Embed Size (px)
Citation preview

CITY OF PORTLAND, TENNESSEE FINANCIAL STATEMENTS AND
SUPPLEMENTARY INFORMATION FOR THE YEAR ENDED JUNE 30, 2020

FINANCIAL STATEMENTS AND SUPPLEMENTARY INFORMATION
PageINTRODUCTORY SECTION (Unaudited)
Elected and Appointed City Officials i
FINANCIAL SECTIONIndependent Auditor's Report 1
Management’s Discussion and Analysis (Required Supplementary Information) 4
Basic Financial Statements:
Government-Wide Statements: Statement of Net Position 18Statement of Activities 19
Fund Financial Statements:
Governmental Fund Financial StatementsBalance Sheet – Governmental Funds 20Reconciliation of the Balance Sheet of Governmental Funds
to the Statement of Net Position 21Statement of Revenues, Expenditures, and Changes in
Fund Balances – Governmental Funds 22Reconciliation of the Statement of Revenues, Expenditures, and Changes in
Fund Balances of Governmental Funds to the Statement of Activity 23Statement of Revenues, Expenditures and Changes in Fund
Balances - Budget and Actual - General Fund 24
Proprietory Fund Financial StatementsStatement of Net Position 28Statement of Revenues, Expenses, and Changes in Net Position 29Statement of Cash Flows 30Statement of Fiduciary Net Position - Agency Fund 31
Notes to Financial Statements 32
REQUIRED SUPPLEMENTARY INFORMATION:
Schedules of Changes in Total OPEB Liability and Related Ratios 59Schedule of Changes in Net Pension Liability (Asset) and Related Ratios
Based on Participation in the Public Employee Pension Plan of TCRS 61Schedule of Contributions Based on Participation in the Public
Employee Pension Plan of TCRS 62Notes to Required Supplementary Information 63
CITY OF PORTLAND, TENNESSEE
For the Year Ended June 30, 2020
Table of Contents

FINANCIAL STATEMENTS AND SUPPLEMENTARY INFORMATION
Page
CITY OF PORTLAND, TENNESSEE
For the Year Ended June 30, 2020
Table of Contents
OTHER SUPPLEMENTARY INFORMATION:
Combining Financial StatementsCombining Balance Sheet - Nonmajor Governmental Funds 64Combining Statement of Revenues, Expenditures, and Changes
in Fund Balances - Nonmajor Governmental Funds 65
Budgetary Comparison SchedulesSchedule of Revenues, Expenditures, and Changes in Fund
Balances - Budget and Actual:Airport 66Solid Waste 67Stormwater 68Drug 69Impact Fee 70Revolving Loan 71Golf Course 72
Schedule of Expenditures of Federal Awards and State Financial Assistance 73Notes to the Schedule of Expenditures of Federal Awards
and State Financial Assistance 74
OTHER INFORMATION SECTION (Unaudited)
Schedule of Changes in Long-term Debt by Individual Issue 75Schedule of Principal and Interest Requirements:
Governmental Activities 76Business-type Activities 78
Schedule of Changes in Property Taxes Receivable 79AWWA Water Loss Reporting Worksheet 80AWWA Water System Attributes and Performance Indicators 81Schedule of Tax Rates and Assessments 82Schedule of Utility Rate Structure and Number of Customers 83
GOVERNMENT AUDITING STANDARDS SECTION
Independent Auditor's Report on Internal Control over Financial Reportingand on Compliance and Other Matters Based on an Audit of FinancialStatements Performed in Accordance with Government Auditing Standards 84
Summary Schedule of Prior Year Findings 86

INTRODUCTORY SECTION

CITY OF PORTLAND, TENNESSEE ELECTED AND APPOINTED OFFICIALS
JUNE 30, 2020
i
ELECTED OFFICIALS
Mike Callis Mayor
John Kerley Vice Mayor
Thomas Dillard Alderman
Mike Hall Alderman
Brian Harbin Alderman
Andrew Jennings Alderman
Jody McDowell Alderman
Megann Thompson Alderwoman
APPOINTED OFFICIALS
Doug Yoeckel, CPA, CMFO Finance Director Patricia Keen City Recorder John R. Bradley City Attorney Joseph B. (Jack) Freedle City Judge
AUDIT COMMITTEE
Andrew Jennings
Kim Delaney, CPA
Jake Daughtry

FINANCIAL SECTION

CERTIFIED PUBLIC ACCOUNTANTS AND CONSULTANTS
515 NW Atlantic Street, Tullahoma, Tennessee 37388 16053 Rankin Avenue, Dunlap, Tennessee 37327
Phone (931) 393-3307 Fax (931) 563-5585
INDEPENDENT AUDITOR’S REPORT To the Honorable Mayor and Board of Aldermen City of Portland, Tennessee Report on the Financial Statements We have audited the accompanying financial statements of the governmental activities, the business-type activities, each major fund, and the aggregate remaining fund information of the City of Portland, Tennessee, as of and for the year ended June 30, 2020, and the related notes to the financial statements, which collectively comprise the City of Portland, Tennessee’s basic financial statements as listed in the table of contents.
Management’s Responsibility for the Financial Statements Management is responsible for the preparation and fair presentation of these financial statements in accordance with accounting principles generally accepted in the United States of America; this includes the design, implementation, and maintenance of internal control relevant to the preparation and fair presentation of financial statements that are free from material misstatement, whether due to fraud or error.
Auditor’s Responsibility Our responsibility is to express opinions on these financial statements based on our audit. We conducted our audit in accordance with auditing standards generally accepted in the United States of America and the standards applicable to financial audits contained in Government Auditing Standards, issued by the Comptroller General of the United States. Those standards require that we plan and perform the audit to obtain reasonable assurance about whether the financial statements are free from material misstatement.
An audit involves performing procedures to obtain audit evidence about the amounts and disclosures in the financial statements. The procedures selected depend on the auditor’s judgment, including the assessment of the risks of material misstatement of the financial statements, whether due to fraud or error. In making those risk assessments, the auditor considers internal control relevant to the entity’s preparation and fair presentation of the financial statements in order to design audit procedures that are appropriate in the circumstances, but not for the purpose of expressing an opinion on the effectiveness of the entity’s internal control. Accordingly, we express no such opinion. An audit also includes evaluating the appropriateness of accounting policies used and the reasonableness of significant accounting estimates made by management, as well as evaluating the overall presentation of the financial statements.

2
We believe that the audit evidence we have obtained is sufficient and appropriate to provide a basis for our audit opinions.
Opinions In our opinion, the financial statements referred to above present fairly, in all material respects, the respective financial position of the governmental activities, the business-type activities, each major fund, the statement of budgetary comparison for the general fund, and the aggregate remaining fund information of the City of Portland, Tennessee as of June 30, 2020, and the respective changes in financial position and, where applicable, cash flows thereof and the respective budgetary comparison for the general fund for the year then ended in accordance with accounting principles generally accepted in the United States of America.
Other Matters
Required Supplementary Information
Accounting principles generally accepted in the United States of America require that the management’s discussion and analysis and required supplementary information as listed in the table of contents be presented to supplement the basic financial statements. Such information, although not a part of the basic financial statements, is required by the Governmental Accounting Standards Board who considers it to be an essential part of the financial reporting for placing the basic financial statements in an appropriate operational, economic, or historical context. We have applied certain limited procedures to the required supplementary information in accordance with auditing standards generally accepted in the United States of America, which consisted of inquiries of management about the methods of preparing the information and comparing the information for consistency with management’s responses to our inquiries, the basic financial statements, and other knowledge we obtained during our audit of the basic financial statements. We do not express an opinion or provide any assurance on the information because the limited procedures do not provide us with sufficient evidence to express an opinion or provide any assurance.
Other Information
Our audit was conducted for the purpose of forming opinions on the financial statements that collectively comprise the City of Portland, Tennessee’s basic financial statements. The introductory section, combining and individual nonmajor fund financial statements and schedules, schedule of expenditures of federal awards and state financial assistance, and the other information section are presented for the purposes of additional analysis and are not a required part of the basic financial statements.
The combining and individual nonmajor fund financial statements and schedules, including the schedule of expenditures of federal awards and state financial assistance are the responsibility of management and were derived from and relate directly to the underlying accounting and other records used to prepare the basic financial statements. Such information has been subjected to the auditing procedures applied in the audit of the basic financial statements and certain
3
additional procedures, including comparing and reconciling such information directly to the underlying accounting and other records used to prepare the basic financial statements or to the basic financial statements themselves, and other additional procedures in accordance with auditing standards generally accepted in the United States of America. In our opinion, the combining and individual nonmajor fund financial statements and schedules, including the schedule of expenditures of federal awards and state financial assistance is fairly stated, in all material respects, in relation to the basic financial statements as a whole.
The introductory section, and other information section have not been subjected to the auditing procedures applied in the audit of the basic financial statements, and accordingly, we do not express an opinion or provide any assurance on them.
Other Reporting Required by Government Auditing Standards
In accordance with Government Auditing Standards, we have also issued our report dated December 07, 2020 on our consideration of the City of Portland, Tennessee’s internal control over financial reporting and on our tests of its compliance with certain provisions of laws, regulations, contracts, and grant agreements and other matters. The purpose of that report is solely to describe the scope of our testing of internal control over financial reporting and compliance and the results of that testing, and not to provide an opinion on the effectiveness of the City of Portland, Tennessee’s internal control over financial reporting or on compliance. That report is an integral part of an audit performed in accordance with Government Auditing Standards in considering the City of Portland, Tennessee’s internal control over financial reporting and compliance.
MG Group, P.C. Tullahoma, Tennessee December 07, 2020

4
CITY OF PORTLAND, TENNESSEE
MANAGEMENT'S DISCUSSION AND ANALYSIS (UNAUDITED)
As management of the City of Portland, Tennessee (the City) we offer readers of the City’s financial statements this narrative overview and analysis of the financial activities of the City for the fiscal year ended June 30, 2020. The analysis focuses on significant financial position, budget changes and variances from the budget, and specific issues related to funds and the economic factors affecting the City.
Management’s Discussion and Analysis (MD&A) focuses on current year activities and resulting changes.
FINANCIAL HIGHLIGHTS
* The assets of the City of Portland exceeded its liabilities at the close of June 30, 2020 by $72,919,546.Of this amount, $14,677,890 (unrestricted net position) may be used to meet the government’s ongoingobligations to citizens and creditors.
* The government’s total net position increased by $4,689,284.
As of the close of the current fiscal year, the City’s governmental funds reported combinedending fund balances of $8,620,902, an increase of $2,446,853 in comparison to the prior year.Approximately 42.3% of this total amount, $3,643,412 is available for spending at thegovernment’s discretion (unassigned general fund balance).
* The City’s long-term liabilities increased by $1,373,731. Additional debt issues of $4,656,000 reducedby payments of $1,569,763 and a reduction in OPEB liability of $1,853,352 amount to the majority of thechange.
OVERVIEW OF THE FINANCIAL STATEMENTS
This discussion and analysis is intended to serve as an introduction to the City of Portland’s basic financial statements. The City’s basic financial statements comprise three components: (1) government-wide financial statements, (2) fund financial statements, and (3) notes to the financial statements. This report also contains other supplementary information in addition to the basic financial statements.
Government-wide financial statements: The government-wide financial statements are designed to provide readers with a broad overview of the City’s finances, in a manner similar to a private-sector business.
The Statement of Net Position presents information on all of the City’s assets, liabilities, deferred outflows and inflows, with the difference between these reported as net position. Over time, increases or decreases in net position may serve as a useful indicator of whether the financial position of the City is improving or deteriorating.
The Statement of Activities presents information showing how the government’s net position changed during the most recent fiscal year. All changes in net position are reported as soon as the underlying event giving rise to the change occurs, regardless of the timing of related cash flows. Thus, revenues and

5
expenses are reported in this statement for some items that will only result in cash flows in future fiscal periods (e.g., uncollected tax and earned but unused vacation leave).
Both of the government-wide financial statements distinguish functions of the City that are principally supported by taxes and intergovernmental revenues (governmental activities) from other functions that are intended to recover all or a significant portion of their cost through user fees and charges (business-type activities). The governmental activities of the City of Portland include general government, planning, codes, police, fire, highways and streets, recreation, animal control, city engineering, community development, sanitation, storm water, golf course and the airport authority. The business-type activities of the City include Water and Sewer and Natural Gas operations.
Fund financial statements: A fund is a grouping of related accounts that is used to maintain control over resources that have been segregated for specific activities or objectives. The City of Portland, like other state and local governments, uses fund accounting to ensure and demonstrate compliance with finance-related legal requirements. All of the funds of the City can be divided into two categories: governmental funds and proprietary funds.
Governmental Funds: Governmental Funds are funds used to account for essentially the same functions reported as governmental activities in the government-wide financial statements. However, unlike the governmental-wide financial statements, government fund financial statements focus on near-term inflows and outflows of spendable resources, as well as on balances of spendable resources available at the end of the fiscal year. Such information may be useful in evaluating a government’s near-term financing requirements.
Because the focus of governmental funds is narrower than that of the government-wide financial statements, it is useful to compare the information presented for governmental funds with similar information presented for governmental activities in the government-wide financial statements. By doing so, readers may better understand the long-term impact of the government’s near-term financing decisions. Both the governmental fund balance sheet and the governmental fund statement of revenues, expenditures, and changes in fund balance provide a reconciliation to facilitate this comparison between governmental funds and governmental activities.
The City maintains eight (8) individual governmental funds. Information is presented separately in the governmental fund balance sheet and in the governmental fund statement of revenues, expenditures, and changes in fund balances for the general fund, which is considered a major fund. Data for the other governmental funds are combined into a single, aggregated presentation, as nonmajor governmental funds. Individual fund data for each of these non-major governmental funds is provided in the form of combining statements elsewhere in this report.
The City of Portland adopts an annual appropriated budget for its general fund as well as drug fund, airport authority fund, impact fee fund, industrial loan fund, storm water fund, golf course fund and solid waste fund. A budgetary comparison statement has been provided for the general fund to demonstrate compliance with this budget. See Table 3 for the general fund budget comparison. The other budgetary comparisons are in the combining and individual nonmajor fund statements and schedules section of the report.

6
FINANCIAL ANALYSIS OF THE FINANCIAL STATEMENTS
Proprietary Funds: The City of Portland maintains two proprietary funds. Proprietary funds are used to report the same functions presented as business-type activities in the government-wide financial statements. The City uses proprietary funds to account for its Water and Sewer and Natural Gas operations.
Proprietary fund financial statements provide the same type of information as the government-wide financial statements, only in more detail. The proprietary fund financial statements provide separate information of the water and sewer and natural gas activities, which are considered to be major funds of the City.
Notes to the Financial Statements: The notes provide additional information that is essential to a full understanding of the data provided in the government-wide and fund financial statements.
The combining statements referred to earlier in connection with nonmajor governmental funds are presented immediately following the notes to the financial statement.
Government-wide Financial Analysis
As noted earlier, net position may serve as a useful indicator of a government’s financial position. For the City of Portland, assets and deferred outflows exceeded liabilities and deferred inflows by $68,230,263 at the close of 2019 and $72,919,546 at the close of the most recent fiscal year.
By far the largest portion of the City’s net position (70.6%) reflects its investment in capital assets (e.g., land, buildings, machinery, equipment, and infrastructure), less any related debt that is still outstanding, used to acquire those assets. The City uses these capital assets to provide services to citizens; consequently, these assets are not available for future spending. Although the City’s investment in its capital assets is reported net of related debt, it should be noted that the resources needed to repay this debt must be provided from other sources, since the capital assets themselves cannot be used to liquidate these liabilities.
An additional portion of the City’s net position (approximately 9.3%) represents resources that are subject to external restrictions on how these may be used and assigned encumbrances from prior year. The remaining balance of unrestricted net position $14,677,890 may be used to meet the government’s ongoing obligations to citizens and creditors.
At the end of the current fiscal year, the City is able to report positive balances in all three categories of net position for the government as a whole and for the business-type activities. The same situation held true for the prior year. Unrestricted net position of the governmental activities reflected a balance of $2,950,744 at the end of the current fiscal year.
During the current fiscal year, the government’s net position increased by $4,689,284. This increase is approximately 6.4% of total net position. Of this $4,689,284 increase, the governmental activities increased $2,358,801 and the business-related activities increased $2,330,483.

7
Table 1 Net Position(In Thousands)
Government Activities Business -type Activities Total2020 2019 Change 2020 2019 Change 2020 2019 Change
AssetsCurrent & Other Assets 15,953$ 12,729$ 3,224$ 14,631$ 13,845$ 786$ 30,584$ 26,574$ 4,010$ Capital Assets 34,708 31,794 2,914 43,316 42,897 419 78,024 74,691 3,333
Total Assets 50,661 44,523 6,138 57,947 56,742 1,205 108,608 101,265 7,343
Deferred OutflowsDeferred Outflows 431 779 (347) 273 494 (221) 704 1,273 (569)
Total Deferred Outflows 431 779 (347) 273 494 (221) 704 1,273 (569)
LiabilitesOther Liabilities 1,079 698 381 936 1,152 (216) 2,015 1,850 165 L-T Liabilities 12,949 10,311 2,638 15,011 16,275 (1,264) 27,960 26,586 1,374
Total Liabilities 14,028 11,010 3,018 15,947 17,426 (1,480) 29,975 28,436 1,539
Deferred InflowsDeferred Inflows 5,885 5,471 413 533 400 133 6,418 5,872 546
Total Deferred Inflows 5,885 5,471 413 533 400 133 6,418 5,872 546
Net PositionNet Investment in Capital Assets 22,240 23,158 (918) 29,244 28,966 279 51,484 52,124 (640) Restricted 5,989 3,791 2,197 769 659 110 6,757 4,450 2,307 Unrestricted 2,951 1,871 1,080 11,727 9,785 1,942 14,678 11,656 3,022
Total Net Position 31,179$ 28,820$ 2,359$ 41,740$ 39,410$ 2,330$ 72,920$ 68,230$ 4,689$

8
Table 2 Changes in Net Position(In Thousands)
Government Activities Business -type Activities Total2020 2019 Change 2020 2019 Change 2020 2019 Change
RevenuesProgram Revenues:
Charges for Services 2,825$ 2,991$ (165)$ 13,036$ 13,283$ (247)$ 15,861$ 16,273$ (412)$ Operating Grants 5 56 (51) - - - 5 56 (51) Capital Grants 1,619 751 868 76 63 13 1,695 814 881
General Revenues:Property Taxes 4,862 4,726 136 - - - 4,862 4,726 136 Intergovernmental 4,487 4,275 212 - - - 4,487 4,275 212 Interest 16 16 - 58 60 (2) 75 76 (1) Other Revenues 272 200 72 51 49 2 323 249 74 Gain 128 127 2 98 (2) 100 226 125 101
Total Revenues 14,215$ 13,141$ 1,074$ 13,318$ 13,452$ (134)$ 27,533$ 26,594$ 939$
Program ExpensesGen Gov't 1,180$ 1,442$ (263)$ -$ -$ -$ 1,180$ 1,442$ (263)$ Public Safety 4,936 5,612 (676) - - - 4,936 5,612 (676) City Court 20 16 4 - - - 20 16 4 Hwy, Streets 2,099 1,899 200 - - - 2,099 1,899 200 Solid Waste 1,044 1,038 5 - - - 1,044 1,038 5 Impact Fee - - - - - - - - - Parks 784 917 (132) - - - 784 917 (132) Airport 539 685 (145) - - - 539 685 (145) Planning 328 341 (13) - - - 328 341 (13) Comm Develop 67 83 (16) - - - 67 83 (16) City Garage 51 54 (3) - - - 51 54 (3) Engineering 9 22 (13) - - - 9 22 (13) Animal Control 23 58 (35) - - - 23 58 (35) Golf Course 207 187 20 - - - 207 187 20 Stormwater 563 708 (145) - - - 563 708 (145) Water & Sewer - - - 6,699 7,134 (435) 6,699 7,134 (435) Gas - - - 3,989 4,848 (859) 3,989 4,848 (859) Interest on L-T Debt 307 290 17 - - - 307 290 17
Total Expenses 12,156 13,350 (1,194) 10,688 11,982 (1,294) 22,844 25,332 (2,488)
Increase (Decrease) in net positionOther Items - - - - - - - - - Transfers 300 271 28 (300) (271) (28) - - -
Increase (Decrease) in net position 2,359 63 2,296 2,330 1,199 1,131 4,689 1,262 3,427 Net Position - Beginning 28,820 28,758 63 39,410 38,211 1,199 68,230 66,968 1,262 Prior Period Adjustment - - - - - - - - - Net Position - Ending 31,179$ 28,820$ 2,359$ 41,740$ 39,410$ 2,330$ 72,920$ 68,230$ 4,689$

9
FINANCIAL ANALYSIS OF THE FINANCIAL STATEMENTS, continued
Governmental Funds
The focus of the City of Portland’s governmental funds is to provide information on near-term inflows, outflows and balances of spendable resources. Such information is useful in assessing the City’s financing requirements. In particular, unreserved fund balance may serve as useful measure to a government’s net resources available for spending at the end of the fiscal year.
As of the end of the current fiscal year, the City’s governmental funds reported combined ending fund balances of $8,620,902, an increase of $2,446,851, in comparison with 2019. Of this total amount, $3,643,412 constitutes unassigned fund balance which is used for spending at the government’s discretion. The non-spendable portion of fund balance ($356,390) is reserved to indicate that it is not available for new spending because it has been committed to provide for prepaid items and inventory and the restricted fund balance ($1,386,916) is set aside for statutorily reserved purposes. The committed fund balance ($105,450) is designated for special projects that are provided by City Council action. The assigned fund balance ($3,128,734) is amounts intended to be used for specific purposes primarily capital projects funded by the GO bond issue.
The general fund is the chief operating fund of the City. At the end of the current fiscal year the total general fund balance was $7,247,359 with $3,643,412 (approximately 50.3%) constituting unassigned fund balance. As a measure of the general fund’s liquidity, it may be useful to compare both unreserved fund balance and total fund balance to total fund expenditures.
Unassigned fund balance represents 26.6% of total general fund expenditures and 39.4% of total expenditures less capital outlays. Total fund balance represents 52.9% of total general fund expenditures. During the current fiscal year, the fund balance of the City’s general fund increased by $2,261,093.
Overall revenues performed very well for the year even with the 4th quarter of the year covered by the COVID pandemic.
Overall sales tax revenues and local option tax revenues continue to improve year over year as new retail outlets continue to open or expand with additional outlets planned or in process for the coming year. The new interstate interchange continues to attract several new retail outlets. Current year levels improved 2.4% and 11.5% respectively over 2019 levels.
Collections of current year property taxes were at 96.6% of total taxes billed. Overall collections of property taxes including delinquents and penalties exceeded planned levels by approximately 2.8%.
Building permits continue to be very strong however not up to prior year level (-29.5%) versus 2019 and but up (+3.1%) to forecasted levels. Building permits are an excellent indicator of the construction business because they affect sewer and water taps and impact fees. Permits also affect the property tax revenues and sales tax revenues because of the impact of builders buying supplies and the increase in property assessment values. Building permits should continue to be strong because of growth indicators that support the road infrastructure improvements that are in process (new interchange on I-65) and the planned road project (Hwy 109 by-pass). The current year strength is attributed to the construction of

10
several retail facilities, strong residential housing construction and an expansion of an existing facility (Dorman).
The State of Tennessee’s state shared revenues were up approximately +5.6% over prior year. Sales Tax continued to show solid improvements, +2.4%. Local option tax continues to grow because of the growth in retail business, +11.5%. The phase out of the state income tax and the delay in filing date due to COVID contributed to the decrease in revenue, down 79.0% from prior year. The Income tax level will continue to decrease under the phase-out, completely phased-out in 2021. Business tax continues to improve, up from prior year, +3.5%. These factors contributed to the improvement in general unassigned fund balance +$522,611. The overall net change in general fund balance was (+$2,261,093) created by the proceeds of the GO bond issue without the corresponding increase in capital spending, this is reflected in the assigned fund balance increase of $1,980,049.
The City of Portland, recognizing fund balance problems in mid-year 2010, made several changes which continue to aid in the improvement in the fund balance. The improved economy and continued spending controls lend to continued positive signs with the strongest indicator being the unassigned fund balance of $3,643,412 at the end of 2020.
Proprietary Funds
The City’s proprietary funds provide the same type of information found in the government-wide financial statements but in more detail.
Unrestricted net position of the proprietary funds at the end of the year amounted to $11,727,146, an increase of $1,942,112 (+19.9%) with Water & Sewer contributing a (+$1,191,206) and Gas contributing a (+$750,906). Operating income was up in Gas (+$63,949) and up in Water & Sewer (+$944,348) versus prior year.
Gas revenues were down for the year -$795,207 (-14.2%) as temperatures were milder than prior year. Natural gas costs for the year were down -$937,486 due to decrease in usage and the overall margin on gas increased by 10.7% percentage points (pricing structure change with largest user). Spending was up moderately (+$78,330) with operating expenses (+$129,996), depreciation (+$66,142) and administrative expenses down (-$117,808). Overall operating income was up (+$63,949).
Water & Sewer was up over 6.9% in operating revenues, +$533,760. Costs were down significantly in operating expenses (-$183,435), administrative expenses (-$352,614) offset by an increase in depreciation (+$125,461) creating the overall increase in operating income (+$944,348). A significant adjustment in the OPEB liability contributed to the decline in administrative expenses.
GENERAL FUND BUDGETARY HIGHLIGHTS
The General Fund budget was amended during the year. The following table illustrates the change to the annual budget.

11
Table 3 General FundBudgeted Amounts
Original Final ChangeRevenues
Local Taxes:Property and Personalty Taxes 4,621,000$ 4,732,500$ 111,500$ Sales Taxes 1,875,000 1,875,000 - Alcoholic Beverage Taxes 341,000 321,000 (20,000) Business Taxes 125,000 75,000 (50,000) Cable TV Franchise and Lease Taxes 117,000 107,000 (10,000) Other Taxes - - -
Licenses & Permits 375,000 323,000 (52,000) Fines 185,000 154,500 (30,500) Intergovernmnetal Revenues: -
Sales Taxes 1,048,000 956,375 (91,625) Gasoline and Motor Fuel Taxes 400,000 395,000 (5,000) Petroleum Special Taxes 23,000 23,000 - Income Taxes 30,000 - (30,000) Corporate Excise Tax 65,000 95,250 30,250 In Lieu of Tax 155,000 160,000 5,000 Federal & State Grants - 266,475 266,475
Charges for Services 70,750 40,600 (30,150) Rental Income 22,000 10,000 (12,000) Investment Income 7,950 11,450 3,500 Miscellaneous Revenues 70,500 1,122,575 1,052,075
Total Revenues 9,531,200$ 10,668,725$ 1,137,525$
ExpendituresCurrent:
General Government 998,600$ 1,209,612$ (211,012)$ Public Safety 5,255,438 5,245,513 9,925 City Court 19,258 23,758 (4,500) Highways, Streets and Roadways 918,293 1,042,343 (124,050) Parks and Recreation 758,085 749,985 8,100 Planning and Zoning 144,086 193,336 (49,250) Codes 158,450 167,100 (8,650) Community Development 80,366 80,366 - City Garage 57,229 57,129 100 Engineering 4,500 15,100 (10,600) Animal Control 94,333 56,033 38,300
Debt ServicePrincipal 785,970 698,070 87,900 Interest 326,142 344,922 (18,780)
Capital Outlay 3,673,950 7,206,586 (3,532,636) Total Expenditures 13,274,700$ 17,089,853$ (3,815,153)$
Excess of Revenues Over (Under) Expenditures (3,743,500)$ (6,421,128)$ (2,677,628)$
Other Financing Sources (Uses)Operating Transfers In/Out 101,000$ 295,750$ 194,750$ Proceeds from Sales of Capital Assets 2,500 102,022 99,522 Insurance Recoveries 10,000 12,000 2,000 Bond Premium - 215,248 215,248 Bond Discount - - - Proceeds from Debt Issuance 3,230,000 4,149,000 919,000 TIF Payment - (8,500) (8,500)
Total Other Financing Sources (Uses) 3,343,500$ 4,765,520$ 1,422,020$
Net Change in Fund Balance (400,000)$ (1,655,608)$ (1,255,608)$
Budgetary Fund Balance - July 1, 2019 4,986,266$ 4,986,266$ -$
Budgetary Fund Balance - June 30, 2020 4,586,266$ 3,330,658$ (1,255,608)$

12
CAPITAL ASSETS AND DEBT ADMINISTRATION
Capital Assets
The City of Portland’s investment in capital assets from its governmental and business-type activities at June 30, 2020, amounts to $78,024,090 (net of accumulated depreciation). This investment in capital assets consists mainly of land, buildings, improvements, machinery and equipment, park facilities, roads, bridges, and utility plant for the water, sewer, and natural gas services the City provides. Total Capital Assets increased by $3,333,030 due to several large projects, City Hall Building renovation/expansion, contribution of two properties (land & Building) to the city and purchase of several pieces of equipment. The cost additions were offset by the annual depreciation of $3,322,022.
Additional information on the City of Portland’s capital assets can be found in the notes to the financial statements section of this report.

13
Table 4 Balance Disposals/ Balance7/1/2019 Additions Transfers 6/30/2020
Governmental ActivitiesCapital Assets not being Depreciated
Land 6,267,174$ 574,048$ -$ 6,841,222$ Construction in Progress 743,181 3,913,669 (2,188,541) 2,468,309
Total Capital Assets not being Depreciated 7,010,355$ 4,487,717$ (2,188,541)$ 9,309,531$
Capital Assets Being DepreciatedBuildings 12,167,259$ 769,145$ -$ 12,936,404$ Improvements Other than Buildings 7,019,712 516,811 - 7,536,523 Infrastructure 13,622,701 171,091 - 13,793,792 Machinery & Equipment 6,241,716 634,769 (230,617) 6,645,868
Total Capital Assets being Depreciated 39,051,388$ 2,091,816$ (230,617)$ 40,912,587$
Accumulated DepreciationBuildings, Improvements, Machinery and Equipment 9,015,764$ 1,067,604$ (215,706)$ 9,867,662$ Infrastructure 5,251,918 394,719 - 5,646,637
Total Accumulated Depreciation 14,267,682$ 1,462,323$ (215,706)$ 15,514,299$
Total Governmental Activities, Net 31,794,061$ 5,117,210$ (2,203,452)$ 34,707,819$
Business-type ActivitiesCapital Assets not being Depreciated
Land & Right of Way 1,280,682$ 6,000$ -$ 1,286,682$ Construction in Progress 6,422,714 1,807,952 (6,679,525) 1,551,141
Total Capital Assets not being Depreciated 7,703,396$ 1,813,952$ (6,679,525)$ 2,837,823$
Capital Assets Being DepreciatedWater & Sewer Plant 42,142,410$ 5,957,912$ -$ 48,100,322$ Natural Gas Plant 15,604,830 665,610 - 16,270,440 Equipment & Vehicles 2,801,722 573,295 (372,864) 3,002,153 Furniture & Fixtures 335,740 33,464 - 369,204
Total Capital Assets being Depreciated 60,884,702$ 7,230,281$ (372,864)$ 67,742,119$
Accumulated DepreciationWater & Sewer Plant 18,201,918$ 1,221,799$ -$ 19,423,717$ Natural Gas Plant 5,251,466 374,761 - 5,626,227 Machinery & Equipment 1,928,797 253,986 (287,127) 1,895,656 Furniture & Fixtures 308,918 9,153 - 318,071
Total Accumulated Depreciation 25,691,099$ 1,859,699$ (287,127)$ 27,263,671$
Total Business-type Activities, Net 42,896,999$ 7,184,534$ (6,765,262)$ 43,316,271$

14
ASSETS AND DEBT ADMINISTRATION – Continued
Long-Term Debt
At the end of the current year, the City of Portland had total debt outstanding of $27,959,547. Of this amount, $12,848,980 comprises debt backed by the full faith and credit of the government (governmental activity debt) and the remainder of the debt of the City represents debt secured by both the taxing power of the City and specific revenue sources (e.g. revenue and tax bonds) of the proprietary funds.
The total debt obligations increased by $1,373,731. Bonds, Leases and Capital Outlay Notes with bond premium and discount increased +$3,223,362 from the previous year due to the issue of the GO bonds (+$3,780,000) and capital outlay notes (+$876,000) offset by normal debt service liquidation, OPEB obligation decreased -$1,853,352 and Compensated Absences increased +$3,721.
State statutes impose no debt limit on the amount of general obligation debt a governmental entity may issue.
Additional information on the City of Portland’s debt can be found in the notes to the financial statements section of this report.

15
Table 5 Balance Balance AmountsJune, 30 June, 30 Due Within
2019 Increases Decreases 2020 One YearGovernmental Activities
Capital Outlay Notes 1,790,160$ 639,000$ 598,648$ 1,830,512$ 556,920$ Capital Leases - - - -$ - Bonds 6,790,000 3,780,000 180,000 10,390,000$ 255,000
8,580,160 4,419,000 778,648 12,220,512 811,920 Plus Bond Premium 215,248 7,135 208,113$ 7,135 Less Bond Discount 1,137 34,294 (33,157)$ (1,137) Compensated Absences 224,984 - 224,984$ Total OPEB Liability 1,506,127 - 1,177,599 328,528$
10,311,271$ 4,635,385$ 1,997,676$ 12,948,980$ 817,918$
Balance Balance AmountsJune, 30 June, 30 Due Within
2019 Increases Decreases 2020 One YearBusiness-Type Activities
Water & Sewer System Refunding and Improvement Bonds, Series 2016 13,715,000 - 680,000 13,035,000$ 700,000 State Revolving Loan 870,370 - 64,448 805,922$ 60,005 Capital Leases - - -$ - Capital Outlay Notes 46,667 237,000 46,667 237,000$ 47,400
14,632,037 237,000 791,115 14,077,922 807,405 Plus bond premium 700,840 - 38,220 662,620$ 38,220 Less bond discount (6,525) 389 - (6,136)$ (389) Compensated Absences 105,034 3,721 108,755$ Total OPEB Liability 843,159 - 675,753 167,406$
16,274,545$ 241,110$ 1,505,088$ 15,010,567$ 845,236$
ECONOMIC FACTORS AND NEXT YEAR’S BUDGET AND RATES
The unemployment rate for the City of Portland is currently 5.9%, compared to the State unemployment rate of 6.3% and the national rate of 6.6%. Unemployment rates are up due to the COVID pandemic. The 2010 Census numbers revealed substantial growth and we are confident the 2020 numbers will be strong.
The Portland Airport continues to seek federal and state grant programs to enhance the airport. Realizing the benefit of air service in the northern part of the county, Sumner County provides an annual allocation of funds to partner with Portland on Airport projects. The completion of various major projects at the airport and the current additional on-going enhancement projects (Phase I Construction of a Parallel Taxiway and Runway Pavement Overlay) will provide more opportunities for service to our local industries and citizens. The improved airport also is a strong attraction for prospective industries to our City. Additionally, Civil Air Patrol (Search and Rescue Disaster Team) meets monthly at the Portland Airport

16
Portland’s automotive manufacturers continue to thrive in our community. U.S. Tsubaki completed a new 250,000 square foot facility to consolidate all their Portland operations and to provide additional expansion capability. Dorman Products (After- market auto parts assembly supplier) is operating in an 815,000 SF facility and added an additional 181,640 SF to the facility during the year, total employment for the facility is 700.
Portland has experienced additional industrial growth with Advanced Plating locating in Portland at an existing 115,000 SF facility adding $4 million in investment and the addition of 200 new jobs over a five-year period. S.R. Smith relocated and expanded operations into an available 166,500 SF facility. Nabholz Construction – National Commercial Contractor; SSW Holding Company – Pre-Cast Counter Weights; Pennar Global – Engineering Building Systems; Specialty Water Technologies – Water Purification Systems for the medical industry and Genessee – Metal stamping group are new Industries that located in Portland during the year. Some building modifications are underway and hiring has begun for most of the new locators. In addition, SurKoat an existing industry purchased the property previously occupied by Tsubaki. Companies who expand their operations in the same community manifest proof of their success.
Portland continues to captivate industry seeking a US Southeastern location. Our location is ideal for product to market whether it be distribution or manufacturing. Our location also serves well for access to a skilled and trainable workforce. The Portland Campus of the TN college of Applied Technology is in full operation with Advanced Manufacturing, Machine Tool, Information Technology, Construction , Nursing, Office Administration and Cosmetology and Welding classes all offered, Addition of a night shift to the welding class is providing more opportunity to enhance our local workforce training. A partnership with Sumner County School Board, TN Board of Regents and the City of Portland provided for the installation of an elevator and renovations to open up the second floor of the building to accommodate Middle School Core Curriculum classes. The TCAT staff is working closely with the local industries to meet their special training needs. The process of feeding the TCAT with high school students who wish to graduate with certifications to enter the workforce using the Middle College curriculum has been a huge success.
Road projects were a major part of the year with completion of construction on the new I-65 interchange. The new interchange ties into Hwy 109 north of Portland. Additionally, the joint project between four government entities (City of Portland, City of Orlinda, Robertson County and Sumner County) for the widening and adding of a signal at the intersection of Hwy 31W and Hwy 52, a main port of entrance to Portland, was completed. The proposed Portland By-Pass route which will tie into HWY 109 at the new interchange is in the final engineering stages, however, a delay has pushed land acquisition out until late 2021. The 109 corridor is the tie in to the northern loop of I-840, the loop around Nashville. These road projects continue to enhance our ability to recruit new industry and retail prospects.
Portland continues to have a presence at the International ICSC in Las Vegas, the TN-KY ICSC Annual Conference and the Southeastern Conference in Atlanta for retail recruitment. Additionally, the City entered into a contract with Retail Strategies for retail recruitment expertise. Developers, Investors and Retailers are showing increased interest in our community. Of particular interest is our strong growth rate in the federal census from 2000-2010 and the new interstate interchange completion . During the year we added a Dollar General Store on our east side, an independent convenience store, a Speedway store and fueling station and a 5-Star store and fueling station near the new interchange. A Dunkin Donuts is

17
opening in one of our downtown convenience stores. Portland is a good market for locally owned and operated businesses such as Milo’s Coffee Shop. Highway 109 is still the main focus for retailers but significant additional interest is being generated along the new interchange corridor.
Tractor Supply was the first Tax Increment Financing Project (TIF) completed by the City. The project was completed in conjunction and cooperation with the Sumner County Government. The relationships forged and success experienced with Tractor Supply has initiated additional interest in the Portland market by local and regional investors and developers.
The City completed a bond issue in August 2015 of over $7.4 million for a building program to include two fire halls, (one on the north side of town at the mouth of the interchange tie in to 109 and a joint project with the Sumner County EMS on the south side of town), a City Hall and several parks improvements. Due to increased construction costs, an additional bond issue of $3.8 million was completed in April 2020 for completion of the renovation and addition to the City Hall. Additional funds are available under the 2020 bond to renovated the Police Station, add roads, and complete other Parks related projects. Completion of the City Hall project is scheduled for January, 2021.
The City completed the waste water plant improvement/renovation during the current year along with several sewer collection system projects and the phase II design for the waste water plant expansion. The City closed an additional $17 million dollar Water & Sewer Bond issue in October 2020 to fund the waste water plant expansion ($10 million) and several large collection system projects ($7 million) in order to upgrade our system for the anticipated growth due to the road infrastructure improvements.
REQUESTS FOR INFORMATION
This financial report is designed to provide a general overview of the City of Portland, Tennessee’s finances for all those with an interest in the government’s finances. Questions concerning any of the information provided in this report or requests for additional financial information should be addressed to:
City Recorder
City of Portland, Tennessee
100 South Russell St.
Portland, TN 37148

BASIC FINANCIAL STATEMENTS

Governmental Business-typeActivities Activities Total
ASSETSCash and cash equivalents 5,270,713$ 10,421,401$ 15,692,114$ Investments - 1,018,495 1,018,495 Receivables: Property taxes, net of allowance 5,056,159 - 5,056,159 Other, net of allowance 183,570 841,249 1,024,819 Due from other governments 436,552 - 436,552 Internal balances (1,344) 1,344 - Inventories 95,022 344,482 439,504 Prepaid items 261,368 134,028 395,396 Restricted cash and cash equivalents 3,177,757 1,101,202 4,278,959 Net pension asset 1,473,046 768,663 2,241,709 Depreciable capital assets 40,912,587 67,742,120 108,654,707 Less: accumulated depreciation (15,514,299) (27,263,671) (42,777,970) Non-depreciable capital assets 9,309,531 2,837,823 12,147,354
Total assets 50,660,662 57,947,136 108,607,798
DEFERRED OUTFLOWS OF RESOURCESDeferred charge on refunding - 48,598 48,598 Related to pension 386,108 201,478 587,586 Related to OPEB 45,043 22,952 67,995
Total deferred outflows of resources 431,151 273,028 704,179
LIABILITIESAccounts payable and accrued liabilities 866,229 667,533 1,533,762 Accrued payroll 140,253 66,459 206,712 Accrued interest 72,539 112,211 184,750 Unearned revenue - 90,000 90,000 Noncurrent liabilities: Compensated absences 224,984 108,755 333,739 Total OPEB Liability 328,528 167,406 495,934 Due within one year 817,918 845,236 1,663,154 Due in more than one year, net of premiums and discounts 11,577,550 13,889,170 25,466,720
Total Liabilities 14,028,001 15,946,770 29,974,771
DEFERRED INFLOWS OF RESOURCESDeferred revenue - property tax 4,852,413 - 4,852,413 Related to OPEB 448,147 228,359 676,506 Related to pension 584,000 304,741 888,741
Total deferred inflows of resources 5,884,560 533,100 6,417,660
NET POSITIONNet invesment in capital assets 22,239,812 29,244,485 51,484,297 Restricted for: -
Airport 40,418 - 40,418 Golf course 56,452 - 56,452 Soild Waste 268,851 - 268,851 Stormwater 556,276 - 556,276 Drug enforcement 20,587 - 20,587 Industrial revolving loan 136,662 - 136,662 Impact fee 219,647 - 219,647 Streets and highways 52,386 - 52,386 Day Care 35,637 - 35,637 Net pension asset 1,473,046 768,663 2,241,709
Assigned for prior year encumbrances 3,128,734 - 3,128,734 Unrestricted 2,950,744 11,727,146 14,677,890
Total Net Position 31,179,252$ 41,740,294$ 72,919,546$
City of Portland, TennesseeStatement of Net Position
June 30, 2020
See notes to the financial statements18
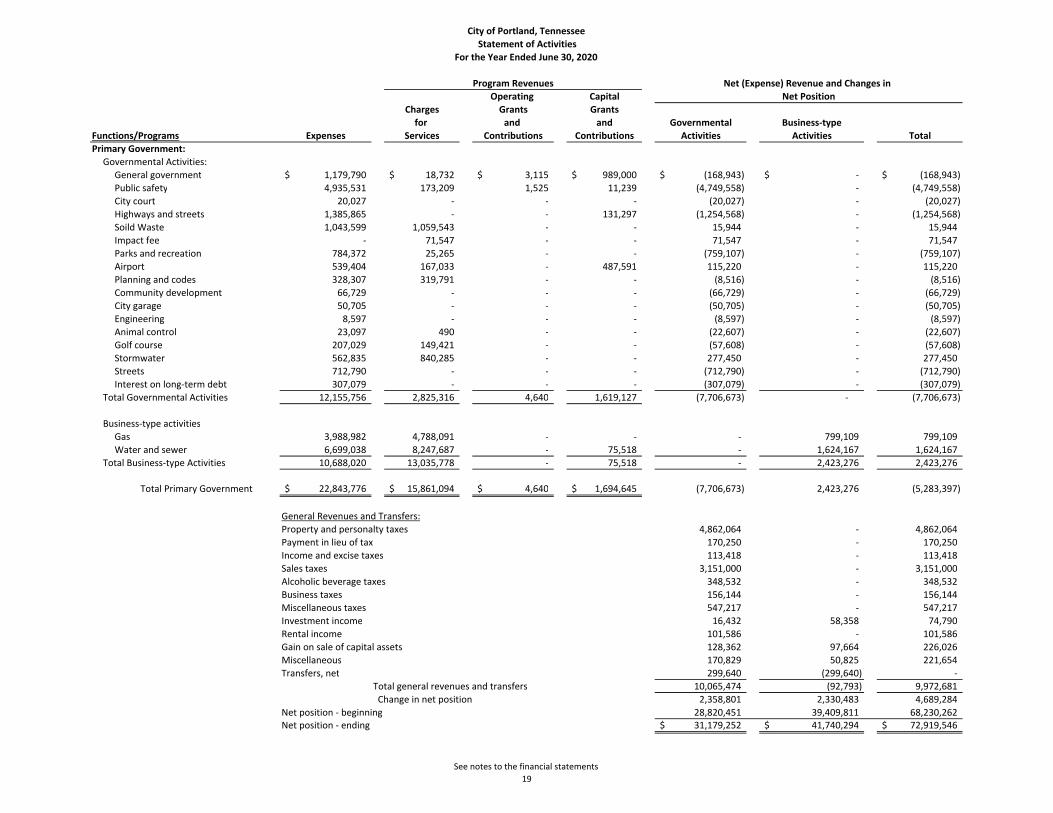
Operating Capital
Charges Grants Grants
for and and Governmental Business-type
Functions/Programs Expenses Services Contributions Contributions Activities Activities Total
Primary Government:
Governmental Activities:
General government 1,179,790$ 18,732$ 3,115$ 989,000$ (168,943)$ -$ (168,943)$
Public safety 4,935,531 173,209 1,525 11,239 (4,749,558) - (4,749,558)
City court 20,027 - - - (20,027) - (20,027)
Highways and streets 1,385,865 - - 131,297 (1,254,568) - (1,254,568)
Soild Waste 1,043,599 1,059,543 - - 15,944 - 15,944
Impact fee - 71,547 - - 71,547 - 71,547
Parks and recreation 784,372 25,265 - - (759,107) - (759,107)
Airport 539,404 167,033 - 487,591 115,220 - 115,220
Planning and codes 328,307 319,791 - - (8,516) - (8,516)
Community development 66,729 - - - (66,729) - (66,729)
City garage 50,705 - - - (50,705) - (50,705)
Engineering 8,597 - - - (8,597) - (8,597)
Animal control 23,097 490 - - (22,607) - (22,607)
Golf course 207,029 149,421 - - (57,608) - (57,608)
Stormwater 562,835 840,285 - - 277,450 - 277,450
Streets 712,790 - - - (712,790) - (712,790)
Interest on long-term debt 307,079 - - - (307,079) - (307,079)
Total Governmental Activities 12,155,756 2,825,316 4,640 1,619,127 (7,706,673) - (7,706,673)
Business-type activities
Gas 3,988,982 4,788,091 - - - 799,109 799,109
Water and sewer 6,699,038 8,247,687 - 75,518 - 1,624,167 1,624,167
Total Business-type Activities 10,688,020 13,035,778 - 75,518 - 2,423,276 2,423,276
Total Primary Government 22,843,776$ 15,861,094$ 4,640$ 1,694,645$ (7,706,673) 2,423,276 (5,283,397)
General Revenues and Transfers:
Property and personalty taxes 4,862,064 - 4,862,064
Payment in lieu of tax 170,250 - 170,250
Income and excise taxes 113,418 - 113,418
Sales taxes 3,151,000 - 3,151,000
Alcoholic beverage taxes 348,532 - 348,532
Business taxes 156,144 - 156,144
Miscellaneous taxes 547,217 - 547,217
Investment income 16,432 58,358 74,790
Rental income 101,586 - 101,586
Gain on sale of capital assets 128,362 97,664 226,026
Miscellaneous 170,829 50,825 221,654
Transfers, net 299,640 (299,640) -
Total general revenues and transfers 10,065,474 (92,793) 9,972,681
Change in net position 2,358,801 2,330,483 4,689,284
Net position - beginning 28,820,451 39,409,811 68,230,262
Net position - ending 31,179,252$ 41,740,294$ 72,919,546$
City of Portland, Tennessee
Statement of Activities
For the Year Ended June 30, 2020
Program Revenues Net (Expense) Revenue and Changes in
Net Position
See notes to the financial statements
19

Nonmajor TotalGeneral Governmental Governmental
Fund Funds FundsAssets
Cash and cash equivalents 4,014,355$ 1,256,358$ 5,270,713$ Receivables, net Property taxes 5,056,159 - 5,056,159 Customer 62,968 120,602 183,570 Due from other funds 1,023 2,620 3,643 Due from other governments 436,552 - 436,552 Inventories 59,885 35,137 95,022 Prepaid items 221,855 39,513 261,368 Restricted cash and cash equivalents 3,177,757 - 3,177,757
Total assets 13,030,554$ 1,454,230$ 14,484,784$
LiabilitiesAccounts payable and accrued liabilities 808,568$ 57,661$ 866,229$ Accrued payroll 119,178 21,075 140,253 Due to other funds 3,036 1,951 4,987
Total liabilities 930,782 80,687 1,011,469
Deferred Inflows of ResourcesUnavailable revenue - property taxes 4,852,413 - 4,852,413
Total deferred inflows of resources 4,852,413 - 4,852,413
Fund BalancesNonspendable 281,740 74,650 356,390 Restricted for: Airport - 40,418 40,418
Soild Waste - 268,851 268,851 Stormwater - 556,276 556,276 Drug enforcement - 20,587 20,587 Golf course - 56,452 56,452 Industrial revolving loan - 136,662 136,662 Impact fee - 219,647 219,647 Streets and highways 52,386 - 52,386 Day care 35,637 - 35,637 Committed to: Cable 20,171 - 20,171 Capital projects 76,194 - 76,194 SOR 9,085 - 9,085 Assigned to: Prior year encumbrances 3,128,734 - 3,128,734 Unassigned 3,643,412 - 3,643,412
Total fund balances 7,247,359 1,373,543 8,620,902
Total liabilities, deferred inflows of resources and fund balances 13,030,554$ 1,454,230$ 14,484,784$
City of Portland, TennesseeBalance Sheet
Governmental FundsJune 30, 2020
See notes to the financial statements20

Total fund balances, governmental funds 8,620,902$
Amounts reported for governmental activities in the statement of net position are different because:
Capital assets used in governmental activities are not financialresources and therefore are not reported in the funds. 34,707,819
Net pension asset and deferred outflows of resources that are not reported in the funds related to pensions. 1,859,154
Deferred outflows of resources that are not reported inthe funds related to OPEB. 45,043 Some liabilities, including bonds payable are not due and payablein the current period and therefore are not reported in the funds. (12,692,991)
Deferred inflows of resources that are not reported inthe funds related to pensions. (584,000)
Total OPEB liability and deferred inflows of resources that are not reported in the funds related to OPEB. (776,675)
Net Position of governmental activities 31,179,252$
City of Portland, TennesseeReconciliation of the Balance Sheet of Governmental Funds to
the Statement of Net PositionJune 30, 2020
See notes to the financial statements21

Nonmajor TotalGeneral Governmental Governmental
Fund Funds FundsRevenues:
Taxes 9,348,625$ -$ 9,348,625$ Licenses and permits 319,791 - 319,791 Fines and forfeitures 169,083 6,326 175,409 Charges for services 44,487 2,285,629 2,330,116 Federal and state grants 145,651 487,591 633,242 Investment income 14,511 1,921 16,432 Rental/property income 9,191 92,395 101,586 Miscellaneous and contribution income 1,131,678 11,095 1,142,773
Total Revenues 11,183,017 2,884,957 14,067,974
Expenditures:Current:
General government 729,106 - 729,106 Administrative and Mayor 230,549 - 230,549 Collection 67,360 - 67,360 Human resources 80,134 - 80,134 Planning & codes 328,715 - 328,715 Solid waste - 915,999 915,999 Engineering 9,275 - 9,275 Airport - 318,558 318,558 Golf course - 188,002 188,002 Court 20,027 - 20,027 Police department 3,030,427 532 3,030,959 Fire department 1,967,939 - 1,967,939 Streets and highways 971,167 - 971,167 City garage 52,145 - 52,145 Stormwater - 587,690 587,690 State Street Aid 10,084 - 10,084 Animal control 37,348 - 37,348 Swimming pool 25,097 - 25,097 Parks & recreation 613,022 - 613,022 Community development 69,032 - 69,032
Debt Service:Principal 698,998 84,336 783,334 Interest 307,079 7,151 314,230
Capital outlay 4,460,600 849,535 5,310,135 Total Expenditures 13,708,104 2,951,803 16,659,907
Excess (deficiency) of revenues over (under) expenditures (2,525,087) (66,846) (2,591,933)
Other Financing Sources (Uses)Insurance proceeds 11,856 7,475 19,331 Revolving loans - 270,000 270,000 Bond Premiums 215,248 - 215,248 Bond Discounts (34,294) - (34,294) Debt Proceeds 4,149,000 - 4,149,000 TIF Payments (8,503) - (8,503) Sale of capital assets 106,922 21,440 128,362 Operating transfers In 485,951 - 485,951 Operating transfers out (140,000) (46,311) (186,311)
Total other financing sources (uses) 4,786,180 252,604 5,038,784
Net Change in Fund Balance 2,261,093 185,758 2,446,851
Fund Balance - beginning 4,986,266 1,187,785 6,174,051
Fund Balance - end 7,247,359$ 1,373,543$ 8,620,902$
City of Portland, TennesseeStatement of Revenues, Expenditures, and Changes in Fund Balances
Governmental FundsFor the Year Ended June 30, 2020
See notes to the financial statements22

Net changes in fund balance - total governmental funds 2,446,851$
Amounts reported for governmental activities in the statement of activities are different because:
Governmental funds report capital outlays as expenditures. However, in the statement of activities the cost of those assets is allocated over their estimated useful lives and reported as depreciation expense. This is the amount by which depreciation exceeded capital outlays in the current period, net loss on disposal. 2,928,458
Governmental funds report retirement contributions as expenditures. These expendtiures are reported as deferred outflows of resources and either pension and OPEB income or expense in the government-wide financial statements. This is the amount by which pension income exceeds pension expenditures andOPEB income exceeds OPEB expenditures in the current period. 827,269
Revenues in the statement of activities that do not provide current financial resources are not reported as revenues in the funds. (270,000)
The issuance of long-term debt provides current financial resources to governmental funds, while the repayment of the principal of long-term debt consumes the current financial resources of governmental funds. Neither transaction has any effect on net position. Also, governmental funds report the effect of issuance costs, premiums, discounts, and similar items when debt is first issued, whereas these amounts are deferred and amortized in the statement of activities. This amount is the net effect of these differences in the treatment of long-term debt and related items. (3,571,355)
Expenses reported in the statement of activities that do not require the use of current financial resources are not reported as expenditures in the funds. (2,422)
Change in net position of governmental activities 2,358,801$
City of Portland, TennesseeReconciliation of the Statement of Revenues, Expenditures, and
Changes in Fund Balances of Governmental Funds to the Statement of Activities
For the Year Ended June 30, 2020
See notes to the financial statements23

Positive(Negative)
Variance withOriginal Final Actual Final Budget
Revenues Local taxes:
Property and personalty taxes 4,621,000$ 4,732,500$ 4,862,064$ 129,564$ Sales tax 1,875,000 1,875,000 2,090,728 215,728 Alcoholic beverage tax 341,000 321,000 348,532 27,532 Business tax 125,000 75,000 156,144 81,144 Cable TV franchise and lease tax 117,000 107,000 118,235 11,235
Licenses and permits 375,000 323,000 319,791 (3,209) Fines 185,000 154,500 169,083 14,583 Intergovernmental revenues:
Sales tax 1,048,000 956,375 1,060,272 103,897 Gasoline and motor fuel tax 400,000 395,000 406,191 11,191 Petroleum special tax 23,000 23,000 22,791 (209) Income tax 30,000 - 18,168 18,168 Corporate excise tax 65,000 95,250 95,250 - In lieu of tax 155,000 160,000 170,250 10,250 Federal and state grants - 266,475 145,651 (120,824)
Charges for services 70,750 40,600 44,487 3,887 Rental income 22,000 10,000 9,191 (809) Investment income 7,950 11,450 14,511 3,061 Miscellaneous and contribution income 70,500 1,122,575 1,131,678 9,103
Total revenues 9,531,200 10,668,725 11,183,017 514,292
Expenditures:Current:
General GovernmentSalaries, taxes and benefits 285,502 252,992 245,781 7,211 Repairs and maintenance 8,000 8,000 5,954 2,046 Supplies 57,000 78,000 79,885 (1,885) Utilities 51,000 65,500 63,367 2,133 Other operating expenses 127,297 245,569 204,108 41,461 Donations 90,000 90,000 88,625 1,375 Capital outlay 3,007,500 5,694,288 3,397,738 2,296,550 Grants, contracts and other - 42,000 41,386 614
3,626,299 6,476,349 4,126,844 2,349,505 Administrative & Mayor
Salaries, taxes and benefits 154,117 172,017 165,047 6,970 Repairs and maintenance 1,000 1,000 689 311 Supplies 1,250 1,250 728 522 Utilities 1,000 1,750 2,224 (474) Other operating expenses 48,314 71,314 61,861 9,453
205,681 247,331 230,549 16,782 Collection
Salaries, taxes and benefits 82,985 76,735 67,360 9,375 82,985 76,735 67,360 9,375
Human ResourcesSalaries, taxes and benefits 81,815 86,665 71,787 14,878 Supplies 2,000 1,500 438 1,062 Utilities 750 1,000 893 107 Other operating expenses 6,570 14,320 7,016 7,304 Capital outlay 2,000 1,000 - 1,000
93,135 104,485 80,134 24,351
(Continued on next page)
City of Portland, TennesseeStatement of Revenues, Expenditures, and Changes in Fund Balances
Budget and ActualGeneral Fund
For the Year Ended June 30, 2020
Budgeted Amounts
See notes to the financial statements24

Positive(Negative)
Variance withOriginal Final Actual Final Budget
Expenditures (continued):Planning
Salaries, taxes and benefits 110,395 143,620 141,058 2,562 Repairs and maintenance 1,500 1,000 254 746 Supplies 7,000 7,000 2,783 4,217 Utilities 1,500 1,500 1,905 (405) Other operating expenses 23,691 40,216 24,814 15,402 Capital outlay 2,500 22,750 7,811 14,939
146,586 216,086 178,625 37,461 Engineering
Salaries, taxes and benefits 1,000 10,000 6,465 3,535 Repairs and maintenance - 250 10 240 Supplies 500 500 69 431 Utilities 1,000 2,250 2,659 (409) Other operating expenses 2,000 2,100 72 2,028
4,500 15,100 9,275 5,825
CodesSalaries, taxes and benefits 137,849 141,099 137,915 3,184 Repairs and maintenance 11,000 9,000 4,653 4,347 Supplies 2,500 4,150 3,974 176 Other operating expenses 7,101 12,851 11,359 1,492 Capital outlay 1,500 13,250 11,600 1,650
159,950 180,350 169,501 10,849
CourtSalaries, taxes and benefits 13,325 13,325 12,961 364 Supplies 4,000 4,500 4,418 82 Utilities 250 - - - Other operating expenses 1,683 5,933 2,648 3,285 Capital outlay 750 - - -
20,008 23,758 20,027 3,731 Police Department
Salaries, taxes and benefits 2,668,665 2,532,665 2,410,292 122,373 Repairs and maintenance 70,000 68,000 53,626 14,374 Supplies 57,500 90,500 89,970 530 Utilities 66,250 68,250 61,925 6,325 Other operating expenses 511,633 493,033 414,614 78,419 Capital outlay 152,000 386,100 169,642 216,458
3,526,048 3,638,548 3,200,069 438,479 Fire Department
Salaries, taxes and benefits 1,672,182 1,766,182 1,749,497 16,685 Repairs and maintenance 41,000 49,175 51,133 (1,958) Supplies 31,500 36,500 36,957 (457) Utilities 74,000 78,750 73,679 5,071 Other operating expenses 62,708 62,458 56,673 5,785 Capital outlay 105,000 105,000 97,501 7,499
1,986,390 2,098,065 2,065,440 32,625 Streets and Highway Department
Salaries, taxes and benefits 517,615 519,115 506,771 12,344 Repairs and maintenance 62,000 189,500 168,135 21,365 Supplies 10,750 10,750 11,059 (309) Utilities 226,500 232,000 225,707 6,293 Other operating expenses 78,428 79,078 59,495 19,583 Capital outlay 20,000 47,464 21,552 25,912
915,293 1,077,907 992,719 85,188
(Continued on next page)
City of Portland, TennesseeStatement of Revenues, Expenditures, and Changes in Fund Balances (Continued)
Budget and ActualGeneral Fund
For the Year Ended June 30, 2020
Budgeted Amounts
See notes to the financial statements25
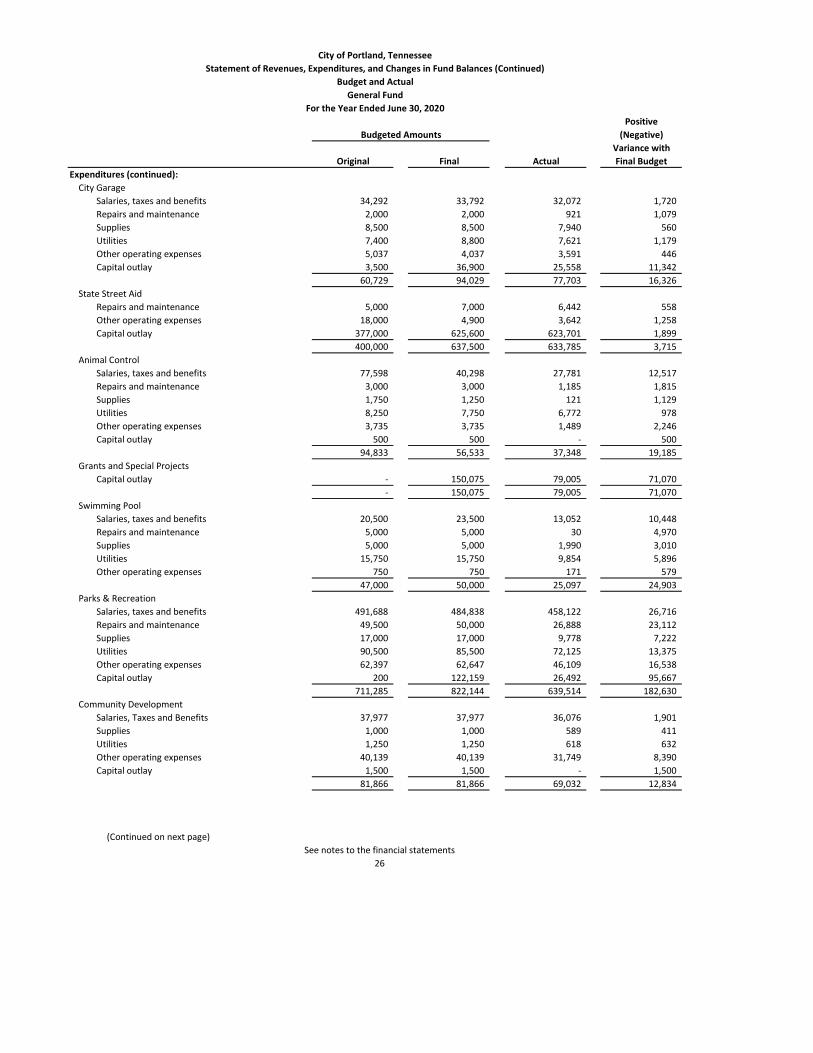
Positive(Negative)
Variance withOriginal Final Actual Final Budget
Expenditures (continued):City Garage
Salaries, taxes and benefits 34,292 33,792 32,072 1,720 Repairs and maintenance 2,000 2,000 921 1,079 Supplies 8,500 8,500 7,940 560 Utilities 7,400 8,800 7,621 1,179 Other operating expenses 5,037 4,037 3,591 446 Capital outlay 3,500 36,900 25,558 11,342
60,729 94,029 77,703 16,326 State Street Aid
Repairs and maintenance 5,000 7,000 6,442 558 Other operating expenses 18,000 4,900 3,642 1,258 Capital outlay 377,000 625,600 623,701 1,899
400,000 637,500 633,785 3,715 Animal Control
Salaries, taxes and benefits 77,598 40,298 27,781 12,517 Repairs and maintenance 3,000 3,000 1,185 1,815 Supplies 1,750 1,250 121 1,129 Utilities 8,250 7,750 6,772 978 Other operating expenses 3,735 3,735 1,489 2,246 Capital outlay 500 500 - 500
94,833 56,533 37,348 19,185 Grants and Special Projects
Capital outlay - 150,075 79,005 71,070 - 150,075 79,005 71,070
Swimming PoolSalaries, taxes and benefits 20,500 23,500 13,052 10,448 Repairs and maintenance 5,000 5,000 30 4,970 Supplies 5,000 5,000 1,990 3,010 Utilities 15,750 15,750 9,854 5,896 Other operating expenses 750 750 171 579
47,000 50,000 25,097 24,903 Parks & Recreation
Salaries, taxes and benefits 491,688 484,838 458,122 26,716 Repairs and maintenance 49,500 50,000 26,888 23,112 Supplies 17,000 17,000 9,778 7,222 Utilities 90,500 85,500 72,125 13,375 Other operating expenses 62,397 62,647 46,109 16,538 Capital outlay 200 122,159 26,492 95,667
711,285 822,144 639,514 182,630 Community Development
Salaries, Taxes and Benefits 37,977 37,977 36,076 1,901 Supplies 1,000 1,000 589 411 Utilities 1,250 1,250 618 632 Other operating expenses 40,139 40,139 31,749 8,390 Capital outlay 1,500 1,500 - 1,500
81,866 81,866 69,032 12,834
(Continued on next page)
City of Portland, TennesseeStatement of Revenues, Expenditures, and Changes in Fund Balances (Continued)
Budget and ActualGeneral Fund
For the Year Ended June 30, 2020
Budgeted Amounts
26See notes to the financial statements

Positive(Negative)
Variance withOriginal Final Actual Final Budget
Expenditures (continued):Principal 785,970 698,070 698,998 (928) Interest 326,142 344,922 307,079 37,843
1,112,112 1,042,992 1,006,077 36,915
Total Expenditures 13,274,700 17,089,853 13,708,104 3,381,749
Excess (deficiency) of revenues over (under) expenditures (3,743,500) (6,421,128) (2,525,087) 3,896,041
Other Financing Sources (Uses)Sale of capital assets 2,500 102,022 106,922 4,900 Insurance recoveries 10,000 12,000 11,856 (144) Bond Premiums - 215,248 215,248 - Bond Discounts - - (34,294) (34,294) Debt Proceeds 3,230,000 4,149,000 4,149,000 - TIF Payments - (8,500) (8,503) (3) Transfers in 311,000 485,750 485,951 201 Transfers out (210,000) (190,000) (140,000) 50,000
Total Other Financing Sources (Uses) 3,343,500 4,765,520 4,786,180 20,660
Net Change in Fund Balances (400,000)$ (1,655,608)$ 2,261,093 3,916,701$
Fund Balance - beginning 4,986,266
Fund Balance - end 7,247,359$
Budgeted Amounts
27See notes to the financial statements
City of Portland, TennesseeStatement of Revenues, Expenditures, and Changes in Fund Balances (Continued)
Budget and ActualGeneral Fund
For the Year Ended June 30, 2020

Gas Water & SewerFund Fund Total
AssetsCurrent assetsCash and cash equivalents 5,416,225$ 5,005,176$ 10,421,401$ Investments - 1,018,495 1,018,495 Receivables, customers, net 174,047 667,202 841,249 Due from other funds 1,620 1,078 2,698 Inventory 118,192 226,290 344,482 Prepaid expenses 23,170 110,858 134,028 Restricted cash and cash equivalents - 1,101,202 1,101,202 Net pension asset 200,684 567,979 768,663
Total current assets 5,933,938 8,698,280 14,632,218 Noncurrent assetsCapital assets, not being depreciated Land, right of ways, usages 240,061 1,046,621 1,286,682 Construction in progress - 1,551,141 1,551,141 Capital assets, being depreciated Plant and equipment 17,561,673 50,180,447 67,742,120 Less accumulated depreciation (6,572,961) (20,690,710) (27,263,671)
Total capital assets, net 11,228,773 32,087,499 43,316,272 Total assets 17,162,711 40,785,779 57,948,490
Deferred Outflows of ResourcesDeferred charge on refunding - 48,598 48,598 Related to pension 52,602 148,876 201,478 Related to OPEB 5,847 17,105 22,952
Total deferred outflows of resources 58,449 214,579 273,028
LiabilitiesCurrent LiabilitiesAccounts payable and accrued liabilities 100,879 405,114 505,993 Retainage payable - 161,540 161,540 Unearned revenue - 90,000 90,000 Accrued payroll 17,684 48,775 66,459 Accrued interest - 112,211 112,211 Due to other funds 604 750 1,354 Notes and bonds payable, current - 845,236 845,236
Total current liabilities 119,167 1,663,626 1,782,793 Noncurrent LiabilitiesAccrued compensated absences 32,683 76,072 108,755 Total OPEB liability 42,646 124,760 167,406 Notes and bonds payable, net of premiums and discounts - 13,889,170 13,889,170
Total noncurrent liabilities 75,329 14,090,002 14,165,331 Total liabilites 194,496 15,753,628 15,948,124
Deferred Inflows of ResourcesRelated to OPEB 58,174 170,185 228,359 Releated to pension 79,562 225,179 304,741
Total deferred inflows of resources 137,736 395,364 533,100
Net PositionNet investment in capital assets 11,228,774 18,015,711 29,244,485 Restricted for pension 200,684 567,979 768,663 Unrestricted 5,459,470 6,267,676 11,727,146
Total net position 16,888,928$ 24,851,366$ 41,740,294$
City of Portland, TennesseeStatement of Net Position
Proprietary FundsJune 30, 2020
Business-type Activities - Enterprise Funds
See notes to the financial statements28
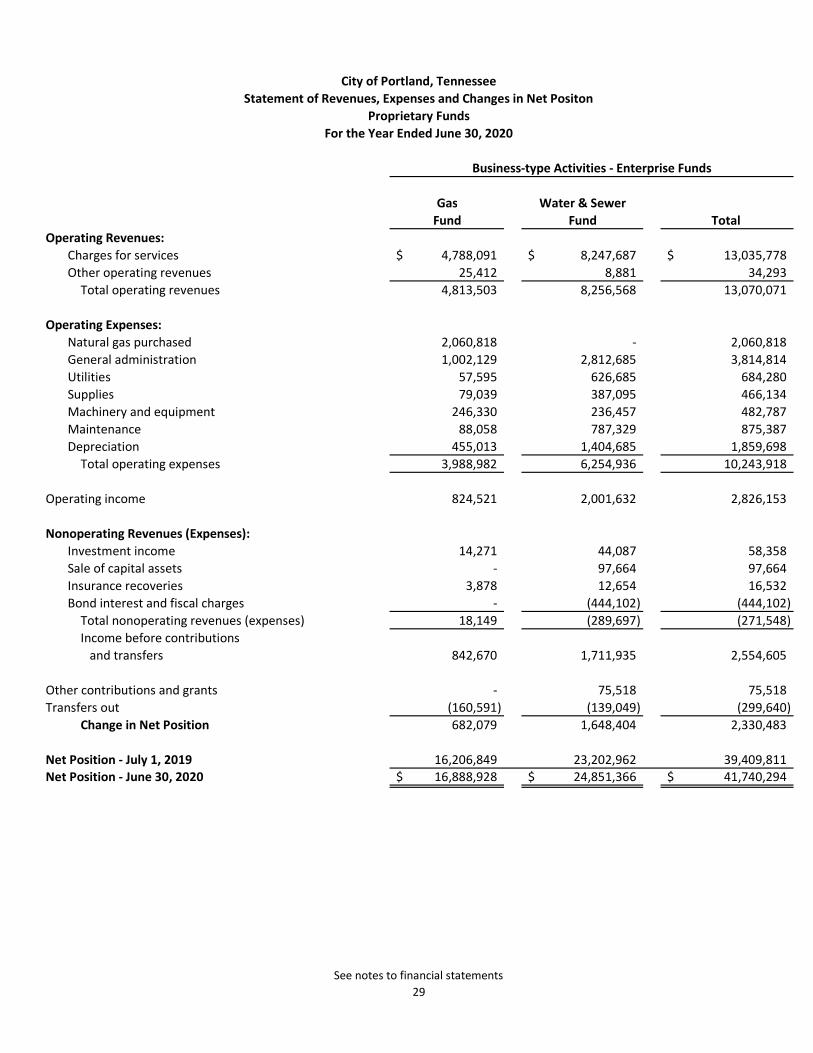
Gas Water & SewerFund Fund Total
Operating Revenues:Charges for services 4,788,091$ 8,247,687$ 13,035,778$ Other operating revenues 25,412 8,881 34,293
Total operating revenues 4,813,503 8,256,568 13,070,071
Operating Expenses:Natural gas purchased 2,060,818 - 2,060,818 General administration 1,002,129 2,812,685 3,814,814 Utilities 57,595 626,685 684,280 Supplies 79,039 387,095 466,134 Machinery and equipment 246,330 236,457 482,787 Maintenance 88,058 787,329 875,387 Depreciation 455,013 1,404,685 1,859,698
Total operating expenses 3,988,982 6,254,936 10,243,918
Operating income 824,521 2,001,632 2,826,153
Nonoperating Revenues (Expenses):Investment income 14,271 44,087 58,358 Sale of capital assets - 97,664 97,664 Insurance recoveries 3,878 12,654 16,532 Bond interest and fiscal charges - (444,102) (444,102)
Total nonoperating revenues (expenses) 18,149 (289,697) (271,548) Income before contributions and transfers 842,670 1,711,935 2,554,605
Other contributions and grants - 75,518 75,518 Transfers out (160,591) (139,049) (299,640)
Change in Net Position 682,079 1,648,404 2,330,483
Net Position - July 1, 2019 16,206,849 23,202,962 39,409,811 Net Position - June 30, 2020 16,888,928$ 24,851,366$ 41,740,294$
City of Portland, TennesseeStatement of Revenues, Expenses and Changes in Net Positon
Proprietary FundsFor the Year Ended June 30, 2020
Business-type Activities - Enterprise Funds
See notes to financial statements29

Gas Water & SewerFund Fund Total
Cash Flows from Operating Activities:Receipts from customers and users 4,811,523$ 8,088,638$ 12,900,161$ Payments to suppliers (2,531,840) (2,037,566) (4,569,406) Payments to employees (1,002,129) (2,812,685) (3,814,814)
Net cash provided by operating activities 1,277,554 3,238,387 4,515,941
Cash Flows from Noncapital Financing Activities:Transfers to other funds (160,591) (139,049) (299,640)
Net cash used by noncapital financing activities (160,591) (139,049) (299,640)
Cash Flows from Capital and Related Financing Activities:Capital contributions 1,980 167,930 169,910 Other contributions and grants - 75,518 75,518 Insurance recoveries 3,878 12,654 16,532 Sale of capital asset gain/(loss) - 97,664 97,664 Debt Proceeds - 237,000 237,000 Principal paid on capital debt - (791,115) (791,115) Interest paid on capital debt - (444,102) (444,102) Purchases and construction of capital assets (460,879) (2,495,671) (2,956,550)
Net cash used for capital and related financing activities (455,021) (3,140,122) (3,595,143)
Cash Flows from Investing Activities:Interest received 14,271 44,087 58,358
Net cash provided by investing activities 14,271 44,087 58,358
Net increase (decrease) in cash and cash equivalents 676,213 3,303 679,516
Cash and cash equivalents, beginning 4,740,012 6,020,368 10,760,380
Cash and cash equivalents, end 5,416,225$ 6,023,671$ 11,439,896$
Reconciliation of Operating Income to Net Cash Providedby Operating Activities:
Operating income 824,521$ 2,001,632$ 2,826,153$ Adjustments to reconcile operating Income to net cash
provided by operating activities:Depreciation and amortization 455,013 1,404,685 1,859,698
(Increase) decrease in:Receivable, net (67,075) 60,609 (6,466) Due from other governments - (62,964) (62,964) Due from other funds 982 (3,936) (2,954) Inventory (15,949) (7,890) (23,839) Prepaid expenses (1,575) (343) (1,918) Deferred outflow - pension and OPEB (55,286) (706,042) (761,328) Net pension asset 32,954 76,732 109,686
Increase (decrease) in:Accounts payable and accrued liabilities 97,151 550,935 648,086 Retainage payable - (55,231) (55,231) Unearned revenue - (2,000) (2,000) Accrued interest - 5,100 5,100 Accrued payroll (5,278) (10,774) (16,052) OPEB liability (89,941) (339,057) (428,998) Due to other funds 2,666 (663) 2,003 Deferred inflow - pension and OPEB 101,545 329,141 430,686 Compensated absences (2,174) (1,547) (3,721)
Net Cash Provided by Operating Activities 1,277,554$ 3,238,387$ 4,515,941$
Business-type Activities - Enterprise Funds
City of Portland, TennesseeStatement of Cash Flows
Proprietary FundsFor the Year Ended June 30, 2020
See notes to the financial statments30

AgencyFund
Assets
Cash and cash equivalents - restricted 5,510$
Total Assets 5,510$
Liabilities
Accrued liabilities 2,500$ Due to other funds 3,010
Total Liabilities 5,510$
City of Portland, TennesseeStatement of Fiduciary Net Position
Agency Fund - Statement of Assets and LiabilitiesJune 30, 2020
See notes to the financial statements31
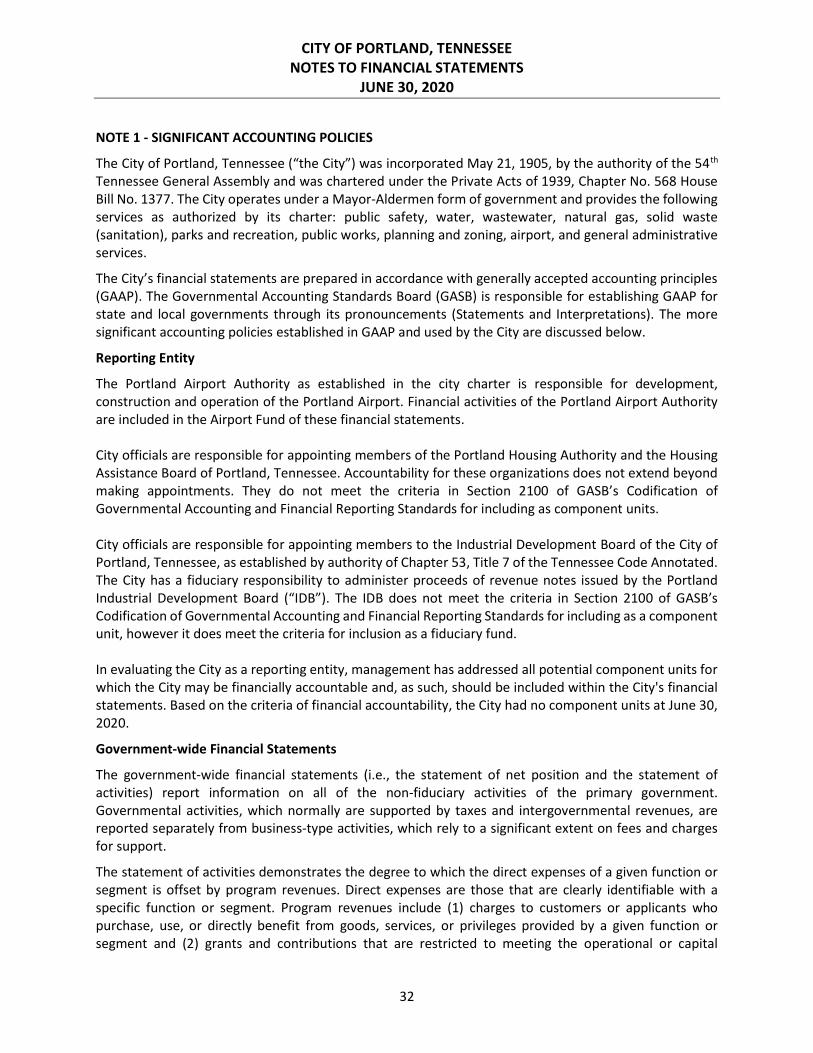
CITY OF PORTLAND, TENNESSEE NOTES TO FINANCIAL STATEMENTS
JUNE 30, 2020
32
NOTE 1 - SIGNIFICANT ACCOUNTING POLICIES
The City of Portland, Tennessee (“the City”) was incorporated May 21, 1905, by the authority of the 54th Tennessee General Assembly and was chartered under the Private Acts of 1939, Chapter No. 568 House Bill No. 1377. The City operates under a Mayor-Aldermen form of government and provides the following services as authorized by its charter: public safety, water, wastewater, natural gas, solid waste (sanitation), parks and recreation, public works, planning and zoning, airport, and general administrative services.
The City’s financial statements are prepared in accordance with generally accepted accounting principles (GAAP). The Governmental Accounting Standards Board (GASB) is responsible for establishing GAAP for state and local governments through its pronouncements (Statements and Interpretations). The more significant accounting policies established in GAAP and used by the City are discussed below.
Reporting Entity
The Portland Airport Authority as established in the city charter is responsible for development, construction and operation of the Portland Airport. Financial activities of the Portland Airport Authority are included in the Airport Fund of these financial statements. City officials are responsible for appointing members of the Portland Housing Authority and the Housing Assistance Board of Portland, Tennessee. Accountability for these organizations does not extend beyond making appointments. They do not meet the criteria in Section 2100 of GASB’s Codification of Governmental Accounting and Financial Reporting Standards for including as component units. City officials are responsible for appointing members to the Industrial Development Board of the City of Portland, Tennessee, as established by authority of Chapter 53, Title 7 of the Tennessee Code Annotated. The City has a fiduciary responsibility to administer proceeds of revenue notes issued by the Portland Industrial Development Board (“IDB”). The IDB does not meet the criteria in Section 2100 of GASB’s Codification of Governmental Accounting and Financial Reporting Standards for including as a component unit, however it does meet the criteria for inclusion as a fiduciary fund. In evaluating the City as a reporting entity, management has addressed all potential component units for which the City may be financially accountable and, as such, should be included within the City's financial statements. Based on the criteria of financial accountability, the City had no component units at June 30, 2020.
Government-wide Financial Statements
The government-wide financial statements (i.e., the statement of net position and the statement of activities) report information on all of the non-fiduciary activities of the primary government. Governmental activities, which normally are supported by taxes and intergovernmental revenues, are reported separately from business-type activities, which rely to a significant extent on fees and charges for support.
The statement of activities demonstrates the degree to which the direct expenses of a given function or segment is offset by program revenues. Direct expenses are those that are clearly identifiable with a specific function or segment. Program revenues include (1) charges to customers or applicants who purchase, use, or directly benefit from goods, services, or privileges provided by a given function or segment and (2) grants and contributions that are restricted to meeting the operational or capital

CITY OF PORTLAND, TENNESSEE NOTES TO FINANCIAL STATEMENTS (CONTINUED)
JUNE 30, 2020
33
requirements of a particular function or segment. Taxes and other items not properly included among program revenues are reported instead as general revenues. Separate financial statements are provided for governmental funds, proprietary funds and fiduciary funds. However, data from fiduciary funds are not incorporated in the government-wide financial statements. The government-wide financial statements are reported using the economic resources measurement focus and the accrual basis of accounting, as are the proprietary fund and fiduciary fund financial statements. Long-term assets, receivables, long-term debt and other obligations are recognized. Revenues are recorded when earned and expenses are recorded when a liability is incurred, regardless of the timing of related cash flows. Property taxes are recognized as revenues in the year for which they are assessed. Grants and similar items are recognized as revenue as soon as all eligibility requirements imposed by the provider have been met. Amounts reported as program revenues include (1) charges to customers or applicants for goods, services, or privileges provided, and (2) operating grants and contributions, and (3) capital grants and contributions. General revenues include all taxes and internally dedicated resources. Expenses are allocated among various City functions including administrative overhead charges allocated by the general fund to various City functions. As a rule, the effect of inter-fund activity has been eliminated from the government-wide financial statements. Exceptions to this general rule are payments-in-lieu of taxes and other charges between the government’s utilities and various other functions of the government. Elimination of these charges would distort the direct costs and program revenues reported for the various functions concerned.
Fund Financial Statements
The financial transactions of the City are reported in individual funds in the fund financial statements. Each fund is accounted for by providing a separate set of self-balancing accounts that comprise its assets, liabilities, fund equity, revenues and expenditures. Separate financial statements are provided for governmental funds, fiduciary funds and proprietary funds. Major individual governmental funds and major individual enterprise funds are reported as separate columns in the fund financial statements.
Measurement Focus, Basis of Accounting, and Basis of Presentation
Governmental Fund Financials
Governmental fund financial statements are reported using the current financial focus and the modified accrual basis of accounting. Revenues are recognized as soon as they are both measurable and available. Revenues are considered to be available when they are collectible within the current period or soon enough thereafter to pay liabilities of the current period. For this purpose, the City considers revenues to be available if they are collected within 60 days of the end of the current fiscal period. Expenditures are recorded when the related liability is incurred. However, debt service expenditures, as well as expenditures related to compensated absences and claims and judgements are recorded only when payment is due. Property taxes, intergovernmental revenues, and interest associated with the current fiscal period are all considered to be susceptible to accrual and so have been recognized as revenues of the current fiscal

CITY OF PORTLAND, TENNESSEE NOTES TO FINANCIAL STATEMENTS (CONTINUED)
JUNE 30, 2020
34
period using the criteria specified in the paragraph above. All other revenue items are considered to be measurable and available only when cash is received by the government. The City reports the following governmental funds:
General Fund - The government’s primary operating fund. It accounts for all financial resources of the general government, except those required to be accounted for in another fund. This fund is considered a major fund for reporting purposes.
Nonmajor governmental Funds – The special revenues fund of the City that are reported as nonmajor are as follows: Airport, Solid Waste (Sanitation), Stormwater, Industrial Revolving Loan, Drug Enforcement, Golf Course, and Impact Fee.
Since the governmental fund financial statements are presented on a different basis than the governmental activities column of the government-wide financial statements, a reconciliation is provided that explains the transition from one basis of accounting to another.
Proprietary Fund Financial Statements
The focus of the proprietary fund measurement is upon determination of operating income, changes in net position and cash flows. Proprietary funds distinguish operating revenues and expenses from nonoperating items. Operating revenues and expenses generally result from providing services and producing and delivering goods in connection with a proprietary fund’s principal ongoing operations.
The principal operating revenues of the various utility funds are charges to customers for sales and services. The Water & Sewer fund also recognizes as operating revenue the portion of tap fees intended to cover the cost of connecting new customers to the system. Operating expenses for the enterprise funds include the cost of sales and services, administrative expenses, and depreciation on capital assets. All revenues and expenses not meeting this definition are reported as nonoperating revenues and expenses.
The government reports the following major proprietary funds:
Water & Sewer Fund – accounts for the water and wastewater services provided to customers of the system.
Natural Gas Fund – accounts for the distribution of natural gas to customers of the system.
Fiduciary Fund Financial Statement
The Fiduciary fund financial statement consists of a Statement of Net Position for an agency fund of the Portland Industrial Development Board which are custodial in nature (assets equal liabilities) and do not involve measurement of results of operations. The agency fund is accounted for on a spending or “economic reasons” measurement focus and the accrual basis of accounting.
Estimates
The preparation of the financial statements in conformity with generally accepted accounting principles requires management to make estimates and assumptions that affect the amounts reported in the financial statements and accompanying notes. Actual results may differ from those estimates

CITY OF PORTLAND, TENNESSEE NOTES TO FINANCIAL STATEMENTS (CONTINUED)
JUNE 30, 2020
35
Budget and Budgetary Accounting
The City’s fiscal operating year begins July 1st. An annual operating budget is adopted by the Mayor and Board of Aldermen prior to the commencement of the fiscal year. The budget is legally enacted through the passage of an ordinance which also sets the tax rate. Any revision that alters the total appropriations of any fund requires the Board of Aldermen action. The budgetary basis is consistent with GAAP.
Cash and Cash Equivalents
For purposes of the proprietary statements of cash flows, the City defines its cash and cash equivalents to include only cash on hand, demand deposits, and all highly liquid investments with original maturities of three months or less from date of acquisition. Certain cash is reported as restricted because they are maintained in separate bank accounts and their use is either limited by applicable bond covenants or are restricted for use by outside parties or bond issues.
Investments consist of bank certificates of deposit with maturity in excess of three months from the date of purchase.
Inventories and Prepaid Items
Inventory of the Public Works and Solid Waste departments, Airport Authority, Water & Sewer and Gas Funds is stated at cost determined by the first-in, first-out (FIFO) method. The costs of governmental funds inventories are recorded as expenditures when purchased. Certain payments to vendors reflecting costs applicable to future accounting periods are recorded as prepaid items in both the government-wide and fund financial statements. The cost of prepaid items is recorded as expenditures/expenses when consumed rather than when purchased. The inventories and prepaid items recorded in the governmental funds do not reflect current appropriable resources and, thus, an equivalent portion of fund balance is reported as non-spendable.
Capital Assets
Capital assets, which include property, plant, equipment, and infrastructure assets are reported in the applicable governmental or business-type activities columns in the government-wide financial statements and the proprietary fund financial statements. Capital assets used in governmental fund operations are accounted for as capital outlay expenditures. Capital assets, not including general government infrastructure assets, are defined by the government as assets with an initial, total cost of more than $2,500 and an estimated useful life in excess of one year.
General government infrastructure assets with a total cost greater than $10,000 and an estimated useful life in excess of one year are capitalized. All capital assets are valued at historical cost or estimated historical cost if actual historical cost is not available. Donated fixed assets are valued at their estimated fair value on the date donated.
The costs of normal maintenance and repairs that do not add to the value of the asset or materially extend the asset lives are not capitalized.

CITY OF PORTLAND, TENNESSEE NOTES TO FINANCIAL STATEMENTS (CONTINUED)
JUNE 30, 2020
36
Depreciation has been provided over estimated useful lives using the straight-line method. The estimated useful lives are as follows:
Governmental Activities:
Buildings 40 years Improvements Other than Buildings 10-40 years Infrastructure Assets 15-50 years Machinery, Equipment, & Vehicles 5-40 years Business-type Activities:
Water and Sewer Plant 10-50 years Natural Gas Plant 10-50 years Machinery, Equipment, & Vehicles 5-15 years Furniture and Fixtures 5-15 years Property Tax
The City’s property tax is levied each October 1st on the assessed value listed as of the prior January 1st for all real and personal property located in the City’s legal boundaries. All City taxes on real estate are declared to be a lien on such realty from January 1st of the year assessments are made. Taxes become delinquent in March of the year subsequent to the levy date; at that time a lien attaches, and delinquent taxes are turned over for collection proceedings. Property tax revenues are recognized when levied. An allowance is established for delinquent taxes to the extent that their collectability is doubtful. Property taxes are treated as non-exchange revenue. Accounts receivable from imposed non-exchange transactions are recorded when the City has an enforceable legal claim to the asset. The enforceable legal claim date for property taxes is the assessment date of January 1st. Therefore, the City has recorded the succeeding year’s receivable and deferred inflows of resources for taxes assessed as of June 30, 2020 that will not be received until after year-end. Interfund Receivables, Payables, and Transfers
Activity between funds that are representative of lending/borrowing arrangements outstanding at the end of the fiscal year are referred to as either “due from/to other funds” (i.e. the current portion of inter-fund loans). Any residual balances outstanding between the governmental activities and the business-type activities are reported in the government-wide financial statements as “internal balances”.
Compensated Absences
The City’s policies permit employees to earn vacation time on a calendar-year basis. Any unused vacation leave at December 31 is forfeited. Vacation leave earned but unpaid at June 30, 2020 is accrued and presented as current liabilities in the government-wide and proprietary fund financial statements. The City’s policies permit the accumulation, within certain limitations, of unused sick leave with vesting of unused amounts upon retirement with no monetary payouts. In the fund financial statements, governmental funds report only the compensated absence liability payable from expendable available resources. The compensated absence liability attributable to the governmental activities will be liquidated primarily by the General Fund.

CITY OF PORTLAND, TENNESSEE NOTES TO FINANCIAL STATEMENTS (CONTINUED)
JUNE 30, 2020
37
Long-Term Liabilities
In the government-wide financial statements, and proprietary fund types in the fund financial statements, long-term debt and other long-term obligations are reported as liabilities in the applicable governmental activities, business-type activities, or proprietary fund type statement of net assets. Bond premiums and discounts are deferred and amortized straight-line over the life of the bonds that are reported net with bonds payable. Bond issue costs are expensed as incurred. In the fund financial statements, governmental fund types recognize bond premiums and discounts, as well as bond issuance costs, during the current period. The face amount of debt issued is reported as other financing sources while discounts on debt issuances are reported as other financing uses. Issuance costs, whether or not withheld from the actual debt proceeds received, are reported as debt service expenditures. Fund Balance
Fund balances are classified into clearly defined categories making the nature and extent of the constraints placed on a government’s fund balances more transparent. The following classifications describe the relative strength of the spending constraints as defined in the City’s fund balance policy.
Non-spendable Fund Balance - Amounts that cannot be spent because they are either in a (a) non-spendable form, including items not expected to be converted to cash (i.e. inventories, prepaid amounts, long-term portion of loans and notes receivable and property acquired for resale), or (b) legally or contractually required to be maintained intact (i.e. principal of permanent funds).
Restricted Fund Balance - Amounts constrained to be used for a specific purpose as per external parties, constitutional provision, or enabling legislation.
Committed Fund Balance - Amounts constrained to be used for a specific purpose as per action by the Board of Aldermen (by ordinance). Amounts classified as committed are not subject to legal enforceability like restricted resources; however, they cannot be used for any other purpose unless the Board removes or changes the commitment by taking the same action it employed to impose the commitment.
Assigned Fund Balance – Amounts intended to be used by the City for a specific purpose, but are neither restricted nor committed. The intent shall be expressed by the Board of Aldermen or a designee authorized by the Board of Aldermen. The nature of the actions necessary to remove of modify an assignment is not as rigid as required under a committed fund balance classification. It does not require formal action. This classification includes the remaining positive fund balance for all governmental funds except for the General Fund.
Unassigned Fund Balance – Amounts available for any purpose (amounts that are not non-spendable, restricted, committed or assigned) in the General Fund. It represents the resources available for future spending. This classification includes negative residual fund balances of any other governmental fund that cannot be eliminated by the offsetting of assigned fund balance amounts. An appropriate level of unassigned fund balance should be maintained in the General Fund in order to cover unexpected expenditures and revenue shortfalls.
When expenditures are incurred for purposes for which both restricted and unrestricted (committed, assigned or unassigned) amounts are available, it shall be the policy of the City to use the restricted
CITY OF PORTLAND, TENNESSEE NOTES TO FINANCIAL STATEMENTS (CONTINUED)
JUNE 30, 2020
38
amounts first as permitted under law. When an expenditure is incurred for purposes for which amounts in any of the unrestricted fund balance classifications could be used, it shall be the policy of the City to use the committed amounts first, followed by the assigned amounts and the unassigned amounts.
Net Position
Net position represents the difference between assets and deferred outflows of resources less liabilities and deferred inflows of resources. Government-wide and proprietary fund net position are divided into three components:
Net investment in capital assets - consist of the historical cost of capital assets less accumulated depreciation and less any debt that remains outstanding that was used to finance those assets plus deferred outflows of resources less deferred inflows of resources related to those assets. Restricted net position - consist of assets that are restricted by the City’s creditors (for example, through debt covenants), by the state enabling legislation (through restrictions on shared revenues), by grantors (both federal and state), and by other contributors (including those who have donated to the City less related liabilities and deferred inflows of resources). Restrictions from enabling legislation include the State Street Aid Fund, Solid Waste Fund, Stormwater Fund, SOR, Impact Fee Fund and Drug Fund. Unrestricted - all other net position is reported in this category.
When an expense is incurred that can be paid using either restricted or unrestricted resources (net position), the City’s policy is to first apply the expense toward restricted resources and then toward unrestricted resources. Pensions
For purposes of measuring the net pension liability, deferred outflows of resources and deferred inflows of resources related to pensions, and pension expense, information about fiduciary net position of the City’s participation in the Public Employee Retirement Plan of the Tennessee Consolidated Retirement System (TCRS), and additions to/deductions from the City’s fiduciary net position have been determined on the same basis as they are reported by TCRS for Public Employee Retirement Plan. For this purpose, benefits (including refunds of employee contributions) are recognized when due and payable in accordance with the benefit terms of the Public Employee Retirement Plan of TCRS. Investments are reported at their fair value. NOTE 2 – CASH AND CASH INVESTMENTS
The City has no formal deposit and investment policies other than those prescribed by State of Tennessee statute and explained below.
Policies: Deposits in financial institutions are required by State statute to be secured and collateralized by the institutions. The collateral must meet certain requirements and must have a total minimum market value of 105% of the value of the deposits placed in the institutions, less the amount protected by Federal Deposit Insurance Corporation Insurance (FDIC). Collateral requirements are not applicable for financial institutions that participate in the State of Tennessee’s collateral pool.

CITY OF PORTLAND, TENNESSEE NOTES TO FINANCIAL STATEMENTS (CONTINUED)
JUNE 30, 2020
39
Deposits: As of June 30, 2020, all of the City’s deposits were held by financial institutions which participate in the bank collateral pool administered by the Treasurer of the State of Tennessee. Participating banks in the bank collateral pool determine the aggregate balance of their public fund accounts. The amount of collateral required to secure these public deposits must be at least 105% of the average daily balance of public deposits held. Collected securities required to be pledged by the participant banks to protect their public fund accounts are pledged to the State Treasurer on behalf of the bank collateral pool. The securities pledged to protect these accounts are pledged in the aggregate rather than against each individual account. The members of the pool may be required by agreement to pay an assessment to cover any deficiency. Under the additional assessment agreement, public fund accounts covered by the pool are considered to be insured for purposes of custodial credit risk disclosure.
Investments: As of June 30, 2020, the City also held certificates of deposit with initial maturities of greater than three months which have been classified as investments. The certificates of deposit earn interest ranging from .15% to .75% and are invested with banks participating in the state bank collateral pool.
NOTE 3 - INTERFUND RECEIVABLES, PAYABLES, AND TRANSFERS
The composition of interfund balances as of June 30, 2020 is as follows:
All balances resulted from the time lag between the dates that (1) interfund goods and services are provided or reimbursable expenditures occur, (2) transactions are recorded in the accounting system, and (3) payments between funds are made. These balances will be repaid within one year.
Interfund Receivable
Interfund Payable
Major FundsGeneral Fund 1,023$ 3,036$
1,023 3,036 Nonmajor Funds
Airport Fund - 106 Stormwater 782 1,023 Solid Waste Fund 1,738 822 Golf Fund 100 -
2,620 1,951 Proprietary Funds
Water and Sewer Fund 1,078 750 Gas Fund 1,620 604
2,698 1,354 6,341$ 6,341$

CITY OF PORTLAND, TENNESSEE NOTES TO FINANCIAL STATEMENTS (CONTINUED)
JUNE 30, 2020
40
The composition of interfund transfers for the year ended June 30, 2020, is as follows:
NOTE 4 - CAPITAL ASSETS
A summary of changes in capital assets as presented in the governmental activities column of the government-wide financial statement is as follows:
From Fund To Fund AmountIndustrial Revolving Loan Fund General Fund 171,311$ Drug Fund General Fund 15,000 General Fund Airport Fund 50,000 General Fund Golf 90,000 Water and Sewer Fund General Fund 139,049 Gas Fund General Fund 160,591
Total Transfers 625,951$
Governmental ActivitiesBeginning Balance Deletions/ Ending Balance
July 1, 2019 Additions Adjustments June 30, 2020
Capital assets not being depreciated:
Land $ 6,267,174 $ 574,048 $ - $ 6,841,222
Construction in progress 743,181 3,913,669 (2,188,541) 2,468,309
Total Not Being Depreciated 7,010,355 4,487,717 (2,188,541) 9,309,531
Capital assets being depreciated:
Buildings and plant 12,167,259 769,145 - 12,936,404
Other improvements 7,019,712 516,811 - 7,536,523
Infrastructure 13,622,701 171,091 - 13,793,792
Machinery and equipment 6,241,716 634,769 (230,617) 6,645,868
Total Being Depreciated 39,051,388 2,091,816 (230,617) 40,912,587
Less: Accumulated Depreciation (14,267,682) (1,462,323) 215,706 (15,514,299)
Net Capital Assets Being Depreciated 24,783,706 629,493 (14,911) 25,398,288
Net Capital Assets $ 31,794,061 $ 5,117,210 $ (2,203,452) $ 34,707,819

CITY OF PORTLAND, TENNESSEE NOTES TO FINANCIAL STATEMENTS (CONTINUED)
JUNE 30, 2020
41
Depreciation expense was charged to functions/programs of the primary government as follows:
Business-type ActivitiesBeginning Balance Deletions/ Ending Balance
July 1, 2019 Additions Adjustments June 30, 2020
Capital assets not being depreciated:
Land $ 1,280,682 $ 6,000 $ - $ 1,286,682
Construction in progress 6,422,714 1,807,952 (6,679,525) 1,551,141
Total Not Being Depreciated 7,703,396 1,813,952 (6,679,525) 2,837,823
Capital assets being depreciated:
Water & Sewer plant 42,142,410 5,957,912 - 48,100,322
Natural Gas plant 15,604,830 665,610 - 16,270,440
Machinery, equipment & vehicles 3,137,462 606,759 (372,864) 3,371,357
Total Being Depreciated 60,884,702 7,230,281 (372,864) 67,742,119
Less: Accumulated Depreciation (25,691,099) (1,859,699) 287,127 (27,263,671)
Net Capital Assets Being Depreciated 35,193,603 5,370,582 (85,737) 40,478,448
Net Capital Assets $ 42,896,999 $ 7,184,534 $ (6,765,262) $ 43,316,271
Primary Government- Governmenta l Activi ties
89,081$
384,418
Parks & recreation 194,546
Planning and codes 5,827
Streets 429,925
Sol id Waste 78,483
Stormwater 32,085
Gol f course 29,011
Ai rport 218,947
Tota l Depreciation 1,462,323$
Primary Government-Bus iness -type Activi ties
1,404,686$
Natura l gas Fund 455,013
Tota l Depreciation 1,859,699$
General government
Publ ic sa fety
Water and sewer fund

CITY OF PORTLAND, TENNESSEE NOTES TO FINANCIAL STATEMENTS (CONTINUED)
JUNE 30, 2020
42
NOTE 5 - LONG-TERM OBLIGATIONS
Governmental Activities
Long-Term Debt
General Obligation Bonds and Capital Outlay Notes
The City has outstanding general obligation refunding bonds and capital outlay notes from direct borrowings and direct placements related to governmental activities totaling $10,390,000 and $1,830,512, respectively. Direct borrowings related to business-type activities include capital outlay notes and state revolving loans totaling $1,042,922 and water/sewer system refunding bonds of $13,035,000. Debt outstanding as of June 30, 2020 consisted of the following:
Interest Maturity Original Balance Rates Date Issue at Year End
Direct Borrowings:
Fire Dept. Note 2018 2.87% 2023 500,000$ 152,750$
Series 2013 (Fire Dept.) 3.78% 2022 378,000 92,700
Library Expansion Note 2011 2.35% 2020 675,000 -
Parks Dept. Note 2015 2.49% 2020 160,000 -
Police Dept. Note 2017 2.65% 2022 225,000 71,250
Police Dept Note 2018 3.16% 2023 225,000 123,750
Sanitation Truck 2018 3.78% 2023 267,000 160,200
Series 2014 3.78% 2023 154,500 84,000
Street Equipment 2015 2.17% 2020 150,000 7,500
Street Paving 2015 2.61% 2023 1,150,000 467,140
Parks Improvements 2017 2.65% 2027 150,000 102,500
Police/Fire Equipment 3.00% 2024 369,000 324,972
Sanitation Truck 2020 3.00% 2025 270,000 243,750
General Obligation Refunding Bonds, Series 2015 3.50% 2045 7,410,000 6,610,000
General Obligation Refunding Bonds, Series 20202.625-4.00% 2050 3,780,000 3,780,000
15,863,500$ 12,220,512$
Refunding Bonds, Series 2016 3.00% 2046 14,405,000$ 13,035,000$
Direct Borrowings
State Revolving Loan Fund 1.70% 2031 1,500,000 805,922
Capital Outlay Note-Equip 2.35% 2020 350,000 -
Capital Outlay Note-Equip 2.48% 2025 237,000 237,000
16,492,000$ 14,077,922$
Governmental activities:
Capital Outlay Notes:
General Obligation Bonds:
Business-type activities:
Water and Sewer System Refunding Bonds

CITY OF PORTLAND, TENNESSEE NOTES TO FINANCIAL STATEMENTS (CONTINUED)
JUNE 30, 2020
43
General obligation bonds, capital outlay notes and other loans are direct obligations and pledge the full faith and credit of the government. The City’s direct borrowings related to governmental and business-type activities require the same pledge of the full faith and credit; however, none of the direct borrowings contain any provision for acceleration of payments of principal or are secured by collateral. All bonds and other loans included in long-term debt as of June 30, 2020 will generally be retired from governmental or enterprise fund cash.
Governmental fund debt service requirements to maturity for bonds and notes payable are as follows:
Business-type Activities debt service requirements to maturity for bonds, notes, and loans payable are as follows:
Years Ending
June 30 Principal Interest
2021 811,920$ 383,937$
2022 785,670 370,021
2023 702,240 347,225
2024 439,660 329,131
2025 369,772 316,065
2026-2030 1,616,250 1,413,179
2031-2035 1,860,000 1,116,681
2036-2040 2,175,000 796,982
2041-2045 2,570,000 405,438
2046-2050 890,000 82,051
Total $ 12,220,512 $ 5,560,710
Years Ending
June 30 Principal Interest
2021 807,405$ 466,556$
2022 683,976 444,175
2023 570,128 424,748
2024 591,280 408,770
2025 597,468 394,531
2026-2030 2,948,748 1,717,865
2031-2035 2,963,917 1,200,351
2036-2040 2,485,000 691,843
2041-2045 1,990,000 270,225
2046 440,000 14,300
Total $ 14,077,922 $ 6,033,364

CITY OF PORTLAND, TENNESSEE NOTES TO FINANCIAL STATEMENTS (CONTINUED)
JUNE 30, 2020
44
A summary of long-term liability activity, including debt, for the year ended June 30, 2020 is as follows:
The bond resolution authorizing the Water and Sewer System Refunding and Improvement Bonds, Series 2016 shown above requires the City to establish a Debt Service Reserve Fund, a Bond and Interest Sinking Fund, and requires the City to establish rates to its customers in order to maintain a debt service coverage ratio of no less than 1.2 to 1.0 for the 2006 bonds and all prior lien bonds and 1 to 1 for all other obligations. These refunding bonds defeased certain outstanding bonds, which were retired in October 2016.
The City issued $15,560,000 in Water & Sewer System Refunding and Improvement Bonds, Series 2016 to refund certain outstanding debt of the City (Series 2006 and 2014 Bonds) and add approximately $8,500,000 in new monies. The new refunding bonds bear interest at rates that range between 2.50% and 4.00% per annum for the life of the bond. The City refunded $4,909,167 of Water & Sewer System Revenue Refunding Bonds, Series 2006 and $2,781,091 of Water & Sewer Bonds, Series 2014 with interest rates ranging from 3.875% to 4.375% for the Series 2006 and 2.400% for the Series 2014. The reacquisition price exceeded the net carrying amount of the old debt by $6,113. This amount is presented as a deferred outflow of resources and amortized over the remaining life of the refunding debt. The refunded debt reduced the City’s total debt service payments by $749,293 and resulted in an economic gain (difference between the present values of the debt service payments on the old and new debt) of $672,310.
Balance Balance AmountsJuly 01 June 30 Due Within2019 Increases Decreases 2020 One Year
Governmental Activities
General Obl igation bonds 6,790,000$ 3,780,000$ (180,000)$ 10,390,000$ 255,000$
Plus Bond Premium - 215,248 (7,135) 208,113 7,135
Les s bond dis count - 1,137 (34,294) (33,157) (1,137)
Tota l bonds payable 6,790,000 3,996,385 (221,429) 10,564,956 260,998
Private Placement Notes 1,790,160 639,000 (598,648) 1,830,512 556,920
Compens ated Abs ences 224,984 - - 224,984 -
Tota l OPEB Liabi l i ty 1,506,127 - (1,177,599) 328,528 -
Total governmental activi ties 10,311,271$ 4,635,385$ (1,997,676)$ 12,948,980$ 817,918$
Balance Balance AmountsJuly 01 June 30 Due Within2019 Increases Decreases 2020 One Year
Business-Type Activities
Water & Sewer Refunding & Improvement Bonds , Series 2016 13,715,000$ -$ (680,000)$ 13,035,000$ 700,000$
Plus Bond Premium 700,840 - (38,220) 662,620 38,220
Les s bond dis count (6,525) 389 - (6,136) (389)
Tota l bonds payable 14,409,315 389 (718,220) 13,691,484 737,831 Notes and Loans from Direct Borrowings
State Revolving Loan 870,370 - (64,448) 805,922 60,005
Capita l Outlay Notes 46,667 237,000 (46,667) 237,000 47,400
Compens ated Abs ences 105,034 3,721 - 108,755 -
Tota l OPEB Liabi l i ty 843,159 - (675,753) 167,406 -
Total bus ines s-type activities 16,274,545$ 241,110$ (1,505,088)$ 15,010,567$ 845,236$

CITY OF PORTLAND, TENNESSEE NOTES TO FINANCIAL STATEMENTS (CONTINUED)
JUNE 30, 2020
45
NOTE 6 – PENSION PLANS
General Information about the Pension Plan
Plan Description
Employees of the City are provided a defined benefit pension plan through the Public Employee Retirement Plan, an agent multiple-employer pension plan administered by the TCRS. The TCRS was created by state statute under Tennessee Code Annotated, Title 8, Chapters 34-37. The TCRS Board of Trustees is responsible for the proper operation and administration of the TCRS. The Tennessee Treasury Department, an agency in the legislative branch of state government, administers the plans of the TCRS. The TCRS issues a publicly available financial report that can be obtained at www.treasury.tn.gov/Retirement/Boards-and-Governance/Reporting-and-Investment-Policies.
Benefits provided
Tennessee Code Annotated Title 8, Chapters 34-37 establishes the benefit terms and can be amended only by the Tennessee General Assembly. The chief legislative body may adopt the benefit terms permitted by statute. Members are eligible to retire with an unreduced benefit at age 60 with 5 years of service credit or after 30 years of service credit regardless of age. Benefits are determined by a formula using the member’s highest five consecutive year average compensation and the member’s years of service credit. Reduced benefits for early retirement are available at age 55 and vested. Members vest with five years of service credit. Service related disability benefits are provided regardless of length of service. Five years of service is required for non-service related disability eligibility. The service related and non-service related disability benefits are determined in the same manner as a service retirement benefit but are reduced 10 percent and include projected service credits. A variety of death benefits are available under various eligibility criteria.
Member and beneficiary annuitants are entitled to automatic cost of living adjustments (COLAs) after retirement. A COLA is granted each July for annuitants retired prior to the 2nd of July of the previous year. The COLA is based on the change in the consumer price index (CPI) during the prior calendar year, capped at 3 percent, and applied to the current benefit. No COLA is granted if the change in the CPI is less than one-half percent. A one percent COLA is granted if the CPI change is between one-half percent and one percent. A member who leaves employment may withdraw their employee contributions, plus any accumulated interest.
Employees Covered by Benefit Terms. At the measurement date of June 30, 2019, the following employees were covered by the benefit terms:
Inactive employees or beneficiaries currently receiving benefits 58 Inactive employees entitled to but not yet receiving benefits 82 Active Employees 154 Total Employees 294
Contributions. Contributions for employees are established in the statutes governing the TCRS and may only be changed by the Tennessee General Assembly. Employees contribute 5 percent of salary. The City makes employer contributions at the rate set by the Board of Trustees as determined by an actuarial valuation. For the year ended June 30, 2020, employer contributions for the City were $214,592 based on a rate of 3 percent of covered payroll. By law, employer contributions are required to be paid. The TCRS may intercept the City’s state shared taxes if required employer contributions are not remitted. The

CITY OF PORTLAND, TENNESSEE NOTES TO FINANCIAL STATEMENTS (CONTINUED)
JUNE 30, 2020
46
employer’s ADC and member contributions are expected to finance the cost of benefits earned by during the year, the cost of administration, as well as an amortized portion of any unfunded liability.
Net Pension Liability (Asset)
The City’s net pension liability (asset) was measured as of June 30, 2019, and the total pension liability used to calculate net pension liability (asset) was determined by an actuarial valuation as of that date.
Actuarial Assumptions
The total pension liability as of June 30, 2019 actuarial valuation was determined using the following actuarial assumptions, applied to all periods included in the measurement:
Inflation 2.5 percent Salary increases Graded salary ranges from 8.72 to 3.44 percent based on
age, including inflation, averaging 4.00 percent Investment rate of return 7.25 percent, net of pension plan investment expenses,
including inflation Cost-of-Living Adjustment 2.25 percent
Mortality rates were based on actual experience including an adjustment for some anticipated improvement.
The actuarial assumptions used in the June 30, 2019 actuarial valuation were based on the results of an actuarial experience study performed for the period July 1, 2012 through June 30, 2016. The demographic assumptions were adjusted to more closely reflect actual and expected future experience.
The long-term expected rate of return on pension plan investments was established by the TCRS Board of Trustees in conjunction with the June 30, 2016 actuarial experience study. A blend of future capital market projections and historical market returns was used in a building-block method in which a best-estimate of future real rates of return (expected returns, net of pension plan investment expense and inflation) is developed for each major asset class. These best-estimates are combined to produce the long-term expected rate of return by weighting the expected future real rates of return by the target asset allocation percentage and by adding expected inflation of 2.5 percent.
The best estimates of geometric real rates of return and the TCRS investment policy target asset allocation for each major asset class are summarized in the following table:
Asset Class Long-Term Expected Real Rate of Return
Target Allocation
U.S. equity 5.69% 31% Developed market international equity 5.29% 14% Emerging market international equity 6.36% 4% Private equity and strategic lending 5.79% 20% U.S. fixed income 2.01% 20% Real estate 4.32% 10% Short-term securities 0.00 1% 100%

CITY OF PORTLAND, TENNESSEE NOTES TO FINANCIAL STATEMENTS (CONTINUED)
JUNE 30, 2020
47
Changes in Net Pension Liability (Asset)
The long-term expected rate of return on pension plan investments was established by the TCRS Board of Trustees as 7.25 percent based on a blending of the factors described above.
Discount rate. The discount rate used to measure the total pension liability was 7.25 percent. The projection of cash flows used to determine the discount rate assumed that employee contributions will be made at the current rate and that contributions from Portland will be made at the actuarially determined contribution rate pursuant to an actuarial valuation in accordance with the funding policy of the TCRS Board of Trustees and as required to be paid by state statute. Based on those assumptions, the pension plan’s fiduciary net position was projected to be available to make projected future benefit payments of current active and inactive members. Therefore, the long-term expected rate of return on pension plan investments was applied to all periods of projected benefit payments to determine the total pension liability.
Changes in the Net Pension Liability (Asset) Increase (Decrease)
Sensitivity of the Net Pension Liability (Asset) to Changes in the Discount Rate. The following presents the net pension liability (asset) of the City calculated using the discount rate of 7.25 percent, as well as what the net pension liability (asset) would be if it were calculated using a discount rate that is 1- percentage-point lower (6.25 percent) or 1-percentage-point higher (8.25 percent) than the current rate:
1% Decrease (6.25%)
Current Discount Rate
(7.25%) 1% Increase
(8.25%) Portland’s net pension liability (asset) $435,491 ($2,241,709) ($4,444,368)
Total Plan Net Pension Pension Liability Fiduciary Net Position Liability (Asset)
(a) (b) (a)– (b)
Balance at 6/30/18 $ 17,782,606 $ 19,580,085 $ (1,797,479)
Changes for the year:
Service cost 552,366 - 552,366
Interest 1,306,593 - 1,306,593
Differences between expected and actual experience
(139,442) - (139,442)
Changes in benefits - - -
Changes in assumptions - - -
Contributions-employer - 331,739 (331,739)
Contributions-employees - 383,706 (383,706)
Net investment income - 1,460,793 (1,460,793)
Benefit payments, including refunds of employee contributions
(625,990) (625,990) -
Administrative expense - (12,491) 12,491
Other changes - - -
Net changes 1,093,527 1,537,757 (444,230)
Balance at 6/30/19 $ 18,876,133 $ 21,117,842 $ (2,241,709)

CITY OF PORTLAND, TENNESSEE NOTES TO FINANCIAL STATEMENTS (CONTINUED)
JUNE 30, 2020
48
Pension Expense and Deferred Outflows of Resources and Deferred Inflows of Resources Related to Pensions
Pension expense. For the year ended June 30, 2020, the City recognized pension expense of $96,675
Deferred Outflows of Resources and Deferred Inflows of Resources. For the year ended June 30, 2020, Portland reported deferred outflows of resources and deferred inflows of resources related to pensions from the following sources:
The amount shown above for “Contributions subsequent to the measurement date of June 30, 2019,” will be recognized as a reduction (increase) to net pension liability (asset) in the following measurement period.
Amounts reported as deferred outflows of resources and deferred inflows of resources related to pensions will be recognized in pension expense as follows:
In the table shown above, positive amounts will increase pension expense while negative amounts will decrease pension expense. Payable to the Pension Plan At June 30, 2020, Portland reported a payable of $45,129 for the outstanding amount of contributions to the pension plan required at the year ended June 30, 2020.
Deferred Outflows of Resources
Deferred Inflows of Resources
Difference between expected and actua l experience
$ 178,213 $ 649,121
Net di fference between projected and actual earnings on pens ion plan inves tment
- 239,620
Changes in ass umptions 194,781 -
Tota l $ 587,586 $ 888,741
Contributions subsequent to the measurement date of June 30, 2018
214,592 (not appl i cable)
Year Ended June 30:
2021 (99,040)
2022 (184,722)
2023 (117,659)
2024 (85,050)
2025 (9,356)
Thereafter (19,920)

CITY OF PORTLAND, TENNESSEE NOTES TO FINANCIAL STATEMENTS (CONTINUED)
JUNE 30, 2020
49
NOTE 7 - OTHER POST-EMPLOYMENT BENEFITS Local Government OPEB Plan (LGOP) Plan description - Employees of the City of Portland, who were hired prior to July 1, 2015, are provided with pre-65 retiree health insurance benefits through the closed Local Government OPEB Plan (LGOP) administered by the Tennessee Department of Finance and Administration. This plan is considered to be multiple-employer defined benefit plan that is used to provide postemployment benefits other than pensions (OPEB). However, for accounting purposes, this plan will be treated as a single-employer plan. All eligible pre-65 retired employees and disability participants of local governments, who choose coverage, participate in the LGOP. This plan is closed to the employees of all participating employers that were hired on or after July 1, 2015.
Benefits provided - The City of Portland offers the LGOP to provide health insurance coverage to eligible pre-65 retirees and disabled participants of local governments. Insurance coverage is the only postemployment benefit provided to retirees. An insurance committee created in accordance with TCA 8-27-701 establishes and amends the benefit terms of the LGOP. All members have the option of choosing between the premier preferred provider organization (PPO), standard PPO, limited PPO or the wellness health savings consumer-driven health plan (CDHP) for healthcare benefits. Retired plan members, of the LGOP, receives the same plan benefits as active employees, at a blended premium rate that considers the cost of all participants. This creates an implicit subsidy for retirees. Participating employers determine their own policy related to direct subsidies provided for the retiree premiums.[Entities should insert language to explain their direct subsidy policy for pre-65 retiree insurance coverage or the fact that they do not directly subsidize and are only subject to the implicit]. The LGOP is funded on a pay-as-you-go basis and there are no assets accumulating in a trust that meets the criteria of paragraph 4 of GASB Statement No. 75.
Employees covered by benefit terms - At July 1, 2019, the following employees of City of Portland were covered by the benefit terms of the LGOP: Inactive employees currently receiving benefit payments 9 Inactive employees entitled to but not yet receiving benefit payments - Active employees 152 Total 161 An insurance committee, created in accordance with TCA 8-27-701, establishes the required payments to the LGOP by member employers and employees through the blended premiums established for active and retired employees. Claims liabilities of the plan are periodically computed using actuarial and statistical techniques to establish premium rates. For the fiscal year ended June 30, 2020, the City of Portland paid $40,341 to the LGOP for OPEB benefits as they came due.

CITY OF PORTLAND, TENNESSEE NOTES TO FINANCIAL STATEMENTS (CONTINUED)
JUNE 30, 2020
50
Actuarial assumptions - The total OPEB liability in the June 30, 2019 actuarial valuation was determined using the following actuarial assumptions and other inputs, applied to all periods included in the measurement, unless otherwise specified:
Inflation 2.25% Salary increases
Graded salary ranges from 3.44 to 8.72 percent based on age, including inflation, averaging 4 percent
Healthcare cost trend rates 6.03% for pre-65 for 2019, decreasing annually over a 10-year period to an ultimate rate of 4.50%. 5.20% for post-65 in 2019 decreasing annually over a 4 year period to an ultimate rate of 4.50%.
Retiree's share of benefit-related costs
Members are required to make monthly contributions in order to maintain their coverage. For the purpose of this Valuation a weighted average has been used with weights derived from the current distribution of members among plans offered.
Unless noted otherwise, the actuarial demographic assumptions used in the June 30, 2019, valuations were the same as those employed in the July 1, 2018 Pension Actuarial Valuation of the Tennessee Consolidated Retirement System (TCRS). These assumptions were developed by TCRS based on the results of an actuarial experience study for the period July 1, 2012 - June 30, 2016. The demographic assumptions were adjusted to more closely reflect actual and expected future experience. Mortality tables are used to measure the probabilities of participants dying before and after retirement. The mortality rates employed in this valuation are taken from the RP-2014 Healthy Participant Mortality Table for Annuitants for non-disabled post-retirement mortality, with mortality improvement projected to all future years using Scale MP-2016. Post-retirement tables are Blue Collar and adjusted with a 2% load for males and a -3% load for females. Mortality rates for impaired lives are the same as those used by TCRS and are taken from a gender distinct table published in the IRS Ruling 96-7 for disabled lives with a 10% load. Discount rate - The discount rate used to measure the total OPEB liability was 3.51 percent. This rate reflects the interest rate derived from yields on 20-year, tax-exempt general obligation municipal bonds, prevailing on the measurement date, with an average rating of AA/Aa as shown on the Fidelity 20-Year Municipal GO AA index.

CITY OF PORTLAND, TENNESSEE NOTES TO FINANCIAL STATEMENTS (CONTINUED)
JUNE 30, 2020
51
Changes in assumptions - The discount rate was changed from 3.62% as of the beginning of the measurement period to 3.51% as of June 30, 2019. This change in assumption decreased the total OPEB liability. It was also decided to change the status will increase the OPEB liability. Other changes in assumptions include adjustment to initial per capita cost and slight changes to the near term health trend rates. Changes in benefit terms- A change in benefit terms resulted in a $1,365,252 decrease in the City’s total OPEB liability. Sensitivity of total OPEB liability to changes in the discount rate - The following presents the total OPEB liability related to the LGOP, as well as what the total OPEB liability would be if it were calculated using a discount rate that is 1-percentage-point lower (2.51%) or 1-percentage-point higher (4.51%) than the current discount rate.
1% Decrease (2.51%)
Discount Rate (3.51%)
1% Increase (4.51%)
Total OPEB Liability $ 521,307 $ 484,320 $ 450,421 Sensitivity of total OPEB liability to changes in the healthcare cost trend rate - The following presents the total OPEB liability related to the LGOP, as well as what the total OPEB liability would be if it were calculated using a healthcare cost trend rate that is 1-percentage-point lower or 1-percentage-point higher than the current healthcare cost trend rate.
1% Decrease (5.03%/4.20% decreasing to
3.50%)
Healthcare Cost Trend Rates
(6.03%/5.20% decreasing to 4.50%)
1% Increase (7.03%/6.20%
decreasing to 5.50%) Total OPEB Liability $ 438,669 $ 484,320 $ 538,924
Total OPEB Liabil ity
(a)
2,206,992$
152,342
Interest 82,955
(1,365,252)
(475,369)
19,405
(136,753)
(1,722,672)
484,320$
Benefit payments
Net changes
Total OPEB l iabil ity - ending balance
Total OPEB l iabil ity- beginning balance
Changes for the year:
Service cost
Changes of benefit terms
Differences between expected and actual experience
Change in assumptions
Changes in the Total OPEB Liability
LGOP

CITY OF PORTLAND, TENNESSEE NOTES TO FINANCIAL STATEMENTS (CONTINUED)
JUNE 30, 2020
52
OPEB Expense and Deferred Outflows of Resources and Deferred Inflows of Resources Related to OPEB
OPEB expense - For the fiscal year ended June 30, 2020, the City recognized OPEB expense of $1,223,221.
Deferred outflows of resources and deferred inflows of resources - For the fiscal year ended June 30, 2020, the City reported deferred outflows of resources and deferred inflows of resources related to OPEB benefits in the LGOP from the following sources:
The amounts shown above for "Employer payments subsequent to the measurement date" will be recognized as a reduction to total OPEB liability in the following measurement period.
In the table above, positive amounts will increase OPEB expense while negative amounts will decrease OPEB expense.
LGOPDeferred
Outflows of res ources
Deferred Inflows of resources
Di fferences between actua l and expected experience $ 2,788 $ 413,793
Changes of as sumptions 16,891 251,392
Employer payments subsequent to the meas urement date 40,341 -
Tota l $ 60,020 $ 665,185
Amounts reported as deferred outflows of resources and deferred inflows of resources will be recognized in OPEB expense as follows: For the year ended June 30: 2021 (93,266) 2022 (93,266) 2023 (93,266) 2024 (93,266) 2025 (93,266) Thereafter (179,176)

CITY OF PORTLAND, TENNESSEE NOTES TO FINANCIAL STATEMENTS (CONTINUED)
JUNE 30, 2020
53
Tennessee Plan (TNP) Plan description - Employees of the City of Portland, who were hired prior to July 1, 2015, are provided with post-65 retiree health insurance benefits through the closed Tennessee Plan (TNP) administered by the Tennessee Department of Finance and Administration. This plan is considered multiple-employer defined benefit plan that is used to provide postemployment benefits other than pensions (OPEB). However, for accounting purposes, this plan will be treated as a single-employer plan. All eligible post-65 retirees and disability participants of local governments, who choose coverage, participate in the TNP. The TNP also includes eligible retirees of the state, certain component units of the state, and local education agencies. This plan is closed to the employees of all participating employers that were hired on or after July 1, 2015. Benefits provided - The state offers the TNP to help fill most of the coverage gaps created by Medicare for eligible post-65 retirees and disabled participants of local governments. Insurance coverage is the only postemployment benefit provided to retirees. The TNP does not include pharmacy. In accordance with TCA 8-27-209, benefits of the TNP are established and amended by cooperation of insurance committees created by TCA 8-27-201, 8-27-301 and 8-27-701. Retirees and disabled employees of the state, component units, local education agencies, and certain local governments who have reached the age of 65, are Medicare eligible and also receives a benefit from the Tennessee Consolidated Retirement System may participate in this plan. All plan members receive the same plan benefits at the same premium rates. Participating employers determine their own policy related to subsidizing the retiree premiums. The TNP is funded on a pay-as-you-go basis and there are no assets accumulating in a trust that meets the criteria of paragraph 4 of GASB Statement No. 75. Employees covered by benefit terms - At July 1, 2019, the following employees of the City of Portland were covered by the benefit terms of the TNP:
In accordance with TCA 8-27-209, the state insurance committees established by TCAs 8-27-201, 8-27-301 and 8-27-701 determine the required payments to the plan by member employers and employees. Claims liabilities of the plan are periodically computed using actuarial and statistical techniques to establish premium rates. Administrative costs are allocated to plan participants. Employers contribute towards employee costs based on their own developed policies. During the current reporting period, the City of Portland paid $447 to the TNP for OPEB benefits as they came due.
Inactive employees currently receiving benefit payments -
Inactive employees entitled to but not yet receiving benefit payments 3
Active employees -
Total 3

CITY OF PORTLAND, TENNESSEE NOTES TO FINANCIAL STATEMENTS (CONTINUED)
JUNE 30, 2020
54
Actuarial assumptions - The collective total OPEB liability in the June 30, 2019 actuarial valuation was determined using the following actuarial assumptions and other inputs, applied to all periods included in the measurement, unless otherwise specified
Inflation
2.25%
Salary increases
Graded salary ranges from 3.44 to 8.72 percent based on age, including inflation, averaging 4 percent
Healthcare cost trend rates The premium subsidies provided to retirees in the Tennessee Plan are assumed to remain unchanged for the entire projection; therefore, trend rates are not applicable.
Unless noted otherwise, the actuarial demographic assumptions used in the June 30, 2019, valuations were the same as those employed in the July 1, 2018 Pension Actuarial Valuation of the Tennessee Consolidated Retirement System (TCRS). These assumptions were developed by TCRS based on the results of an actuarial experience study for the period July 1, 2012 - June 30, 2016. The demographic assumptions were adjusted to more closely reflect actual and expected future experience. Mortality tables are used to measure the probabilities of participants dying before and after retirement. The mortality rates employed in this valuation are taken from the RP-2014 Healthy Participant Mortality Table for Annuitants for non-disabled post-retirement mortality, with mortality improvement projected to all future years using Scale MP-2016. Post-retirement tables are Blue Collar and adjusted with a 2% load for males and a -3% load for females. Mortality rates for impaired lives are the same as those used by TCRS and are taken from a gender distinct table published in the IRS Ruling 96-7 for disabled lives with a 10% load. Discount rate - The discount rate used to measure the total OPEB liability was 3.51 percent. This rate reflects the interest rate derived from yields on 20-year, tax-exempt general obligation municipal bonds, prevailing on the measurement date, with an average rating of AA/Aa as shown on the Bond Buyer 20-Year Municipal GO AA index.

CITY OF PORTLAND, TENNESSEE NOTES TO FINANCIAL STATEMENTS (CONTINUED)
JUNE 30, 2020
55
Changes in assumptions - The discount rate was changed from 3.62% as of the beginning of the measurement period to 3.51% as of June 30, 2019. This change in assumption increased the total OPEB liability. Changes in benefit terms- A change in benefit terms resulted in a $144,994 decrease in the City’s total OPEB liability. Sensitivity of total OPEB liability to changes in the discount rate - The following presents the total OPEB liability related to the TNP, as well as what the total OPEB liability would be if it were calculated using a discount rate that is 1-percentage-point lower or 1-percentage-point higher than the current discount rate.
1% Decrease (2.51%)
Discount Rate (3.51%)
1% Increase (4.51%)
Total OPEB Liability $ 12,878 $ 11,614 $ 10,531
Tota l OPEB Liabi l i ty
(a )
142,294$
3,932
Interest 5,279
(144,994)
5,776
127
(800)
(130,680)
11,614$
Changes in the Total OPEB Liability
TNP
Benefi t payments
Net changes
Tota l OPEB l iabi l i ty - ending balance
Tota l OPEB l iabi l i ty - beginning ba lance
Changes for the year:
Service cost
Changes of benefi t terms
Di fferences between expected and actua l experience
Change in ass umptions

CITY OF PORTLAND, TENNESSEE NOTES TO FINANCIAL STATEMENTS (CONTINUED)
JUNE 30, 2020
56
OPEB Expense and Deferred Outflows of Resources and Deferred Inflows of Resources Related to OPEB
OPEB expense - For the fiscal year ended June 30, 2020, the City recognized OPEB expense of $136,477.
Deferred outflows of resources and deferred inflows of resources - For the fiscal year ended June 30, 2020, the City reported deferred outflows of resources and deferred inflows of resources related to OPEB benefits in the TNP from the following sources:
The amounts shown above for "Employer payments subsequent to the measurement date" will be recognized as a reduction to total OPEB liability in the following measurement period.
In the table above, positive amounts will increase OPEB expense while negative amounts will decrease OPEB expense.
TNPDeferred
Outflows of resources
Deferred Inflows of resources
Di fferences between actual and expected experience $ 7,416 $ -
Changes of as sumptions 112 11,321
Employer payments subsequent to the meas urement date 447 -
Tota l $ 7,975 $ 11,321
Amounts reported as deferred outflows of resources and deferred inflows of resources will be recognized in OPEB expense as follows: TNP For the year ended June 30: 2021 (694) 2022 (694) 2023 (694) 2024 (694) 2025 (694) Thereafter (323)

CITY OF PORTLAND, TENNESSEE NOTES TO FINANCIAL STATEMENTS (CONTINUED)
JUNE 30, 2020
57
NOTE 8 - RISK MANAGEMENT
The City is exposed to various risks to general liability and property and casualty losses. The City deems it was more economically feasible to participate in a public entity risk pool as opposed to purchasing commercial insurance for general liability, property, casualty and workman’s compensation coverage. The City participates in the TML Risk Pool which is a public entity risk pool established by the Tennessee Municipal League, an association of member Cities. The City pays an annual premium to the TML for its general liability, law enforcement liability, errors and omissions liability, auto liability, workers’ compensation and property coverage. The City’s workers’ compensation coverage is retrospectively rated, whereby premiums are accrued based on the ultimate costs of the experience of the City. Claims arising are paid by the Pool. The Pool has the right to assess participants for loss experience in excess of premiums collected. The City also obtains commercial insurance coverage for accidents and sick-leave for volunteer firemen. Insurance recoveries during 2020 were approximately $35,853. Settled claims have not exceeded insurance coverage since 2008.
NOTE 9 – COMMITMENTS AND CONCENTRATIONS
Commitments
The City is committed on future capital expenditures for projects ongoing at June 30, 2020:
The City of Portland and Sumner County Government have adopted the Tax Increment Financing Program established by the Industrial Development Board (IDB) of Sumner County. TIF is an economic development tool that allocates all or a portion of the new, additional taxes generated by a development over a specified period of time to pay for infrastructure such as utility and road improvements related to that development.
The TIF Program is primarily for the economic development projects that provide improvements in underutilized areas. This program applies only to projects initiated by a private developer and supported
Amt Thru Additional Total6/30/2020 Commitment Project
Governmental Funds ProjectsCity Hall Renovation/Addition 2,668,084$ -$ 2,668,084$ Gateview Road 70,745$ 69,255$ 140,000$
Water & Sewer FundWaste Water Collection System Upgrade 1,043,075$ 78,210$ 1,121,285$ City Hall Renovation/Addition -$ 1,131,625$ 1,131,625$ Lyon Drive Lift Station 343,005$ 226,100$ 569,105$ West Side Sewer Interceptor 115,580$ 18,495$ 134,075$ WB Dye Water Line -$ 130,000$ 130,000$ AMR Project -$ 150,000$ 150,000$
Gas FundCity Hall Renovation/Addition -$ 1,131,625$ 1,131,625$ AMR Project 505,991$ 19,009$ 525,000$
CITY OF PORTLAND, TENNESSEE NOTES TO FINANCIAL STATEMENTS (CONTINUED)
JUNE 30, 2020
58
by tax increment property tax revenues. It is a discretionary program and does not create or vest any rights in any person or entity.
Concentrations
The business-type activities have a concentration of accounts receivable with customers who are geographically concentrated in the City service area. The business-type activities require a cash deposit from new customers or a letter of credit from a previous utility company showing timely payment of bills. These requirements are in place to mitigate the risk of uncollectible accounts.
NOTE 10 - SUBSEQUENT EVENTS
Management has evaluated subsequent events through December 07, 2020, which is the date the financial statements were available to be issued. The full impact of the COVID-19 outbreak continues to evolve as of December 07, 2020. As such, it is uncertain as to the full magnitude that the pandemic will have on the City’s financial condition and future results of operations. Management is actively monitoring the situation on its financial condition, liquidity, operations, suppliers, and workforce. Given the daily evolution of the COVID-19 outbreak and the global responses to curb its spread, there is no estimate as to the effects of the COVID-19 outbreak on its results of operations, financial condition, or liquidity for the fiscal year 2021.

REQUIRED SUPPLEMENTARY INFORMATION

LGOP2018 2019 2020
Total OPEB liability Service cost 149,187$ 141,202$ 152,342$ Interest 70,860 85,728 82,955 Changes of benefit terms - - (1,365,252) Differences between expected and actual experience - 3,512 (475,369) Changes of assumptions (106,826) (225,062) 19,405 Benefit payments (117,143) (130,554) (136,753) Net change in total OPEB liability (3,922) (125,174) (1,722,672) Total OPEB liability - beginning 2,336,088 2,332,166 2,206,992 Total OPEB liability - ending (a) 2,332,166$ 2,206,992$ 484,320$
Covered-employee payroll 6,901,160$ 7,688,246$ 7,705,243$ Total OPEB liability as a percentage of covered-employee payroll 33.79% 28.71% 6.29%
**There are no assets accumulating, in a trust that meets the criteria in paragraph 4 of GASB Statement No. 75, related to this OPEB plan. The amounts reported for each fiscal year were determined as of the prior fiscal year-end. This schedule is intended to display ten years of information. Additional years will be displayed as they become available.
City of Portland, TennesseeSchedule of Changes in Total OPEB Liability and Related Ratios
For the Fiscal Year Ended June 30
See independent auditor's report59

TNP2018 2019 2020
Total OPEB liability Service cost 6,603$ 5,095$ 3,932$ Interest 3,727 4,844 5,279 Changes of benefit terms - - (144,994) Differences between expected and actual experience - 3,156 5,776 Changes of assumptions (15,184) (1,399) 127 Benefit payments (15,300) (738) (800) Net change in total OPEB liability (20,154) 10,958 (130,680) Total OPEB liability - beginning 151,490 131,336 142,294 Total OPEB liability - ending (a) 131,336$ 142,294$ 11,614$
Covered-employee payroll 6,901,160$ 7,688,246$ 7,705,243$ Total OPEB liability as a percentage of covered-employee payroll 1.90% 1.85% 0.15%
**There are no assets accumulating, in a trust that meets the criteria in paragraph 4 of GASB Statement No. 75, related to this OPEB plan. The amounts reported for each fiscal year were determined as of the prior fiscal year-end. This schedule is intended to display ten years of information. Additional years will be displayed as they become available.
City of Portland, TennesseeSchedule of Changes in Total OPEB Liability and Related Ratios
For the Fiscal Year Ended June 30
See independent auditor's report.60

2014 2015 2016 2017 2018 2019Total Pension Liability (Asset)Service Cost 423,986$ 409,779$ 423,986$ 578,391$ 573,359$ 552,366$ Interest 1,128,066 1,040,811 1,128,066 1,208,654 1,217,498 1,306,593 Changes in Benefit Terms - - - - - - Differences Between Actual and Expected Experience 36,093 384,722 36,093 (816,907) 73,950 (139,442) Change of Assumptions - - - 340,869 - - Benefit Payments, Including Refunds of Employee Contributions (683,337) (688,881) (683,337) (652,758) (603,825) (625,990) Net Change in Total Pension Liability (Asset) 904,808 1,146,431 904,808 658,249 1,260,982 1,093,527 Total Pension Liability (Asset), Beginning 14,958,567 13,812,136 14,958,567 15,863,375 16,521,624 17,782,606 Total Pension Liability (Asset), Ending (a) 15,863,375$ 14,958,567$ 15,863,375$ 16,521,624$ 17,782,606$ 18,876,133$
Plan Fiduciary Net PositionContributions - Employer 587,552$ 526,805$ 587,552$ 631,603$ 477,517$ 331,739$ Contributions - Employee 276,673 248,121 276,673 297,087 368,786 383,706 Net Investment Income 405,013 452,471 405,013 1,804,246 1,491,884 1,460,793 Benefit Payments, Including Refunds of Employee Contributions (683,337) (688,881) (683,337) (652,758) (603,825) (625,990) Administrative Expense (9,659) (5,977) (9,659) (11,315) (12,580) (12,491) Net Change in Plan Fiduciary Net Position 576,242 532,539 576,242 2,068,863 1,721,782 1,537,757 Plan Fiduciary Net Position, Beginning 15,213,198 14,680,659 15,213,198 15,789,440 17,858,303 19,580,085 Plan Fiduciary Net Position, Ending (b) 15,789,440$ 15,213,198$ 15,789,440$ 17,858,303$ 19,580,085$ 21,117,842$
Net Pension Liability (Asset), Ending (a - b) 73,935$ (254,631)$ 73,935$ (1,336,679)$ (1,797,479)$ (2,241,709)$
Plan Fiduciary Net Position as a Percentage of Total Pension Liability 99.53% 101.70% 99.53% 108.09% 110.11% 111.88%Covered Employee Payroll 5,527,302$ 4,955,832$ 5,527,302$ 5,941,704 6,366,885 6,634,785 Net Pension Liability (Asset) as a Percentage of Covered Employee Payroll 1.34% -5.14% 1.34% -22.50% -28.23% -33.79%
**GASB 68 requires a 10-year schedule for this data to be presented starting with the implementation of GASB 68. Theinformation in this schedule is not required to be presented retroactively prior to the implementation date. Please refer topreviously supplied data from TCRS GASB website for prior years’ data, if needed.
Changes of assumptions. In 2017, amounts reported as changes of assumptions resulted from changes to the inflation rate, investment
rate of return, cost-of-living adjustment, salary growth and mortality improvements.
City of Portland, TennesseeSchedule of Changes in Net Pension Liability (Asset) and Related Ratios Based on
Participation in the Public Employee Pension Plan of TCRSGeneral Government Employees
For the Fiscal Year Ended June 30
See independent auditor's report61

2014 2015 2016 2017 2018 2019 2020Actuarially Determined Contribution 495,742$ 526,805$ 587,552$ 620,314$ 306,247$ 192,409$ 214,592$
Contributions in relation to the actuarially determined contribution 495,742 526,805 577,156 631,603 477,517 331,739 214,592 Contribution deficiency (excess) -$ -$ 10,396$ (11,289)$ (171,270)$ (139,330)$ -$
Covered Payroll 4,775,917$ 4,955,832$ 5,527,302$ 5,941,704$ 6,366,885$ 6,634,785$ 7,463,992$
Contributions as a Percentage of Covered Payroll 10.38% 10.63% 10.44% 10.63% 7.50% 5.00% 2.88%
**GASB 68 requires a 10-year schedule for this data to be presented starting with the implementation of GASB 68. Theinformation in this schedule is not required to be presented retroactively prior to the implementation date. Please refer topreviously supplied data from TCRS GASB website for prior years’ data, if needed.
City of Portland, TennesseeSchedule of Contributions Based on Participation in the Public
Employee Pension Plan of TCRSFor the Fiscal Year Ended June 30
See independent auditor's report.62

CITY OF PORTLAND, TENNESSEE
NOTES TO REQUIRED SUPPLEMENTARY INFORMATION
For the Year Ended June 30, 2020
See independent auditor’s report 63
Valuation date: Actuarially determined contribution rates for fiscal year 2020 were calculated based on the June 30, 2018 actuarial valuation.
Methods and assumptions used to determine contribution rates:
Actuarial Cost Method Entry Age Normal Amortization Method Level dollar, closed (not to exceed 20 years) Remaining Amortization Period
Varies by Year Asset Valuation 10-Year Smoothed Within a 20% Corridor to Market
Value Inflation 2.50% Salary Increases Graded Salary Ranges from 8.72% to 3.44% Based on
Age, Including Inflation, Averaging 4.00% Investment Rate of Return 7.25%, Net of Investment Expense, Including Inflation Retirement Age Pattern of Retirement Determined by Experience Study Mortality Customized Table Based on Actual Experience Including
an Adjustment for Some Anticipated Improvement Cost of Living Adjustment 2.25%
Changes of assumptions. In 2017, the following assumptions were changed: decreased inflation rate from 3.00 percent to 2.50 percent; decreased the investment rate of return from 7.50 percent to 7.25 percent; decreased the cost-of-living adjustment from 2.50 percent to 2.25 percent; decreased salary growth graded ranges from an average of 4.25 percent to an average of 4.00 percent; and modified mortality assumptions.

OTHER SUPPLEMENTARY INFORMATION

NonmajorCapital Projects
Funds TotalGolf Impact Revolving Nonmajor
Airport Solid Waste Stormwater Drug Course Fees Loan GovernmentalFund Fund Fund Fund Fund Fund Fund Funds
Cash & cash equivalents 43,467$ 225,729$ 541,797$ 27,964$ 61,092$ 219,647$ 136,662$ 1,256,358$ Receivables, net - 83,902 36,700 - - - - 120,602 Due from other funds - 1,738 782 - 100 - - 2,620 Prepaid items and other assets 11,032 17,295 7,294 - 3,892 - - 39,513 Inventory 21,492 13,645 - - - - - 35,137
Total assets 75,991 342,309 586,573 27,964 65,084 219,647 - 136,662 1,454,230
Accounts payable 554 34,353 13,456 7,377 1,921 - - 57,661 Accrued payroll 2,389 7,343 8,524 - 2,819 - - 21,075 Due to other funds 106 822 1,023 - - - - 1,951
Total liabilities 3,049 42,518 23,003 7,377 4,740 - - 80,687
NonspendableInventory and prepaid items 32,524 30,940 7,294 - 3,892 - - 74,650
Restricted For:Airport 40,418 - - - - - - 40,418 Solid waste - 268,851 - - - - - 268,851 Stormwater - - 556,276 - - - - 556,276 Drug control - - - 20,587 - - - 20,587 Golf course - - - - 56,452 - - 56,452 Revolving loans - - - - - - 136,662 136,662 Impact fee - - - - - 219,647 - 219,647
Total fund balances 72,942 299,791 563,570 20,587 60,344 219,647 136,662 1,373,543
Total liabilities and fund balances 75,991$ 342,309$ 586,573$ 27,964$ 65,084$ 219,647$ 136,662$ 1,454,230$
Liabilities
Fund Balances
City of Portland, TennesseeCombining Balance Sheet
Nonmajor Governmental FundsJune 30, 2020
Special Revenue Funds
Assets
See independent auditor's report.64

NonmajorCapital Projects
Funds TotalGolf Impact Revolving Nonmajor
Airport Solid Waste Stormwater Drug Course Fees Loan GovernmentalFund Fund Fund Fund Fund Fund Fund Funds
RevenuesCharges for services 167,033$ 1,059,543$ 838,085$ -$ 149,421$ 71,547$ -$ 2,285,629$ Fines and forfeitures - - 2,200 4,126 - - - 6,326 Federal and state grants 487,591 - - - - - - 487,591 Investment income 67 559 879 18 - - 398 1,921 Rental 91,600 - - - 795 - - 92,395 Miscellaneous and contributions 725 168 9,677 250 275 - - 11,095
Total revenues 747,016 1,060,270 850,841 4,394 150,491 71,547 398 2,884,957
ExpendituresSalaries, taxes and benefits 106,930 434,347 417,879 - 106,759 - - 1,065,915 Repairs and maintenance 25,071 36,842 88,727 - 8,829 - - 159,469 Utilities 31,659 11,968 16,825 - 12,157 - - 72,609 Supplies 136,097 41,187 25,691 532 30,677 - - 234,184 Other operating 18,801 391,655 38,568 - 29,580 - - 478,604 Debt service - 91,487 - - - - - 91,487 Capital outlay 475,670 318,656 41,409 - 13,800 - - 849,535
Total expenditures 794,228 1,326,142 629,099 532 201,802 - - 2,951,803
Excess (deficiency) of revenues over (under) expenditures (47,212) (265,872) 221,742 3,862 (51,311) 71,547 398 (66,846)
Other Financing Sources (Uses) Sale of capital assets - 18,000 - 3,440 - - - 21,440 Insurance proceeds - - 7,475 - - - - 7,475 Revolving loans - 270,000 - - - - - 270,000 Transfers in (out) 50,000 - - (15,000) 90,000 - (171,311) (46,311)
Total other financing sources and uses 50,000 288,000 7,475 (11,560) 90,000 - (171,311) 252,604
Net Change in Fund Balances 2,788 22,128 229,217 (7,698) 38,689 71,547 (170,913) 185,758
Fund Balance - beginning 70,154 277,663 334,353 28,285 21,655 148,100 307,575 1,187,785
Fund Balance - end 72,942$ 299,791$ 563,570$ 20,587$ 60,344$ 219,647$ 136,662$ 1,373,543$
City of Portland, TennesseeCombining Statement of Revenues, Expenditures and Changes in Fund Balances
Nonmajor Governmental FundsFor the Year Ended June 30, 2020
Special Revenue Funds
See independent auditor's report.65

Positive(Negative)
Variance withOriginal Final Actual Final
RevenuesCharges for services 155,000$ 175,000$ 167,033$ (7,967)$ Federal and state grants 1,109,500 579,050 487,591 (91,459) Investment income 78 78 67 (11) Rental 92,000 92,000 91,600 (400) Miscellaneous and contributions 100 800 725 (75)
Total revenues 1,356,678 846,928 747,016 (99,912)
ExpendituresSalaries, taxes and benefits 107,105 108,105 106,930 1,175 Repairs and maintenance 24,000 27,825 25,071 2,754 Utilities 34,550 34,550 31,659 2,891 Supplies 140,000 153,500 136,097 17,403 Other operating 25,750 23,175 18,801 4,374 Capital outlay 1,100,273 574,773 475,670 99,103
Total expenditures 1,431,678 921,928 794,228 127,700
Excess (deficiency) of revenues over (under) expenditures (75,000) (75,000) (47,212) 27,788
Other Financing Sources (Uses)Transfers in (out) 75,000 75,000 50,000 (25,000)
Total other financing sources (uses) 75,000 75,000 50,000 (25,000)
Net Change in Fund Balance -$ -$ 2,788 2,788$
Fund Balance - beginning 70,154
Fund Balance - end 72,942$
Budgeted Amounts
City of Portland, TennesseeSchedule of Revenues, Expenditures, and Changes in
Fund Balance - Budget and ActualAirport Fund
For the Year Ended June 30, 2020
See independent auditor's report.66

Positive(Negative)
Variance withOriginal Final Actual Final
RevenuesCharges for services 1,037,000$ 1,044,000$ 1,059,543$ 15,543$ Investment income 420 450 559 109 Miscellaneous and contributions 111 111 168 57
Total revenues 1,037,531 1,044,561 1,060,270 15,709
ExpendituresSalaries, taxes and benefits 444,848 443,598 434,347 9,251 Repairs and maintenance 51,000 47,780 36,842 10,938 Utilities 12,750 13,000 11,968 1,032 Supplies 53,737 47,237 41,187 6,050 Other operating 383,135 393,385 391,655 1,730 Debt service 124,561 96,561 91,487 5,074 Capital outlay 314,500 314,500 318,656 (4,156)
Total expenditures 1,384,531 1,356,061 1,326,142 29,919
Excess (deficiency) of revenues over (under) expenditures (347,000) (311,500) (265,872) 45,628
Other Financing Sources (Uses)Sale of capital assets - - 18,000 18,000 Debt proceeds 267,000 270,000 270,000 -
Total other financing sources (uses) 267,000 270,000 288,000 18,000
Net Change in Fund Balance (80,000)$ (41,500)$ 22,128 63,628$
Fund Balance - beginning 277,663
Fund Balance - end 299,791$
Budgeted Amounts
City of Portland, TennesseeSchedule of Revenues, Expenditures, and Changes in
Fund Balance - Budget and ActualSolid Waste Fund
For the Year Ended June 30, 2020
See independent auditor's report.67
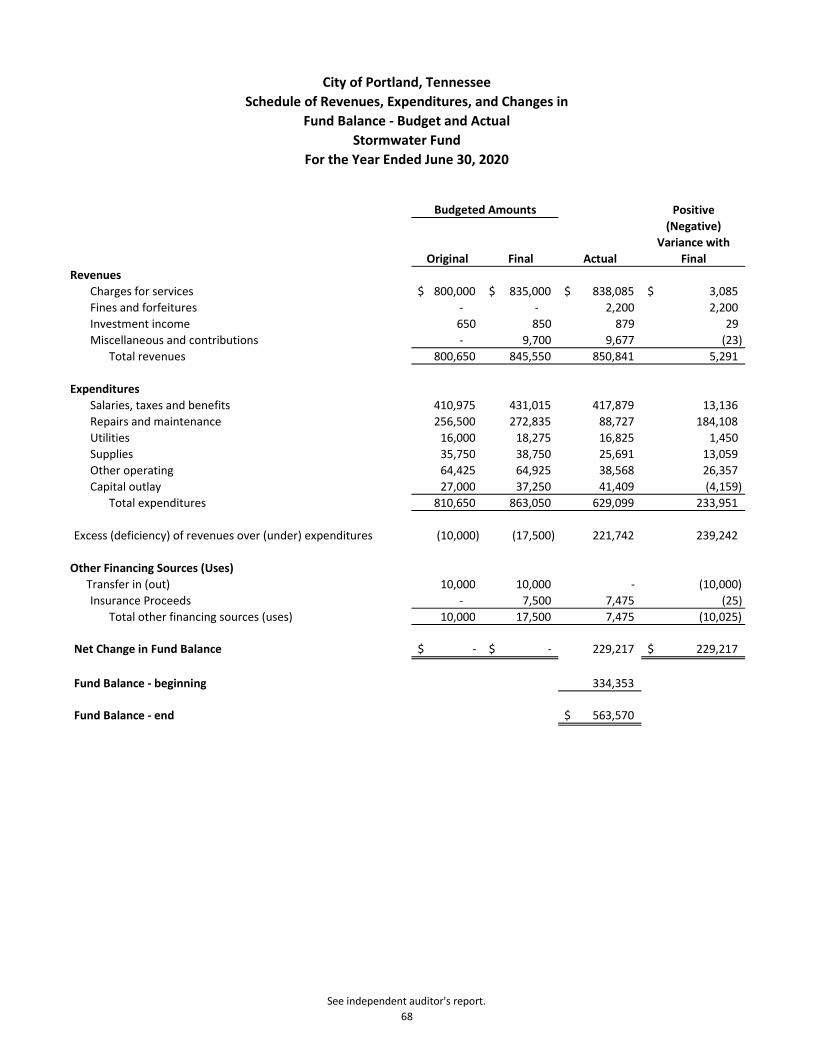
Positive(Negative)
Variance withOriginal Final Actual Final
RevenuesCharges for services 800,000$ 835,000$ 838,085$ 3,085$ Fines and forfeitures - - 2,200 2,200 Investment income 650 850 879 29 Miscellaneous and contributions - 9,700 9,677 (23)
Total revenues 800,650 845,550 850,841 5,291
ExpendituresSalaries, taxes and benefits 410,975 431,015 417,879 13,136 Repairs and maintenance 256,500 272,835 88,727 184,108 Utilities 16,000 18,275 16,825 1,450 Supplies 35,750 38,750 25,691 13,059 Other operating 64,425 64,925 38,568 26,357 Capital outlay 27,000 37,250 41,409 (4,159)
Total expenditures 810,650 863,050 629,099 233,951
Excess (deficiency) of revenues over (under) expenditures (10,000) (17,500) 221,742 239,242
Other Financing Sources (Uses)Transfer in (out) 10,000 10,000 - (10,000) Insurance Proceeds - 7,500 7,475 (25)
Total other financing sources (uses) 10,000 17,500 7,475 (10,025)
Net Change in Fund Balance -$ -$ 229,217 229,217$
Fund Balance - beginning 334,353
Fund Balance - end 563,570$
Budgeted Amounts
City of Portland, TennesseeSchedule of Revenues, Expenditures, and Changes in
Fund Balance - Budget and ActualStormwater Fund
For the Year Ended June 30, 2020
See independent auditor's report.68

Positive(Negative)
Variance withOriginal Final Actual Final
RevenuesFines and forfeitures 7,000$ 4,450$ 4,126$ (324)$ Investment income - 50 18 (32) Miscellaneous and contribution income - - 250 250
Total revenues 7,000 4,500 4,394 (106)
ExpendituresSupplies 1,000 1,000 532 468
Total expenditures 1,000 1,000 532 468
Excess (deficiency) of revenues over (under) expenditures 6,000 3,500 3,862 362
Other Financing Sources (Uses)Transfers in (out) (15,000) (15,000) (15,000) - Sale of capital assets 5,000 4,000 3,440 560
Total other financing sources (uses) (10,000) (11,000) (11,560) 560
Net Change in Fund Balance (4,000)$ (7,500)$ (7,698) 922$
Fund Balance - beginning 28,285
Fund Balance - end 20,587$
Budgeted Amounts
City of Portland, TennesseeSchedule of Revenues, Expenditures, and Changes in
Fund Balance - Budget and ActualDrug Fund
For the Year Ended June 30, 2020
See independent auditor's report.69

Positive(Negative)
Variance withOriginal Final Actual Final
RevenuesCharges for services 30,000$ 68,500$ 71,547$ 3,047$
Total revenues 30,000 68,500 71,547 3,047
ExpendituresTotal expenditures - - - -
Net Change in Fund Balance 30,000$ 68,500$ 71,547$ 3,047$
Fund Balance - beginning 148,100
Fund Balance - end 219,647$
Budgeted Amounts
City of Portland, TennesseeSchedule of Revenues, Expenditures, and Changes in
Fund Balance - Budget and ActualImpact Fee Fund
For the Year Ended June 30, 2020
See independent auditor's report.70

Positive(Negative)
Variance withOriginal Final Actual Final
RevenuesInvestment income 250$ 500$ 398$ (102)$
Total revenues 250 500 398 (102)
ExpendituresTotal expenditures - - - -
Excess (deficiency) of revenues over (under) expenditures 250 500 398 (102)
Other Financing Sources (Uses) Transfers in (out) - (171,250) (171,311) (61) Total other financing sources (uses) - (171,250) (171,311) (61)
Net Change in Fund Balance 250$ (170,750)$ (170,913)$ (163)$
Fund Balance - beginning 307,575
Fund Balance - end 136,662$
Budgeted Amounts
City of Portland, TennesseeSchedule of Revenues, Expenditures, and Changes in
Fund Balance - Budget and ActualRevolving Loan Fund
For the Year Ended June 30, 2020
See independent auditor's report.71

Positive(Negative)
Variance withOrignial Final Actual Final
RevenuesCharges for services 150,500$ 119,000$ 149,421$ 30,421$ Rental 3,000 1,000 795 (205) Miscellaneous and contribution income - 350 275 (75)
Total revenues 153,500 120,350 150,491 30,141
ExpendituresSalaries, taxes and benefits 170,503 111,503 106,759 4,744 Repairs and maintenance 17,000 14,000 8,829 5,171 Utilities 16,500 15,000 12,157 2,843 Supplies 32,200 35,350 30,677 4,673 Other operating 37,297 35,497 29,580 5,917 Capital outlay 5,000 14,000 13,800 200
Total expenditures 278,500 225,350 201,802 23,548
Excess (deficiency) of revenues over (under) expenditures (125,000) (105,000) (51,311) 53,689
Other Financing Sources (Uses)Transfers in (out) 125,000 105,000 90,000 (35,000)
Total other financing sources (uses) 125,000 105,000 90,000 (35,000)
Net Change in Fund Balance -$ -$ 38,689 18,689$
Fund Balance - beginning 21,655
Fund Balance - end 60,344$
Budgeted Amounts
City of Portland, TennesseeSchedule of Revenues, Expenditures, and Changes in
Fund Balance - Budget and ActualGolf Course Fund
For the Year Ended June 30, 2020
See Independent auditor's report.72

CFDANO. PROGRAM CONTRACT NO. EXPENDITURES
U.S. Department of Housing and Urban DevelopmentPass-through funding:Tennessee Dept. of Economic Home Investmentand Community Development 14.24 Partnerships Program 10-THDA-H-20 3,115$
Total U.S. Department of Housing and Urban Development 3,115
Federal Aviation AdministrationPass-through funding:TN Dept of Transportation, Aeronautics Division 20.11 T-Hangar Apron Rehab - Construction AERO 19-174-00 259,346
TN Dept of Transportation, Aeronautics Division 20.11 T-Hangar Apron Rehab - Resurfacing AERO 20-204-00 156,002
Total Federal Aviation Administration 415,348
U.S. Department of TransportationPass-through funding:TN Dept of Transportation 20.21 SRTS Watt Hardison Sidewalk 130261 42,862 Surface Transportation Program (Safe Routes To Schools)
Surface Transportation Program 20.21 Kirby Road Paving 150201 15
Federal Highway Administration 20.21 Traffic Light Study 83LPLM-F1-097 7,457
Total U.S. Department of Transportation 50,334
TOTAL EXPENDITURES OF FEDERAL AWARDS 468,797
STATE AWARDS
TN Dept of Transportation, Aeronautics Division N/A Annual Airport Maint. Grant AERO-M12-250 15,000
TN Dept of Transportation, Aeronautics Division N/A Parallel Taxiway South AERO-19-220-00 60,451 Design Only Agency Tracking #40100-00619
State of Tennessee N/A Fast Track Infrastructure Dev Prog (FIDP)Office of Economic & Community Development Cardinal Sewer Addition CN: 306200 9,200
TOTAL EXPENDITURES OF STATE AWARDS 84,651
FEDERAL AWARDS
CITY OF PORTLAND, TENNESSEESCHEDULE OF EXPENDITURES OF FEDERAL AWARDS AND STATE FINANCIAL ASSISTANCE
YEAR ENDED JUNE 30, 2020
FEDERAL GRANTOR/PASS-THROUGH GRANTOR
See independent auditor's report73

See independent auditor’s report. 74
CITY OF PORTLAND, TENNESSEE
NOTES TO THE SCHEDULE OF EXPENDITURES OF FEDERAL AWARDS AND STATE FINANCIAL ASSISTANCE
For the Year Ended June 30, 2020
NOTE A – BASIS OF PRESENTATION
The accompanying schedule of expenditures of federal awards and state financial assistance includes the federal and state grant activity of the City of Portland, Tennessee under programs of the federal government for the year ended June 30, 2020. The information in this Schedule is presented in accordance with the requirements of Title 2 U.S. Code of Federal Regulations Part 200, Uniform Administrative Requirements, Cost Principles, and Audit Requirements for Federal Awards (Uniform Guidance). Because the Schedule presents only a selected portion of the operations of the City, it is not intended to and does not present the financial position, changes in net assets, or cash flows of the City.
NOTE B – SUMMARY OF SIGNIFICANT ACCOUNTING POLICIES
1. Expenditures reported on the Schedule are reported on the accrual basis of accounting. Such expenditures are recognized following the cost principles contained in the Uniform Guidance, wherein certain types of expenditures are not allowable or are limited as to reimbursement.
2. Pass-through entity contract numbers are presented where available. 3. The City has elected not to use the 10% de minimis indirect cost rate as allowed under
the Uniform Guidance.
NOTE C – OUTSTANDING LOANS
The City has outstanding a loan of $805,922 obtained through the State Revolving Loan Fund (SRLF) in 2006. The loan is presented in detail elsewhere in the supplementary and other information section of this report.

OTHER INFORMATION SECTION

Paid and/orOriginal Last Issued MaturedAmount Interest Maturity Outstanding During During Outstanding
Description of Indebtedness Of Issue Rate Date 7/1/2019 Period Period 6/30/2020Governmental Activities
Capital Outlay Notes PayableFire Department Capital Outlay Note #72 378,000$ 3.78% 3/1/2022 123,600$ -$ (30,900)$ 92,700$ Public Library Expansion Capital Outlay Note 2011 Loan #56 675,000 2.35% 1/20/2020 43,750 - (43,750) - Street Paving Note Capital Outlay Note #60 500,000 2.87% 4/1/2023 208,310 - (55,560) 152,750 Parks Equipment Capital Outlay Note, Series 2015 160,000 2.49% 3/9/2020 24,000 - (24,000) - Street Equipment Capital Outlay Note #65 150,000 2.17% 10/1/2020 37,500 - (30,000) 7,500 Street Paving Note Capital Outlay Note #66 1,150,000 2.61% 10/1/2023 610,900 - (143,760) 467,140 Police Cars Capital Outlay Note #68 225,000 2.65% 1/11/2022 116,250 - (45,000) 71,250 Parks Improvements Capital Outlay Note, Series 2017 150,000 2.65% 4/15/2027 117,500 - (15,000) 102,500 Police Cars Capital Outlay Note #70 225,000 3.16% 4/15/2023 168,750 - (45,000) 123,750 Sanitation Trucks Capital Outlay Note #71 267,000 3.78% 06/21/2023 213,600 - (53,400) 160,200 Fire Department Capital Outlay Note, Series 2013 154,500 3.78% 06/21/2023 126,000 - (42,000) 84,000 Police/Fire Eqiupment Capital Outlay Note #73 369,000 3.00% 11/05/2024 - 369,000 (44,028) 324,972 Sanitation Truck Capital Outlay Note #74 270,000 3.00% 11/15/2025 - 270,000 (26,250) 243,750
Total Capital Outlay Notes Payable 1,790,160$ 639,000$ (598,648)$ 1,830,512$
Bonds PayableGeneral Obligation Refunding Bonds, Series 2015 Loan #64 7,410,000$ 3.50% 4/1/2045 6,790,000$ -$ (180,000)$ 6,610,000$ General Obligation Refunding Bonds, Series 2020 Loan #75 3,780,000 2.625-4.00% 6/30/2050 - 3,780,000 - 3,780,000
Total Bonds Payable 6,790,000$ 3,780,000$ (180,000)$ 10,390,000$
Business ActivitiesCapital Outlay Notes Payable
Jet Vac Trk #62 350,000$ 2.35% 2/6/2020 46,667$ -$ (46,667)$ -$ Jet Vac Trk #76 237,000 2.48% 6/15/2025 - 237,000 - 237,000
Total Capital Outlay Notes Payable 46,667$ 237,000$ (46,667)$ 237,000$
Bonds PayableWater and Sewer System Revenue Refunding Bonds, Series 2016 #67 14,405,000$ 3.00% 4/1/2046 13,715,000$ -$ (680,000)$ 13,035,000$
Total Bonds Payable 13,715,000$ -$ (680,000)$ 13,035,000$
Other Loan PayableState Revolving Fund Loan, 2006 Loan #37 1,500,000$ 1.70% 10/1/2031 870,370$ -$ (64,448)$ 805,922$
Total Other Loans Payable 870,370$ -$ (64,448)$ 805,922$
City of Portland, TennesseeSchedule of Changes in Long-term Debt by Individual Issue
June 30, 2020
75

Year EndingJune 30, Principal Interest Principal Interest Principal Interest Principal Interest Principal Interest Principal Interest
2021 180,000 218,438 45,000 3,259 143,760 10,473 55,560 3,653 15,000 3,337 42,000 2,251
2022 185,000 213,937 45,000 1,837 143,760 6,720 55,560 2,059 15,000 2,814 42,000 1,125
2023 190,000 209,312 33,750 444 143,760 2,968 41,630 497 15,000 2,290 - -
2024 195,000 204,563 - - 35,860 156 - - 15,000 1,767 - -
2025 200,000 199,200 - - - - - - 15,000 1,243 - -
2026 205,000 193,700 - - - - - - 15,000 720 - -
2027 215,000 188,062 - - - - - - 12,500 200 - -
2028 220,000 181,613 - - - - - - - - - -
2029 225,000 175,012 - - - - - - - - - -
2030 230,000 168,263 - - - - - - - - - -
2031 240,000 161,362 - - - - - - - - - -
2032 245,000 154,163 - - - - - - - - - -
2033 255,000 146,812 - - - - - - - - - -
2034 260,000 139,163 - - - - - - - - - -
2035 270,000 130,062 - - - - - - - - - -
2036 280,000 120,613 - - - - - - - - - -
2037 290,000 110,812 - - - - - - - - - -
2038 300,000 100,663 - - - - - - - - - -
2039 310,000 90,162 - - - - - - - - - -
2040 320,000 79,313 - - - - - - - - - -
2041 335,000 67,312 - - - - - - - - - -
2042 345,000 54,750 - - - - - - - - - -
2043 360,000 41,813 - - - - - - - - - -
2044 370,000 28,312 - - - - - - - - - -
2045 385,000 14,438 - - - - - - - - - -
2046 - - - - - - - - - - - -
- - - - - - - - - - - - 6,610,000$ 3,391,850$ 123,750$ 5,540$ 467,140$ 20,317$ 152,750$ 6,209$ 102,500$ 12,371$ 84,000$ 3,376$
Principal Interest Principal Interest Principal Interest Principal Interest Principal Interest Principal Interest
2021 53,400 5,124 7,500 27 45,000 1,340 30,900 2,965 73,800 8,890 45,000$ 6,695$
2022 53,400 3,114 - - 26,250 233 30,900 1,802 73,800 6,643 45,000 5,344
2023 53,400 1,095 - - - - 30,900 634 73,800 4,398 45,000 3,994
2024 - - - - - - - - 73,800 2,158 45,000 2,644
2025 - - - - - - - - 29,772 235 45,000 1,294
2026 - - - - - - - - - - 18,750 141 160,200$ 9,333$ 7,500$ 27$ 71,250$ 1,573$ 92,700$ 5,401$ 324,972$ 22,323$ 243,750$ 20,111$
City of Portland, TennesseeSchedule of Principal and Interest Requirements - Governmental Funds
June 30, 2020
Fire Department Capital Outlay Note, Series 2013 Note
# 59General Obligation Refunding Bonds, Series 2015 Loan #64
Police Cars Capital Outlay Note #70
Street Paving Note Capital Outlay Note #66
Street Paving/Street Truck Capital Outlay Note #60
Parks Improvements Capital Outlay Note, Series 2017-Note #
69
Fire Department Capital Outlay Note #72
Police/Fire Equipment Capital Outlay Note # 73
Sanitation Truck Capital Outlay Note # 74
Sanitation Trucks Capital Outlay Note #71
Street Equipment Capital Outlay Note #65
Police Cars Capital Outlay Note #68
76
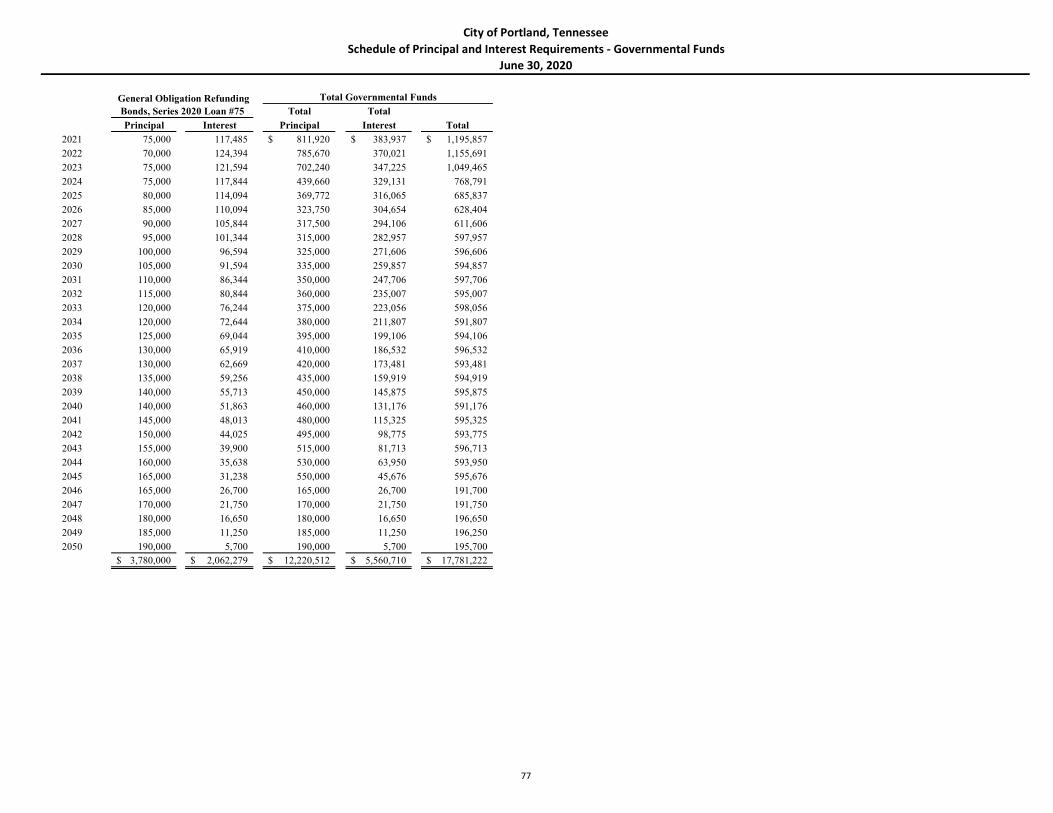
City of Portland, TennesseeSchedule of Principal and Interest Requirements - Governmental Funds
June 30, 2020
Total Total
Principal Interest Principal Interest Total
2021 75,000 117,485 811,920$ 383,937$ 1,195,857$
2022 70,000 124,394 785,670 370,021 1,155,691
2023 75,000 121,594 702,240 347,225 1,049,465
2024 75,000 117,844 439,660 329,131 768,791
2025 80,000 114,094 369,772 316,065 685,837
2026 85,000 110,094 323,750 304,654 628,404
2027 90,000 105,844 317,500 294,106 611,606
2028 95,000 101,344 315,000 282,957 597,957
2029 100,000 96,594 325,000 271,606 596,606
2030 105,000 91,594 335,000 259,857 594,857
2031 110,000 86,344 350,000 247,706 597,706
2032 115,000 80,844 360,000 235,007 595,007
2033 120,000 76,244 375,000 223,056 598,056
2034 120,000 72,644 380,000 211,807 591,807
2035 125,000 69,044 395,000 199,106 594,106
2036 130,000 65,919 410,000 186,532 596,532
2037 130,000 62,669 420,000 173,481 593,481
2038 135,000 59,256 435,000 159,919 594,919
2039 140,000 55,713 450,000 145,875 595,875
2040 140,000 51,863 460,000 131,176 591,176
2041 145,000 48,013 480,000 115,325 595,325
2042 150,000 44,025 495,000 98,775 593,775
2043 155,000 39,900 515,000 81,713 596,713
2044 160,000 35,638 530,000 63,950 593,950
2045 165,000 31,238 550,000 45,676 595,676
2046 165,000 26,700 165,000 26,700 191,700
2047 170,000 21,750 170,000 21,750 191,750
2048 180,000 16,650 180,000 16,650 196,650
2049 185,000 11,250 185,000 11,250 196,250
2050 190,000 5,700 190,000 5,700 195,700 3,780,000$ 2,062,279$ 12,220,512$ 5,560,710$ 17,781,222$
General Obligation Refunding Bonds, Series 2020 Loan #75
Total Governmental Funds
77

Year Ending Total TotalJune 30, Principal Interest Principal Interest Principal Interest Principal Interest Total
2021 700,000 448,844 60,005 12,177 47,400 5,535 807,405$ 466,556$ 1,273,961$ 2022 570,000 427,844 66,576 12,168 47,400 4,163 683,976 444,175 1,128,151 2023 455,000 410,744 67,728 11,016 47,400 2,988 570,128 424,748 994,876 2024 475,000 397,094 68,880 9,864 47,400 1,812 591,280 408,770 1,000,050 2025 480,000 385,218 70,068 8,676 47,400 637 597,468 394,531 991,999 2026 490,000 373,218 71,268 7,476 - - 561,268 380,694 941,962 2027 500,000 360,969 72,492 6,252 - - 572,492 367,221 939,713 2028 530,000 340,969 73,728 5,016 - - 603,728 345,985 949,713 2029 545,000 319,769 74,988 3,756 - - 619,988 323,525 943,513 2030 515,000 297,968 76,272 2,472 - - 591,272 300,440 891,712 2031 535,000 277,368 77,580 1,164 - - 612,580 278,532 891,112 2032 555,000 255,969 26,337 93 - - 581,337 256,062 837,399 2033 575,000 239,319 - - - - 575,000 239,319 814,319 2034 590,000 222,069 - - - - 590,000 222,069 812,069 2035 605,000 204,369 - - - - 605,000 204,369 809,369 2036 635,000 180,169 - - - - 635,000 180,169 815,169 2037 435,000 154,769 - - - - 435,000 154,769 589,769 2038 455,000 137,369 - - - - 455,000 137,369 592,369 2039 470,000 119,168 - - - - 470,000 119,168 589,168 2040 490,000 100,368 - - - - 490,000 100,368 590,368 2041 370,000 80,769 - - - - 370,000 80,769 450,769 2042 385,000 65,968 - - - - 385,000 65,968 450,968 2043 400,000 53,938 - - - - 400,000 53,938 453,938 2044 410,000 41,438 - - - - 410,000 41,438 451,438 2045 425,000 28,112 - - - - 425,000 28,112 453,112 2046 440,000 14,300 - - - - 440,000 14,300 454,300
13,035,000$ 5,938,099$ 805,922$ 80,130$ 237,000$ 15,135$ 14,077,922$ 6,033,364$ 20,111,286$
City of Portland, TennesseeSchedule of Principal and Interest Requirements - Enterprise Funds
June 30, 2020
Jet Vac Trk # 76Total Business-Type Activities
Water and Sewer System Revenue Refunding Bonds,
Series 2016 #67State Revolving Fund Loan,
2006 Loan #37
78

Year of Levy
Gross Property
Taxes Receivable
July 1, 2019
Property Tax
Levied
Anticipated
Current Year
Levy
Abatements and
Adjustments Collections
Allowance for
Uncollectibles
Net Property
Taxes Receivable
June 30, 2020
2020 $ - $ - 4,852,413$ $ - $ - $ - $ 4,852,413
2019 - 4,692,284 - 147,699 (4,689,263) - 150,721
2018 96,103 - - 36,085 (79,163) - 53,025
2017 29,394 - - (5,047) (391) (23,956) -
2016 28,295 - - (2,329) - (25,966) -
2015 11,118 - - (1,035) - (10,083) -
2014 7,286 - - (1,122) - (6,164) -
2013 8,826 - - (907) - (7,919) -
2012 14,240 - - (3,112) - (11,128) -
2011 27,191 - - (238) (372) (26,581) -
2010 11,205 - - - - (11,205) -
233,658$ 4,692,284$ 4,852,413$ 169,994$ (4,769,189)$ (123,002)$ 5,056,159$
Note: All uncollected taxes for years due prior to March 1, 2017 have been turned over to the County for collection.
City of Portland, Tennessee
Schedule of Changes in Property Taxes Receivable
and Uncollected Delinquent Taxes Filed
June 30, 2020
79
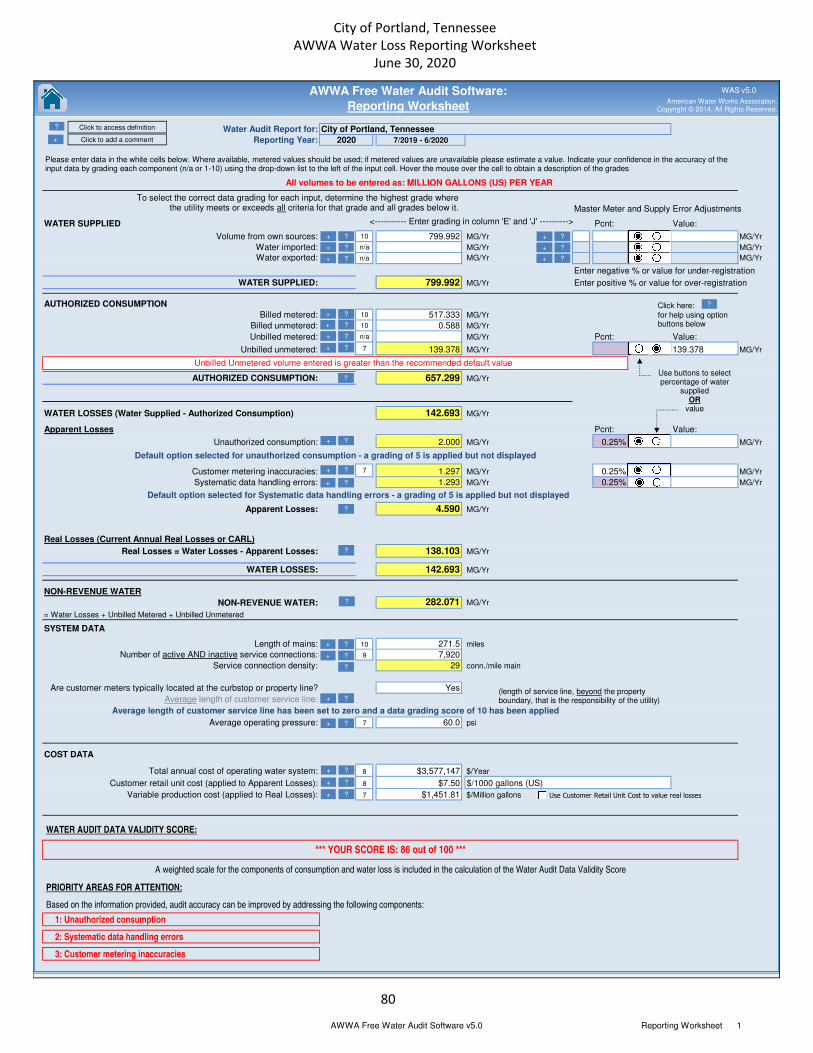
Water Audit Report for:
Reporting Year:
All volumes to be entered as: MILLION GALLONS (US) PER YEAR
Master Meter and Supply Error Adjustments
WATER SUPPLIED Pcnt: Value:
Volume from own sources: 10 799.992 MG/Yr MG/Yr
Water imported: n/a MG/Yr MG/Yr
Water exported: n/a MG/Yr MG/Yr
Enter negative % or value for under-registration
WATER SUPPLIED: 799.992 MG/Yr Enter positive % or value for over-registration.
AUTHORIZED CONSUMPTION
Billed metered: 10 517.333 MG/Yr
Billed unmetered: 10 0.588 MG/Yr
Unbilled metered: n/a MG/Yr Pcnt: Value:
Unbilled unmetered: 7 139.378 MG/Yr 1.25% MG/Yr24061
AUTHORIZED CONSUMPTION: 657.299 MG/Yr
WATER LOSSES (Water Supplied - Authorized Consumption) 142.693 MG/Yr
Apparent Losses Pcnt: Value:
Unauthorized consumption: 2.000 MG/Yr 0.25% MG/Yr
Customer metering inaccuracies: 7 1.297 MG/Yr 0.25% MG/Yr
Systematic data handling errors: 5 1.293 MG/Yr 0.25% MG/Yr
Apparent Losses: 4.590 MG/Yr
Real Losses (Current Annual Real Losses or CARL)
Real Losses = Water Losses - Apparent Losses: 138.103 MG/Yr
WATER LOSSES: 142.693 MG/Yr
NON-REVENUE WATER
NON-REVENUE WATER: 282.071 MG/Yr
= Water Losses + Unbilled Metered + Unbilled Unmetered
SYSTEM DATA
Length of mains: 10 271.5 miles
Number of active AND inactive service connections: 9 7,920
Service connection density: 29 conn./mile main
Yes
Average length of customer service line: 10 0.0 ft
Average operating pressure: 7 60.0 psi
COST DATA
Total annual cost of operating water system: 8 $3,577,147 $/Year
Customer retail unit cost (applied to Apparent Losses): 8 $7.50
Variable production cost (applied to Real Losses): 7 $1,451.81 $/Million gallons
WATER AUDIT DATA VALIDITY SCORE:
PRIORITY AREAS FOR ATTENTION:
1: Unauthorized consumption
2: Systematic data handling errors
3: Customer metering inaccuracies
Based on the information provided, audit accuracy can be improved by addressing the following components:
$/1000 gallons (US)
<----------- Enter grading in column 'E' and 'J' ---------->
Default option selected for unauthorized consumption - a grading of 5 is applied but not displayed
*** YOUR SCORE IS: 86 out of 100 ***
A weighted scale for the components of consumption and water loss is included in the calculation of the Water Audit Data Validity Score
Default option selected for Systematic data handling errors - a grading of 5 is applied but not displayed
Average length of customer service line has been set to zero and a data grading score of 10 has been applied
Are customer meters typically located at the curbstop or property line?
AWWA Free Water Audit Software:
Reporting Worksheet
Unbilled Unmetered volume entered is greater than the recommended default value
139.378
2020 7/2019 - 6/2020
City of Portland, Tennessee
?
?
?
?
?
? Click to access definition
?
?
?
?
?
?
Please enter data in the white cells below. Where available, metered values should be used; if metered values are unavailable please estimate a value. Indicate your confidence in the accuracy of the input data by grading each component (n/a or 1-10) using the drop-down list to the left of the input cell. Hover the mouse over the cell to obtain a description of the grades
?
?
?
?
?
?
(length of service line, beyond the property boundary, that is the responsibility of the utility)
Use buttons to selectpercentage of water
suppliedOR
value
?Click here:
for help using option buttons below
?
?
?
?
+
+ Click to add a comment
WAS v5.0
+
+
+
+
+
+
American Water Works Association.Copyright © 2014, All Rights Reserved.
?
?
?
+
+
+
+
+
+
+
+
+
+
+
+
+ Use Customer Retail Unit Cost to value real losses
?
To select the correct data grading for each input, determine the highest grade where the utility meets or exceeds all criteria for that grade and all grades below it.
AWWA Free Water Audit Software v5.0 Reporting Worksheet 1
City of Portland, TennesseeAWWA Water Loss Reporting Worksheet
June 30, 2020
80

Water Audit Report for: City of Portland, Tennessee
Reporting Year:
System Attributes:
Apparent Losses: 4.590 MG/Yr
+ Real Losses: 138.103 MG/Yr
= Water Losses: 142.693 MG/Yr
Unavoidable Annual Real Losses (UARL): 58.18 MG/Yr
Annual cost of Apparent Losses: $34,424
Annual cost of Real Losses: $200,499 Valued at Variable Production Cost
Performance Indicators:
Non-revenue water as percent by volume of Water Supplied: 35.3%
Non-revenue water as percent by cost of operating system: 12.2% Real Losses valued at Variable Production Cost
Apparent Losses per service connection per day: 1.59 gallons/connection/day
Real Losses per service connection per day: N/A gallons/connection/day
Real Losses per length of main per day*: 1,393.61 gallons/mile/day
Real Losses per service connection per day per psi pressure: N/A gallons/connection/day/psi
From Above, Real Losses = Current Annual Real Losses (CARL): 138.10 million gallons/year
2.37
* This performance indicator applies for systems with a low service connection density of less than 32 service connections/mile of pipeline
Infrastructure Leakage Index (ILI) [CARL/UARL]:
2020 7/2019 - 6/2020
Return to Reporting Worksheet to change this assumpiton
AWWA Free Water Audit Software:
System Attributes and Performance Indicators
*** YOUR WATER AUDIT DATA VALIDITY SCORE IS: 86 out of 100 ***
?
?
American Water Works Association.Copyright © 2014, All Rights Reserved.
WAS v5.0
Financial:
Operational Efficiency:
AWWA Free Water Audit Software v5.0 Performance Indicators 1
City of Portland, TennesseeAWWA Water System Attributes and
Performance IndicatorsJune 30, 2020
81

Year of Levy Fiscal YearTax Rate Per $100 Sumner
Tax Rate Per $100
Robertson Tax Assessment 2020 2021 1.41 1.11 4,852,413$ 2019 2020 1.41 1.11 4,692,284$ 2018 2019 1.21 1.21 3,982,140$ 2017 2018 1.21 1.21 3,982,140$ 2016 2017 1.21 1.21 3,985,892$ 2015 2016 1.21 1.21 3,882,467$ 2014 2015 1.21 1.21 2,679,618$ 2013 2014 1.18 1.18 3,761,856$ 2012 2013 1.1 1.13 3,310,126$ 2011 2012 1.1 1.13 3,315,772$ 2010 2011 1.1 1.13 3,230,794$
*Anticipated Levy as of June 30, 2020
City of Portland, TennesseeSchedule of Property Tax Rates and Assessments
Last Ten Fiscal Years
82

Effective 7/1/16 Inside City Limits Outside City LimitsResidential
First 2,500 gallons 12.75 26.23 Per 1,000 gallons over 2,500 5.10 10.49
CommercialFirst 2,500 gallons 16.53 28.05 Per 1,000 gallons over 2,500 6.61 11.22
IndustrialFirst 2,500 gallons 20.05 30.10 Per 1,000 gallons over 2,500 8.02 12.04
PondvilleFirst 5,000 gallons 26.23 Per 1,000 gallons over 5,000 10.49
Inside City Limits Outside City LimitsEffective 7/1/19Residential
First 2,500 gallons 28.75 37.25 Per 1,000 gallons over 2,500 11.50 14.90
CommercialFirst 2,500 gallons 34.38 44.73 Per 1,000 gallons over 2,500 13.75 17.89
IndustrialFirst 2,500 gallons 37.25 48.45 Per 1,000 gallons over 2,500 14.90 19.38
Residential - Inside City LimitsService Fee 6.00 Per MonthPTA Rate 0.28 Per CCFCost of Gas Rate 0.31 Per CCF
Residential - Outside City LimitsService Fee 10.00 Per MonthPTA Rate 0.35 Per CCFCost of Gas Rate 0.31 Per CCF
Commercial - Inside/Outside City LimitsService Fee 35.00 Per MonthPTA Rate 0.35 Per CCFCost of Gas Rate 0.31 Per CCF
Industrial - Inside/Outside City LimitsService Fee 250.00 Per MonthPTA Rate 0.35 Per CCFCost of Gas Rate 0.31 Per CCF
The rate structure is made up of three components: gas cost, PTA and service fees. The cost of gas and the pass
through adjustment make up the current cost of gas to the city at the city's source of supply. This cost is adjusted
monthly, increased or decreased, to reflect the current market cost of gas to the city. The service fee covers the
projected cost of operating and maintaining the city's gas department. The service fee and PTA rates were effective
July 2019 and the monthly cost of the gas rate were in effect at June 30, 2020.
Service June 30, 2020Solid Waste (special revenue) 4,672 Stormwater (special revenue) 4,935 Water 7,813 Sewer 4,238 Natural Gas 5,141
Sanitation for residential customers inside the city limits is $18 per month.Business customer rate is $22 per month.
Natural Gas Customer Rates
Number of Customers
City of Portland, TennesseeSchedule of Utility Rate Structure and Number of Customers
For the Year Ended June 30, 2020
Water Customer Rates
Sewer Customer Rates
Solid Waste (Sanitation) Rates
83

GOVERNMENT AUDITING STANDARDS SECTION

CERTIFIED PUBLIC ACCOUNTANTS AND CONSULTANTS
515 NW Atlantic Street, Tullahoma, Tennessee 37388 16053 Rankin Avenue, Dunlap, Tennessee 37327
Phone (931) 393-3307 Fax (931) 563-5585
INDEPENDENT AUDITOR’S REPORT ON INTERNAL CONTROL OVER FINANCIAL REPORTING AND ON COMPLIANCE AND OTHER MATTERS BASED ON AN AUDIT OF FINANCIAL
STATEMENTS PERFORMED IN ACCORDANCE WITH GOVERNMENT AUDITING STANDARDS To the Honorable Mayor and Board of Aldermen City of Portland, Tennessee
We have audited, in accordance with the auditing standards generally accepted in the United States of America and the standards applicable to financial audits contained in Government Auditing Standards issued by the Comptroller General of the United States, the financial statements of the governmental activities, the business-type activities, each major fund, and the aggregate remaining fund information of the City of Portland, Tennessee as of and for the year ended June 30, 2020, and the related notes to the financial statements, which collectively comprise the City of Portland, Tennessee’s basic financial statements, and have issued our report thereon dated December 07, 2020.
Internal Control over Financial Reporting
In planning and performing our audit of the financial statements, we considered the City of Portland, Tennessee’s internal control over financial reporting (internal control) to determine the audit procedures that are appropriate in the circumstances for the purpose of expressing our opinions on the financial statements, but not for the purpose of expressing an opinion on the effectiveness of the City of Portland, Tennessee’s internal control. Accordingly, we do not express an opinion on the effectiveness of the City of Portland, Tennessee’s internal control.
A deficiency in internal control exists when the design or operation of a control does not allow management or employees, in the normal course of performing their assigned functions, to prevent, or detect and correct, misstatements on a timely basis. A material weakness is a deficiency, or a combination of deficiencies, in internal control such that there is a reasonable possibility that a material misstatement of the entity’s financial statements will not be prevented, or detected and corrected on a timely basis. A significant deficiency is a deficiency, or a combination of deficiencies, in internal control that is less severe than a material weakness, yet important enough to merit attention by those charged with governance.
Our consideration of internal control was for the limited purpose described in the first paragraph of this section and was not designed to identify all deficiencies in internal control that might be material weaknesses or significant deficiencies. Given these limitations, during our audit we did not identify any deficiencies in internal control that we consider to be material weaknesses. However, material weaknesses may exist that have not been identified.

85
Compliance and Other Matters
As part of obtaining reasonable assurance about whether the City of Portland, Tennessee’s financial statements are free from material misstatement, we performed tests of its compliance with certain provisions of laws, regulations, contracts, and grant agreements, noncompliance with which could have a direct and material effect on the determination of financial statement amounts. However, providing an opinion on compliance with those provisions was not an objective of our audit, and accordingly, we do not express such an opinion. The results of our tests disclosed no instances of noncompliance or other matters that are required to be reported under Government Auditing Standards.
Purpose of this Report
The purpose of this report is solely to describe the scope of our testing of internal control and compliance and the results of that testing, and not to provide an opinion on the effectiveness of the entity’s internal control or on compliance. This report is an integral part of an audit performed in accordance with Government Auditing Standards in considering the entity’s internal control and compliance. Accordingly, this communication is not suitable for any other purpose.
MG Group, P.C. Tullahoma, Tennessee December 07, 2020

86
City of Portland, Tennessee
Summary Schedule of Prior Year Findings June 30, 2020
No prior year findings.