Embed Size (px)
Citation preview

sustainability
Article
Post-Treatment of Palm Oil Mill Effluent Using ImmobilisedGreen Microalgae Chlorococcum oleofaciens
Kah Aik Tan 1, Japareng Lalung 1,* , Norhashimah Morad 1, Norli Ismail 1, Wan Maznah Wan Omar 2 ,Moonis Ali Khan 3 , Mika Sillanpää 4 and Mohd Rafatullah 1,*
�����������������
Citation: Tan, K.A.; Lalung, J.;
Morad, N.; Ismail, N.; Wan Omar,
W.M.; Khan, M.A.; Sillanpää, M.;
Rafatullah, M. Post-Treatment of
Palm Oil Mill Effluent Using
Immobilised Green Microalgae
Chlorococcum oleofaciens. Sustainability
2021, 13, 11562. https://doi.org/
10.3390/su132111562
Academic Editor: Antonio Zuorro
Received: 5 August 2021
Accepted: 18 October 2021
Published: 20 October 2021
Publisher’s Note: MDPI stays neutral
with regard to jurisdictional claims in
published maps and institutional affil-
iations.
Copyright: © 2021 by the authors.
Licensee MDPI, Basel, Switzerland.
This article is an open access article
distributed under the terms and
conditions of the Creative Commons
Attribution (CC BY) license (https://
creativecommons.org/licenses/by/
4.0/).
1 School of Industrial Technology, Universiti Sains Malaysia, Gelugor 11800, Malaysia;[email protected] (K.A.T.); [email protected] (N.M.); [email protected] (N.I.)
2 School of Biological Sciences, Universiti Sains Malaysia, Gelugor 11800, Malaysia; [email protected] Chemistry Department, College of Science, King Saud University, Riyadh 11451, Saudi Arabia;
[email protected] Department of Biological and Chemical Engineering, Aarhus University, Nørrebrogade 44, 8000 Aarhus,
Denmark; [email protected]* Correspondence: [email protected] (J.L.); [email protected] (M.R.)
Abstract: Microalgae immobilisation can be a long-term solution for effective wastewater post-treatment. This study was conducted to evaluate the ability of immobilised Chlorococcum oleofaciens toremove contaminants from palm oil mill effluent (POME) until it complies with the POME dischargestandard. First, the native dominating green microalga was isolated from a polishing POME treatmentpond. Then, the microalgae cells were immobilised on sodium alginate beads and cultivated in alab-scale-treated POME to treat it further. The immobilised microalgae cells demonstrated a highremoval of total phosphorus, total nitrogen, ammonia nitrogen, and soluble chemical oxygen demandwith 90.43%, 93.51%, 91.26%, and 50.72% of reduction, respectively. Furthermore, the growth rate ofthe microalgae fitted nicely with the Verhulst logistical model with r2 of more than 0.99, indicatingthe model’s suitability in modelling the growth. Thus, we concluded that the species can be usedfor post-treatment of effluents to remove TP, TN, and ammonia nitrogen from palm oil mills until itcomplies with the POME effluent discharge standard. However, during the process, degradationof the beads occurred and the COD value increased. Therefore, it is not suitable to be used forCOD removal.
Keywords: alginate beads; C. oleofaciens; immobilisation; green microalgae; POME treatment;post-treatment
1. Introduction
The palm oil industry’s contribution to Malaysia’s economic growth and rapid devel-opment has widely been acknowledged. This industry is rapidly expanding, and Malaysiais the world’s second-largest palm oil producer. Unfortunately, the large amounts ofbyproducts generated during the oil extraction process have contributed to environmentalpollution [1]. The wastewater generated by the palm oil extraction process is known aspalm oil mill effluent (POME). Total solids (40,500 mg/L), oil and grease (4000 mg/L),chemical oxygen demand (50,000 mg/L), biological oxygen demand (BOD3) (25,000 mg/L),total nitrogen (TN) (1400 mg/L), and total phosphorus (TP) (150 mg/L) are all present inlarge concentrations [2]. According to the Malaysian Department of Environment, POMEmust follow regulatory requirements for BOD (20 mg/L), COD (1000 mg/L), total solid(1500 mg/L), suspended solid (400 mg/L), oil and grease (50 mg/L), and total nitrogen(50 mg/L) before being released into the environment [3]. However, some of these valuesare often exceeded in the POME discharged into the environment. For example, the CODof POME from Sembilan, Malaysia, was 3250 mg/L [4]. The non-compliance may well bewhy the discharge limit for COD and TSS was removed in 1982 [3]. Similarly, the COD
Sustainability 2021, 13, 11562. https://doi.org/10.3390/su132111562 https://www.mdpi.com/journal/sustainability

Sustainability 2021, 13, 11562 2 of 18
of POME from Gampong Ujong Lamie, Acheh, Indonesia, was 4177 mg/L exceeding thecountry’s 350 mg/L regulatory discharge limit by more than tenfold [5]. Therefore, there isa need to treat the POME further before releasing it to the environment.
The ponding treatment system, which consists of anaerobic, aerobic, and facultativeponds, is widely used in POME treatment. Because of its ability to handle large quantities ofPOME with low operating costs, this treatment method is used by around 85% of palm oilmills in Malaysia [6]. However, this treatment system will lead to greenhouse gas emissions,especially the methane gas that causes global warming. In addition, the characteristics ofthe handled POME using this treatment method do not always follow the requirements ofthe Malaysian Department of Environment’s industrial discharge standard [7]. Therefore,there is a need to improvise the current treatment methods.
Many researchers have recently shifted their focus to wastewater reuse to protect theenvironment and produce renewable resources such as food, fuel, and feed. Microalgaeare thought to be a promising post-treatment option for agro-industrial wastewater be-cause of their ability to use nutrients for growth [8]. While doing so, they could reduceenvironmental pollution significantly [9]. Value-added compounds can also be extractedfrom the microalgae, but the extraction method is crucial to determine the quality of thecompound [10].
POME has been reported in several studies to have the potential to promote thegrowth of microalgae because it contains sufficient nutrients, especially TN, TP, and otherorganic matters [11]. POME has been successfully used to cultivate Chlamydomonas sp. [11],Chlorella sorokiniana [12], Botryococcus brauni [13], and a mixed culture of microalgae [14].However, Kayombo et al., in 2003, reported that a higher concentration of POME wouldinhibit microalgae growth due to its biotic and abiotic factors. In addition, the micro-sizeof microalgae cells adds to the treatment process’s difficulty. Therefore, before processedPOME is discharged into waterways, microalgae must be harvested. Otherwise, eutroph-ication, another environmental problem, would occur [15]. One of the difficulties thatmany researchers face is the isolation or harvesting of microalgae from treated wastewater.Harvesting methods such as flocculation, centrifugation, and filtration have been successfulat a laboratory scale, but they require expensive equipment [16]. Immobilisation creates aprotective microenvironment for rapid cell development and enables easier harvesting com-pared to the free-living cells. Various microalgae cells have been successfully immobilisedin natural polysaccharide gels or synthetic polymers, enhancing biomass stability andproductivity. For example, calcium alginate is one of the most frequently used methods totrap microalgal cells because it does not need heating and is non-toxic [17]. In this research,a dominant native green microalga strain was isolated from a polishing pond of a POMEtreatment. The strain was used to further treat POME on a laboratory scale. The microalgaecells were immobilised with calcium alginate to study the effects of nutrient load and lightpenetration on microalgal growth and nutrient removal.
2. Materials and Methods2.1. Sampling of POME
The raw POME samples were obtained from a palm oil mill holding tank at NibongTebal, Pulau Pinang, Malaysia (GPS coordinate: 5◦12′33.7′′ N, 100◦29′01.1′′ E), just before itwas discharged into a cooling pond. Sample collection was conducted using high-densitypolyethylene (HDPE) containers with a capacity of 25 L. All POME samples were kept in arefrigerator at 4 ◦C to reduce microbial activities. The raw POME collected was pre-treatedusing two stages of lab-scale treatment: anaerobic and aerobic processes with 50 and16 days hydraulic retention times (HRTs), respectively. In this analysis, the lab-scale-treatedPOME (LABT-POME) was used to ensure that the physiochemical characteristics of thePOME sample did not change significantly during the experiment.

Sustainability 2021, 13, 11562 3 of 18
2.2. Algae Culture Media
Throughout the study, microalgae were grown and cultured using Bold’s BasalMedium (BBM). The BBM compositions are shown in Table 1.
Table 1. The Bold’s Basal Medium (BBM) composition.
Reagent A per 400 mL
NaNO3 10.00 gMgSO4.7H2O 3.00 g
K2HPO4 4.00 gNaCl 1.00 g
KH2PO4 6.00 gCaCl2 1.00 g
Microelement Stock Solution * per 1 L
ZnSO4 8.82 gMoO3 0.71 g
Co(NO3)2.6H2O 0.49 gMnCl2 1.44 g
CuSO4.5H2O 1.57 g
Solution 1 per 100 mL
H3BO4 1.14 g
Solution 2 per 100 mL
EDTA.Na2 5.00 gKOH 3.10 g
Solution 3 per 100 mL
FeSO4.7H2O 4.98 gHCl (Concentrated) 1.00 mL
* autoclave to dissolve before storage.
2.3. Isolation and Cultivation of Green Microalgae
The native green microalgae were isolated from the POME treated in a palm oil millponding system (POMST-POME). The sampling site was a polishing pond, as illustrated inFigure 1. The POMST-POME sample was first examined using a Nikon Eclipse E200 lightmicroscope to ensure the presence of microalgae. A total of 50 mL of POMST-POME wasadded into 250 mL Erlenmeyer flasks before 50 mL of sterilised liquid BBM was added toeach flask. All samples were incubated for 14 days at 35± 3 ◦C with continuous agitation at100 rpm and 32.4± 2.7 µmol.m−2s−1 illuminations. The visible green microalgae cells werewithdrawn from each flask, diluted into different series dilutions, and then spread ontothe BBM agar plates. These agar plate samples were cultivated under the same conditionfor another 14 days. Every agar plate with a single colony was examined under a lightmicroscope before the colony was streaked onto a new agar plate for another 14 days ofcultivation. This process was repeated several times until a single microalgae species wasisolated. Then, the single species of green microalgae was transferred and grown into aliquid BBM at the same cultivation condition. The green microalgae were sub-cultured intoa new fresh liquid BBM monthly to maintain the culture.
2.4. Morphological Identification of Microalgae
A light microscope with a magnification of 40× was used to examine the morphologyof the isolated green microalgae. Cellular shape, scale, flagella, and other visible character-istics of green microalgae cells were reported and compared with the guidebook [18]. Inaddition, scanning electron microscopy (SEM) was performed to validate the microalgaecells’ three-dimensional shape and scale. Before being examined with SEM, the samplecells were dried and fixed using hexamethyldisilazane (HMDS).

Sustainability 2021, 13, 11562 4 of 18
Figure 1. A polishing pond in a palm oil mill located in Nibong Tebal, Penang, from where the greenmicroalgae were collected.
Microalgae Sample Processing Using HMDS Method
Each 1 mL green microalgae cell was withdrawn from a stock culture and centrifugedat 4032 rcf for 15 min. The supernatant of each sample was discarded. The pellet cells werefixed with the McDowell–Trump reagent, prepared in 0.1 M of phosphate buffer, for 24 h.After 24 h, each sample was washed with 0.1 M of phosphate buffer twice by centrifugingand resuspension. The sample was then post-fixed in 1% of Osmium tetraoxide for 1 h.After that, each sample was washed with distilled water, centrifuged, and resuspendedtwice [19].
After the fixation process, all samples underwent a dehydration process by immersingeach sample in ethanol at the concentrations of 50%, 75%, 95%, and 100%, respectively.Each dehydration process was carried out by centrifugation and resuspension of thesamples. The reaction time for each procedure was 10 min. In the last step, each samplewas immersed in hexamethyldisilazane (HMDS) for another 10 min. Finally, HMDS wasdecanted from the samples, and the samples were air-dried in a desiccator at ambienttemperature for one day. Each of the sample cells was coated with gold and examinedunder SEM [19].
2.5. Molecular Identification of Algal Strain
One millilitre of green microalgae was taken from each stock culture and centrifugedfor two minutes at 11,200 rcf. The supernatant of the green microalgae sample was dis-carded entirely, and the suspended biomass of the green microalgae was used in themolecular identification process. The genomic DNA from the green microalgae cultureswas extracted using Plant DNA Extraction Kits (Vivantis Technologies, Malaysia). The pro-cedures of the extraction works were conducted according to the manufacturer’s handbook.The target sequences from the extracted DNA samples were amplified by polymerase chainreaction (PCR). The target genes were amplified with different primers and PCR protocols,as listed in Table 2. The PCR was performed using an Eppendorf Mastercycler® ep, Ger-many. The sequencing of purified PCR product was carried out by the Centre for ChemicalBiology, University Sains Malaysia. The Basic Local Alignment Search Tool (BLAST) wasused to analyse the 18S rRNA sequences. The sequence similarities were compared to theavailable database from the National Center for Biological Information (NCBI).

Sustainability 2021, 13, 11562 5 of 18
Table 2. Primer combination, target gene, and PCR protocols used in the present study.
Target Gene Primer (5′ → 3) Protocol Reference
Chloroccocum
Forward primerCLO-GEN-S3
(GCATGGAATMRCACGATAGGACTC)
Reverse primerCLO-GEN-A4
(CGGCATCGTTTATGGTTGGTTGAGACTAC)
Initial: 15 min (95 ◦C)Denaturation: 30 s (94 ◦C)
Annealing: 90 s (63 ◦C)Extension: 90 s (72 ◦C)
Elongation: 10 min (72 ◦C)
Total runs: 35 cycles
[20]
2.6. Green Microalgae–Alginate Beads Preparation
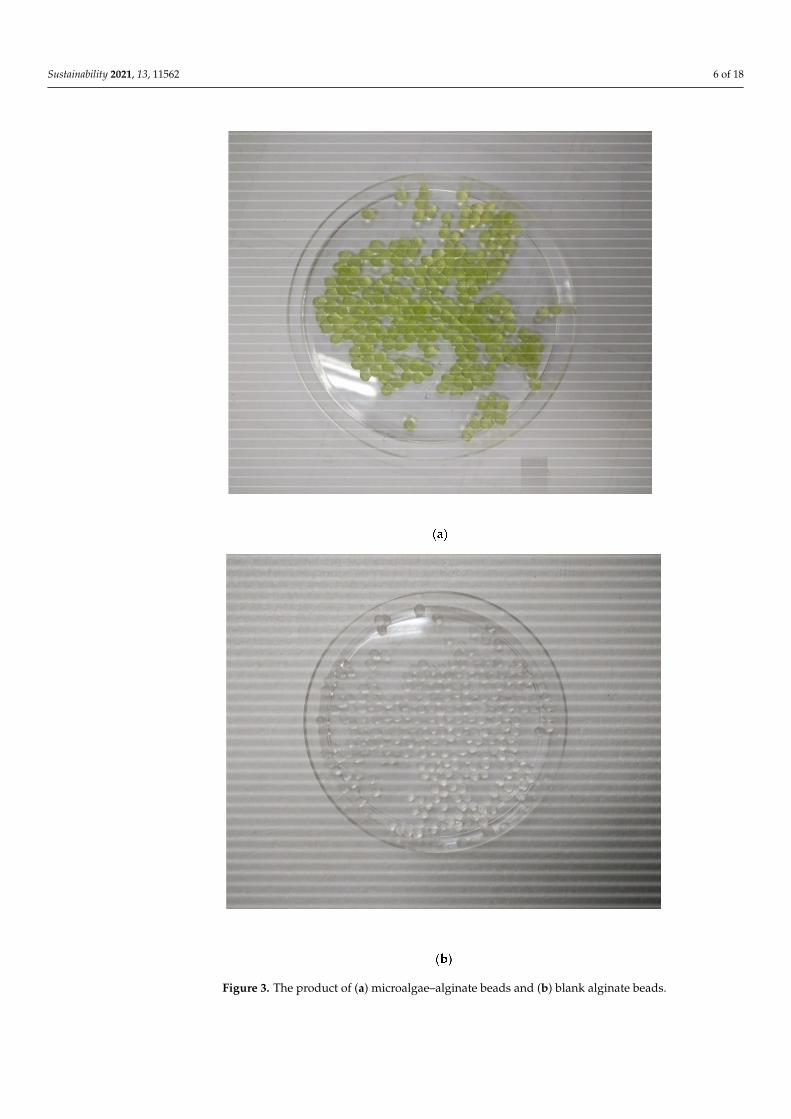
The procedure was adopted from Ruiz-Marin and Sánchez-Saavedra (2016) [21]. Inbrief, 10 mL of the microalgae cells was harvested by centrifugation at 11,200 rcf for 2 min.The pellets were resuspended in 10 mL of autoclaved sterilised water after the microalgaesupernatant was discarded. A two-per-cent microalgae–alginate suspension mixture wasprepared by mixing each microalgae strain with 10 mL of 4% sterile alginate solution in a1:1 volume ratio. The mix was vigorously stirred to ensure the uniformity of the solution.As shown in Figure 2, the mixture was then moved into a 10 mL syringe and placed8–10 cm above a beaker containing a 2% calcium chloride solution. The microalgae–alginate mix was dropped into a calcium chloride solution to form the microalgae–alginatebeads immediately. The process created light green spherical beads (as shown in Figure 3a)with around 3 ± 0.5 mm diameter. The beads were left for four hours in the calciumchloride solution at room temperature to harden. Next, the microalgae–alginate beads werewashed with a 0.85% sterile sodium chloride solution followed by autoclaved distilledwater to remove any residuals. The same process was used to create blank alginate beadsas control, but distilled water was used instead of condensed microalgae cells. Figure 3bshows the morphology of the blank beads.
Figure 2. Experimental work for microalgae beads preparation.
Sustainability 2021, 13, 11562 6 of 18
Figure 3. The product of (a) microalgae–alginate beads and (b) blank alginate beads.

Sustainability 2021, 13, 11562 7 of 18
2.7. Experimental Setup
The microalgae–alginate beads were prepared with the following microalgae–alginateto calcium chloride concentration ratios: 2:2, 2:4, 2:6, 4:2, 4:4, 4:6, 6:4, and 6:6. All of thebeads were placed into Erlenmeyer flasks containing 150 mL of LABT-POME. The flaskswere placed at (35 ± 3 ◦C) with 12 h of light and 12 h of darkness intervals. All sampleswere shaken on an orbital shaker model KJ-201B, Xiangtian China, with a speed of 100 rpmat 32.4 ± 2.7 µmol.m−2s−1 light intensity. After ten days, ten beads from each samplewere removed to determine their hardness and diameter. A texture analyser (TA.XTPlus;U.S.A.) was used to calculate the beads’ hardness, while a digital calliper (TPI 3C350-NB; China) was used to determine their diameter. For the post-treatment LABT-POMEstudy, the microalgae–alginate beads were prepared using the selected best pair of ratios(sodium alginate: calcium chloride). All of the microalgae–alginate beads were placedin a 250 mL Erlenmeyer flask containing 150 mL of LABT-POME. Three sets of controlruns were conducted in this study: a blank control run (BLK-CTRL), autoclaved blankcontrol (AUTOBLK-CTRL), and actual control (ACT-CTRL). BLK-CTRL was prepared withaddition of blank beads into the LABT-POME sample. AUTOBLK-CTRL was prepared bymixing blank beads with a sterilised LABT-POME sample. ACT-CTRL was prepared bythe addition of microalgae–alginate beads into a sterile LABT-POME sample. All sampleswere placed at 35 ± 3 ◦C with continuous agitation at 100 rpm and a light intensity of32.4 ± 2.7 µmol.m−2s−1. For the growth study, ten beads from each sample flask werewithdrawn every two days and re-dissolved for chlorophyll-a extraction (details are furtherdiscussed in Section 2.8.2). At the same time, 10 mL of LABT-POME was collected fromeach flask to test for reducing or removing TN, TP, ammonia nitrogen, and SCOD. Theanalysis of TN, TP, ammonia nitrogen, and SCOD was according to the HACH standardmethods. All the experimental works were ended when the beads started to degrade. Allthe experimental runs were carried out in triplicates.
2.8. Analytical Methods2.8.1. Measurement of Substrate Reduction
The percentage of substrate reduction was calculated using Equation (1) below,
p =So − Se
So× 100% (1)
where p is the percentage removal; So is the initial substrate concentration (mg/L); and Seis the concentration of substrate at equilibrium state (mg/L).
2.8.2. Chlorophyll-a Extraction and Quantification
Ten microalgae–alginate beads were collected from each sample every two days. Toobtain cells trapped in the beads, they were dissolved in 10 mL of 0.1 M tri-sodium citratedihydrate. The Chlorophyll-a was extracted from the microalgae cells. In brief, each flaskhad 1 mL of green microalgae pipetted into a 1.5 mL centrifuge tube. All sample cells werecentrifuged at 11,200 rcf for 2 min. Next, each sample cell’s supernatant was discardedand resuspended in 1 mL of methanol. Then, all sample cells were vortexed for 5 s andheld at 4 ◦C in the dark for an hour. The sample cells were then centrifuged for 2 min at11,200 rcf. Finally, UV-spectrophotometer analysis was performed on the supernatant fromeach sample cell at 649 nm and 665 nm wavelengths. Equation (2) was used to calculatethe chlorophyll-a concentration of green microalgae [22].
Chl. = −8.0962A652 + 16.169A665 (2)

Sustainability 2021, 13, 11562 8 of 18
2.8.3. Growth Rate Study
The doubling time of the green microalgae was calculated using Equation (3) [23,24]:
td =ln 2µ
(3)
where td is the doubling time of microalgae (d), and µ is the specific growth rate ofmicroalgae (d−1).
The specific growth rate of the microalgae was determined using Equation (4) [22,23]:
µ =ln x2 − ln x1
t2 − t1(4)
where µ is the specific growth rate (d−1); x1 and x2 are chlorophyll-a (µg/L); and t1 and t2are the time within the exponential phase (d).
2.8.4. Growth Kinetic Study
Verhulst logistical model was used to determine the dynamic growth of microalgae inthe present study [25]. The equation as below:
X =Xoeµt
1− ( XoXm
)(1− eµt)(5)
where X is the chlorophyll-a concentration of green microalgae in the time-course (g/L);Xo is the initial biomass concentration of green microalgae (g/L); Xm is the biomass concen-tration at equilibrium state (g/L); t is the time taken (d); and µ is the maximum specificgrowth rate of green microalgae (d−1).
2.8.5. Quantification of Substrate Consumption Rate
The substrate consumption rate of immobilised microalgae was calculated usingEquation (6) [21]:
r =So − Siti − to
(6)
where r is the consumption rate of substrate (mg/L.d); So is the initial concentration ofsubstrate (mg/L); Si is the concentration of substrate at time ti (mg/L); and to and ti are thetime within the exponential phase (d).
3. Results and Discussion3.1. Identification of Green Microalgae
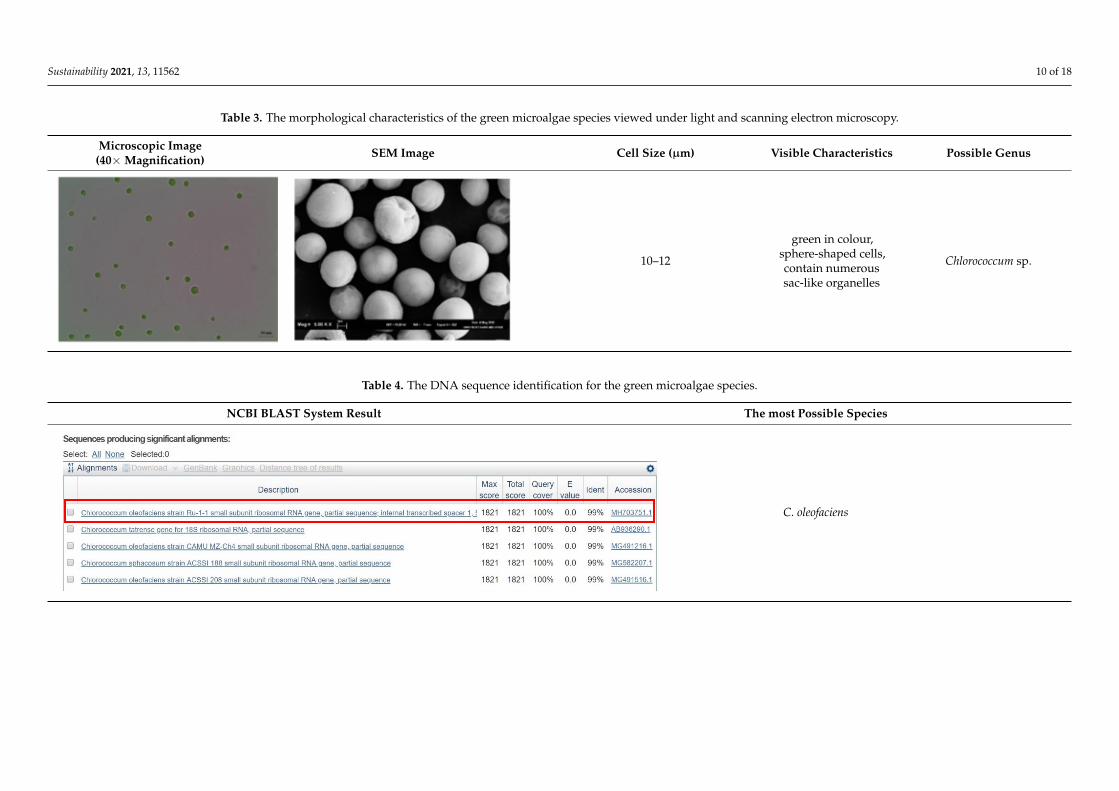
Table 3 shows the picture and morphological characteristics of the green microalgae.The microalgae cells were unicellular and green in colour. As a result, it is classified as aChlorophyte [18]. Table 3 shows that the average size of microalgae cells is between 10 and12 µm. The identities of the microalgae cells were suspected based on their visible charac-teristics, which are described in Table 3. The morphology and features of these microalgaeled to Chlorococcum sp. as the potential genus. Table 4 lists the most related species forthis green microalga using the DNA sequence in the NCBI method. As shown in Table 4,the 18rRNA result for this green microalgae showed 99–100% similarity. Therefore, due tomorphology and molecular identification, the microalgal species is most likely C. oleofaciens.
3.2. Selection of the Suitable Beads
The size of the microalgae–alginate beads shrank over time. As a result, some exper-imental work was conducted to increase the strength of the microalgae–alginate beadsto achieve a longer-lasting duration of beads in the LABT-POME before conducting theimmobilisation studies of C. oleofaciens for POME post-treatment. The beads were rein-forced using three typical concentration ratios of calcium chloride (2%, 4%, and 6%) to

Sustainability 2021, 13, 11562 9 of 18
microalgae–alginate (2%, 4%, and 6%). Figure 4 shows the hardness of the beads made atvarious percentages of calcium chloride to microalgae–alginate concentration ratios. All ofthe beads were inoculated for ten days in LABT-POME at the same time. Throughout thecultivation time, the growth of the strain and the bead degradation were measured. Table 5summarises all of the data obtained.
Figure 4. Hardness of microalgae–alginate beads prepared from different volume ratio pairs ofmicroalgae–alginate to calcium chloride.
Figure 4 shows the increased hardness of beads with the increase in the ratio ofmicroalgae–alginate to calcium chloride. The 6:6 ratio produced the hardest beads, and thesize diameter deteriorated the least throughout the cultivation period, as shown in Table 5.In addition, C. oleofaciens had a low chlorophyll-a concentration average (2.309 µg/mL).These data indicate that the strain did not develop well in the 6:6 ratios because the higheralginate concentration hindered nutrient transport from the LABT-POME into the beads.As a result, the species’ proliferation in the microalgae–alginate beads was slowed. Theresearch work from Banerjee et al. (2019) supports this [26]. They reported that increasingalginate concentration would reduce the pore size of the alginate bead wall, leading torestrictive uptake of nutrients or other macro-molecules.
Sustainability 2021, 13, 11562 10 of 18
Table 3. The morphological characteristics of the green microalgae species viewed under light and scanning electron microscopy.
Microscopic Image(40×Magnification) SEM Image Cell Size (µm) Visible Characteristics Possible Genus
10–12
green in colour,sphere-shaped cells,contain numeroussac-like organelles
Chlorococcum sp.
Table 4. The DNA sequence identification for the green microalgae species.
NCBI BLAST System Result The most Possible Species
C. oleofaciens

Sustainability 2021, 13, 11562 11 of 18
Table 5. Comparison of the strength of microalgae–alginate beads and chlorophyll-a of C. oleofaciens before and aftercultivation in LABT-POME.
Microalgae–Alginate:CaCl2
(% conc.:% conc.)
Initial Diameter ofBeads (mm)
Diameter of Beadsafter 10 Days (mm)
Initial Chlorophyll-a(µg/mL)
Chlorophyll-a after 10Days (µg/mL)
2:2 3.5 ± 0.05 1.2 ± 0.03 0.501 5.8812:4 3.3 ± 0.05 1.8 ± 0.05 0.493 5.6792:6 3.5 ± 0.03 2.0 ± 0.07 0.512 5.6544:2 3.3 ± 0.05 2.5 ± 0.08 0.502 5.0214:4 3.4 ± 0.02 3.0 ± 0.06 0.495 4.9784:6 3.5 ± 0.02 3.1 ± 0.02 0.522 4.8896:2 3.3 ± 0.03 3.1 ± 0.09 0.506 2.8996:4 3.4 ± 0.04 3.3 ± 0.01 0.483 2.3336:6 3.5 ± 0.01 3.4 ± 0.01 0.517 2.309
The immobilised cells had a high average of chlorophyll-a concentration. The beadsize decreased by more than 65% for the ratio pairs of 2:2, 2:4, and 2:6 after ten daysof cultivation in LABT-POME. This finding shows that the microalgae–alginate beadsmade using these ratios were inappropriate for LABT-POME treatment because theydeteriorated quickly. As a result, the 4:4 ratio was chosen as the best ratio for preparingmicroalgae–alginate beads. Table 5 shows that after ten days of cultivation, the size of thebeads decreased by approximately 10%, and the chlorophyll-a concentration average fromimmobilised C. oleofaciens increased to 4.978 µg/mL from 0.495 µg/mL. This result provedthat C. oleofaciens could be grown in certain proportions in the beads. Hence, a ratio of 4:4was selected for further study.
3.3. Growth Study of Immobilised C. oleofaciens in LABT-POME
Figure 5 shows the growth of immobilised C. oleofaciens over 16 days. When cultivatingthe immobilised stain in the LABT-POME sample, the lag phase took two days to develop.In the ACT-CTRL sample, the lag phase was developed on the first day. After the lagtime, both the ACT-CTRL and LABT-POME growth curves of immobilised cell cultivationshowed a sharp increase with no stationary phase. The size of microalgae–alginate beadsdecreases as the cultivation time increases. Due to this, this study only measured thegrowth of immobilised cells for up to 16 days. Consequently, stationary phases were absentfrom both growth curves (Figure 5). Over the 16 days, the size of microalgae–alginatebeads in both the ACT-CTRL and LABT-POME samples was decreased by approximately12% and 30%, respectively. The microalgae–alginate beads degraded due to the higher pHand TP content in LABT-POME. When cultivated in the LABT-POME study, the size ofmicroalgae–alginate beads shrank the most. Since alginate is an organic compound, othermicroorganisms in the LABT-POME may be causing the beads to shrink [27]. On day 14,the deterioration of the beads caused the microalgae cell to leak from the beads, resulting inlower chlorophyll-a concentrations from immobilised cells cultivated in the LABT-POMEsample (35.776 µg/mL) relative to the ACT-CTRL sample (51.435 µg/mL). This resultdemonstrates that immobilising microalgae can concentrate a significant amount of biomassthat can be used as a byproduct. The research on the immobilisation of Synechococcus sp.produced similar results. Immobilised cells, which developed more biomass than free cellcultures, were immobilised in chitosan to protect the cell walls from NaOH toxicity [28].Therefore, similar to the previous study, the cells grew faster when immobilised withalginate beads than free cell culture.

Sustainability 2021, 13, 11562 12 of 18
Figure 5. Average chlorophyll-a concentration of immobilised C. oleofaciens in LABT-POME.
3.4. Removal of TP from LABT-POME
BLK-CTRL has existing POME bacteria, and the bacteria in AUTOBLK-CTRL wereeliminated. The result of this study shows that nutrient removal was not affected by thepresence of the bacteria. Figure 6 shows the absorption of TP by immobilised C. oleofaciensfor 16 days. The TP removal curves for both the ACT-CTRL and LABT-POME samplesdecreased over the 16 days. The species took approximately eight days to eliminatemore than 90% of TP from the LABT-POME in an immobilised state with an ingestionrate of 8.6950 mg/L.d. The higher TP concentration, on the other hand, can hinder thedeterioration of the beads. The Na+ ions exchange ions with Ca2+ ions, loosening thestructure of the beads. Calcium phosphate was then formed by the reaction of phosphateions with Ca2+, which increased the turbidity of the LABT-POME [29]. As a result, thediameter of the beads shrank throughout the 16-day cultivation cycle. The removal ofTP by free-living cells was more than 90% within 16 days of cultivation [30]. However,immobilised cells could remove more than 90% of TP from POME within just 6–8 daysof cultivation. This result indicates that the efficiency of immobilised cells is higher thanfree-living cells. Therefore, the TP removal was probably done not only by algal cells butalso by the beads. However, the removal of TP by beads was not evaluated.

Sustainability 2021, 13, 11562 13 of 18
Figure 6. Removal of total phosphorus from LABT-POME using immobilised C. oleofaciens.
3.5. Removal of Ammonia Nitrogen and TN from LABT-POME
Figure 7a,b depict TN and ammonia nitrogen elimination from LABT-POME over16 days using immobilised cells. In both the ACT-CTRL and LABT-POME samples, TN andammonia nitrogen concentrations decreased over the 16-day cultivation period, as shownin Figure 7a,b. By referring to Figure 7a,b, the immobilised cells performed a high rate ofremoval TN (25.5536 mg/L.d) and ammonia nitrogen (7.3857 mg/L.d). A similar resultwas reported by Liu et al. (2012), which concluded that immobilised Chlorella sorokinianaGXNN 01 removed more nitrogen from synthetic wastewater than free-living cells underthree different conditions: autotrophic, heterotrophic, and 23 microaerobic cultivation oversix days [30]. Within 6–8 days of the cultivation date, the immobilised cells extracted over95% of TN and ammonia nitrogen from ACT-CTRL and LABT-POME samples. However,the free-living cells took a longer time (about 16 days) to achieve more than 90% of TNand ammonia nitrogen removal [30]. This result shows that immobilised cells are moreefficient than free-living cells. When cells are contained inside the alginate, it is shieldedfrom being ingested by other microorganisms. Furthermore, since nutrients can diffuse intothe beads for C. oleofaciens to absorb, the immobilisation produces a micro-environmentfor the species to develop [27]. Therefore, consistent with the previous study, the TN andammonia nitrogen can be efficiently removed by microalgae immobilised with alginate.

Sustainability 2021, 13, 11562 14 of 18
Figure 7. Removal of (a) total nitrogen and (b) ammonia nitrogen from LABT-POME using immo-bilised C. oleofaciens.

Sustainability 2021, 13, 11562 15 of 18
3.6. Reduction of Soluble COD (SCOD) from LABT-POME
Figure 8 shows the reduction of SCOD from LABT-POME over 16 days using immo-bilised cells. In the first ten days, the SCOD removal pattern is shown to be dramaticallyreduced. Within ten days of cultivation, immobilised cells were able to reduce SCOD byabout 60%. Both the ACT-CTRL and LABT-POME samples had significantly higher SCODconcentrations after day 10. The breakdown of microalgae–alginate beads contributes tothe rise in SCOD. After the degradation of the beads, some functional groups such as thecarboxyl in alginate can contribute SCOD into the LABT-POME [29]. Hence, the SCODcurve showed a slight increase over the cultivation period. The 60% removal is lowerthan the 70% removal by Nannochloropsis sp. microalgae [4]. However, the POME usedby Emparan et al., 2020, [4] was filtered or diluted. In contrast, the raw POME used inthe present study was not diluted but pre-treated using two-stage, anaerobic and aerobic,lab-scale treatment. Therefore, considering the dilution factor, the total COD removal inthis study was higher than that of Emparan et al., 2020, [4]. Therefore if this lab-scaletreatment can be upscaled, it can be used to treat POME directly, without dilution.
Figure 8. Reduction of SCOD from LABT-POME using immobilised C. oleofaciens.
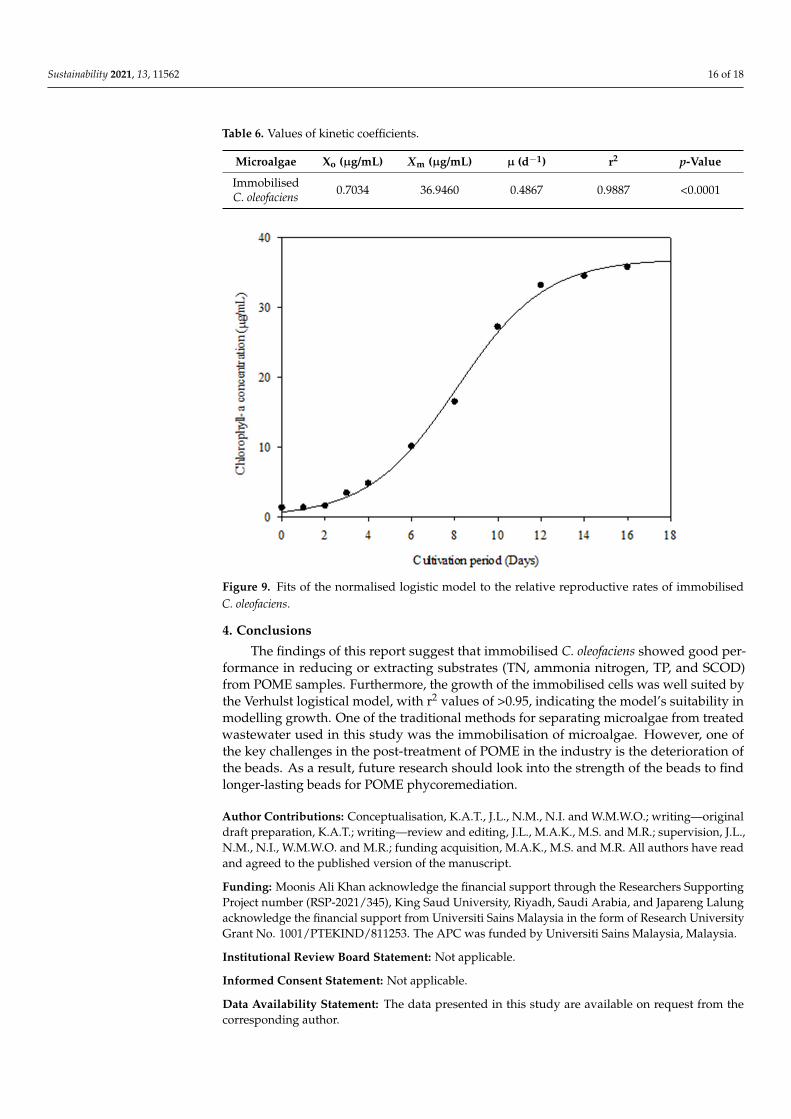
The SigmaPlot®12.5 programme was used to adapt the growth data for immobilisedcells to the Verhulst logistic model. The kinetic model coefficients are shown in Table 6.The data fitting curves to the Verhulst logistic model are shown in Figure 9. For growthin immobilised form, the p-value was less than 0.05. Both systems had an r2 of 0.99. As aresult, the Verhulst logistic model was accurate in describing the growth of immobilisedcells. Similar to Azlin Suhaida et al.’s (2018) research work, the microalgae growth wasalso well fitted with the Verhulst logistic model [31]. The growth rate of immobilised cellswas 0.4867 d−1. The high growth rate of immobilised cells could be because cells are pro-tected from being consumed by other microorganisms in POME. Therefore, the maximumchlorophyll-a concentration, Xm obtained from immobilised cells at the stationary state,was 36.9460 µg/mL.
Sustainability 2021, 13, 11562 16 of 18
Table 6. Values of kinetic coefficients.
Microalgae Xo (µg/mL) Xm (µg/mL) µ (d−1) r2 p-Value
ImmobilisedC. oleofaciens 0.7034 36.9460 0.4867 0.9887 <0.0001
Figure 9. Fits of the normalised logistic model to the relative reproductive rates of immobilisedC. oleofaciens.
4. Conclusions
The findings of this report suggest that immobilised C. oleofaciens showed good per-formance in reducing or extracting substrates (TN, ammonia nitrogen, TP, and SCOD)from POME samples. Furthermore, the growth of the immobilised cells was well suited bythe Verhulst logistical model, with r2 values of >0.95, indicating the model’s suitability inmodelling growth. One of the traditional methods for separating microalgae from treatedwastewater used in this study was the immobilisation of microalgae. However, one ofthe key challenges in the post-treatment of POME in the industry is the deterioration ofthe beads. As a result, future research should look into the strength of the beads to findlonger-lasting beads for POME phycoremediation.
Author Contributions: Conceptualisation, K.A.T., J.L., N.M., N.I. and W.M.W.O.; writing—originaldraft preparation, K.A.T.; writing—review and editing, J.L., M.A.K., M.S. and M.R.; supervision, J.L.,N.M., N.I., W.M.W.O. and M.R.; funding acquisition, M.A.K., M.S. and M.R. All authors have readand agreed to the published version of the manuscript.
Funding: Moonis Ali Khan acknowledge the financial support through the Researchers SupportingProject number (RSP-2021/345), King Saud University, Riyadh, Saudi Arabia, and Japareng Lalungacknowledge the financial support from Universiti Sains Malaysia in the form of Research UniversityGrant No. 1001/PTEKIND/811253. The APC was funded by Universiti Sains Malaysia, Malaysia.
Institutional Review Board Statement: Not applicable.
Informed Consent Statement: Not applicable.
Data Availability Statement: The data presented in this study are available on request from thecorresponding author.

Sustainability 2021, 13, 11562 17 of 18
Acknowledgments: Moonis Ali Khan acknowledge the financial support through the ResearchersSupporting Project number (RSP-2021/345), King Saud University, Riyadh, Saudi Arabia, andJapareng Lalung acknowledge the financial support from Universiti Sains Malaysia in the form ofResearch University Grant No. 1001/PTEKIND/811253.
Conflicts of Interest: The authors declare no conflict of interest.
References1. Parthasarathy, S.; Mohammed, R.R.; Fong, C.M.; Gomes, R.L.; Manickam, S. A novel hybrid approach of activated carbon and
ultrasound cavitation for the intensification of palm oil mill effluent (POME) polishing. J. Clean. Prod. 2016, 112, 1218–1226.[CrossRef]
2. Ahmad, A.; Buang, A.; Bhat, A.H. Renewable and sustainable bioenergy production from microalgal co-cultivation with palm oilmill effluent (POME): A review. Renew. Sustain. Energy Rev. 2016, 65, 214–234. [CrossRef]
3. EQA. Environmental Quality Act (Prescribed Premises) (Crude Palm Oil) Regulations; Department of Environment: Putrajaya,Malaysia, 1974; Volume 93.
4. Emparan, Q.; Jye, Y.S.; Danquah, M.K.; Harun, R. Cultivation of Nannochloropsis sp. microalgae in palm oil mill effluent (POME)media for phycoremediation and biomass production: Effect of microalgae cells with and without beads. J. Water Process. Eng.2020, 33, 101043.
5. Zulfahmi, I.; Ravika, N.; Feizia, H.; Lina, R.; Muliari, M.; Kizar, A.S.; Mohammad, M.R. Phytoremediation of Palm Oil MillEffluent (POME) Using Water Spinach (Ipomoea Aquatica Forsk). Environ. Technol. Innov. 2021, 21, 101260. [CrossRef]
6. Ahmad, A.; Krimly, M.Z. Palm oil mill effluent treatment process evaluation and fate of priority components in an open andclosed digestion system. Curr. World Environ. 2014, 9, 321–330. [CrossRef]
7. Wu, T.Y.; Mohammad, A.W.; Jahim, J.M.; Anuar, N. Pollution control technologies for the treatment of palm oil mill effluent(POME) through end-of-pipe processes. J. Environ. Manag. 2010, 91, 1467–1490. [CrossRef]
8. Delrue, F.; Álvarez-Díaz, P.D.; Fon-Sing, S.; Fleury, G.; Sassi, J.-F. The Environmental Biorefinery: Using Microalgae to RemediateWastewater, a Win-Win Paradigm. Energies 2016, 9, 132. [CrossRef]
9. Goswami, R.K.; Mehariya, S.; Verma, P.; Lavecchia, R.; Zuorro, A. Microalgae-based biorefineries for sustainable resource recoveryfrom wastewater. J. Water Process. Eng. 2021, 40, 101747. [CrossRef]
10. Mehariya, S.; Fratini, F.; Lavecchia, R.; Zuorro, A. Green extraction of value-added compounds form microalgae: A short reviewon natural deep eutectic solvents (NaDES) and related pre-treatments. J. Environ. Chem. Eng. 2021, 9, 105989. [CrossRef]
11. Ding, G.T.; Yaakob, Z.; Takkriff, M.S.; Salihon, J.; Rahaman, M.S.A. Biomass production and nutrients removal by a newly-isolatedmicroalgal strain Chlamydomonas sp in palm oil mill effluent (POME). Int. J. Hydrogen Energy 2016, 41, 4888–4895. [CrossRef]
12. Khalid, A.A.H.; Yaakob, Z.; Abdullah, S.R.S.; Takriff, M.S. Growth improvement and metabolic profiling of native and commercialChlorella sorokiniana strains acclimatised in recycled agricultural wastewater. Bioresour. Technol. 2016, 247, 930–939. [CrossRef]
13. Nur, M.M.A.; Setyoningrum, T.M.; Budiaman, I.G.S. Potency of Botryococcus braunii cultivated on palm oil mill effluent (POME)wastewater as the source of biofuel. Environ. Eng. Res. 2018, 22, 1–8.
14. Babu, A.; Katam, K.; Gundupalli, M.P.; Bhattacharyya, D. Nutrient removal from wastewater using microalgae: A kineticevaluation and lipid analysis. Water Environ. Res. 2018, 90, 520–529. [CrossRef]
15. Kayombo, S.; Mbwette, T.S.A.; Katima, J.H.Y.; Jorgensen, S.E. Effects of substrate concentrations on the growth of heterotrophicbacteria and algae in secondary facultative ponds. Water Res. 2003, 37, 2937–2943. [CrossRef]
16. Sanchez-Galvis, E.M.; Cardenas-Gutierrez, I.Y.; Contreras-Ropero, J.E.; Garcia-Martinez, J.B.; Barajas-Solano, A.F.; Zuorro, A. Aninnovative low-cost equipment for electro-concentration of microalgal biomass. Appl.Sci. 2020, 10, 4841. [CrossRef]
17. Richmond, A. Handbook of Microalgal Culture: Biotechnology and Applied Phycology; John Wiley & Sons: Hoboken, NJ, USA, 2008.18. Bellinger, E.G.; Sigee, D.C. Freshwater Algae: Identification, Enumeration and Use as Bioindicators; John Wiley & Sons. Ltd.: Chichester,
UK, 2015.19. Glauert, A.M. Fixation, Dehydration and Embedding of Biological Specimens. In Practical Methods in Electron Microscopy; Elsevier
Science: Amsterdam, The Netherlands, 1984.20. Fiera, C. Detection of food in the gut content of Heteromurusnitidus (Hexapoda:Collembola) by DNA/PCR-based molecular
analysis. North-West. J. Zool. 2014, 10, 67–73.21. Ruiz-Güereca, D.A.; Sánchez-Saavedra, M.d.P. Growth and phosphorus removal by Synechococcus elongatus co-immobilized in
alginate beads with Azospirillum brasilense. J. Appl. Phycol. 2016, 28, 1501–1507. [CrossRef]22. Ritchie, R.J. Consistent Sets of Spectrophotometric Chlorophyll Equations for Acetone, Methanol and Ethanol Solvents. Photosynth.
Res. 2006, 89, 27–41. [CrossRef] [PubMed]23. Delgadillo-Mirquez, L.; Lopes, F.; Taidi, B.; Pareau, D. Nitrogen and phosphate removal from wastewater with a mixed microalgae
and bacteria culture. Biotechnol. Rep. 2016, 11, 18–26. [CrossRef]24. Ermis, H.; Altınbas, M. Determination of biokinetic coefficients for nutrient removal from anaerobic liquid digestate by mixed
microalgae. Environ. Boil. Fishes 2018, 31, 1773–1781. [CrossRef]25. Peleg, M.; Corradini, M.; Normand, M.D. The logistic (Verhulst) model for sigmoid microbial growth curves revisited. Food Res.
Int. 2007, 40, 808–818. [CrossRef]

Sustainability 2021, 13, 11562 18 of 18
26. Banerjee, S.; Balakdas Tiwade, P.; Sambhav, K.; Banerjee, C.; Kumar Bhaumik, S. Effect of alginate concentration in wastewaternutrient removal using alginate-immobilised microalgae beads: Uptake kinetics and adsorption studies. Biochem. Eng. J. 2019,149, 1–12. [CrossRef]
27. de-Bashan, L.E.; Bashan, Y. Immobilised microalgae for removing pollutants: Review of practical aspects. Bioresour. Technol. 2010,101, 1611–1627. [CrossRef]
28. Aguilar-May, B.; del Pilar Sánchez-Saavedra, M.; Lizardi, J.; Voltolina, D. Growth of Synechococcus sp. immobilised in chitosanwith different times of contact with NaOH. J. Appl. Phycol. 2007, 19, 181–183.
29. Bajpai, S.; Sharma, S. Investigation of swelling/degradation behaviour of alginate beads crosslinked with Ca2+ and Ba2+ ions.React. Funct. Polym. 2004, 59, 129–140. [CrossRef]
30. Liu, K.; Li, J.; Qiao, H.; Lin, A.; Wang, G. Immobilisation of Chlorella sorokiniana GXNN 01 in alginate for removal of N and Pfrom synthetic wastewater. Bioresour. Technol. 2012, 114, 26–32. [CrossRef] [PubMed]
31. Azlin Suhaida, A.; Nurain Atikah Che, A.; Noor Illi Mohamad, P.; Amanatuzzakiah Abdul, H.; Faridah, Y.; Suzana, Y. Chlorellavulgaris logistic growth kinetics model in high concentrations of aqueous ammonia. IIUM Eng. J. 2018, 19, 1–9.


