Embed Size (px)
Citation preview

/ Child Psychol PiyrkuU Vol i^. N.i. 3, pp. S21-545, !99*Elsevier Science Ltd
Association for Child PsychoioKy and PsychiatryPrinted m Great Britain.
0021-9630/94 t6.00.0.fl()
Postnatal Growth and Mental DevelopmentEvidence for a "Sensitive Period"
David Skuse," Andrew Pickles,t Dieterand Sheena Reilly*
Abstract—For many years it has been suspected that severely impaired somatic growth duringearly postnatal life can be associated with the subsequent impairment of mental abilities.This study aimed to test that hypothesis on the basis of data gathered from a prospectivewhole population survey of infant development in south London. A year's birth cohortof 1558 full-term singletons was monitored; 47 otherwise heahhy cases with serious growthfaltering in the first year were recruited. Mental and psychomotor abilities were assessedat 15 months. Potentially confounding psychosocial variables, including cognitive stimulationreceived at home, were measured contemporaneously. A statistical model was constructedthat enabled the timing, duration and severity of growth faltering to be used as predictorsof mental functioning. Up to 37% of the variance in cognitive and psychomotor outcomeat 15 months can be explained by the model. The first few postnatal months appear toconstitute a "sensitive period" for the relationship between growth and mental development.
Keywords: growth, psychosocial deprivation, infant, cognition, failure to thrive
Introduction
Recently, increasing attention has been given to characteristics of prenatal and earlypostnatal growth which may be linked to adult pathology, including hypertension(Barker, Bull, Osmond & Simmonds, 1990), ischaemic heart disease (Barker, Osmond,Winter & Margetts, 1989) and other physiological measures (Barker et ai, 1992).It has been hypothesised that certain processes linked to growth, acting during prenatalor early postnatal life, strongly influence the risk of such disorders. This may be becausethe environment in some way "programs" the organism during a sensitive early stagein development (Barker, 1991). Other studies have found that impaired growth during
Accepted manuscript received 15 September 1993
'Institute of Child Health, London, U.K.^Institute of Psychiatry, London, U.K.^University of Munich Children's Hospital, Germany.Requests for reprints to: Dr D. Skusc, Behavioural Sciences Unit, Institute of Child Health, 30 GuilfordStreet, London VVCIN lEH.
521

522 D. Skusc et ai
the nutrition-dependent infantile phase (Tse, Hindmarsh & Brook, 1989) maycause later stunting (Costello, 1989) and that body size in the first postnatal yearis associated with the timing of puberty in boys (Mills, Shiono, Shapiro, Crawford& Rhoads, 1986). A link between the composition of milk feeds and the subsequentdevelopmental status of preterm babies also seems to reflect a sensitive postnatal period(Lucas f a/., 1990; Lucas, Morley, Cole, Lister & Leeson-Payne, 1992), during whichrelatively subtle dietary manipulations over a brief period of time have longlastingconsequences.
This study was based upon the premise that there is a sensitive period fordevelopment which persists for a short period after birth, during which the brainis especially vulnerable to adversity which influences somatic growth. Early postnatallife is a time when a brain growth spurt is taking place (e.g. Dobbing & Sands, 1973),although there are substantial regional differences in the timing of its development.For example, glial cell multiplication, that begins about mid-gestation, continues wellinto the second postnatal year (Dobbing & Sands, 1973, 1979). Also the dendritictrees of the rather primitive neurones grow over the first 2 years or so to accomplishtheir extraordinarily complex branching (Dobbing, 1981). Concurrently, synapticconnectivity is established. It is important to remember that the effects of detrimentalconditions upon the developing central nervous system will be different at differenttimes of development, and that they will have their maximal effect upon those processesthat are most active at the time of the adversity. The cerebellum, and in particularthe neocerebellum, has its maximum growth spurt just at the time of birth and inthe first year of life (Smart, 1991). Myelination of nervous system pathways takesplace largely postnatally (Casaer, 1993). For example, vestibular and spinal tracts,related to basic postural control, are myelinated at 40 weeks. Mid-brain cortical visualpathways are myelinated at 2-3 months of age, and descending lateral cortical spinaltracts are available at the end of the first postnatal year, when fine motor controlappears (Casaer & Lagae, 1991).
Because of the difficulty studying such processes in children, most investigationswhich have been made into this subject have for obvious reasons not been carriedout on humans but on laboratory animals, especially rats. Poor rates of postnatalgrowth have been induced by dietary manipulation during the suckling period of ratpups (e.g. Widdowson & McCance, I960). In these circumstances early postnatalgrowth retardation, encompassing the suckling period, can lead to permanentrestriction on the growth attainment of the whole body and to some extent this isalso true for the brain itself (e.g. Bedi, Thomas, Davies & Dobbing, 1980a; Bedi,Hall, Davies & Dobbing, 1980b). However, the functional significance of these changesis by no means clear cut, even in the laboratory animal. There are many potentiallyconfounding variables which could account for the undoubted behavioural differencesobserved in formerly malnourished animals (e.g. Katz, 1982; Rogers, Tonkiss &Smart, 1985; Smart, 1987).
Nonetheless, it would seem that nutritional restriction during a critical period inthe growth of rat pups can have long term consequences for somatic and brain growth.This is difficult to prove for human infants. Rat pups are born at a far earlier stageof development than primates, at an age roughly corresponding to 16 postnatal weeksin man (Tanner, 1989). Testing whether there would be an equivalent resetting

Postnaial growth and ineni;i] devtlopmeni 52 3
downwards of the body's growth trajectory in humans would require growth restrictionfor most of the period from 30 weeks gestation until about the second birthday. Bythe same analogy, restriction for short times within this period should be recoverable,as would restriction over the age of two, provided it was not too severe. As in othermatters in developmental undernutrition, three factors; its duration, severity and abovealt timing, need to be taken into account in any extrapolation to the human infant(Dobbing, 1990).
That a relationship exists between somatic growth failure in early childhood andimpaired mental development has been recognised for many years (e.g. Stoch &Smythe, 1963, 1967 (but see commentary by Scrimshaw & Gordon, 1968);Richardson, 1976; Barrett and Frank, 1987; Cabak & Najdanovic, 1965; Lloyd-Still,1976; Caller, Ramsey, Solimano, Lowell & Mason, 1983; Brockman & Ricciuti, 1971;Cravioto & Delicardic, 1972; Pollitt & Cranoff, 1967). Assessment of the effects ofmalnutrition on the development of the nervous system of children is complicatedby at least three main difficulties (Jacobson, 1991). First, the effects of malnutritioncannot be entirely separated from the effects of other harmful conditions, such asmaternal neglect, environmental impoverishment, and lack of stimulation andincentive. Secondly, malnourished children often show behavioural abnormalities thatare variable and difficult to measure accurately, such as reduced social responsiveness,increased irritability and emotional disturbances. It has been suggested thatmotivational changes associated with undernutrition may influence test performancein experimental animals, independent of cognitive impairments arising from neuraldeficits or altered patterns of maternal and environmental stimulation (Crnic, 1976).Alternatively, learning may be reduced as a consequence of the effects of earlierundernutrition, but increased motivation can compensate for the deficit in certaincircumstances (e.g. Katz, Rosatt & Ostwald, 1979). The relevance of motivation tothe cognitive and psychomotor performance of human infants has also attractedattention (e.g. Yarrow & Messer, 1983; Morgan & Harmon, 1984). The dimensionsof mastery-motivation have recently been summarised by Redding, Morgan &Harmon (1988, 1990). They include task pleasure (positive affects such as smiling,contiguous with task-directed behaviour) and task persistence, both of which werefound to be relatively independent of task difficulty. Temperamental and motivationalfactors may play a role in the relation between early and later IQ (e.g. Bornstein& Sigman, 1986; Rose, Feldman, Wallace & McCarton, 1991). For example, Benson,Cherny, Haith & Fulker (1993) found that the child's Task Orientation, measuredon a modified version of the Bayley Infant Behavior Record, was a strong predictorof parental IQ_. Thirdly, only very limited information is available on the effects ofundernutrition on the human brain. The brains of children who have died of starvationweigh less and contain fewer cells and less total protein and phospholipids than thoseof well-nourished children, but little more than that is known (Smart, 1987). In olderchildren, who have been chronically malnourished, it is often difficult, if not impossible,to determine whether any reduction in IQ, over what would have been expected ifthere had been no such adversity, is the result of retarded brain development dueto malnourishment and associated conditions such as disease, or whether the poorperformance is largely or entirely due to social and economic disadvantages. Thisis a particularly acute problem when the research is being conducted in a developing
5 2 4 D. Skuse fA at.
country, and the deficits in question are being examined many years after the mostsevere period of malnutrition (which was very often during infancy, cases havingbeen identified retrospectively through hospital records). There will be manyintervening variables such as socioeconomic status during the follow-up period whichcould be salient to the outcome but which were not measured, and which may notbe stable over long periods of time (see Smart, 1987, p. 192).
We report an investigation that has attempted to find evidence for, and to definethe parameters of, a sensitive period for mental development in full-term infants bystudying a sample whose growth persistently faltered in the first year of life. Theirgrowth failure was equivalent to that described in malnourished children fromdeveloping countries (e.g. Karlberg, Ashraf, Saleemi, Yaqoob &Jalil, 1993). Wehad detailed information on both medical and social histories of our sample throughoutthe pregnancy and postnatal period. They lived in socioeconomic conditions that wererelatively poor by the standards of the society from which they were drawn, but itwas nevertheless possible to control for many potentially confounding psychosocialvariables which could mediate between their growth failure and outcome in termsof mental development. Because of the potentially increased significance of interveningvariables the greater the time gap between the onset of the growth failure and themeasurement of mental outcome, our aim was to conduct a short follow-up, earlyin the second postnatal year. We hypothesised that if there was a sensitive periodfor growth early in the postnatal period it should be possible to demonstrate that,if weight gain failed to exceed certain minimal criteria, based upon the duration,severity and timing of the growth failure, a predictable deficit in cognitive and motorachievements would ensue.
Study design and methods
The investigation was a prospective longitudinal survey of virtually all infants bornduring one calendar year within an inner city health district in London, England.The district has an ethnically diverse population (140,000), which in socioeconomicterms is relatively homogeneous and quite severely disadvantaged (South East ThamesRegional Health Authority, Statistical and Operational Research Department,1984).
The sampling frame comprised all 2510 births who were registered with participatingchild health clinics or family doctor practices, between 1 January and 31 December1986. The planning and execution of the survey was facilitated by the good relationshipbuilt up between the research team and the local community paediatric services inthe course of previous research there (e.g. Dowdney, Skuse, Heptinstall, Puckering& Zur-Szpiro, 1987). Prior to the year in question, leaflets for parents had beencirculated to all health visitors, explaining the purpose of the survey and the fact thatinformation would be abstracted from clinic records for comparative analysis. Onlyone mother refused to participate at this stage. A computerised database was establishedand updated monthly; demographic, developmental and growth data were obtainedby systematic and regular perusal of clinical records. In this way the growth trajectoryof each attender could be monitored prospectively through the first year of life. A

PorJtnatal jjrowth and menial development
minimum schedule of visits to the clinic, or family doctor practice, for weighing,immunisations and checks of developmental progress would be at 6 weeks, 6 monthsand 9 months. However, many children were brought more often than this, and asmall proportion were seen less frequently or not at all.
The selection of subjects who had growth faltering was made from all children whocontinued to live in the district until 12 months of age, and who were weighed onat least one occasion. During this period 14.4% of the population moved out of thearea. There were also niissing data on a small minority of subjects (1.2%) who wereknown to health visitors but were seen only at home. Other families were untraceable(3.3%). There are a number of reasons for this situation. First, the district containsseveral unofficial encampments of travellers who may spend just a few weeks at atime on any one site. Secondly, it is known that some women come from outsidethe district (often from overseas) for the express purpose oi' giving birth at the localteaching hospital. They live at a temporary local address but move away immediatelyfollowing discharge. Thirdly, some families moving within or out of the district fail togive any notification of their whereabouts. Clinic records for those subjects were thereforeinevitably incomplete. A small proportion of infants (.8%) are known to have died.
Growth trajectories were computed from weight data recorded at clinic visits; mostscales in health clinics were of the lever balance type and their accuracy was subjectto regular checks. Infants were weighed nude, usually by clinic nurses. Because childrenwere not weighed at consistent ages, weights were standardised for age and expressedin standard deviation (or Z) scores. Z scores represent the extent of a value aboveor below the mean of weight for age (WAZ) or length for age (LAZ) or weight forlength (WLZ) of the National Centre for Health Statistics growth standards (Hamill,Drizd, Johnson, Reed & Roche, 1977). Computation of the Z scores was undertakenby the CDC anthropometric analysis system (Center for Disease Control, Atlanta;Jordan, 1986) and, calculated separately for age and gender provided scores at a setof fixed ages for all children. Practically, a WAZ, LAZ or WLZ score of - 1.88corresponds to the third percentile.
Definition of growth faltering
Potential cases were limited to singleton deliveries at term, i.e. between 38 and41 completed weeks' gestation. Cestational age was calculated from the date of delivery,recorded by the midwife or obstetrician, based on the date of the last menstrual periodand results of routine ultrasound examination. Preterm infants (gestation 37 weeks6 days or less) were excluded because of the known association with below averagegrowth in the early postnatal period (Brandt, 1986; Ounsted, Moar & Scott, 1982).Also excluded were infants with severe intra-uterine growth retardation (i.e.birthweights at or below the third percentile, on charts standardised for gestation,sex, ordinal position, maternal height and mid-pregnancy weight; Tanner & Thomson,1970). Confirmed cases of growth faltering had to have a WAZ of at least - 1.88,this trajectory relative to population norms having been attained by 12 months ofage, and sustained for 3 months or more.
All children with a suspicious weight gain trajectory, on the basis of clinic data,were traced and visited at home for confirmatory anthropometry. The investigation

5 2 6 D, Skusc et al
procedures were discussed with mothers of subjects and they were asked to give verbalinformed consent. Ethical permission for the study was obtained from the EthicalCommittee of the health district concerned.
Methods
Anthropometric examination undertaken to confirm diagnostic status included: nude weight (SECAdigital baby scales), length (Harpenden infantomcter), left subscapular and triceps skinfold thickness(Holtain skinfold calipers), head circumference (llat steel tape measure), left mid-upper arm circumference(insertion tape marked in 2 mm divisions). Each measurement was taken on two separate occasionsto ensure its accuracy, which was in most cases ± .5%. Techniques were as recommended by Cameron(1984); the child's mother was used as an assistant where necessary. All children were investigated bymeans of a simple screening procedure to identify serious organic disease as a cause of their falteringgrowth. This procedure entailed, firstly, a standardised interview on relevant medical symptoms whichmight be indicative of, for example, gastro-oesophageal reflux or malabsorption syndrome. Secondly,a comprehensive physical examination was performed. Minor congenital anomalies were assignedweighted scores according to the method developed by Waldrop (Waldrnp, Pedcrson & Bell, 1968).Thirdly, a 1 ml {minimum) sample of capillary blood was taken from all subjeris for a full blood count,haemoglobin electrophorcsis, and ferritin estimation (Bcckton-Dickinson immunoradiometric assay—IRMA). Analyses were al.so made for red blood ct-H folate and scrum B12 (Bcckton-Dickinson Simuhrac).
In a small proportion of subjects it was possible to obtain a biood lead level. Analyses were madeusing a modification of the flame microsamphng atomic absorption spectrophotometric method (Delves,1970). In some cases a measure was also obtained of serum insulin-like growth factor I, a variable thatis reduced in severely malnourished children (e.g. Soliman etai, 1986). The technique used to measureserum IGF-I bioactivity was the porcine costal cartilage bioassay, as described by Taylor et al. (1990).Antenatal and birth records were traced on 96% of subjects. These were coded according to a versionofPrechtl's optimality index (Prcchtl, 1980), as modified by Gillberg. Encrskog and Johansson (1990)in their population survey of normal urban Swedish children with mental retardation. Subscale scoresfor prenatal, perinatal and neonatal adversity were derived; the ma.ximum possible adversity score was 29.
Infants were assessed at 15 months on the Bayley Scales of Infant Development (Bayley, 1969) fromwhich were derived indices of mental and psychomotor competence, the Mental Development Index(MDI) and the Psychomotor Development Index (PDl). The mental scale contains language items andmany types of problem solving tasks. The psychomotor scale mainly addresses gross motor development.The child's behaviour during the administration of the Bayley Scales was rated on the Tester's Ratingof Infant Behaviour—TRIB (Wolke, 1987) which is an instrument comprising 16 subscales. Its factorialstructure has demonstrated three coherent factors, difficult ness, attcntiveness-competence and vigour-aciivity (Wolke, Skuse & Mathist-n, 1990). Cronbach's alpha for the internal rehability of these factorswas .89, .86 and .87, respectively. Although the Bayley Infant Behaviour Record (Bayley, 1969) servedas the basis for the development of this instrument, it was designed to yield a more thorough pictureof the child's behavioural style during testing, with a view to deriving indices of mastery-motivation(Yarrow & Messer, 1983).
All mothers were tested using the Wcchsler Scales of Adult Intelligence (Wcchsler, 1974). Proratingof Ihe scores on the block design and picture composition (Performance), vocabulary and information(Verbal) subscales was undertaken in order to yield a full scale IQ score. Mothers' cognitive stimulationof the infants was rated, double blind, from vidcorerordings of semi-structured interactions made intheir homes. The cognitive growth fostering subscale of the Nursing Child Assessment Teaching (NCAST)Scales was employed for this purpose; the instrument has been widely used and possesses good concurrentand predictive validity (Barnard d at., 1989). An experienced independent rater rescored a random25% of the videorecordings, and excellent inter-rater reliability was obtained (Kappa > .95) (Fleiss,1981). A further measure of the quality of the home environment for fostering child development wasaJso obtained (HOME scale; Bradley et al, 1989). Nutritional histories were recorded from semi-structuredinterviews with molhers. Evidence from our previous research (Mathisen et al., 1989) has shown thatoral-motor skills may be impaired in infants who are failing to thrive. Accordingly, we obtained evidence
Pnsinatal growth and ineiitiil development 527
of oral motor functioning from two sources; interviews with mothers about early feeding difficulties,using a semistructured interview format, and direct observations of the infants feeding in a standardizedsituation. Oral-motor behaviour in the latter context was rated on an instrument [Schedule tor OralMotor Assessment (SOMA)] we have developed specifically for the purpose of rating skills in childrenwith and without overt neurological disorder (Reilly, Skuse, Mathisen & Wolke, 1994; Skuse, Stevenson,Reilly & Mathisen, 1994a). This instrument was administered blind to all subjects and lotal abnormalityscores for a variety of food textures were calculated. Some children have more difficulty with one texturethan others (e.g. semi-solids or solids rather than liquids).
Subjects
There were 1554 potential subjects remaining after exclusion criteria had been implemented. Of those,52 (3.3%) were confirmed cases of growth faltering at 12 months of age. Only 3/52 (5.8%) were foundto have an overt organic disorder that was considered to be making a major contribution to the infant'spoor rate of growth. The organic diagnoses included one case of cerebral palsy, one of non-progressivecongenital myopathy and one case of cystic tibrosis. Mealtime observations revealed all three childrenhad major feeding difficulties. All had been diagnosed previous to our contact; no further cases or organicdisease that could account for failure to thrive emerged cither from the results of a medical examination,blood tests or, as was the case for 30% of the sample, referral to a specialist at the local academic teachinghospital ior more extensive investigations. There was thus little or no evidence of occult organic diseasecontributing to the growth faltering of the majority of subjects. Accordingly, for the sake of parsimonyand clarity, the group of growth faltering infants was dichotomised into those whom clinical judgmentsuggested were suffering primarily from an organic disorder, and those who were diagnosed as sufferingfrom 'non-organic failure to thrive' (NOET). Within the NOFT group was one child with microcephaly,hypoionia, and an action tremor or ataxia of unknown origin. All others were, apart from their growthproblem, in good physical health.
A comparison group, chosen from the population database, was matched pairwise with confirmedcasts on ihe basis of sex, age, ethnic origin, birthweight (to within 300 g) and ordinal position.Socioeconomic status was matched on the basis of geographical proximity and nature of housing occupied.Two case families and three comparison families failed to complete the extensive assessment procedureand have been excluded from analyses. All measures, except anthropometry, were made by researcherswho were blind to case/comparison status. Their estimates of group membership, recorded at the timeof testing, were no belter than chance. The final sample comprised 47 NOET cases and 47 pairwisematched comparisons.
Results
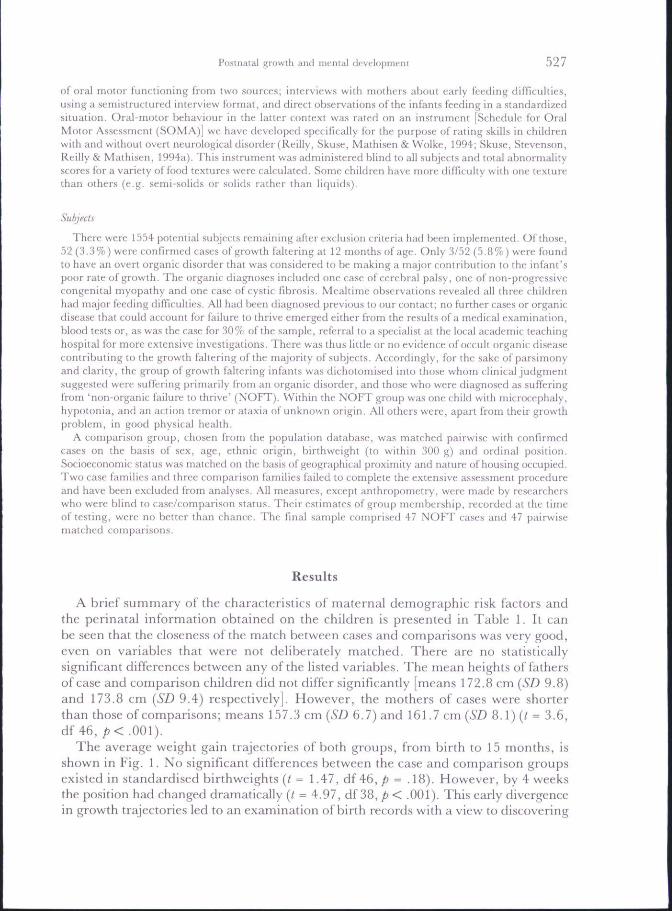
A brief summary of the characteristics of maternal demographic risk factors andthe perinatal information obtained on the children is presented in Table 1. It canbe seen that the closeness of the match between cases and comparisons was very good,even on variables that were not deliberately matched. There are no statisticallysignificant differences between any of the listed variables. The mean heights of fathersof case and comparison children did not differ significantly [means 172.8 cm [SD 9.8)and 173.8 cm {SD 9.4) respectively]. However, the mothers of cases were shorterthan those of comparisons; means 157.3 cm {SD 6.7) and 161.7 cm {SD 8.1) (( = 3.6,df 46,/j<.001).
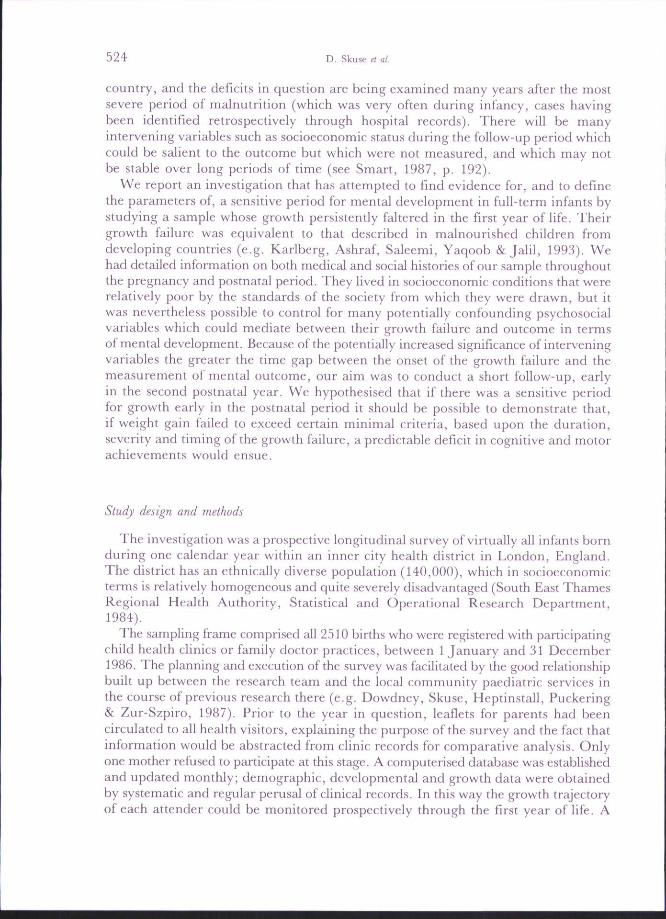
The averatje weight gain trajectories of both groups, from birth to 15 months, is.shown in Fig. 1. No significant differences between the case and comparison groupsexisted in standardised birthweights (/ - 1.47, df46,/) = .18). However, by 4 weeksthe position had changed dramatically {t = 4.97, df 38, p < .001). This early divergencein growth trajectories led to an examination of birth records with a view to discovering

528 D. Skuse et al.
Comparisons
-0.5 -
-1.0 -
-1.5 -
-2.0 -
-2.515m
Fig. 1. Growth trajectories of weight gam of non-organic failure to thrive infants and a comparisongroup, from birth to follow-up examination, expressed in standard deviation scores: 95% confidence
intervals for mean weights are given.
Table 1. Maternal demographic risk factors, perinatal and outcome data for casesand comparisons
Maternal risk factorAge at infant's birlh (yr)Single parentNon-whiteIQ (WAIS)On income/welfare support
Perinatal dataFirstbornMale sexGestational age (wk)Standardised birthweight (SD)Antenatal/perinatal/neonatai
risk factor score
Casesn =
27.6102083.416
212339.5- . 7 6
1.72
'- 47
±5.27(21)(43)±17.1(34)
(45)(49)±1.06± .72
±1.67
Comparisonsn =
26.79
1686.411
212339.5- . 5 7
1,83
= 47
±5.91(19)(34)±16.2(23.4)
(45)(49)±1.28± .81
±1.3
Data are given as means [±SD) or as numbers of subjects, with equivalent percentagesgiven in parentheses. There are no significant differences between the groups on any ofthese variables.

Postnatal growth and mental development
whether the case and comparisons might, despite having similar birthweights, havediffered in other anthropometric respects at that time. Information has been (bundin birth records about the length and head circumference for over 90% of both caseand comparison infants. On the basis of this information the distribution of thesevariables was plotted for cases and comparisons, together with their ponderal index,corrected for sex and gestational age (Table 2). Data for ponderal indices are from(Miller and Hassanein, 1971), and are based on the formula: birthweight in g -(crown-heel length cm*) x 100; this formula was derived from the observations thatthe weight of an object of uniform density and dimension increases as the cube ofits length. Birth length standards were from Kitchen, Bajuk, Lisscndcn and Yu (1981);those for head circumference from Yudkin, Aboualfa, Eyre, Redman and Wilkinson(1987).
There was a tendency for the distribution of the eases' and comparisons'anthropometric indices at birth to differ in respeet of all three variables. NOFT subjectshad a significantly higher pondera] index (mean 2.4; SD 0.4) than comparisons (mean2.3; SD 0.3) {t = 2.24, df 37, p = .03). Lengths and head circumferences at birth wereconverted into standard deviation (z) scores, and standardized for gestation and gender.There were significant differences between the groups in terms of length, thecomparisons (mean 0.74; SD 1.3} being longer than the cases (mean - 0.01; SD 1.3){t = 3.14, df 37, p = .003). The comparisons also had larger head circumferences(mean = .46; 5Z) 1.3) than cases (mean - 1.24; 5Z) 0.94) ( = 3.56; df 42,/? = .001).The pairwise matching for the above analysis led to a few subjects for whom we haddata being excluded.
Mothers were interviewed at home about their infant's medical histories. Twiceas many case infants as comparisons (29.8% vs 15.2%) had been admitted to hospital(McNemar/? =.17) but similar proportions had attended an emergency room (39.1 %vs 41.3%) or been to an outpatient clinic (36.9% vs 26.1%). Their histories ofattendance at child health centres were also similar, with 89.4% of cases and 85.1 %of comparisons being taken on at least three occasions in the first postnatal year. Nodifferences were reported in the frequency of intercurrent illnesses, such as upperrespiratory tract infections, otitis media, gastroenteritis, or persistent episodes ofdiarrhoea and/or vomiting. The great majority of cases (91 %) and comparisons (96%)had been given at least one medical prescription by their family doctor within thepast year.
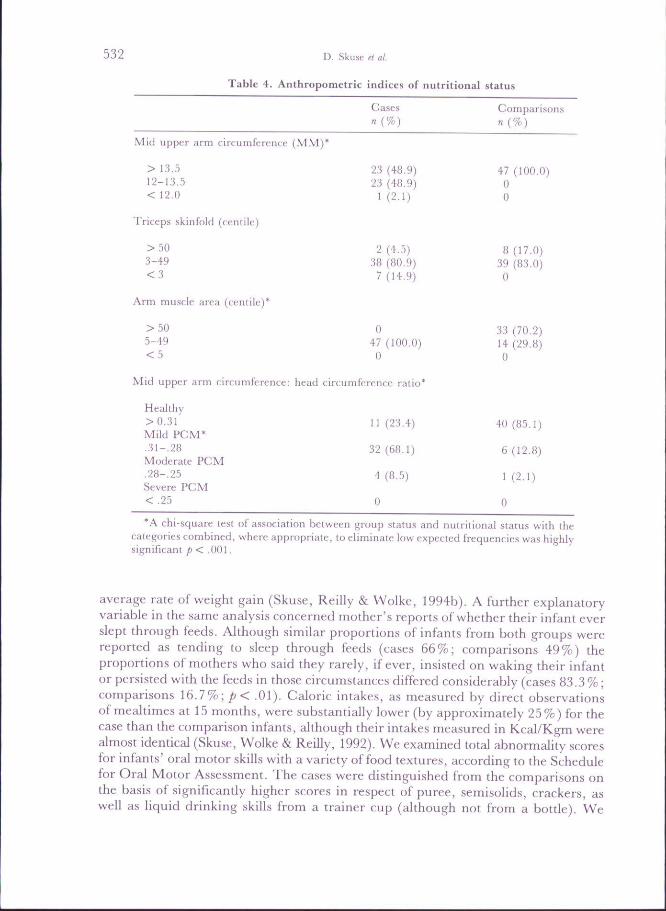
At follow-up all infants were examined at similar ages; cases at a mean age of 14.6months {SD 1.4) and comparisons at a mean age of 14.2 months {SD 1.44). As canbe seen from Table 3 there were considerable differences in both weight, length, weightfor length and head eireumference between the groups. In fact, 93% of case infantswere underweight for their length by at least 1.88 SD, whereas this was not so forany of the comparisons. Other anthropometrit: indices also distinguished the groupsat follow-up (Table 4). Cut-off points for mid-upper arm circumference (MUAC)are from Rees, Henry, Diskett and Shears (1987), for triceps skinfold thickness fromTanner and VVhitehouse (1984), for mid-upper arm circumference: head circumferenceratio (MUACiHC) from Kanawati and McLaren (1970) and for arm muscle areain infancy (claimed to be indicative of protein reserves) from Sann, Durand, Picard,Lasne and Bethenod (1988). More than three out of four cases were suspected of

530 D. Skusc et al
o a.
I s
B0
0Ul
a
u3H
o•g.£k-(UC0
P-.
ison
!a£0
- cu TO
o cc ro ino t-~. cvj •*
S^ CN O C I tM CN
• c ' . CO CO —
O o to r~. CO '*•
'CO CO lO i n COf^ C . 00 O^ " ^
• CM CM CM • — " - ^
o tM iT) CO criCT) iC i n •cf —
CO — c C'l lO
CO CO CM i n c ^
' • — • — CM ^ • *
< — <M tD — '+• CO
>CTl • * t ^ O Ol CT)
Ol CO rt-I i I

Postnatal growth and menial development
Table 3. Outcome data for cases and comparisons
Cases Comparisonsn = 47 7! = 47
Outcome
Age at examination (mth)Standardised weight {SD)Standardised length (SO)Standardised weight for length (SD)Standardised head circumference
(SD)Mental Development Index #Psychomotor Development Index #
14,6-2.07-1.27-1.67
- .8898.296.7
±1.4±.44±.94±.63
±.99±19.0±17.3
14
108103
.2
.10
.18
.09
,25.5.6
±1.4±0.96*± . 7 3 '±1.12*
±.93*±14.4±14.4
Data are given as means ( ±SD), or as numbers of subjects, with equivalent percentagesgiven in parentheses.
*/7<.001,# MANOVA F(l,46) 8.07 p = 0.007. Neither scale effect {p = .07) nor scale x status
interaction {p = ,31) were significant.All other comparisons not statistically significant.
having some degree of protein-caloric malnutrition (PCM), on the basis of theirMUACiHC ratio.
Haeniatological indice.s showed a high proportion of subjects in both groups hadsome degree of anaemia. The World Health Organisation has proposed that ahaemoglobin count of less than llg/dl may be used to identify anaemia in childrenbetween the ages of 6 months and 6 years (World Health Organization, 1972). Bythis criterion (25.5%) of cases and (23.9%) of comparisons were affected. All hadsimple iron-deficiency anaemia, as indicated by serum ferritin < 7ng/nl (Crnic, 1976)which were found in (20.9%) cases and (17.5%) comparisons. Values of serum B12and red cell folate were all within the normal range for infancy. No blood lead valueswere elevated in the 17 children on whom this measure could be obtained. All butone were below the paediatric upper limit of 1.2 micro mol/litre. Sera for insulin-Ukegrowth factor I were obtained on 18 case and seven comparison subjects in total.No significant correlations were found between these values and weight or lengthfor age, nor weight for length, mid-upper arm circumference or triceps skinfoldthickness. There was however, within cases, a positive correlation with the difference(in SDS) between birthweight and current weight (r = 0,41, p< .05).
Although the study design precluded contemporaneous measurement of postnatalfeeding, mothers' retrospective accounts of their early feeding practices did distinguishcases from comparisons. We examined the hypothesis that a proportion of case infantsmay have been failing to thrive at the breast (Habbick & Gerrard, 1984). Relativelymore case mothers (72,3%) started to breast feed than comparisons (61,7%) andthey breast fed for longer, a mean of 20,9 {SD 18.5) weeks compared with 12.9(SD 15.1) weeks {p = .06). However, a multiple regression analysis of postnatalstandardized weights with the case group, using exclusive breast feeding as anexplanatory variable, found that this was if anything associated with a better than
Casesn{%)
2:5 (48.9)23 (48,9)
1 (2.1)
2 (4,5)38 (80,9)
7 (14,9)
047 (100.0)0
Comparisonsn{%)
47 (100.0)00
8 (17.0)39 (83.0)0
33 (70,2)14 (29.8)0
532 D. Skusc et al.
Table 4. Anthropometric indices of nutritional status
Mid upper arm circumference (MM)
> 13.512-13.5<12.0
Triceps skinfold (centile)
3-49
Arm mtiscle area (centile)
>50•'i-49
Mid upper arm circumference: head circumference ratio*
Healthy>0-31 11 (23,4) 40 (85.1)Mild PCM'•31-.28 32(68.1) 6(12.8)Moderate PCM•28-.25 4(8.5) 1(2.1)Severe PCM<.25 0 0
'A chi-square test of association between group status and nutritional status with thecategories combined, where appropriate, to eliminate low expected frequencies was highlysignificani p< .001.
average rate of weight gain (Skuse, Reilly & Wolke, 1994b). A further explanatoryvariable in the same analysis concerned mother's reports of whether their infant everslept through feeds. Although similar proportions of infants from both groups werereported as tending to sleep through feeds {cases 66%; comparisons 49%) theproportions of mothers who said they rarely, if ever, insisted on waking their infantor persisted with the feeds in those circumstances differed considerably (cases 83.3 %;comparisons 16.7%; p< .01). Caloric intakes, as measured by direct observationsof mealtimes at 15 months, were substantially lower (by approximately 25%) for thecase than the comparison infants, although their intakes measured in Kcal/Kgm werealmost identical (Skuse, Wolke & Reilly, 1992). We examined total abnormality scoresfor infants' oral motor skills with a variety of food textures, according to the Schedulefor Oral Motor Assessment. The cases were distinguished from the comparisons onthe basis of significantly higher scores in respect of puree, semisolids, crackers, aswell as liquid drinking skills from a trainer cup (although not from a bottle). We
Posliiaial Ri-owth and mental development JOJ
also found a negative correlation within the case group between a total abnormalityscore, summing across all the textures tested, and weights for age at 4 weeks ( - ,33,p = .012), at 6 weeks ( - .32, p - .01) and at 3 months ( - .35, p = ,01). Weight atbirth and weight at ages after 3 months did not correlate significantly with this score.When individual textures were looked at separately the maximum correlation wasbetween weight-for-age at 3 months and difficulties with solids at 15 months ( - .46,p = .001), There was also a significant negative correlation between the SOMA totalabnormality score and the case infants' MDI (r = - .38; p = ,008) but no significantcorrelation with the PDL The correlations between MDI and total abnormality scorein the comparisons was in the same direction (r = - . 18) but failed to reach significance{p = .20). No significant correlations were found between weights at any age and theSOMA total abnormality score in the comparison group.
Summary data on the outcome for case and comparison children, in terms of theirgrowth and mental development, are presented in Table 3. Both in terms of mentaland psychomotor development case infants were performing significantly less wellthan comparisons. We investigated the possibility that infants in the case group showedless mastery-motivation behaviour during the administration of the Bayley Scales,as measured by the TRIB (Wolke, 1987). There were no significant differences betweenthe groups in terms of expression of positive affect, in association with task directedbehaviour, or in terms of task persistence,
In neither cases nor comparisons did measures of the degree of iron deficiency (serumferritin, mean corpu.scular volume, mean corpuscular haemoglobin concentration)correlate significandy with developmental indices.
In order to test the hypothesis that the consequences of early growth faltering weremerely indicative of a more longstanding problem the duration of growth retardationwas measured. This was taken as the time between the age at which each child's weightgain trajectory crossed the third centile and their age at the follow-up assessment.No significant correlation was found between the duration of growth retardation andmental outcome. Nor did maternal intelligence contribute significantly to the variancein the MDI or PDI scores of either the case or comparison infants.
Construction of statistical modelWithin the case group neither birthweight nor weight at 15 months was significantly
correlated with the MDI or PDI (Table 5), Yet at the intermediate ages, around 6months, a strong correlation with outcome was observed. Multiple regressions of MDIand PDI against birthweight, weight at 6 months and weight at 15 months (enteredsimultaneously) were undertaken. The estimated regression coefficients forstandardized weight at 6 months were large and significant; MDI 15.16 {p = .004)and PDI 10.79 {p = .028), but those for birthweight and weight at 15 months weresmall and non-significant.
In order to investigate the importance of poor early growth as a predictor of latermental abilities, a formal analysis that directly related the timing, severity and durationof growth failure to developmental outcome (Dobbing, 1990) was undertaken usinga nonlinear regression model (statistical software SPSS-PC 4.1). The period frombirth to 15 months was divided into short intervals of age. We hypothesised that within

534 D. Skuse ft al.
Table 5. Standardised weights-for-age from birth, and their correlation with mentaland psychomotor development scale scores at 15 months - cases (n = 47)
Age
Birch4 weeks6 weeks3 months6 months9 months12 month.s15 months
Standardisedweight for age
Mean- .76- .72- .77- . 9 3- 1.51- 1.88-2.08-2.09
SD,72,51.55.51.58,50.42.48
Correlations with15 month scale
scores
MDI- .06
,26.31 '.45+.42+.33*.26.13
PDI- . 14
.10,14.22.33*.15.20.11
*p< .05.V< .01.
each interval (t) the effect on developmental outcome would be determined by themultiplication of two age-specific measures. Firsdy, the sensitivity of mental abilitiesto growth faltering in that interval; secondly, the severity or degree of growth failure.The overall impact of the child's growth trajectory on outcome was obtained bysummmg the effects for all the intervals. The model for data over n time intervalscan be summarised by the following equation:Mental development outcome score
[sensitivity at age t] [severity at age t]
\b +ct] [w, ~ w,_i]. (1)
The coefficient a is the simple regression constant. The expression in the first set ofbraces allows sensitivity to vary with age; that is to say, it expresses the magnitudeof the decrement of the mental outcome score to a unit of severity (or unit dose) ofgrowth faltering occurring within the short interval t. The coefficient b representsthe sensitivity at birth, a value that may increase or decrease with age, dependingupon the value of the coefficient c. With a positive value of c sensitivity increaseslmearly. With a zero value for c sensitivity remains constant with age. With a negativevalue of c, sensitivity falls progressively to zero and then could potentially take onmeaningless negative values. This possibility was avoided by setting such values ofsensitivity automatically to zero. The expression in the second set of braces is thedifference in weight between successive time intervals, measured in standard deviationscores, and represents the trajectory from one time interval to the next. If the infant'sstandardized weight is falling it will yield a negative value. If the weight, relativeto international norms, remains unchanged the value in the second set of braces willbe zero.
Postnatal growth and mental development 535
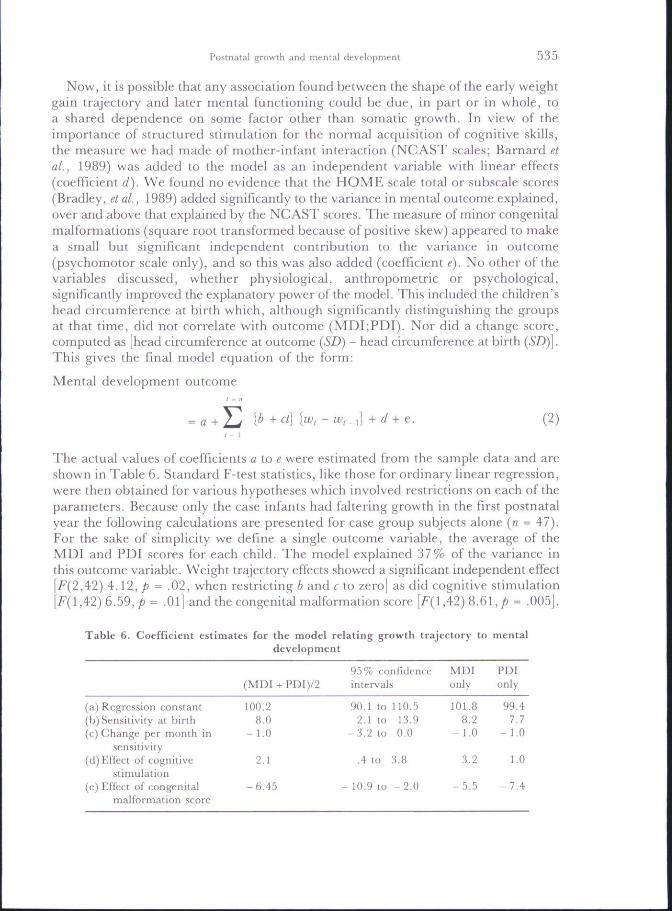
Now, it is possible that any association found between the shape of the early weightgain trajectory and later mental functioning could be due, in part or in whole, toa shared dependence on some factor other than somatic growth. In view of theimportance of structured stimulation for the normal acquisition of cognitive skills,the measure we had made of mother-infant interaction (NCAST scales; Barnard etal., 1989) was added to the model as an independent variable with linear effects(coefficient d). We found no evidence that the HOME scale total or subscale scores(Bradley, et aL, 1989) added significantly to the variance in mental outcome explained,over and above that explained by the NCAST scores. The measure of minor congenitalmalformations (square root transformed because of positive skew) appeared to makea small but significant independent contribution to the variance in outcome(psychomotor scale only), and so this was also added (coefficient e). No other of thevariables discussed, whether physiological, anthropometric or psychological,significantly improved the explanatory power of the model. This included the children'shead circumference at birth which, although significantly distinguishing the groupsat that time, did not correlate with outcome (MDI;PDI). Nor did a change score,computed as [head circumference at outcome {SD) - head circumference at birthThis gives the final model equation of the form:
Mental development outcome
[b (2)
The actual values of coefficients a to i? were estimated from the sample data and areshown in Table 6. Standard F-test statistics, like those for ordinary linear regression,were then obtained for various hypotheses which involved restrictions on each of theparameters. Because only the case infants had faltering growth in the first postnatalyear the following calculations are presented for case group subjects alone {n = 47).For the sake of simplicity we define a single outcome variable, the average of theMDI and PDI scores for each child. The model explained 37% of the variance inthis outcome variable. Weight trajectory effects showed a significant independent effect
2) 4.12, p = .02, when restricting b and e to zero] as did cognitive stimulation,42) 6,59,/J = .01] and the congenital malformation score [^(1,42) 8.61, ^ = .005].
Table 6. Coefficient estimates for the model relating growth trajectory to mentaldevelopment
(a) Regression constant(b) Sensitivity at birth(c) Change per month in
sensitivity(d)Effec( of cogniiive
stimulation(e) Effect of congenital
malformation score
(MDI + PDI)/2
100,28.0
-1 .0
2.1
-6.45
95% t:nni"i(len(:eintervals
90.1 to 110.52.1 to 13,9
-3 .2 to 0.0
.4 to 3.8
- 10,9 lo -2 .0
MDIonly
101.88.2
- 1.0
3.2
-5 .5
PDIonly
99.47.7
- 1,0
1,0
- 7 . 4

5 3 6 D. Skuse et al.
These parameter estimates suggested that sensitivity to growth failure was highestat birth (in this full term sample), and declined rather quickly with age so that byabout 8 months sensitivity was zero. Growth faltering after that date had no furtherimpact upon mental or psychomotor outcome. A test of no change over time insensitivity to growth failure (i.e. restricting parameter c to zero) was strongly rejected[F(l,42) 6.43, p = .02]. The estimates for the initial sensitivity to growth failure(parameter b) and the change per month in sensitivity (parameter c) were remarkablystable, whether the combined MDI/PDI score was used in the analysis or whetherthey were used singly in separate analyses. What did differ was the relative importanceof the eognitive stimulation variable and the score of minor congenital abnormalities.In line with predictions, the former variable was more important for the MDI{p = .003), (p = .3 for the PDI) and the latter variable was more important for thePDI {p = .007), {p = .05 for the MDI).
The model suggests contrasting outcomes will be found for those with early or lategrowth failure. A child whose standardised weight begins to fall immediately afterbirth, from 0 SDS to - 2 SDS uniformly over the first six months post-term, wouldsuffer a loss of 10 points in predicted mental/psychomotor abilities in the secondpostnatal year. A child with the same ultimate loss of weight (by 10 months), butfor whom the onset of the growth faltering was delayed by four months, would suffera loss in predicted abilities of only 3 points. If the weight loss commenced only after8 months of age the model predicts no detriment to mental abilities at all. No evidencewas found to support the alternative hypothesis that this finding simply reflected alow birthweight or a longer duration of low weight-for-age among the infants withthe worst outcome.
Discussion
We have shown that, in a population of otherwise healthy full term infants drawnfrom an inner city birth cohort, severely impaired somatic growth (weight gain) inthe first six postnatal months is associated with poorer mental and psychomotordevelopment in the second year. The degree of growth restriction alone seems to beof major importance. When the timing, duration and severity of growth faltering is takeninto account by a relatively simple statistical model, it is possible to specify with afair degree of confidence the magnitude of the detriment to mental outcome. Ourfinding begs the question, what was the aetiology of the growth failure of our casegroup children? Are we likely to be correct in assuming that the explanation is thatthey were all chronically undernourished? Mathematical modelling of the humangrowth curve has shown there to be two components in early childhood (Karlberg,Engstrom, Karlberg & Fryer, 1987; Tse et al., 1989): the infancy phase, whichcommences at birth and is thought to be largely nutritionally determined, and thechildhood component, which is dependent upon growth hormone secretion. Thechildhood phase begins to assume significance only toward the end of the first postnatalyear. Accordingly, growth failure during the preceding period is believed to indicateundernutrition, and consequently nutritional status can be inferred fromanthropometric indices such as weight for length and MUAC:HC ratio, even in

Posmatal growth and iiicnTal developmcm JJ7
developed countries (e.g. Thieriot-Prevost, Boccara, Francoual, Badoual & Job, 1988).The majority of our case infants were seriously underweight for their length, whereasthis was not so for any of the children in the comparison group, and other nutritionalindices were in line with the same conclusion. However, even if case group childrenwere likely to have been chronically undernourished we cannot be certain about themechanism by which this happened, nor about the relevance of that putativemechanism to their mental outcome in the second postnatal year.
It is unlikely that one explanation could account for all cases of growth failure inthe case group. Evidence that there are probably at least two main mechanisms ispresented elsewhere (Skuse et ai, 1994b). Briefly, it was possible to partition, by asimple arithmetical procedure, the sample of growth faltering infants into twosubgroups: those in whom the growth failure began immediately after birth, and thosefor whom it began 3-6 months later. Remarkably, the outcome for the two subgroupsof infants was quite distinct in terms of mental and psychomotor development, butnot in terms of anthropometric criteria. Mental development was relatively poor onlyfor those children whose growth failure began early; for infants in the late falteringsubgroup it was no different to the outcome of the comparisons. Surprisingly, thechildren with early growth failure came from relatively advantaged homes in whichthe burden of psychosocial adversity was actually lower than for the later growth falteringsubjects; they were even slightly advantaged relative to the comparisons. Essentiallythere are three possible explanations for the association we found between postnatalgrowth and mental and psychomotor development. Firstly, that the growth failurewas primary and was due entirely to environmental factors. According to thisexplanation chronic undernourishment would have been the crucial factor, due perhapsto maternal neglect or serious intercurrent infections, and this led to brain dysiunctionwhich was proportional to the timing, duration and severity of the nutritionaldeficiencies.
Alternatively, the poor mental and psychomotor development could have been theprimary disorder, possibly due to pathology such as covert organic disease or congenitalanomaly; manifestations of the disorder could include a disinclination to feed, ordisordered development of oral-motor skills, both of which put the child at risk ofbeing undernourished. Organic pathology may even have provided a directphysiological explanation for the growth failure. Thirdly, both the growth failure andthe mental and psychomotor outcome could have been due to the same underlyingmechanism, in which there was a relatively subtle interaction between thecharacteristics of the child, which put it at risk, but did not reflect any underlyingpathology, and the quality of parenting provided. The child's contribution to thisinteraction may merely have been a temperamental predisposition to be undemanding;a detrimental outcome would be dependent upon the child's potentially nurturingenvironment failing to provide compensatory experiences.
Considering first the hypothesis that the postnatal growth failure was the primarydisorder, we did not find any evidence that case group children suffered any moreserious or frequent infections during the first postnatal year than the comparisons.Nor was there any convincing evidence that the great majority of mothers were veryneglectful of their children's welfare. We established during the course of home visitsthat adequate and suitable food was available for the index child, although we could

538 D. Skuse d al.
not of course ensure that it was always given exactly as the mother claimed. Onlya handful of mothers had come, or subsequently came, to the attention of social servicesbecause of parenting difficulties. Nevertheless, we have evidence that this may havebeen the explanation for the failure to thrive of a small minority of the case groupwhose growth problem began in the latter part of the first year. Secondly, there isthe possibility that poor mental and psychomotor development could have reflectedcovert organic disease which was present at birth or soon thereafter, but was missedby our screening procedure. Certain metabolic disorders, such as subclinical thyroiddeficiency, may have been responsible (Fisher, 1989) and might not have been detected.Although we did not routinely test for this disorder, besides the screening procedureundertaken with all subjects, nearly 1 in 3 cases was referred for further hospital-based investigations, yet no positive findings of any significant metabolic dysfunctionwere made. All subjects have now been followed up for a further five years and noadditional cases of relevant organic disorders have been identified. Thirdly, it hasbeen claimed (Breitmayer & Ramey, 1986) that suboptimal perinatal status (asmeasured by the modified Prechtl index) could act with subsequent environmental"insufficiency" as a cumulative risk factor. No evidence was found to substantiatethis hypothesis either. We could not differentiate the cases from the comparisons,nor the early from the late growth faltering infants on the basis of antenatal or perinataladversity. However, some case infants—especially those in the early FTT group—did have unusual physiognomies, although in no case was it possible to identif'y arecognisable pattern of human malformation. A small minority may have had a pooroutcome in terms of growth and/or mental development as a consequence of suchdisorder. The finding that in general case infants were born with heads that weresmall relative to their body length does demand explanation, but it does not explainsatisfactorily these findings. Infants in the late FTT subgroup (whose mental outcomewas no different to the comparisons) had heads that were no bigger on average thanthe early FTT subjects, whose mental outcome was relatively poor (see Skuse et al.,1994b).
Thirdly, the growth faltering and the poor mental development of the case groupchildren could have reflected a subde interactional disorder between the child andhis or her caregiver. We do not have any measures of the children's temperamentearly in the first year, only at outcome, and stability of temperamental qualities isnot to be expected over that period (Bates, 1987); at any rate we found no significantdifferences between cases and comparisons in infant behavioural style at follow-upexamination (Skuse et al., 1992), However, it is possible that a proportion of caseinfants showed a relatively low motivation to feed, and poor communication of hungersignals early in postnatal life. Such behaviour is well recognised clinically in someinfants who are failing to thrive, and appears to be the cause rather than theconsequence of their growth problem (Skuse & Wolke, 1992). The behaviour couldreflect a mild degree of delay in the development of normal cognitive processes, andthereby account for their poorer mental and psychomotor outcome too. We have someevidence that case group mothers may have failed to feed their infants adequatelybecause they were passively responding to the child's demands, rather than activelykeeping to a schedule of regular mealtimes. For example, many mothers admittedtheir children were often left to sleep through feeds, both during the day and overnight,

Postnatal growth and mental development
rather than routinely woken (see Skuse et aL, 1994b). However, it is curious thatthere was such a close relationship between the degree of growth faltering and thedegree of detriment to mental and psychomotor development if this is a validexplanation.
A further proportion of case group infants may have failed to thrive because theywere difficult for their mothers to feed. Although the mothers themselves did not reporta greater incidence of feeding problems among case than comparison children wedo have evidence from our own investigation of their oral-motor skills (Skuse et ai,1994a) that those with the lowest weight-for-age at 3 months had the greatest difficultyeating solid food at 15 months. Few children were weaned before 4 months of age.Weights at birth and after 3 months of age were not correlated with abnormality atfollow-up. This observation does suggest that there was a relationship between growthfailure early in the postnatal period and later oral-motor dysfunction but it does nottell us unequivocally the direction of the causal flow. It might be supposed that thecase subgroup whose growth faltered relatively late in the first year were undernourishedas a consequence of feeding difficulties subsequent to weaning. We attempted to "map"onto each child's growth chart the age at which they were said to have been weanedand thereby to demonstrate that there was an association with the onset of failureto thrive in the later cases, but no such simple temporal relationship existed (Skuseet al., 1994b).
Finally, a number of other alternative hypotheses which could explain the poormental outcome for case group children need to be considered. First, there is thepotential role of genetic influences. These are hard to exclude convincingly but severalstrands of evidence against their importance can be cited. No significant differencesin mean IQwere found between case and comparison mothers. In any event, maternalIQdid not independently contribute significantly to the variance in either the MDIor the PDI, a finding that is less surprising when it is considered that heritable variationin general mental development is believed to be more important after infancy (Fulker,DeFries & Plomin, 1988). It has recently been shown the correlation between biologicalmothers' cognitive abilities and those of their adopted-away offspring is only 0,1 orso, at 1-2 years of age (Plomin, DeFries & Fulker, 1988), Secondly, there may havebeen an indirect influence on mental and psychomotor development as a consequenceof the growth failure. Young infants who are malnourished may be lethargic andbecause of that may be neglected or otherwise treated differently by their mothers,setting up a eycle of malnutrition and environmental isolation (e.g. Chavez & Martinez,1984; Graves, 1978). We do not have any measures of the quality of the mother-infant relationship in early infancy, but we found the contribution to the variancein MDI at outcome attributable to concurrent cognitive stimulation was very similarfor both early FTT and late FTT subjects, and comparisons (about 10%). Anexplanation of the poorer mental outcome for those whose growth faltered soon afterbirth is that mothers in the early FTT group were inconsistent, and provided relativelyless mental stimulation to their infants in the first few months after birth than theydid later on. Because no difference between the early FTT and late FTT groups wasfound in terms of stimulation observed to be provided in the second postnatal year,if this was the aetiology of the deficit this explanation would require mental abilitiesat outcome for infants with early growth faltering to be correlated more closely with

540 D. Skusc d al.
what had been going on between mother and infant one year previously than whatwas happening contemporaneously. On the face of it this seems a less thanparsimonious hypothesis. However, it is possible that poor nutrition early in postnatallife renders a child more vulnerable to a low level of stimulation, eithercontemporaneously or subsequendy, than if it had been adequately nourished.
A related matter is the measure of mental development we employed. The BayleyScales are a widely used measure of infant performance, but they are not a goodmeasure of "intelligence" at 15 months, insofar as there is poor stability withdevelopmental test performance at later ages. Bornstein and Sigman (1986) arguedthat traditional tests such as this depend largely upon sensorimotor tasks that dependon infant motor abilities or affective expressiveness. Such skills have little in commonwith processes that underlie intellectual performance in later childhood. As analternative to these approaches Bornstein (1989a) suggested that measures of visualattention and habituation be considered as preferable measures of intellectualfunctioning in infancy, because they reflect basic information-processing abilities andare not subject to potential bias caused by the infant's affective expressiveness ormotoric abilities, socioeconomic or cultural variables. Several studies have shown thatindividual differences in information processing can predict later childhood IQscores(see review by Bornstein, 1989b). We had considered at the outset using measuresof novelty preference (e.g. Rose et al., 1991) to assess infant cognitive abilities.However, the practical difficulties of arranging for children to be tested by thesemethods in their homes proved insuperable. Nevertheless, if the study were to bereplicated with the aim of picking up children with growth failure much earlier inpostnatal life, with a view to undertaking an intervention using a case-control design,it would be essential to use more sensitive measures of cognitive processing. At 15months, most relevant items on the Bayley Mental Development Index scale requirea degree of fine motor coordination; the psychomotor scale measures gross motorskills. Poor performance on both scales could reflect cerebellar dysfunction. The factthat there was a significant negative correlation between the degree of abnormalityon the SOMA and the case infant's MDI, could be interpreted as .support for thishypothesis.
In conclusion, we have shown that, in a population of otherwise healthy fullterminfants drawn from an inner city birth cohort, severely impaired somatic growth (weightgain) in the first half year of life is associated with poorer mental and psychomotordevelopment measured in the second year. The degree of growth restriction alone,especially an early sharp decline in growth trajectory, seems to be of major importance.When the timing, duration and severity of growth faltering is taken into account bya relatively simple statistical model, it is possible to specify with a fair amount ofconfidence the magnitude of detriment to mental outcome. Our results are compatiblewith the findings of a number of previous studies which have suggested the first sixpostnatal months do constitute a sensitive period (e,g. Lloyd-Still, Hurwitz, Wolff& Schwachman, 1974; Cravioto & Robles, 1965; Chase & Martin, 1970; Carmonada Mota, Antonio, Leitayo & Porto, 1990) as is our finding that growth restrictionand cognitive stimulation contribute independently to mental development (e.g. Bedi& Bhide, 1988; Grantham-McGregor, Powell, Walker & Himes, 1991). We cannotat this stage state unequivocally that for the majority of our sample it was

Postnatal growth and mental development o41
undernutrition per se that accounted both for the growth faltering and the detrimentto mental outcome. This is a matter that will have to be investigated with a suitablycontrolled intervention study, designed to pick up potential cases as soon after birthas possible. However, it may be possible for others to attempt to replicate our findingson already existing longitudinal data sets. The potential magnitude of morbidity causedby preventable growth failure in chronically undernourished at-risk populations isconsiderable if our findings are shown to be generalisable. The mean growth trajectoriesof children born into such communities fall rapidly soon after birth to levels far belowinternational norms (e.g. Karlberg et ai, 1993). Assuming the influence of growthimpairment is similar across the whole range of potential attainments, a mean decreasein a population's mental development score of only .5 SD (about 8 points) due toa uniformly poor rate of growth would result in a doubling of the number of subjectswith intelligence quotients in the mentally retarded range.
Acknowledgements—This research was supported by grants from the Wellcome Trust, the Child GrowthFoundation and the Newcomen Educational Foundation and the work was carried out at the BehaviouralSciences Unit, Institute of Child Health, London. We thank the staff of Guy's HospitEil CommunityPaediatric Services, the Lewisham and North Southwark Health Authority Priority Care Unit and thelocal general practitioners who actively cooperated with our investigations. Further invaluable assistancewith tracing subjects and records was provided by Mrs Dorothy Gill and by Mrs Jennifer Smith,administrative assistant, who coordinated data collection and prepared the manuscript. We are gratefulfor discussions on earlier drafts of (his paper with Professor Sir Michael RuHer, Profe.s.sor John Dobbing,Dr Hillary Katz and Dr Jim Stevenson.
References
Barker, D, J, P, (1991). The intrauterine environment and adult cardiovascular disease. In The childhoodenvironment and adult disease (pp. 3-16). Chichester: John Wiley & Sons.
Barker, D. J. P.. Bull A. R,. Osmond, G. & Simmonds, S. J. (1990). Fetal and placental size andrisk of hypertension in adult life. British Medical Journal, 301, 259-262.
Barker. D. J. P., Meade, T. W., Fall, C. H. D., Lee, A,, Osmond, G,, Phipps, K, & Stirling, Y.(1992). Relation of fetal and infant growth to plasma fibrinogen and factor VII concentration inadult life, British Medical Journal, 304, 148*152.
Barker, D. J. P., Osmond, C , Winter, P. D., Margetts, B. & Simmonds, S. J. (1989). Weight ininfancy and death from ischaemic heart disease. Lancet, ii, 577-580.
Barnard, K., Hammond, M,, Booth, K., Bee, H., Mitchell, S. & Spieker, S. (1989). Measurementand meaning of parent-child interaction. In F, Morrison, G, Lord and D, Keating (Eds),/l/>/'/ifc/developmental psychology, vol HI (pp. 38-80). New York: Academic Press.
Barrett, D. E. & Frank, D. A. (1987). The effects of undernutrition on children's behavior. New York: Gordon& Breach,
Bates, J, E. (1987), Temperament in infancy. In J. Osofsky (Ed.), Handbook of infant development (pp.1101-1149). New York: Wiley.
Bayley, N. (1969), Bayley scales of infant development. Psychological Corporation: New York.Bedi, K. S. & Bhide, P. G, (1988), ElTects of environmental diversity on brain morphology. Early Human
Development, 17, 107-144.Bedi, K. S., Hall, R., Davies, G, A, & Dobbing, J. (1980b). A stereological analysis of the cerebellar
granule and Purkinje cells of 30-day-old and adult rats undernourished during early postnatal life.Journal of Comparative Neurology, 193, 863-870.

542 D. Skusf et al.
Bedi, K. S., Thomas, Y. M., Davies, C. A. & Dobbing, J. (1980a), Synapse-to-neuron ratios of thefrontal and cerebellar cortex of 30-day-old and adull rats undernourished during early postnatallik. Journal of Comparative Neurology, 193, 49-56.
Benson, J, B., Gherny, S. S., Haith, M. M. & Fulker, D. W. (1993). Rapid assessment of infantpredictors of adult IQ: midtwin-midparent analyses. Developmental Psychology, 29, 434-447.
Bornstein, M. H. (1989a). Information processing (habiluation) in infancy and stability in cognitivedevelopment. Human Development, 32, 129-136.
Bornstein, M. H. (1989b), Stability in early mental development: from attention and informationprocessing in infancy to language and cognition in childhood. In M. H. Bornstein & N. K. Krasnege(Eds), Stability and continuity in mental development: behavioural and biological perspective.^ (pp 147-170)Hillsdale, NJ: Erlbaum.
Bradley, R, H,, Caldwell, B. M., Rock, S, L., Barnard, K. E., Gray, C , Hammond, M. A., Mitchell,S., Siegel. L., Ramey, C. T., Gottfried, A. W. & Johnson, D. L, (1989). Home environmentand cognitive development in the first 3 years of life: a collaborative study involving six sites andihree ethnic groups in North America. Developmental Psychology, 25, 217-235.
Brandt, I. (1986). Growth dynamics of low birthweighl infants with emphasis on the perinatal period.In F. Faulkner &J, Tanner (Eds), Human growth: a comprehensive treatise, (pp. 415-475)- New York:Plenum Press.
Breitmayer, B. J. & Ramey, G- T. (1986). Biological nonoptimality and quality of postnatal environmentas codeterminants of intellectual development. Child Development, 57, 1151-1165.
Brockman, L. & Ricciuti, H- (1971). Severe protein-calorie malnutrition and cognitive developmentin infancy and early childhood. Developmental Psychology, 4, 312-319.
Cabak, V. & Najdanovie, R. (1965). Effect of undernutrition in early life on physical and mentaldevelopment. Archives of Disease in Childhood, 40, 532-534.
Cameron, N. (1984). The measurement of human growth. London: Croom Helm.Garmona da Mota, H., Antonio, A. M., Leitayo, G. & Porto, M. (1990). Late effects of early
malnutrition. Lancet, i, 1158 (letter).Gasaer, P. (1993). Old and new facts about perinatal brain development. Journal of Child Psychology and
Psychiatry, 34, 101-111.Casaer, P. & Lagae, L. (1991). Age specific approach to neurological assessment in the first year of
life. Acta Paediatrica Japonica. 3 3 . 125-138.Chase, H, P. & Martin, H. P. (1970). Undernutrition and child development, 2\'ew England Journal
of Medicine, 282, 935-939.Ghavez, A. & Martinez, G. (1984)- Behavioral measurements of activity in children and their relation
to food intake in a poor community. In E. Pollilt & P. Amante (Eds), Energ)' intake and activity (pp.303-321), New York: Alan R, Liss.
Costello, A. M. (1989). Growth velocity and stunting in rural Nepal. Archives of Disea.se in Childhood64, 1478-1482.
Cravioto, J, & Uelicardie, E. (1972), Environmental correlates of severe clinical malnutrition and languagedevelopment in survivors from kwashiorkor and malnutrition. In Nutrition, the Nervous System andBehavior (pp. 73-94). Pan-American Health Organization Scientific Publication no. 251,
Crnic, L. S. (1976), Effects of infantile undernutrition on adult learning in rats: methodological anddesign problems. Psychological Bulletin, 83, 715-728.
Delves, H. T, (1970). A microsampling method for the rapid determination of lead in blood by atomicabsorbtion spectrophotometry. Analyst, 95, 431-438.
Dobbing, J, (1981), Nutritional growth restriction and the nervous system. In A, N. Davison & R.H. S. Thompson (Eds), l^he molecular basis of neuropathology (pp. 221-223). London: Edward Arnold,
Dobbing, J. (1990). Eariy nutrition and later achievement. Proceedings of the Nutrition Society, 49, 103-118,Dobbing, J. & Sands, J. (1973). The quantitative growth and development of the human brain. Archives
of Disease in Childhood, 48, 757-767,Dobbing, J, & Sands. J. (1979). Comparative aspects of the brain growth spurt. Early Human Development
3, 79-83.Dowdney, L., Skuse, D., Heptinstall, E., Puckering, G. & Zur-Szpiro, S, (1987). Growth retardation
and developmental delay amongst inner-city infants. Journal of Child Psychology and Psychiatry 28,529-541.

Postnatal growlh and mental development 543
Fisher, D. A. (1989). The thyroid gland. In C. G. D, Brook (Ed.), Clinical paediatric endocrinology (2ndedn, pp. 309-337). Oxford: Blackwell Scientific.
Fleiss, J, L, (1981). The measurement of interrater agreement. In J. L. Fleiss (Ed.), Statistical methodsfor rates and proportions (2nd edn, pp. 212-236). New York: John Wiley & Sons.
Fulker, D. W., DeFries, J. G. & Plomin, R, (1988). Genetic influences on general mental ability increasesbetween infancy and middle childhood. Nature, 336, 767-769.
Galler, J. R., Ramsey, F., Solimano, C , Lowell, G. & Mason, E. (1983). The influence of earlymalnutrition on subsequent behavioural development, (i) Degree of impairment of intellectualperformance, /ourfifl/ of Child Psychiatry, 22, 8-15.
Gillberg, C , Enerskog, 1. & Johansson, S.-E, (1990). Mental retardation in urban children: a populationstudy of reduced optimality in the pre-, peri- and neonatal periods. Developmental Medicine & ChildNeurology, 32, 230-237.
Grantham-McGregor, S. M., Powell, G, A,, Walker, S. P. & Hines, J, H, (1991), Nutritionalsupplementation, psychosocial stimulation, and mental development of stunted children: theJamaican study. Lancet, 338, 1.
Graves, P. L, (1978), Nutrition and infant behavior. A replication study in Nepal. American Journalof Clinical Nutrition, 31, 541-551.
Habbick, B. F. & Gerrard, J. W, (1984). Failure to thrive in the contented breast-led baby. CanadianMedical Association Journal. 131, 765-768,
Hamill, P. V. V,, Drizd, T. A., Johnson, G. L., Reed, R. B. & Roche, A, F. (1977). NCHS growthcurves for children. Birth - 18 years. Hyattsville, Maryland: National Center for Health Statistics,1977; DHEW Publication no (PHS)78-1650. Vital and health statistics; series 11; no 165,
Jacobson, M, (1991). Dependence of the developing nervous system on nutrition and hormones. InJ. Jacobson, Developmental neurobiology (3rd edn, pp. 285-310). New York: Plenum Press.
Jordan, M, D, (1986), The CDC Anthropometric Software Package, version 3. Centers for DiseaseControl, Atlanta, Georgia.
Kanawati, A. A. & McLaren, D. S. (1970) Assessment of marginal malnutrition. Nature, 228, 573-575,Karlberg, J., Ashraf, R. N., Saleemi, M., Yaqoob, M, & Jalil, F. (1993). Early child health in Lahore,
Pakistan: growth, Acta Paediatrica, 82, suppl 390, 119-150,Karlberg, J,, Engstrom, I,, Karlberg, P. & Fryer, J, G. (1987). Analysis of linear growth using a
mathematical model. Acta Paediatrica Scandinavica, 76, 478-488.Katz, H. B, (1982), Superior learning performance by malnourished animals? In R. Sinz & M. R.
Rozenzweig (Eds), Psychophysiology (pp, 1401-1445). Amsterdam: Elsevier,Katz, H. B., Rosett, R. E. & Ostwald, R, (1979). The compensatory role of food-mutivatiun in the maze
learning performance oriactationally undernourished rats. Developmental Psychobiology, 4, 305-315,Kitchen, W. H., Bajuk, B., Lissenden, J. V. & Yu, V, Y. H. (1981). Intra-uterine growth charts from
24-29 weeks gestation. Australian Paediatric Journal, 17, 269-272-Lloyd-Still, J. D. (1976). Clinical studies on the effects of malnutrition during infancy on subsequent
physical and intellectual development. InJ, E. Lloyd-Still (Ed.), Malnutrition and intellectual development(pp. 103-159). Littletown, MA: Publishing Sciences Croup.
Lloyd-Still, J. D,, Hurwitz, I., Wolff, P. H. & Shwachman, H. (1974). Intellectual development aftersevere malnutrition in infancy. Pediatrics, 54, 306-311.
Lucas, A., Morley, R., Cole, T. J., Gore, S. M., Lucas, P.J . , Crowle, P., Pearse, R., Boon, A. J.& Powell, R. (1990). Early diet in preterm babies and developmental status at 18 months. Lancet,335, 1477-1481.
Lucas, A., Morley, R., Cole, T. J., Lister, G. & Leeson-Payne, C. (1992). Breast milk and subsequentintelligence quotient in children born preterm. Lancet, 339, 261-264,
Miller, H. C. & Hassanein, K. (1971). Diagnosis of impaired fetal growth in newborn infants. Pediatrics,48, 511-521.
Mills, J. L,, Shionu, P- H., Shapiro, L. R., Crawford, P, B. & Rhoads, G. G. (1986). Early growthpredicts timing of puberty in boys: results of a 14-year nutrition and growth study. Journal of Pediatrics,109, 543-547,
Morgan, G. A. & Harmon, R. J. (1984). Developmental transformations in mastery motivation:measurement and validation. In R- N, Emde & R. J. Harmon (Eds), Continuities a?id discontinuitiesin development. New York: Plenum Press,

544 D. Skuse et al.
Ounsted, M., Moar, V, & ScoH, A. (1982). Crowth in the first yearoflife: effects of sex and weightfor gestational age at birth. Developmental Medicine and Child Neurology, 24, 356-365.
Plnmin, R., DeFries, J, C. & Fulker, D. W. (1988). Nature and nurture during infancy and early childhood.Cambridge: Cambridge University Press.
Pollitt, E. & Cranoff, D. (1967), Mental and motor development of Peruvian children treated for severemalnutrition. Review of Interamerican Psychology, 1, 93-102,
Prechtl, H. F. R. (1980). The optimality concept- Early Human Development, 4, 201-205.Redding, R. E., Morgan. G, A, & Harmon, R-J. (1988). Mastery motivation in infants and toddlers:
is it greatest when tasks are moderately challenging? Infant Behavior & Development, 11, 419-430.Redding, R. E., Morgan, G. A, & Harmon, R, J. (1990). Relationships between maternal depression
and infants' mastery motivation. Infant Behavior & Development, 13, 391-395.Rees, D. G., Henry, C. J. K., Diskett, P. & Shears, P, (1987). Measures of nutritional status. Lancet,
i, 87-89,Reilly, S., Skuse, D., Mathisen, B. & Wolkt:, D, (1994). The objective rating of oral motor functions
during feeding. Dysphagia (in press).Richardson, S. A. (1976). The relation of severe malnutrition in infancy to the intelligence of school
children having differing life histories. Pediatric Research, 10, 57-61.Rogers, P. J., Tonkiss, J. & Smart, J. L, (1985). Incidental learning is impaired during early life
undernutrition. Developmental Psychobiology, 19, 113-124.Rose, S. A,, Feldman, J. F-, Wallace, I. F. & McCarton, C. (1991). Information processing at 1 year;
relation to birth status and developmental outcome during the first 5 years. Developmental Psychology,27, 723-737.
Sann, L,, Durand, M., Picard, J., Lasne, Y, & Bethenod, M. (1988), Arm fat and muscle areas ininfancy. Archives of Disease in Childhood, 63, 256-260.
Scrimshaw, N. S. & Gordon, J. E. (Eds). {196S) Malnutrition, learning and behavior. Cambridge, MA:MIT Press,
Skuse, D.. Stevenson. J,, Reilly, S. & Mathisen, B. (1994a), Schedule for oral motor assessment (SOMA):methods of validation, (Submitted for publieation.)
Skuse, D., Reilly, S. & Wolke, D. (1994b). Psychosocial adversity and growth during infancy, EuropeanJournal of Clinical Nutrition 48, (Suppl. I) S113-S130.
Skuse, D. & Wolke, D. (1992). The nature and consequences of feeding problems in infants. In P.Cooper & A. Stein (Eds), The nature and management of feeding problems and eating disorders in youngpeople (pp. 1-25). New York: Harwood Publications.
Skuse, D. H., Wolke. D. & Reilly, S, (1992)- Failure to thrive. Clinical and developmental aspects.In H. Remschmidt & M. Schmidt (Eds), Developmental psychopathology, child and youth psychiatry. Europeanperspectives (Vol II, pp. 41-76). Cottingen: Hogrefe & Huber,
Smart, J. L. (1987). The need for and the relevance of animal studies of early undernutrition. InJ. Dobbing (Ed,), Early nutrition and later achievement (pp. 50-85). London: Academic Press.
Smart, J. L. (1991). Critical periods in brain development. In G. R. Bock & J. Whelan (Eds), Thechildhood environment and adult disease (pp. 109-124). London: Wiley & Sons.
Soliman, A. T,, Hassan, A. H. I., Aref, M. K., Hintz, R, L,, Rosenfeld, R. C. & Rogol, A. D,(1986), Serum insulin-like growth factors I and II concentrations and growth hormone and insulinresponses to arginine infusion in children with prolein-energy malnutrition before and afternutritional rehabilitation. Pediatric Research, 20, 1122-1130.
South East Thames Regional Health Authority Statistical and Operational Research Department (1984).District Health Authority ACORN populations.
StQch, M. B. & Smythe, P. M. (1963). Does undernutrition during infancy inhibit growth and subsequentintellectual development? Archives of Disease in Childhood, 38, 546-552.
Stoch, M. B. & Smythe, P, M, (1967), The effect of undernutrition during infancy on subsequent braingrowth and intellectual development. East Africa Medical Journal, 41, 1027-1030,
Tanner, J. M, (1989), Foetus into man: physical growth from conception to maturity (2nd edn). Ware: GastlemeadPublications.
Tanner, J. M. & Thomson, A. M, (1970). Standards for birthweight at gestation periods from 32 to42 weeks, allowing for maternal height and weight. Archives of Disease in Childhood, 45,566-569,

Postnaial growth and mental Hevt'lopment 545
Tanner, J, M, & Whitehouse. R. H. (1984). Standards for height and weight from birth to five years: Britishchildren 1970. Growth and development charts nos. 28/29. Ware: Castlemead Publications.
Taylor, A. M., Dunger, D- B., Preece, M, A,, Holly, J. M. P., Smith, C. P., Wass, J. A. H,, Patel,S. & Tate, V, F. (1990). The growth hormone independent insulin-Hke growth factor-I bindingprotein BP-28 is associated with serum insulin-like growth factor-I inhibitory bioactivity in adolescentinsulin-dependent diabetics. Clinical Endocrinology, 32, 229-239.
Thieriot-Prevost, G,, Boccara,J. F., Francoual, C , Badoual, J. &Job, J. C. (1988). Serum insulin-like growth factor I and serum growth-promoting activity during the first postnatal year in infantswith intrauterine growth retardation. Pediatric Research, 24, .S80-383.
Tse, W. Y., Hindmarsh, P, C. & Brook, C. C, (1989). The infancy-childhood-puberty mode of growth:clinical aspects, Acta Paediatrica Scandinavica Supplement, 356, 38-45.
Waldrop, M., Pedersen, F. & Bell. R. (1968). Minor physical anomalies and behavior in preschoolchildren. Child Development, 39, 391-400.
Wechsier, D. (1974). Wechsler adult intelligence scale—revised. New York: Psychological Corporation.Widdowson, E. M. & McCance, R. A. (1960). The effect of fmite periods of undernutrition at different
ages on the composition and subsequent development of the rat. Proceedings of the Royal Society, 8,158-329.
Wolke. D. (1987). Tester's rating of infant behaviour (TRIB). (Further details from author.)Wolke, D., Skuse, D. & Mathisen, B. (1990). Behavioral style in failure to thrive infants: a preliminary
communication. Journal of Pediatric Psychology, 15, 237-254.World Health Organization (1972). Nutritional anemias. Technical Report Series, 503.Yarrow, L.J. & Messer, D. J. (1983). Motivation and cognition in infancy. In M. Lewis (Ed.), Origins
of intelligence (2nd edn). New York: Plenum Press,Yarrow, L.J , , MacTurk, R, H., Vietze, P. M., McCarthy, M. E,, Klein, R. P, & McQuiston, S.
(1984). Developmental course of parental stimulation and its relationship to mastery motivationduring infancy. Developmental Psychology, 20, 492-503,
Yudkin, P, L,, Aboualfa, M,, Eyre, J, A,, Redman, C, W, & Wilkinson, A. R, (1987), New birthweightand head circumference centiles for gestation ages 24 to 42 weeks. Early Human Development, 15,45-52,


