Embed Size (px)
Citation preview
consumption varies continuously with the levelof AGRP neuron activation, nearly full suppres-sion of activity is required to block the evokedfeeding response (28).
AGRP neurons in Agrp-cre mice (29) weretransduced using a bicistronic Cre recombinase(Cre)–dependent viral vector (30) (Fig. 4A). AGRPneurons coexpressing ChR2 and PSAML141F,Y115F-GlyR (Fig. 4B) could be activated with light andwere reversibly silenced byPSEM89S during photo-stimulation in brain slices (Fig. 4, C and D).Micecoexpressing ChR2 and PSAML141F,Y115F-GlyRor expressing ChR2 alone in AGRP neurons atevoraciously in response to photostimulation af-ter intraperitoneal (i.p.) saline injection, and, foreach mouse, this consumption was used as thebaseline for subsequent treatments. After i.p. ad-ministration of PSEM89S, photostimulation-evokedfeeding was strongly suppressed in mice express-ing PSAML141F,Y115F-GlyR but not in mice ex-pressing onlyChR2 (Fig. 4, E and F). Twenty-fourhours later, photostimulation-evoked food intakerecovered to baseline levels (two-way analysis ofvariance, one-factor repeated measure, TPSEM89S:F1,9 = 12.9, P = 0.006; TPSAML141F,Y115F-GlyR:F1,9 = 1.3, P = 0.30; interaction: F1,9 = 22.4, P <0.001; Fig. 4, E and F). Moreover, after pho-tostimulation, Fos, a marker of neuron activa-tion (31), was almost completely suppressed inChR2-expressing neurons frommice administeredPSEM89S (fig. S14). Thus, PSAML141F,Y115F-GlyRand PSEM89S constitute an effective neuronalsilencer system in vivo, even for strong, synchro-nous depolarizing currents that result from ChR2photoactivation.
Our results show how concerted chemical andgenetic engineering of a complex ligand-bindinginterface can be used to develop pharmaco-logically selective actuators and small-moleculeeffectors for construction of a LGIC toolbox.PSEMs, the agonists for the resulting ion chan-nels, act rapidly in the brain after peripheraldelivery. Together, these components enable com-binatorial construction (fig. S15) of cell type–selective tools to control a range of conductances,which can be used to activate or silence neurons.These ion channels could be further elaboratedby applying extensive structure-function relation-ships in Cys-loop receptors, including mutationsthat modify ion selectivity (27, 32–34), intra-cellular interactions (35–37), and desensitization(27, 38, 39). The pharmacologically orthogonalion channels described here can also be usedwitheach other or with existing tools such as chan-nelrhodopsin, facilitating multiple perturbationsin the same organism to investigate functions ofion flux in cell biology, physiology, and behavior.
References and Notes1. E. M. Slimko, S. McKinney, D. J. Anderson, N. Davidson,
H. A. Lester, J. Neurosci. 22, 7373 (2002).2. E. M. Tan et al., Neuron 51, 157 (2006).3. P. Wulff et al., Nat. Neurosci. 10, 923 (2007).4. B. N. Armbruster, X. Li, M. H. Pausch, S. Herlitze,
B. L. Roth, Proc. Natl. Acad. Sci. U.S.A. 104,5163 (2007).
5. S. Gosgnach et al., Nature 440, 215 (2006).6. W. Lerchner et al., Neuron 54, 35 (2007).7. S. M. Ferguson et al., Nat. Neurosci. 14, 22 (2011).8. E. S. Boyden, F. Zhang, E. Bamberg, G. Nagel,
K. Deisseroth, Nat. Neurosci. 8, 1263 (2005).9. X. Li et al., Proc. Natl. Acad. Sci. U.S.A. 102, 17816 (2005).10. F. Zhang et al., Nature 446, 633 (2007).11. J. L. Eiselé et al., Nature 366, 479 (1993).12. T. Grutter et al., Proc. Natl. Acad. Sci. U.S.A. 102, 18207
(2005).13. H. A. Lester, M. I. Dibas, D. S. Dahan, J. F. Leite,
D. A. Dougherty, Trends Neurosci. 27, 329 (2004).14. J. A. Dent, J. Mol. Evol. 62, 523 (2006).15. A. Tasneem, L. M. Iyer, E. Jakobsson, L. Aravind,
Genome Biol. 6, R4 (2005).16. Y. W. Hwang, D. L. Miller, J. Biol. Chem. 262, 13081 (1987).17. A. C. Bishop et al., Nature 407, 395 (2000).18. Q. Lin, F. Jiang, P. G. Schultz, N. S. Gray, J. Am.
Chem. Soc. 123, 11608 (2001).19. P. H. Celie et al., Neuron 41, 907 (2004).20. D. P. Walker et al., Bioorg. Med. Chem. 14, 8219 (2006).21. A. L. Bodnar et al., J. Med. Chem. 48, 905 (2005).22. P. N. Vinson, J. B. Justice Jr., J. Neurosci. Methods 73,
61 (1997).23. J. L. Galzi et al., FEBS Lett. 294, 198 (1991).24. S. P. Kelley, J. I. Dunlop, E. F. Kirkness, J. J. Lambert,
J. A. Peters, Nature 424, 321 (2003).25. D. Rayes, G. Spitzmaul, S. M. Sine, C. Bouzat,
Mol. Pharmacol. 68, 1475 (2005).26. P. Séguéla, J. Wadiche, K. Dineley-Miller, J. A. Dani,
J. W. Patrick, J. Neurosci. 13, 596 (1993).27. J. L. Galzi et al., Nature 359, 500 (1992).28. Y. Aponte, D. Atasoy, S. M. Sternson, Nat. Neurosci. 14,
351 (2011).29. C. B. Kaelin, A. W. Xu, X. Y. Lu, G. S. Barsh,
Endocrinology 145, 5798 (2004).30. D. Atasoy, Y. Aponte, H. H. Su, S. M. Sternson,
J. Neurosci. 28, 7025 (2008).31. J. I. Morgan, T. Curran, Annu. Rev. Neurosci. 14,
421 (1991).
32. D. Bertrand, J. L. Galzi, A. Devillers-Thiéry, S. Bertrand,J. P. Changeux, Proc. Natl. Acad. Sci. U.S.A. 90, 6971(1993).
33. A. Keramidas, A. J. Moorhouse, C. R. French,P. R. Schofield, P. H. Barry, Biophys. J. 79, 247 (2000).
34. M. J. Gunthorpe, S. C. Lummis, J. Biol. Chem. 276, 10977(2001).
35. M. K. Temburni, R. C. Blitzblau, M. H. Jacob, J. Physiol.525, 21 (2000).
36. J. Xu, Y. Zhu, S. F. Heinemann, J. Neurosci. 26, 9780 (2006).37. M. Jansen, M. Bali, M. H. Akabas, J. Gen. Physiol. 131,
137 (2008).38. F. Revah et al., Nature 353, 846 (1991).39. H. G. Breitinger, C. Villmann, K. Becker, C. M. Becker,
J. Biol. Chem. 276, 29657 (2001).Acknowledgments: Supported by the Howard Hughes
Medical Institute. C.J.M. performed the electrophysiologyand the imaging; P.H.L. synthesized the moleculesand performed the MP screen; D.A. performed thebehavioral experiments; H.H.S. made the mutantchannels and other constructs; L.L.L. made the homologymodel; and S.M.S. developed the mutant ion channelscreen, planned the experiments, analyzed data, andwrote the paper with comments from all authors. Wethank S. Winfrey and H. White for cell culture support.S.M.S., P.H.L., and L.L.L. are inventors on a patentapplication by the Howard Hughes Medical Instituteregarding combined use of these ligand-gated ionchannels and small-molecule agonists.
Supporting Online Materialwww.sciencemag.org/cgi/content/full/333/6047/1292/DC1Materials and MethodsFigs. S1 to S15Tables S1 to S3Movie S1References (40–42)
6 April 2011; accepted 8 August 201110.1126/science.1206606
Potential for ChemolithoautotrophyAmong Ubiquitous Bacteria Lineagesin the Dark OceanBrandon K. Swan,1 Manuel Martinez-Garcia,1 Christina M. Preston,2 Alexander Sczyrba,3
Tanja Woyke,3 Dominique Lamy,4* Thomas Reinthaler,4 Nicole J. Poulton,1
E. Dashiell P. Masland,1 Monica Lluesma Gomez,1 Michael E. Sieracki,1 Edward F. DeLong,5
Gerhard J. Herndl,4 Ramunas Stepanauskas1†
Recent studies suggest that unidentified prokaryotes fix inorganic carbon at globallysignificant rates in the immense dark ocean. Using single-cell sorting and whole-genomeamplification of prokaryotes from two subtropical gyres, we obtained genomic DNA from738 cells representing most cosmopolitan lineages. Multiple cells of Deltaproteobacteriacluster SAR324, Gammaproteobacteria clusters ARCTIC96BD-19 and Agg47, and someOceanospirillales from the lower mesopelagic contained ribulose-1,5-bisphosphatecarboxylase-oxygenase and sulfur oxidation genes. These results corroborated communityDNA and RNA profiling from diverse geographic regions. The SAR324 genomes alsosuggested C1 metabolism and a particle-associated life-style. Microautoradiography andfluorescence in situ hybridization confirmed bicarbonate uptake and particle associationof SAR324 cells. Our study suggests potential chemolithoautotrophy in several unculturedProteobacteria lineages that are ubiquitous in the dark oxygenated ocean and providesnew perspective on carbon cycling in the ocean’s largest habitat.
The dark ocean (below 200 m) contains anactive and metabolically diverse microbi-al assemblage that is responsible for the
majority of marine organic carbon mineraliza-
tion (1). In addition to heterotrophic microbialactivity, autotrophic carbon assimilation may besignificant not only in oxygen minimum zones(OMZs) and anoxic basins (2–4), but also
2 SEPTEMBER 2011 VOL 333 SCIENCE www.sciencemag.org1296
REPORTS
on
Sep
tem
ber
1, 2
011
ww
w.s
cien
cem
ag.o
rgD
ownl
oade
d fr
om
throughout the oxygenated water column (5–7).In the North Atlantic, the dark ocean’s primaryproduction is 20 to 40% of the photic zone’sexported production and may be of the same or-der of magnitude as the dark ocean’s heterotro-phic production (6). It has been generally assumedthat the predominant type of autotrophy in thedark ocean is CO2 fixation through the 3-hydroxypropionate/4-hydroxybutyrate cycle, driv-en by the archaeal marine group I Crenarchaeaand fueled by ammonia oxidation (8, 9). However,archaeal nitrification may be insufficient to supportthe measured inorganic carbon fixation rates insome regions of the North Atlantic (6, 10, 11).Thus, as yet unidentified microbial lineages andenergy sources may be responsible for a sig-nificant fraction of carbon fixation in the darkocean. The paucity of representative pure cul-tures has hindered experimental and genomicstudies of the majority of bacterioplankton fromthe deep ocean so far.
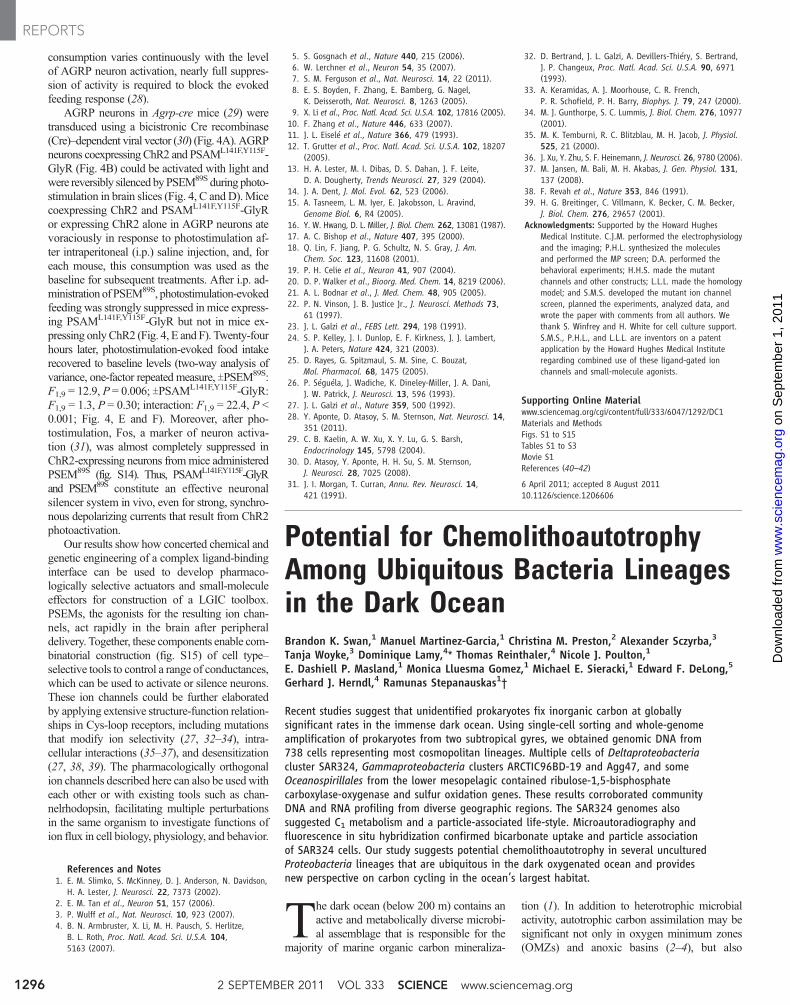
We used single-cell sorting and DNA se-quencing to identify the predominant bacteriallineages in the mesopelagic that contain genesfor inorganic carbon fixation (12). This ap-proach can link phylogenetic [such as smallsubunit ribosomal RNA (SSU rRNA)] and meta-bolic marker genes by sequencing them fromthe same cell obtained directly from its envi-ronment, without the need for cultivation (13–17).Using single-cell sorting and whole-genome am-plification, we generated libraries of prokaryoticsingle amplified genomes (SAGs) from surfaceand mesopelagic samples from the South Atlanticand North Pacific Subtropical Gyres (figs. S1 andS2). By polymerase chain reaction (PCR) andsubsequent sequencing of the SSU rRNA genes,we identified 502 mesopelagic and 236 surface-ocean prokaryote SAGs (Fig. 1 and Table 1). Mi-crobial community composition, as determined bySAG libraries, differed between the surface andthe mesopelagic zones within each gyre. In con-trast, microbial composition was similar betweensamples collected at similar depths at the twostations, especially for the mesopelagic (Fig. 1),in agreement with past studies employing moretraditional molecular techniques (18, 19). Over-all, our SAG libraries captured the majority ofpreviously described uncultivated marine lin-eages and opened the door for their genomicstudy (Fig. 1 and figs. S3 to S11).
Using PCR, we screened mesopelagic SAGsfor several key genes mediating carbon fixa-tion and chemolithotrophic energy production(table S1) and found that Deltaproteobacteriacluster SAR324, Gammaproteobacteria clustersARCTIC96BD-19 andAgg47, and someOceano-spirillales possess genes for both carbon fixationand sulfur oxidation (Fig. 2). PCR did not detectgenes central to the reductive tricarboxylic acidcycle. However, sequences (cbbL and cbbM) codingfor the large subunit of ribulose-1,5-bisphosphatecarboxylase-oxygenase (RuBisCO), a key enzymemediating the Calvin-Benson-Bassham (CBB)cycle, were recovered from 47% of SAR324 (thefirst record of RuBisCO inDeltaproteobacteria),25% of Gammaproteobacteria, and 12% of allmesopelagic bacteria SAGs. These gene frequen-cies representminimal estimates andmay be higherwithin the bacterioplankton. Several inherent lim-itations in the PCR-based SAG screening approachapplied here could lead to an underestimation ofthese frequencies, including incomplete whole-genome amplification, PCR primer mismatches,and PCR template secondary structures. For com-parison, recA-normalized abundances ofRuBisCOgenes recovered from several dark ocean (≥500m)metagenomes and a metatranscriptome at stationALOHA were 6 to 26% and 33%, respectively(table S2). Together, SAR324, ARCTIC96BD-19,Agg47, and Oceanospirillales made up 31 and34%of all bacterial SAGs from the SouthAtlanticand North Pacific mesopelagic, respectively. Thisis consistent with previous findings of high abun-dances of these lineages in the dark ocean invarious geographic regions (18, 20, 21), which
is indicative of their significance in biogeochem-ical processes.
Genomic sequencing of two ARCTIC96BD-19 and two SAR324 SAGs (tables S7 to S9) re-covered complete RuBisCO operons in all fourSAGs (tables S10 to S13). Phylogenetic anal-ysis of gene sequences and the presence of pro-tein active sites, RuBP binding sites, and RuBisCOsequence motifs confirm that these are bona fideRuBisCO genes, in contrast to RuBisCO-like sys-tems found in certain bacteria and archaea (fig.S12 and S13) (22). Nonfunctional genes are rarein oligotrophic bacterioplankton (23, 24). Thus,the presence of RuBisCO genes in the meso-pelagic is likely to be indicative of carbon fix-ation via the CBB cycle by several indigenousbacterial lineages and could account for at leastsome of the RuBisCO proteins observed belowthe photic zone (25). A closely related cDNA se-quence from 500 m at station ALOHA (26)provides evidence for RuBisCO gene expressionin situ (fig. S12).Microautoradiography linkedwithcatalyzed reporter deposition fluorescence in situhybridization (MAR-CARD-FISH) performed onprokaryotes from an oceanic station in the NorthAtlantic (fig. S1) confirmed that at least one of theRuBisCO-containing groups, SAR324, assimilatedinorganic carbon in situ (Fig. 3, A and B). TheSAR324 cells constituted 6 to 17% of all pro-karyotes, and 3 to 21% of SAR324 cells exhibiteddetectable bicarbonate assimilation throughout themeso- and bathypelagic (Fig. 3C). The bicarbonate-active SAR324 cells made up 20.4 T 13.3%(n = 5 samples) of total bicarbonate-positive 4 ,́6-diamidino-2-phenylindole–stained cells, suggesting
1Bigelow Laboratory for Ocean Sciences, 180 McKown PointRoad, Post Office Box 475, West Boothbay Harbor, ME 04575,USA. 2Monterey Bay Aquarium Research Institute, Moss Landing,CA 95064, USA. 3Department of Energy Joint Genome Institute,Walnut Creek, CA 94598, USA. 4Department of Marine Biology,University of Vienna, Faculty Center of Ecology, Althanstrasse14, A-1090 Vienna, Austria. 5Department of Biological Engi-neering and Department of Civil and Environmental Engineer-ing, Massachusetts Institute of Technology, Cambridge, MA02138, USA.
*Present address: UMR BOREA, CNRS 7208, Muséum Nationald’Histoire Naturelle, 61 Rue Buffon, 75231 Paris Cedex 5,France.†To whom correspondence should be addressed. E-mail:[email protected]
Fig. 1. Proportions of bac-terial and archaeal SAGsretrieved from surface andmesopelagic stations, iden-tified by SSU rRNA sequenceanalysis. Alphaprot., Alpha-proteobacteria; Deltaprot.,Deltaproteobacteria.
www.sciencemag.org SCIENCE VOL 333 2 SEPTEMBER 2011 1297
REPORTS
on
Sep
tem
ber
1, 2
011
ww
w.s
cien
cem
ag.o
rgD
ownl
oade
d fr
om
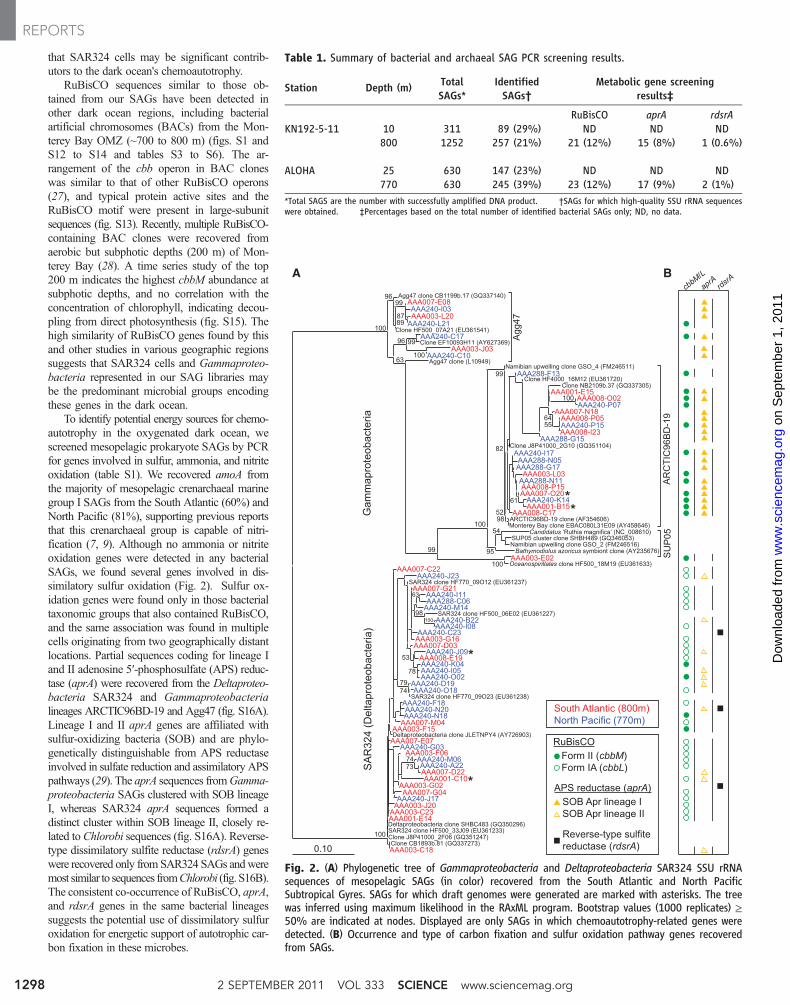
that SAR324 cells may be significant contrib-utors to the dark ocean's chemoautotrophy.
RuBisCO sequences similar to those ob-tained from our SAGs have been detected inother dark ocean regions, including bacterialartificial chromosomes (BACs) from the Mon-terey Bay OMZ (~700 to 800 m) (figs. S1 andS12 to S14 and tables S3 to S6). The ar-rangement of the cbb operon in BAC cloneswas similar to that of other RuBisCO operons(27), and typical protein active sites and theRuBisCO motif were present in large-subunitsequences (fig. S13). Recently, multiple RuBisCO-containing BAC clones were recovered fromaerobic but subphotic depths (200 m) of Mon-terey Bay (28). A time series study of the top200 m indicates the highest cbbM abundance atsubphotic depths, and no correlation with theconcentration of chlorophyll, indicating decou-pling from direct photosynthesis (fig. S15). Thehigh similarity of RuBisCO genes found by thisand other studies in various geographic regionssuggests that SAR324 cells and Gammaproteo-bacteria represented in our SAG libraries maybe the predominant microbial groups encodingthese genes in the dark ocean.
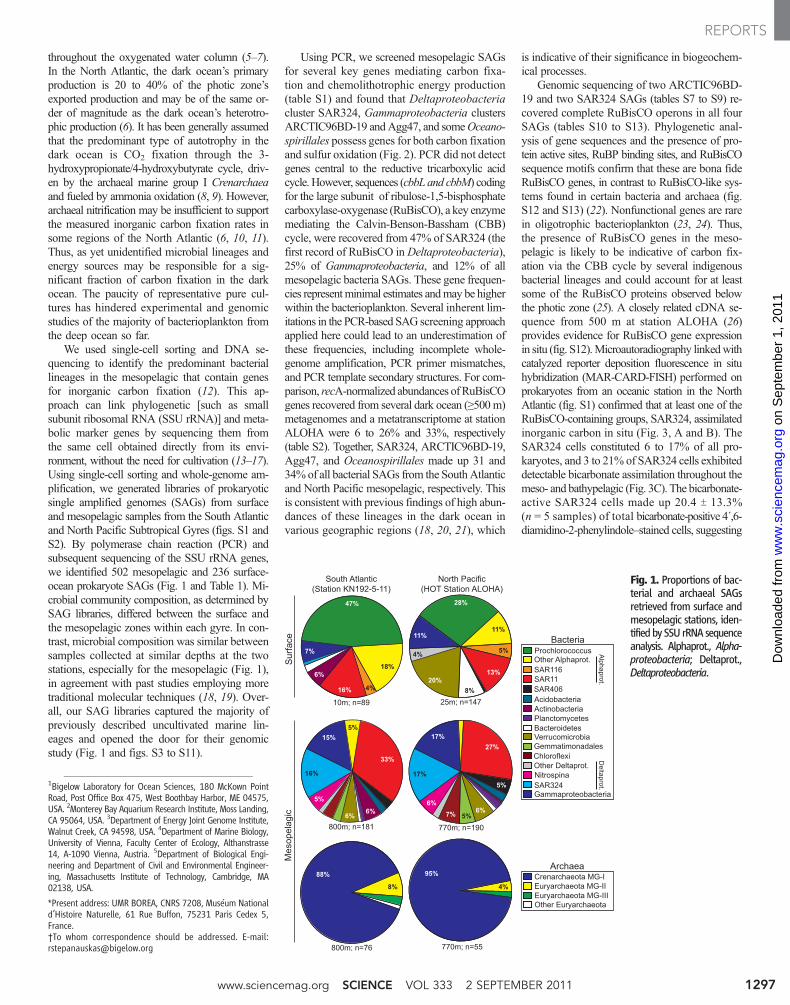
To identify potential energy sources for chemo-autotrophy in the oxygenated dark ocean, wescreened mesopelagic prokaryote SAGs by PCRfor genes involved in sulfur, ammonia, and nitriteoxidation (table S1). We recovered amoA fromthe majority of mesopelagic crenarchaeal marinegroup I SAGs from the South Atlantic (60%) andNorth Pacific (81%), supporting previous reportsthat this crenarchaeal group is capable of nitri-fication (7, 9). Although no ammonia or nitriteoxidation genes were detected in any bacterialSAGs, we found several genes involved in dis-similatory sulfur oxidation (Fig. 2). Sulfur ox-idation genes were found only in those bacterialtaxonomic groups that also contained RuBisCO,and the same association was found in multiplecells originating from two geographically distantlocations. Partial sequences coding for lineage Iand II adenosine 5′-phosphosulfate (APS) reduc-tase (aprA) were recovered from the Deltaproteo-bacteria SAR324 and Gammaproteobacterialineages ARCTIC96BD-19 and Agg47 (fig. S16A).Lineage I and II aprA genes are affiliated withsulfur-oxidizing bacteria (SOB) and are phylo-genetically distinguishable from APS reductaseinvolved in sulfate reduction and assimilatory APSpathways (29). The aprA sequences fromGamma-proteobacteria SAGs clustered with SOB lineageI, whereas SAR324 aprA sequences formed adistinct cluster within SOB lineage II, closely re-lated toChlorobi sequences (fig. S16A). Reverse-type dissimilatory sulfite reductase (rdsrA) geneswere recovered only fromSAR324 SAGs andweremost similar to sequences fromChlorobi (fig. S16B).The consistent co-occurrence of RuBisCO, aprA,and rdsrA genes in the same bacterial lineagessuggests the potential use of dissimilatory sulfuroxidation for energetic support of autotrophic car-bon fixation in these microbes.
Table 1. Summary of bacterial and archaeal SAG PCR screening results.
Station Depth (m) TotalSAGs*
IdentifiedSAGs†
Metabolic gene screeningresults‡
RuBisCO aprA rdsrAKN192-5-11 10 311 89 (29%) ND ND ND
800 1252 257 (21%) 21 (12%) 15 (8%) 1 (0.6%)
ALOHA 25 630 147 (23%) ND ND ND770 630 245 (39%) 23 (12%) 17 (9%) 2 (1%)
*Total SAGS are the number with successfully amplified DNA product. †SAGs for which high-quality SSU rRNA sequenceswere obtained. ‡Percentages based on the total number of identified bacterial SAGs only; ND, no data.
Fig. 2. (A) Phylogenetic tree of Gammaproteobacteria and Deltaproteobacteria SAR324 SSU rRNAsequences of mesopelagic SAGs (in color) recovered from the South Atlantic and North PacificSubtropical Gyres. SAGs for which draft genomes were generated are marked with asterisks. The treewas inferred using maximum likelihood in the RAxML program. Bootstrap values (1000 replicates) ≥50% are indicated at nodes. Displayed are only SAGs in which chemoautotrophy-related genes weredetected. (B) Occurrence and type of carbon fixation and sulfur oxidation pathway genes recoveredfrom SAGs.
2 SEPTEMBER 2011 VOL 333 SCIENCE www.sciencemag.org1298
REPORTS
on
Sep
tem
ber
1, 2
011
ww
w.s
cien
cem
ag.o
rgD
ownl
oade
d fr
om
Additional sulfur oxidation geneswere identifiedfromwhole-genome analysis of ARCTIC96BD-19and SAR324 SAGs, including genes supportingthiosulfate oxidation, adenosine 5′-triphosphate(ATP) sulfurylase, and sulfate permease (tables S10to S13). The SAR324 cells also contained genespotentially supporting the oxidation of carbonmon-oxide and methane and a suite of genes found inmethylotrophic pathways (table S14). Together,these data suggest a flexible and opportunisticmetabolic lifestyle of the SAR324 lineage.
Because these RuBisCO-containing bacteriallineages are found throughout the dark oxygen-ated water column (Fig. 3C and fig. S2), it is notimmediately apparent what the sources of re-duced sulfur compounds are that would be re-quired for chemolithotrophic energy production.Reduced inorganic sulfur is rare outside thevicinity of hydrothermally active or upwellingregions (2, 30). Possible other sources includeproteins, osmolytes (such as dimethylsulfonio-propionate), and particles, the hot spots of micro-bial activity that may contain anoxic microniches(5, 31, 32). Supporting the latter, we detected asuite of motility and adhesion genes in SAR324cells (table S15) and confirmed their commonassociation with particles in situ (Fig. 3A). Like-wise, Agg47 cells have also been found to bepreferentially on particles (33). Recently, an ac-tive but cryptic sulfur cycle was reported in the
OMZ waters off the coast of Chile, where sul-fide produced from sulfate reduction is immedi-ately oxidized and therefore does not accumulatein the water column (4). The ARCTIC96BD-19lineage is phylogenetically close to the SUP05cluster, which dominates many OMZ regions, sug-gesting the possibility of a similar sulfur dynamicmediated by the former lineage even in well-oxygenated waters.
All four ARTIC96BD-19 and SAR324 ge-nomes possessed multiple ATP-binding cassette(ABC) transporters for sugar transport and ac-cessory periplasmic components, as well as sev-eral amino acid and oligopeptide transporters(tableS14), often in tandem, indicating co-regulation.This suggests a likely mixotrophic lifestyle forthese RuBisCO-containing lineages.
We have demonstrated that several uncul-tured Proteobacteria lineages that are indigenousand abundant in the dark oxygenated ocean arelikely mixotrophs and have the potential for au-totrophic CO2 fixation, coupled to the oxidationof reduced sulfur compounds. Some of these darkocean bacteria may also be methylotrophs, usingreduced single-carbon compounds as energy sourcesfor growth. These previously unrecognizedmeta-bolic types of dark ocean bacteria may play animportant role in global biogeochemical cycles,and their activities may in part reconcile currentdiscrepancies in the dark ocean's carbon budget.
References and Notes1. P. A. del Giorgio, C. M. Duarte, Nature 420, 379 (2002).2. D. A. Walsh et al., Science 326, 578 (2009).3. G. T. Taylor et al., Limnol. Oceanogr. 46, 148 (2001).4. D. E. Canfield et al., Science 330, 1375 (2010).5. D. M. Karl, G. A. Knauer, J. H. Martin, B. B. Ward, Nature
309, 54 (1984).6. T. Reinthaler, H. M. van Aken, G. J. Herndl, Deep Sea Res.
Part II Top. Stud. Oceanogr. 57, 1572 (2010).7. G. J. Herndl et al., Appl. Environ. Microbiol. 71, 2303 (2005).8. I. A. Berg, D. Kockelkorn, W. Buckel, G. Fuchs, Science
318, 1782 (2007).9. C. Wuchter et al., Proc. Natl. Acad. Sci. U.S.A. 103,
12317 (2006).10. H. Agogué, M. Brink, J. Dinasquet, G. J. Herndl, Nature
456, 788 (2008).11. M. M. Varela, H. M. van Aken, E. Sintes, T. Reinthaler,
G. J. Herndl, Environ. Microbiol. 13, 1524 (2011).12. Materials and methods are available as supporting
material on Science Online.13. Y. Marcy et al., Proc. Natl. Acad. Sci. U.S.A.104, 11889 (2007).14. A. Raghunathan et al., Appl. Environ. Microbiol. 71,
3342 (2005).15. R. Stepanauskas, M. E. Sieracki, Proc. Natl. Acad.
Sci. U.S.A. 104, 9052 (2007).16. K. Zhang et al., Nat. Biotechnol. 24, 680 (2006).17. T. Woyke et al., PLoS ONE 4, e5299 (2009).18. E. F. DeLong et al., Science 311, 496 (2006).19. V. D. Pham, K. T. Konstantinidis, T. Palden, E. F. DeLong,
Environ. Microbiol. 10, 2313 (2008).20. J. Arístegui, J. M. Gasol, C. M. Duarte, G. J. Herndl,
Limnol. Oceanogr. 54, 1501 (2009).21. M. T. Suzuki et al., Microb. Ecol. 48, 473 (2004).22. T. E. Hanson, F. R. Tabita, Proc. Natl. Acad. Sci. U.S.A.
98, 4397 (2001).23. H. J. Tripp et al., Nature 464, 90 (2010).24. S. J. Giovannoni et al., Science 309, 1242 (2005).25. C. M. Turley, P. J. Mackie, Deep Sea Res. Part I Oceanogr.
Res. Pap. 42, 1453 (1995).26. Y. Shi, G. W. Tyson, E. F. DeLong, Nature 459, 266 (2009).27. N. R. Hayashi, H. Arai, T. Kodama, Y. Igarashi, Biochem.
Biophys. Res. Commun. 241, 565 (1997).28. V. I. Rich, V. D. Pham, J. Eppley, Y. Shi, E. F. DeLong,
Environ. Microbiol. 13, 116 (2011).29. B. Meyer, J. Kuever, Appl. Environ. Microbiol. 73, 7664 (2007).30. J. Radford-Knoery, C. R. German, J.-L. Charlou,
J.-P. Donval, Y. Fouquet, Limnol. Oceanogr. 46, 461 (2001).31. A. L. Shanks, M. L. Reeder,Mar. Ecol. Prog. Ser. 96, 43 (1993).32. R. Stocker, J. R. Seymour, A. Samadani, D. E. Hunt,
M. F. Polz, Proc. Natl. Acad. Sci. U.S.A. 105, 4209 (2008).33. E. F. DeLong, D. G. Franks, A. L. Alldredge, Limnol.
Oceanogr. 38, 924 (1993).Acknowledgments: This work was supported by NSF grants
EF-826924 and OCE-0821374 (R.S. and M.E.S.), a grantfrom the Maine Technology Institute (Bigelow Laboratory),U.S. Department of Energy (DOE) JGI 2010 MicrobesProgram grant CSP77 (R.S. and M.E.S.), the David andLucille Packard Foundation (C.M.P.), the Gordon andBetty Moore Foundation (E.F.D.), the Dutch ScienceFund-Earth and Life Sciences (G.J.H.), the Austrian ScienceFund-FWF and European Science Foundation EuroEEFGproject MOCA (G.J.H.), and Marie Curie project ARCADIA(G.J.H.). Work conducted by the DOE Joint GenomeInstitute is supported by the Office of Science of the DOEunder contract no. DE-AC02-05CH11231. We thank chiefscientist S. Curless, the officers and crew of the RVKa'imikai-O-Kanaloa, and the HOT team for samplecollection at station ALOHA; S. Sievert of the Woods HoleOceanographic Institute for providing PCR primerinformation; J. Heywood of Bigelow for collecting SouthAtlantic field samples; the crew of the RV Point Lobos;V. Rich for initial screening of Monterey Bay libraries; andF. Chavez, R. Michasaki, and T. Pennington for providingMonterey Bay oceanographic data. SSU rRNA and metabolicgene sequences have been deposited in GenBank with thefollowing accession numbers: SSU rRNA, HQ675122 toHQ675859; cbbL, HQ675043 to HQ675069; cbbM,HQ675070-HQ675086; aprA, HQ675087-HQ675118; andrdsrA, HQ675119 to HQ675121. Whole-genome sequence
C
% of total DAPI cells or SAR324 cells
O2 concentration (µmol kg-1)250 260 270 280 290 300
Salinity (psu)34.80 34.85 34.90 34.95 35.00
Dep
th (
m)
Temperature (°C)3 4 5 6
0 5 10 15 20 25
0
500
1000
1500
2000
2500
20 µm
B
A
SAR324 cells
3000
% SAR324 of DAPI cells
% DI14C-positive SAR324 of total SAR324 cells
Fig. 3. Micrographs demonstrating bicarbonate uptake and aggregation around particles by Delta-proteobacteria SAR324. (A) Overlay of transmitted-light and epifluorescence micrographs showingSAR324 cells labeled by CARD-FISH and silver grains indicating bicarbonate uptake by SAR324 (dark graydots). Particles are also visible (faint grayish background). (B) Single-layer transmitted light micrographfor better visibility of the silver halos detected by microautoradiography and particle aggregates. (C)Vertical profiles of the percent of SAR324 cells out of total prokaryote cells, the percent of total SAR324cells positive for dissolved inorganic 14C uptake, temperature, dissolved oxygen, and salinity in the NorthAtlantic (58.60°N, 39.71°W) during the Dutch Geotraces-1 cruise (RV Pelagia, 5 May 2010).
www.sciencemag.org SCIENCE VOL 333 2 SEPTEMBER 2011 1299
REPORTS
on
Sep
tem
ber
1, 2
011
ww
w.s
cien
cem
ag.o
rgD
ownl
oade
d fr
om
data have accession numbers AFHZ00000000 (AAA001-B15),AFIB00000000 (AAA001-C10), AFHY00000000(AAA007-O20), and AFIA00000000 (AAA240-J09). Rawsequences were deposited in the GenBank Short Read Archiveunder accession numbers SRA029592 and SRA035467(AAA001-B15), SRA029604 and SRA035394 (AAA001-C10),
SRA029593 and SRA035468 (AAA007-O20), and SRA029596and SRA035470 (AAA240-J09).
Supporting Online Materialwww.sciencemag.org/cgi/content/full/333/6047/1296/DC1Materials and Methods
Figs. S1 to S19Tables S1 to S15References
1 February 2011; accepted 13 July 201110.1126/science.1203690
Tet Proteins Can Convert5-Methylcytosine to 5-Formylcytosineand 5-CarboxylcytosineShinsuke Ito,1,2* Li Shen,1,2* Qing Dai,3 Susan C. Wu,1,2 Leonard B. Collins,4 James A. Swenberg,2,4
Chuan He,3 Yi Zhang1,2†
5-methylcytosine (5mC) in DNA plays an important role in gene expression, genomic imprinting, andsuppression of transposable elements. 5mC can be converted to 5-hydroxymethylcytosine (5hmC) bythe Tet (ten eleven translocation) proteins. Here, we show that, in addition to 5hmC, the Tet proteins cangenerate 5-formylcytosine (5fC) and 5-carboxylcytosine (5caC) from 5mC in an enzymatic activity–dependent manner. Furthermore, we reveal the presence of 5fC and 5caC in genomic DNA of mouseembryonic stem cells andmouse organs. The genomic content of 5hmC, 5fC, and 5caC can be increased orreduced through overexpression or depletion of Tet proteins. Thus, we identify two previously unknowncytosine derivatives in genomic DNA as the products of Tet proteins. Our study raises the possibilitythat DNA demethylation may occur through Tet-catalyzed oxidation followed by decarboxylation.
Although enzymes that catalyze DNAmeth-ylation process are well studied (1), howDNA demethylation is achieved is less
known, especially in animals (2, 3). A repair-based mechanism is used in DNA demethylationin plants, but whether a similar mechanism is
also used in mammalian cells is unclear (3, 4).Identification of hydroxymethylcytosine (5hmC)as the sixth base of the mammalian genome(5, 6) and the capacity of Tet (ten eleven trans-location) proteins to convert 5-methylcytosine(5mC) to 5hmC in an Fe(II) and alpha-ketoglutarate(a-KG)–dependent oxidation reaction (6, 7) raisedthe possibility that a Tet-catalyzed reaction mightbe part of the DNA demethylation process.
A potential 5mC demethylation mechanismcan be envisioned from similar chemistry forthymine-to-uracil conversion (3, 8, 9) (fig. S1A),
1Howard Hughes Medical Institute and Department of Bio-chemistry and Biophysics, University of North Carolina atChapel Hill, Chapel Hill, NC 27599–7295, USA. 2LinebergerComprehensive Cancer Center, University of North Carolina atChapel Hill, Chapel Hill, NC 27599–7295, USA. 3Departmentof Chemistry and Institute for Biophysical Dynamics, Uni-versity of Chicago, Chicago, IL 60637, USA. 4Department ofEnvironmental Sciences and Engineering, University of NorthCarolina at Chapel Hill, Chapel Hill, NC 27599–7295, USA.
*These authors contributed equally to this work.†To whom correspondence should be addressed. E-mail:[email protected]
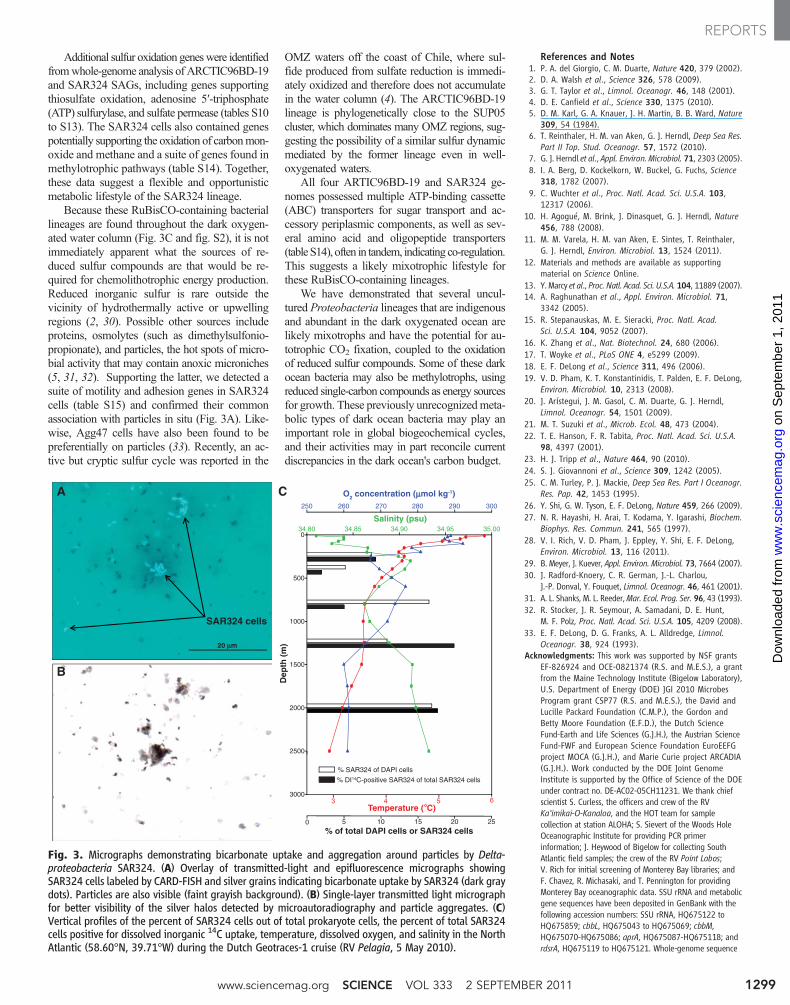
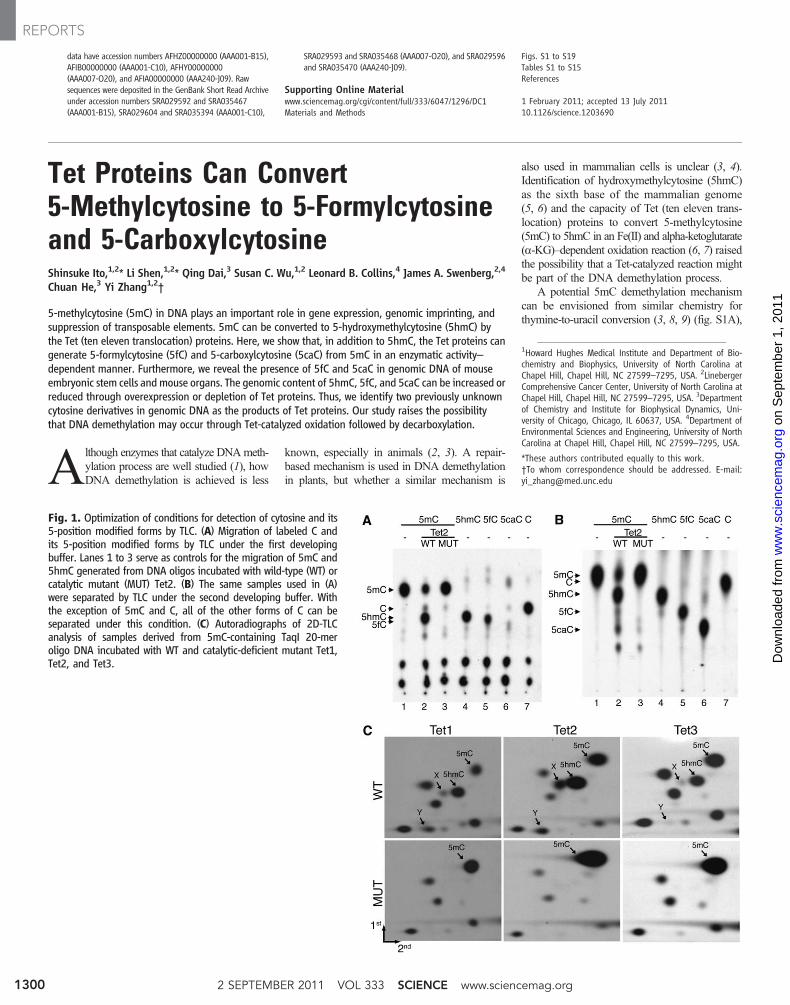
Fig. 1. Optimization of conditions for detection of cytosine and its5-position modified forms by TLC. (A) Migration of labeled C andits 5-position modified forms by TLC under the first developingbuffer. Lanes 1 to 3 serve as controls for the migration of 5mC and5hmC generated from DNA oligos incubated with wild-type (WT) orcatalytic mutant (MUT) Tet2. (B) The same samples used in (A)were separated by TLC under the second developing buffer. Withthe exception of 5mC and C, all of the other forms of C can beseparated under this condition. (C) Autoradiographs of 2D-TLCanalysis of samples derived from 5mC-containing TaqI 20-meroligo DNA incubated with WT and catalytic-deficient mutant Tet1,Tet2, and Tet3.
2 SEPTEMBER 2011 VOL 333 SCIENCE www.sciencemag.org1300
REPORTS
on
Sep
tem
ber
1, 2
011
ww
w.s
cien
cem
ag.o
rgD
ownl
oade
d fr
om
www.sciencemag.org/cgi/content/full/333/6047/1296/DC1
Supporting Online Material for
Potential for Chemolithoautotrophy Among Ubiquitous Bacteria Lineages in the Dark Ocean
Brandon K. Swan, Manuel Martinez-Garcia, Christina M. Preston, Alexander Sczyrba, Tanja Woyke, Dominique Lamy, Thomas Reinthaler, Nicole J. Poulton, E. Dashiell P.
Masland, Monica Lluesma Gomez, Michael E. Sieracki, Edward F. DeLong, Gerhard J. Herndl, Ramunas Stepanauskas*
*To whom correspondence should be addressed. E-mail: [email protected]
Published 2 September 2011, Science 333, 1296 (2011)
DOI: 10.1126/science.1203690
This PDF file includes:
Materials and Methods Figs. S1 to S19 Tables S1 to S15 References
2
Materials and Methods
Single cell sample collection and preservation
Water samples for single cell analyses were collected from surface and mesopelagic depths using Niskin bottles during cruises in the South Atlantic (27 November 2007, 10m and 800m, Cruise KN192-5 station 11, 12°2941.4S, 4°5955.2W) and North Pacific (9 September 2009, 25m and 770m; Hawaii Ocean Time-series (HOT) Cruise 215, station ALOHA; 22°45N, 158°00W) Subtropical Gyres (fig. S1). Replicate, 1 mL aliquots of water were cryopreserved with 6% glycine betaine (Sigma) and stored at 80ºC (1). Construction of single amplified genome (SAG) libraries
Prior to cell sorting, samples with prokaryote cell abundances above 5x10⁵ mL-1 were diluted 10x with filter-sterilized field samples and pre-screened through a 70 µm mesh-size cell strainer (BD). For heterotrophic prokaryote detection, diluted subsamples (1-3 mL) were incubated for 10-120 min with SYTO-9 DNA stain (5 µM; Invitrogen). Cell sorting was performed with a MoFlo™ (Beckman Coulter) flow cytometer using a 488 nm argon laser for excitation, a 70 µm nozzle orifice and a CyClone™ robotic arm for droplet deposition into microplates. The cytometer was triggered on side scatter. The “single 1 drop” mode was used for maximal sort purity. Prokaryote cells were separated from eukaryotes, viruses, and detritus based on SYTO-9 fluorescence (proxy to nucleic acid content) and light side scatter (proxy to particle size) (2). Synechococcus cells were excluded, based on their autofluorescence signal. Target cells were deposited into 384-well plates containing 600 nL per well of either a) 1x TE buffer or b) prepGEM™ Bacteria (Zygem) reaction mix and stored at 80ºC until further processing. Of the 384 wells, 315 were dedicated for single cells, 66 were used as negative controls (no droplet deposited) and 3 received 10 cells each (positive controls).
The accuracy of droplet deposition was determined by depositing 10 um fluorescent
beads into 384-well plates and the results checked by microscopically verifying the presence of beads in the plate wells. Of the 2-3 plates examined each sort day, with one bead deposited per well, fewer than 2% of wells were found to contain no bead and 0.4% to contain more than one bead. The latter is most likely caused by co-deposition of two beads attached to each other, which at certain orientation may have similar optical properties to single beads.
Cells that were sorted into TE buffer were lysed and their DNA was denatured using
cold KOH (all SAGs except those with names starting AAA001) (3). Cells that were sorted into the prepGEM™ Bacteria reaction mix were first lysed following Zygem instructions and then exposed to KOH treatment as above (SAG names starting AAA001). Relatively minor differences were found in the phylogenetic compositions obtained from each cell lysis method (fig. S17). Genomic DNA from the lysed cells was amplified using multiple displacement amplification (MDA) (3, 4) in 10 µL final volume. The MDA reactions contained 2 U/µL Repliphi polymerase (Epicentre), 1x reaction buffer (Epicentre), 0.4 mM each dNTP (Epicentre), 2 mM DTT (Epicentre), 50 mM
3
phosphorylated random hexamers (IDT) and 1 µM SYTO-9 (Invitrogen) (all final concentration). The MDA reactions were run at 30°C for 12-16 h, then inactivated by a 15 min incubation at 65°C. Amplified genomic DNA was stored at -80°C until further processing. We refer to the MDA products originating from individual cells as single amplified genomes (SAGs).
To obtain sufficient quantity of genomic DNA for shotgun sequencing of selected
SAGs, the original MDA products of SAR324 cluster bacteria SCGC AAA001-C10 and SCGC AAA240-J09, as well as Gammaproteobacteria SCGC AAA001-B15 and SCGC AAA007-O20 were re-amplified using similar MDA conditions as above: eight replicate 125 µL reactions were performed and then pooled together, resulting in ~100 µg of genomic dsDNA for each SAG.
Prior to cell sorting, the instrument and the workspace were decontaminated for DNA
as previously described (5). High molecular weight DNA contaminants were removed from all MDA reagents by a UV treatment in Stratalinker (Stratagene). During UV treatment, reagents were placed on ice to avoid overheating. An empirical optimization of the UV exposure was performed to remove all detectable contaminants without inactivating the reaction. Cell sorting and MDA setup were performed in a HEPA-filtered environment. As a quality control, the kinetics of all MDA reactions was monitored by measuring the SYTO-9 fluorescence using either LightCycler 480 (Roche) or FLUOstar Omega (BMG). The critical point (Cp) was determined for each MDA reaction as the time required to produce half of the maximal fluorescence (fig. S18). The Cp is inversely correlated to the amount of DNA template (6). The MDA kinetics was monitored for all SAG microplates, except those with names starting AAA003 and AAA015. The Cp values were significantly lower in 1-cell wells compared to 0-cell wells in all microplates for which MDA kinetics was monitored (p<0.001; Wilcoxon Two Sample Test). PCR screening of SAG libraries
MDA products were diluted 50-fold in TE buffer and 500 nL aliquots of diluted MDA product served as the template DNA in 5 µL final volume real-time PCR screens. All PCR reactions were performed using LightCycler 480 SYBR Green I Master Mix (Roche) and the Roche LightCycler® 480 II real-time thermal cycler. PCR amplification of SSU rRNA and metabolic genes from SAGs was done using primers and conditions listed in table S1. Forward (5´GTAAAACGACGGCCAGT3´) and reverse (5´CAGGAAACAGCTATGACC3´) M13 sequencing primers were added to the 5´ ends of each target primer pair to aid direct sequencing of PCR products. All PCR reactions were run for 40 cycles at the appropriate annealing temperature, followed by melting curve analysis performed as follows: 95°C for 5 s, 52°C for 1 min, and a continuous temperature ramp (0.11°C/s) from 52 to 97°C. Real-time PCR kinetics and amplicon melting curves served as proxies for detecting SAGs positive for target genes. New, 20 µL PCR reactions were set up for all PCR-positive SAGs and amplicons were sequenced from both ends using Sanger technology by Beckman Coulter Genomics.
4
Single cell sorting, whole genome amplification, real-time PCR screens and PCR product sequence analyses were performed at the Bigelow Laboratory Single Cell Genomics Center (www.bigelow.org/scgc). Phylogenetic analysis of SAG SSU rRNA and metabolic genes
SSU rRNA and metabolic gene sequences were trimmed and edited using Sequencher v4.7 (Gene Codes). Edited sequences were compared to previously deposited sequences using the RDP v10 Classifier (SSU rRNA) (7) and NCBI BLAST (SSU rRNA and metabolic genes) (8) online tools. SAG SSU rRNA nucleotide and metabolic gene protein sequences were aligned with selected database sequences using MUSCLE v3.8 (9). In order to reduce the number of misplaced gaps within metabolic gene sequence alignments, nucleotide sequences were translated to protein sequences and aligned, then backtranslated to produce nucleotide alignments using the RevTrans 1.4 server (10). Maximum likelihood trees (1,000 bootstrap replicates) of SSU rRNA and metabolic gene nucleotide sequences were generated using RAxML v7.2.6 (11). Relative gene abundances in dark ocean metagenomes and a metatranscriptome
DNA sequences from several metagenomes from HOT station ALOHA, as well as cDNA sequences from a small metatranscriptome (12; NCBI Sequence Read Archive accession number SRX002160), were used to create custom databases for BLASTX similarity searches to several metabolic genes identified in mesopelagic SAGs, as well as recA for estimating relative gene abundances. The stand-alone BLAST 2.2.22+ executable package (ftp://ftp.ncbi.nlm.nih.gov/blast/) was used to compare metagenomic sequences to RuBisCO (cbbL and cbbM), APS reductase (aprA) and reverse-type dissimilatory sulfite reductase (rdsrA) sequences recovered from mesopelagic SAGs and databases (table S2), and bacterial recA query sequences employed by Sharma et al. (13), using an expect (E) value cut-off of 1 x 10⁻⁵. Relative gene abundances in each library were estimated by dividing the sum of all significant BLASTX hits by the sum of all recA hits (13; table S2). Screening of environmental DNA for RuBisCO in Monterey Bay stations
BAC libraries were screened for RuBisCO genes as previously described (14). A 400 base pair region of form II RuBisCO was amplified using primer pair, cbbMF (5´ATCATCAARCCSAARCTSGGCCTGCGTCCC3´, 15) and cbbMRb (5´AGAAGTTACTGCACCATGGCCAGCTCTATG3´). PCR reactions contained 0.5 U AmpliTAQ Gold DNA polymerase (Applied Biosystems), 1X buffer, and 0.5 mM of each primer, 0.25 mM dNTPs, 3mM MgCl2 and 2-100 ng DNA template. Amplification conditions were: 95°C for 10 min, followed by 30 cycles of 95°C for 30 min, 45°C for 1 min, 72°C for 2 min, and a final extension at 72°C for 5 min. Amplification products were analyzed by gel electrophoresis using a modified TAE buffer (40mM Tris-Acetate pH 8.0, 0.1 mM EDTA). Products corresponding to the correct size were excised, purified using Ultrafree-DA columns (Millipore) and sequenced directly using BigDye
5
chemistry on an ABI3100. BACs identified with RuBisCO sequences were selected for full sequencing (TIGR).
In addition, environmental DNA from water samples collected from Monterey Bay
Line 67 (stations 67-90, 67-80, 67-70 and 67-60) in March 1998 and Station M2 in December 1998 were also screened for form II RuBisCO. RuBisCO genes were amplified as described above, cloned into PCR 2.1 (Invitrogen), and then sequenced. Distribution and abundance of RuBisCO (cbbM) in Monterey Bay
A SYBR based qPCR assay was developed to amplify a 200 base pair region for the two cbbM genes detected in Monterey Bay (fig. S12, green) and used to screen DNA from bacterioplankton samples from station M1. Reactions contained 1X SYBR Green Buffer 200 µM dATP, dCTP, and dGTP, 400 µM dUTP, primer concentrations as empirically determined, AmpErase, AmpliTAQ Gold (Life Technologies) and 2.5µl of DNA template. Total reaction volume was 25 µl. Reaction conditions were as follows 50° C for 2 min, 95°C for 10 min, then 40 cycles of 95°C for 15 s and at either 59°C (plank1 primer pair: plank1cbbM65f, 5´CACAAGGAAATCAAGTATATGCAAG3´; Plank1cbbM269r, 5´TCAACTAGKAAGGCAACATGGTG3´) or 57°C (plank2 primer pair: plank2cbbM68f, 5´AAGGTAATCAAATTTGGGGTCC3´; Plank2cbbM270r, 5´ATCAACAAGAAATGCAATGTTTTC3´) for 60 s. After qPCR, the melting curve of the products was determined. The specificity of each primer pair was tested against recovered cbbM genes from bacterioplankton samples and cbbM-containing BAC inserts from Monterey Bay. Optimal conditions and copies per L seawater were determined according to the conditions in Suzuki et al. (16, 17).
All bacterioplankton samples from Monterey Bay station M1 were collected from a CTD rosette. Fifty to 100 ml of seawater was filtered onto a 13 mm 0.2 Supor filter (Pal Gelman) after prefiltration through a glass fiber filter (GFA; Whatman). Filters were then placed in 130 µl Qiagen lysis buffer without lysozyme and stored at –20°C until extraction. DNA extractions were performed as previously described (18) except lysozyme was added to the filters at the time of extraction. SAG whole genome sequencing, assembly and annotation
A combination of Illumina and 454 shotgun sequencing was performed on the single cell re-MDA products for SAR324 cluster bacteria SCGC AAA001-C10 and SCGC AAA240-J09, as well as Gammaproteobacteria SCGC AAA001-B15 and SCGC AAA007-O20. For Illumina sequencing, normalized 0.3 Kbp shotgun libraries were constructed for each SAG. Briefly, 3 g MDA product was sheared in 100 l using the Covaris E210 with the setting of 10% duty cycle, intensity 5, and 200 cycle per burst for 3 min per sample and the fragmented DNA was purified using QIAquick columns (Qiagen) according to the manufacturer's instructions. The sheared DNA was end-repaired and A-tailed according to the Illumina standard PE protocol and purified using the MinElute PCR Purification Kit (Qiagen) with a final elution in 12 l of Buffer EB. After quantification using a Bioanalyzer DNA 1000 chip (Agilent), the fragments were
6
ligated to the Illumina adaptors according to the Illumina standard PE protocol, followed by a purification step of the ligation product using AMPure SPRI beads. The Illumina libraries were quantified using a Bioanalyzer DNA High Sensitivity chip (Agilent) and 300 ng of DNA (in 6 l) then underwent normalization using the Duplex-Specific Nuclease (DSN) Kit (Axxora) (19). For normalization, the dsDNA was denatured for 3 min at 98°C, following a hybridization step at 68°C for 5h and DSN treatment at 68°C for 20 min. The normalized libraries were amplified by PCR for 12 cycles, gel-purified and QC assessed on a Bioanalyzer DNA High Sensitivity chip (Agilent), and then sequenced using an Illumina GAIIx sequencer. For 454 pyrosequencing, a 4Kbp paired-end library was constructed and sequenced for each SAG. All general aspects of and detailed protocols for library construction and sequencing can be found at the JGI website (http://www.jgi.doe.gov/). Sequencing yields generated for the two different sequencing platforms are shown in table S7.
The MDA amplification introduces a tremendous bias in the sequencing coverage of
the genome. Therefore, all raw Illumina sequence data was passed through a filtering program developed at JGI, which filters out known Illumina sequencing and library preparation artifacts. Specifically, all reads containing sequencing adapters, low complexity reads, and reads containing short tandem repeats were removed. Duplicated read pairs derived from PCR amplification during library preparation were identified and consolidated into a single consensus read pair. The artifact-filtered sequence data was screened and trimmed according to the k-mers present in the dataset. High-depth k-mers, presumably derived from MDA amplification bias, cause problems in the assembly, especially if the k-mer depth varies in orders of magnitude for different regions of the genome. We removed reads representing high-abundance k-mers (>64x k-mer depth) and trimmed reads that contain unique k-mers. The results of the k-mer based coverage normalization are shown in table S8.
For each of the SAGs the following steps were performed for assembly: (1)
normalized Illumina reads were assembled using Velvet version 1.1.02 (20). The VelvetOptimiser script (version 2.1.7) was used with default optimization functions (n50 for k-mer choice, total number of base pairs in large contigs for cov_cutoff optimization). (2) Next, Illumina contigs larger than 800 bp were shredded into 1 Kbp pieces with 200 bp overlaps. (3) Illumina shreds and raw 454 pyrosequence reads were then assembled using the 454 Newbler assembler version 2.4 (Roche). (4) The 454 contigs were subject to another round of assembly, using Sequencher software version 4.10.1 (Gene Codes). Ambiguities were trimmed off the ends and contigs overlapping by at least 100 bp and 98% sequence identity were merged into larger contigs. Assembly statistics for each step are shown in table S9.
The gene modeling program Prodigal (http://prodigal.ornl.gov/) was run on the draft
single cell genomes, using default settings that permit overlapping genes and using ATG, GTG, and TTG as potential starts. The resulting protein translations were compared to GenBank's non-redundant database (NR), the Swiss-Prot/TrEMBL, Pfam, TIGRFam, Interpro, KEGG, and COGs databases using BLASTP or HMMER. From these results, product assignments were made. Initial criteria for automated functional assignment set
7
priority based on TIGRFam, Pfam, COG, Intepro profiles, pairwise BLAST versus Swiss-Prot/TrEMBL, and KO groups. The annotation was imported into The Joint Genome Institute Integrated Microbial Genomes (IMG; http://img.jgi.doe.gov/cgi-bin/pub/main.cgi) (21). In addition to IMG, annotations of draft SAG assemblies were done using fgenesb (Softberry) and RAST server (22) pipelines. Gene sequences within assembled and non-assembled (454 paired-end reads) whole genome reads were also identified with the stand-alone BLAST 2.2.22+ executable package (ftp://ftp.ncbi.nlm.nih.gov/blast/), using an expect (E) value cut-off of 1 x 10⁻⁵. SAG genes of interest identified by annotation pipelines and stand-alone blast searches were checked manually using PSI-Blast (8), and the phylogenetic identities of closest hits were determined. SAG whole genome sequence quality control
Each raw sequence data set was screened against all finished bacterial and archaeal
genome sequences (downloaded from NCBI) and the human genome to identify potential contamination in the sample. Reads were mapped against reference genomes with bwa version 0.5.9 (23) using default parameters (96% identity threshold). None of the libraries showed significant contamination. Additionally, gene sequences of the final assemblies (see below) were compared against the GenBank nr database by blastx and taxonomically classified using MEGAN (24).
To further verify the absence of contaminating sequences in the assemblies, tetramer
frequencies were extracted from all scaffolds using two alternative settings: 1) sliding window of 1000 bp and 100 bp step size and 2) sliding window of 5000 bp and 500 bp step size. Reverse-complementary tetramers were combined and the frequencies represented as a N×136 feature matrix, where N is the number of windows and each column of the matrix corresponds to the frequency of one of the 136 possible tetramers. Principal Component Analysis (PCA) was then used to extract the most important components of this high dimensional feature matrix. The analysis produced unimodal distribution along the first four PCs for all four SAGs, suggesting homogenous DNA sources (fig S19). Scaffolds representing extremes on the first four PCs were identified and manually examined for their closest tblastx hits against NCBI nt database. The obtained closest hits were either representatives of marine deltaproteobacteria (for AAA001-C10 and AAA240-J09), marine gammaproteobacteria (for AAA007-O20 and AAA001-B15), or unidentified environmental sequences, thus providing further evidence of no contamination in the assemblies.
To estimate the completeness of each assembled genome, we analyzed all finished
genome sequences of the two taxonomic classes Delta- (n=40) and Gamma-Proteobacteria (n=283) available from the IMG database (21). A set of conserved single copy genes (gene set that occur only once in each of the genomes that contributed to class) were defined for each group. For the class of Deltaproteobacteria, a set of 80 conserved single copy genes were identified, and the genomes of the Gammaproteobacteria class had 10 conserved single copy genes. The ratio of conserved
8
single copy genes that were observed for each assembly and for the corresponding pan-genome was used as a measure of genome recovery (table S7).
Microautoradiography linked with catalyzed reporter deposition fluorescence in situ hybridization (MAR-CARD-FISH) with 14C-bicarbonate
Water samples were collected at one station in the North Atlantic (58.60°N,
39.71°W) at 250m, 400m, 800m, 1250m and 2000m depths during the Dutch Geotraces-1 cruise on board of R/V Pelagia in 5 May 2010. Water samples of 20-40 ml were spiked with 14C- bicarbonate (100 µCi; SA, 54.0 mCi mmol-1; Amersham) and incubated in the dark at in situ temperature for 72 h. To the controls, 2% paraformaldehyde (final concentration) was added 15 min prior to radiotracer addition. Incubations were terminated with paraformaldehyde (2% final concentration) and subsequently, the samples were kept at 4ºC in the dark for 12-18 h. Thereafter, the samples were filtered onto a 0.2-µm polycarbonate filter (Millipore, GTTP, 25 mm filter diameter) supported by a cellulose nitrate filter (Millipore, HAWP, 0.45 µm), rinsed twice with Milli-Q, dried and stored in a microfuge vial at –20ºC until further processing in the home laboratory. The CARD-FISH protocol was carried out as described in detail in Varela et al. (25) using the SAR324-1412 probe at 35% formamide concentration and a hybridization temperature of 46°C (26). Autoradiographic development was conducted by transferring previously hybridized filter sections onto slides coated with photographic emulsion (type NTB-2 melted at 43ºC for 1h). The slides were then placed in a light-tight box containing a drying agent and incubated for exposure at 4ºC for 7 d. Finally, the slides were developed and fixed following Kodak´s specifications [in Dektol developer for 2 min (1:1 dilution with Milli-Q water), in Milli-Q water for 10 s, in fixer for 5 min and in Milli-Q water for 2 min]. Before completely dried, filter sections were removed and cells were counterstained with a DAPI-mix and examined under a Zeiss Axioplan-2 epifluorescence microscope. The presence of silver grains surrounding the cells was checked in the transmission mode of the microscope. In each microscope field, we enumerated the DIC-positive cells of total prokaryotes and SAR324. Cells were classified DIC-positive if at least three silver grains were associated with an individual cell. Between 20 and 50 DIC-positive cells were counted per sample. In the killed controls, <1% of cells were associated with silver grains. Supplementary References
1. D. Cleland, P. Krader, C. McCree, J. Tang, D. Emerson, Glycine betaine as a cryoprotectant for prokaryotes. J. Microbiol. Methods 58, 31–38 (2004).
2. P. A. del Giorgio, D. F. Bird, Y. T. Prairie, D. Planas, Flow cytometric determination of bacterial the green nucleic acid stain SYTO 13. Limnol. Oceanogr. 41, 783–789 (1996).
3. A. Raghunathan, H. R. Ferguson, Jr., C. J. Bornarth, W. Song, M. Driscoll et al., Genomic DNA amplification from a single bacterium. Appl. Environ. Microbiol. 71, 3342–3347 (2005).
9
4. F. B. Dean, S. Hosono, L. Fang, X. Wu, A. F. Faruqi et al., Comprehensive human genome amplification using multiple displacement amplification. Proc. Natl. Acad. Sci. USA 99, 5261–5266 (2002).
5. R. Stepanauskas, M. E. Sieracki, Matching phylogeny and metabolism in the uncultured marine bacteria, one cell at a time. Proc. Natl. Acad. Sci. USA 104, 9052–9057 (2007).
6. K. Zhang, A. C. Martiny, N. B. Reppas, K. W. Barry, J. Malek et al., Sequencing genomes from single cells by polymerase cloning. Nat. Biotechnol. 24, 680–686 (2006).
7. J. R. Cole, Q. Wang, E. Cardenas, J. Fish, B. Chai et al., The Ribosomal Database Project: improved alignments and new tools for rRNA analysis. Nucleic Acids Res. 37, D141–D145 (2009).
8. S. Altschul, T. Madden, A. Schaffer, J. Zhang, Z. Zhang et al., Gapped BLAST and PSI-BLAST: a new generation of protein database search programs. Nucleic Acids Res. 25, 3389–3402 (1997).
9. R. C. Edgar, MUSCLE: multiple sequence alignment with high accuracy and high throughput. Nucleic Acids Res. 32, 1792–1797 (2004).
10. R. Wernersson, A. G. Pedersen, RevTrans: multiple alignment of coding DNA from aligned amino acid sequences. Nucleic Acids Res. 31, 3537–3539 (2003).
11. A. Stamatakis, RAxML-VI-HPC: maximum likelihood-based phylogenetic analyses with thousands of taxa and mixed models. Bioinformatics 22, 2688–2690 (2006).
12. Y. Shi, G. W. Tyson, E. F. DeLong, Metatranscriptomics reveals unique microbial small RNAs in the ocean's water column. Nature 459, 266–269 (2009).
13. A. K. Sharma, O. Zhaxybayeva, R. T. Papke, W. F. Doolittle, Actinorhodopsins: proteorhodopsin-like gene sequences found predominantly in non-marine environments. Environ. Microbiol. 10, 1039–1056 (2008).
14. M. T. Suzuki, C. M. Preston, O. Béjà, J. R. de la Torre, G. F. Steward et al., Phylogenetic screening of ribosomal RNA gene-containing clones in bacterial artificial chromosome (BAC) libraries from different depths in Monterey Bay. Microb. Ecol. 48, 473–488 (2004).
15. H. Elsaied, T. Naganuma, Phylogenetic diversity of ribulose-1,5-bisphosphate carboxylase/oxygenase large-subunit genes from deep-sea microorganisms. Appl. Environ. Microbiol. 67, 1751–1765 (2001).
16. M. T. Suzuki, L. T. Taylor, E. F. DeLong, Quantitative analysis of small-subunit rRNA genes in mixed microbial populations via 5'-nuclease assays. Appl. Environ. Microbiol. 66, 4605–4614 (2000).
17. M. T. Suzuki, C. M. Preston, F. P. Chavez, E. F. DeLong, Quantitative mapping of bacterioplankton populations in seawater: field tests across an upwelling plume in Monterey Bay. Aquat. Microb. Ecol. 24, 117–127 (2001).
18. M. T. Suzuki, O. Béjà, L. T. Taylor, E. F. DeLong, Phylogenetic analysis of ribosomal RNA operons from uncultivated coastal marine bacterioplankton. Environ. Microbiol. 3, 323–331 (2001).
19. E. Bogdanova, I. Shagina, E. Mudrik, I. Ivanov, P. Amon et al., DSN depletion is a simple method to remove selected transcripts from cDNA populations. Mol. Biotechnol. 41, 247–253 (2009).
10
20. D. R. Zerbino, E. Birney, Velvet: algorithms for de novo short read assembly using de Bruijn graphs. Genome Res. 18, 821–829 (2008).
21. V. M. Markowitz, I.-M. A. Chen, K. Palaniappan, K. Chu, E. Szeto et al., The integrated microbial genomes system: an expanding comparative analysis resource. Nucleic Acids Res. 38, D382–D390 (2010).
22. R. Aziz, D. Bartels, A. Best, M. DeJongh, T. Disz et al., The RAST Server: Rapid Annotations using Subsystems Technology. BMC Genomics 9, 75 (2008).
23. H. Li, R. Durbin, Fast and accurate short read alignment with Burrows–Wheeler transform. Bioinformatics 25, 1754–1760 (2009).
24. D. H. Huson, A. F. Auch, J. Qi, S. C. Schuster, MEGAN analysis of metagenomic data. Genome Res. 17, 377–386 (2007).
25. M. M. Varela, H. M. van Aken, E. Sintes, T. Reinthaler, G. J. Herndl, Contribution of Crenarchaeota and Bacteria to autotrophy in the North Atlantic interior. Environ. Microbiol. 13, 1524–1533 (2011).
26. M. Schattenhofer, B. M. Fuchs, R. Amann, M. V. Zubkov, G. A. Tarran et al., Latitudinal distribution of prokaryotic picoplankton populations in the Atlantic Ocean. Environ. Microbiol. 11, 2078–2093 (2009).
27. T. E. Hanson, F. R. Tabita, A ribulose-1,5-bisphosphate carboxylase/oxygenase (RubisCO)-like protein from Chlorobium tepidum that is involved with sulfur metabolism and the response to oxidative stress. Proc. Natl. Acad. Sci. USA 98, 4397–4402 (2001).
28. N. R. Hayashi, H. Arai, T. Kodama, Y. Igarashi, The novel genes, cbbQ and cbbO, located downstream from the RubisCO genes of Pseudomonas hydrogenothermophila, affect the conformational states and activity of RubisCO. Biochem. Biophys. Res. Commun. 241, 565–569 (1997).
29. H. R. Beller, P. S. G. Chain, T. E. Letain, A. Chakicherla, F. W. Larimer et al., The genome sequence of the obligately chemolithoautotrophic, facultatively anaerobic bacterium Thiobacillus denitrificans. J. Bacteriol. 188, 1473–1488 (2006).
30. B. Kusian, B. Bowien, Organization and regulation of cbb CO2 assimilation genes in autotrophic bacteria. FEMS Microbiol. Rev. 21, 135–155 (1997).
31. K. A. Page, S. A. Connon, S. J. Giovannoni, Representative freshwater bacterioplankton isolated from Crater Lake, Oregon. Appl. Environ. Microbiol. 70, 6542–6550 (2004).
32. D. J. Lane, in Nucleic acid techniques in bacterial systematics, E. Stackebrandt, M. Goodfellow, Eds. (John Wiley & Sons, Chichester, UK, 1991), pp. 115–175.
33. L. Ovreas, L. Forney, F. Daae, V. Torsvik, Distribution of bacterioplankton in meromictic Lake Saelenvannet, as determined by denaturing gradient gel electrophoresis of PCR-amplified gene fragments coding for 16S rRNA. Appl. Environ. Microbiol. 63, 3367–3373 (1997).
34. A. Teske, K. B. Sørensen, Uncultured archaea in deep marine subsurface sediments: have we caught them all? The ISME Journal 2, 3–18 (2008).
35. E. F. DeLong, Archaea in coastal marine environments. Proc. Natl. Acad. Sci. USA 89, 5685–5689 (1992).
36. S. Gantner, A. F. Andersson, L. Alonso-Sáez, S. Bertilsson, Novel primers for 16S rRNA-based archaeal community analyses in environmental samples. J. Microbiol. Methods 84, 12–18 (2010).
11
37. B. J. Campbell, S. C. Cary, Abundance of reverse tricarboxylic acid cycle genes in free-living microorganisms at deep-sea hydrothermal vents. Appl. Environ. Microbiol. 70, 6282–6289 (2004).
38. M. Hügler, C. O. Wirsen, G. Fuchs, C. D. Taylor, S. M. Sievert, Evidence for autotrophic CO2 fixation via the reductive tricarboxylic acid cycle by members of the subdivision of Proteobacteria. J. Bacteriol. 187, 3020–3027 (2005).
39. B. J. Campbell, J. L. Stein, S. C. Cary, Evidence of chemolithoautotrophy in the bacterial community associated with Alvinella pompejana, a hydrothermal vent polychaete. Appl. Environ. Microbiol. 69, 5070–5078 (2003).
40. G. M. King, Molecular and culture-based analyses of aerobic carbon monoxide oxidizer diversity. Appl. Environ. Microbiol. 69, 7257–7265 (2003).
41. K. E. Dunfield, G. M. King, Molecular analysis of carbon monoxide-oxidizing Bacteria associated with recent Hawaiian volcanic deposits. Appl. Environ. Microbiol. 70, 4242–4248 (2004).
42. B. Meyer, J. Kuever, Phylogeny of the alpha and beta subunits of the dissimilatory adenosine-5'-phosphosulfate (APS) reductase from sulfate-reducing prokaryotes - origin and evolution of the dissimilatory sulfate-reduction pathway. Microbiology 153, 2026–2044 (2007).
43. R. Petri, L. Podgorsek, J. F. Imhoff, Phylogeny and distribution of the soxB gene among thiosulfate-oxidizing bacteria. FEMS Microbiol. Lett. 197, 171–178 (2001).
44. B. Meyer, J. F. Imhoff, J. Kuever, Molecular analysis of the distribution and phylogeny of the soxB gene among sulfur-oxidizing bacteria – evolution of the Sox sulfur oxidation enzyme system. Environ. Microbiol. 9, 2957–2977 (2007).
45. G. Lavik, T. Stuhrmann, V. Bruchert, A. Van der Plas, V. Mohrholz et al., Detoxification of sulphidic African shelf waters by blooming chemolithotrophs. Nature 457, 581–584 (2009).
46. M. Klein, M. Friedrich, A. J. Roger, P. Hugenholtz, S. Fishbain et al., Multiple lateral transfers of dissimilatory sulfite reductase genes between major lineages of sulfate-reducing prokaryotes. J. Bacteriol. 183, 6028–6035 (2001).
47. J. R. Stephen, Y.-J. Chang, S. J. Macnaughton, G. A. Kowalchuk, K. T. Leung et al., Effect of toxic metals on indigenous soil beta -subgroup proteobacterium ammonia oxidizer community structure and protection against toxicity by inoculated metal-resistant bacteria. Appl. Environ. Microbiol. 65, 95–101 (1999).
48. A. Untergasser, H. Nijveen, X. Rao, T. Bisseling, R. Geurts et al., Primer3Plus, an enhanced web interface to Primer3. Nucleic Acids Res. 35, W71–W74 (2007).
49. E. F. DeLong, C. M. Preston, T. Mincer, V. Rich, S. J. Hallam et al., Community genomics among stratified microbial assemblages in the ocean's interior. Science 311, 496–503 (2006).
50. K. T. Konstantinidis, J. Braff, D. M. Karl, E. F. DeLong, Comparative metagenomic analysis of a microbial community residing at a depth of 4,000 meters at Station ALOHA in the North Pacific Subtropical Gyre. Appl. Environ. Microbiol. 75, 5345–5355 (2009).
12
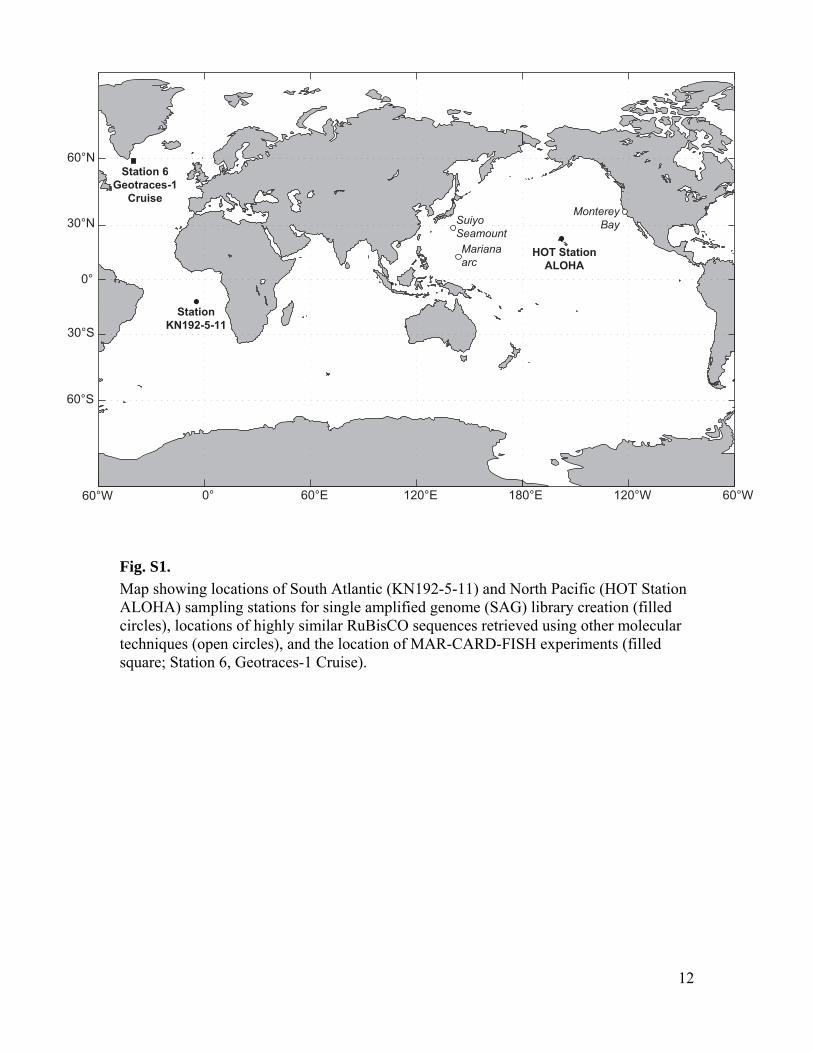
Fig. S1.
Map showing locations of South Atlantic (KN192-5-11) and North Pacific (HOT Station ALOHA) sampling stations for single amplified genome (SAG) library creation (filled circles), locations of highly similar RuBisCO sequences retrieved using other molecular techniques (open circles), and the location of MAR-CARD-FISH experiments (filled square; Station 6, Geotraces-1 Cruise).
30°N
60°N
30°S
0°
StationKN192-5-11
SuiyoSeamountMarianaarc
HOT StationALOHA
MontereyBay
60°S
60°W 0° 60°E 120°E 180°E 120°W 60°W
Station 6Geotraces-1
Cruise
13
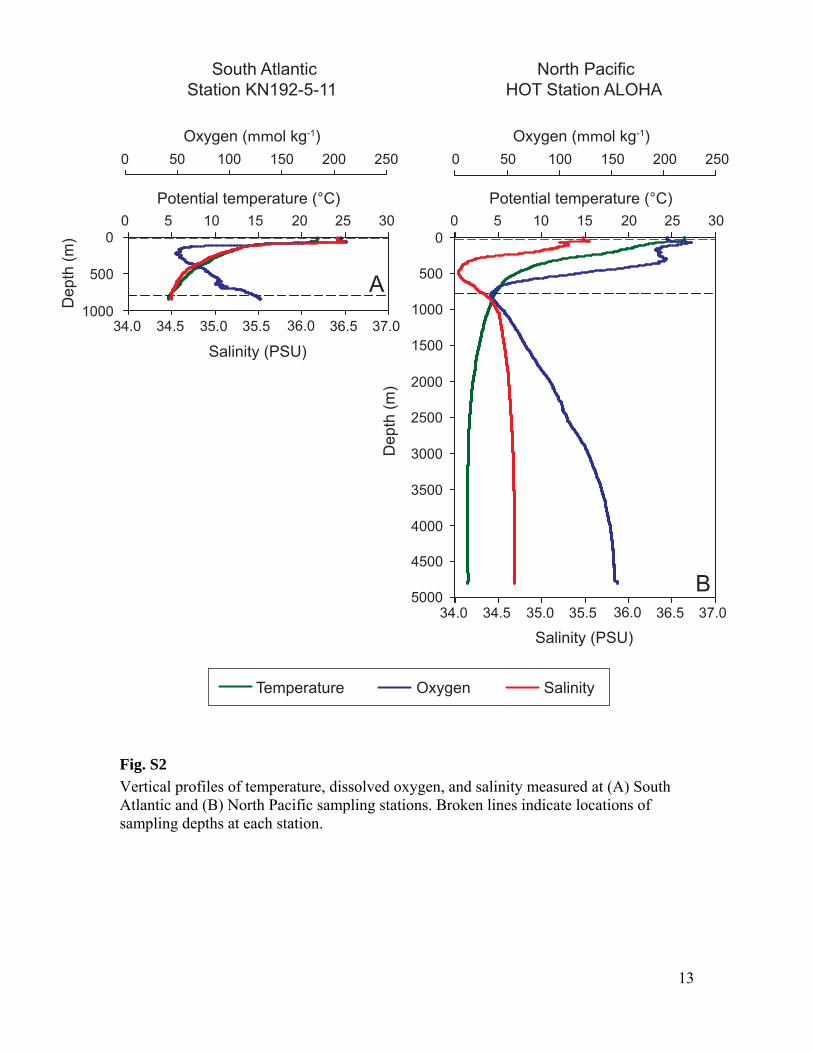
Fig. S2
Vertical profiles of temperature, dissolved oxygen, and salinity measured at (A) South Atlantic and (B) North Pacific sampling stations. Broken lines indicate locations of sampling depths at each station.
1000
500
34.0 34.5 35.0 35.5 36.0 36.5 37.0
00 5 10 15 20 25 30
0 50 100 150 200 250
0
500
1000
1500
2000
2500
3000
3500
4000
4500
5000
0 5 10 15 20 25 30
0 50 100 150 200 250
34.0 34.5 35.0 35.5 36.0 36.5 37.0
Dep
th (m
)
Salinity (PSU)
Salinity (PSU)
Potential temperature (°C) Potential temperature (°C)
Oxygen (mmol kg-1)Oxygen (mmol kg-1)
Temperature Oxygen Salinity
South AtlanticStation KN192-5-11
North PacificHOT Station ALOHA
B
Dep
th (m
)
A
14
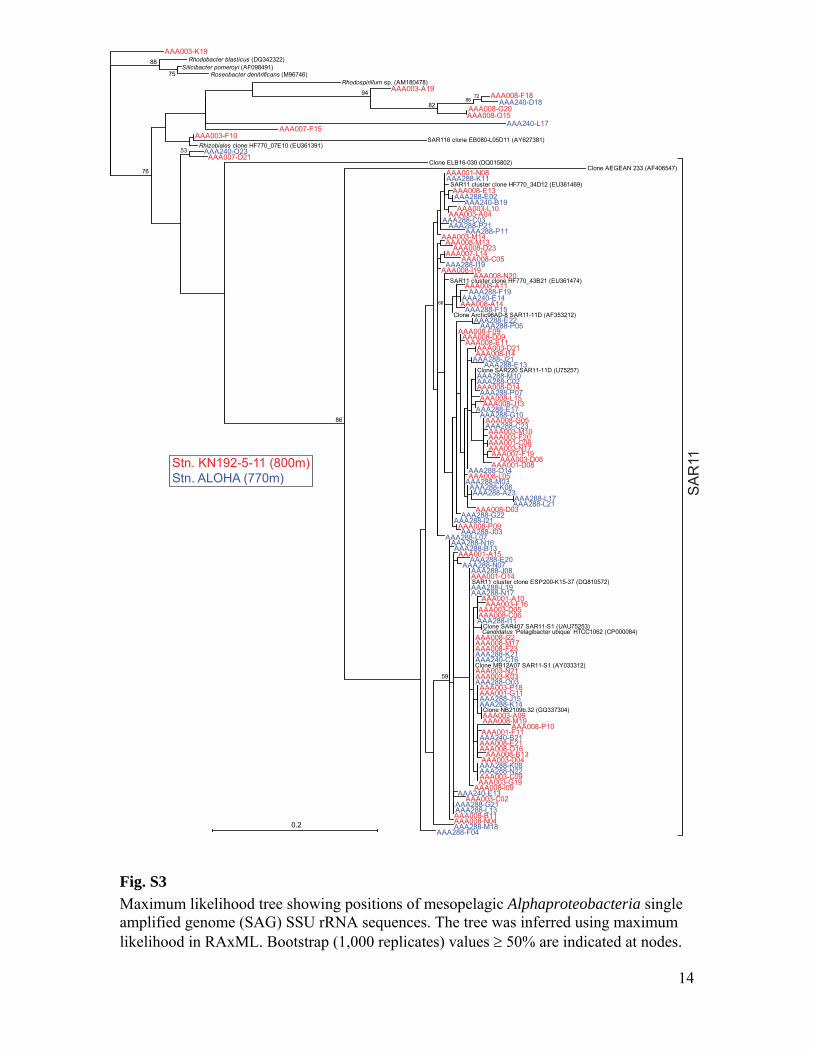
Fig. S3
Maximum likelihood tree showing positions of mesopelagic Alphaproteobacteria single amplified genome (SAG) SSU rRNA sequences. The tree was inferred using maximum likelihood in RAxML. Bootstrap (1,000 replicates) values 50% are indicated at nodes.
Rhodobacter blasticus (DQ342322)Silicibacter pomeroyi (AF098491)
Roseobacter denitrificans (M96746)Rhodospirillum sp. (AM180478)
AAA003-A19 AAA008-F18
AAA240-D18 AAA008-G20 AAA008-O15
AAA240-L17 AAA007-F15
AAA003-F10 SAR116 clone EB080-L05D11 (AY627381)Rhizobiales clone HF770_07E10 (EU361391) AAA240-O23 AAA007-D21
Clone ELB16-030 (DQ015802)Clone AEGEAN 233 (AF406547)
AAA001-N08 AAA288-K11
SAR11 cluster clone HF770_34D12 (EU361469) AAA008-E13 AAA288-E02
AAA240-B19 AAA003-L10
AAA003-A04 AAA288-C03
AAA288-P21 AAA288-P11
AAA003-M14 AAA008-M13
AAA008-D23 AAA007-L14
AAA008-C05 AAA288-I19
AAA008-I19 AAA008-N20
SAR11 cluster clone HF770_43B21 (EU361474) AAA008-A11 AAA288-F19
AAA240-E14 AAA008-A14
AAA288-F15Clone Arctic96AD-8 SAR11-11D (AF353212)
AAA288-E22 AAA288-P05
AAA008-F09 AAA008-D09 AAA008-E11
AAA003-D21 AAA008-I14
AAA288-J21 AAA288-E13
Clone SAR220 SAR11-11D (U75257) AAA288-M10 AAA288-C02 AAA008-D14 AAA288-P07 AAA008-L15 AAA008-J13
AAA288-E17 AAA288-G10
AAA008-G05 AAA288-C23 AAA003-M10 AAA003-F20 AAA001-C06 AAA003-N17 AAA007-F19
AAA003-D08 AAA001-D08
AAA288-O14 AAA008-L05
AAA288-M03 AAA288-K06 AAA288-A23
AAA288-L17 AAA288-L21
AAA008-D03 AAA288-G22
AAA288-I21 AAA008-P09 AAA288-J03
AAA288-L07 AAA288-N16 AAA288-B13
AAA001-A15 AAA288-E20
AAA288-N07 AAA288-J08 AAA001-O14SAR11 cluster clone ESP200-K15-37 (DQ810572)
AAA288-L19 AAA288-N17
AAA001-A10 AAA003-F16
AAA003-D05 AAA008-C06 AAA288-I11
Clone SAR407 SAR11-S1 (UAU75253)Candidatus ‘Pelagibacter ubique’ HTCC1062 (CP000084)
AAA008-I22 AAA008-M17 AAA008-F23 AAA288-K21 AAA240-C16Clone MB12A07 SAR11-S1 (AY033312) AAA003-N21 AAA003-K03 AAA288-O03
AAA003-P18 AAA001-G11 AAA288-J15 AAA288-K14
Clone NB2109b.32 (GQ337304) AAA003-A09 AAA008-M19
AAA008-P10 AAA001-F11 AAA240-B21 AAA008-E21 AAA008-O16
AAA008-B13 AAA003-D04 AAA288-K08 AAA288-N22 AAA003-C09 AAA003-G19
AAA008-I09 AAA240-E13
AAA003-C02 AAA288-G21 AAA288-L13 AAA008-B11 AAA008-N04 AAA288-M18
AAA288-F04
AAA003-K19
75
88
68
59
86
7286
82
94
76
0.2
SA
R11Stn. KN192-5-11 (800m)
Stn. ALOHA (770m)
53
15
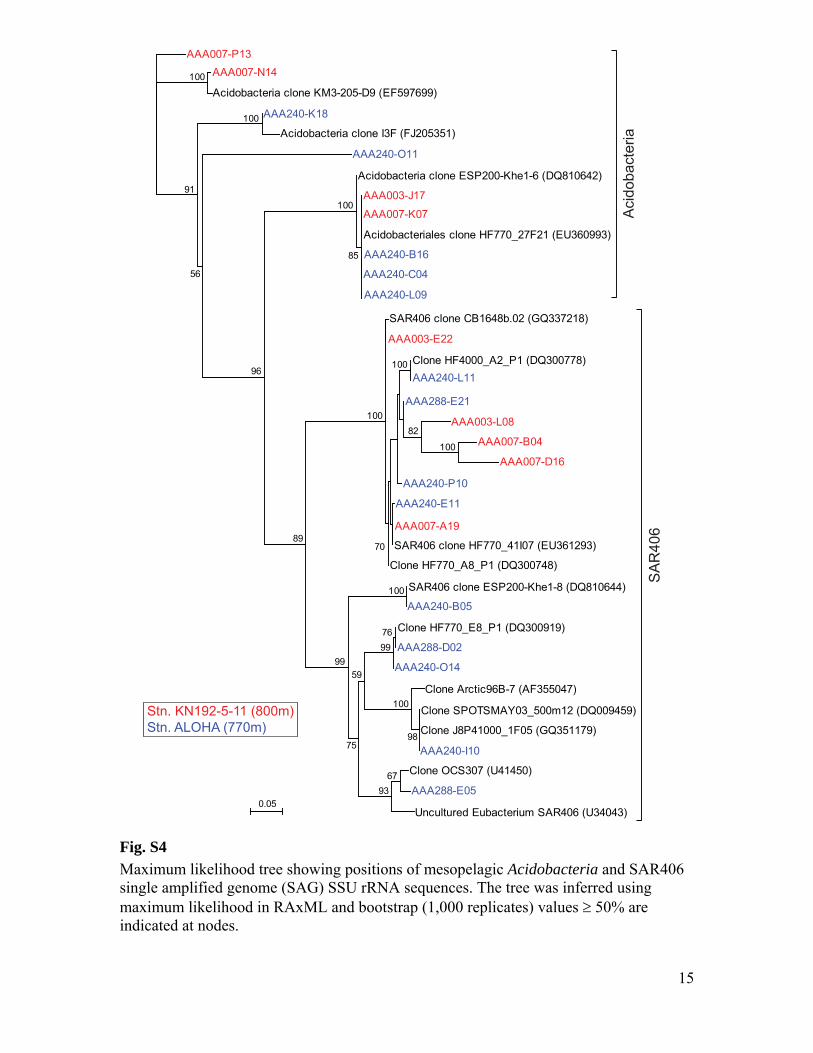
Fig. S4
Maximum likelihood tree showing positions of mesopelagic Acidobacteria and SAR406 single amplified genome (SAG) SSU rRNA sequences. The tree was inferred using maximum likelihood in RAxML and bootstrap (1,000 replicates) values 50% are indicated at nodes.
AAA007-N14
Acidobacteria clone KM3-205-D9 (EF597699)
AAA240-K18
Acidobacteria clone I3F (FJ205351)
AAA240-O11
Acidobacteria clone ESP200-Khe1-6 (DQ810642)
AAA003-J17
AAA007-K07
Acidobacteriales clone HF770_27F21 (EU360993)
AAA240-B16
AAA240-C04
AAA240-L09
SAR406 clone CB1648b.02 (GQ337218)
AAA003-E22
Clone HF4000_A2_P1 (DQ300778) AAA240-L11
AAA288-E21
AAA003-L08
AAA007-B04
AAA007-D16
AAA240-P10
AAA240-E11
AAA007-A19
SAR406 clone HF770_41I07 (EU361293)
Clone HF770_A8_P1 (DQ300748)
SAR406 clone ESP200-Khe1-8 (DQ810644)
AAA240-B05
Clone HF770_E8_P1 (DQ300919)
AAA288-D02
AAA240-O14
Clone Arctic96B-7 (AF355047)
Clone SPOTSMAY03_500m12 (DQ009459)
Clone J8P41000_1F05 (GQ351179)
AAA240-I10
Clone OCS307 (U41450)
AAA288-E05
Uncultured Eubacterium SAR406 (U34043)
AAA007-P13
100
100
85
100
100
100
82
70
100
100
7699
98
100
59
6793
75
99
89
96
56
91
0.05
Aci
doba
cter
ia
SA
R40
6
Stn. KN192-5-11 (800m)Stn. ALOHA (770m)
16
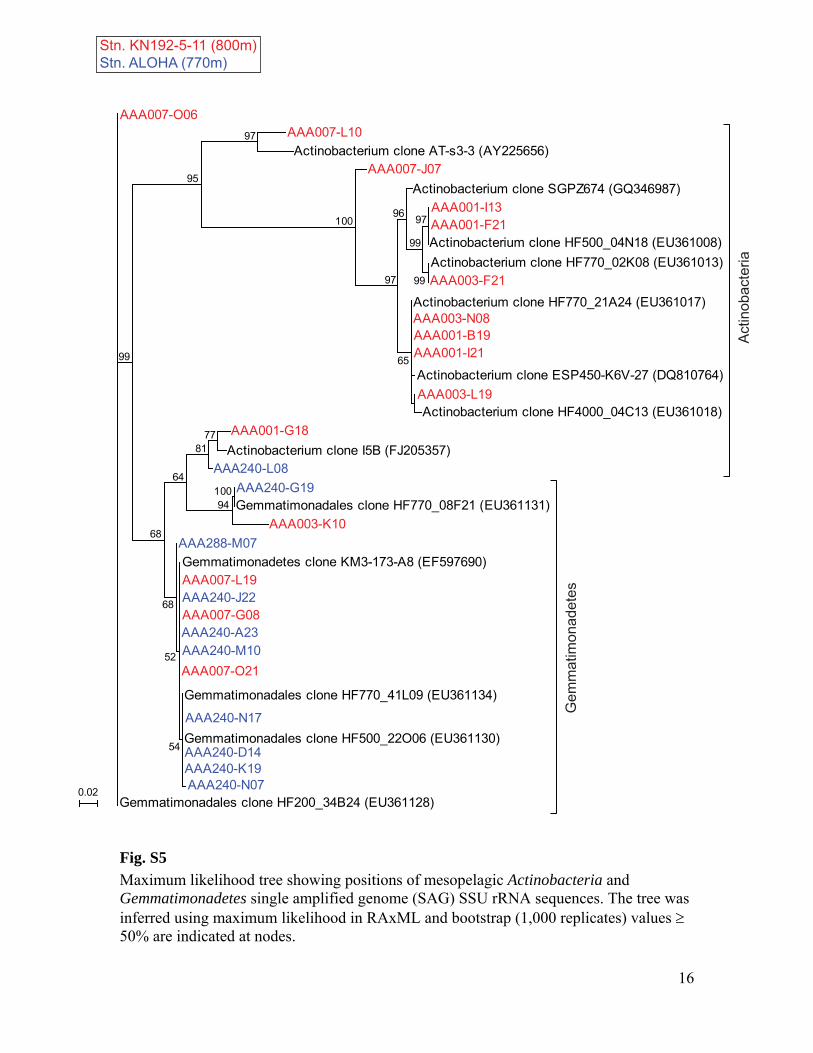
Fig. S5
Maximum likelihood tree showing positions of mesopelagic Actinobacteria and Gemmatimonadetes single amplified genome (SAG) SSU rRNA sequences. The tree was inferred using maximum likelihood in RAxML and bootstrap (1,000 replicates) values 50% are indicated at nodes.
AAA007-O06 AAA007-L10
Actinobacterium clone AT-s3-3 (AY225656) AAA007-J07
Actinobacterium clone SGPZ674 (GQ346987) AAA001-I13 AAA001-F21Actinobacterium clone HF500_04N18 (EU361008)Actinobacterium clone HF770_02K08 (EU361013)
AAA003-F21Actinobacterium clone HF770_21A24 (EU361017)
AAA003-N08 AAA001-B19 AAA001-I21
Actinobacterium clone ESP450-K6V-27 (DQ810764) AAA003-L19 Actinobacterium clone HF4000_04C13 (EU361018)
AAA001-G18Actinobacterium clone I5B (FJ205357)
AAA240-L08 AAA240-G19Gemmatimonadales clone HF770_08F21 (EU361131)
AAA003-K10 AAA288-M07 Gemmatimonadetes clone KM3-173-A8 (EF597690) AAA007-L19 AAA240-J22 AAA007-G08 AAA240-A23 AAA240-M10 AAA007-O21
Gemmatimonadales clone HF770_41L09 (EU361134)
AAA240-N17Gemmatimonadales clone HF500_22O06 (EU361130) AAA240-D14 AAA240-K19 AAA240-N07
Gemmatimonadales clone HF200_34B24 (EU361128)
10094
7781
64
54
52
68
68
65
99
97
99
96
97
100
97
95
99
0.02
Act
inob
acte
ria
Gem
mat
imon
adet
es
Stn. KN192-5-11 (800m)Stn. ALOHA (770m)
17
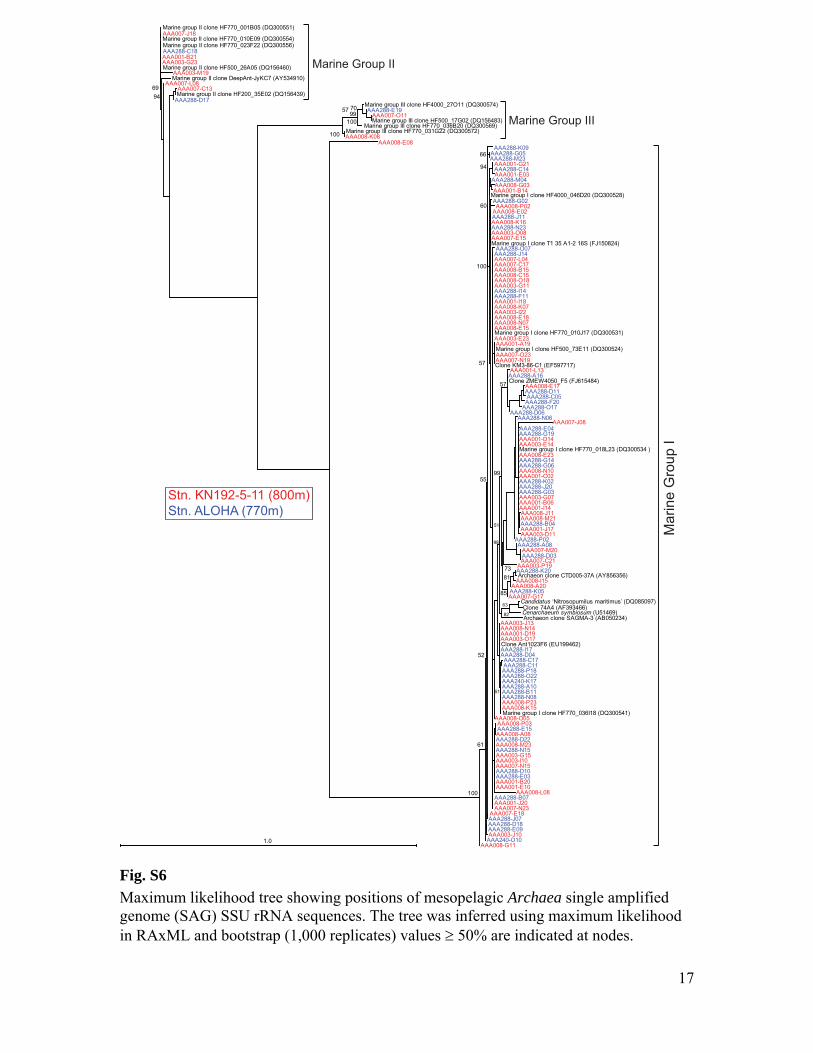
Fig. S6
Maximum likelihood tree showing positions of mesopelagic Archaea single amplified genome (SAG) SSU rRNA sequences. The tree was inferred using maximum likelihood in RAxML and bootstrap (1,000 replicates) values 50% are indicated at nodes.
AAA007-J18Marine group II clone HF770_010E09 (DQ300554)Marine group II clone HF770_023F22 (DQ300556)
AAA288-C18 AAA001-B21 AAA003-G23Marine group II clone HF500_26A05 (DQ156460)
AAA003-M19Marine group II clone DeepAnt-JyKC7 (AY534910)
AAA007-L08 AAA007-C13Marine group II clone HF200_35E02 (DQ156439)
AAA288-D17Marine group III clone HF4000_27O11 (DQ300574) AAA288-E19
AAA007-O11Marine group III clone HF500_17G02 (DQ156483)
Marine group III clone HF770_036B20 (DQ300569)Marine group III clone HF770_031G22 (DQ300572)
AAA008-K08 AAA008-E08
AAA288-K09 AAA288-G05 AAA288-M23
AAA001-G21 AAA288-C14 AAA001-E03
AAA288-M04 AAA008-G03 AAA001-B14Marine group I clone HF4000_046D20 (DQ300528) AAA288-G02 AAA008-P02
AAA008-E02 AAA288-J11 AAA008-K16 AAA288-N23 AAA003-O08 AAA007-E15Marine group I clone T1 35 A1-2 16S (FJ150824) AAA288-O07 AAA288-J14 AAA007-L04 AAA007-C17 AAA008-B15 AAA008-C15 AAA008-O18 AAA003-G11 AAA288-I14 AAA288-F11 AAA001-I18 AAA008-K07 AAA003-I22 AAA008-E18 AAA008-N07 AAA008-E15Marine group I clone HF770_010J17 (DQ300531)
AAA003-E23 AAA001-A19Marine group I clone HF500_73E11 (DQ300524)
AAA007-O23 AAA007-N19Clone KM3-86-C1 (EF597717)
AAA001-L13 AAA288-A16Clone ZMEW4050_F5 (FJ615484)
AAA008-E17 AAA288-D11 AAA288-C05 AAA288-F20
AAA288-O17 AAA288-D06
AAA288-N06 AAA007-J08
AAA288-E04 AAA288-G19 AAA001-D14 AAA003-E14Marine group I clone HF770_018L23 (DQ300534 )
AAA008-E23 AAA288-G14 AAA288-G06 AAA008-N10 AAA001-C02 AAA288-K02 AAA288-J20 AAA288-G03 AAA003-G07 AAA001-B06 AAA001-I14 AAA008-J11 AAA008-M21 AAA288-B04 AAA001-J17 AAA003-D11
AAA288-P02 AAA288-A08
AAA007-M20 AAA288-D03 AAA007-C21
AAA003-P19 AAA288-K20
Archaeon clone CTD005-37A (AY856356) AAA008-I15
AAA008-A20 AAA288-K05 AAA007-G17
Candidatus ‘Nitrosopumilus maritimus’ (DQ085097)Clone 74A4 (AF393466)Cenarchaeum symbiosum (U51469)Archaeon clone SAGMA-3 (AB050234)
AAA003-J13 AAA008-N14 AAA001-D19 AAA003-O17Clone Ant1023F6 (EU199462)
AAA288-I17 AAA288-D04 AAA288-C17 AAA288-C11 AAA288-P18 AAA288-O22 AAA240-K17 AAA288-A10 AAA288-B11 AAA288-N08 AAA008-P23 AAA008-K15Marine group I clone HF770_036I18 (DQ300541)
AAA008-O05 AAA008-P03 AAA288-E15 AAA008-A08 AAA288-D22 AAA008-M23 AAA288-N15 AAA003-G15 AAA003-I10 AAA007-N15 AAA288-D10 AAA288-E03 AAA001-B20 AAA001-E10
AAA008-L08 AAA288-B07 AAA001-J20 AAA007-N23
AAA007-E18 AAA288-J07 AAA288-D18 AAA288-E09 AAA003-J10
AAA240-O10 AAA008-G11
Marine group II clone HF770_001B05 (DQ300551)
61
51
52
82
7381
85
98
51
55
57
57
94
66
100
99
100
7099
100
100
6994
60
57
1.0
Mar
ine
Gro
up I
Marine Group III
Marine Group II
Stn. KN192-5-11 (800m)Stn. ALOHA (770m)
63
18
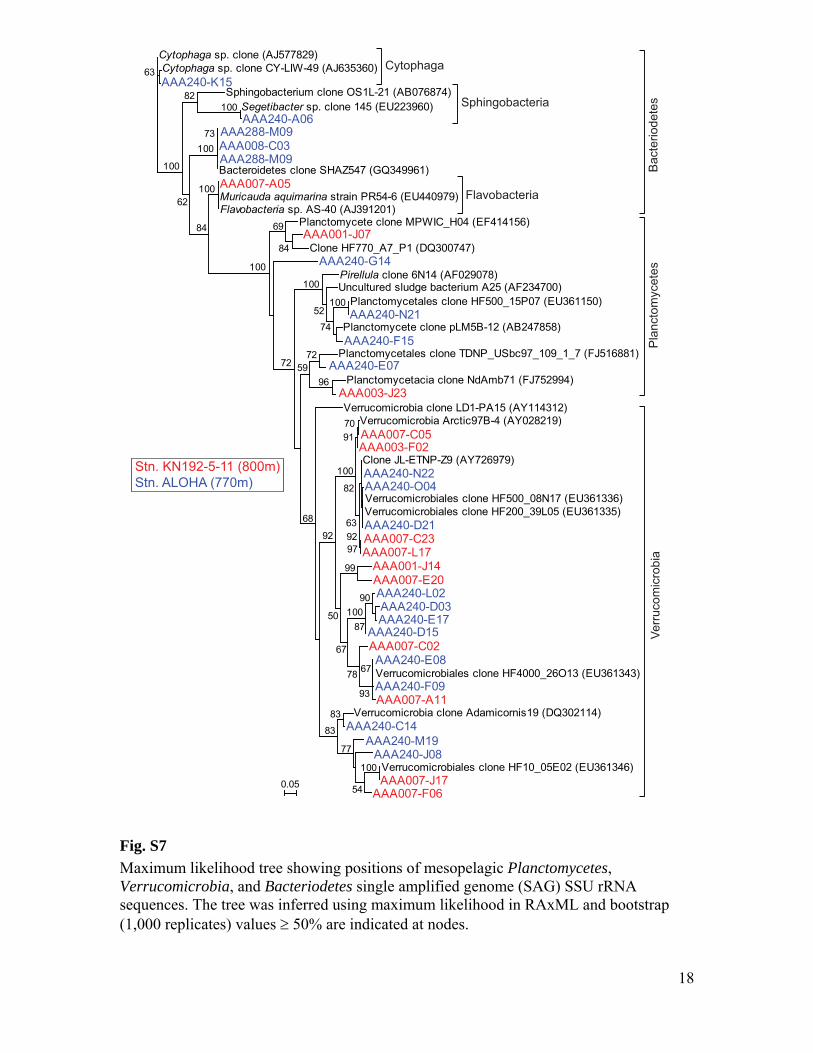
Fig. S7
Maximum likelihood tree showing positions of mesopelagic Planctomycetes, Verrucomicrobia, and Bacteriodetes single amplified genome (SAG) SSU rRNA sequences. The tree was inferred using maximum likelihood in RAxML and bootstrap (1,000 replicates) values 50% are indicated at nodes.
Cytophaga sp. clone CY-LIW-49 (AJ635360) AAA240-K15
AAA288-M09 AAA008-C03 AAA288-M09Bacteroidetes clone SHAZ547 (GQ349961) AAA007-A05Muricauda aquimarina strain PR54-6 (EU440979)Flavobacteria sp. AS-40 (AJ391201)
Planctomycete clone MPWIC_H04 (EF414156) AAA001-J07
Clone HF770_A7_P1 (DQ300747) AAA240-G14
Pirellula clone 6N14 (AF029078)Uncultured sludge bacterium A25 (AF234700)
Planctomycetales clone HF500_15P07 (EU361150) AAA240-N21Planctomycete clone pLM5B-12 (AB247858) AAA240-F15Planctomycetales clone TDNP_USbc97_109_1_7 (FJ516881)
AAA240-E07Planctomycetacia clone NdAmb71 (FJ752994)
AAA003-J23Verrucomicrobia clone LD1-PA15 (AY114312)
Verrucomicrobia Arctic97B-4 (AY028219) AAA007-C05 AAA003-F02
Clone JL-ETNP-Z9 (AY726979) AAA240-N22 AAA240-O04Verrucomicrobiales clone HF500_08N17 (EU361336)Verrucomicrobiales clone HF200_39L05 (EU361335)
AAA240-D21 AAA007-C23 AAA007-L17
AAA001-J14 AAA007-E20 AAA240-L02 AAA240-D03 AAA240-E17
AAA240-D15 AAA007-C02 AAA240-E08Verrucomicrobiales clone HF4000_26O13 (EU361343)
AAA240-F09 AAA007-A11
Verrucomicrobia clone Adamicornis19 (DQ302114) AAA240-C14
AAA240-M19 AAA240-J08
Verrucomicrobiales clone HF10_05E02 (EU361346) AAA007-J17
AAA007-F06
Sphingobacterium clone OS1L-21 (AB076874)Segetibacter sp. clone 145 (EU223960) AAA240-A06
Cytophaga sp. clone (AJ577829)63
84
69
100
74
52
100
7091
63
82
9792
100
99
87
90100
67
93
78
67
50
92
83
100
54
77
83
68
96
725972
100
100
84
73100
62
10082
100
0.05
Cytophaga
Sphingobacteria
Flavobacteria
Pla
ncto
myc
etes
Verr
ucom
icro
bia
Bac
terio
dete
s
Stn. KN192-5-11 (800m)Stn. ALOHA (770m)
19
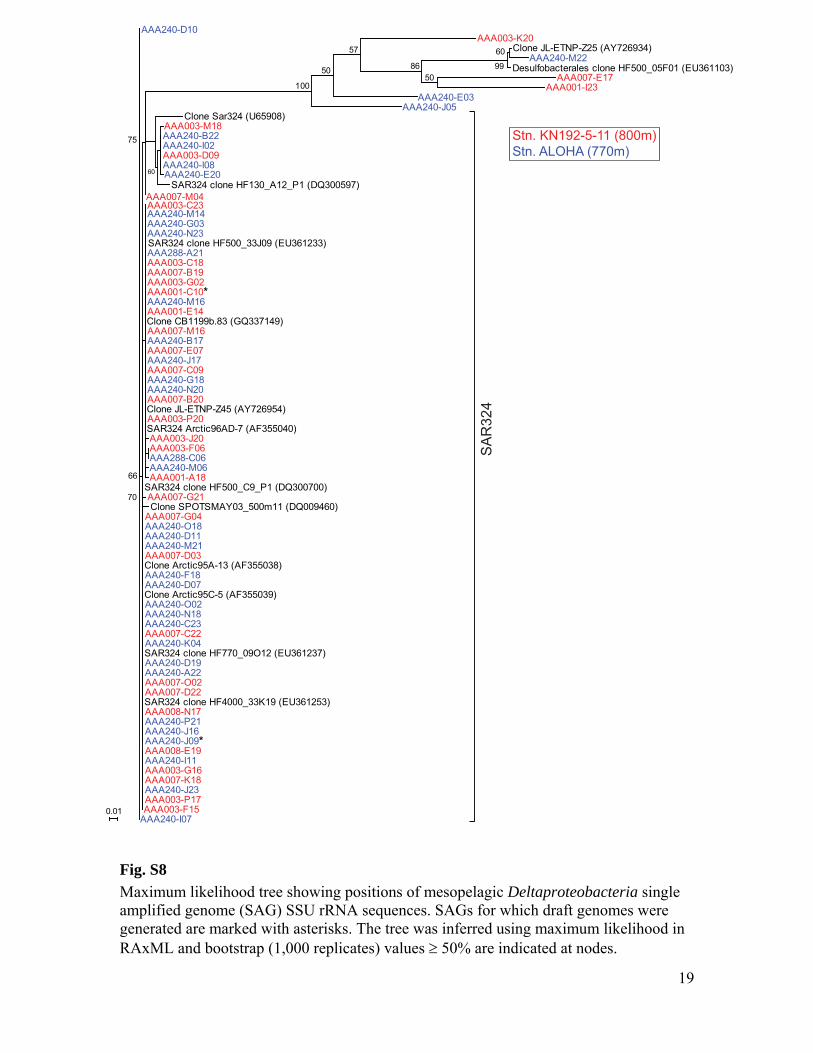
Fig. S8
Maximum likelihood tree showing positions of mesopelagic Deltaproteobacteria single amplified genome (SAG) SSU rRNA sequences. SAGs for which draft genomes were generated are marked with asterisks. The tree was inferred using maximum likelihood in RAxML and bootstrap (1,000 replicates) values 50% are indicated at nodes.
AAA240-D10 AAA003-K20
Clone JL-ETNP-Z25 (AY726934) AAA240-M22
Desulfobacterales clone HF500_05F01 (EU361103) AAA007-E17
AAA001-I23 AAA240-E03
AAA240-J05Clone Sar324 (U65908)
AAA003-M18 AAA240-B22 AAA240-I02 AAA003-D09 AAA240-I08 AAA240-E20
SAR324 clone HF130_A12_P1 (DQ300597) AAA007-M04 AAA003-C23 AAA240-M14 AAA240-G03 AAA240-N23SAR324 clone HF500_33J09 (EU361233)
AAA288-A21 AAA003-C18 AAA007-B19 AAA003-G02 AAA001-C10* AAA240-M16 AAA001-E14Clone CB1199b.83 (GQ337149) AAA007-M16 AAA240-B17 AAA007-E07 AAA240-J17 AAA007-C09 AAA240-G18 AAA240-N20 AAA007-B20Clone JL-ETNP-Z45 (AY726954) AAA003-P20SAR324 Arctic96AD-7 (AF355040) AAA003-J20 AAA003-F06 AAA288-C06 AAA240-M06 AAA001-A18SAR324 clone HF500_C9_P1 (DQ300700) AAA007-G21
Clone SPOTSMAY03_500m11 (DQ009460) AAA007-G04 AAA240-O18 AAA240-D11 AAA240-M21 AAA007-D03Clone Arctic95A-13 (AF355038) AAA240-F18 AAA240-D07Clone Arctic95C-5 (AF355039) AAA240-O02 AAA240-N18 AAA240-C23 AAA007-C22 AAA240-K04SAR324 clone HF770_09O12 (EU361237) AAA240-D19 AAA240-A22 AAA007-O02 AAA007-D22SAR324 clone HF4000_33K19 (EU361253) AAA008-N17 AAA240-P21 AAA240-J16 AAA240-J09* AAA008-E19 AAA240-I11 AAA003-G16 AAA007-K18 AAA240-J23 AAA003-P17 AAA003-F15
AAA240-I07
66
75
60
50
60
9986
57
50
100
70
0.01
SA
R32
4
Stn. KN192-5-11 (800m)Stn. ALOHA (770m)
20
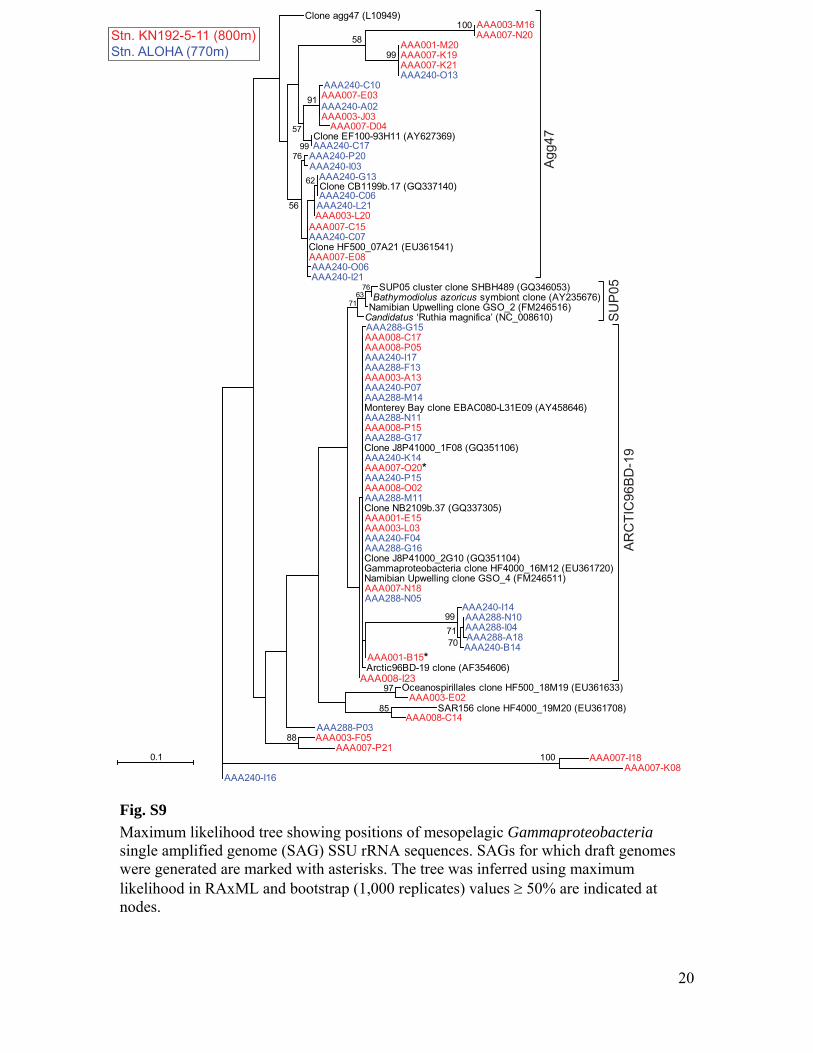
Fig. S9
Maximum likelihood tree showing positions of mesopelagic Gammaproteobacteria single amplified genome (SAG) SSU rRNA sequences. SAGs for which draft genomes were generated are marked with asterisks. The tree was inferred using maximum likelihood in RAxML and bootstrap (1,000 replicates) values 50% are indicated at nodes.
Clone agg47 (L10949) AAA003-M16 AAA007-N20
AAA001-M20 AAA007-K19 AAA007-K21 AAA240-O13
AAA240-C10 AAA007-E03 AAA240-A02 AAA003-J03
AAA007-D04Clone EF100-93H11 (AY627369)
AAA240-C17 AAA240-P20 AAA240-I03
AAA240-G13 Clone CB1199b.17 (GQ337140) AAA240-C06 AAA240-L21 AAA003-L20
AAA007-C15 AAA240-C07Clone HF500_07A21 (EU361541)
AAA007-E08 AAA240-O06 AAA240-I21
SUP05 cluster clone SHBH489 (GQ346053)Bathymodiolus azoricus symbiont clone (AY235676)
Namibian Upwelling clone GSO_2 (FM246516)Candidatus ‘Ruthia magnifica’ (NC_008610) AAA288-G15 AAA008-C17 AAA008-P05 AAA240-I17 AAA288-F13 AAA003-A13 AAA240-P07 AAA288-M14Monterey Bay clone EBAC080-L31E09 (AY458646) AAA288-N11 AAA008-P15 AAA288-G17Clone J8P41000_1F08 (GQ351106) AAA240-K14 AAA007-O20* AAA240-P15 AAA008-O02 AAA288-M11Clone NB2109b.37 (GQ337305) AAA001-E15 AAA003-L03 AAA240-F04 AAA288-G16Clone J8P41000_2G10 (GQ351104)Gammaproteobacteria clone HF4000_16M12 (EU361720)Namibian Upwelling clone GSO_4 (FM246511) AAA007-N18 AAA288-N05
AAA240-I14 AAA288-N10 AAA288-I04 AAA288-A18 AAA240-B14
AAA001-B15*Arctic96BD-19 clone (AF354606)
AAA008-I23Oceanospirillales clone HF500_18M19 (EU361633) AAA003-E02
SAR156 clone HF4000_19M20 (EU361708) AAA008-C14
AAA288-P03 AAA003-F05
AAA007-P21 AAA007-I18
AAA007-K08 AAA240-I16
99
10058
91
99
57
76
62
56
7663
71
7170
99
97
85
88
1000.1
Agg
47
AR
CTI
C96
BD
-19
SU
P05
Stn. KN192-5-11 (800m)Stn. ALOHA (770m)
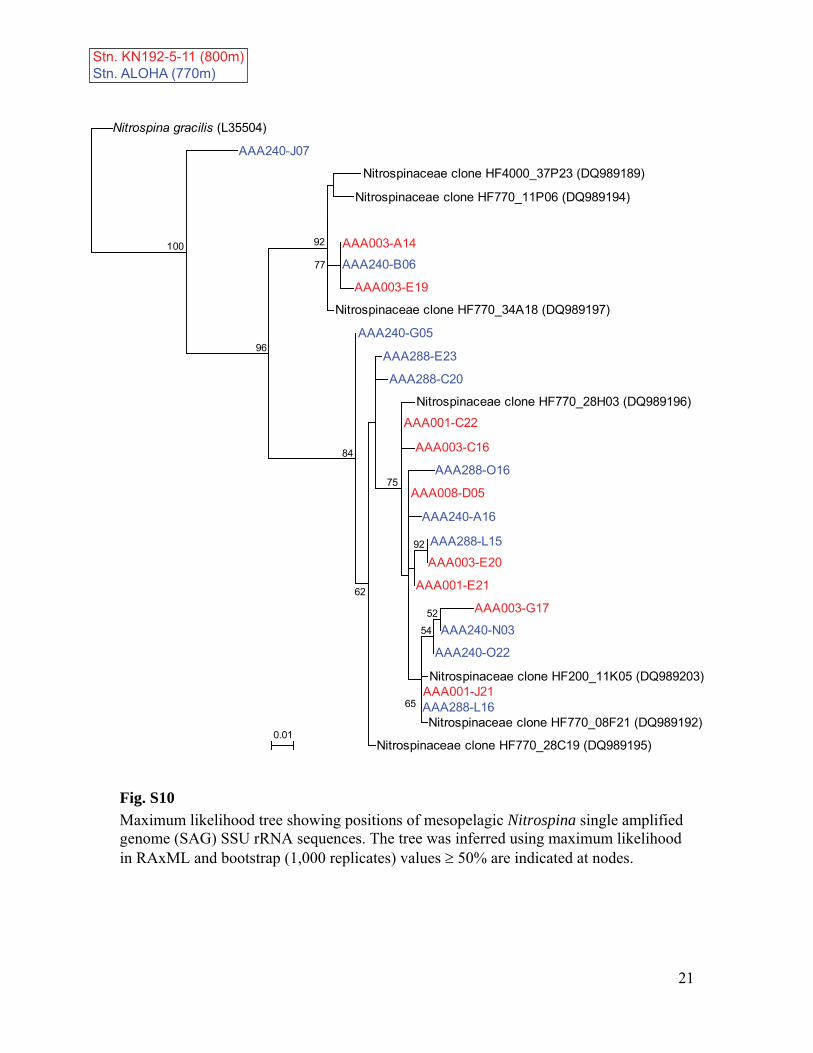
21
Fig. S10
Maximum likelihood tree showing positions of mesopelagic Nitrospina single amplified genome (SAG) SSU rRNA sequences. The tree was inferred using maximum likelihood in RAxML and bootstrap (1,000 replicates) values 50% are indicated at nodes.
Nitrospina gracilis (L35504)
AAA240-J07
Nitrospinaceae clone HF4000_37P23 (DQ989189)
Nitrospinaceae clone HF770_11P06 (DQ989194)
AAA003-A14
AAA240-B06
AAA003-E19
Nitrospinaceae clone HF770_34A18 (DQ989197)
AAA240-G05
AAA288-E23
AAA288-C20
Nitrospinaceae clone HF770_28H03 (DQ989196)
AAA001-C22
AAA003-C16
AAA288-O16
AAA008-D05
AAA240-A16
AAA288-L15
AAA003-E20
AAA001-E21
AAA003-G17
AAA240-N03
AAA240-O22
Nitrospinaceae clone HF200_11K05 (DQ989203) AAA001-J21 AAA288-L16
Nitrospinaceae clone HF770_08F21 (DQ989192)
Nitrospinaceae clone HF770_28C19 (DQ989195)
77
92
92
52
54
65
75
62
84
96
100
0.01
Stn. KN192-5-11 (800m)Stn. ALOHA (770m)
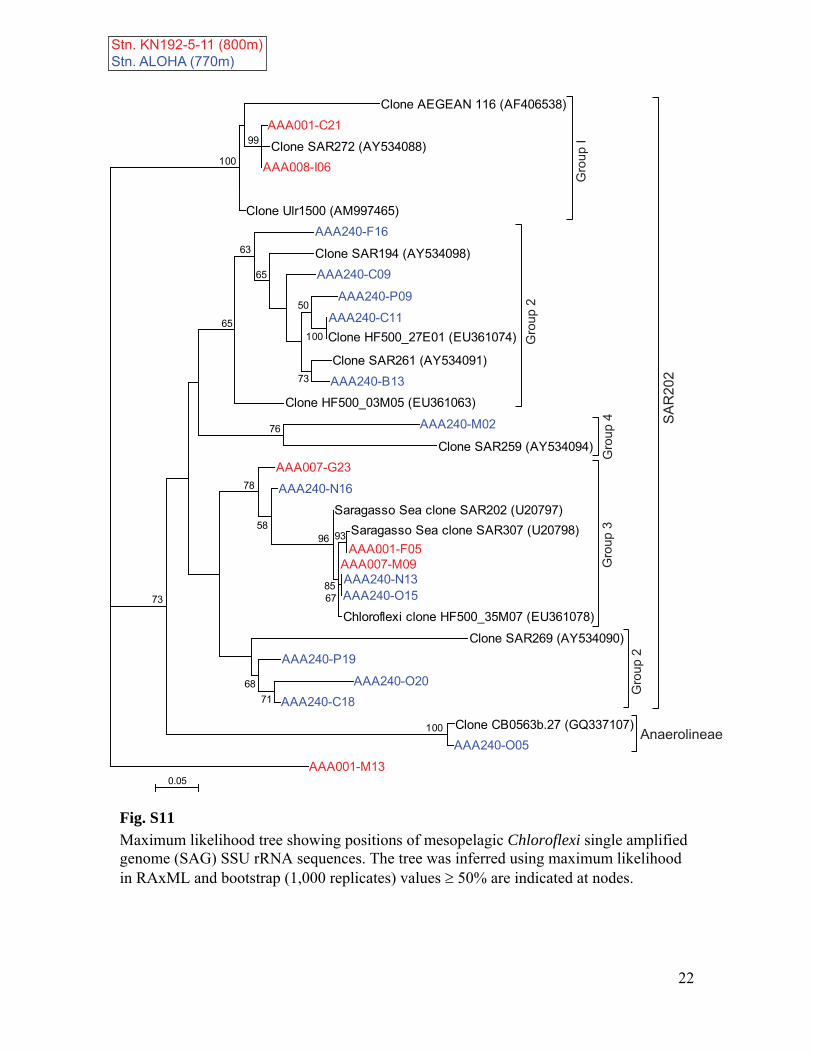
22
Fig. S11
Maximum likelihood tree showing positions of mesopelagic Chloroflexi single amplified genome (SAG) SSU rRNA sequences. The tree was inferred using maximum likelihood in RAxML and bootstrap (1,000 replicates) values 50% are indicated at nodes.
Gro
up 3
Clone AEGEAN 116 (AF406538) AAA001-C21
Clone SAR272 (AY534088) AAA008-I06
Clone Ulr1500 (AM997465) AAA240-F16
Clone SAR194 (AY534098) AAA240-C09
AAA240-P09
AAA240-C11Clone HF500_27E01 (EU361074)
Clone SAR261 (AY534091) AAA240-B13
Clone HF500_03M05 (EU361063)
AAA240-M02
Clone SAR259 (AY534094) AAA007-G23
AAA240-N16
Saragasso Sea clone SAR202 (U20797)Saragasso Sea clone SAR307 (U20798)
AAA001-F05 AAA007-M09 AAA240-N13 AAA240-O15Chloroflexi clone HF500_35M07 (EU361078)
Clone SAR269 (AY534090)
AAA240-O20 AAA240-C18
AAA240-P19
Clone CB0563b.27 (GQ337107) AAA240-O05
AAA001-M13
99
100
100
50
73
65
63
65
76
93
8567
9658
78
7168
100
73
0.05
Gro
up I
Gro
up 2
Gro
up 4
Gro
up 2
Anaerolineae
Stn. KN192-5-11 (800m)Stn. ALOHA (770m)
SA
R20
2
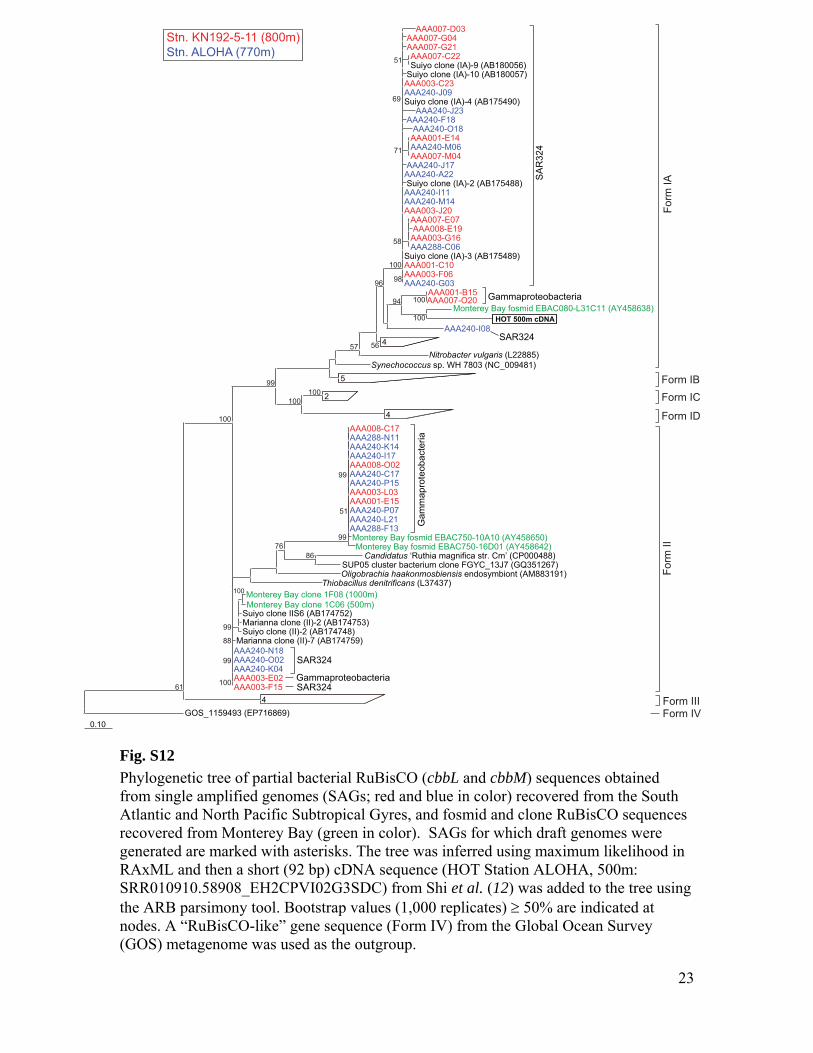
23
Fig. S12
Phylogenetic tree of partial bacterial RuBisCO (cbbL and cbbM) sequences obtained from single amplified genomes (SAGs; red and blue in color) recovered from the South Atlantic and North Pacific Subtropical Gyres, and fosmid and clone RuBisCO sequences recovered from Monterey Bay (green in color). SAGs for which draft genomes were generated are marked with asterisks. The tree was inferred using maximum likelihood in RAxML and then a short (92 bp) cDNA sequence (HOT Station ALOHA, 500m: SRR010910.58908_EH2CPVI02G3SDC) from Shi et al. (12) was added to the tree using the ARB parsimony tool. Bootstrap values (1,000 replicates) 50% are indicated at nodes. A “RuBisCO-like” gene sequence (Form IV) from the Global Ocean Survey (GOS) metagenome was used as the outgroup.
AAA007-D03AAA007-G04AAA007-G21AAA007-C22Suiyo clone (IA)-9 (AB180056)
Suiyo clone (IA)-10 (AB180057)AAA003-C23AAA240-J09Suiyo clone (IA)-4 (AB175490)
AAA240-J23AAA240-F18
AAA240-O18AAA001-E14AAA240-M06AAA007-M04
AAA240-J17AAA240-A22Suiyo clone (IA)-2 (AB175488)
AAA240-I11AAA240-M14AAA003-J20
AAA007-E07AAA008-E19
AAA003-G16AAA288-C06
Suiyo clone (IA)-3 (AB175489)AAA001-C10AAA003-F06AAA240-G03
AAA001-B15AAA007-O20
Monterey Bay fosmid EBAC080-L31C11 (AY458638)HOT 500m cDNA
AAA240-I08 4
Nitrobacter vulgaris (L22885)Synechococcus sp. WH 7803 (NC_009481)
5
2
4AAA008-C17AAA288-N11AAA240-K14AAA240-I17AAA008-O02AAA240-C17AAA240-P15AAA003-L03AAA001-E15AAA240-P07AAA240-L21AAA288-F13Monterey Bay fosmid EBAC750-10A10 (AY458650)Monterey Bay fosmid EBAC750-16D01 (AY458642)
Candidatus ‘Ruthia magnifica str. Cm’ (CP000488)SUP05 cluster bacterium clone FGYC_13J7 (GQ351267)Oligobrachia haakonmosbiensis endosymbiont (AM883191)
Thiobacillus denitrificans (L37437)
Suiyo clone IIS6 (AB174752)Marianna clone (II)-2 (AB174753)Suiyo clone (II)-2 (AB174748)
Marianna clone (II)-7 (AB174759)AAA240-N18AAA240-O02AAA240-K04AAA003-E02AAA003-F15
4 GOS_1159493 (EP716869)
0.10
100
99
88
7699
51
99
86
61
100100
99
5657
94 100
100
100
96 98
58
71
Form
IA
Form IBForm IC
Form ID
Form
II
Form III
SA
R32
4
Gammaproteobacteria
Gam
map
rote
obac
teria
SAR324
SAR324Gammaproteobacteria
SAR324
100
99
69
51
Form IV
Stn. KN192-5-11 (800m)Stn. ALOHA (770m)
100 Monterey Bay clone 1F08 (1000m)Monterey Bay clone 1C06 (500m)
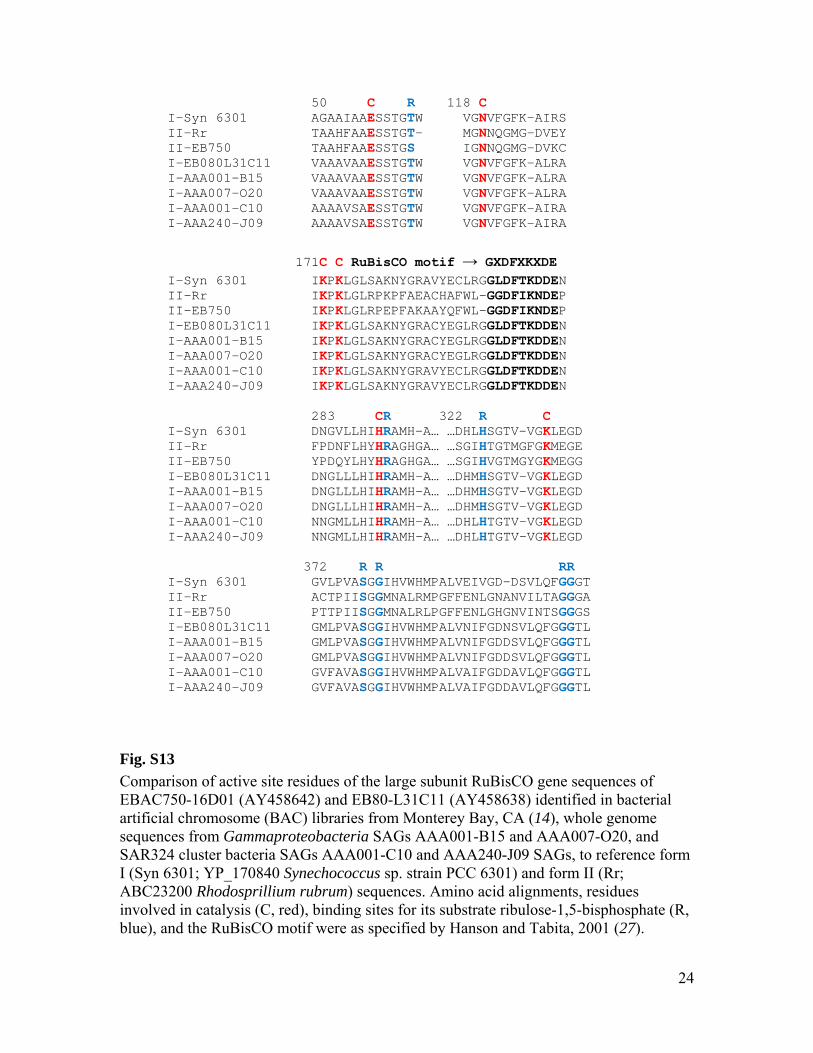
24
50 C R 118 C I-Syn 6301 AGAAIAAESSTGTW VGNVFGFK-AIRS II-Rr TAAHFAAESSTGT- MGNNQGMG-DVEY II-EB750 TAAHFAAESSTGS IGNNQGMG-DVKC I-EB080L31C11 VAAAVAAESSTGTW VGNVFGFK-ALRA I-AAA001-B15 VAAAVAAESSTGTW VGNVFGFK-ALRA I-AAA007-O20 VAAAVAAESSTGTW VGNVFGFK-ALRA I-AAA001-C10 AAAAVSAESSTGTW VGNVFGFK-AIRA I-AAA240-J09 AAAAVSAESSTGTW VGNVFGFK-AIRA
171C C RuBisCO motif → GXDFXKXDE I-Syn 6301 IKPKLGLSAKNYGRAVYECLRGGLDFTKDDEN II-Rr IKPKLGLRPKPFAEACHAFWL-GGDFIKNDEP II-EB750 IKPKLGLRPEPFAKAAYQFWL-GGDFIKNDEP I-EB080L31C11 IKPKLGLSAKNYGRACYEGLRGGLDFTKDDEN I-AAA001-B15 IKPKLGLSAKNYGRACYEGLRGGLDFTKDDEN I-AAA007-O20 IKPKLGLSAKNYGRACYEGLRGGLDFTKDDEN I-AAA001-C10 IKPKLGLSAKNYGRAVYECLRGGLDFTKDDEN I-AAA240-J09 IKPKLGLSAKNYGRAVYECLRGGLDFTKDDEN
283 CR 322 R C
I-Syn 6301 DNGVLLHIHRAMH-A… …DHLHSGTV-VGKLEGD II-Rr FPDNFLHYHRAGHGA… …SGIHTGTMGFGKMEGE II-EB750 YPDQYLHYHRAGHGA… …SGIHVGTMGYGKMEGG I-EB080L31C11 DNGLLLHIHRAMH-A… …DHMHSGTV-VGKLEGD I-AAA001-B15 DNGLLLHIHRAMH-A… …DHMHSGTV-VGKLEGD I-AAA007-O20 DNGLLLHIHRAMH-A… …DHMHSGTV-VGKLEGD I-AAA001-C10 NNGMLLHIHRAMH-A… …DHLHTGTV-VGKLEGD I-AAA240-J09 NNGMLLHIHRAMH-A… …DHLHTGTV-VGKLEGD
372 R R RR
I-Syn 6301 GVLPVASGGIHVWHMPALVEIVGD-DSVLQFGGGT II-Rr ACTPIISGGMNALRMPGFFENLGNANVILTAGGGA II-EB750 PTTPIISGGMNALRLPGFFENLGHGNVINTSGGGS I-EB080L31C11 GMLPVASGGIHVWHMPALVNIFGDNSVLQFGGGTL I-AAA001-B15 GMLPVASGGIHVWHMPALVNIFGDDSVLQFGGGTL I-AAA007-O20 GMLPVASGGIHVWHMPALVNIFGDDSVLQFGGGTL I-AAA001-C10 GVFAVASGGIHVWHMPALVAIFGDDAVLQFGGGTL I-AAA240-J09 GVFAVASGGIHVWHMPALVAIFGDDAVLQFGGGTL
Fig. S13
Comparison of active site residues of the large subunit RuBisCO gene sequences of EBAC750-16D01 (AY458642) and EB80-L31C11 (AY458638) identified in bacterial artificial chromosome (BAC) libraries from Monterey Bay, CA (14), whole genome sequences from Gammaproteobacteria SAGs AAA001-B15 and AAA007-O20, and SAR324 cluster bacteria SAGs AAA001-C10 and AAA240-J09 SAGs, to reference form I (Syn 6301; YP_170840 Synechococcus sp. strain PCC 6301) and form II (Rr; ABC23200 Rhodosprillium rubrum) sequences. Amino acid alignments, residues involved in catalysis (C, red), binding sites for its substrate ribulose-1,5-bisphosphate (R, blue), and the RuBisCO motif were as specified by Hanson and Tabita, 2001 (27).
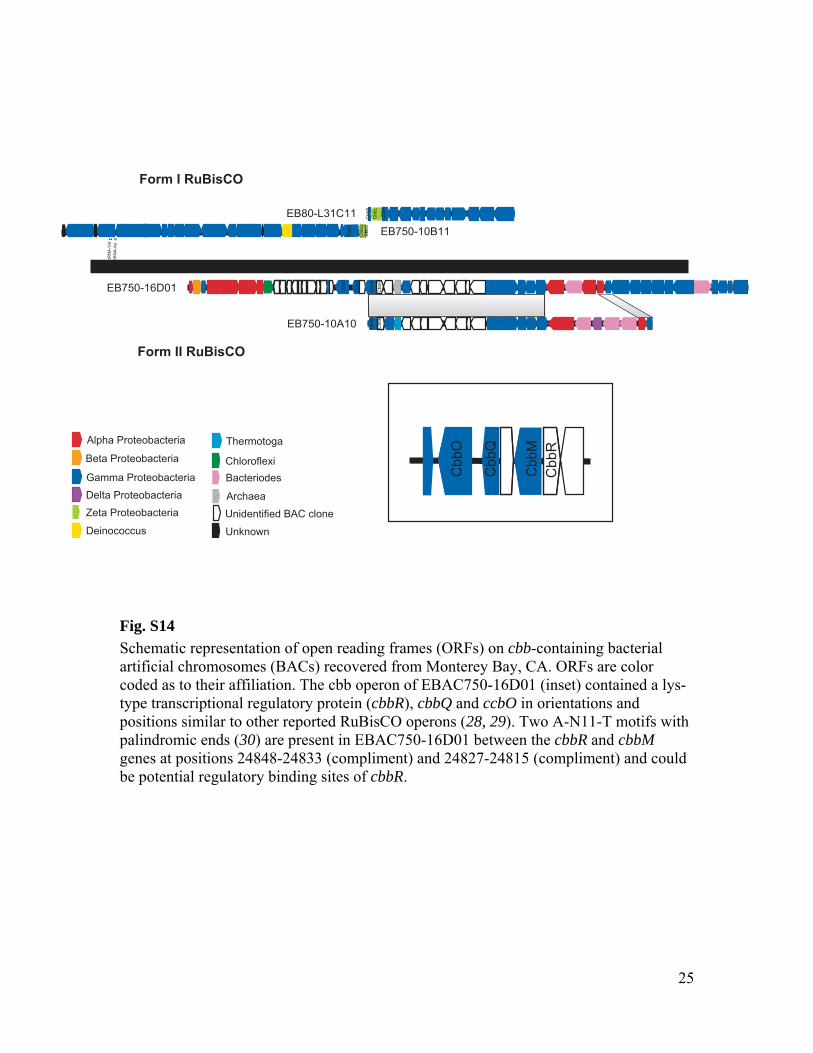
25
Fig. S14
Schematic representation of open reading frames (ORFs) on cbb-containing bacterial artificial chromosomes (BACs) recovered from Monterey Bay, CA. ORFs are color coded as to their affiliation. The cbb operon of EBAC750-16D01 (inset) contained a lys-type transcriptional regulatory protein (cbbR), cbbQ and ccbO in orientations and positions similar to other reported RuBisCO operons (28, 29). Two A-N11-T motifs with palindromic ends (30) are present in EBAC750-16D01 between the cbbR and cbbM genes at positions 24848-24833 (compliment) and 24827-24815 (compliment) and could be potential regulatory binding sites of cbbR.
Cbb
Q
Cbb
MC
bbR
EB750-16D01
EB750-10B11
EB750-10A10
tRN
A-Va
ltR
NA-
Asp**
Cbb
O
R
EB80-L31C11
**
Cbb
O
Cbb
QC
bbS
Cbb
L
Cbb
R
Cbb
SC
bbM
Cbb
R
Cbb
Q
Cbb
MC
bbR
Cbb
O
Form I RuBisCO
Form II RuBisCO
Zeta Proteobacteria
Chloroflexi
Alpha Proteobacteria
Beta Proteobacteria
Gamma Proteobacteria
Deinococcus
Thermotoga
Bacteriodes
Archaea
Unidentified BAC clone
Unknown
Delta Proteobacteria
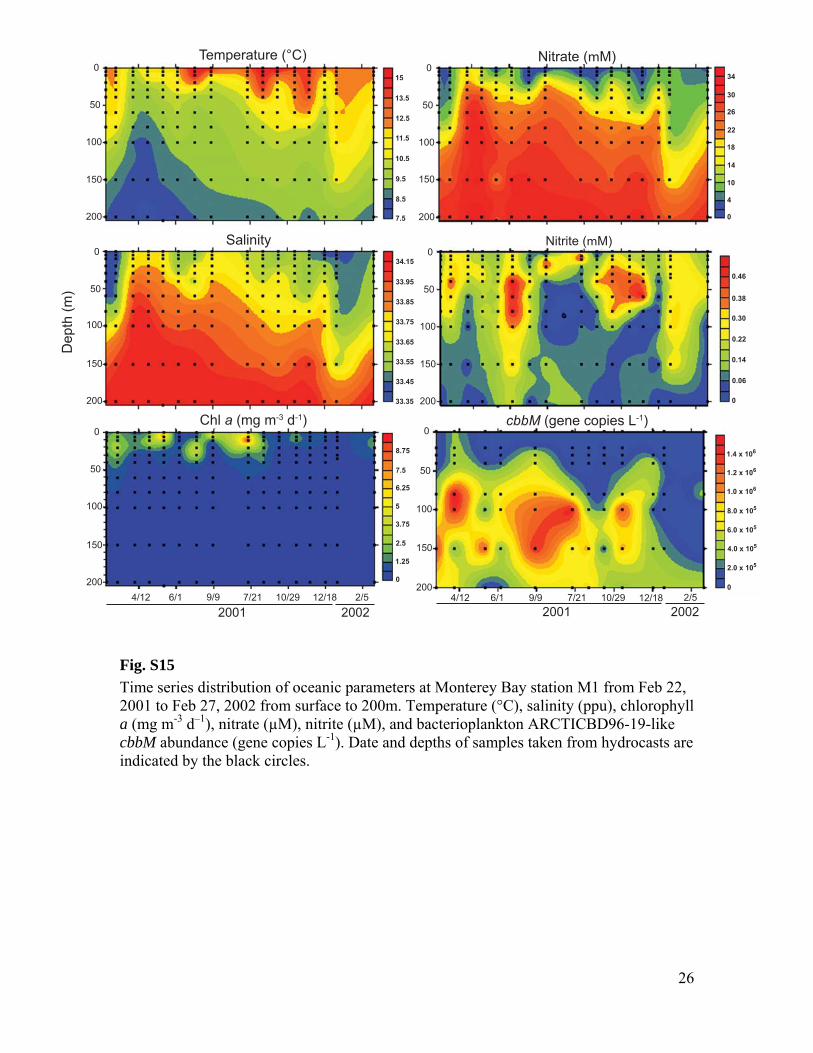
26
Fig. S15
Time series distribution of oceanic parameters at Monterey Bay station M1 from Feb 22, 2001 to Feb 27, 2002 from surface to 200m. Temperature (°C), salinity (ppu), chlorophyll a (mg m-3 d–1), nitrate (µM), nitrite (µM), and bacterioplankton ARCTICBD96-19-like cbbM abundance (gene copies L-1). Date and depths of samples taken from hydrocasts are indicated by the black circles.
Temperature (°C)
Salinity
Chl a (mg m-3 d-1)
Nitrate (mM)
Nitrite (mM)
cbbM (gene copies L-1)
4/12 6/1 9/9 7/21 10/29 12/18 2/5 4/12 6/1 9/9 7/21 10/29 12/18 2/5
0
50
100
150
200
0
50
100
150
200
0
50
100
150
200
0
50
100
150
200
0
50
100
150
200
0
50
100
150
200
15
13.5
12.5
11.5
10.5
9.5
8.5
7.5
34.15
33.95
33.85
33.75
33.65
33.55
33.45
33.35
8.75
7.5
6.25
5
3.75
2.5
1.25
0
34
30
26
22
18
14
10
4
0
0.46
0.38
0.30
0.22
0.14
0.06
0
1.4 x 10⁶
1.2 x 10⁶
1.0 x 10⁶
8.0 x 10⁵
6.0 x 10⁵
4.0 x 10⁵
2.0 x 10⁵
0
Dep
th (m
)
2001 2002 2001 2002
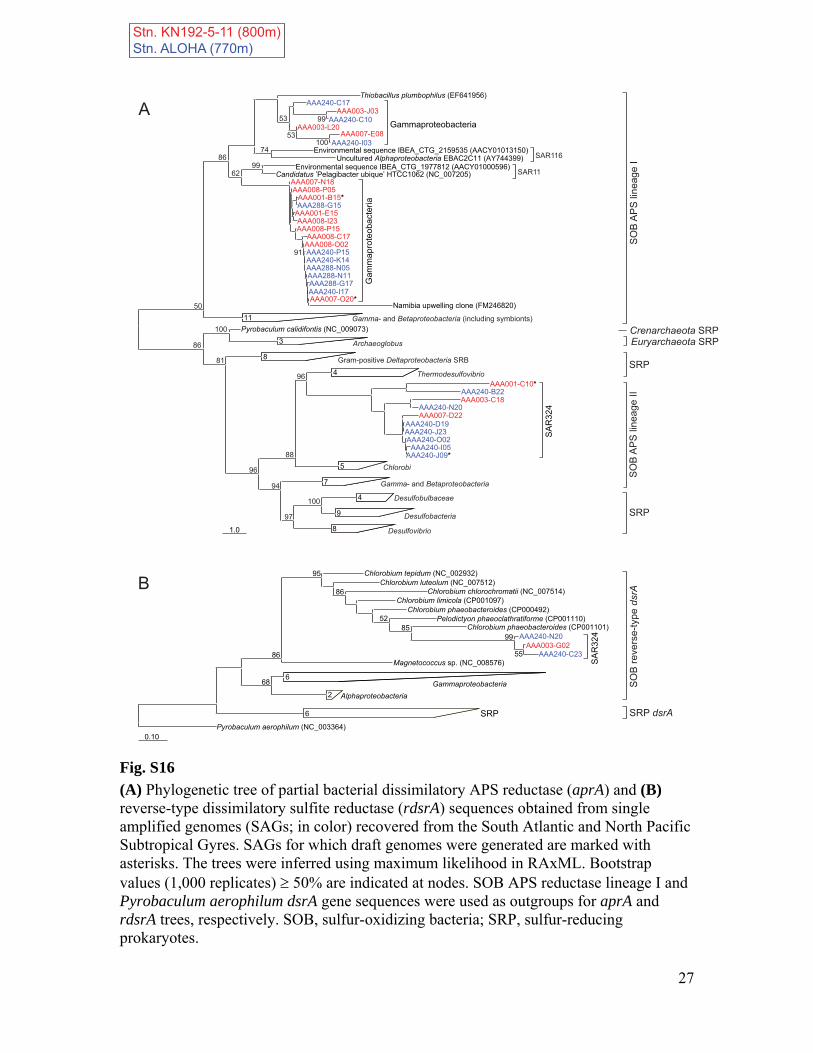
27
Fig. S16
(A) Phylogenetic tree of partial bacterial dissimilatory APS reductase (aprA) and (B) reverse-type dissimilatory sulfite reductase (rdsrA) sequences obtained from single amplified genomes (SAGs; in color) recovered from the South Atlantic and North Pacific Subtropical Gyres. SAGs for which draft genomes were generated are marked with asterisks. The trees were inferred using maximum likelihood in RAxML. Bootstrap values (1,000 replicates) 50% are indicated at nodes. SOB APS reductase lineage I and Pyrobaculum aerophilum dsrA gene sequences were used as outgroups for aprA and rdsrA trees, respectively. SOB, sulfur-oxidizing bacteria; SRP, sulfur-reducing prokaryotes.
Thiobacillus plumbophilus (EF641956)AAA240-C17
AAA003-J03AAA240-C10
AAA003-L20AAA007-E08
AAA240-I03Environmental sequence IBEA_CTG_2159535 (AACY01013150)
Uncultured Alphaproteobacteria EBAC2C11 (AY744399)Environmental sequence IBEA_CTG_1977812 (AACY01000596)
Candidatus ’Pelagibacter ubique’ HTCC1062 (NC_007205)AAA007-N18AAA008-P05
AAA001-B15*AAA288-G15
AAA001-E15AAA008-I23AAA008-P15
AAA008-C17AAA008-O02AAA240-P15AAA240-K14AAA288-N05AAA288-N11AAA288-G17AAA240-I17AAA007-O20*
Namibia upwelling clone (FM246820) 11Pyrobaculum calidifontis (NC_009073)
3
8
4AAA001-C10*
AAA240-B22AAA003-C18
AAA240-N20AAA007-D22
AAA240-D19AAA240-J23AAA240-O02
AAA240-I05AAA240-J09*
5
7
4
9
81.0
Chlorobium tepidum (NC_002932)Chlorobium luteolum (NC_007512)
Chlorobium chlorochromatii (NC_007514)Chlorobium limicola (CP001097)
Chlorobium phaeobacteroides (CP000492)Pelodictyon phaeoclathratiforme (CP001110)
Chlorobium phaeobacteroides (CP001101)AAA240-N20
AAA003-G02AAA240-C2355
9985
52
86
Magnetococcus sp. (NC_008576)
95
Gammaproteobacteria 6
Alphaproteobacteria 2
86
68
SRP 6Pyrobaculum aerophilum (NC_003364)
0.10
99
91
62
50
74
53 99
10053
100Gamma- and Betaproteobacteria (including symbionts)
Archaeoglobus
Gram-positive Deltaproteobacteria SRB
Thermodesulfovibrio
Chlorobi
Gamma- and Betaproteobacteria
Desulfobacteria
Desulfobulbaceae
Desulfovibrio
81
94
97
88
96
100
96
86
A
B
SO
B A
PS
line
age
I
Crenarchaeota SRPEuryarchaeota SRP
SRP
SO
B A
PS
line
age
II
SRP
Gammaproteobacteria
Gam
map
rote
obac
teria
SA
R32
4
86
SO
B re
vers
e-ty
pe d
srA
SRP dsrA
SA
R32
4
Stn. KN192-5-11 (800m)Stn. ALOHA (770m)
SAR11
SAR116
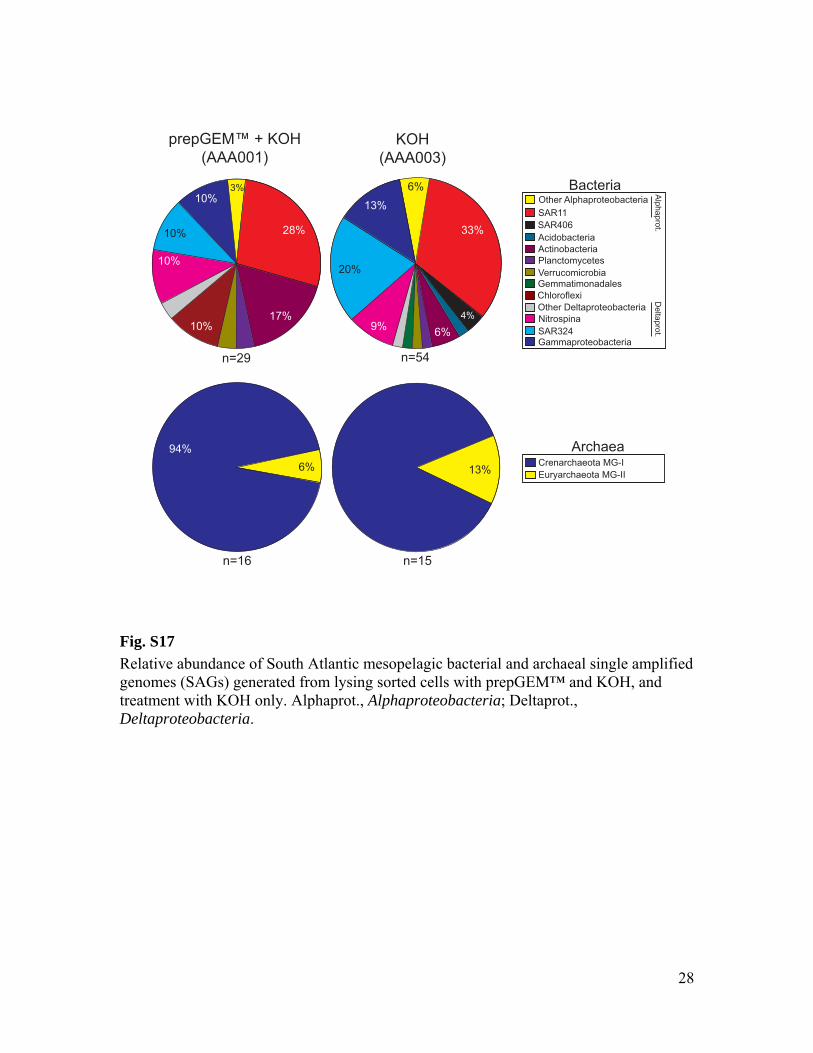
28
n=54n=29
n=16 n=15
Crenarchaeota MG-IEuryarchaeota MG-II
Bacteria
Archaea
prepGEM™ + KOH(AAA001)
KOH(AAA003)
SAR11Other Alphaproteobacteria
GammaproteobacteriaSAR324NitrospinaOther DeltaproteobacteriaChloroflexiGemmatimonadalesVerrucomicrobia
ActinobacteriaAcidobacteriaSAR406
Alphaprot.
Deltaprot.
28%
17%
10%
10%
10%
10% 33%
6%13%
9% 6%
20% Planctomycetes
87%94%6% 13%
28% 33%
3% 6%
4%17%6%10%
10%
9%
10%
20%
10% 13%
Fig. S17
Relative abundance of South Atlantic mesopelagic bacterial and archaeal single amplified genomes (SAGs) generated from lysing sorted cells with prepGEM™ and KOH, and treatment with KOH only. Alphaprot., Alphaproteobacteria; Deltaprot., Deltaproteobacteria.
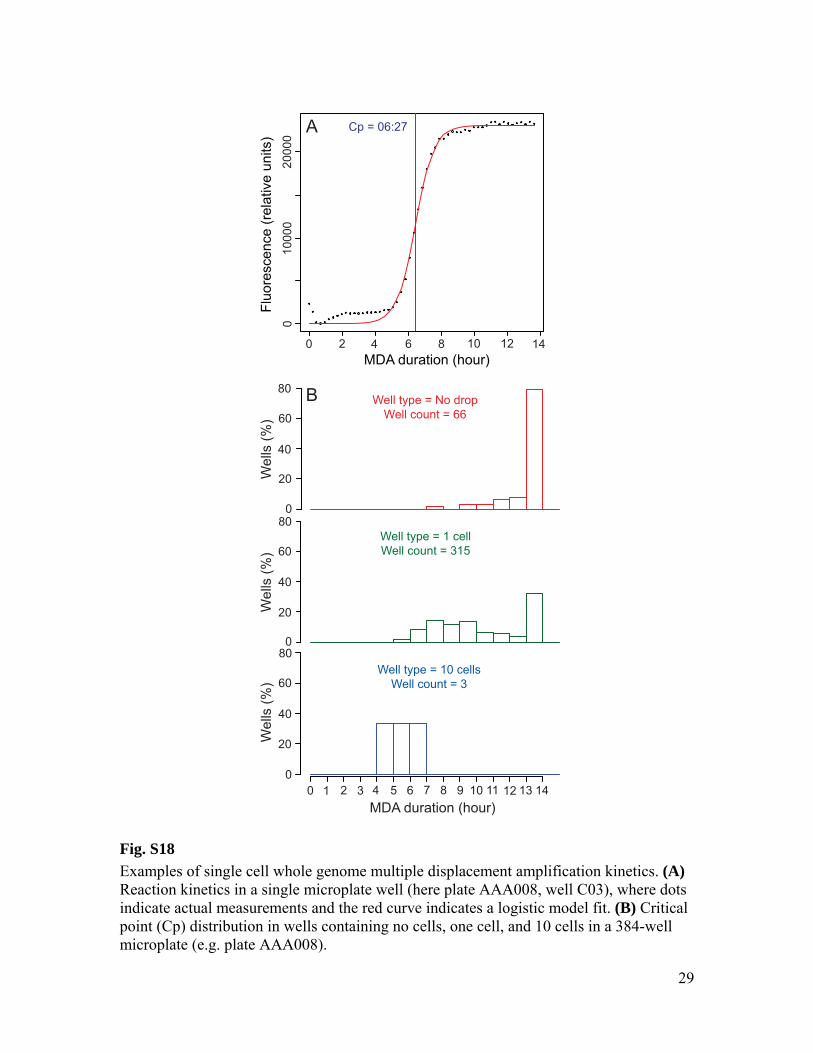
29
MDA duration (hour)
Fluo
resc
ence
(rel
ativ
e un
its)
Cp = 06:27
010
000
2000
0
0 2 4 6 8 10 12 14
80
60
40
20
0
Wel
ls (%
)
Well type = No dropWell count = 66
80
60
40
20
0
Wel
ls (%
)
Well type = 1 cellWell count = 315
80
60
40
20
0
Wel
ls (%
)
Well type = 10 cellsWell count = 3
MDA duration (hour)0 1 2 3 4 5 6 7 8 9 10 11 12 13 14
A
B
Fig. S18
Examples of single cell whole genome multiple displacement amplification kinetics. (A) Reaction kinetics in a single microplate well (here plate AAA008, well C03), where dots indicate actual measurements and the red curve indicates a logistic model fit. (B) Critical point (Cp) distribution in wells containing no cells, one cell, and 10 cells in a 384-well microplate (e.g. plate AAA008).
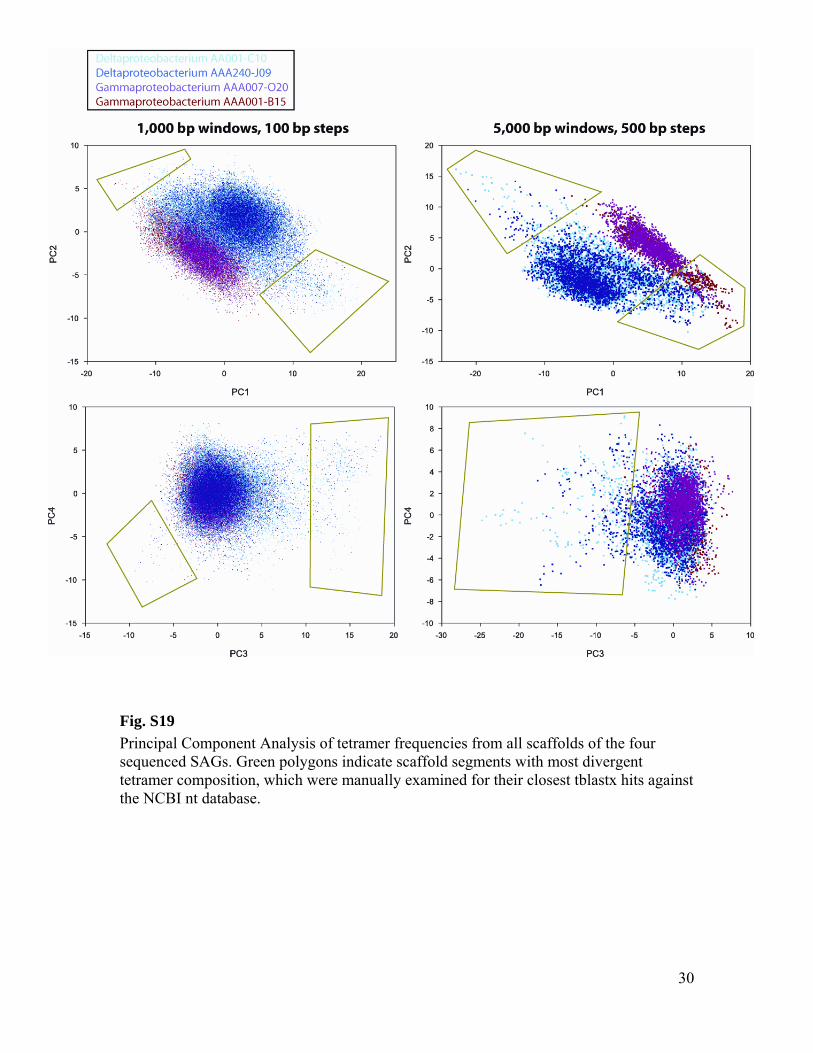
30
Fig. S19
Principal Component Analysis of tetramer frequencies from all scaffolds of the four sequenced SAGs. Green polygons indicate scaffold segments with most divergent tetramer composition, which were manually examined for their closest tblastx hits against the NCBI nt database.
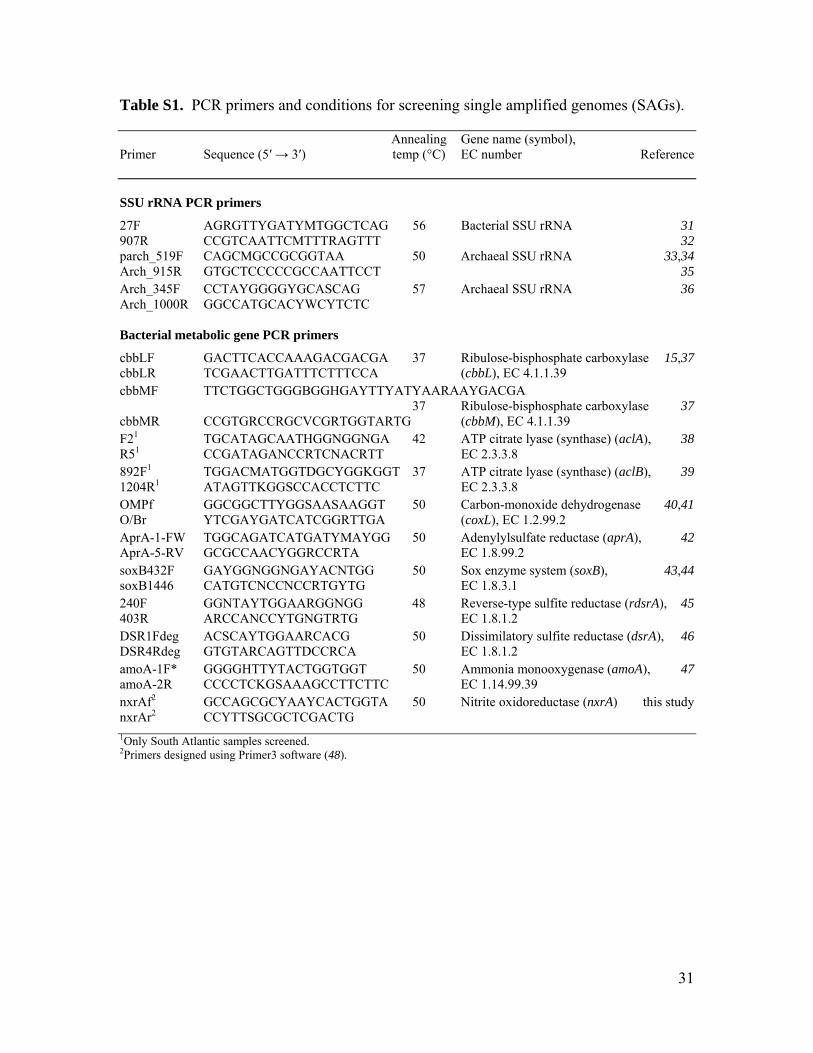
31
Table S1. PCR primers and conditions for screening single amplified genomes (SAGs). Annealing Gene name (symbol), Primer Sequence (5′ → 3′) temp (°C) EC number Reference SSU rRNA PCR primers
27F AGRGTTYGATYMTGGCTCAG 56 Bacterial SSU rRNA 31 907R CCGTCAATTCMTTTRAGTTT 32 parch_519F CAGCMGCCGCGGTAA 50 Archaeal SSU rRNA 33,34 Arch_915R GTGCTCCCCCGCCAATTCCT 35 Arch_345F CCTAYGGGGYGCASCAG 57 Archaeal SSU rRNA 36 Arch_1000R GGCCATGCACYWCYTCTC
Bacterial metabolic gene PCR primers
cbbLF GACTTCACCAAAGACGACGA 37 Ribulose-bisphosphate carboxylase 15,37 cbbLR TCGAACTTGATTTCTTTCCA (cbbL), EC 4.1.1.39 cbbMF TTCTGGCTGGGBGGHGAYTTYATYAARAAYGACGA 37 Ribulose-bisphosphate carboxylase 37 cbbMR CCGTGRCCRGCVCGRTGGTARTG (cbbM), EC 4.1.1.39 F21 TGCATAGCAATHGGNGGNGA 42 ATP citrate lyase (synthase) (aclA), 38 R51 CCGATAGANCCRTCNACRTT EC 2.3.3.8 892F1 TGGACMATGGTDGCYGGKGGT 37 ATP citrate lyase (synthase) (aclB), 39 1204R1 ATAGTTKGGSCCACCTCTTC EC 2.3.3.8 OMPf GGCGGCTTYGGSAASAAGGT 50 Carbon-monoxide dehydrogenase 40,41 O/Br YTCGAYGATCATCGGRTTGA (coxL), EC 1.2.99.2 AprA-1-FW TGGCAGATCATGATYMAYGG 50 Adenylylsulfate reductase (aprA), 42 AprA-5-RV GCGCCAACYGGRCCRTA EC 1.8.99.2 soxB432F GAYGGNGGNGAYACNTGG 50 Sox enzyme system (soxB), 43,44 soxB1446 CATGTCNCCNCCRTGYTG EC 1.8.3.1 240F GGNTAYTGGAARGGNGG 48 Reverse-type sulfite reductase (rdsrA), 45 403R ARCCANCCYTGNGTRTG EC 1.8.1.2 DSR1Fdeg ACSCAYTGGAARCACG 50 Dissimilatory sulfite reductase (dsrA), 46 DSR4Rdeg GTGTARCAGTTDCCRCA EC 1.8.1.2 amoA-1F* GGGGHTTYTACTGGTGGT 50 Ammonia monooxygenase (amoA), 47 amoA-2R CCCCTCKGSAAAGCCTTCTTC EC 1.14.99.39 nxrAf2 GCCAGCGCYAAYCACTGGTA 50 Nitrite oxidoreductase (nxrA) this study nxrAr2 CCYTTSGCGCTCGACTG 1Only South Atlantic samples screened. 2Primers designed using Primer3 software (48).
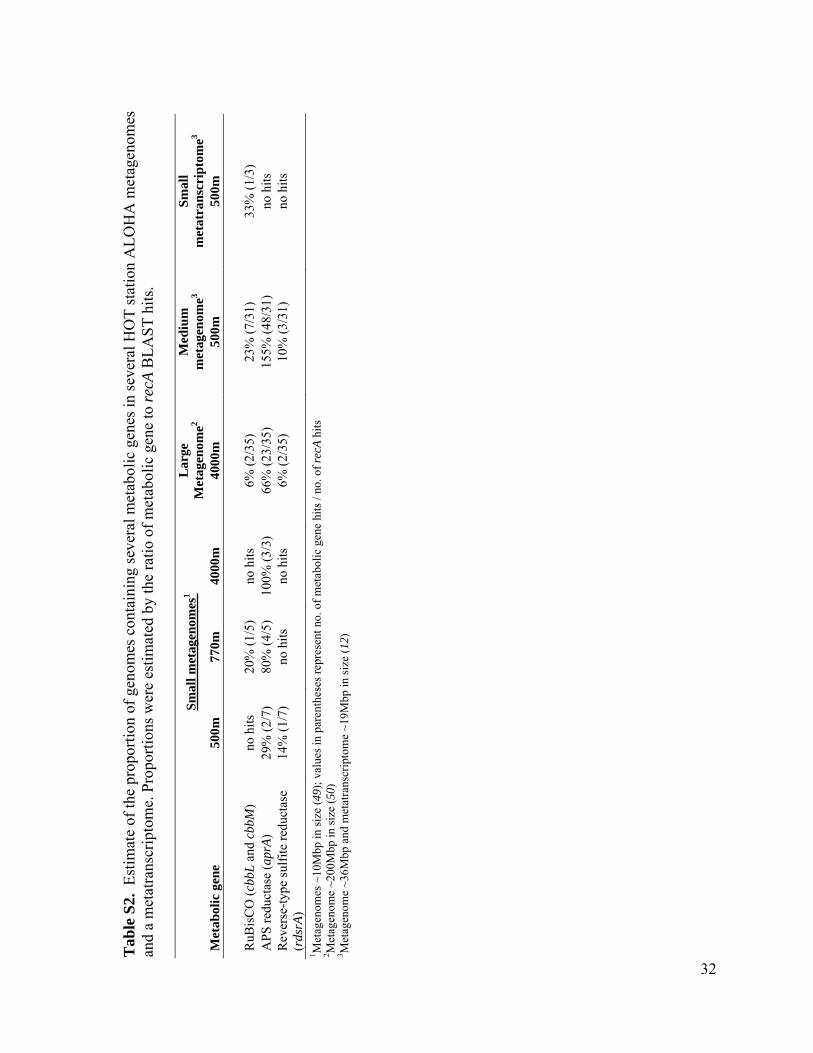
T
able
S2.
Est
imat
e of
the
prop
orti
on o
f ge
nom
es c
onta
inin
g se
vera
l met
abol
ic g
enes
in s
ever
al H
OT
sta
tion
AL
OH
A m
etag
enom
es
and
a m
etat
rans
crip
tom
e. P
ropo
rtio
ns w
ere
esti
mat
ed b
y th
e ra
tio
of m
etab
olic
gen
e to
rec
A B
LA
ST
hit
s.
S
mal
l met
agen
omes
1 L
arge
M
etag
enom
e2 M
ediu
m
met
agen
ome3
Sm
all
met
atra
nsc
rip
tom
e3 M
etab
olic
gen
e 50
0m
770m
40
00m
40
00m
50
0m
500m
RuB
isC
O (
cbbL
and
cbb
M)
no h
its
20%
(1/
5)
no h
its
6% (
2/35
) 23
% (
7/31
) 33
% (
1/3)
A
PS
redu
ctas
e (a
prA
) 29
% (
2/7)
80
% (
4/5)
10
0% (
3/3)
66
% (
23/3
5)
155%
(48
/31)
no
hits
R
ever
se-t
ype
sulf
ite r
educ
tase
(r
dsrA
) 14
% (
1/7)
no
hits
no
hits
6%
(2/
35)
10%
(3/
31)
no h
its
1 Met
agen
omes
~10
Mbp
in s
ize
(49)
; val
ues
in p
aren
thes
es r
epre
sent
no.
of
met
abol
ic g
ene
hits
/ no
. of
recA
hit
s 2 M
etag
enom
e ~2
00M
bp in
siz
e (5
0)
3 Met
agen
ome
~36M
bp a
nd m
etat
rans
crip
tom
e ~1
9Mbp
in s
ize
(12)
32
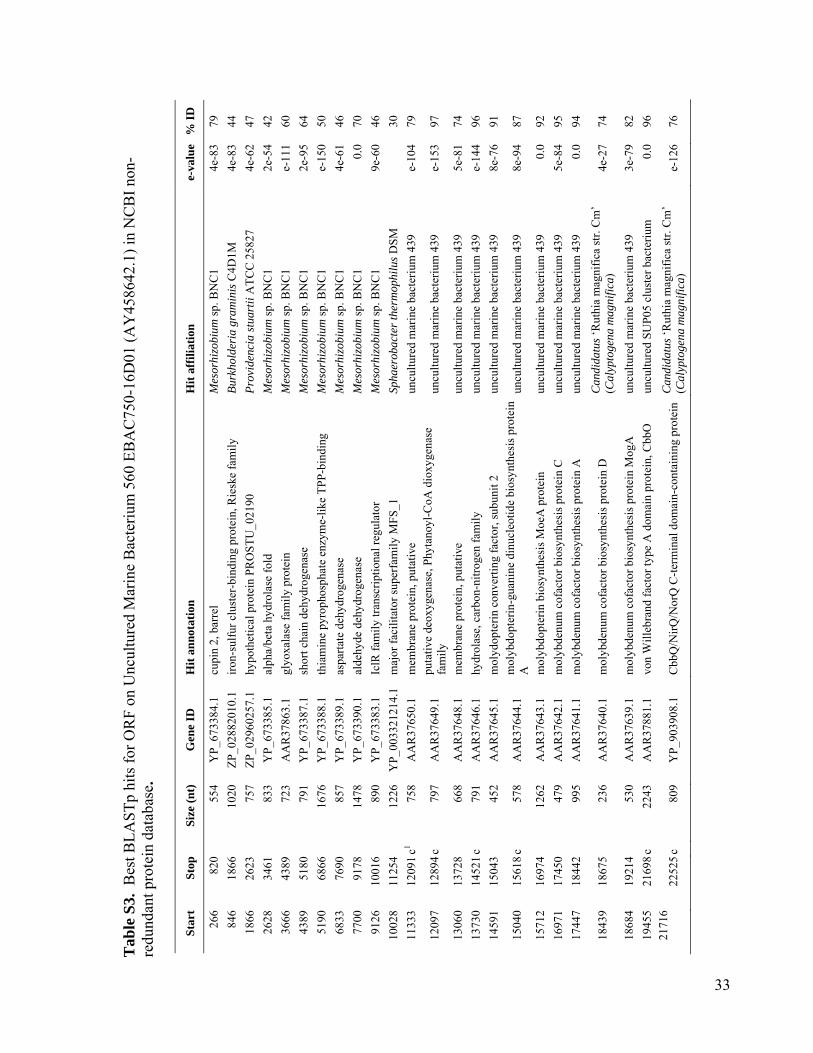
T
able
S3.
Bes
t BL
AS
Tp
hits
for
OR
F o
n U
ncul
ture
d M
arin
e B
acte
rium
560
EB
AC
750-
16D
01 (
AY
4586
42.1
) in
NC
BI
non-
redu
ndan
t pro
tein
dat
abas
e.
Sta
rt
Sto
p
Siz
e (n
t)
Gen
e ID
H
it a
nn
otat
ion
H
it a
ffil
iati
on
e-va
lue
% I
D
266
820
55
4 Y
P_6
7338
4.1
cupi
n 2,
bar
rel
Mes
orhi
zobi
um s
p. B
NC
1 4e
-83
79
846
1866
10
20
ZP
_028
8201
0.1
iron
-sul
fur
clus
ter-
bind
ing
prot
ein,
Rie
ske
fam
ily
Bur
khol
deri
a gr
amin
is C
4D1M
4e
-83
44
1866
26
23
757
ZP
_029
6025
7.1
hypo
thet
ical
pro
tein
PR
OS
TU
_021
90
Pro
vide
ncia
stu
arti
i AT
CC
258
27
4e-6
247
2628
34
61
833
YP
_673
385.
1 al
pha/
beta
hyd
rola
se f
old
Mes
orhi
zobi
um s
p. B
NC
1 2e
-54
42
3666
43
89
723
AA
R37
863.
1 gl
yoxa
lase
fam
ily
prot
ein
Mes
orhi
zobi
um s
p. B
NC
1 e-
111
60
4389
51
80
791
YP
_673
387.
1 sh
ort c
hain
deh
ydro
gena
se
Mes
orhi
zobi
um s
p. B
NC
1 2e
-95
64
5190
68
66
1676
Y
P_6
7338
8.1
thia
min
e py
roph
osph
ate
enzy
me-
like
TP
P-b
indi
ng
Mes
orhi
zobi
um s
p. B
NC
1 e-
150
50
6833
76
90
857
YP
_673
389.
1 as
part
ate
dehy
drog
enas
e M
esor
hizo
bium
sp.
BN
C1
4e-6
146
7700
91
78
1478
Y
P_6
7339
0.1
alde
hyde
deh
ydro
gena
se
Mes
orhi
zobi
um s
p. B
NC
1 0.
070
9126
10
016
89
0 Y
P_6
7338
3.1
IclR
fam
ily
tran
scri
ptio
nal r
egul
ator
M
esor
hizo
bium
sp.
BN
C1
9e-6
046
1002
8 11
254
12
26
YP
_003
3212
14.1
m
ajor
fac
ilita
tor
supe
rfam
ily
MF
S_1
Sp
haer
obac
ter
ther
mop
hilu
s D
SM
30
1133
3 12
091
c1 75
8 A
AR
3765
0.1
mem
bran
e pr
otei
n, p
utat
ive
uncu
ltur
ed m
arin
e ba
cter
ium
439
e-
104
79
1209
7 12
894
c 79
7 A
AR
3764
9.1
puta
tive
deo
xyge
nase
, Phy
tano
yl-C
oA d
ioxy
gena
se
fam
ily
uncu
ltur
ed m
arin
e ba
cter
ium
439
e-
153
97
1306
0 13
728
66
8 A
AR
3764
8.1
mem
bran
e pr
otei
n, p
utat
ive
uncu
ltur
ed m
arin
e ba
cter
ium
439
5e
-81
74
1373
0 14
521
c 79
1 A
AR
3764
6.1
hydr
olas
e, c
arbo
n-ni
trog
en f
amil
y un
cult
ured
mar
ine
bact
eriu
m 4
39
e-14
496
1459
1 15
043
45
2 A
AR
3764
5.1
mol
ydop
teri
n co
nver
ting
fac
tor,
sub
unit
2
uncu
ltur
ed m
arin
e ba
cter
ium
439
8e
-76
91
1504
0 15
618
c 57
8 A
AR
3764
4.1
mol
ybdo
pter
in-g
uani
ne d
inuc
leot
ide
bios
ynth
esis
pro
tein
A
un
cult
ured
mar
ine
bact
eriu
m 4
39
8e-9
487
1571
2 16
974
12
62
AA
R37
643.
1 m
olyb
dopt
erin
bio
synt
hesi
s M
oeA
pro
tein
un
cult
ured
mar
ine
bact
eriu
m 4
39
0.0
92
1697
1 17
450
47
9 A
AR
3764
2.1
mol
ybde
num
cof
acto
r bi
osyn
thes
is p
rote
in C
un
cult
ured
mar
ine
bact
eriu
m 4
39
5e-8
495
1744
7 18
442
99
5 A
AR
3764
1.1
mol
ybde
num
cof
acto
r bi
osyn
thes
is p
rote
in A
un
cult
ured
mar
ine
bact
eriu
m 4
39
0.0
94
1843
9 18
675
23
6 A
AR
3764
0.1
mol
ybde
num
cof
acto
r bi
osyn
thes
is p
rote
in D
C
andi
datu
s ‘R
uthi
a m
agni
fica
str
. Cm
’ (C
alyp
toge
na m
agni
fica
) 4e
-27
74
1868
4 19
214
53
0 A
AR
3763
9.1
mol
ybde
num
cof
acto
r bi
osyn
thes
is p
rote
in M
ogA
un
cult
ured
mar
ine
bact
eriu
m 4
39
3e-7
982
1945
5 21
698
c 22
43
AA
R37
881.
1 vo
n W
ille
bran
d fa
ctor
type
A d
omai
n pr
otei
n, C
bbO
un
cult
ured
SU
P05
clu
ster
bac
teri
um
0.0
96
2171
6 22
525
c 80
9 Y
P_9
0390
8.1
Cbb
Q/N
irQ
/Nor
Q C
-ter
min
al d
omai
n-co
ntai
ning
pro
tein
C
andi
datu
s ‘R
uthi
a m
agni
fica
str
. Cm
’ (C
alyp
toge
na m
agni
fica
) e-
126
76
33
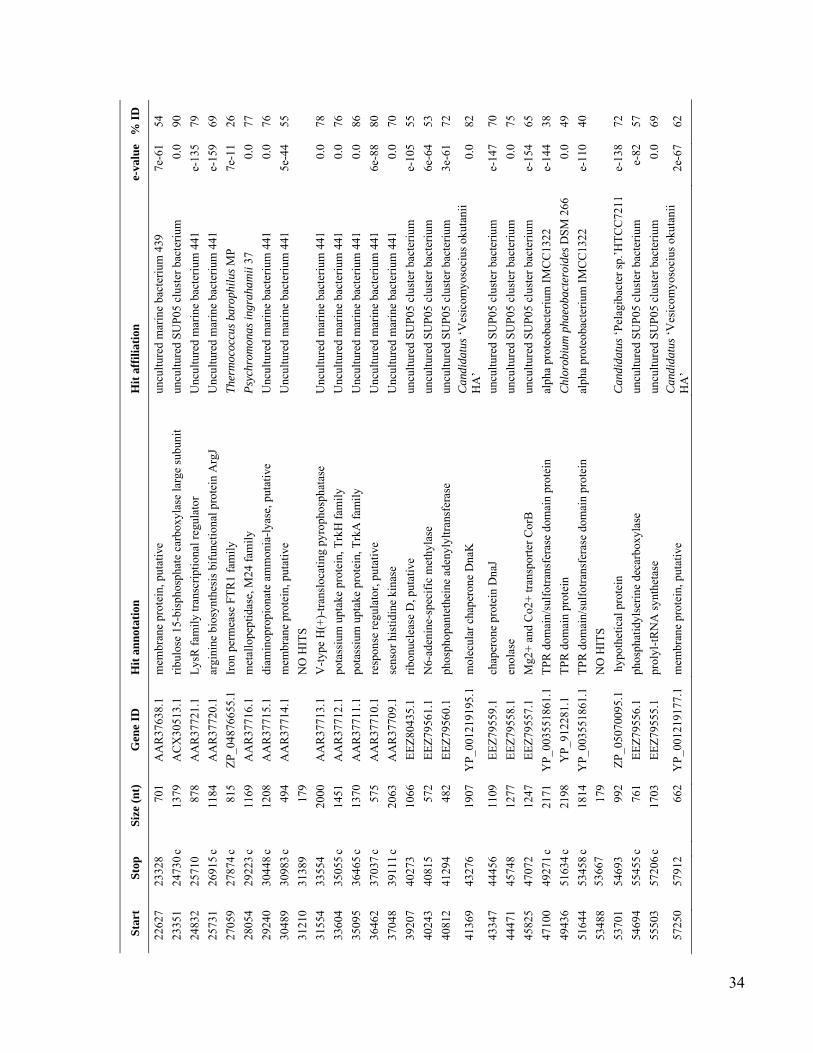
Sta
rt
Sto
p
Siz
e (n
t)
Gen
e ID
H
it a
nn
otat
ion
H
it a
ffil
iati
on
e-va
lue
% I
D
2262
7 23
328
70
1 A
AR
3763
8.1
mem
bran
e pr
otei
n, p
utat
ive
uncu
ltur
ed m
arin
e ba
cter
ium
439
7e
-61
54
2335
1 24
730
c 13
79
AC
X30
513.
1 ri
bulo
se 1
5-bi
spho
spha
te c
arbo
xyla
se la
rge
subu
nit
uncu
ltur
ed S
UP
05 c
lust
er b
acte
rium
0.
090
2483
2 25
710
87
8 A
AR
3772
1.1
Lys
R f
amil
y tr
ansc
ript
iona
l reg
ulat
or
Unc
ultu
red
mar
ine
bact
eriu
m 4
41
e-13
579
2573
1 26
915
c 11
84
AA
R37
720.
1 ar
gini
ne b
iosy
nthe
sis
bifu
ncti
onal
pro
tein
Arg
J U
ncul
ture
d m
arin
e ba
cter
ium
441
e-
159
69
2705
9 27
874
c 81
5 Z
P_0
4876
655.
1 Ir
on p
erm
ease
FT
R1
fam
ily
Th
erm
ococ
cus
baro
phil
us M
P
7e-1
126
2805
4 29
223
c 11
69
AA
R37
716.
1 m
etal
lope
ptid
ase,
M24
fam
ily
Psy
chro
mon
as in
grah
amii
37
0.0
77
2924
0 30
448
c 12
08
AA
R37
715.
1 di
amin
opro
pion
ate
amm
onia
-lya
se, p
utat
ive
Unc
ultu
red
mar
ine
bact
eriu
m 4
41
0.0
76
3048
9 30
983
c 49
4 A
AR
3771
4.1
mem
bran
e pr
otei
n, p
utat
ive
Unc
ultu
red
mar
ine
bact
eriu
m 4
41
5e-4
455
3121
0 31
389
17
9
NO
HIT
S
3155
4 33
554
20
00
AA
R37
713.
1 V
-typ
e H
(+)-
tran
sloc
atin
g py
roph
osph
atas
e U
ncul
ture
d m
arin
e ba
cter
ium
441
0.
078
3360
4 35
055
c 14
51
AA
R37
712.
1 po
tass
ium
upt
ake
prot
ein,
Trk
H f
amil
y U
ncul
ture
d m
arin
e ba
cter
ium
441
0.
076
3509
5 36
465
c 13
70
AA
R37
711.
1 po
tass
ium
upt
ake
prot
ein,
Trk
A f
amil
y U
ncul
ture
d m
arin
e ba
cter
ium
441
0.
086
3646
2 37
037
c 57
5 A
AR
3771
0.1
resp
onse
reg
ulat
or, p
utat
ive
U
ncul
ture
d m
arin
e ba
cter
ium
441
6e
-88
80
3704
8 39
111
c 20
63
AA
R37
709.
1 se
nsor
his
tidi
ne k
inas
e U
ncul
ture
d m
arin
e ba
cter
ium
441
0.
070
3920
7 40
273
10
66
EE
Z80
435.
1 ri
bonu
clea
se D
, put
ativ
e un
cult
ured
SU
P05
clu
ster
bac
teri
um
e-10
555
4024
3 40
815
57
2 E
EZ
7956
1.1
N6-
aden
ine-
spec
ific
met
hyla
se
uncu
ltur
ed S
UP
05 c
lust
er b
acte
rium
6e
-64
53
4081
2 41
294
48
2 E
EZ
7956
0.1
phos
phop
ante
thei
ne a
deny
lyltr
ansf
eras
e un
cult
ured
SU
P05
clu
ster
bac
teri
um
3e-6
172
4136
9 43
276
19
07
YP
_001
2191
95.1
m
olec
ular
cha
pero
ne D
naK
C
andi
datu
s ‘V
esic
omyo
soci
us o
kuta
nii
HA
’ 0.
082
4334
7 44
456
11
09
EE
Z79
559.
1 ch
aper
one
prot
ein
Dna
J un
cult
ured
SU
P05
clu
ster
bac
teri
um
e-14
770
4447
1 45
748
12
77
EE
Z79
558.
1 en
olas
e un
cult
ured
SU
P05
clu
ster
bac
teri
um
0.0
75
4582
5 47
072
12
47
EE
Z79
557.
1 M
g2+
and
Co2
+ tr
ansp
orte
r C
orB
un
cult
ured
SU
P05
clu
ster
bac
teri
um
e-15
465
4710
0 49
271
c 21
71
YP
_003
5518
61.1
T
PR
dom
ain/
sulf
otra
nsfe
rase
dom
ain
prot
ein
alph
a pr
oteo
bact
eriu
m I
MC
C13
22
e-14
438
4943
6 51
634
c 21
98
YP
_912
281.
1 T
PR
dom
ain
prot
ein
Chl
orob
ium
pha
eoba
cter
oide
s D
SM 2
66
0.0
49
5164
4 53
458
c 18
14
YP
_003
5518
61.1
T
PR
dom
ain/
sulf
otra
nsfe
rase
dom
ain
prot
ein
alph
a pr
oteo
bact
eriu
m I
MC
C13
22
e-11
040
5348
8 53
667
17
9
NO
HIT
S
5370
1 54
693
99
2 Z
P_0
5070
095.
1 h
ypot
heti
cal p
rote
in
Can
dida
tus
‘Pel
agib
acte
r sp
.’H
TC
C72
11
e-13
872
5469
4 55
455
c 76
1 E
EZ
7955
6.1
phos
phat
idyl
seri
ne d
ecar
boxy
lase
un
cult
ured
SU
P05
clu
ster
bac
teri
um
e-82
57
5550
3 57
206
c 17
03
EE
Z79
555.
1 pr
olyl
-tR
NA
syn
thet
ase
uncu
ltur
ed S
UP
05 c
lust
er b
acte
rium
0.
069
5725
0 57
912
66
2 Y
P_0
0121
9177
.1
mem
bran
e pr
otei
n, p
utat
ive
Can
dida
tus
‘Ves
icom
yoso
cius
oku
tani
i H
A’
2e-6
762
34
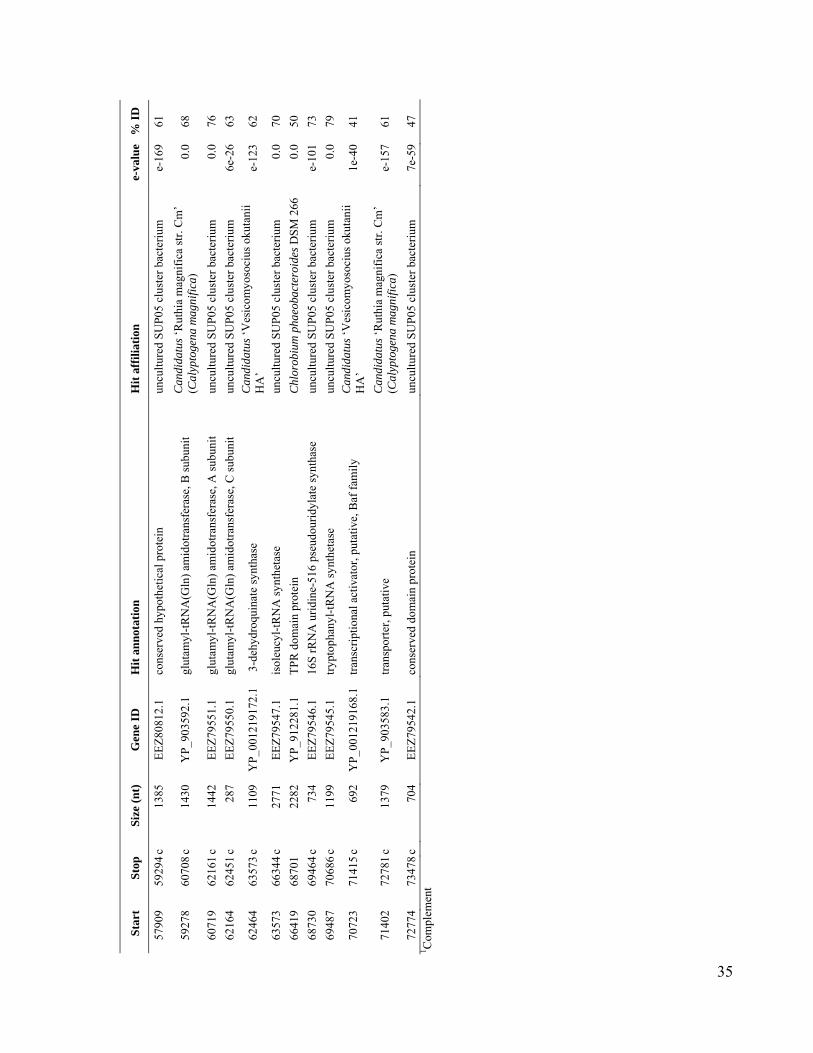
Sta
rt
Sto
p
Siz
e (n
t)
Gen
e ID
H
it a
nn
otat
ion
H
it a
ffil
iati
on
e-va
lue
% I
D
5790
9 59
294
c 13
85
EE
Z80
812.
1 co
nser
ved
hypo
thet
ical
pro
tein
un
cult
ured
SU
P05
clu
ster
bac
teri
um
e-16
961
5927
8 60
708
c 14
30
YP
_903
592.
1 gl
utam
yl-t
RN
A(G
ln)
amid
otra
nsfe
rase
, B s
ubun
it
Can
dida
tus
‘Rut
hia
mag
nifi
ca s
tr. C
m’
(Cal
ypto
gena
mag
nifi
ca)
0.0
68
6071
9 62
161
c 14
42
EE
Z79
551.
1 gl
utam
yl-t
RN
A(G
ln)
amid
otra
nsfe
rase
, A s
ubun
it un
cult
ured
SU
P05
clu
ster
bac
teri
um
0.0
76
6216
4 62
451
c 28
7 E
EZ
7955
0.1
glut
amyl
-tR
NA
(Gln
) am
idot
rans
fera
se, C
sub
unit
uncu
ltur
ed S
UP
05 c
lust
er b
acte
rium
6e
-26
63
6246
4 63
573
c 11
09
YP
_001
2191
72.1
3
-deh
ydro
quin
ate
synt
hase
C
andi
datu
s ‘V
esic
omyo
soci
us o
kuta
nii
HA
’ e-
123
62
6357
3 66
344
c 27
71
EE
Z79
547.
1 is
oleu
cyl-
tRN
A s
ynth
etas
e un
cult
ured
SU
P05
clu
ster
bac
teri
um
0.0
70
6641
9 68
701
22
82
YP
_912
281.
1 T
PR
dom
ain
prot
ein
Chl
orob
ium
pha
eoba
cter
oide
s D
SM 2
66
0.0
50
6873
0 69
464
c 73
4 E
EZ
7954
6.1
16S
rR
NA
uri
dine
-516
pse
udou
ridy
late
syn
thas
e un
cult
ured
SU
P05
clu
ster
bac
teri
um
e-10
173
6948
7 70
686
c 11
99
EE
Z79
545.
1 tr
ypto
phan
yl-t
RN
A s
ynth
etas
e un
cult
ured
SU
P05
clu
ster
bac
teri
um
0.0
79
7072
3 71
415
c 69
2 Y
P_0
0121
9168
.1
tran
scri
ptio
nal a
ctiv
ator
, put
ativ
e, B
af f
amil
y C
andi
datu
s ‘V
esic
omyo
soci
us o
kuta
nii
HA
’ 1e
-40
41
7140
2 72
781
c 13
79
YP
_903
583.
1 tr
ansp
orte
r, p
utat
ive
Can
dida
tus
‘Rut
hia
mag
nifi
ca s
tr. C
m’
(Cal
ypto
gena
mag
nifi
ca)
e-15
761
7277
4 73
478
c 70
4 E
EZ
7954
2.1
cons
erve
d do
mai
n pr
otei
n un
cult
ured
SU
P05
clu
ster
bac
teri
um
7e-5
947
1 C
ompl
emen
t
35
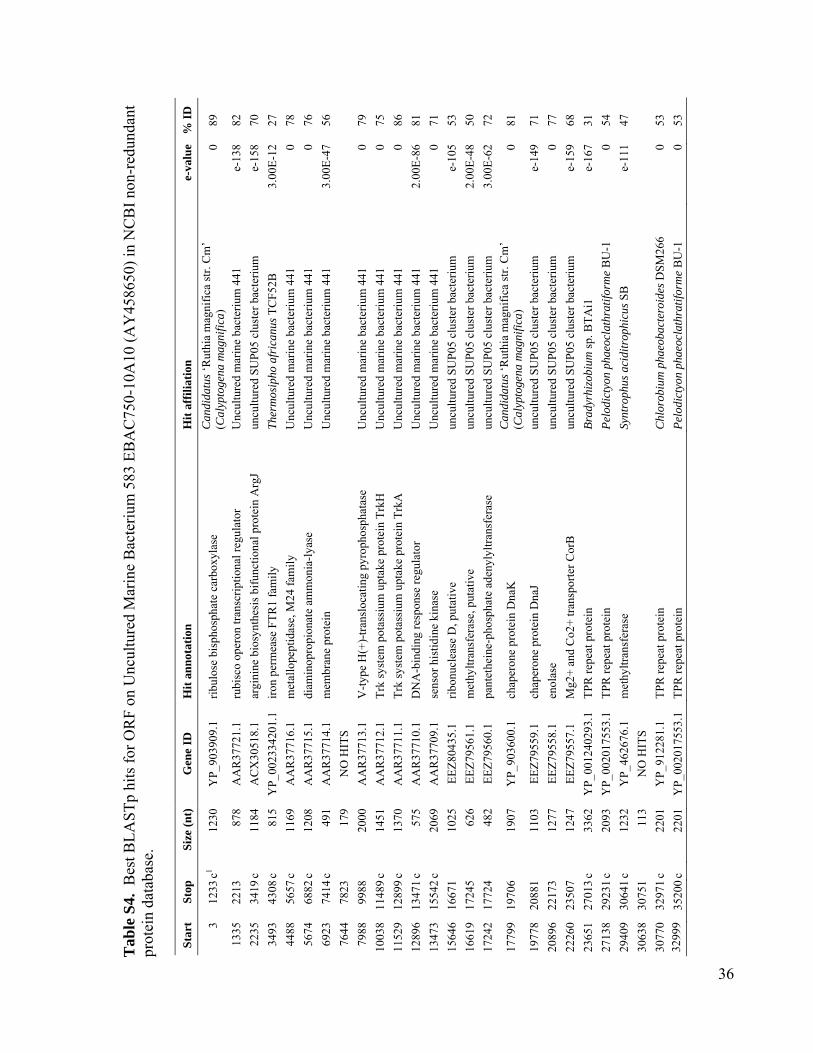
T
able
S4.
Bes
t BL
AS
Tp
hits
for
OR
F o
n U
ncul
ture
d M
arin
e B
acte
rium
583
EB
AC
750-
10A
10 (
AY
4586
50)
in N
CB
I no
n-re
dund
ant
prot
ein
data
base
.
Sta
rt
Sto
p
Siz
e (n
t)
Gen
e ID
H
it a
nn
otat
ion
H
it a
ffil
iati
on
e-va
lue
% I
D
3 12
33 c
1 12
30
YP
_903
909.
1 ri
bulo
se b
isph
osph
ate
carb
oxyl
ase
Can
dida
tus
‘Rut
hia
mag
nifi
ca s
tr. C
m’
(Cal
ypto
gena
mag
nifi
ca)
089
1335
22
13
878
AA
R37
721.
1 ru
bisc
o op
eron
tran
scri
ptio
nal r
egul
ator
U
ncul
ture
d m
arin
e ba
cter
ium
441
e-
138
82
2235
34
19 c
11
84
AC
X30
518.
1 ar
gini
ne b
iosy
nthe
sis
bifu
ncti
onal
pro
tein
Arg
J un
cult
ured
SU
P05
clu
ster
bac
teri
um
e-15
870
3493
43
08 c
81
5 Y
P_0
0233
4201
.1
iron
per
mea
se F
TR
1 fa
mil
y T
herm
osip
ho a
fric
anus
TC
F52
B
3.00
E-1
227
4488
56
57 c
11
69
AA
R37
716.
1 m
etal
lope
ptid
ase,
M24
fam
ily
Unc
ultu
red
mar
ine
bact
eriu
m 4
41
078
5674
68
82 c
12
08
AA
R37
715.
1 di
amin
opro
pion
ate
amm
onia
-lya
se
Unc
ultu
red
mar
ine
bact
eriu
m 4
41
076
6923
74
14 c
49
1 A
AR
3771
4.1
mem
bran
e pr
otei
n U
ncul
ture
d m
arin
e ba
cter
ium
441
3.
00E
-47
56
7644
78
23
179
NO
HIT
S
7988
99
88
2000
A
AR
3771
3.1
V-t
ype
H(+
)-tr
ansl
ocat
ing
pyro
phos
phat
ase
Unc
ultu
red
mar
ine
bact
eriu
m 4
41
079
1003
8 11
489
c 14
51
AA
R37
712.
1 T
rk s
yste
m p
otas
sium
upt
ake
prot
ein
Trk
H
Unc
ultu
red
mar
ine
bact
eriu
m 4
41
075
1152
9 12
899
c 13
70
AA
R37
711.
1 T
rk s
yste
m p
otas
sium
upt
ake
prot
ein
Trk
A
Unc
ultu
red
mar
ine
bact
eriu
m 4
41
086
1289
6 13
471
c 57
5 A
AR
3771
0.1
DN
A-b
indi
ng r
espo
nse
regu
lato
r U
ncul
ture
d m
arin
e ba
cter
ium
441
2.
00E
-86
81
1347
3 15
542
c 20
69
AA
R37
709.
1 se
nsor
his
tidi
ne k
inas
e U
ncul
ture
d m
arin
e ba
cter
ium
441
0
71
1564
6 16
671
10
25
EE
Z80
435.
1 ri
bonu
clea
se D
, put
ativ
e un
cult
ured
SU
P05
clu
ster
bac
teri
um
e-10
553
1661
9 17
245
62
6 E
EZ
7956
1.1
met
hyltr
ansf
eras
e, p
utat
ive
uncu
ltur
ed S
UP
05 c
lust
er b
acte
rium
2.
00E
-48
50
1724
2 17
724
48
2 E
EZ
7956
0.1
pant
ethe
ine-
phos
phat
e ad
enyl
yltr
ansf
eras
e un
cult
ured
SU
P05
clu
ster
bac
teri
um
3.00
E-6
272
1779
9 19
706
19
07
YP
_903
600.
1 ch
aper
one
prot
ein
Dna
K
Can
dida
tus
‘Rut
hia
mag
nifi
ca s
tr. C
m’
(Cal
ypto
gena
mag
nifi
ca)
081
1977
8 20
881
11
03
EE
Z79
559.
1 ch
aper
one
prot
ein
Dna
J un
cult
ured
SU
P05
clu
ster
bac
teri
um
e-14
971
2089
6 22
173
12
77
EE
Z79
558.
1 en
olas
e un
cult
ured
SU
P05
clu
ster
bac
teri
um
077
2226
0 23
507
12
47
EE
Z79
557.
1 M
g2+
and
Co2
+ tr
ansp
orte
r C
orB
un
cult
ured
SU
P05
clu
ster
bac
teri
um
e-15
968
2365
1 27
013
c 33
62
YP
_001
2402
93.1
T
PR
rep
eat p
rote
in
Bra
dyrh
izob
ium
sp.
BT
Ai1
e-
167
31
2713
8 29
231
c 20
93
YP
_002
0175
53.1
T
PR
rep
eat p
rote
in
Pel
odic
tyon
pha
eocl
athr
atif
orm
e B
U-1
0
54
2940
9 30
641
c 12
32
YP
_462
676.
1 m
ethy
ltran
sfer
ase
Synt
roph
us a
cidi
trop
hicu
s S
B
e-11
147
3063
8 30
751
11
3 N
O H
ITS
3077
0 32
971
c 22
01
YP
_912
281.
1 T
PR
rep
eat p
rote
in
Chl
orob
ium
pha
eoba
cter
oide
s D
SM26
6 0
53
3299
9 35
200
c 22
01
YP
_002
0175
53.1
T
PR
rep
eat p
rote
in
Pel
odic
tyon
pha
eocl
athr
atif
orm
e B
U-1
0
53
36
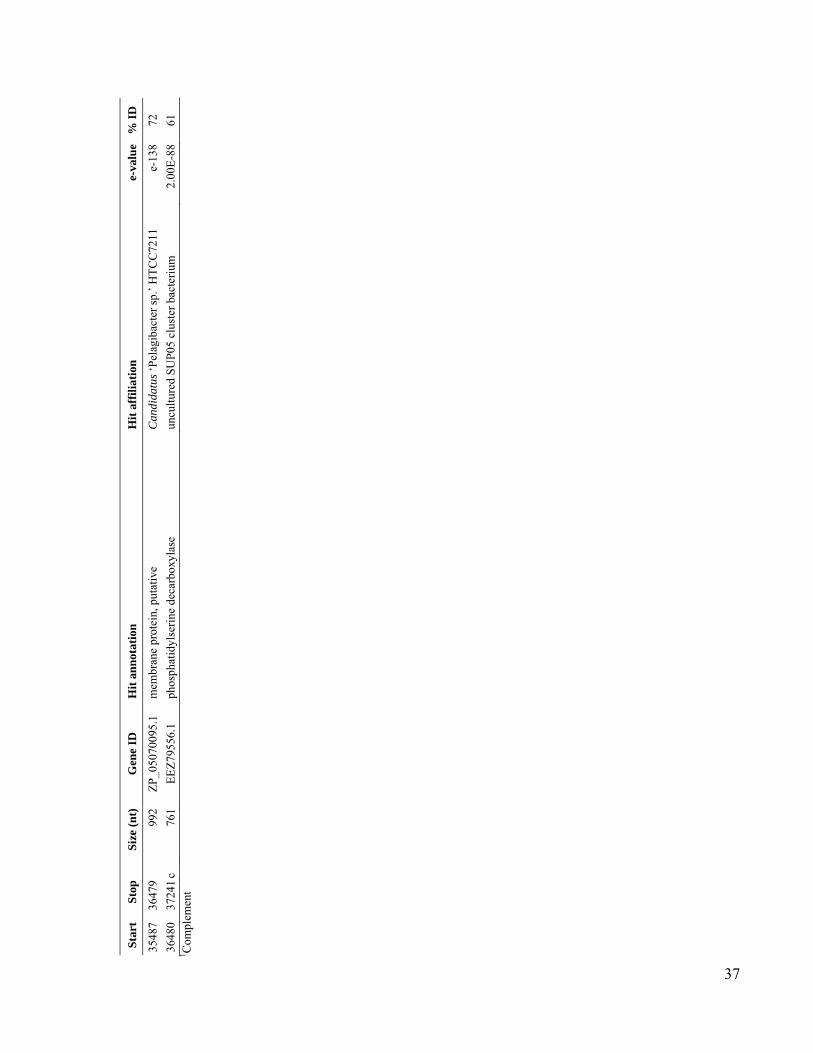
Sta
rt
Sto
p
Siz
e (n
t)
Gen
e ID
H
it a
nn
otat
ion
H
it a
ffil
iati
on
e-va
lue
% I
D
3548
7 36
479
99
2 Z
P_0
5070
095.
1 m
embr
ane
prot
ein,
put
ativ
e C
andi
datu
s ‘P
elag
ibac
ter
sp.’
HT
CC
7211
e-
138
72
3648
0 37
241
c 76
1 E
EZ
7955
6.1
phos
phat
idyl
seri
ne d
ecar
boxy
lase
un
cult
ured
SU
P05
clu
ster
bac
teri
um
2.00
E-8
861
1 C
ompl
emen
t
37
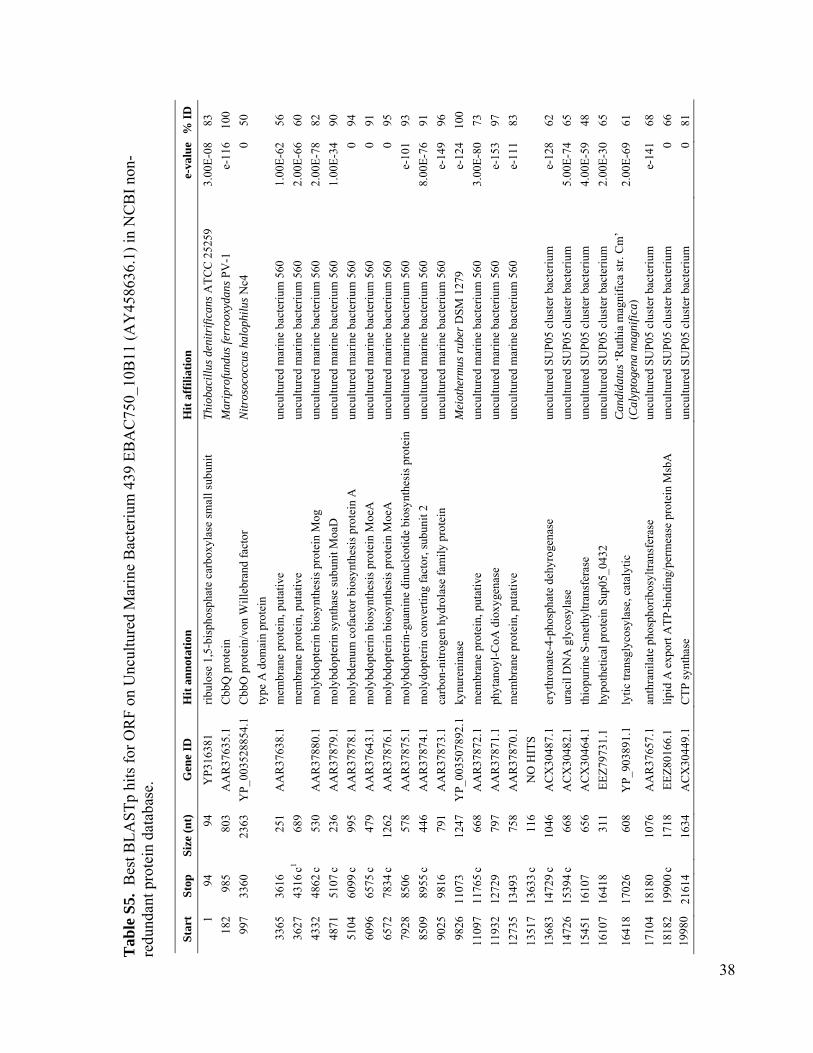
T
able
S5.
Bes
t BL
AS
Tp
hits
for
OR
F o
n U
ncul
ture
d M
arin
e B
acte
rium
439
EB
AC
750_
10B
11 (
AY
4586
36.1
) in
NC
BI
non-
redu
ndan
t pro
tein
dat
abas
e.
S
tart
S
top
S
ize
(nt)
G
ene
ID
Hit
an
not
atio
n
Hit
aff
ilia
tion
e-
valu
e%
ID
1 94
94
Y
P31
6381
ri
bulo
se 1
,5-b
isph
osph
ate
carb
oxyl
ase
smal
l sub
unit
T
hiob
acil
lus
deni
trif
ican
s A
TC
C 2
5259
3.
00E
-08
83
182
985
80
3 A
AR
3763
5.1
Cbb
Q p
rote
in
Mar
ipro
fund
us fe
rroo
xyda
ns P
V-1
e-
116
100
997
3360
23
63
YP
_003
5288
54.1
C
bbO
pro
tein
/von
Wil
lebr
and
fact
or
Nit
roso
cocc
us h
alop
hilu
s N
c4
050
type
A d
omai
n pr
otei
n
3365
36
16
251
AA
R37
638.
1 m
embr
ane
prot
ein,
put
ativ
e un
cult
ured
mar
ine
bact
eriu
m 5
60
1.00
E-6
256
3627
43
16 c
1 68
9
mem
bran
e pr
otei
n, p
utat
ive
uncu
ltur
ed m
arin
e ba
cter
ium
560
2.
00E
-66
60
4332
48
62 c
53
0 A
AR
3788
0.1
mol
ybdo
pter
in b
iosy
nthe
sis
prot
ein
Mog
un
cult
ured
mar
ine
bact
eriu
m 5
60
2.00
E-7
882
4871
51
07 c
23
6 A
AR
3787
9.1
mol
ybdo
pter
in s
ynth
ase
subu
nit M
oaD
un
cult
ured
mar
ine
bact
eriu
m 5
60
1.00
E-3
490
5104
60
99 c
99
5 A
AR
3787
8.1
mol
ybde
num
cof
acto
r bi
osyn
thes
is p
rote
in A
un
cult
ured
mar
ine
bact
eriu
m 5
60
094
6096
65
75 c
47
9 A
AR
3764
3.1
mol
ybdo
pter
in b
iosy
nthe
sis
prot
ein
Moe
A
uncu
ltur
ed m
arin
e ba
cter
ium
560
0
91
6572
78
34 c
12
62
AA
R37
876.
1 m
olyb
dopt
erin
bio
synt
hesi
s pr
otei
n M
oeA
un
cult
ured
mar
ine
bact
eriu
m 5
60
095
7928
85
06
578
AA
R37
875.
1 m
olyb
dopt
erin
-gua
nine
din
ucle
otid
e bi
osyn
thes
is p
rote
in
uncu
ltur
ed m
arin
e ba
cter
ium
560
e-
101
93
8509
89
55 c
44
6 A
AR
3787
4.1
mol
ydop
teri
n co
nver
ting
fac
tor,
sub
unit
2
uncu
ltur
ed m
arin
e ba
cter
ium
560
8.
00E
-76
91
9025
98
16
791
AA
R37
873.
1 ca
rbon
-nit
roge
n hy
drol
ase
fam
ily
prot
ein
uncu
ltur
ed m
arin
e ba
cter
ium
560
e-
149
96
9826
11
073
12
47
YP
_003
5078
92.1
ky
nure
nina
se
Mei
othe
rmus
rub
er D
SM
127
9 e-
124
100
1109
7 11
765
c 66
8 A
AR
3787
2.1
mem
bran
e pr
otei
n, p
utat
ive
uncu
ltur
ed m
arin
e ba
cter
ium
560
3.
00E
-80
73
1193
2 12
729
79
7 A
AR
3787
1.1
phyt
anoy
l-C
oA d
ioxy
gena
se
uncu
ltur
ed m
arin
e ba
cter
ium
560
e-
153
97
1273
5 13
493
75
8 A
AR
3787
0.1
mem
bran
e pr
otei
n, p
utat
ive
uncu
ltur
ed m
arin
e ba
cter
ium
560
e-
111
83
1351
7 13
633
c 11
6 N
O H
ITS
1368
3 14
729
c 10
46
AC
X30
487.
1 er
ythr
onat
e-4-
phos
phat
e de
hyro
gena
se
uncu
ltur
ed S
UP
05 c
lust
er b
acte
rium
e-
128
62
1472
6 15
394
c 66
8 A
CX
3048
2.1
urac
il D
NA
gly
cosy
lase
un
cult
ured
SU
P05
clu
ster
bac
teri
um
5.00
E-7
465
1545
1 16
107
65
6 A
CX
3046
4.1
thio
puri
ne S
-met
hyltr
ansf
eras
e un
cult
ured
SU
P05
clu
ster
bac
teri
um
4.00
E-5
948
1610
7 16
418
31
1 E
EZ
7973
1.1
hypo
thet
ical
pro
tein
Sup
05_0
432
uncu
ltur
ed S
UP
05 c
lust
er b
acte
rium
2.
00E
-30
65
1641
8 17
026
60
8 Y
P_9
0389
1.1
lyti
c tr
ansg
lyco
syla
se, c
atal
ytic
C
andi
datu
s ‘R
uthi
a m
agni
fica
str
. Cm
’ (C
alyp
toge
na m
agni
fica
) 2.
00E
-69
61
1710
4 18
180
10
76
AA
R37
657.
1 an
thra
nila
te p
hosp
hori
bosy
ltra
nsfe
rase
un
cult
ured
SU
P05
clu
ster
bac
teri
um
e-14
168
1818
2 19
900
c 17
18
EE
Z80
166.
1 li
pid
A e
xpor
t AT
P-b
indi
ng/p
erm
ease
pro
tein
Msb
A
uncu
ltur
ed S
UP
05 c
lust
er b
acte
rium
0
66
1998
0 21
614
16
34
AC
X30
449.
1 C
TP
syn
thas
e un
cult
ured
SU
P05
clu
ster
bac
teri
um
081
38
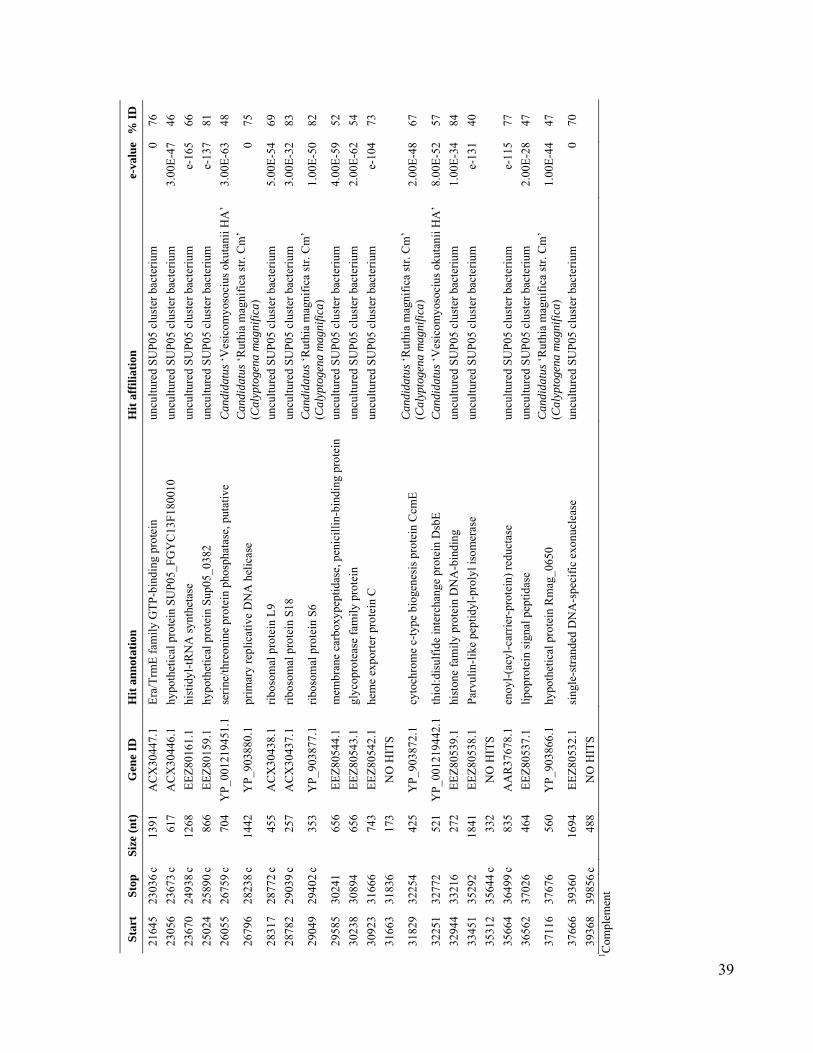
Sta
rt
Sto
p
Siz
e (n
t)
Gen
e ID
H
it a
nn
otat
ion
H
it a
ffil
iati
on
e-va
lue
% I
D
2164
5 23
036
c 13
91
AC
X30
447.
1 E
ra/T
rmE
fam
ily
GT
P-b
indi
ng p
rote
in
uncu
ltur
ed S
UP
05 c
lust
er b
acte
rium
0
76
2305
6 23
673
c 61
7 A
CX
3044
6.1
hypo
thet
ical
pro
tein
SU
P05
_FG
YC
13F
1800
10
uncu
ltur
ed S
UP
05 c
lust
er b
acte
rium
3.
00E
-47
46
2367
0 24
938
c 12
68
EE
Z80
161.
1 hi
stid
yl-t
RN
A s
ynth
etas
e un
cult
ured
SU
P05
clu
ster
bac
teri
um
e-16
566
2502
4 25
890
c 86
6 E
EZ
8015
9.1
hypo
thet
ical
pro
tein
Sup
05_0
382
uncu
ltur
ed S
UP
05 c
lust
er b
acte
rium
e-
137
81
2605
5 26
759
c 70
4 Y
P_0
0121
9451
.1
seri
ne/t
hreo
nine
pro
tein
pho
spha
tase
, put
ativ
e C
andi
datu
s ‘V
esic
omyo
soci
us o
kuta
nii H
A’
3.00
E-6
348
2679
6 28
238
c 14
42
YP
_903
880.
1 pr
imar
y re
plic
ativ
e D
NA
hel
icas
e C
andi
datu
s ‘R
uthi
a m
agni
fica
str
. Cm
’ (C
alyp
toge
na m
agni
fica
) 0
75
2831
7 28
772
c 45
5 A
CX
3043
8.1
ribo
som
al p
rote
in L
9 un
cult
ured
SU
P05
clu
ster
bac
teri
um
5.00
E-5
469
2878
2 29
039
c 25
7 A
CX
3043
7.1
ribo
som
al p
rote
in S
18
uncu
ltur
ed S
UP
05 c
lust
er b
acte
rium
3.
00E
-32
83
2904
9 29
402
c 35
3 Y
P_9
0387
7.1
ribo
som
al p
rote
in S
6 C
andi
datu
s ‘R
uthi
a m
agni
fica
str
. Cm
’ (C
alyp
toge
na m
agni
fica
) 1.
00E
-50
82
2958
5 30
241
65
6 E
EZ
8054
4.1
mem
bran
e ca
rbox
ypep
tida
se, p
enic
illin
-bin
ding
pro
tein
un
cult
ured
SU
P05
clu
ster
bac
teri
um
4.00
E-5
952
3023
8 30
894
65
6 E
EZ
8054
3.1
glyc
opro
teas
e fa
mil
y pr
otei
n un
cult
ured
SU
P05
clu
ster
bac
teri
um
2.00
E-6
254
3092
3 31
666
74
3 E
EZ
8054
2.1
hem
e ex
port
er p
rote
in C
un
cult
ured
SU
P05
clu
ster
bac
teri
um
e-10
473
3166
3 31
836
17
3 N
O H
ITS
3182
9 32
254
42
5 Y
P_9
0387
2.1
cyto
chro
me
c-ty
pe b
ioge
nesi
s pr
otei
n C
cmE
C
andi
datu
s ‘R
uthi
a m
agni
fica
str
. Cm
’ (C
alyp
toge
na m
agni
fica
) 2.
00E
-48
67
3225
1 32
772
52
1 Y
P_0
0121
9442
.1
thio
l:di
sulf
ide
inte
rcha
nge
prot
ein
Dsb
E
Can
dida
tus
‘Ves
icom
yoso
cius
oku
tani
i HA
’ 8.
00E
-52
57
3294
4 33
216
27
2 E
EZ
8053
9.1
hist
one
fam
ily
prot
ein
DN
A-b
indi
ng
uncu
ltur
ed S
UP
05 c
lust
er b
acte
rium
1.
00E
-34
84
3345
1 35
292
18
41
EE
Z80
538.
1 P
arvu
lin-
like
pep
tidy
l-pr
olyl
isom
eras
e un
cult
ured
SU
P05
clu
ster
bac
teri
um
e-13
140
3531
2 35
644
c 33
2 N
O H
ITS
3566
4 36
499
c 83
5 A
AR
3767
8.1
enoy
l-(a
cyl-
carr
ier-
prot
ein)
red
ucta
se
uncu
ltur
ed S
UP
05 c
lust
er b
acte
rium
e-
115
77
3656
2 37
026
46
4 E
EZ
8053
7.1
lipo
prot
ein
sign
al p
epti
dase
un
cult
ured
SU
P05
clu
ster
bac
teri
um
2.00
E-2
847
3711
6 37
676
56
0 Y
P_9
0386
6.1
hypo
thet
ical
pro
tein
Rm
ag_0
650
Can
dida
tus
‘Rut
hia
mag
nifi
ca s
tr. C
m’
(Cal
ypto
gena
mag
nifi
ca)
1.00
E-4
447
3766
6 39
360
16
94
EE
Z80
532.
1 si
ngle
-str
ande
d D
NA
-spe
cifi
c ex
onuc
leas
e un
cult
ured
SU
P05
clu
ster
bac
teri
um
070
3936
8 39
856
c 48
8 N
O H
ITS
1 Com
plem
ent
39
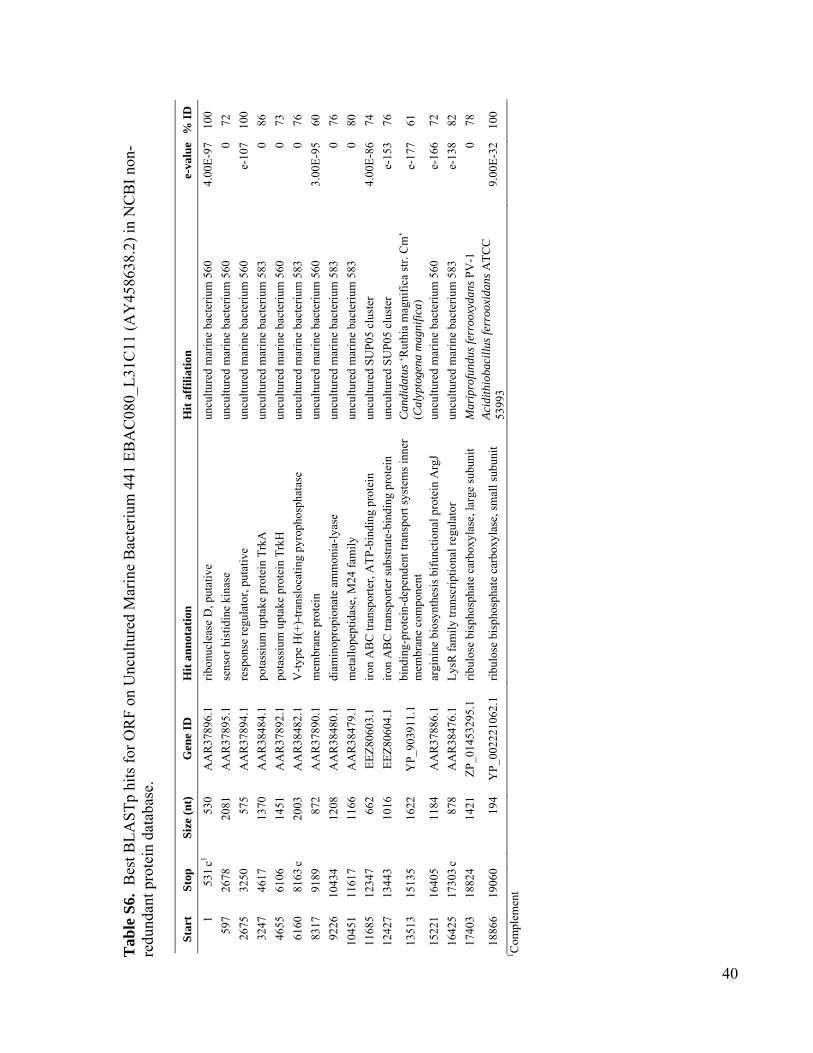
T
able
S6.
Bes
t BL
AS
Tp
hits
for
OR
F o
n U
ncul
ture
d M
arin
e B
acte
rium
441
EB
AC
080_
L31
C11
(A
Y45
8638
.2)
in N
CB
I no
n-re
dund
ant p
rote
in d
atab
ase.
Sta
rt
Sto
p
Siz
e (n
t)
Gen
e ID
H
it a
nn
otat
ion
H
it a
ffil
iati
on
e-va
lue
% I
D
1 53
1 c1
530
AA
R37
896.
1 ri
bonu
clea
se D
, put
ativ
e un
cult
ured
mar
ine
bact
eriu
m 5
60
4.00
E-9
710
0
597
2678
20
81
AA
R37
895.
1 se
nsor
his
tidi
ne k
inas
e un
cult
ured
mar
ine
bact
eriu
m 5
60
072
2675
32
50
575
AA
R37
894.
1 re
spon
se r
egul
ator
, put
ativ
e un
cult
ured
mar
ine
bact
eriu
m 5
60
e-10
710
0
3247
46
17
1370
A
AR
3848
4.1
pota
ssiu
m u
ptak
e pr
otei
n T
rkA
un
cult
ured
mar
ine
bact
eriu
m 5
83
086
4655
61
06
1451
A
AR
3789
2.1
pota
ssiu
m u
ptak
e pr
otei
n T
rkH
un
cult
ured
mar
ine
bact
eriu
m 5
60
073
6160
81
63 c
20
03
AA
R38
482.
1 V
-typ
e H
(+)-
tran
sloc
atin
g py
roph
osph
atas
e un
cult
ured
mar
ine
bact
eriu
m 5
83
076
8317
91
89
872
AA
R37
890.
1 m
embr
ane
prot
ein
uncu
ltur
ed m
arin
e ba
cter
ium
560
3.
00E
-95
60
9226
10
434
12
08
AA
R38
480.
1 di
amin
opro
pion
ate
amm
onia
-lya
se
uncu
ltur
ed m
arin
e ba
cter
ium
583
0
76
1045
1 11
617
11
66
AA
R38
479.
1 m
etal
lope
ptid
ase,
M24
fam
ily
uncu
ltur
ed m
arin
e ba
cter
ium
583
0
80
1168
5 12
347
66
2 E
EZ
8060
3.1
iron
AB
C tr
ansp
orte
r, A
TP
-bin
ding
pro
tein
un
cult
ured
SU
P05
clu
ster
4.
00E
-86
74
1242
7 13
443
10
16
EE
Z80
604.
1 ir
on A
BC
tran
spor
ter
subs
trat
e-bi
ndin
g pr
otei
n un
cult
ured
SU
P05
clu
ster
e-
153
76
1351
3 15
135
16
22
YP
_903
911.
1 bi
ndin
g-pr
otei
n-de
pend
ent t
rans
port
sys
tem
s in
ner
mem
bran
e co
mpo
nent
C
andi
datu
s ‘R
uthi
a m
agni
fica
str
. Cm
’ (C
alyp
toge
na m
agni
fica
) e-
177
61
1522
1 16
405
11
84
AA
R37
886.
1 ar
gini
ne b
iosy
nthe
sis
bifu
ncti
onal
pro
tein
Arg
J
uncu
ltur
ed m
arin
e ba
cter
ium
560
e-
166
72
1642
5 17
303
c 87
8 A
AR
3847
6.1
Lys
R f
amil
y tr
ansc
ript
iona
l reg
ulat
or
uncu
ltur
ed m
arin
e ba
cter
ium
583
e-
138
82
1740
3 18
824
14
21
ZP
_014
5329
5.1
ribu
lose
bis
phos
phat
e ca
rbox
ylas
e, la
rge
subu
nit
Mar
ipro
fund
us fe
rroo
xyda
ns P
V-1
0
78
1886
6 19
060
19
4 Y
P_0
0222
1062
.1
ribu
lose
bis
phos
phat
e ca
rbox
ylas
e, s
mal
l sub
unit
A
cidi
thio
baci
llus
ferr
ooxi
dans
AT
CC
53
993
9.00
E-3
210
0 1 C
ompl
emen
t
40
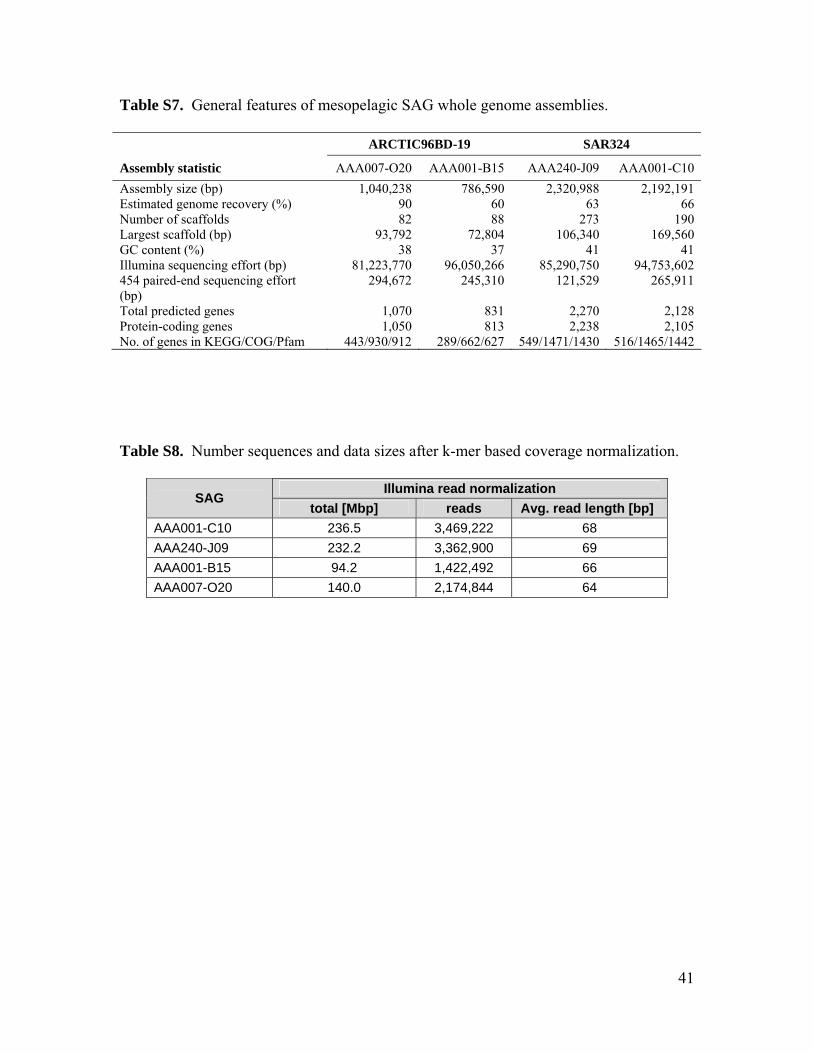
41
Table S7. General features of mesopelagic SAG whole genome assemblies. ARCTIC96BD-19 SAR324
Assembly statistic AAA007-O20 AAA001-B15 AAA240-J09 AAA001-C10
Assembly size (bp) 1,040,238 786,590 2,320,988 2,192,191 Estimated genome recovery (%) 90 60 63 66 Number of scaffolds 82 88 273 190 Largest scaffold (bp) 93,792 72,804 106,340 169,560 GC content (%) 38 37 41 41 Illumina sequencing effort (bp) 81,223,770 96,050,266 85,290,750 94,753,602 454 paired-end sequencing effort (bp)
294,672 245,310 121,529 265,911
Total predicted genes 1,070 831 2,270 2,128 Protein-coding genes 1,050 813 2,238 2,105 No. of genes in KEGG/COG/Pfam 443/930/912 289/662/627 549/1471/1430 516/1465/1442 Table S8. Number sequences and data sizes after k-mer based coverage normalization.
Illumina read normalization SAG
total [Mbp] reads Avg. read length [bp]
AAA001-C10 236.5 3,469,222 68
AAA240-J09 232.2 3,362,900 69
AAA001-B15 94.2 1,422,492 66
AAA007-O20 140.0 2,174,844 64
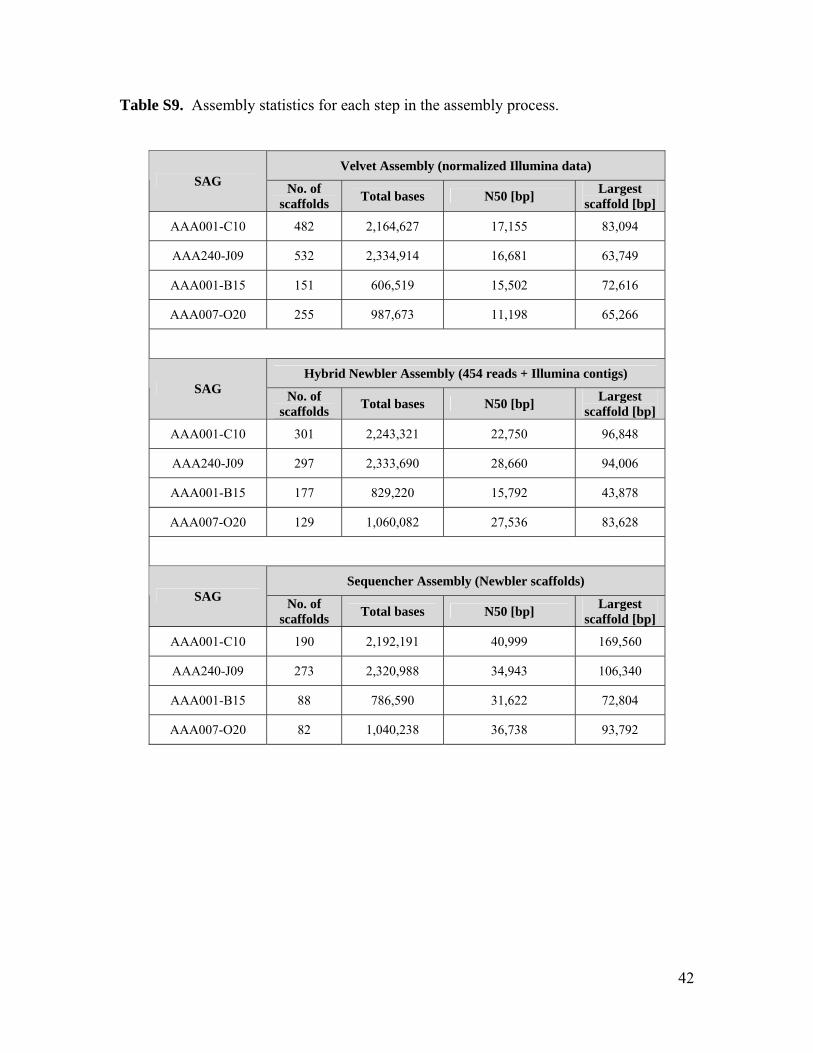
42
Table S9. Assembly statistics for each step in the assembly process.
Velvet Assembly (normalized Illumina data) SAG No. of
scaffolds Total bases N50 [bp]
Largest scaffold [bp]
AAA001-C10 482 2,164,627 17,155 83,094
AAA240-J09 532 2,334,914 16,681 63,749
AAA001-B15 151 606,519 15,502 72,616
AAA007-O20 255 987,673 11,198 65,266
Hybrid Newbler Assembly (454 reads + Illumina contigs) SAG No. of
scaffolds Total bases N50 [bp]
Largest scaffold [bp]
AAA001-C10 301 2,243,321 22,750 96,848
AAA240-J09 297 2,333,690 28,660 94,006
AAA001-B15 177 829,220 15,792 43,878
AAA007-O20 129 1,060,082 27,536 83,628
Sequencher Assembly (Newbler scaffolds) SAG
No. of scaffolds
Total bases N50 [bp] Largest
scaffold [bp]
AAA001-C10 190 2,192,191 40,999 169,560
AAA240-J09 273 2,320,988 34,943 106,340
AAA001-B15 88 786,590 31,622 72,804
AAA007-O20 82 1,040,238 36,738 93,792
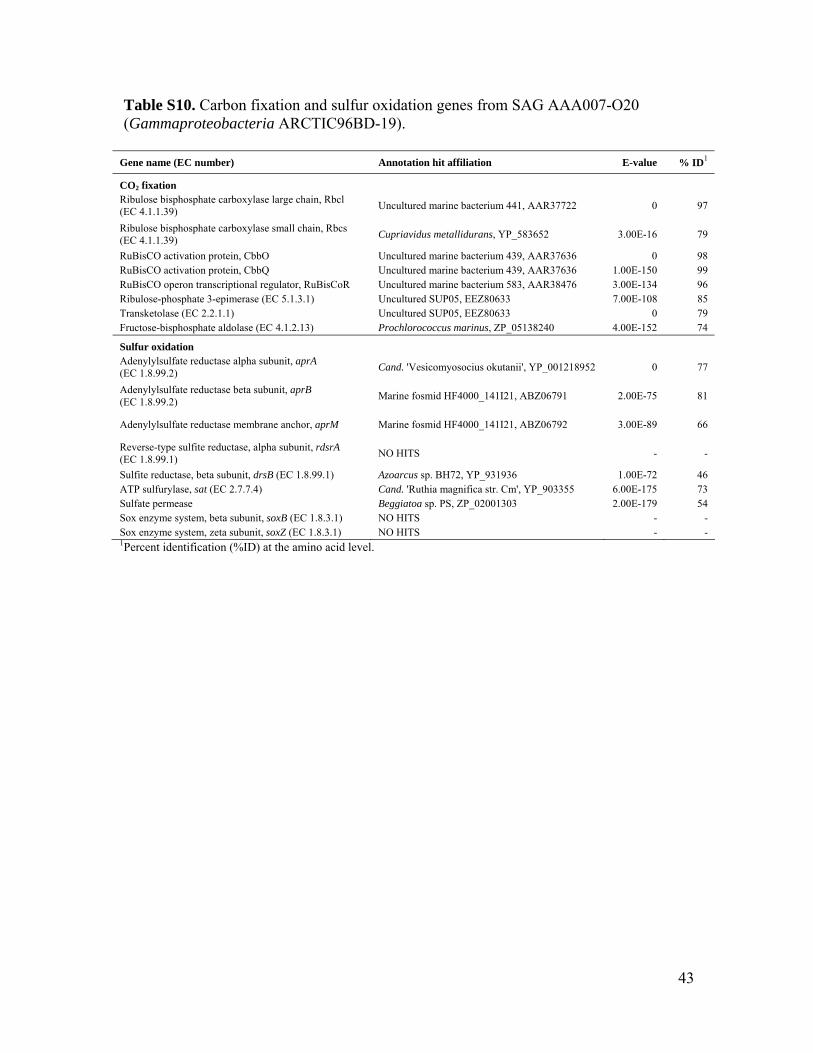
43
Table S10. Carbon fixation and sulfur oxidation genes from SAG AAA007-O20 (Gammaproteobacteria ARCTIC96BD-19). Gene name (EC number) Annotation hit affiliation E-value % ID1
CO2 fixation
Ribulose bisphosphate carboxylase large chain, Rbcl (EC 4.1.1.39)
Uncultured marine bacterium 441, AAR37722 0 97
Ribulose bisphosphate carboxylase small chain, Rbcs (EC 4.1.1.39)
Cupriavidus metallidurans, YP_583652 3.00E-16 79
RuBisCO activation protein, CbbO Uncultured marine bacterium 439, AAR37636 0 98 RuBisCO activation protein, CbbQ Uncultured marine bacterium 439, AAR37636 1.00E-150 99 RuBisCO operon transcriptional regulator, RuBisCoR Uncultured marine bacterium 583, AAR38476 3.00E-134 96 Ribulose-phosphate 3-epimerase (EC 5.1.3.1) Uncultured SUP05, EEZ80633 7.00E-108 85 Transketolase (EC 2.2.1.1) Uncultured SUP05, EEZ80633 0 79 Fructose-bisphosphate aldolase (EC 4.1.2.13) Prochlorococcus marinus, ZP_05138240 4.00E-152 74
Sulfur oxidation
Adenylylsulfate reductase alpha subunit, aprA (EC 1.8.99.2)
Cand. 'Vesicomyosocius okutanii', YP_001218952 0 77
Adenylylsulfate reductase beta subunit, aprB (EC 1.8.99.2)
Marine fosmid HF4000_141I21, ABZ06791 2.00E-75 81
Adenylylsulfate reductase membrane anchor, aprM Marine fosmid HF4000_141I21, ABZ06792 3.00E-89 66
Reverse-type sulfite reductase, alpha subunit, rdsrA (EC 1.8.99.1)
NO HITS - -
Sulfite reductase, beta subunit, drsB (EC 1.8.99.1) Azoarcus sp. BH72, YP_931936 1.00E-72 46 ATP sulfurylase, sat (EC 2.7.7.4) Cand. 'Ruthia magnifica str. Cm', YP_903355 6.00E-175 73 Sulfate permease Beggiatoa sp. PS, ZP_02001303 2.00E-179 54 Sox enzyme system, beta subunit, soxB (EC 1.8.3.1) NO HITS - - Sox enzyme system, zeta subunit, soxZ (EC 1.8.3.1) NO HITS - - 1Percent identification (%ID) at the amino acid level.
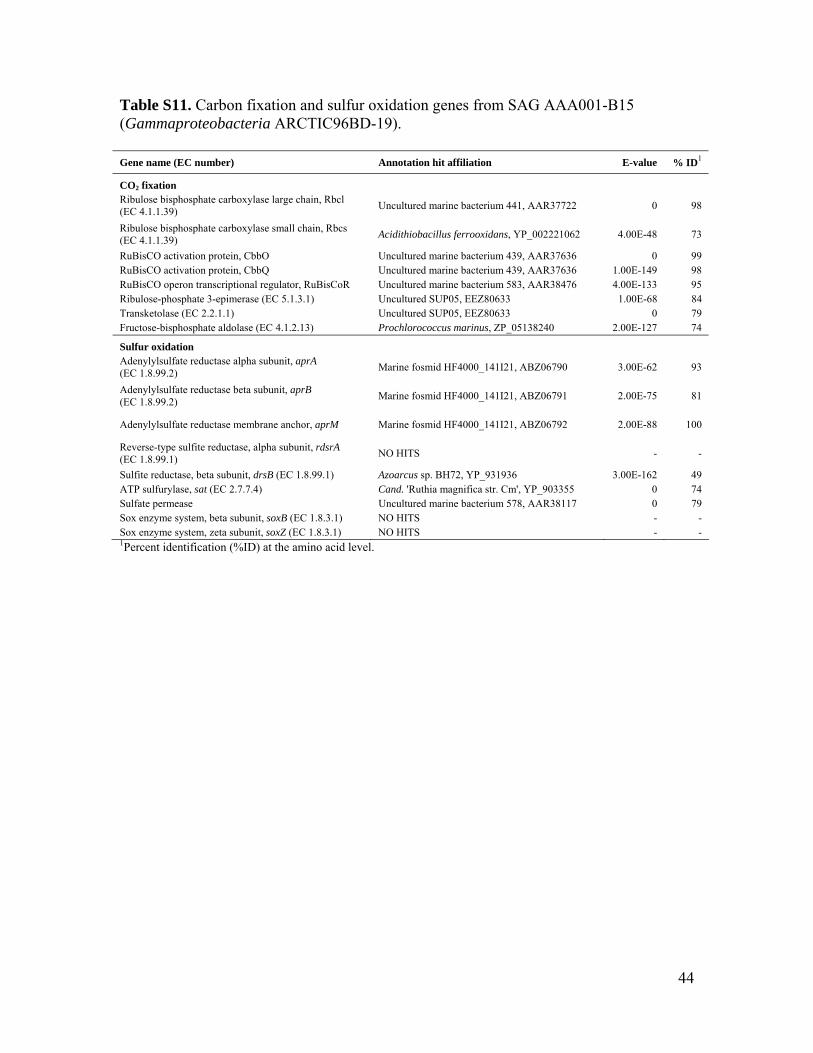
44
Table S11. Carbon fixation and sulfur oxidation genes from SAG AAA001-B15 (Gammaproteobacteria ARCTIC96BD-19). Gene name (EC number) Annotation hit affiliation E-value % ID1
CO2 fixation
Ribulose bisphosphate carboxylase large chain, Rbcl (EC 4.1.1.39)
Uncultured marine bacterium 441, AAR37722 0 98
Ribulose bisphosphate carboxylase small chain, Rbcs (EC 4.1.1.39)
Acidithiobacillus ferrooxidans, YP_002221062 4.00E-48 73
RuBisCO activation protein, CbbO Uncultured marine bacterium 439, AAR37636 0 99 RuBisCO activation protein, CbbQ Uncultured marine bacterium 439, AAR37636 1.00E-149 98 RuBisCO operon transcriptional regulator, RuBisCoR Uncultured marine bacterium 583, AAR38476 4.00E-133 95 Ribulose-phosphate 3-epimerase (EC 5.1.3.1) Uncultured SUP05, EEZ80633 1.00E-68 84 Transketolase (EC 2.2.1.1) Uncultured SUP05, EEZ80633 0 79 Fructose-bisphosphate aldolase (EC 4.1.2.13) Prochlorococcus marinus, ZP_05138240 2.00E-127 74
Sulfur oxidation
Adenylylsulfate reductase alpha subunit, aprA (EC 1.8.99.2)
Marine fosmid HF4000_141I21, ABZ06790 3.00E-62 93
Adenylylsulfate reductase beta subunit, aprB (EC 1.8.99.2)
Marine fosmid HF4000_141I21, ABZ06791 2.00E-75 81
Adenylylsulfate reductase membrane anchor, aprM Marine fosmid HF4000_141I21, ABZ06792 2.00E-88 100
Reverse-type sulfite reductase, alpha subunit, rdsrA (EC 1.8.99.1)
NO HITS - -
Sulfite reductase, beta subunit, drsB (EC 1.8.99.1) Azoarcus sp. BH72, YP_931936 3.00E-162 49 ATP sulfurylase, sat (EC 2.7.7.4) Cand. 'Ruthia magnifica str. Cm', YP_903355 0 74 Sulfate permease Uncultured marine bacterium 578, AAR38117 0 79 Sox enzyme system, beta subunit, soxB (EC 1.8.3.1) NO HITS - - Sox enzyme system, zeta subunit, soxZ (EC 1.8.3.1) NO HITS - - 1Percent identification (%ID) at the amino acid level.
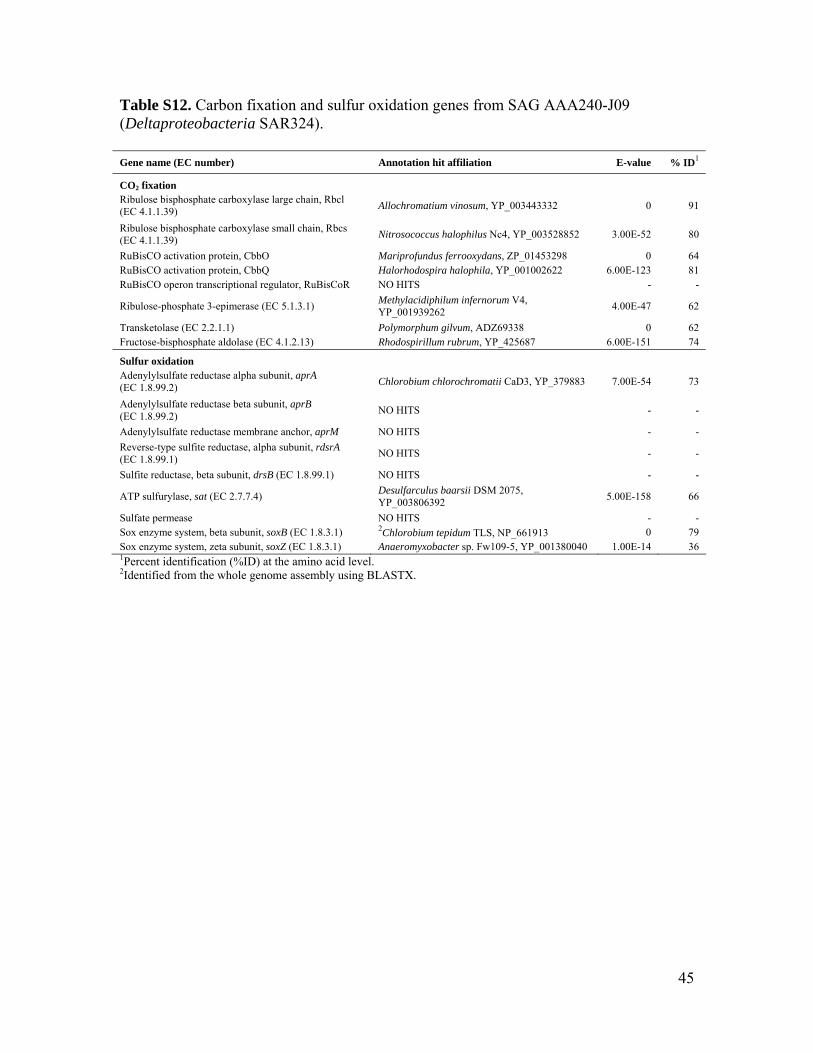
45
Table S12. Carbon fixation and sulfur oxidation genes from SAG AAA240-J09 (Deltaproteobacteria SAR324). Gene name (EC number) Annotation hit affiliation E-value % ID1
CO2 fixation Ribulose bisphosphate carboxylase large chain, Rbcl (EC 4.1.1.39)
Allochromatium vinosum, YP_003443332 0 91
Ribulose bisphosphate carboxylase small chain, Rbcs (EC 4.1.1.39)
Nitrosococcus halophilus Nc4, YP_003528852 3.00E-52 80
RuBisCO activation protein, CbbO Mariprofundus ferrooxydans, ZP_01453298 0 64 RuBisCO activation protein, CbbQ Halorhodospira halophila, YP_001002622 6.00E-123 81 RuBisCO operon transcriptional regulator, RuBisCoR NO HITS - -
Ribulose-phosphate 3-epimerase (EC 5.1.3.1) Methylacidiphilum infernorum V4, YP_001939262
4.00E-47 62
Transketolase (EC 2.2.1.1) Polymorphum gilvum, ADZ69338 0 62 Fructose-bisphosphate aldolase (EC 4.1.2.13) Rhodospirillum rubrum, YP_425687 6.00E-151 74
Sulfur oxidation Adenylylsulfate reductase alpha subunit, aprA (EC 1.8.99.2)
Chlorobium chlorochromatii CaD3, YP_379883 7.00E-54 73
Adenylylsulfate reductase beta subunit, aprB (EC 1.8.99.2)
NO HITS - -
Adenylylsulfate reductase membrane anchor, aprM NO HITS - -
Reverse-type sulfite reductase, alpha subunit, rdsrA (EC 1.8.99.1)
NO HITS - -
Sulfite reductase, beta subunit, drsB (EC 1.8.99.1) NO HITS - -
ATP sulfurylase, sat (EC 2.7.7.4) Desulfarculus baarsii DSM 2075, YP_003806392
5.00E-158 66
Sulfate permease NO HITS - - Sox enzyme system, beta subunit, soxB (EC 1.8.3.1) 2Chlorobium tepidum TLS, NP_661913 0 79 Sox enzyme system, zeta subunit, soxZ (EC 1.8.3.1) Anaeromyxobacter sp. Fw109-5, YP_001380040 1.00E-14 36 1Percent identification (%ID) at the amino acid level. 2Identified from the whole genome assembly using BLASTX.

46
Table S13. Carbon fixation and sulfur oxidation genes from SAG AAA001-C10 (Deltaproteobacteria SAR324). Gene name (EC number) Annotation hit affiliation E-value % ID1
CO2 fixation Ribulose bisphosphate carboxylase large chain, Rbcl (EC 4.1.1.39)
Allochromatium vinosum, YP_003443332 0 91
Ribulose bisphosphate carboxylase small chain, Rbcs (EC 4.1.1.39)
Nitrosococcus halophilus Nc4, YP_003528852 1.00E-52 80
RuBisCO activation protein, CbbO Mariprofundus ferrooxydans, ZP_01453298 0 63 RuBisCO activation protein, CbbQ Halorhodospira halophila, YP_001002622 2.00E-123 81 RuBisCO operon transcriptional regulator, RuBisCoR NO HITS - - Ribulose-phosphate 3-epimerase (EC 5.1.3.1) Desulfuromonas acetoxidans, ZP_01311306 3.00E-75 65 Transketolase (EC 2.2.1.1) Stappia aggregata, ZP_01545752 0 62 Fructose-bisphosphate aldolase (EC 4.1.2.13) Rhodospirillum rubrum, YP_425687 5.00E-150 73
Sulfur oxidation Adenylylsulfate reductase alpha subunit, aprA (EC 1.8.99.2)
2Chlorobium chlorochromatii CaD3, YP_379883 9.00E-25 47
Adenylylsulfate reductase beta subunit, aprB (EC 1.8.99.2)
NO HITS - -
Adenylylsulfate reductase membrane anchor, aprM NO HITS - -
Reverse-type sulfite reductase, alpha subunit, rdsrA (EC 1.8.99.1)
3Cand. 'Ruthia magnifica str. Cm', YP_904057 1.00E-40 100
Sulfite reductase, beta subunit, drsB (EC 1.8.99.1) NO HITS - - ATP sulfurylase, sat (EC 2.7.7.4) NO HITS - - Sulfate permease NO HITS - - Sox enzyme system, beta subunit, soxB (EC 1.8.3.1) 4Chlorobium tepidum TLS, NP_661913 2.00E-152 78 Sox enzyme system, zeta subunit, soxZ (EC 1.8.3.1) NO HITS - - 1Percent identification (%ID) at the amino acid level. 2Identified by SAG PCR screening. 3Identified from the whole genome assembly using BLASTX. 4Identified from non-assembled 454 reads using BLASTX.
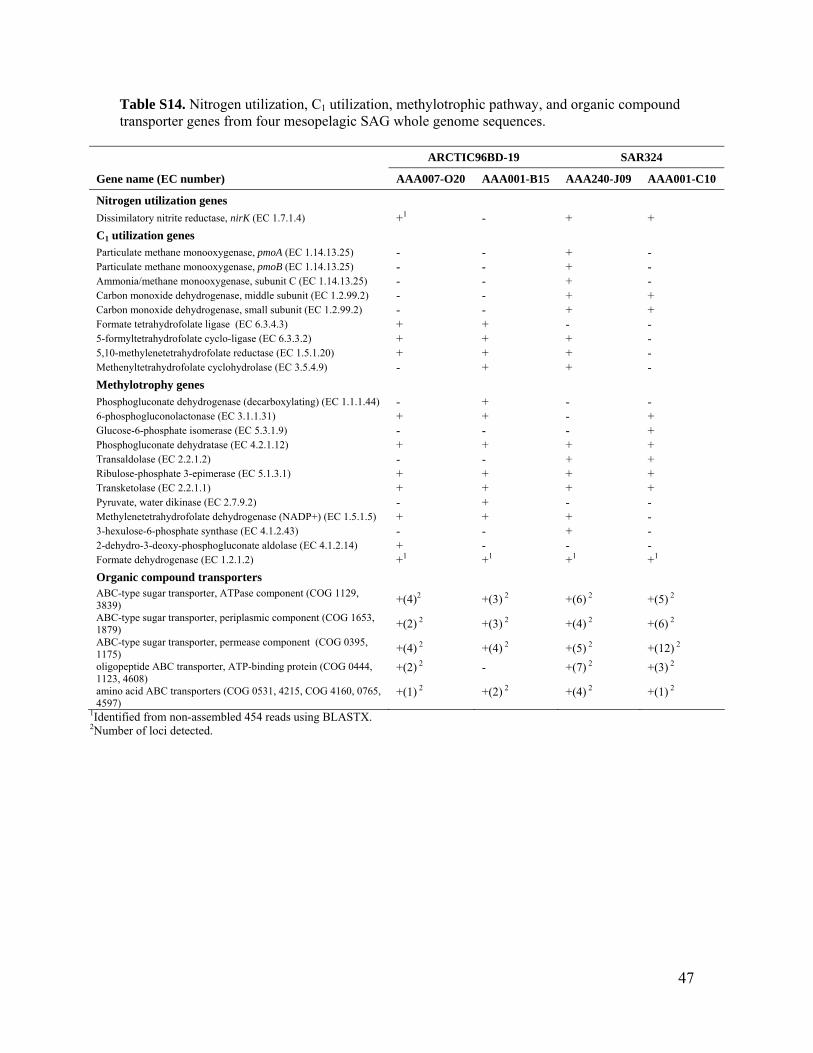
47
Table S14. Nitrogen utilization, C1 utilization, methylotrophic pathway, and organic compound transporter genes from four mesopelagic SAG whole genome sequences.
ARCTIC96BD-19 SAR324
Gene name (EC number) AAA007-O20 AAA001-B15 AAA240-J09 AAA001-C10
Nitrogen utilization genes
Dissimilatory nitrite reductase, nirK (EC 1.7.1.4) +1 - + +
C1 utilization genes
Particulate methane monooxygenase, pmoA (EC 1.14.13.25) - - + - Particulate methane monooxygenase, pmoB (EC 1.14.13.25) - - + - Ammonia/methane monooxygenase, subunit C (EC 1.14.13.25) - - + - Carbon monoxide dehydrogenase, middle subunit (EC 1.2.99.2) - - + + Carbon monoxide dehydrogenase, small subunit (EC 1.2.99.2) - - + + Formate tetrahydrofolate ligase (EC 6.3.4.3) + + - - 5-formyltetrahydrofolate cyclo-ligase (EC 6.3.3.2) + + + - 5,10-methylenetetrahydrofolate reductase (EC 1.5.1.20) + + + - Methenyltetrahydrofolate cyclohydrolase (EC 3.5.4.9) - + + -
Methylotrophy genes
Phosphogluconate dehydrogenase (decarboxylating) (EC 1.1.1.44) - + - - 6-phosphogluconolactonase (EC 3.1.1.31) + + - + Glucose-6-phosphate isomerase (EC 5.3.1.9) - - - + Phosphogluconate dehydratase (EC 4.2.1.12) + + + + Transaldolase (EC 2.2.1.2) - - + + Ribulose-phosphate 3-epimerase (EC 5.1.3.1) + + + + Transketolase (EC 2.2.1.1) + + + + Pyruvate, water dikinase (EC 2.7.9.2) - + - - Methylenetetrahydrofolate dehydrogenase (NADP+) (EC 1.5.1.5) + + + - 3-hexulose-6-phosphate synthase (EC 4.1.2.43) - - + - 2-dehydro-3-deoxy-phosphogluconate aldolase (EC 4.1.2.14) + - - - Formate dehydrogenase (EC 1.2.1.2) +1 +1 +1 +1
Organic compound transporters ABC-type sugar transporter, ATPase component (COG 1129, 3839) +(4)2 +(3) 2 +(6) 2 +(5) 2
ABC-type sugar transporter, periplasmic component (COG 1653, 1879) +(2) 2 +(3) 2 +(4) 2 +(6) 2
ABC-type sugar transporter, permease component (COG 0395, 1175) +(4) 2 +(4) 2 +(5) 2 +(12) 2
oligopeptide ABC transporter, ATP-binding protein (COG 0444, 1123, 4608)
+(2) 2 - +(7) 2 +(3) 2
amino acid ABC transporters (COG 0531, 4215, COG 4160, 0765, 4597)
+(1) 2 +(2) 2 +(4) 2 +(1) 2
1Identified from non-assembled 454 reads using BLASTX. 2Number of loci detected.
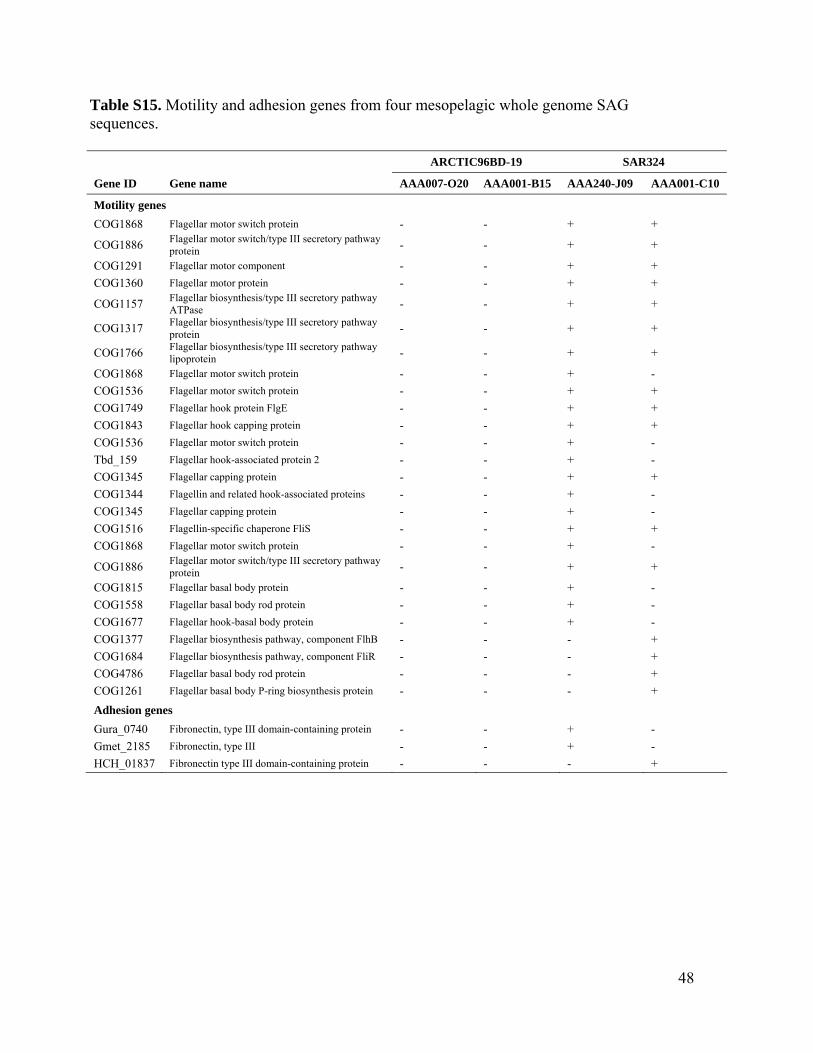
48
Table S15. Motility and adhesion genes from four mesopelagic whole genome SAG sequences. ARCTIC96BD-19 SAR324
Gene ID Gene name AAA007-O20 AAA001-B15 AAA240-J09 AAA001-C10
Motility genes
COG1868 Flagellar motor switch protein - - + +
COG1886 Flagellar motor switch/type III secretory pathway protein - - + +
COG1291 Flagellar motor component - - + +
COG1360 Flagellar motor protein - - + +
COG1157 Flagellar biosynthesis/type III secretory pathway ATPase - - + +
COG1317 Flagellar biosynthesis/type III secretory pathway protein - - + +
COG1766 Flagellar biosynthesis/type III secretory pathway lipoprotein - - + +
COG1868 Flagellar motor switch protein - - + -
COG1536 Flagellar motor switch protein - - + +
COG1749 Flagellar hook protein FlgE - - + +
COG1843 Flagellar hook capping protein - - + +
COG1536 Flagellar motor switch protein - - + -
Tbd_159 Flagellar hook-associated protein 2 - - + -
COG1345 Flagellar capping protein - - + +
COG1344 Flagellin and related hook-associated proteins - - + -
COG1345 Flagellar capping protein - - + -
COG1516 Flagellin-specific chaperone FliS - - + +
COG1868 Flagellar motor switch protein - - + -
COG1886 Flagellar motor switch/type III secretory pathway protein - - + +
COG1815 Flagellar basal body protein - - + -
COG1558 Flagellar basal body rod protein - - + -
COG1677 Flagellar hook-basal body protein - - + -
COG1377 Flagellar biosynthesis pathway, component FlhB - - - +
COG1684 Flagellar biosynthesis pathway, component FliR - - - +
COG4786 Flagellar basal body rod protein - - - +
COG1261 Flagellar basal body P-ring biosynthesis protein - - - +
Adhesion genes
Gura_0740 Fibronectin, type III domain-containing protein - - + -
Gmet_2185 Fibronectin, type III - - + -
HCH_01837 Fibronectin type III domain-containing protein - - - +


