Embed Size (px)
Citation preview
773 San Marin Drive, Suite 2115, Novato, CA 94998 415.899.0700
ENVIRON International Corporation
Final Report
POTENTIAL OZONE IMPACTS OF EXCESS NO2 EMISSIONS FROM DIESEL PARTICULATE FILTERS FOR ON- AND OFF-ROAD DIESEL ENGINES
Project Number: H93
Prepared for: David Hitchcock
Houston Advanced Research Center 4800 Research Forest Dr.
The Woodlands, TX 77381
Prepared by Amnon Bar-Ilan
Jeremiah Johnson Allison DenBleyker
Lit Chan Greg Yarwood
ENVIRON International Corporation 773 San Marin Drive, Suite 2115
Novato, CA 94998
April 27, 2009
April 2009
G:\HARC_H93_DPF\Technical Report\Final\HARC93_DPF-NO2_Final_4-27-09.doc i
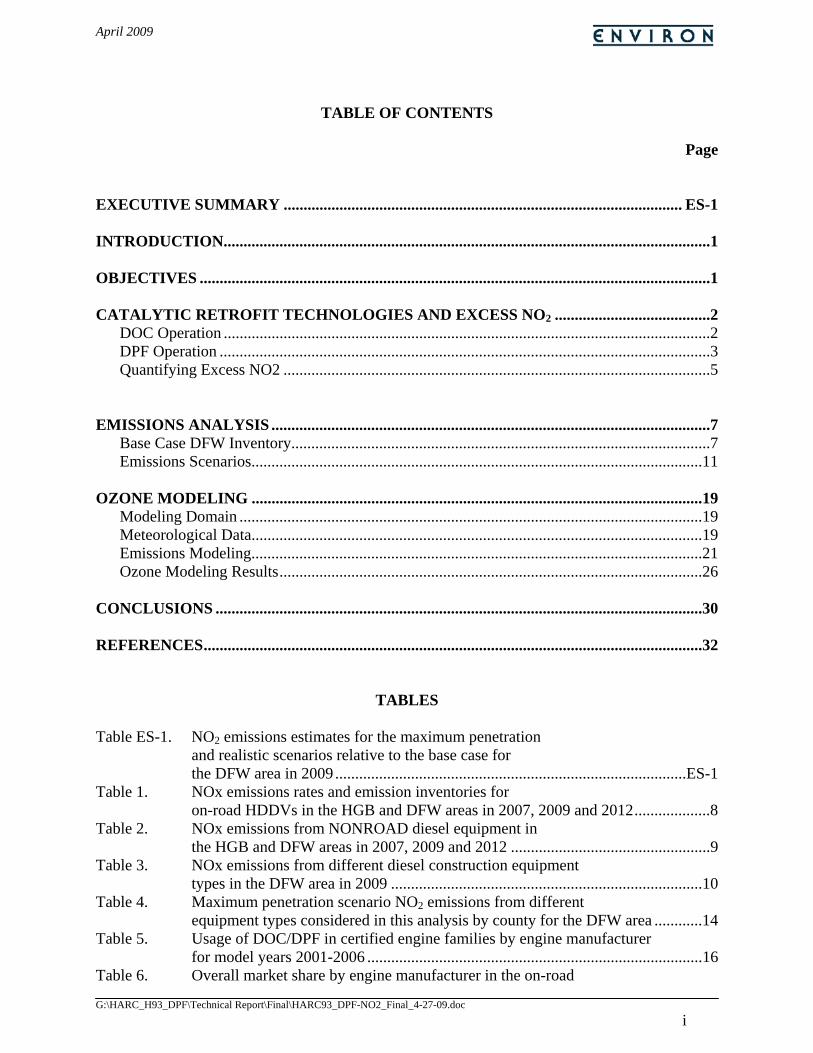
TABLE OF CONTENTS
Page EXECUTIVE SUMMARY .................................................................................................... ES-1 INTRODUCTION..........................................................................................................................1 OBJECTIVES ................................................................................................................................1 CATALYTIC RETROFIT TECHNOLOGIES AND EXCESS NO2 .......................................2 DOC Operation ..........................................................................................................................2 DPF Operation ...........................................................................................................................3 Quantifying Excess NO2 ...........................................................................................................5 EMISSIONS ANALYSIS ..............................................................................................................7 Base Case DFW Inventory.........................................................................................................7 Emissions Scenarios.................................................................................................................11 OZONE MODELING .................................................................................................................19 Modeling Domain ....................................................................................................................19 Meteorological Data.................................................................................................................19 Emissions Modeling.................................................................................................................21 Ozone Modeling Results..........................................................................................................26 CONCLUSIONS ..........................................................................................................................30 REFERENCES.............................................................................................................................32
TABLES
Table ES-1. NO2 emissions estimates for the maximum penetration and realistic scenarios relative to the base case for the DFW area in 2009........................................................................................ES-1 Table 1. NOx emissions rates and emission inventories for on-road HDDVs in the HGB and DFW areas in 2007, 2009 and 2012...................8 Table 2. NOx emissions from NONROAD diesel equipment in the HGB and DFW areas in 2007, 2009 and 2012 ..................................................9 Table 3. NOx emissions from different diesel construction equipment types in the DFW area in 2009 ..............................................................................10 Table 4. Maximum penetration scenario NO2 emissions from different equipment types considered in this analysis by county for the DFW area ............14 Table 5. Usage of DOC/DPF in certified engine families by engine manufacturer
for model years 2001-2006 ....................................................................................16 Table 6. Overall market share by engine manufacturer in the on-road
April 2009
G:\HARC_H93_DPF\Technical Report\Final\HARC93_DPF-NO2_Final_4-27-09.doc ii
heavy-duty truck market in 2003 ...........................................................................17 Table 7. Number of DPF and DOC retrofits on school buses in the DFW area through the TERP program as of October 2008.............................................17 Table 8. Realistic scenario NO2 emissions from different equipment types
considered in this analysis by county for the DFW area .......................................18 Table 9. CAMx meteorological input data requirements.....................................................20 Table 10. MM5 and CAMx vertical grid structures based on 28 sigma-p levels.
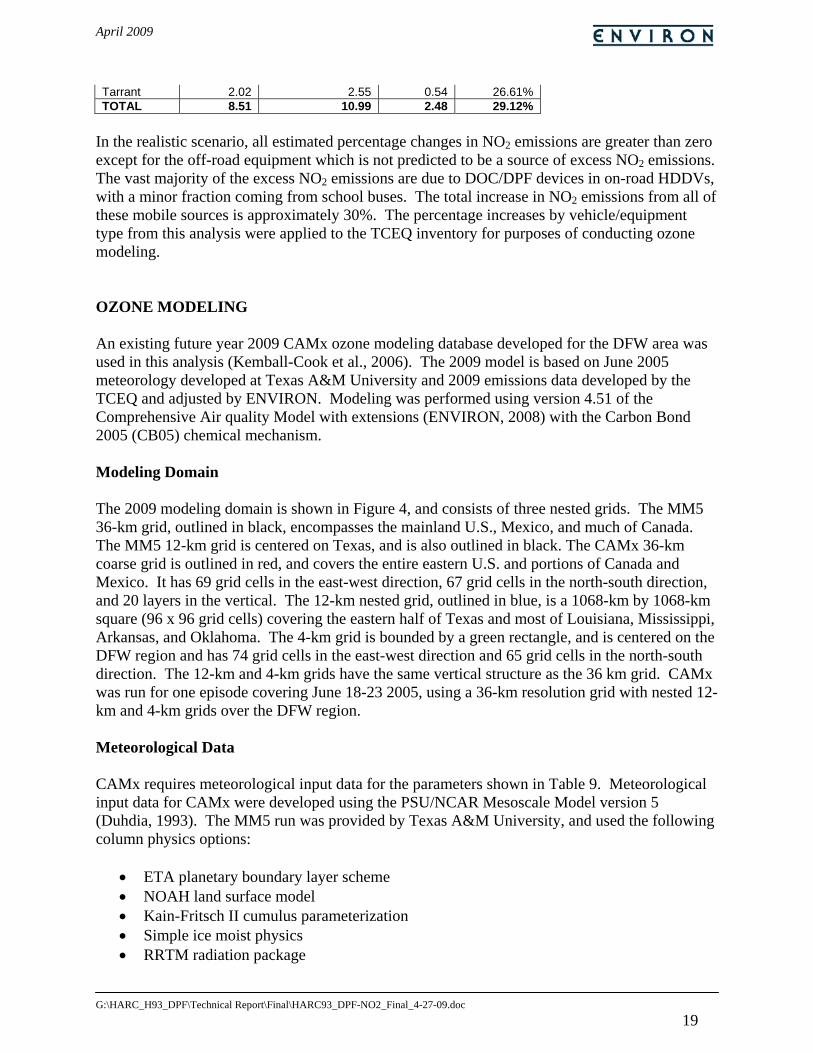
Heights (m) are above ground level according to a standard atmosphere; pressure is in millibars ...........................................................................................21
Table 11. NOx emissions (tpd) totals for Class 8 heavy duty diesel vehicles for run 1 and run 2 for DFW counties on June 23, 2005 for future year 2009. Total NOx emissions did not change between run 2 and run 3.......................................22
Table 12. NOx emissions (tpd) totals for the two highest-emitting emissions categories of off-road equipment for run 1 and run 2 for DFW counties on June 23, 2005 for future year 2009. Total NOx emissions did not change between run 2 and run3..........................................................................................23
Table 13. NO emissions (tpd) totals for diesel school buses for run 1 and run 2 for DFW counties on June 23, 2005 for future year 2009. Note that diesel school bus NO emissions did not change from run 2 to run 3...............................23
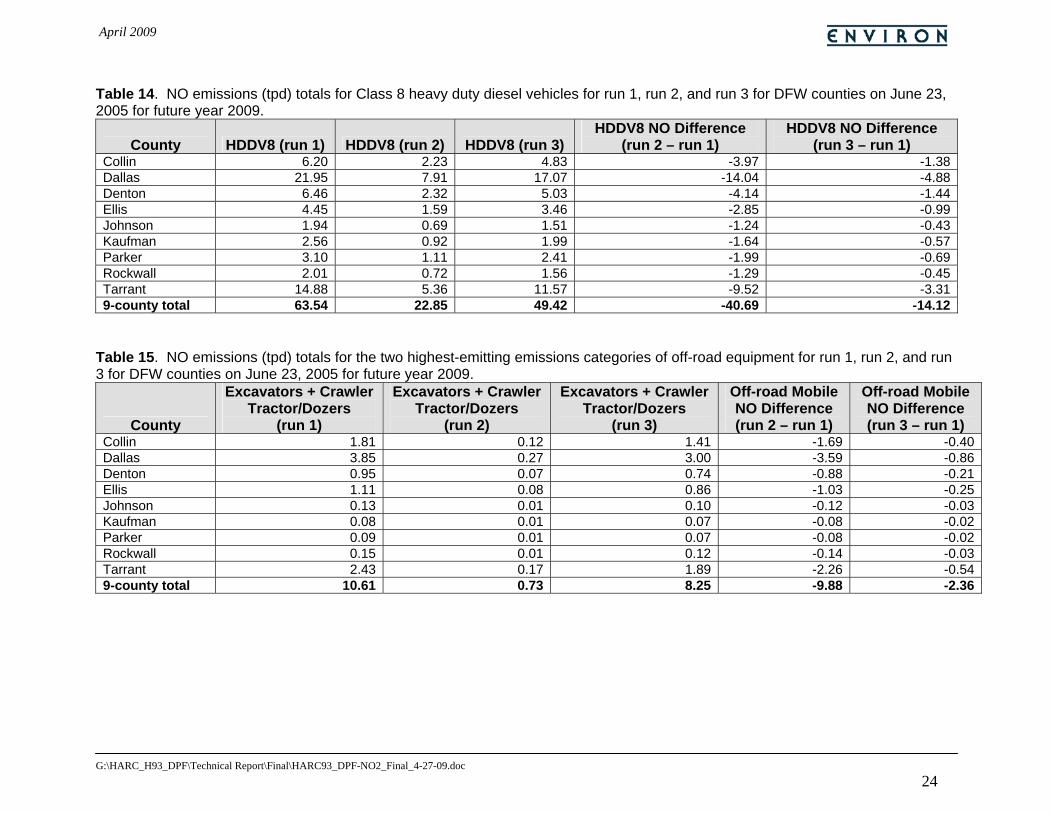
Table 14. NO emissions (tpd) totals for Class 8 heavy duty diesel vehicles for run 1, run 2, and run 3 for DFW counties on June 23, 2005 for future year 2009...........24
Table 15. NO emissions (tpd) totals for the two highest-emitting emissions categories of off-road equipment for run 1, run 2, and run 3 for DFW counties on June 23, 2005 for future year 2009.....................................................24
FIGURES
Figure 1. Schematic of a Diesel Oxidation Catalyst and emissions reduction process .....................................................................................................3 Figure 2. Diesel particulate filter.............................................................................................4 Figure 3. Transient federal test procedure (FTP) for heavy-duty trucks and buses .......................................................................................................6 Figure 4. CAMx 36 km domain (outlined in red), 12 km CAMx modeling domain (outlined in blue), and CAMx DFW 4 km domain (outlined in
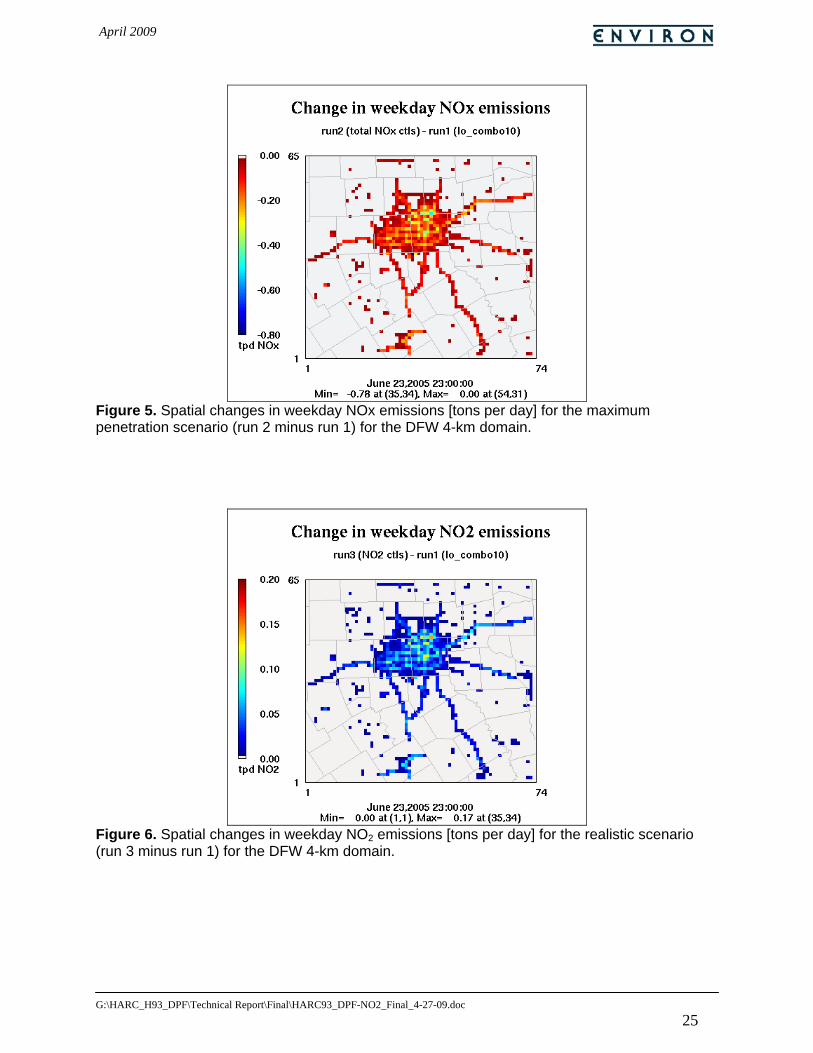
green) for the 2005 ozone model ...........................................................................20 Figure 5. Spatial changes in weekday NOx emissions [tons per day] for the
maximum penetration scenario (run 2 minus run 1) for the DFW 4-km domain....................................................................................................................25
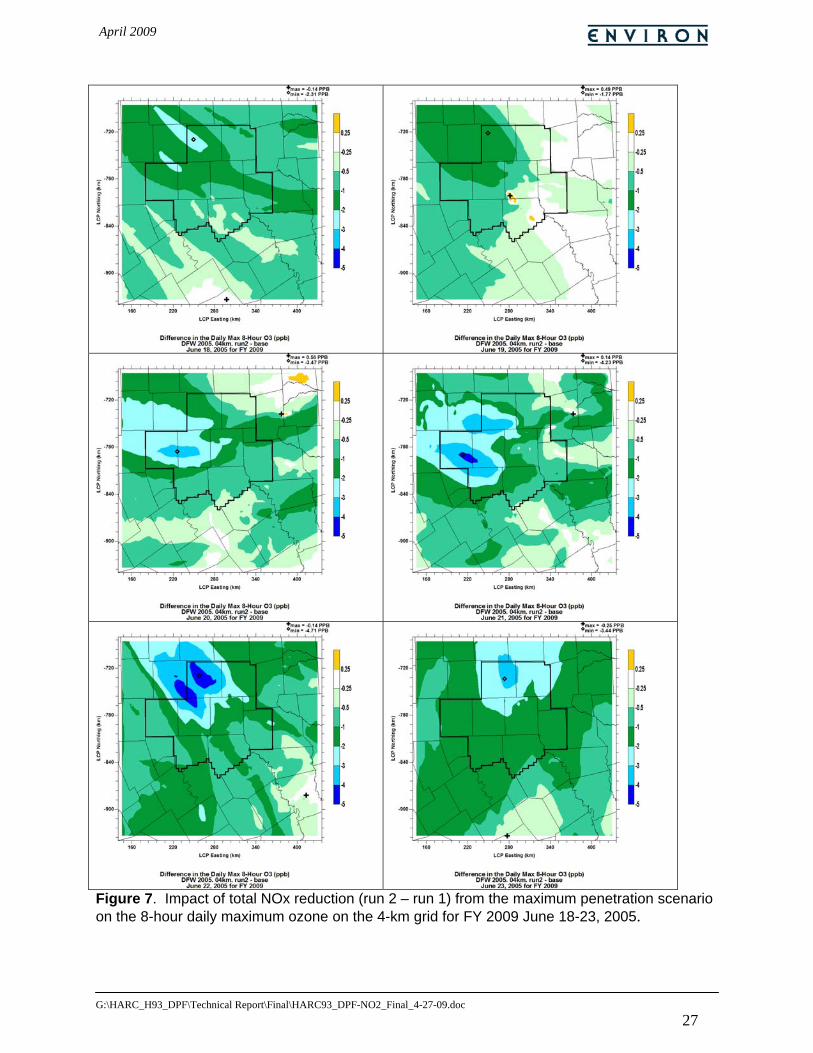
Figure 6. Spatial changes in weekday NO2 emissions [tons per day] for the realistic scenario (run 3 minus run 1) for the DFW 4-km domain...................25 Figure 7. Impact of total NOx reduction (run 2 – run 1) from the maximum
penetration scenario on the 8-hour daily maximum ozone on the 4-km grid for FY 2009 June 18-23, 2005........................................................................27 Figure 8. Impact of excess NO2 (run 3 – run 1) from the realistic scenario on the 8-hour daily maximum ozone on the 4-km grid for FY 2009 June 18-23, 2005....................................................................................................28 Figure 9. Hourly ozone time series plots for run 1 (black), run 2 (red), and run 3
(blue) at DFW monitoring locations for FY 2009 June 18-23, 2005.....................29
April 2009
G:\HARC_H93_DPF\Technical Report\Final\HARC93_DPF-NO2_Final_4-27-09.doc ES-1
EXECUTIVE SUMMARY
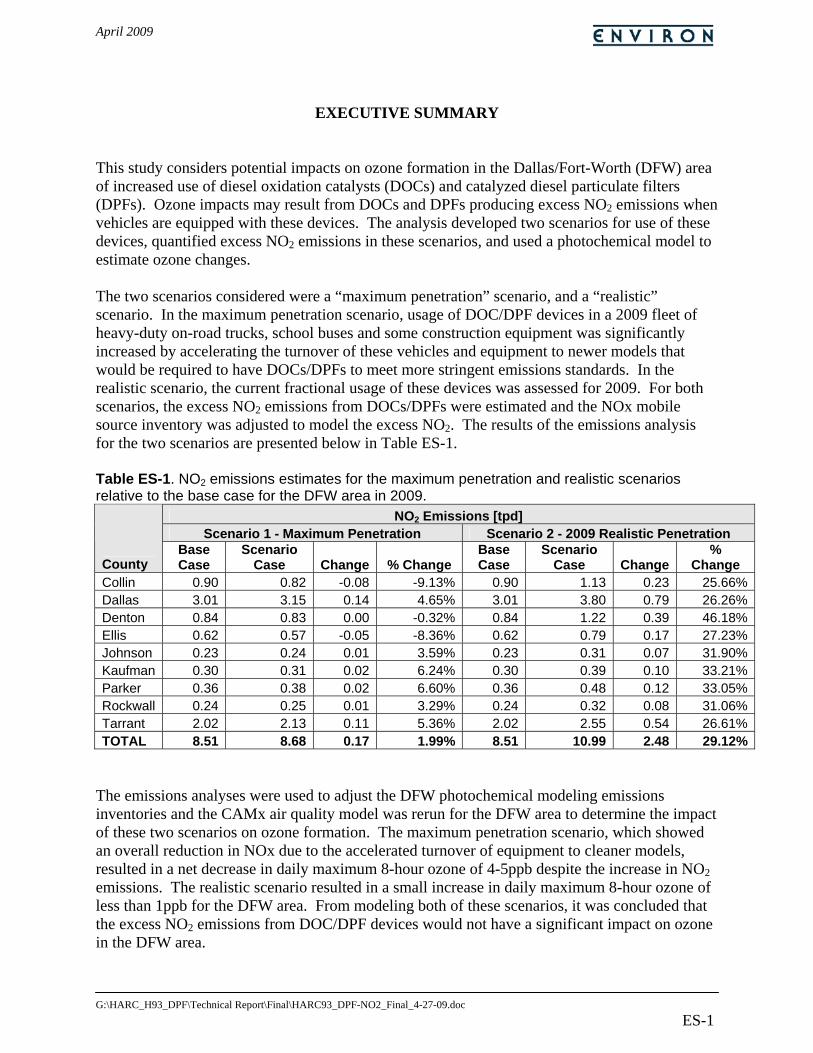
This study considers potential impacts on ozone formation in the Dallas/Fort-Worth (DFW) area of increased use of diesel oxidation catalysts (DOCs) and catalyzed diesel particulate filters (DPFs). Ozone impacts may result from DOCs and DPFs producing excess NO2 emissions when vehicles are equipped with these devices. The analysis developed two scenarios for use of these devices, quantified excess NO2 emissions in these scenarios, and used a photochemical model to estimate ozone changes. The two scenarios considered were a “maximum penetration” scenario, and a “realistic” scenario. In the maximum penetration scenario, usage of DOC/DPF devices in a 2009 fleet of heavy-duty on-road trucks, school buses and some construction equipment was significantly increased by accelerating the turnover of these vehicles and equipment to newer models that would be required to have DOCs/DPFs to meet more stringent emissions standards. In the realistic scenario, the current fractional usage of these devices was assessed for 2009. For both scenarios, the excess NO2 emissions from DOCs/DPFs were estimated and the NOx mobile source inventory was adjusted to model the excess NO2. The results of the emissions analysis for the two scenarios are presented below in Table ES-1. Table ES-1. NO2 emissions estimates for the maximum penetration and realistic scenarios relative to the base case for the DFW area in 2009.
NO2 Emissions [tpd] Scenario 1 - Maximum Penetration Scenario 2 - 2009 Realistic Penetration
County Base Case
Scenario Case Change % Change
Base Case
Scenario Case Change
% Change
Collin 0.90 0.82 -0.08 -9.13% 0.90 1.13 0.23 25.66%Dallas 3.01 3.15 0.14 4.65% 3.01 3.80 0.79 26.26%Denton 0.84 0.83 0.00 -0.32% 0.84 1.22 0.39 46.18%Ellis 0.62 0.57 -0.05 -8.36% 0.62 0.79 0.17 27.23%Johnson 0.23 0.24 0.01 3.59% 0.23 0.31 0.07 31.90%Kaufman 0.30 0.31 0.02 6.24% 0.30 0.39 0.10 33.21%Parker 0.36 0.38 0.02 6.60% 0.36 0.48 0.12 33.05%Rockwall 0.24 0.25 0.01 3.29% 0.24 0.32 0.08 31.06%Tarrant 2.02 2.13 0.11 5.36% 2.02 2.55 0.54 26.61%TOTAL 8.51 8.68 0.17 1.99% 8.51 10.99 2.48 29.12%
The emissions analyses were used to adjust the DFW photochemical modeling emissions inventories and the CAMx air quality model was rerun for the DFW area to determine the impact of these two scenarios on ozone formation. The maximum penetration scenario, which showed an overall reduction in NOx due to the accelerated turnover of equipment to cleaner models, resulted in a net decrease in daily maximum 8-hour ozone of 4-5ppb despite the increase in NO2 emissions. The realistic scenario resulted in a small increase in daily maximum 8-hour ozone of less than 1ppb for the DFW area. From modeling both of these scenarios, it was concluded that the excess NO2 emissions from DOC/DPF devices would not have a significant impact on ozone in the DFW area.
April 2009
G:\HARC_H93_DPF\Technical Report\Final\HARC93_DPF-NO2_Final_4-27-09.doc 1
INTRODUCTION Modern diesel engines are increasingly incorporating into their design a combination diesel oxidation catalyst (DOC) and catalyzed diesel particulate filter (DPF) to meet stringent new particulate matter (PM) emissions standards for on-road and off-road vehicles. In addition, some states have instituted retrofit programs for specific vehicle types to encourage DPF retrofits for PM emissions reduction. The DOC and DPF, either individually or in combination, have the potential to create excess NO2 emissions which may impact ozone and PM nitrate formation. Ozone impacts of excess NO2 emissions may be especially problematic in the urban core of the Dallas/Fort-Worth (DFW) area. The purpose of this project is to evaluate the potential impacts of DPFs on emissions and ozone for the DFW area. Several agencies in the U.S. and in Europe have investigated the phenomenon of increased NO2 from catalytically-equipped diesel engines, and have documented that the excess NO2 emissions are real and observable. The findings of the EPA’s recently published “Diesel Retrofit Technology and Program Experience” report several fleet tests that showed baseline NO2 of only 6% of total NOx, but NO2 emissions from DPF-equipped grocery trucks ranged from 26% to 34% (Emissions Advantage, 2005). The California Air Resources Board (ARB) has conducted some analyses to determine whether excess NO2 emissions, such that the NO2/NOx ratio exceeded 0.2, had the effect of exceeding the NO2 national ambient air quality standards (NAAQS) in specific micro-climates, and used this analysis to set a limit of 20% excess NO2 above baseline for all verified retrofit devices (ARB, 2004). Several European studies have looked at the potential excess NO2 emissions from air quality and health risk standpoints – these analyses have been driven by the high usage of catalytically equipped retrofit devices in the large light-duty diesel passenger vehicle fleet in Europe relative to the U.S. (Carslaw, 2004; Carslaw, 2005). These studies have observed specific instances of excess NO2 from catalytically-equipped buses and diesel passenger vehicles, and indicated potential air quality impacts from excess NO2. Given this body of research on the air quality impacts of excess NO2, this emissions and air quality modeling analysis attempts to quantify whether these impacts would be observed in the 9-county DFW area. The DFW area was selected for this analysis because it has an urban core with a high density of on-road traffic, as well as significant NOx emissions from some off-road equipment types. The DFW area has also been the subject of air quality analyses in the past, and thus there is an existing model-ready emissions inventory for use in this study. OBJECTIVES The specific objectives of this study are to:
(1) Identify devices that would lead to excess NO2 – this task involves identifying the mechanisms by which excess NO2 is formed and which types of retrofit devices would have the configuration and chemical characteristics that would lead to the formation of excess NO2;
(2) Quantify the excess NO2 emissions from applicable retrofit devices – this task would use the information gathered in Task (1) above to determine a reasonable quantitative value of the excess NO2 emissions, either as an increase by mass in NO2 emissions or as an
April 2009
G:\HARC_H93_DPF\Technical Report\Final\HARC93_DPF-NO2_Final_4-27-09.doc 2
increase in the ratio of NO2/NOx. To the extent possible the quantitative estimations of excess NO2 would account for different retrofit technology types and different engine and vehicle types;
(3) Identify on-road and off-road vehicles that use these devices and their populations – this task would estimate the population of catalytic DPF-equipped vehicles by vehicle or engine type for use in estimating the magnitude of emissions from these vehicles;
(4) Quantify the excess NO2 emissions from DPF-equipped vehicles in the DFW region – this task would use the results of Tasks (1) – (3) above to quantify the excess NO2 emissions in the DFW region under one or more scenarios that model the penetration of retrofit devices into the vehicle fleets;
(5) Conduct regional air quality modeling to determine the impact on ozone of excess NO2 – this task would use the results of the emissions analysis to modify the existing DFW model-ready emissions inventory to account for the effect of excess NO2 and develop new modeling outputs. The modeling would be conducted for one or more scenarios of device penetration and show the impacts on ozone formation of the excess NO2.
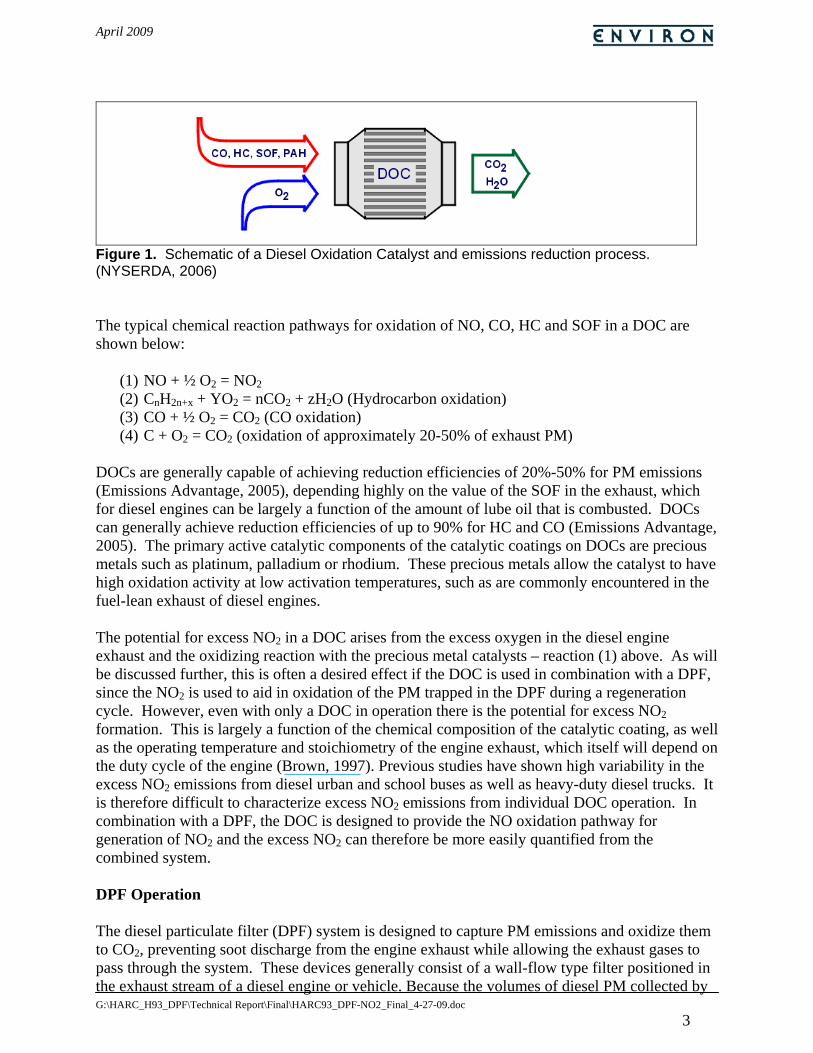
The analyses for each of the objectives are described in detail below. CATALYTIC RETROFIT TECHNOLOGIES AND EXCESS NO2 The two retrofit device types considered in this analysis are DOCs and DPFs, which may be used individually or in combination. DOCs are an older technology that has been in use since the late 1980’s initially for retrofitting mining equipment, but since the mid-1990’s as retrofits for on-road diesel trucks and buses (ESI International, 1999; MECA, 2001). DOCs are a verified retrofit technology by both the ARB and EPA, and their primary purpose is to reduce emissions of hydrocarbon species from diesel exhaust as well as emissions of liquid hydrocarbons, or soluble organic fraction (SOF), which can account for as much as 30% of PM emissions by mass from diesel engines. DPFs are a more recent technology that functions by trapping PM in small filter pores and then burning off the PM through oxidation in a “regeneration” process. DPFs are capable of achieving very high control efficiencies for PM, and some are verified by the ARB and EPA to the highest level of PM control by a retrofit technology. The basic pathways by which these devices operate, and hence their potential for excess NO2 formation, are described below. DOC Operation A diesel oxidation catalyst (DOC) system consists of a stainless steel canister that is positioned in the exhaust stream of the engine. This canister contains a catalyst support or substrate which is typically ceramic or metallic, and honeycomb-shaped. In some cases, it is wire mesh coated with catalytic formulation (which includes precious metals such as platinum and palladium). The oxidation catalyst oxidizes hydrocarbons through the removal of electrons associated with carbon atoms in the hydrocarbons to form carbon dioxide (CO2) and water. Oxygen is present in diesel exhaust in large quantities due to the lean stoichiometry of diesel engines, so oxidation occurs naturally; a diesel oxidation catalyst speeds up the reaction rate. The diesel oxidation catalyst is designed to oxidize carbon monoxide, gas phase hydrocarbons, and the soluble organic fraction (SOF) of diesel particulate matter to CO2 and H2O. Figure 1 shows an example of the process in a diesel oxidation catalyst.
April 2009
G:\HARC_H93_DPF\Technical Report\Final\HARC93_DPF-NO2_Final_4-27-09.doc 3
Figure 1. Schematic of a Diesel Oxidation Catalyst and emissions reduction process. (NYSERDA, 2006) The typical chemical reaction pathways for oxidation of NO, CO, HC and SOF in a DOC are shown below:
(1) NO + ½ O2 = NO2 (2) CnH2n+x + YO2 = nCO2 + zH2O (Hydrocarbon oxidation) (3) CO + ½ O2 = CO2 (CO oxidation) (4) C + O2 = CO2 (oxidation of approximately 20-50% of exhaust PM)
DOCs are generally capable of achieving reduction efficiencies of 20%-50% for PM emissions (Emissions Advantage, 2005), depending highly on the value of the SOF in the exhaust, which for diesel engines can be largely a function of the amount of lube oil that is combusted. DOCs can generally achieve reduction efficiencies of up to 90% for HC and CO (Emissions Advantage, 2005). The primary active catalytic components of the catalytic coatings on DOCs are precious metals such as platinum, palladium or rhodium. These precious metals allow the catalyst to have high oxidation activity at low activation temperatures, such as are commonly encountered in the fuel-lean exhaust of diesel engines. The potential for excess NO2 in a DOC arises from the excess oxygen in the diesel engine exhaust and the oxidizing reaction with the precious metal catalysts – reaction (1) above. As will be discussed further, this is often a desired effect if the DOC is used in combination with a DPF, since the NO2 is used to aid in oxidation of the PM trapped in the DPF during a regeneration cycle. However, even with only a DOC in operation there is the potential for excess NO2 formation. This is largely a function of the chemical composition of the catalytic coating, as well as the operating temperature and stoichiometry of the engine exhaust, which itself will depend on the duty cycle of the engine (Brown, 1997). Previous studies have shown high variability in the excess NO2 emissions from diesel urban and school buses as well as heavy-duty diesel trucks. It is therefore difficult to characterize excess NO2 emissions from individual DOC operation. In combination with a DPF, the DOC is designed to provide the NO oxidation pathway for generation of NO2 and the excess NO2 can therefore be more easily quantified from the combined system. DPF Operation The diesel particulate filter (DPF) system is designed to capture PM emissions and oxidize them to CO2, preventing soot discharge from the engine exhaust while allowing the exhaust gases to pass through the system. These devices generally consist of a wall-flow type filter positioned in the exhaust stream of a diesel engine or vehicle. Because the volumes of diesel PM collected by
April 2009
G:\HARC_H93_DPF\Technical Report\Final\HARC93_DPF-NO2_Final_4-27-09.doc 4
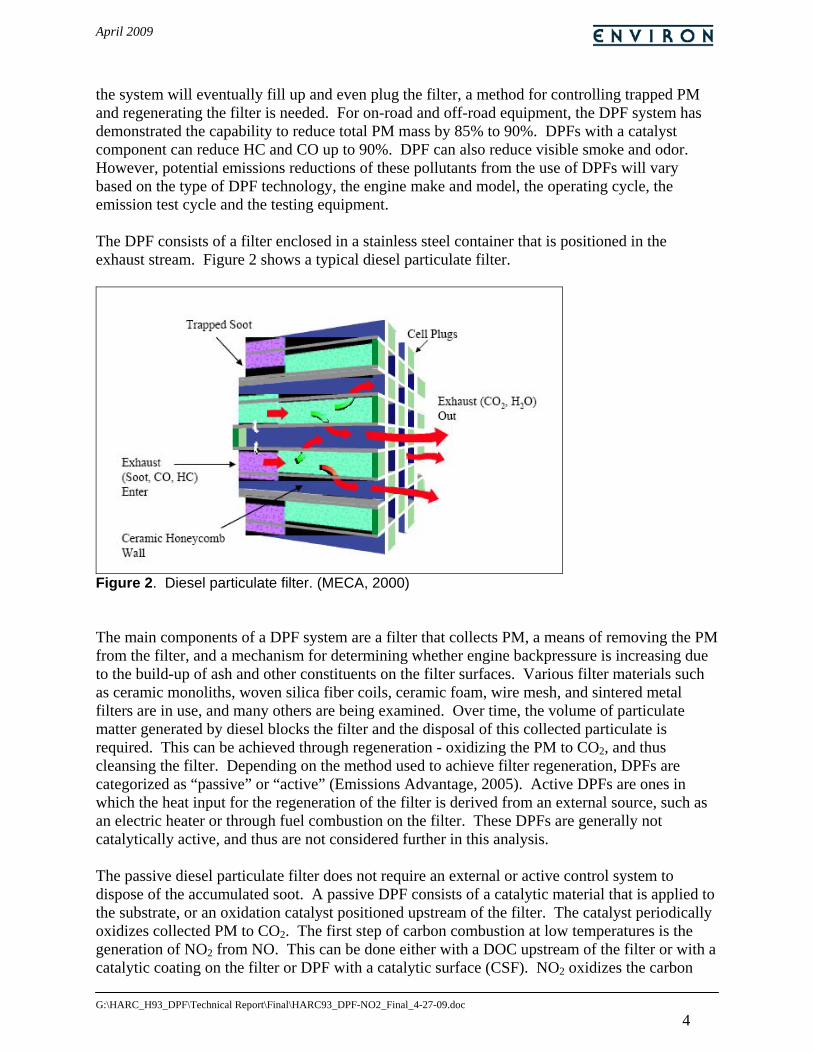
the system will eventually fill up and even plug the filter, a method for controlling trapped PM and regenerating the filter is needed. For on-road and off-road equipment, the DPF system has demonstrated the capability to reduce total PM mass by 85% to 90%. DPFs with a catalyst component can reduce HC and CO up to 90%. DPF can also reduce visible smoke and odor. However, potential emissions reductions of these pollutants from the use of DPFs will vary based on the type of DPF technology, the engine make and model, the operating cycle, the emission test cycle and the testing equipment. The DPF consists of a filter enclosed in a stainless steel container that is positioned in the exhaust stream. Figure 2 shows a typical diesel particulate filter.
Figure 2. Diesel particulate filter. (MECA, 2000) The main components of a DPF system are a filter that collects PM, a means of removing the PM from the filter, and a mechanism for determining whether engine backpressure is increasing due to the build-up of ash and other constituents on the filter surfaces. Various filter materials such as ceramic monoliths, woven silica fiber coils, ceramic foam, wire mesh, and sintered metal filters are in use, and many others are being examined. Over time, the volume of particulate matter generated by diesel blocks the filter and the disposal of this collected particulate is required. This can be achieved through regeneration - oxidizing the PM to CO2, and thus cleansing the filter. Depending on the method used to achieve filter regeneration, DPFs are categorized as “passive” or “active” (Emissions Advantage, 2005). Active DPFs are ones in which the heat input for the regeneration of the filter is derived from an external source, such as an electric heater or through fuel combustion on the filter. These DPFs are generally not catalytically active, and thus are not considered further in this analysis. The passive diesel particulate filter does not require an external or active control system to dispose of the accumulated soot. A passive DPF consists of a catalytic material that is applied to the substrate, or an oxidation catalyst positioned upstream of the filter. The catalyst periodically oxidizes collected PM to CO2. The first step of carbon combustion at low temperatures is the generation of NO2 from NO. This can be done either with a DOC upstream of the filter or with a catalytic coating on the filter or DPF with a catalytic surface (CSF). NO2 oxidizes the carbon
April 2009
G:\HARC_H93_DPF\Technical Report\Final\HARC93_DPF-NO2_Final_4-27-09.doc 5
(soot) collected on and in the filter walls to CO2. The typical reaction pathways in a catalyzed DPF are shown below:
(1) Ctrapped + 2NO2 = CO2 + NO + CO + ½N2 (major reaction pathway) (2) 2Ctrapped + 2NO2 = 2CO2 + N2 (3) Ctrapped + O2 = CO2 (minor reaction path) (4) NO + ½O2 = NO2 (minor reaction path) (5) CO + ½O2 = CO2
Reaction pathway (1) above reduces NO2 back to NO, but excess NO2 from the DPF may result if the soot is not completely reacted or if a greater fraction of NO2 was generated than needed for stoichiometric oxidation of the PM (i.e. if engine exhaust conditions are non-stoichiometric). The main functional requirements for a passively regenerated DPF system are a sufficient exhaust temperature, and a minimum NOx to PM ratio. The average exhaust temperature at the filter’s inlet and the rate of PM generated by the engine are mainly driven by the duty cycle of the engine (i.e. the engine load) and will directly impact the efficiency and suitability of a passive DPF for a particular engine application. The NO2 oxidation pathway for PM is favored at high temperatures, whereas at low temperatures the O2 oxidation pathway is favored. But in both cases engine exhaust temperature must reach the light-off temperature of the catalyst. For this reason, passive, catalytically-active DPFs are generally only recommended for on-road vehicles which would achieve catalyst light-off exhaust temperatures through their normal duty cycles. These include heavy-duty trucks and some bus applications. Non-road equipment, such as for the construction or agriculture sectors, generally is not well-suited to the use of passive DPFs and will use active DPFs or other retrofit technology. Quantifying Excess NO2 Combined DPF/DOC systems are manufactured both for the original equipment manufacturer (OEM) market (Bar-Ilan, et al., 2007), as well as for retrofit systems (Cleaire, 2009; Johnson-Matthey, 2009). In passive applications, these combination devices are the most prevalent in OEM designs required to meet on-road model year 2007 and later emissions standards. For on-road vehicles of model years older than 2007, some vehicles incorporate a DOC in their OEM design, but generally in Texas these vehicles do not incorporate DPFs unless through a specific retrofit program (e.g. school buses). For off-road applications, some equipment in the Tier 0 – Tier 3 category range incorporates DOCs in their OEM design, but generally do not incorporate DPFs. Tier 4 off-road equipment will generally require some form of DPF in their design in order to meet the stringent PM standards for Tier 4 equipment. It should be noted that in 2009 there are few equipment categories and horsepower ranges for which Tier 4 equipment is available. The phase in for Tier 4 equipment occurs over the period 2008-2014, with earlier phase-in for smaller horsepower equipment (EPA, 2004). Therefore the quantitative determination of excess NO2 in this analysis has to consider both individual DOC usage for pre-MY2007 on-road vehicles and for Tier 0 – Tier 3 off-road equipment, and combined DPF/DOC usage for MY2007 or newer on-road vehicles and Tier 4 off-road equipment. The combination DOC/DPF device (or other catalyzed DPF) has been studied more thoroughly for the potential for excess NO2 emissions than individual DOC devices, and quantitative excess NO2 emissions were developed from the research literature. The primary variables in determining the excess NO2 for heavy-duty trucks and buses, as much of the research literature
April 2009
G:\HARC_H93_DPF\Technical Report\Final\HARC93_DPF-NO2_Final_4-27-09.doc 6
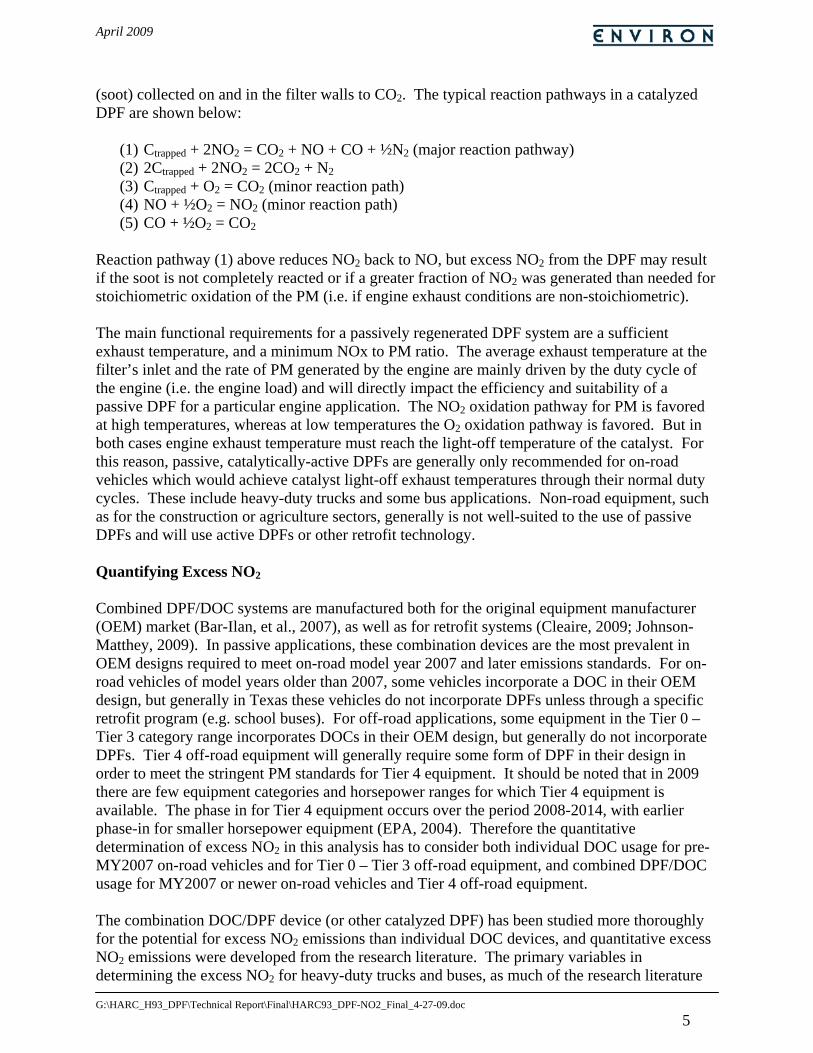
showed, are the exhaust temperature and PM loading. Exhaust temperature affects the chemistry of the device, the exhaust conditions, and therefore the excess NO2 emissions. PM loading affects the fraction of NO2 generated catalytically that is used to oxidize PM. The exhaust temperature and PM loading are themselves functions of the load on the engine, and this varies greatly depending on the duty cycle of the specific vehicle type. The duty cycles can be quite variable, as shown below in Figure 3.
Figure 3. Transient federal test procedure (FTP) for heavy-duty trucks and buses. (Dieselnet, 2000) For the highly variable duty cycle of heavy duty trucks and urban and school buses, detailed load-specific NO2 emissions could not be determined from the studies available. The most detailed study, focusing on school and transit buses and heavy-duty tanker trucks, determined that NO2 emissions in vehicles without a DOC/DPF were generally less than 6% of total NOx by mass (LeTavec, 2002). In vehicles tested with the DOC/DPF combination device, over a variety of simulated duty cycles, these vehicles showed NO2 emissions of 24% to 36% of NOx by mass (LeTavec, 2002). Other studies have shown NO2 emissions at particular engine loads and various duty cycles to range from 10-50% of NOx by mass (Lanni, 2003; Richards, 2004). In addition, for retrofit devices, ARB has instituted a regulation that NO2 emissions not increase by 20% by mass (over baseline) for catalyzed and uncatalyzed DPF systems (CCR, 2009). EPA has followed suit and issued a series of “Dear Manufacturer” letters, informing emission control device manufacturers that retrofit devices must meet ARB’s maximum NO2 emissions increase (EPA, 2007). Considering the variability in excess NO2 emissions from load studies, and the limits imposed on retrofit devices by ARB and EPA, this analysis assumes that NO2 emissions from catalytic DPFs and DOC/DPF combination devices are 30% by mass of NOx emissions as an average over the duty cycle of on-road and off-road equipment using these devices. Baseline emissions from equipment not using these devices are assumed to have NO2 emissions of 10% by mass of NOx. Use of individual DOC devices, such as in some pre-MY2007 on-road vehicles and some Tier 0 – Tier 1 off-road equipment, may or may not result in excess NO2 emissions. Because of the
April 2009
G:\HARC_H93_DPF\Technical Report\Final\HARC93_DPF-NO2_Final_4-27-09.doc 7
variability in the chemical composition and configuration of the DOCs, variability in the engine/equipment types using DOCs, and the variability in the load conditions which might generate excess NO2, it is difficult to quantify excess NO2 emissions from DOCs in a detailed analysis. It was therefore assumed conservatively that any engine or equipment using DOCs would result in similar excess NO2 as for catalyzed DPFs and DOC/DPF combination devices. Baseline emissions of NO2 from engines/equipment not using DOCs were assumed to be 10% by mass of NOx. Emissions of NO2 from engines/equipment using DOCs were assumed to be 30% by mass of NOx. EMISSIONS ANALYSIS An emissions analysis was conducted to quantify excess NO2 emissions from vehicles using DOCs and catalyzed DPFs under two scenarios described below. The basis for the analysis was the DFW 9-county criteria pollutant inventory (Chan et al., 2006). This inventory was adjusted to account for these estimated excess NO2 emissions. In order to construct the excess NO2 emissions scenarios, the vehicles and equipment type that would be included in this analysis were determined by examining the NOx inventories of various vehicle/equipment types, determining the likely percentage of vehicles/equipment using these devices, and applying the excess NO2 emissions percentages discussed in the above section. The process for characterizing the emissions scenarios is described in more detail below. Base Case DFW Inventory The base case inventory for this analysis was the 9-county DFW inventory developed by TCEQ as part of the SIP analysis for DFW, and analyzed as part of the HARC H-72 project (Chan et al., 2006). This inventory provided county-level NOx emissions from heavy-duty on-road trucks, HDDV8a and HDDV8b as modeled using EPA’s MOBILE6 model (EPA, 2003), and from off-road equipment as modeled using EPA’s NONROAD2005 model (EPA, 2005). The results of the inventory analysis from the H-72 project for diesel on-road vehicles are shown below in Table 1.
April 2009
G:\HARC_H93_DPF\Technical Report\Final\HARC93_DPF-NO2_Final_4-27-09.doc 8
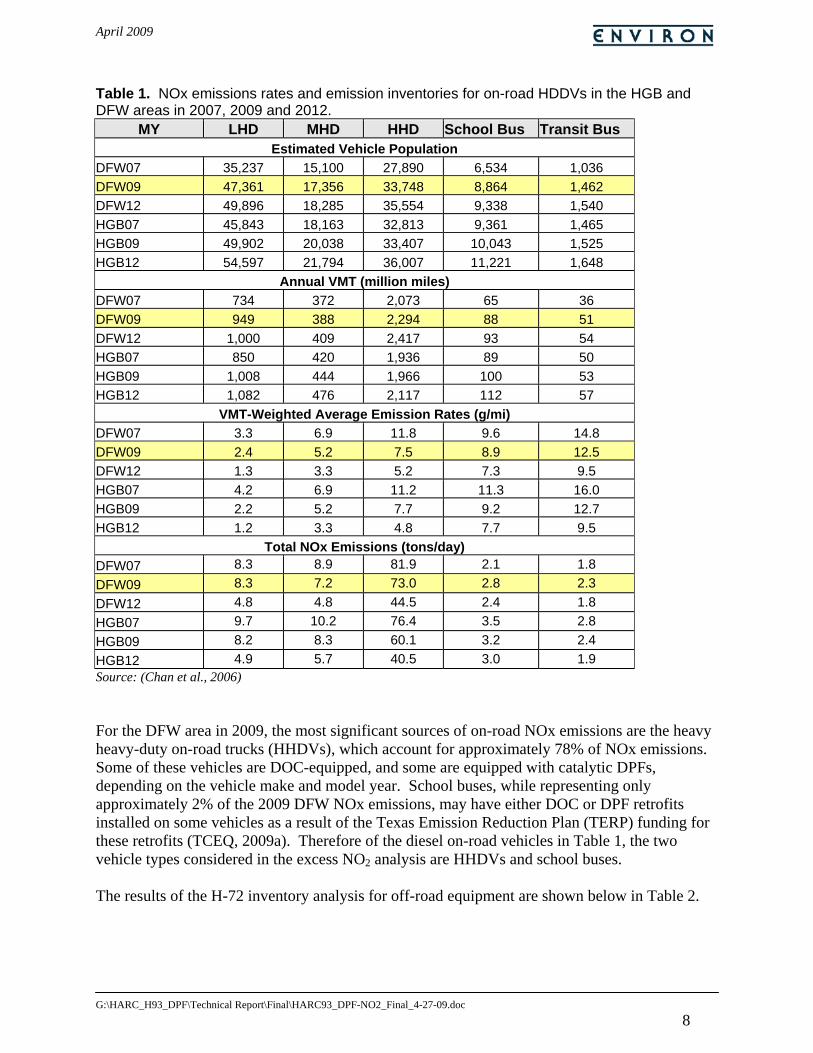
Table 1. NOx emissions rates and emission inventories for on-road HDDVs in the HGB and DFW areas in 2007, 2009 and 2012.
MY LHD MHD HHD School Bus Transit Bus Estimated Vehicle Population
DFW07 35,237 15,100 27,890 6,534 1,036 DFW09 47,361 17,356 33,748 8,864 1,462 DFW12 49,896 18,285 35,554 9,338 1,540 HGB07 45,843 18,163 32,813 9,361 1,465 HGB09 49,902 20,038 33,407 10,043 1,525 HGB12 54,597 21,794 36,007 11,221 1,648
Annual VMT (million miles) DFW07 734 372 2,073 65 36 DFW09 949 388 2,294 88 51 DFW12 1,000 409 2,417 93 54 HGB07 850 420 1,936 89 50 HGB09 1,008 444 1,966 100 53 HGB12 1,082 476 2,117 112 57
VMT-Weighted Average Emission Rates (g/mi) DFW07 3.3 6.9 11.8 9.6 14.8 DFW09 2.4 5.2 7.5 8.9 12.5 DFW12 1.3 3.3 5.2 7.3 9.5 HGB07 4.2 6.9 11.2 11.3 16.0 HGB09 2.2 5.2 7.7 9.2 12.7 HGB12 1.2 3.3 4.8 7.7 9.5
Total NOx Emissions (tons/day) DFW07 8.3 8.9 81.9 2.1 1.8 DFW09 8.3 7.2 73.0 2.8 2.3 DFW12 4.8 4.8 44.5 2.4 1.8 HGB07 9.7 10.2 76.4 3.5 2.8 HGB09 8.2 8.3 60.1 3.2 2.4 HGB12 4.9 5.7 40.5 3.0 1.9 Source: (Chan et al., 2006) For the DFW area in 2009, the most significant sources of on-road NOx emissions are the heavy heavy-duty on-road trucks (HHDVs), which account for approximately 78% of NOx emissions. Some of these vehicles are DOC-equipped, and some are equipped with catalytic DPFs, depending on the vehicle make and model year. School buses, while representing only approximately 2% of the 2009 DFW NOx emissions, may have either DOC or DPF retrofits installed on some vehicles as a result of the Texas Emission Reduction Plan (TERP) funding for these retrofits (TCEQ, 2009a). Therefore of the diesel on-road vehicles in Table 1, the two vehicle types considered in the excess NO2 analysis are HHDVs and school buses. The results of the H-72 inventory analysis for off-road equipment are shown below in Table 2.
April 2009
G:\HARC_H93_DPF\Technical Report\Final\HARC93_DPF-NO2_Final_4-27-09.doc 9
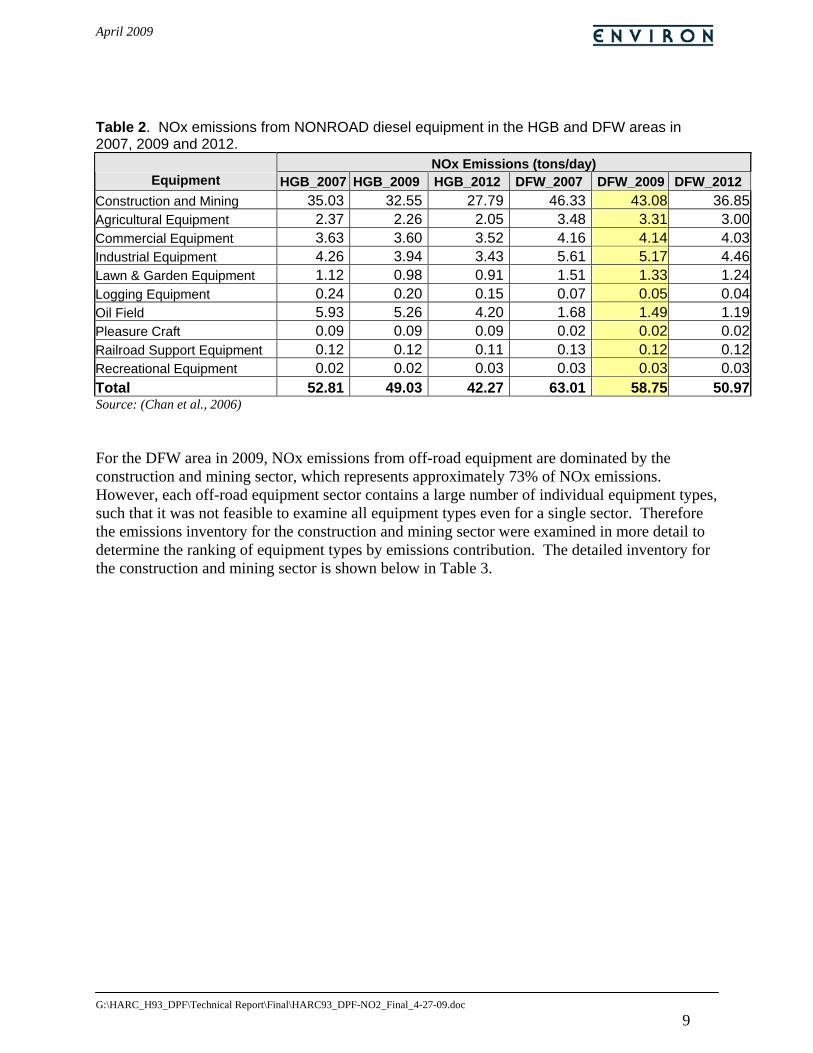
Table 2. NOx emissions from NONROAD diesel equipment in the HGB and DFW areas in 2007, 2009 and 2012.
NOx Emissions (tons/day) Equipment HGB_2007 HGB_2009 HGB_2012 DFW_2007 DFW_2009 DFW_2012
Construction and Mining 35.03 32.55 27.79 46.33 43.08 36.85Agricultural Equipment 2.37 2.26 2.05 3.48 3.31 3.00Commercial Equipment 3.63 3.60 3.52 4.16 4.14 4.03Industrial Equipment 4.26 3.94 3.43 5.61 5.17 4.46Lawn & Garden Equipment 1.12 0.98 0.91 1.51 1.33 1.24Logging Equipment 0.24 0.20 0.15 0.07 0.05 0.04Oil Field 5.93 5.26 4.20 1.68 1.49 1.19Pleasure Craft 0.09 0.09 0.09 0.02 0.02 0.02Railroad Support Equipment 0.12 0.12 0.11 0.13 0.12 0.12Recreational Equipment 0.02 0.02 0.03 0.03 0.03 0.03Total 52.81 49.03 42.27 63.01 58.75 50.97Source: (Chan et al., 2006) For the DFW area in 2009, NOx emissions from off-road equipment are dominated by the construction and mining sector, which represents approximately 73% of NOx emissions. However, each off-road equipment sector contains a large number of individual equipment types, such that it was not feasible to examine all equipment types even for a single sector. Therefore the emissions inventory for the construction and mining sector were examined in more detail to determine the ranking of equipment types by emissions contribution. The detailed inventory for the construction and mining sector is shown below in Table 3.
April 2009
G:\HARC_H93_DPF\Technical Report\Final\HARC93_DPF-NO2_Final_4-27-09.doc 10
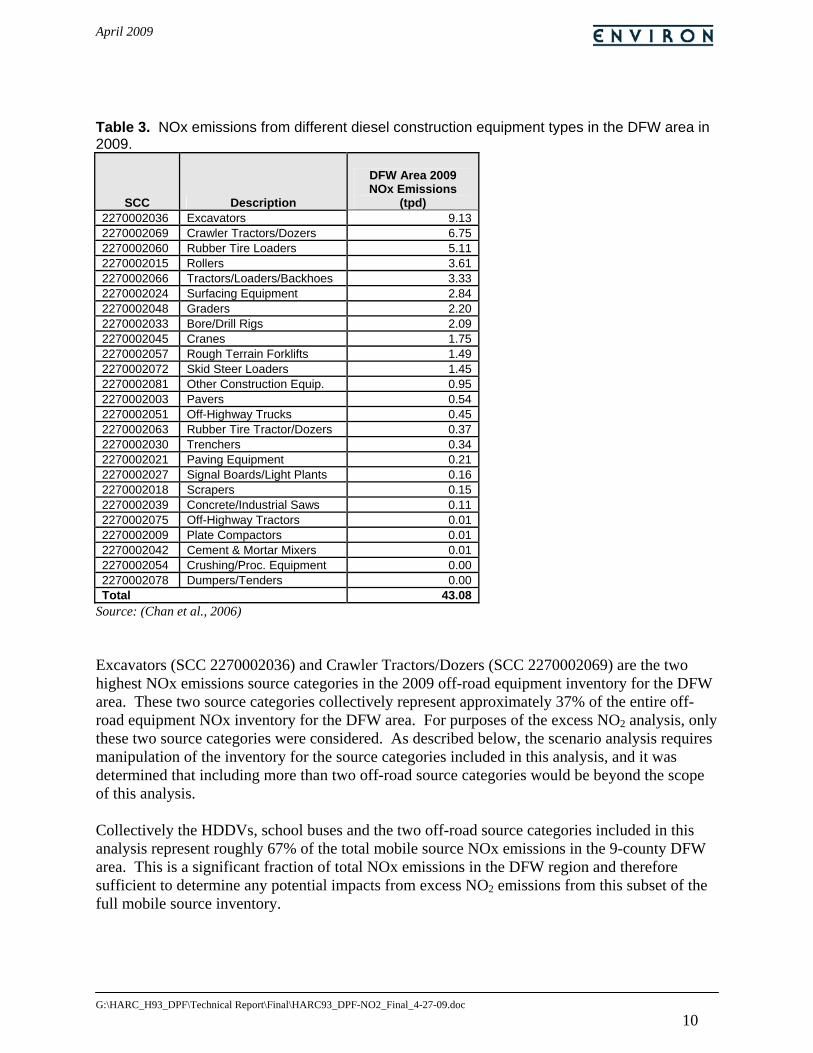
Table 3. NOx emissions from different diesel construction equipment types in the DFW area in 2009.
SCC Description
DFW Area 2009 NOx Emissions
(tpd) 2270002036 Excavators 9.132270002069 Crawler Tractors/Dozers 6.752270002060 Rubber Tire Loaders 5.112270002015 Rollers 3.612270002066 Tractors/Loaders/Backhoes 3.332270002024 Surfacing Equipment 2.842270002048 Graders 2.202270002033 Bore/Drill Rigs 2.092270002045 Cranes 1.752270002057 Rough Terrain Forklifts 1.492270002072 Skid Steer Loaders 1.452270002081 Other Construction Equip. 0.952270002003 Pavers 0.542270002051 Off-Highway Trucks 0.452270002063 Rubber Tire Tractor/Dozers 0.372270002030 Trenchers 0.342270002021 Paving Equipment 0.212270002027 Signal Boards/Light Plants 0.162270002018 Scrapers 0.152270002039 Concrete/Industrial Saws 0.112270002075 Off-Highway Tractors 0.012270002009 Plate Compactors 0.012270002042 Cement & Mortar Mixers 0.012270002054 Crushing/Proc. Equipment 0.002270002078 Dumpers/Tenders 0.00Total 43.08
Source: (Chan et al., 2006) Excavators (SCC 2270002036) and Crawler Tractors/Dozers (SCC 2270002069) are the two highest NOx emissions source categories in the 2009 off-road equipment inventory for the DFW area. These two source categories collectively represent approximately 37% of the entire off-road equipment NOx inventory for the DFW area. For purposes of the excess NO2 analysis, only these two source categories were considered. As described below, the scenario analysis requires manipulation of the inventory for the source categories included in this analysis, and it was determined that including more than two off-road source categories would be beyond the scope of this analysis. Collectively the HDDVs, school buses and the two off-road source categories included in this analysis represent roughly 67% of the total mobile source NOx emissions in the 9-county DFW area. This is a significant fraction of total NOx emissions in the DFW region and therefore sufficient to determine any potential impacts from excess NO2 emissions from this subset of the full mobile source inventory.
April 2009
G:\HARC_H93_DPF\Technical Report\Final\HARC93_DPF-NO2_Final_4-27-09.doc 11
Emissions Scenarios Two emissions scenarios for excess NO2 were considered in this analysis:
(1) A “maximum penetration” scenario (2) A “realistic” scenario
Both scenarios considered calendar year 2009 and began with the base case 2009 DFW NOx inventory as described above. The maximum penetration scenario considered the excess NO2 emissions if all of the vehicles/equipment types considered in the analysis were turned over to MY2007 or newer on-road vehicles and/or Tier 4 off-road equipment., such that these vehicles would be equipped with OEM catalyzed DPFs in order to meet emissions standards. This scenario resulted in changes both to NO2 emissions and to the overall NOx emissions inventory from these source categories. The accelerated turnover in the maximum penetration scenario was intended to simulate a far future year in which a greater fraction of the fleets of these vehicles would be using devices with potential excess NO2 emissions. The realistic scenario considered the actual penetration of devices with potential excess NO2 emissions into the 2009 modeled DFW fleet. In this scenario, DOC usage by pre-MY2007 and Tier 0-3 in-use vehicles and equipment, and DPF usage by MY2007-MY2009 vehicles and Tier 4 equipment was examined, and this information was used to construct an inventory of excess NO2. The realistic scenario was developed to examine the potential impacts of excess NO2 emissions from devices currently in use in the DFW area in 2009. The implementation of each scenario into emissions models is described below. The MOBILE6 model (EPA, 2003) was used to estimate NOx emissions by model year of heavy duty diesel class 8 trucks (HDDV8A and HDDV8B) and diesel school buses (HDDBS). Post-processing of the model year output database was used to evaluate the two scenarios. The NONROAD2004 model (EPA, 2005) was used to estimate NOx emissions of the two types of construction and mining equipment: excavators and crawler tractors/dozers. NOx exhausted from vehicles equipped with a DPF or DOC was assumed to contain 30% NO2 instead of 10%. The off-road equipment meeting final Tier 4 standards is conservatively assumed to be equipped with DPFs or DOCs, generating excess NO2. None of the horsepower levels of the two equipment types at the interim Tier 4 case are assumed to have these devices or generate any excess NO2. The percent of NOx affected by excess NO2 was calculated for each scenario, and this percent was used to adjust the previous TCEQ NO2 inventory for the DFW area. Maximum Penetration Scenario EPA (EPA, 2000 regulations) finalized PM emissions standards for new heavy-duty diesel engines to take full effect in the 2007 model year. The tighter PM standards along with the introduction of low-sulfur diesel fuel enabled the use of catalyzed DPFs and DOCs, so all 2007 and later model year diesel trucks must be equipped with these emission control devices to meet the PM standards. An unrealistically rapid vehicle turnover rate by 2009 was considered in which all pre-MY2007 trucks are removed from the fleet and replaced by MY2007-MY2009 vehicles, all of which contain the emission control devices that emit a higher NO2/NOx ratio. The Texas Clean School Bus Program receives funding which is in part to retrofit diesel school buses with closed crankcase systems, DPFs, DOCs and partial flow-through filters (FTF) (TCEQ, 2009b). The maximum penetration scenario for these buses assumes that 100% of the vehicles are retrofit with the emission control devices. EPA’s final Tier 4 emissions standards
April 2009
G:\HARC_H93_DPF\Technical Report\Final\HARC93_DPF-NO2_Final_4-27-09.doc 12
for off-road diesel engines are similar in stringency to the 2007 highway diesel emissions rule with respect to PM emissions, and thus require the use of control devices (EPA, 2004). For purposes of the maximum penetration scenario, excavators and crawler tractor/dozers are assumed to meet final Tier 4 emissions standards in 2009. It should be noted that the final rule is implemented on a phased-in schedule. Under the phase-in schedule excavators and crawler tractor/dozers of typical horsepower ranges from 100hp – 750hp which meet the final Tier 4 emissions standards would likely not be available in 2009. However, for the maximum penetration scenario these are modeled as meeting the final 2009 PM emissions standard in order to represent a most conservative assumption. In the maximum penetration scenario for 2009:
• All heavy duty class 8a and 8b diesel trucks are model year 2007 to 2009 • 100% of diesel school buses are retrofit with DPFs • 100% of off-road equipment (excavators and crawler tractors/dozers) meet final Tier 4
emission standards On-Road HDDVs and School Buses A single 2009 MOBILE6 model run for Texas was used to obtain gram per mile NOx emission rates for HDDV8A, HDDV8B and HDDBS by model year. MOBILE6 keeps track of 25 model years, with the oldest model year group 1985 containing all 1985 and older vehicles. Increasing vehicle age corresponds to higher deterioration and higher emission rates. In addition to emission factors, the model database output contains miles traveled by each model year and registration distribution fractions. Miles by model year is based on mileage accrual rates with vehicle age. Registration distribution reflects the fraction of vehicle population in a particular model year. The product of miles and registration distribution in fraction form is termed the travel fraction and is the basis by which MOBILE6 weights by-model-year emission factors into a single emission factor for a given vehicle class. This is shown below in Equation (1) and Equation (2):
Equation (1) ( )TOTTOT
MYMYMYtravel AP
Apf××
=,
where:
ftravel is the travel fraction (sums to 1 over all model years) pMY is the fractional population in of model year MY AMY is the mileage accrual for a vehicle of model year MY [mi/day] PTOT is the fractional population for vehicles of all model years (PTOT = 1) ATOT is the total mileage accrual for vehicles of all model years [mi/day]
Equation (2) MY
MYMYtravelcomp EFfEF ×=∑ ,
where:
EFcomp is the composite fleet emissions factor of a particular pollutant [g/mi] ftravel is the travel fraction (sums to 1 over all model years) EFMY is the emissions factor for a vehicle of model year MY of a particular pollutant [g/mi]
This post-processing step was performed on the heavy duty diesel class 8 trucks (1) with normal travel fractions for model years 2009 to 1985+, and (2) with travel fractions rescaled so that
April 2009
G:\HARC_H93_DPF\Technical Report\Final\HARC93_DPF-NO2_Final_4-27-09.doc 13
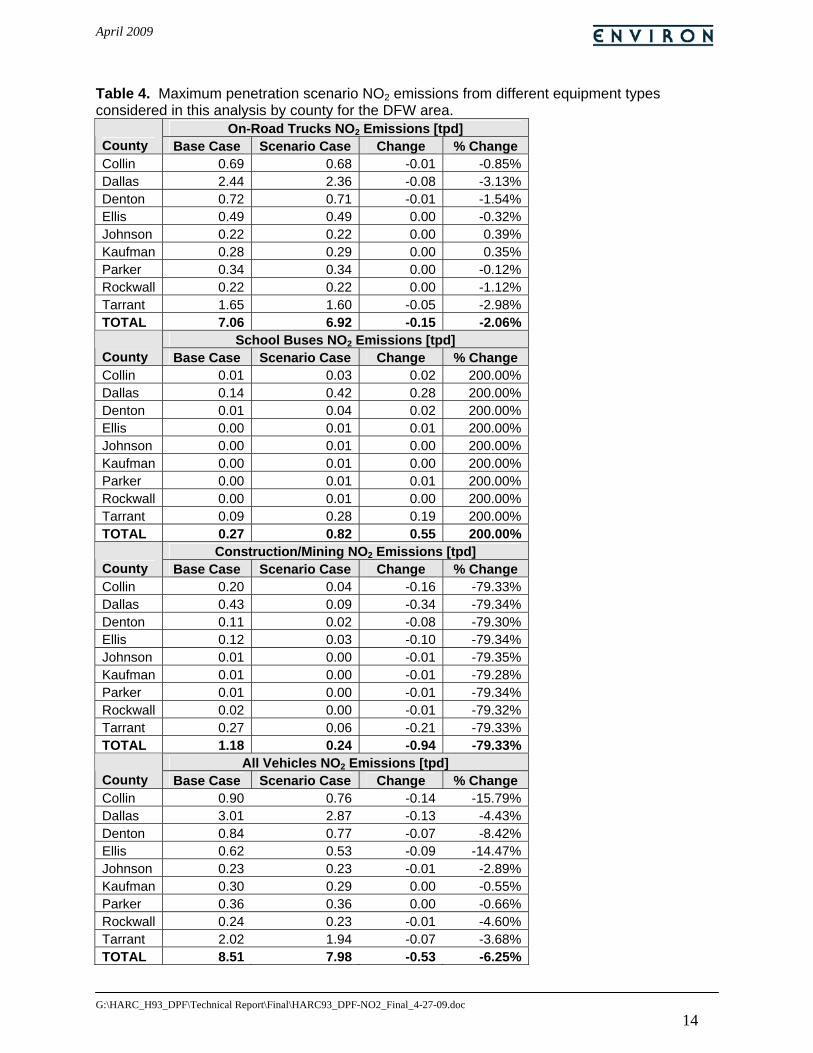
model years 2009 to 2007 contain 100% of the travel fraction and 2006 through 1985+ model years contain 0%, eliminating them from the fleet. No model post-processing was required for school buses in this scenario, as no fleet turnover change is required to achieve 100% retrofit of the fleet with devices that lead to excess NO2. Off-Road Construction Equipment 2009 NONROAD model runs were performed to assess the maximum penetration scenario. In these maximum penetration scenario runs it was assumed that all horsepower levels of excavators and crawler tractor/dozers meet final Tier 4 standards. Tier 4 emissions standards for off-road equipment are phased in over the period 2008-2014, depending on the horsepower of the equipment. Tier 4 emissions standards for off-road equipment require a significant reduction in NOx emissions. It should be noted that engines certified to final Tier 4 emissions standards will not be available in 2009. In order to investigate the effects of the maximum usage of DPF and DOC control devices in such equipment, ENVIRON assumed that all diesel fueled excavators and crawler tractor/dozers engines met final Tier 4 emissions standards. The populations of excavators and crawler tractor/dozers in the Tier 0-3 categories were adjusted to zero, and were added to the final Tier 4 category such that the total population of this equipment in the 9-county DFW region remained unchanged. Summary The results of the maximum penetration scenario analysis for the on-road and off-road equipment types is shown below in Table 4.
April 2009
G:\HARC_H93_DPF\Technical Report\Final\HARC93_DPF-NO2_Final_4-27-09.doc 14
Table 4. Maximum penetration scenario NO2 emissions from different equipment types considered in this analysis by county for the DFW area.
On-Road Trucks NO2 Emissions [tpd] County Base Case Scenario Case Change % Change Collin 0.69 0.68 -0.01 -0.85%Dallas 2.44 2.36 -0.08 -3.13%Denton 0.72 0.71 -0.01 -1.54%Ellis 0.49 0.49 0.00 -0.32%Johnson 0.22 0.22 0.00 0.39%Kaufman 0.28 0.29 0.00 0.35%Parker 0.34 0.34 0.00 -0.12%Rockwall 0.22 0.22 0.00 -1.12%Tarrant 1.65 1.60 -0.05 -2.98%TOTAL 7.06 6.92 -0.15 -2.06%
School Buses NO2 Emissions [tpd] County Base Case Scenario Case Change % Change Collin 0.01 0.03 0.02 200.00%Dallas 0.14 0.42 0.28 200.00%Denton 0.01 0.04 0.02 200.00%Ellis 0.00 0.01 0.01 200.00%Johnson 0.00 0.01 0.00 200.00%Kaufman 0.00 0.01 0.00 200.00%Parker 0.00 0.01 0.01 200.00%Rockwall 0.00 0.01 0.00 200.00%Tarrant 0.09 0.28 0.19 200.00%TOTAL 0.27 0.82 0.55 200.00%
Construction/Mining NO2 Emissions [tpd] County Base Case Scenario Case Change % Change Collin 0.20 0.04 -0.16 -79.33%Dallas 0.43 0.09 -0.34 -79.34%Denton 0.11 0.02 -0.08 -79.30%Ellis 0.12 0.03 -0.10 -79.34%Johnson 0.01 0.00 -0.01 -79.35%Kaufman 0.01 0.00 -0.01 -79.28%Parker 0.01 0.00 -0.01 -79.34%Rockwall 0.02 0.00 -0.01 -79.32%Tarrant 0.27 0.06 -0.21 -79.33%TOTAL 1.18 0.24 -0.94 -79.33%
All Vehicles NO2 Emissions [tpd] County Base Case Scenario Case Change % Change Collin 0.90 0.76 -0.14 -15.79%Dallas 3.01 2.87 -0.13 -4.43%Denton 0.84 0.77 -0.07 -8.42%Ellis 0.62 0.53 -0.09 -14.47%Johnson 0.23 0.23 -0.01 -2.89%Kaufman 0.30 0.29 0.00 -0.55%Parker 0.36 0.36 0.00 -0.66%Rockwall 0.24 0.23 -0.01 -4.60%Tarrant 2.02 1.94 -0.07 -3.68%TOTAL 8.51 7.98 -0.53 -6.25%
April 2009
G:\HARC_H93_DPF\Technical Report\Final\HARC93_DPF-NO2_Final_4-27-09.doc 15
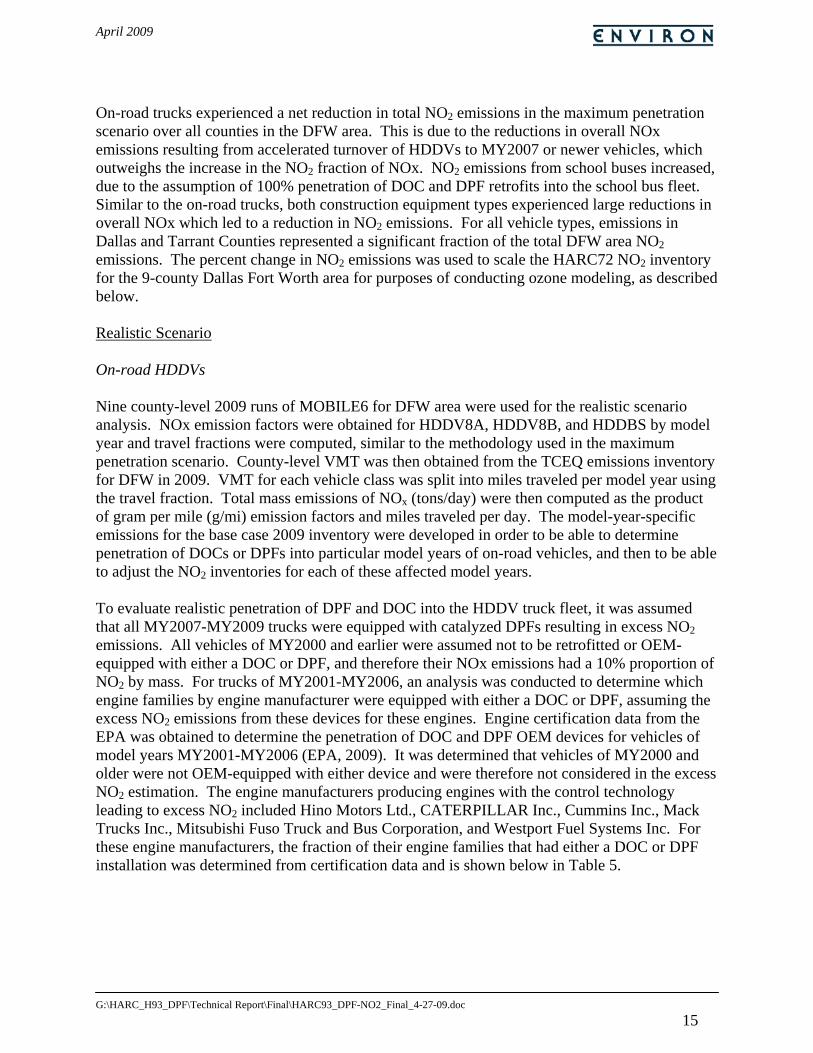
On-road trucks experienced a net reduction in total NO2 emissions in the maximum penetration scenario over all counties in the DFW area. This is due to the reductions in overall NOx emissions resulting from accelerated turnover of HDDVs to MY2007 or newer vehicles, which outweighs the increase in the NO2 fraction of NOx. NO2 emissions from school buses increased, due to the assumption of 100% penetration of DOC and DPF retrofits into the school bus fleet. Similar to the on-road trucks, both construction equipment types experienced large reductions in overall NOx which led to a reduction in NO2 emissions. For all vehicle types, emissions in Dallas and Tarrant Counties represented a significant fraction of the total DFW area NO2 emissions. The percent change in NO2 emissions was used to scale the HARC72 NO2 inventory for the 9-county Dallas Fort Worth area for purposes of conducting ozone modeling, as described below. Realistic Scenario On-road HDDVs Nine county-level 2009 runs of MOBILE6 for DFW area were used for the realistic scenario analysis. NOx emission factors were obtained for HDDV8A, HDDV8B, and HDDBS by model year and travel fractions were computed, similar to the methodology used in the maximum penetration scenario. County-level VMT was then obtained from the TCEQ emissions inventory for DFW in 2009. VMT for each vehicle class was split into miles traveled per model year using the travel fraction. Total mass emissions of NOx (tons/day) were then computed as the product of gram per mile (g/mi) emission factors and miles traveled per day. The model-year-specific emissions for the base case 2009 inventory were developed in order to be able to determine penetration of DOCs or DPFs into particular model years of on-road vehicles, and then to be able to adjust the NO2 inventories for each of these affected model years. To evaluate realistic penetration of DPF and DOC into the HDDV truck fleet, it was assumed that all MY2007-MY2009 trucks were equipped with catalyzed DPFs resulting in excess NO2 emissions. All vehicles of MY2000 and earlier were assumed not to be retrofitted or OEM-equipped with either a DOC or DPF, and therefore their NOx emissions had a 10% proportion of NO2 by mass. For trucks of MY2001-MY2006, an analysis was conducted to determine which engine families by engine manufacturer were equipped with either a DOC or DPF, assuming the excess NO2 emissions from these devices for these engines. Engine certification data from the EPA was obtained to determine the penetration of DOC and DPF OEM devices for vehicles of model years MY2001-MY2006 (EPA, 2009). It was determined that vehicles of MY2000 and older were not OEM-equipped with either device and were therefore not considered in the excess NO2 estimation. The engine manufacturers producing engines with the control technology leading to excess NO2 included Hino Motors Ltd., CATERPILLAR Inc., Cummins Inc., Mack Trucks Inc., Mitsubishi Fuso Truck and Bus Corporation, and Westport Fuel Systems Inc. For these engine manufacturers, the fraction of their engine families that had either a DOC or DPF installation was determined from certification data and is shown below in Table 5.
April 2009
G:\HARC_H93_DPF\Technical Report\Final\HARC93_DPF-NO2_Final_4-27-09.doc 16
Table 5. Usage of DOC/DPF in certified engine families by engine manufacturer for model years 2001-2006.
Engine Manufacturer
Model Year Hino Motors,
Ltd. CATERPILLAR,
Inc. Cummins,
Inc.
Mack Trucks,
Inc.
Mitsubishi Fuso Truck and Bus
Corp.
Westport Fuel
Systems DOC/DPF Count 1 2001 % of Total 100% DOC/DPF Count 1 2002 % of Total 100% DOC/DPF Count 1 5 2003 % of Total 100% 100% DOC/DPF Count 1 3 2004 % of Total 100% 100% DOC/DPF Count 1 3 2005 % of Total 100% 100% DOC/DPF Count 2 3 8 4 1 1 2006 % of Total 100% 100% 61.5% 36.3% 100% 100%
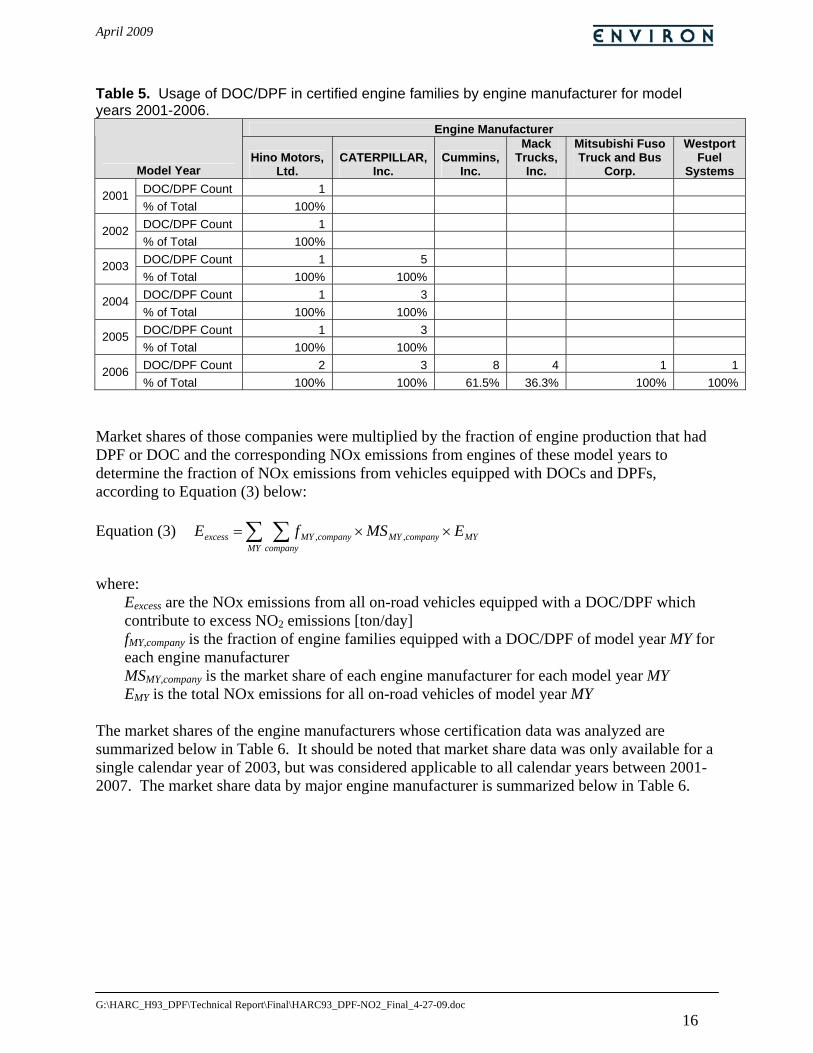
Market shares of those companies were multiplied by the fraction of engine production that had DPF or DOC and the corresponding NOx emissions from engines of these model years to determine the fraction of NOx emissions from vehicles equipped with DOCs and DPFs, according to Equation (3) below: Equation (3) ∑ ∑ ××=
MY companyMYcompanyMYcompanyMYexcess EMSfE ,,
where:
Eexcess are the NOx emissions from all on-road vehicles equipped with a DOC/DPF which contribute to excess NO2 emissions [ton/day] fMY,company is the fraction of engine families equipped with a DOC/DPF of model year MY for each engine manufacturer MSMY,company is the market share of each engine manufacturer for each model year MY EMY is the total NOx emissions for all on-road vehicles of model year MY
The market shares of the engine manufacturers whose certification data was analyzed are summarized below in Table 6. It should be noted that market share data was only available for a single calendar year of 2003, but was considered applicable to all calendar years between 2001-2007. The market share data by major engine manufacturer is summarized below in Table 6.
April 2009
G:\HARC_H93_DPF\Technical Report\Final\HARC93_DPF-NO2_Final_4-27-09.doc 17
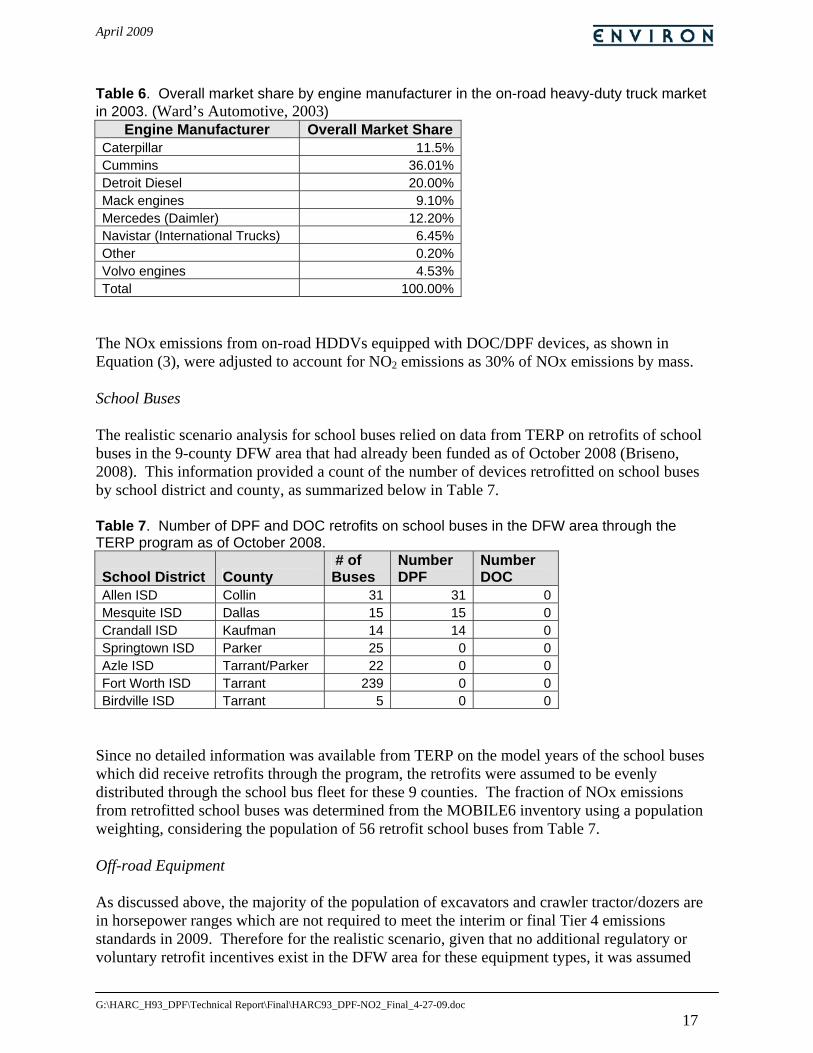
Table 6. Overall market share by engine manufacturer in the on-road heavy-duty truck market in 2003. (Ward’s Automotive, 2003)
Engine Manufacturer Overall Market ShareCaterpillar 11.5%Cummins 36.01%Detroit Diesel 20.00%Mack engines 9.10%Mercedes (Daimler) 12.20%Navistar (International Trucks) 6.45%Other 0.20%Volvo engines 4.53%Total 100.00%
The NOx emissions from on-road HDDVs equipped with DOC/DPF devices, as shown in Equation (3), were adjusted to account for NO2 emissions as 30% of NOx emissions by mass. School Buses The realistic scenario analysis for school buses relied on data from TERP on retrofits of school buses in the 9-county DFW area that had already been funded as of October 2008 (Briseno, 2008). This information provided a count of the number of devices retrofitted on school buses by school district and county, as summarized below in Table 7. Table 7. Number of DPF and DOC retrofits on school buses in the DFW area through the TERP program as of October 2008.
School District County # of Buses
Number DPF
Number DOC
Allen ISD Collin 31 31 0Mesquite ISD Dallas 15 15 0Crandall ISD Kaufman 14 14 0Springtown ISD Parker 25 0 0Azle ISD Tarrant/Parker 22 0 0Fort Worth ISD Tarrant 239 0 0Birdville ISD Tarrant 5 0 0
Since no detailed information was available from TERP on the model years of the school buses which did receive retrofits through the program, the retrofits were assumed to be evenly distributed through the school bus fleet for these 9 counties. The fraction of NOx emissions from retrofitted school buses was determined from the MOBILE6 inventory using a population weighting, considering the population of 56 retrofit school buses from Table 7. Off-road Equipment As discussed above, the majority of the population of excavators and crawler tractor/dozers are in horsepower ranges which are not required to meet the interim or final Tier 4 emissions standards in 2009. Therefore for the realistic scenario, given that no additional regulatory or voluntary retrofit incentives exist in the DFW area for these equipment types, it was assumed
April 2009
G:\HARC_H93_DPF\Technical Report\Final\HARC93_DPF-NO2_Final_4-27-09.doc 18
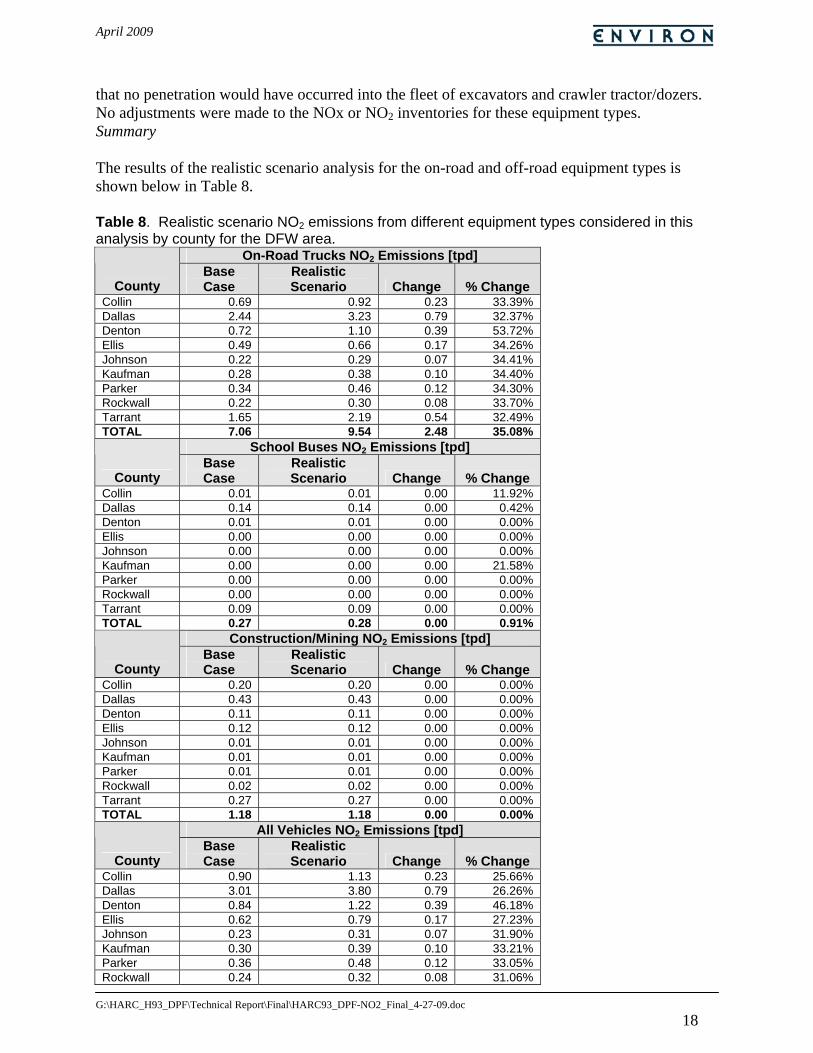
that no penetration would have occurred into the fleet of excavators and crawler tractor/dozers. No adjustments were made to the NOx or NO2 inventories for these equipment types. Summary The results of the realistic scenario analysis for the on-road and off-road equipment types is shown below in Table 8. Table 8. Realistic scenario NO2 emissions from different equipment types considered in this analysis by county for the DFW area.
On-Road Trucks NO2 Emissions [tpd]
County Base Case
Realistic Scenario Change % Change
Collin 0.69 0.92 0.23 33.39% Dallas 2.44 3.23 0.79 32.37% Denton 0.72 1.10 0.39 53.72% Ellis 0.49 0.66 0.17 34.26% Johnson 0.22 0.29 0.07 34.41% Kaufman 0.28 0.38 0.10 34.40% Parker 0.34 0.46 0.12 34.30% Rockwall 0.22 0.30 0.08 33.70% Tarrant 1.65 2.19 0.54 32.49% TOTAL 7.06 9.54 2.48 35.08%
School Buses NO2 Emissions [tpd]
County Base Case
Realistic Scenario Change % Change
Collin 0.01 0.01 0.00 11.92% Dallas 0.14 0.14 0.00 0.42% Denton 0.01 0.01 0.00 0.00% Ellis 0.00 0.00 0.00 0.00% Johnson 0.00 0.00 0.00 0.00% Kaufman 0.00 0.00 0.00 21.58% Parker 0.00 0.00 0.00 0.00% Rockwall 0.00 0.00 0.00 0.00% Tarrant 0.09 0.09 0.00 0.00% TOTAL 0.27 0.28 0.00 0.91%
Construction/Mining NO2 Emissions [tpd]
County Base Case
Realistic Scenario Change % Change
Collin 0.20 0.20 0.00 0.00% Dallas 0.43 0.43 0.00 0.00% Denton 0.11 0.11 0.00 0.00% Ellis 0.12 0.12 0.00 0.00% Johnson 0.01 0.01 0.00 0.00% Kaufman 0.01 0.01 0.00 0.00% Parker 0.01 0.01 0.00 0.00% Rockwall 0.02 0.02 0.00 0.00% Tarrant 0.27 0.27 0.00 0.00% TOTAL 1.18 1.18 0.00 0.00%
All Vehicles NO2 Emissions [tpd]
County Base Case
Realistic Scenario Change % Change
Collin 0.90 1.13 0.23 25.66% Dallas 3.01 3.80 0.79 26.26% Denton 0.84 1.22 0.39 46.18% Ellis 0.62 0.79 0.17 27.23% Johnson 0.23 0.31 0.07 31.90% Kaufman 0.30 0.39 0.10 33.21% Parker 0.36 0.48 0.12 33.05% Rockwall 0.24 0.32 0.08 31.06%
April 2009
G:\HARC_H93_DPF\Technical Report\Final\HARC93_DPF-NO2_Final_4-27-09.doc 19
Tarrant 2.02 2.55 0.54 26.61% TOTAL 8.51 10.99 2.48 29.12%
In the realistic scenario, all estimated percentage changes in NO2 emissions are greater than zero except for the off-road equipment which is not predicted to be a source of excess NO2 emissions. The vast majority of the excess NO2 emissions are due to DOC/DPF devices in on-road HDDVs, with a minor fraction coming from school buses. The total increase in NO2 emissions from all of these mobile sources is approximately 30%. The percentage increases by vehicle/equipment type from this analysis were applied to the TCEQ inventory for purposes of conducting ozone modeling. OZONE MODELING An existing future year 2009 CAMx ozone modeling database developed for the DFW area was used in this analysis (Kemball-Cook et al., 2006). The 2009 model is based on June 2005 meteorology developed at Texas A&M University and 2009 emissions data developed by the TCEQ and adjusted by ENVIRON. Modeling was performed using version 4.51 of the Comprehensive Air quality Model with extensions (ENVIRON, 2008) with the Carbon Bond 2005 (CB05) chemical mechanism. Modeling Domain The 2009 modeling domain is shown in Figure 4, and consists of three nested grids. The MM5 36-km grid, outlined in black, encompasses the mainland U.S., Mexico, and much of Canada. The MM5 12-km grid is centered on Texas, and is also outlined in black. The CAMx 36-km coarse grid is outlined in red, and covers the entire eastern U.S. and portions of Canada and Mexico. It has 69 grid cells in the east-west direction, 67 grid cells in the north-south direction, and 20 layers in the vertical. The 12-km nested grid, outlined in blue, is a 1068-km by 1068-km square (96 x 96 grid cells) covering the eastern half of Texas and most of Louisiana, Mississippi, Arkansas, and Oklahoma. The 4-km grid is bounded by a green rectangle, and is centered on the DFW region and has 74 grid cells in the east-west direction and 65 grid cells in the north-south direction. The 12-km and 4-km grids have the same vertical structure as the 36 km grid. CAMx was run for one episode covering June 18-23 2005, using a 36-km resolution grid with nested 12-km and 4-km grids over the DFW region. Meteorological Data CAMx requires meteorological input data for the parameters shown in Table 9. Meteorological input data for CAMx were developed using the PSU/NCAR Mesoscale Model version 5 (Duhdia, 1993). The MM5 run was provided by Texas A&M University, and used the following column physics options:
• ETA planetary boundary layer scheme • NOAH land surface model • Kain-Fritsch II cumulus parameterization • Simple ice moist physics • RRTM radiation package

April 2009
G:\HARC_H93_DPF\Technical Report\Final\HARC93_DPF-NO2_Final_4-27-09.doc 20
Figure 4. CAMx 36 km domain (outlined in red), 12 km CAMx modeling domain (outlined in blue), and CAMx DFW 4 km domain (outlined in green) for the 2005 ozone model.
Table 9. CAMx meteorological input data requirements.
CAMx Input Parameter Description Layer interface height (m) 3-D gridded time-varying layer heights for the start and end of each hour Winds (m/s) 3-D gridded wind vectors (u,v) for the start and end of each hour Temperature (K) 3-D gridded temperature and 2-D gridded surface temperature for the
start and end of each hour Pressure (mb) 3-D gridded pressure for the start and end of each hour Vertical Diffusivity (m2/s) 3-D gridded vertical exchange coefficients for each hour Water Vapor (ppm) 3-D gridded water vapor mixing ratio for each hour Clouds and Rainfall (g/m3) 3-D gridded cloud and rain liquid water content for each hour
Meteorological data were reformatted from MM5 to CAMx-ready inputs using the MM5CAMx processor with some layer aggregation above the PBL as shown in Table 10. CAMx was run with 20 vertical layers, a model top located above an altitude of 18 km and a surface layer thickness of 20 meters. Vertical diffusivity coefficients for CAMx were calculated from turbulent kinetic energy (TKE) produced by the MM5 ETA PBL scheme. Vertical diffusivity coefficient (Kv) values near the ground were modified because the MM5 does not seem to capture real world near-surface mixing of trace gases. First, land-use dependant minimum Kv
April 2009
G:\HARC_H93_DPF\Technical Report\Final\HARC93_DPF-NO2_Final_4-27-09.doc 21
values were applied in the surface layer. Then, in each vertical column, the maximum diffusivity encountered in the lowest 100 meters was applied to all layers below 100 meters. Table 10. MM5 and CAMx vertical grid structures based on 28 sigma-p levels. Heights (m) are above ground level according to a standard atmosphere; pressure is in millibars.
Layer sigma pressure height thickness CAMx Layers ===========================================| |=============== 28 0.0000 50.00 18874.41 1706.76 27 0.0250 73.75 17167.65 1362.47 26 0.0500 97.50 15805.17 2133.42 --20--- 25 0.1000 145.00 13671.75 1664.35 --19--- 24 0.1500 192.50 12007.40 1376.75 23 0.2000 240.00 10630.65 1180.35 --18--- 22 0.2500 287.50 9450.30 1036.79 21 0.3000 335.00 8413.52 926.80 --17--- 20 0.3500 382.50 7486.72 839.57 19 0.4000 430.00 6647.15 768.53 18 0.4500 477.50 5878.62 709.45 --16--- 17 0.5000 525.00 5169.17 659.47 16 0.5500 572.50 4509.70 616.58 15 0.6000 620.00 3893.12 579.34 --15--- 14 0.6500 667.50 3313.78 546.67 --14--- 13 0.7000 715.00 2767.11 517.77 --13--- 12 0.7500 762.50 2249.35 491.99 --12--- 11 0.8000 810.00 1757.36 376.81 --11--- 10 0.8400 848.00 1380.55 273.60 --10--- 9 0.8700 876.50 1106.95 266.37 ---9--- 8 0.9000 905.00 840.58 259.54 ---8--- 7 0.9300 933.50 581.04 169.41 ---7--- 6 0.9500 952.50 411.63 166.65 ---6--- 5 0.9700 971.50 244.98 82.31 ---5--- 4 0.9800 981.00 162.67 65.38 ---4--- 3 0.9880 988.60 97.29 56.87 ---3--- 2 0.9950 995.25 40.43 20.23 ---2--- 1 0.9975 997.62 20.19 20.19 ---1--- 0 1.0000 1000.00 0.00 ========= Surface ======
Emissions Modeling The emission impacts from the maximum penetration and realistic scenarios were evaluated for a June 2009 future year episode by adjusting a 2009 base inventory using the Emissions Processing System version 3 (EPS3). The base inventory was developed by the TCEQ for the DFW SIP and has been referred to as run “lo_combo10” because it includes a combined package of SIP emission reduction strategies. Three emission inventories were prepared (referred to as runs 1 through 3):
1. 2009 lo_combo10 (run 1): Future year emissions for 2009 estimated by TCEQ and for the DFW SIP.
2. 2009 lo_combo10 with total NOx controls (run 2): This run corresponds to the maximum penetration scenario. The estimated percentage changes to emissions of NOx were applied to the model-ready inventories for on-road HDDV8 vehicles, excavator and crawler tractor/dozers, and school buses. An increase in the NO2/NOx ratio was applied for these source categories.
3. 2009 lo_combo10 with 30% NO2/NOx ratio controls (run 3): This run corresponds to the realistic scenario. Total NOx emissions were left unchanged from run1, but the
April 2009
G:\HARC_H93_DPF\Technical Report\Final\HARC93_DPF-NO2_Final_4-27-09.doc 22
NO2/NOx ratio was increased for a portion of the NOx emissions from the same vehicle classes as scaled in run 2.
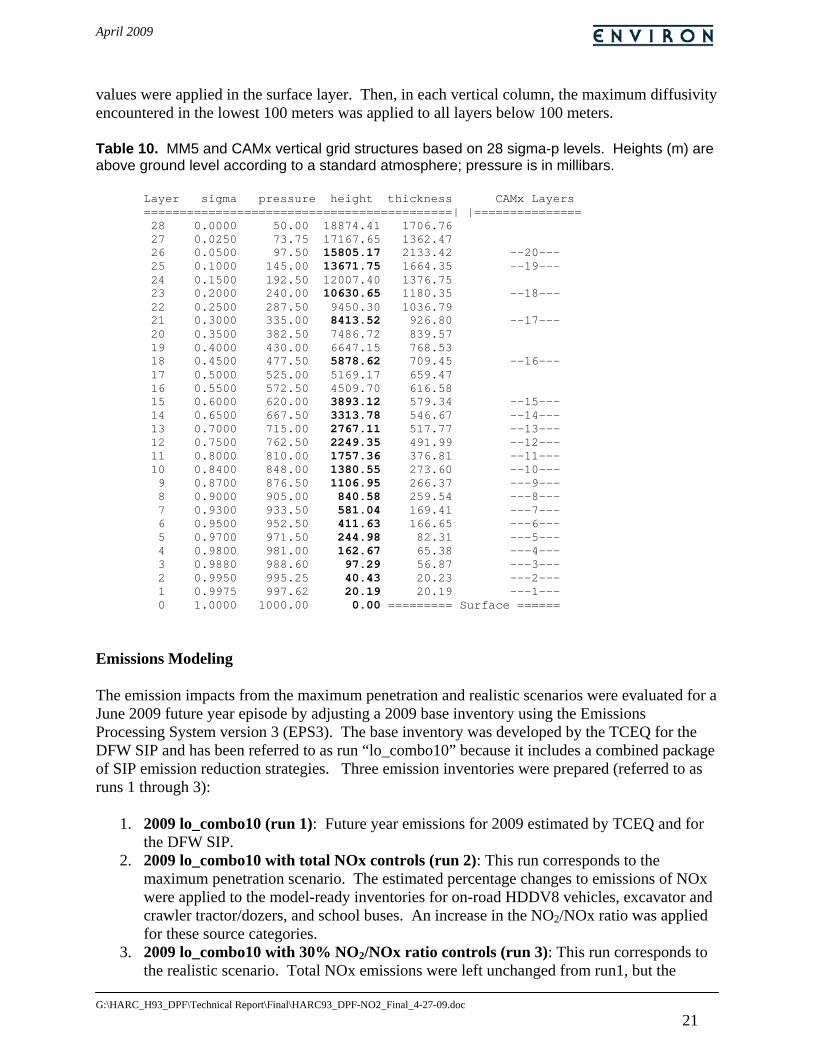
For run 2, NOx scaling factors were applied to specific vehicle classes, based on full market penetration, which was simulated by an accelerated turnover of vehicles to newer models. The on-road mobile controls had to be applied by estimating what percentage of Class 8 heavy duty diesel vehicles by SCC code were comprised of model year 2007 or newer vehicles by June 2009, then applying this factor to each SCC code since EPS3 does not have model year information. Table 11 shows a 45 tpd NOx decrease for the 9-county DFW area associated with application of the assumptions from the maximum penetration scenario. A similar procedure was followed for the two highest-emitting off-road mobile emissions SCCs, excavators and crawler tractors/dozers. This control resulted in a 11 tpd NOx decrease for the DFW 9-county area, which is shown in Table 12. Total NOx emissions for diesel school buses were not scaled, but the NO2/NOx ratio used in the EPS3 chemical speciation module was increased from 10% to 30% to account for excess NO2 generated by retrofit of 100% of the school bus population with DOC/DPF devices. The difference in NO emissions between run 2 and run 1 is shown in Table 13, which gives ~ 0.5 tpd NO decrease. For run 3, total NOx emissions remained constant for all categories. The same method applied in run 2 for diesel school buses was extended to the on-road and off-road mobile categories as described above. This scenario was designed to isolate the impact of excess NO2 from a realistic penetration of DOC/DPF devices into the vehicle and equipment fleets, since the effect of a decrease in total NOx could mask the ozone effect of an increase in the NO2/NOx ratio. Tables 14 and 15 show the change in NO emissions for each of the three runs for HDDV8 vehicles and non-road equipment categories scaled, respectively. NO emissions from HDDV8 vehicles in the 9-county DFW area are decreased by ~ 14 tpd in run 3 compared to the base case, while non-road emissions are decreased by ~ 2.3 tpd. The spatial distribution of changes in Texas on-road and off-road mobile source NOx emissions between run 2 and run 1 is presented in Figure 5 for the DFW 4-km CAMx domain. As expected, NOx increases are concentrated in urban areas and along major interstate highways, where heavy-duty diesel trucks and school buses are likely to be located. The isolated cells with small NOx decreases away from roadways are associated with the off-road equipment NOx reductions. Figure 6 presents a spatial plot of NO2 emissions changes between run 3 and run 1. The NO2 increases in this plot generally correlate with NOx decreases found in Figure 5. This is expected since the same vehicle classes are being affected in run 2 and run 3. Table 11. NOx emissions (tpd) totals for Class 8 heavy duty diesel vehicles for run 1 and run 2 for DFW counties on June 23, 2005 for future year 2009. Total NOx emissions did not change between run 2 and run 3.
County HDDV8 (run 1) HDDV8 (run 2) HDDV8 NOx Difference
(run 2 – run 1) Collin 6.89 2.48 -4.42Dallas 24.38 8.78 -15.60Denton 7.18 2.58 -4.60Ellis 4.94 1.77 -3.17Johnson 2.15 0.77 -1.38Kaufman 2.84 1.02 -1.83Parker 3.44 1.23 -2.21
April 2009
G:\HARC_H93_DPF\Technical Report\Final\HARC93_DPF-NO2_Final_4-27-09.doc 23
Rockwall 2.23 0.80 -1.43Tarrant 16.53 5.95 -10.589-county total 70.61 25.39 -45.22
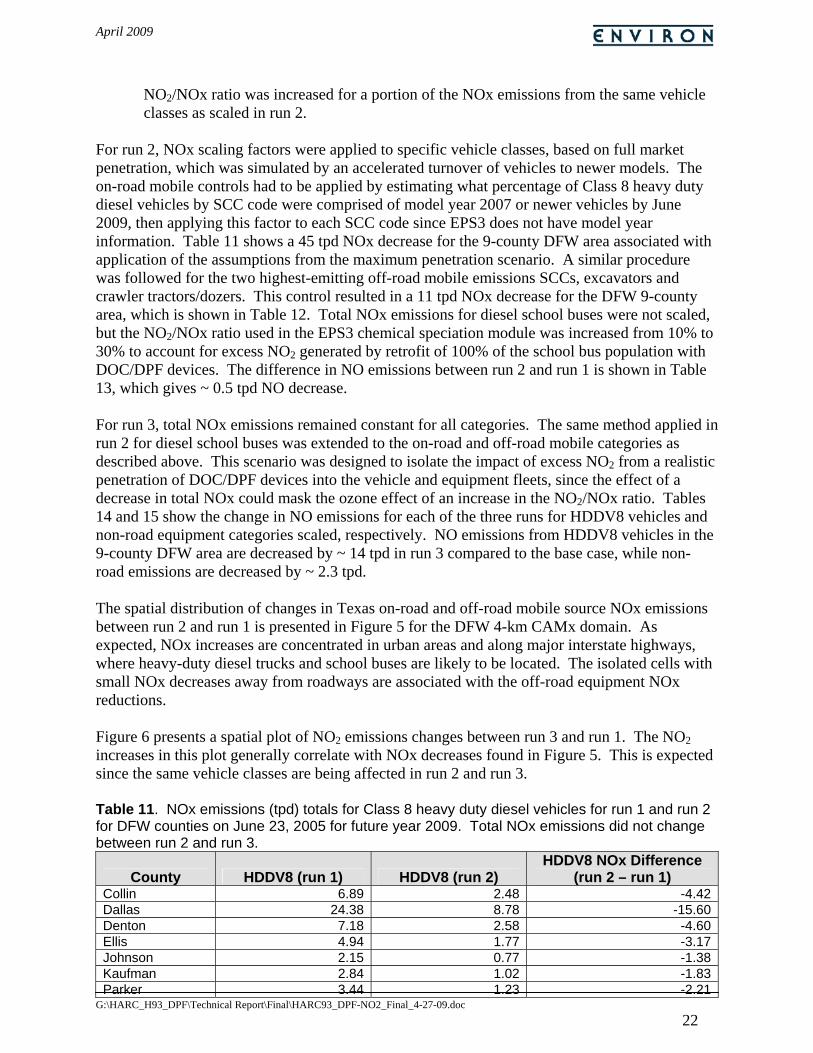
Table 12. NOx emissions (tpd) totals for the two highest-emitting emissions categories of off-road equipment for run 1 and run 2 for DFW counties on June 23, 2005 for future year 2009. Total NOx emissions did not change between run 2 and run3.
County
Excavators + Crawler Tractor/Dozers
(run 1)
Excavators + Crawler Tractor/Dozers
(run 2)
Off-road Mobile NOx Difference
(run 2 – run 1) Collin 2.01 0.14 -1.88Dallas 4.28 0.29 -3.99Denton 1.05 0.07 -0.98Ellis 1.23 0.08 -1.15Johnson 0.15 0.01 -0.14Kaufman 0.09 0.01 -0.09Parker 0.10 0.01 -0.09Rockwall 0.17 0.01 -0.16Tarrant 2.70 0.19 -2.519-county total 11.79 0.81 -10.97
Table 13. NO emissions (tpd) totals for diesel school buses for run 1 and run 2 for DFW counties on June 23, 2005 for future year 2009. Note that diesel school bus NO emissions did not change from run 2 to run 3.
County Diesel School Buses
(run 1) Diesel School Buses
(run 2)
Diesel School Buses NO Difference (run 2 – run 1)
Collin 0.104 0.081 -0.023Dallas 1.272 0.989 -0.283Denton 0.109 0.085 -0.024Ellis 0.042 0.032 -0.009Johnson 0.019 0.015 -0.004Kaufman 0.022 0.017 -0.005Parker 0.027 0.021 -0.006Rockwall 0.021 0.016 -0.005Tarrant 0.852 0.663 -0.1899-county total 2.467 1.919 -0.548
April 2009
G:\HARC_H93_DPF\Technical Report\Final\HARC93_DPF-NO2_Final_4-27-09.doc 24
Table 14. NO emissions (tpd) totals for Class 8 heavy duty diesel vehicles for run 1, run 2, and run 3 for DFW counties on June 23, 2005 for future year 2009.
County HDDV8 (run 1) HDDV8 (run 2) HDDV8 (run 3) HDDV8 NO Difference
(run 2 – run 1) HDDV8 NO Difference
(run 3 – run 1) Collin 6.20 2.23 4.83 -3.97 -1.38Dallas 21.95 7.91 17.07 -14.04 -4.88Denton 6.46 2.32 5.03 -4.14 -1.44Ellis 4.45 1.59 3.46 -2.85 -0.99Johnson 1.94 0.69 1.51 -1.24 -0.43Kaufman 2.56 0.92 1.99 -1.64 -0.57Parker 3.10 1.11 2.41 -1.99 -0.69Rockwall 2.01 0.72 1.56 -1.29 -0.45Tarrant 14.88 5.36 11.57 -9.52 -3.319-county total 63.54 22.85 49.42 -40.69 -14.12
Table 15. NO emissions (tpd) totals for the two highest-emitting emissions categories of off-road equipment for run 1, run 2, and run 3 for DFW counties on June 23, 2005 for future year 2009.
County
Excavators + Crawler Tractor/Dozers
(run 1)
Excavators + Crawler Tractor/Dozers
(run 2)
Excavators + Crawler Tractor/Dozers
(run 3)
Off-road Mobile NO Difference (run 2 – run 1)
Off-road Mobile NO Difference (run 3 – run 1)
Collin 1.81 0.12 1.41 -1.69 -0.40Dallas 3.85 0.27 3.00 -3.59 -0.86Denton 0.95 0.07 0.74 -0.88 -0.21Ellis 1.11 0.08 0.86 -1.03 -0.25Johnson 0.13 0.01 0.10 -0.12 -0.03Kaufman 0.08 0.01 0.07 -0.08 -0.02Parker 0.09 0.01 0.07 -0.08 -0.02Rockwall 0.15 0.01 0.12 -0.14 -0.03Tarrant 2.43 0.17 1.89 -2.26 -0.549-county total 10.61 0.73 8.25 -9.88 -2.36
April 2009
G:\HARC_H93_DPF\Technical Report\Final\HARC93_DPF-NO2_Final_4-27-09.doc 25
Figure 5. Spatial changes in weekday NOx emissions [tons per day] for the maximum penetration scenario (run 2 minus run 1) for the DFW 4-km domain.
Figure 6. Spatial changes in weekday NO2 emissions [tons per day] for the realistic scenario (run 3 minus run 1) for the DFW 4-km domain.
April 2009
G:\HARC_H93_DPF\Technical Report\Final\HARC93_DPF-NO2_Final_4-27-09.doc 26
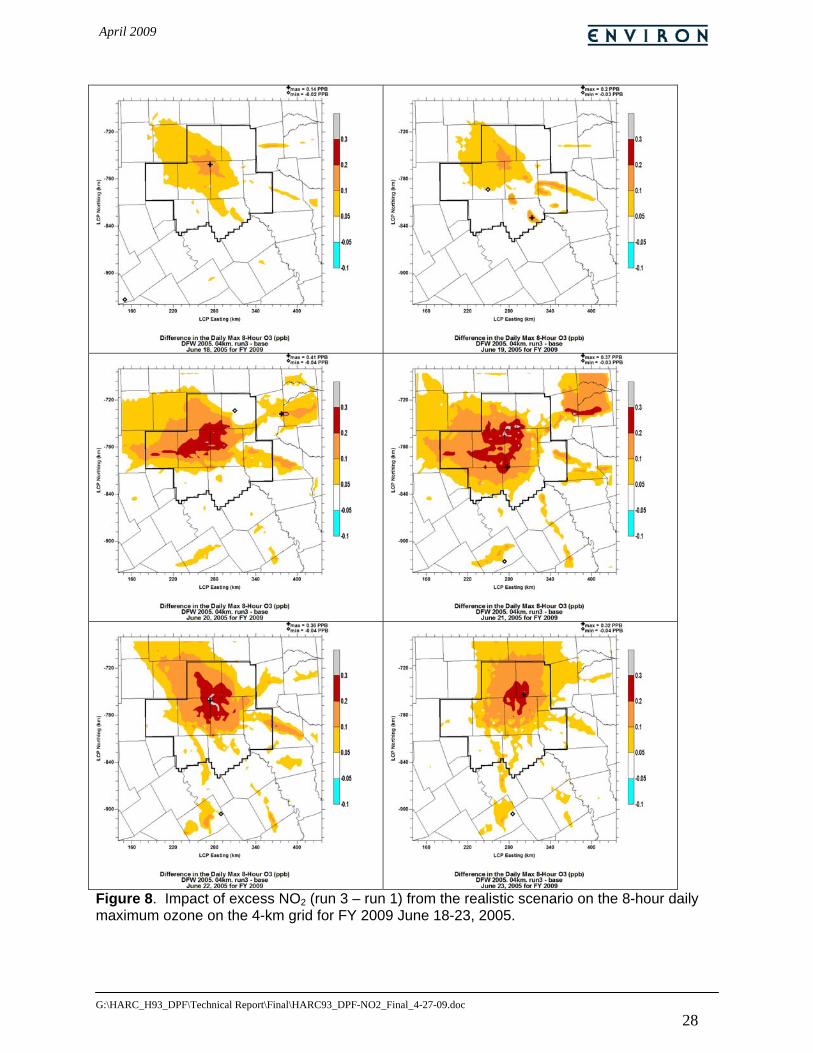
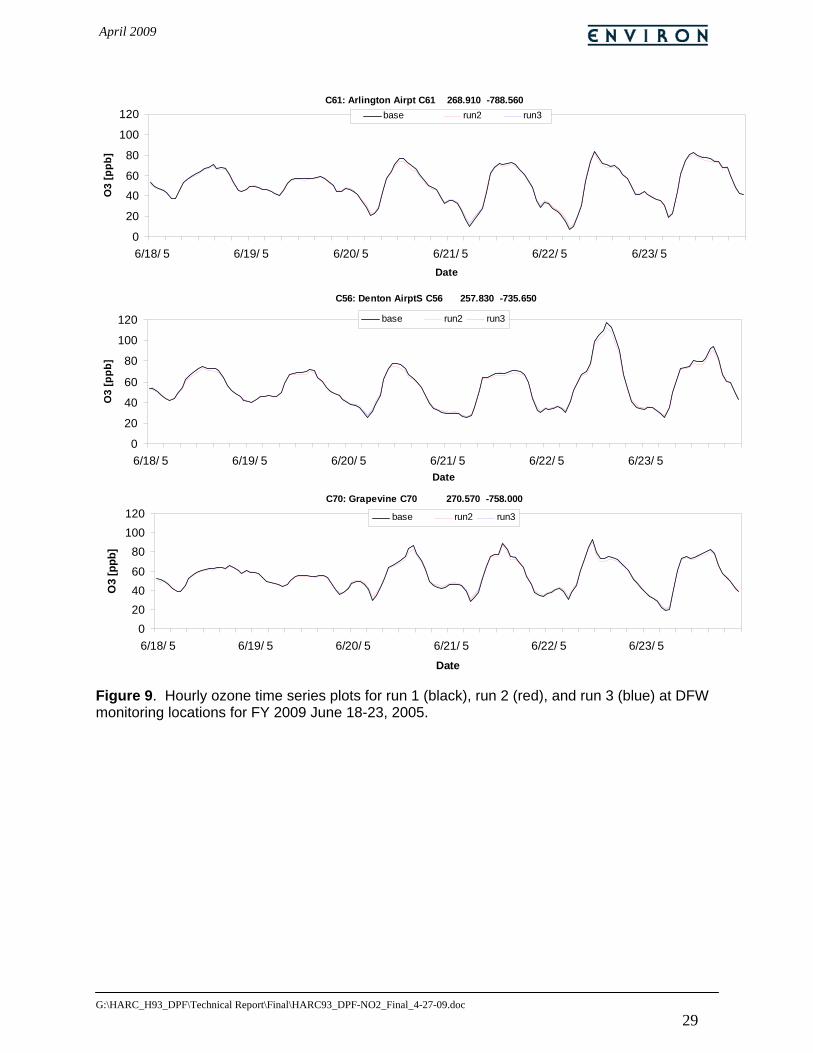
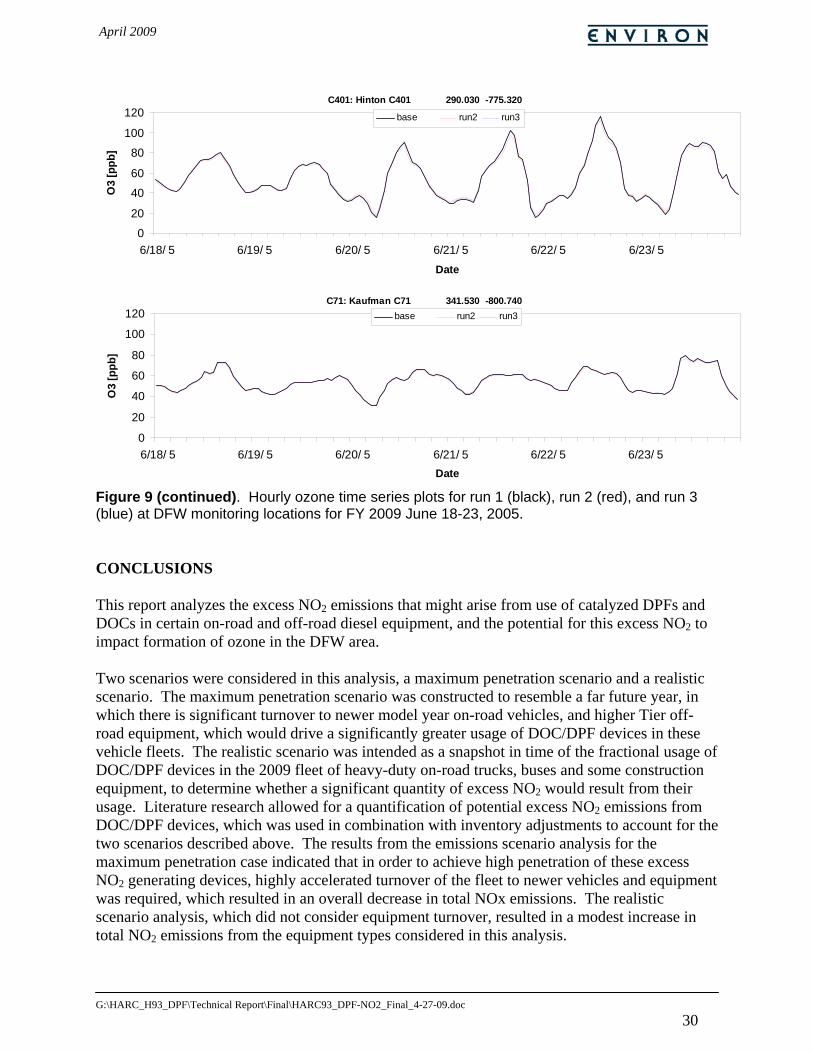
Ozone Modeling Results The maximum penetration and base case scenarios (runs 2 and 1, respectively) were compared to determine the ozone impacts of implementing the maximum penetration scenario. Run 2 represents a “high effect case” since it is unlikely that such a broad market penetration could be reached by June 2009, and in fact more resembles a far future year in which significant turnover to later model year trucks and buses and higher tier off-road equipment has occurred. Run 3 was designed to determine the ozone sensitivity to a realistic increase in NO2 emissions, such as might be observed from the use of DOC/DPF devices. Figure 7 depicts the 2009 daily maximum 8-hour ozone differences (run 2 – run 1) for each date of the June 2005 episode. The plots show that the overall effect of the scenario is a decrease in 8-hour ozone of 1-5 ppb. This is consistent with previous modeling in the DFW non attainment area (NAA), which suggests that decreases in NOx lead to decreases in daily maximum 8-hour ozone. There are slight ozone increases in isolated portions of the DFW NAA (June 19) and just to the east of the DFW NAA (June 20) that are located near NOx point sources. In locations with high NOx concentrations, decreasing NOx emissions tends to increase rather than decrease ozone (i.e., the NOx titration effect). While these ozone increases are not insignificant (~ 0.5 ppb), they are relatively small compared to the ozone decreases found in the rest of the DFW NAA. Spatial plots are presented for the realistic scenario in Figure 8, which shows (run3 – run1) daily maximum 8 hour ozone differences. There are areas in the DFW core with 0.1 to 0.4 ppb ozone increases on most days. These ozone increases due to excess NO2 are much smaller in magnitude than the ozone decreases in Figure 7. Some isolated pockets of ozone decreases exist, but they are very small, on the order of a few hundredths of ppb each day of the episode. Hourly ozone concentration time series plots for selected monitors in the DFW area are presented in Figure 9. These plots confirm what was observed in the spatial plots. The time series show that run 2 has lower ozone peaks than run 1 on days where ozone is highest. The run 3 time series is not easily discernible from run 1, which agrees with the small ozone differences found in the 8-hour daily maximum spatial plots. The results of this analysis suggest that in terms of ozone impact, the excess NO2 generated by DOC/DPF devices is less significant than the total NOx decreases created by turning over equipment to newer models with DOCs/DPFs.
April 2009
G:\HARC_H93_DPF\Technical Report\Final\HARC93_DPF-NO2_Final_4-27-09.doc 27
Figure 7. Impact of total NOx reduction (run 2 – run 1) from the maximum penetration scenario on the 8-hour daily maximum ozone on the 4-km grid for FY 2009 June 18-23, 2005.
April 2009
G:\HARC_H93_DPF\Technical Report\Final\HARC93_DPF-NO2_Final_4-27-09.doc 28
Figure 8. Impact of excess NO2 (run 3 – run 1) from the realistic scenario on the 8-hour daily maximum ozone on the 4-km grid for FY 2009 June 18-23, 2005.
April 2009
G:\HARC_H93_DPF\Technical Report\Final\HARC93_DPF-NO2_Final_4-27-09.doc 29
C61: Arlington Airpt C61 268.910 -788.560
0
20
40
60
80
100
120
6/18/ 5 6/19/ 5 6/20/ 5 6/21/ 5 6/22/ 5 6/23/ 5Date
O3
[ppb
]base run2 run3
C56: Denton AirptS C56 257.830 -735.650
0
20
40
60
80
100
120
6/18/ 5 6/19/ 5 6/20/ 5 6/21/ 5 6/22/ 5 6/23/ 5Date
O3
[ppb
]
base run2 run3
C70: Grapevine C70 270.570 -758.000
0204060
80100120
6/18/ 5 6/19/ 5 6/20/ 5 6/21/ 5 6/22/ 5 6/23/ 5Date
O3
[ppb
]
base run2 run3
Figure 9. Hourly ozone time series plots for run 1 (black), run 2 (red), and run 3 (blue) at DFW monitoring locations for FY 2009 June 18-23, 2005.
April 2009
G:\HARC_H93_DPF\Technical Report\Final\HARC93_DPF-NO2_Final_4-27-09.doc 30
C401: Hinton C401 290.030 -775.320
0
20
40
60
80
100
120
6/18/ 5 6/19/ 5 6/20/ 5 6/21/ 5 6/22/ 5 6/23/ 5Date
O3
[ppb
]base run2 run3
C71: Kaufman C71 341.530 -800.740
0
20
40
60
80
100
120
6/18/ 5 6/19/ 5 6/20/ 5 6/21/ 5 6/22/ 5 6/23/ 5Date
O3
[ppb
]
base run2 run3
Figure 9 (continued). Hourly ozone time series plots for run 1 (black), run 2 (red), and run 3 (blue) at DFW monitoring locations for FY 2009 June 18-23, 2005. CONCLUSIONS This report analyzes the excess NO2 emissions that might arise from use of catalyzed DPFs and DOCs in certain on-road and off-road diesel equipment, and the potential for this excess NO2 to impact formation of ozone in the DFW area. Two scenarios were considered in this analysis, a maximum penetration scenario and a realistic scenario. The maximum penetration scenario was constructed to resemble a far future year, in which there is significant turnover to newer model year on-road vehicles, and higher Tier off-road equipment, which would drive a significantly greater usage of DOC/DPF devices in these vehicle fleets. The realistic scenario was intended as a snapshot in time of the fractional usage of DOC/DPF devices in the 2009 fleet of heavy-duty on-road trucks, buses and some construction equipment, to determine whether a significant quantity of excess NO2 would result from their usage. Literature research allowed for a quantification of potential excess NO2 emissions from DOC/DPF devices, which was used in combination with inventory adjustments to account for the two scenarios described above. The results from the emissions scenario analysis for the maximum penetration case indicated that in order to achieve high penetration of these excess NO2 generating devices, highly accelerated turnover of the fleet to newer vehicles and equipment was required, which resulted in an overall decrease in total NOx emissions. The realistic scenario analysis, which did not consider equipment turnover, resulted in a modest increase in total NO2 emissions from the equipment types considered in this analysis.
April 2009
G:\HARC_H93_DPF\Technical Report\Final\HARC93_DPF-NO2_Final_4-27-09.doc 31
The results from the emissions scenario analyses were used to perform CAMx modeling to determine predicted ozone concentrations within the modeling domain for the DFW area. Results were compared to base case modeling previously conducted. The modeling showed that the maximum penetration scenario, as expected, resulted in a decrease in ozone due primarily to the reduction in total NOx emissions from the vehicles considered, despite the increase in NO2. The realistic scenario showed minor ozone increases within the DFW modeling domain of less than 1ppb of ozone. This analysis would indicate that, despite the use of conservative assumptions in the construction of these scenarios, the potential excess NO2 from DOC/DPF devices would not significantly impact ozone in the near term. In the long term, the general trend towards more stringent control of NOx from newer equipment and vehicles would outweigh any additional excess NO2 arising from greater use of DOC/DPF devices. It should be noted that the manufacturers of these devices are investigating strategies to mitigate the excess NO2 formation, so it is possible that future generations of catalyzed DPF technology for on-road and off-road sources may not exhibit excess NO2.
April 2009
G:\HARC_H93_DPF\Technical Report\Final\HARC93_DPF-NO2_Final_4-27-09.doc
REFERENCES Air Resources Board, 2004. “Assessment of Possible Worst-Case NO2 Exposure Scenarios
Related to Catalyst-Based Diesel Particle Traps”, Dr. Scott Fruin, P.E., Dr. Alberto Ayala, Research Division, October.
Bar-Ilan, A., Chandler-Nogales, C., Lindhjem, C., 2007. “Massachusetts Diesel PM Emissions
Reduction: Retrofit Technical Feasibility Analysis”, Prepared for Northeast States Coordinated Air Use Management (NESCAUM), October.
Briseno, J., Texas Commission on Environmental Quality (TCEQ), 2008. Personal
Communication, October. Brown, K.F., Rideout, G.B., 1997. “Urban Driving Cycle Results of Retrofitted Diesel Oxidation
Catalysts on Heavy-Duty Vehicles: One Year Later”, SAE Paper 970186, February. Carslaw, D.C., Beevers, S.D., 2004. “Investigating the Potential Importance of Primary NO2
Emissions in a Street Canyon”, Atmospheric Environment, Vol. 38, March. Carslaw, D.C., 2005. “Evidence of an Increasing NO2/NOX Emissions Ratio from Road Traffic
Emissions”, Atmospheric Environment, Vol. 39, August. CCR, 2009. “Verification Procedure, Warranty and In-Use Compliance Requirements for In-Use
Strategies to Control Emissions from Diesel Engines”, California Code of Regulations, Title 13, Chapter 14, §2700.
Chan, L., Grant, J., Bar-Ilan, A., Lindhjem, C., Pollack, A., 2006. “On-Road and Non-Road
Emission Reductions from TERP in 2007, 2009 and 2012 in the Houston-Galveston Brazoria and Dallas Fort-Worth Areas”, Prepared for Houston Advanced Research Center (HARC), The Woodlands, TX, December.
Cleaire, 2009. “Longview®: Passive Diesel Particulate Filter with NOx Reduction”, Cleaire
Advanced Emission Controls. Internet Address: http://www.cleaire.com/on-road/longview.shtml
Dieselnet, 2000. “Heavy-Duty FTP Transient Cycle”, EcoPoint Inc., Internet Address:
http://www.dieselnet.com/standards/cycles/ftp_trans.html Dudhia, J. 1993. "A Non-hydrostatic Version of the Penn State/NCAR Mesoscale Model:
Validation Tests and Simulation of an Atlantic Cyclone and Cold Front", Mon. Wea. Rev., Vol. 121. pp. 1493-1513.
Emissions Advantage, 2005. “Diesel Retrofit Technology and Program Experience”, submitted
to U.S. Environmental Protection Agency, Research Triangle Park, NC, July. ENVIRON, 2008. “User’s Guide, Comprehensive Air Quality Model with Extensions (CAMx),
v4.50”, Prepared by ENVIRON International Corporation, Novato, CA, May. Internet Address: www.camx.com
April 2009
G:\HARC_H93_DPF\Technical Report\Final\HARC93_DPF-NO2_Final_4-27-09.doc 33
EPA, 2003, “User’s Guide to MOBILE6.1 and MOBILE6.2: Mobile Source Emission Factor Model”, U.S. Environmental Protection Agency, Research Triangle Park, NC, August. EPA420-R-03-010.
EPA, 2004. “Final Regulatory Analysis: Control of Emissions from Nonroad Diesel Engines”,
U.S. Environmental Protection Agency, Research Triangle Park, NC, May. EPA420-R-04-007
EPA, 2005. User’s Guide for the Final NONROAD2005 Model, U.S. Environmental Protection
Agency, Research Triangle Park, NC, 2005; EPA420-R-05-013. EPA, 2007. “Nitrogen Dioxide Limits from Retrofit Technologies – Letter to Manufacturers or
Other Interested Parties”, U.S. Environmental Protection Agency, Research Triangle Park, NC, December. EPA420-B-08-005.
EPA, 2009. “Large Engine (On-Highway and Nonroad Compression-Ignition) Certification
Data”, U.S. Environmental Protection Agency, Research Triangle Park, NC. Internet Address: http://www.epa.gov/OMS/certdata.htm
ESI International, 1999. “Diesel Emission Control Strategies Available to the Underground
Mining Industry”, Submitted to Diesel Emission Evaluation Program, February. Internet Address: http://www.deep.org/reports/esi_contents.html
Johnson Matthey, 2009. “CRT Filter Systems”, Johnson Matthey Catalysts. Internet Address:
http://ect.jmcatalysts.com/documents/CRT2009DataSheet_000.pdf Kemball-Cook, S., Johnson, J., Yarwood, G., 2006. “Seasonal and Episodic Modeling of 2005
Ozone in Eastern Texas”, Prepared for the Houston Advanced Research Center (HARC), The Woodlands, TX, September.
Lanni, T., Frank, B.P., Tang, S., Rosenblatt, D., Lowell, D., 2003. “Performance and Emissions
Evaluation of Compressed Natural Gas and Clean Diesel Buses at New York City’s Metropolitan Transit Authority”, Society of Automotive Engineers (SAE), March. SAE-2003-01-0300.
LeTavec, C., Uihlein, J., Vertin, K., Chatterjee, S., Wayne, S., Clark, N., Gautam, M.,
Thompson, G., Lyons, D., Halstrom, K., Chandler, K., Coburn, T., 2002. “Year-Long Evaluation of Trucks and Buses Equipped with Passive Diesel Particulate Filters”, Society of Automotive Engineers (SAE), March. SAE-2002-01-0433.
MECA. 2000. “Catalyst-Based Diesel Particulate Filters and NOx Adsorbers: A Summary of the
Technologies and the Effects of Fuel Sulfur”, Manufacturers of Emission Controls Association, August. Internet Address: http://www.meca.org/galleries/default-file/cbdpf-noxadwp.pdf
MECA, 2001. “Diesel Exhaust Retrofit Programs-Available Control Technologies and Retrofit
Program Considerations”, Manufacturers of Emission Controls Association, Waterfront Diesel Emissions Conference, Long Beach, California, October, 25.
April 2009
G:\HARC_H93_DPF\Technical Report\Final\HARC93_DPF-NO2_Final_4-27-09.doc 34
New York State Energy Research and Development Authority (NYSERDA). 2006. “NYC Private Ferry Fleet Emissions Reduction Technology Study and Demonstration”, Final Report 06-15, September.
Richards, P.. Terry, B., Chadderton, J., Vincent, M.W., 2004. “Retrofitting Urban Buses to
Reduce PM and NO2”, Society of Automotive Engineers (SAE), June. SAE-2004-01-1939.
TCEQ, 2009a. “Overview of Texas Emissions Reduction Plan (TERP)”, Texas Commission on
Environmental Quality (TCEQ), Austin, TX, March. Internet Address: http://www.tceq.state.tx.us/implementation/air/terp/
TCEQ, 2009b. “Overview of Texas Clean School Bus Program”, Texas Commission on
Environmental Quality (TCEQ), Austin, TX, March. Internet Address: http://www.tceq.state.tx.us/assistance/clean-vehicles/school-buses.html
Ward’s Automotive Group, 2003. “North America Production by Country and Vehicle Type and
by Manufacturer for 2003”, from Ward’s Automotive Annual Reference Book. Internet Address: http://www.ttnews.com/articles/basetemplate.aspx?storyid=20420