Embed Size (px)
Citation preview
1
Poverty Alleviation or Aggravation? The Impacts of Community Forestry Policies in Nepal
Bhubaneswor Dhakal, Hugh Bigsby, Ross Cullen
Commerce Division, PO Box 84, Lincoln University, New Zealand
“Poverty Alleviation or Aggravation? The Impacts of Community Forestry Policies in Nepal” paper prepared for presentation at the International Association of Agricultural Economists
Conference, Gold Coast, Aus tralia August 12-18, 2006
Copyright 2006 by Dhakal, Bigsby, Cullen. All rights reserved. Readers may make verbatim copies of this document for non-commercial purposes by any means, provided that this copy
right notice appears on all such copies.
2
Poverty Alleviation or Aggravation?
The Impacts of Community Forestry Policies in Nepal
Bhubaneswor Dhakal, Hugh Bigsby, Ross Cullen
Commerce Division, PO Box 84, Lincoln University, New Zealand
Abstract
This research studies the effects on income and employment when externally imposed
policies constrain use of common forest resources. Using a mixed-integer linear programming
model, the study examines the impacts of cons ervation-oriented community forest policies in
Nepal on three household income groups. The results show that current community forest
policies, which direct forest use towards environment conservation and timber production,
cause large reductions in employment and income of the poorest households and largely
explain the recent increase in rural poverty.
JEL Classification: C6, D3, D6, I3, O2 and Q0
Keywords: Nepal, community forestry policy, rural poverty, community welfare
Introduction
In physical and institutional terms, land is a limiting factor for primary production in Nepal.
Forestland, including shrub-land and alpine pasture, comprises 39 percent of the total land
area in Nepal, and arable land covers 21 percent. The rest of the land provides little scope for
3
economic use. In the 2002 agricultural census, the average land holding was less than 0.8
hectares per household and 74.1 percent of land-owning households had less than one hectare
of land. The bottom 47 percent of land-owning households had an average land area of 0.5
hectares (CBS, 2003). Despite being an agriculture-based economy, 29 percent of farming
households are landless (UNDP, 2005), and more than 60 percent of the land-owning
households in Nepal have a food deficit from their own land (CBS, 2003).
Historically, mountain communities managed pastures and forests together in common.
Households with marginal landholdings had easy access to community resources to
complement their private resources and to sustain their livelihoods. When the Government
introduced the Private Forestry Nationalization Act (1957), it abolished the traditional
regulation systems of common forestlands. This was followed by substantial deforestation,
which the government and international agencies believed caused landslides in Nepal and
flooding in Bangladesh (Ives and Messerli, 1989). Livestock farming and firewood use by hill
farmers were believed to be the main factors causing deforestation (Ives and Messerli, 1989;
Master Plan, 1988).
With the realisation of the importance of users’ involvement in making forest conservation
effective, the government prepared the Forest ry Sector Master Plan (1988) (hereafter “The
Plan”). The Plan provided guidelines for participatory community forestry implementation,
and a local user group-based community forestry policy was introduced in the late 1980s. The
objectives for the policy were, “[T]o meet people’s needs” for forestry products, “[T]o
support other sectors… in meeting people’s basic needs” and “[T]o conserve and maintain
safe and wholesome natural environment” (Master Plan 1988: pp 68-69).
4
Community forestry policies have achieved their goals in terms of the number of forest user
groups and in improving forest cover. Over 14,000 forestry users groups were formed in the
first 12 years of the community forestry program (CFUG Database 2005). Deforestation has
been halted and high forest stocks are being restored (Gautam et al., 2002), in some cases to
the extent that forests are over-stocked (Nurse et. al. 2004). Wildlife populations have
increased and the government is being urged to introduce wildlife control policies
(Community Forestry Division 2004). Some communities have also been able to generate
funds from sales of forest products from community forests (Dongol et. al. 2002).
Despite these successes, a number of studies have shown that there are negative distributional
outcomes under community forestry policies, with poor households receiving less benefit
from community forests than wealthier households (Dhakal et al., 2005; Agrawal, 2001;
Adhikari et al., 2004). Generally, the regressive outcomes from community forestry are
largely attributed to problems in decision-making at the community level (Pokharel and
Nurse, 2004). However, the focus of reforestation activities, forest laws and institutional
changes were on increasing forest cover and limiting access for livestock or firewood (Master
Plan, 1988). For example, one of the policy strategies for reducing forest products demand, is
“reducing and controlling livestock numbers” (Master Plan 1988 p. 148) and making
household fodder supply “fully self sufficient” from private lands (Master Plan 1988 p. 85).
The government also introduced compulsory forest inventories and forest harvesting to less
than 30 percent of mean annual increment (MAI) for slow growing species and 60 percent of
MAI for fast growing species. As a result, the negative distributional outcomes under
community forestry could instead be attrbutable to government constraints on use of
community forests rather than how user groups decide how to use them.
5
A key question addressed by this study is whether constraints on use of community forests
under current community forestry policy are linked to the inability of communities to meet the
needs of the poorest households. If there is a link, then the second question is whether there
are alternative policies that will make it easier for communities to meet the needs of the poor.
In this context, the issue is one of constrained income-maximization. The following section
outlines a model for studying the effects of household and com munity forest land allocation
on income and employment under different constraints.
Modeling Community Forest Based Households
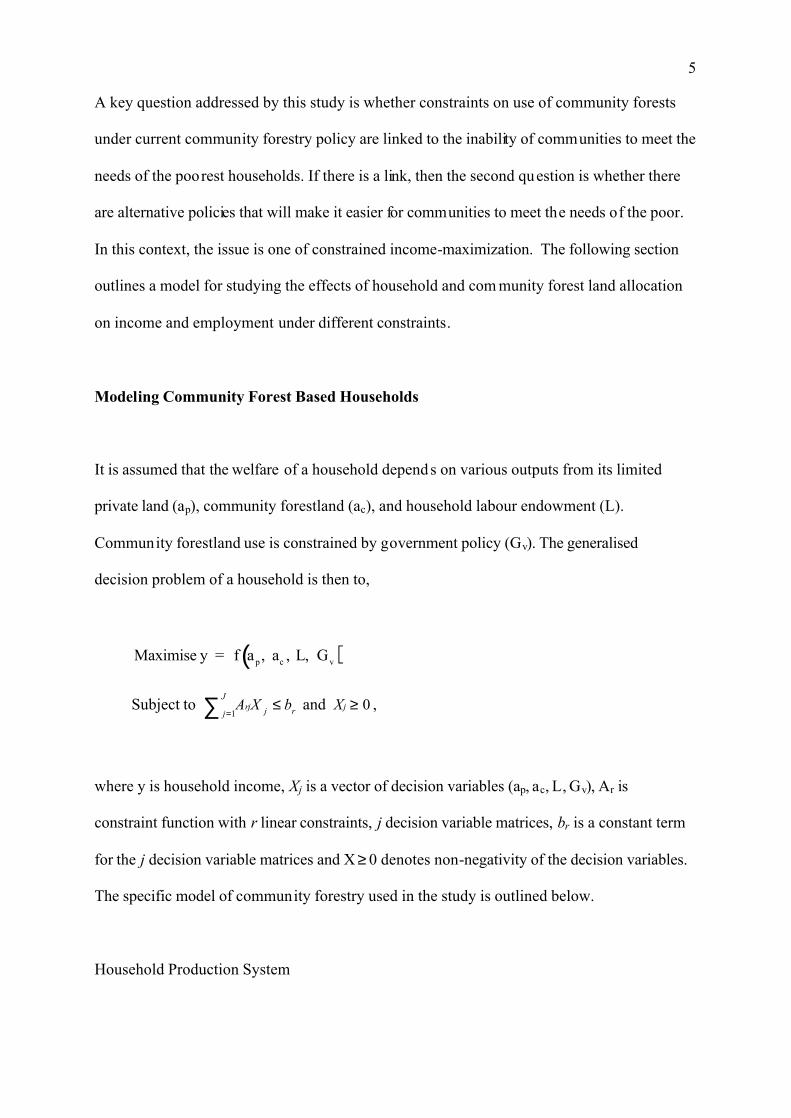
It is assumed that the welfare of a household depends on various outputs from its limited
private land (ap), community forestland (ac), and household labour endowment (L).
Community forestland use is constrained by government policy (Gv). The generalised
decision problem of a household is then to,
Maximise y = f ap , ac , L, Gv( )
Subject to 1
Jrj j rj
A X b=
≤∑ and 0jX ≥ ,
where y is household income, Xj is a vector of decision variables (ap, ac, L, Gv), Ar is
constraint function with r linear constraints, j decision variable matrices, br is a constant term
for the j decision variable matrices and X ≥ 0 denotes non-negativity of the decision variables.
The specific model of community forestry used in the study is outlined below.
Household Production System
6
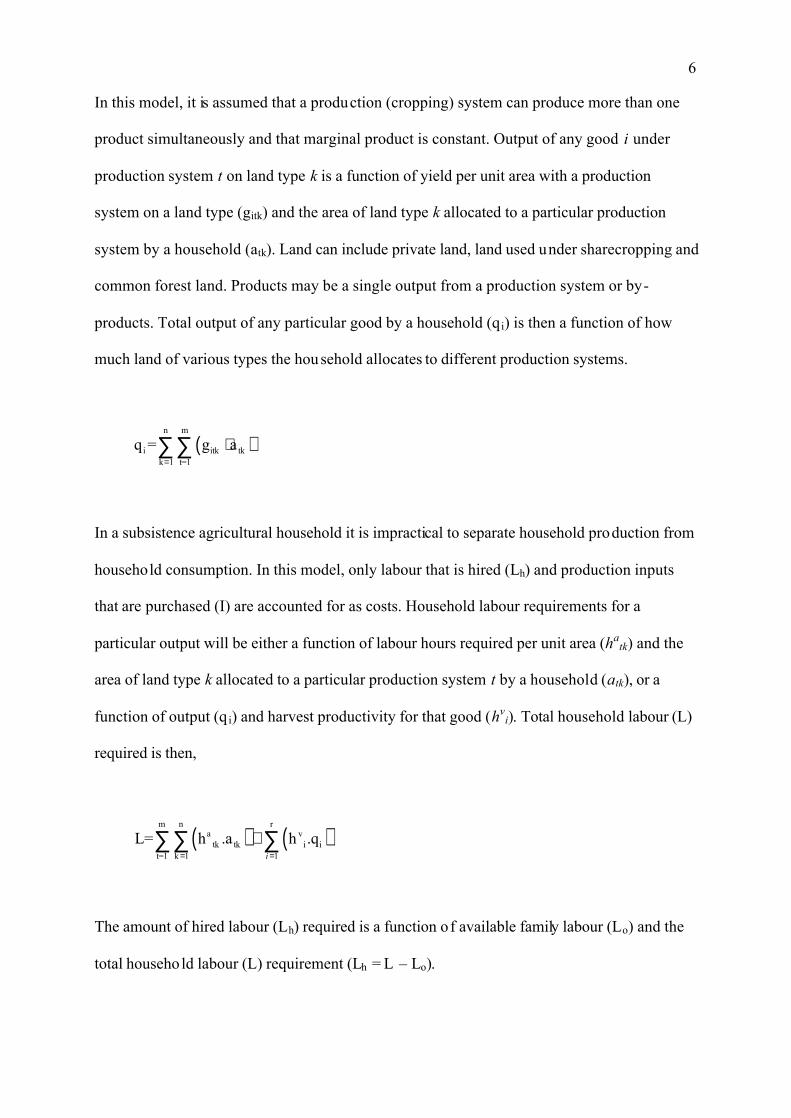
In this model, it is assumed that a production (cropping) system can produce more than one
product simultaneously and that marginal product is constant. Output of any good i under
production system t on land type k is a function of yield per unit area with a production
system on a land type (gitk) and the area of land type k allocated to a particular production
system by a household (atk). Land can include private land, land used under sharecropping and
common forest land. Products may be a single output from a production system or by-
products. Total output of any particular good by a household (q i) is then a function of how
much land of various types the household allocates to different production systems.
( )n m
i itk tkk 1 t=1
q = g a=
⋅∑∑
In a subsistence agricultural household it is impractical to separate household production from
household consumption. In this model, only labour that is hired (Lh) and production inputs
that are purchased (I) are accounted for as costs. Household labour requirements for a
particular output will be either a function of labour hours required per unit area (hatk) and the
area of land type k allocated to a particular production system t by a household (atk), or a
function of output (q i) and harvest productivity for that good (hvi). Total household labour (L)
required is then,
( ) ( )m n r
a vtk tk i i
t=1 k 1 1
L= h .a h .qi= =
+∑∑ ∑
The amount of hired labour (Lh) required is a function of available family labour (Lo) and the
total household labour (L) requirement (Lh = L – Lo).
7
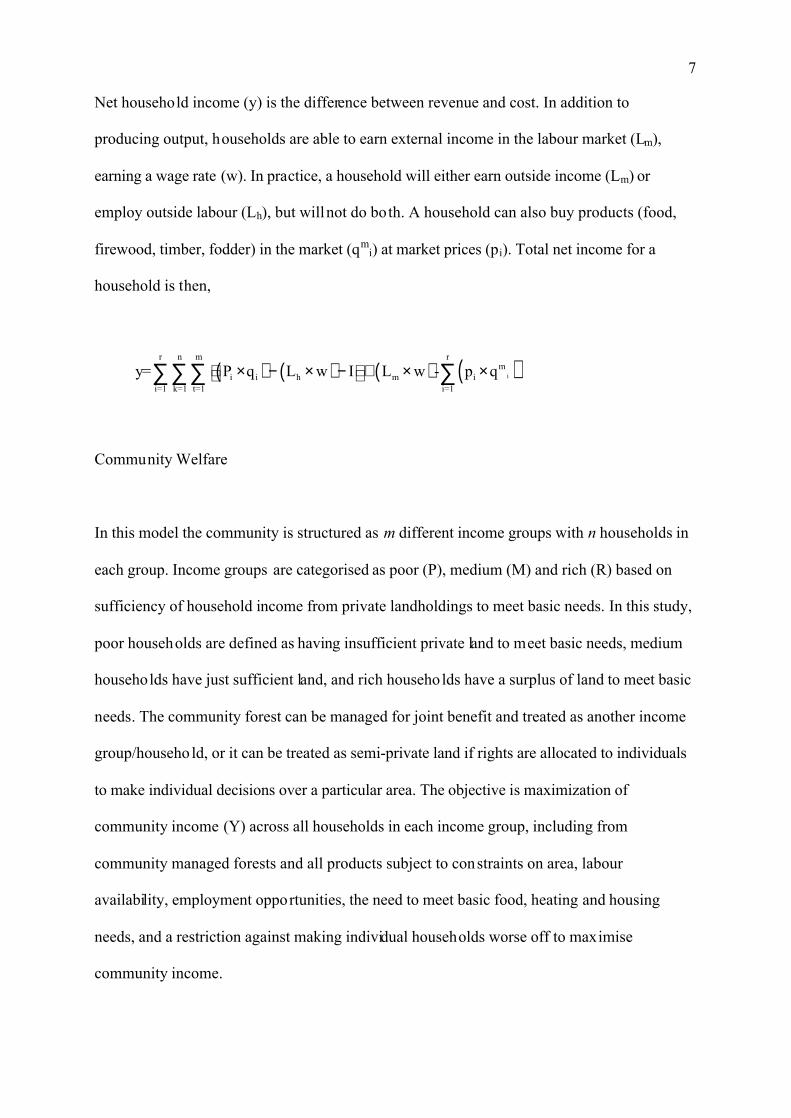
Net household income (y) is the difference between revenue and cost. In addition to
producing output, households are able to earn external income in the labour market (Lm),
earning a wage rate (w). In practice, a household will either earn outside income (Lm) or
employ outside labour (Lh), but will not do both. A household can also buy products (food,
firewood, timber, fodder) in the market (qmi) at market prices (pi). Total net income for a
household is then,
( ) ( ) ( ) ( )i
r n m rm
i i h m ii=1 k=1 t=1 i=1
y= P q L w I L w - p q× − × − + × × ∑∑∑ ∑
Community Welfare
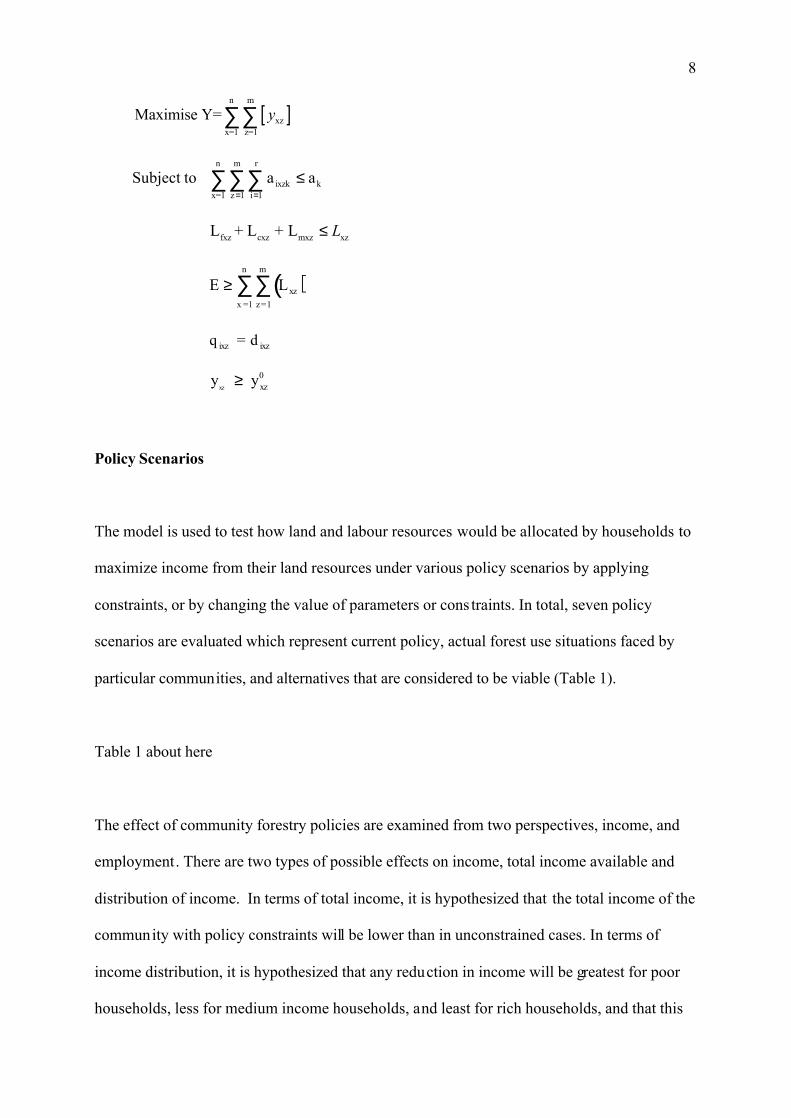
In this model the community is structured as m different income groups with n households in
each group. Income groups are categorised as poor (P), medium (M) and rich (R) based on
sufficiency of household income from private landholdings to meet basic needs. In this study,
poor households are defined as having insufficient private land to meet basic needs, medium
households have just sufficient land, and rich households have a surplus of land to meet basic
needs. The community forest can be managed for joint benefit and treated as another income
group/househo ld, or it can be treated as semi-private land if rights are allocated to individuals
to make individual decisions over a particular area. The objective is maximization of
community income (Y) across all households in each income group, including from
community managed forests and all products subject to constraints on area, labour
availability, employment opportunities, the need to meet basic food, heating and housing
needs, and a restriction against making individual households worse off to maximise
community income.
8
[ ]n m
xzx=1 z=1
Maximise Y= y∑∑
Subject to n m r
ixzk kx=1 z 1 i 1
a a= =
≤∑∑∑
fxz cxz mxz xzL + L + L L≤
E ≥ Lxz( )
z =1
m
∑x =1
n
∑
q ixz = d ixz
xz
0 xzy y≥
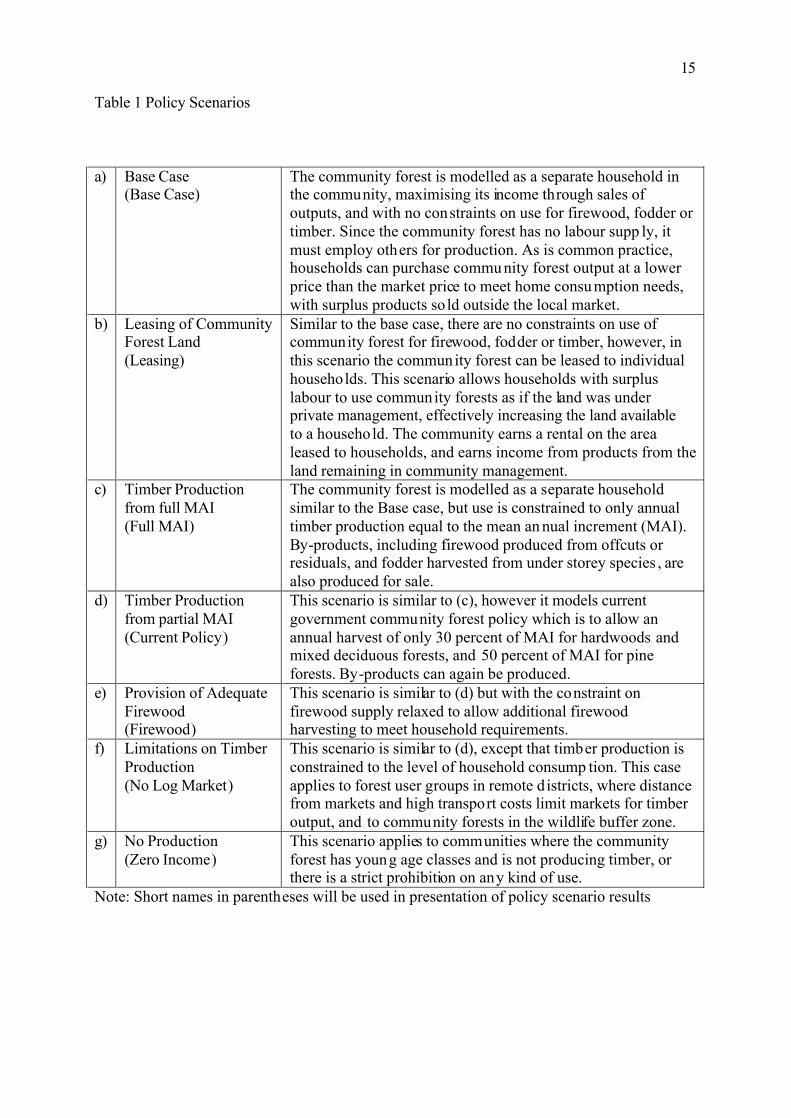
Policy Scenarios
The model is used to test how land and labour resources would be allocated by households to
maximize income from their land resources under various policy scenarios by applying
constraints, or by changing the value of parameters or cons traints. In total, seven policy
scenarios are evaluated which represent current policy, actual forest use situations faced by
particular communities, and alternatives that are considered to be viable (Table 1).
Table 1 about here
The effect of community forestry policies are examined from two perspectives, income, and
employment. There are two types of possible effects on income, total income available and
distribution of income. In terms of total income, it is hypothesized that the total income of the
community with policy constraints will be lower than in unconstrained cases. In terms of
income distribution, it is hypothesized that any reduction in income will be greatest for poor
households, less for medium income households, and least for rich households, and that this
9
would cause income disparity to increase. In addition, a household needs minimum amo unts
of some goods for survival. The hypothesis is that the ability to meet these needs will be
adequate for each household in the unconstrained cases, and lower and perhaps insufficient in
constrained cases. There are two types of effects on employment. Total employment under
constraints imposed by government policies is expected to be lower than an unconstrained
situation. Any reduction in employment with constraints is also expected to be borne more by
poor households than by m edium or rich households.
Data
Data for the model was collected using household surveys, user group su rveys and secondary
sources. For the study, six community forest user groups in three districts (Dolakha, Kavre
and Nuwakot) of the mid-hill region of Nepal were selected on the basis of representative
forest condition, type of forage-gathering practices, age of the user group, forest size and level
of access to district forest office services. For the household surveys, a semi-structured
questionnaire was administered to female heads of 259 farming households in May-July,
2003. The respondents were asked a range of questions including their size of land holding of
all types of private lands including share cropping, their level of food sufficiency, family size,
household labour, livestock holdings, and firewood and timber collection from community
forests. The information common to all households were collected from local market surveys,
key informants, and secondary sources. For the policy modelling, a proforma community was
derived from an average of the six survey groups for private landholding size, consumer units,
and labour supply.
10
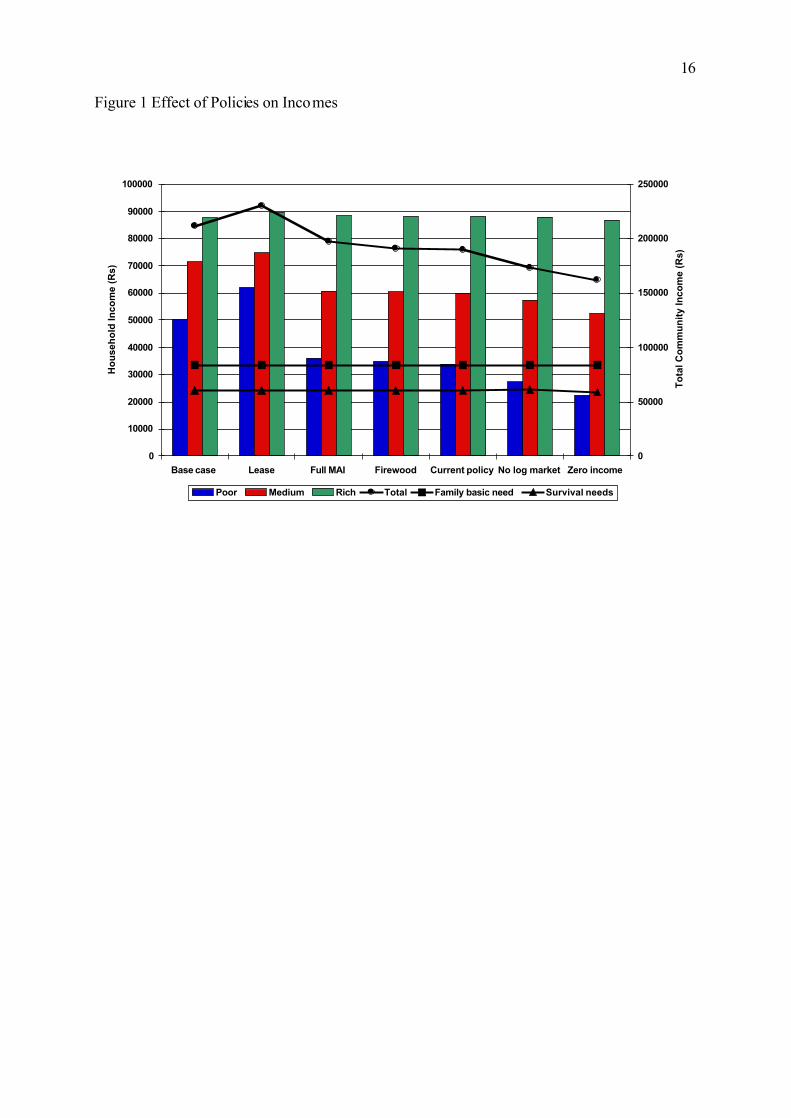
Results
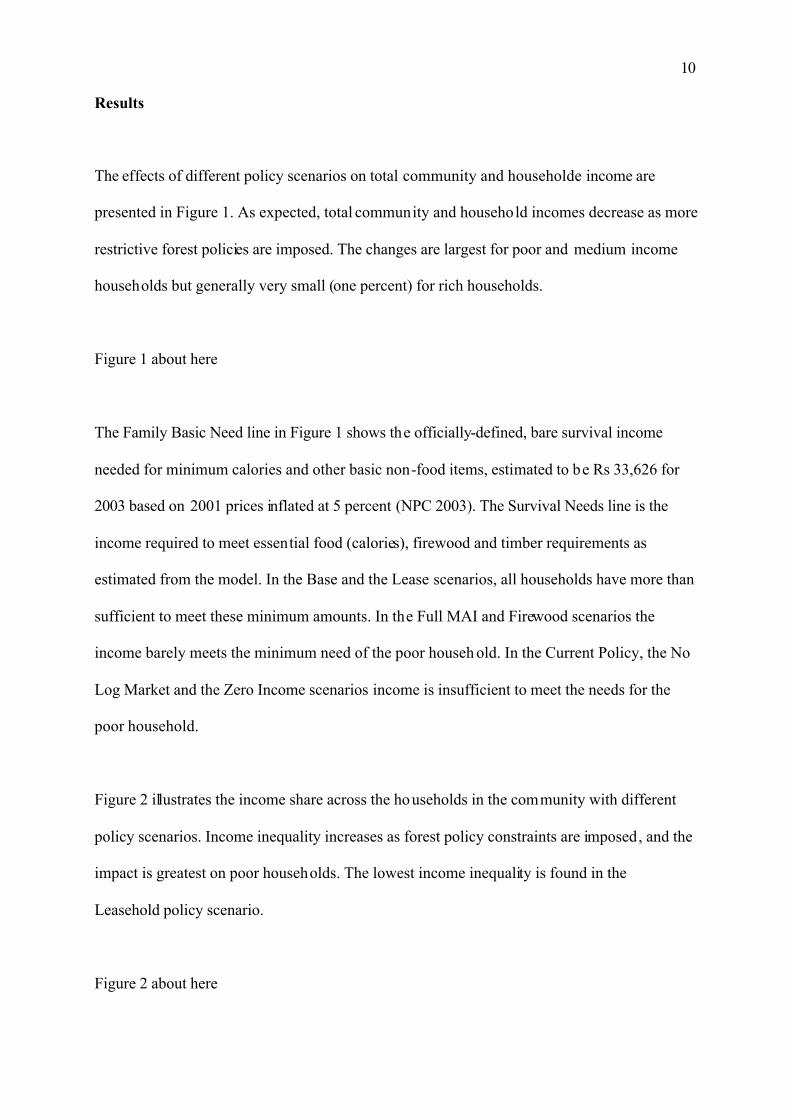
The effects of different policy scenarios on total community and householde income are
presented in Figure 1. As expected, total community and household incomes decrease as more
restrictive forest policies are imposed. The changes are largest for poor and medium income
households but generally very small (one percent) for rich households.
Figure 1 about here
The Family Basic Need line in Figure 1 shows the officially-defined, bare survival income
needed for minimum calories and other basic non-food items, estimated to be Rs 33,626 for
2003 based on 2001 prices inflated at 5 percent (NPC 2003). The Survival Needs line is the
income required to meet essential food (calories), firewood and timber requirements as
estimated from the model. In the Base and the Lease scenarios, all households have more than
sufficient to meet these minimum amounts. In the Full MAI and Firewood scenarios the
income barely meets the minimum need of the poor househ old. In the Current Policy, the No
Log Market and the Zero Income scenarios income is insufficient to meet the needs for the
poor household.
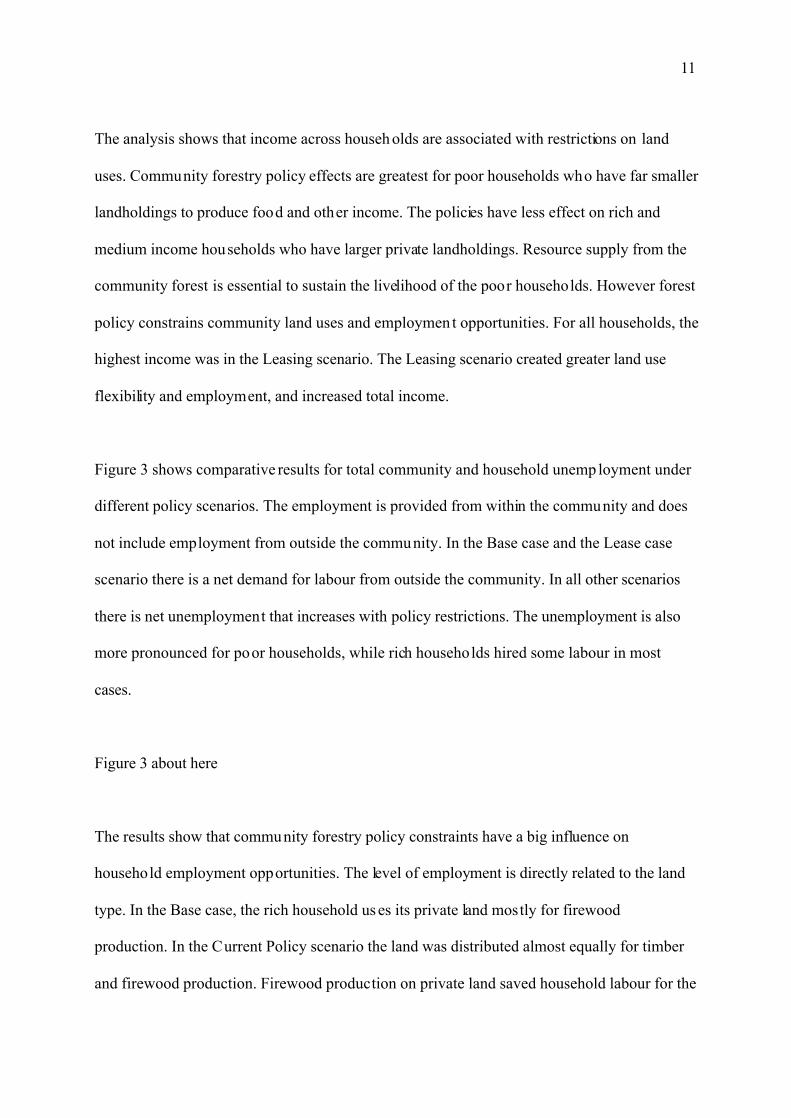
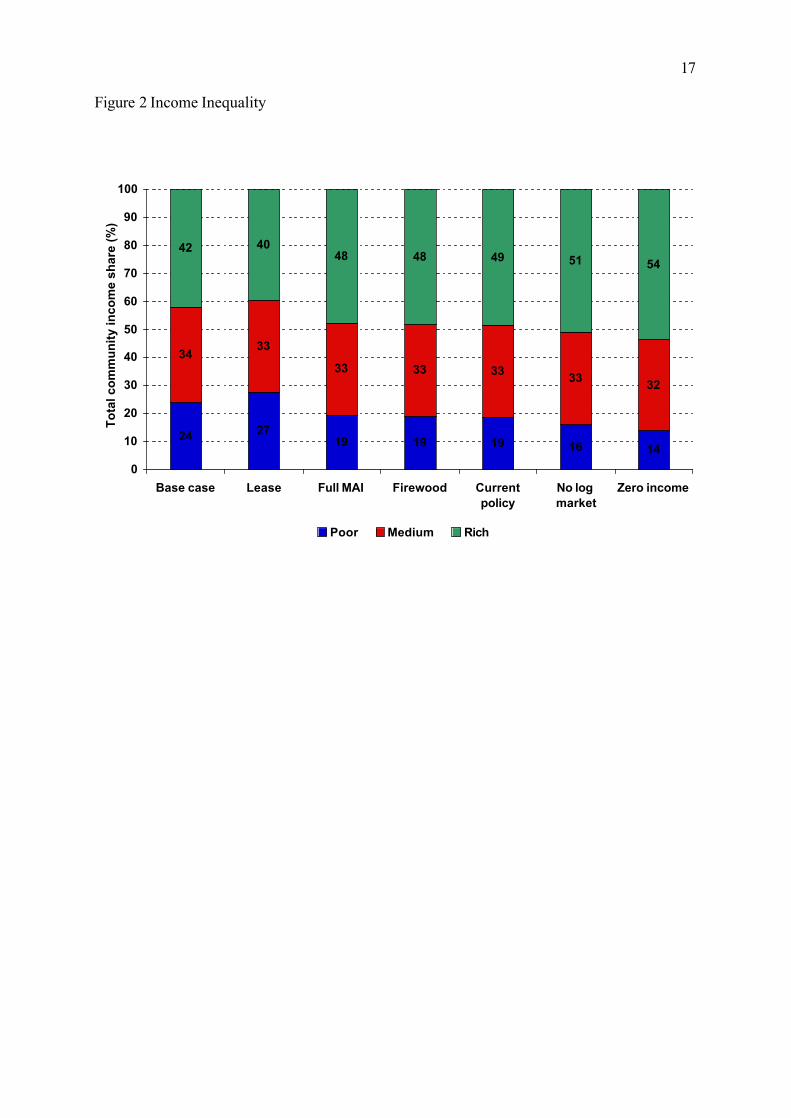
Figure 2 illustrates the income share across the households in the community with different
policy scenarios. Income inequality increases as forest policy constraints are imposed, and the
impact is greatest on poor households. The lowest income inequality is found in the
Leasehold policy scenario.
Figure 2 about here
11
The analysis shows that income across househ olds are associated with restrictions on land
uses. Community forestry policy effects are greatest for poor households who have far smaller
landholdings to produce food and other income. The policies have less effect on rich and
medium income households who have larger private landholdings. Resource supply from the
community forest is essential to sustain the livelihood of the poor households. However forest
policy constrains community land uses and employment opportunities. For all households, the
highest income was in the Leasing scenario. The Leasing scenario created greater land use
flexibility and employment, and increased total income.
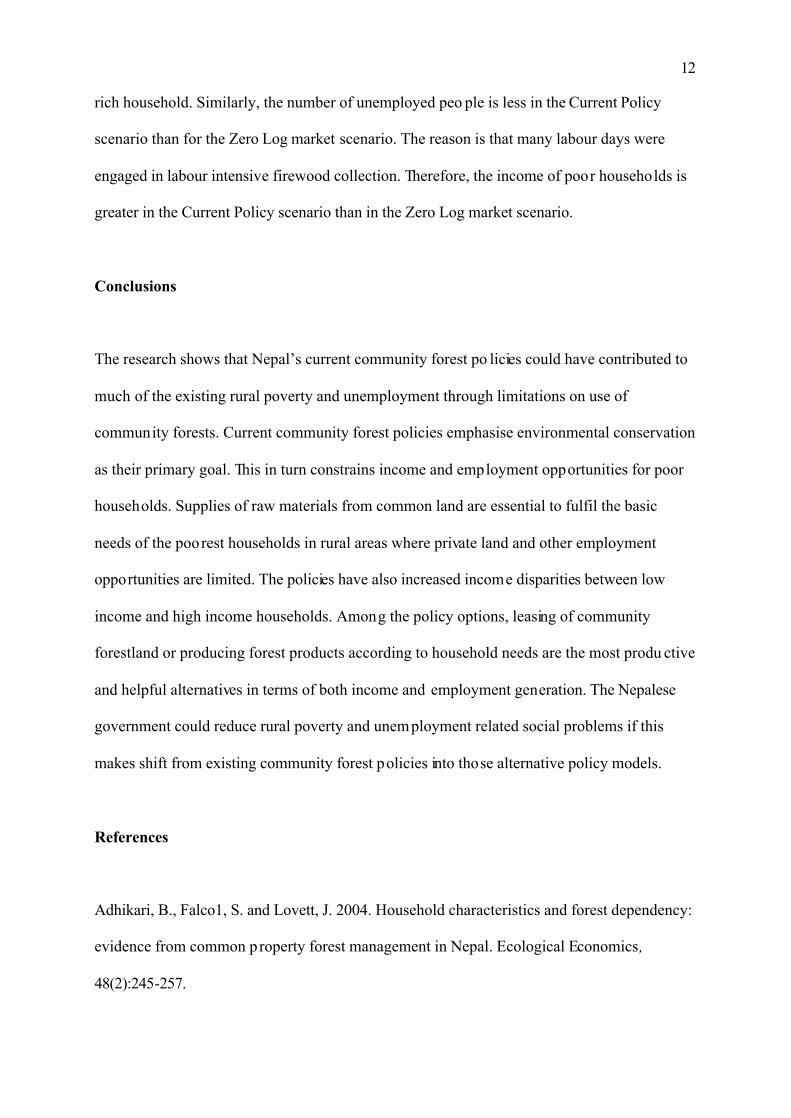
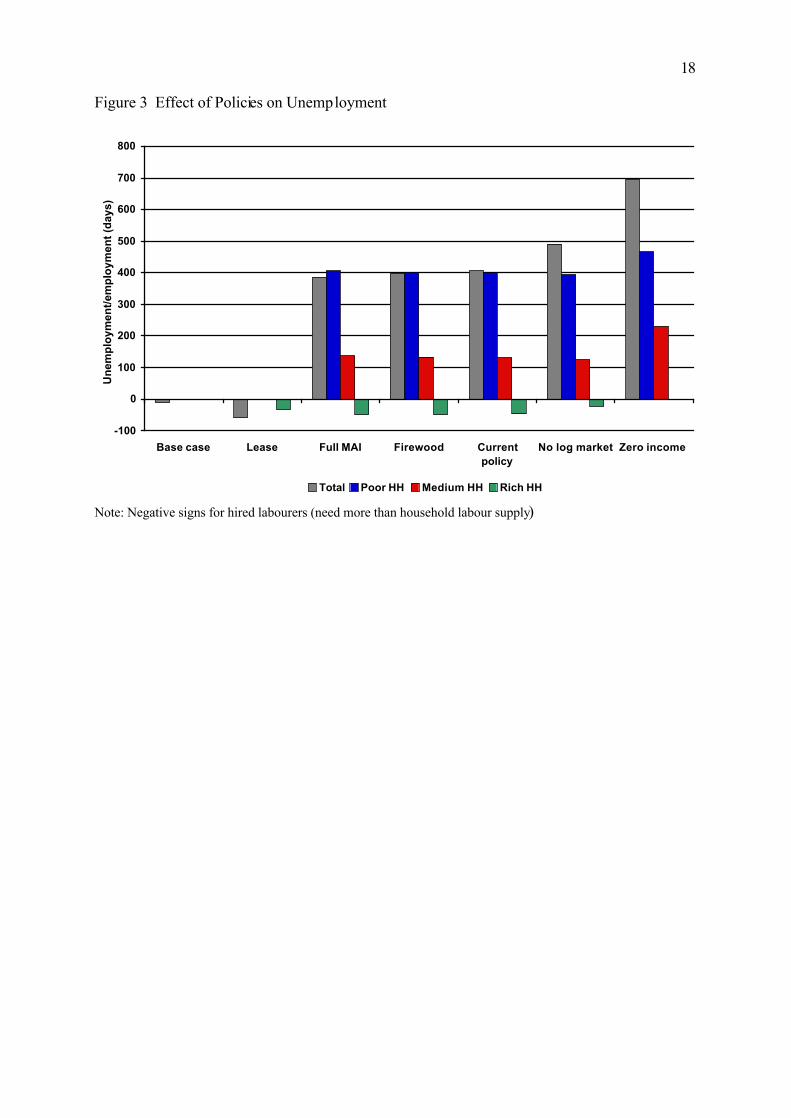
Figure 3 shows comparative results for total community and household unemployment under
different policy scenarios. The employment is provided from within the community and does
not include employment from outside the community. In the Base case and the Lease case
scenario there is a net demand for labour from outside the community. In all other scenarios
there is net unemployment that increases with policy restrictions. The unemployment is also
more pronounced for poor households, while rich households hired some labour in most
cases.
Figure 3 about here
The results show that community forestry policy constraints have a big influence on
household employment opportunities. The level of employment is directly related to the land
type. In the Base case, the rich household us es its private land mostly for firewood
production. In the Current Policy scenario the land was distributed almost equally for timber
and firewood production. Firewood production on private land saved household labour for the
12
rich household. Similarly, the number of unemployed peo ple is less in the Current Policy
scenario than for the Zero Log market scenario. The reason is that many labour days were
engaged in labour intensive firewood collection. Therefore, the income of poor households is
greater in the Current Policy scenario than in the Zero Log market scenario.
Conclusions
The research shows that Nepal’s current community forest po licies could have contributed to
much of the existing rural poverty and unemployment through limitations on use of
community forests. Current community forest policies emphasise environmental conservation
as their primary goal. This in turn constrains income and employment opportunities for poor
households. Supplies of raw materials from common land are essential to fulfil the basic
needs of the poorest households in rural areas where private land and other employment
opportunities are limited. The policies have also increased income disparities between low
income and high income households. Among the policy options, leasing of community
forestland or producing forest products according to household needs are the most produ ctive
and helpful alternatives in terms of both income and employment generation. The Nepalese
government could reduce rural poverty and unemployment related social problems if this
makes shift from existing community forest policies into those alternative policy models.
References
Adhikari, B., Falco1, S. and Lovett, J. 2004. Household characteristics and forest dependency:
evidence from common property forest management in Nepal. Ecological Economics,
48(2):245-257.
13
Agrawal, B. 2001. Participatory Exclusion, Community Forestry, and Gender: An Analysis of
South Asia and a Conceptual Framework. World Development, 29 (10).1623-48.
CBS. 2003. National Sample Census of Agriculture Nepal. 2001/02. Highlights. National
Bureau of Statistics, Kathmandu.
CFUG Database. 2005. Community Forest User Group National Database. Community
Forestry Division, Department of Forest. Kathmandu, Nepal.
Community Forestry Division 2004. Group Discussion. In the Proceeding of the Fourth
National Workshop on Community Forestry. 4-6 August 2004. Kathmandu, Nepal.
Dhakal, B., Bigsby, H. and Cullen R. 2005. Impacts of Community Forestry Development on
Livestock-Based Livelihood in Nepal. J. of Forest & Livelihood. 4(2): 43-49.
Dongol, C., Hughhey K. & Bigsby, H. 2002. Capital Formation and Sustainable Community
Forestry in Nepal. Mountain Research and Development, 22 (4),70-77.
Gautam, A., Webb. E. and Eiumnoh, A. 2002. GIS Assessment of Land Use/ Land Cover
Changes Associated with Community Forestry Implementation in the Middle Hills of Nepal.
Mountain Research and Development. 22(1); 63-69.
Ives, J and Messerli, B. 1989. The Himalayan Dilemma Reconciling Development and
Conservation. United Nations University & Routledge, London & New York.
14
Master Plan 1988. The Forestry Sector Master Plan. Ministry of Forest, HMG/Nepal.
NPC 2003. The Tenth Plan 2002–2007 (Poverty Reduction Strategy Paper). His Majesty's
Government. National Planning Commission, Kathmandu, Nepal.
http://www.npc.gov.np/tenthplan/docs/Formated10Plan_A4_size.doc Downloaded December
10, 2003
Nurse, M., Tembe, H., Paudel, D. & Dahal, U. 2004. From Passive Management to Health
and wealth Creation from Nepal’s Community Forests. Proceeding of the Fourth National
Workshop on Community Forestry, 4-6 August 2004, Kathmandu: Community Forestry
Division, Department of Forest.
Pokharel, B. and Nurse, N. 2004. Forests and peop le’s Livelihood: Benefiting the Poor from
Community Forestry. J. of Forest & Livelihood. 4(1): 19-29.
UNDP (2005). Nepal Human Development Report 2004. Retrieved on 15 August 2005 from
web: http://www.undp.org.np/publications/nhdr2004/Chapter2.pdf
15
Table 1 Policy Scenarios
a) Base Case (Base Case)
The community forest is modelled as a separate household in the community, maximising its income through sales of outputs, and with no constraints on use for firewood, fodder or timber. Since the community forest has no labour supp ly, it must employ others for production. As is common practice, households can purchase commu nity forest output at a lower price than the market price to meet home consu mption needs, with surplus products sold outside the local market.
b) Leasing of Community Forest Land (Leasing)
Similar to the base case, there are no constraints on use of community forest for firewood, fodder or timber, however, in this scenario the community forest can be leased to individual households. This scenario allows households with surplus labour to use community forests as if the land was under private management, effectively increasing the land available to a household. The community earns a rental on the area leased to households, and earns income from products from the land remaining in community management.
c) Timber Production from full MAI (Full MAI)
The community forest is modelled as a separate household similar to the Base case, but use is constrained to only annual timber production equal to the mean an nual increment (MAI). By-products, including firewood produced from offcuts or residuals, and fodder harvested from under storey species , are also produced for sale.
d) Timber Production from partial MAI (Current Policy)
This scenario is similar to (c), however it models current government community forest policy which is to allow an annual harvest of only 30 percent of MAI for hardwoods and mixed deciduous forests, and 50 percent of MAI for pine forests. By-products can again be produced.
e) Provision of Adequate Firewood (Firewood)
This scenario is similar to (d) but with the constraint on firewood supply relaxed to allow additional firewood harvesting to meet household requirements.
f) Limitations on Timber Production (No Log Market)
This scenario is similar to (d), except that timber production is constrained to the level of household consump tion. This case applies to forest user groups in remote districts, where distance from markets and high transport costs limit markets for timber output, and to community forests in the wildlife buffer zone.
g) No Production (Zero Income)
This scenario applies to communities where the community forest has young age classes and is not producing timber, or there is a strict prohibition on any kind of use.
Note: Short names in parentheses will be used in presentation of policy scenario results
16
Figure 1 Effect of Policies on Incomes
0
10000
20000
30000
40000
50000
60000
70000
80000
90000
100000
Base case Lease Full MAI Firewood Current policy No log market Zero income
Hou
seho
ld In
com
e (R
s)
0
50000
100000
150000
200000
250000
Tota
l Com
mun
ity In
com
e (R
s)
Poor Medium Rich Total Family basic need Survival needs
17
Figure 2 Income Inequality
24 2719 19 19 16 14
34 33
33 33 33 33 32
42 4048 48 49 51 54
0
10
20
30
40
50
60
70
80
90
100
Base case Lease Full MAI Firewood Currentpolicy
No logmarket
Zero income
Tota
l com
mun
ity in
com
e sh
are
(%)
Poor Medium Rich
18
Figure 3 Effect of Policies on Unemployment
-100
0
100
200
300
400
500
600
700
800
Base case Lease Full MAI Firewood Currentpolicy
No log market Zero income
Une
mpl
oym
ent/e
mpl
oym
ent (
days
)
Total Poor HH Medium HH Rich HH
Note: Negative signs for hired labourers (need more than household labour supply)


