Embed Size (px)
Citation preview
Report No. 24296-PAK
PakistanPoverty AssessmentPoverty in Pakistan: Vulnerabilities, Social Gaps,and Rural DynamicsOctober 28, 2002
Poverty Reduction and Economic Management Sector UnitSouth Asia Region
Document of the World Bank
Pub
lic D
iscl
osur
e A
utho
rized
Pub
lic D
iscl
osur
e A
utho
rized
Pub
lic D
iscl
osur
e A
utho
rized
Pub
lic D
iscl
osur
e A
utho
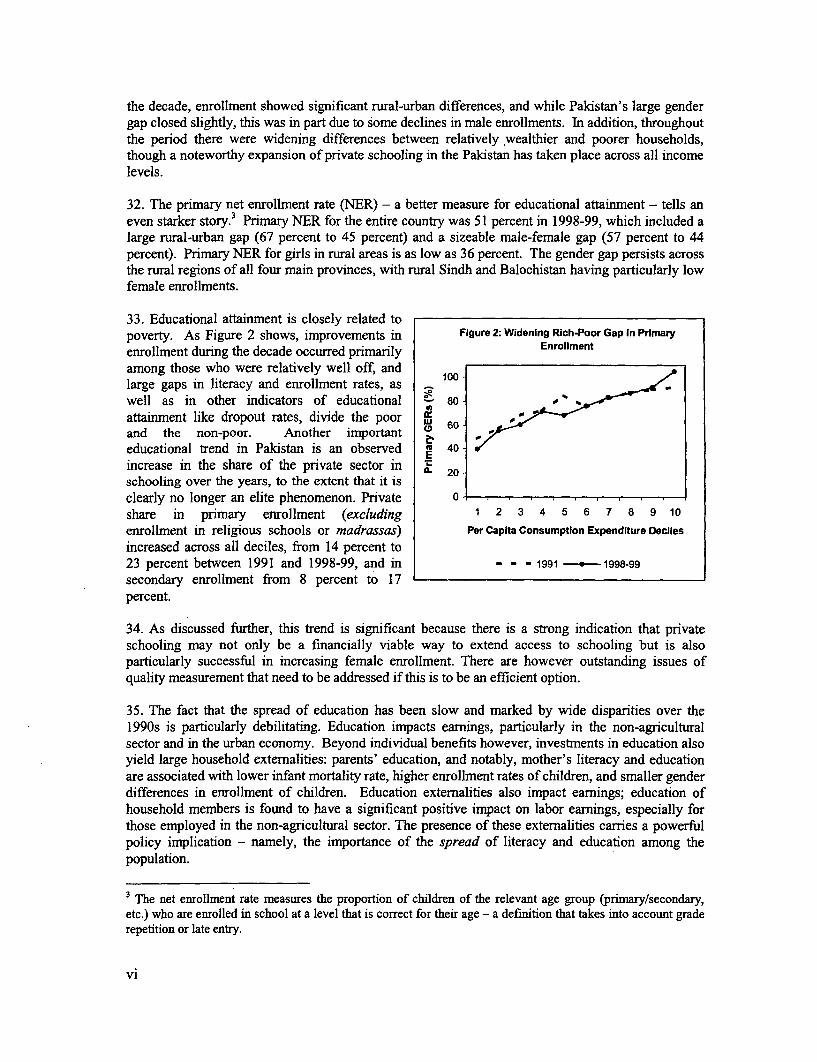
rized
CURRENCY AND EQUIVALENTS
Currency Unit = Pakistan RupeeUS $1 = PKR 58.73
FISCAL YEARJuly 1 - June 30
ACRONYMS AND ABBREVIATIONS
ADBP Agricultural Development Bank of Pakistan NRSP National Rural Support Program
AKRSP Agha Khan Rural Support Program NWFP North West Frontier Province
BHU Basic Health Unit OLS Ordinary Least Squares
CBO Community-Based Organization OPD Outpatient Department
DFID Department for International Development (UK Government) OPP Orangi Pilot Project
EOBI Employees Old-Age Benefits Program ORS Oral Rehydration System
FATA Federally Administered Tribal Areas PBM Pakistan Bait-ul-Maal
FBC Federal Bank for Cooperatives PIHS Pakistan Integrated Household Survey
FFE Food-for-Education Program PPAF Pakistan Poverty Alleviation Fund
GDP Gross Domestic Product PRHS Pakistan Rural Household Survey
GER Gross Enrollment Rate PSU Primary Sarnpling Unit
GIC Growth Incidence Curve PTA Parent-Teacher Association
HBFC House Building Finance Corporation QPS Qualitative Poverty Survey
HIES Househild Income and Expenditure Survey REIC Rural Health Clinic
IFPRI International Food Policy Research Institute RSP Rural Support Program
IMF International Monetary Fund SAP Social Action Program
I-PRSP Interim Poverty Reduction Strategy Paper SBP State Bank of Pakistan
KAIRP Katchi Abadi Improvement and Regularization Program SRSP Sarhad Rural Support Program
MFI Microfmance Institution TC Tehsil Council
NCB Nationalized Commercial Banks UC Union Council
NER Net Enrollment Rate ZC Zilla (district) Council
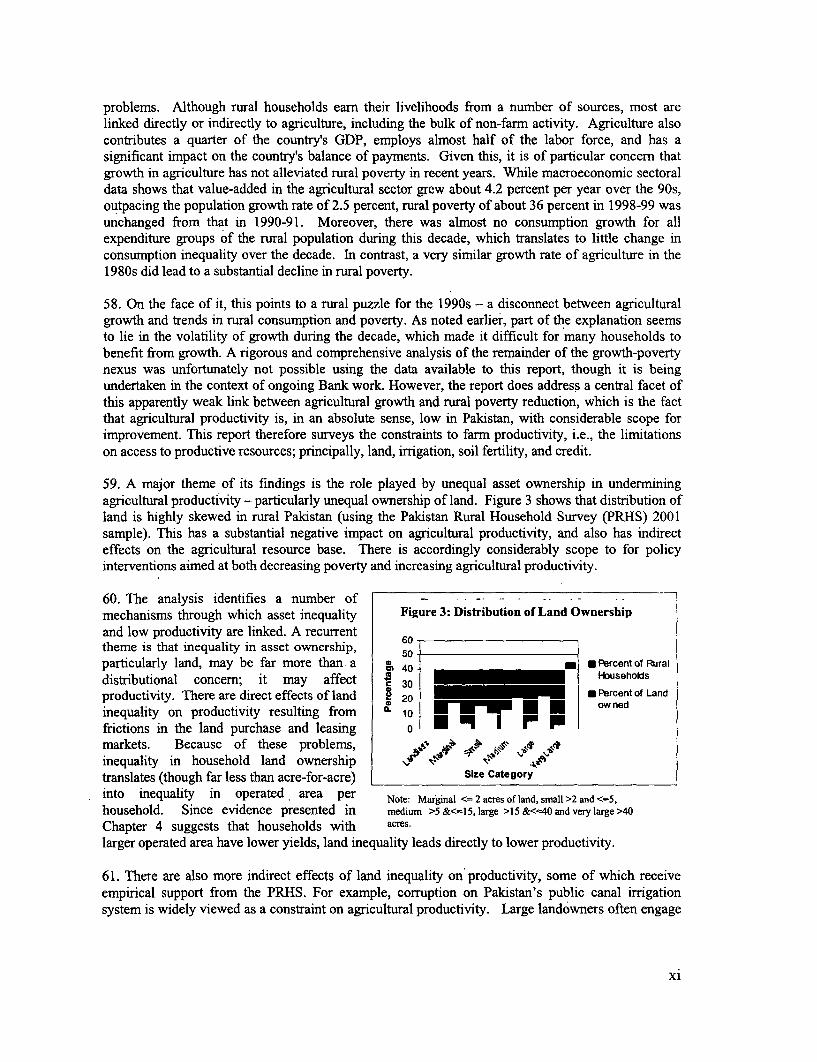
NGO Non-Government Organization
Vice President: Mieko Nishimizu, SARVPCountry Director: John W. Wall, SACPK
Sector Director: Sadiq Ahmed, SASPRSector Manager: Ijaz Nabi, SASPR
Task Manager: Tara Vishwanath, SASPR
Table of Contents
EXECUTIVE SUM M ARY .............................................................. i
1. LOOKING BEYOND THE DEFICIT: SOCIAL GAPS AND SUSTAINABLEDEVELOPMENT IN PAKISTAN ........................................................ 1
Poverty, Growth and the Social Gap ....................................................... 2
Explaining the Social Gap: Inadequate Social Spending ................................................. 5
Problems of Public Sector Management and Implementation ......................................... 8
Political Economy and Social Spending: A New Hypothesis ......................................... 9
Dual Constraints: Closing the Social Gap under Constraint of Fiscal Deficit ................ 14
Re-addressing the Social Gap ...................................................... 15
2. UNDERSTANDING POVERTY IN PAKISTAN .18
Poverty: Measurement, Incidence and Trends for the 1990s .18Poverty, Growth and Inequality .25Income Dynamics, Risk and Vulnerability .28Household Determinants of Vulnerability and Poverty .32Social Determinants of Poverty: Labor Markets and the Rule of Law .37
Conclusion ...... 42
3. FOCUS ON HUMAN DEVELOPMENT: THE BENEFITS AND POLITICALECONOMY OF HEALTH AND EDUCATION .45
Trends in Education During the 1990s, with Recent Findings .46
Education, Household Welfare and the Economy .52What Determines Participation in Schooling? .53Health in Pakistan .62The Political Economy of Service Delivery: Some Hypotheses .73
4. THE RURAL NEXUS: POVERTY AND PRODUCTIVITY .83
Distribution of Land Ownership and Other Farm Assets .84
Public Provision of Canal Irigation .86Soil Degradation: Waterlogging and Salinity .90Access to Credit .93Rural Factor Markets .96Farm Productivity .100Policy Conclusions .102
5. POLICY IMPLICATIONS: RECENT EXPERIENCE ANDFUTURE PRIORITIES ............................................. 105
Social Protection - Managing Risk and Reducing Vulnerability .................................... 107Human Development - Education and Health ............................................. 114Coordinated Strategies for Addressing Rural Poverty ............................................. 1 119Conclusion ............................................. 123
ANNEX TO CHAPTER 2 .................................................... 126ANNEX TO CHAPTER 3 .................................................... 139ANNEX TO CHAPTER 4 .................................................... 164ANNEX TO CHAPTER 5 .................................................... 167
LIST OF BACKGROUND PAPERS .................................................... 170
REFERENCES .................................................... 171
TABLES
Table 1.1: Health indicators in Pakistan relative to comparable countries ............................................ 3Table 1.2: Education indicators in Pakistan relative to comparable countries ..... 3Table 1.3: Regional Comparison of Select Human Development Indicators ..... 5Table 1.4: Benefit of Public Education Spending Per Capita: 1998-996 ..... 6Table 1.5: Distribution of Public Expenditure on Education: 1998-99 ..... 6Table 2.1: Poverty Estimates for Pakistan .................................................................. 20Table 2.2: Incidence of Poverty by Province and Region During 1990s .................................................. 21Table 2.3: Mean Per Equivalent Adult Expenditure (Monthly, 1990-91 Prices) - 1998-99 .................... 23Table 2.4: Inequality - Gini Coefficients (Per Equivalent Adult Consumption Expenditures) ................ 26Table 2.5. Vulnerability and Poverty by agro-climatic zones (using IFPRI panel;
poverty line-Rs. 2580, TimeHorizon =2 years) .................................................................. 29Table 2.6: hicidence of Poverty by Employment Status of Household Head (1998-99) .33Table 2.7: Incidence of Poverty by Land Ownership of Household (98-99) .34Table 2.8: Share of Selected Expenditure Categories in Household Consumption (1998-99) .35Table 2.9: Incidence of Poverty by Education of Household Head (98-99) .35Table 2.10: Net Primary Enrollments of Poor and Non-Poor .................................................................... 36Table 2.11: Access to Drinking Water and Sanitation for Poor and Non-Poor . . 36Table 2.12: Connectivity to Electricity, Gas and Phone ............................................... 37Table 3.1: Primary Gross Enrollment Rates (%) .................................................................... 46Table 3.2: Net Enrollment Rates in 1998-99 .................................................................... 47Table 3.3: Gross Enrollments, Share of Private Schools in Enrollment, and Proportion of
Individuals in Primary and Secondary School Age Groups - 1998-99 ................................... 49Table 3.4: School Attendance Profile (1998-99) for Children .............................................................. 50Table 3.5: Access to School and Enrollments in Rural Areas (1998-99) ................................................. 56Table 3.6: School Quality Indicators .................................................................... 59Table 3.7: Teacher Absenteeism .................................................................... 59Table 3.8: Female Health Care (Related to Childbirth) -- 1998-99 ......................................................... 64Table 3.9: Knowledge and Use of Contraception, and Fertility (Married Women, Age 15-49) .............. 65Table 3.10: Infant Mortality (Per 1000 Live Births) .................................................................... 66Table 3.11: Incidence of Diarrhea for Children of Age 5 and Below (During 30 Days Preceding
the Survey) - 1998-99 .................................................................... 66Table 3.12: Proportion of Rural Population with Health Facilities in Village (1998-99) ........................... 71Table 3.13: Access to Health Facilities and Selected Health Indicators (1998-99) . . 71Table 3.14: Facility characteristics and outpatient visits .............................................. 72Table 4.1 Land Inequality by Province (Village Census) .................................................................... 85Table 4.2: Distribution of Income by Source for Landless Households ................................................... 86Table 4.3. Distribution of Farm Asset Ownership among Cultivating Households ................................. 86Table 4.4: Availability of water in watercourse ........................................ ...... 88Table 4.5: Position of watercourse/plot and water use ............................................ 89Table 4.6: Credit Status by Farm Size Category ............................................ 94Table 4.7: The Effect of Asset Ownership on Factor Intensity ............................................ 97Table 4.8: Property Rights over Land ............................................ 97
BOXES
Box 1.1: Patterns of Low and Inefficient Social Spending: The Case of Punjab ........................................ 7Box 1.2: The Paradox of Access: Water, but no Education ....................................................................... 11Box 1.3: Politics, rent-seeking and local elites: the nexus between a nambardar and the police ............. 12Box 2:1: Household, Data Sources and Caveats ........................................................................ 19Box 2.2: Vulnerability, Chronic Poverty, and Transitory Poverty ............................................................ 30Box 2.3: Drought-Related Shock: Insights from Case Studies of Two Villages ....................................... 31Box 2.4: Dogar truckers and Christian brick-kiln workers in Faisalabad .................................................. 39Box 2.5a: How Informal Mediation Reproduces Inequalities (1) ................................................................ 40Box 2.5b: How Informal Mediation Reproduces Inequalities (II) .............................................................. 41Box 3.1: Reasons for Never Attending or Leaving School - Evidence from PIHS (1998-99) ................. 54Box 3.2: Female Enrollment and Private Schooling: A Unique Opportunity? .......................................... 57Box 3.3: Caste and Schooling ........................................................................ 58Box 3.4: Private Schools in Pakistan: Purely an Urban Elite Phenomenon? ............................................. 62Box 3.5: Quality Variations Across Health Facilities in Rural Pakistan ................................................... 72Box 4.1: Ownership of Land by Women ........................................................................ 84Box 4.2 Canal Water Misappropriation: Insights from the Qualitative Survey ....................................... 89Box 4.3: Formal and Informal Sources of Credit in Rural Pakistan .......................................................... 95Box 5.1: Pakistan's Interim Poverty Reduction Strategy Paper (I-PRSP) ............................................... 106Box 5.2: Poverty Monitoring and Tracking of Progress towards the Millennium Development Goals.. 107Box 5.3: Recent Initiatives in Financing Microcredit Programs ............................................................. 112Box 5.4: The Social Action Program in Pakistan ........................................................................ 115Box 5.5: Decentralization and Devolution in Pakistan ........................................................................ 116Box 5.6: Food for Education and Female Education Scholarship Programs ........................................... 118Box 5.7: Innovative Experiments in Micro-finance and Land Allocation ............................................... 121
FIGURES
Figure 1.1: Income and infant mortality in Pakistan and comparison sample, 1960-98 ............................... 4Figure 1.2: Income and female-male illiteracy gap in Pakistan and comparison sample, 1970-1998 .......... 4Figure 1.3: Social service expenditures in Pakistan (Categories of spending as a fraction of GDP ............. 6Figure 1.4: Share of Primary in Public Spending on Education: 1990s ........................................................ 7Figure 1.5: Governance impacts incomes: benchmarking Pakistan's record .............................................. 15Figure 2.1: Poverty in Pakistan ........................................................................ 20Figure 2.2: Mean Per Equivalent Adult Consumption (Constant 1990-91 Prices) ..................................... 21Figure 2.3: Poverty in Provinces: 1998-99 ........................................................................ 22Figure 2.4: Sensitivity of Head-Count Ratio to Poverty Line: 1990s ........................................................ 25Figure 2.5: Growth Incidence Curve (Rural): 90-91 to 98-99 ..................................................................... 27Figure 2.6: Growth Incidence Curve (Urban): 90-91 to 98-99 ................................................................... 27Figure 2.7: Decomposition of the change in poverty incidence .................................................................. 28Figure 2.8: Literacy in 1998-99 (population of Age> 15) Poor and Non-poor ............................................ 36Figure 3.1: Primary GERs in 1990s ........................................................................ 46Figure 3.2: Gross Primary Enrollment Ratios by Per Capita Household Expenditure ................................ 48Figure 3.3: Median Per Capita Annual Expenditure on Primary Schooling ............................................... 49Figure 3.4: Private Shares in Gross Enrollment by Per Capita Household Expenditure ............................. 49Figure 3.5: School Attendance Profile for Rural Girls: 1998-99 ................................................................ 51Figure 3.6: School Attendance Profile for Rural Boys: 1998-99 ................................................................ 51Figure 3.7: Proportion of Dropouts for Age 5-21 those dropping out in primary school ........................... 51Figure 3.8: Parents' Education and School Participation ........................................................................ 55
Figure 3.9: Student attendance as a function of school quality ............................................................ 59
Figure 3.10: Enrollment by School Access & Amenities ............................................................ 60
Figure 3.11: Establishment of Private Schools ............................................................ 61
Figure 3.12- Proportion of Stunted, Underweight and Wasted Children in Rural Areas ............................ 67
Figure 3.13: Z-scores vs. Age ............................................................ 68
Figure 3.14: Z-scores vs. Income ..................... 69
Figure 3.15: Actual is less than Expected Primary School Enrollment in Palistan .................................... 74
Figure 4.1: Distribution of Land Ownership ......................................................... 84
Figure 4.2: Distribution of Owned Land by Per Capita Consumption Quintiles ...................... .................. 85
Figure 4.3: Non-Agricultural Income as Percentage of Total Income ........................................................ 85
Figure 4.4: Distribution of waterlogged and saline plots by zone ......................................................... 92
Figure 4.5: Fraction of plot area waterlogged or saline among affected plots ............................ ................ 92
Figure 4.6: Fertilizer Expenditure per Cultivated Area ......................................................... 95
Figure 4.7: Land Acquisition Pattern ......................................................... 97
Figure 4.8: Tenant by Province .................... 98

Preface
This report is a culmination of work that began in September 2000 with the drafting of a concept paperidentifying issues crucial to understanding poverty in Pakistan, in which the country's government, localresearchers and NGOs were all involved.
The issues that were identified during this consultative process addressed particularly the country's ruralsector, impediments to service delivery, and institutional and political constraints, in preparation for thedesign and implementation of a new integrated quantitative-qualitative survey under the aegis of thePoverty Assessment work - Pakistan Rural Household Survey (PRHS) and an associated QualitativeSurvey of Poverty.
The PRHS is a nationally representative, multi topic, rural household survey covering 16 districts with asample size of about 2,800 households distributed among approximately 180 villages. Approximately onethird of the sample consists of households that were part of a panel dataset collected by IFPRI between1986-1991. In addition to a very detailed rural module to uncover determinants of rural poverty, it alsoincluded a detailed community questionnaire, as well as facility questionnaires for schools and ruralhealth centers.
The Qualitative Survey of Poverty enriches and informs analyses based on quantitative information fromPRHS. It consists of detailed case studies and was designed to understand constraints to collective actionto mitigate poverty, by examining the social dynamics and groupings in communities and how theyimpede or improve access to institutions, services, and markets. In-depth fieldwork was conducted in sixvillages in Punjab and Sindh, drawn from the universe of communities where the PRHS wasadministered.
The insights and findings of this report are primarily based on analyses of three data sources: severalrounds of Pakistan Integrated Household Survey (PIHS) and Household Income Expenditure Surveysconducted regularly by the Federal Bureau of Statistics (FBS), Pakistan; the Private School Censusundertaken by the FBS, and the aforementioned PRHS and the integrated qualitative survey, which wasundertaken in the context of the World Bank's Poverty Assessment, in collaboration with the PakistanInstitute of Development Economics and the Sustainable Development Policy Institute. The report alsoreferences secondary sources as appropriate to its needs, but should not be considered a comprehensivesurvey of the literature on the topics covered.
The report has evolved in cooperation with the PRSP initiatives undertaken in Pakistan. Further, severalstrands of the report have been disseminated and discussed during the process of preparation. The mostnotable forums for discussion have been the National Poverty Workshop in March 2001, the HumanDevelopment Forum in January 2002, and the Regional Poverty Workshop in March 2002, all held inIslamabad.
Broadly, the report should be seen as being part of an evolving effort to increase policy makers'understanding of poverty in Pakistan. It attempts when possible to provide policy recommendations forsuch individuals, but also points to important outstanding issues that should be the subject of future work.This includes expanding the understanding of urban poverty; conducting a Public Expenditure Review toidentify the inefficiencies associated with public spending, deepening and clarifying specific strategiesaddressed to human development and rural areas; assessing the impact of poverty programs, andunderstanding enduring institutional constraints in the context of the full implementation of Pakistan'sdevolution reforms. The World Bank looks forward to continue working with our clients in the pursuit ofthese issues.
ACKNOWLEDGEMENTS
This report was prepared by a team led by Tara Vishwanath, with the core team comprising of PhilipKeefer, Ghazala Mansuri and Ambar Narayan.
The report draws on specific contributions to various chapters - from Jishnu Das (chapter 3), WilliamEasterly and Zahid Hasnain (chapter 1), and Hanan Jacoby (chapter 4). Acknowledgements are also dueto Shahnaz Kazi for task managing and coordinating the Pakistan Rural Household Survey (PRHS) in thefield.
The quantitative survey (PRHS) undertaken for this report was conducted in collaboration with a teamfrom the Pakistan Institute of Development Economics (PIDE) led by Ghulam Arif; a team fromSustainable Development Policy Institute, led by Haris Gazdar, collaborated in the associated qualitativesurvey.
Research based on new and existing data benefitedfrom analysis and research by Martin Cumpa, HabibaDjebbari, Tulika Narayan, Hina Nazli and Nobuo Yoshida; a team led by Nabeela Arshad (PIDE)prepared the PRHS data for analysis; editorial support was provided by Peter Lagerquist, and PinckneyHargrove contributed tofinal editingfor the gray cover.
At various stages of its preparation, the report gained from comments and advice from Harold Alderman,Zoubida Allaoua, David Dollar, Jeffrey Hanmmer, Emmanuel Jimenez, John Panzer, Michael Walton, N.Roberto Zagha and Salman Zaidi. The team would like to thank Charles Griffin and all otherparticipants at the Bankwide review meeting for the last round of comments and suggestions. Finally, theteam thanks Ijaz Nabi, Sadiq Ahmed and John Wallfor continuing support and guidance.
The document benefited from consultations held in September, 2000 with the Government of Pakistan(GOP), researchers and NGOs; discussions at the National Poverty Workshop in March 2001;discussions with Dr Waqar Masood Khan (GOP) and PRSP related dialogue during the intermediatedrafts; and discussions for the gray cover with representatives from the Government of Pakistan -
federal, as well as provincial governments - at a meeting in Islamabad (September, 2002).
Abdul Qadir made arrangements for missions andfacilitation of contracts for fieldwork. Jillian Tullettand Thelma Rutledge formatted earlier draft versions of the report, and Thelma Rutledge finalized thedocument for gray cover. The team gratefully acknowledges financial support from Dutch Trust Fund, theDanish Trust Fund, the Social Protection Board, and RAD for the new survey and all related preparatorywork
Executive Summary
1. In the last three years, the Government of Pakistan has brought about macroeconomic stabilityand has implemented wide-ranging structural reform to spur economic growth. Perhaps the mostimportant example of restructuring is the devolution initiative which, when successfully implemented,holds promise for improved access to critical public services for the poor. In addition the povertyreduction strategy prepared by the country highlights needed improvements in education, health andwater sectors. Further the Government took two major initiatives - Khushal Pakistan (acomprehensive poverty intervention) and Khushali Bank (a microcredit bank) - as nationwide effortsto address poverty and vulnerability.
2. This report is a detailed examination of poverty trends and their underlying causes. The analysiscovers the 1990s, documenting the underlying causes of the deficiencies in the social agenda. Indoing so, it highlights the critical priorities for poverty reduction that the ongoing reform programwill need to incorporate.
3. The Government of Pakistan faces challenges and opportunities unprecedented in its history. Thelevel of poverty in the country has not appreciably changed in the ten years preceding 1999, despitehaving fallen in the previous ten. The educated and well off urban population lives not so verydifferently from their counterparts in other countries of similar income range, or even of theircounterparts in Western countries. However, the poor and rural inhabitants of Pakistan are being leftbehind. This is shown by many social indicators in ways that, unless sharply improved will leavePakistan falling further below other countries' performance in the future.
4. Largely based on data collected by Pakistani agencies and institutes', the report analyzes thesocial gaps and fissures that are becoming ever more pronounced. It identifies constraints that impedeeconomic and social progress and suggests policies for the future.
5. One third of the population can be classified as poor in 1999, and somewhat more in rural areas.The country's education and health indicators are depressed when compared to other countries ofsimilar per capita income or rate of growth, and reveal large regional, urban/rural, and genderdisparities.
6. The differences between urban and rural education and health indicators are closely associatedwith the high incidence of poverty in the 1990s. The raising and narrowing of health and educationdifferences, this report argues, is the way the government can move towards its goal of povertyreduction and macroeconomic growth.
7. For example, Pakistan, in comparison to other countries of similar income, had a 23 percent lowershare of the population with access to sanitation. The gender gap in literacy has not decreased since1970, as it has in comparator countries. School enrollment is lower in Pakistan, adult illiteracy isgreater, and child mortality is higher.
' The Government of Pakistan has produced a candid and analytical assessment of the challenges it faces in apaper called the Interim Poverty Reduction Strategy Paper ("I-PRSP"). Their effort, which is a strategy not anassessment, differs somewhat from the thrust of this paper, but the effort is strong and well taken, and in largepart agrees with the message in this paper.
8. The most significant feature of the social gap is the variance of social indicators between the richand the poor. Lagging national social indicators are in large part a direct result of very low health andeducational outcomes among the poorer segments of its population in comparison to its richersegments, whose indicators are almost on a par with those of developed countries. For example,primary gross enrollment rates among the top three deciles, by per capita consumption, are around 90percent, whereas that among the bottom three deciles is around 50 percent. As argued in this report,these outcomes reflect a failure of public service delivery. The poor cannot afford to substitute privatefor public services, so they are disproportionately affected. Also, to the extent the rich no longer usepublic services, they exert little pressure on the public service to be responsive in terms of quality oramount of spending.
9. The problems in public service delivery can be linked to the fact that in the competition for theallocation of public spending, social spending has been squeezed. For the past two decades a risingdebt service burden along with continued substantial defense expenditure in the face of stagnantrevenues has left little fiscal capacity to meet the rising needs of basic social services. During the1990s, overall government revenue fell from 17 percent of GDP in 1991 to around 16 percent in 1998and 1999. Even though defense spending fell from 6 percent of GDP in 1991 to below 5 percent in1999, interest expense rose from 5 percent to 7.3 percent over the same period. As a consequence,compared to other countries at its income level, Pakistan allocates 42 percent lower health spendingper capita. Furthermore, the failure of public services can also be traced to a record of poorimplementation of public programs, which has eroded their quality. This report introduces aninteresting hypothesis that these patterns of spending are the result of political choices that reflect thevoting blocks prevalent in Pakistani elections.
10. Much research has shown that there is a correlation between educational attainment andeconomic growth in developing countries. The low level of education must therefore be understoodas slowing economic growth. Similarly, the chronic child malnutrition in rural areas, which appearsto have not changed in severity in 15 years, impedes the economic prospects of affected adults in theirlater lives. The report thus argues that low education and health indicators have themselves been partof the reason that Pakistan's economic growth rate has not been sustained through the 1990s.
11. Growing debt has also contributed to the slowing down of economic growth. External borrowingfinanced short term and unsustainable spurts in growth in the 1980s. With increased debt servicing,fiscal space shrank, which contributed to stagnation in the latter half of the 1990s, further increasingthe burden imposed by the debt.
12. Therefore debt management inescapably has become a major priority of recent governments.This report argues that cutting spending on the social sector is not the solution, as it will only ensurethat poverty remains well entrenched. What is needed is a sustained and coordinated effort to addressthe obstacles that have hitherto prevented Pakistan from making better use of its limited resources.This report argues that obstacles to the implementation of public policies need to be removed, and theunderlying issues of governance addressed. Furthermore, particular attention should be paid toPakistan's rural sector, which is home to most of the country's poor, and also exposes a number ofspecific challenges to poverty reduction.
13. The chapters of this report discuss a number of specific ways in which govemment spending andpolicy decisions contribute to the social gap. These range from allocation and quality of spending inhealth and education to the range of barriers to market access confronting the rural poor. Chapterone introduces the main themes of the report, placing them in a cross-country context. Chapter twoprovides an anatomy of poverty, exploring its evolution through the 1 990s, outlining problems relatedto its measurement, and discussing dynamic factors that influence how people identified as poor
ii
either fall into or escape from their circumstances. It also explores the broader dimensions andpossible social determinants of poverty; exploring the social characteristics associated with lack ofconsumption and pointing to the influence of human capital on poverty. Chapters three and four thenmore deeply examine the dynamics of the most important social sectors - education and health, and ofthe most neglected target areas -the rural sector. Chapter five places the findings of this report in thecontext of Pakistan's own Interim Poverty Reduction Strategy, summing up priorities for povertyalleviation, highlighting areas for further research, and identifying relevant challenges and lessons forstakeholders, including governments and NGOs. A summary of the main chapter findings andsuggestions follows below.
Poverty, Growth and Inequality
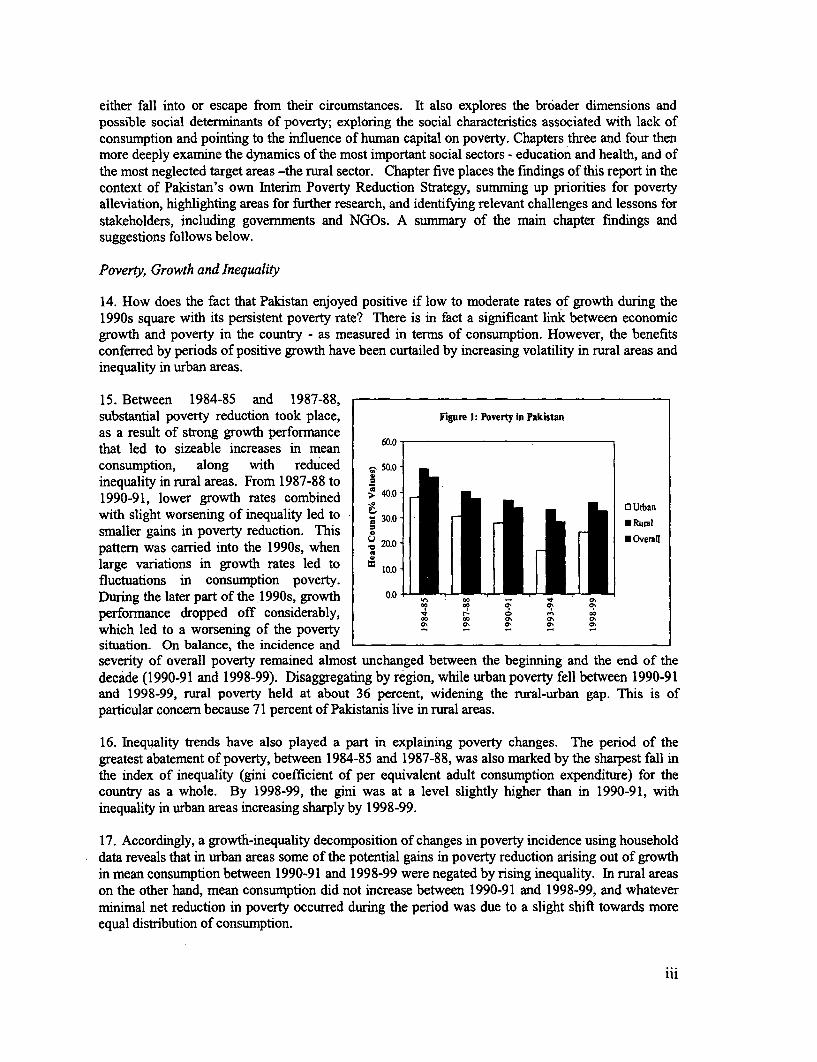
14. How does the fact that Pakistan enjoyed positive if low to moderate rates of growth during the1990s square with its persistent poverty rate? There is in fact a significant link between economicgrowth and poverty in the country - as measured in terms of consumption. However, the benefitsconferred by periods of positive growth have been curtailed by increasing volatility in rural areas andinequality in urban areas.
15. Between 1984-85 and 1987-88,substantial poverty reduction took place, Figure 1: Poverty in Pakistan
as a result of strong growth performancethat led to sizeable increases in meanconsumption, along with reduced . 50.0
inequality in rural areas. From 1987-88 to . *1990-91, lower growth rates combined > 40.b_n
with slight worsening of inequality led to -30.0 . Rurl
smaller gains in poverty reduction. This __u 20.0 ~~~~~~~~~~~moverallpattern was carried into the 1990s, when Q 20.0
large variations in growth rates led to M t * * fluctuations in consumption poverty.During the later part of the l990s, growth 0.0 ., -X
performance dropped off considerably, v cO
which led to a worsening of the povertysituation. On balance, the incidence andseverity of overall poverty remained almost unchanged between the beginning and the end of thedecade (1990-91 and 1998-99). Disaggregating by region, while urban poverty fell between 1990-91and 1998-99, rural poverty held at about 36 percent, widening the rural-urban gap. This is ofparticular concern because 71 percent of Pakistanis live in rural areas.
16. Inequality trends have also played a part in explaining poverty changes. The period of thegreatest abatement of poverty, between 1984-85 and 1987-88, was also marked by the sharpest fall inthe index of inequality (gini coefficient of per equivalent adult consumption expenditure) for thecountry as a whole. By 1998-99, the gini was at a level slightly higher than in 1990-91, withinequality in urban areas increasing sharply by 1998-99.
17. Accordingly, a growth-inequality decomposition of changes in poverty incidence using householddata reveals that in urban areas some of the potential gains in poverty reduction arising out of growthin mean consumption between 1990-91 and 1998-99 were negated by rising inequality. In rural areason the other hand, mean consumption did not increase between 1990-91 and 1998-99, and whateverminimal net reduction in poverty occurred during the period was due to a slight shift towards moreequal distribution of consumption.
Vulnerability and Poverty in Pakistan
18. The high volatility of poverty rates during the 1990s, especially in rural areas, suggests that alarge share of the population may be classified as transient poor-i.e. households that move in and outof poverty in response to economic shocks. Analysis in Chapter 2 suggests that in 1998-99, these"transients" may have accounted for a substantial proportion of observed poverty, with as much as 43percent of the total population clustered within a small range of 75 to 125 percent of the poverty line.
19. There is a need to understand the consumption dynamics that drive vulnerability but which cannotbe determined on the basis of static cross-sectional indicators. Chapter 2 uses IFPRI (IntemationalFood Policy Research Institute) panel data to develop a dynamic measure of vulnerability, defined asthe ex-ante probability of falling into poverty during a specified period of time. The analysis focusesspecifically on the risk imposed by weather-related shocks, which are the most significant causes ofincome volatility in Pakistan and particularly its rural areas. It finds both a high incidence ofvulnerability in Pakistan, as well as a close overlap with poverty: 56 percent of all sampledhouseholds were found to be vulnerable, 75 percent of those classified as vulnerable were alsochronically poor, and 87 percent of all chronically poor households were vulnerable.
20. Furthermore, the correlates of vulnerability appear, not surprisingly, to overlap considerably withthose of poverty. These include more unequal land ownership and less diversification of agriculturalincome. These factors also are likely to explain strong regional effects observed in the IFPRI data,with the lowest levels of vulnerability prevailing in the canal colony areas of Punjab, and the highestin the southem irrigated plains in the province of Sindh, where land ownership is both more unequaland incomes less diversified than in the northern province.
21. However, there are also some apparent differences between the correlates of vulnerability andpoverty. IFPRI panel data correlating household characteristics with vulnerability broadly indicatesthat ownership of assets like land, machinery or livestock clearly mitigates vulnerability. However,land ownership by itself mitigates vulnerability the least, pointing up the prevalence of thin marketsfor land and collateral in rural areas, and the importance of livestock, which has the greatest impacton vulnerability, in smoothing household consumption.
22. This analysis carries a number of implications. Given the importance of weather related risks,policies that expand access to non-farm sources of income may be quite important, and these maybenefit from being geographically focused in light of the significant regional correlates ofvulnerability. In this* context, the preliminary results call for continued analytical focus towardsunderstanding better how income risk differs across regions, and how that should influence thetargeting of poverty programs.
Household and Socially Based Linkages to Poverty
23. As noted, lagging and uneven growth and inequality help to explain poverty trends. But it is alsoclear that some factors weaken the link between growth and poverty, particularly for some segmentsof society, for instance by making them vulnerable to risk. Data from the household surveys in the1990s, including qualitative information on social dynamics, offer some evidence on these multi-dimensional aspects of poverty. The economic and social factors identified below are considered tobe particularly relevant in this context. The constraints imposed by these factors are further
iv
exacerbated by rule of law problems associated with governance that exist in the country, in terms ofthe costs and obstacles they create for the poor.2
24. Skewed pattern of landownership: More than one-half of the rural population in Pakistan islandless. The incidence of rural poverty is highest among those who own no land and falls steadily asthe ownership of land increases. Over 40 percent of landless households are poor and togetherconstitute 70 percent of the rural poor, while less than 3 percent of households owning 10 acres ormore are poor.
25. Poor educational attainment: 42 percent of the population living in households with illiterateheads is poor, compared to 21 percent of those in other households. Net primary enrollment rates are59 percent for the non-poor, and 37 percent for the poor, and are otherwise particularly low amongpoor female children in rural areas.
26. Poor health and fertility indicators: The poor are less likely to access health facilities - theincidence of medical consultation for diarrhea among children is 79 percent for the poor compared to84 percent for the non-poor. Similar or larger gaps exist in various measures of access to maternalhealth care; 15 percent of married women of ages 15 to 49 in the lowest expenditure quintile haveever used contraceptives, compared to 25 percent of those in the highest quintile.
27. Disadvantageous consumption patterns: The low level of human development of the poor isreinforced by the fact that they have to allocate a larger share of their expenditures towardsnecessities like food, fuel and lighting than do the better off. Consequently they are able to spend lesson items, such as healthcare or education, which could boost their long-term earning potential.
28. Poor access to critical infrastructure: As many as 24 percent of the poor rely on potentially unsafesources for drinking water, compared to 19 percent of the non-poor; only about 52 percent of the poorlive in households connected to electricity, compared to 76 percent of non-poor households.
29. Restrictive social grouping: Individuals and households are part of wider social groupings,defined by kinship or caste characteristics. According to case studies based on qualitative data onlabor markets in rural Pakistan, (illustrated in Chapter 2) the associated importance of social collateralcan be a critical determinant of the opportunities and vulnerabilities to which an individual or ahousehold is exposed. Social grouping also matters for issues like access to schooling, and collectiveaction, e.g., to secure community access to services.
Education in the 1990s
30. The poverty analysis above provides some indication of the nature and extent of poverty inPakistan, not just as a measure of consumption, but also as an index of human development.Educational attainment is among the most valuable benefits of such development because it is animportant determinant of whether someone living in poverty is likely to improve their circumstances.
31. Among the most salient educational trends in Pakistan during the 1990s is the fact that while theprimary gross enrollment rate (GER) improved until the middle of the decade, it then stagnated. AGER of 69 percent around 1998-99 was well short of the target of 88 percent by 1997-98 set by thecountry's ambitious Social Action Program - and lowest among countries in the region. Throughout
2 Chapter One provides some evidence on how Pakistan ranks poorly on certain indices of governmenteffectiveness and rule of law, compared to other countries with similar levels of income - factors that are likelyto have the most significant impact on the poorer sections of the population.
v
the decade, enrollment showed significant rural-urban differences, and while Pakistan's large gendergap closed slightly, this was in part due to some declines in male enrollments. In addition, throughoutthe period there were widening differences between relatively wealthier and poorer households,though a noteworthy expansion of private schooling in the Pakistan has taken place across all incomelevels.
32. The primary net enrollment rate (NER) - a better measure for educational attainment - tells aneven starker story.3 Primary NER for the entire country was 51 percent in 1998-99, which included alarge rural-urban gap (67 percent to 45 percent) and a sizeable male-female gap (57 percent to 44percent). Primary NER for girls in rural areas is as low as 36 percent. The gender gap persists acrossthe rural regions of all four main provinces, with rural Sindh and Balochistan having particularly lowfemale enrollments.
33. Educational attainment is closely related topoverty. As Figure 2 shows, improvements in Figure 2: Widening Rich-Poor Gap In Primaryenrollment during the decade occurred primarily Enrollmentamong those who were relatively well off, andlarge gaps in literacy and enrollment rates, aswell as in other indicators of educational 80
attainment like dropout rates, divide the poor & ,and the non-poor. Another important 6
educational trend in Pakistan is an observed E 40
increase in the share of the private sector in X 20
schooling over the years, to the extent that it isclearly no longer an elite phenomenon. Private 0share in primary enrollment (excluding 1 2 3 4 5 6 7 8 9 10
enrollment in religious schools or madrassas) Per Capita Consumption Expenditure Decilesincreased across all deciles, from 14 percent to23 percent between 1991 and 1998-99, and in - - - 1991 - 1998-99secondary enrollment from 8 percent to 17percent.
34. As discussed further, this trend is significant because there is a strong indication that privateschooling may not only be a financially viable way to extend access to schooling but is alsoparticularly successful in increasing female enrollment. There are however outstanding issues ofquality measurement that need to be addressed if this is to be an efficient option.
35. The fact that the spread of education has been slow and marked by wide disparities over the1990s is particularly debilitating. Education impacts earnings, particularly in the non-agriculturalsector and in the urban economy. Beyond individual benefits however, investments in education alsoyield large household extemalities: parents' education, and notably, mother's literacy and educationare associated with lower infant mortality rate, higher enrollment rates of children, and smaller genderdifferences in enrollment of children. Education externalities also impact earnings; education ofhousehold members is found to have a significant positive impact on labor earnings, especially forthose employed in the non-agricultural sector. The presence of these externalities carries a powerfulpolicy implication - namely, the importance of the spread of literacy and education among thepopulation.
3 The net enrollment rate measures the proportion of children of the relevant age group (primary/secondary,etc.) who are enrolled in school at a level that is correct for their age - a definition that takes into account graderepetition or late entry.
vi
Determinants of School Attendance
36. Both supply and demand factors are important in determining school attendance. On the supplyside, a multivariate analysis of school participation establishes that access to school facilities iscritical; the probability of a girl attending school is increased by 15 percent by the presence of anappropriate primary school within I km. of the village.
37. However, evidence also shows that merely providing school facilities is clearly not sufficient toincrease enrollment. First, because the quality of available schooling is also a crucial determinant ofschool participation, and second, because demand side considerations - which are in turn influencedby issues of quality and access - are also important.
38. It is clear first, that the mere existence of a school does not imply that it offers quality education,or even that it meets the minimum standards of a functional school. In fact, results from the PRHSfacilities survey demonstrate wide spread quality problems, ranging from teacher absenteeism to lackof amenities. For instance, no classes were being held in 34 out of the 200 schools surveyed, 48percent of the remaining lacked drinking water, and 77 percent lacked adequate supply of textbooks.Not surprisingly, such conditions impact school enrollments. Among girls of primary school age incommunities with schools with adequate amenities, the net enrollment rate is 42 percent, incomparison to 32 percent in communities where the local girl's school lacks amenities.
39. Second, a multivariate analysis of school participation confirms the importance of such demandfactors as economic status in determining the probability of a child attending school: it increasessignificantly if he/she belongs to a higher expenditure group. Parents' education is also important:having a mother who attended school makes it 23 percent more likely for the child to attend school.Evidence also suggests that household social attitudes may have a role in determining schoolattendance, particularly for girls. Responses of households in the PIHS (1998-99) point up thatparental disapproval is more frequently cited as a reason for girls never attending or leaving schoolthan it is for boys, by a margin of 39 percent and 18 percent vs. 6 percent and 4 percent in rural andurban areas respectively.
40. That social attitudes play an important part is also indicated by evidence that gender gaps inschool enrollment are, to a large measure, prevalent among poor and well-off households alike.While net primary enrollment rate among the poor and the non-poor are 37 and 59 percentrespectively, a gender gap of 13 percentage points exists for both groups. Further, controlling for ahost of factors - including household economic status, parents' education, availability of schools,household demographics and community infrastructure characteristics - a girl child in rural areas ofthe country between ages 6 and 14 is found to be 24 percent less likely to be enrolled in school than aboy child.
41. It is of course important to note that demand side responses, including factors like parentaldisapproval, are not independent of supply factors: parents may well have little incentive to send theirchildren to non-functioning schools, or send their girl child to distant schools. However, the interplayof both supply and demand side factors only emphasizes the importance of crafting comprehensiveeducational policies in Pakistan, focusing on institutional reforms to expand availability and toimprove quality of education facilities, as well as providing appropriate demand side incentives tohouseholds to send their children to school.
42. In the context of further education reform, the shift to private schools deserves close scrutiny. Itpresents opportunities for alleviating pressure on the public school system, and improving enrollmentindicators, in particular for girls. If the chief advantage of private schooling - greater choice and
vii
competition - is to be realized, households need further assistance in ascertaining the quality ofschooling, possibly through national testing standards.
Health in the 1990s
43. While various health indicators in Pakistan (computed from PIHS of 1998-99) have shownimprovements since the beginning of the decade, important challenges remain. For instance, evenafter steady improvement through the decade, infant mortality per thousand live births in Pakistan is83, compared to 70 for India and 61 in Bangladesh. Overall, health indicators for Pakistan also tend tobe lower in rural areas than in urban areas, and for the poor relative to those better off. They also tendto improve with women's education and where relevant, with access to safe water and sanitation.There is evidence of chronic malnutrition among a number of sampled villages, which has remainedunabated for 15 years.
44. Infant mortality (per 1000 live births): mortality rate among infants (of age 1 or less) of 83 in1998-99 compares favorably with 127 in 1991, which represents a considerable achievement for thecountry. There remain outstanding challenges in the form of the need to close large gaps - betweenrural and urban areas on the one hand, and between infants bom of women with some education, andthose bom of women with no education on the other. Infant mortality rates are also significantlylower for households with access to proper sanitation facilities. Incidence of diarrhea among childrenof age 5 and under (in 30 days preceding the survey), considered an important indicator of childhealth and a common cause for mortality, also exhibits improvement, having fallen from 25 percent in1991 to 12 percent in 1998-99. Large gaps exist for this indicator also, particularly between rural andurban areas.
45. While the incidence of awareness about contraception methods among married women ofchildbearing age has increased sharply from 1991 to 1998-99 (38 percent to 92 percent), the increasein actual use of contraception (10 percent to 20 percent) has not been proportional to the expansion inknowledge. As expected, there are wide differences in use of contraception between rural and urbanareas, economic status and the woman's education. Also, incidence of pre-natal medical consultationamong married women (of age 15-49) is found to be low in general (31 percent). There are very largedifferences between rural and urban regions, and within regions among various expenditure groups,as well as women of differing literacy levels. Similar pattems are observed for other indicators, likeproportion of deliveries unassisted by trained personnel, and incidence of post-natal consultation.
46. A particularly worrying health issue, as identified by the PRHS survey, is the prevalence ofchronic child malnutrition in rural areas. 2001 data shows that, by the time a child reaches age 5,he/she has a 62 percent probability of being stunted, 45 percent probably of being underweight, and12 percent likelihood of being wasted. There are also significant regional variations in childnutritional status, with districts in rural Sindh and Balochistan faring the worst. Compared with datafrom the IFPRI studies, the 2001 findings show that incidence of child malnutrition has remainedvirtually unchanged over 15 years in the four rural districts included in the IFPRI survey. Suchevidence of persistent child malnutrition is significant because numerous studies conducted in otherdeveloping countries strongly indicate that poor childhood nutrition impacts the productive life of theadult, and that interventions later in their adolescence are ineffective remedies.
What Determines Health Outcomes?
47. While various household characteristics like education, social attitudes, cultural mores and accessto information play a role in determining health outcomes, availability and quality of facilities appearto be most important. According to household data, a whole range of health indicators, from infant
viii
and child mortality rates to indicators of female health are found to be better for villages with a
hospital, dispensary or clinic, or for that matter, any health facility or health worker. 31 percent of the
rural population lives in villages that do not have such access.
48. In addition, an important finding of regression analysis based on PRHS data is that community
wealth, not household characteristics, is likely to be most important to a child's health - as
determined by height and weight. In light of household data findings, it is a reasonable conjecture
that this may be in large part because wealthier communities commnand better facilities. Regardless of
what specific factors explain inter-conumunity differences in anthropometric outcomes, the very
impact of these differences suggest that health policies should target relevant health care
interventions, including preventive care initiatives, to poorer commnunities.
49. Moreover, just like in education, quality of health facilities is a critical factor. Evidence from
other sources indicates serious questions about the quality of service provided by public facilities,
especially in rural facilities like the Rural Health Centers and Basic Health Units. Patterns of
outpatient visits and personnel records, used as rough and preliminary estimations of quality, indicate
that the health facilities differ considerably in terms of usage across communities. Secondary sources
indicate that a dearth of qualified doctors in rural areas remains a serious issue and there are serious
questions about public facilities where rampant absenteeism of medical personnel and severe
shortages of equipment and medicines are reported. In light of this evidence, expanding the
availability of health facilities must be accompanied by measures to improve quality of service.
Governance, Patronage and the Political Economy of Service Delivery
50. As seen above, in education and health alike, under-provision of public facilities, along with poor
quality of existing facilities, are important factors constraining human development. As argued in this
chapter, this is largely attributable to two factors. The first of these are skewed incentives set by the
non-formal parameters of political competition in rural areas, which reduce the willingness of elected
politicians to provide quality universal public goods. Second, there is also evidence of social
resistance that appears to reduce demand for certain services by some constituencies, in particular
education for girls.
51. At the core of the first problem is the observation that elected officials have more incentives to
provide targeted benefits to specific individuals or groups rather than public goods to a wider and
more anonymous set of beneficiaries, of which universal public education is an example. These
incentives are partly explained by the characteristics of rural politics. Rural politicians can easily
identify their supporters and target them with benefits because the distance between communities in
rural areas makes it easy to do. Also, since rural areas are dominated by voting blocs, patronage is
often a more effective political strategy than the provision of well functioning public services. Thus
educational inputs flow in a manner more consistent with a patronage model: schools are built for the
jobs and profit opportunities that construction provides; teacher postings are based less on merit and
more on how best to provide jobs to supporters. There are, in contrast, few incentives to increase
access or to promote accountability of service providers for the quality of education.
52. A second issue, which compounds the above problem, is that the use of certain social services
may not be a high priority for many Pakistani households. As indicated previously, this appears to be
the case particularly for the education of girls. From the point of view of elected officials there may
therefore be little political incentive to enhance access to this service. This also has implications for
institutional reforms such as devolution, as discussed below.
ix
Pakistan 's Devolution Reforms: Significance for Service Delivery
53. Improving the accountability and incentive mechanisms of public service delivery is one of theprimary objectives of the comprehensive plan of devolution being implemented in Pakistan. The planaims to reform what is considered to be an over-centralized government, in order to improvedecision-making, accountability and service delivery. It envisages creating full-fledged districtgovernments with legislative and financial powers, serving below the federal and provincial levels.Yet this devolution effort can be expected to succeed only to the extent that it solves fundamentalgovernance problems that have bedeviled earlier efforts to improve service delivery. In particular, itwill succeed if local government officials exhibit a greater interest in improving the provision ofpublic goods than in targeting private goods; and if they are better placed to improve parentalincentives to educate girls. A thorough analysis of the impact of devolution on service delivery andincentives of administrators and parents awaits further evaluation.
54. To date, there is reason for being somewhat optimistic about devolution boosting official interestin improving the provision of public goods. However, it is less clear if they will be better placed toimprove parental incentives. The optimism stems from the possibility that the institutional changesintroduced by devolution are likely to reduce incentives for patronage. A second reason for optimismis that with devolution, there are potentially more checks operating on officials who try to providepatronage. To this end, it may provide a positive change to the incentives of government decisionmakers regarding delivery of public goods. However, a necessary pre-condition for such optimism isthat elections at the local level be competitive.
55. Pessimism about devolution stems from the unlikelihood that it can solve problems of socialresistance to girls' education. Experiences in other countries suggest that when incentives of localgovernments are few, or even perverse, due to local opposition to reform, the involvement of higher-level governments becomes necessary. Such interventions can take different shapes: outrightsubsidies to households to send their daughters to school would be one example; another would becross-sectoral incentives to districts, perhaps in the form of provision of goods (such as infrastructure)that are heavily demanded. There may also be a need for central government monitoring to ensurethat informal incentives and greater local powers do not subvert the new formal rules of politicalcompetition. Notably, of course, the ability of the central govermment to safeguard the integrity of thedevolution process will depend on the extent to which the government itself is effective and exercisesgood govemance. In order to evaluate the kind of incentives that local govemments are in fact subjectto, and the kind of higher-level interventions that may accordingly be necessary, further informationand more detailed analysis is necessary.
56. In addition to resistance to girl's schooling, there are other social obstacles to service delivery thatare exacerbated by local govemance failures, and which may therefore in some cases requireintervention from federal authorities. For example, the qualitative study undertaken for this reportfinds that interaction of caste relationships and public services can produce a range of outcomes, withvery different policy implications. While in some cases, properly functioning public facilities tend toeradicate caste-based differentials, in other areas there is evidence that existing social hierarchiescompromise the very functioning of these public services. In these areas, true public access to theseservices is likely to become possible only through political empowerment of marginalized groups,possibly aided by supra-local initiatives.
The Rural Nexus: Productivity and Poverty
57. Since two-thirds of the poor reside in rural areas and their poverty is both deeper and more severethan urban poverty, any poverty reduction strategy must focus on the rural economy and its specific
x
problems. Although rural households earn their livelihoods from a number of sources, most arelinked directly or indirectly to agriculture, including the bulk of non-farm activity. Agriculture alsocontributes a quarter of the country's GDP, employs almost half of the labor force, and has asignificant impact on the country's balance of payments. Given this, it is of particular concern thatgrowth in agriculture has not alleviated rural poverty in recent years. While macroeconomic sectoraldata shows that value-added in the agricultural sector grew about 4.2 percent per year over the 90s,outpacing the population growth rate of 2.5 percent, rural poverty of about 36 percent in 1998-99 wasunchanged from that in 1990-91. Moreover, there was almost no consumption growth for allexpenditure groups of the rural population during this decade, which translates to little change inconsumption inequality over the decade. In contrast, a very similar growth rate of agriculture in the1980s did lead to a substantial decline in rural poverty.
58. On the face of it, this points to a rural puzzle for the 1990s - a disconnect between agriculturalgrowth and trends in rural consumption and poverty. As noted earlier, part of the explanation seemsto lie in the volatility of growth during the decade, which made it difficult for many households tobenefit from growth. A rigorous and comprehensive analysis of the remainder of the growth-povertynexus was unfortunately not possible using the data available to this report, though it is beingundertaken in the context of ongoing Bank work. However, the report does address a central facet ofthis apparently weak link between agricultural growth and rural poverty reduction, which is the factthat agricultural productivity is, in an absolute sense, low in Pakistan, with considerable scope forimprovement. This report therefore surveys the constraints to farm productivity, i.e., the limitationson access to productive resources; principally, land, irrigation, soil fertility, and credit.
59. A major theme of its findings is the role played by unequal asset ownership in underminingagricultural productivity - particularly unequal ownership of land. Figure 3 shows that distribution ofland is highly skewed in rural Pakistan (using the Pakistan Rural Household Survey (PRHS) 2001sample). This has a substantial negative impact on agricultural productivity, and also has indirecteffects on the agricultural resource base. There is accordingly considerably scope to for policyinterventions aimed at both decreasing poverty and increasing agricultural productivity.
60. The analysis identifies a number of _. :mechanisms through which asset inequality Figure 3: Distribution of Land Ownershipand low productivity are linked. A recurrent 6
theme is that inequality in asset ownership, 50particularly land, may be far more than a 40 m _ Percent of Rural
distributional concern; it may affect 30 Householdsproductivity. There are direct effects of land ! 20 m | Percent of Land
inequality on productivity resulting from I to l U U I owned
frictions in the land purchase and leasing 0 l q I - P smarkets. Because of these problems, ' - *, ,0 ,,*inequality in household land ownership V 4 translates (though far less than acre-for-acre) Size Categoryinto inequality in operated. area per Note: Marginal <= 2 acres of land, small >2 and <=5,household. Since evidence presented in medium >5 &<=15, large >15 &<=40 and very large >40
Chapter 4 suggests that households with acTes.larger operated area have lower yields, land inequality leads directly to lower productivity.
61. There are also more indirect effects of land inequality on productivity, some of which receiveempirical support from the PRHS. For example, corruption on Pakistan's public canal irrigationsystem is widely viewed as a constraint on agricultural productivity. Large landowners often engage
xi
in wasteful rent-seeking behavior, using their influence with irrigation officials to manipulate thewater distribution in their favor.
62. Land inequality can also lower incentives to invest in land. The skewed distribution of land leadsto tenancy, mostly on share basis, which provides lower incentives for investment in soil fertility thanunder owner-cultivation. Soil degradation, due to waterlogging and salinity, is significant in ruralPakistan, particularly in Sindh province and in southern Punjab. As a consequence of pervasive landtenancy, available medium and longer-term measures to combat soil salinity are rarely undertaken,resulting in loss of cultivated area and low yields.
63. Last, due to collateral requirements, land-poor households are mostly excluded from the formalcredit market, which can finance precisely the long-term productive investments in land andagricultural machinery that can raise them out of poverty. As a result, unequal land ownership maylead to entrenched rural poverty.
64. In terms of mitigating the impact of unequal land ownership, an important observation is thestrong dependence of the landless on non-agricultural sources for income, which implies that the non-farm sector is an important avenue for poverty reduction efforts.
65. As discussed, while much of this evidence on rural productivity and poverty is of a preliminarynature and should therefore be viewed at least partly as merely laying out a roadmap for futureanalytical work on rural Palistan, it does futnish some useful observations, with policy implicationsthat are further discussed below.
Policies and Priorities for Poverty Reduction
66. The analysis in this report highlights three critical areas of intervention that should be a focus ofpoverty reduction strategies for Pakistan. The crosscutting theme of social protection is vital in orderto mitigate the vulnerability, which affects a large share of households in rural and urban areas alike.This is in turn closely linked to Pakistan's persistent and on many fronts widening social gap,particularly in education and health. Hence the importance of strategies to improve humandevelopment indicators. Given the disproportionate weight and depth of rural poverty, there is alsothe need for a well-coordinated rural strategy.
67. Broadly, the ensuing recommendations emphasize common themes: improving access to marketsfor credit that mitigate vulnerability; removing institutional obstacles to service delivery - particularlytopical in the context of Pakistan's recent political devolution reforms; improving access to land andother assets in the context of rural poverty, and furthering better coordination among mutuallyreinforcing policies. The importance of improving the monitoring of program outcomes is also noted.These objectives are broadly consistent with the Interim Poverty Reduction Strategy Paper drawn upthe Government of Pakistan.
68. In addition to the critical areas of focus covered by this report and Pakistan's I-PRSP, it will alsobe necessary to formulate policies that address the specific nature of urban poverty, and to collectadditional information and research to support this work. For lack of such information, this chaptercovers this issue mainly in the cross-sectoral context of social protection strategies to manage risk.Yet it is clearly informed by underlying dynamics requiring more attention.
xii
Social Protection: Managing Risk and Reducing Vulnerability
69. Risk mitigation can aim to provide mechanisms that insure against inevitable shocks, for instance
by addressing market failures in financial markets by improving access to credit. Microfinance
institutions are one prominent example of such a tactic, as discussed further. But many risks are
difficult to eliminate entirely. Therefore, there is a need for mechanisms that enable the poor to cope
with the impact of a shock after it has occurred, through programs like social assistance, public works
and cash transfers. Given the government's institutional and financial constraints, the social
protection. strategy for the immediate future has to involve existing programs like public works,
targeted assistance, and programs that involve the use of informal community-based institutions.
Their performance to date and outstanding challenges are noted here.
70. The principal formal social protection program in Pakistan is the publicly administered Zakat
cash transfer system. However, the impact of Zakat funds on poverty and vulnerability has been
limited, mainly because of the small amount of aggregate transfers. Zakat collections as a proportion
of GDP amounted to only 0.2 percent by 1992-93, implying that even if all the benefits had gone to
the lowest quintile of households, the income of this group would have been augmented by 2 percent.
During 2000-01, about 2.5 million beneficiaries received assistance from Zakat, which may be large
in absolute numbers but is a small proportion of the estimated 40-50 million of poor or vulnerable
people in Pakistan. To compound the problem, there is evidence of poor targeting, due to problems in
identification of eligible beneficiaries, partly because of patronage at the local level. The system of
collection and disbursement of Zakat has been recently reorganized to improve its efficacy by
strengthening the institutional framework for implementation and monitoring of the program and by
raising the amount of grants to beneficiaries. The govemment expects that an additional 1.5 million
beneficiaries will be added to the current list of around 2.5 million Zakat recipients. The revitalized
Zakat system will also provide funds to beneficiaries not only to fulfill basic needs but also to
rehabilitate the recipients, by assisting in small-scale commerce or other means of suitable livelihood.
71. Public works programs in Pakistan in the past inadequately smoothed consumption in periods of
high unemployment, in part due to their capture by patronage politics. Examples of such programs
are the Rural Works Program (1962-72) and the Peoples Works Programs (1972-83). In this context
it is encouraging that the govenmment's recent Khushal Pakistan Program (KPP) incorporates active
community participation in program selection. Funds are allocated under the Program to the districts
through provincial governments. Total budget allocation to the KPP was Rs.5.2 billion in 2000-01
and about Rs.7 billion in 2001-02. The schemes under the Program are identified and selected at the
district level through active community participation, and the projects are managed and implemented
in partnership with the communities.
72. Improvements can be made now even though systematic evaluation of the Khushal Pakistan
Program will be possible only after the program has been in operation for some time. Some crucial
aspects need to be considered in the design and implementation of the Program in order for it to attain
its social protection objectives. Critical challenges include ensuring targeting efficiency, maximizing
employment and stabilization (income smoothing) benefits, and creating community infrastructure
beneficial to the poor. Experiences in other countries have shown that delivery of benefits, as well as
cost-effectiveness, can be enhanced by effective organization at the local level. Since the ongoing
devolution program in the country can help strengthen local govemments and build capacity, the
success of the Khushal Pakistan Program will be linked to that of the broad devolution exercise.
73. Microfinance offers considerable promise. However, at present, the microfinance programs that
exist in Pakistan are unable to cover a vast majority of the poor. Evidence suggests that it would be
beneficial to expand coverage, deepen alliances with formal market institutions such as banks, and
xiii
regularize public support for some programs. The main impetus to microfinance has so far comefrom the NGOs, primarily the rural support programs. In view of the heightened demand formicrocredit in poor communities, the Government and donors have realized the need for ensuring thesupply of sufficient funds on a sustainable and institutionalized basis. To channel the funds, twomajor on-lending institutions have been set up and distanced from the Governmental bureaucracythrough the involvement of the NGOs and the private sector. While the Pakistan Poverty AlleviationFund (PPAF) has adopted the method of wholesaling credit through selected NGOs, the KhushaliBank initiative has incorporated retailing credit to the individual borrower through a newly createdmicrocredit bank with the cooperation of nationalized commercial banks and local organizations.
74. For the long-term sustainability of microcredit, as well as to create conditions conducive toscaling up these programs, links between such institutions and formal markets must be strengthened.In keeping with this objective, the State Bank of Pakistan (SBP) has envisaged licensing of threecategories of microcredit institutions at national, provincial and district levels as public or privatelimited companies. This will enable them to raise capital and generally exploit opportunities in thefornal sector. Given that SBP surveillance of these institutions needs to be flexible due to theiroperational needs, it will be necessary to develop a regulatory framework suitable for them.Moreover, in order to eliminate inefficiency and reduce the costs of delivery of borrowed funds, theremay also be a need to foster competition in the microfinance market. Integrated public policies cansupport such efforts by providing technical and financial support in the start-up phase, and in the longtern, by creating an enabling legal and regulatory framework for such institutions.
75. There is also clearly a need to broaden forms of social protection specific to urban areas. One ofthe more neglected, yet important, correlates of urban poverty and vulnerability is the lack of secureand adequate housing. 40 percent to 60 percent of the urban population lives in katchi abadis or non-regularized subdivisions on agricultural land. Since they lack a clear title to land, they cannot accessformal long-term credit for housing, e.g., from the House Building Finance Corporation (HBFC).Government housing programs have been relatively unsuccessful in tackling this problem, due to avariety of reasons, including lack of trust of government on the part of the beneficiary, lack ofcommunity participation, and lack of capacity and capability in the implementing agencies. Inaddition, there are no avenues for credit available to low-income groups and the poor for housing.However, innovative non-governmental initiatives like the Orangi Pilot Project (OPP) and carefullydesigned government programs like the Sindh Katchi Abadi Authority have been more successful. Akey reason is that they have relied on communities' involvement in finding solutions to housingproblems, accessing the services of the line departments, and networking with the technical experts.Notably, since PIHS data does not cover the urban informal sector and slum settlements where mostof urban poverty exists, obtaining such data should be a priority for the future.
Focus on Human Development: Education and Health
76. In order to improve the status of human development in Pakistan, it will be imperative to increasethe availability of facilities, along with correcting the institutional failures that have hampered qualityof service delivery in the past. While finances are a constraint, the mere availability of funds will notensure significant improvements, as seen from the experience of the Social Action Program (SAP) inthe recent past. SAP was launched in 1992/93, with the aid of donor financing and technicalassistance, with the objective of social development in four target areas - elementary education, basichealth care, family planning, and rural water supply and sanitation. The program has had somesuccesses: improvements have occurred in health indicators, access to related infrastructure,immunization, and availability of Lady Health Workers. However, the gains have been marginal andespecially so in education that has been the major area of focus. The program appears to havesucceeded more in terms of enhanced funding and more physical facilities, rather than in ensuring
xiv
delivery of quality services by creating accountability. Consequently, the impact on enrollments and
other measures of school attaimnent have been limited, as evident from the trends described before.
77. One reason for these disappointing outcomes is the politicization of the distribution of benefits
under SAP. Not only was there tampering with the agenda of implementation, but the mechanisms
through which SAP was to be implemented provided powerful vehicles for patronage, to the
detriment of community participation and often in direct conflict with the planned goals. Future
reform efforts must directly address the incentives for distorted implementation that hampered
implementation of SAP.
78. Ongoing reforms in Pakistan have sought to address some of the critical constraints in education
service delivery, by focusing on the core institutional factors that have limited the success of efforts
like SAP. The government's Education Sector Reform strategy emphasizes national assessments and
training, specifically aimed to close the "achievement" gaps that arise out of poor standards and lack
of qualified teachers. The aforementioned devolution plan, on the other hand, is in large part
expected to address accountability issues in service delivery, including education and health. As
discussed above, the institutional changes introduced by devolution could increase the incentives of
local government to improve service delivery, weakening the systems of patronage that have often
dominated in the past. Yet it is clear from both domestic and international experience that devolution
is no panacea. More information is needed, and it is clear that the impact on education and health
will only become apparent over a long time horizon.
79. The optimism about devolution must also be tempered by the realization that local level decision-
making may not always be enough. As discussed above, this is especially true with regard to
demand-side problems like parental resistance to child education and in particular to girls' education.
Interventions may likely require significant resources and involvement of higher-level govemments,
perhaps through instruments like outright subsidies to households. Experience in Nepal and
Bangladesh shows that girls' enrollment can be improved by paying families to send their daughters
to school. In Pakistan, this approach is being tested in isolated World Food Program initiatives in
Balochistan and NWFP and now in the Government of Sindh's education sector reform program.
80. The increased role of private schools in Pakistan, though yet insufficiently studied, may offer
opportunities for public-private partnerships, especially in urban areas where private schools are
relatively prevalent. While private schools are naturally more likely to attract the relatively well off
because of cost considerations, in selected areas there may be a role for providing public subsidies -
either in the form of vouchers to parents for the education of children at selected private schools or as
direct subsidies to private schools - that encourage school enrollment of poor children. One example
is the Quetta Urban Fellowship Program, where private schools controlled by the community in poor
urban neighborhoods were encouraged to establish new facilities for girls through subsidies paid
directly to the schools. The program had a positive impact on female enrollment, increasing girls'
enrollment in the target neighborhoods by around 33 percent. In a wider sense however, it should be
noted that the efficiency of private schooling is highly dependent on the ability of households to
observe the quality of services offered. While existing evidence on this is mildly optimistic, if yet
inadequate, there is clearly a need for the implementation of universal school standards and tests
concomitant to any publicly assisted expansion of private schooling.
81. The success of private schools also provides lessons for public policy. Among others, their
experience shows that contrary to prevailing public wisdom, it may be more important to have a
school close by than to have a single-sex institution, since households feel more uncomfortable about
sending their girls to single-sex institutions that are far away than to co-educational schools that are
close to the village. Second, private schools emphasize the importance of recruiting women teachers.
xv
More than 50 percent of all teachers in the private educational sector are women, which has had animpressive impact on the enrollment of girls. Increasing the percentage of female teachers in a schoolfrom 0 to 100 increases female enrollment from 22 percent to 52 percent. Notably, initiativesdrawing on these lessons have already been shown to work in Balochistan, and corroboratingevidence at the national level provides considerable further grounds for optimism.
82. Private-public sector partnerships can also be advanced in health, as recognized partly by thegovernment's Health Policy. However, expanding the scope of such partnerships is contingent onimproving information about the functioning of private health facilities in Pakistan, a topic on whichno national data is currently available. Indeed, more generally, the crafting of a comprehensive healthstrategy for Pakistan needs to be informed by adequate health data, which is currently lacking. Forinstance, a priority for the government should be the development of a disease monitoring andinformation gathering system that would regularly gather information on relevant health indicatorsand impose rigorous standards of record maintenance in health facilities.
83. In regards to specific priorities for health policy in Pakistan, it is important to note the need forimprovements in preventive health care and for increased targeting of poor communities. Accordingto PIHS (1996-97), only about half of the children in the country were immunized in 1996-97,including only about 40 percent of children belonging to households in the lowest income quintile. Inview of such shortcomings, the govemment's medium term health strategy is rightly focused towardsraising public sector health expenditures, concentrating on prevention and control programs,especially in the area of reproductive health, child health, nutrient deficiencies and cormmunicable andinfectious diseases. Programs include adoption of strategies against TB and malaria, measures forpreventing the spread of Hepatitis B, HIV, and AIDS through immunization and public healthcampaigns. It also promotes targeted interventions that focus on disadvantaged sections of society,especially in rural areas, through programs like Lady Health Workers Program and Women HealthProject.
84. A community based focus for health policy is also in line with the observation made in Chapter 3,that community-specific characteristics, such as wealth and possibly the presence of quality healthfacilities, strongly determine health outcomes among Pakistani children. This is particularly the casefor the noted chronic deficiencies in child anthropometrics, e.g., height and weight in ruralcommunities - a symptom indicative of malnutrition and other health problems. There is accordinglya clear need to target health interventions at poorer communities.
Coordinated Rural Strategv
85. As seen above, improving productivity and reducing poverty and vulnerability in the rural regionwill require strong improvements in access to land, credit, and infrastructure - particularly water - aswell as expansion of opportunities in the non farm sector. A reassessment of land reform efforts inPakistan is clearly needed, with previous reforms having been largely unsuccessful and indeedhurting many marginal farmers. Notably, tenancy still persists in about 70 percent of cropped area inSindh, which is characterized by strong feudal power. In light of the failure of formal bankinginstitutions in rural finance, improving access to credit will require both encouragement andevaluation of the variety of NGO and micro credit institutions, modeled on the Agha Khan RuralSupport Project (AKRSP), that have come up in Pakistan in recent years. While their lending modeladdresses fundamental market failures in credit markets, there are outstanding questions about theirlong-term solvency and impact.
86. In regards to the extension of water provision and irrigation, the government's water sectorprogram has recently focused on creating additional storage capacity through dams, canals and lining
xvi
of watercourses. The long run benefits of this appear likely to run into diminishing returns withoutfundamental institutional reforms in water management such as those the Government has designedinto its National Drainage Program, which has yet to be adopted beyond pilot areas. The presentpricing and delivery of canal water encourages rent seeking and wastage. Inequities in access to canalirrigation, for this and other reasons, are reinforced by land inequality. Larger land owners are oftenable to skew local water allocations in their favor, while the poor, paying both regular water chargesand bribes, suffer lower productivity due to uncertain and low water supplies.
87. Overall, it is therefore clear that strong inter-linkages exist among the main issues shaping therural economy, and that these must be considered when designing policy. These policies should seekto rationalize public delivery systems, in addition to increasing public investments in the managementof land and water resources, and to create an environment which encourages private on-farminvestment and the rational and equitable use of rural resources, involving substantial communityorganization and participation. Such policies should also be accompanied by efforts to improveaccess to land in particular, as well as to other assets. For instance, merely improving access to land isunlikely to have the intended results without improving access to inputs and credit.
88. In surnmation, there is need for broad-based and coordinated policy reforms, which seek toaddress critical areas. First, it will be of critical importance to create assets for the poor, given thenegative impact of highly unequal distribution of land and other key assets on investment andproductivity. Any concomitant interventions need to address the reasons why previous attempts atland reform have not succeeded in affecting redistribution, or ensuring security of tenure, and did infact entail adverse consequences for the rural poor. Second, given the severe restrictions oninstitutional credit, improving access to credit is another critical area for public intervention - adifficult challenge in an environment where asset inequality is severe. One approach that manycountries have adopted, and that Pakistan is moving towards, is microcredit. While this represents anenormous opportunity, there is a need to examine carefully the strengths and constraints of micro-finance institutions (MFIs). A third priority area for public policy should be improving opportunitiesin the labor-intensive non-farm sector. A fourth challenge would be to improve public expenditurearid management of agricultural infrastructure and resources, particularly water resources. In thiscontext, there is a need to rationalize expenditure administration - providing incentives that induceprivate investment in water and land management. These can be done in a framework of acommunity driven development process that encourages decentralized decision-making and structuresof responsibility.
Conclusion
89. This report is part of an ongoing project to understand poverty, growth and human developmentin Pakistan. It argues that if the country does not close its social gap, its long-tern ability to groweconomically, alleviate poverty and sustain its debt will be fundamentally compromised.
90. Spanning social, economic and fiscal difficulties, the country's current predicament is not rootedin a discrete set of policies amenable to rapid rectification, but in structural factors linked very oftento issues of governance. It is within this context of a broader failure of policy and implementationthat one should understand Pakistan's inability to take sufficient advantage of the growth that it hasenjoyed in the past, to attract investment, build enough infrastructure, or to promote adequateadvances in social indicators. Over the past decade, stagnating poverty and a persistent, evenwidening, social gap are direct legacies of these failures.
91. As this report strongly suggests, issues of governance, for instance in the form of the lack ofaccountability, are at the heart of many of the difficulties encountered in mitigating poverty and
xvii
broadening access to social services in Pakistan. Neither debt reform nor the mere availability ofdonor funds is likely to dispel these problems. The strategies and tactics outlined by this report takethis into account, emphasizing the need to consider and implement concomitant policies in acomprehensive, mutually reinforcing manner. The Pakistani govemment's ongoing governancereforms are perhaps the strongest indication of its commitment to this process. The World Bankhopes to continue lending its support and looks forward to sharing and discussing its findings andrecommendations with other stakeholders in Pakistan's development.
xviii
1. Looking Beyond the Deficit: Social Gaps and SustainableDevelopment in Pakistan
1.1 Pakistan's fiscal deficit is the subject of much concern. Servicing the country's public debtabsorbs a disproportionate share of public resources, renders it vulnerable to debt traps, and dampenseconomic growth. Yet as argued in this report, in terms of its impact on development and povertyreduction, Pakistan's fiscal deficit is overshadowed by a wider, and in the longer run, much costlier gap -a social one.
1.2 Over the last few decades, economic growth in Pakistan has not produced commensurate socialimprovements. The country's social indicators are both below those of other developing countries withsimilar per capita incomes and have improved more slowly than those of countries with similar growthrates. The social gap is intimately linked to Pakistan's persistently high incidence of poverty over the1990s - particularly in rural areas. Growing evidence also suggests that not only has economic growth notnarrowed the social gap, but that the social gap itself is partly responsible for the slow-down in economicgrowth in the 1 990s. The social gap is therefore a critical long-term constraint on sustainabledevelopment and poverty alleviation.
1.3 In October 1999, a major economic reform program was launched by the Government of Pakistanto address the macroeconomic and structural constraints that impede economic and social progress. Inmany respects the content of this reform program recognized this social gap and introduced mechanismsto reduce it. Over the last three years, such reforms have brought about macroeconomic stabilityaccompanied by wide-ranging sectoral initiatives to spur economic growth. Even more important from theviewpoint of addressing the social gap is the devolution program which, when successfully implemented,holds promise for improved access to critical public services for the poor. In addition, the povertyreduction strategy prepared by the country highlights needed improvements in education, health and watersectors.
1.4 The analysis in this chapter identifies the macro economic and public expenditure policies overthe previous decade that impinged on the social sectors. It highlights the critical challenges that theongoing reform program will need to incorporate to reverse the trends particularly in poverty and humandevelopment. The chapter introduces and places in a cross-country context themes that are documentedmore fully in the remainder of the report. The main theme is that social services are significantlyunderprovided in Pakistan, whether one uses as a benchmark either countries with similar per capitaincomes or countries with similar records of growth. As argued, the predominant explanation for this isthat fiscal policies and practices pursued since 1980 (or earlier), have been characterized by a notably lowsocial spending, on the one hand, and by poor implementation on the other.
1.5 An important argument of this chapter is that these patterns of misallocation and inefficiency inpublic spending are the result of skewed incentives confronting political decision makers, which havereduced their interest in supporting certain kinds of public programs and actions that would improve thewelfare of all Pakistanis, including the poor. This includes neglect of improving universal access to andthe quality of schooling and health. Moreover, these incentives have also impeded efforts to reform thegovernance environment, in order to address inefficiencies in the implementation of fiscal policies thatappear to affect all public sector spending in Pakistan.
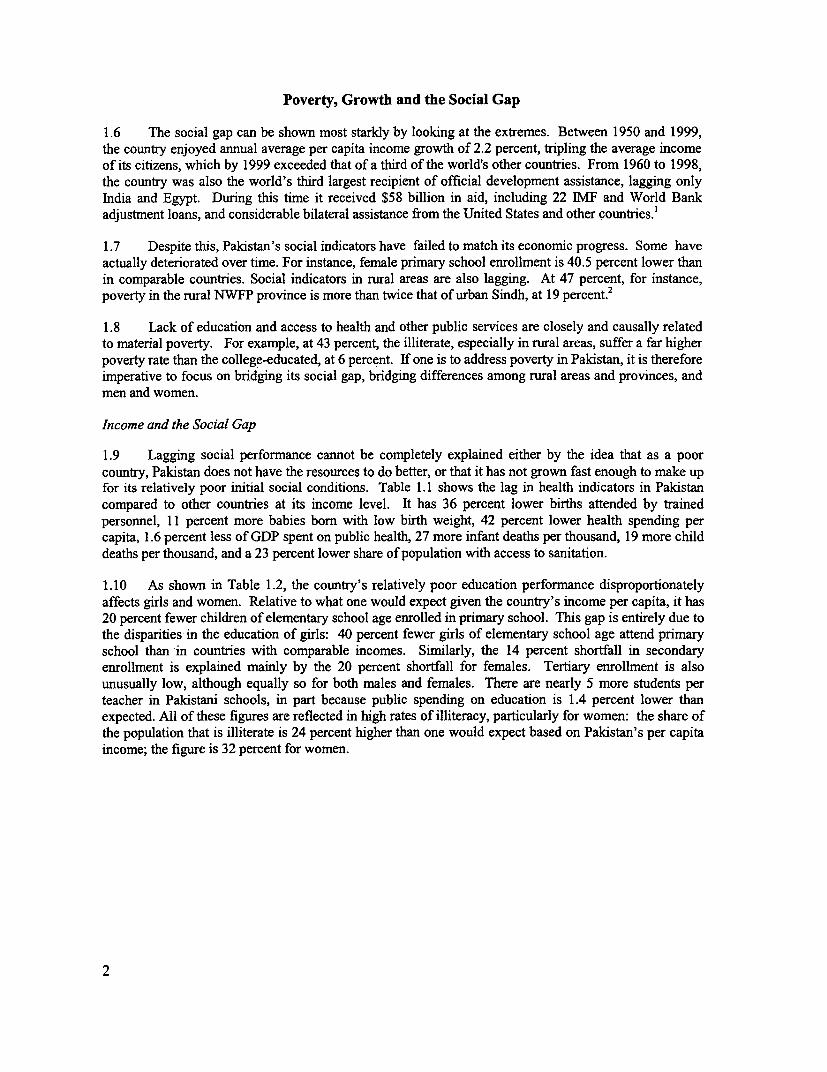
Poverty, Growth and the Social Gap
1.6 The social gap can be shown most starkly by looking at the extremes. Between 1950 and 1999,the country enjoyed annual average per capita income growth of 2.2 percent, tripling the average incomeof its citizens, which by 1999 exceeded that of a third of the world's other countries. From 1960 to 1998,the country was also the world's third largest recipient of official development assistance, lagging onlyIndia and Egypt. During this time it received $58 billion in aid, including 22 IMF and World Bankadjustment loans, and considerable bilateral assistance from the United States and other countries.'
1.7 Despite this, Pakistan's social indicators have failed to match its economic progress. Some haveactually deteriorated over time. For instance, female primary school enrollment is 40.5 percent lower thanin comparable countries. Social indicators in rural areas are also lagging. At 47 percent, for instance,poverty in the rural NWFP province is more than twice that of urban Sindh, at 19 percent.2
1.8 Lack of education and access to health and other public services are closely and causally relatedto material poverty. For example, at 43 percent, the illiterate, especially in rural areas, suffer a far higherpoverty rate than the college-educated, at 6 percent. If one is to address poverty in Pakistan, it is thereforeimperative to focus on bridging its social gap, bridging differences among rural areas and provinces, andmen and women.
Income and the Social Gap
1.9 Lagging social performance cannot be completely explained either by the idea that as a poorcountry, Pakistan does not have the resources to do better, or that it has not grown fast enough to make upfor its relatively poor initial social conditions. Table 1.1 shows the lag in health indicators in Pakistancompared to other countries at its income level. It has 36 percent lower births attended by trainedpersonnel, 11 percent more babies born with low birth weight, 42 percent lower health spending percapita, 1.6 percent less of GDP spent on public health, 27 more infant deaths per thousand, 19 more childdeaths per thousand, and a 23 percent lower share of population with access to sanitation.
1.10 As shown in Table 1.2, the country's relatively poor education performance disproportionatelyaffects girls and women. Relative to what one would expect given the country's income per capita, it has20 percent fewer children of elementary school age enrolled in primary school. This gap is entirely due tothe disparities in the education of girls: 40 percent fewer girls of elementary school age attend primaryschool than in countries with comparable incomes. Similarly, the 14 percent shortfall in secondaryenrollment is explained mainly by the 20 percent shortfall for females. Tertiary enrollment is alsounusually low, although equally so for both males and females. There are nearly 5 more students perteacher in Pakistani schools, in part because public spending on education is 1.4 percent lower thanexpected. All of these figures are reflected in high rates of illiteracy, particularly for women: the share ofthe population that is illiterate is 24 percent higher than one would expect based on Pakistan's per capitaincome; the figure is 32 percent for women.
2
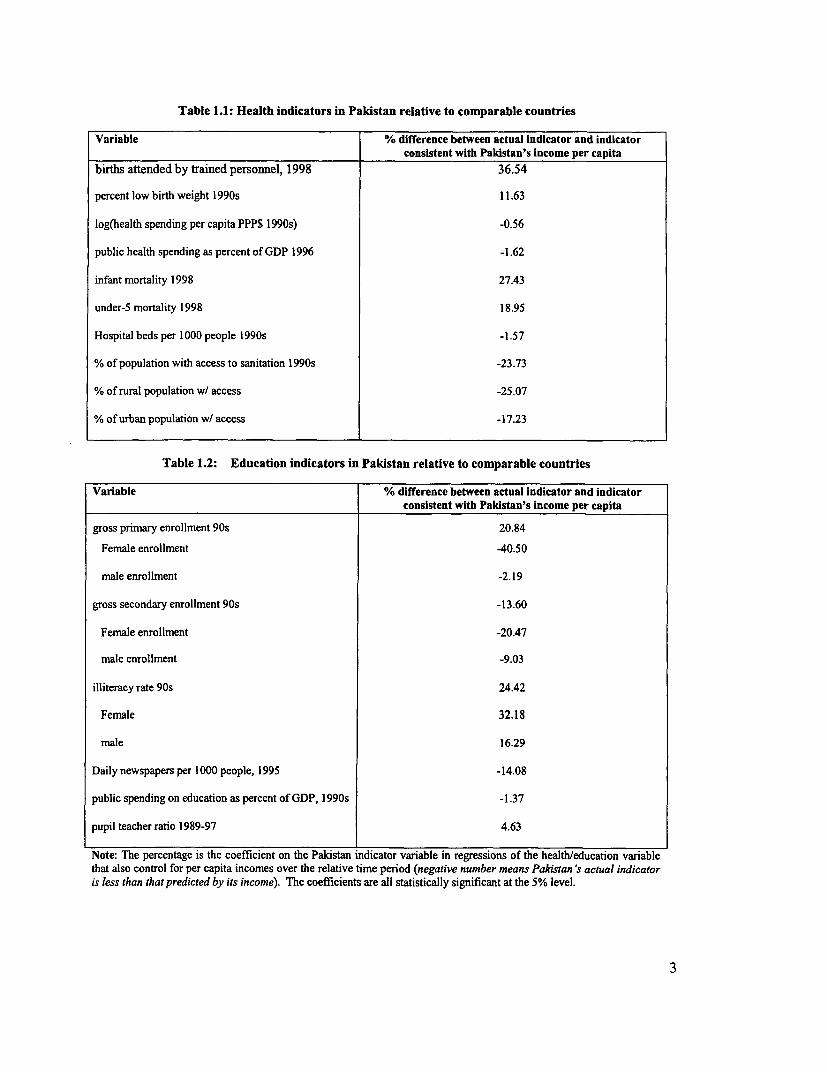
Table 1.1: Health indicators in Pakistan relative to comparable countries
Variable % difference between actual indicator and indicatorconsistent with Pakistan's income per capita
births attended by trained personnel, 1998 36.54
percent low birth weight 1990s 11.63
log(health spending per capita PPP$ 1990s) -0.56
public health spending as percent of GDP 1996 -1.62
infant mortality 1998 27.43
under-S mortality 1998 18.95
Hospital beds per 1000 people 1990s -1.57
% of population with access to sanitation 1990s -23.73
% of rural population w/ access -25.07
% of urban population w/ access -17.23
Table 1.2: Education indicators in Pakistan relative to comparable countries
Variable % difference between actual indicator and indicatorconsistent with Pakistan's income per capita
gross prinary enrollment 90s 20.84
Female enrollment -40.50
male enrollment -2.19
gross secondary enrollment 90s -13.60
Female enrollment -20.47
male enrollment -9.03
illiteracy rate 90s 24.42
Female 32.18
male 16.29
Daily newspapers per 1000 people, 1995 -14.08
public spending on education as percent of GDP, 1990s -1.37
pupil teacher ratio 1989-97 4.63
Note: The percentage is the coefficient on the Pakistan indicator variable in regressions of the health/education variable
that also control for per capita incomes over the relative time period (negative number means Pakistan 's actual indicator
is less than that predicted by its income). The coefficients are all statistically significant at the 5% level.
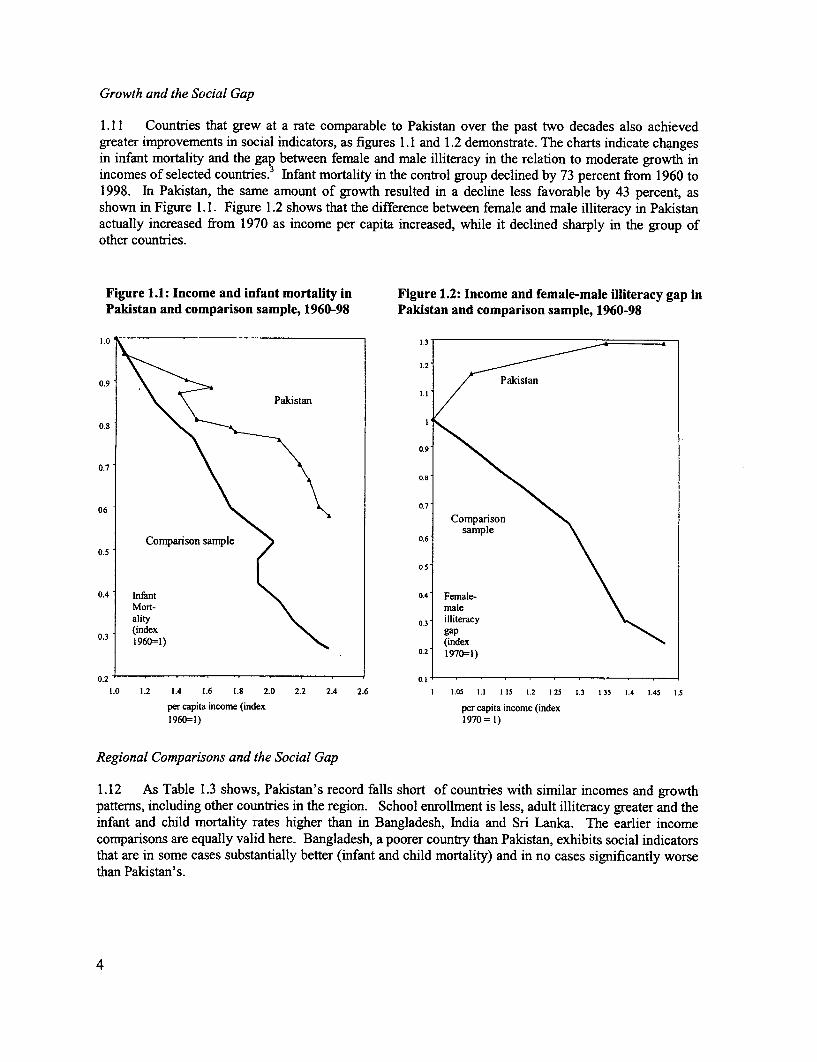
Growth and the Social Gap
1.11 Countries that grew at a rate comparable to Pakistan over the past two decades also achievedgreater improvements in social indicators, as figures 1.1 and 1.2 demonstrate. The charts indicate changesin infant mortality and the gap between female and male illiteracy in the relation to moderate growth inincomes of selected countries.3 Infant mortality in the control group declined by 73 percent from 1960 to1998. In Pakistan, the same amount of growth resulted in a decline less favorable by 43 percent, asshown in Figure 1.1. Figure 1.2 shows that the difference between female and male illiteracy in Pakistanactually increased from 1970 as income per capita increased, while it declined sharply in the group ofother countries.
Figure 1.1: Income and infant mortality in Figure 1.2: Income and female-male illiteracy gap inPakistan and comparison sample, 1960-98 Pakistan and comparison sample, 1960-98
O 9'0 1331.0~~~~~~~~~~~~~~~~~~~~~~~~~~~~~~.
0.9 Pksa
0.8I
0.7
06~~~~~~~~~~~~~~~~~~~~~~~~~~~.
Comparison sample 0e60.5
0.4 Infant 0.4 Female-Mort- maleality 03 illiteracy
0.3 (index gap1960=1) (ne
0.2 1970=1)
0.2 0. I1 .
1.0 1.2 1.4 1.6 1.8 2.0 2.2 2.4 2.6 1 1.05 1.1 1.15 1.2 1 25 1.3 1 35 1.4 1.45 1.5
per capita income (index per capita income (index1960=1) 1970=1)
Regional Comparisons and the Social Gap
1.12 As Table 1.3 shows, Pakistan's record falls short of countries with similar incomes and growthpatterns, including other countries in the region. School enrollment is less, adult illiteracy greater and theinfant and child mortality rates higher than in Bangladesh, India and Sri Lanka. The earlier incomecomparisons are equally valid here. Bangladesh, a poorer country than Pakistan, exhibits social indicatorsthat are in some cases substantially better (infant and child mortality) and in no cases significantly worsethan Pakistan's.
4
Table 1.3: Regional Comparison of Select Human Development Indicators
% of children (age 11- Adult Illiteracy Mortality rate per 100015)currentlyenrolled (age15+), 1999/2000** 1998/99**
in school*
Male Female Male Female Infant Under-5
Bangladesh 62 66 48 70 73 96
India 73 58 32 55 70 83
Pakistan 63 41 42 73 83 116SriLanka 6 11 15 19Note: All Pakistan figures are for 1998-99 (PIHS). Sources for other countries are as below:* Bangladesh: 1995-96 (HIES); India: 1995-96 NSO 52nd round; ** World Development Indicators
Intra-Country Disparities and the Social Gap
1.13 The above tables and figures conceal significant disparities among regions and rural and urbanareas, which are in many instances at least as stark as the differences in performance between Pakistan
and other developing countries. For instance, Pakistan's social gap with respect to female primary schoolenrollment is nearly of the same magnitude as the urban/rural gap in the Sindh province, where only 25percent of girls living in rural areas are enrolled, compared to 62 percent in urban areas.4 Similarly, whilefemale literacy stands at only at 55 percent in urban Sindh it reaches the low of 11 percent in rural NWFP,and 7 percent in Balochistan. While access in Pakistan to rural sanitation - drainage - is already 25
percent lower than in countries with comparable income levels, there are gaps of 40 percent across itsregions. For instance, only five percent of rural residents of Balochistan have access to drainage.
Explaining the Social Gap: Inadequate Social Spending
1.14 Pakistan's fiscal policies do not reflect the imperative of improving social indicators. Per capitahealth expenditure, for instance, is currently only $2 - well below regional and international comparators .This is partly due to the constraints imposed by the country's heavy debt burden and unusually high
defense expenditures. Social spending seems to have bome the brunt of the adjustments to these otherexpenditures.
1.15 The problems in public service delivery can be linked to the fact that social spending has sufferedin the competition for the allocation of public spending. For the past two decades a rising debt service
burden along with continued substantial defense expenditure in the face of stagnant revenues has left littlefiscal capacity to meet the rising needs of basic social services. During the 1990s, overall governmentrevenue fell from 17 percent of GDP in 1991 to around 16 percent in 1998 and 1999. Even thoughdefense spending fell from 6 percent of GDP in 1991 to below 5 percent in 1999, interest expense rosefrom 5 percent to 7.3 percent over the same period. In fact, from 1987 to 1999, the non-interest
component of the government budget fell from 22 percent of GDP to 15 percent. Indeed, devising fiscalremedies and securing new financing to enable the government to service its external and domestic debtand to cover its projected deficit has preoccupied recent administrations.
1.16 In the first four decades of Pakistan, other types of "discretionary" spending, such as publicinvestment, have historically fared better than social spending on health and education in the competitionfor resources. As Figure 1.3 shows, throughout the 1980s, social spending - comprising largely of
recurrent spending on items such as teacher salaries, textbooks and medicines - hovered around 2.5percent of GDP, while development spending - largely for public investment or infrastructure such asroads, irrigation and buildings - consumed around 7 percent of GDP. This gap between developmentand social spending significantly reduced after 1991-92, as shown in Figure 1.3. The fiscal compression
5
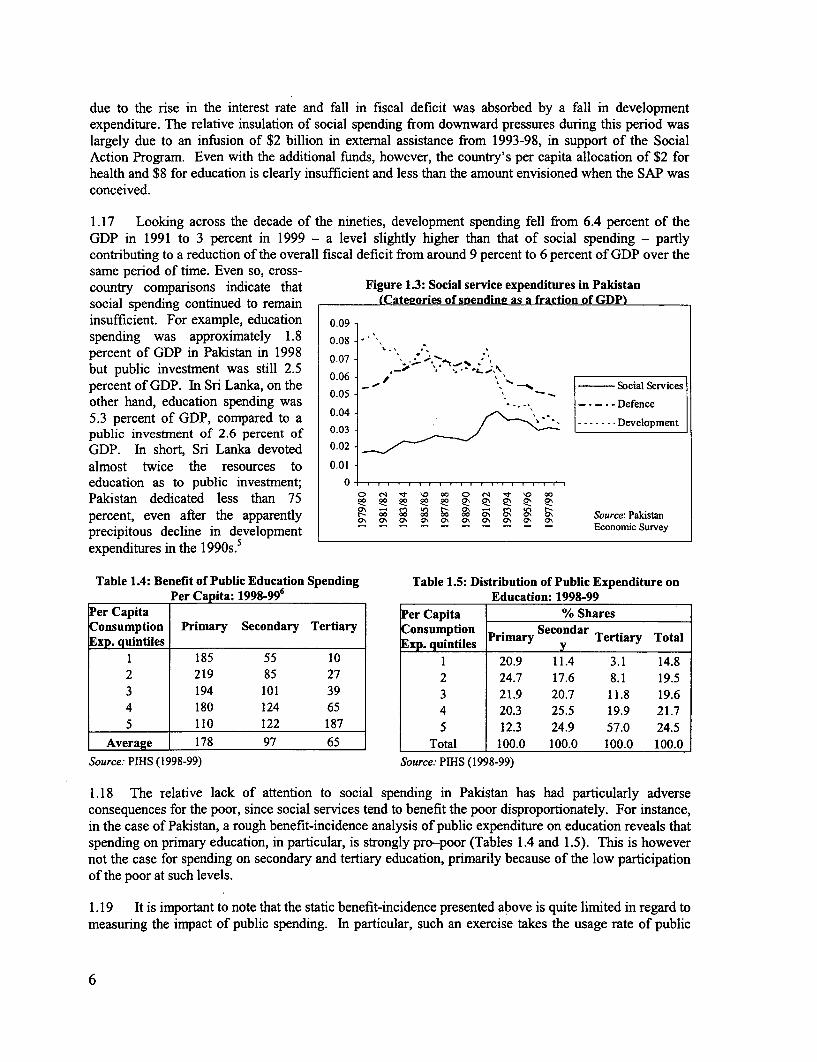
due to the rise in the interest rate and fall in fiscal deficit was absorbed by a fall in developmentexpenditure. The relative insulation of social spending from downward pressures during this period waslargely due to an infusion of $2 billion in external assistance from 1993-98, in support of the SocialAction Program. Even with the additional funds, however, the country's per capita allocation of $2 forhealth and $8 for education is clearly insufficient and less than the amount envisioned when the SAP wasconceived.
1.17 Looking across the decade of the nineties, development spending fell from 6.4 percent of theGDP in 1991 to 3 percent in 1999 - a level slightly higher than that of social spending - partlycontributing to a reduction of the overall fiscal deficit from around 9 percent to 6 percent of GDP over thesame period of time. Even so, cross-country comparisons indicate that Figure 1.3: Social service expenditures in Pakistansocial spending continued to remain (Categories of sDendina as a fraction of GDP)insufficient. For example, education 0.09spending was approximately 1.8 0.08 . -
percent of GDP in Pakistan in 1998 0.07 . 'but public investment was still 2.5 0.06 .- ' s sericepercent of GDP. In Sri Lanka, on the 0S05 - - -' social servicesother hand, education spending was . Defence5.3 percent of GDP, compared to a 0.04 Developmentpublic investment of 2.6 percent of 0.03
GDP. In short, Sri Lanka devoted 0.02almost twice the resources to 0.01education as to public investment; 0Pakistan dedicated less than 75 0 0 2 £ X z $ t t zpercent, even after the apparently ch 00 10 0, 9 0 S Source: Pakistanprecipitous decline in development Economic Surveyexpenditures in the 1990s.5
Table 1.4: Benefit of Public Education Spending Table 1.5: Distribution of Public Expenditure onPer Capita: 1998_996 Education: 1998-99
Per Capita Per Capita % SharesConsumption Primary Secondary Tertiary Consumption Primary Secondar Trti TotalExp. guintiles Exp. quintiles yeary
1 185 55 10 1 20.9 11.4 3.1 14.82 219 85 27 2 24.7 17.6 8.1 19.53 194 101 39 3 21.9 20.7 11.8 19.64 180 124 65 4 20.3 25.5 19.9 21.75 110 122 187 5 12.3 24.9 57.0 24.5
Average 178 97 65 Total 100.0 100.0 100.0 100.0Source: PIHS (1998-99) Source: PIHS (1998-99)
1.18 The relative lack of attention to social spending in Pakistan has had particularly adverseconsequences for the poor, since social services tend to benefit the poor disproportionately. For instance,in the case of Pakistan, a rough benefit-incidence analysis of public expenditure on education reveals thatspending on primary education, in particular, is strongly pro-poor (Tables 1.4 and 1.5). This is howevernot the case for spending on secondary and tertiary education, primarily because of the low participationof the poor at such levels.
1.19 It is important to note that the static benefit-incidence presented above is quite limited in regard tomeasuring the impact of public spending. In particular, such an exercise takes the usage rate of public
6
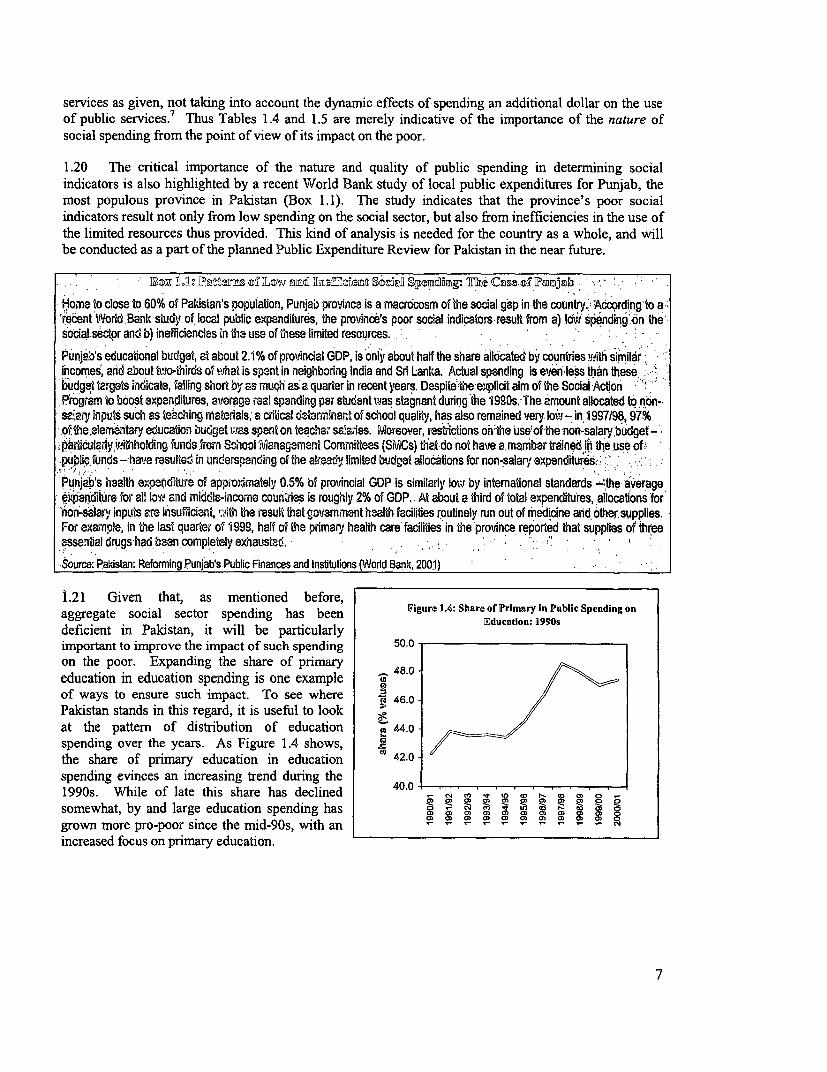
services as given, not taking into account the dynamic effects of spending an additional dollar on the use
of public services.7 Thus Tables 1.4 and 1.5 are merely indicative of the importance of the nature of
social spending from the point of view of its impact on the poor.
1.20 The critical importance of the nature and quality of public spending in determining social
indicators is also highlighted by a recent World Bank study of local public expenditures for Punjab, the
most populous province in Pakistan (Box 1.1). The study indicates that the province's poor social
indicators result not only from low spending on the social sector, but also from inefficiencies in the use of
the limited resources thus provided. This kind of analysis is needed for the country as a whole, and will
be conducted as a part of the planned Public Expenditure Review for Pakistan in the near future.
Mau M11. lo .dtens Lo w aid SI manem $sal $pelda: 0*
'Home to close to 60% of Pakistan's population, Punjab province is a macrocosm of the social gap in the country. -According to a
iecent World Bank study of lcal public expenditures, the province's poor social indicators result from a) Iow spending on thesocial sedlor and b) inefficiencies in the use of these limited resources.
Punjab's educational budget, at about 2.1% of provincial GDP, is only about half the share allocated by countries .with similar,incomes, and about t6-&thirds of what is spent in neighboring India and Sri Lanka. Actual spending is even less than thesebudget targets indicate, failing short by as much as a quarter in recent years. Despite the explicit aim of the Social ActionProgram to boost expenditures, averaga ral spending par student was stagnant during the 1990s. The amount allocated to non-
salary inputs such as teaching materials, a crtical de-terminant of school quality, has-also remained very low - in 1997198,97%r;.ofthe eemenitary education budget was spent on teachea sala7ies. rMoreover, restrictons on 'the use of the non-salary budget' -,rticutaly withholding funds from Scihool Management Committees (SiCs) thatdo not havea .rmber trained in the use ofi.public funds -'have resulted in underspanding of the already limited budget allocations for non-salary expenditures.,:
PunjaVbs hal1th expenditure of approximately 0.5% bf provincial GDP is similarly low by international standards -;the a,veragevenrditure for all low and middle-income countries is roughly 2% of GDP. -At about a third of total expenditures, ,allocations 'for
'non-salary inputs, are insufficient, avith the result that government health facilities routinely run out of rmedicine and other supplies.For example, in the last quarter of i999, half of th primary health care' facilities in, the:province reported that supplies of threeessential drugs had beancompletely exhausted. -
'Soure: Pakistan: Reforming Punjab's Public Finances and Institutions (Wodd Bank, 2001)
1.21 Given that, as mentioned before,aggregate social sector spending has been Figure 1.4: Share or Primary in Public Spending on
deficient in Pakistan, it will be particularly Education: 1990s
important to improve the impact of such spending 50.0on the poor. Expanding the share of primary 480
education in education spending is one example _of ways to ensure such impact. To see where X 46.0
Pakistan stands in this regard, it is useful to lookat the pattern of distribution of education '44.0spending over the years. As Figure 1.4 shows,the share of primary education in education 42.0spending evinces an increasing trend during the1990s. While of late this share has declined 40.0 - U X T M
e 0) ~ ~ ~ 0~
somewhat, by and large education spending has ° cn a x,, Q , 0 O X 0
grown more pro-poor since the rnid-90s, with anincreased focus on primary education.
7
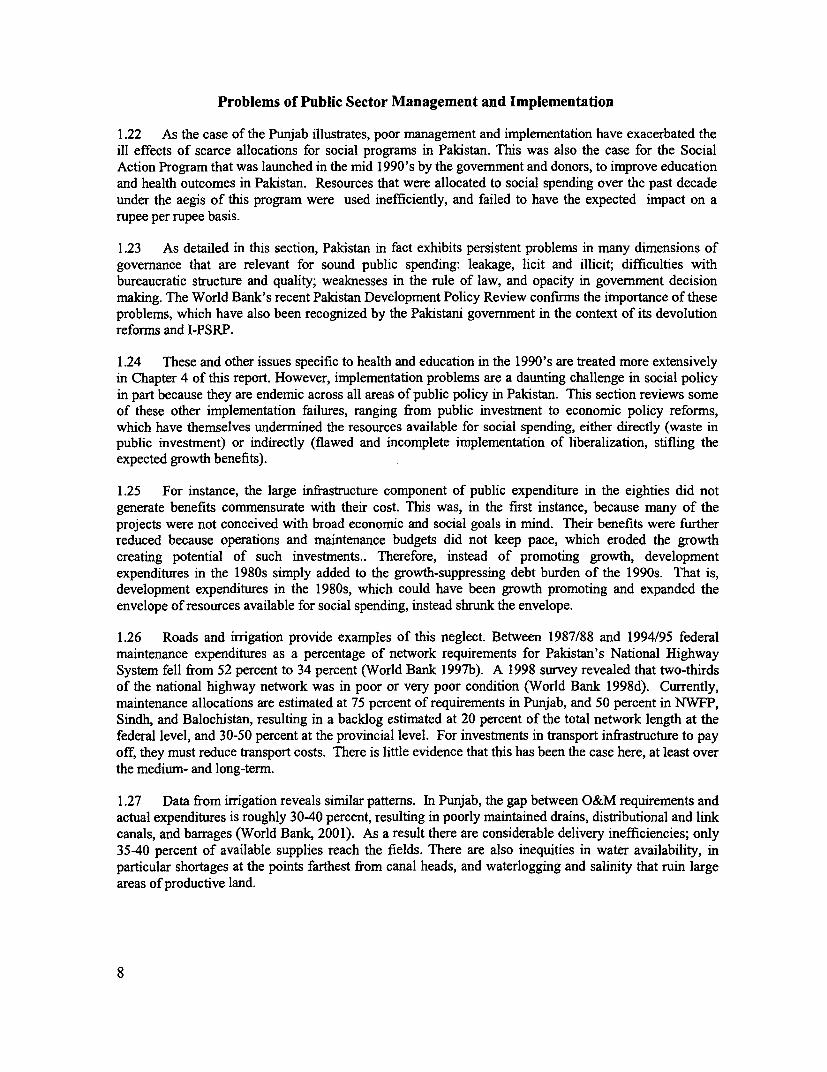
Problems of Public Sector Management and Implementation
1.22 As the case of the Punjab illustrates, poor management and implementation have exacerbated theill effects of scarce allocations for social programs in Pakistan. This was also the case for the SocialAction Program that was launched in the mid 1990's by the government and donors, to improve educationand health outcomes in Pakistan. Resources that were allocated to social spending over the past decadeunder the aegis of this program were used inefficiently, and failed to have the expected impact on arupee per rupee basis.
1.23 As detailed in this section, Pakistan in fact exhibits persistent problems in many dimensions ofgovernance that are relevant for sound public spending: leakage, licit and illicit; difficulties withbureaucratic structure and quality; weaknesses in the rule of law, and opacity in government decisionmaking. The World Bank's recent Pakistan Development Policy Review confirms the importance of theseproblems, which have also been recognized by the Pakistani government in the context of its devolutionreforms and I-PSRP.
1.24 These and other issues specific to health and education in the 1990's are treated more extensivelyin Chapter 4 of this report. However, implementation problems are a daunting challenge in social policyin part because they are endemic across all areas of public policy in Pakistan. This section reviews someof these other implementation failures, ranging from public investment to economic policy reforms,which have themselves undermined the resources available for social spending, either directly (waste inpublic investment) or indirectly (flawed and incomplete implementation of liberalization, stifling theexpected growth benefits).
1.25 For instance, the large infrastructure component of public expenditure in the eighties did notgenerate benefits commensurate with their cost. This was, in the first instance, because many of theprojects were not conceived with broad economic and social goals in mind. Their benefits were furtherreduced because operations and maintenance budgets did not keep pace, which eroded the growthcreating potential of such investments.. Therefore, instead of promoting growth, developmentexpenditures in the 1980s simply added to the growth-suppressing debt burden of the 1990s. That is,development expenditures in the 1980s, which could have been growth promoting and expanded theenvelope of resources available for social spending, instead shrunk the envelope.
1.26 Roads and irrigation provide examples of this neglect. Between 1987/88 and 1994/95 federalmaintenance expenditures as a percentage of network requirements for Pakistan's National HighwaySystem fell from 52 percent to 34 percent (World Bank 1997b). A 1998 survey revealed that two-thirdsof the national highway network was in poor or very poor condition (World Bank 1998d). Currently,maintenance allocations are estimated at 75 percent of requirements in Punjab, and 50 percent in NWFP,Sindh, and Balochistan, resulting in a backlog estimated at 20 percent of the total network length at thefederal level, and 30-50 percent at the provincial level. For investments in transport infrastructure to payoff, they must reduce transport costs. There is little evidence that this has been the case here, at least overthe medium- and long-term.
1.27 Data from irrigation reveals similar pattems. In Punjab, the gap between O&M requirements andactual expenditures is roughly 30-40 percent, resulting in poorly maintained drains, distributional and linkcanals, and barrages (World Bank 2001). As a result there are considerable delivery inefficiencies; only35-40 percent of available supplies reach the fields. There are also inequities in water availability, inparticular shortages at the points farthest from canal heads, and waterlogging and salinity that ruin largeareas of productive land.
8
1.28 Efforts to reform the economy have also been undermined by related governance issues.
Although successive civilian governments in the late 1980s and early 1990s introduced extensive
measures to liberalize trade in order to encourage export-led growth, an anti-export bias remains.
Successive rounds of tariff reforms reduced the maximum tariff rate from 225 percent in 1988 to 45
percent by 1997 and quantitative restrictions were lifted on 332 of 400 items. However, the tariff
structure continued to be characterized by substantial differences among rates. This resulted in large and
unpredictable de facto differences in effective protection across commercial sectors and activities. For
example, imports of plant and machinery competing with the domestic engineering industry were chargeda rate of 35 percent, as compared to the 10 percent tariff on non-competing capital goods (World Bank
1998b).
1.29 The tariff regime sent mixed signals to producers and exporters. The complexity and non-
transparency of the tariff regime was further exacerbated by ad-hoc exemptions and concessions, which
allowed considerable scope for discretion and corruption in customs administration. Exports rose from
approximately 10 percent of GDP in 1985 to approximately 15 percent in 1995; but they have stagnated
since. In keeping with the spirit of the economic reform program, the current government has rationalized
the existing tariff structure to reduce duties on a range of imported inputs for domestic industry. In
addition, the tariff structure has been substantially simplified, which is expected to improve valuation,
clearance, and customs administration, thus addressing the aforementioned problems of non-transparencyand governance
1.30 Problems of implementation also arise due to lack of management capacity in the public sector.
In the opinion of many within the Government the quality of the civil service has steadily eroded over
time. A recent World Bank study (1998a) pointed to a over-staffed and under-skilled civilian
bureaucracy; an over-centralized organizational structure and inappropriate skills mix; seriously eroded
internal accountability and lack of accountability to the public. This was exacerbated by widespread
corruption and excessive political interference in the functioning of the civil service. Since 1999, the
government has adopted a strategy that addresses the aforementioned concerns. The strategy involves
giving more autonomy to the Federal Public Services Commission to enhance its independence and
improve accountability for merit-based recruitment and other personnel management decisions. Public
financial management has been much improved by structural reform and the use of Ad Hoc Public
Accounts Committees. Furthermore, the National accountability Bureau has been established with
powers to investigate and prosecute, which is expected to enhance accountability and reduce corruption.
1.31 To some extent, political factors may also impede implementation of public sector policies. For
instance, public expenditure allocations, such as the selection of infrastructure projects without sufficient
attention to maintenance and sustainability, may be driven by incentives that govern local politicaldynamics. Further discussion of such local dynamics follows below.
Political Economy and Social Spending: A New Hypothesis
1.32 Pakistan is currently implementing or contemplating the implementation of substantial politicalrestructuring, including devolution. A key motivation of such reforms is to improve the performance of
the Pakistani government in serving the needs of its citizens - most of who are poor and have had little
access to social services compared to the poor in other, similarly- situated countries. The effectiveness of
these reforms, both those that are underway and are currently contemplated, depends on the degree to
which they address the incentive problems that seem to have driven past allocation and implementation
decisions in fiscal policy, as discussed below. That is, future reforms will succeed to the extent that they
correct the problems in political economy that have undermined past policies.
9
1.33 Traditional explanations of the incentives of political decision makers in Pakistan have focusedon elite capture of the state and the fractionalization of the society. The elites, benefiting little frompublic spending directed at the poor, and in some cases threatened by it (education), were said to blockfiscal reforms. Evidence reviewed here suggests a different story. Elected legislators were veryconcerned about demonstrating their effectiveness in delivering government benefits to constituents.However, their incentives were such that they focused attention on goods and services that could betargeted as patronage to supporters - such as infrastructure - rather than true public goods, like universalaccess to public education or the rule of law and bureaucratic quality (key to successful implementation).Their incentives to improve education and health were further dampened by demand issues: the lowsupport among some voters for these services, particularly for girls.
Traditional explanations of the political economy of the social gap
1.34 The deepest and most pervasive poverty in the country is rural, and it is worst in areas that havebeen traditionally considered as "feudal", such as rural Sindh. A strong association between landlessnessand poverty supports this link. Among the 70 percent of the population that do not own any land, thepoverty rate is 35 percent, while it is only 13 percent among the 6 percent who owned at least 4 hectaresof land. Conversely, 75 percent of the poor owned no land, and among those characterized as poor, only2 percent owned more than 4 hectares of land. It is not surprising, then, that the first explanations ofpersistently low social indicators in Pakistan would reference the particular social and economiclandscape of rural areas.
1.35 Rural elites have always had exceptional influence in Pakistan - whether by marriage or otherfamily ties to state officials in either military of civilian governments, or because of constitutionallymandated over-representation in the elected legislature. The characteristics of these elite vary. Ingeneral, elites have had relatively little interest in enhancing their constituents' access to education, or inensuring that the poor could obtain the protection of the law without elite intervention. In some othercases, in particular concerning the poorest parts of rural Pakistan, elected politicians were large semi-feudal landowners, who would have had weak incentives to advocate better government for theirconstituents.8 Prominent in virtually all government coalitions, this "rural gentry" is said to have captured70 percent of the seats in local elections in December 2000.9 Their success until this year in blockingfederal taxation of their incomes is cited as evidence of their influence.' 0
1.36 The political hold that landlords exert on rural inhabitants is easily overstated. First, landlords arenot a monolithic class and compete vigorously among themselves for political office. Many landlords,including the most feudal, lost their parliamentary seats in the 1990s. Second, anthropological evidenceshows that rural inhabitants were less reliant on landowners in the 1 990s than earlier - if not necessarilyby choice. For example, they were less able to turn to landlords for support in the event of family illnesssince the offspring of traditionally powerful landlord families now spend more time in the city and areunavailable for traditional landlord "services."
1.37 A careful survey of 125 primary schools in selected rural locales provides one indication thatfailures in the provision of government services are particularly acute in rural Pakistan, but underlines aswell the difficulty of tracing these failures back to landlords. In surprise visits, Gazdar (2000) found thata quarter of the schools surveyed were not open;" there were no teachers present at all in 19 per cent ofthem, and only one teacher was present in 35 per cent.'2 Only 38 percent of the schools were classified as"functional", according to the least demanding of criteria,' 3 only a quarter of the schools had electricity,and only half had a latrine.'4
1.38 Specific landlord influence was visible in several of these cases, but it was neither unambiguouslypernicious, nor was it sufficient to explain the pervasive breakdown of the educational system that was
10
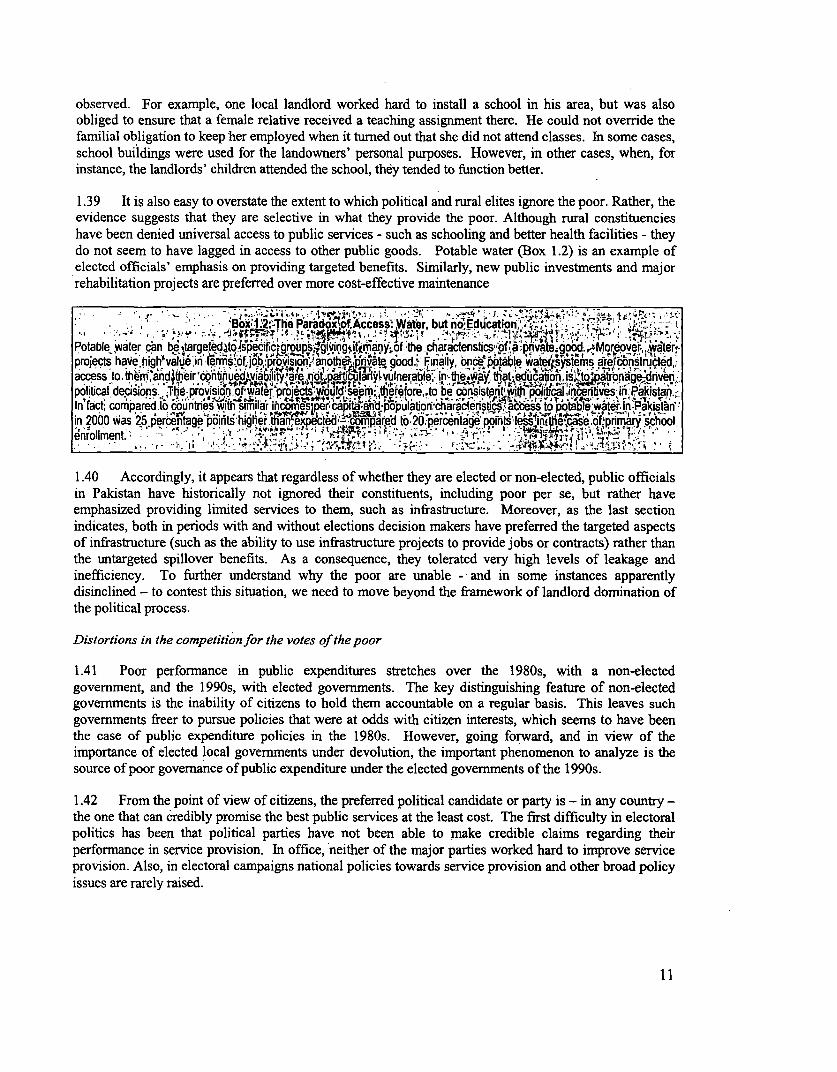
observed. For example, one local landlord worked hard to install a school in his area, but was also
obliged to ensure that a female relative received a teaching assignment there. He could not override the
familial obligation to keep her employed when it turned out that she did not attend classes. In some cases,
school buildings were used for the landowners' personal purposes. However, in other cases, when, for
instance, the landlords' children attended the school, they tended to function better.
1.39 It is also easy to overstate the extent to which political and rural elites ignore the poor. Rather, the
evidence suggests that they are selective in what they provide the poor. Although rural constituencies
have been denied universal access to public services - such as schooling and better health facilities - they
do not seem to have lagged in access to other public goods. Potable water (Box 1.2) is an example of
elected officials' emphasis on providing targeted benefits. Similarly, new public investments and major
rehabilitation projects are preferred over more cost-effective maintenance
` Bok;1.2:TheParadoXf A:cess Water uno Education- .. y., '= ,1 ~~~- , N0 ',,=-P rT `t?rl|*!|^ s-tk3 ;44gX-S-n*- 7t-;',1p'w
Potable wnater c ofbetargetelatol a ivingsitrmany of the charactens'cs'ofTa.;pnvate;good.,tMoreoveTr. waterr-projects have high value.in terrnmsof;job,'provision''ancthpvate good.i 6611l, bndgkWe water$syster sreynstructed;access to thbeimttanad theirsn .6 qofisgoodnginah.' b't, t 2nvenpoligcal decisions. ;The provisiton of q wter'ro cos$Ld,sebr,n,-therefore'.to be c'nsistentl with po_lifiamlinceritives in,PAIStaIn'fact, compared to coun nes fh'1similar incomes'per capita-and-populabon-charactenscsd,aess to potablewaterinWPakistnrf:in 2000 was 2 p ternted"Womared to 20,percentage Rpomts 1eWinite sebopri3r; 'schol
enrirollment '-i> ., A-II>a|'rd,,:'f,'q,--*r 1- ! L;Xt|7-..
1.40 Accordingly, it appears that regardless of whether they are elected or non-elected, public officials
in Pakistan have historically not ignored their constituents, including poor per se, but rather have
emphasized providing lirnited services to them, such as infrastructure. Moreover, as the last section
indicates, both in periods with and without elections decision mnakers have preferred the targeted aspects
of infrastructure (such as the ability to use infrastructure projects to provide jobs or contracts) rather than
the untargeted spillover benefits. As a consequence, they tolerated very high levels of leakage and
inefficiency. To further understand why the poor are unable - and in some instances apparently
disinclined - to contest this situation, we need to move beyond the framework of landlord domination of
the political process.
Distortions in the competition for the votes of the poor
1.41 Poor performance in public expenditures stretches over the 1980s, with a non-elected
government, and the 1990s, with elected governments. The key distinguishing feature of non-elected
govemments is the inability of citizens to hold them accountable on a regular basis. This leaves such
govemments freer to pursue policies that were at odds with citizen interests, which seems to have been
the case of public expenditure policies in the 1980s. However, going forward, and in view of the
importance of elected local govemments under devolution, the important phenomenon to analyze is the
source of poor govemance of public expenditure under the elected govemments of the 1990s.
1.42 From the point of view of citizens, the preferred political candidate or party is - in any country -
the one that can credibly promise the best public services at the least cost. The first difficulty in electoral
politics has been that political parties have not been able to make credible claims regarding their
performance in service provision. In office, neither of the major parties worked hard to improve service
provision. Also, in electoral campaigns national policies towards service provision and other broad policy
issues are rarely raised.
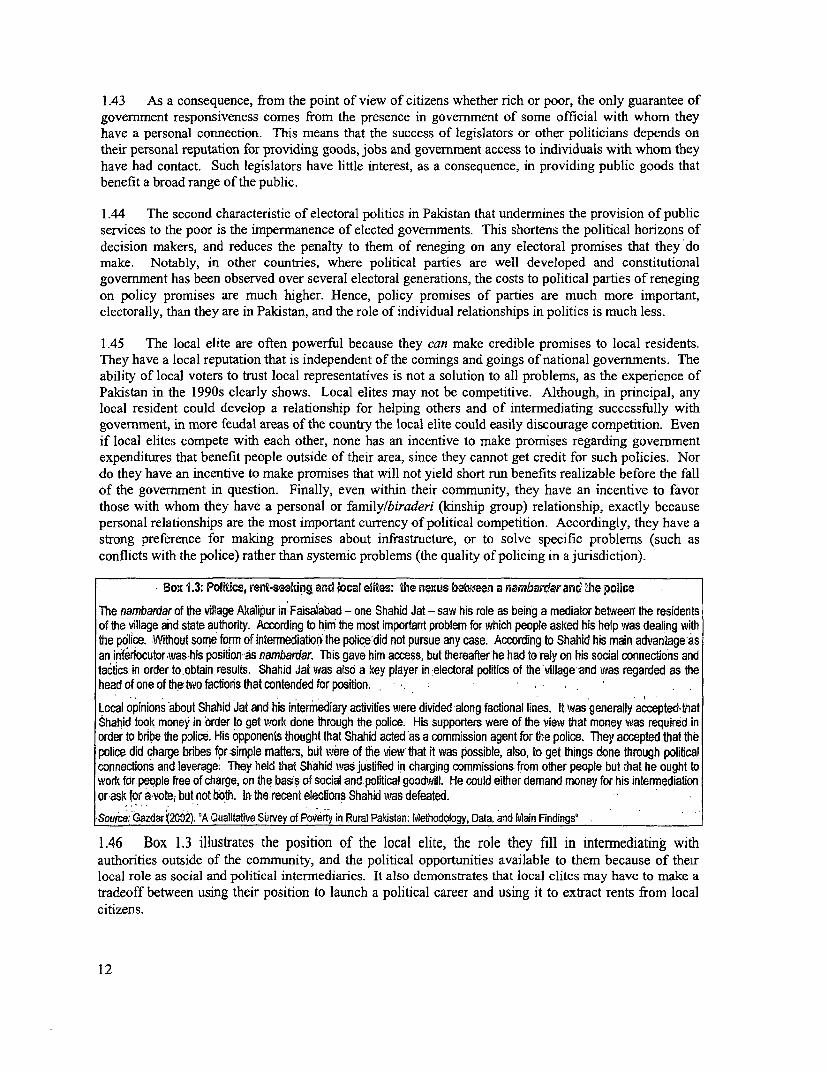
1.43 As a consequence, from the point of view of citizens whether rich or poor, the only guarantee ofgovernment responsiveness comes from the presence in government of some official with whom theyhave a personal connection. This means that the success of legislators or other politicians depends ontheir personal reputation for providing goods, jobs and government access to individuals with whom theyhave had contact. Such legislators have little interest, as a consequence, in providing public goods thatbenefit a broad range of the public.
1.44 The second characteristic of electoral politics in Pakistan that undermines the provision of publicservices to the poor is the impermanence of elected governments. This shortens the political horizons ofdecision makers, and reduces the penalty to them of reneging on any electoral promises that they'domake. Notably, in other countries, where political parties are well developed and constitutionalgovernment has been observed over several electoral generations, the costs to political parties of renegingon policy promises are much higher. Hence, policy promises of parties are much more important,electorally, than they are in Pakistan, and the role of individual relationships in politics is much less.
1.45 The local elite are often powerful because they can make credible promises to local residents.They have a local reputation that is independent of the comings and goings of national governments. Theability of local voters to trust local representatives is not a solution to all problems, as the experience ofPakistan in the I990s clearly shows. Local elites may not be competitive. Although, in principal, anylocal resident could develop a relationship for helping others and of intermediating successfully withgovemment, in more feudal areas of the country the local elite could easily discourage competition. Evenif local elites compete with each other, none has an incentive to make promises regarding governmentexpenditures that benefit people outside of their area, since they cannot get credit for such policies. Nordo they have an incentive to make promises that will not yield short run benefits realizable before the fallof the government in question. Finally, even within their community, they have an incentive to favorthose with whom they have a personal or family/biraderi (kinship group) relationship, exactly becausepersonal relationships are the most important currency of political competition. Accordingly, they have astrong preference for making promises about infrastructure, or to solve specific problems (such asconflicts with the police) rather than systemic problems (the quality of policing in a jurisdiction).
- Box 1.3: Politcs, rent-seeking and local elites: the nexus between a nambardarand the police
The nambardar of the 'village Akalipur in Faisalabad - one Shahid Jat - saw his role as being a mediator between the residentsof the village and state authority. According to him the most important problem for which people asked his help was dealing withthe police. Without somre form of intermediation the police'did not pursue any case. According to Shahid his main advantage asan interlocutor was his positiornas nambardar. This gave him access, but thereafter'he had to rely on his social connections andtactics. in order to.obtain results, Shahid Jat was also a key player in :electoral politics of the vOllage and was regarded as thehead of one of the two factions that contended for position.
Local opinions about Shahid Jat and his intermediary activities were divided along factional lines. It was generally accepted4thatShahid took money in order to get work done through the police. His supporters were of the view that money was required inorder to bribe the police. His opponents thought that Shahid acted as a commission agent for the police. They accepted that thepolice did charge bribes for simple matters, but were of the view that it was possible, also, to get things done through politicalconnecfions and leverage. They held that Shahid was justified in charging commissions from other people but that he ought towork for people free of charge, on the basis of social and political goodwill. He could either demand money for his intermediationorvask for a-vote, but not both. IQ the recent electons Shahid was defeated.*Source:Gazdar(2002). 'A Qualitative Survey of Poverty in Rural Pakistan: Methodology, Data, and Main Findings'
1.46 Box 1.3 illustrates the position of the local elite, the role they fill in internediating withauthorities outside of the community, and the political opportunities available to them because of theirlocal role as social and political intermediaries. It also demonstrates that local elites may have to make atradeoff between using their position to launch a political career and using it to extract rents from localcitizens.
12
1.47 The importance of locally important people in the political calculations of national and provincial
government leaders is evident in the efforts that these leaders make to recruit them as candidates for
elected office; to secure their endorsement when elections take place; or simply to secure their
cooperation in the implementation of public policy. Indeed, governmental concerns about the behavior
and allegiances of local elites have been evident in every government, extending to the most recent local
elections.
1.48 These characteristics of political competition in Pakistan explain why spending on infrastructure,
such as market roads and water, is large in proportion to the share of the total population living in rural
areas. These public goods have two important distinguishing characteristics: they provide immediate and
easily assessed benefits in the form of construction jobs and flow of services - especially important where
political instability is great and current politicians are unable to credibly promise future benefits to
constituents. And they can be narrowly targeted to supporters - especially important where voters,
particularly rural or poor voters, perceive that their ability to obtain goods and services from the state
depends on personal relationships.
1.49 Public goods such as universal access to education and health, including broad improvements in
the quality of teachers or curricula, do not share these two characteristics. As public goods, improved
curricula and better oversight of school performance can less easily be targeted and are not easily
sustained over a long period of time without additional effort. Moreover, the benefits of political efforts
to maintain highways or improve school quality are difficult for constituents to perceive in the short run,
further reducing their utility to policy makers with short horizons. More importantly, the larger and more
concentrated the effects of an expenditure, the easier it is for constituents to give credit for it to their
personal representative. Small expenditures, such as maintenance on a highway in good condition, could
as easily be the product of some govemment-wide policy with which the local representative has had little
to do.
1.50 The incentive structure that induces elected officials to under-supply public goods should not be
viewed as an indictment of democratic politics per se, since it is not necessarily a characteristic of other
democratic systems around the world. Many democratic govermments, such as the state of Kerala in
India, have emphasized investments in education and health. It is rather the specific informal rules of
electoral competition in Pakistan that has uniquely shaped the incentives of the legislators. In any case,
non-elected govemments in Pakistan have traditionally placed no greater weight on the welfare of the
rural poor than have elected govemments. Second, insofar as local elites are the only interlocutors with
the government that the rural poor have at their disposal, their potential marginalization under non-elected
govemments may not benefit the poor, since the poor have no other way of exerting leverage on national
level policy makers and officials, whether elected or military.
The poor and the demandfor public goods
1.51 While there are structural reasons for elected officials to expend greater effort on procuring
physical infrastructure for their constituents, there is also evidence that their constituents themselves may
prefer spending on infrastructure relative to improved education and health. For example, in systematic
surveys and, especially, in informal contacts, the rural poor frequently place access, to water ahead of
improvements in access to and the quality of education. Indeed, the Pakistani poor evidence a very low
demand for female education by intemational standards. Accordingly, political representatives predictably
prefer infrastructure spending to service delivery.
1.52 However, if public policy were oriented towards the efficient provision of desired infrastructure,
such as water resources and market roads, one would not expect to see empty school buildings,
considerable waste and leakage in infrastructure construction, and stark breakdowns in the maintenance
13
and operation of physical infrastructure once provided. The prevalence of these more negative phenomenasuggests that more is at work than skewed demands for public services on the part of the poor. The shorthorizons of political decision makers and their focus on targeted goods rather than broad public policyissues (such as improved implementation) provide some explanation for these problematic aspects ofinfrastructure provision.
1.53 While the foregoing analysis argues that the poor do have some, though inadequately transmitted,influence on public policy outcomes, it is still the case that the rich have more significant influence. Ifthey expressed a demand for high quality public services, one might expect these to emerge rapidly.However, it is abundantly clear that the rich have opted out of the public system, as in many othercountries, and have not used their considerable political power to improve public policies that benefit thepoor.
Dual Constraints: Closing the Social Gap Under Constraint of Fiscal Deficit
1.54 Pakistan's fiscal crisis has captured most of the attention of economic policy makers. And,clearly, its high debt, low growth, and high real interest rate payments are a volatile mix that could lead toexplosive debt increases in the near future. In the 1980s and early 1990s, the emerging debt and growthcrisis was disguised by substantial external flows. These flows, from international lenders andremittances, dropped off long ago: official remittances from migrant workers declined from over 10percent of GDP at their peak in 1983 to 2.3 percent by 1996, creating the crisis atmosphere nowsurrounding the national debt.' 5 However, the newly emergent crisis atmosphere surrounding debt ismatched by the chronic, but more silent crisis of the growing social gap.
1.55 The argument in this section is not that fiscal objectives should be compromised in order toaddress Palistan's social gap. Rather, it is that by attacking the governance problems that are at the rootof this gap, Pakistan would work also to spur economic growth that will mitigate the fiscal crisis. In thepast, governance problems have precipitated a vicious circle: a focus on fiscal policies that de-emphasized social spending; were implemented with excessive leakage and insufficient attention toefficiency and equity; and eventually gave rise to serious fiscal and social gaps. A different strategy,focused on governance reforms, can create a virtuous circle, in which growth is accelerated and resourcesare freed for spending, helping to effectively close both social and fiscal gaps.
1.56 Governance problems were the main reason that deficit-funded public investments of the 1980sfailed to yield long-term growth dividends. If these dividends had been realized, the debt incurred wouldnow constitute a small fraction of GDP and debt service payments would today be much less onerous.For example, if the $58 billion in development assistance provided to Pakistan between 1960 and 1999had been invested during this time to yield a moderate real return of 6%, it would have grown into assetsequal to $239 billion in 1998, and Pakistan's GDP would have been much higher than its present level.Instead, this debt now stands at 92 percent of GDP, and is in and of itself a constraint on growth.
1.57 Govemance reforms that are specifically directed at improving the implementation of socialspending should close the social gap by increasing the amount of real resources allocated to meetingneeds "on the ground." In addition, by closing the social gap, the country should indirectly incur growthpayoffs that would increase resources available for debt reduction.'6 One set of estimates looking at theeffect of education on growth, controlling for other factors, finds that a ten percentage point increase insecondary school enrollment is associated with a 0.5 percentage point increase in yearly per capitagrowth.
1.58 Social spending is embedded in the fabric of government and society, however, so successfulgovernance reforms will have to be comprehensive and broad in their scope. Reforms that reduce waste
14
and leakage in all areas of fiscal policy, especially in development, and that deepen the rule of law havedirect effects on the efficiency of spending, which relax the fiscal constraint that exacerbates the socialgap. Such reforms also increase growth by expanding the size of the pie available for debt reduction.
1.59 The engine of growth is universally regarded as investment, which is obstructed when thegovemance environment is weak. Both individuals and firms, poor microenterprise entrepreneurs andmultinationals, have borne the brunt of weak governance when they attempt to deal with the police orjudicial institutions, or in times of civilunrest that have precipitated serious Figure.5: Governanceimpacts incomes:deterioration in the rule of law, as in benchmarking Pakistan's recordKarachi in the 1990s. Just as the poor S2,250.0are forced to compete for targeted $2,150.0infrastructure investments, firms are $2,050.0forced to compete for exemption from $2,050.0
onerous regulation or, more commonly, $1,950.0 - Pakistanfrom the arbitrary imposition of $1,50.0 . - -Indiaunjustified regulatory requirements.. $1,750.0 ------ Thailand
Firms see their own labor costs rise and $1,650.0 --competitiveness decline when their $1,550.0 9ngaporeworkers lack the educational basics. $1,450.0Firms, like the poor, are exposed to the $1,350.0tremendous insecurities of crime or to $1,250.0abusive behavior by public officials. a a > a a, o a, a C Like the poor, entrepreneurs ____________ _ _ _understand that success (or, in the caseof the poor, avoidance of catastrophe)requires strong personal relationshipswith government officials who canprotect their interests. This is theantithesis of the rule of law and lies at the root of poor service delivery, the vulnerability of the poor, andthe reluctance of investors to enter the country even in more tranquil times in which the pressures ofinternational conflict are absent.
1.60 In view of its uncertain governance environment, it is not surprising that Pakistan has failed toreap substantial private investment from its significant liberalization efforts. Governance uncertaintieshave a strong negative impact on growth, as Figure 1.5 illustrates. The International Country Risk Guide,published by Political Risk Services (Syracuse, New York), rates countries according to bureaucraticquality, rule of law and corruption; three key components of the governance problems that afflictPakistan. A five point increase in the ICRG ratings, on a scale of 1 to 18, is associated with a onepercentage point increase in the yearly rate of per capita income growth in the countries surveyed.
1.61 Figure 1.5 quantifies the cost of poor governance for Pakistan.'7 It shows that if Pakistan hadexhibited similar performance with respect to the rule of law, bureaucratic quality and corruption asSingapore during the 1990s, per capita income in the year 2000 would have been $300 higher.
Re-addressing the Social Gap
1.62 The remaining chapters of this report discuss the many specific ways in which governmentspending and policy decisions contribute to the social gap. They range from allocation concerns in healthand education, to a range of barriers to market access that confront the rural poor. However, in designingpolicies to remove these barriers, continued attention must be paid to the governance environment and to
15
the incentives of all of the actors whose support is necessary to make reform successful. These policiesmust also be focused on economic growth, but growth that is more sustainable than that experienced inthe 1980s.
1.63 Social sector reforms that ignore the difficulties that the poor face in holding govemmentaccountable, and the important role that local elites play in this regard, are unlikely to be successful. TheSocial Action Program, for example, grew out of recognition by both donors and the Pakistanigovernment that targeted action on social service delivery was needed to address poverty. However, thedesign of the program did not reflect the obstacles to improved service delivery that existed "on theground" nor the gap between the refomis that were envisioned and those that either the poor or theirpolitical representatives sought to secure.. This incomplete understanding of the relevant social andpolitical context meant that the SAP placed excessive emphasis on the creation of parent associations thatcould not exercise influence, and dedicated insufficient human and fmancial resources to circumventingand overcoming institutional and social obstacles.
1.64 The lack of accountability can be improved by increased democratization, decentralization, andtransparency. However, these labels hide a wide array of potential reforms, only some of which may beuseful. In the case of Pakistan, the simultaneous improvement of the investment climate and theprospects for poverty reduction will emerge when narrow groups that have been able to target benefits totheir and their constituents' interests are forced to take into account broader needs, including the needs ofwomen and other disadvantaged groups and classes. Not all democratic governments - and certainly notall non-democratic governments - achieve this. However, growth, development and poverty alleviationdemand it.
1.65 While emphasizing the importance of good macroeconomic policies and the need for continuingattention to the fiscal gap - in regards to which particular attention should be focused on promotinggrowth through governance reforms - the rest of the report will focus on the complementary factors thatare critical to ensure that growth benefits the poor. In doing so, successive chapters analyze the mostsalient social and poverty related characteristics of Pakistan, drawing primarily on household data fromvarious surveys, to identify areas where public policy can make a difference.
1.66 Chapter two provides an anatomy of poverty, exploring its evolution across the 1990s, outliningproblems related to its measurement, and discussing dynamic factors that influence how people identifiedas poor either fall into or escape their circumstances. It also explores the broader dimensions and possiblesocial determinants of poverty; exploring the social characteristics associated with lack of consumptionand pointing to the influence of human capital on poverty.
1.67 Chapters three and four more deeply examine the dynamics of the most important social sectors -education and health, and of the most neglected target areas -the rural sector. Chapter three points to thestrong impact of educational attainment and health on earnings. Using education as a case example, thischapter outlines how governance problems and political economy considerations impede service delivery,with particularly adverse consequences for the poor. Chapter four identifies the major policy challengesof the rural sector, including the need for a coordinated strategy that address some critical constraints suchas access to assets, particularly land, access to credit, non-farm opportunities and infrastructure. Chapterfive concludes the report by collating priorities for poverty alleviation, and identifying relevant challengesand lessons for stakeholders, including governments and NGOs.
1.68 The report does recognize the fact that successfully addressing the specific issues noted hereinmay be conditional on wider reforms being undertaken in Pakistan, as outlined in the recent DevelopmentPolicy Review. It proceeds on the understanding that it is nevertheless important to broach these issues.Moreover, in this regard, the report closely references the Government of Pakistan's own I-PRSP,
16
recognizing the considerable commitment already shown by the government towards addressing theunderlying problems discussed in the report.
l In 1995 dollars; not counting the adjustment loan the multilaterals are making in the years 2000-2001.2 Headcount index, Pakistan Integrated Household Survey. Further discussion of the scope and measurement ofpoverty in Pakistan follows in Chapter 2.
The control group is chosen as the third of the sample ordered by growth and centered on Pakistan. The initial yearincome per capita index set equal to unity for all countries. This group is called "comparison sample" in the figures.The index of per capita income and infant mortality are then plotted, set to I in the initial year. By construction, theindex of per capita income will reach the same point at the end of the period in the control group as in Pakistan:since Pakistani growth over the period is precisely the average of the comparison sample, if all countries start at acommon 1960 or 1970 index = 1, and have the same growth rates, they must end at the same index of per capitaincome in 1998.4 The source of all the regional urban/rural by gender data is the 1998/99 Pakistan Integrated Household Survey(PIHS).s The World Bank country office is the source for education expenditures in 1998 in Pakistan. GovernmentFinancial Statistics is the source for the remaining three expenditure information. 1998 is the latest year for whichdata is available for all variables.6 Benefit of primary public education spending per capita for expenditure decile' k is calculated as (total publicexpenditure on prim schoolng/total number of public primary school students in population) x (number of primarypublic school students in decile k/total population in decile k); similarly for benefit of secondary and tertiaryspending.7 For example, expenditure on building or upgrading a primary school may lead to an increase in future enrollmentin nearby areas - an imnpact not captured by looking at existing enrollment rates, which is what the static benefit-incidence analysis does.8 Hussain (1999), p. 19, argues more strongly for the pervasive and negative influence of semi-feudal landlords onthe Pakistani state.9 http:H/wb.eiu.com/reportflll.asp?valname=CRBPK2&title=Country+Report+Pakistan#7'° Talbot (1998), p. 37-38. The government is introducing an agricultural income tax as of this writing (March2001), but it is too soon to tell how effective it will be at mobilizing revenue from landlords."Gazdar (2000), p.4 6
Ibid., p.51
14 Ibid., p.5015 While official figures capture only a fraction of the total inflows, there is no reason to think that the unofficialremnittances evolved in a different direction over this period.16 Barro (1998) shows that health, education, and fertility indicators significantly affect growth outcomes17 See footnote 3 for a discussion of the methodology used in these simulations, with the variable of interest nowbeing governance instead of enrollment. The governance indicator used in the growth regressions is an average ofthree International Country Risk Guide Indicators - rule of law, bureaucratic quality, and corruption. The timeperiod is 1984-99.
17
2. Understanding Poverty in Pakistan
2.1 Though having abated in the 1980's, poverty in Pakistan was as high at the end of the 1990's as atthe beginning of the decade, and continued to be marked by sharp differences across the country'sprovinces, and its rural and urban areas. This stagnating and uneven development is also reflected inaverage consumption data and inequality measures during this time. To some extent, these trends can beseen as dovetailing the wider macroeconomic performance of the national economy, and beingsusceptible to the same factors that constrained its performance, as mentioned in Chapter One. A betterunderstanding of poverty however entails a more in-depth examination of poverty and its characteristicsat the level of the household, which is the focus of the analysis in this chapter. In addition to the impactof lagging macroeconomic growth and inequality on poverty, this chapter emphasizes micro-level factorsas well as social determinants that have an important impact on the overall persistence of poverty in thecountry.
2.2 The chapter begins by examining national and regional trends and patterns of poverty over thepast decade, highlighting the methodological issues that attend to poverty measurement, and comparisonsacross surveys, particularly in the Pakistani context. The most urgent of these is the question of howpoverty is determined. Notably, though a consensus on the choice of poverty line for Pakistan is expectedto emerge soon, there is currently no such agreed analytical standard for the country.' However, asensitivity analysis shows that regardless of what standard is adopted, the pattern of poverty over theyears observed remains more or less the same.
2.3 In providing a blueprint for understanding poverty, this chapter also emphasizes looking beyondits static measures, with a view of understanding and measuring income dynamics, risk and vulnerabilityin Pakistan. These issues are highlighted through a discussion of methods and data resources foranalyzing poverty dynamics, to measure the extent of vulnerability in rural Pakistan. A large section ofthe rural population of Pakistan population is indeed found to be vulnerable to weather shocks -individuals who are at a high risk of becoming poor in the aftermath of a shock.
2.4 The chapter goes on to discuss the determinants that sustain the pattern of vulnerability andpoverty, focusing on micro-factors such as household asset and land ownership in rural areas, thecharacteristics and constraints of poor households - particularly as regards health and educationalattainment, and their forms of employment. In addition it also discusses the social determinants thatframe these patterns, focusing on the importance of labor market discrimination, and the poor'svulnerability to weak rule of law.
Poverty: Measurement, Incidence and Trends for the 1990s2
2.5 According to head count measures, 32.6 percent of the Pakistani population were currently livingin poverty at the end of the 1 990s. Despite improving briefly during the intervening years of the decade,this figure is now more or less the same as at its beginning. The depth and severity of poverty has alsoremained more or less constant, and while urban poverty fell, rural poverty stagnated, widening the gapbetween city and countryside. There were also persistent differences in incidence across Pakistan'sprovinces, linked primarily to average consumption indicators in rural areas, and to inequality in urbanones. Notably, though there is not yet a consensus on a poverty line for Pakistan, the choice of such a linedoes not seem to substantially affect the general pattems and trends observed here. The analysis alsopoints to a large group of transient poor, clustered around any given poverty line, who are particularlyvulnerable to adverse income and risk dynamics.
18
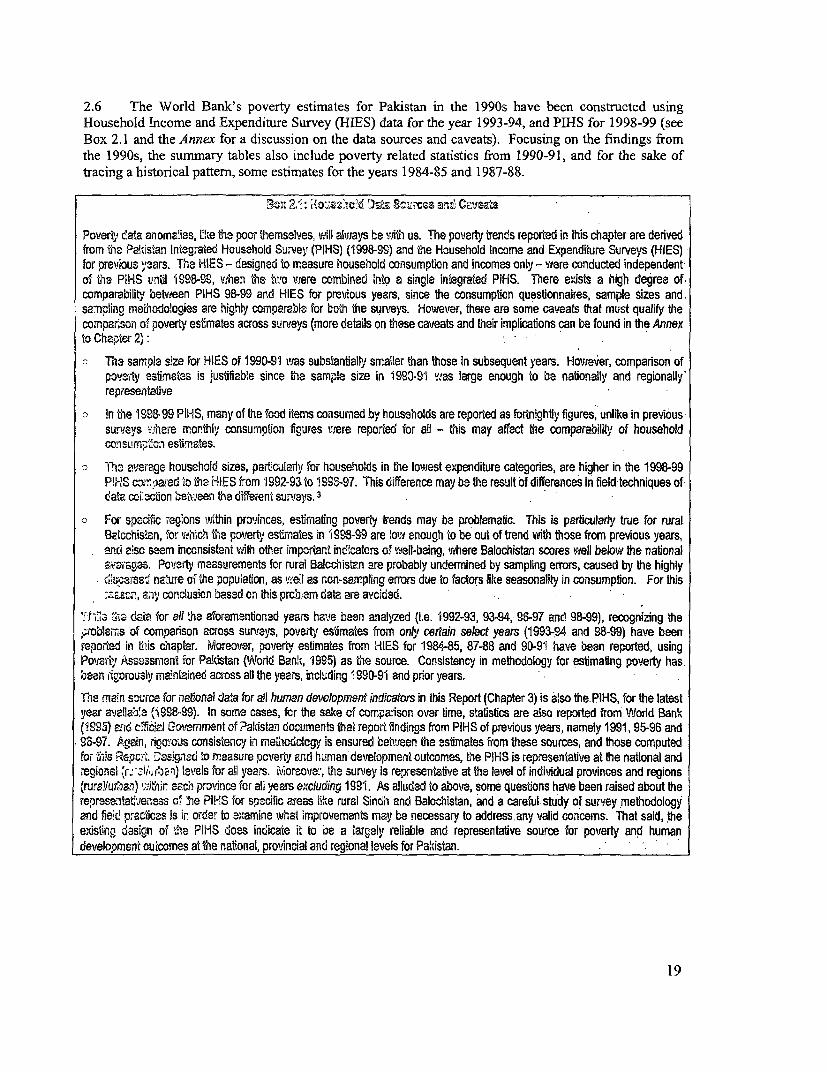
2.6 The World Bank's poverty estimates for Pakistan in the 1990s have been constructed using
Household Income and Expenditure Survey (HIES) data for the year 1993-94, and PIHS for 1998-99 (see
Box 2.1 and the Annex for a discussion on the data sources and caveats). Focusing on the findings from
the 1990s, the summary tables also include poverty related statistics from 1990-91, and for the sake of
tracing a historical pattern, some estimates for the years 1984-85 and 1987-88.
3oi: l.3: it3ue.XcM ()at 8^rc6$ and Cavzea
Poverty data anomalies, like th poor themselves, will always be ith us. The poverty trends reported in this chapter are derivedfrom mhe Pakistan Integrated Household Swvey (PIHS) (1998-99) and the Household Income and Expenditure Surveys (HIES)
for previous years. The HIES - designed to measure household consumption and incomes only - were conducted independent
of the PiHS until 1998-89, when the lm toere combined into a single integrated PIHS. There exists a high degree of
comparability between PIHS 98-99 and HIES for previous years, since the consumption questfonnaires, sample Sizes and,
samnpling methodologies are highly comparable for th the surveys. However, there are some caveats that must qualify the
comparison of poverty estmates across surveys (more details on these caveats and their implications can be found in the Annex
to Chapter 2):
C The sample size for I-IES of 199D-91 was substantially smaller than those in subsequent years. However, comparison of
poverty estimates is justifiable since the sample size in i993-91 Was large enough to ba nafionally and regionally
representative
o In the 1S99899 PIHS, many of the food items consumed by households are reported as fortnighly figures, unlike iri previous
suresys where monthly consumpton figures vuere reported for all - this may affect the comparability of household
consumpton estimates.
o Tho average household sizes, partcularly for households in the lowest expenditure categories, are higher in the 1998-99
P!HS =n? ared to te HIES fom 1992-93 to 1998-97. This difference may be the result of differences in field techniques ofdata coilacicon betjeen the different survays. 3
o For spec'ifc regions within provinces, estimabing poverty trends may be problematic. This is particulady true for rural
Be[cchistan, for wjhich the poverty estmates in '1998-99 are low enough to be out of trend with those from previous years,
. nd a:so seem inconsistent with other important indicators of well-being, wthere Balochistan scores well below the national
averagaes. Poverty measurements for rural Balcohistan are probably undermined by sampling errors, caused by the highly
. rQerset natre of the popuiation, as wel as non-sampling errors due to factors like seasonality in consumption. For this
scn, any conlusion based on this problem data are avcided.
.l-,Ila l; a data for all tha aforementioned years have been analyzed (i.e. 1992-93, 93-94, 96-97 and 98-99), recognizing the
roblsars of comparison across sunteys, poverty estimates from only certain select years (1993-94 and 98-99) have been
reported in this chapter. Moreover, poverty estimates from HIES for 1984-85, 87-88 and 90-91 have been reported, using
Povertr Assessment for Pakistan (World Bank, 1995) as the source. Consistency in methodology for astimatng poverty has.
been rigorously maintained across all the years, including 1 9s991 and prior years.
The main sauroe for natonal data for all human development indicators in this Report (Chapter 3) is also the PIHS, for the latest
year aveailale (1998-9). In some cases, for the sake of cwmparison over time, statistics are aiso reported fron World Bank
(1895) and cfflcial Government of ?aisstan documents thai report findings from PIHS of previous years, namely 1991, 95-96 and
S9-97. Again, rigorous consistency in meuhodology is ensured behtween the estimates from these sources, and tose computed
for li5Ls Repcft Designed to measure pcverly End human development outcomes, the PIHS is representative at the national and
regioal { e ~ll) levels for all years. uloreove,, the survey is representative at the level of individual provinces and regions
(ruralJuwan) ~i-thir each province for all years excluding 1991. As alluded to above, some questons have been raised about the
ressen-tatjeness c' lie PIPS for spescific areas ihke rural Sindih and Balochistan, and a careful- study of suriey methodology
and field practices Is in order to examine what improvements may be necessary to address.any valid concems. That said, the
existing design of the PIHS does indicate it to be a largely reliable and representative source for poverty and human
development ouicomes at the national, provincial and regional levels for Pakistan.
19
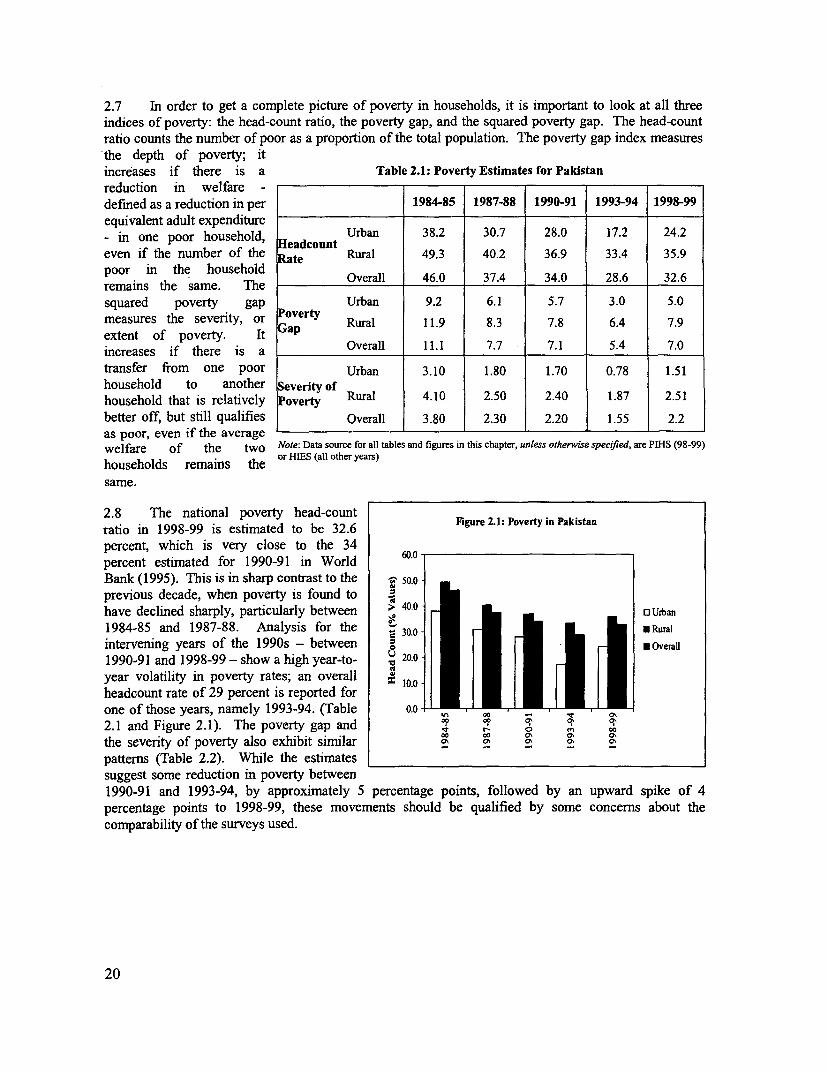
2.7 In order to get a complete picture of poverty in households, it is important to look at all threeindices of poverty: the head-count ratio, the poverty gap, and the squared poverty gap. The head-countratio counts the number of poor as a proportion of the total population. The poverty gap index measuresthe depth of poverty; itincreases if there is a Table 2.1: Poverty Estimates for Pakistanreduction in welfare -defined as a reduction in per 1984-85 1987-88 1990-91 1993-94 1998-99equivalent adult expenditure- in one poor household, eadcount Urban 38.2 30.7 28.0 17.2 24.2even if the number of the ate Rural 49.3 40.2 36.9 33.4 35.9poor in the householdremains the hoame.hTh Overall 46.0 37.4 34.0 28.6 32.6remains the same. Thesquared poverty gap Urban 9.2 6.1 5.7 3.0 5.0measures the severity, or oerty Rural 11.9 8.3 7.8 6.4 7.9extent of poverty. It Oapincreases if there is a Overall 11.1 7.7 7.1 5.4 7.0transfer from one poor Urban 3.10 1.80 1.70 0.78 1.51household to another everity ofhousehold that is relatively Poverty Rural 4.10 2.50 2.40 1.87 2.51better off, but still qualifies Overall 3.80 2.30 2.20 1.55 2.2as poor, even if the averagewelfare of the two Note: Data source for all tables and figures in this chapter, unless otherwise specified, are PIHS (98-99)households remains the or HIES (all other years)
same.
2.8 The national poverty head-countratio in 1998-99 is estimated to be 32.6 FSgure 2.1: Poverty in Pakistanpercent, which is very close to the 34percent estimated for 1990-91 in WorldBank (1995). This is in sharp contrast to the p 50.0.previous decade, when poverty is found tohave declined sharply, particularly between > 40.0- Urbsan1984-85 and 1987-88. Analysis for the -. 300 * * Rurintervening years of the 1990s - between g * Ovemil1990-91 and 1998-99 - show a high year-to- Q 20.0year volatility in poverty rates; an overall lheadcount rate of 29 percent is reported for . *one of those years, namely 1993-94. (Table 0.0 - ,, 0
2.1 and Figure 2.1). The poverty gap and 4 'r 0 m 0
the severity of poverty also exhibit similar o'patterns (Table 2.2). While the estimatessuggest some reduction in poverty between1990-91 and 1993-94, by approximately 5 percentage points, followed by an upward spike of 4percentage points to 1998-99, these movements should be qualified by some concems about thecomparability of the surveys used.
20
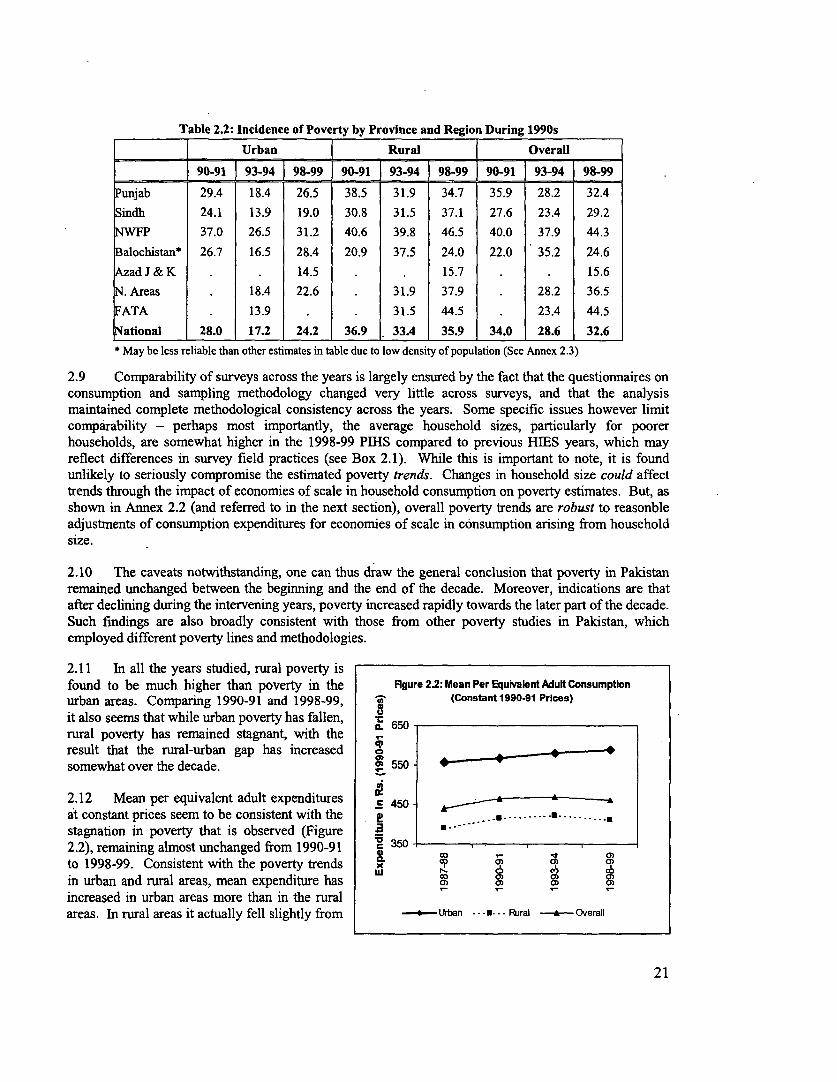
Table 2.2: Incidence of Poverty by Province and Region During 1990s
___ - _ Urban = Rural Overall
90-91 93-94 [ 98-99 90-91 93-94 l 98-99 ] 90-91 J 93-94 98-99
Punjab 29.4 18.4 26.5 38.5 31.9 34.7 35.9 28.2 32.4
indh 24.1 13.9 19.0 30.8 31.5 37.1 27.6 23.4 29.2
NWFP 37.0 26.5 31.2 40.6 39.8 46.5 40.0 37.9 44.3
Balochistan* 26.7 16.5 28.4 20.9 37.5 24.0 22.0 35.2 24.6
Azad J & K . . 14.5 . . 15.7 . . 15.6
Areas . 18.4 22.6 . 31.9 37.9 . 28.2 36.5
FATA . 13.9 . . 31.5 44.5 . 23.4 44.5
ational 28.0 17.2 24.2 36.9 33.4 35.9 34.0 28.6 32.6
* May be less reliable than other estimates in table due to low density of population (See Annex 2.3)
2.9 Comparability of surveys across the years is largely ensured by the fact that the questionnaires on
consumption and sampling methodology changed very little across surveys, and that the analysis
maintained complete methodological consistency across the years. Some specific issues however limit
comparability - perhaps most importantly, the average household sizes, particularly for poorer
households, are somewhat higher in the 1998-99 PIHS compared to previous HIES years, which may
reflect differences in survey field practices (see Box 2.1). While this is important to note, it is found
unlikely to seriously compromise the estimated poverty trends. Changes in household size could affect
trends through the impact of economies of scale in household consumption on poverty estimates. But, as
shown in Annex 2.2 (and referred to in the next section), overall poverty trends are robust to reasonble
adjustments of consumption expenditures for economies of scale in consumption arising from household
size.
2.10 The caveats notwithstanding, one can thus draw the general conclusion that poverty in Pakistan
remained unchanged between the beginning and the end of the decade. Moreover, indications are that
after declining during the intervening years, poverty increased rapidly towards the later part of the decade.
Such findings are also broadly consistent with those from other poverty studies in Pakistan, which
employed different poverty lines and methodologies.
2.11 In all the years studied, rural poverty isfound to be much higher than poverty in the Rgure 2.2: Mean Per Equivalent Aduf Consumption
urban areas. Comparing 1990-91 and 1998-99, , (Constant 1990-91 Prices)
it also seems that while urban poverty has fallen, _
0. 650-rural poverty has remained stagnant, with theresult that the rural-urban gap has increased losomewhat over the decade. ° 550 -
2.12 Mean per equivalent adult expenditures c 450 -
at constant prices seem to be consistent with the E . ........ .......... -
stagnation in poverty that is observed (Figure 2 .-
2.2), remaining almost unchanged from 1990-91 350 .
to 1998-99. Consistent with the poverty trends c p a ;)LU 6~0 0 0) 0)
in urban and rural areas, mean expenditure has a o 0) 0)
increased in urban areas more than in the ruralareas. In rural areas it actually fell slightly from -- ban .- .E... Rural - Overall
21
1990-91 to 1998-99. Analysis of intervening years also shows relatively high volatility of mean perequivalent adult consumption across years in rural areas, compared to stable consumption with anincreasing trend in urban areas.
2.13 The lack of growth in rural consumption and poverty reduction during the l990s is in sharpcontrast to rapid growth in rural consumption during the later part of the 1980s - a period that also sawsharp fall in rural poverty. Moreover, the 1990s also saw growth in value added in agriculture, to the tuneof a compounded average of 4.5% annually, which compares well with agricultural growth in the 1980s.This raises the important question as to why agricultural growth in the 1990s did not lead to the kind ofgrowth in rural consumption and reduction in poverty as it did in the 1980s. While increasing inequalityin rural Pakistan in the 1990s could provide an explanation for this puzzle, as a later section will show,inequality in consumption as measured by gini coefficients in fact did not increase in rural Pakistan in the1990s.
2.14 Addressing this puzzle, which necessarily involves reconciling the findings from household datawith those from macroeconomic sectoral data, would require understanding how the benefits of growthwere distributed among the rural population. 4 In doing so, for one thing, it will be imperative to identifythe sources of income, farm and non-farm, of the rural population and to measure the changes inproductivity and incomes over time. Such analysis has not been attempted in this report due to lack ofcredible micro-data for the time horizon of the 1990s on rural incomes and their sources. An agriculturalstrategy paper planned for the future will have to undertake such detailed analysis in addressing this issueof apparent disconnect between agricultural growth and rural consumption during the 1990s.
Poverty in the Provinces
2.15 A regional breakdown of poverty also reveals persistent differences across its major provinces,with the southern Sindh province, and the northern North West Frontier Province faring the best andworst, respectively. With some qualification, rural-urban differences in the incidence of provincialpoverty persist across all survey years. Regional mean consumption figures appear to be quite a goodindicator of exigency, particularly in rural areas, but inequality in consumption plays a greater role inexplaining differences in urban poverty betweenprovinces.
Figure 2.3: Poverty In Provinces: 199849
2.16 According to most recent estimates, at the NaUoral
provincial level, NWFP is the poorest of the major FATA
provinces, Punjab is poorer than Sindh, and No_hem_A_s
Balochistan has the lowest poverty rate (Figure 2.3).This pattem is also reflected to some extent in Azad J & K
estimates from 1990-91 and 1993-94 (Table 2.2). The Balochistan
notable difference is that Balochistan has a higher NWFP
poverty rate than Punjab or Sindh for two of those Sindh
years. NWFP appears to be the poorest among all Punjab
provinces during these years, with rural poverty 10 2 30 40 50especially, remaining very high throughout the period. Head Count (% Values)
The pattern of poverty in Punjab and Sindh over theyears is more or less in keeping with that of the *May be less reliable than estimates for other provincescountry as a whole. due to low density of population (See Annex 2.3)
22
2.17 It is instructive to look at mean consumption and inequality figures (Table 2.3), to see if any
consistent patterns emerge that explain differences in poverty incidence across provinces. While the
variation in mean consumption across provinces is broadly consistent with poverty rates, in both urban
and rural areas, there is much greater variation in inequality of consumption across provinces in urban
areas as compared to rural areas, suggesting that inequality plays a greater role in explaining differences
in urban poverty between provinces, than it does differences in rural poverty.
Table 2.3: Mean Per Equivalent Adult Expenditure (Monthly, 1990-91 Prices) - 1998-99
_ Punjab Sindh NWFP Balochistan* Azad J & K N. Areas FATA National
Urban 599.4 592.4 535.2 464.7 620.2 541.8 . 589.1
Rural 420.6 398.8 372.4 440.1 494.9 382.4 355.6 410.8
Overall 472.1 482.7 396.3 443.3 504.9 397.5 355.6 460.9
Inequality (Gini): Mean Per Equivalent Adult Expenditure - 1998-99
Urban 37.0 33.0 34.6 25.5 28.9 29.4 . 37.0
Rural 25.7 24.6 24.5 22.5 21.7 20.9 20.3 25.7
Overall 30.6 30.4 27.1 22.9 22.6 .22.7 20.3 30.6
* May be less reliable than other statistics in table. See Annex 2.3
2.18 A case in point is the Punjab and Sindh - two large provinces that are home to 55 and 35 percent
of the country's urban population, respectively. While the two states have very similar urban mean
consumption, the consumption gini coefficient that measures inequality, is about 12 percent higher for
urban Punjab. This partly explains why the incidence of poverty in urban Sindh is substantially lower than
that in Punjab. Azad J & K, with the highest mean consumption and lowest inequality, naturally exhibits
the lowest urban poverty incidence. At the other end of the spectrum is NWFP, where substantially lower
than average mean consumption, and a high consumption gini, translates into the highest urban poverty
rate in the country.
2.19 Since the gini coefficient for per equivalent adult consumption in rural areas shows little variation
across provinces in 1998-99, the incidence of rural poverty across provinces varies consistently with
mean consumption. The rural areas of Sindh, NWFP, the Northern Areas and FATA are characterized by
mean consumption levels well below the national rural average, which translate into poverty rates above
the national average.
2.20 Rural-urban differences in incidence of poverty persist in the major provinces across all survey
years, with the notable exception of Balochistan in 1998-99.5 Sindh by far exhibits the largest rural-urban
gap in poverty incidence, with a rural head count that is 1 percent above the national rural average, and an
urban head count that is 5 percentage points below the urban average. While Balochistan stands out as
the only province with a rural poverty head count lower than the urban on in some years (including 1998-
99), this finding should be qualified. Indeed, there are difficulties in measuring poverty in Balochistan -
arising out of difficulty in sampling a vast area with highly dispersed population, as well as possible large
seasonal variations in consumption - that affect the comparability of its estimates across years, with those
of other provinces (see Box 2.1 and Annex 2.3).
Methodological Issues in Measuring Poverty6
2.21 The measurement of poverty in Pakistan is slightly complicated by difficulties in establishing a
consensus on a poverty line for the country. These are not considered to have impaired the utility of the
analysis in this report, but some discussion of the methodological concerns surrounding the measurement
of poverty is therefore particularly important.
23
2.22 Generally, the measurement of poverty follows the well-known notion of comparing householdconsumption expenditures with a pre-decided poverty line defined in terms of aggregate householdexpenditure. This includes expenditures on all non-durable goods and services, and expenses on servicesand repair charges of household effects.7 The household expenditures thus obtained are adjusted for pricedifferences between urban and rural regions, making it possible to compare expenditures used separateurban and rural poverty lines that are also defined in terms of expenditures.
Adiustments for Household Size and Composition
2.23 In order to measure welfare at an individual level, household expenditure should be adjustedaccording to household size and composition. In the Pakistani case, the correction for composition wasdone via a correction by the per adult equivalent in the household. 8 However, in calculating povertyestimates, the expenditures were not corrected for household size, which implies that the estimates do notmake any allowance for economies of scale in household consumption. By itself, this would be a causefor concern, particularly with relation to any analysis about the demographics of poverty.9 However,since this report will not attempt such examination of demographics as related to poverty, a detailedinvestigation of the kind of scale adjustment suitable for the current PIHS data Pakistan is not conductedfor this report.
2.24 That said, it is important to explore the sensitivity of the poverty measures, and more importantlythe poverty trends, to adjustments for the "scale effect" in consumption. Such investigation, using areasonable range of parameters, reveals that poverty trends during the 1990s remain almost unchanged -for rural and urban Pakistan alike - with scale effects (see Annex 2.2). Although poverty estimates forindividual years tend to decrease with such scale adjustment, the movement of poverty rates from year toyear are similar to that in the absence of such adjustments. In the light of these results, the estimateswithout such adjustments are considered to provide a satisfactory picture of poverty trends. Moreover,these estimates are comparable with the historical estimates of poverty in the years preceding 1992-93 -which were computed without taking into account scale effects - that makes it possible to look at povertytrends over the entire time horizon starting in the mid- 1 980s.
Poverty Lines Used for the Analysis
2.25 The poverty line for every year is the "basic needs" poverty line, which was used for theestimates in the 1995 Poverty Assessment, using HIES data up to 1990-91, and was in turn based onmodifications of the poverty line developed by Ahmad (1993). The poverty line was adjusted forinflation for every year in the analysis. The guiding principle behind this poverty line is to take the line"as the cost of achieving a minimum bundle of basic needs, in which calorific needs are includedalongside other purchasable needs such as fuel, housing and clothing".'°
2.26 This report arrived at a poverty line - which was necessary for purposes of its analysis -- whilerecognizing that Pakistan does not yet have such an officially recognized standard. The line adopted isconsistent with two important conditions that poverty lines should satisfy, and on which consensus hashowever been reached. First, holding the poverty line constant in terms of purchasing power across theyears covered in the analysis ensures comparability over time. Second, poverty is defined not only byhousehold members' (lack of) calorie intake, but also by the ability of the household to meet its basicnon-food needs. The poverty line was established following an exhaustive analysis of available options,as a part of background work undertaken for the World Bank's preceding Pakistan Poverty Assessment. "
2.27 Importantly, for the sake of consistency across future studies, and in order to facilitate themonitoring of poverty trends over time, it will be imperative to eventually establish an informedconsensus on a poverty line for Pakistan. To this end the report welcomes the considerable progress thathas been made towards reaching a consensus on this issue in recent times. Having said that, it is also the
24
case that given the subjective judgments that invariably inform the choice of poverty lines, such measures
should best be employed in comparative contexts. Relative rankings, rather than absolute numerical
values, should be used to gauge changes and differences in poverty across different times and locations.
Thus, even if there are disagreements over the suitability of the poverty line adopted by this report, this
should not detract from its central story. It is also worth noting that the estimates and trends of poverty in
Pakistan reported here are broadly consistent with those of other works employing the same data, but
different poverty lines.
Sensitivity of Head Count Ratios to Choice of Poverty Lines
2.28 Since the choice of poverty line is essentially subjective, it is useful to examine how poverty
estimates respond to adjustments of this line. A sensitivity analysis illustrates this clearly and also shows
that the observations of this report appear quite robust to any adjustments. Figure 2.4 graphs the head
count ratio for urban and rural Pakistan in 1998-99 against different levels of poverty lines.'2 It shows as
evident the fact that rural poverty isgreater than urban poverty, irrespective Figure 2A: Sensithty of Head-Count Rao to Pover Line: 1990s
of the level of the poverty line. 70
However, it turns out that the rural headcount is more sensitive to the choice of 60
poverty line than the urban head count, to0
as evident from the steeper slope of the 40
line corresponding to rural head-count. The sensitivity analysis also validates 9
the comparison across years. From X20O
Figure 2.4, the head-count ratio in 1993- 10.94 is always higher than those in 1992- o
93 and 1996-97, irrespective of any e e s s e s s s s s
choice of poverty lines between 50 and * 0 X ,_150 percent of the actual lines. By the % of Poverty Une
same token, the head-count ratio in - 1992-93 - i- 1993.94 -1996-97-199899
1998-99 is unequivocally greater than inthe other three years.
2.29 A broad picture of the extent and nature of poverty in Pakistan is also obtained by looking at the
distribution of the population around the poverty line. It turns out that as much as 43 percent of the
Pakistani population is distributed between 75 and 125 percent of the poverty line. Given this proximity
to the poverty line it is possible that small shocks could translate into large changes in the observed static
poverty rate. This may explain, at least in part, the large movements in the rural poverty rate over the
90's, a decade characterized by substantial exogenous weather shocks. A following section on
vulnerability examines this in more detail.
Poverty, Growth and Inequality
2.30 In light of the fact that Pakistan enjoyed positive if low to moderate rates of growth during the
1990's, it is worth asking how growth and its distribution affected poverty. As detailed in this section,
there is evidence of a significant link between economic growth and poverty in the country - as measured
in terms of consumption - and between inequality and poverty. While growth promoted poverty reduction
in urban areas, some of the gains were wiped out by rising inequality. In rural areas on the other hand,
stagnation in growth between the beginning and the end of the decade, combined with volatility during
the intervening years, sustained poverty. While growth is therefore likely to be important for poverty
25
reduction in Pakistan, its direct benefits to many poorer constituencies has been curtailed by volatility andinequality.
The Role of Growth and Inequality in Explaining Poverty
2.31 Though economic growth has largely failed to translate into commensurate development ofhuman capital in Pakistan, as discussed in Chapter 1, growth and consumption poverty appear to bestrongly and immensely linked. This is consistent with the international evidence reviewed in the samechapter. In addition, the evidence below links poverty to income inequality, which worsened appreciablyin urban areas during the 1990's, but saw only moderate changes in rural areas. The latter howeverexperienced considerably more volatility, in consumption.
2.32 It is instructive to look at poverty trends in relation to macroeconomic growth patterns. Asmentioned before, the period between 1984-85 and 1987-88, and that between 1987-88 and 1990-91, sawpoverty reduction make large inroads. These also coincided with periods of high growth in per capitaGDP, at average annual per capita rates of 4.1 percent and 2.8 percent respectively. In the nineties,annual average per capita growth was around 2 percent between 1990-91 and 1993-94, when povertydeclined by 5 percentage points. In contrast, poverty increased by 4 percentage points over the period1993-94 to 1998-99, when per capita GDP grew only at an annual average rate of 1.4 percent. Furtheranalysis shows that even within this period, the largest increase in poverty took place between 1996-97and 1998-99, when per capita GDP grew at an annual rate of less than I percent. This evidence supportsthe point made in Chapter 1: growth and poverty reduction tend to go together in developing countries,and Pakistan is no exception.
2.33 While macroeconomic growth seems to be associated with observed movements in aggregatepoverty rates, regional trends can be better understood by looking at growth in consumption fromhousehold data. Consumption data reveals that urban areas have experienced relatively higher growth inmean consumption than rural areas (see Figure 2.3). Notably, rural areas are also subject to much greatervolatility in adult consumption, which translates into correspondingly larger fluctuations in rural povertyrates.
2.34 Associations betweeninequality and poverty are also Table 2.4: Inequality - Gini Coefficients (Per Equivalent Adultimportant to explore. Nationwide, 1IIIII9 Con 1993-E94 i197e99inequality worsened slightly between - 98451987-8819901992-9311993-941996971998-991990-91 and 1998-99, as measured by Urban 31.4 31.6 31.6 31.6 30.2 28.4 35.3the gini coefficient of per equivalent Rural 26.3 24.0 26.7 25.2 24.6 23.8 25.1adult consumption (Table 2.4). Overall 28.4 27.0 28.7 27.6 27.6 26.3 29.6However, the aggregate figures mask substantial differences in the evolution of rural and urbaninequality. Irrespective of whether one takes 1990-91 or 1996-97 as the reference period, urbaninequality had worsened considerably by 1998-99, while rural inequality fell slightly between 1990-91and 1998-99.
2.35 Analysis based on standard methodology confirms that growth in average consumption, as well aschanges in distribution has had significant impact on changes in poverty levels in Pakistan. Based on amethod developed in recent literature, growth-redistribution decomposition of changes in povertyestimates are conducted for various periods between surveys.' 3 The small decrease in poverty incidenceover the entire period, between 1990-91 and 1998-99, is found to be almost entirely due to a slightredistribution of consumption from higher expenditure groups to lower expenditure groups. In any case,the change in poverty over this period is quite small, and not much can be inferred from the results.
26
2.36 However, the decompositions for urban and rural regions separately are more informative. For
urban areas, the observed decline in poverty over the period is entirely due to the consumption growth
component, and the redistribution effect has in fact has had the opposite effect. If the distribution of
consumption in urban Pakistan could be held constant at the 1990-91 level, growth that actually occurred
would have reduced the poverty headcount by around 8 percentage points, compared to the observed 4
points. The opposite is true for rural Pakistan, where a slight reduction in inequality, along with no
growth in consumption, resulted in a small net reduction in poverty of around I percentage point.
2.37 Consistent with the picture of stagnant poverty for Pakistan as a whole, growth incidence curves
(GICs) drawn for the country reveal almost no change in consumption for most expenditure centiles
between 1990-91 and 1998-99 (Figure A-2.2, Annex). Even the largest change in consumption that
occured in the form of a reduction among the bottom decile, amounted to a rather low average annual rate
of less than 0.4 percent.
2.38 The aggregate picture however, just as it is Figure 2.5: Growth Incidence Curve (Rural):
with the growth-inequality decomposition, masks 90.91 to 98-9
the considerable differences between the rural and 0.5
urban regions. The GICs drawn separately for ' 1.0
urban and rural Pakistan paint a pictre consistent a 0 20 30 40 50 60 70 10
with the above decomposition exercise (Figures C O2.5 and 2.6). For rural Pakistan, the curve indicates e
that very little growth in per capita consumption &1S.5
occurred for all expenditure groups between 1990- .2.0
91 and 1998-99. While all expenditure groups 2
between the 10f" and the 70th percentile 3
experienced slight growth, growth was negative -3.0 Percentiles of population ranked by per capita expenditure
for the very poor as well as the relatively well off.For urban regions, the GIC indicates clearly that Figure 2.6: Growth Incidence Curve (Urban):
growth occurred primarily among the relatively 90-91 to 98-99
well off over the decade. The average annual 3.0
growth rate in consumption among the bottom 20 e 2.0
percent and the middle 20 percent (between 4 0 th 2
and 6 0th percentile) of the distribution werenegative 0.6 percent and 0.1 percent respectively; _ E 0o0in contrast, the average annual growth for the top 40 50 60 70 80 90 1
20 percent was 1.2 percent. Thus while rural .
Pakistan suffered from lack of growth in e -2.0
consumption, urban regions experienced -3,0
consumption growth that was not pro-poor during Percentiles of population ranked by per caplta expenditure
the 1990s. - growth rate of centile ----- mean of growth rates
-gmowth in mean
2.39 The decompositions of poverty changesfor successive time periods for which household data were available, during the 1990s throw further light
on the role of growth and inequality in influencing poverty (Figure 2.7). In urban areas, both growth in
mean consumption and changes in the distribution had sizeable impact on poverty, often in opposing
directions.'4 In rural areas, it is noticeable that rise and fall in poverty in intervening years have pretty
much followed movements of the growth component, with the redistribution component remaining
relatively small.
27
2.40 Thus both growth and distributional changes were Figure 2.7: Decomposition of the change in povertyimportant during the 1990s, particularly with respect to incidencediffering patterns of poverty in rural and urban areas.While growth promoted poverty reduction in urban areas,some of the gains were wiped out by rising inequality. In X
rural areas on the other hand, stagnation in growth betweenthe beginning and the end of the decade, combined with -_ .volatility during the intervening years, were the main Ufactors impeding poverty reduction. Notably, in the lightof the experience in rural areas, a primary objective ofpublic policy aimed at mitigating poverty and (RPralvulnerability, should be to promote growth and reduce 15
fluctuations in rural consumption. In urban areas, a major 10challenge would be to ensure that the benefits of growth 5are distributed more broadly among the population. 0 " F i i ,2.41 An important corollary of this section is that -5
although there is a relationship between growth and -o Epoverty in Pakistan, it is also clear that even rapid growth 199091 tD 1992-93 tD 199394 tD 199947 to
does not touch many poor, in part because of changes ininequality and fluctuations in income. Understanding these Growt _ds r .IsuaI X Total
dynamics and the manner in which they preventhouseholds from benefiting from growth should be an integral part of a poverty analysis if it is to provideconcrete recommendations for future policy initiatives. However, the static measures of poverty hithertoemployed in this chapter do not tell us much in this regard. The following sections attempt to bridge thisgap.
Income Dynamics, Risk, and Vulnerability
2.42 Income volatility is a defining feature of life for many citizens in developing and transitionaleconomies. While its precise causes differ among countries and over time, it imposes many substantialand often unavoidable risks. Private and social efforts to mitigate these risks can also be quite costly inthe absence of well-developed markets for credit and insurance. Indeed, a number of recent studies usingpanel data have suggested considerable "churning" under the surface of aggregate poverty and incomestatistics. This movement of households into and out of poverty suggests that a substantial proportion ofobserved poverty at any given time might be 'transient' in nature. The clustering of households aroundthe poverty line described in a preceding section is certainly indicative of such a possibility in the contextof Pakistan. However, our real interest is in the extent to which uninsured risk plays a causative role increating or sustaining welfare losses and in the policy levers which might be most effective at reducingsuch losses.
2.43 While there are many possible ways to identify uninsured risk and, consequently, more than onepossible definition of "vulnerability", it seems useful from a policy perspective to obtain a measure basedon the variability of consumption expenditures, since it is the inability to smooth consumption in the faceof income fluctuations which is, to a substantial degree, at the heart of concerns about the role ofvulnerability in creating or sustaining poverty. Notably, if households were able to adequately smoothexpenditures, static poverty measures would tell us most of what we need to know about the poor.
2.44 However a measure of vulnerability based on consumption variability entails two generaldifficulties. First, one must estimate the extent of consumption variability due to exogenous incomeshocks, as distinct from the variability due to measurement error, preference shocks, and endogenous
28
adjustments to shocks (e.g., labor supply, transfers). Second, one must formulate a meaningful measure
of ex-ante vulnerability based on the result of step 1.
Examining vulnerability to weather- induced shocks
2.45 The first issue is addressed by combining household consumption data with 20 years of monthly
rainfall measurements to estimate the exogenous component of consumption variability. Rainfall shocks
are not only exogenous to households, but because they are covariate, i.e. tend to cause and accompany
general declines in local incomes, they are difficult to insure in local markets. Using information on
household farm assets, the exogenous component of the consumption variance is therefore allowed to
vary by household (e.g., because households with more irrigated land may have lower consumption
variability). The second issue is addressed by developing a measure of household vulnerability that can
be used to ascertain vulnerability ex-ante, i.e. before the shock in question. Vulnerability is accordingly
defined as the probability that a household experiences at least one episode of poverty over a defined time
period, and vulnerable households as those for whom that probability exceeds a threshold value.'5
2.46 In the context of rural Pakistan, the focus on weather-related shocks is of particular importance
since these were by far the most important adverse events reported by communities sampled by the recent
representative rural survey (PR}HS 2001). Over 63 percent of all villages in the survey experienced at least
one severe drought over the past five years. Many experienced repeated droughts, with 2000 being the
worst drought year. A third of all villages experienced floods, most in 1998. This year saw a drought in
the monsoon season being followed by late rains and floods. Since a disproportionate fraction of the poor
reside in rural areas, these weather shocks are a particularly useful focus for the study of rural
vulnerability in Pakistan, and can form the basis for thinking through concrete policy measures to reduce
such vulnerability. 16
2.47 The vulnerability estimates, derived from the IFPRI panel survey data (from 1986 to 1991), are
used to examine the characteristics of vulnerable households and to compare vulnerability with notions of
chronic and transient poverty.'7 A household is classified as chronically poor if its mean expenditure level
is below the poverty line. Transient poverty is then the variation of observed expenditure around its time
mean (both chronic and transient poverty are defined using the. squared poverty gap as the empirical
poverty measure).' 8
Table 2.5. Vulnerability and Poverty by agro-climatic zones2.48 First, it is important to note (using IFPRJ panel; poverty line=Rs. 2580, TimeHorizon =2 years)
that the measure predicts actual Percentage Households
episodes of poverty extremely Vulnerable Poor: using Chronically Transienti
accurately (see appendix) This expenditure poor y poor
implies that expenditure volatility Northern 29.1 47.2 34.3 129
induced by weather shocks had a irrigated plains .1 4.2 3.
substantial impact on household Barani plains 42.0 25.9 16.1
welfare, even in areas with canal 46.1irrigation. In fact, winter rainfall in Dry mountains 67.3 58.1 46.7 11.4
the season preceding the agricultural Southernyear, which we use as a rough proxy ig ans 71.0 61.0 46.4 14.6
of expected water levels in the canal All 56.1 53.4 39.7 13.7
system, has a substantial effect on
expenditures, highlighting the importance of rainfall for canal water supplies.
2.49 Second, there is a strong variation in levels of vulnerability (Table 2.5). While less than a third of
all households in the northern irrigated plains of the Punjab, essentially the canal colony areas, were
classified as vulnerable, over two-thirds were classified as vulnerable in the southern irrigated plains of
29
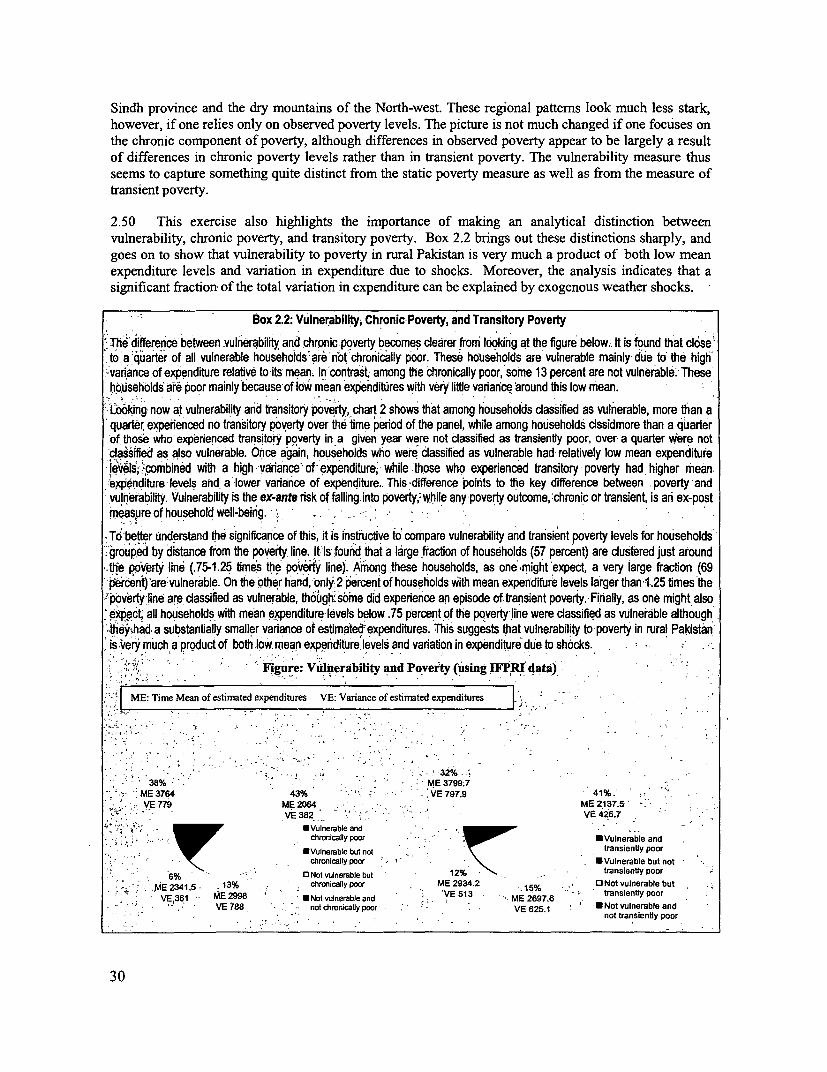
Sindh province and the dry mountains of the North-west. These regional patterns look much less stark,however, if one relies only on observed poverty levels. The picture is not much changed if one focuses onthe chronic component of poverty, although differences in observed poverty appear to be largely a resultof differences in chronic poverty levels rather than in transient poverty. The vulnerability measure thusseems to capture something quite distinct from the static poverty measure as well as from the measure oftransient poverty.
2.50 This exercise also highlights the importance of making an analytical distinction betweenvulnerability, chronic poverty, and transitory poverty. Box 2.2 brings out these distinctions sharply, andgoes on to show that vulnerability to poverty in rural Pakistan is very much a product of both low meanexpenditure levels and variation in expenditure due to shocks. Moreover, the analysis indicates that asignificant fraction of the total variation in expenditure can be explained by exogenous weather shocks.
Box 2.2: Vulnerability, Chronic- Poverty, and Transitory PovertyThedifference between vulnerability and chronic.poverty becomes clearer fromn looking at the figure below.. It is found that cl6setto.'a-quarter of all vulnerable households&are 'not' chronically poor. These households are vulnerable mainly due to the high'
.-variance of expenditure relative to-its mean. In contrast, among the chronically poor, some 13 percent are not vulnerable.-Theseho'useh6olds' are poor mainly because of low mean expenditures with very little variarnce around this low mean.'ooking now at vulnerability and transitory poverty, chart 2 shows that among households classified as vulnerable, more than aquarter experienced no transitory poverty over the time period of.the panel, while among households clssidmore than a quarterof those who experienced transitory poverty in a given year were not classified as transiently poor, over a quarter Were notclaisifsed as also vulnerable. Once again, households who wer'e'classified as vulnerable had relatively low mean expenditure-levelsycombined with a high yvaance'of expenditure, while-those who experienced transitory poverty had higher mean@enditure levels and a'lower variarce of expenditure. This difference points to the key difference between poverty andvulnerability. Vulnerability is the ex-ante risk of falling, into poverty,: while any poverty outcome, chronic or transient, is ari ex-postmeasure of household well-being. ; :
.To-better understand the significance of this, it is instrucive to compare vulnerability and transient poverty levels for householdsgrouped by distance from the poverty line. IttIs found that a large fractbon of households (57 percent) are clustered just around
poverty line (.75-1.25 bmes the poveFlj line). Among these households, as one might'expect, a very large fraction (69-p'ercent)'arevulnerable. On the other hand, only 2 percent of households with mean expenditure levels larger than 1.25times the
,"povertyjine are dassified as vulnerable, though/ some did experience an episode of transient poverty.-Finally, as one might also:pct, all households with mean expenditure levels below .75 percent of the poverty line were classified as vulnerable although
they;had: a substantially smaller variance of estimated expenditures. This suggests that vulnerability to poverty in rural Pakistanisvery much a product of both low, mean expenditure levels and variabon in expenditure due to shocks.
l-.jF oi, . ' jFiigure: Vlnerability and Povert (using IFPRI data):
ME: Time Mean of estimated expenditures VE: Variance of estimated expenditures
. .3, -38% - ME 3799.7
ME3764 43% VE7979 41%-,VE 779 ME 2064 - ME 2137.5 ,
VE 382 ' VE i25.7U Vulnerable an'd
cdronically poor M Vulnerableand- _*EVulnerable bt not . transienty poor
chronically poor ' EVulnerable but not -6% D Not vulnerable but transiently poor
ME 2341.5 13% dironically poor ME 2934.2 - 1Not vulnerable butVE361 ME2998 *Notvulnerableand ; VE513 ME2697.6
VE73 -- not chronically poor i - VE 6251 *Not vulnerable andnot transiently poor
30
2.51 It is clear that the vulnerability measure based on weather related shocks is able to predict welfare
shocks quite accurately, and allows one to distinguish between observed poverty at a point in time, and
the risk of a welfare shock due to income variability. In addition, some insights the coping strategies
available to vulnerable are available from the qualitative survey (QPS). The discussion in Box 2.3, drawn
from the QPS, underscores the ways in which coping strategies vary across income groups and regions. In
regions where agricultural production is less significant (Barani or rainfed areas), and income
diversification is a necessary condition of survival among the asset poor, weather shocks appear to
increase reliance on wage work outside agriculture. In contrast, credit played a key role in sustaining
consumption in areas where agricultural production was a substaintial component of the rural economy.
Agricultural wage workers and tenant farmers survived mainly by taking credit from their landlords or
from shopkeepers, and landlord credit was largely available only in areas with high inequality in land
ownership. Other than non-farm wage work in the village and credit, sales of livestock and out-migration
in search of wage work also appear to be key coping strategies.
.ox. 2.3: Drought-Related Shock: Insights f7rom Case Studies of Two Villages
The qualitative survey allowed insights into the effects of the drought in two very different types of agro-climatic zones. Thevillage of Raheema in Attock district relied on rain-fed (barani) agriculture. Shah Alam in Nawabshah, on the other handdepended almost entirely on canal-irrigated farming. Both areas suffered from the effects of the drought in the year of thesurvey. The failure of the rains during the rabi 2000-2001 season had severely reduced the wheat crop in Raheema. This shockwas compounded with another - a hailstorm destroyed much of the following kharits maize crop. Shah Alam felt the effects ofthe drought through a sharp reducton in the supply of canal water. The shortage was particularly severe in 2001, though it hadpersisted since around 1998. Both Raheema and Shah Alam had relatively unequal agrarian structures. The poorest inRaheema were landless families, who depended on tenant farming and casual wage labor for their livelihoods. The twin adverse.shock of drought and hailstorm had negative impacts on both types of acfivities. Wheat yields were around a quarter of theirusual levels, and the maize crop was entirely destroyed, and was good only for green fodder. The loss of the crops also affectedthe casual labor market. There was no harvesting labor to be found during the year. The poor had coped largely by working atcasual wage labor jobs, mostly in construction, and some away from home. They had borrowed food from shopkeepers in thevillage and in the nearby market towns. Some had been forced to part with their assets, mostly livestock.
In Shah Alam, the poorest were landless sharecroppers and laborers, as well as small landowners. The main impact of the on-going water shortage on agriculture was a dedine in the sown area. There was also a change in cropping pattems as water-intensive sugarcane was replaced with wheat and cotton. A positive impact (on future productivity) was that land previouslymade uncultivable by waterlogging had been reclaimed for future use. Landlords had shifted their tenants around in order tomake optimal use of the canal water that was available. Most tenants were getting less land than before, and some were notgiven any land at all. Tubewells had been installed and these had raised the cost of crop production. It was widely believed thattubewell water was saline and that it Was going to ruin the land after two or three years of cumulatve increases ifi the saltcontent of the soil. This had not yet kicked in and yields on the lands that were cultivated remained close to their historicaverages. Those among the poor who remained tenants saw their eamings decline as a result of getting less land, and due tothe higher costs of production. Many of them borrowed grain from the landlords against future crops. There were some who nolonger worked as tenants, and were mostly seeking work as casual laborers. Harvest tme work was still available for both wheat
and cotton. There w,vere reports, also, of families migrating to work for landlords who had managed to secure water supplies.
Even within the area of Shah Alam there was evidence in one area of out-migration and in another of in-migration.
The drought affected the conditions of the poor very differently in the two areas. The differences were partly due to, the
technology of irrigation - rain-fed in one and canal-based in another, Differences were also due to the initial conditions in whichthe poor found themselves. The poor in Raheema were mostly low caste wage laborers, relying on diverse agricultural and non-
agricultural activities for sustenance. The diversity of their pre-shock livelihoods was understandable, given that agricultural
productivity is relatively low and varied in the barani areas. The livelihoods strategies, therefore, had already intemalized the
environmental hazards. There was no strong credit or insurance relationship with the landlords. In Shah Alam, large land
holdings provided a cushion against a total collapse in productivity. Large landlords attempted to use their water allocations
optimally by restrictng cultivation to part of their holdings, and moving tenants around in order to achieve this goal. They also
managed the allocation of water to their different tenants optmally. Landlords retained an interest in holding on to their tenants
in anticipation of future improvements in water supply, and therefore were willing to extend consumpbon-smoothing credit.
Source: Gazdar (2002). 'A Qualitative Survey of Poverty in Rural Pakistan: Methodology, Data, and Main Findings'
31
Household Determinants of Vulnerability and Poverty
Household Determinants of Vulnerability
2.52 In order to ask how household vulnerability correlates with household characteristics, it isimportant to understand whether the correlates of vulnerability are in any way distinct from the correlatesof 'transient' or 'chronic' poverty. Accordingly, vulnerability, chronic poverty and transient povertywere regressed on a range of household assets, household composition and education variables, andlocation and year dummies.
2.53 The focus is mainly on 4 types of assets; land, livestock, farm assets like tractors, and otherdurables, which included vehicles, refrigerators and sewing machines. The evidence shows all four typesof assets significantly reduce vulnerability, however there are important differences across asset types.First, while land ownership has a negative effect on vulnerability, its effect on vulnerability and transientpoverty is much smaller than its effect on chronic poverty. This suggests, as expected, that land is lesslikely to be used to protect consumption in the face of covariate shocks, and is consistent with a relativelythin market for the purchase and sale of land in rural Pakistan. In contrast, the ownership of farm assetslike tractors and other vehicles has a significantly negative effect on both vulnerability and chronicpoverty, but appears to have no effect on transient poverty. This suggests that the effect of farm assets onvulnerability works through its effect on chronic poverty. Finally, livestock ownership has a much largernegative effect on vulnerability as compared to both chronic and transient poverty. This seems to providesome evidence that households use livestock sales to buffer consumption.
2.54 It is also apparent that household composition has an effect; households with young kids anddependents are more likely to be vulnerable. Interestingly however, qualifying observations from crosssectional data noted below, it also appears that education lowers vulnerability only if at least onehousehold member has a post-secondary education.
2.55 Finally, as expected, location has a significant effect on vulnerability, according to the patternevident from Table 2.5. Households in district Badin in Sindh, and district Dir in the dry mountainregion, have a significantly higher probability of being vulnerable as compared to households in districtFaisalabad (in canal colony Punjab). In contrast, location has much smaller effects on both chronic andtransient poverty.
2.56 The noted differences in the sample between Sindh and Punjab throw into some relief earlierobservations from previous section. As noted, the lowest level of vulnerability was in the northernirrigated plains, essentially the canal colony areas of Punjab, while the highest levels were in the southemirrigated plains, the province of Sindh. While a large fraction of cultivated area in both regions is canalirrigated, the regions are substantially different in several respects. Importantly, these include sharpdifferences in the degree of inequality in land ownership. While land is held in small and relatively equalholdings in the canal colony areas of the Punjab, much of Sindh is characterized by a high degree ofinequality in land ownership.
2.57 Another notable difference is that there is substantial diversification of income across farm andnon-farm sources in central and Barani Punjab while there are few, if any, opportunities for non-farmemployment in much of Sindh. In addition, extemal transfers appear to play some role. As expected, therainfed plains of northem Punjab have a higher percentage of vulnerable households. Nonetheless, levelsof vulnerability there are lower than in southern Sindh. This appears to be due in large part to remittanceincome from migrants to the Gulf, and again, increasing levels of diversification out of agriculture. Thesecharacteristics are discussed in more detail in the rural poverty chapter of this report.
32
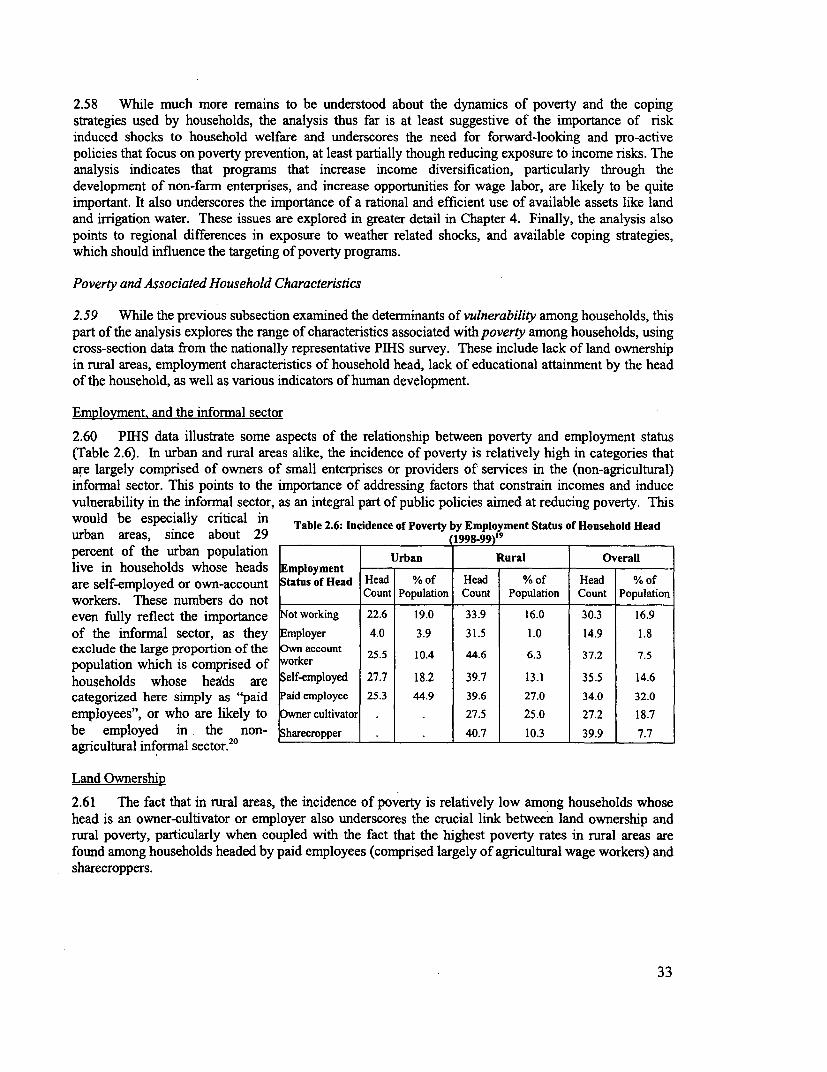
2.58 While much more remains to be understood about the dynamics of poverty and the coping
strategies used by households, the analysis thus far is at least suggestive of the importance of risk
induced shocks to household welfare and underscores the need for forward-looking and pro-activepolicies that focus on poverty prevention, at least partially though reducing exposure to income risks. The
analysis indicates that programs that increase income diversification, particularly through the
development of non-farm enterprises, and increase opportunities for wage labor, are likely to be quite
important. It also underscores the importance of a rational and efficient use of available assets like land
and irrigation water. These issues are explored in greater detail in Chapter 4. Finally, the analysis also
points to regional differences in exposure to weather related shocks, and available coping strategies,
which should influence the targeting of poverty programs.
Poverty and Associated Household Characteristics
2.59 While the previous subsection examined the determinants of vulnerability among households, this
part of the analysis explores the range of characteristics associated with poverty among households, using
cross-section data from the nationally representative PIHS survey. These include lack of land ownershipin rural areas, employment characteristics of household head, lack of educational attainment by the head
of the household, as well as various indicators of human development.
Employment, and the informal sector
2.60 PIHS data illustrate some aspects of the relationship between poverty and employment status
(Table 2.6). In urban and rural areas alike, the incidence of poverty is relatively high in categories that
are largely comprised of owners of small enterprises or providers of services in the (non-agricultural)infornal sector. This points to the importance of addressing factors that constrain incomes and induce
vulnerability in the informal sector, as an integral part of public policies aimed at reducing poverty. This
would be especially critical in Table 2.6: Incidence of Poverty by Employment Status of Household Headurban areas, since about 29 1998-99)'9percent of the urban population rlive in households whose heads Employment - Rural Overall
are self-employed or own-account Status of Head Head % of Head % of Head % of
workers. These numbers do not Count Population Count Population Count Population
even fully reflect the importance Not working 22.6 19.0 33.9 16.0 30.3 16.9
of the informal sector, as they Employer 4.0 3.9 31.5 1.0 14.9 1.8
exclude the large proportion of the wn account 25.5 10.4 44.6 6.3 37.2 7.5
population which is comprised of worker
households whose heeds are Self-employed 27.7 18.2 39.7 13.1 35.5 14.6
categorized here simply as "paid Paid employee 25.3 44.9 39.6 27.0 34.0 32.0
employees", or who are likely to Owner cultivator . . 27.5 25.0 27.2 18.7
be employed in the non- Sharecropper . . 40.7 10.3 39.9 7.7
agricultural informal sector.
Land Ownership
2.61 The fact that in rural areas, the incidence of poverty is relatively low among households whose
head is an owner-cultivator or employer also underscores the crucial link between land ownership and
rural poverty, particularly when coupled with the fact that the highest poverty rates in rural areas are
found among households headed by paid employees (comprised largely of agricultural wage workers) and
sharecroppers.
33
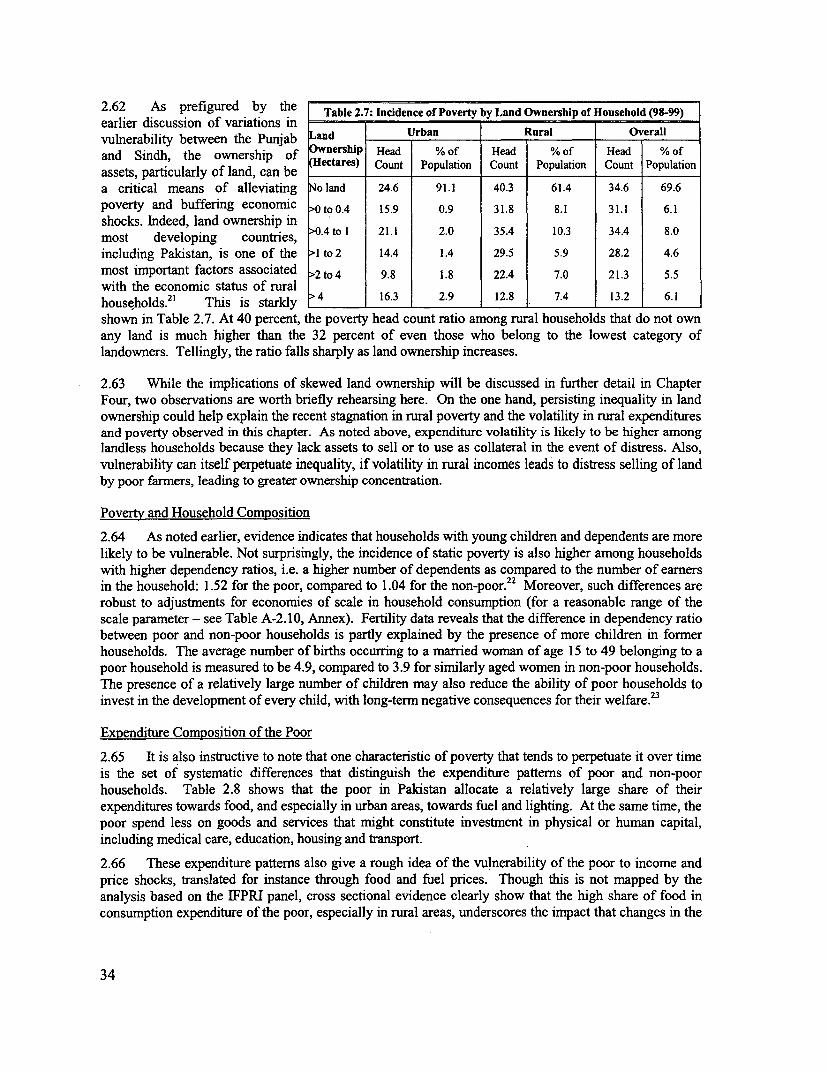
2.62 As prefigured by the Table 2.7: Incidence of Poverty by Land Ownership of Household (9899)earlier discussion of variations invulnerability between the Punjab Land Urban Rural Overalland Sindh, the ownership of Ownership Head % of Head % of Head % ofassets, particularly of land, can be (Hectares) Count Population Count Population Count Populationa critical means of alleviating No land 24.6 91.1 40.3 61.4 34.6 69.6poverty and buffering economic >0to0.4 15.9 0.9 31.8 8.1 31.1 6.1shocks. Indeed, land ownership inmost developing countries, >0.4 to 1 21.1 2.0 35.4 10.3 34.4 8.0including Pakistan, is one of the >I to 2 14.4 1.4 29.5 5.9 28.2 4.6most important factors associated >2 to4 9.8 1.8 22.4 7.0 21.3 5.5with the economic status of ruralhouseholds.2 ' This is starkly 4 16.3 2.9 12.8 7.4 13.2 6.1shown in Table 2.7. At 40 percent, the poverty head count ratio among rural households that do not ownany land is much higher than the 32 percent of even those who belong to the lowest category oflandowners. Tellingly, the ratio falls sharply as land ownership increases.
2.63 While the implications of skewed land ownership will be discussed in further detail in ChapterFour, two observations are worth briefly rehearsing here. On the one hand, persisting inequality in landownership could help explain the recent stagnation in rural poverty and the volatility in rural expendituresand poverty observed in this chapter. As noted above, expenditure volatility is likely to be higher amonglandless households because they lack assets to sell or to use as collateral in the event of distress. Also,vulnerability can itself perpetuate inequality, if volatility in rural incomes leads to distress selling of landby poor farmers, leading to greater ownership concentration.
Poverty and Household Composition
2.64 As noted earlier, evidence indicates that households with young children and dependents are morelikely to be vulnerable. Not surprisingly, the incidence of static poverty is also higher among householdswith higher dependency ratios, i.e. a higher number of dependents as compared to the number of earnersin the household: 1.52 for the poor, compared to 1.04 for the non-poor.22 Moreover, such differences arerobust to adjustments for economies of scale in household consumption (for a reasonable range of thescale parameter - see Table A-2. 10, Annex). Fertility data reveals that the difference in dependency ratiobetween poor and non-poor households is partly explained by the presence of more children in formerhouseholds. The average number of births occurring to a married woman of age 15 to 49 belonging to apoor household is measured to be 4.9, compared to 3.9 for similarly aged women in non-poor households.The presence of a relatively large number of children may also reduce the ability of poor households toinvest in the development of every child, with long-term negative consequences for their welfare.23
Expenditure Composition of the Poor
2.65 It is also instructive to note that one characteristic of poverty that tends to perpetuate it over timeis the set of systematic differences that distinguish the expenditure patterns of poor and non-poorhouseholds. Table 2.8 shows that the poor in Pakistan allocate a relatively large share of theirexpenditures towards food, and especially in urban areas, towards fuel and lighting. At the same time, thepoor spend less on goods and services that might constitute investment in physical or human capital,including medical care, education, housing and transport.
2.66 These expenditure pattems also give a rough idea of the vulnerability of the poor to income andprice shocks, translated for instance through food and fuel prices. Though this is not mapped by theanalysis based on the IFPRI panel, cross sectional evidence clearly show that the high share of food inconsumption expenditure of the poor, especially in rural areas, underscores the impact that changes in the
34
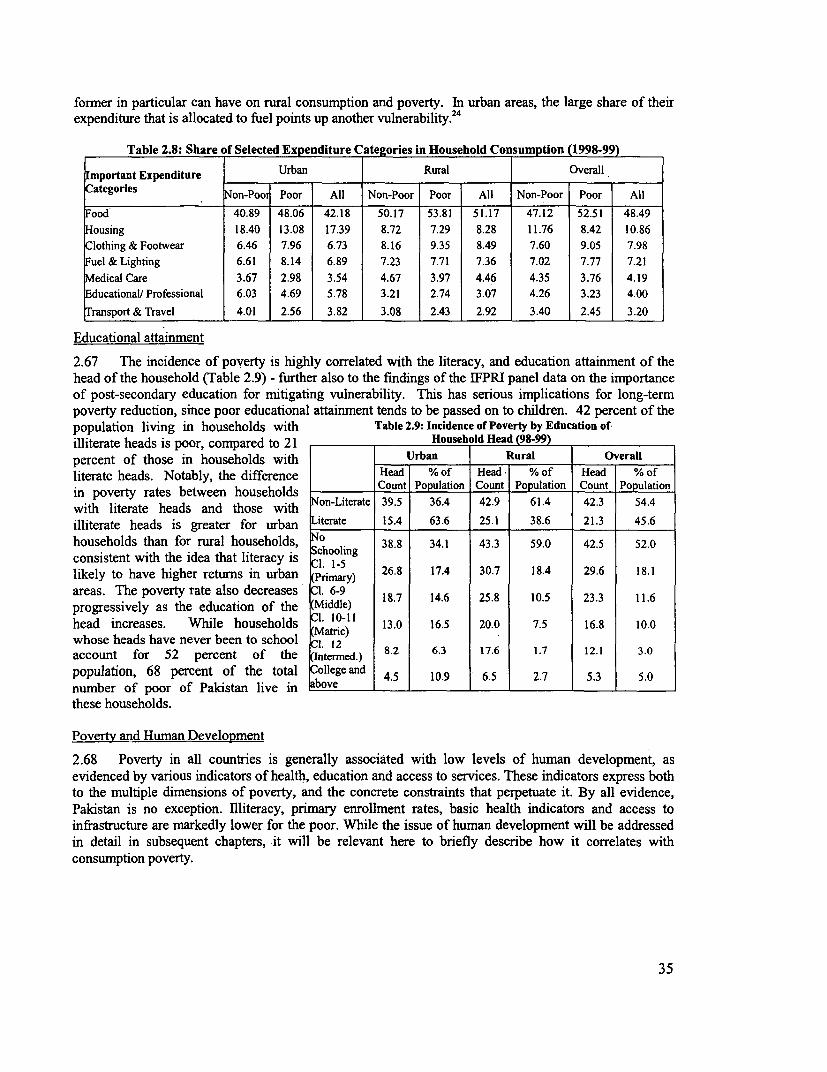
former in particular can have on rural consumption and poverty. In urban areas, the large share of theirexpenditure that is allocated to fuel points up another vulnerability.24
Table 2.8: Share of Selected Expenditure Categories in Household Co sumption (1998-99)
Important Expenditure Urban Rural OverallCategories Non-Poor Poor All Non-Poor Poor All Non-Poor Poor All
Food 40.89 48.06 42.18 50.17 53.81 51.17 47.12 52.51 48.49
ousing 18.40 13.08 17.39 8.72 7.29 8.28 11.76 8.42 10.86
lothing & Footwear 6.46 7.96 6.73 8.16 9.35 8.49 7.60 9.05 7.98
uel & Lighting 6.61 8.14 6.89 7.23 7.71 7.36 7.02 7.77 7.21
edical Care 3.67 2.98 3.54 4.67 3.97 4.46 4.35 3.76 4.19
ducationalV Professional 6.03 4.69 5.78 3.21 2.74 3.07 4.26 3.23 4.00
ransport & Travel 4.01 2.56 3.82 3.08 2.43 2.92 3.40 2.45 3.20
Educational attainment
2.67 The incidence of poverty is highly correlated with the literacy, and education attainment of thehead of the household (Table 2.9) - further also to the findings of the IFPRI panel data on the importanceof post-secondary education for mitigating vulnerability. This has serious implications for long-termpoverty reduction, since poor educational attainment tends to be passed on to children. 42 percent of thepopulation living in households with Table 2.9: Incidence of Poverty by Education ofilliterate heads is poor, compared to 21 Househ ld Head (98-99)percent of those in households with Urban Rural Overallliterate heads. Notably, the difference Head % of Head %of Head %of
in poverty rates between households Count POPUlatiOn Count PoPulation Count Population
with literate heads and those with Non-Literate 39.5 36.4 42.9 61.4 42.3 54.4
illiterate heads is greater for urban terate 15.4 63.6 25.1 38.6 21.3 45.6households than for rural households, 0N 38.8 34.1 43.3 59.0 42.5 52.0consistent with the idea that literacy is -chooling11. 1-5likely to have higher returns in urban Primary) 26.8 17.4 30.7 18.4 29.6 18.1
areas. The poverty rate also decreases 1.6-9 18.7 14.6 25.8 10.5 23.3 11.6progressively as the education of the iddle)head increases. While households ( n10-11 13.0 16.5 20.0 7.5 16.8 10.0
atric)whose heads have never been to school C. 12account for 52 percent of the Intermed.) 8.2 6.3 17.6 1.7 12.1 3.0
population, 68 percent of the total OIlege and 4.5 10.9 6.5 2.7 5.3 5.0
number of poor of Pakistan live in bove _these households.
Poverty and Human Development
2.68 Poverty in all countries is generally associated with low levels of human development, asevidenced by various indicators of health, education and access to services. These indicators express bothto the multiple dimensions of poverty, and the concrete constraints that perpetuate it. By all evidence,Pakistan is no exception. Illiteracy, primary enrollment rates, basic health indicators and access toinfrastructure are markedly lower for the poor. While the issue of human development will be addressedin detail in subsequent chapters, it will be relevant here to briefly describe how it correlates withconsumption poverty.
35
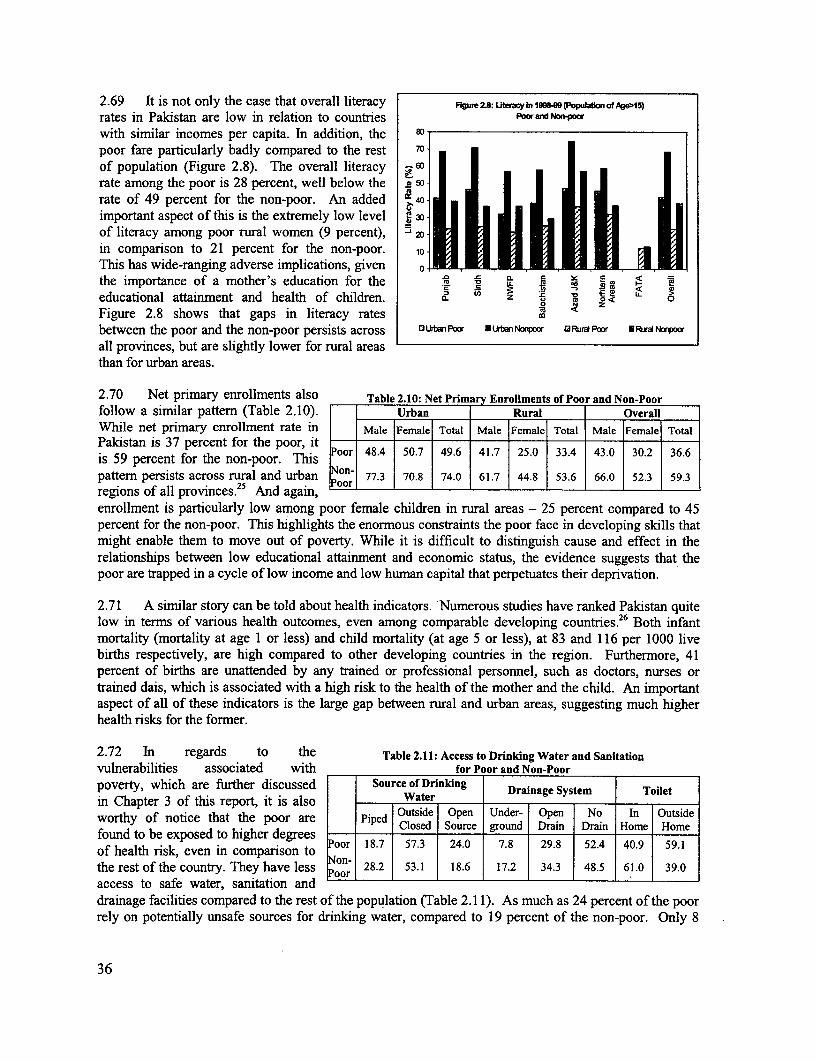
2.69 It is not only the case that overall literacy Figure28:LitaWyIn19989 (PoputatikmofAge>15)
rates in Pakistan are low in relation to countries Poo A Nonoo
with similar incomes per capita. In addition, the 80
poor fare particularly badly compared to the rest 70of population (Figure 2.8). The overall literacy s 60rate among the poor is 28 percent, well below the - sorate of 49 percent for the non-poor. An added 40
important aspect of this is the extremely low level 30
of literacy among poor rural women (9 percent), 20
in comparison to 21 percent for the non-poor. 10This has wide-ranging adverse implications, given o 0 athe importance of a mother's education for the n X L seducational attainment and health of children. a. z B zFigure 2.8 shows that gaps in literacy rates mbetween the poor and the non-poor persists across oUrta Pw EUrta Non a R%11 *Ra Nonw
all provinces, but are slightly lower for rural areasthan for urban areas.
2.70 Net primary enrollments also Table 2.10: Net Prima Enrollments of Poor and Non-Poorfollow a similar pattern (Table 2.10). Urban Rural OverallWhile net primary enrollment rate in Male Female Total Male Female Total Male Female TotalPakistan is 37 percent for the poor, it.ialstanis 59 percent for the n poor. is Poor 48.4 50.7 49.6 41.7 25.0 33.4 43.0 30.2 36.6is 59 percent for the non-poor. This Nnpattern persists across rural and urban 77.3 70.8 74.0 61.7 44.8 53.6 66.0 52.3 59.3
25 Proorregions of all provinces. And again,enrollment is particularly low among poor female children in rural areas - 25 percent compared to 45percent for the non-poor. This highlights the enormous constraints the poor face in developing skills thatmight enable them to move out of poverty. While it is difficult to distinguish cause and effect in therelationships between low educational attainment and economic status, the evidence suggests that thepoor are trapped in a cycle of low income and low human capital that perpetuates their deprivation.
2.71 A similar story can be told about health indicators. Numerous studies have ranked Pakistan quitelow in terms of various health outcomes, even among comparable developing countries. 26 Both infantmortality (mortality at age 1 or less) and child mortality (at age 5 or less), at 83 and 116 per 1000 livebirths respectively, are high compared to other developing countries in the region. Furthermore, 41percent of births are unattended by any trained or professional personnel, such as doctors, nurses ortrained dais, which is associated with a high risk to the health of the mother and the child. An importantaspect of all of these indicators is the large gap between rural and urban areas, suggesting much higherhealth risks for the former.
2.72 In regards to the Table 2.11: Access to Drinking Water and Sanitationvulnerabilities associated with for Poor and Non-Poorpoverty, which are further discussed Source of Drinking Drainage System Toiletin Chapter 3 of this report, it is also Waterworthy of notice that the poor are Piped Outside Open Under- Open No In Outsideworndthy beepClosed I Source ground Drain Drain Home Homefound to be exposed to higher degrees - l. l l lof health risk, even in comparison to Poor 18.7 57.3 24.0 7.8 29.8 52.4 40.9 59.1the rest of the country. They have less Non- 28.2 53.1 18.6 17.2 34.3 48.5 61.0 39.0access to safe water, sanitation and - I I I I
drainage facilities compared to the rest of the population (Table 2.1 1). As much as 24 percent of the poorrely on potentially unsafe sources for drinking water, compared to 19 percent of the non-poor. Only 8
36
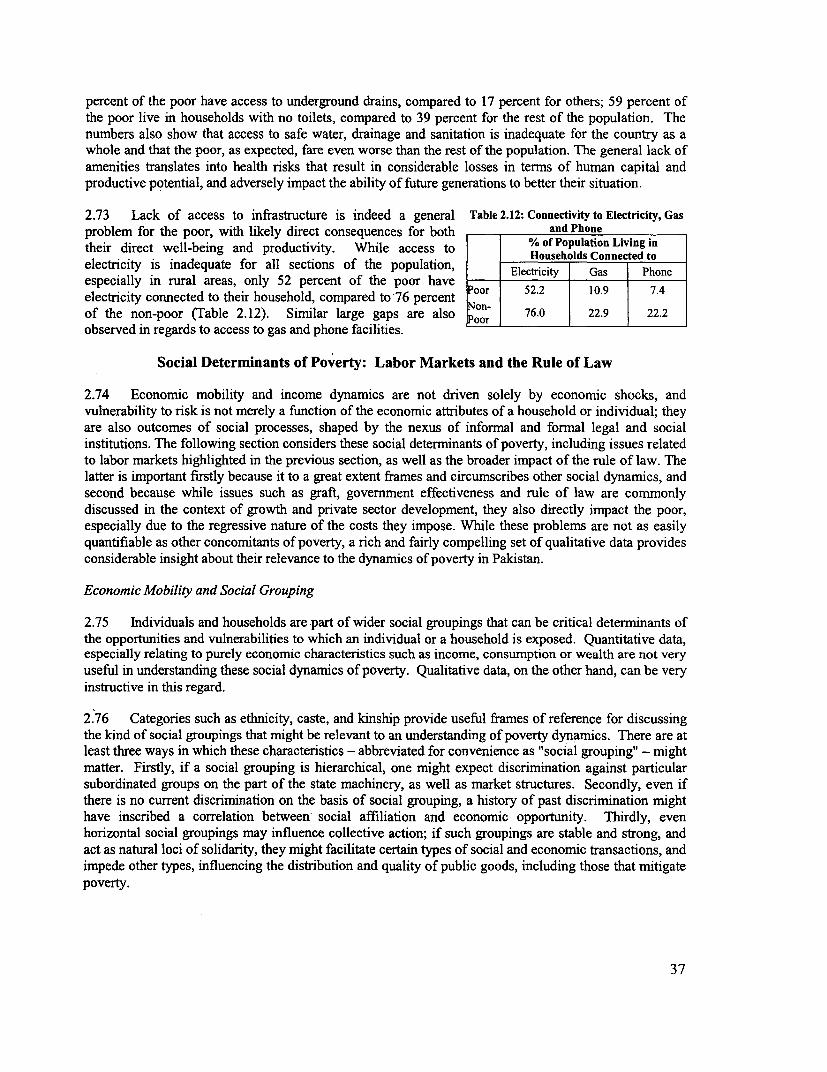
percent of the poor have access to underground drains, compared to 17 percent for others; 59 percent ofthe poor live in households with no toilets, compared to 39 percent for the rest of the population. Thenumbers also show that access to safe water, drainage and sanitation is inadequate for the country as awhole and that the poor, as expected, fare even worse than the rest of the population. The general lack ofamenities translates into health risks that result in considerable losses in terms of human capital andproductive potential, and adversely impact the ability of future generations to better their situation.
2.73 Lack of access to infrastructure is indeed a general Table 2.12: Connectivity to Electricity, Gas
problem for the poor, with likely direct consequences for both and Phone
their direct well-being and productivity. While access to % of Population Living in
electricity is inadequate for all sections of the population, Electricity Gas Phone
especially in rural areas, only 52 percent of the poor haveelectricity connected to their household, compared to 76 percent Poor 52.2 10.9 7.4of the non-poor (Table 2.12). Similar large gaps are also Non- 76.0 22.9 22.2
observed in regards to access to gas and phone facilities.
Social Determinants of Poverty: Labor Markets and the Rule of Law
2.74 Economic mobility and income dynamics are not driven solely by economic shocks, andvulnerability to risk is not merely a function of the economic attributes of a household or individual; theyare also outcomes of social processes, shaped by the nexus of informal and fonnal legal and socialinstitutions. The following section considers these social determinants of poverty, including issues relatedto labor markets highlighted in the previous section, as well as the broader impact of the rule of law. Thelatter is important firstly because it to a great extent frames and circumscribes other social dynamics, andsecond because while issues such as graft, government effectiveness and rule of law are commonlydiscussed in the context of growth and private sector development, they also directly impact the poor,especially due to the regressive nature of the costs they impose. While these problems are not as easilyquantifiable as other concomitants of poverty, a rich and fairly compelling set of qualitative data providesconsiderable insight about their relevance to the dynamics of poverty in Pakistan.
Economic Mobility and Social Grouping
2.75 Individuals and households are part of wider social groupings that can be critical determinants ofthe opportunities and vulnerabilities to which an individual or a household is exposed. Quantitative data,especially relating to purely economic characteristics such as income, consumption or wealth are not veryuseful in understanding these social dynamics of poverty. Qualitative data, on the other hand, can be veryinstructive in this regard.
2. 76 Categories such as ethnicity, caste, and kinship provide useful frames of reference for discussingthe kind of social groupings that might be relevant to an understanding of poverty dynamics. There are atleast three ways in which these characteristics - abbreviated for convenience as "social grouping" - mightmatter. Firstly, if a social grouping is hierarchical, one might expect discrimination against particularsubordinated groups on the part of the state machinery, as well as market structures. Secondly, even ifthere is no current discrimination on the basis of social grouping, a history of past discrimination mighthave inscribed a correlation between social affiliation and economic opportunity. Thirdly, evenhorizontal social groupings may influence collective action; if such groupings are stable and strong, andact as natural loci of solidarity, they might facilitate certain types of social and economic transactions, andimpede other types, influencing the distribution and quality of public goods, including those that mitigatepoverty.
37
Social Norms, Groups and Labour Market Distortions
2.77 As noted in the previous section, employment diversification, certain kinds of informalemployment - and the labor market distortions they signal - are both associated and indeed correlated withvulnerability and poverty. This would lead one to ask: how might social norms and social organizationaffect the functioning of markets in general and labor markets in particular, and what might be theimplications for poverty? There are a number of possibilities: There might be overt or hiddendiscrimination against certain groups, based on group-based prejudice (gender, racial or castestereotyping, for example), and there might be official sanction for such discrimination in some cases. Orit might simply reflect widespread social prejudice. All these phenomena are evidenced in Pakistan, as inother societies. And as this section details, there is strong survey evidence that social groupings such ascaste, kinship groups and biradris affect the functioning of its labor markets. Policy options to remedysuch problems can include some combination of legal reform, cultural change, and positive discriminationin public sector employment. Notably however, the viability of such reforms would to some extent beconditioned on the broader efficacy of the rule of law.
2.78 The economics of discrimination might be understood in two ways. Firstly, if it is costly toobtain information about the characteristics of an individual worker, more easily observable groupcharacteristics, or prejudices, might be used by employers to rank and screen employees. There might beany number of feedback mechanisms that actually encourage individuals belonging to a particular groupto conform to their perceived group characteristics, or prejudices about these group characteristics.Secondly, employers might prefer to hire workers with some level of social collateral - i.e. those overwhom they might be exercise some potential leverage through common social networks. The notion ofsocial collateral - which is more commonly used with reference to credit markets - is applicable also tolabor markets if employers face high monitoring costs. Notably, both these propositions - social groupingas screening signal, and social grouping as source of social collateral - relate to situations whereemployers value information on potential employees - i.e. where skill, effort, and trustworthiness areimportant.
2.79 To evaluate these explanations, a World Bank qualitative survey was undertaken in six districts inPakistan with the aim of addressing social grouping and labor market clustering. It found thatemployment opportunities appeared to be closely correlated with caste, kinship or prior social grouping.This held true across a range of sectors and jobs. Notably, the active decisions leading to a clustering ofeconomic activity around specific social groupings primarily concerned the inclusion of particular groupsrather than the exclusion of others - supporting the importance of social "collateral" rather than the"screening" hypothesis noted above.
2.80 In almost every case, the use of sifarish, or personal recommendation and guarantees, was asignificant factor in the history of job clustering. Social collateral was found to be important from theemployers' point of view even in relatively low-skill, casual jobs. This revealed the weakness of theoverall institutional environment vis-a-vis the prior strength and robustness of social groupings,confirmed by the fact that sifarish appeared to work also largely through close caste and kinshipnetworks. The group, therefore, was clearly significant as a determinant of economic opportunity andmobility, and therefore also an important feature of poverty traps. Box 2.4 illustrates this vividly.
2.81 These findings have two types of policy implications. First, it is clear that in some cases there isscope for legal action and possibly even positive discrimination in the favor of some historicallymarginalized groups. Second, however it is also apparent that the labor market distortion associated withsocial group clustering is related to the weakness of other institutions, particularly in the realm of the ruleof law and contract enforcement.
38
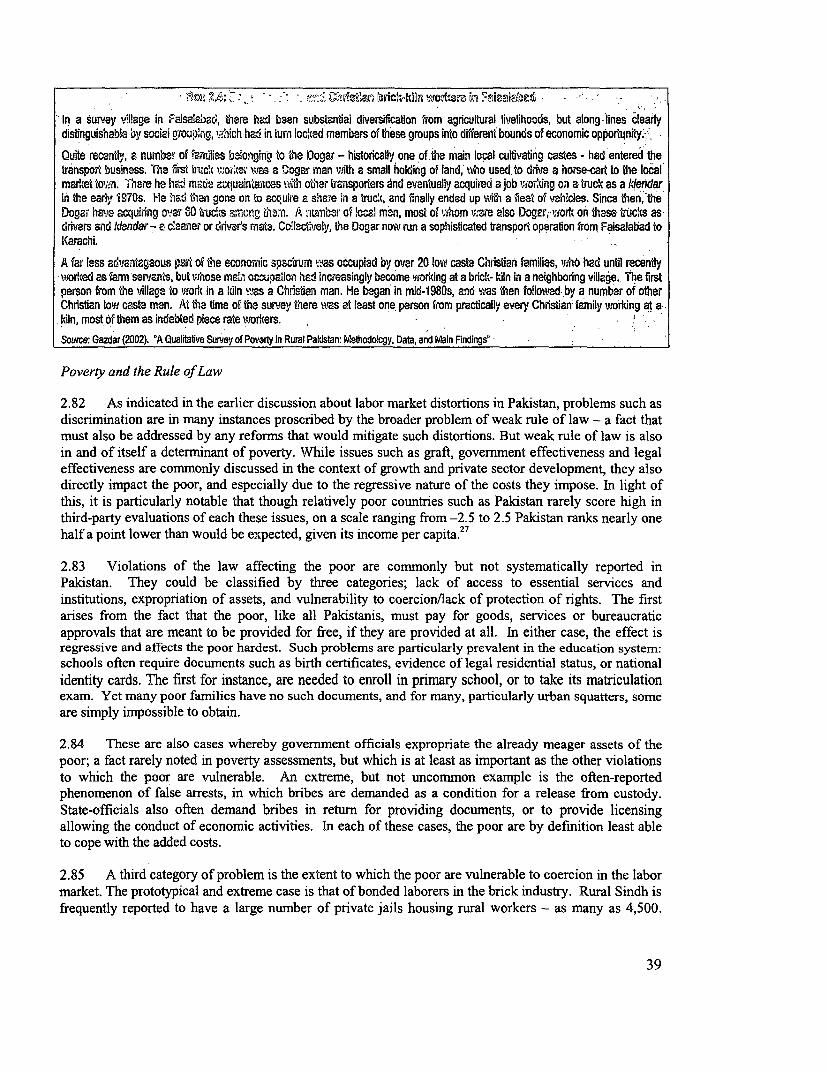
In a survey village in Faisa!abad, fthre had bsen substantial diversificaton from agricultural livelihoods, but along -lines clearlydistnguishable by sociai group,ng, which had in turn locked members of these groups into different bounds of economic opportunity.'
Quite recently, a number of famnilies belonging to the Dogar - historically one of the main local cuflvating castes - had entered thetransport business. (he first tuck mei e was a Dogar man with a small holding of land, who used, to drive a horse-cart to the localmarket town. 'ihare he had made aquainisans wihother transporters snd eventually acquired a job working cn a truck as a kendarih the early i°70s. iHe had then gone on to acquire a share in a truck, and finally ended up with a fleet of vehicles. Since then,"the
Dogar have acquiring ovar 0 tuuciks wiong them. A number of local man, most of whom were also Doger, work on these ttcks asdrivers and !dendar- a cleaner or drivers mate. Collsct;vely, the Dogar now run a sophistcated transport operation frorn Faisalabad to
Karachi.
A far less advantagaous part of the economic spactum was occupied by over 20 low caste Chnstian famiies, who had until recently
worted as farm servants, but whose maii occupaion had inceasingly become working at a brick- kiln in a neighboring village., The first
person from the village to work in a kiln tas a Christan man. He began in mid-1980s, and was then followad. by a number of other
Chrstian low caste men. At the fime of the survey there was at least one person from practically every Christian mily working at a,
kiln, most of them as indebted piece rate workers.
Source: Gazdar (2002) 'A Qualitative Survey of Poverty In Rural Pakistan: WMthodology, Data, and Main Findings'
Poverty and the Rule of Law
2.82 As indicated in the earlier discussion about labor market distortions in Pakistan, problems such asdiscrimination are in many instances proscribed by the broader problem of weak rule of law - a fact thatmust also be addressed by any reforms that would mitigate such distortions. But weak rule of law is also
in and of itself a determinant of poverty. While issues such as graft, government effectiveness and legaleffectiveness are commonly discussed in the context of growth and private sector development, they alsodirectly impact the poor, and especially due to the regressive nature of the costs they impose. In light ofthis, it is particularly notable that though relatively poor countries such as Pakistan rarely score high inthird-party evaluations of each these issues, on a scale ranging from -2.5 to 2.5 Pakistan ranks nearly onehalf a point lower than would be expected, given its income per capita.27
2.83 Violations of the law affecting the poor are commonly but not systematically reported inPakistan. They could be classified by three categories; lack of access to essential services andinstitutions, expropriation of assets, and vulnerability to coercion/lack of protection of rights. The firstarises from the fact that the poor, like all Pakistanis, must pay for goods, services or bureaucraticapprovals that are meant to be provided for free, if they are provided at all. In either case, the effect isregressive and affects the poor hardest. Such problems are particularly prevalent in the education system:schools often require documents such as birth certificates, evidence of legal residential status, or national
identity cards. The first for instance, are needed to enroll in primary school, or to take its matriculationexam. Yet many poor families have no such documents, and for many, particularly urban squatters, someare simply impossible to obtain.
2.84 These are also cases whereby govemment officials expropriate the already meager assets of thepoor; a fact rarely noted in poverty assessments, but which is at least as important as the other violationsto which the poor are vulnerable. An extreme, but not uncommon example is the often-reportedphenomenon of false arrests, in which bribes are demanded as a condition for a release from custody.
State-officials also often demand bribes in return for providing documents, or to provide licensingallowing the conduct of economic activities. In each of these cases, the poor are by definition least ableto cope with the added costs.
2.85 A third category of problem is the extent to which the poor are vulnerable to coercion in the labormarket. The prototypical and extreme case is that of bonded laborers in the brick industry. Rural Sindh isfrequently reported to have a large number of private jails housing rural workers - as many as 4,500.
39
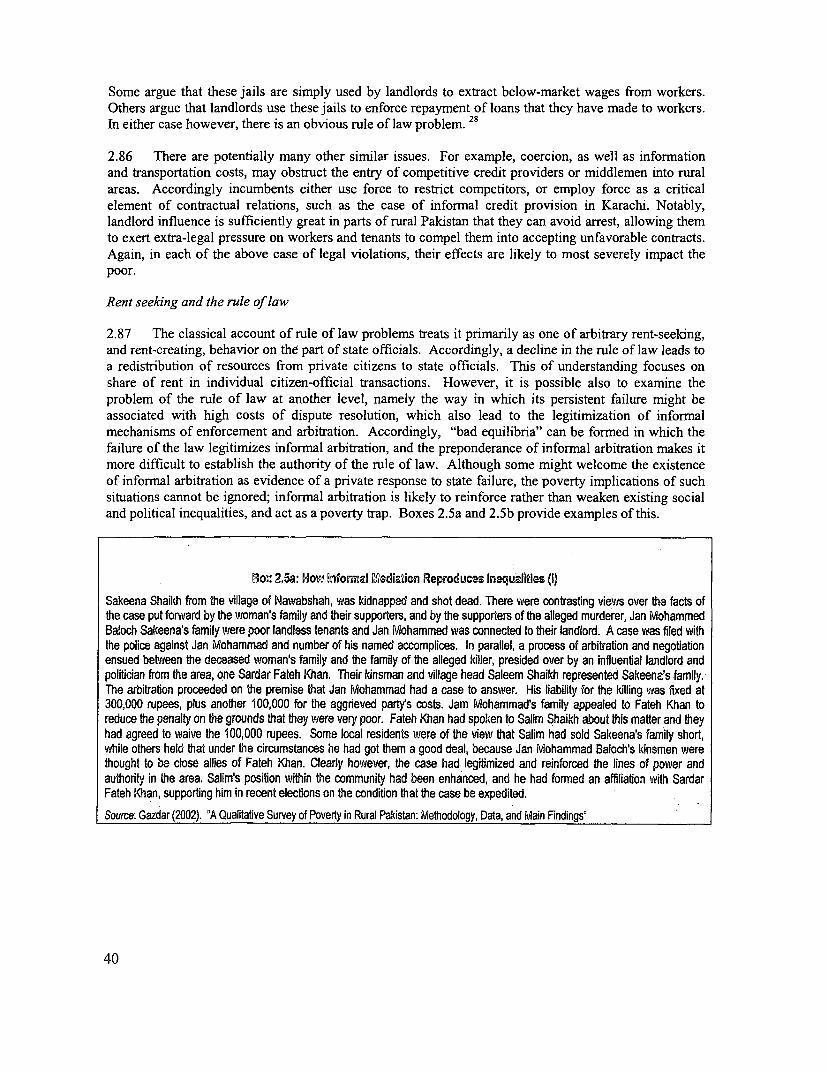
Some argue that these jails are simply used by landlords to extract below-market wages from workers.Others argue that landlords use these jails to enforce repayment of loans that they have made to workers.In either case however, there is an obvious rule of law problem. 28
2.86 There are potentially many other similar issues. For example, coercion, as well as informationand transportation costs, may obstruct the entry of competitive credit providers or middlemen into ruralareas. Accordingly incumbents either use force to restrict competitors, or employ force as a criticalelement of contractual relations, such as the case of informal credit provision in Karachi. Notably,landlord influence is sufficiently great in parts of rural Pakistan that they can avoid arrest, allowing themto exert extra-legal pressure on workers and tenants to compel them into accepting unfavorable contracts.Again, in each of the above case of legal violations, their effects are likely to most severely impact thepoor.
Rent seeking and the rule of law
2.87 The classical account of rule of law problems treats it primarily as one of arbitrary rent-seeking,and rent-creating, behavior on the part of state officials. Accordingly, a decline in the rule of iaw leads toa redistribution of resources from private citizens to state officials. This of understanding focuses onshare of rent in individual citizen-official transactions. However, it is possible also to examine theproblem of the rule of law at another level, namely the way in which its persistent failure might beassociated with high costs of dispute resolution, which also lead to the legitimization of inforrnalmechanisms of enforcement and arbitration. Accordingly, "bad equilibria" can be forrned in which thefailure of the law legitimizes informal arbitration, and the preponderance of informal arbitration makes itmore difficult to establish the authority of the rule of law. Although some might welcome the existenceof informal arbitration as evidence of a private response to state failure, the poverty implications of suchsituations cannot be ignored; informal arbitration is likely to reinforce rather than weaken existing socialand political inequalities, and act as a poverty trap. Boxes 2.5a and 2.5b provide examples of this.
BSoi 2.5a: How lnforoimal fediation Reproduces lnequal'ties (1)Sakeena Shaikh from the village of Nawabshah, was kidnapped and shot dead. There were contrastng views over the facts ofthe case put forward by the woman's family and their supporters, and by the supporters of the alleged murderer, Jan MohammedBaloch Sakeena's family were poor landless tenants and Jan Mohammed was connected to their landlord. A case was filed withthe police against Jan Mohammad and number of his named accomplices. In parallel, a process of arbitraton and negotiatonensued between the deceased woman's family and the family of the alleged killer, presided over by an influental landlord andpolitician from the area, one Sardar Fateh Khan. Their kinsman and village head Saleem Shaikh represented Sakeena's family.The arbitration proceeded on the premise that Jan Mohammad had a case to answer. His liability for the killing was fixed at300,000 rupees, plus another 100,000 for the aggrieved partys costs. Jam Mohammad's family appealed to Fateh Khan toreduce the penalty on the grounds that they were very poor. Fateh Khan had spoken to Salim Shaikh about this matter and theyhad agreed to waive the 100,000 rupees. Some local residents were of the view that Salim had sold Sakeena's family short,while others held that under the circumstances he had got them a good deal, because Jan Mohammad Baloch's kinsmen werethought to be close allies of Fateh Khan. Clearly however, the case had, legitmized and reinforced the lines of power andauthority in the area. Salim's position within the community had been enhanced, and he had formed an affiliaton with SardarFateh Khan, supporting him in recent elections on the condition that the case be expedited.Sourm. Gazdar (2002). 'A Qualitative Survey of Poverty in Rural Pakistan: Methodology, Data, and Main Findings'
40
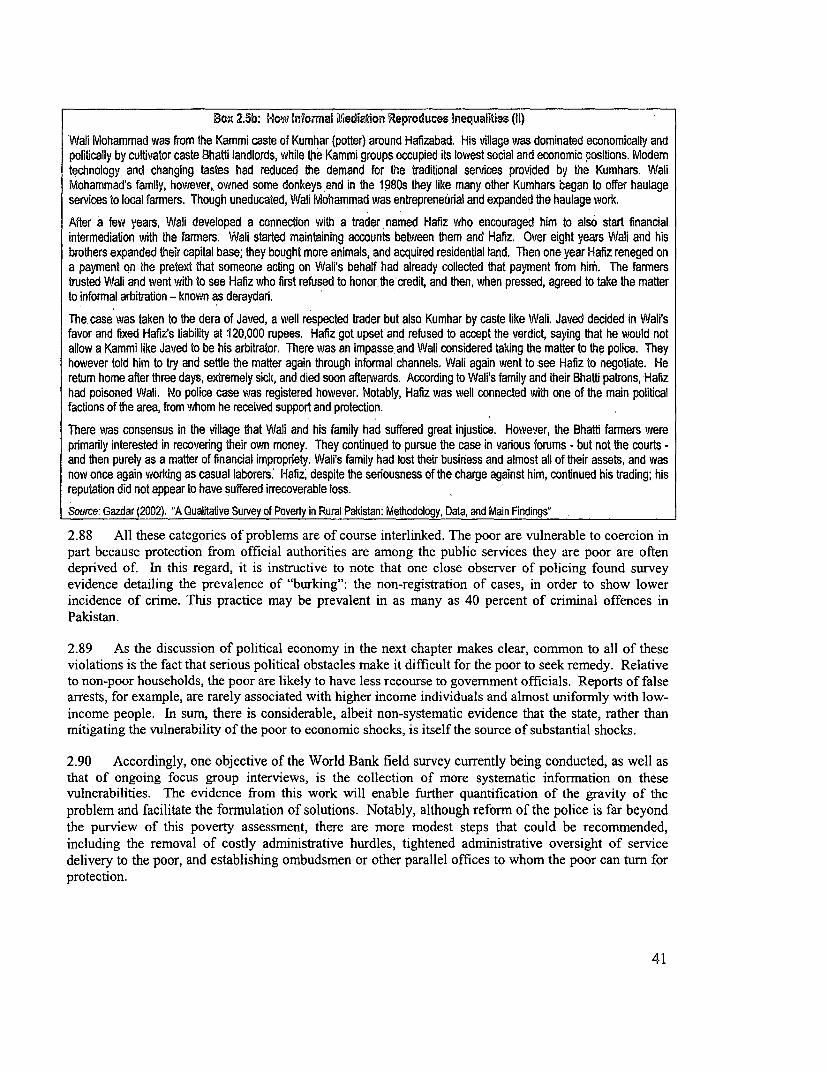
Bo:z 2.5b: Now Informal Mediation Reproduces ;nequalities (II)
Wali Mohammad was from the Kammi caste of Kumhar (potter) around Hafizabad. His village was dominated economically and
politically by cultivator caste Bhatti landlords, while the Kammi groups occupied its lowest social and economic positions. Modem
technology and changing tastes had reduced the demand for the traditional services provided by the Kumhars. Wali
Mohammad's family, however, owned some donkeys and in the 1980s they like many other Kumhars began to offer haulage
services to local farmers. Though uneducated, Wali Mohammad was entrepreneurial and expanded the haulage work.
After a few years, Wali developed a connection with a trader named Hafiz who encouraged him to also start financial
intermediation with the farmers. Wall started maintaining accounts between them and Hafiz. Over eight years Wali and his
brothers expanded their capital base; they bought more animals, and acquired residential land. Then one year Hafiz reneged on
a payment on the pretext that someone acting on Wali's behalf had already collected that payment from him. The farmers
trusted Wali and went with to see Hafiz who first refused to honor,the credit, and then, when pressed, agreed to take the matter
to informal arbitration - known as deraydari.
The case was taken to the dera of Javed, a well respected trader but also Kumhar by caste like Wali. Javed decided in Wali's
favor and fixed Hafiz's liability at 120,000 rupees. Hafiz got upset and refused to accept the verdict, saying that he would not
allow a Kammi like Javed to be his arbitrator. There was an impasse, and Wali considered taking the matter to the police. They
however told him to try and settle the matter again through informal channels. Wali again went to see Hafiz to negotiate. He
return home after three days, extremely sick, and died soon afterwards. According to Wali's family and their Bhatti patrons, Hafiz
had poisoned Wali. No police case was registered however. Notably, Hafiz was well connected with one of the main political
factions of the area, from whom he received support and protection.
There was consensus in the village that Wali and his family had suffered great injustice. However, the Bhatti farmers were
primarily interested in recovering their own money. They continued to pursue the case in various forums - but not the courts -
and then purely as a matter of financial impropriety. Wali's family had lost their business and almost all of their assets, and was
now once again working as casual laborers: Hafiz, despite the seriousness of the charge against him, contnued his trading; his
reputation did not appear to have suffered irrecoverable loss.
Source: Gazdar (2002). 'A Qualitative Survey of Poverty in Rural Pakistan: Methodology, Data, and Main Findings'
2.88 All these categories of problems are of course interlinked. The poor are vulnerable to coercion in
part because protection from official authorities are among the public services they are poor are often
deprived of. In this regard, it is instructive to note that one close observer of policing found survey
evidence detailing the prevalence of "burking": the non-registration of cases, in order to show lower
incidence of crime. This practice may be prevalent in as many as 40 percent of criminal offences in
Pakistan.
2.89 As the discussion of political economy in the next chapter makes clear, common to all of these
violations is the fact that serious political obstacles make it difficult for the poor to seek remedy. Relative
to non-poor households, the poor are likely to have less recourse to govemment officials. Reports of false
arrests, for example, are rarely associated with higher income individuals and almost uniformly with low-
income people. In sum, there is considerable, albeit non-systematic evidence that the state, rather than
mitigating the vulnerability of the poor to economic shocks, is itself the source of substantial shocks.
2.90 Accordingly, one objective of the World Bank field survey currently being conducted, as well as
that of ongoing focus group interviews, is the collection of more systematic information on these
vulnerabilities. The evidence from this work will enable further quantification of the gravity of the
problem and facilitate the formulation of solutions. Notably, although reform of the police is far beyond
the purview of this poverty assessment, there are more modest steps that could be recommended,
including the removal of costly administrative hurdles, tightened administrative oversight of service
delivery to the poor, and establishing ombudsmen or other parallel offices to whom the poor can tum for
protection.
41
Conclusion
2.91 As detailed in this chapter, the aggregate incidence of poverty in Pakistan at the end of the 1990'sstood at 33 percent of the population - a figure that had hardly improved since the beginning of thedecade. In addition, there is evidence that the depth and severity of poverty also persisted, along withsharp differences across the country's provinces, and its rural and urban areas. Indeed, indications are thatthe gap between countryside and city has only widened over the decade, reflecting a pattern of stagnantand uneven development. Notably, this pattern seems not to be too sensitive to the choice of poverty linethat is applied to Pakistan, an important point given that there is not yet a consensus on such ameasurement standard.
2.92 Building on this, the chapter attempts to collate evidence correlating and linking vulnerability andpoverty in Pakistan to certain household attributes that both constitute and determine poverty, indicatingthe constraints that impede the ability of poor households to improve their economic status. As detailedabove, these include household asset ownership; expenditure patterns reflecting inability to spend in waysthat improve human capital, for example education and health; and employment patterns. Poverty is alsoassociated with low literacy; perhaps even more importantly, the gap between the poor and the non-pooris equally large in case of primary enrollment rates, suggesting the enormous obstacles future generationsface in improving their economic status. Health indicators for the country reflect the high degree ofhealth risks that the population is exposed to, especially in rural areas. This is more marked for its poorergroups, on account of their limited access to infrastructure like safe water, sanitation, and health facilities.
2.93 Regional differences in levels of vulnerability as well as differences in coping strategies amonghouseholds within regions, point to the importance of forward-looking and pro-active policies that focuson poverty prevention, at least partially though reducing exposure to income risks and less reliance onstatic poverty measures for targeting poverty reduction programs. In particular, it appears that programsthat increase income diversification, particularly through the development of non-farm enterprises, andincrease opportunities for wage labor, are likely to be quite important as is the rational and efficient use ofavailable assets like land and irrigation water.
2.94 In this context, the high degree of inequality in land ownership is worth noting. As Chapter 4 willexplore in some detail, lack of land ownership adversely affects access to credit and incentives to carryout productive investment, and a combination of these factors are likely to constrain productivity andincomes. Evidence in this chapter also point up the importance of diversifying incomes in agriculturalareas, and also that distortions in labor markets may impede such strategies. In light of the broadersocietal considerations that often circumscribe both access to land and labor - e.g. the role that socialgroupings play in delineating economic opportunities - the chapter also devoted some discussion to theimportance of social determinants of poverty, including the role of the rule of law.
2.95 Such findings reaffirm the need for greater promotion of comprehensive poverty reduction.strategies in Pakistan. These should seek to improve access to education and healthcare for the poor, andcritical disadvantaged groups such as women. Other policy implications owing to observations aboutdisadvantageous land tenures, and vulnerability to corruption and abuses of power in both the public andprivate sector - are somewhat less apparent. As noted earlier they are also potentially fraught withcontroversy since they touch on questions of political economy. Yet this does not make theseunderlying issues any less pressing. And even within the limited purview of this poverty assessment,suggestions have been made about the kind of administrative reforms that may mitigate their impact.
2.96 The simple correlations presented here are not sufficient to establish causal relationships betweenpoverty and vulnerability on the one hand, and the various factors associated with poverty on the other.Such causal relationships are however difficult to establish and doing so is arguably less important than
42
understanding how these various factors collectively determine cycles of poverty and vulnerability. The
next chapter will consider in greater detail, two important elements in this cycle, namely education and
health. It will examine the trends in these two vital dimensions of human development revealed by
household data, along with further discussing the factors - including economic status - that help explain
their relationship to the poverty outcomes observed in Pakistan.
' The regional workshop on poverty analysis and monitoring held in March, 2002 at Islamabad made substantialprogress in the direction of arriving at a consensus on the choice of poverty line.
See Annex 2.1 for information on the household surveys used for the analysis3 Since the definition of the household members in the two surveys is exactly the same, the main reason for thedifferences seem to lie in the field collection techniques. One factor seems to be that while HIES data werecollected by single male enumerators, interviewing mainly male household members, for PIHS there were both maleand female enumerators. Whereas the PIHS data on household structure and size are very similar to the findings ofthe 1998 Census, the HIES data of previous years appear to be out of trend, indicating that the increase in householdsizes in 1998-99 was a result of improved collection techniques.4 See Chapter 4 for a more detailed discussion on this issue.5 The poverty estimnates for Balochistan in 1998-99 are curiously out of trend from what is observed during the othersurvey years, and also contradicts what is generally known about the province vis-a-vis other provinces. The likelyproblems with the Balochistan data for this year will be discussed later.6 See Annex 2.2 for detailed discussion on the methodology of constructing expenditures and poverty lines7To ensure comparability, the expenditure aggregates for households were constructed using the same methodologyused in previous poverty work by the World Bank for Pakistan. See Annex 2.2 for details on how the consumptionexpenditure aggregate was constructed.8 Per adult equivalent is calculated by simply weighting all household members younger than 18 as 0.8, and all otherhousehold members as 19 See Lanjouw and Ravallion (1995), for a detailed analysis, using household data from Pakistan, of howadjustments for economies of scale crucially affect relationship between poverty and household size.10 Using this method, the poverty lines for urban and rural regions in 1998-99, are Rs. 767 and Rs. 680 respectively,in per equivalent adult terms.11 As defined in Gazdar et al (1994)12 "100 percent" denoting the poverty lines used in the report's calculations so far.13 The so-called growth component of poverty change measures how much of the change in poverty measures is dueto the variation in mean expenditure (in per equivalent adult terms) over time, holding the distribution constant. Onthe other hand, the so-called redistribution component assesses how much of the variation in poverty measures isdue to a change in the distribution of expenditure, holding the mean expenditure constant (see Appendix formethodology; also see Ravallion and Datt (1992).14 For example, from 1993-94 to 1996-97, the growth effect by increasing poverty, almost cancelled out theredistribution effect that reduced poverty. From 1996-97 to 1998-99, however the negative impact of theredistribution effect swamped the poverty-reducing effect of growth. I15 Consider a time horizon (T) of three periods and let the initial period be t. The probability that a household'sexpenditure level will fall below the poverty line at least once within the following three periods is given by: Vi, (T,Poverty line) = P(At least one period of poverty). A household i is then classified as vulnerable at time t if thevulnerability measure, V¾t, exceeds some threshold value V0 (which, for the analysis here, is taken as 0.5). Vat isobtained by conditioning future probabilities of poverty on outcomes in previous periods (see Annex 2.6 for detailson how the measure was constructed)16 The analysis is based on the IFPRI rural panel study, comprising of a sample of just over 800 households in 4districts, over a 5 year period between 1986 and 1991.17 See Annex 2.6 for details on the methodology of measuring vulnerability, and more detailed results.13 The definition follows Jalan and Ravallion (1998).19 For the categories of owner-cultivator and sharecropper, share of population in urban areas are too low to beconsidered separately (2.6% and 0.9% respectively).20 It should be noted that some of the employment categories as defined here are too heterogeneous, e.g. the category"paid employee", which includes a diverse array of occupations, from wage labor to professionals. Furtherrefinement of these categories by information on occupation would be needed for more rigorous analysis.
43
21 The relationship between poverty and land ownership is obviously more meaningful for the rural sector, since inurban areas only about 9 percent of people belong to households owning any agricultural land at all (Table 2.9)22 Dependency ratio is measured by the ratio of number of household members of age 14 and less or of age 65 ormore, to the number of members of age 15 to 64.23 In this context, it is also useful to note that higher poverty rates tends to be associated with larger household sizes,although this is at least partly a result of household expenditures not being adjusted for economies of scale inconsumption. With such adjustment, the difference in average household size between the poor and the non-poorbecomes smaller. That said, for reasonable values of the scale parameter, the average poor household is stillmarginally larger than the non-poor household (see Table A-2.lO, Annex).24 Price increases of food and fuel, given the stringent budget constraints of the poor, may lead to reducedconsumption resulting in greater poverty. But even before that happens, given that the demand for essential goodslike food and fuel are likely to be relatively inelastic, increase in their prices may lead to even lower expenditures onhealth and education, with long-term consequences for poverty and vulnerability.25 See Figure A-2.3, Annex26 See Chapter 1 of this report27 See Table 5, Easterly (2001), Background Paper for the Pakistan Poverty Assessment 200128 Notably, the policy response that is called for is distinct: in the first case, the optimal response would be forgovernment to demolish the jails; in the second case, the optimal response is to provide lower cost contractenforcement services in rural areas.
44
3. Focus on Human Development: The Benefits and PoliticalEconomy of Health and Education
3.1 The poverty analysis in Chapter 2 provides some indication of the nature and extent of poverty inPakistan, not just as a measure of consumption, but also as ar; index of human development. Educationalattainment and health are among the most valuable benefits of such development and are also- since theyconstitute vital investments in human capital - important determinants of whether someone living inpoverty is likely to improve their circumstances. In aggregate, the educational attainment and health ofPakistan's population is therefore crucial to the country's ability to grow economically, and alleviatepoverty.
3.2 This chapter charts its progress in education and health during the 1990s, primarily usinghousehold data from the Pakistan Integrated Household Survey (PIHS), and the new survey conductedunder the aegis of this report.' The evidence presented quantifies the significant effect that trends ineducation and health have exerted on the welfare and long-term economic potential of households. It alsopermits a systematic investigation of household characteristics that seem to explain differences in theeducational attainment and health of its members - characteristics that need to be considered in the designand targeting of policy interventions.
3.3 The urgency for intervention has grown during the 1990s. Some indicators like infant mortalityand contraception awareness and usage have posted significant gains, however, significant challengesremain among health indicators that are lagging behind. One of the most salient trends noted is the factthat while the primary gross enrollment rate (GER) in Pakistan improved until the middle of the decade, itthen stagnated. Throughout, enrollment showed significant rural/urban differences, with poorconstituents unsurprisingly faring the worst. While the gender gap in enrollment closed slightly, this wasin large part, due to some declines in male enrollments. While the significance of a rapid concomitantexpansion of private schooling is unclear, this is a phenomenon deserving further study.
3.4 The lack of improvement in education outcomes is particularly significant for poverty as theevidence suggests education does impact earnings in Pakistan, particularly in the urban economy, thoughit appears to yield less appreciable earnings benefits in rural areas. However, as widely observed,investments in education appear to yield strong household externalities, and among factors that determinewhether children stay in school, parental education is the most important. Some direct policyimplications follow on these observations. Particularly, the importance of targeting education benefits toensure as wide coverage as possible, because of the high household extemalities that can accrue if evenonly one family member is educated.
3.5 As discussed in Chapter 1, the underlying obstacles to the provision of public services such aseducation and health in Pakistan are embedded in its political economy. Accordingly, the last section ofthe chapter addresses the issue of govemance and service provision, primarily using the case of education,where exhaustive data is available, as an example. The discussion, for example, identifies obstacles bothin the supply and demand of education, in the former case the formal and informal institutions that govempolitical decision making, and in the latter cultural attitudes that appear to depresses demand for educationin Pakistan, particularly for girls. The last section of chapter describes the potential for the ongoingdevolution reforms in Pakistan to address the institutional limitations on educational progress in the1990s. It highlights areas where they may be particular windows for change, as well as some of thepractical limitations on reforms.
45
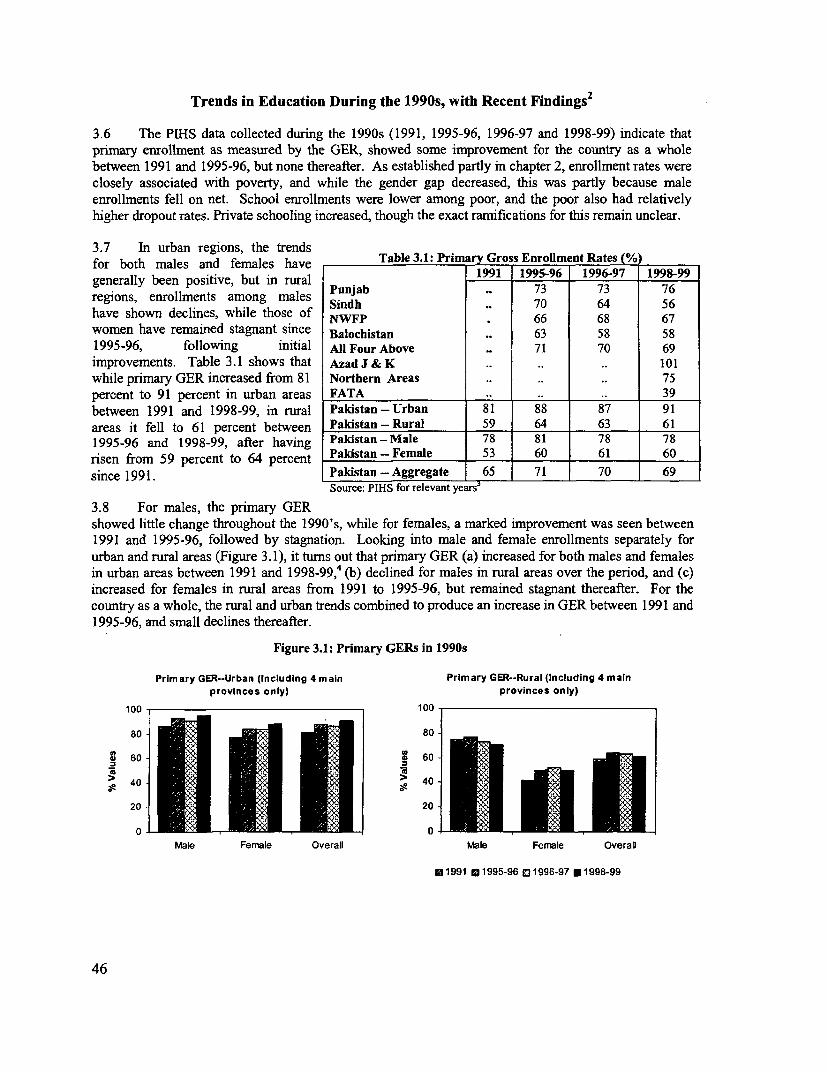
Trends in Education During the 1990s, with Recent Findings2
3.6 The PIUS data collected during the 1990s (1991, 1995-96, 1996-97 and 1998-99) indicate thatprimary enrollment as measured by the GER, showed some improvement for the country as a wholebetween 1991 and 1995-96, but none thereafter. As established partly in chapter 2, enrollment rates wereclosely associated with poverty, and while the gender gap decreased, this was partly because maleenrollments fell on net. School enrollments were lower among poor, and the poor also had relativelyhigher dropout rates. Private schooling increased, though the exact ramifications for this remain unclear.
3.7 In urban regions, the trendsfor both males and females have Table 3.1: Primary Gross Enrollment Rates (%generally been positive, but in rural I 1991 1995-96 1996-97 1998-99regions, enrollments among males Punjab 73 73 76have shown declines, while those of NWFP . 66 68 67women have remained stagnant since Balochistan 63 58 581995-96, following initial All Four Above .. 71 70 69improvements. Table 3.1 shows that Azad J & K .. .. .. 101while primary GER increased from 81 Northern Areas .. .. .. 75percent to 91 percent in urban areas FATA .. .. .. 39between 1991 and 1998-99, in rural Pakistan - Urban 81 88 87 91areas it fell to 61 percent between Pakistan - Rural 59 64 63 611995-96 and 1998-99, after having Pakistan- Male 78 81 78 78risen from 59 percent to 64 percent Pakistan - Female 53 60 61 60since 1991. Pakistan - Aggregate 65 71 70 69
Source: PIHS for relevant years
3.8 For males, the primary GERshowed little change throughout the 1990's, while for females, a marked improvement was seen between1991 and 1995-96, followed by stagnation. Looking into male and female enrollments separately forurban and rural areas (Figure 3.1), it turns out that primary GER (a) increased for both males and femalesin urban areas between 1991 and 1998-99,4 (b) declined for males in rural areas over the period, and (c)increased for females in rural areas from 1991 to 1995-96, but remained stagnant thereafter. For thecountry as a whole, the rural and urban trends combined to produce an increase in GER between 1991 and1995-96, and small declines thereafter.
Figure 3.1: Primary GERs in 1990s
Primary GER--Urban (Including 4 main Primary GER--Rural (Including 4 mainprovinces only) provinces only)
100 100
0 0Male Female Overall Male Fermale Overall
0 1991 01995-96 Ej1996-97 *1998-99
46
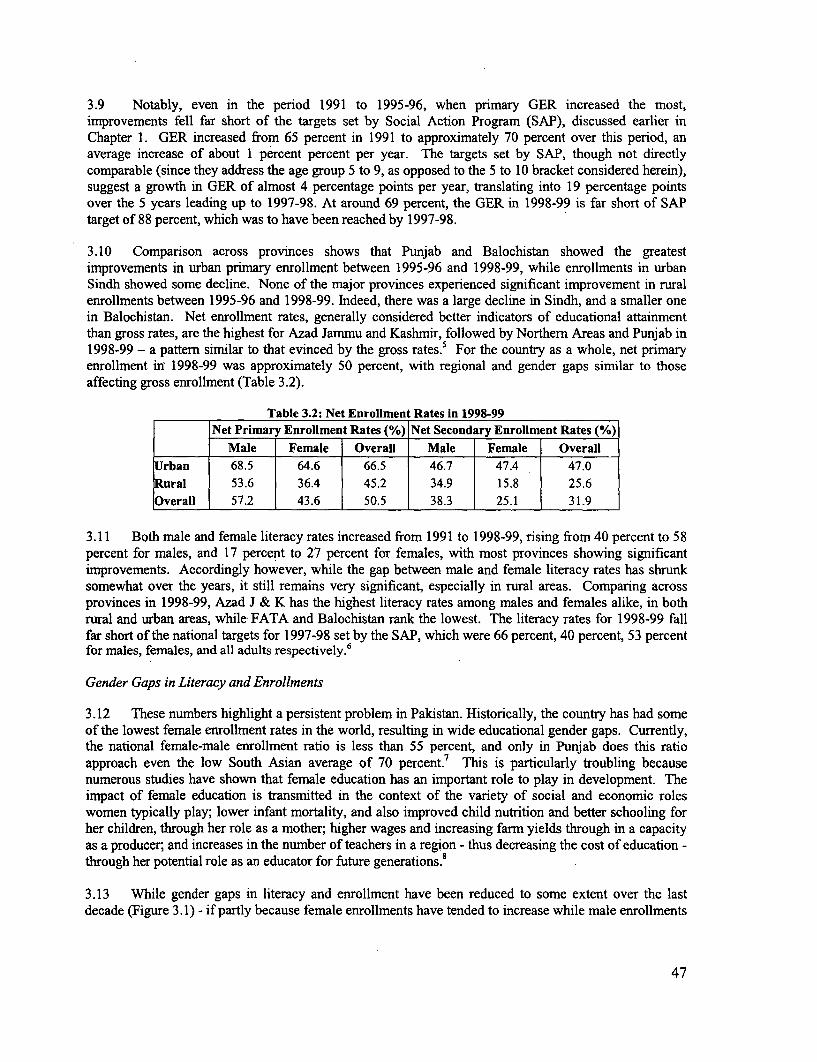
3.9 Notably, even in the period 1991 to 1995-96, when primary GER increased the most,improvements fell far short of the targets set by Social Action Program (SAP), discussed earlier inChapter 1. GER increased from 65 percent in 1991 to approximately 70 percent over this period, anaverage increase of about 1 percent percent per year. The targets set by SAP, though not directlycomparable (since they address the age group 5 to 9, as opposed to the 5 to 10 bracket considered herein),suggest a growth in GER of almost 4 percentage points per year, translating into 19 percentage pointsover the 5 years leading up to 1997-98. At around 69 percent, the GER in 1998-99 is far short of SAPtarget of 88 percent, which was to have been reached by 1997-98.
3.10 Comparison across provinces shows that Punjab and Balochistan showed the greatestimprovements in urban primary enrollment between 1995-96 and 1998-99, while enrollments in urbanSindh showed some decline. None of the major provinces experienced significant improvement in ruralenrollments between 1995-96 and 1998-99. Indeed, there was a large decline in Sindh, and a smaller onein Balochistan. Net enrollment rates, generally considered better indicators of educational attainmentthan gross rates, are the highest for Azad Jammu and Kashmir, followed by Northern Areas and Punjab in1998-99 - a pattern similar to that evinced by the gross rates.5 For the country as a whole, net primaryenrollment in 1998-99 was approximately 50 percent, with regional and gender gaps similar to thoseaffecting gross enrollment (Table 3.2).
Table 3.2: Net Enrollment Rates in 1998-99Net Primary Enrollment Rates (%) Net Secondary Enrollment Rates (%)
Male Female Overall Male Female OverallUrban 68.5 64.6 66.5 46.7 47.4 47.0Rural 53.6 36.4 45.2 34.9 15.8 25.6Overall 1 57.2 43.6 50.5 38.3 25.1 31.9
3.11 Both male and female literacy rates increased from 1991 to 1998-99, rising from 40 percent to 58percent for males, and 17 percent to 27 percent for females, with most provinces showing significantimprovements. Accordingly however, while the gap between male and female literacy rates has shrunksomewhat over the years, it still remains very significant, especially in rural areas. Comparing acrossprovinces in 1998-99, Azad J & K has the highest literacy rates among males and females alike, in bothrural and urban areas, while FATA and Balochistan rank the lowest. The literacy rates for 1998-99 fallfar short of the national targets for 1997-98 set by the SAP, which were 66 percent, 40 percent, 53 percentfor males, females, and all adults respectively.6
Gender Gaps in Literacy and Enrollments
3.12 These numbers highlight a persistent problem in Pakistan. Historically, the country has had someof the lowest female enrollment rates in the world, resulting in wide educational gender gaps. Currently,the national female-male enrollment ratio is less than 55 percent, and only in Punjab does this ratioapproach even the low South Asian average of 70 percent. This is particularly troubling becausenumerous studies have shown that female education has an important role to play in development. Theimpact of female education is transmitted in the context of the variety of social and economic roleswomen typically play; lower infant mortality, and also improved child nutrition and better schooling forher children, through her role as a mother; higher wages and increasing farm yields through in a capacityas a producer; and increases in the number of teachers in a region - thus decreasing the cost of education -through her potential role as an educator for future generations.!
3.13 While gender gaps in literacy and enrollment have been reduced to some extent over the lastdecade (Figure 3.1) - if partly because female enrollments have tended to increase while male enrollments
47
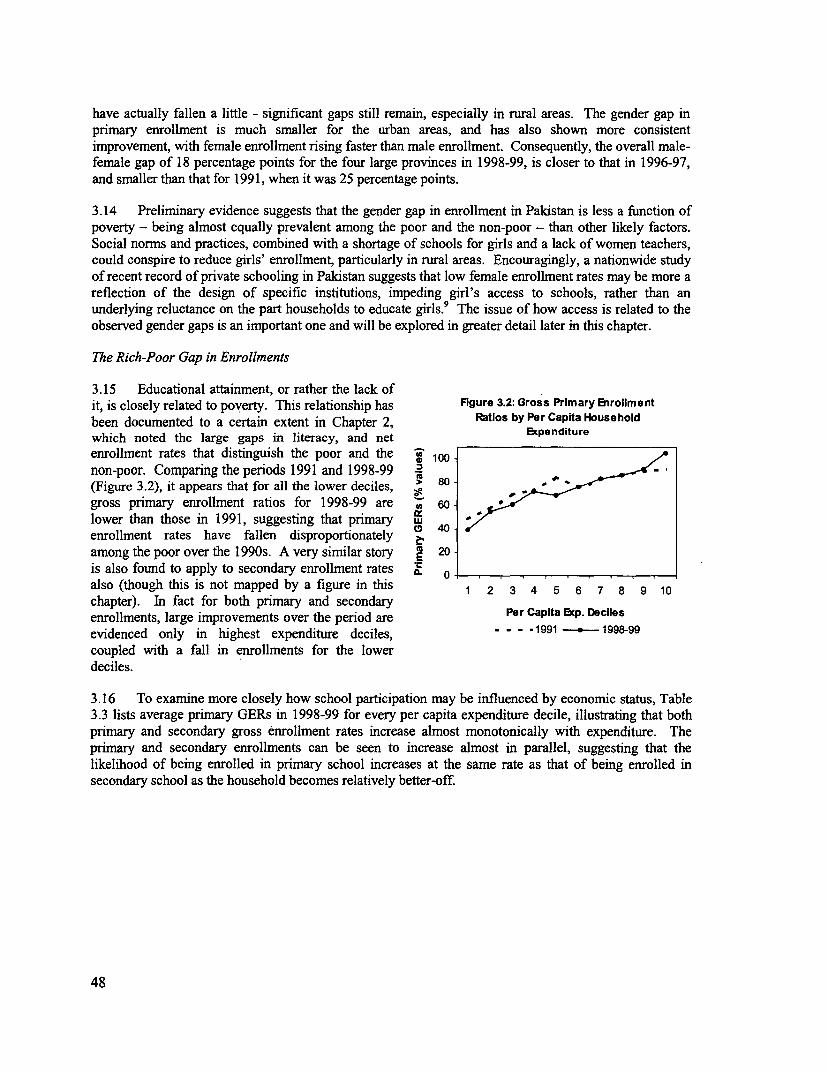
have actually fallen a little - significant gaps still remain, especially in rural areas. The gender gap inprimary enrollment is much smaller for the urban areas, and has also shown more consistentimprovement, with female enrollment rising faster than male enrollment. Consequently, the overall male-female gap of 18 percentage points for the four large provinces in 1998-99, is closer to that in 1996-97,and smaller than that for 1991, when it was 25 percentage points.
3.14 Preliminary evidence suggests that the gender gap in enrollment in Pakistan is less a function ofpoverty - being almost equally prevalent among the poor and the non-poor - than other likely factors.Social norms and practices, combined with a shortage of schools for girls and a lack of women teachers,could conspire to reduce girls' enrollment, particularly in rural areas. Encouragingly, a nationwide studyof recent record of private schooling in Pakistan suggests that low female enrollment rates may be more areflection of the design of specific institutions, impeding girl's access to schools, rather than anunderlying reluctance on the part households to educate girls.9 The issue of how access is related to theobserved gender gaps is an important one and will be explored in greater detail later in this chapter.
The Rich-Poor Gap in Enrollments
3.15 Educational attainment, or rather the lack ofit, is closely related to poverty. This relationship has Figure 3.2: Gross Primary inrollmentbeen documented to a certain extent in Chapter 2, Ratios by Per Capita Householdwhich noted the large gaps in literacy, and net Bcpenditureenrollment rates that distinguish the poor and the 1 100non-poor. Comparing the periods 1991 and 1998-99 '_(Figure 3.2), it appears that for all the lower deciles, 80-gross primary enrollment ratios for 1998-99 are 60lower than those in 1991, suggesting that primary
CD 40-enrollment rates have fallen disproportionately 2%among the poor over the 1 990s. A very similar story 10 20is also found to apply to secondary enrollment rates f __-
also (though this is not mapped by a figure in this 1 2 3 4 5 6 7 8 9 10chapter). In fact for both primary and secondaryenrollments, large improvements over the period are Per capita ep9 Decilesevidenced only in highest expenditure deciles, ' ' -1991 199&9coupled with a fall in enrollments for the lowerdeciles.
3.16 To examine more closely how school participation may be influenced by economic status, Table3.3 lists average primary GERs in 1998-99 for every per capita expenditure decile, illustrating that bothprimary and secondary gross enrollment rates increase almost monotonically with expenditure. Theprimary and secondary enrollments can be seen to increase almost in parallel, suggesting that thelikelihood of being enrolled in primary school increases at the same rate as that of being enrolled insecondary school as the household becomes relatively better-off.
48
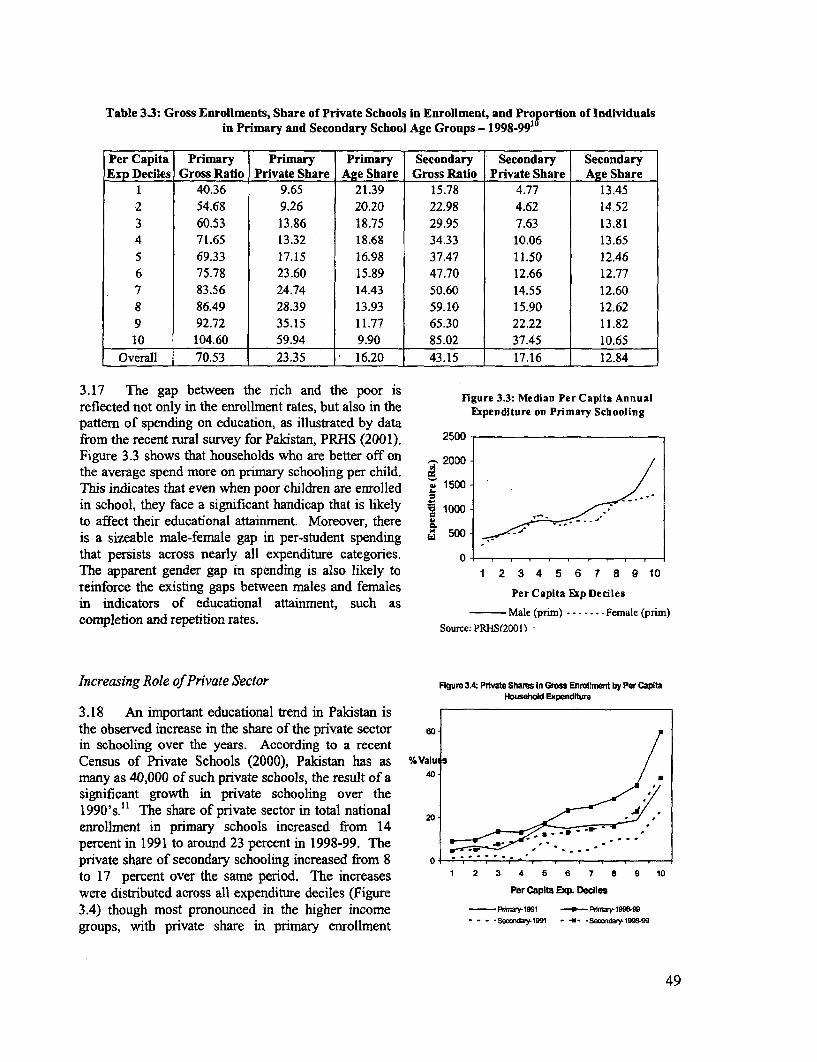
Table 3.3: Gross Enrollments, Share of Private Schools in Enrollment, and Pro ortion of Individualsin Primary and Secondary School Age Groups - 1998-991
Per Capita Primary Primary Primary Secondary Secondary SecondaryExp Deciles Gross Ratio Private Share Age Share Gross Ratio Private Share Age Share
1 40.36 9.65 21.39 15.78 4.77 13.452 54.68 9.26 20.20 22.98 4.62 14.523 60.53 13.86 18.75 29.95 7.63 13.814 71.65 13.32 18.68 34.33 10.06 13.655 69.33 17.15 16.98 37.47 11.50 12.466 75.78 23.60 15.89 47.70 12.66 12.777 83.56 24.74 14.43 50.60 14.55 12.608 86.49 28.39 13.93 59.10 15.90 12.629 92.72 35.15 11.77 65.30 22.22 11.8210 104.60 59.94 9.90 85.02 37.45 10.65
Overall 70.53 23.35 16.20 43.15 17.16 12.84
3.17 The gap between the rich and the poor isFlgure 3.3: Median Per Capita Annual
reflected not only in the enrollment rates, but also in the Expenditure on Primary Schoolingpattern of spending on education, as illustrated by datafrom the recent rural survey for Pakistan, PRHS (2001). 2500-Figure 3.3 shows that households who are better off on , 2000the average spend more on primary schooling per child. /This indicates that even when poor children are enrolled , 1500in school, they face a significant handicap that is likely , 1000 -to affect their educational attainment. Moreover, there :is a sizeable male-female gap in per-student spending rw 5 *
that persists across nearly all expenditure categories. 0oThe apparent gender gap in spending is also likely to 1 2 3 4 5 6 7 8 9 10reinforce the existing gaps between males and females Per Capita Exp Decilesin indicators of educational attainment, such ascompletion and repetition rates. SouMce: P(eS(2001 re
Increasing Role ofPrivate Sector Figum 3.4 Prvate Shanms In Gross Enrolment by Per CapitaHousehold ExpenditLre
3.18 An important educational trend in Pakistan isthe observed increase in the share of the private sector 60rin schooling over the years. According to a recentCensus of Private Schools (2000), Pakistan has as %Valusmany as 40,000 of such private schools, the result of a 40,
significant growth in private schooling over the1990's." The share of private sector in total national i/enrollment in primary schools increased from 14percent in 1991 to around 23 percent in 1998-99. Theprivate share of secondary schooling increased from 8 o- - 7 .to 17 percent over the same period. The increases 1 2 3 4 5 6 7 8 9 10
were distributed across all expenditure deciles (Figure Per Capita Exp. Dedles
3.4) though most pronounced in the higher income --- MnY1991 -.-"P&Wr-19589
groups, with private share in primary enrollment - - - ses191 -- _ seoarM9eB-
49
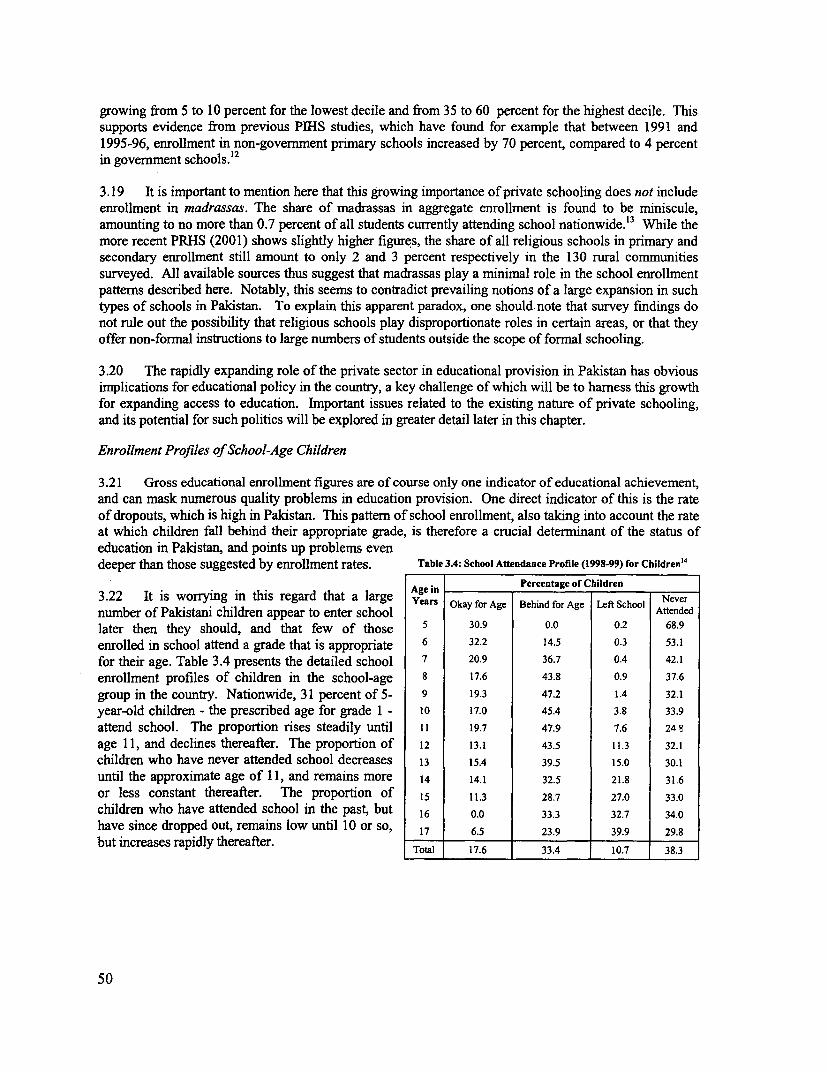
growing from 5 to 10 percent for the lowest decile and from 35 to 60 percent for the highest decile. Thissupports evidence from previous PIHS studies, which have found for example that between 1991 and1995-96, enrollment in non-government primary schools increased by 70 percent, compared to 4 percentin government schools.'2
3.19 It is important to mention here that this growing importance of private schooling does not includeenrollment in madrassas. The share of madrassas in aggregate enrollment is found to be miniscule,amounting to no more than 0.7 percent of all students currently attending school nationwide. 13 While themore recent PRHS (2001) shows slightly higher figures, the share of all religious schools in primary andsecondary enrollment still amount to only 2 and 3 percent respectively in the 130 rural communitiessurveyed. All available sources thus suggest that madrassas play a minimal role in the school enrollmentpatterns described here. Notably, this seems to contradict prevailing notions of a large expansion in suchtypes of schools in Pakistan. To explain this apparent paradox, one should note that survey findings donot rule out the possibility that religious schools play disproportionate roles in certain areas, or that theyoffer non-formal instructions to large numbers of students outside the scope of formal schooling.
3.20 The rapidly expanding role of the private sector in educational provision in Pakistan has obviousimplications for educational policy in the country, a key challenge of which will be to harness this growthfor expanding access to education. Important issues related to the existing nature of private schooling,and its potential for such politics will be explored in greater detail later in this chapter.
Enrollment Profiles of School-Age Children
3.21 Gross educational enrollment figures are of course only one indicator of educational achievement,and can mask numerous quality problems in education provision. One direct indicator of this is the rateof dropouts, which is high in Pakistan. This pattern of school enrollment, also taking into account the rateat which children fall behind their appropriate grade, is therefore a crucial determinant of the status ofeducation in Pakistan, and points up problems evendeeper than those suggested by enrollment rates. Table 3.4: School Attendance Profile (1998-99) for Children14
Percentage of Children3.22 It is worrying in this regard that a large AYears Okay for Age Behind for Age Left School Nevernumber of Pakistani children appear to enter school Attendedlater then they should, and that few of those 5 30.9 0.0 0.2 68.9
enrolled in school attend a grade that is appropriate 6 32.2 14.5 0.3 53.1for their age. Table 3.4 presents the detailed school 7 20.9 36.7 0.4 42.1enrollment profiles of children in the school-age 8 17.6 43.8 0.9 37.6
group in the country. Nationwide, 31 percent of 5- 9 19.3 47.2 1.4 32.1year-old children - the prescribed age for grade 1 - 10 17.0 45.4 3.8 33.9
attend school. The proportion rises steadily until I1 19.7 47.9 7.6 24 Q
age 11, and declines thereafter. The proportion of 12 13.1 43.5 11.3 32.1children who have never attended school decreases 13 15.4 39.5 15.0 30.1
until the approximate age of 11, and remains more 14 14.1 32.5 21.8 31.6or less constant thereafter. The proportion of 15 11.3 28.7 27.0 33.0children who have attended school in the past, but 16 0.0 33.3 32.7 34.0
have since dropped out, remains low until 10 or so, 17 6.5 23.9 39.9 29.8but increases rapidly thereafter. Tota 17.6 33.4 10.7 38.3
50
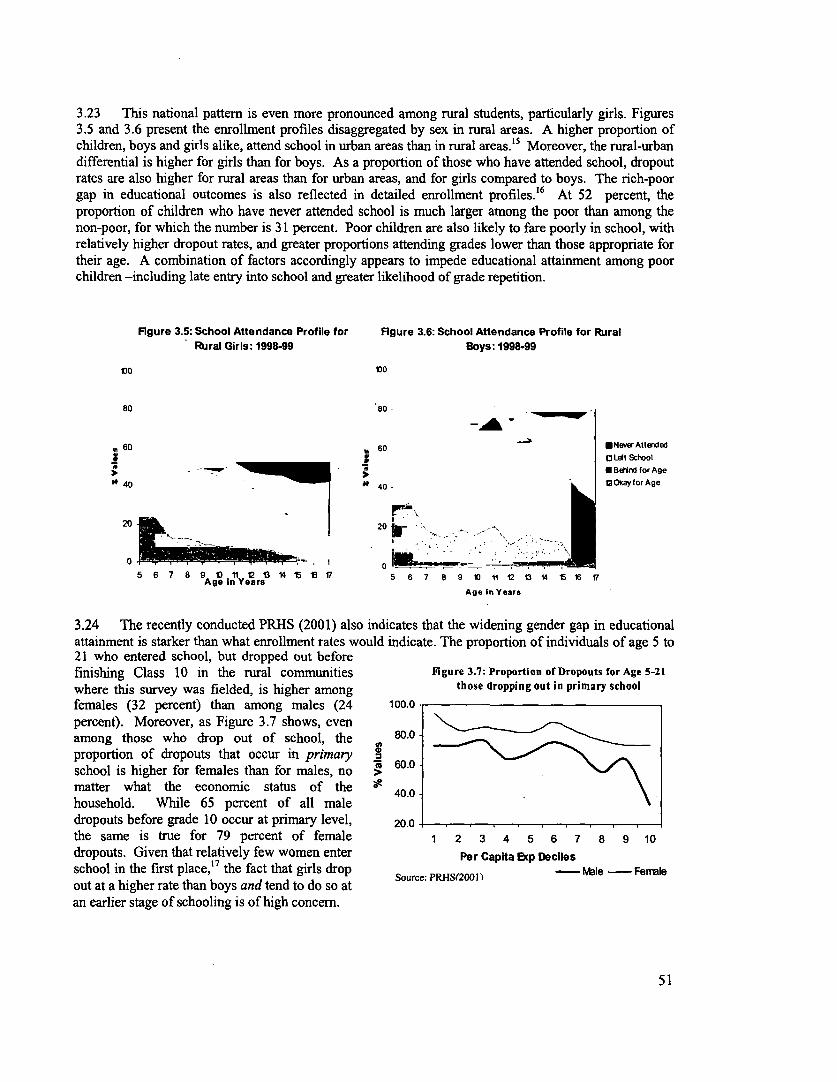
3.23 This national pattern is even more pronounced among rural students, particularly girls. Figures
3.5 and 3.6 present the enrollment profiles disaggregated by sex in rural areas. A higher proportion of
children, boys and girls alike, attend school in urban areas than in rural areas.'5 Moreover, the rural-urban
differential is higher for girls than for boys. As a proportion of those who have attended school, dropout
rates are also higher for rural areas than for urban areas, and for girls compared to boys. The rich-poor
gap in educational outcomes is also reflected in detailed enrollment profiles.'6 At 52 percent, the
proportion of children who have never attended school is much larger among the poor than among the
non-poor, for which the number is 31 percent. Poor children are also likely to fare poorly in school, with
relatively higher dropout rates, and greater proportions attending grades lower than those appropriate for
their age. A combination of factors accordingly appears to impede educational attainment among poor
children -including late entry into school and greater likelihood of grade repetition.
Figure 3.5: School Attendance Profile for Figure 3.6: School Attendance Profile for Rural
Rural Girls: 1998-99 Boys: 1998-99
tD0 100
80 80
, 60 H 60 *NeverAttended
3 3 IJtdt Scool- BeHrn for Age
" 0 40 M OkayforAge
20 20
5 6 7 8 Age" in Years t 5 6 7 8 9 tD 11 12 tt 151 17Ago n Years
Age In Years
3.24 The recently conducted PRHS (2001) also indicates that the widening gender gap in educational
attainment is starker than what enrollment rates would indicate. The proportion of individuals of age 5 to
21 who entered school, but dropped out beforefinishing Class 10 in the rural communities Figure 3.7: Proportion of Dropouts for Age 5-21
where this survey was fielded, is higher among those dropping out in primary school
females (32 percent) than among males (24 100.0
percent). Moreover, as Figure 3.7 shows, evenamong those who drop out of school, the 80.0
proportion of dropouts that occur in primarymyschool is higher for females than for males, no >
matter what the economic status of the W400household. While 65 percent of all maledropouts before grade 10 occur at primary level, 20.0 . . . . . .
the same is true for 79 percent of female 1 2 3 4 5 6 7 8 9 10
dropouts. Given that relatively few women enter Per Capita Bcp Deciles
school in the first place,' 7 the fact that girls drop Source: PRHS(20011) Nble - Ferale
out at a higher rate than boys and tend to do so atan earlier stage of schooling is of high concern.
51
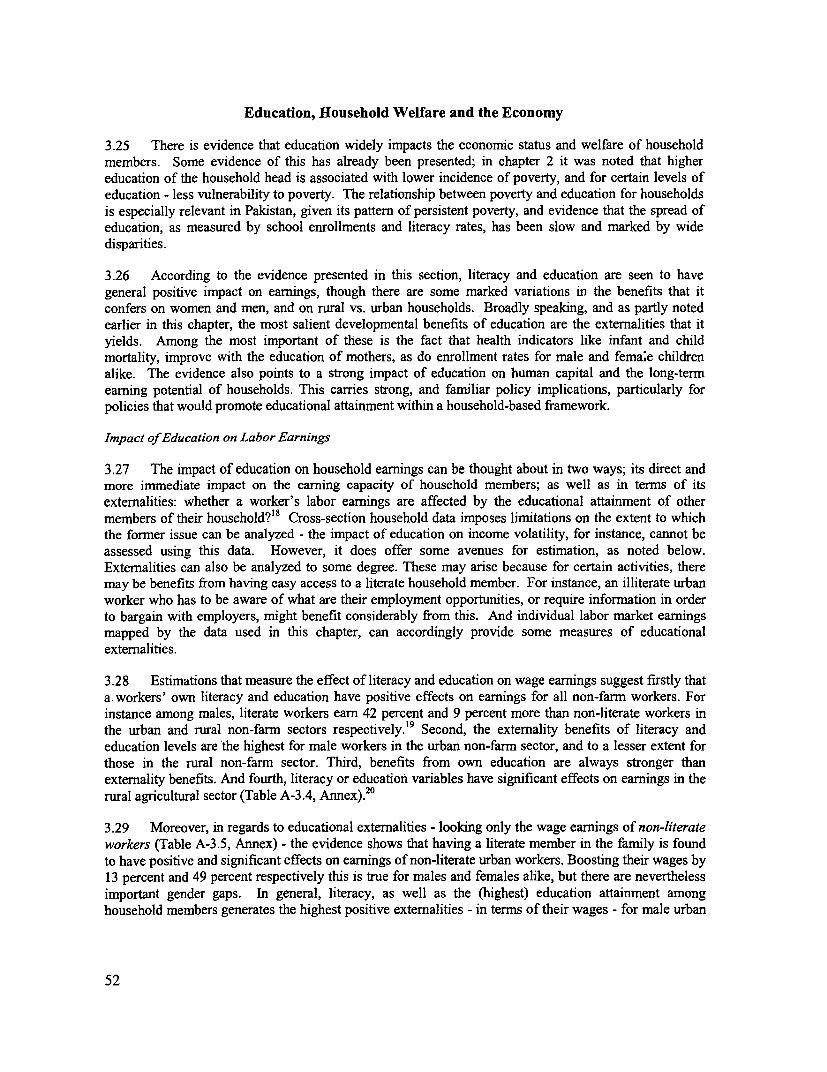
Education, Household Welfare and the Economy
3.25 There is evidence that education widely impacts the economic status and welfare of householdmembers. Some evidence of this has already been presented; in chapter 2 it was noted that highereducation of the household head is associated with lower incidence of poverty, and for certain levels ofeducation - less vulnerability to poverty. The relationship between poverty and education for householdsis especially relevant in Pakistan, given its pattern of persistent poverty, and evidence that the spread ofeducation, as measured by school enrollments and literacy rates, has been slow and marked by widedisparities.
3.26 According to the evidence presented in this section, literacy and education are seen to havegeneral positive impact on earnings, though there are some marked variations in the benefits that itconfers on women and men, and on rural vs. urban households. Broadly speaking, and as partly notedearlier in this chapter, the most salient developmental benefits of education are the externalities that ityields. Among the most important of these is the fact that health indicators like infant and childmortality, improve with the education of mothers, as do enrollment rates for male and fema;e childrenalike. The evidence also points to a strong impact of education on human capital and the long-termearning potential of households. This carries strong, and familiar policy implications, particularly forpolicies that would promote educational attainment within a household-based framework.
Impact of Education on Labor Earnings
3.27 The impact of education on household earnings can be thought about in two ways; its direct andmore immediate impact on the earning capacity of household members; as well as in terms of itsexternalities: whether a worker's labor earnings are affected by the educational attainment of othermembers of their household?'8 Cross-section household data imposes limitations on the extent to whichthe former issue can be analyzed - the impact of education on income volatility, for instance, cannot beassessed using this data. However, it does offer some avenues for estimation, as noted below.Externalities can also be analyzed to some degree. These may arise because for certain activities, theremay be benefits from having easy access to a literate household member. For instance, an illiterate urbanworker who has to be aware of what are their employment opportunities, or require information in orderto bargain with employers, might benefit considerably from this. And individual labor market earningsmapped by the data used in this chapter, can accordingly provide some measures of educationalexternalities.
3.28 Estimations that measure the effect of literacy and education on wage earnings suggest firstly thata. workers' own literacy and education have positive effects on earnings for all non-farm workers. Forinstance among males, literate workers earn 42 percent and 9 percent more than non-literate workers inthe urban and rural non-farm sectors respectively.' 9 Second, the externality benefits of literacy andeducation levels are the highest for male workers in the urban non-farm sector, and to a lesser extent forthose in the rural non-farm sector. Third, benefits from own education are always stronger thanexternality benefits. And fourth, literacy or education variables have significant effects on earnings in therural agricultural sector (Table A-3.4, Annex). 20
3.29 Moreover, in regards to educational externalities - looking only the wage earnings of non-literateworkers (Table A-3.5, Annex) - the evidence shows that having a literate member in the family is foundto have positive and significant effects on earnings of non-literate urban workers. Boosting their wages by13 percent and 49 percent respectively this is true for males and females alike, but there are neverthelessimportant gender gaps. In general, literacy, as well as the (highest) education attainment amonghousehold members generates the highest positive externalities - in terms of their wages - for male urban
52
workers. In comparison, externalities are generally weaker for female wage earners, and for the ruralnon-farm sector compared to the urban sector; they are non-existent for the rural farm sector.2 '
3.30 The pattern of education being more important for wage earnings in the non-farm sector isconsistent with what one would reasonably expect, given that wage earners in the farm sector are likely toconsist mostly of daily wage labor engaged in activities with low or non-existent returns to education.The pattern of education having higher direct retums and externalities on earnings in the urban sector,compared to rural areas, is also consistent with expectations, since urban areas are likely to offer greaterrange of opportunities to workers with more education, or are better-informed about job opportunities (asa result of having educated members in the household). 22
3.31 With some qualifications, these findings are also consistent with the notion that education canimprove opportunities for workers in the often better-paying non-farm sector. Workers being educatedand literate are found to increase the probability that rural male and female workers alike participate inthe non-farm sector vis-A-vis the farm sector. Education also confers extemalities in this regard, but asnoted earlier, these seem to accrue less to women while having a literate member in the household makes
it more likely for a rural male illiterate worker to participate in the non-farm sector, it has little effect onthe participation of rural women in either sector.
3.32 Therefore, not only do literacy and the level of education of a worker matter for earnings, theeducational attainment of other household members can also confer sizeable positive externalities in thenon-agricultural labor market. This evidence of intra-household externalities carries an important policyimplication - namely that the spread or the distribution of literacy and education among the populationcan have a powerful impact on their welfare. A household with no education among any of its membersmay benefit from even one member gaining access to education, beyond the immediate gains to thatparticular individual. And this not only in terms of improvements to health and education of the family'schildren, but also in terms of better immediate earning opportunities for other members. Householdfocused policies must however grapple with the gender dimension of this phenomenon, since womenseem to benefit less from the earning externalities than do men.
What Determines Participation in Schooling?
3.33 Given the importance of education in determining earnings and economic status, and in the lightof the deficiencies in enrollments and attendance profiles identified so far, it is important to identify thefactors that help explain participation in schooling. The evidence suggests enrollment is linked strongly
to parent's education, both that of the mother and father. It is also linked to the ease of access, andproximity, to schools. However, no definite causality can be established in these regards. This alsounderlines the additional difficulty of distinguishing methodologically the extent to which lack of demandfor or supply of schooling is the determinant culprit. While subjective responses lifted from the PIHShousehold survey offer a glimpse at the kind of factors respondents themselves use to explain why the
children in question have never attended, or dropped out of school, these also reflect this ambiguity (Box3.1).
53
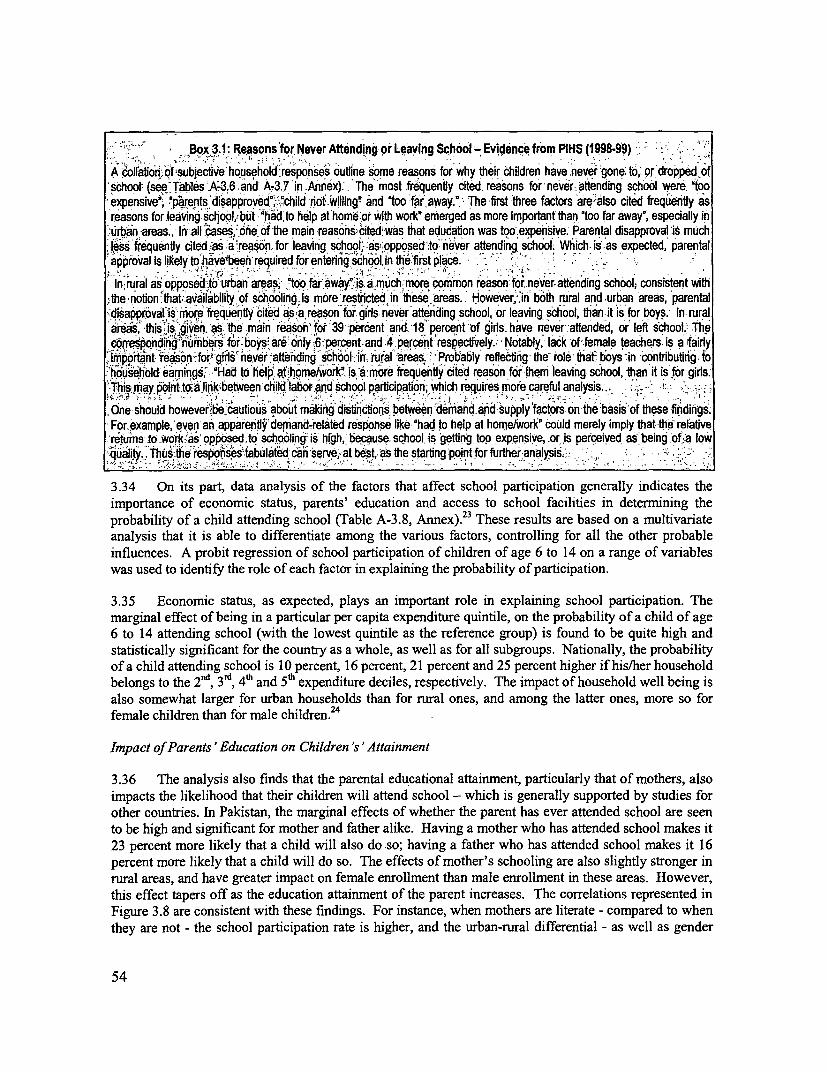
Box 3.1: Reasons'for NeverAfttendingor L.e,avig School-Evidencjfrom PIHS9(1998.9)
A .olla'oni.of,subjective household :responses outline some reasons for why their children have never gone; to;' or dropped of'school (see. Tabl6s' A3.6 -and A-3.7 'in Annex). . Thrmost frequenty cited reasons for inever attending school were. "tooexpensive', 'parents disapproved", "..child nifot1WillingD and "too far away.',- The first 'three factors arealso' cited frequ"e'ntly asreasons for .leaving school,but b hadS to help at 'home pr w,ith work" emerged as more important than 'too far away, especially in
-urban areas.. In all'cases, ohe of the main reasons'bited was-that education was too.expensive. Parental disapproval is much.less frequently cited.as,a'reason for leavirig schooi,- .as':opposed :to':ne'ver attending school; Which. is' as expected, parentalappro'val is likely to'havetbeen required for entering sc6hool, in th6e'first p!ace. . -.
n. ,wb mrd'- n n6or-afendin schol,,cnsistnt w .th
In rural as opposed to urbah' areas, "too far a mu more'common reason for.never attending school, consistent wit,the, rotion that` avaiiability of schoolingJis .more restricted in-these areas.. However, in b6th rural and urban areas, parental'disappr.oval is more frequentiy cited as a reason for girls never attending school, or leaving, school, than it is for boys. In- ruralareas, -thlsjsa,gisen.as the main reason for 3 percent and:18"percent of girs. have never.attended, or left school. The
'resordungnumbeirs for'boys,',are-oily;6-percent-and 4 percent respectively: Notably, lack of.female teachers. is a fairlyhmpousehol feasni "Hfo ad g tioehyerlattending shoo:irrs rura m areas. robabiy refietting the- role thaf toysln contributirig to
'ho'us'ehold'eamings' -."Had to atihomelworKfrequentlycited reason for them leaving school, than it is for-girls:'hi -,may ~ibt to.aoliirk'betwen childlab.or, and'chool participation; which requires more careful analysis..,
,Onb should however be.cautious about maki'nig dstindtiorh s, between 'deand ad-supplyfa,ct,orson the basis'of these findiigsFor.example,'even an apparehtly'derrand-related response like,"had to help at home/work'" could merely imply that the relativertums to work 'as opposed io schooling is' h[gh,' becauserschool,is 'getting, too expensive, .or is perceived as eing Cofa lowqiiuality.; .Thus the rsespoh tsiabulated; cah serve,-at bt as -the startng :point-frfurther 'analysis.
3.34 On its part, data analysis of the factors that affect school participation generally indicates theimportance of economic status, parents' education and access to school facilities in determining theprobability of a child attending school (Table A-3.8, Annex).2 3 These results are based on a multivariateanalysis that it is able to differentiate among the various factors, controlling for all the other probableinfluences. A probit regression of school participation of children of age 6 to 14 on a range of variableswas used to identify the role of each factor in explaining the probability of participation.
3.35 Economic status, as expected, plays an important role in explaining school participation. Themarginal effect of being in a particular per capita expenditure quintile, on the probability of a child of age6 to 14 attending school (with the lowest quintile as the reference group) is found to be quite high andstatistically significant for the country as a whole, as well as for all subgroups. Nationally, the probabilityof a child attending school is 10 percent, 16 percent, 21 percent and 25 percent higher if his/her householdbelongs to the 2nd, 3rd, 4' and 5h expenditure deciles, respectively. The impact of household well being isalso somewhat larger for urban households than for rural ones, and among the latter ones, more so forfemale children than for male children.2 4
Impact of Parents 'Education on Children 's 'Attainment
3.36 The analysis also finds that the parental educational attainment, particularly that of mothers, alsoimpacts the likelihood that their children will attend school - which is generally supported by studies forother countries. In Pakistan, the marginal effects of whether the parent has ever attended school are seento be high and significant for mother and father alike. Having a mother who has attended school makes it23 percent more likely that a child will also do so; having a father who has attended school makes it 16percent more likely that a child will do so. The effects of mother's schooling are also slightly stronger inrural areas, and have greater impact on female enrollment than male enrollment in these areas. However,this effect tapers off as the education attainment of the parent increases. The correlations represented inFigure 3.8 are consistent with these findings. For instance, when mothers are literate - compared to whenthey are not - the school participation rate is higher, and the urban-rural differential - as well as gender
54
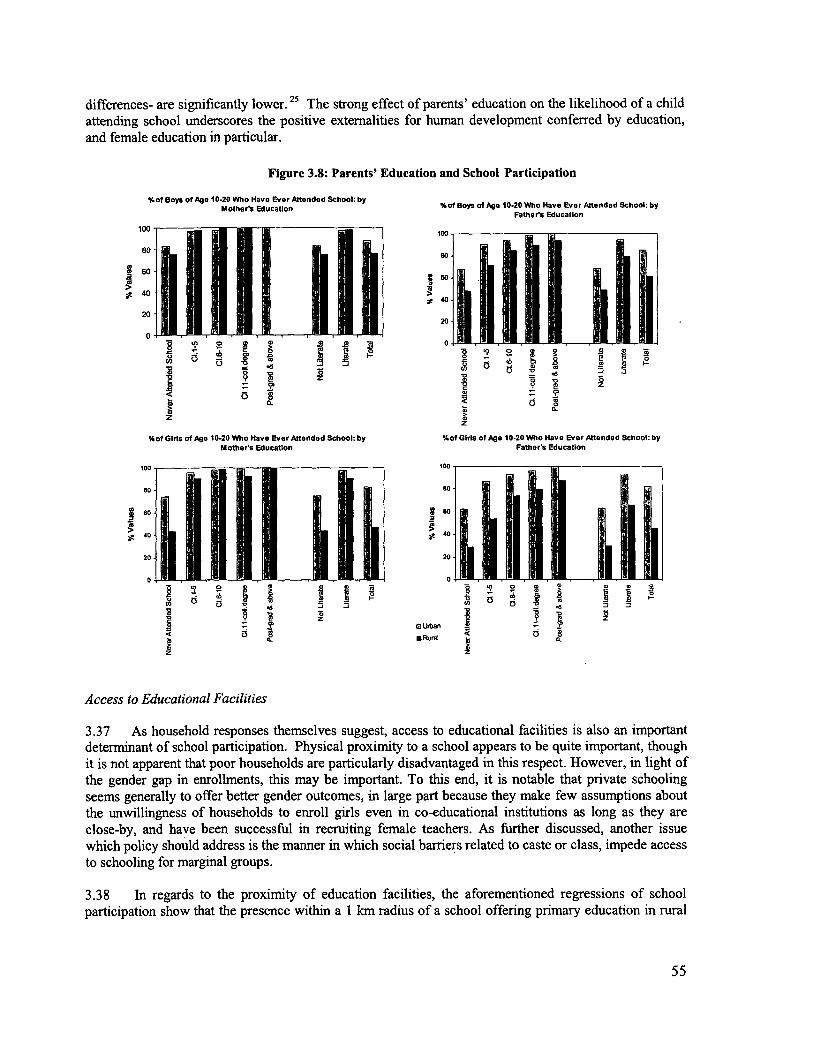
differences- are significantly lower. 25 The strong effect of parents' education on the likelihood of a childattending school underscores the positive extemalities for human development conferred by education,and female education in particular.
Figure 3.8: Parents' Education and School Participation
%of Boys of Age 10-20 Who Have Ever Attended School: byMother's Education %of Boys of Age 10.20 Who Have Ever Attended School: by
Father's Education
100 0
8 0 u) 9°- D S 3
0~~~~~~~~~~~~~~~~~~~~~~8
_60 0~~~~~~~~~~~~~~~~~~~~~~6
40-
20~~~~~~~~~~~~~~~~~~~~4
20~~~~~~~~~~~~~~~~~~~~~~0~~~~~~~~2
Z~~ ~ Z a X
a~~~ S 3 Vo3n
0 0~~~~~~~~~0
0 fz~~~~~~~~~~~~~~~~~~~~~
z~~~~~~~~~~~~~
%of Girls of Age 10.20 WVho Have Ever Attended School: by %of Girls of Age 10-20 Who Have Ever Attended School: byMothers Education Fathers Education
3.7 Ashueodrponsstesleugs,acs taoedctoafcitessalonim rat
60 ~~~~~~~~~~~~~~~~Iso> 40
40 O~4
20 20
0
* B
t3~~~~~~~~~~~~~~F" IL~ua
I elz z
Access to Educational Facilities
3.37 As household responses themselves suggest, access to educational facilities is also an importantdeterminant of school participation. Physical proximity to a school appears to be quite important, thoughit is not apparent that poor households are particularly disadvantaged in this respect. However, in light ofthe gender gap in enrollments, this may be important. To this end, it is notable that private schoolingseems generally to offer better gender outcomes, in large part because they make few assumptions aboutthe unwillingness of households to enroll girls even in co-educational institutions as long as they areclose-by, and have been successful in recruiting female teachers. As further discussed, another issuewhich policy should address is the manner in which social barriers related to caste or class, impede accessto schooling for marginal groups.
3.38 In regards to the proximity of education facilities, the aforementioned regressions of schoolparticipation show that the presence within a I km radius of a school offering primary education in rural
55
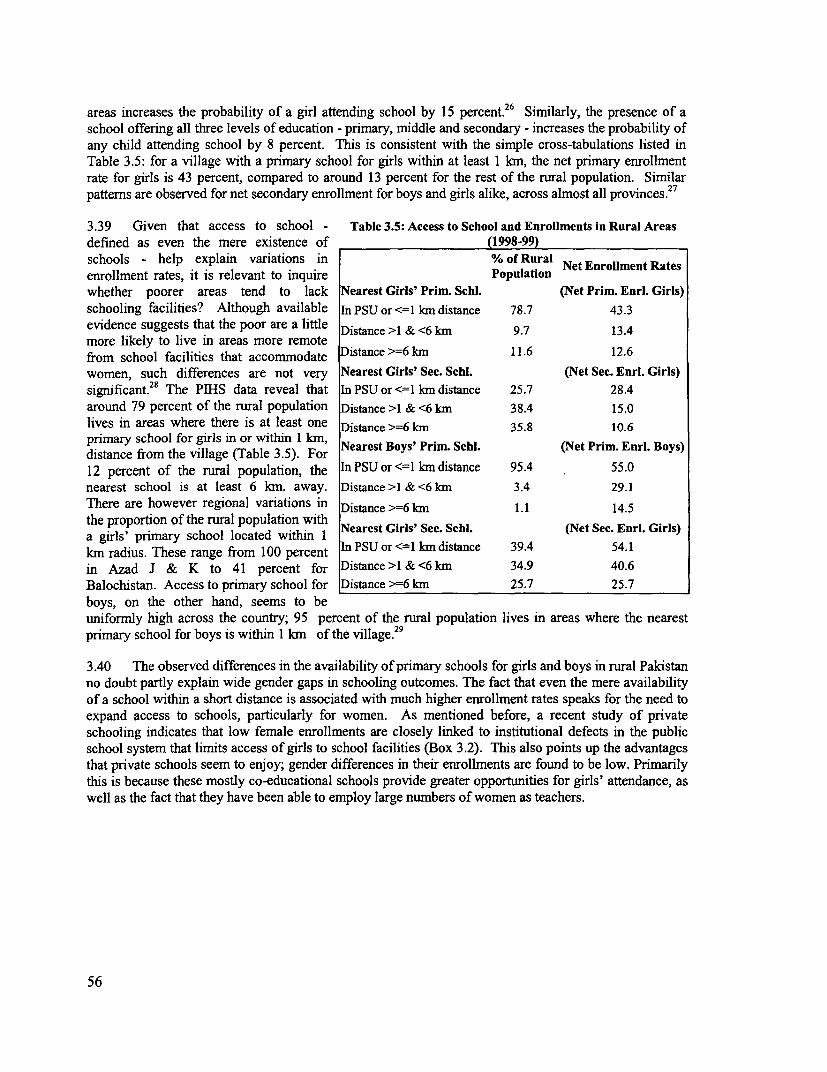
areas increases the probability of a girl attending school by 15 percent. 26 Similarly, the presence of aschool offering all three levels of education - primary, middle and secondary - increases the probability ofany child attending school by 8 percent. This is consistent with the simple cross-tabulations listed inTable 3.5: for a village with a primary school for girls within at least 1 Iam, the net primary enrollmentrate for girls is 43 percent, compared to around 13 percent for the rest of the rural population. Similarpatterns are observed for net secondary enrollment for boys and girls alike, across almost all provinces. 27
3.39 Given that access to school - Table 3.5: Access to School and Enrollments in Rural Areasdefined as even the mere existence of (1998-99)schools - help explain variations in % of Rural Net Enrollment Ratesenrollment rates, it is relevant to inquire Populationwhether poorer areas tend to lack Nearest Girls' Prim. Schl. (Net Prim. Enrl. Girls)schooling facilities? Although available In PSU or <=1 km distance 78.7 43.3evidence suggests that the poor are a little Distance >1 & <6 km 9.7 13.4more likely to live in areas more remotefrom school facilities that accommodate Distance>=6km 11.6 12.6women, such differences are not very Nearest Girls' Sec. Schl. (Net Sec. Enrl. Girls)significant.28 The PIHS data reveal that In PSU or <= km distance 25.7 28.4around 79 percent of the rural population Distance >1 & <6 km 38.4 15.0lives in areas where there is at least one Distance >=6 km 35.8 10.6primary school for girls in or within 1 Nearest Boys' Prim. Schl. (Net Prim. Enrl. Boys)distance from the village (Table 3.5). For12 percent of the rural population, the In PSU or <=1 km distance 95.4 55.0nearest school is at least 6 kan. away. Distance >1 & <6 km 3.4 29.1There are however regional variations in Distance >=6 km 1.1 14.5the proporton of the rural population with Nearest Girls' Sec. Schl. (Net Sec. EnrL. Girls)a girls' primary school located withi I kIn radius. These range from 100 percent InPSUor<=1 kmdistance 39.4 54.1in Azad J & K to 41 percent for Distance >1 & <6 kmn 34.9 40.6Balochistan. Access to primary school for Distance >=6 kn 25.7 25.7boys, on the other hand, seems to beuniformly high across the country; 95 percent of the rural population lives in areas where the nearestprimary school for boys is within 1 km of the village.29
3.40 The observed differences in the availability of primary schools for girls and boys in rural Pakistanno doubt partly explain wide gender gaps in schooling outcomes. The fact that even the mere availabilityof a school within a short distance is associated with much higher enrollment rates speaks for the need toexpand access to schools, particularly for women. As mentioned before, a recent study of privateschooling indicates that low female enrollments are closely linked to institutional defects in the publicschool system that limits access of girls to school facilities (Box 3.2). This also points up the advantagesthat private schools seem to enjoy; gender differences in their enrollments are found to be low. Primarilythis is because these mostly co-educational schools provide greater opportunities for girls' attendance, aswell as the fact that they have been able to employ large numbers of women as teachers.
56
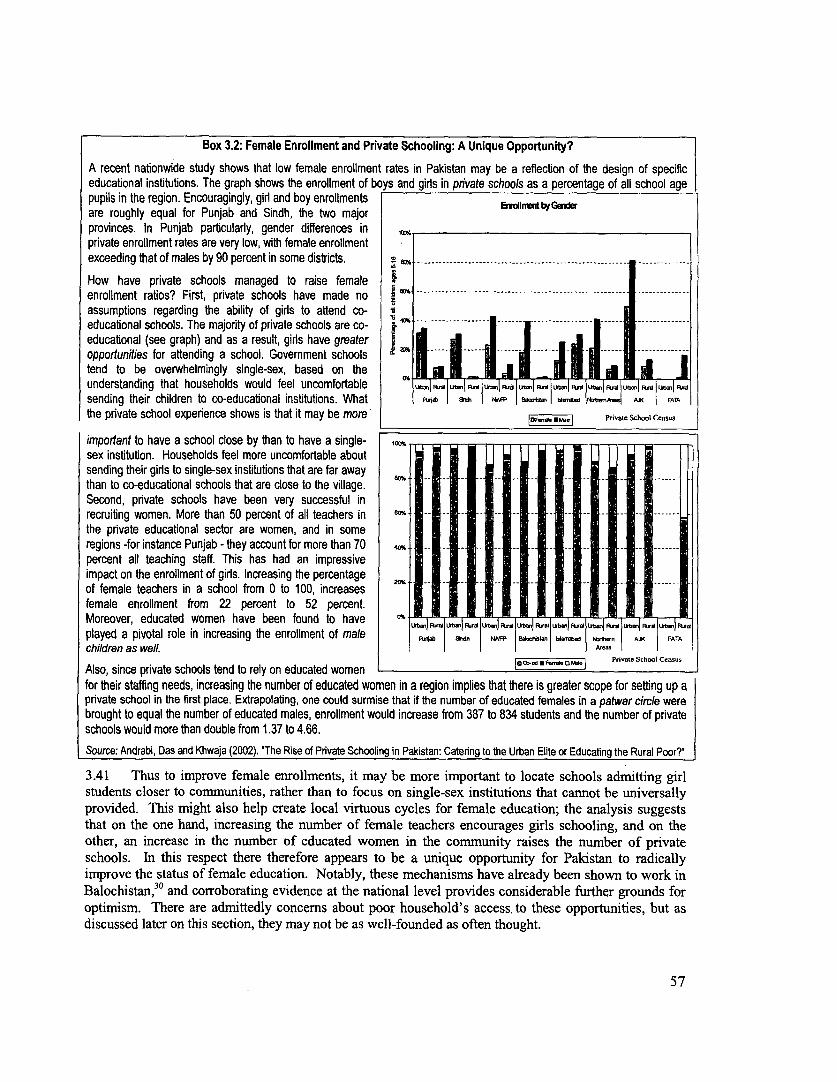
Box 3.2: Female Enrollment and Private Schooling: A Unique Opportunity?
A recent nationwide study shows that low female enrollment rates in Pakistan may be a reflection of the design of specific
educational institutions. The graph shows the enrollment of boys and girls in private schools as a percentage of all school age
pupils in the region. Encouragingly, girl and boy enrollments r
are roughly equal for Punjab and Sindh, the two majorprovinces. In Punjab particularly, gender differences inprivate enrollment rates are very low, with female enrollmentexceeding that of males by 90 percent in some districts. % --
How have private schools managed to raise female .enrollment ratios? First, private schools have made noassumptions regarding the ability of girls to attend co- '
educational schools. The majority of private schools are co- E
educational (see graph) and as a result, girls have greateropportunities for attending a school. Government schools E - -- - d - - .
tend to be overwhelmingly single-sex, based on theunderstanding that households would feel uncomfortable U u AT; ;b Rd
sending their children to co-euaina nttuin.WatSd AR d lk5 J
the private school experience shows is that it may be more' pnve School Census
important to have a school close by than to have a single- 1-sex institution. Households feel more uncomfortable aboutsending their girls to single-sex institutions that are far away lii
than to co-educational schools that are close to the village.Second, private schools have been very successful inrecruiting women. More than 50 percent of all teachers in e--
the private educational sector are women, and in someregions -for instance Punjab - they account for more than 70 40-
percent all teaching staff. This has had an impressiveimpact on the enrollment of girls. Increasing the percentage 1 f
of female teachers in a school from 0 to 100, increasesfemale enrollment from 22 percent to 52 percent.Moreover, educated women have been found to have 0 4 I1 U Ft.
played a pivotal role in increasing the enrollment of male R | B*l W Wth FATA
children as well. I I II
Also, since private schools tend to rely on educated women Pn-nw School Cens.
for their staffing needs, increasing the number of educated women in a region implies that there is greater scope for setting up a
private school in the first place. Extrapolafing, one could surmise that if the number of educated females in a patwar circle were
brought to equal the number of educated males, enrollment would increase from 387 to 834 students and the number of private
schools would more than double from 1.37 to 4.66.
Source: Andrabi, Das and Khwaja (2002). 'The Rise of Private Schooling in Pakistan: Catering to the Urban Elite or Educating the Rural Poor?
3.41 Thus to improve female enrollments, it may be more important to locate schools admitting girl
students closer to communities, rather than to focus on single-sex institutions that cannot be universally
provided. This might also help create local virtuous cycles for female education; the analysis suggests
that on the one hand, increasing the number of female teachers encourages girls schooling, and on the
other, an increase in the number of educated women in the community raises the number of private
schools. In this respect there therefore appears to be a unique opportunity for Pakistan to radically
improve the status of female education. Notably, these mechanisms have already been shown to work in
Balochistan, 30 and corroborating evidence at the national level provides considerable further grounds for
optimism. There are admittedly concerns about poor household's access. to these opportunities, but as
discussed later on this section, they may not be as well-founded as often thought.
57
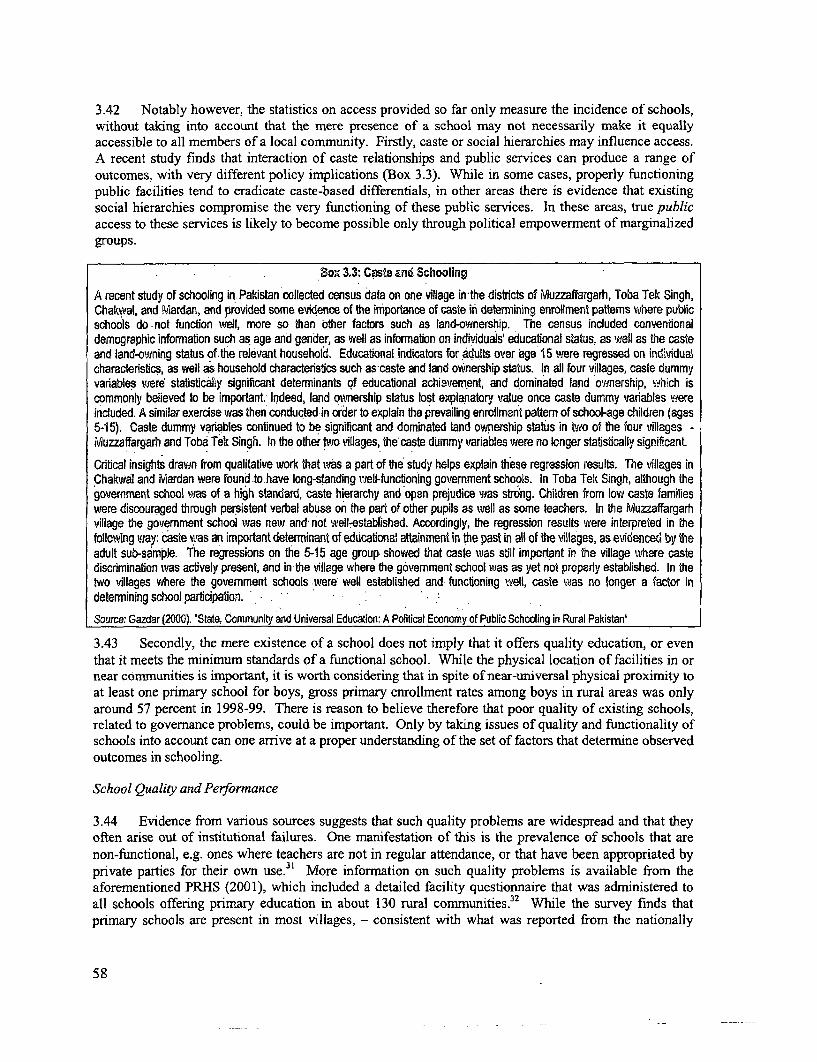
3.42 Notably however, the statistics on access provided so far only measure the incidence of schools,without taking into account that the mere presence of a school may not necessarily make it equallyaccessible to all members of a local community. Firstly, caste or social hierarchies may influence access.A recent study finds that interaction of caste relationships and public services can produce a range ofoutcomes, with very different policy implications (Box 3.3). While in some cases, properly functioningpublic facilities tend to eradicate caste-based differentials, in other areas there is evidence that existingsocial hierarchies compromise the very functioning of these public services. In these areas, true publicaccess to these services is likely to become possible only through political empowermnent of marginalizedgroups.
.oBO 3.3: Caste and Schooling
A recent study of schooling in. Pakistan collected census data on one village in the districts of iMuzzaffargarh, Toba Tek Singh,Chakwal, and Mardan, and provided some evidence of the importance of caste in determining enrollment pattems where publicscbools do not funcbton well, more so than bther factors such as land-ownership. The census included conventionaldemographic information such as age and gender, as well as information on individuals' educational status, as well as the casteand iand-owning status of the relevant household. Educational indicators for 4.ults over age 15 were regressed on ind'vidualcharacteristics, as well as household characteristics such as-caste and land ownership status. In all four villages, caste dummyvariables were statistically significant determinants of educational achievement, and dominated land ownership, which iscommonly believed to be important. Indeed, land ownership status lost explanatory value once caste dummy variabies wereincluded. A similar exercise was then conducted in order to explain the prevailing enrollment pattern of school-age children (ages5-15). Caste dummy variables continued to be significant and dominated land ownership status in two of the four villages -Muzzaffargarh and Toba Tek Singh. In the other two villages, the caste dummy variables were no longer stastically significant.
Critbcal insights drawn from qualitative work that was a part of the study helps explain these regression results. The villages inChakwal and Mardan were found to have long-standing well-functioning govemment schools. In Toba Tek Singh, although thegovemment school was of a high standard, caste hierarchy and open prejudice was strong. Children from low caste familieswere discouraged through persistent verbal abuse on the part of other pupils as well as some teachers. In the Muzzaffargarhvillage the government school was new and, not well-established. Accordingly, the regression results were interpreted in thefollowing way: caste was an important determinant of educational attainment in the past in all of the villages, as evidenced by theadult sub-sample. The regressions on the 5-15 age group showed that caste was still important in the village where castediscriminabon was actively present, and in the village where the government school was as yet not properly established. In thetwo villages where the govemment schools were well established and functioning well, caste was no longer a factor indetermining school participaton.
Source: Gazdar (2000). 'State, Community and Universal Education: A Political Economy of Public Schooling in Rural Pakistan'
3.43 Secondly, the mere existence of a school does not imply that it offers quality education, or eventhat it meets the minimum standards of a functional school. While the physical location of facilities in ornear communities is important, it is worth considering that in spite of near-universal physical proximity toat least one primary school for boys, gross primary enrollment rates among boys in rural areas was onlyaround 57 percent in 1998-99. There is reason to believe therefore that poor quality of existing schools,related to governance problems, could be important. Only by taking issues of quality and functionality ofschools into account can one arrive at a proper understanding of the set of factors that determine observedoutcomes in schooling.
School Quality and Performance
3.44 Evidence from various sources suggests that such quality problems are widespread and that theyoften arise out of institutional failures. One manifestation of this is the prevalence of schools that arenon-functional, e.g. ones where teachers are not in regular attendance, or that have been appropriated byprivate parties for their own use.3 ' More informnation on such quality problems is available from theaforementioned PRHS (2001), which included a detailed facility questionnaire that was administered toall schools offering primary education in about 130 rural communities. 32 While the survey finds thatprimary schools are present in most villages, - consistent with what was reported from the nationally
58
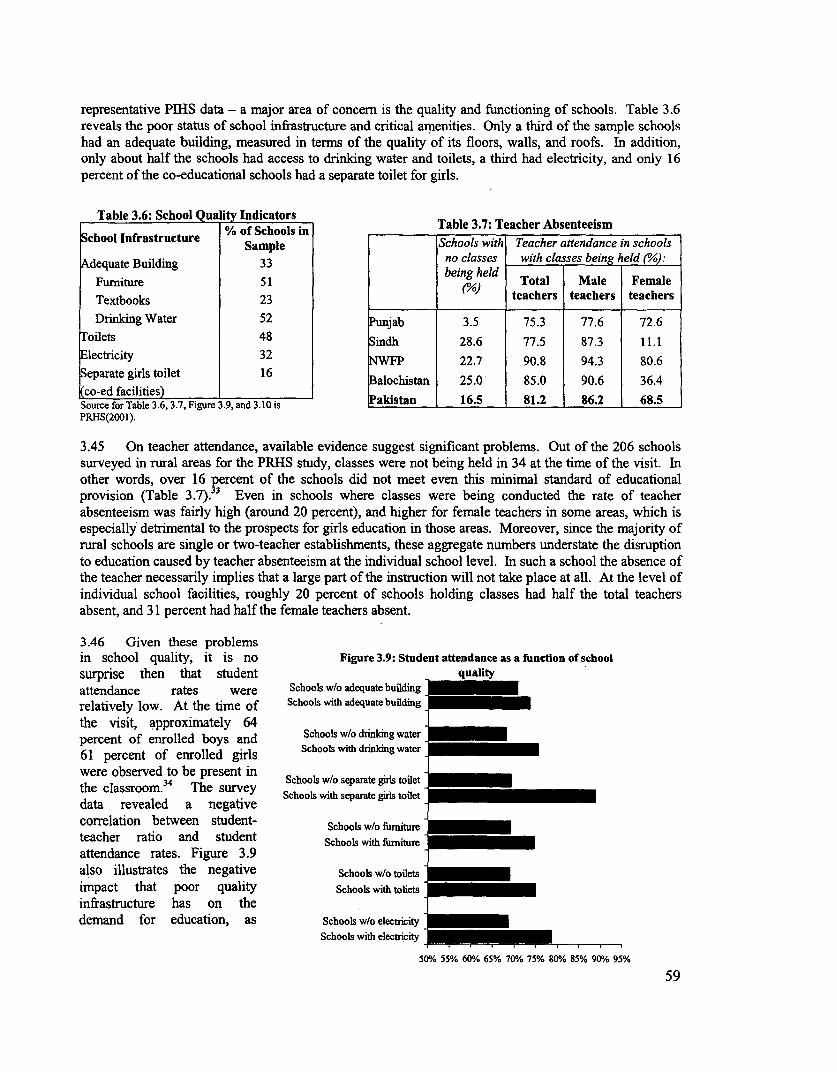
representative PIHS data - a major area of concern is the quality and functioning of schools. Table 3.6
reveals the poor status of school infrastructure and critical amenities. Only a third of the sample schools
had an adequate building, measured in terms of the quality of its floors, walls, and roofs. In addition,
only about half the schools had access to drinking water and toilets, a third had electricity, and only 16
percent of the co-educational schools had a separate toilet for girls.
Table 3.6: School Qua lity Indicators Table 3.7: Teacher Absenteeism
Schol Ifrasrucure % of Schools in _____Tbe37 ece betesSchool Infrastructure % of Sample Schools with Teacher attendance in schools
Adequate Building 33 no classes with cla ses being hjeld (/-:
Furniture 51 being held Total Male Female
Textbooks 23 teachers teachers teachers
Drinking Water 52 Punjab 3.5 75.3 77.6 72.6
Toilets 48 Sindh 28.6 77.5 87.3 11.1
Electricity 32 NWFP 22.7 90.8 94.3 80.6
Separate girls toilet 16 alochistan 25.0 85.0 90.6 36.4
(co-ed facilities)________Source for Table 3.6, 3.7, Figure 3.9, and 3.10 is akistan 16.5 81.2 86.2 68.5PRHS(2001).
3.45 On teacher attendance, available evidence suggest significant problems. Out of the 206 schools
surveyed in rural areas for the PRHS study, classes were not being held in 34 at the time of the visit. In
other words, over 16 percent of the schools did not meet even this minimal standard of educational
provision (Table 3.7).33 Even in schools where classes were being conducted the rate of teacher
absenteeism was fairly high (around 20 percent), and higher for female teachers in some areas, which is
especially detrimental to the prospects for girls education in those areas. Moreover, since the majority of
rural schools are single or two-teacher establishments, these aggregate numbers understate the disruption
to education caused by teacher absenteeism at the individual school level. In such a school the absence of
the teacher necessarily implies that a large part of the instruction will not take place at all. At the level of
individual school facilities, roughly 20 percent of schools holding classes had half the total teachers
absent, and 31 percent had half the female teachers absent.
3.46 Given these problemsin school quality, it is no Figure 3.9: Student attendance as a function of school
surprise then that student qualityattendance rates were Schools w/o adequate buildingrelatively low. At the time of Schools with adequate building
the visit, approximately 64 .
percent of enrolled boys and Schools wio drinkingwater61 percent of enrolled girls Schoolswithdrinigwawere observed to be present in S w
34 Schools w/o separate guirs toietthe classroom. 4 The survey.. datheclassreve ahe negvey Schools with separate girls toiletdata revealed a negativecorrelation between student- Schools w/o fiunitureteacher ratio and student Schools with fiunitureattendance rates. Figure 3.9also illustrates the negative Schools w/o toilets
impact that poor quality Schools with toIletsinfrastructure has on thedemand for education, as Schools w/o electricity
Schools with electricity
50% 55% 600/6 65% 70% 75% 80% 85% 900% 95%
59
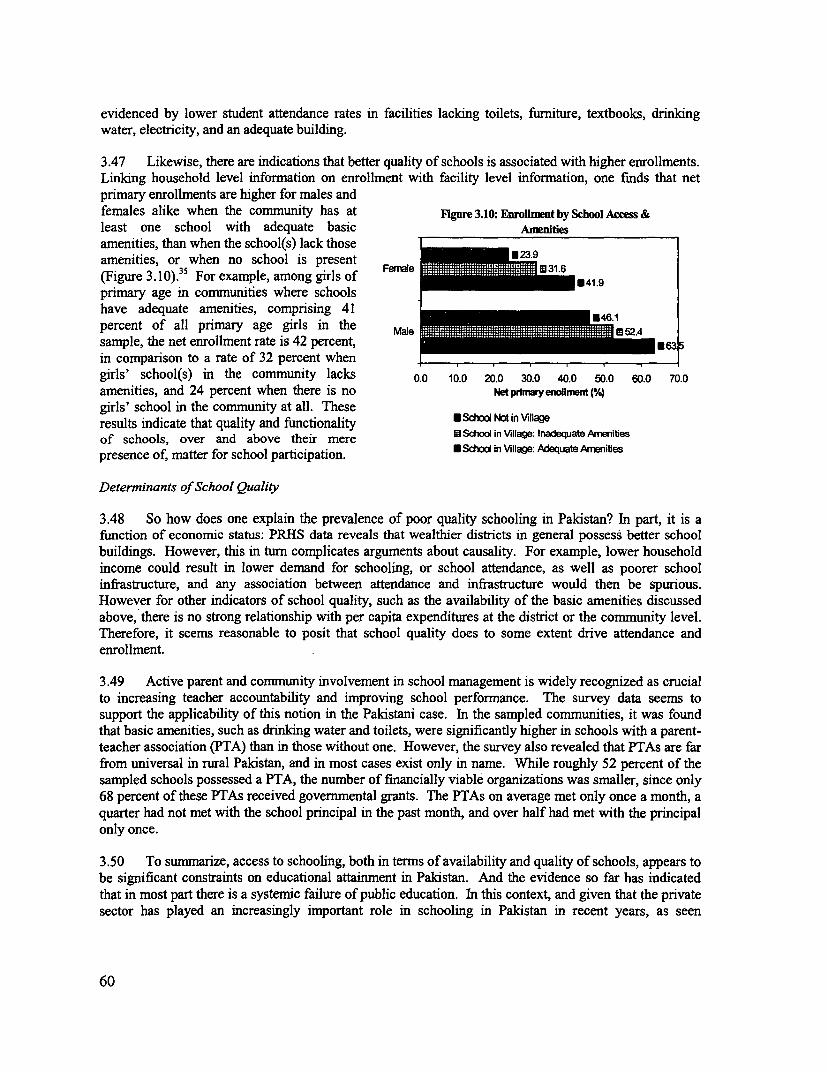
evidenced by lower student attendance rates in facilities lacking toilets, furniture, textbooks, drinkingwater, electricity, and an adequate building.
3.47 Likewise, there are indications that better quality of schools is associated with higher enrollments.Linking household level information on enrollment with facility level information, one finds that netprimary enrollments are higher for males andfemales alike when the community has at Figure 3.10: Enllment by School Access &least one school with adequate basic Amnfflesamenities, than when the school(s) lack thoseamenities, or when no school is present(Figure 3.10).35 For example, among girls of Fieml e419primary age in communities where schoolshave adequate amenities, comprising 41percent of all primary age girls in thesample, the net enrollment rate is 42 percent,in comparison to a rate of 32 percent whengirls' school(s) in the community lacks 0.0 10.0 20.0 30.0 40.0 50.0 60.0 70.0amenities, and 24 percent when there is no Netprmyereolmet(0,6girls' school in the community at all. Theseresults indicate that quality and functionality Sdoo Not in Villageof schools, over and above their mere lSchool in Village: Inaequate Amenitespresence of, matter for school participation. dlod inVillage: AdequateArrssiies
Determinants of School Quality
3.48 So how does one explain the prevalence of poor quality schooling in Pakistan? In part, it is afunction of economic status: PRHS data reveals that wealthier districts in general possess better schoolbuildings. However, this in turn complicates arguments about causality. For example, lower householdincome could result in lower demand for schooling, or school attendance, as well as poorer schoolinfrastructure, and any association between attendance and infrastructure would then be spurious.However for other indicators of school quality, such as the availability of the basic amenities discussedabove, there is no strong relationship with per capita expenditures at the district or the community level.Therefore, it seems reasonable to posit that school quality does to some extent drive attendance andenrollment.
3.49 Active parent and community involvement in school management is widely recognized as crucialto increasing teacher accountability and improving school performance. The survey data seems tosupport the applicability of this notion in the Pakistani case. In the sampled communities, it was foundthat basic amenities, such as drinking water and toilets, were significantly higher in schools with a parent-teacher association (PTA) than in those without one. However, the survey also revealed that PTAs are farfrom universal in rural Pakistan, and in most cases exist only in name. While roughly 52 percent of thesampled schools possessed a PTA, the number of financially viable organizations was smaller, since only68 percent of these PTAs received governmental grants. The PTAs on average met only once a month, aquarter had not met with the school principal in the past month, and over half had met with the principalonly once.
3.50 To summarize, access to schooling, both in terms of availability and quality of schools, appears tobe significant constraints on educational attainment in Pakistan. And the evidence so far has indicatedthat in most part there is a systemic failure of public education. In this context, and given that the privatesector has played an increasingly important role in schooling in Pakistan in recent years, as seen
60
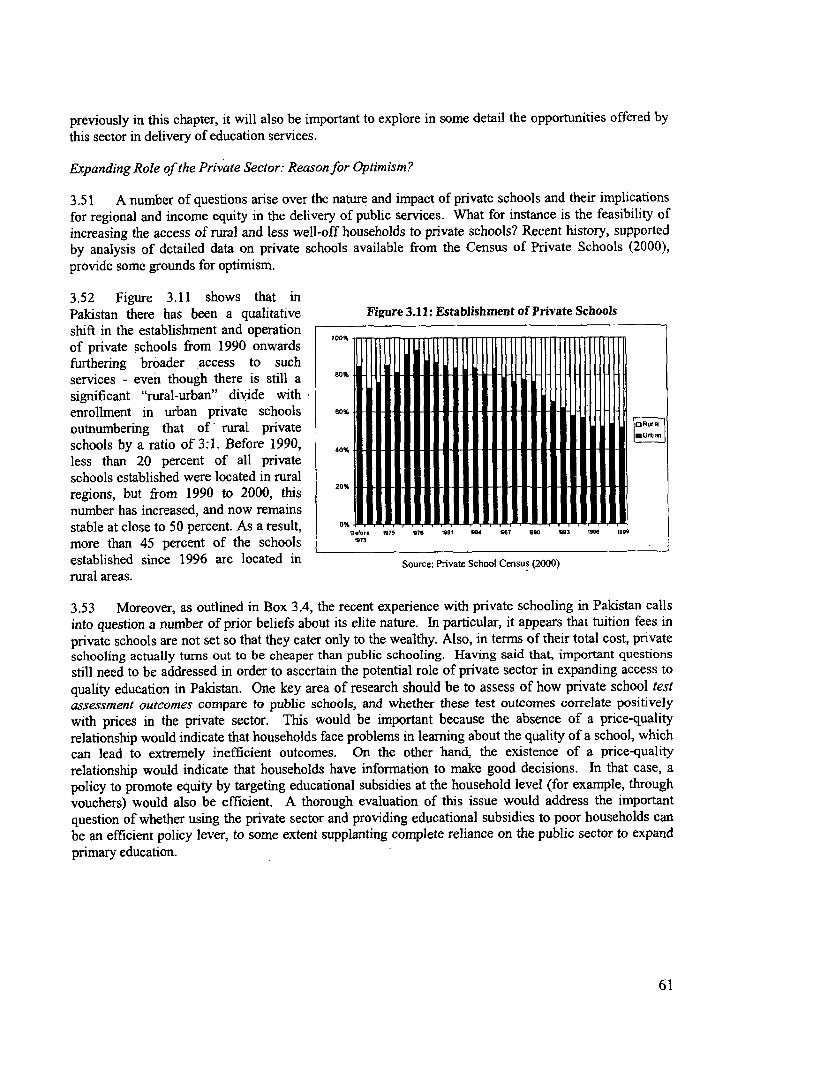
previously in this chapter, it will also be important to explore in some detail the opportunities offered bythis sector in delivery of education services.
Expanding Role of the Private Sector: Reasonfor Optimism?
3.51 A number of questions arise over the nature and impact of private schools and their implicationsfor regional and income equity in the delivery of public services. What for instance is the feasibility ofincreasing the access of rural and less well-off households to private schools? Recent history, supportedby analysis of detailed data on private schools available from the Census of Private Schools (2000),provide some grounds for optimism.
3.52 Figure 3.11 shows that inPakistan there has been a qualitative Figure 3.11: Establishment of Private Schoolsshift in the establishment and operationof private schools from 1990 onwardsfurthering broader access to suchservices - even though there is still a 80%
significant "rural-urban" divide withenrollment in urban private schools 0oloutnumbering that of rural privateschools by a ratio of 3:1. Before 1990, 40%
less than 20 percent of all privateschools established were located in ruralregions, but from 1990 to 2000, this 20%
number has increased, and now remainsstable at close to 50 percent. As a result, 0% n vr9.
S.W 3 to y$ 1 975 Sue 1a 4 7 vco 93 g m 19e *999
more than 45 percent of the schools 173
established since 1996 are located in Source: Private School Census (2000)rural areas.
3.53 Moreover, as outlined in Box 3.4, the recent experience with private schooling in Pakistan callsinto question a number of prior beliefs about its elite nature. In particular, it appears that tuition fees inprivate schools are not set so that they cater only to the wealthy. Also, in terrns of their total cost, privateschooling actually turns out to be cheaper than public schooling. Having said that, important questionsstill need to be addressed in order to ascertain the potential role of private sector in expanding access toquality education in Pakistan. One key area of research should be to assess of how private school testassessment outcomes compare to public schools, and whether these test outcomes correlate positivelywith prices in the private sector. This would be important because the absence of a price-qualityrelationship would indicate that households face problems in learning about the quality of a school, whichcan lead to extremely inefficient outcomes. On the other hand, the existence of a price-qualityrelationship would indicate that households have information to make good decisions. In that case, apolicy to promote equity by targeting educational subsidies at the household level (for example, throughvouchers) would also be efficient. A thorough evaluation of this issue would address the importantquestion of whether using the private sector and providing educational subsidies to poor households canbe an efficient policy lever, to some extent supplanting complete reliance on the public sector to expandprimary education.
61
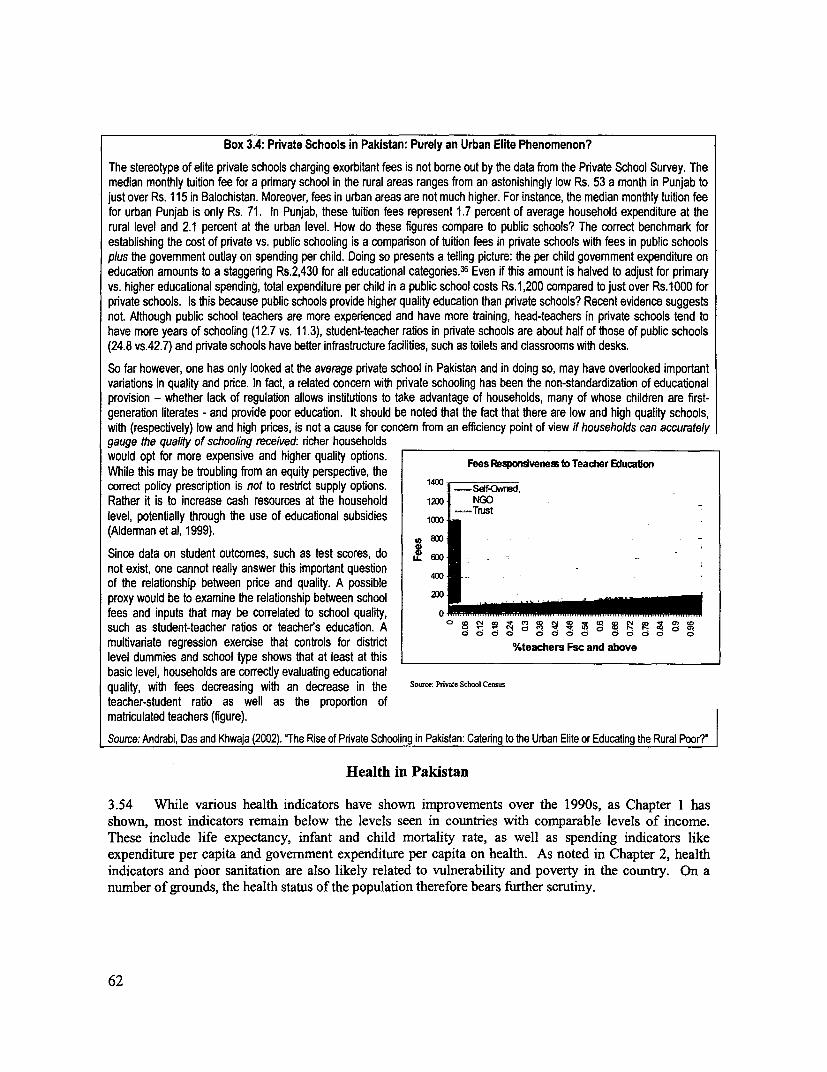
Box 3.4: Private Schools in Pakistan: Purely an Urban Elite Phenomenon?
The stereotype of elite private schools charging exorbitant fees is not bome out by the data from the Private School Survey. Themedian monthly tuition fee for a primary school in the rural areas ranges from an astonishingly low Rs. 53 a month in Punjab tojust over Rs. 115 in Balochistan. Moreover, fees in urban areas are not much higher. For instance, the median monthly tuiton feefor urban Punjab is only Rs. 71. In Punjab, these tuition fees represent 1.7 percent of average household expenditure at therural level and 2.1 percent at the urban level. How do these figures compare to public schools? The correct benchmark forestablishing the cost of private vs. public schooling is a comparison of tuibon fees in private schools with fees in public schoolsplus the govemment outlay on spending per child. Doing so presents a telling picture: the per child govemment expenditure oneducation amounts to a staggering Rs.2,430 for all educational categories.36 Even if this amount is halved to adjust for primaryvs. higher educational spending, total expenditure per child in a public school costs Rs.1,200 compared to just over Rs.1000 forprivate schools. Is this because public schools provide higher quality educabon than private schools? Recent evidence suggestsnot Although public school teachers are more experienced and have more training, head-teachers in private schools tend tohave more years of schooling (12.7 vs. 11.3), student-teacher rabos in private schools are about half of those of public schools(24.8 vs.42.7) and private schools have better infrastructure facilities, such as toilets and classrooms with desks.
So far however, one has only looked at the average private school in Pakistan and in doing so, may have overiooked importantvariabons in quality and price. In fact, a related concem with private schooling has been the non-standardizabon of educatonalprovision - whether lack of regulation allows institutions to take advantage of households, many of whose children are first-generation literates - and provide poor education. It should be noted that the fact that there are low and high quality schools,with (respectively) low and high prices, is not a cause for concem from an efficiency point of view if households can accuratelygauge the quality of schooling received: richer householdswould opt for more expensive and higher quality optons. Fees Itsonsvenes to Teacher EducationWhile this may be troubling from an equity perspectve, thecorrect policy prescription is not to restrict supply options. 14 0 Se0ffed.Rather it is to increase cash resources at the household 1iO NGOlevel, potentally through the use of educabonal subsidies D -Tut(Alderman et al, 1999).
Since data on student outcomes, such as test scores, do -o
not exist, one cannot really answer this important questionof the relabonship between price and quality. A possible *proxy would be to examine the relationship between school 2iOfees and inputs that may be correlated to school quality, 0such as student-teacher ratos or teachers education. A ° s ZXmutivariate regression exercise that controls for district %teachers Fsc and abovelevel dummies and school type shows that at least at thisbasic level, households are correctly evaluating educationalquality, with fees decreasing with an decrease in the Souce: Pvate School Censusteacher-student rato as well as the proportion ofmabiculated teachers (figure).
Source: Andrabi, Das and Khwaja (2002). 'The Rise of Private Schooling in Pakistan: Catering to the Urban Elite or Educating the Rural Poor?'
Health in Pakistan
3.54 While various health indicators have shown improvements over the 1990s, as Chapter 1 hasshown, most indicators remain below the levels seen in countries with comparable levels of income.These include life expectancy, infant and child mortality rate, as well as spending indicators likeexpenditure per capita and government expenditure per capita on health. As noted in Chapter 2, healthindicators and poor sanitation are also likely related to vulnerability and poverty in the country. On anumber of grounds, the health status of the population therefore bears further scrutiny.
62
3.55 There are reasons for optimism on the health front: available data suggests that infant mortalityhas improved over the decade and evinces no significant gender gap; the incidence of diarrhea - a leadingcause of infant death - has also fallen; the immunization rate has improved over the decade; and
knowledge of contraception has increased significantly among married women of child bearing age andnow appears near universal. However, significant challenges remain. Infant mortality rate is characterizedby a large rural-urban gap; the incidence of pre-natal consultation remains low, particularly in rural areas;
Oral Rehydration System, a simple, inexpensive and highly effective treatnment for diarrhea isadministered for only 49 percent of diarrhea incidents among children of the poor; and, in spite of muchimproved awareness, actual use of contraception remains low among women of childbearing age.
3.56 One significant point of this section, is its highlighting of the persistence of chronic malnutritionamong a number of districts sampled by an IFPRI survey in Pakistan, with almost no improvement overthe past 15 years. While the survey is not nationally representative, it provides a robust indicator ofchanges in household health in four separate communities over a longer period. It shows that by the timea child reaches age 5, it has a 60 percent probability of being stunted, 40 percent probably of beingunderweight, and 10 percent likelihood of being wasted. This is significant because numerous studiesconducted in other developing countries strongly indicate that poor childhood nutrition impacts theproductive life of the adult, and that interventions later on in their adolescence are ineffective inremedying this.
3.57 What determines these poor nutritional outcomes? Crucially, the section shows that the wealth oreconomic status of the community is likely to be more important than household specific factors indetermining a child's nutritional status. It is a reasonable conjecture that this may be in large part becausewealthier communities command better facilities. As discussed, this has vital implications for thetargeting and design of health policies. While differences in access prove important in explainingvariations in health status, the quality of facilities is also a significant problem. Tabulations of outpatientvisits show considerable variation across facilities in terms of usage, with some catering to far higherpopulations than others. Secondary sources also confirm that while the number of doctors and healthfacilities in Pakistan grew in 1980 and 90, there is a dearth of qualified doctors in rural areas.
Measuring Health in Pakistan - Indicators, Analysis and Limitations
3.58 Measuring the health of a population is a complicated exercise, requiring numerous ways ofgathering information- including self-reporting, clinical measures, and observation of daily life activities.In Pakistan, this problem is accentuated by the fact there is a high reliance on self-reported measurementsthat suffer threshold problems; richer households for instance have a lower threshold at which they wouldreport a disease. There are also problems about definitions of morbidity, and specificities of thequestionnaire used. In addition, like many developing countries, Pakistan also suffers from lack of data at
district levels on mortality causes, making it hard to obtain accurate estimates of the toll exacted byspecific diseases. Given these constraints, this section will focus on the specific health indicators outlinedbelow.
3.59 Firstly, it will examine some process indicators: medical consultation, knowledge about medicalpractices at household level, and use of preventive medical services. These are useful in so much as theyare indicative of the factors that may determine health outcomes. However, since they are jointlydetermined by demand, supply and knowledge, they do not tell a clear story. Some outcome indicatorsare therefore also analyzed. Particular attention is focused on anthropometrics - height and weight ofgrowing children - since the nutritional well being of children is known to correlate to a number of long-term and short-term health variables. In looking at process and outcome indicators alike, equity issues
will also be highlighted, across regions as well as levels of economic status.
63
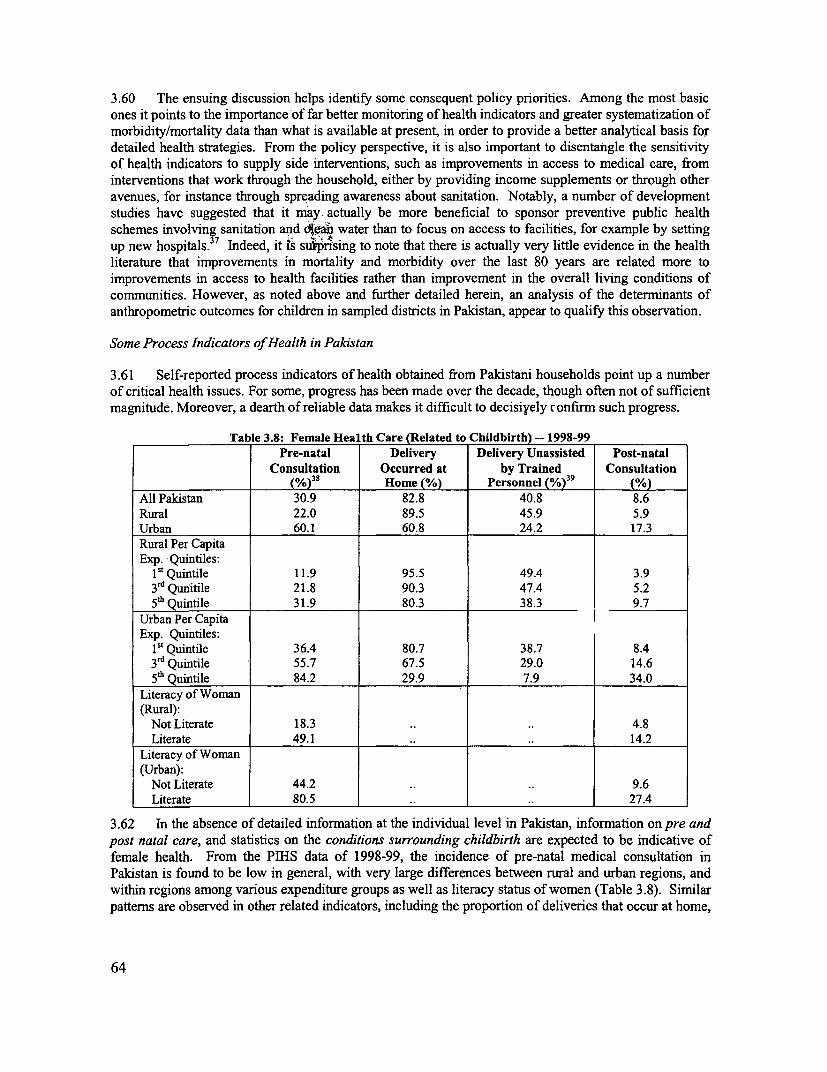
3.60 The ensuing discussion helps identify some consequent policy priorities. Among the most basicones it points to the importance of far better monitoring of health indicators and greater systematization ofmorbidity/mortality data than what is available at present, in order to provide a better analytical basis fordetailed health strategies. From the policy perspective, it is also important to disentangle the sensitivityof health indicators to supply side interventions, such as improvements in access to medical care, frominterventions that work through the household, either by providing income supplements or through otheravenues, for instance through spreading awareness about sanitation. Notably, a number of developmentstudies have suggested that it may actually be more beneficial to sponsor preventive public healthschemes involving sanitation and d%*,a_ water than to focus on access to facilities, for example by settingup new hospitals.37 Indeed, it is sui Ising to note that there is actually very little evidence in the healthliterature that improvements in mortality and morbidity over the last 80 years are related more toimprovements in access to health facilities rather than improvement in the overall living conditions ofcommunities. However, as noted above and further detailed herein, an analysis of the determinants ofanthropometric outcomes for children in sampled districts in Pakistan, appear to qualify this observation.
Some Process Indicators of Health in Pakistan
3.61 Self-reported process indicators of health obtained from Pakistani households point up a numberof critical health issues. For some, progress has been made over the decade, though often not of sufficientmagnitude. Moreover, a dearth of reliable data makes it difficult to decisiyely confirm such progress.
Table 3.8: Female Health Care (Related to Childbirth) --1998-99Pre-natal Delivery Delivery Unassisted Post-natal
Consultation Occurred at by Trained Consultation(%)38 Home (%) Personnel (%)39 (%)
All Pakistan 30.9 82.8 40.8 8.6Rural 22.0 89.5 45.9 5.9Urban 60.1 60.8 24.2 17.3Rural Per CapitaExp. Quintiles:
15' Quintile 11.9 95.5 49.4 3.93rd Qunitile 21.8 90.3 47.4 5.25th Quintile 31.9 80.3 38.3 9.7
Urban Per Capita IExp. Quintiles:
1" Quintile 36.4 80.7 38.7 8.43 rd Quintile 55.7 67.5 29.0 14.65t" Quintile 84.2 29.9 7.9 34.0
Literacy of Woman(Rural):
Not Literate 18.3 .. .. 4.8Literate 49.1 .. .. 14.2
Literacy of Woman(Urban):
Not Literate 44.2 .. .. 9.6Literate 80.5 .. .. 27.4
3.62 In the absence of detailed information at the individual level in Pakistan, information on pre andpost natal care, and statistics on the conditions surrounding childbirth are expected to be indicative offemale health. From the PIHS data of 1998-99, the incidence of pre-natal medical consultation inPakistan is found to be low in general, with very large differences between rural and urban regions, andwithin regions among various expenditure groups as well as literacy status of women (Table 3.8). Similarpatterns are observed in other related indicators, including the proportion of deliveries that occur at home,
64
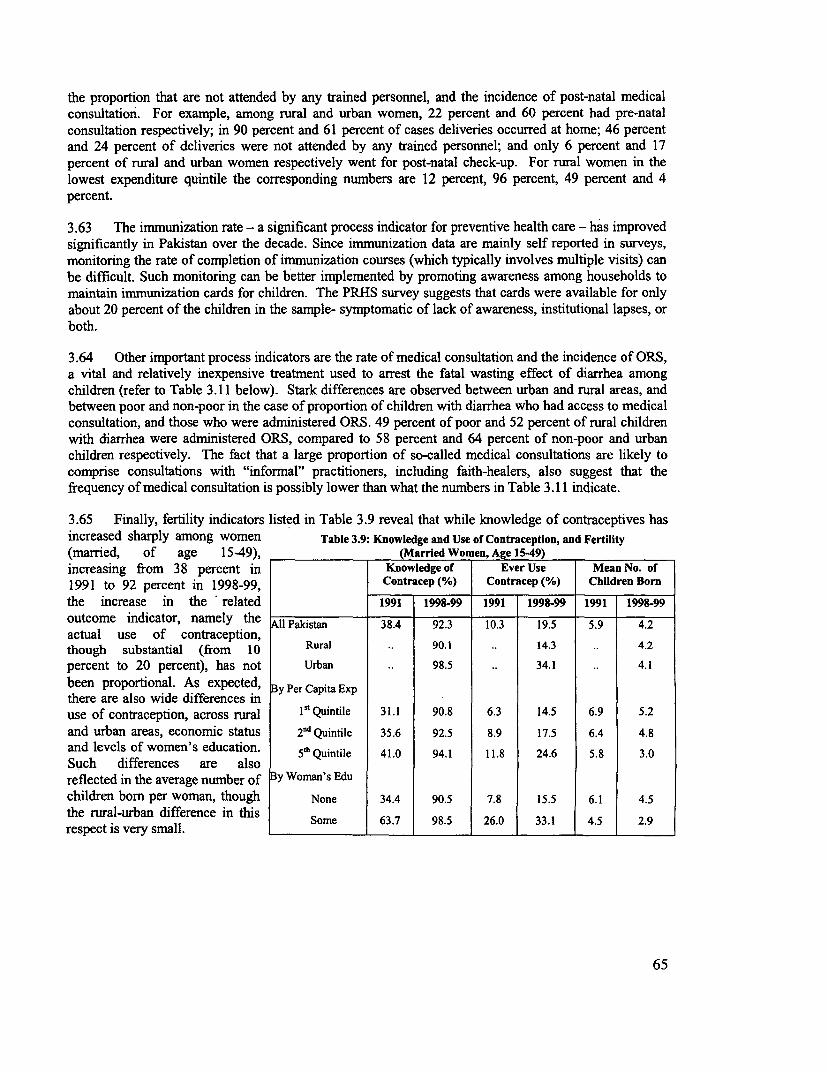
the proportion that are not attended by any trained personnel, and the incidence of post-natal medicalconsultation. For example, among rural and urban women, 22 percent and 60 percent had pre-natalconsultation respectively; in 90 percent and 61 percent of cases deliveries occurred at home; 46 percentand 24 percent of deliveries were not attended by any trained personnel; and only 6 percent and 17
percent of rural and urban women respectively went for post-natal check-up. For rural women in thelowest expenditure quintile the corresponding numbers are 12 percent, 96 percent, 49 percent and 4percent.
3.63 The immunization rate - a significant process indicator for preventive health care - has improvedsignificantly in Pakistan over the decade. Since immunization data are mainly self reported in surveys,
monitoring the rate of completion of immunization courses (which typically involves multiple visits) canbe difficult. Such monitoring can be better implemented by promoting awareness among households tomaintain immunization cards for children. The PRHS survey suggests that cards were available for only
about 20 percent of the children in the sample- symptomatic of lack of awareness, institutional lapses, orboth.
3.64 Other important process indicators are the rate of medical consultation and the incidence of ORS,a vital and relatively inexpensive treatment used to arrest the fatal wasting effect of diarrhea amongchildren (refer to Table 3.11 below). Stark differences are observed between urban and rural areas, andbetween poor and non-poor in the case of proportion of children with diarrhea who had access to medicalconsultation, and those who were administered ORS. 49 percent of poor and 52 percent of rural childrenwith diarrhea were administered ORS, compared to 58 percent and 64 percent of non-poor and urbanchildren respectively. The fact that a large proportion of so-called medical consultations are likely tocomprise consultations with "informal" practitioners, including faith-healers, also suggest that thefrequency of medical consultation is possibly lower than what the numbers in Table 3.11 indicate.
3.65 Finally, fertility indicators listed in Table 3.9 reveal that while knowledge of contraceptives has
increased sharply among women Table 3.9: Knowledge and Use of Contraception, and Fertility(married, of age 15-49), (Married Women, Age 15.49)increasing from 38 percent in Knowledge of Ever Use Mean No. of1991 to 92 percent in 1998-99, Contracep (%) Contracep (%) Children Bornthe increase in the related 1991 1998-99 1991 1998-99 1991 1998-99outcome indicator, namely the All Pakistan 38.4 92.3 10.3 19.5 5.9 4.2
actual use of contraception,though substantial (from 0 Rural .. 90.1 .. 14.3 .. 4.2
percent to 20 percent), has not Urban .. 98.5 .. 34.1 .. 4.1
been proportional. As expected, y Per Capita Expthere are also wide differences inuse of contraception, across rural I' Quintile 31.1 90.8 6.3 14.5 6.9 5.2
and urban areas, economic status 2nd Quintile 35.6 92.5 8.9 17.5 6.4 4.8
and levels of women's education. 5h Quintile 41.0 94.1 11.8 24.6 5.8 3.0
Such differences are alsoreflected in the average number of By Woman's Edu
children bom per woman, though None 34.4 90.5 7.8 15.5 6.1 4.5
the rural-urban difference in this Some 63.7 98.5 26.0 33.1 4.5 2.9respect is very small. _
65
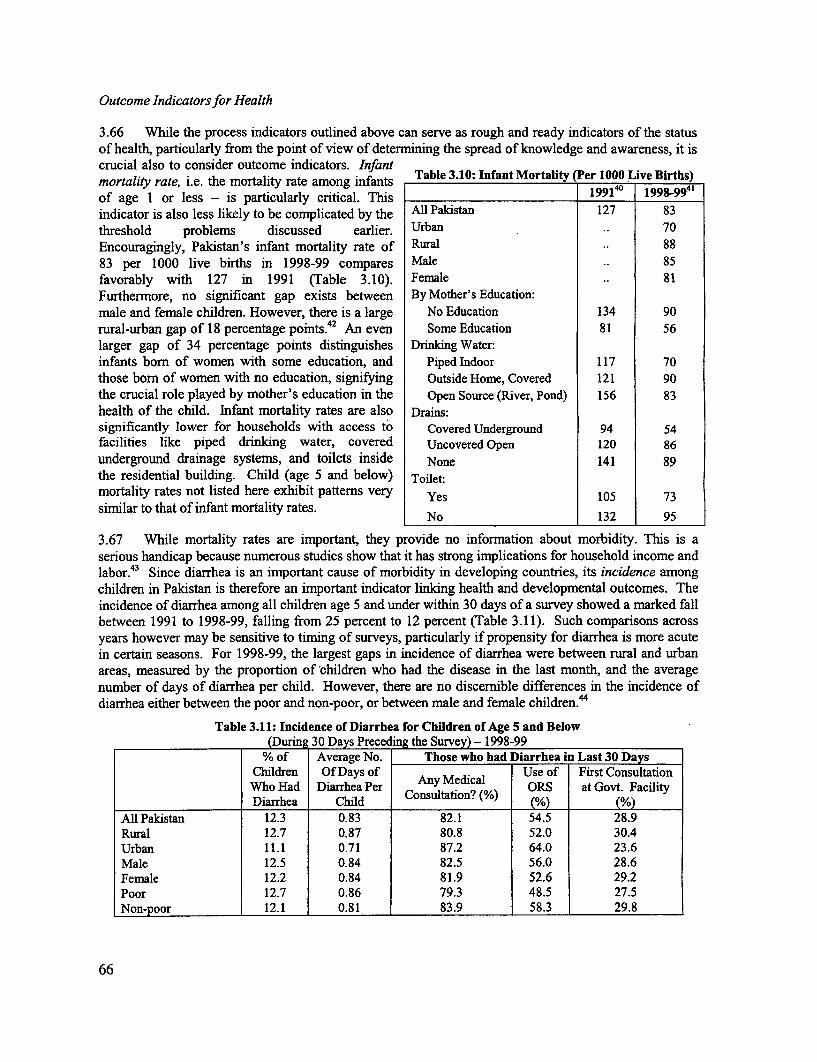
Outcome Indicators for Health
3.66 While the process indicators outlined above can serve as rough and ready indicators of the statusof health, particularly from the point of view of determining the spread of knowledge and awareness, it iscrucial also to consider outcome indicators. Infantmortality rate, i.e. the mortality rate among infants Table 3.10: Infant Mortality (Per 1000 Live Births)of age 1 or less - is particularly critical. This 199140 1998994indicator is also less likely to be complicated by the All Palistan 127 83threshold problems discussed earlier. Urban .. 70Encouragingly, Pakistan's infant mortality rate of Rural .. 8883 per 1000 live births in 1998-99 compares Male .. 85favorably with 127 in 1991 (Table 3.10). Female .. 81Furthermore, no significant gap exists between By Mother's Education:male and female children. However, there is a large No Education 134 90rural-urban gap of 18 percentage points.42 An even Some Education 81 56larger gap of 34 percentage points distinguishes Drinking Water:infants born of women with some education, and Piped Indoor 117 70those born of women with no education, signifying Outside Home, Covered 121 90the crucial role played by mother's education in the Open Source (River, Pond) 156 83health of the child. Infant mortality rates are also Drains:significantly lower for households with access to Covered Underground 94 54facilities like piped drinking water, covered Uncovered Open 120 86underground drainage systems, and toilets inside None 141 89the residential building. Child (age 5 and below) Toilet:mortality rates not listed here exhibit patterns very Yes 105 73similar to that of infant mortality rates. No 132 95
3.67 While mortality rates are important, they provide no information about morbidity. This is aserious handicap because numerous studies show that it has strong implications for household income andlabor.43 Since diarrhea is an important cause of morbidity in developing countries, its incidence amongchildren in Pakistan is therefore an important indicator linking health and developmental outcomes. Theincidence of diarrhea among all children age 5 and under within 30 days of a survey showed a marked fallbetween 1991 to 1998-99, falling from 25 percent to 12 percent (Table 3.11). Such comparisons acrossyears however may be sensitive to timing of surveys, particularly if propensity for diarrhea is more acutein certain seasons. For 1998-99, the largest gaps in incidence of diarrhea were between rural and urbanareas, measured by the proportion of children who had the disease in the last month, and the averagenumber of days of diarrhea per child. However, there are no discernible differences in the incidence ofdiarrhea either between the poor and non-poor, or between male and female children.44
Table 3.11: Incidence of Diarrhea for Children of Age 5 and Below(Durin 30 Days Preceding the Survey) - 1998-99
% of Average No. Those who had Diarrhea in Last 30 DaysChildren Of Days of Any Medical Use of First ConsultationWhoHadDiarrhea Chid Consltateion? (l) OORS at Govt. FacilityDiarrhea Child CoMlain % % N%
All Pakistan 12.3 0.83 82.1 54.5 28.9Rural 12.7 0.87 80.8 52.0 30.4Urban 11.1 0.71 87.2 64.0 23.6Male 12.5 0.84 82.5 56.0 28.6Female 12.2 0.84 81.9 52.6 29.2Poor 12.7 0.86 79.3 48.5 27.5Non-poor 12.1 0.81 83.9 58.3 29.8
66
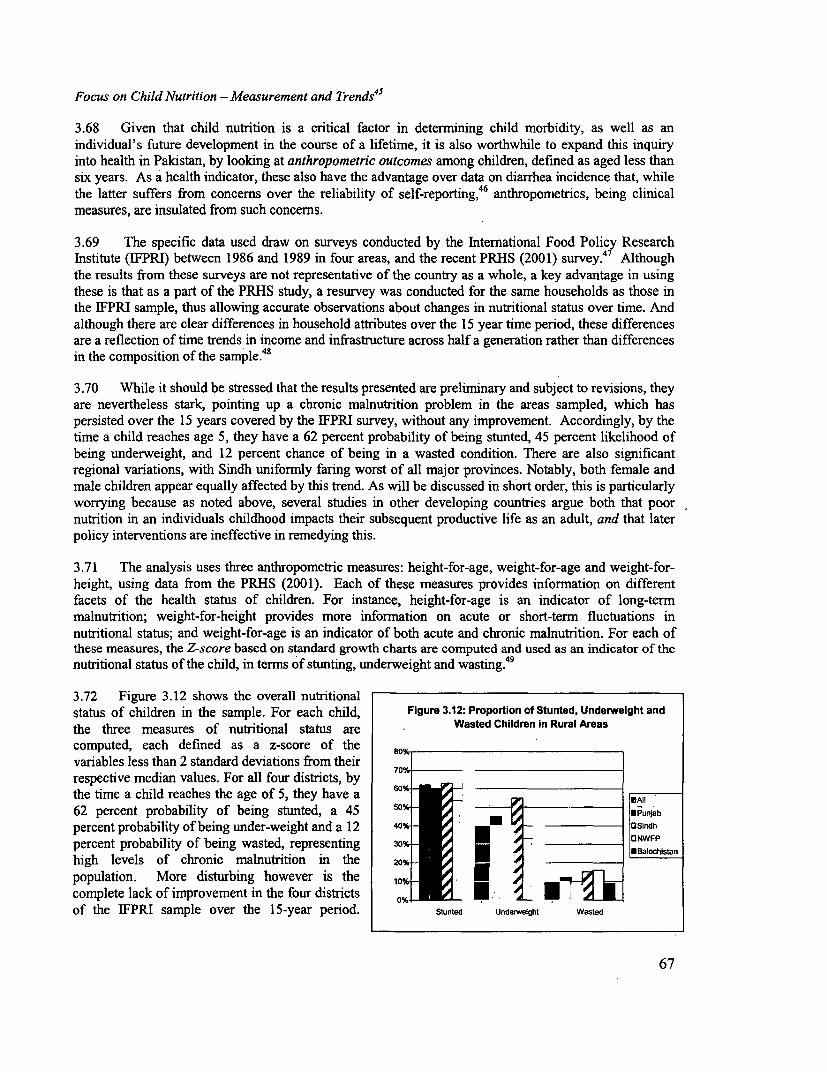
Focus on Child Nutrition - Measurement and Trends45
3.68 Given that child nutrition is a critical factor in determining child morbidity, as well as anindividual's future development in the course of a lifetime, it is also worthwhile to expand this inquiryinto health in Pakistan, by looking at anthropometric outcomes among children, defined as aged less thansix years. As a health indicator, these also have the advantage over data on diarrhea incidence that, whilethe latter suffers from concerns over the reliability of self-reporting, 46 anthropometrics, being clinicalmeasures, are insulated from such concerns.
3.69 The specific data used draw on surveys conducted by the International Food Policy ResearchInstitute (IFPRI) between 1986 and 1989 in four areas, and the recent PRHS (2001) survey.47 Althoughthe results from these surveys are not representative of the country as a whole, a key advantage in usingthese is that as a part of the PRHS study, a resurvey was conducted for the same households as those inthe IFPRI sample, thus allowing accurate observations about changes in nutritional status over time. Andalthough there are clear differences in household attributes over the 15 year time period, these differencesare a reflection of time trends in income and infrastructure across half a generation rather than differencesin the composition of the sample.48
3.70 While it should be stressed that the results presented are preliminary and subject to revisions, theyare nevertheless stark, pointing up a chronic malnutrition problem in the areas sampled, which haspersisted over the 15 years covered by the IFPRI survey, without any improvement. Accordingly, by thetime a child reaches age 5, they have a 62 percent probability of being stunted, 45 percent likelihood ofbeing underweight, and 12 percent chance of being in a wasted condition. There are also significantregional variations, with Sindh uniformly faring worst of all major provinces. Notably, both female andmale children appear equally affected by this trend. As will be discussed in short order, this is particularlyworrying because as noted above, several studies in other developing countries argue both that poornutrition in an individuals childhood impacts their subsequent productive life as an adult, and that laterpolicy interventions are ineffective in remedying this.
3.71 The analysis uses three anthropometric measures: height-for-age, weight-for-age and weight-for-height, using data from the PRHS (2001). Each of these measures provides information on differentfacets of the health status of children. For instance, height-for-age is an indicator of long-termmalnutrition; weight-for-height provides more infortnation on acute or short-term fluctuations innutritional status; and weight-for-age is an indicator of both acute and chronic malnutrition. For each ofthese measures, the Z-score based on standard growth charts are computed and used as an indicator of thenutritional status of the child, in terms of stunting, underweight and wasting.49
3.72 Figure 3.12 shows the overall nutritionalstatus of children in the sample. For each child, Figure 3.12: Proportion of Stunted, Underweight and
the three measures of nutritional status are Wasted Children in Rural Areas
computed, each defined as a z-score of thevariables less than 2 standard deviations from theirrespective median values. For all four districts, by 70%
the time a child reaches the age of 5, they have a 60* LAII
62 percent probability of being stunted, a 45 so% EPunjab
percent probability of being under-weight and a 12 40% OSindh
percent probability of being wasted, representing 30% I Balodistan
high levels of chronic malnutrition in the 20% Blht
population. More disturbing however is the 10% complete lack of improvement in the four districts 0% _of the IFPRI sample over the 15-year period. Stunted Underweight Wasted
67
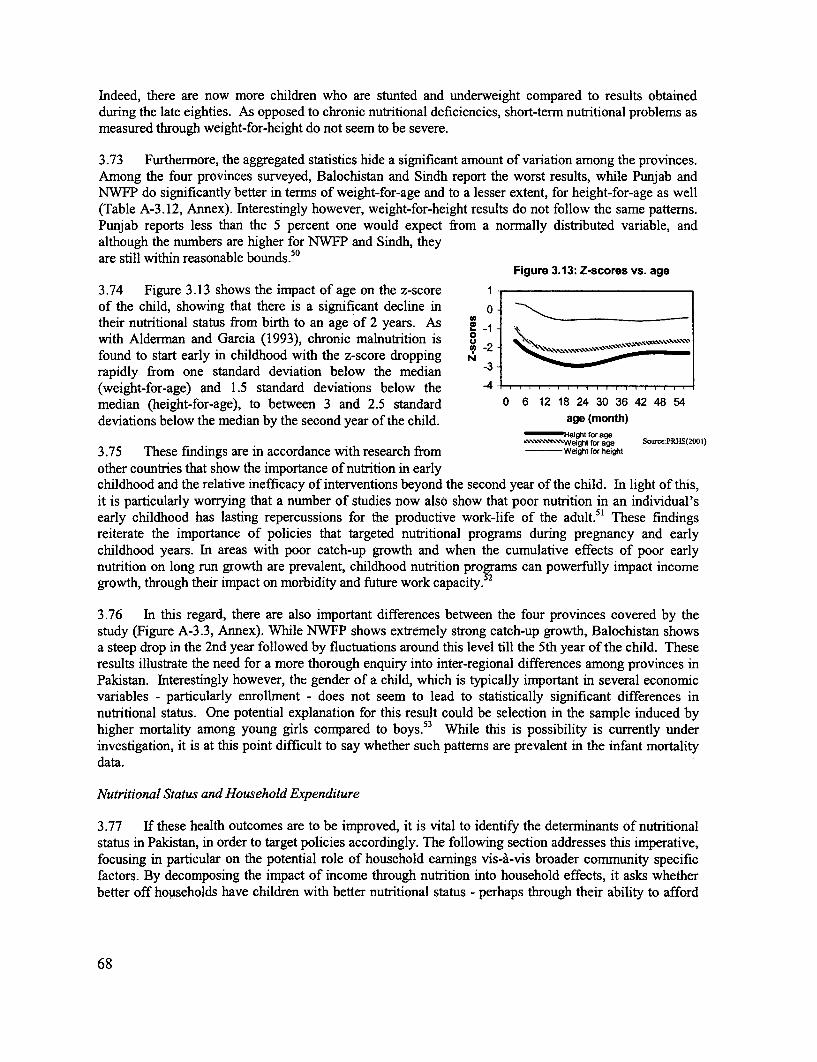
Indeed, there are now more children who are stunted and underweight compared to results obtainedduring the late eighties. As opposed to chronic nutritional deficiencies, short-term nutritional problems asmeasured through weight-for-height do not seem to be severe.
3.73 Furthermore, the aggregated statistics hide a significant amount of variation among the provinces.Among the four provinces surveyed, Balochistan and Sindh report the worst results, while Punjab andNWFP do significantly better in temns of weight-for-age and to a lesser extent, for height-for-age as well(Table A-3.12, Annex). Interestingly however, weight-for-height results do not follow the same pattems.Punjab reports less than the 5 percent one would expect from a normally distributed variable, andalthough the numbers are higher for NWFP and Sindh, theyare still within reasonable bounds.50
Figure 3.13: Z-scores vs. age3.74 Figure 3.13 shows the impact of age on the z-score 1of the child, showing that there is a significant decline in 0 -their nutritional status from birth to an age of 2 years. As e -
with Alderman and Garcia (1993), chronic malnutrition is °found to start early in childhood with the z-score dropping ,3rapidly from one standard deviation below the median(weight-for-age) and 1.5 standard deviations below the 4- . .median (height-for-age), to between 3 and 2.5 standard 0 6 12 18 24 30 36 42 48 54deviations below the median by the second year of the child. age (month)
-Height for age`XwWeight for age Sowrce:PRHS(2001)
3.75 These findings are in accordance with research from Weight for height
other countries that show the importance of nutrition in earlychildhood and the relative inefficacy of interventions beyond the second year of the child. In light of this,it is particularly worrying that a number of studies now also show that poor nutrition in an individual'searly childhood has lasting repercussions for the productive work-life of the adult.51 These findingsreiterate the importance of policies that targeted nutritional programs during pregnancy and earlychildhood years. In areas with poor catch-up growth and when the cumulative effects of poor earlynutrition on long run growth are prevalent, childhood nutrition programs can powerfully impact incomegrowth, through their impact on morbidity and future work capacity.52
3.76 In this regard, there are also important differences between the four provinces covered by thestudy (Figure A-3.3, Annex). While NWFP shows extremely strong catch-up growth, Balochistan showsa steep drop in the 2nd year followed by fluctuations around this level till the 5th year of the child. Theseresults illustrate the need for a more thorough enquiry into inter-regional differences among provinces inPakistan. Interestingly however, the gender of a child, which is typically important in several economicvariables - particularly enrollment - does not seem to lead to statistically significant differences innutritional status. One potential explanation for this result could be selection in the sample induced byhigher mortality among young girls compared to boys.53 While this is possibility is currently underinvestigation, it is at this point difficult to say whether such patterns are prevalent in the infant mortalitydata.
Nutritional Status and Household Expenditure
3.77 If these health outcomes are to be improved, it is vital to identify the determinants of nutritionalstatus in Pakistan, in order to target policies accordingly. The following section addresses this imperative,focusing in particular on the potential role of household earnings vis-a-vis broader community specificfactors. By decomposing the impact of income through nutrition into household effects, it asks whetherbetter off households have children with better nutritional status - perhaps through their ability to afford
68
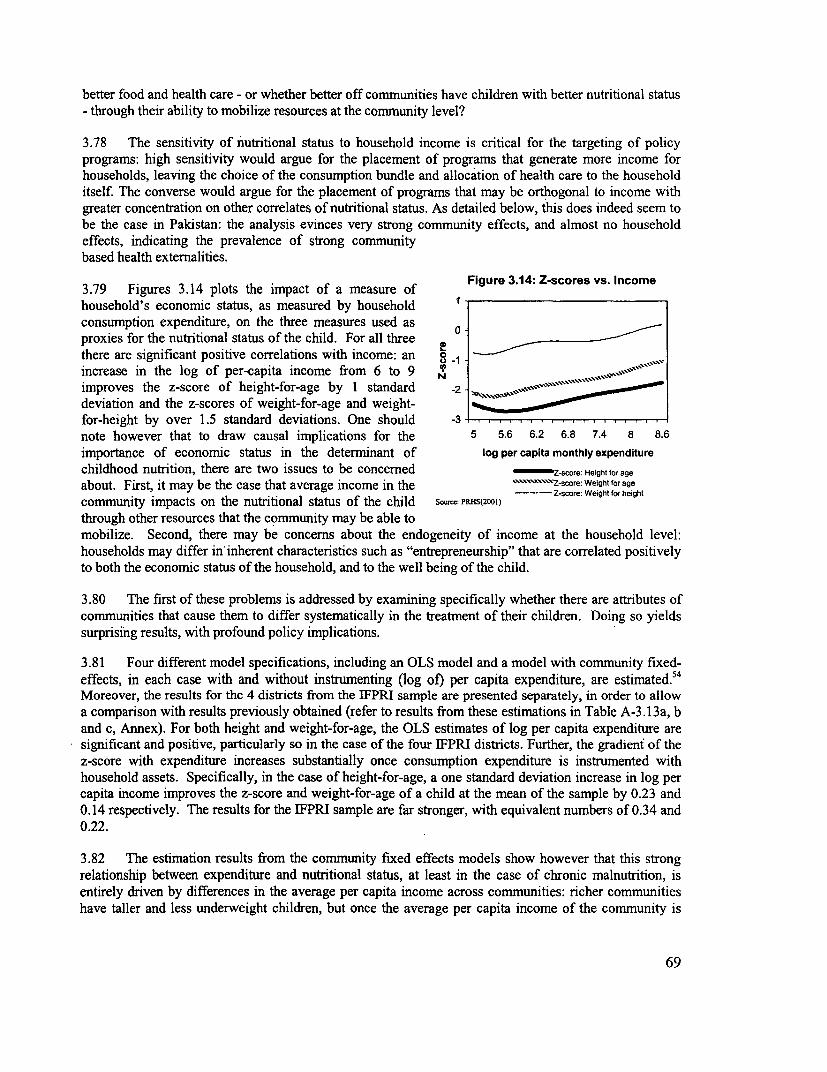
better food and health care - or whether better off communities have children with better nutritional status- through their ability to mobilize resources at the community level?
3.78 The sensitivity of nutritional status to household income is critical for the targeting of policyprograms: high sensitivity would argue for the placement of programs that generate more income forhouseholds, leaving the choice of the consumption bundle and allocation of health care to the householditself. The converse would argue for the placement of programs that may be orthogonal to income withgreater concentration on other correlates of nutritional status. As detailed below, this does indeed seem tobe the case in Pakistan: the analysis evinces very strong community effects, and almost no householdeffects, indicating the prevalence of strong communitybased health externalities.
3.79 Figures 3.14 plots the impact of a measure of Figure 3.14: Z-scores vs. Incomehousehold's economic status, as measured by household Iconsumption expenditure, on the three measures used asproxies for the nutritional status of the child. For all three 0
there are significant positive correlations with income: an o -i
increase in the log of per-capita income from 6 to 9 ,p
improves the z-score of height-for-age by 1 standard -2 -deviation and the z-scores of weight-for-age and weight-for-height by over 1.5 standard deviations. One should -3uldrnote however that to draw causal implications for the 5 5.6 6.2 6.8 7.4 8 8.6
importance of economic status in the determinant of log per capita monthly expenditure
childhood nutrition, there are two issues to be concerned -score: Height for age
about. First, it may be the case that average income in the oxZ-score: Weight for age
community impacts on the nutritional status of the child Sow: PRHS(2001)
through other resources that the community may be able tomobilize. Second, there may be concerns about the endogeneity of income at the household level:households may differ in inherent characteristics such as "entrepreneurship" that are correlated positivelyto both the economic status of the household, and to the well being of the child.
3.80 The first of these problems is addressed by examining specifically whether there are attributes ofcommunities that cause them to differ systematically in the treatment of their children. Doing so yieldssurprising results, with profound policy implications.
3.81 Four different model specifications, including an OLS model and a model with community fixed-effects, in each case with and without instrumenting (log of) per capita expenditure, are estimated.54
Moreover, the results for the 4 districts from the IFPRI sample are presented separately, in order to allowa comparison with results previously obtained (refer to results from these estimations in Table A-3.13a, band c, Annex). For both height and weight-for-age, the OLS estimates of log per capita expenditure aresignificant and positive, particularly so in the case of the four IFPRI districts. Further, the gradient of thez-score with expenditure increases substantially once consumption expenditure is instrumented withhousehold assets. Specifically, in the case of height-for-age, a one standard deviation increase in log percapita income improves the z-score and weight-for-age of a child at the mean of the sample by 0.23 and0.14 respectively. The results for the IFPRI sample are far stronger, with equivalent numbers of 0.34 and0.22.
3.82 The estimation results from the community fixed effects models show however that this strongrelationship between expenditure and nutritional status, at least in the case of chronic malnutrition, isentirely driven by differences in the average per capita income across communities: richer communitieshave taller and less underweight children, but once the average per capita income of the community is
69
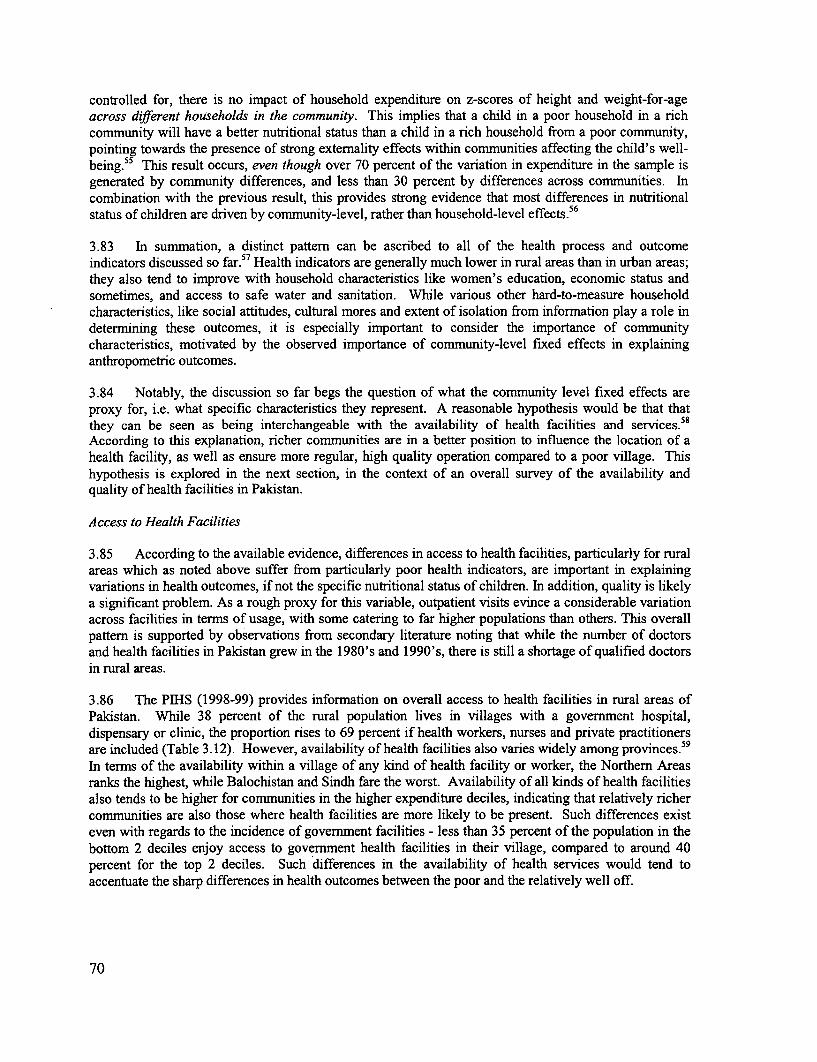
controlled for, there is no impact of household expenditure on z-scores of height and weight-for-ageacross different households in the community. This implies that a child in a poor household in a richcommunity will have a better nutritional status than a child in a rich household from a poor community,pointing towards the presence of strong extemality effects within communities affecting the child's well-being.55 This result occurs, even though over 70 percent of the variation in expenditure in the sample isgenerated by community differences, and less than 30 percent by differences across communities. Incombination with the previous result, this provides strong evidence that most differences in nutritionalstatus of children are driven by community-level, rather than household-level effects. 56
3.83 In summation, a distinct pattem can be ascribed to all of the health process and outcomeindicators discussed so far.57 Health indicators are generally much lower in rural areas than in urban areas;they also tend to improve with household characteristics like women's education, economic status andsometimes, and access to safe water and sanitation. While various other hard-to-measure householdcharacteristics, like social attitudes, cultural mores and extent of isolation from information play a role indetermining these outcomes, it is especially important to consider the importance of communitycharacteristics, motivated by the observed importance of community-level fixed effects in explaininganthropometric outcomes.
3.84 Notably, the discussion so far begs the question of what the community level fixed effects areproxy for, i.e. what specific characteristics they represent. A reasonable hypothesis would be that thatthey can be seen as being interchangeable with the availability of health facilities and services.58According to this explanation, richer communities are in a better position to influence the location of ahealth facility, as well as ensure more regular, high quality operation compared to a poor village. Thishypothesis is explored in the next section, in the context of an overall survey of the availability andquality of health facilities in Pakistan.
Access to Health Facilities
3.85 According to the available evidence, differences in access to health facilities, particularly for ruralareas which as noted above suffer from particularly poor health indicators, are important in explainingvariations in health outcomes, if not the specific nutritional status of children. In addition, quality is likelya significant problem. As a rough proxy for this variable, outpatient visits evince a considerable variationacross facilities in terms of usage, with some catering to far higher populations than others. This overallpattem is supported by observations from secondary literature noting that while the number of doctorsand health facilities in Pakistan grew in the 1980's and 1990's, there is still a shortage of qualified doctorsin rural areas.
3.86 The PIHS (1998-99) provides information on overall access to health facilities in rural areas ofPakistan. While 38 percent of the rural population lives in villages with a govemment hospital,dispensary or clinic, the proportion rises to 69 percent if health workers, nurses and private practitionersare included (Table 3.12). However, availability of health facilities also varies widely among provinces.59
In terms of the availability within a village of any kind of health facility or worker, the Northem Areasranks the highest, while Balochistan and Sindh fare the worst. Availability of all kinds of health facilitiesalso tends to be higher for communities in the higher expenditure deciles, indicating that relatively richercommunities are also those where health facilities are more likely to be present. Such differences existeven with regards to the incidence of govermment facilities - less than 35 percent of the population in thebottom 2 deciles enjoy access to govemment health facilities in their village, compared to around 40percent for the top 2 deciles. Such differences in the availability of health services would tend toaccentuate the sharp differences in health outcomes between the poor and the relatively well off.
70
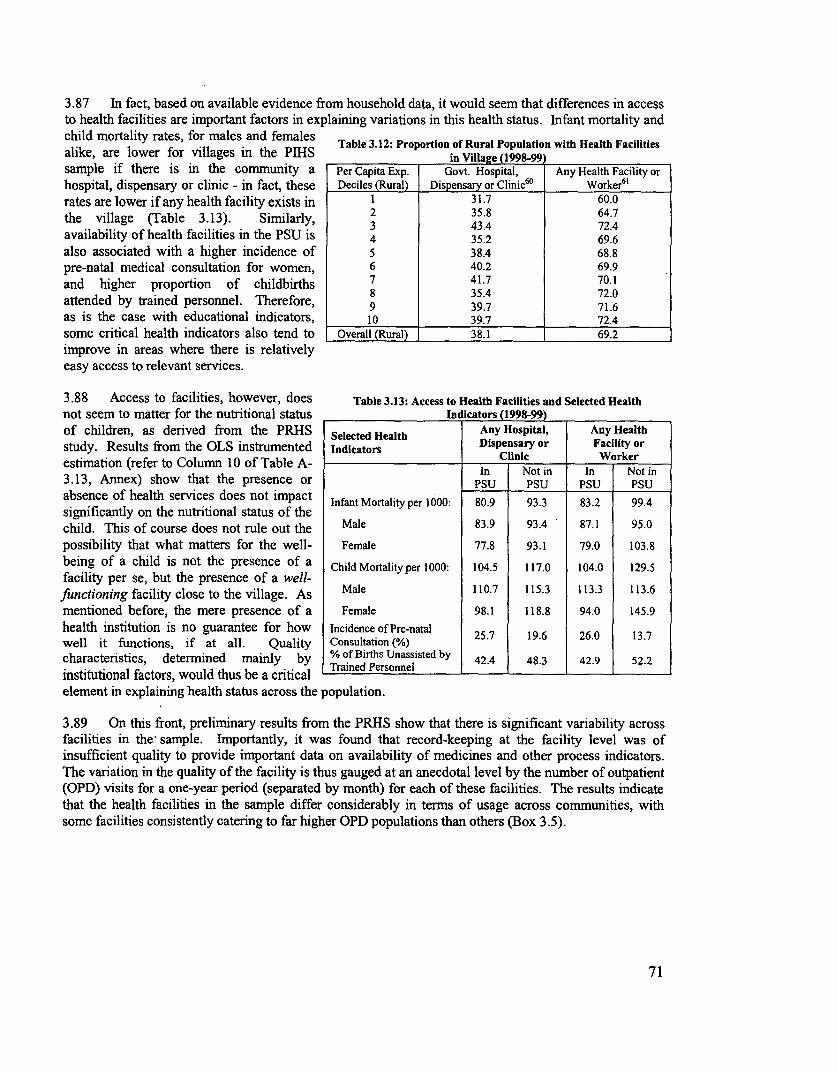
3.87 In fact, based on available evidence from household data, it would seem that differences in access
to health facilities are important factors in explaining variations in this health status. Infant mortality and
child mortality rates, for males and females Table 3.12: Proportion of Rural Population with Health Facilitiesalike, are lower for villages in the PIHS in Village (1998-99)
sample if there is in the community a Per Capita Exp. Govt. Hospital, Any Health Facility or
hospital, dispensary or clinic - in fact, these Deciles (Rural) Dispensary or Clinic60 Worker6'
rates are lower if any health facility exists in 1 31.7 60.0
the village (Table 3.13). Similarly, 3 4354 72.4
availability of health facilities in the PSU is 4 35.2 69.6
also associated with a higher incidence of 5 38.4 68.8
pre-natal medical consultation for women, 6 40.2 69.9
and higher proportion of childbirths 7 41.7 70.1
attended by trained personnel. Therefore, 8 35.4 72.6
as is the case with educational indicators, 10 39.7 72.4
some critical health indicators also tend to Overall (Rural) 38.1 69.2
improve in areas where there is relativelyeasy access to relevant services.
3.88 Access to facilities, however, does Table 3.13: Access to Health Facilities and Selected Health
not seem to matter for the nutritional status In icators (1998-99)
of children, as derived from the PRHS Selected Health Any Hospital, Any Health
study. Results from the OLS instrumented Indicators Dispensary or Facility or
estimation (refer to Column 10 of Table A- c linic WorkerIn Not in In Not in
3.13, Annex) show that the presence or ISU PSU psu psu
absence of health services does not impact Infant Mortality per 1000: 80.9 93.3 83.2 99.4
significantly on the nutritional status of thechild. This of course does not rule out the Male 83.9 93.4 87.1 95.0
possibility that what matters for the well- Female 77.8 93.1 79.0 103.8
being of a child is not the presence of a ChildMortalityper 000: 104.5 117.0 104.0 129.5
facility per se, but the presence of a well-functioning facility close to the village. As Male 110.7 115.3 113.3 113.6
mentioned before, the mere presence of a Female 98.1 118.8 94.0 145.9
health institution is no guarantee for how Incidence of Pre-natal 25.7 19.6 26.0 13.7
well it functions, if at all. Quality Consultation (%)
characteristics, determined mainly by % of Births Unassisted by 42.4 48.3 42.9 52.2
institutional factors, would thus be a critical Trained Personnel . -
element in explaining health status across the population.
3.89 On this front, preliminary results from the PRHS show that there is significant variability across
facilities in the- sample. Importantly, it was found that record-keeping at the facility level was of
insufficient quality to provide important data on availability of medicines and other process indicators.
The variation in the quality of the facility is thus gauged at an anecdotal level by the number of outpatient
(OPD) visits for a one-year period (separated by month) for each of these facilities. The results indicate
that the health facilities in the sample differ considerably in terms of usage across communities, with
some facilities consistently catering to far higher OPD populations than others (Box 3.5).
71
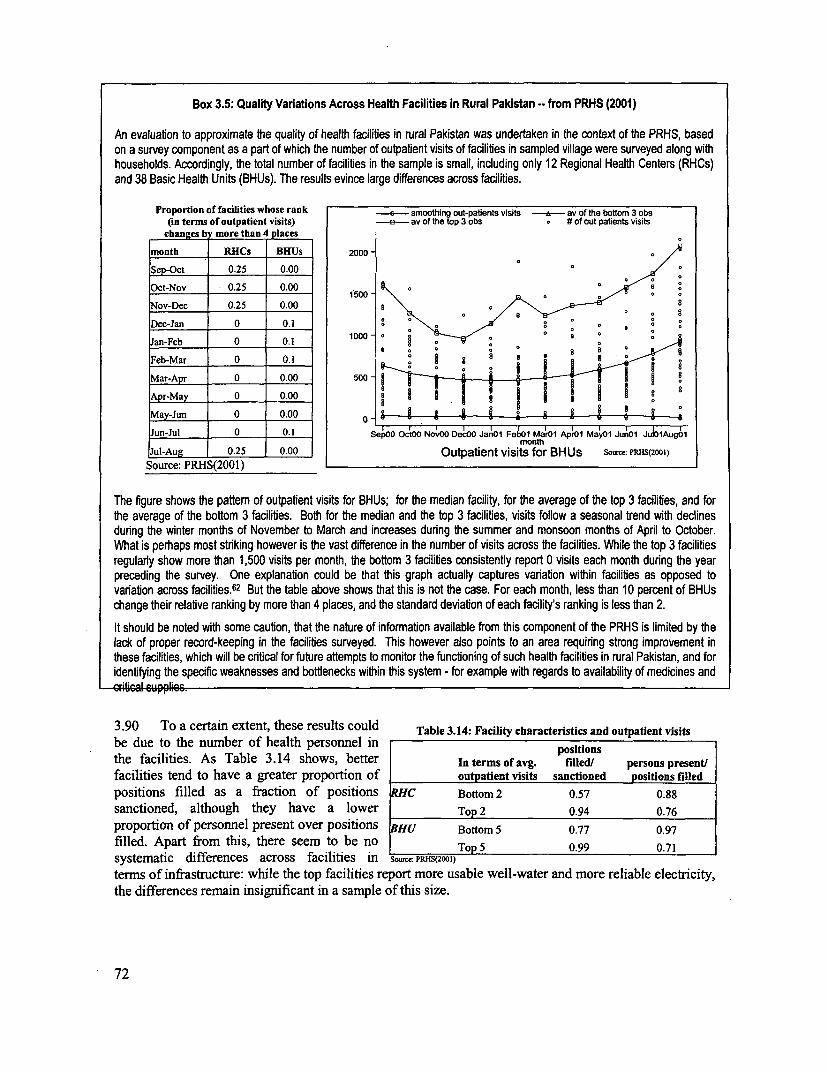
Box 3.5: Quality Variations Across Health Facilities in Rural Pakistan -- from PRHS (2001)
An evaluafion to approximate the quality of health facilities in rural Pakistan was undertaken in the context of the PRHS, basedon a survey component as a part of which the number of outpabent visits of facilitbes in sampled village were surveyed along withhouseholds. Accordingly, the total number of facilities in the sample is small, including only 12 Regional Health Centers (RHCs)and 38 Basic Health Units (BHUs). The results evince large differences across facilities.
Proportion of facilities whose rank - smoothing out-paUents visits - av of the bottom 3 obs(in terms of outpatient visits) - av of the top 3 obs o # of out patents visits
changes b more than 4 places
month RHCs BHUs 2000
Sep-Oct 0.25 0.00
Oct-Nov 0.25 0.00
Nov-Dec 0.25 0.00 9
Dec-Jan 0 0.1 0
Jan-Feb 0 0.1
Feb-Mar 0 0.1 - S R
Mar-Apr 0 0.00 500 8Apr-May 0 0.00 0
May-Jun 0 0.00 I 8 -- A Jun-Jul 0 0.1 SepOO OctOO NovOO DecOO Jan01 FebO1 Mar01 Apr01 Ma.Oi JunO1 Jul1oAugol
Jul-Aug 0.25 0.00 Outpatient visits for BHUs some: PRH5(20DI)Source: PRHS(2001)
The figure shows the pattem of outpatient visits for BHUs; for the median facility, for the average of the top 3 facilities, and forthe average of the bottom 3 facilities. Both for the median and the top 3 facilibes, visits follow a seasonal trend with dedinesduring the winter months of November to March and increases during the summer and monsoon months of April to October.What is perhaps most striking however is the vast difference in the number of visits across the facilities. While the top 3 facilitiesregularly show more than 1,500 visits per month, the bottom 3 facilities consistenbty report 0 visits each month during the yearpreceding the survey. One explanation could be that this graph actually captures variaion within facilibies as opposed tovariation across facilities.62 But the table above shows that this is not the case. For each month, less than 10 percent of BHUschange their relative ranking by more than 4 places, and the standard deviation of each facility's ranking is less than 2.It should be noted with some caubon, that the nature of informaton available from this component of the PRHS is limited by thelack of proper record-keeping in the facilities surveyed. This however also points to an area requiring strong improvement inthese facilities, which will be critical for future attempts to monitor the functioning of such health facilities in rural Pakistan, and foridentifying the specific weaknesses and bottlenecks within this system - for example with regards to availability of medicines andcGitcal supplioc.
3.90 To a certain extent, these results could Table 3.14: Facility characteristics and outpatient visitsbe due to the number of health personnel inthe facilities. As Table 3.14 shows, better In terms of avg. p tled/ persons presentfacilities tend to have a greater proportion of outpatient visits sanctioned positions filledpositions filled as a fraction of positions RHC Bottom 2 0.57 0.88sanctioned, although they have a lower Top 2 0.94 0.76proportion of personnel present over positions HU Bottom 5 0.77 0.97filled. Apart from this, there seem to be no To 5 0.99 0.71systematic differences across facilities in Source: PRHS(2001)
terms of infrastructure: while the top facilities report more usable well-water and more reliable electricity,the differences remain insignificant in a sample of this size.
72
3.91 Accordingly, the discussion so far, including that on the nutrition status of children and on the
state of health facilities in the sample, points towards the importance of effects at the community level,
including the quality and availability of health services, in determining the health status of the rural
population.. While measuring quality characteristics continues to be problematic due to the lack of proper
records and the absence of health facility surveys with sufficient breadth and detail, anecdotal evidence
provides some measure of such problems. Secondary sources indicate that while the number of doctors
and health facilities has grown in the 1980s and the 1990s, a dearth of qualified doctors in rural areas
remains a serious issue. There are also serious questions about public facilities, especially in rural ones
like RHCs and BHUs, where rampant absenteeism of medical personnel and severe shortages of
equipments and medicines are reported.63 This underscores the serious quality problems that beset health
service delivery, akin to those reported in its school facilities. The govemance problems that underpin
problems of access and quality in both these sectors are discussed in the following section.
The Political Economy of Service Delivery: Some Hypotheses
3.92 This section examines the political economy of poor educational and health outcomes in Pakistan,
particularly in light of the 2000 devolution plan for local govemment in the country. As noted in Chapter
1, it is difficult to attribute Pakistan's gap in human development indicators to low income, since they
suffer even in comparison to countries with similar income levels. Nor can this under-provision be
attributed simply to feudal domination, as is commonly held in journalistic and policy circles in Pakistan.
There is ample village-level evidence, also discussed in Chapter 1, that suggests that the rural poor do
have political voice and have on occasion voted out local landlord-politicians. Moreover, the influence of
landlords on local service delivery has not been uniformly pernicious. Indeed, the under-provision of
education and health is particularly perplexing because there is evidence that elected officials have been
eager and able to provide certain kinds of targeted goods to their constituents. As argued in Chapter 1 the
problem is at least partly one of govemance; decision makers have poor incentives to serve their
constituents, which in the context of health and education, negatively impacts the poor.
3.93 Although there are potentially many potential explanations for the failure of local service
delivery, this section focuses on only two. First, elected officials demonstrate an extraordinary interest in
providing targeted benefits to specific individuals or groups, rather than public goods to a wider and more
anonymous set of beneficiaries.64 Education and health have suffered in particular because of this since
universal access to these services is, by definition, untargeted. Notably, the formal institutions of political
competition and decision-making do not explain this incentive structure, but the unique informal rules of
political competition do seem to shed light on it. Second, it also appears that many households seem to
place a low value on education - particularly the education of girls - so that there may be little political
incentive to enhance the access of girls to education.
Political Institutions and Governance Problems in Service Delivery
3.94 Both the formal and informal rules of political decision-making and competition influence
political attitudes towards broad public goods. However, it tums out that such formal rules in Pakistan in
the 1990s should have led elected officials to focus less on targeted benefits. Accordingly, it was informal
political dynamics that seem to have mattered most.
73
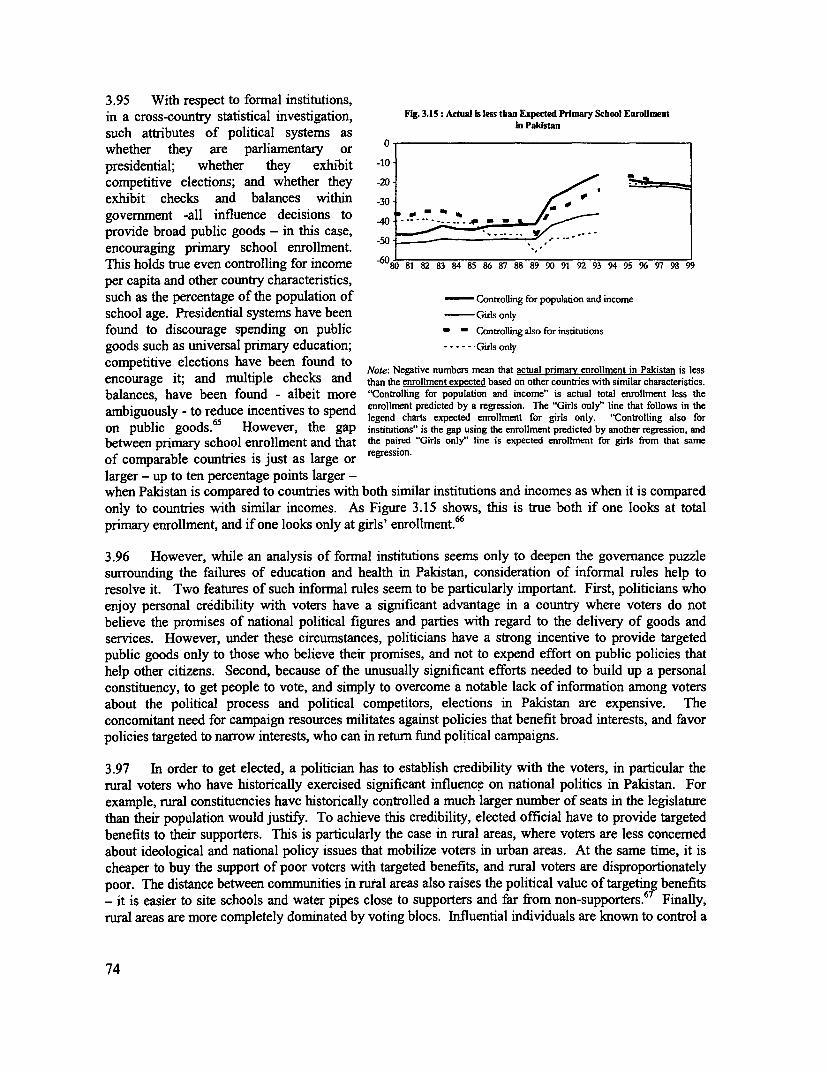
3.95 With respect to formal institutions,in a cross-country statistical investigation, Fig. 3.15: Actual is less than Expected Primary School Enrollment
such attributes of political systems as in Pakitanwhether they are parliamentary or 0presidential; whether they exhibit -10competitive elections; and whether they -20
exhibit checks and balances within -30.
government -all influence decisions to 0..0- -W- Vprovide broad public goods - in this case, - ........encouraging primary school enrollment.This holds true even controlling for income b6080 81 82 83 84 85 86 87 88 89 90 91 92 93 94 95 96 97 98 99per capita and other country characteristics,such as the percentage of the population of - Controlling for population and incomeschool age. Presidential systems have been Girs only
found to discourage spending on public - - Controllingalsoforinstitutionsgoods such as universal primary education; ...... Girs onl
competitive elections have been found tocompetitive elections have been found to Note: Negative numbers mean that actual primarv enrollment in Pakistan is lessencourage it; and multiple checks and than the enrollment expected based on other countries with similar characteristics.
balances, have been found - albeit more "Controlling for population and income" is actual total enrollment less theambiguously - to reduce incentives to spend enrollment predicted by a regression. The "Girls only" line that follows in the
65 a olegend charts expected enrollment for girls only. "Controlling also foron public goods. However, the gap institutions" is the gap using the enrollment predicted by another regression, andbetween primary school enrollment and that the paired "Girls only" line is expected enrollment for girls from that sameof comparable countries is just as large or regression.larger - up to ten percentage points larger -when Pakistan is compared to countries with both similar institutions and incomes as when it is comparedonly to countries with similar incomes. As Figure 3.15 shows, this is true both if one looks at totalprimary enrollment, and if one looks only at girls' enrollment.66
3.96 However, while an analysis of formal institutions seems only to deepen the governance puzzlesurrounding the failures of education and health in Pakistan, consideration of informal rules help toresolve it. Two features of such informal rules seem to be particularly important. First, politicians whoenjoy personal credibility with voters have a significant advantage in a country where voters do notbelieve the promises of national political figures and parties with regard to the delivery of goods andservices. However, under these circumstances, politicians have a strong incentive to provide targetedpublic goods only to those who believe their promises, and not to expend effort on public policies thathelp other citizens. Second, because of the unusually significant efforts needed to build up a personalconstituency, to get people to vote, and simply to overcome a notable lack of information among votersabout the political process and political competitors, elections in Pakistan are expensive. Theconcomitant need for campaign resources militates against policies that benefit broad interests, and favorpolicies targeted to narrow interests, who can in return fund political campaigns.
3.97 In order to get elected, a politician has to establish credibility with the voters, in particular therural voters who have historically exercised significant influence on national politics in Pakistan. Forexample, rural constituencies have historically controlled a much larger number of seats in the legislaturethan their population would justify. To achieve this credibility, elected official have to provide targetedbenefits to their supporters. This is particularly the case in rural areas, where voters are less concernedabout ideological and national policy issues that mobilize voters in urban areas. At the same time, it ischeaper to buy the support of poor voters with targeted benefits, and rural voters are disproportionatelypoor. The distance between communities in rural areas also raises the political value of targeting benefits- it is easier to site schools and water pipes close to supporters and far from non-supporters.67 Finally,rural areas are more completely dominated by voting blocs. Influential individuals are known to control a
74
precise number of votes, and whether those votes are cast and how they are cast is easy to monitor.
Patronage, then, is a far more effective strategy in rural areas than political strategies that rely on quality
public good provision. Because Pakistan's rural constituencies are particularly poor, particularly spread
out and thoroughly organized into voting blocs, the relative political benefits of providing narrowly
targeted rather than broadly available public goods, are high.
3.98 Pakistani legislators have argued publicly that the provision of targeted benefits unduly dominates
their political life. Wilder (1999) quotes former Members of the National Assembly from Punjab as
saying: "People now think that the job of an MNA and MPA is to fix their gutters, get their children
enrolled in school, arrange for job transfers...[These tasks] consume your whole day...." (p. 196); "Look,
we get elected because we are ba asr log [effective people] in our area. People vote for me because they
perceive me as someone who can help them...Somebody's son is a matric fail and I get him a job as a
teacher or a government servant ....... If somebody has merit they very rarely come to me......But it's the
real wrongdoers who come to me"(p. 204).
3.99 Notably, in contrast to the near exclusive dedication to resolving individual problems that
Pakistani legislators exhibited before suspension of the legislature, members of the United States
Congress, well-known for their incessant efforts to secure re-election, have been found to spend on
average fewer than six hours per week directly and personally intervening on behalf of constituents in
order to obtain favors for them or help them solve bureaucratic difficulties.68
3.100 Elected officials in Pakistan in the l990s also de-emphasized public goods because of their high
demand for resources to fund political campaigns - resources that generally come from narrow groups
that benefit from government policies in some way. While there are no exact figures on the role and
magnitude of campaign finance in Pakistani politics, vote buying and the growing expense of elections
are widely noted.69 Shafqat (1999) has argued that campaign spending rose to $120,000 per
parliamentarian in the 1997 elections. To provide some context, the electoral system that most closely
resembles Pakistan's is the United Kingdom's. There, spending per constituency amounted to less than
$10,000 in the 1992 elections.70
3.101 While the incentives of political decision makers have been helpful in ensuring better access to
potable water and to market roads, as noted in Chapter one, they pose significant problems for health and
educational policy in Pakistan. Good quality schooling and healthcare cannot be effectively targeted to a
politician's supporters and therefore fail as mechanisms for generating political support. Unlike
investments in infrastructure, such as road construction and the provision of potable water, as discussed in
Chapter 1, higher teacher and doctor attendance, and better teaching materials and medical equipment
benefit everyone in the village, supporters and non-supporters alike. 7 ' And, to the extent that politicians
do focus on educational and health provision, they do so in a manner that is more consistent with the
patronage model: schools and hospitals are built for the jobs and profit opportunities that construction
provides; teacher and doctor postings are based relatively less on merit and relatively more on the
political calculation of how best to provide jobs to supporters or their relatives; and few efforts are made
to extend schooling access to disfavored castes when the politician relies on votes from the favored
castes, as in Box 3.3.
The Demandfor Social Services and Governance
3.102 Beyond the political incentives created by informal rules of political competition, it is also the
case that many Pakistani households seem to place a different value on education than households in
comparator countries, particularly the education of daughters. The previous sections pointed to some of
the evidence for the significant social and cultural barriers to improved access to education for girls.
Nearly half of all girls between 10 and 20 years old have never attended school. When asked why, the
75
parents of nearly 40 percent of these girls indicated that parental or elder disapproval was the mainreason, though as noted again, there are problems in interpreting these subjective responses due tooutstanding uncertainties about whether these may mask supply-side problems and more complexparental trade-offs between the relative costs and benefits of sending their female children to school.While it is conceivable that there are similar cultural barriers to improving health, particularly withregards to contraceptive use, the demand component of the health sector is not as well understood.
3.103 It is clear however that even if formal and informal institutional obstacles to educational supplywere removed, educational improvements may be conditional on an attitudinal change among parents.From the point of view of elected officials, pushing for expanded access for girls to existing educationalfacilities is therefore not only of limited political utility, but presents real political hazards. Parentalresistance also has implications for the success of institutional reforms such as decentralization, sinceexperience elsewhere suggests that local officials in areas where these norms are prevalent may besingularly unable to push through reforms that increase girls' access to education.
Devolution, Governance and Service Delivery
3.104 The above concerns are particularly fraught with significance in light of Pakistan's massivedevolution effort, which was launched in 2000, and sees as its main objective precisely the improvementof availability of government services to all Pakistanis. While the concomitant political reforms are onlyan initial step, and the crucial areas of fiscal and administrative decentralization have yet to be tackled,the preceding discussion suggests that devolution will succeed only to the extent that it solvesfundamental governance problems that have bedeviled earlier efforts to improve service delivery. Inparticular, devolution will only succeed to the extent that local government officials exhibit a notablygreater interest in improving the provision of public goods than in targeting private goods, and if they arebetter placed to overcome any eventual parental resistance to the education of girls. A preliminaryanalysis suggests some reason for optimism on the first count, and some reason for pessimism on thesecond.
3.105 Some observers are pessimistic that local governments will have a greater incentive to improveaccess to and the quality of education in their jurisdictions. Press accounts of recent union councilelections note that in many places familiar "old faces" seem to have dominated the election returns.Moreover, the prevalence of "old faces" is greatest in precisely those areas of the country in whichpatronage rather than public good provision has been the most intense focus of political competition (e.g.,in rural areas). Still, depending on how they work in practice, the institutional changes introduced bydevolution could reduce the patronage incentives even of the "old guard." Information that is currentlybeing collected in the field will help to verify whether these positive effects are, in practice, actually beingrealized.
3.106 One potentially important change that could improve outcomes under devolution is that localofficials may only be able to fund patronage by making transfers from one set of voters inside theirjurisdiction to another. Before devolution, patronage could be funded by transferring resources fromvoters outside of their jurisdiction - for example, urban voters - reducing the political costs of providingbenefits to supporters. Under devolution, then, the net number of votes that a local official wins byproviding patronage may drop. This is all the more true the more homogeneous are voters in thejurisdiction (for example, with respect to income, ideological orientation, or ethnic group). In this regardit is notable that the constituencies of the members of the national and provincial legislatures were likelymore heterogeneous than those of the Union Nazims who comprise the new District Councils.Consequently, the Union Nazims should find patronage somewhat less desirable than earlier politicaldecision makers. Accordingly, a Union Nazim is still likely to find it politically useful to influence
76
teacher appointments, but he may have a stronger incentive than the previous MNA or MPA, to ensure
that such teachers show up to teach.72
3.107 A necessary pre-condition for optimism, though, is that the elections at the local level be
competitive. If one or two families, biraderis or individuals dominate electoral competition in most
Union Councils throughout a District, then we would expect little change in public good provision. The
cross-country empirical results demonstrate strongly that the competitiveness of elections has an
extremely strong and positive effect on enrollment in primary school; the same should be true in
decentralized electoral settings. If the return of the "old guard" is a consequence of their extra-
institutional influence over the electoral process - i.e. if they faced no real competition - then we should
expect no change in educational outcomes.
3.108 A preliminary analysis of the recently concluded local government elections provides some
evidence that the local contests were generally competitive. Overall, voter turnout was a respectable 52.5
percent, which indicates that the outcome was not a forgone conclusion in many or most constituencies,
and did elicit the interest of a majority of voters. In general, several candidates competed for each union
council seat, and only approximately 6 percent of the candidates for the unreserved seats were elected
unopposed. However, further analysis, for example of vote shares of competing candidates and variations
in turnout across union councils, is required before one can say definitively that the competitive election
condition has been met in local elections.
3.109 Devolution may also have created more checks on local officials who try to provide patronage.
During the 1990s, decisions regarding teacher postings or reactions to teacher absenteeism could be
appealed only to the provincial government hierarchy, or the MPA or MNA for that district. Under the
new system, there are two types of potential checks, whose efficacy must be verified (and enhanced,
where possible). First, parents can appeal to members of the Union Council (a district or Zila is
comprised of many unions), who are directly elected by voters and who in turn vote for the District, or
Zila Nazim, who sits at the apex of decision-making under devolution. They can also appeal to the
District Nazim, to the district educational bureaucracy, or to the District Council itself, whose members
are comprised of the directly elected Union Nazims and others. In practice, however, the effectiveness of
these additional avenues of appeal requires further investigation.
3.110 An additional and more obvious potential check is simply that decisions of the Nazims at each
level may need to be. approved by the appropriate council. If the new councils are independentlypowerful and not controlled by the Nazims, the sheer number of Union Council members will make it
more difficult for Nazims, or any individual council members, to systematically tax some groups in order
to provide patronage. However, the independence of the legislative branches under devolution, and their
authority, is not yet clear. In addition, there is some evidence of rules that are intended to weaken the
councils relative to the Nazims. Councils have the power to impeach nazims, but beyond this the extent
to which the councils can reverse or block Nazim decisions regarding the district budget, the targeting of
expenditures or the conduct of the district administration, are unclear. Moreover, there are a number of
laws that weaken legislative oversight. The Naib Nazim - the deputy mayor - is required to be the chair
or "speaker" of the Council - by definition; however, the Naib Nazim is close to the Nazim, since they
are co-elected. 'Second, the law imposes significant risks on Council members who move for
impeachment - the failure of an impeachment motion means that the council members who moved and
seconded it lose their seats. To the extent that Council authority is weak, little will prevent the Nazim
from targeting his supporters at the expense of his non-supporters, to the detriment of public good
provision.
3.111 Therefore, devolution can provide a positive change to the incentives of government decision
makers regarding education, but only under the conditions specified above. Even in theory, though, it is
77
unlikely that devolution can solve the demand problems in education: resistance to standard forms ofeducational provision for girls. Indeed, two examples, although not perfectly comparable, indicate thatovercoming social barriers to girls' education will likely require significant resources and the continued,or even increased, involvement of higher-level governments.
3.112 First, experience in Nepal and other places shows that girls' education can be dramaticallyimproved by paying families to send their daughters to school. In these instances, poor families saw littleeconomic return to educating girls, and monetary compensation was a natural means to persuade them todecide otherwise. In Pakistan, however, any similar program would have to set compensation at a levelsufficient not only to offset the economic costs of girls' education, but also the disutility that parentsattribute to sending their daughters to school.
3.113 Second, in the United States, efforts to persuade states to provide education to African-Americanstudents in the same facilities as other students eventually required federal intervention, over theobjections of the representatives of these states in the national legislature. Again, the parallels withPakistan are inexact, since African-American families were eager to educate their children and frustratedby the lack of access. The key point, though, is that significant local opposition to an education reformdid not naturally dissipate as a consequence of local reform efforts, but required the intervention of ahigher level government.
3.114 Difficulties in enforcing accountability for service provision emerge under devolution if localconstituencies do not place a high priority on education. For example, central government efforts toreward high-performing districts with extra education funding are likely-to be ineffective if parents inparticular districts are uninterested in educating girls. However, solutions to this problem are available,and need not involve the level of coercion that was required to integrate schools in the US. One involvesoutright subsidies to households to overcome the demand problem, as in Nepal. Another involves cross-sectoral linkages: central government rewards to high-performing districts could take the form ofincreased assistance in the provision of goods - such as infrastructure - that are heavily demanded in theconstituency. Again, however, further information is needed to evaluate the extent to which officials inthe new local governments have the incentive and resources to improve educational provision on alldimensions.
3.115 The demand issue reveals another, broader concern regarding the success of devolution, which isthe continuing important role of the central government. To the extent that governance problems notedabove and in Chapter One are not addressed, central government efforts to, for example, provideincentives to local officials to educate girls are likely to be poorly implemented. Even more seriously, theformal institutional rules of the new system of local government may not be self-enforcing - they mayrequire central government oversight to ensure, for example, that Nazims do not invoke extra-legal orillegal authority to circumvent formal rules. Only a central government that is itself relatively free ofgovemance problems will reliably intervene in such cases to protect the integrity of the devolutionprocess. Similarly, the central government can best ensure the integrity of the devolution process byallowing local governments to make their own decisions about how to implement education, health andother objectives in their jurisdictions. The central government's role would be to closely observe, to test,and to collect and publicize information about outcomes and "value for money" across the union councils.This role will be undercut if governance failures that have crippled central government performance in thepast are not addressed in the future.
3.116 In concluding this chapter, it is important to note that the human development diagnostics andtheir implications for policy outlined here will forrn the basis for the discussion in Chapter 5 on theeducation and health sector strategies adopted by the government, in the overall framework of the I-PRSP. The objective there will be to focus on the critical issues that are likely to determine how
78
particular strategies of institutional reform, including the broad devolution exercise, are able to addressthe policy challenges identified here.
' Pakistan Rural Household Survey (PRHS), 20012 All findings from PIHS (1991 to 1996-97) are from "PIHS Education Sector Performance in the 1990s" by FederalBureau of Statistics, Government of Pakistan, Islamabad, and from Pakistan Poverty Assessment (1995), World Bank.Figures for 1998-99 are from staff calculations on PIHS/HIES (1998-99).3 Note: Data source for all tables and graphs in this chapter, unless otherwise specified, is PIHS for the relevantyears4For urban males, primnary GER increased from 86 percent to 95 percent; for urban females, the increase was from 77percent to 88 percent.
Table A-3.1, Annex6 See Table A-3.2, Appendix for 1998-99 figures7 Filmer et al (1998)8 See Alderman and Garcia (1994), Behrman and Deolalikar (1995) and Quisumbing (1996)9 Andrabi et al (2002)'0AII numbers in Figures 4.1 and 4.2, and Table 3 have been calculated taking the 4 main provinces - Punjab, Sindh,NWFP and Balochistan only - to ensure comparability between 1991 and 1998-99, since the 1991 numbers took intoaccount these provinces only. It is easy to see that the numbers for 1998-99 by per capita expenditure deciles are verysimilar whether the 4 main provinces or all provinces are counted." The Census of Private Schools was conducted by the Federal Bureau of Statistics, GOP in 200012 In urban areas, the absolute enrollment in government schools for both sexes fell by about 11 percent during 1991to 1995-96, while that in the non-government sector increased by as much as 60 percent. In rural areas, boys'enrollment in the non-government sector increased by 131 percent over this period, while for girls the increase was61 percent.13 The share of deeni madrassas is 1.2 and 0.8 percent in primary enrollment for urban and rural regions respectively, andthat in secondary enrollment is less than 0.5 percent for either region.14Okayfor Age: Currently enrolled in school in a grade suitable for age or higher; Behindfor Age: Currently enrolled in agrade lower than suitable for age; Left School: Have attended school, but not currently enrolled; Never Attended: Neverwent to school. Target age for Grade 1 is taken to be 6 years; target age for Grade 12 is 17 years. This is done eventhough technically the age for grade 1 is 5 years, to allow for more leeway in judging whether a child is enrolled in theright grade for his/her age. The same rule was adopted by the PIHS Education Report of the 1990s by the FBS.5 Refer to Figures A-3.1 and A-3.2, Annex for enrollment profiles in urban areas.
'6 Refer to Table A-3.3, Annex7 According to PRHS (2001), 63 percent of women between ages 5 and 21 have never attended school, compared to34 percent of mnales. These numbers are similar to what is seen for the same age groups in rural Pakistan from PIHS(1998-99) - a survey that is representative for the country.18 Existing literature has found evidence that having a literate family member is like being partly literate oneself (Greenet al, 1985), and that the advantages of literacy can spread to others in the household by virtue of certain kinds ofdecision-making on behalf of the household shifting toward the literate (Drnze and Saran, 1995); an attempt has alsobeen made to develop a theoretical measure of literacy which captures these natural externalities (Basu and Foster, 1998)19 The difference in wages between male literate and non-literate workers is statistically insignificant in the farmsector.20 The estimation exercise uses the maximum-likelihood Heckman selection model to correct for any "selectionbias", arising out of the fact that one only observes wage earnings for those who have chosen to enter the (paid)work force, and that some of the variables that affect earnings also affect the "participation" of the worker in thepaid labor force.
A possible challenge to the findings on education externalities would be on the grounds of endogeneity of educationalstatus of household members with respect to earnings. The so-called externality would then be the result of a positiveeffect of higher earnings of a wage-earner on school participation of other household members. The observeddifferences in externalities between farm and non-farm sector however suggest that the endogeneity argument is unlikelyto explain the entire measured effects. For if it were so, one would have to believe that the effect of earnings oneducation is stronger for non-farm earnings than for farm earnings.
79
22 This exercise is similar to what has been conducted in recent literature using household data from Bangladesh(Basu et al, 2001). Some of the results from that study are qualitatively similar, e.g. that education externalities arerelatively stronger in the non-farm sector and almost absent in the farm sector. That study however finds thatexternality benefits confer more strongly to women than to men, which is the opposite of what is found for Pakistan.23 However, the results should be interpreted with caution, since the analysis cannot distinguish between the supplyand demand factors that interact to produce the observed patterns in enrollment, as well as endogeneity issues, forexample the possibility that supply of schools may respond to demand for schools represented by existing schoolparticipation rates. In that sense, these results provide only a rough indication of the precise roles played bydifferent factors.24 This exercise is similar to the models estimated in Filmer and Pritchett (1994). Their results for India are comnparable;they estimate that the probability of a child attending school is 10 percent, 17 percent, 24 percent and 31 percent higher ifhis/her household belongs to the 2nd, 3rd, 4th and 5th deciles respectively, defined by wealth (and not expenditure).25 Only a small proportion of rural mothers of boys and girls alike are literate, implying that the results for those groupsshould be interpreted with caution. The sample sizes are much larger for all groups of fathers.26 The presence of a school is defined as the existence of a school meant for child of a particular sex. For example, for agirl child in community A, a primary school is defined to be present if there exists a girls only or co-ed school offeringprimary education, in or within I km. of the community.
Such observations are not meaningful with net primary enrollment rates for boys, since access to primary schools forboys is very high overall as well as quite uniform across provinces.28 Refer to Table A-3.9, Annex.29 Refer to Table A-3.10, Annex for access figures by province.30 Alderman et al (1999)31 Gazdar (2000) reports that out of 125 schools visited by the survey team, only 47 out of 125 schools wereclassified as "fully functional" by the survey. The poor quality of schools has strong detrimental effects onattendance of students, a fact usually not reflected by the enrollment figures quoted so far.32 This added up to 206 primary schools, mostly public.33 These findings from the PRHS, although based on a different sample, are roughly similar to Gazdar's findings.The latter found that 14 percent of the 125 schools visited (i.e., 17 schools) had either a building but no school, orwere reported to be "generally closed".34 There is an interesting discrepancy in student attendance rates between those reported by headmasters and thosedirectly observed by the survey staff. The headmaster survey revealed a much higher number - approximately 78percent for both boys and girls. Other sources (Gazdar 2000) suggest that the true figure is closer to the onereported by direct observation. This difference perhaps highlights the incentives that headmasters have inmisreporting school performance indicators.35 Note that the finding that enrollments are higher when just a facility is present in the community is consistent withpreviously reported findings from the PIHS (98-99).36 Figures from recurring expenditures in education (Economic Survey of Pakistan, 2000)37 Scrimshaw 1995; Filmer and Pritchett; Jensen 2001; Riley38 Pre-natal as well as post natal consultation includes any consultation with medical personnel including traditionalbirth attendants.39 Refers to the proportion of deliveries not assisted by any doctor, nurse, trained birth attendant or dai, or lady healthworker; these deliveries are assisted only by family members, neighbors or traditional birth attendants.40 From Poverty Assessment for Pakistan (1995), World Bank41 Infant mortality rates were calculated as averages for children bom in the period 1993-97, to ensure that only infantswho would be of age I and above (if they were alive) are considered.42 The rural-urban gap persists across almost all provinces, with the exceptions of Balochistan and Azad J & K, whereinfant mortality is actually higher in urban areas than in rural areas (see Figure A-3.6, Annex).43 Examples of such studies include Foster (1995), Case and Deaton (1998), Gertler and Grueber (1997), Schultz andTansel (1997), and Dow et al. (1997).44 Moreover, curiously enough, no clear relationship between incidence of diarrhea, and indicators of sanitation, orsource of drinking water for the household emerges from the household data.45 For detailed discussion on analysis of child nutrition using PRHS(2001), see Annex 3.246 Dow et al., Murray and Chen (1992)47 The results presented here build on the work by Alderman and Garcia ( 1993), Alderman et al (2001), Haddad etal (1996), Hughes and Dunleavy (2000) and Alderman, Grosh and Glewwe (2000). The body of work by Alderman
80
et al. (2001) on Pakistan is particularly relevant, and will form the basis of the comparisons undertaken in thissection48One area of particular concern is the number of observations that are unusable at this moment. For this reason, theresults are presented at the 10 percent level of significance in addition to the standard 1 percent and 5 percent levels.The analysis will be updated later by using the expanded sample following an extensive round of cleaning and re-matching (see Annex for details).49 All variables used in the study were measured by the surveyors and measurement error in the weight of the childwas significantly reduced through the use of electronic scales with an error margin of <100 gin.50 These results match up with those reported by Alderman and Garcia (1993) for the IFPRI survey51 A longitudinal study in Guatemala reported in Martorell et al. (1990 and 1995) showed that while supplements inthe first two years of the childhood had significant impacts on adolescent intelligence and adult work-capacity,interventions during the later childhood years did not have any such benefits" Scrimshaw (1995)53 If it is the case that infant mortality among girls is significantly higher, the sample of children observed for eachcohort will select on 'more-healthy' girls compared to boys, and this could lead us to (erroneously) conclude thatthere is no gender discrimination in nutrition status in our sample.54 Estimations are based on a reduced form household maximization program as in Alderman et al (2001). Thecommunity fixed effects model implicitly argues that there may be attributes of communities that determine thenutritional status of the child, and that may be correlated positively with expenditure.ss Such results have been noted, both in Alderman et al (2001) with regard to anthropometry and Hughes andDunleavy (2000) for mortality data in Peru and India respectively. This result occurs for the PRHS sample, eventhough over 70 percent of the variation in income is generated by within conununity differences, and less than 30percent by differences across communities.6 At this stage, one might be interested in knowing more about what the community level fixed effects proxy for
(see Annex for the possible ways this can be done)See Table A-16 (Appendix) for a comparison of selected health indicators across provinces.
58 See for instance, Thomas et al (1992)59 See Table A-3.14, Annex60 Including government hospitals, dispensaries, BHUs, RHCs, Mother & Child Clinics, and Family Welfare Clinics61 Includes health workers, private practitioners and nurses62 In other words, the number of OPD patients in each facility fluctuates with other services (such as the availabilityof medicines) and hence the identity of the top 3 and the bottom 3 facilities changes across the sample period63 See Chapter 7 of the report by SPDC (2000)64 This focus on the incentives of elected officials should not suggest that centralized, authoritarian regimes arebetter at providing public goods. The educational achievement gap in Pakistan was much higher under the militarygovernment in the 1980s than in the 1990s; there is no evidence that elections per se are responsible for the gap, butrather that the incentives of elected officials were not as directed as they could have been to the provision of publicFoods.
Checks and balances reduce incentives to spend on public goods to the extent that, as the number of individualsexercising veto power over government decision-making rises, their interests become narrower and less coincidentwith the provision of broad public goods.66 The difference between the two gaps (girls only and all children) seems to have disappeared in the late 1990s.However, this is likely an artifact of the data. Through 1993, the data comes from World Development Indicators;from 1995 on, the data has been calculated from the PIHS data reported in the earlier part of this chapter. Theresulting data series exhibits an unexplained jump in gross primary school enrollment for girls between 1993 and1995 from 45.4 percent to 60 percent, and a decline in the enrollment of boys from 100 percent to 81 percent. Notealso that average per capita incomes (purchasing power parity adjusted) rose 9.5 percent or $US740 from 1995 to1999, but only 3.3 percent in Pakistan, or $US58. This effect alone would have caused all gaps to convergesomewhat.67 Gazdar also points out several examples where even the intra-village location of a school was contentious anddictated by political influences, underlining the significance of the targeting influence in the location of developmentprojects, and the political obstacles to government activities that are not easily targeted. Also see Dixit andLondregan (1996).68 This is the time they spend while in Washington, as opposed to their districts, to make the appropriate comparisonwith the citations from Pakistan: Johannes (1983)
81
69 see, e.g., Wilder, page 20670 The information comes from Pattie et al (1995)7' Potable water has some of the characteristics of a private good, in that it can be targeted to specific groups.Although a road per se is a public good, the construction of it can be contracted out to specific private parties inexchange for political support.72 An additional advantage of devolution operates on the demand side. In Chapter 1, the point was made that moreethnically or linguistically heterogeneous jurisdictions may provide fewer public goods. The entire country ofPakistan is likely to be considerably more heterogeneous than most districts that are the focal point of governmentdecision making under devolution.
82
4. The Rural Nexus: Poverty and Productivity
4.1 By 1998/99, 29 million poor people, two-thirds of all Pakistan's poor, lived in rural areas. Withinrural areas, poverty in Pakistan remained more or less stagnant during the 1990's, averaging about 36percent. Although rural households earn their livelihoods from a number sources, most are linked directlyor indirectly to agriculture. So, it is indeed puzzling that agricultural productivity actually grew at anannual rate of 4.8 percent during the 90's, far outstripping the population growth rate of 2.5 percent.'Clearly, rural poverty is as complex a phenomenon as it is persistent. And, yet, it is important to bear inmind that, despite this growth, productivity in Pakistan's agriculture is, in an absolute sense, very low.Moreover, as argued in this chapter, there is still considerable scope for policy intervention aimed atenhancing agricultural productivity in Pakistan. Increasing the ability of cultivating households togenerate income must, ultimately, be the focus of any sustainable poverty reduction strategy in ruralPakistan.
4.2 The focus of the chapter is, accordingly, on understanding the constraints to farm productivity inPakistan, which is to say: the limitations on access to productive resources; principally, land, irrigation,soil fertility, and credit. The analysis relies largely on new data from the 2001 Pakistan Rural HouseholdSurvey (PRHS), a nationally representative survey of rural areas that covers a broad range of issues,including detailed information on farm production. Much of the evidence from the PRHS, it should beemphasized, is of a preliminary nature, and should therefore be viewed as suggestive at this stage.Nonetheless, this chapter does, at the very least, lay out a roadmap for future analytical work on ruralPakistan.
4.3 A recurrent theme of this chapter is that inequality in asset ownership, particularly land, may befar more than a distributional concern; it may affect productivity. There are direct effects of landinequality on productivity resulting from frictions in the land purchase and leasing markets. Because ofthese problems, inequality in household land ownership translates (though far less than acre-for-acre) intoinequality in operated area per household. Since, as will be shown, households with larger operated areahave lower yields and are less productive, land inequality leads directly to lower productivity.
4.4 There are also more indirect and subtle effects of land inequality on productivity, some of whichreceive empirical support in this chapter. For example, corruption on Pakistan's public canal irrigationsystem is widely viewed as a constraint on agricultural productivity. Large landowners often engage inwasteful rent-seeking behavior, using their influence with irrigation officials to manipulate the waterdistribution in their favor.
4.5 Land inequality can also lower incentives to invest in land. The skewed distribution of land leadsto tenancy, mostly on share basis, which provides lower incentives for investment in soil fertility thanunder owner-cultivation. Soil degradation, due to waterlogging and salinity, is quite significant in ruralPakistan, particularly in Sindh province and in Southern Punjab. As a consequence of pervasive landtenancy, available medium and longer-term measures to combat soil salinity are rarely undertaken,resulting in loss of cultivated area and low yields.
4.6 Lastly, due to collateral requirements, land-poor households are mostly excluded from the formalcredit market, which can finance precisely the long-term productive investments in land and agriculturalmachinery that can raise them out of poverty. As a result, unequal land ownership may lead to entrenchedrural poverty.
83
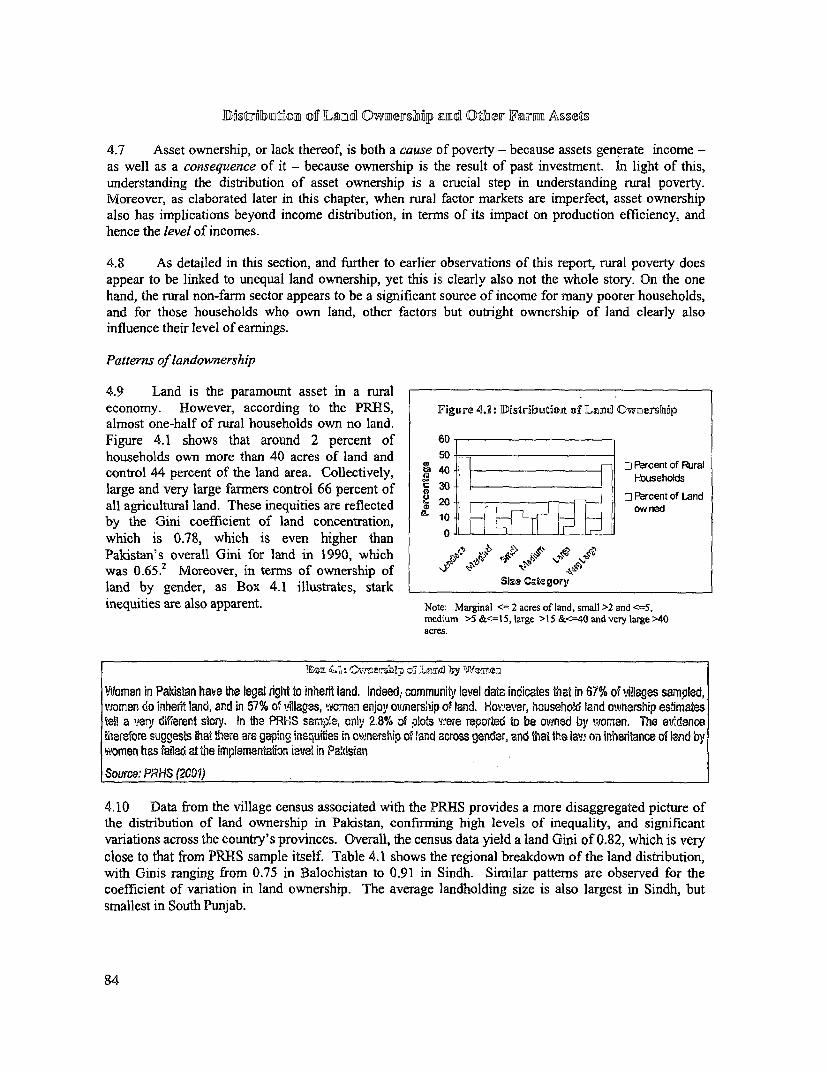
HC21biltolm of Laml GwnmelrsYi nrmd ¢D¢hir JFarmm AsseCs
4.7 Asset ownership, or lack thereof, is both a cause of poverty - because assets generate income -as well as a consequence of it - because ownership is the result of past investment. In light of this,understanding the distribution of asset ownership is a crucial step in understanding rural poverty.Moreover, as elaborated later in this chapter, when rural factor markets are imperfect, asset ownershipalso has implications beyond income distribution, in terms of its impact on production efficiency, andhence the level of incomes.
4.8 As detailed in this section, and further to earlier observations of this report, rural poverty doesappear to be linked to unequal land ownership, yet this is clearly also not the whole story. On the onehand, the rural non-farm sector appears to be a significant source of income for many poorer households,and for those households who own land, other factors but outright ownership of land clearly alsoinfluence their level of earnings.
Patterns of landownership
4.9 Land is the paramount asset in a ruraleconomy. However, according to the PRHS, Figure 4.1: 1DWstrnbudtion of Land Ownershipalmost one-half of rural households own no land.Figure 4.1 shows that around 2 percent of 60households own more than 40 acres of land and sofcontrol 44 percent of the land area. Collectively, a Households
large and very large farmers control 66 percent of ,, 30 lall agricultural land. These inequities are reflected e 20 ow ned
by the Gini coefficient of land concentration, 10which is 0.78, which is even higher than O . _ V mlA
Pakistan's overall Gini for land in 1990, which po , e
was 0.65.2 Moreover, in terms of ownership ofland by gender, as Box 4.1 illustrates, stark Size Category
inequities are also apparent. Note: Marginal <= 2 acres of land, small >2 and c=5,rnedium >5 &<=15, large >15 &<=40 and very large >40acres.
D1m 4.f: Ow era12tM eT ZJImd by Wairlen
Women in Pakistan have the legal rght to inherit land. Indeed; community level data indicates that in 67% of villages sampled,women do inhert land, and in 57% of villages, wometnenjoy ovnership of land. Hovwaver, household land ownership esbmatesit a veny dirierent story. In tha PRPS sam.ploe, only 2.8% of plots were repore to be owned by women. The ev.dencetherefore suggests that thewe are gaping inequites in ownership of land across gender, and that the law on inheritance of land bywomen has failed at the implamentaton lavet in Pakistan
Source: PRHS (2001)
4.10 Data from the village census associated with the PRHS provides a more disaggregated picture ofthe distribution of land ownership in Pakistan, confirming high levels of inequality, and significantvariations across the country's provinces. Overall, the census data yield a land Gini of 0.82, which is very
close to that from PRHS sample itself. Table 4.1 shows the regional breakdown of the land distribution,with Ginis ranging from 0.75 in Balochistan to 0.91 in Sindh. Simnilar pattems are observed for thecoefficient of variation in land ownership. The average landholding size is also largest in Sindh, butsmallest in South Punjab.
84
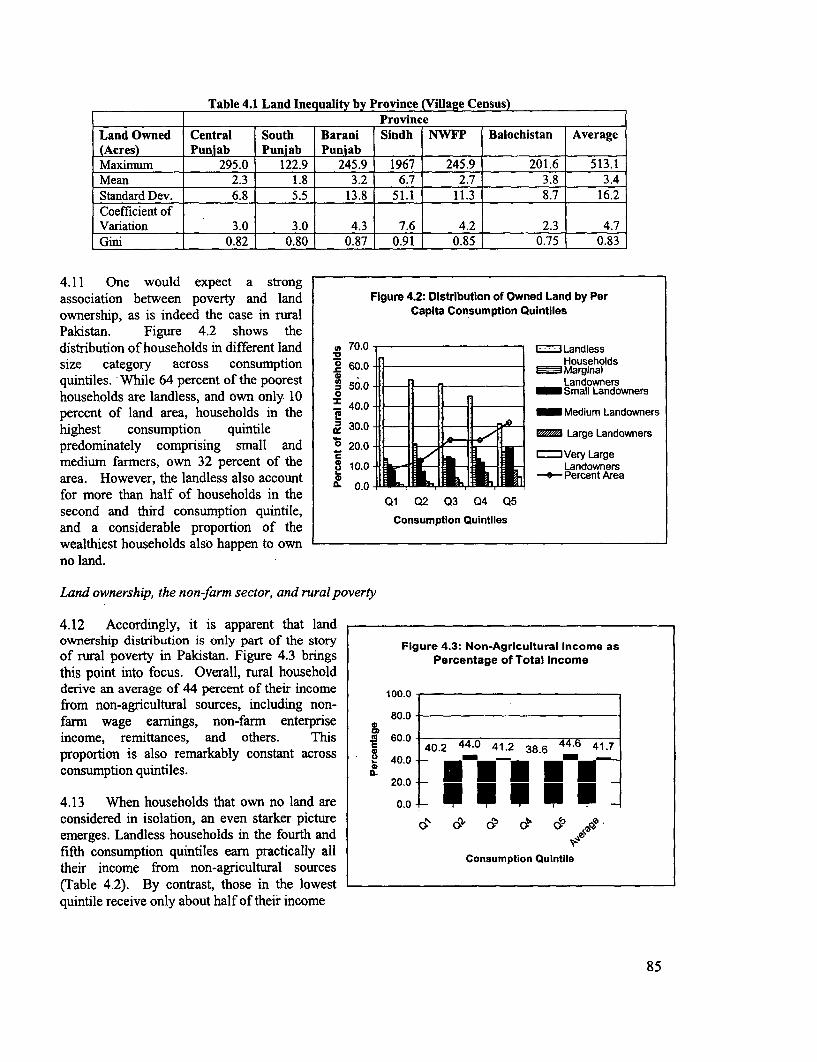
Table 4.1 Land Inequality by Province (Village Census)Province
Land Owned Central South Barani Sindh NWFP Balochistan Average(Acres) Punjab Pun,jab Punjab IMaximum 295.0 122.9 245.9 1967 245.9 201.6 513.1Mean 2.3 1.8 3.2 6.7 2.7 3.8 3.4Standard Dev. 6.8 5.5 13.8 51.1 11.3 8.7 16.2Coefficient ofVariation 3.0 3.0 4.3 7.6 4.2 2.3 4.7Gini 0.82 0.80 0.87 0.91 0.85 0.75 0.83
4.11 One would expect a strongassociation between poverty and land Figure 4.2: Distribution of Owned Land by Perownership, as is indeed the case in rural Capita Consumption QuintilesPakistan. Figure 4.2 shows thedistribution of households in different land X 70.0 - r*.vLandlesssize category across consumption ° 60.0 Marginalquintiles. While 64 percent of the poorest 50. r Landownershouseholds are landless, and own only 10 I Small Landownerspercent of land area, households in the f Medium Landownershighest consumption quintile l Large Landowners
predominately comprising small and 6 20.0 _V Largemedium farmers, own 32 percent of the 10.0 Landownersarea. However, the landless also account X 0.0 -L-Percent Areafor more than half of households in the Q3asecond and third consumption quintile, QC Q2 Q3 04 Q5and a considerable proportion of the Consumption Quintileswealthiest households also happen to ownno land.
Land ownership, the non-farm sector, and rural poverty
4.12 Accordingly, it is apparent that landownership distribution is only part of the story Figure 4.3: Non-Agricultural Income asof rural poverty in Pakistan. Figure 4.3 brings Percentage of Total Incomethis point into focus. Overall, rural householdderive an average of 44 percent of their income 100.0from non-agricultural sources, including non-farm wage earnings, non-farm enterprise 80.0
income, remittances, and others. This .9 60.0 4 4406 4117proportion is also remarkably constant across 40.0 2 4 2 38.6 4 4consumption quintiles. 200 * * *4.13 When households that own no land are 0.0considered in isolation, an even starker pictureemerges. Landless households in the fourth and O4 & CP 0 d' 0fifth consumption quintiles earn practically all Consumption Quintiletheir income from non-agricultural sources(Table 4.2). By contrast, those in the lowestquintile receive only about half of their income
85
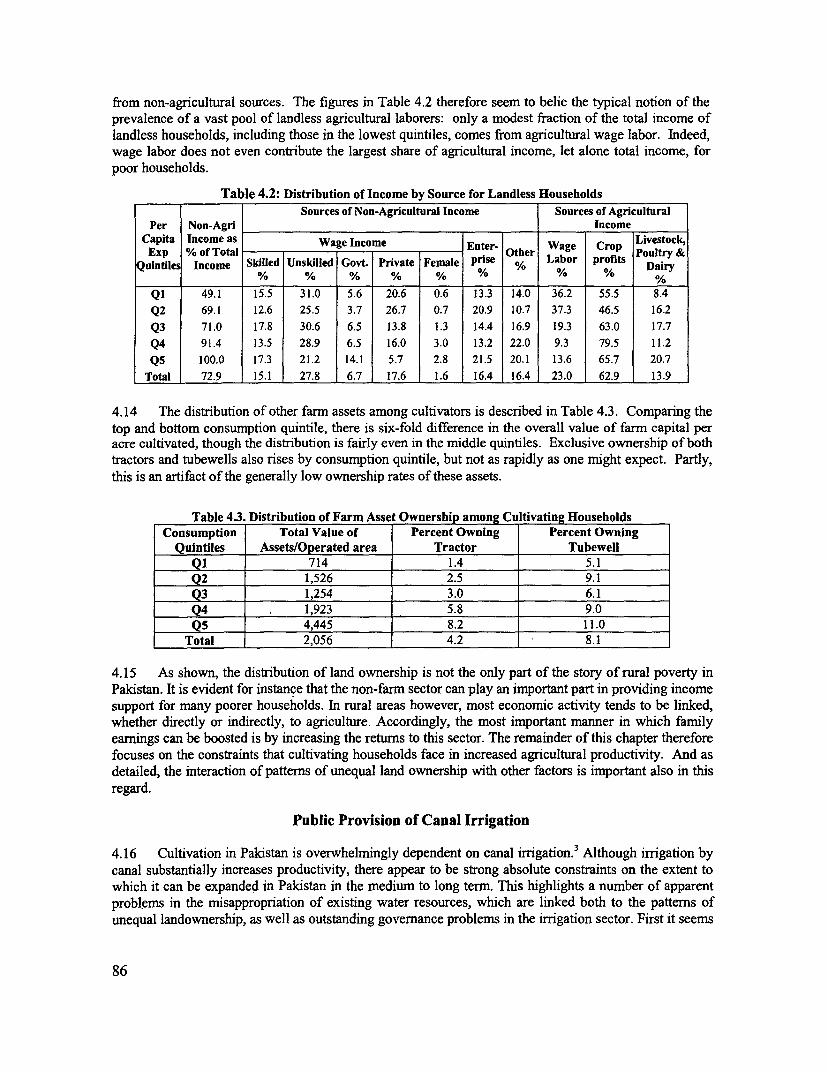
from non-agricultural sources. The figures in Table 4.2 therefore seem to belie the typical notion of theprevalence of a vast pool of landless agricultural laborers: only a modest fraction of the total income oflandless households, including those in the lowest quintiles, comes from agricultural wage labor. Indeed,wage labor does not even contribute the largest share of agricultural income, let alone total income, forpoor households.
Table 4.2: Distribution of Income by Source for Landless HouseholdsSources of Non-Agricultural Income Sources of Agricultural
Per Non-Agri IncomeCExpta Income as Wage Income = Enter- Wage Crop Livestock,Exp % of Total Other Poultry &~~~~~~~~~~~~~~~~~~~~~~~~~~~~~~~~~~~~~~~~~~~~~~~~~~~~~~~~~~~~~~~~~~~~~~~~~~~~~~~~~~~~~~~~~~~~~~~~~~~~~~~~~~~~~~~~~~~~~~~~~~~~~~~~~~~~~~~~~~~~~~~~~~~~~~~~~~~~~~~~~~~~~~~~~~~Ote olr
Quintiles Income Skilled Unskilled Govt. Private Female prise % Labor profits DairyI% % % % % % % %
Qi 49.1 15.5 31.0 5.6 20.6 0.6 13.3 14.0 36.2 55.5 8.4Q2 69.1 12.6 25.5 3.7 26.7 0.7 20.9 10.7 37.3 46.5 16.2Q3 71.0 17.8 30.6 6.5 13.8 1.3 14.4 16.9 19.3 63.0 17.7Q4 91.4 13.5 28.9 6.5 16.0 3.0 13.2 22.0 9.3 79.5 11.2Q5 100.0 17.3 21.2 14.1 5.7 2.8 21.5 20.1 13.6 65.7 20.7
Total 72.9 15.1 27.8 6.7 17.6 1.6 16.4 16.4 23.0 62.9 13.9
4.14 The distribution of other farm assets among cultivators is described in Table 4.3. Comparing thetop and bottom consumption quintile, there is six-fold difference in the overall value of farm capital peracre cultivated, though the distribution is fairly even in the middle quintiles. Exclusive ownership of bothtractors and tubewells also rises by consumption quintile, but not as rapidly as one might expect. Partly,this is an artifact of the generally low ownership rates of these assets.
Table 4.3. Distribution of Farm Asset Ownership among Culffvating HouseholdsConsumption Total Value of Percent Owning Percent Owning
Quintiles Assets/Operated area Tractor TubewellQ1 714 1.4 5.1Q2 1,526 2.5 9.1Q3 1,254 3.0 6.1Q4 . 1,923 5.8 9.0Q5 4,445 8.2 11.0
Total 2,056 4.2 8.1
4.15 As shown, the distribution of land ownership is not the only part of the story of rural poverty inPakistan. It is evident for instance that the non-farm sector can play an important part in providing incomesupport for many poorer households. In rural areas however, most economic activity tends to be linked,whether directly or indirectly, to agriculture. Accordingly, the most important manner in which familyearnings can be boosted is by increasing the returns to this sector. The remainder of this chapter thereforefocuses on the constraints that cultivating households face in increased agricultural productivity. And asdetailed, the interaction of patterns of unequal land ownership with other factors is important also in thisregard.
Public Provision of Canal Irrigation
4.16 Cultivation in Pakistan is overwhelmingly dependent on canal irrigation.3 Although irrigation bycanal substantially increases productivity, there appear to be strong absolute constraints on the extent towhich it can be expanded in Pakistan in the medium to long term. This highlights a number of apparentproblems in the misappropriation of existing water resources, which are linked both to the pattems ofunequal landownership, as well as outstanding govemance problems in the irrigation sector. First it seems
86
clear that the pricing regime and delivery mechanism for canal water clearly benefits those who have
larger holdings. The flat rate for water leads to wasteful usage of a valuable and scarce resource. And the
prevalence of rent seeking in this sector, coupled with the disproportionate ability of large land owners to
influence officials of the irrigation department, allows those with larger land holdings to skew water
distribution in their favor, improving their own yields, but further tightening the constraint that limited
water availability imposes on smaller cultivators.
Canal Irrigation: Absolute Resource Constraints and Management Issues
4.17 Direct rainfall contributes less than 15% of the water supplied to crops and other sources of water
in Pakistan, including ground water, are scarce. The recurrent drought and flood cycle over the past
decade has intensified the problem of water availability and raised concerns about water storage on the
one hand, and flood prevention, due to overflows, on the other. Unfortunately, studies suggest that
prospects for further expansion in irrigated area through new investment appear to be quite limited. With
river flows fully utilized, providing more storage in the Indus river system can increase water availability
by about 14 percent at best. However, economic returns to both storage investment and investment
required to develop additional canal capacity to utilize this flow, are rather low4 .
4.18 Water sources outside the Indus system are also largely exhausted, limiting the scope for any
major expansion in perennial irrigation outside the Indus basin. Finally, the ground water table in most
fresh ground water areas is falling due to the expansion in tubewell use over the 1980's. This limits the
potential for further investment in private or public tubewells. The limited scope for major increases in
water supply both within and outside the Indus basin implies that the efficient use of currently available
water supplies has to be an important component of any strategy to increase the productivity of irrigated
agriculture in a sustainable way.
4.19 There are two main issues related to canal irrigation that require attention. First, current water
delivery and use patterns are quite wasteful. It is estimated that the delivery mechanism has an average
delivery efficiency of only about 35 to 40 percent, from the canal head to the root zone. (World Bank,
1999) Farmers also tend to use wasteful flood irrigation methods instead of drip and sprinkler irrigation,
which economizes on the use of water.5 Second, there is a perception that there is considerable
misappropriation of canal water that leads to distributional inequities and uncertain supplies of available
water, imposing substantial productivity losses on the economy.
Technical Delivery Losses in Pakistan's Irrigation System
4.20 The reduction of delivery losses requires improvements in irrigation infrastructure and better
maintenance of water channels. However, improvements in physical infrastructure, such as the
rehabilitation of canals, the lining of water channels, and land leveling have been undertaken only
sporadically, and maintenance efforts have also been quite inadequate. Thus, irrigation infrastructure is
growing increasingly dilapidated. This is corroborated by a community survey in which respondents were
asked about changes over the past 5 years in the quality of nine public goods and services. In nearly 50
percent of sampled villages, respondents reported deterioration in irrigation facilities, while an
improvement was reported in only 11 percent of villages. This is in sharp contrast to all other services,
including law enforcement, for which a much smaller fraction of villages reported deterioration over the
past 5 years.
4.21 One potential determinant of this problem appears to be the poor incentives provided to
provincial irrigation departments to maintain and improve the system. Studies have suggested that the
budgets of the provincial irrigation department are inadequate and largely absorbed by the wage and
salary costs of their employees. There is also no relationship between budgets and performance in
87
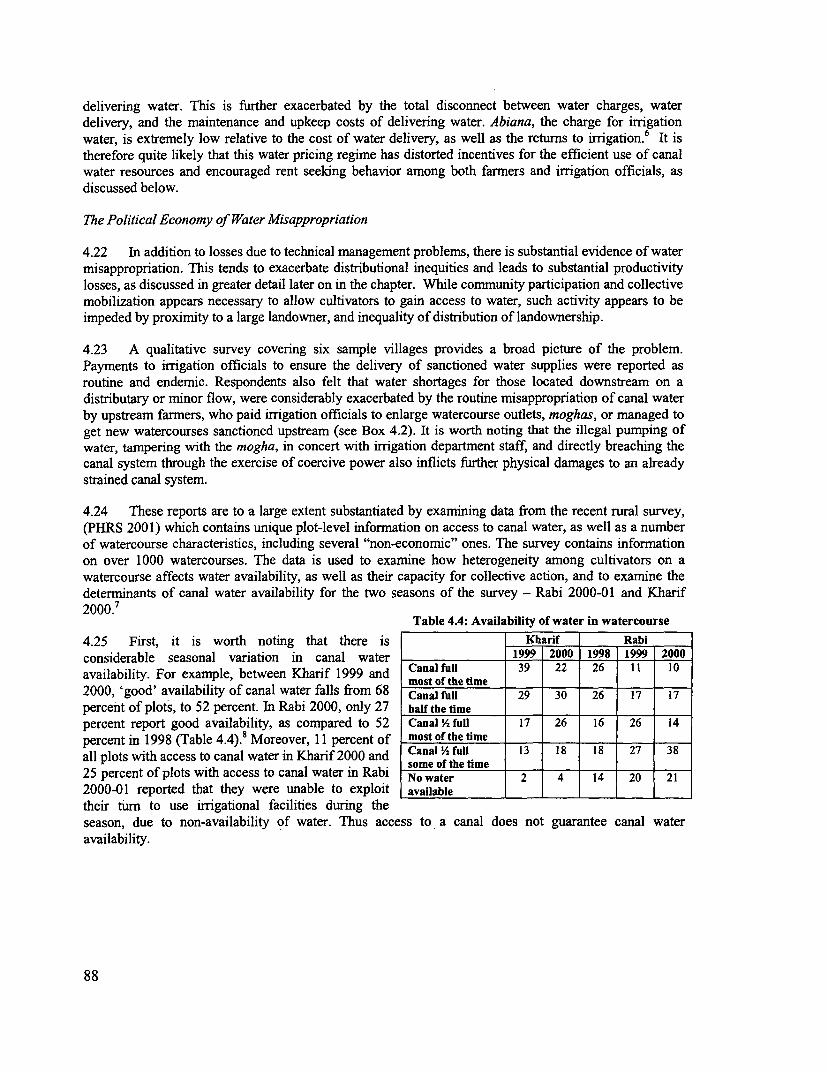
delivering water. This is further exacerbated by the total disconnect between water charges, waterdelivery, and the maintenance and upkeep costs of delivering water. Abiana, the charge for irrigationwater, is extremely low relative to the cost of water delivery, as well as the returns to irrigation.6 It istherefore quite likely that this water pricing regime has distorted incentives for the efficient use of canalwater resources and encouraged rent seeking behavior among both farmers and irrigation officials, asdiscussed below.
The Political Economy of Water Misappropriation
4.22 In addition to losses due to technical management problems, there is substantial evidence of watermisappropriation. This tends to exacerbate distributional inequities and leads to substantial productivitylosses, as discussed in greater detail later on in the chapter. While community participation and collectivemobilization appears necessary to allow cultivators to gain access to water, such activity appears to beimpeded by proximity to a large landowner, and inequality of distribution of landownership.
4.23 A qualitative survey covering six sample villages provides a broad picture of the problem.Payments to irrigation officials to ensure the delivery of sanctioned water supplies were reported asroutine and endemic. Respondents also felt that water shortages for those located downstream on adistributary or minor flow, were considerably exacerbated by the routine misappropriation of canal waterby upstream farmers, who paid irrigation officials to enlarge watercourse outlets, moghas, or managed toget new watercourses sanctioned upstream (see Box 4.2). It is worth noting that the illegal pumping ofwater, tampering with the mogha, in concert with irrigation department staff, and directly breaching thecanal system through the exercise of coercive power also inflicts further physical damages to an alreadystrained canal system.
4.24 These reports are to a large extent substantiated by examining data from the recent rural survey,(PHRS 2001) which contains unique plot-level information on access to canal water, as well as a numberof watercourse characteristics, including several "non-economic" ones. The survey contains informationon over 1000 watercourses. The data is used to examine how heterogeneity among cultivators on awatercourse affects water availability, as well as their capacity for collective action, and to examine thedeterminants of canal water availability for the two seasons of the survey - Rabi 2000-01 and Kharif2000.7
Table 4A: Availability of water in watercourse4.25 First, it is worth noting that there is Kharif Rabiconsiderable seasonal variation in canal water 1999 2000 1998 1999 2000availability. For example, between Kharif 1999 and Canal full 39 22 26 11 10most of the time2000, 'good' availability of canal water falls from 68 Canal full 29 30 26 17 17percent of plots, to 52 percent. In Rabi 2000, only 27 half the timepercent report good availability, as compared to 52 Canal V2 full 17 26 16 26 14percent in 1998 (Table 4.4).8 Moreover, 11 percent of most of the time _all plots with access to canal water in Kharif 2000 and Canal V2 full 13 18 18 27 38some of the time I___25 percent of plots with access to canal water in Rabi No water 2 4 14 20 212000-01 reported that they were unable to exploit available .__ _ _their turn to use irrigational facilities during theseason, due to non-availability of water. Thus access to a canal does not guarantee canal wateravailability.
88
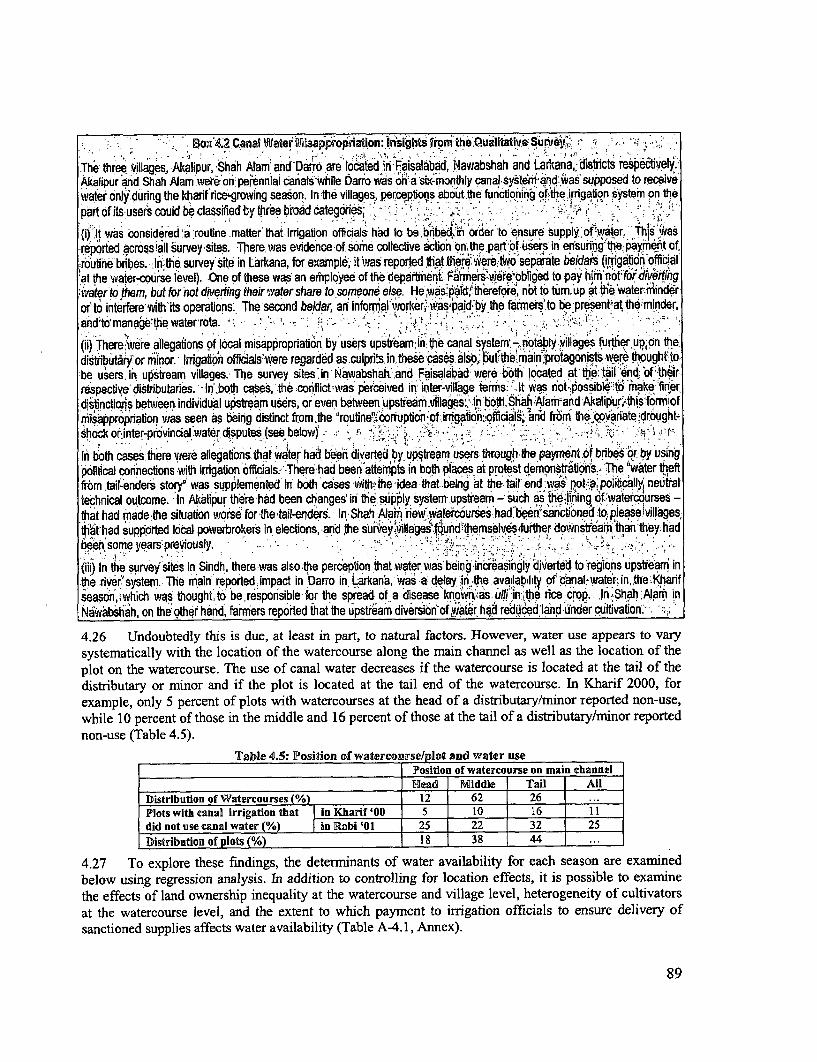
Box'4.2.Canal Water fisa?propriation: Insighcs from the Qualiaiv S u,rv,,
The three villages, Akalipur, Shah Adam'abd Darro are lo6ated:in Faisalabad, Nawabshah and Larkana,;-disticts tespidtively.Akalipur and Shah A4am .were on peienniai canals witl'e Darro was on a si xmonthly canal system a,nd aas supposed to receivewater onJly.during the kharif rice'growing season. In the villages,percptions aboutthe functionin Fe igabon system on thepart oits users could be classied by_thr broad'ategones :
(i)'lt was considered a,routine.matter that irrigation officials had to be brbed1rin order to ensure supply. of water. ,T,hi; wasreported across*ail survey-sites. There, was evidence ofsonme collective actin' on thepart'of users in' ensuringi'tep,ayrnenti of,routine brbes. 'ln;the. survey'site in Larkana, for example, it was reported th'atthere 'wiretwo sepa'te ekldais (irngatiorxi'officialat the water-course level). One of these was an employee of the departmeint. O rs6we r,eobliged to pay hiffi'no t'fr,'di4v6rfting'water to them, but for not diverting their tvater share to someone else. He' as'ip 1Wd1therefore, nbt to tum.up at the watermind,ror to interfere with'its operations: The second beldar, an informial'worker, was paid:by the farmers'to bepresent,af the 'minder,and1tomanage thewaterrota. . ."- .-
(i) Therre allegations ,f local misappropriation by users upstreamnin the canal system,,-notablI villages furtlier upon the.distributarjor minor. Irigation officials'were regarded as.culprits. in. tese cases. also} butheniein'tprotagonists wsre toughtobe users.in upstream villages. The survey sites'in Nawabshah:,and Faisalabad were b6th located at' the':tail:end f theirrespective'distributaries. -In',both ca,es, the conflict'was perceived in inter-village terms. it was nbot'possibpe"s'to6 4a'k,efin'erdistinctions between individual upstream users, or even between'upstream.villages< i.!n both, Shah Alamand Akalipr, thislrnvofmisappropration was seen as being distinct from the 'routinel;coriuption of .irngation.officials, -and fr6m' the6oWVariate dr,ought-nshock orinter-provincial water disputes (see below) . .. ,a
In b'oth cases.there were allegations. ta water had been diverted by upstream users throughbthe payment.of bribesor by usingp6fibial connections with irrigation officials. There',had been attempts in both places at protest demonstrations The T wter theftfrom .tail-enders story' was.supplemented in both cases withnihe idea that.being at the tail end was pot a policallyj neutraltechnical outcome. In Akalipur the're!had been changes' ini the. supply system ,upstream - such as 'the-i,ning ofwater6o.urses -that had made the situation worse for the tatl-enders. In Shah Alam n'rew' wate'rcourses had been1 sanctoned to; pieasei,villages,that-had supported local powerbrokers in, electons, and the sburVey.`llages f,Wunidhemselves4urther downstr'eami than they hadee'some years. . - .. ' ' - ' l
(iii) In the survey sites in Sindh, there was also the perception thatwater was baingincreasihgiy diverted to regio,ns upstfearn inthe river'system. The main' reported impact in Darro in Larkanba, was a delay ri the availability of canal -wate'r, in.the:iKharifseason,which was thoughtJto be,responsible for the spread of a! disease knowni.sasfilj nXthe rice crop. jn,Shalh Alanm inN1wabshah, on the other hand, farmers repored that the upstream diversion ofwiaterha,d reided'land-under cultivation:.
4.26 Undoubtedly this is due, at least in part, to natural factors. However, water use appears to vary
systematically with the location of the watercourse along the main channel as well as the location of the
plot on the watercourse. The use of canal water decreases if the watercourse is located at the tail of the
distributary or minor and if the plot is located at the tail end of the watercourse. In Kharif 2000, for
example, only 5 percent of plots with watercourses at the head of a distributary/minor reported non-use,
while 10 percent of those in the middle and 16 percent of those at the tail of a distributary/minor reported
non-use (Table 4.5).
Table 4.5: Position of watercourse/plot and water usePosition of watercourse on main channel_Head Middle Tail All
Distribution of Watercourses (%) 12 62 26
Plots with canal irrigation that I in Kharif '00 5 10 16 11
did not use canal water (%) in Rabi '01 25 22 32 25
FDIistribution of plots (%) 18 38 44 ...
4.27 To explore these findings, the determinants of water availability for each season are examined
below using regression analysis. In addition to controlling for location effects, it is possible to examine
the effects of land ownership inequality at the watercourse and village level, heterogeneity of cultivators
at the watercourse level, and the extent to which payment to irrigation officials to ensure delivery ofsanctioned supplies affects water availability (Table A-4. 1, Annex).
89
4.28 The analysis indicates that canal water availability declines significantly in both seasons if thewatercourse is at the tail of the distributary or minor on which it is located. While this is consistent withthe misappropriation of canal water by upstream watercourses, it does not constitute direct evidence ofsuch misappropriation. One could argue that the outcome is also consistent with the kind of well-documented conveyance losses to which the system is subject.
4.29 However, controlling for any location effects, payment to irrigation officials significantlyincreases the availability of canal water. Thus water availability clearly depends on efforts to bribeirrigation officials.9 In addition, water availability increases significantly as the land holdings of thelargest cultivators on the watercourse increase. Water availability also increases significantly as thevillage land gini increases. Since larger landowners are likely to be able to lobby more effectively withirrigation officials and politicians, this also suggests that water availability depends on the ability ofcultivators on the watercourse to influence irrigation officials.
4.30 In surnnary, losses due to the poor maintenance of the infrastructure appear to be compounded byconsiderable mismanagement and corruption. Such rent-seeking behavior could reinforce distributionalinequities and may also lead to substantial productivity losses, an issue that is examined in a later section.What appears to be clear so far is that farmers are willing to pay bribes to ensure water delivery andimproved access. This is particularly significant since there is little support among farmers for a higherwater rate, perhaps because farmers cannot see any link between their contribution and water deliveries orthe maintenance of the system. Moreover, uncertain water supplies and flat-water charges also create anincentive to waste water. This not only constrains an expansion in production, but also penalizescultivatoTs who are located at the tail end of watercourses and often end up paying for water that they donot get.
4.31 Clearly, this begs the question of the extent to which collective action by cultivators reduces themaintenance and rnismanagement problems discussed above. Table A-4.2 (Annex) shows thedeterminants of participation in the collecfive activity of watercourse cleaning and maintenance, and theformation of water user's groups. It is indeed found that better water availability in the Rabi seasonsignificantly increases participation in the cleaning and maintenance of the watercourse. Larger landholdings and the presence of a politician on the watercourse also increase participation significantly.Interestingly, however, the number of zaats/castes on the watercourse (one measure of heterogeneity)appears to have no effect.
4.32 Turning to the determinants of water user groups, it is found that the presence of a politician onthe watercourse significantly reduces participation, as does village land inequality. While these results arequite tentative, and only 11 percent of the watercourses had a water user's group, they suggest that highlevels of wealth inequality and power restrict certain forms of collective action while promoting others. Inparticular, forms of collective action that benefit wealthier cultivators appear to thrive on watercourseswith high inequality while forms of collective action that could undermine their influence appear to bediscouraged.
Soil Degradation: Waterlogging and Salinity
4.33 Waterlogging and salinity are considered to be a primary cause of low yields and low croppingintensities in rural Palistan. Combating this growing problem would yield significant productivity gainsto many rural households.'° In addition to the geographical or technical constraints to this- i.e. those thatpertain to particular agricultural practices - unequal distribution of land ownership leading to theprevalence of tenancy contracts in certain areas, also appear to be important, by reducing incentives forbetter stewardship of soil resources among cultivators.
90
Soil degradation: a reversible problem
4.34 In some parts of Pakistan, notably Sindh and Southern Punjab, the soil is naturally saline andground water tends to be brackish. However, canal irrigation and tubewell installation have substantiallyworsened the problem in recent years. Due to its flat topography and the lack of natural drainage in theIndus plain, repeated irrigation has led to a rise in the water table in Pakistan. This is compounded byseepage from the canal system during delivery. In areas where ground water aquifers are fresh, water lostduring conveyance can be re-used by pumping, since it simply recharges the aquifer. However, in salineareas such as Sindh, not only is the water permanently lost, it also raises the water table and makessurface soils saline. However, waterlogging and salinity are largely reversible and there are large potentialproductivity gains from doing so.
4.35 Measures to reduce soil salinity and waterlogging can be grouped into 3 categories: (1) Activitiesthat must be undertaken collectively, by the government or a community"1; (2) Contractible farm levelactivities'2 ; and, (3) Non-contractible farm level activities. The last category is of particular interest sinceover a third of cultivated area in Pakistan is worked by tenants who may have rather poor incentives toprovide the kind of effort-intensive care that problem soils require. There are four main types of non-contractible on-farm activities: (i) Irigation practices such as the use of more canal water, more frequentirrigations, use of better quality ground water, and pre-sowing irrigation for leaching salts; (ii) Croppingpractices like the removal of a salt encrusted top layer, the planting of soil tolerant crops like Berseen,Jantar and varieties of rice, continuous cropping or leaving land fallow, and using a higher seed rate; (iii)Land preparation practices such as deeper/more ploughing, adding sand, and minor leveling to removehigh spots and salt deposits; (iv) Chemical/organic practices such as the application of higher qualitychemical fertilizers, use of green manure and plant stems, and the use of gypsum.
4.36 Some of these practices tend primarily to mitigate the effect of salinity on current crop yields(e.g., changing irrigation practices, leaving affected area fallow), while others have the longer termobjective of solving or alleviating the underlying problem not only for the current season but also for thefuture (e.g., land levelling, gypsum application, manure application). These latter, 'curative' measures aremore easily viewed as a form of investment'3.
Mapping Soil Degradation in Pakistan
4.37 The PRHS 2001 collected data on salinity and waterlogging for each plot owned or cultivated bysample households. For each plot, information is available on the fraction of area affected by salinity,how long the problem has existed, the acuteness of the problem (subjectively evaluated using localterminology), and any major investments undertaken, either singly or collectively by the household todeal with it. The cultivators of each saline (or sodic) plot were also asked about their use of 26 separatefarming practices (noncontractible farm level activities under items (i)-(iv) above) in the two seasonspreceding the survey.
91
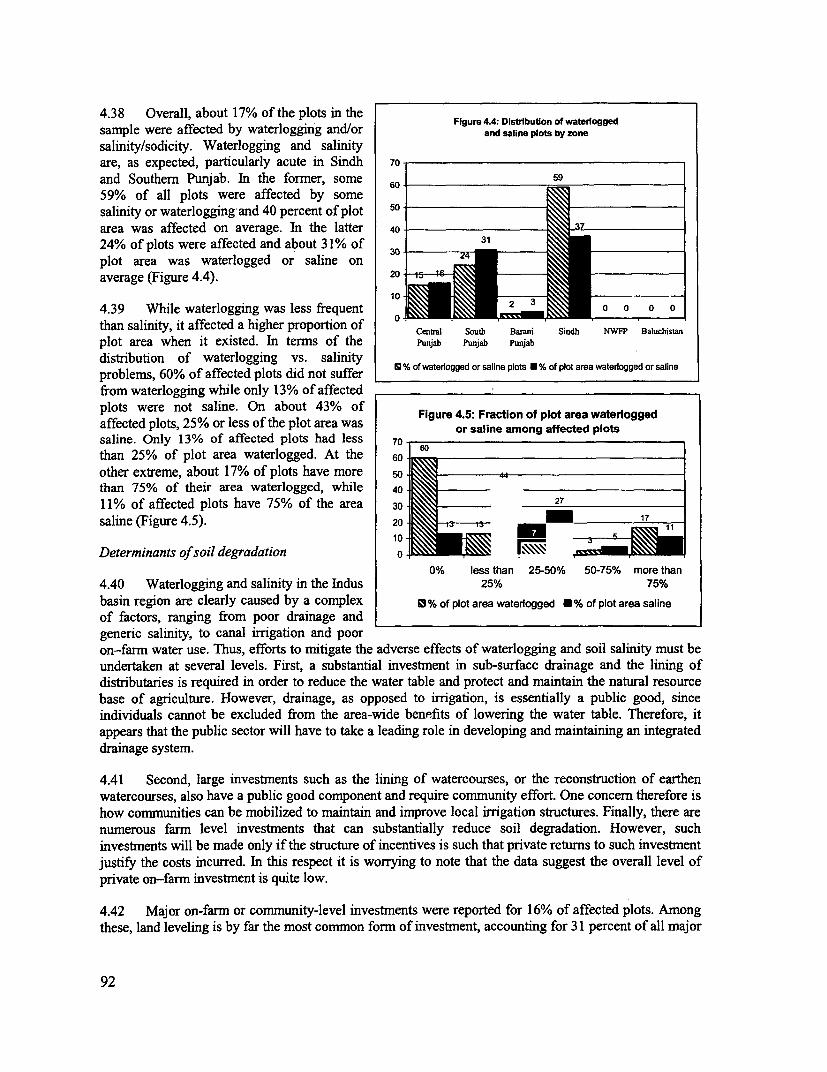
4.38 Overall, about 17% of the plots in the. . * ., ~~~~~~~~~Flgure 4.4: Dlstrlbuton of waterloggedsample were affected by waterlogging and/or and salite plots by zonesalinity/sodicity. Waterlogging and salinityare, as expected, particularly acute in Sindh 70
and Southern Punjab. In the former, some 69
59% of all plots were affected by somesalinity or waterlogging and 40 percent of plot 50
area was affected on average. In the latter 40 '_7
24% of plots were affected and about 31% of 31
plot area was waterlogged or saline on 30
average (Figure 4.4). 20
104.39 While waterlogging was less frequent 20 0 0than salinity, it affected a higher proportion of South Barsm Sindh NWFP BaluchistaCentral Sot Baai Snh NF Buhsmplot area when it existed. In terns of the Punjab Punjab Punjab
distribution of waterlogging vs. salinitydsribution 60 of waffeter plogg didg vs. salntr O % of watelogged or saline plots * % of plot area waterogged or salineproblems, 60% Of affected plOtS did not suffer _ _ _ _ _ _ _ _ _ _ _ _ _ _ _ _ _ _ _ _ _ _
from waterlogging while only 13% of affectedplots were not saline. On about 43% of Figure 4.5: Fraction of plot area waterloggedaffected plots, 25% or less of the plot area was or saline among affected plotssaline. Only 13% of affected plots had less 70
than 25% of plot area waterlogged. At the 60
other extreme, about 17% of plots have more 50 44than 75% of their area waterlogged, while 40
11% of affected plots have 75% of the area 30 27
saline (Figure 4.5). 20 17
1 0 3___
Determinants of soil degradation 0 F\70 , i =0% less than 25-50% 50-75% more than
4.40 Waterlogging and salinity in the Indus 25% 75%basin region are clearly caused by a complex 3% of plot area waterlogged *% of plot area salineof factors, ranging from poor drainage andgeneric salinity, to canal irrigation and pooron-farm water use. Thus, efforts to mitigate the adverse effects of waterlogging and soil salinity must beundertaken at several levels. First, a substantial investment in sub-surface drainage and the lining ofdistributaries is required in order to reduce the water table and protect and maintain the natural resourcebase of agriculture. However, drainage, as opposed to irrigation, is essentially a public good, sinceindividuals cannot be excluded from the area-wide benefits of lowering the water table. Therefore, itappears that the public sector will have to take a leading role in developing and maintaining an integrateddrainage system.
4.41 Second, large investments such as the lining of watercourses, or the reconstruction of earthenwatercourses, also have a public good component and require community effort. One concern therefore ishow communities can be mobilized to maintain and improve local irrigation structures. Finally, there arenumerous farm level investments that can substantially reduce soil degradation. However, suchinvestments will be made only if the structure of incentives is such that private returns to such investrnentjustify the costs incurred. In this respect it is worrying to note that the data suggest the overall level ofprivate on-farm investment is quite low.
4.42 Major on-farm or community-level investments were reported for 16% of affected plots. Amongthese, land leveling is by far the most common form of investment, accounting for 31 percent of all major
92
investments over the past 10 years on affected plots. This is followed by drainage, tree planting and
tubewell installation (Figure A-4.1, Annex). Most investments were undertaken either by individual
farmers, a large farmer in the area, or a farmer's group.
4.43 In addition, regular farm level measures - termed non-contractible since they are effort -intensive
and require costly monitoring, were carried out on 22% of affected plots (Figure A-4.2, Annex). Among
these measures, 11 percent of all affected plots undertook some irrigation-related measure, 16 percent
implemented a spe6ific cropping technique to mitigate salinity, and 13 percent undertook some type of
land preparation practice. The data also includes information for all plots on the use of chemical and
organic practices, including the application of green manure. The use of organic manure is particularly
beneficial, and effects of an application last up to 3 years. Organic manure is used in over a third of all
cultivated plots.
4.44 Importantly, it is worth noting that waterlogging and salinity problems and the efforts undertaken
to solve them are related to the land holding status of cultivators. About 27 percent of saline plots were
cultivated by tenants, however, while some sort of salinity/waterlogging mitigating practice was carried
out on 85% of owner-cultivated plots, only 12% of affected sharecropped plots and 4% of affected fixed
rent contract plots undertook any deliberate salinity reducing measures. This suggests that incentives to
invest are considerably dampened by moral hazard problems and insecure tenure. Preliminary analysis
suggests that the use of organic manure is significantly lower among tenants. In the context of ongoing
rural sector work for Pakistan, the data will be used to more rigorously examine the relationship between
land tenure and land degradation suggested here.
Access to Credit
4.45 A well functioning rural financial market plays a critical role in both agriculture and rural
development by enabling deposit mobilization, financing production activity and investments,' 4 and
assisting with consumption smoothing in response to production and other risks. In a world of perfect
information, credit markets would obviate the impact of initial asset inequality on productivity, since all
projects with sufficiently high returns would be funded by creditors. In real world credit markets,
however, enforcement of repayment is always a major problem and collateral, often in the form of land, is
typically required to obtain large loans. As a consequence, initial inequalities may be entrenched or
exacerbated, contributing to the development of 'poverty traps'.
4.46 Specialized credit surveys, such as the Pakistan Rural Credit Survey (1985) estimate that between
40 and 50 percent of all rural households in Pakistan borrow regularly, and that farm households borrow
more than non-farm households. This pattern is broadly corroborated in the PRHS 2001. Among farm
households, more than three-fourths had outstanding loans during the reference period of the survey
(Table 4.6). However, the distinction between formal and informal credit is extremely important. While
formal loans have collateral requirements, most often in the form of land, informal lenders, enforce loan
contracts largely through reputation, the interlinking of contracts and the use of family/social ties. Thus
the asset poor are able to participate in informal markets much more easily.
93
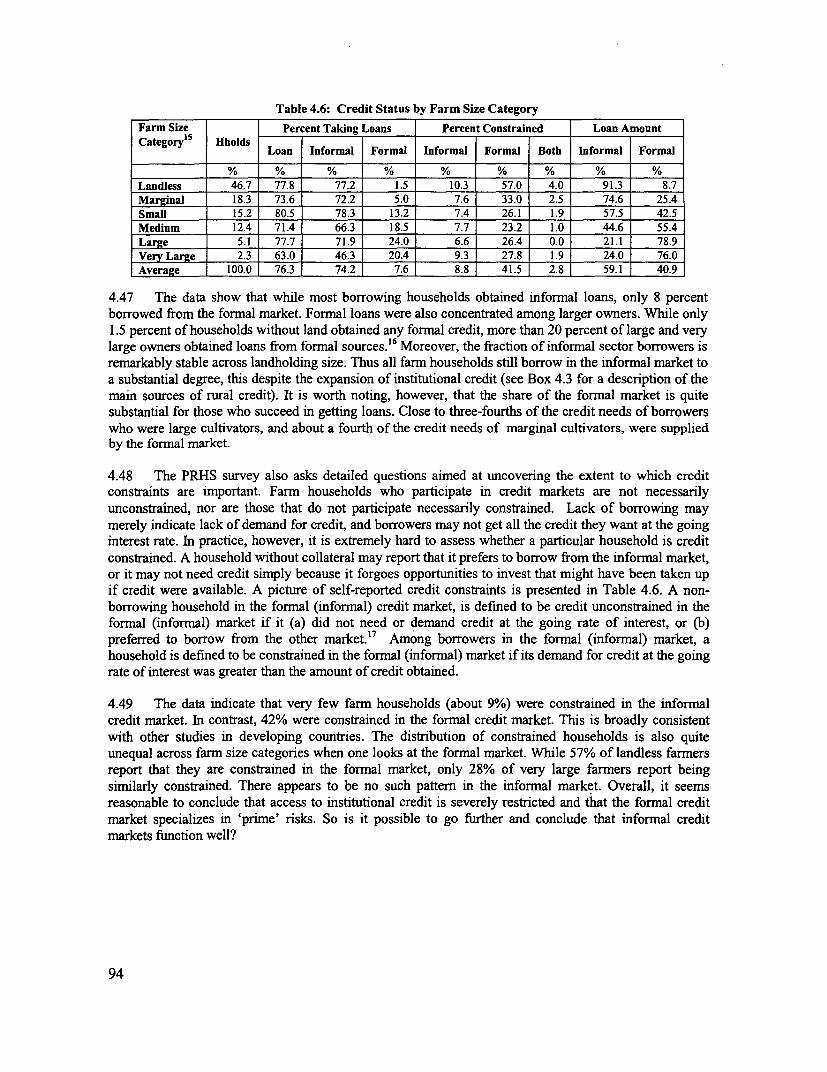
Table 4.6: Credit Status by Farm Size CategoryFarm Size Percent Taking Loans Percent Constrained Loan AmountCategory1 s Hholds
Loan Informal Formal Informal Formal Both Informal Formal
Landless 46.7 77.8 77.2 1.5 10.3 57.0 4.0 91.3 8.7Marginal 18.3 73.6 72.2 5.0 7.6 33.0 2.5 74.6 25.4Small 15.2 80.5 78.3 13.2 7.4 26.1 1.9 57.5 42.5Medium 12.4 71.4 66.3 18.5 7.7 23.2 1.0 44.6 55.4Large 5.1 77.7 71.9 24.0 6.6 26.4 0.0 21.1 78.9Very Large 2.3 63.0 46.3 20.4 9.3 27.8 1.9 24.0 76.0Average 100.0 76.3 74.2 7.6 8.8 41.5 2.8 59.1 40.9
4.47 The data show that while most borrowing households obtained informal loans, only 8 percentborrowed from the formal market. Formal loans were also concentrated among larger owners. While only1.5 percent of households without land obtained any formal credit, more than 20 percent of large and verylarge owners obtained loans from formal sources. 16 Moreover, the fraction of informal sector borrowers isremarkably stable across landholding size. Thus all farm households still borrow in the informal market toa substantial degree, this despite the expansion of institutional credit (see Box 4.3 for a description of themain sources of rural credit). It is worth noting, however, that the share of the formal market is quitesubstantial for those who succeed in getting loans. Close to three-fourths of the credit needs of borrowerswho were large cultivators, and about a fourth of the credit needs of marginal cultivators, were suppliedby the formal market.
4.48 The PRHS survey also asks detailed questions aimed at uncovering the extent to which creditconstraints are important. Farm households who participate in credit markets are not necessarilyunconstrained, nor are those that do not participate necessarily constrained. Lack of borrowing maymerely indicate lack of demand for credit, and borrowers may not get all the credit they want at the goinginterest rate. In practice, however, it is extremely hard to assess whether a particular household is creditconstrained. A household without collateral may report that it prefers to borrow from the informal market,or it may not need credit simply because it forgoes opportunities to invest that might have been taken upif credit were available. A picture of self-reported credit constraints is presented in Table 4.6. A non-borrowing household in the formal (informal) credit market, is defined to be credit unconstrained in theformal (informal) market if it (a) did not need or demand credit at the going rate of interest, or (b)preferred to borrow from the other market.'7 Among borrowers in the formal (informal) market, ahousehold is defined to be constrained in the formal (informal) market if its demand for credit at the goingrate of interest was greater than the amount of credit obtained.
4.49 The data indicate that very few farm households (about 9%) were constrained in the informalcredit market. In contrast, 42% were constrained in the formal credit market. This is broadly consistentwith other studies in developing countries. The distribution of constrained households is also quiteunequal across farm size categories when one looks at the formal market. While 57% of landless farmersreport that they are constrained in the formal market, only 28% of very large farmers report beingsimilarly constrained. There appears to be no such pattern in the informal market. Overall, it seemsreasonable to conclude that access to institutional credit is severely restricted and that the formal creditmarket specializes in 'prime' risks. So is it possible to go further and conclude that informal creditmarkets function well?
94
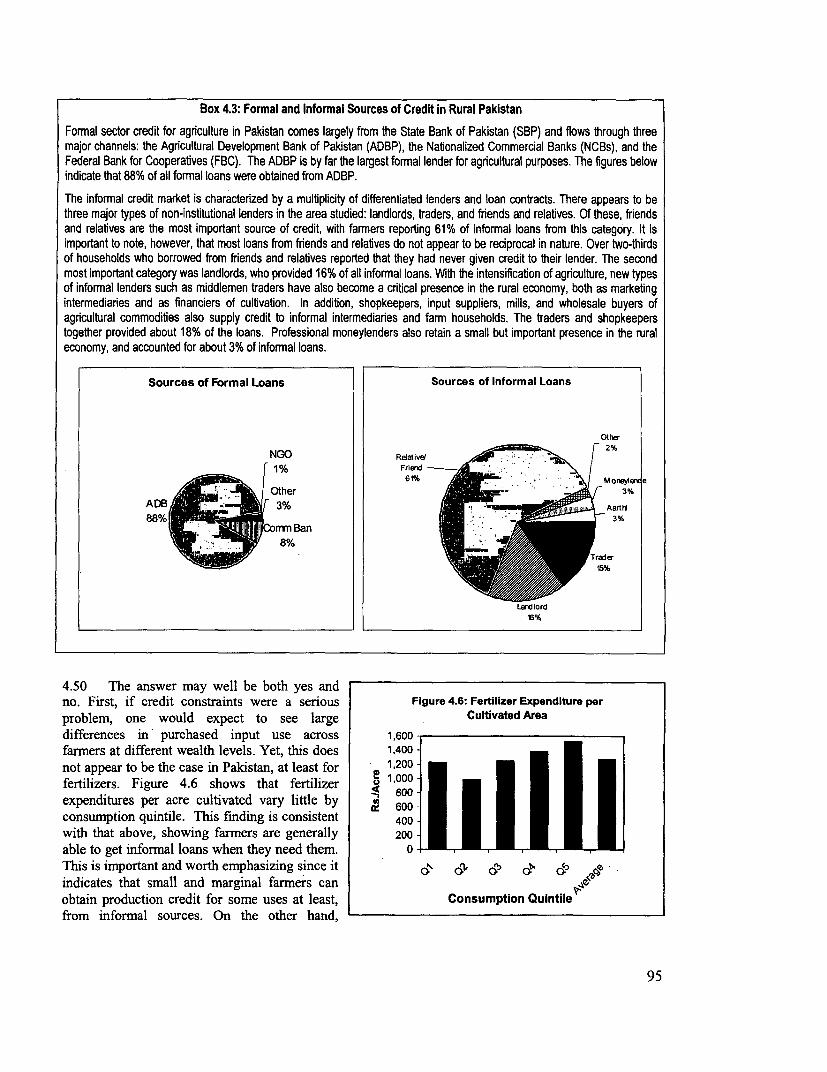
Box 4.3: Formal and Informal Sources of Credit in Rural Pakistan
Formal sector credit for agriculture in Pakistan comes largely from the State Bank of Pakistan (SBP) and flows through three
major channels: the Agricultural Development Bank of Pakistan (ADBP), the Nationalized Commercial Banks (NCBs), and the
Federal Bank for Cooperatives (FBC). The ADBP is by far the largest formal lender for agricultural purposes. The figures below
indicate that 88% of all formal loans were obtained from ADBP.
The informal credit market is characterized by a multplicity of differentiated lenders and loan contracts. There appears to be
three major types of non-institutional lenders in the area studied: landlords, traders, and friends and relatives. Of these, friends
and relatives are the most important source of credit, with farmers reporting 61% of informal loans from this category. It is
important to note, however, that most loans from friends and relatives do not appear to be reciprocal in nature. Over two-thirds
of households who borrowed from friends and relatives reported that they had never given credit to their lender. The second
most important category was landlords, who provided 16% of all informal loans. With the intensification of agriculture, new types
of informal lenders such as middlemen traders have also become a critical presence in the rural economy, both as marketing
intermediaries and as financiers of cultivation. In addition, shopkeepers, input suppliers, mills, and wholesale buyers of
agricultural commodities also supply credit to informal intermediaries and farm households. The traders and shopkeepers
together provided about 18% of the loans. Professional moneylenders also retain a small but important presence in the rural
economy, and accounted for about 3% of informal loans.
Sources of Formal Loans Sources of Informal Loans
NGO Rdativet 2%
. ] _ p 1% Friend ffifi., , XI Moneye e
4.50 The anlswer may well be both yes andno. First, if credit constraints were a serious Figure46:FertilizerAExpenditureper
problem, one would expect to see large Cultivated Area
differences in purchased input use across 1,600
farmers at different wealth levels. Yet, this does 1,400not appear to be the case in Pakistan, at least for 21,200 *
fertilizers. Figure 4.6 shows that fertilizer o 8w000
expenditures per acre cultivated vary little by & 600 * consumption quintile. This finding is consistent 400 * * * *with that above, showing farmers are generally 200 * * * * *
able to get informnal loans when they need them. 0 , _ ~ ,-
This is important and worth emphasizing since it & P e
indicates that small and marginal farmers can tt
obtain production credit for some uses at least, Consumption Quintile~
from informal sources. On the other hand,
95
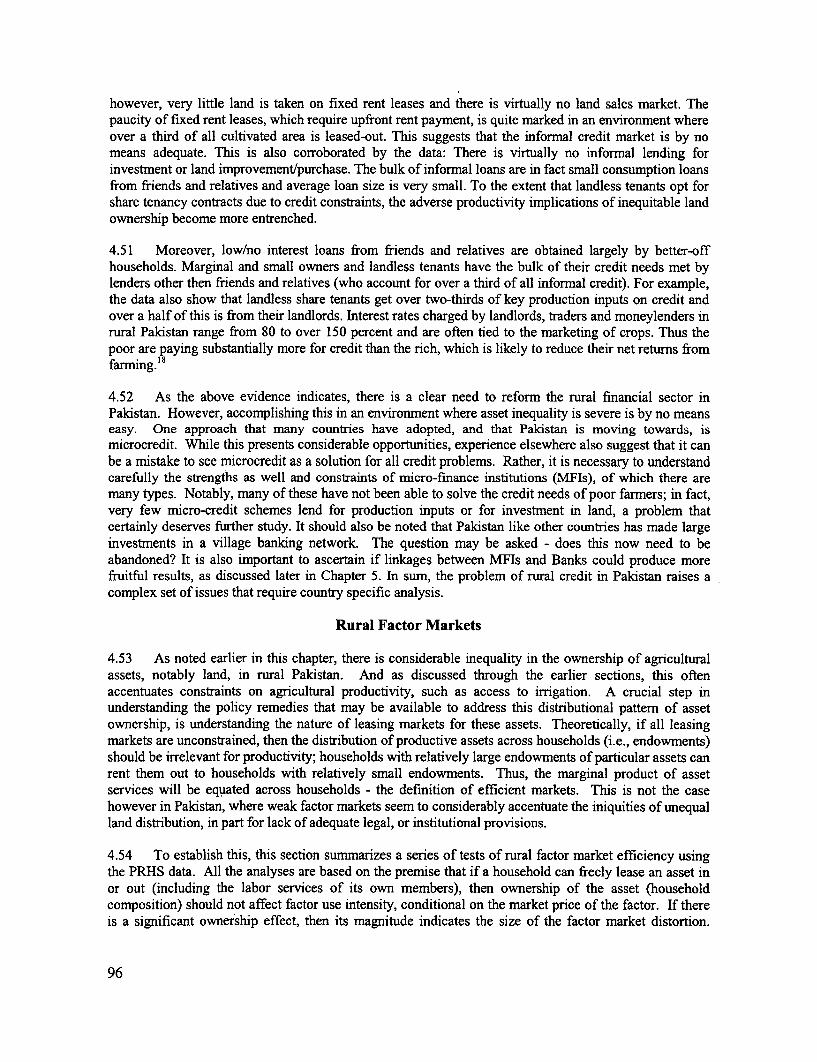
however, very little land is taken on fixed rent leases and there is virtually no land sales market. Thepaucity of fixed rent leases, which require upfront rent payment, is quite marked in an environment whereover a third of all cultivated area is leased-out. This suggests that the informal credit market is by nomeans adequate. This is also corroborated by the data: There is virtually no informal lending forinvestment or land improvement/purchase. The bulk of informal loans are in fact small consumption loansfrom friends and relatives and average loan size is very small. To the extent that landless tenants opt forshare tenancy contracts due to credit constraints, the adverse productivity implications of inequitable landownership become more entrenched.
4.51 Moreover, low/no interest loans from friends and relatives are obtained largely by better-offhouseholds. Marginal and small owners and landless tenants have the bulk of their credit needs met bylenders other then friends and relatives (who account for over a third of all informal credit). For example,the data also show that landless share tenants get over two-thirds of key production inputs on credit andover a half of this is from their landlords. Interest rates charged by landlords, traders and moneylenders inrural Pakistan range from 80 to over 150 percent and are often tied to the marketing of crops. Thus thepoor are paying substantially more for credit than the rich, which is likely to reduce their net returns fromfarning.'8
4.52 As the above evidence indicates, there is a clear need to reform the rural financial sector inPakistan. However, accomplishing this in an environment where asset inequality is severe is by no meanseasy. One approach that many countries have adopted, and that Pakistan is moving towards, ismicrocredit. While this presents considerable opportunities, experience elsewhere also suggest that it canbe a mistake to see microcredit as a solution for all credit problems. Rather, it is necessary to understandcarefully the strengths as well and constraints of micro-finance institutions (MFIs), of which there aremany types. Notably, many of these have not been able to solve the credit needs of poor farmers; in fact,very few micro-credit schemes lend for production inputs or for investment in land, a problem thatcertainly deserves further study. It should also be noted that Pakistan like other countries has made largeinvestments in a village banking network. The question may be asked - does this now need to beabandoned? It is also important to ascertain if linkages between MFIs and Banks could produce morefruitful results, as discussed later in Chapter 5. In sum, the problem of rural credit in Pakistan raises acomplex set of issues that require country specific analysis.
Rural Factor Markets
4.53 As noted earlier in this chapter, there is considerable inequality in the ownership of agriculturalassets, notably land, in rural Pakistan. And as discussed through the earlier sections, this oftenaccentuates constraints on agricultural productivity, such as access to irrigation. A crucial step inunderstanding the policy remedies that may be available to address this distributional pattern of assetownership, is understanding the nature of leasing markets for these assets. Theoretically, if all leasingmarkets are unconstrained, then the distribution of productive assets across households (i.e., endowments)should be irrelevant for productivity; households with relatively large endowments of particular assets canrent them out to households with relatively small endowments. Thus, the marginal product of assetservices will be equated across households - the definition of efficient markets. This is not the casehowever in Pakistan, where weak factor markets seem to considerably accentuate the iniquities of unequalland distribution, in part for lack of adequate legal, or institutional provisions.
4.54 To establish this, this section summarizes a series of tests of rural factor market efficiency usingthe PRHS data. All the analyses are based on the premise that if a household can freely lease an asset inor out (including the labor services of its own members), then ownership of the asset (householdcomposition) should not affect factor use intensity, conditional on the market price of the factor. If thereis a significant ownership effect, then its magnitude indicates the size of the factor market distortion.
96
Table 4.7 summarizes the ownership effects uncovered in the five most important factor leasing markets;those for land, labor, groundwater, tractor services, and thresher/combine harvester services. The resultsare discussed below.
Table 4.7: The Effect of Asset Ownership on Factor Intensity% channe in input use
Input: Experiment: Kharif RabiCultivated land area Double owned area 22 26Labor (on-farm) Add 1 Male age 14-59 7 5
Add 1 Female age 14-59 3* 4*Groundwater Add I tubewell 17 15Tractor services Add I tractor (large or small) 17 16Thresher/combine Add 1 thresher or combine 0* 0*harvester services harvester
Notes: All inputs (expect land itself) are per unit cultivated area. * Not statistically significant
Land leasing markets
4.55 One need only observe the paucity of landsales in Paklstan to realize that this market ishardly capable of bringing household landholdings Purchasedinto alignment with labor and other asset 14%endowments. As Figure 4.7 indicates, the vast Govemmenmajority of individual plots were acquired via tinheritance rather than through purchase. 4%However, the thinness of the land sales market, so Other
typical of the developing world, does not seem to lnhertited' . 1%
arise from a lack of well-defined property rights. 81% X .Most land is legally titled (though titles are less -
common in the less developed provinces of NWFPand Balochistan), and, more importantly, the owners report that they have the right to sell most of theirland (see Table 4.8). More likely, land sales are scarce due to the absence of a well-developed creditmarket and, more fundamentally, of a supporting legal system, to provide for instance, enforcement offoreclosure, that would allow mortgage financing of land purchases.
4.56 Absent an active sales markets, farmers can turn to Table 4.8: Property Rights over Landland leasing markets, which is clearly important in rural Province Ownership of Right to SellPakistan: of those households that own land, about one- Legal Title (% Area)third do not cultivate crops (this excludes uses such as (% Area)orchard and pasture). Conversely, a third of households Central Punjab 69 87that cultivate cropland own none of it, being pure leasers. South Punjab 93 87However, this does not mean that the land-lease marketfunctions efficiently. Indeed, there is a very strong Barani Punjab 80 93relationship between cultivated area and owned area, Sindh 81 89whether one looks at all fanners, or just those owning NWFP 50 99land. The first row of Table 4.8 indicates that, on average, Balochistan 59 82for every additional acre of land owned, about one-quarter National 72 88of an acre additional land is cultivated. These figures arefor land owners only, though results for all farmers are similar, and are derived from regressions that alsocontrol for household composition, the value of farm equipment, and for village fixed effects, which, inparticular, capture variation in the rental price of land. These results suggest significant limitations onhouseholds' ability to lease land in, or to lease it out.
97
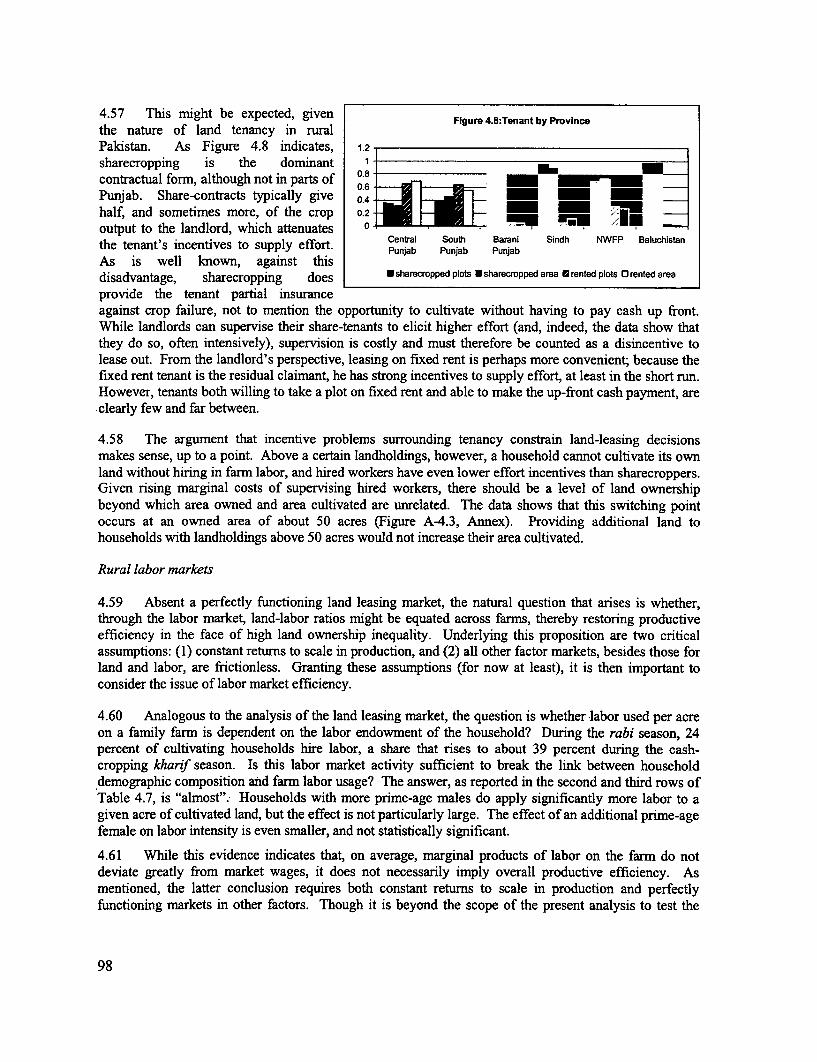
4.57 This might be expected, given Figure 4.8:Tenant by Provincethe nature of land tenancy in ruralPakistan. As Figure 4.8 indicates, 1.2sharecropping is the dominant Icontractual form, although not in parts of 0.8
gie 0.6-Punjab. Share-contracts typically give 0.4 _
half, and sometimes more, of the crop 0.2 ____
output to the landlord, which attenuates 0 - _ I,n I N *thle tenanit's incentives to supply effort. Punjab Punjab PBuaranjb S NWFP BaluchistanAs is well known, against thisdisadvantage, sharecropping does *sharecropped plots *sharecropped area Orented plots Orented area
provide the tenant partial insuranceagainst crop failure, not to mention the opportunity to cultivate without having to pay cash up front.While landlords can supervise their share-tenants to elicit higher effort (and, indeed, the data show thatthey do so, often intensively), supervision is costly and must therefore be counted as a disincentive tolease out. From the landlord's perspective, leasing on fixed rent is perhaps more convenient; because thefixed rent tenant is the residual claimant, he has strong incentives to supply effort, at least in the short run.However, tenants both willing to take a plot on fixed rent and able to make the up-front cash payment, areclearly few and far between.
4.58 The argument that incentive problems surrounding tenancy constrain land-leasing decisionsmakes sense, up to a point. Above a certain landholdings, however, a household cannot cultivate its ownland without hiring in farm labor, and hired workers have even lower effort incentives than sharecroppers.Given rising marginal costs of supervising hired workers, there should be a level of land ownershipbeyond which area owned and area cultivated are unrelated. The data shows that this switching pointoccurs at an owned area of about 50 acres (Figure A-4.3, Annex). Providing additional land tohouseholds with landholdings above 50 acres would not increase their area cultivated.
Rural labor markets
4.59 Absent a perfectly functioning land leasing market, the natural question that arises is whether,through the labor market, land-labor ratios might be equated across farms, thereby restoring productiveefficiency in the face of high land ownership inequality. Underlying this proposition are two criticalassumptions: (1) constant returns to scale in production, and (2) all other factor markets, besides those forland and labor, are frictionless. Granting these assumptions (for now at least), it is then important toconsider the issue of labor market efficiency.
4.60 Analogous to the analysis of the land leasing market, the question is whether labor used per acreon a family farm is dependent on the labor endowment of the household? During the rabi season, 24percent of cultivating households hire labor, a share that rises to about 39 percent during the cash-cropping kharif season. Is this labor market activity sufficient to break the link between householddemographic composition and farm labor usage? The answer, as reported in the second and third rows ofTable 4.7, is "almost". Households with more prime-age males do apply significantly more labor to agiven acre of cultivated land, but the effect is not particularly large. The effect of an additional prime-agefemale on labor intensity is even smaller, and not statistically significant.
4.61 While this evidence indicates that, on average, marginal products of labor on the farm do notdeviate greatly from market wages, it does not necessarily imply overall productive efficiency. Asmentioned, the latter conclusion requires both constant returns to scale in production and perfectlyfunctioning markets in other factors. Though it is beyond the scope of the present analysis to test the
98
constant returns assumption, some evidence against the second assumption is provided below. What canbe reasonably concluded from this investigation is that interventions in the rural labor market would notappreciably enhance farm productivity.
Groundwater markets
4.62 Over the past two decades, farmers in Pakistan have increasingly relied upon groundwaterextracted from private (largely diesel) tubewells for irrigation, though there are stark regional differences,due largely to variation in groundwater availability. In Punjab, 74 percent of cultivating households usedgroundwater during the 2000-01 agricultural year, and 29 percent owned a tubewell; whereas, in Sindh,these figures are just 9 percent and 1 percent, respectively. Given the high costs of tubewell installation(about a year's income for the average farm household), it is not surprising that the rate of tubewellownership among cultivating households-even among the two-thirds that own land-is low (around 16percent nationwide). Consequently, groundwater markets are active, at least in Punjab. Overall, almost30 percent of the groundwater used is purchased from other farmers.
4.63 The fourth row of Table 4.7 summarizes the analysis of efficiency in the groundwater market.Unlike the other markets studied here, groundwater use per acre is examined at the plot level rather thanat the household level. This is because of the importance of location. Since it is not feasible to transportirrigation water very far through unlined field channels, access to both a tubewell and an irrigation canalis crucial in determining groundwater use. Two plots owned by the same household may have verydifferent access to these irrigation sources. The regression analysis controls for the availability of canalirrigation and position along the watercourse, for the availability of a tubewell (regardless of ownership)near the plot, as well as for soil type and topography of the plot. However, even conditional on tubewellavailability, plots cultivated by tubewell-owning households receive significantly more groundwater peracre than plots cultivated by non-owners. The misallocation of groundwater is not trivial; tubewellowners have a 15 percent higher utilization rate in rabi season and 17 percent higher rate in kharif. Ofcourse, given the high transport cost and low density of tubewells, some imperfection in the groundwatermarket should be expected. The more important question, one that will be taken up later, is whethertubewell owners are more productive than non-owners?
Rental markets forfarm machinery
4.64 Like tubewells, the vast majority of cultivating households do not own large farm machinery, yetmost access the services of such machinery through rental markets. The remaining two rows of Table 4.7report on the efficiency of these important rental markets.
4.65 Virtually all plowing is now done by tractor in Pakistan. However, only 8 percent of cultivatinghouseholds own either a small tractor (under 12 horsepower), or a large one. On the other hand, well over90 percent of these households plowed their land with a tractor during kharif and rabi seasons 2000-01.Regressions of tractor usage per acre, along the lines of the previous analyses, reveals that tractor ownersemploy 16-17 percent more hours of tractor services than non-owners. One possible explanation for thisfinding is that poorer cultivators are constrained in their ability to pay for tractor services up front, andhence do too little plowing. Alternatively, tractor rental markets may be somewhat thin, especially atcertain times of the year. In this case, tractor owners, facing idle capacity, plow their own land moreintensively than non-owners; more plowings are generally beneficial for yields, but there are obviouslydiminishing marginal returns. Once again, the salient issue is the magnitude of the impact of tractorownership on productivity. Some productivity effect is indeed likely, as shown, though it may be toosmall to detect in practice.
99
4.66 The case of threshers and combine-harvesters is relatively clearer. These expensive machines areowned by a scant 2 percent of cultivating households. Nonetheless, in rabi season, when wheat isharvested, 82 percent of these households - most, but not all, of whom cultivate wheat - usethreshers/combine-harvesters. There is no evidence that ownership of one of these machines affectsusage, which stands to reason. After all, in contrast to plowing, one can only thresh wheat once, soowning a thresher should not lead to more intensive threshing on one's own plot.
4.67 In summation, it seems that asset ownership, in general, seems to matter for factor usage inPakistani agriculture. Imperfections in the land leasing, groundwater, and tractor rental market suggestthat a redistribution of these assets could improve productivity. Evidence of a reasonably efficient rurallabor market does not belie this point. Given misallocation in three important factor markets, a perfectlyfunctioning labor market, even with constant returns to scale, would not lead to efficient production. Asalready noted, however, the crucial question is how economically important are these factor marketimperfections? Answering this question requires analyzing the impact of asset ownership on the profitsfrom farming. This is the topic of the next section.
Farm Productivity
4.68 Several constraints on farm productivity in Pakistan have been identified in this chapter.Particular emphasis has been placed on the scarcity and mismanagement of canal irrigation, the problemof soil degradation, and the consequences of farm asset inequality when rural factor markets areimperfect. Credit has also been discussed, but in this case the evidence tentatively suggests that lack ofaccess to credit does not seriously constrain input expenditure. At any rate, because of the difficulty ofisolating the "exogenous" component of credit constraints, it is difficult to do more at this point.
4.69 Further to these analyses, this section analyzes the plot-level production data from the PRHS toquantitatively assess the role of canal irrigation, soil degradation, and asset inequality. The resultsreported in Table A-4.3 (Annex), use regressions to identify the main determinants of net revenues forkharif and rabi 2000 - with revenue from orchards and livestock excluded - as well as of yields for themajor seasonal crops, rice in kharif and wheat in rabi.19
4.70 Evidence has already been uncovered of serious friction in the land leasing market. The resultsconfirm the importance of leasing limitations for productivity. A doubling of total operated area by thehousehold lowers per acre net revenue by 22 percent in kharif season, and by 38 percent in rabi season.Where is this large farm-size productivity effect coming from? The wheat yield regression suggests that,at least in rabi season, much of it is coming from variation in cropping intensity rather than allocativeefficiency. In particular, a doubling in farm size reduces wheat yields by "only" 10 percent, which is farless than the 38 percent reduction in net revenue for the same season. Similar, but less dramatic, resultsemerge in kharif season, where the farm-size effect on rice yields is just 13 percent, compared to the 22percent net revenue effect.
4.71 Evidently, households with larger operated area are leaving a larger fraction of their land fallow,especially during rabi season. The question is, why? One possibility is that cultivation is constrained bythe availability of irrigation, so that at some point part or all of a plot is simply not worth cultivating bythe owner, and certainly not by a tenant. However, the regressions hold constant the supply of irrigation tothe plot. Indeed, both the availability of canal irrigation during the season and access to a tubewell areimportant determinants of productivity. Yet, the farm-size productivity effect remains. Of course, it isstill possible, if not likely, that these variables do not capture all aspects of irrigation supply, especially inlight of the fact that 2000 was a year of unprecedented drought in parts of Pakistan. If one takes theseresults, along with those on the land leasing market above, at face value, the policy implications are quiteprofound. In principle, a redistribution of land would have a sizeable positive effect on farm productivity,
100
both by increasing yields and by increasing land use intensity. Of course, as with all the preliminaryresults from the PRHS survey reported in this chapter, these findings should only be viewed assuggestive. There may be other factors, not taken into account in the regressions, that are being conflatedwith the farm-size productivity effect. These factors need to be investigated further in future work.
4.72 Turning now to other farm assets, tractor ownership significantly increases net revenue in kharifseason;20 the effect in rabi is also positive but not significant. Since the imputed cost of services fromowned tractors is deducted from revenue, these findings mean that imperfections in the tractor rentalmarket are appreciably constraining farm productivity, at least in the cash-cropping season. Once again,this might be the result of credit constraints that limit the ability to pay for such pre-harvest inputs upfront, though there may be other reasons as well.
4.73 Somewhat the opposite situation prevails for tubewells, where the productivity effects ofownership are very large and highly significant only in rabi season. Ownership of a tubewell, holdingconstant access of the plot to a tubewell (whether owned or not), raises wheat yields by 30 percent andoverall rabi season net revenues by a whopping 83 percent. The lower impact of tubewell ownership inkharif probably reflects the fact that groundwater is a relatively less important source of irrigation duringthis season.
4.74 Whereas considerable inefficiencies were detected in the tractor and groundwater markets inSection 2, this was not the case for labor: rural labor markets in Pakistan are reasonably flexible. Hence,it is not surprising that, in contrast to these other household assets, endowments of labor are unrelated tofarm productivity. In particular, the number of prime-age household members, whether male or female,has no effect on net farm revenue in either season.
4.75 Results concerning soil salinity and waterlogging problems indicate very clearly their importancefor agricultural productivity in Pakistan. First off, the regressions show that productivity is higher onplots with access to good quality groundwater, compared to plots with access to brackish water. Thisfinding confirms the role of groundwater pumping in exacerbating soil salinity. As discussed earlier,farmers were also asked directly to assess the proportion of each plot affected by waterlogging andsalinity. Often plots are affected by both of these problems, so the variable in the regressions is theproportion of the plot affected by either waterlogging or salinity. The results: a 10 percentage pointincrease in plot area affected by waterlogging and/or salinity leads to a 11 percent decline in productivityin kharif and a 12 percent decline in rabi seasons. Interestingly, the effect of soil degradation on wheatyields is much smaller, though still negative, suggesting that the main affect of soil degradation in rabiseason is to limit the area of the plot that can be cultivated. Meanwhile, waterlogging/salinity have a verysignificant negative effect on rice yields (but not on cotton yields; these results are not reported here).This probably reflects the fact the rice tends to be grown on more saline land; first, because salinity ismore pervasive in rice-growing areas and, second, because rice is more resistant to salinity.
4.76 Finally, the importance of irrigation, both canal and tubewell, for crop yields and farm profitscannot be emphasized enough. The PRHS was not designed to measure actual water usage at the far m orwatercourse level, but relied rather on information from farmer recall. Despite this fact, and the relativelycrude measure of canal water availability (a qualitative index ranging from zero to five), the supply ofcanal irrigation is found to be a significant constraint on productivity. Refining these estimates usingmore sophisticated survey instruments is a clear priority for future research, one that would allow theefficiency losses from the current system of canal water delivery to be adequately quantified.
101
Policy Conclusions
4.77 As noted in this chapter, there is considerable scope for policy intervention to improve efficiencyand agricultural productivity. Particularly in remedying land ownership inequality and concomitantinequality in farm assets in rural Pakistan, which have substantial negative impacts on agriculturalproductivity and reinforces poverty.
4.78 First, the land leasing and land purchase markets function poorly, despite very secure ownershiprights. This appears to be due to friction in a number of other markets, including quite significantly, themarket for credit. As a consequence, the land rich under-use their land while the land poor cannot obtainsufficient land. This not only substantially lowers agricultural productivity, it also restricts theredistribution of wealth through markets, so that poverty can become entrenched. This suggests that thescope for market based land reforms might be quite limited since such reforms require well functioningland lease and purchase markets. On the other hand, other avenues for reform need to be explored. Inparticular, innovative mechanisms for improving access to credit and land for the poor need to beexplored.
4.79 Second, land inequality in rural Pakistan also reinforces inequities in access to critical resourceslike canal irrigation. Although canal irrigation substantially increases productivity, the pricing regime anddelivery mechanism for canal water clearly benefits those who have larger holdings. The flat rate forwater leads to wasteful water use in a situation where irrigation water is an extremely valuable and scarceresource. In addition, the ability to influence officials of the irrigation department to divert water to thehighest bidder allows those with larger land holdings to skew water distribution in their favor. Thisimposes three-fold costs on the poor: They must pay water charges whether or not they get water, paybribes to get the water which is their right, and suffer lower productivity due to uncertain and low watersupplies.
4.80 Finally, the analysis also shows that soil degradation, due to waterlogging and salinity, is quitesignificant in rural Pakistan, particularly in Sindh province and in Southern Punjab. These regions are alsocharacterized by extremely high land inequality and large land leasing markets. As noted above, sharetenancy is the dominant form of land leasing and all available evidence suggests that share tenants,particularly in an environment where tenure is insecure, have few incentives for investments in thepreservation of soil quality. Thus sustainable agricultural growth in these regions may depend on reformsthat increase the rational and equitable use of land resources as well as on public and private investmentto reduce soil degradation.
4.81 There are numerous avenues for policy intervention in canal irrigation, drainage and soil qualitypreservation. The analysis suggests that reforns that aim to rationalize the water-pricing regime andchange the performance incentives of irrigation officials are necessary. New public investment inirrigation infrastructure and drainage is also important. Water conservation and new investment couldbring vast tracts of Barani (rain fed) land under cultivation. In addition, policies that increase incentivesfor private investment in soil quality preservation, both at the farm and community level, are likely to bequite important. Constraints on such investment both at the farm and community level need to be betterunderstood.
4.82 Finally, it is important to note, as detailed early in the chapter, that more than a third of ruralhouseholds now work outside the agricultural economy, or at least do not derive their income mainlyfrom agriculture. The non-farm sector could therefore provide a potentially important avenue for povertyreduction efforts. An increase in wage and self-employment in the sector could not only providealternative income earning opportunities for the poor, it could also improve the bargaining position ofagricultural wageworkers and tenants by pushing up wages. Stagnant poverty rates suggest inadequate
102
growth in the non-farm sector over the past decade. Improving opportunities in the_labor-intensive non-
farn sector should be a priority area for public policy since this sector is a major source of livelihoods
and an important means of diversify incomes for the poor.
1 Agriculture is the single largest sector in Pakistan's economy. It contributes a quarter of the country's GrossDomestic Product and employs almost half of the labor force.2 Agricultural Census for Pakistan (1990)3 Nearly 80 percent of total cropped land is irrigated by the Indus Basin Irrigation system (IBIS) and ground waterresources. Of the 18 million hectares of irrigated land in 1999-2000, about 41 percent was irrigated by canals, 39percent by a combination of canal and tube wells and 17 percent by tube wells alone. Pakistan's irrigation system isthe largest contiguous canal irrigation system in the world. It has over 1.6 million kilometers of canal, branches,distributaries, field channels and watercourses. The major source of water for irrigation is the Indus Basin Irrigationsystem (IBIS), to which 106 million acre feet (MAF) of water is diverted annually (at the canal heads); around 38MAF or so is pumped from groundwater. Increases in the irrigated area were mostly achieved before 1980 when theirrigated area went from 9.25 million hectares in 1950 to 15.4 million hectares in 1983. Since the 1980s, the areairrigated by canals has remained around 8 million hectare while the additions in irrigated area have mainly comefrom groundwater tube wells.4Water Sector Investment Planning Study5 Seepage during water delivery also compounds problems of waterlogging and soil salinity. We take up this issue in
the next section.6 According to a recent World Bank (1999) study the marginal returns from irrigation, as measured by the value ofwater in the private water market, is estimated to be as much as 10 times the water charge).7 About one-half of all plots in the sample had access to canal irrigation, and the analysis in this section is restrictedto those plots. For each plot farmers were asked whether the plot had access to canal irrigation, the position of theplot on the watercourse, and a number of watercourse characteristics. In particular, the data obtained also covers theavailability of canal water over the past three seasons; the position of the watercourse on the distributary; whetherany payments were made to irrigation officials to ensure water supply; the existence of a water user's group on thewatercourse; and a number of variables that reflect something about the extent of landownership inequality amongcultivators on the watercourse, as well as other dimensions of heterogeneity - such as the number of differentcaste/zaat groups cultivating land on the watercourse.8Floods in late monsoon in 1998 increased water availability in Rabi 1998-99.9 It is worth noting that although the payment of bribes significantly affects water availability, the fraction ofwatercourses that report regular bribes to irrigation officials is if anything much smaller than we expected, given ourpre-test results and the findings of the qualitative survey. However, our field teams have reported that manyrespondents were quite reluctant to acknowledge their own participation in such payments although they mnaintainedthat such irregularities were routine.10 Waterlogging refers to the rise of the water table into the root zone of the soil profile at the point where it canasphyxiate the root system. Salt concentration affects seedling germination and vegetative growth. Agronomistshave found that above a certain threshold of salinity depending on soil quality, climate and cultivation practices,yields are considerably decreased." These include large investments such as sub-surface drainage schemes, lining of distributaries and watercourses,and reconstruction of earthen watercourses.12 These include the installation of irrigation tubewells, planting of orchards, the lining/cleaning/repair of on-farnwater channels, and improved surface irrigation via land leveling and the use of bed and furrows irrigation methods.Since these activities are easy to observe, someone can be paid to do them for the farner (hence they arecontractible).13 Manure application improves soil structure, leading to higher crop yields. The use of gypsum restores thechemical balance of the soil, and is particularly beneficial for moderately to strongly saline-sodic root zone soils. Inboth cases, the impact of one application can last for several years. Land levelling is a preventive measure since itreduces the pooling of water and the formation of saline patches.14 Given the timning of crop income, short-term (i.e., seasonal) borrowing allows farmers to finance expenditures oninputs such as seed, fertilizer, and tractor services, while longer term credit facilitates the acquisition of agriculturalmachinery, tubewells, and even land, as well as major land improvements.
103
15 Farmers were classified into size categories as follows: a) Marginal farmers with landholding > 0 & <=2 acres, b)Small with >2 & <=5 acres c) Medium with >5 &>=15 acres d) Large with >15 & <=40 acres c) Very large with >40 acres.16 Overall, some 60 percent of ADBP debt and 45 percent of NCB debt goes to large farmers and non-cultivatinglandowners.17 Households that reported borrowing from informal or formal sources were asked if they would borrow more atthe going rate of interest. If farmers responded yes to this query, they are classified as constrained. Farmers whodid not borrow were asked the reasons for not borrowing. The farmers who said they did not borrow because theydid not need credit, or preferred alternate sources of credit or because they found the rate of interest too high, areclassified as credit constrained.18 Reinforcing this is the fact that large farmers often see access to cheap institutional credit as a rent to landownership. Default rates have been high and substantial funds have been used to purchase urban property oradditional agricultural land.19 AU of the dependent variables are in logarithms, so that the coefficients can be interpreted as percentage changes.There are numerous cases of negative net revenue on a given plot (14 percent of the plots in kharif and 25 percent inrabi), which must be dropped from the samples. Qualitatively similar results are obtained, however, using the fullsamples with the level of net revenues as opposed to the logarithm.20 Controlling for village-level tractor rental prices has no effect on this coefficient.
104
5. Policy Implications: Recent Experience and Future Priorities
5.1 The analysis in this report highlights three critical areas of intervention that need to be the foci of
poverty reduction strategies for Pakistan. The crosscutting theme of social protection is vital to mitigate
the vulnerability, which, as shown in Chapter 2, affects a large share of households in rural and urban
areas alike. As detailed across the report, this is a major reason for the persistence of observed poverty in
Pakistan through the 1990s. And as noted in Chapter 3, this phenomenon is in turn closely linked to
Pakistan's persistent and on many fronts widening social gap, particularly in education and health. Hence
the importance of strategies to improve human development indicators. Given the significant gap
between urban and rural indicators, the high rural incidence of vulnerability - attributable largely to
recurrent weather related shocks in 2000 and 20001 - and the fact that two thirds of Pakistan's poor are
concentrated in the rural areas, this chapter also devotes special attention to the need for a well-
coordinated rural strategy. As discussed in Chapter 4, this should address both the need for social
protection and human development as well as other issues specific to rural poverty such as asset
ownership and agricultural resource management.
5.2 It is important to note that these strategies are premised on a broader developmental commitment
by the Pakistani government to continue supporting and promoting macroeconomic stability and a
govemance environment that is conducive to private sector investment and growth. In this sense, the three
pronged poverty strategy outlined in this report constitutes a mechanism to enable economic growth to be
both sustainable and pro-poor by addressing the structural and sectoral constraints that have undermined
long-term growth and have reduced its impact on poverty reduction.
5.3 To this end Chapter Five takes as its starting reference the Pakistani govemment's own Interim
Poverty Reduction Strategy (I-PRSP) and bases its recommendations on the experience of existing
programs and initiatives in Pakistan and ways in which they can leveraged in the future. A review of such
programs highlights some positive experiences but also points to the need for substantial improvement
and additional effort in many areas. Broadly, the ensuing recommendations emphasize common themes:
improving access to markets for credit that mitigate vulnerability; removing institutional obstacles to
service delivery which is particularly topical in the context of Pakistan's recent devolution reforms;
improving access to assets, including land, in the rural sector; and improving coordination among
mutually reinforcing policies. The importance of improving monitoring of program results is also
emphasized.
5.4 Encouragingly, the recommendations that derive from the analysis in the report are broadly
consistent with the strategy outlined in Pakistan's I-PRSP (Box 5.1), though they also suggest a need for a
strengthening of this strategy. Key elements of the I-PRSP's recommendations are to promote growth
through macroeconomic stabilization and by improving the investment climate for private sector led
growth. Special attention is also paid to specific reforms in the rural sector, and to facilitate productivity
and growth of small and medium enterprises. An additional important feature of this strategy is to lay out
a plan that uses the ongoing process of devolution to enhance efficiency and quality of public services,
particularly in education and health. While this focus of the I-PRSP is critical, there is a need to deepen
the understanding that underpins some areas of reform identified in this chapter. Moreover, the chapter
identifies some possible areas of intervention for which the I-PRSP has not laid out a detailed approach,
for instance in the rural sector.
105
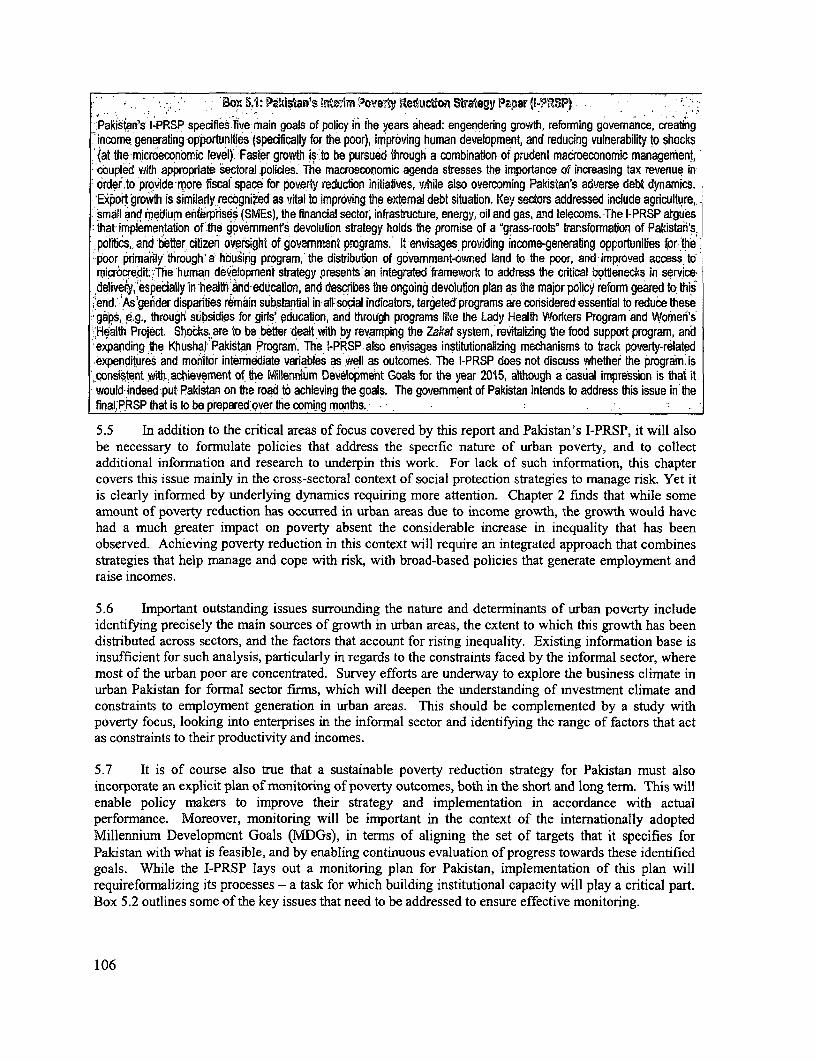
'. ' ' -. ' ' ;Box 51: fPatistan's MOtiam Povery Reductioi Straegy Paper (l@RSP"
Pakistan's I-PRSP specifies mve main goals of policy in the years ahead: engendering growth, reforming govemance, creatingincome generating opportunites (specifically for the poor), improving human developmrent, and reducing vulnerability to shocks({at the microeconomic level). Faster grow is to obe pursued through a combination of prudent macroeconomic management,coupled with appropriate sectoral -policies. The macroeconomic agenda stresses the importance of increasing tax revenue inorder.to provide-more fiscal space for poverty reduction initiatives, while also overcoming Pakistan's adverse debt dynamics.
-'Ex4rt growth is similarly recognized. as vital to improving the extemal debt situabon. Key sectors addressed include agriculture,.smali and mnedium enterprises (SMEs), the financial sector, infrastructure, energy, oil and gas, and telecoms. The I-PRSP arguesthat'implementabon of the govemments devolufion strategy holds the promise of a "grass-rootse transformaboin of Pakistah's.politics, and better citizen- oversight of governm2nt programs. It envisages providing income-generating opportunities for 'the
;poor 'primarily through' a housirig program, the distributon of govemment-owned land to the poor, and Limproved access to'microcreditL.The human development strategy presents an integrated framework to address the critical bottlenecks in servicedeIivery, especially inthealth'and educalion, and descdbes the ongoing devolution plan as the major policy reform geared to this
23end.'-"As'gehder disparities remain substantal inpaWl social indicators, targeted programs are considered essential to reduce thesegaps, e.g., through subsidies for girls' education, and through programs like the Lady Health Workers Program and Women's,ealth Project Shobks,. are to be better dealt-with by revamping the Zakat system, revitalizing the food support program, andexpanding the Khushal Pakistan Program. The l-PRSP.also envisages institutionairzing mechanisms to track poverty-related.expenditures and monitor intermediate variables as well as outcomes. The l-PRSP does not discuss whether the. program, isconsistent ment of the Millennium 1evelopmert Goals for the year 2015, although a casuial impression is that itwould indeed put Pakistan on the road to achieving the goals. The govemment of Pakistan intends to address this issue in'thefinal,PRSP that is to be prepared'over the coming months..-
5.5 In addition to the critical areas of focus covered by this report and Pakistan's I-PRSP, it will alsobe necessary to formulate policies that address the specific nature of urban poverty, and to collectadditional information and research to underpin this work. For lack of such information, this chaptercovers this issue mainly in the cross-sectoral context of social protection strategies to manage risk. Yet itis clearly informed by underlying dynamics requiring more attention. Chapter 2 finds that while someamount of poverty reduction has occurred in urban areas due to income growth, the growth would havehad a much greater impact on poverty absent the considerable increase in inequality that has beenobserved. Achieving poverty reduction in this context will require an integrated approach that combinesstrategies that help manage and cope with risk, with broad-based policies that generate employment andraise incomes.
5.6 Important outstanding issues surrounding the nature and determinants of urban poverty includeidentifying precisely the main sources of growth in urban areas, the extent to which this growth has beendistributed across sectors, and the factors that account for rising inequality. Existing infornation base isinsufficient for such analysis, particularly in regards to the constraints faced by the informal sector, wheremost of the urban poor are concentrated. Survey efforts are underway to explore the business climate inurban Pakistan for formal sector firms, which will deepen the understanding of investment climate andconstraints to employment generation in urban areas. This should be complemented by a study withpoverty focus, looking into enterprises in the informal sector and identifying the range of factors that actas constraints to their productivity and incomes.
5.7 It is of course also true that a sustainable poverty reduction strategy for Pakistan must alsoincorporate an explicit plan of monitoring of poverty outcomes, both in the short and long term. This willenable policy makers to improve their strategy and implementation in accordance with actualperformance. Moreover, monitoring will be important in the context of the intemationally adoptedMillennium Development Goals (MDGs), in terms of aligning the set of targets that it specifies forPakistan with what is feasible, and by enabling continuous evaluation of progress towards these identifiedgoals. While the I-PRSP lays out a monitoring plan for Pakistan, implementation of this plan willrequirefonmalizing its processes - a task for which building institutional capacity will play a critical part.Box 5.2 outlines some of the key issues that need to be addressed to ensure effective monitoring.
106
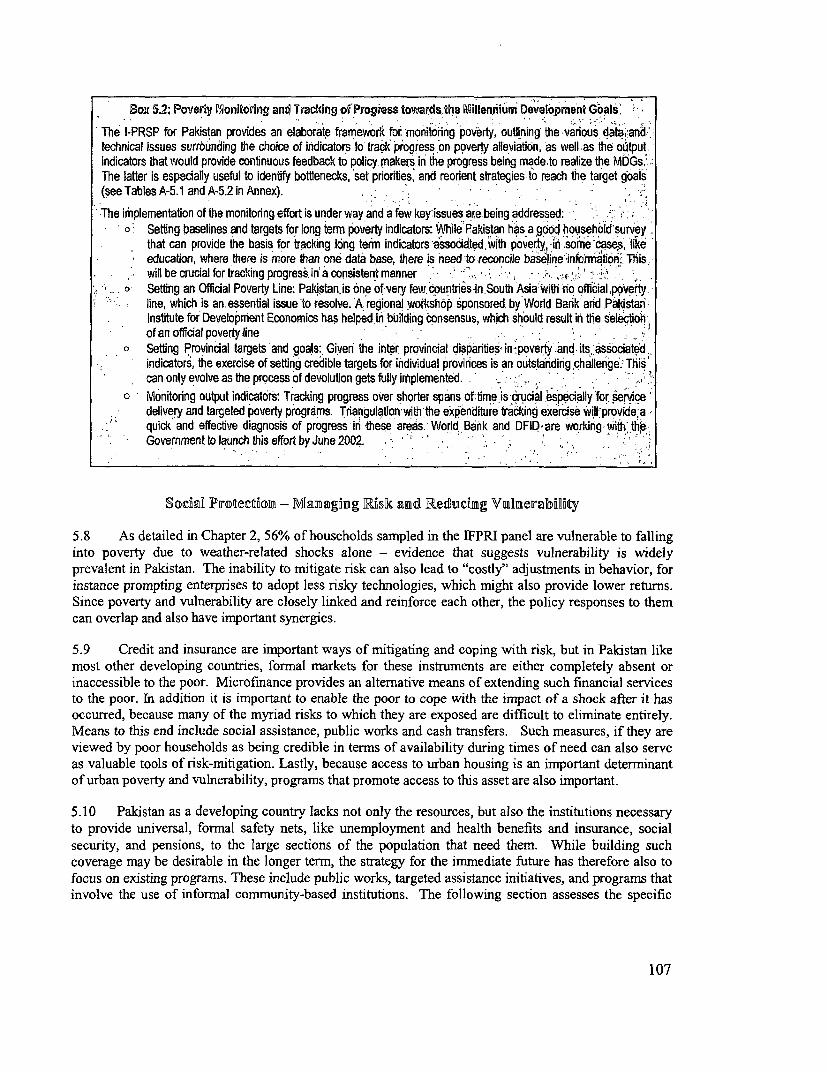
Box 5.2; Poveriy lNonitoring and Tracking ol'Progress towards th Pililenniuim Development Goals'
The I-PRSP for Pakistan provides an elaborate framework far Cmonitoring poverty ouUning' the varous dat and.`technical issues surrbunding the choice of indicators to' track pogress. on ppverty alleviaton, as well .as the outputindicators that would provide contnuous feedback to policy.rnakers in the progress being made.to realize the MDGs..The latter is especially useful to identify bottlenecks, set priorities; and reorient strategies. to reach the target 'goals(see Tables A-5.1 and A-5.2 in Annex). ,
The implementation of the monitoring effort is under way and a few key.issues are-being addressed: ,0 Setting baselines and targets for long term poverty indicators: While Pakistan has a good househ6ld survey .
that can provide the basis for trcking long term indicators assodated,with poverty,-in sorme ,cases' like 'education, where there is more than one data base, there is need to reconcile baseline inIormationr Thiswill be crucial for tracking progress inr a consistent manner ,.;- '. - .
o Setting an Official Poverty Line: Pakistanis dne of very few countries in.South Asia'with no official poverty-line, which is an. essential issue 'to resolve. A-regional worsJip sponsored. by World Bark and PakistanInstitute for Developnient Economics has helped,in building consensus, which should result in the selectionof an official poverty line
o Setting Provincial targets 'and goals: Given the inter provincial disparities in :poverty!'and its ass,ciatedindicators, the exercise of setting credible targets-for individual provirices is an outstanding,challerige: This'
Monitoring output indicators: Tracking progress over shorter spans of tme is-crucial especially 'for, service'delivery and targeted poverty programs. Triagulation with'the expenditure tracking exercise will provide,aquick and effectve diagnosis of progress in 'these areas. World Bank and DFID are working with thb,Govemment to launch this effort by June 2002.
SocWal IProtectioia - Manag&ng Risk anid lReducimg Vulnerability
5.8 As detailed in Chapter 2, 56% of households sampled in the IFPRI panel are vulnerable to fallinginto poverty due to weather-related shocks alone - evidence that suggests vulnerability is widelyprevalent in Pakistan. The inability to mitigate risk can also lead to "costly" adjustments in behavior, forinstance prompting enterprises to adopt less risky technologies, which might also provide lower returns.Since poverty and vulnerability are closely linked and reinforce each other, the policy responses to themcan overlap and also have important synergies.
5.9 Credit and insurance are important ways of mitigating and coping with risk, but in Pakistan likemost other developing countries, formal markets for these instruments are either completely absent orinaccessible to the poor. Microfmance provides an alternative means of extending such financial servicesto the poor. In addition it is important to enable the poor to cope with the impact of a shock after it hasoccurred, because many of the myriad risks to which they are exposed are difficult to eliminate entirely.Means to this end include social assistance, public works and cash transfers. Such measures, if they areviewed by poor households as being credible in terms of availability during times of need can also serveas valuable tools of risk-mitigation. Lastly, because access to urban housing is an important determinantof urban poverty and vulnerability, programs that promote access to this asset are also important.
5.10 Pakistan as a developing country lacks not only the resources, but also the institutions necessaryto provide universal, formal safety nets, like unemployment and health benefits and insurance, socialsecurity, and pensions, to the large sections of the population that need them. While building suchcoverage may be desirable in the longer term, the strategy for the immediate future has therefore also tofocus on existing programs. These include public works, targeted assistance initiatives, and programs thatinvolve the use of informal community-based institutions. The following section assesses the specific
107
roles played by major existing programs of this kind, highlighting positive attributes and lessons forfuture policy, in addition to pointing up shortcomings requiring reform, or additional efforts.
5.11 As noted earlier, an underlying theme of this assessment is the need for greater complementarityamong programs, and for underlying reforms in administration and governance. Existing Zakat, socialpension and public works programs should consider expanding coverage and improving theirresponsiveness and flexibility, in part through better targeting. This also requires institutional reform,greater transparency, and in some cases, stronger government commitments. A review of microfmanceprograms suggests that it would be beneficial to expand coverage, deepen alliances with fornal marketinstitutions such as banks, and regularize public support for some programs. With regards to urbanhousing, the record points to the benefits of greater community participation in leveraging limitedresources, and the importance of such programs being complemented by income support and credit accessschemes.
Social Welfare and Pension Systems
5.12 The following section reviews the current range of disparate programs in Pakistan that provideelements of social protection. The most important of these is the Zakat system, which is the principalform of cash transfers to the poor in Pakistan - an important form of social assistance that helps themmanage risk.. The publicly administered Zakat system is funded by a wealth tax and disbursed toinstitutions operating at the national level, with the remainder divided among local committees fordisbursement to individuals. Those eligible to receive Zakat include the poor, especially widows andorphans, and the handicapped. At present, annual Zakat collection is around Rs. 5 billion, with about 2.5million beneficiaries during 2000-01. Yet although Zakat has emerged as the government's main socialsafety instment, its potential and scope in fighting poverty is yet to be fully realized.
5.13 Zakat has several positive design elements: its subsistence allowance seems adequate, amountingto about three times the average income gap of the poor;' its reliance on a specific source for fundsensures sustainability; and the program has a strong re-distributive potential. However, studies havefound the impact of Zakat funds on the poor to be very limited, mainly because of the relatively smallamount of aggregate transfers. Zakat collections as a proportion of GDP amounted to only 0.2 percent by1992-93, implying that even if all the benefits had gone to the lowest quintile of households, the incomeof this group would have been augmented by only 2 percent. 2 In 1996-97, according to HIES data, only3.5, 2.1 and 1.4 percent of households in the first, second and third lowest expenditure decilesrespectively reported receiving any Zakat transfers. However, the limited aggregate impact of Zakat onpoverty does not preclude a more significant impact on vulnerability, if the cash transfers were to helphouseholds smooth consumption in the face of shocks. Existing studies offer little insight into theconsumption-smoothing aspect of Zakat - a major gap in assessing the program's impact that should beaddressed by future evaluations.
5.14 The impact of Zakat transfers on poverty and vulnerability alike would also depend to a largeextent on targeting efficiency. Evidence on this has been mixed at best. According to some studies, onlyabout half of all direct payments went to households in the lowest expenditure quintile.3 One of thereasons for this inefficiency is the problem in identifying eligible beneficiaries, which appears to beexacerbated by patronage politics at the level of the local Zakat committees. In addition, the status ofbeneficiaries is not kept up-to-date. Accordingly, beneficiaries may continue to receive support for yearsafter their initial entry into the program, regardless of their current status.4
5.15 Encouragingly, the system of collection and disbursement of Zakat has been recently reorganizedto improve its efficacy.5 The institutional framework for implementing, monitoring, and evaluating theprogram is being strengthened, and relief to beneficiaries in the form of subsistence grants were raised
108
last year from a monthly transfer of Rs. 300 to Rs. 500. The government expects that an additional 1.5
million beneficiaries will be added to the current list of around 2.5 million Zakat recipients. Moreover,
the revitalized Zakat system will provide funds not only to fulfill basic needs but also to permanently
rehabilitate beneficiaries, by assisting in the establishment of small-scale commerce or other means of
living suitable to their qualifications, skills profile, and local conditions.
5.16 Pakistan Bait-ul-Maal (PBM) is another notable safety net program, mainly providing assistance
to those in need, like minorities, who are not covered by Zakat. Administered by an autonomous board of
management, PBM provides two main benefits - the Individual Financial Assistance scheme that
disbursed Rs. 14 million to about 5,000 beneficiaries, and the Atta Subsidy Scheme that provided about
200,000 families with a monthly cash stipend of Rs. 200 in 1997-98. However, limited coverage severely
limits the impact of PBM, as does the tedious procedure involved in applying for assistance from this
program. And unlike Zakat, Bait-ul-Maal does not have any identifiable source of income, so that its
exclusive reliance on budgetary support leaves it vulnerable to changing fiscal conditions. From recent
reports, it also appears that transparency is a serious problem, on account of the discretion that high-level
functionaries have in allocating funds from this program.
5.17 For both the Zakat and PBM programs to fulfill their potential as safety nets, institutional
arrangements must be strengthened for the identification of eligible persons, while making this process
more transparent and simple. The risk-mitigating benefits of such programs could also be enhanced not
only by improving targeting, but also by making the programs flexible enough to respond in a timely
manner to the incidence of shocks, especially those of a covariant type. In addition, as far as individual
programs are concerned, Zakat will benefit greatly from improvements in the assessment and collection
of taxes, and the Bait-ul-Maal from a strong financial commitment from the government, along with
improved financial management and planning.
5.18 Employees Old-Age Benefits Institution (EOBI) is the primary public social security scheme for
low-income urban workers in Pakistan, providing pensions to workers earning less than Rs. 3000 a
month in enterprises with 10 or more employees. Anyone who has worked for at least 15 years and is 60
years of age (55 for women) is eligible for a monthly pension; provided the employer makes periodic
EOBI contributions (at 5 percent of wages) for their registered workers. There is also provision for a
reduced pension for workers who retire before the age of 60, a pension for invalids for the duration of the
illness, a survivor's pension and old age grants.6 Given the rapidly expanding labor force and the large
proportion of young workers, a scheme like EOBI has the potential to develop as a major safety net forlow income, retired or invalid workers.
5.19 However, while limiting the coverage to workers below a threshold wage has enhanced targetingefficiency of EOBI, the program suffers from low coverage. The 1.2 million registered workers make up
only 20 percent of the number of urban employees, partly because of the large number of workersemployed in the informal sector and partly because of large scale evasion by employers. In addition, the
fact that the employer contribution system adds to the cost of hiring labor may have an adverse effect on
employment. Introducing a flat rate contribution per worker by the employer and by guaranteeing a
matching contribution by the government may help address this problem, while also ensuring financial
sustainability. It may also be beneficial to encourage contribution by the employees themselves. The
scheme should also be expanded to include the self-employed and employees in firms with less than 10
workers (thus incorporating the informal sector), for which again it will be imperative to create correct
incentives.
5.20 In addition to their functional shortcomings, there is also generally very little evidence about the
impact of any of the programs described so far, in terms of reducing income or consumption volatility.
This prevents an evaluation of their effectiveness as instruments for managing risk. In order to address
109
this gap in knowledge, analysis focused on the risk benefits provided by each program should be apriority for the future, and should underpin strategies that aim to expand their efficacy as riskmnanagement tools.
Public Works Programs
5.21 As the discussion above has shown, existing social protection programs in Pakistan areinsufficient to meet the need for social safety evinced by a large proportion of the vulnerable population.Public works programs, however, have typically played an important role as safety nets in manydeveloping countries by conferring stabilization benefits by smoothing consumption in periods of highunemployment. While such programs have largely failed in Pakistan, for various reasons7, thegovernment has clearly recognized the need for a functional public works program, and through anongoing initiative named Khushal Pakistan Program - established a broad-based scheme that has thepotential to significantly extend the coverage of social protection in the country.
5.22 Khushal Pakistan: Under this program, funds are allocated to districts through provincialgovernments, while the schemes are identified and selected at the district level through active communityparticipation. The criteria are that a project should be capable of integrating with existing infrastructure,and that its management and implementation will be undertaken by a partnership with local beneficiarycommunities. According to the government, the program has created numerous employmentopportunities and is providing essential infrastructure in rural and low-income urban areas. The programreceived an allocation of Rs. 7.5 billion during 2001-02, which has been adjusted in accordance with therate of utilization experienced last year. With the expected improvement of district governmentsenvisaged through Pakistan's recent devolution reforms, the govermment expects the program to enjoygreater local ownership and to gain in importance.8
5.23 While systematic evaluations of the Khushal Pakistan program would be possible only after it hasbeen in operation for some time, there are some critical aspects of its design and implementation that needto be considered if it is to attain its social protection objectives. One concerns targeting. A public worksprogram can achieve targeting efficiency through geographic targeting of areas with vulnerablepopulation and also by inducing self-selection by intended beneficiaries, in which case its wages shouldbe no higher than the market wage for the relevant type of labor. Wage schedules also need to be gender-neutral, and to this end, certain kinds of wage structures (like piece wages) can facilitate participation ofwomen. Another critical aspect relates directly to the risk mitigation benefits provided by the program.Such benefits tend to be high when access to the program is viewed as credible during times of need.9Making Khushal Pakistan available at all times, and expanding it automatically during crises such asdroughts and floods in affected areas, will accordingly maximize its risk mitigating qualities.' 0
5.24 Experience in other countries has also shown that delivery of benefits, as well as cost-effectiveness, can be enhanced by effective organization at the local level, by strengthening localgovernments, by building their capacity, and by ensuring incentive compatibility between local officialsand line agencies. Facilitating empowering coalitions of the poor, like labor unions or community-basedorganizations, would also improve accountability of implementing agencies and act as a check againstcorruption and patronage. In this regard, the fact that the Khushal Pakistan program incorporates activecommunity participation in program selection is a positive feature. And as noted by the Pakistanigovernment, since the ongoing devolution program in the country can help strengthen local governmentsand create accountability, the success of the Khushal Pakistan will be linked to that of this broaddevolution exercise.
110
Microfinance
5.25 As noted in Chapter 4 of this report, market failures in rural financial markets contribute greatlyto the vulnerability of the poor by depriving them of access to credit and insurance. By lending to groups,which leverages the social information that the poor have about each other, microfmance schemes areoften able to circumvent the informational problems that are responsible for the failure of the formalfinancial sector in rural areas, and are consequently able to achieve high repayment rates. Since creditand insurance are closely related in the context of the rural poor, microcredit also plays the important roleof insurance against income shocks. A review of such microfmance programs in Pakistan upholdsobservations about the potential of this model but also suggests that many additional improvement andchanges are warranted, including expanding coverage, deepening alliances with formal market institutionssuch as banks, and regularizing public support for some programs. In addition, there appears to beconsiderable scope for using microfinance institutions to channel additional services to localcommunities.
5.26 In Pakistan, the main impetus to microfinance has come from the NGOs, primarily rural supportprograms (RSPs). RSPs are an experiment with models of participatory development based on institutionbuilding, which incorporates microfinance. The overall strategy, pioneered by the Aga Khan RuralSupport Program (AKRSP), seeks to establish self-help organizations and cooperatives whose leaders areto be trained continuously and redeployed for the benefit of village communities. In recent years,provincial as well as national RSPs, created to follow the pioneering approach of the AKRSP, haveexpanded their outreach significantly. At the end of 1999, 62 districts in Pakistan had been covered byvarious RSPs. The program has mobilized savings of Rs. 697 million and disbursed credit in the amountof Rs. 3 billion. In addition to the role played by RSPs, microfinance has spread rapidly through theefforts of numerous other non-governmental entities, both large and small.
5.27 These efforts share a number of positive characteristics. Microfinance service providers inPakistan generally work with and through community-based groups that they have helped to form. Theybuild the leadership, management and credit capacity of these groups before they commence lending.Concomitantly, almost all microfinance providers are engaged in the delivery of other services, mostcommonly social infrastructure, welfare services and improved natural resource management. Therelative success of microcredit schemes launched by the RSPs is largely because their lending policieshave been conservative.
5.28 In spite of its rapid expansion, significant challenges confront microfinance in Pakistan. It is stillunable to extend coverage to the vast majority of the poor, and efforts like those of the RSPs tend to beconcentrated in the northern areas. The rate of penetration is low in rural Sindh and Balochistan. Mostmicrofmance programs are also unable to attain sustainability by charging sufficiently high interest ratesand finding investment opportunities that yield returns higher than the cost of borrowed funds. Themicrofmance system thus needs to establish a sustainable framework in order to reach much largernumbers in future, rather than remain dependent on donor or govermnent funds.
5.29 In order to promote efficiency, there may accordingly be a need to foster competition in themicrofinance market both spatially and in terms of performance and customer choice. Non-traditionalapproaches, like partnerships with commercial banks, may also work to generate funds. There are someencouraging indications of such collaborations. Recently, the National Rural Support Program (NRSP)and the Sarhad Rural Support Program (SRSP) successfully negotiated with two commercial banks forcredit lines for their lending operations."'
5.30 In view of the heightened demand for microcredit in poor communities, the Pakistani governmentand donors for their part have realized the need for ensuring the supply of sufficient funds on a
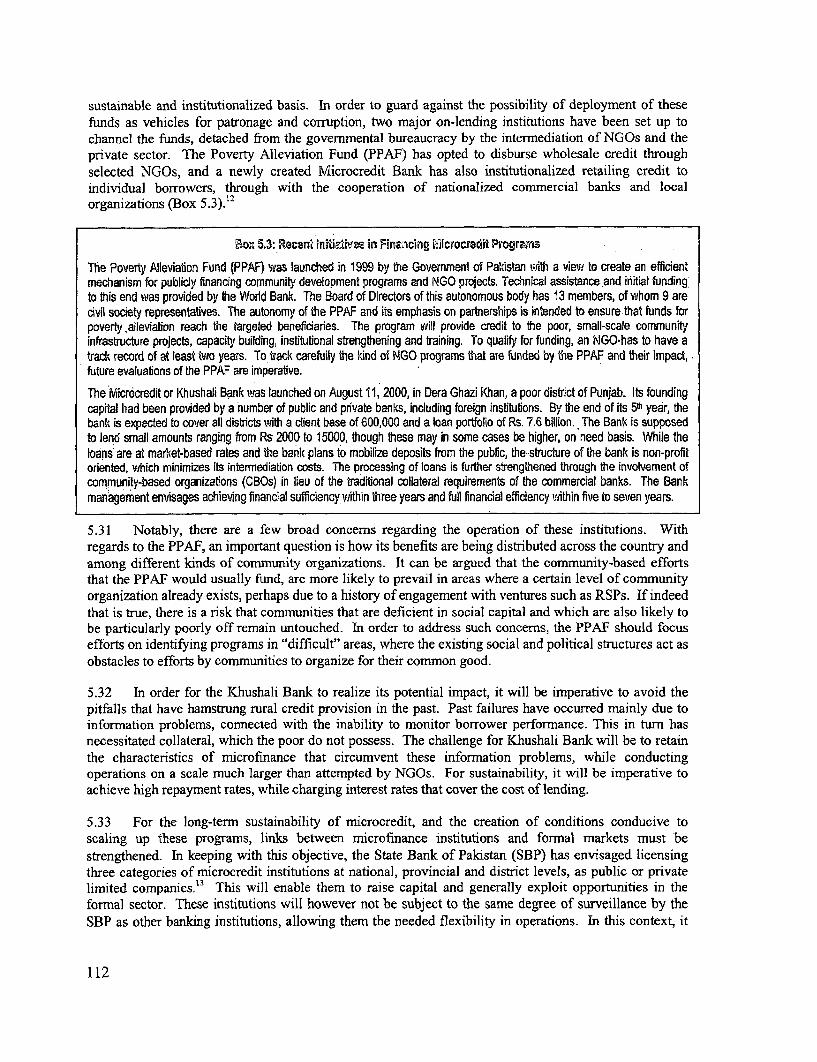
sustainable and institutionalized basis. In order to guard against the possibility of deployment of thesefunds as vehicles for patronage and corruption, two major on-lending institutions have been set up tochannel the fimds, detached from the governmental bureaucracy by the intermediation of NGOs and theprivate sector. The Poverty Alleviation Fund (PPAF) has opted to disburse wholesale credit throughselected NGOs, and a newly created Microcredit Bank has also institutionalized retailing credit toindividual borrowers, through with the cooperation of nationalized commercial banks and localorganizations (Box 5 .3).*2
Box 5.3: Receni lnMitlive- in Fnzacning Hiicrocredit Programs
The Poverty Alleviation Fund (PPAF) was launched in 1999 by the Government of Pakistan with a view to create an efficientmechanism for publicly financing community development programs and NGO projects. Technical assistance,and initial fundingto this end was provided by the World Bank. The Board of Directors of this autonomous body has 13 members, of whom 9 arecivil society representatives. The autonomy of the PPAF and its emphasis on partnerships is intended to ensure that funds forpoverty aileviation reach the targeted beneficaries. The program will provide credit to the poor, small-scale communityinfrastructure projects, capacity building, institubonal strengthening and training. To qualify for funding, an NGO-has to have atrack record of at least two years. To track carefully the kind of NGO programs that are funded by the PPAF and their impact,future evaluations of the PPAF are imperative.
The Microcredit or Khushali Bank was launched on August 11, 2000, in Dera Ghazi Khan, a poor district of Punjab. Its foundingcapital had been provided by a number of public and private banks, including foreign institutions. By the end of its 51h year, thebank is expected to cover all disticts with a client base of 600,000 and a loan portfolio of Rs. 7.6 billion. The Bank is supposedto lend small amounts ranging from Rs 2000 to 15000, though these may in some cases be higher, on need basis. While theloans are at market-based rates and the bank plans to mobilize deposits from the public, the structure of the bank is non-profitoriented, which minimizes its intermediation costs. The processing of loans is further strengthened through the involvement ofcommunity-based organizations (CBOs) in lieu of the traditional collateral requirements of the commercial banks. The Bankmanagement envisages achieving financial sufficiency,within three years and full financial efficiency within five to seven years.
5.31 Notably, there are a few broad concerns regarding the operation of these institutions. Withregards to the PPAF, an important question is how its benefits are being distributed across the country andamong different kinds of community organizations. It can be argued that the community-based effortsthat the PPAF would usually fund, are more likely to prevail in areas where a certain level of communityorganization already exists, perhaps due to a history of engagement with ventures such as RSPs. If indeedthat is true, there is a risk that communities that are deficient in social capital and which are also likely tobe particularly poorly off remain untouched. In order to address such concerns, the PPAF should focusefforts on identifying programs in "difficult" areas, where the existing social and political structures act asobstacles to efforts by communities to organize for their common good.
5.32 In order for the Khushali Bank to realize its potential impact, it will be imperative to avoid thepitfalls that have hamstrung rural credit provision in the past. Past failures have occurred mainly due toinformation problems, conmected with the inability to monitor borrower performance. This in turn hasnecessitated collateral, which the poor do not possess. The challenge for Khushali Bank will be to retainthe characteristics of microfinance that circumvent these information problems, while conductingoperations on a scale much larger than attempted by NGOs. For sustainability, it will be imperative toachieve high repayment rates, while charging interest rates that cover the cost of lending.
5.33 For the long-term sustainability of microcredit, and the creation of conditions conducive toscaling up these programs, links between microfinance institutions and formal markets must bestrengthened. In keeping with this objective, the State Bank of Pakistan (SBP) has envisaged licensingthree categories of microcredit institutions at national, provincial and district levels, as public or privatelimited companies.,3 This will enable them to raise capital and generally exploit opportunities in theformal sector. These institutions will however not be subject to the same degree of surveillance by theSBP as other banking institutions, allowing them the needed flexibility in operations. In this context, it
112
will be necessary to develop a regulatory framework that addresses the unique aspects of such enterprises,while promoting transparency and financial accountability.
5.34 Recent experiences in developing countries have also shown that the community-basedcharacteristics of microcredit are applicable to the provision of an entire range of financial services to thepoor, including saving services and insurance schemes that provide valuable risk management benefits.Examples of such initiatives can be found, among others, in the efforts of Grameen Kalyan inBangladesh, which provides medical and life insurance to a sizeable number of the rural poor inBangladesh. Such efforts have not been undertaken in Pakistan, and there is a case for initiating somepilot efforts that could test the viability of such programs. Public policy can support these efforts byproviding technical and financial support in the start-up phase, and in the long term by creating anenabling legal and regulatory framework for such institutions.
Urban Housing and Infrastructure Programs
5.35 The programs described so far attempt to address different dimensions of vulnerability, primarilyas a function of income. Because lack of secure and adequate urban housing is an important determinantof urban poverty and vulnerability in Pakistan, programs to improve access to this vital asset - initiated bythe government and the civil society alike - are also assessed in the broad-based context of socialprotection strategies in the country. While there have been some less successful attempts to address thisproblem, trial projects have been promising. In aggregate, these experiences point to the need for greatercommunity participation in leveraging limited resources, and for providing complementary incomesupport and access to credit in the contexts of securing and improving urban living conditions.
5.36 One of the more neglected yet important correlates of urban poverty and vulnerability is the lackof adequate housing, combined with the lack of basic facilities like access to electricity, safe drinkingwater, and sanitation. Historically, most of the projects undertaken by the Pakistani government to meetthe housing needs of low income groups have been such that either the end product was not tailored to theneeds of the poor, or priced so high as to be unaffordable. 4 The result of the failures of governmenthousing schemes, coupled with rapid urbanization, has been that an estimated 40 to 60 percent of theurban population currently lives in katchi abadis, or non-regularized subdivisions on agricultural land."5
5.37 The living conditions in katchi abadis are associated with a high degree of risk for the inhabitants,arising from lack of security of tenure, and lack of basic amenities, like safe water and sanitation, whichincreases health risks. Programs to address the urban housing crisis should therefore have a significantimpact on vulnerability. Responding to this need, the government in 1978 started the Katchi AbadiImprovement and Regularization Program (KAIRP). It envisaged infrastructure development and thegranting of tenure for the residents of katchi abadis, against repayment of land and development charges.However, it has failed to achieve its targets for a number of reasons; these include the high costs ofupgrading squatter settlements, lack of community participation, and lack of capacity and capability in theimplementing agencies. In addition, there are no avenues for credit available to low-income groups andthe poor for housing.
5.38 In contrast, less ambitious programs like the Orangi Pilot Project (OPP) that have sought toorganize communities to help solve problems in securing infrastructure facilities like sanitation, have metwith more success.' 6 Innovative programs like OPP share a few common features that suggest guideiinesfor future initiatives, whether initiated by the govenmment or NGOs. First, they have accepted thesituation on th- ground with respect to the existence of these settlements and have refrained fromimposing artificially high standards of construction and sanitation, which are well beyond the means ofboth the state and the households. Second, they have relied on the community's own involvement in
113
finding the solutions to their housing problems, for instance, in accessing the services of the linedepartments. They have also encouraged networking with technical experts.
Human Development - Education and Health
5.39 Education outcomes in Pakistan improved very little during the 1990s, especially in rural areas.Moreover, while key health indicators like infant and child mortality have shown some improvement,they remain poor in absolute terms and still lag well behind what is found in most countries at acomparable stage of economic development. In addition there are wide gaps in educational attainmentbetween males and females and between rural and urban areas. Available health indicators document asimilarly substantial gap between rural and urban areas. A shortage of facilities, a crisis inimplementation, and low demand for some services are the three most important reasons for thesefailures.
5.40 As documented in Chapter 3, the availability and quality of facilities is critical to improvinghealth and education outcomes. The evidence provides a strong basis for concluding that the scarcity ofadequate facilities is a significant constraint on progress in health and education. The converse is moreencouraging: more investments in facilities, despite potential demand-side problems, should have a strongimpact on health and education outcomes if these investments are accompanied by major steps to correctthe institutional failures and obstacles to delivery that have hampered access to quality services in thepast.
5.41 Institutional obstacles were a key reason for the failure of Pakistan's Social Action Program,which to date represents the most concerted effort by its government and donors to remedy the country'ssocial gap. It is also instrumental in the limited progress in preventive health care.' 7 According to PIHS(1996-97), only about half of the children in the country were immunized in 1996-97, implying that thenational health system failed to reach over 9 million out of 19 million children of age 5 and under.Another serious indicator, highlighted in Chapter 3, is the prevalence of chronic malnutrition among veryhigh portions of children in sampled districts. As detailed below, these failures points to the detrimentalconsequences of inadequate govermment support for social policy and the appropriation of expendituresby local patronage politics.
5.42 Pakistan's recent devolution and governance reforms are encouraging, yet as noted in Chapter 3,their success will be contingent on ensuring true competition in local elections. In addition, some federalintervention will probably be necessary in addressing intra-regional gaps. Beyond discussing relevantsupply-side problems, this section also elaborates ways of tackling demand side problems born of socialand other barriers to health and educational attainment. An indication of the former is that while familyplanning programs have been successful in almost universalizing knowledge of contraceptives, only about20% of the women in childbearing age used some form of contraception in 1998-99. In the context cfeducation, where low demand for girls' education appears to be a problem, the potential utility ofincentive subsidies to households is considered, along with the potential for harnessing further privatesector involvement in educational provision. To assess the performance of such reforms, there is a needfor considerably better monitoring and collection of information on educational and health outcomes inPakistan.
The Social Action Program
5.43 The experience of the Social Action Program (SAP) underlines the difficulties of a facilities-focused approach that neither addresses severe institutional nor demand-side obstacles to social progress.The SAP was launched in 1992/93 with the objective of furthering social development in Pakistan andhas to date disbursed Rs.145 billion (See Box 5.4).18
114
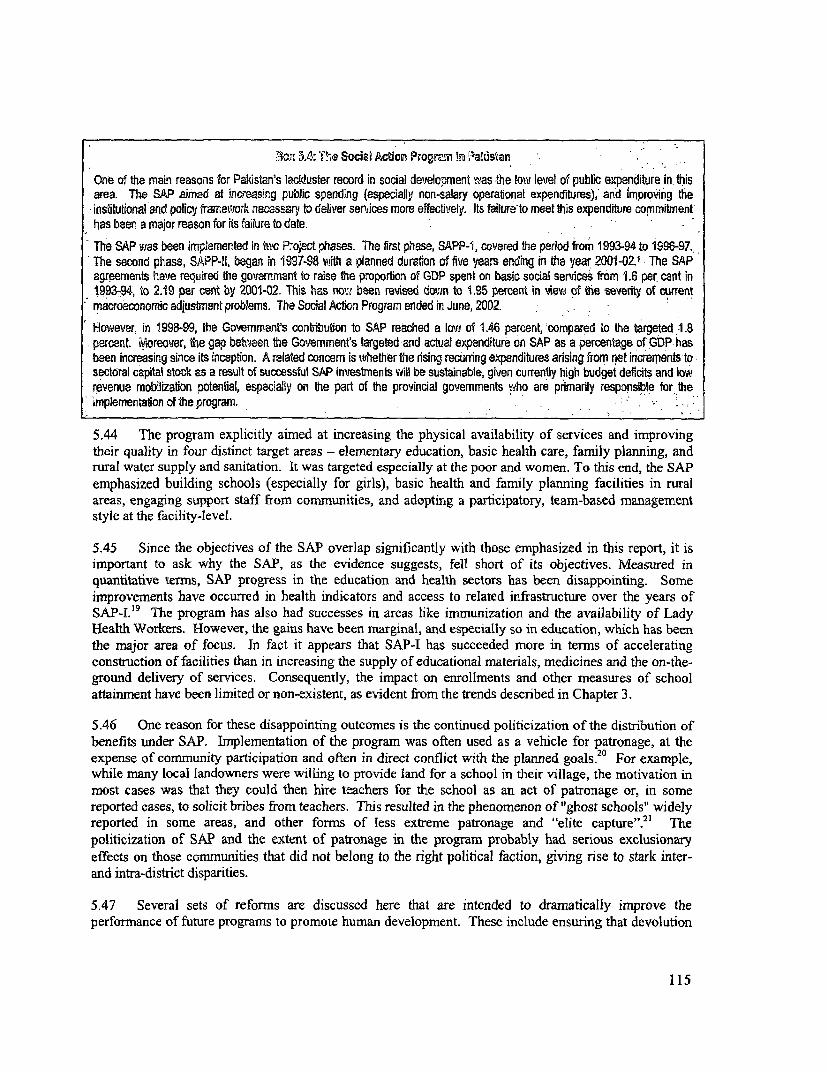
3o 5.4: The Social Action Program in Nafistan
One of the Main reasons [or Pakistan's lackluster record in social development was -te low level of public expenditure in. thisarea. The SAP aimed at increasing public spending (especially non-salary operational expenditures), and impro'ing theinsfituflonal and policy framework necessary to deliver services more effectiFely. Its failure'to meet this expenditure commitmenthas beer a major reason for its failure to date.
The SAP was been implemented in two P.-oect phases. The first phase, SAPP-1, covered the period from 1993-94 to 19997.The second phase, SAPP-ll, began in 1997-98 with a planned duration of five years ending in the year 2001-02.- The SAPagreements have required the government to raise the proporion of GDP spent on basic social services from 1.6 per cant in1993-94, to 2.19 per ent by 2001-02. This has novw been revised dowrn to 1.95 percent in view of the severity of currentmacroeconomic adjustment problems. The Social Action Program ended in June, 2002.
However, in 1998-9, the Govemment's conbibution to SAP reached a low of 1.46 percent, compared to the targeted 1.8percent Moreover, the gap betwen the Govemments targeted and actual expenditure on SAP as a percentage of GDP hasbeen increasing sincs its inception. A related concern is thether the rising recurring expenditures arising from net increments tosectoral capital stock as a result of successful SAP investments wib be sustainable, given currently high budget deficits and lowrevenue mobilization potenUial, especially on the part of the provincial govemments who are primarily responsible for theImplementalon of the program.
5.44 The program explicitly aimed at increasing the physical availability of services and improvingtheir quality in four distinct target areas - elementary education, basic health care, family planning, andrural water supply and sanitation. It was targeted especially at the poor and women. To this end, the SAPemphasized building schools (especially for girls), basic health and family planning facilities in ruralareas, engaging support staff from communities, and adopting a participatory, team-based managementstyle at the facility-level.
5.45 Since the objectives of the SAP overlap significantly with those emphasized in this report, it isimportant to ask why the SAP, as the evidence suggests, fell short of its objectives. Measured inquantitative terms, SAP progress in the education and health sectors has been disappointing. Someimprovements have occurred in health indicators and access to related infrastructure over the years ofSAP-I.'9 The program has also had successes in areas like immunization and the availability of LadyHealth Workers. However, the gains have been marginal, and especially so in education, which has beenthe major area of focus. In fact it appears that SAP-I has succeeded more in terms of acceleratingconstruction of facilities than in increasing the supply of educational materials, medicines and the on-the-ground delivery of services. Consequently, the impact on enrollments and other measures of schoolattaimnent have been limited or non-existent, as evident from the trends described in Chapter 3.
5.46 One reason for these disappointing outcomes is the continued politicization of the distribution ofbenefits under SAP. Implementation of the program was often used as a vehicle for patronage, at theexpense of community participation and often in direct conflict with the planned goals.20 For example,while many local landowners were willing to provide land for a school in their village, the motivation inmost cases was that they could then hire teachers for the school as an act of patronage or, in somereported cases, to solicit bribes from teachers. This resulted in the phenomenon of "ghost schools" widelyreported in some areas, and other forms of less extreme patronage and "elite capture".2 ' Thepoliticization of SAP and the extent of patronage in the program probably had serious exclusionaryeffects on those communities that did not belong to the right political faction, giving rise to stark inter-and intra-district disparities.
5.47 Several sets of reforms are discussed here that are intended to dramatically improve theperformance of future programs to promote human development. These include ensuring that devolution
115
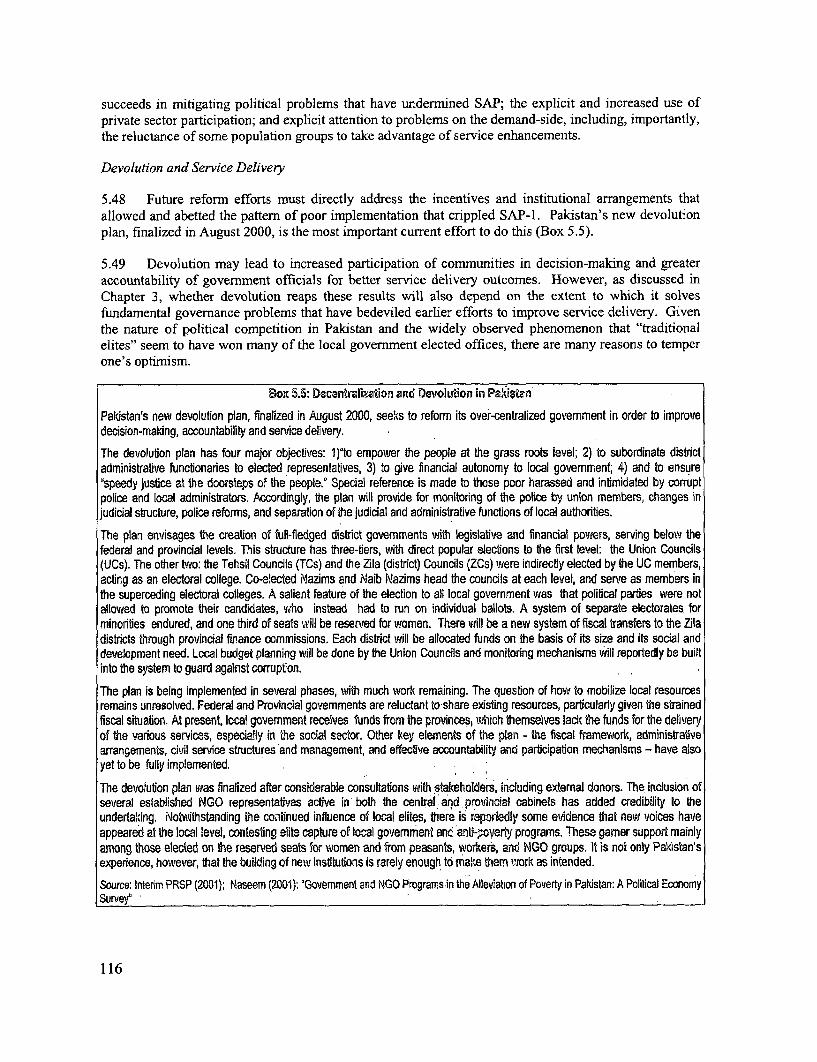
succeeds in mitigating political problems that have undermined SAP; the explicit and increased use ofprivate sector participation; and explicit attention to problems on the demand-side, including, importantly,the reluctance of some population groups to take advantage of service enhancements.
Devolution and Service Delivery
5.48 Future reform efforts must directly address the incentives and institutional arrangements thatallowed and abetted the pattern of poor implementation that crippled SAP-1. Pakistan's new devolutionplan, finalized in August 2000, is the most important current effort to do this (Box 5.5).
5.49 Devolution may lead to increased participation of communities in decision-making and greateraccountability of government officials for better service delivery outcomes. However, as discussed inChapter 3, whether devolution reaps these results will also depend on the extent to which it solvesfundamental governance problems that have bedeviled earlier efforts to improve service delivery. Giventhe nature of political competition in Pakistan and the widely observed phenomenon that "traditionalelites" seem to have won many of the local government elected offices, there are many reasons to temperone's optimism.
Box 5.5: DecentralIzation and Devolution in Pakimtan
Pakistan's new devolution plan, finalized in August 2000, seeks to reform its over-centralized govemrnment in order to improvedecision-making, accountability and service delivery.
The devolution plan has four major objectives: 1 )'to empower the people at the grass roots level; 2) to subordinate districtadministrative functionaries to elected representatives, 3) to give financial autonomy to local govemment; 4) and to ensure.speedy justice at the doorsteps of the people.' Special reference is made to those poor harassed and inlimidated by corruptpolice and local administrators. Accordingly, the plan will provide for monitoring of the police by union members, changes injudicial structure, police reforms, and separation of the judicial and administrative functions of local authorities.
The plan envisages the creation of full-fledged district govemments with legislative and financial powers, serving below thefederal and provincial levels. This structure has three-tiers, with direct popular elections to the first level: the Union Councils(UCs). The other two: the Tehsil Councils (TCs) and the Zila (district) Councils (ZCs) were indirectly elected by the UC members,acting as an electoral college. Co-eected Nazims and Naib Nazims head the councils at each level, and serve as members inthe superceding electoral colleges. A salient feature of the election to all local govemment was that political parties were notallowed to promote their candidates, who instead had to run on individual ballots. A system of separate electorates forminorities endured, and one third of seats will be reserved for women. There will be a new system of fiscal transfers to the Ziladistricts through provincial finance commissions. Each distrct will be allocated funds on the basis of its size ard its social anddevelopment need. Local budget planning will be done by the Union Councils and monitoring mechanisms will reportedly be builtinto the system to guard against corrupton.
The plan is being implemented in several phases, with much work remaining. The question of how to mobilize local resourcesremains unresolved. Federal and Provincial govemments are reluctant to-share existing resources, particularly given the strainedfiscal situation. At present, local government receives funds from the provinces, which themselves lack the funds for the deiiveryof the various services, especially in the social sector. Other key elements of the plan - te fiscal framework, administrativearrangements, civil service structures and management, and effective accountability and participation mechanisms - have alsoyet to be fully implemented.
The devolution plan was finalized after considerable consultatons with stakeholders, including external donors. The inclusion ofseveral established NGO representatives active in both the central and provincial cabinets has added credibility to theundertaking. Notwithstanding the continued influence of local elites, there is reporedly some evidence that new voices haveappeared at the local level, contesting elite capture of local govemment anc: ant-,overil programs. These gamer support mainlyamong those elected on the reserved seats for women and from peasants, workers, and NGO groups. It is not only Pakistan'sexperience, however, that the building of new institutions is rarely enough to make them wiork as intended.
Source: Interim PRSP (2001); Naseem (2001): 'Govemmeni and NGOProgramsin theAlleviation of Povertyin Pakistan. A Political EconomySurvey'
116
5.50 As also noted in Chapter 3, optimism is more justified to the extent that newly elected localofficials confront greater political costs in undermining education and health provision in order togenerate patronage opportunities, relative to provincial and national government officials who havecontrolled these sectors in the past. This is likely to be true, since those who suffer from such diversionwill find it easier to punish local officials when they transfer resources from some district inhabitants toothers than when distant politicians in Islamabad or Lahore transferred resources entirely away from theirdistrict. Optimnism is further justified if, under the structure envisaged by devolution, there are morechecks operating on officials who try to provide patronage. Until now, the highest district officials havebeen able to make decisions in a strictly hierarchical fashion. Under devolution, however, the DistrictNazims could potentially be checked by the district councils, provided that the councils and Nazims areindependent of each other.
5.51 Of course, a necessary pre-condition for positive changes is that elections at the local level becompetitive. If one or two families, biraderis (kinship groups), or individuals dominate electoralcompetition in most Union Councils throughout a District, then one would expect little change in publicgood provision. A preliminary analysis of the elections does suggest that these were generallycompetitive, though the impact of devolution, especially on measurable indicators of education andhealth, will only become apparent over a long time horizon.
5.52 However, two important issues regarding service delivery are not solved by devolution. First,there are severe distributional inequities in the provision of health and education, most of which extendacross districts. In addition, there are inequities across the rural-urban divide. These problems thereforerequire attention at higher levels of government. It is also important that the government focus on theissue of equity and enact measures aimed at reducing problems of differential access for disadvantagedgroups, which as discussed in Chapter 3, may be relevant particularly in the case of access to education.
5.53 Second, there are significant demand side problems - difficulties in encouraging families to takefull advantage of the services that are made available in the health and education sectors. This appears tobe especially true in the context of parental resistance to the education of their children, and in particularto girls' education in rural areas. Addressing such demand-side issues may require interventions that seekto overcome social barriers to girls' education through incentives, monetary and otherwise, to parents.Such interventions are likely to be beyond the resource capacity of local governments, and are in any caselikely to be politically contentious in districts where this is a problem. They will therefore requiresignificant resources and the continued, even increased, involvement of higher-level governments.
5.54 The government's medium term health strategy rightly takes such concerns into account. It isconcentrating on prevention and control programs, especially in the area of reproductive health, childhealth, nutrient deficiencies and communicable and infectious diseases, where demand-side problems aremost acute. Programs include adoption of strategies against TB and malaria, measures for preventing thespread of Hepatitis B, HIV, and AIDS through immnunization and public health campaigns. Distributionalconcerns are also paramount, since the strategy promotes targeted interventions that focus ondisadvantaged sections of society, especially in rural areas, through programs like Lady Health WorkersProgram and Women Health Project.
5.55 A community based focus for health policy is also in line with the observation made in Chapter 3,that community-specific characteristics, such as wealth and possibly the presence of quality healthfacilities, strongly determine health outcomes in Pakistani children. This is particularly the case for thenoted chronic deficiencies in child anthropometrics, e.g., height and weight, in rural communities - asymptom of malnutrition and other health problems. There is accordingly a clear need to target healthinterventions at poorer communities.
117
5.56 Specific ways to solve the demand-side problem in the delivery of social services are still underdiscussion. One intervention that has met with success is outright subsidies to households, such as theBangladesh Food-for-Education and Female Education Scholarship programs, which link food transfersand scholarships for poor households to primary school enrollment of their children, particularly girls(Box 5.6).
5.57 In Pakistan, Food for Schoolgirls, run by the World Food Program, is one programn that addressesthe problem of demand-side incentives. Implemented in selected government girls' primary schools inrural Balochistan and NWFP, it provides an inducement in the form of a tin of edible oil to each student ifshe attends school for 20 days in a month. The project is still not at a stage where it can have a tangibleimpact on keeping girls in school, and dropout rates are still high. It does seem to have increasedenrollment rates, and with greater community awareness, the WFP feels that enrollments can eventuallybe sustained without the oil incentive. Going by experiences like these, there is a strong case forextending the role of demand-side incentive programs for education in Pakistan.
; ,: - Box n.6: lood fr S aliori and Female Education Scholarship lrogams
in :Bangladesh's Food-for-Education (FFE) orogram, households with a child in primary school receive a certain amount ofwheat or rice per month, provided the children attend at least 85 percent of their classes and the family sepds all children ofprimary school age to schbol. The program has achieved wide coverage - an estimated 2.1 million households, covering:243 unions out of approximately 4500 in the country. Another example of a program that provides demand-side subsidies isBangladesh's Female Education Scholarship Program. According to this program, female students are given a stipend asthey progress through secondary grades 6 io 10. The stipend proyides for full tuiion and examinaton fees at all grades; italso covers an increasing proportion of the cost of textbooks, school supplies, uniforms, shoes, transport and kerosene (forlamps) as students advance to grade 10, reflecting the higher direct and opportunity costs of enrollment in the upper grades..Evaluations.showed that participating schools uitnessed a sharp increase in female enrollment, including a reduction indropouts, though there was no impact on repetition rates.
Soirce: Bumelt (2002). 'Pakistan: Working .lith the Pnvate Sedor in Primary and Middle School Educaton', Wolid Bank
5.58 An additional element in future strategies to increase access to health and education should be torecognize the already important role of the private sector. As noted in Chapter 3, there has beenconsiderable growth in private schooling since the denationalization of 1979, particularly in the ruralareas. Moreover, preliminary evidence suggests that these schools provide better quality education thangovernment facilities, at a lower total cost per student, and no longer cater only to an urban elite. There issome evidence, as noted in Chapter 3, that private schools have a positive impact on educationaloutcomes, particularly in regards to encouraging female enrollments. The government of Pakistan'sEducation Sector Reform (ESR) program recognizes the opportunities embodied in the growth of privateeducation, and rightly places a high priority on strengthening public-private partnerships in the delivery ofeducational services. The ESR proposes a number of incentives for private schools, including fiscalincentives such as concessional rates on land and utilities, increased endowments for the EducationFoundations, and the outsourcing of government schools to the private sector.
5.59 These are particularly urgent in light of the constraints faced by the government to quickly extenduniversal access, even in urban areas. Future reforms might therefore include providing choice to parentsin the form of vouchers for education at private schools, or as direct subsidies to private schools. Thesesubsidies would be especially pertinent in urban areas where private schools are more common, and incommunities where public school facilities are non-existent or inadequate.
118
5.60 The Quetta Urban Fellowship Program is one interesting example of the use of such subsidies.There, private schools controlled by communities in poor neighborhoods of Quetta were encouraged toestablish new facilities for girls through subsidies paid directly to the schools. While boys could alsoenroll in the fellowship schools, they could not make up more than half the total enrollment, and schoolsreceived no subsidy for enrolling boys.22 An evaluation of the program reveals that it had a positiveimpact on female enrollments, increasing girls' enrollment in the target neighborhoods by around 33percent. Interestingly, boys' enrollment rose as well, partly because boys were allowed to attend the newschools, and partly because parents would not send their girls to school without also educating theirboys.23
5.61 Notably subsidies to private schools or vouchers to parents entail complicated choices. Thearguments in favor of subsidies are that private schools are more efficient and that public-privatecompetition tends to improve quality. These need to be weighed against counter-arguments that contendthat scarce public resources would be better spent in improving the public school system, which has moreuniversal reach. In addition, as discussed in Chapter 3, the non-standardization of private educationalprovision makes it difficult for parents to distinguish between low and high quality schools, which canlead to inefficient outcomes if poor quality institutions can get away with charging high prices. A properregulatory framework is crucial to address these potential informational problems, with the importantcaveat that this framework not be so burdensome that it forces private schools to raise their fees inresponse to higher costs. For example, a national assessment mechanism can help in determining therelationship between price and school quality, and greatly facilitate parental choice. The nationalassessment currently being implemented by the education ministry represents a beginning in the directionof making such information publicly available.
5.62 Private-public sector partnerships can also be advanced in health. For example, the government'sHealth Policy calls for a strengthening of public-private sector partnerships. These include requirementsthat every medical college in the public and private sector adopt at least one district hospital or primaryhealth facility in addition to the teaching hospital affiliated to it. There are also regulatory reformsdirected at the private sector, specifically with regards to the accreditation of private hospitals/clinics, andat improvements in the government's capacity for quality control of drugs.
5.63 Fundamentally, a comprehensive health policy framework is conditional on the availability ofadequate health data, and as discussed earlier, such data is seriously lacking for Pakistan. Specifically,there has been no comprehensive national study of private health facilities in Pakistan, which poses acritical impediment to further efforts that would seek to promote public-private health partnerships. Inregards to data collection, a broader priority for the government should be the development of a diseasemonitoring and information gathering system that would regularly gather information on relevant healthindicators, and impose rigorous standards of record maintenance in health facilities.
Coordinated Strategies for Addressing Rural Poverty
5.64 Two thirds of Pakistan's poor live in rural areas, and given both the weight and specificdeterminants of rural poverty, it is particularly important to devise a coordinated strategy for addressingrural poverty in the country. As discussed in Chapter 4, a central concern is the fact that agriculturalproductivity is in absolute terns very low in Pakistan and needs improvement. Accordingly, this reportsurveys the structural constraints on farm productivity, e.g., the limitations on access to productiveresources; principally, land, irrigation, soil fertility, and credit. A related and important concern is thatgrowth in agriculture apparently failed to mitigate rural poverty in the 1990s compared to the previousdecade. While a rigorous and comprehensive analysis of this puzzle was not possible using the dataavailable to this report, such work is being undertaken in the context of ongoing Bank work.
119
5.65 In regards to constraints on productivity in the farm sector, there is first a need to improvehousehold access to assets, in particular land. Historically poor outcomes of land and tenancy reforms,examined in light of some innovative new initiatives, point to the importance of improving not only thedistribution of land but also complementary access to agrarian inputs and credits. Improving creditallocation generally requires moving away from supply driven mechanisms, and improving andbroadening micro-credit practices noted earlier. Programs that promote investments in the non-farmsector should be further encouraged since diversification out of agriculture has been shown to mitigaterural vulnerability and poverty. Particularly in light of Pakistan's growing drought problem, which hascaused water resource deterioration the chapter highlights programs that improve access to ruralinfrastructure, focusing on efficiency in irrigation. Increased public investment is warranted here, butsome successes to date stress the importance of local governance reforms, particularly in the form of morecommunity participation in local land and resource management. As the title of this section suggests,these and other measures should be designed a-nd implemented in a coordinated fashion, due toconsiderable interrelationships among the various constraints addressed.
5.66 Before elaborating on these strategies, it is important to note that an overarching precondition fortheir success in promoting growth in agricultural productivity is that they be undertaken in the context ofwider macroeconomic and fiscal policies that are conducive to such growth. Crucially, this entailsavoiding price distortions that skew incentives for the agricultural sector, about which there are still someoutstanding concerns. It is encouraging, however, that policy initiatives announced by the government doaddress some of these. The I-PRSP documents a few interventions for the agrarian sector which can bebroadly summarized as follows: improving incentive structures for farmers (price reforms), upgradingtechnology and marketing (better cropping patterns, corporate financing), improvement in access to landby distributing govemnment land to poor households, and improving efficiency in use of water (irrigationreforms).
Improving access to assets
5.67 Rural assets such as land continue to be of critical importance, in view of the evidence inChapters 2 and 4 about the negative impacts of the observed highly unequal distribution of land and otherkey assets, on investment and productivity, in addition to the vulnerability issues also discussed. Thesharp inequities that prevail in ownership of land, and the friction in the markets to lease land, militate forland reform. However, such reforns are politically problematic to implement. To date, experience inPakistan has been rnixed at best. Previous major attempts at land reform, undertaken during the regimesof Ayub Khan (1962) and Zulfikar Ali Bhutto (1972), have not succeeded in redistribution, particularly totenants and landless, and also appear to have been ineffective in ensuring security of tenure.
5.68 Redistribution should be accompanied by tenancy reform, in order to prevent eviction of tenantsby landlords in the anticipation of land reform. The evidence on tenancy reform seems to suggest that itoften remained confined to paper transactions with little real significance, and, while landowners may nothave directly evicted their tenants, they may have made the situation unbearable for tenants to continuesurviving on their land. This is especially so in Punjab, where the relative success of reforms has also hadthe unintended and unfortunate consequence of creating an expectation among Punjabi landlords of morereform in the future, resulting in a disproportionate rate of tenant evictions in this province, compared forinstance to Sindh.
5.69 An alternative strategy to provide better access to land could involve market-based land reform.However, the diagnostics in Chapter 4 suggest that the potential for such reform is very limited in anenvironment where both land sales markets and land leasing markets function poorly. As Chapter 4points out, a possible precondition for serious land reform might be to improve the market enviromnentfor purchase and lease of land, notably by improving the legal system for enforcing foreclosures on the
120
one hand and access to credit on the other. Landless farmers who cannot provide collateral areparticularly constrained in obtaining credit for purchasing or leasing land. As illustrated in Box 5.7, apossible intervention to remedy this may involve fostering innovative linkages between two governmentinterventions that already exist, in the areas of micro-finance and land allocation.
Box 5.7: innavffive Ep eimentrzTt Nfm-crofinanca and Land Allocetion
NGOs working for the rural poor have often intermediated in credit markets through micro-finance programs. There areorganizations of the landless poor, howaver, that have also begun experimenting with intermediaUion in the land leasing market.Case studies of tjo such NGOs, in the Sanghar and Khairpur distr'cts of Sindh, have revealed innovative models ofintermnediation. These organiza'ions rent lRnd on the lease market and then sublet it to individual. members on the basis ofdeferred rental payments. The organizations use their social collateral to raise capital from larger NGOs, thereby relieving theirmembers' liquidity constraint. They also allowed income smoothing for their members over 4 to 6 crop cycles, thereby alleviatingvulnerability to risk. Both of the experiments resulted in sustained improvements in the asset positions of their participants.
Surveys in the field areas of rural support programs (RSPs) in two districts of southem Punjab (Multan and Dera Ghazi Khan)reveal informal attempts at similar interventions by RSP supported community organizations. The design of the micro-financeprograms of the RSPs, however, is not well suited to sustained intermediation in the land leasing market
The NGO experiments in the leasing market are significant because they represent attempts at tackling the problem of landinequality in an innovative manner by working through existing markets. Their economic role in the leasing market wasanalogous to the now familiar role of intermediation that oornmunity organizations play with respect to micro-finance.Encouragingly, there is already a wide network of RSPs in PaJxistan, which might be able to expand the scope of such innovativeexperiments, and when appropriate, to take them to scale.
Soufce: Gazdar, Khan and Khan (2002). 'Land Tenure, Rural Livelihoods and Institutional Innovation.
Improving access to credit
5.70 As Chapter 4 concludes, access to institutional credit is severely restricted in rural Pakistan, withthe bulk of the cultivator households, in particular the landless, being rationed out of the market.Improved access to assets (collateral) should have a useful impact on access to credit, in particularinstitutional credit. However, the import of credit access extends beyond collateral problems in twoways: to expand the ability of poor farmers to undertake productive investment, and to enable poorhouseholds to smooth their consumption and mitigate risk. To smooth consumption has been discussed inthe context of social protection earlier in this chapter. To undertake productive investment underscoresthe crucial link between agricultural productivity and rural poverty on the one hand, and access to creditin rural areas on the other.
5.71 By and large, credit programs in rural Pakistan have not only been unable to address the creditmarket needs of the rural poor but have also been difficult to sustain financially. Refonning the financialsector will thus be imperative, though not easy in an environment where asset inequality is severe. Oneproblem is the supply driven nature of existing programs to expand credit in rural areas. In this regard,Pakistan's experience mirrors that of many other countries. These demonstrate that creating a viable ruralcredit delivery mechanism will require (i) deepening of financial intermediation through mobilization ofsavings in rural areas, (ii) moving away from a supply driven delivery mechanism to a market basedsystem which creates an enabling environment for private sector participation, (iii) utilizing innovativeand alternative savings mobilization and credit delivery instruments for small farmers and non-farmproducers (such as microcredit) who tend to remain outside the network of formal financial institutions.
5.72 As discussed earlier, access to institutional credit in rural areas, particularly for the poor, isseverely constrained by market failures due to information problems that arise from the isolation of thepoor from financial markets. While microcredit provides a viable alternative to formal markets, it should
121
not be seen as a panacea for all credit problems. For instance, microcredit has been found to play a moresuccessful role in smoothing consumption and helping with small investments in household enterprisesthan in productive investments of the kind usually necessary for agriculture. There is thus a need tounderstand the strengths and limitations of microcredit institutions in rural areas.
5.73 Other solutions to lack of access to credit for farm investments must also be examined, such asthe reasons why the existing village banking network has proved highly inadequate in satisfying creditneeds, and possible reforms that can address weaknesses in this sector. A decline in the number of banksand a fall in the share of commercial lending in total agriculture credit in recent times all suggest thatfinancial markets in rural areas have thinned, instead of deepening, during the 1 990s.
5.74 A long-term strategy in deepening the financial market would have to focus on institutionalreforms to address information problems in rural credit markets that are primarily responsible for marketfailures. The focus should also be on exploring ways to create an enabling environment for private sectorparticipation in the rural financial sector. Doing so will involve providing the right incentives (avoidingsubsidies and bailouts that distort incentives), and creating institutions that promote transparency throughoversight and prudential regulations. Overall, the further specification of rural financial reforms is subjectcomplex set of factors, which require rigorous analytical work using recent data, beyond what has beenundertaken to date.
Improving opportunities in the non-agricultural sector
5.75 As noted in Chapter 4, the non-agricultural sector is a significant source of income for both richand poor households and constitutes an important de facto stabilizing influence on the latter's incomes.Indeed, wage labor in the non-agricultural sector, particularly in unskilled occupations, are a major sourceof income and employment for the poorest quintile of the rural population. These findings suggest thatfacilitating investment and productivity in non-farm enterprises that result in raising wages and profitswould have an impact on large sections of the rural poor. Improving the investment climate andproviding better access to inputs and credit would be necessary, especially for the small householdenterprises that typically face binding credit constraints.
5.76 It is also important to bear in mind that growth and productivity of the rural non-agriculturalsector are inexorably linked with those of the farm sector. In order to exploit these linkages, rural policymust seek to integrate strategies to address issues in the agricultural and non-agricultural sectors.Notably, a strategy that takes into account the range of complex issues must be informed by more analysisto better understand the constraints to productivity and growth of the non-agricultural sector.
Improving access to infrastructure
5.77 Since opportunities tend to be higher for communities that are better connected to markets, thereis a need to extend access to a broad range of facilities in the agricultural sector, including electricity,roads, and other forms of communication. In the context of access to rural infrastructure, of criticalimportance is the availability of adequate water for irrigation and domestic use, which constitutes a keyconstraint in Pakistan's rural economy. Due to arid or semi-arid climate and inadequate water resources,cultivation in Pakistan is overwhelmingly dependent on irrigation. The problem of water shortage hasacquired even more importance in the wake of acute droughts in 2000 and 2001. Although many parts ofSindh and Balochistan had been experiencing drought-like conditions from before 1998, the situationworsened during these years, engulfing the entire country. The continuing dry spell has affectedagricultural output, causing value added in the agricultural sector to register negative growth (at -2.5%) asagainst growth of 6.1% during the previous year.
122
*5.78 Since increase in agricultural productivity requires increased water availability, an expansion in
production depends on improving the efficieAcy of the existing irrigation system. The recently
formulated govemment water management program has focused on creating additional storage capacity
through projects like Gomalzam and Meerani dams, Rainee, Thar and Kachi canals and the lining of
watercourses. These initiatives are expected to provide additional storage capacity of 4.5 million-acre-
feet of water. While initiatives to expand capacity will help address the problem, for various reasons,
prospects for further expansion in irrigated areas through new investments in storage capacity, expansion
of perennial irrigation, and ground water exploitation appear to be limited. In light of this, improvement
in the efficient use of currently available water use seem to be the most viable and sustainable option for
increasing productivity of irrigated agriculture.
5.79 According to some estimates, around 25 million-acre-feet of water are lost every year in the
system due to low water management efficiency. Indeed the evidence in Chapter 4 shows that there is
considerable room to improve the efficiency of the irrigation infrastructure. Delivery efficiency has been
deteriorating over time because of poor incentives for the irrigation department to invest in maintenance.
In addition, there is considerable wasteful use of canal water because of the flat rate charges. Finally,
rent-seeking behavior by large landowners and irrigation officials has led to misappropriation of canal
water, which has in tum increased the existing distributional inequities. In light of the evidence in
Chapter 4 on the productivity increases that can be attained by increasing canal water availability,
removing these existing inefficiencies in canal water infrastructure could be an effective strategy to
increase agricultural productivity.
5.80 Efficient management of tubewell and canal water irrigation is also important because it can
affect salinity and water logging, which have a significant negative impact on productivity. The strategy
to reverse these problems requires both public and private investment. An integrated drainage system
with proper lining of the canal is important in reducing seepage that contributes to water logging.
Notably, the public sector has to play a leading role in both development and maintenance of drainage
system and lining of watercourses, because these are essentially a public good, and require large
investments. In addition, communities can be mobilized to maintain and improve the irrigation structures.
In this context, the success of RSPs in organizing communities to build and maintain infrastructure has
been encouraging.
5.81 Since private on-farm investment can also substantially reduce land degradation, an important
policy intervention would be to create an environment that encourages such investment. Evidence
suggests that security of tenure and ownership of land have significant effect in this regard, which further
reinforces the importance of land and tenancy reforrms. Indeed, as noted throughout this chapter, it is
important to emphasize that strong inter-linkages exist among the main policy concerns with respect to
the rural economy and rural poverty, and which must be addressed in a coordinated fashion if a rural
poverty strategy is to be effective.
Conclusion
5.82 As first noted in Chapter I of this report, Pakistan currently finds itself caught between two
apparently competing constraints. On the one hand it confronts a social gap that has undermined growth
and limited the country's ability to alleviate poverty, and on the other, it must service its substantial
national debt, servicing which absorbs most of the public resources that might be used to close the social
gap.
5.83 Yet as this report has argued, policies that would force a trade-off between fiscal viability and
human development are unlikely to be sustainable or successful on either of these fronts. If Pakistan does
not close its social gap, its long-term ability to grow economically and to sustain its debt are slim. The
123
report points to serious gaps in what is known about poverty, growth and human development in Pakistan.Nevertheless there is already considerable available information and more is being gathered. It indicatesthat in part, in so far as they cut across social, macroeconomic and fiscal domains, Pakistan's currentproblems denote a wider crisis in governance.
5.84 To a great extent, these underlying problems have prevented the country from making better useof its scarce resources, much as they have also impeded private sector growth and discouraged privateinvestment. Unless these problems are rectified, large infusions of donor assistance, whether in support ofprivate sector activities or social goals, are unlikely to produce the desired impact, as shown already bythe relative failure of Pakistan's Social Action Program. Despite the uncertainties associated with recentpolitical changes, this appears to have been recognized by its government, which has responded with therecent devolution reforms.
5.85 To tackle the outstanding issue of poverty in Pakistan and its concomitant social gap, this chapteraccordingly identified a number of strategies and tactics focused particularly on institutions. Theseincluded expansion of microcredit to improve access to credit, community organization to manage ruralresources, and governance reforms to improve access to services. The poverty focus of the economicreform program as articulated in the PRSP encompasses many of the elements highlighted here.Sustaining the current impetus of reforms and implementing comprehensive, mutually reinforcinginterventions to spur growth, reduce poverty, and promote human development remains an enduringchallenge for stakeholders in the country's development, including the World Bank.
'World Bank (1995)2 At present, zakat collections amount to Rs. 5 billion, and reaches around 2.5 million beneficiaries - a small fractionof the population that is in need of such assistance.I World Bank (1995) and Jehle (1995). Further, estimates based on HIES (1996-97) data indicate that only around29 percent of the direct benefits went to the bottom expenditure quintile among households4 See SPDC (1999), Subbarao et al (1997).5 As reported by the I-PRSP (2001)6 By June 1997, more than 37,000 employers were making contnbutions for 1.2 million registered workers,supplemented by a federal grant of up to Rs. I billion every year.7 Examples include large initiatives like the Rural Works Program (1962-72), and the Peoples Works Programs(1972-83), neither of which fulfilled its role in creating infrastructure and providing safety nets to the poor duringtimes of stress (see Naseem, 2000 for a discussion of the history of Works programs)8 As reported in Interim-PRSP, GOP (2001)
The FFW program in Bangladesh is a case in point.10 The Employment Guarantee Scheme (EGS) in Maharashtra state of India is an example where risk mitigationbenefits are high due to such a record." UNDP (1998)12 The World Bank and the Asian Development Bank have partially contributed to the funding of the PPAF andKhushali Bank initiatives, respectively.13 Depending on the type of license each would qualify for, these institutions must have a minimum paid-up capitalof Rs. 50 million to Rs. I billion.4 E.g. Korangi Township in the 1960s, Zakat Housing in the 1980s15 While the overall urban population growth rate is around 5%, informal settlements or katchi abadis are estimatedto grow at over 9% percent per year, with an upward trend (Nassem, 2001). It is estimated that in Karachi, 40% ofpopulation lives in katchi abadis, which accounts for about half of all those living in such urban settlements inPakistan.16 Largely inspired by the success of the OPP, a number of housing programs for upgrading the katchi abadis havebeen initiated in recent years, especially in the sanitation sector. These include large programs in Karachi, Sukkur,and Hyderabad; there has also been OPP collaboration with NGOs in a number of places like Lahore, Faisalabad,Okara, and Gujranwala." See, for instance, report by SPDC (2000)
124
18 Donor financing and technical assistance for SAP, amounting to about 20% of the total expenditure, has been
available since 1993/94 and has been an important driving force in its implementation.
19 Proportion of population without access to safe water has fallen from 50% in 1992-93 to 40% in 1995, and
proportion of those without access to adequate sanitation has fallen from 67% in 1993 to 53% in 1995. There have
also been some increase in life expectancy at birth and rate of use of contraceptives, along with small reductions in
fertility and population growth rates.20 See, for instance, results from a field survey conducted by Ercelawn and Zaidi (1999). They also found little
evidence of NGO involvement in SAP, contrary to one of its stated aims - indications were that NGOs had little or
no contact with SAP-related elected and non-elected members.21 Moreover, Naseem (2000) quotes unofficial reports from a probe conducted by the Army, that refer to the
existence of hundreds of such schools (some of which were used to keep the livestock) along with thousands of
absentee teachers who were found drawing salaries on regular basis.22 The initial subsidy was Rs. 100 per month per girl enrolled, with an upper limit of Rs. 10,000 per month.
23 See Alderman at al (1999).
125
Annex to Chapter 2
2.1: Availability and Use of Household Data
The surveys used are the Household Income and Expenditure Surveys (HIES - for years 1990-91,92-93, 93-94, 96-97), and Pakistan Integrated Household Survey (PIHS - 1998-99). All HEES upto 1996-97 were conducted independent of the PIHS. The PIHS covers many other topics besidesthose of consumption and income focused on by the HIES and therefore has a much more wide-ranging household questionnaire, along with a community questionnaire. The PIHS conductedduring the 1990s have also been on a smaller sample of households than the HIES.' Because ofthe differences between the sample size as well as questionnaire between the HIES and PIHSsurveys, poverty estimates and household characteristics that correlate with poverty were notcompletely consistent between findings from HIES and PIHS in the past.2
Unlike in previous years, in 1998-99 PIHS is essentially a combination of PIHS and HIES into asingle integrated survey, with a sample size comparable to that for the HIES in previous years.However, some other changes have occurred in 1998-99 that has implications for comparabilityacross years. Since a part of the objective of this chapter will be to examine trends in povertyover the years, issues of comparability across surveys are important and merit a discussion.
Issues that Affect Comparability Across Surveys
There exists a high degree of comparability between HlES for all years between 1992-93 and1996-97, since the same questionnaire was used for all these years, identical sampling techniquesused, and sample sizes were also similar.
Comparability between the HIES data from 1990-91 and those from later years is compromisedprimarily by the fact that the samp!e size in 1990-91 was substantially smaller than in subsequentyears - 6693 households in 1990-91 compared to 14594 in 1992-93. One should thus be cautiousabout making comparisons between the poverty estimates for 1990-91 and those for subsequentyears.
The 1998-99 data, being a combination of HTES and PIHS, offer the unique opportunity ofanalyzing information on service delivery and human development in a large sample, withconcomitant detailed information on household consumption. It also eliminates the possibility ofdiscrepancies and contradictions between finding from separate HIES and PIHS data.3 However,the 1998-99 survey has incorporated some changes that may adversely affect comparability ofhousehold consumption expenditures, which determine poverty status, with findings fromprevious HIES data.
Firstly, in the 1998-99 survey, the household expenditure module has undergone some changesfrom previous years - expenditures are now reported in less detail, with some relatively minorcategories of expenditure being combined into single categories. However these changes arefirstly, few in number and secondly, applicable to minor categories of consumption, which shouldnot substantially affect comparability with previous surveys.
' The PIHS for 1991, for example, sampled only 4794 households2For a more detailed discussion on the findings from HIES and PIHS, see Howes and Zaidi (1994)3 See Howes and Zaidi (1994) for a detailed discussion on past problems with consistency between HIESand PIHS findings
126
Secondly, a large proportion of the food items consumed by households are reported asfortnightly figures in the 1998-99 PIHS, unlike in previous surveys where monthly consumptionfigures were reported for all food items. This change in the recall period may affectcomparability with previous surveys. In this context, it should be interesting to consider theimplications of an ongoing debate on Indian data -- about the effects of changing the recall period
for some consumption items from the previously used 30-day period to a combination of 7-dayand 30-day periods in the 1999-2000 round of the NSS in India.
Thirdly, although the surveys use the same methodology in sampling, the sampling frame haschanged somewhat. The 1998-99 PIHS for rural areas adopted a new sample framework basedon the lists of villages from the Housing and Population Census of 1998, whereas HEES used theinformation from the 1981 Census. The main problem with this appears to be that since only therural sample framework was changed, if one were to consider the Census as representing the"true" composition of the country's population, the household survey appears to overestimate therural population.4 This affects the overall estimate of poverty, as well as comparability acrossyears.
Finally, comparing across surveys, it seems that the average household sizes, particularly forhouseholds in the lowest expenditure categories, are significantly higher in the 1998-99 PIHScompared to the HIES from 1992-93 to 1996-97. This is hard to explain, since there is no reasonto believe in a sharp demographic transition in the space of two years. The fact that thisdifference exists suggests a systemic difference in techniques of data collection between thedifferent surveys. Obviously, this works to the detriment of comparability of the 1998-99 survey
with previous ones. This issue will be explored in greater detail later in this chapter.
While the lack of comparability arising from the factors outlined above remains a problem, theanalysis has maintained consistency in methodology for estimating household expenditures andconstructing price indices for all the surveys.
2.2: Estimating Expenditure and Poverty
Measurement ofHousehold Expenditure5
All expenditures for households and across different categories of items are calculated as monthlyvalues. The aggregate household expenditure includes expenditures on food, fuel, housing, other
non-durable goods and services (reported as monthly or yearly expenditures), and certain kinds ofexpenditures on durable goods. Expenditure on consumed items are included whether they werepaid for, or received as gifts or payments in kind. Items left out from expenditure estimates areexpenses on taxes (including house and property tax) and fines. The only yearly durableexpenses included in the expenditure calculation are expenses on services and repair charges ofhousehold effects.
The household expenditures thus obtained are then adjusted for price differences. The adjustmentfactors used here are household level Paasche Indices based on implicit prices computed from thedata, normalized by appropriate average price indices; details on how these are constructed areavailable from the background note. The final step is to normalize the household level Paasche
4 Share of rural areas in total population is 71% according to the 1998-99 PIHS and 67% according to the1998 Population Census5 See the background note "A Note on Poverty Estimates for Pakistan in the 1990s: Issues and PreliminaryFindings from HIES Data" (2001) for a detailed description of the expenditure categories.
127
indices by average price indices, yielding two kinds of household-specific price indices - oneadjusts for price differences across the entire country, the other for intra-region (within urban orrural regions) price differences. The former are used to deflate household-level expenditureestimates to make them comparable across all households. The latter, on the other hand, are usedto deflate household expenditures which can then be compared with separate urban and ruralpoverty lines to determine whether a household is poor or not.
It is important to note that the price indices just described take into account only food prices.Household expenditures adjusted by these price indices thus implicitly assume that costs of livingare exactly proportional to the relative food prices faced by the household. This may beproblematic; in particular if there is reason to believe that relative costs of certain items like thehousing in urban areas vis-a-vis rural areas may be higher than that of food items. But inpractice, calculating implicit prices of non-food items is even more problematic, because offactors like non-availability of quantity information and very high heterogeneity in quality. Onaccount of these difficulties, only food prices are used to compute the price indices, which is astandard practice in poverty analysis.
In order to measure welfare at individual level and to estimate poverty rates, it is also necessary toadjust household consumption expenditure by household composition - for which householdexpenditure is corrected by the per adult equivalent in the household, which is calculated bysimply weighting all household members younger than 18 as 0.8, and all other householdmembers as 1. While this may appear as oversimplifying the problem of adjusting for thecomposition of a household, using a more complex equivalence scale, for instance one thatdifferentiates between sex and various age categories, is even more problematic. This is becausesuch scales are generally based on calorie requirements, and are therefore applicable only to foodconsumption, and not to the vast array of other items that enter into household consumption. 6
Adjusting consumption expenditure for household economies of scale: an investigation
There are also sound arguments for adjusting household expenditures for household size, to allowfor economies of scale in consumption. The expenditure and poverty estimates in this report arehowever calculated without such correction. While ignoring the scale factor may lead tounderstating the welfare of people who live in large households, making such adjustment is alsoproblematic, primarily because it is hard to define the precise adjustment applicable for Pakistan.Moreover, such adjustment will also affect the comparability of poverty estimates for the yearssince 1992-93 with estimates from previous years, which had been conducted by previous reportswithout taking the scale effect into account.
However, it is important to investigate, at least in a rough sense, whether poverty trends duringthe 1990s are sensitive to reasonable scale adjustments. This is all the more important, given theconcern, outlined later in this Annex, about the comparability of household sizes in the 1998-99survey with those from the previous ones. To investigate the effect of scale adjustment, asomewhat arbitrary method is adopted, used in related literature for developing countries.
According to this method, the number of equivalent adults is determined by the formula: AE =(A+ s.QC'; where A is the number of adults, C is the number of children in the household, theparameter s is the cost of a child relative to that of an adult, and equal to 0.8 as mentioned above.
6 Identical equivalence scales have been used for previous poverty analysis with data from Pakistan,including the Pakistan Poverty Assessment (1995) and Poverty in the 1990s, Federal Bureau of Statistics(draft Report, 2001)
128
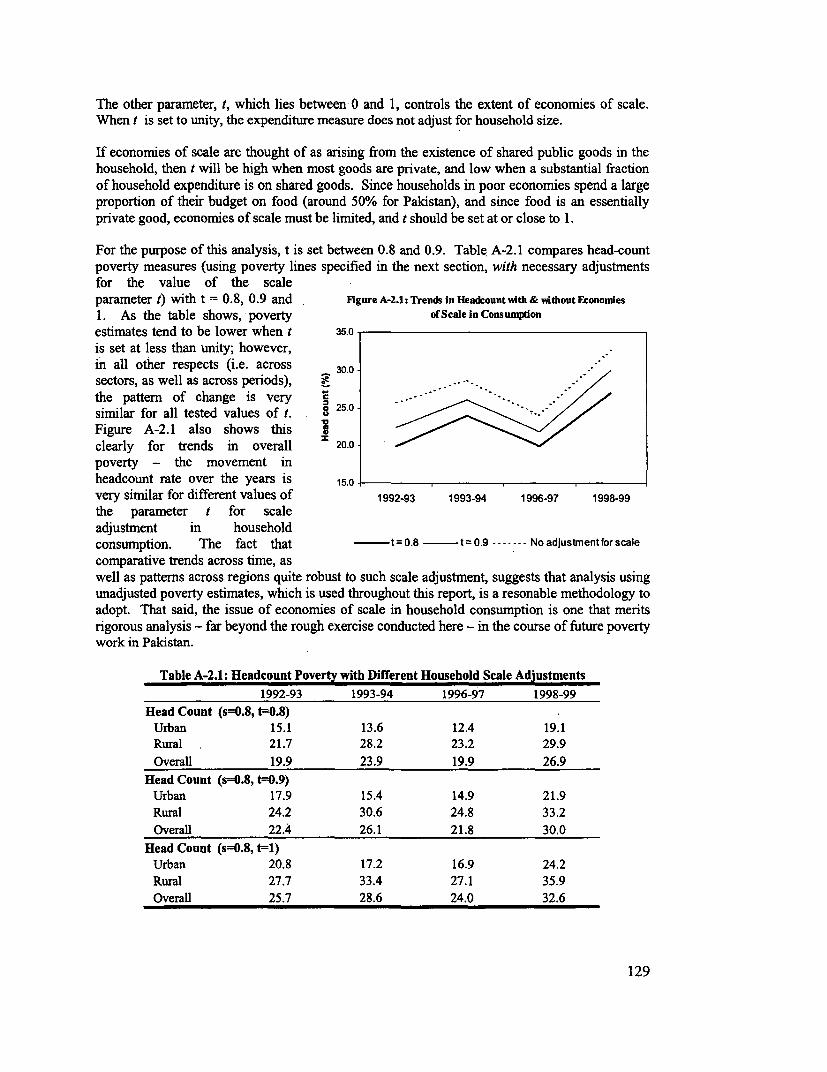
The other parameter, t, which lies between 0 and 1, controls the extent of economies of scale.When t is set to unity, the expenditure measure does not adjust for household size.
If economies of scale are thought of as arising from the existence of shared public goods in thehousehold, then t will be high when most goods are private, and low when a substantial fractionof household expenditure is on shared goods. Since households in poor economies spend a largeproportion of their budget on food (around 50% for Pakistan), and since food is an essentiallyprivate good, economies of scale must be limited, and t should be set at or close to 1.
For the purpose of this analysis, t is set between 0.8 and 0.9. Table A-2.1 compares head-countpoverty measures (using poverty lines specified in the next section, with necessary adjustmentsfor the value of the scaleparameter t) with t = 0.8, 0.9 and FlgureA-2.l:TrendsinHeadcountfiith& iithout Econonnes
1. As the table shows, poverty ofScaleinConsumptionestimates tend to be lower when t 35.0
is set at less than unity; however,in all other respects (i.e. across 300sectors, as well as across periods), _9 .. - .
the pattern of change is verysimilar for all tested values of t. . 250 ./
Figure A-2.1 also shows this 1clearly for trends in overall 20.0
poverty - the movement inheadcount rate over the years is 15.0
very similar for different values of 1992-93 1993-94 1996-97 1998-99
the parameter t for scaleadjustment in householdconsumption. The fact that - t=0.8- t=0.9.---- Noadjustmrentforscale
comparative trends across time, aswell as patterns across regions quite robust to such scale adjustment, suggests that analysis usingunadjusted poverty estimates, which is used throughout this report, is a resonable methodology toadopt. That said, the issue of economies of scale in household consumption is one that meritsrigorous analysis - far beyond the rough exercise conducted here - in the course of future povertywork in Pakistan.
Table A-2.1: Headcount Poverty with Different Household Scale Adjustments1992-93 1993-94 1996-97 1998-99
Head Count (s=0.8, t-0.8)Urban 15.1 13.6 12.4 19.1Rural 21.7 28.2 23.2 29.9Overall 19.9 23.9 19.9 26.9
Head Count (s=0.8, t=0.9)Urban 17.9 15.4 14.9 21.9Rural 24.2 30.6 24.8 33.2
Overall 22.4 26.1 21.8 30.0
Head Count (s=0.8, t=1)Urban 20.8 17.2 16.9 24.2
Rural 27.7 33.4 27.1 35.9Overall 25.7 28.6 24.0 32.6
129
Poverty Lines7
The Poverty Lines for every year are the inflation-adjusted "basic needs" poverty lines, which inturn was based on some modifications (primarily adjustments for prices) of the basic needspoverty line developed by Ahmad (1993). The poverty line was fixed at the 1990-91 level, andupdated for every successive year using Consumer Price Indices (CPIs) for Pakistan. Since thehousehold expenditures were adjusted by spatial price indices to account for within-region pricedifferences (as described above), poverty lines were not adjusted for price differences within eachregion (rural/urban).
Most of the poverty lines used for analyzing poverty in Pakistan in the past have relied on calorie-based poverty lines. Even in so-called basic needs approaches, the practice has been to define theminimum bundle exclusively by the expenditure (including non-food) that is expected to inducethe minimum calorie intake. As Gazdar et al point out, there are 3 standard defenses to thisapproach: First, calorific intake is the most important human need (Ercelawn, 1992). But evenso, the question is, are other needs "unimportant" enough to ignore? Second, calorific need is agood proxy: if a household consumes more than the cost of the minimum bundle of calories it isable to satisfy all its basic needs not just its calorific ones. This would be an attractive argumentwere it to be supported by evidence, but it is not. Given the diversity of expenditure pattemsobserved, there seems little reason to accept this argument in terms of actual calorific intake.Third, non-calorific needs hard to specify, or specified arbitrarily, leaving one with no choice butto look at expenditure on calories and to set basic non-food expenditure requirements on thisbasis (for example, equal to the average non-food expenditure of the poor). This is a compellingargument for many countries, but fortunately not for Pakistan, where a "basic needs" poverty linehas been specified.
An alternative route to the calorific one is to take the poverty line as the cost of achieving aminimum bundle of basic needs, i.e. the money value of a bundle of commodities that representsa minimally acceptable level of living, selected a priori. To do this requires a great deal ofintimate knowledge of the country concemed. Even then, the final line decided on will still be tosome extent arbitrary, and can better be thought of as representing a social judgment than anactual threshold.
Although this procedure of specifying a bundle of basic needs has been little used in developingcountries, it does have a long history in developed countries. Examples include the classic studiesearly this century by Bowley and others in the UK. (see Atkinson, 1987, and Barr, 1987, forreferences. Pakistan is one of the few developing countries for which this exercise has beenundertaken. In a recent paper, Ahmad (1993) describes the process he used to choose a povertyline:
The proposed basic needs package consists of food, clothing, housing, health, education,transport, social interaction and recreational facilities. ... All possible componential needswere identified. Discussions were held with professional economists in Federal Government,Provincial Govenmments, Research Institutes and Universities. A checklist thus prepared wasrechecked with heads of different families. A team of economists was constituted to arrive atthe quantum and value of each componential item of various basic needs separately in therural and urban areas. These were rechecked with the consumers in different areas.
7 This section is draws significantly from Gazdar et al (1994).
130
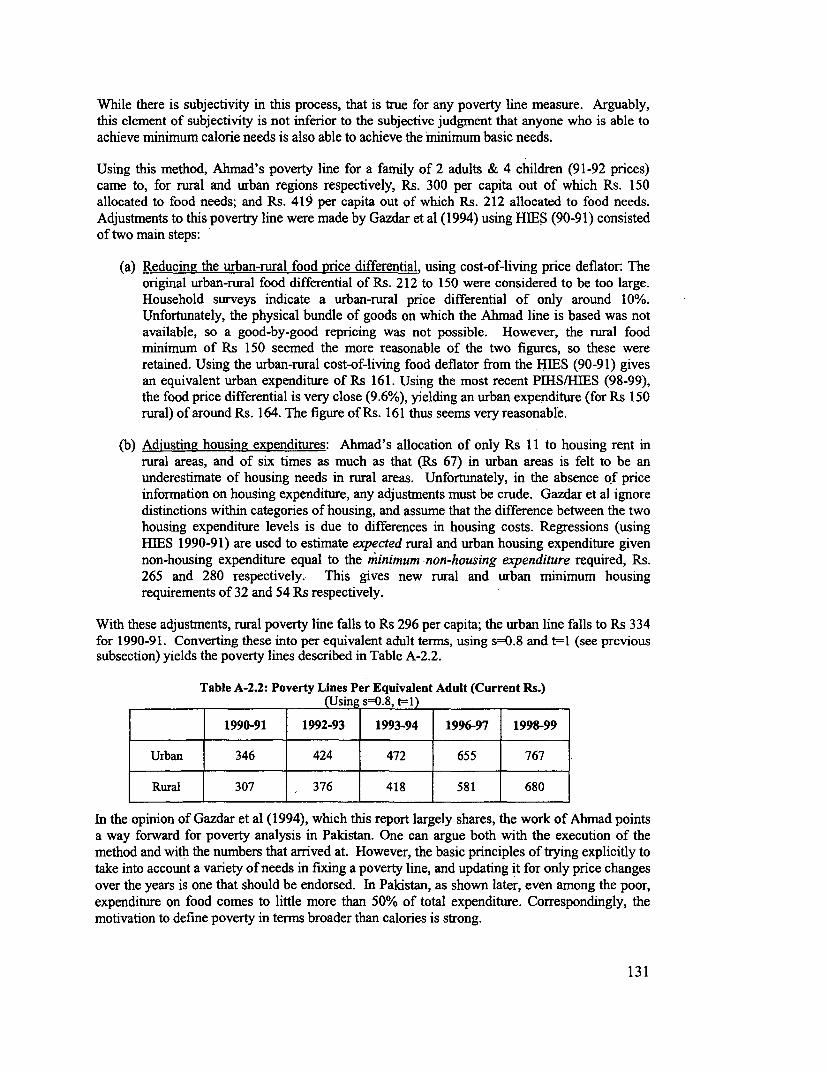
While there is subjectivity in this process, that is true for any poverty line measure. Arguably,this element of subjectivity is not inferior to the subjective judgment that anyone who is able toachieve minimum calorie needs is also able to achieve the minimum basic needs.
Using this method, Ahmad's poverty line for a family of 2 adults & 4 children (91-92 prices)came to, for rural and urban regions respectively, Rs. 300 per capita out of which Rs. 150allocated to food needs; and Rs. 419 per capita out of which Rs. 212 allocated to food needs.Adjustments to this povertry line were made by Gazdar et al (1994) using HIES (90-91) consistedof two main steps:
(a) Reducing the urban-rural food price differential, using cost-of-living price deflator: Theoriginal urban-rural food differential of Rs. 212 to 150 were considered to be too large.Household surveys indicate a urban-rural price differential of only around 10%.Unfortunately, the physical bundle of goods on which the Ahmad line is based was notavailable, so a good-by-good repricing was not possible. However, the rural foodminimum of Rs 150 seemed the more reasonable of the two figures, so these wereretained. Using the urban-rural cost-of-living food deflator from the HIES (90-91) givesan equivalent urban expenditure of Rs 161. Using the most recent PIHS/HIES (98-99),the food price differential is very close (9.6%), yielding an urban expenditure (for Rs 150rural) of around Rs. 164. The figure of Rs. 161 thus seems very reasonable.
(b) Adjusting housing expenditures: Ahmad's allocation of only Rs 11 to housing rent inrural areas, and of six times as much as that (Rs 67) in urban areas is felt to be anunderestimate of housing needs in rural areas. Unfortunately, in the absence of priceinformation on housing expenditure, any adjustments must be crude. Gazdar et al ignoredistinctions within categories of housing, and assume that the difference between the twohousing expenditure levels is due to differences in housing costs. Regressions (usingHIES 1990-91) are used to estimate expected rural and urban housing expenditure givennon-housing expenditure equal to the m~inimum non-housing expenditure required, Rs.265 and 280 respectively. This gives new rural and urban minimum housingrequirements of 32 and 54 Rs respectively.
With these adjustments, rural poverty line falls to Rs 296 per capita; the urban line falls to Rs 334for 1990-91. Converting these into per equivalent adult terms, using s=0.8 and t=l (see previoussubsection) yields the poverty lines described in Table A-2.2.
Table A-2.2: Poverty Lines Per Equivalent Adult (Current Rs.)__________ ___________ (Using s=0.8, tl=)
1990-91 1992-93 1993-94 1996-97 1998-99
Urban 346 424 472 655 767
Rural 307 376 418 581 680
In the opinion of Gazdar et al (1994), which this report largely shares, the work of Ahmad pointsa way forward for poverty analysis in Pakistan. One can argue both with the execution of themethod and with the numbers that arrived at. However, the basic principles of trying explicitly totake into account a variety of needs in fixing a poverty line, and updating it for only price changesover the years is one that should be endorsed. In Pakistan, as shown later, even among the poor,expenditure on food comes to little more than 50% of total expenditure. Correspondingly, themotivation to define poverty in terms broader than calories is strong.
131
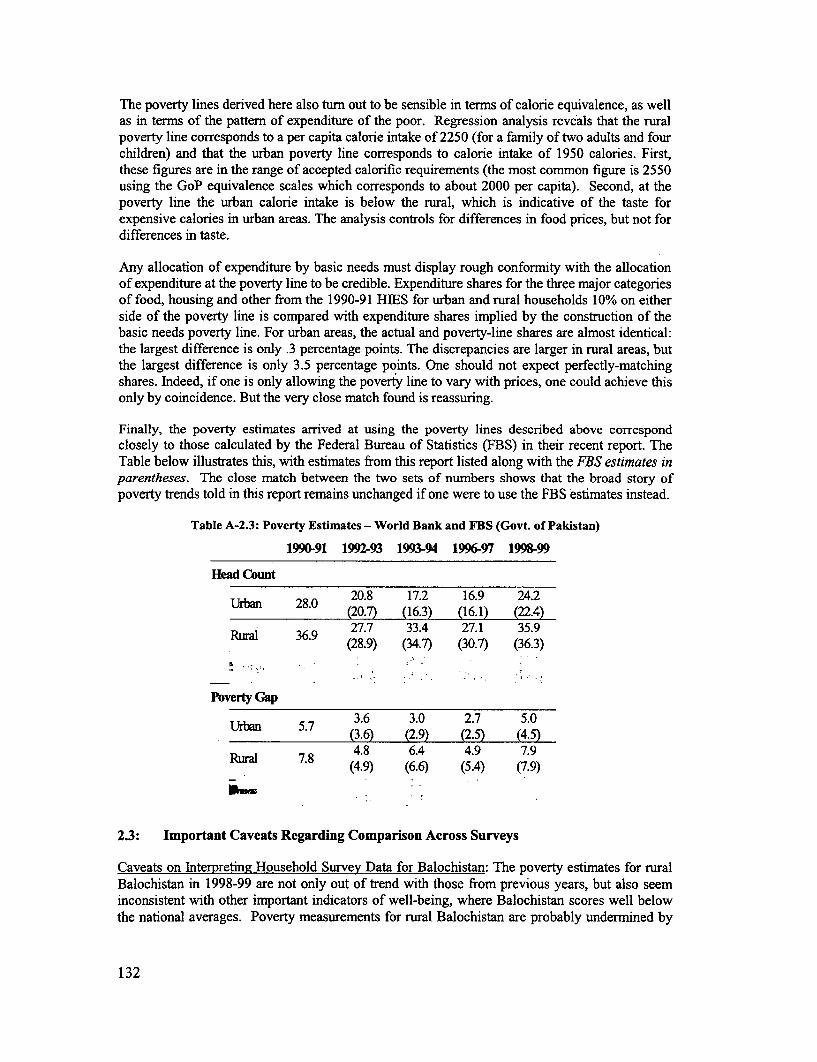
The poverty lines derived here also turn out to be sensible in terms of calorie equivalence, as wellas in terms of the pattern of expenditure of the poor. Regression analysis reveals that the ruralpoverty line corresponds to a per capita calorie intake of 2250 (for a family of two adults and fourchildren) and that the urban poverty line corresponds to calorie intake of 1950 calories. First,these figures are in the range of accepted calorific requirements (the most common figure is 2550using the GoP equivalence scales which corresponds to about 2000 per capita). Second, at thepoverty line the urban calorie intake is below the rural, which is indicative of the taste forexpensive calories in urban areas. The analysis controls for differences in food prices, but not fordifferences in taste.
Any allocation of expenditure by basic needs must display rough conformity with the allocationof expenditure at the poverty line to be credible. Expenditure shares for the three major categoriesof food, housing and other from the 1990-91 HEES for urban and rural households 10% on eitherside of the poverty line is compared with expenditure shares implied by the construction of thebasic needs poverty line. For urban areas, the actual and poverty-line shares are almost identical:the largest difference is only .3 percentage points. The discrepancies are larger in rural areas, butthe largest difference is only 3.5 percentage points. One should not expect perfectly-matchingshares. Indeed, if one is only allowing the poverty line to vary with prices, one could achieve thisonly by coincidence. But the very close match found is reassuring.
Finally, the poverty estimates arrived at using the poverty lines described above correspondclosely to those calculated by the Federal Bureau of Statistics (FBS) in their recent report. TheTable below illustrates this, with estimates from this report listed along with the FBS estimates inparentheses. The close match between the two sets of numbers shows that the broad story ofpoverty trends told in this report remains unchanged if one were to use the FBS estimates instead.
Table A-2.3: Poverty Estimates - World Bank and FBS (Govt. of Pakistan)
1990-91 1992-93 1993-94 1996-97 1998-99
Head Count
LJrbm 28.0 20.8 17.2 16.9 24.2Urban 28.0 (20.7) (16.3) (16.1) (22.4)
27.7 33.4 27.1 35.9Rural 36.9 (28.9) (34.7) (30.7) (36.3)
Poverty Gap
Urban 5.7 3.6 3.0 2.7 5.0Urban 5.7 ~(3.6) (2.9) (2.5) (4.5)
Rural 7.8 4.8 6.4 4.9 7.9R_ral 7.8 (4.9) (6.6) (5.4) (7.9)
2.3: Important Caveats Regarding Comparison Across Surveys
Caveats on Interpreting Household Survey Data for Balochistan: The poverty estimates for ruralBalochistan in 1998-99 are not only out of trend with those from previous years, but also seeminconsistent with other important indicators of well-being, where Balochistan scores well belowthe national averages. Poverty measurements for rural Balochistan are probably undermined by
132
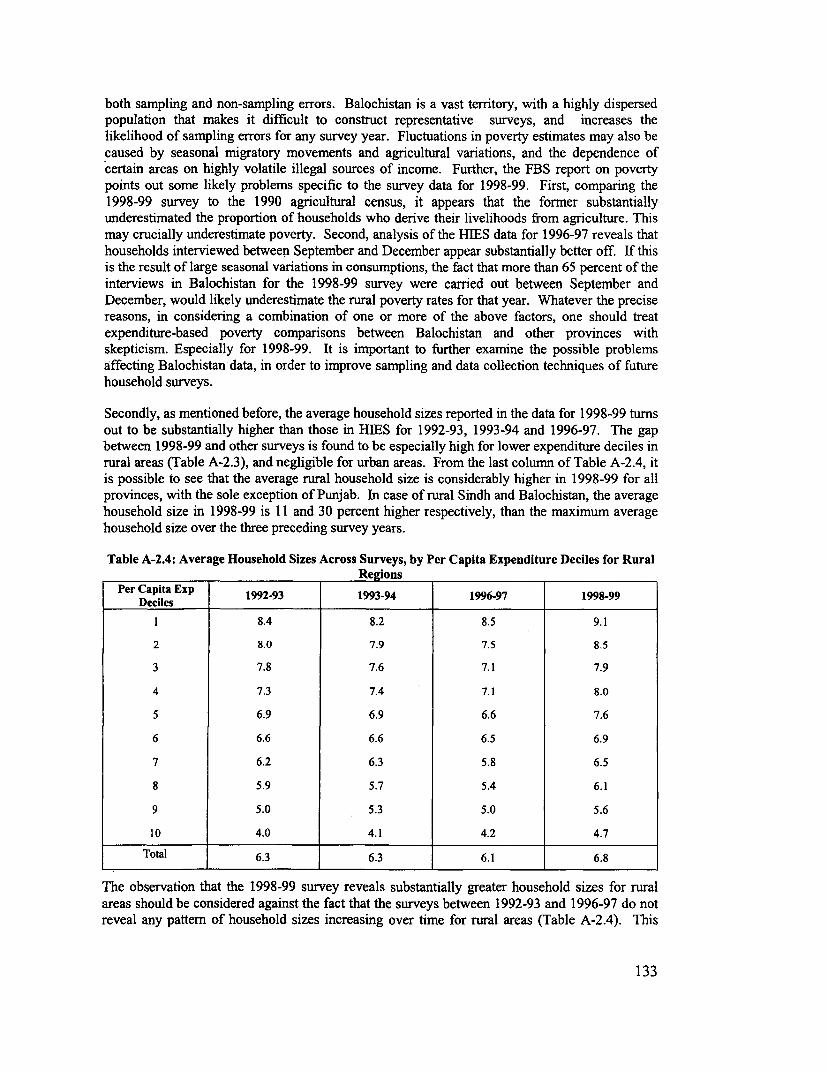
both sampling and non-sampling errors. Balochistan is a vast territory, with a highly dispersedpopulation that makes it difficult to construct representative surveys, and increases thelikelihood of sampling errors for any survey year. Fluctuations in poverty estimates may also becaused by seasonal migratory movements and agricultural variations, and the dependence ofcertain areas on highly volatile illegal sources of income. Further, the FBS report on povertypoints out some likely problems specific to the survey data for 1998-99. First, comparing the1998-99 survey to the 1990 agricultural census, it appears that the former substantiallyunderestimated the proportion of households who derive their livelihoods from agriculture. Thismay crucially underestimate poverty. Second, analysis of the HIES data for 1996-97 reveals thathouseholds interviewed between September and December appear substantially better off. If thisis the result of large seasonal variations in consumptions, the fact that more than 65 percent of theinterviews in Balochistan for the 1998-99 survey were carried out between September andDecember, would likely underestimate the rural poverty rates for that year. Whatever the precisereasons, in considering a combination of one or more of the above factors, one should treatexpenditure-based poverty comparisons between Balochistan and other provinces withskepticism. Especially for 1998-99. It is important to further examine the possible problemsaffecting Balochistan data, in order to improve sampling and data collection techniques of futurehousehold surveys.
Secondly, as mentioned before, the average household sizes reported in the data for 1998-99 turnsout to be substantially higher than those in HIES for 1992-93, 1993-94 and 1996-97. The gapbetween 1998-99 and other surveys is found to be especially high for lower expenditure deciles inrural areas (Table A-2.3), and negligible for urban areas. From the last column of Table A-2.4, itis possible to see that the average rural household size is considerably higher in 1998-99 for allprovinces, with the sole exception of Punjab. In case of rural Sindh and Balochistan, the averagehousehold size in 1998-99 is 11 and 30 percent higher respectively, than the maximum averagehousehold size over the three preceding survey years.
Table A-2.4: Average Household Sizes Across Surveys, by Per Capita Expenditure Deciles for RuralRegions
Per Capita Exp 1992-93 1993-94 1996-97 1998-99Deciles__ _ _ _ _ _
1 8.4 8.2 8.5 9.1
2 8.0 7.9 7.5 8.5
3 7.8 7.6 7.1 7.9
4 7.3 7.4 7.1 8.0
5 6.9 6.9 6.6 7.6
6 6.6 6.6 6.5 6.9
7 6.2 6.3 5.8 6.5
8 5.9 5.7 5.4 6.1
9 5.0 5.3 5.0 5.6
10 4.0 4.1 4.2 4.7
Total 6.3 6.3 6.1 6.8
The observation that the 1998-99 survey reveals substantially greater household sizes for ruralareas should be considered against the fact that the surveys between 1992-93 and 1996-97 do notreveal any pattern of household sizes increasing over time for rural areas (Table A-2.4). This
133
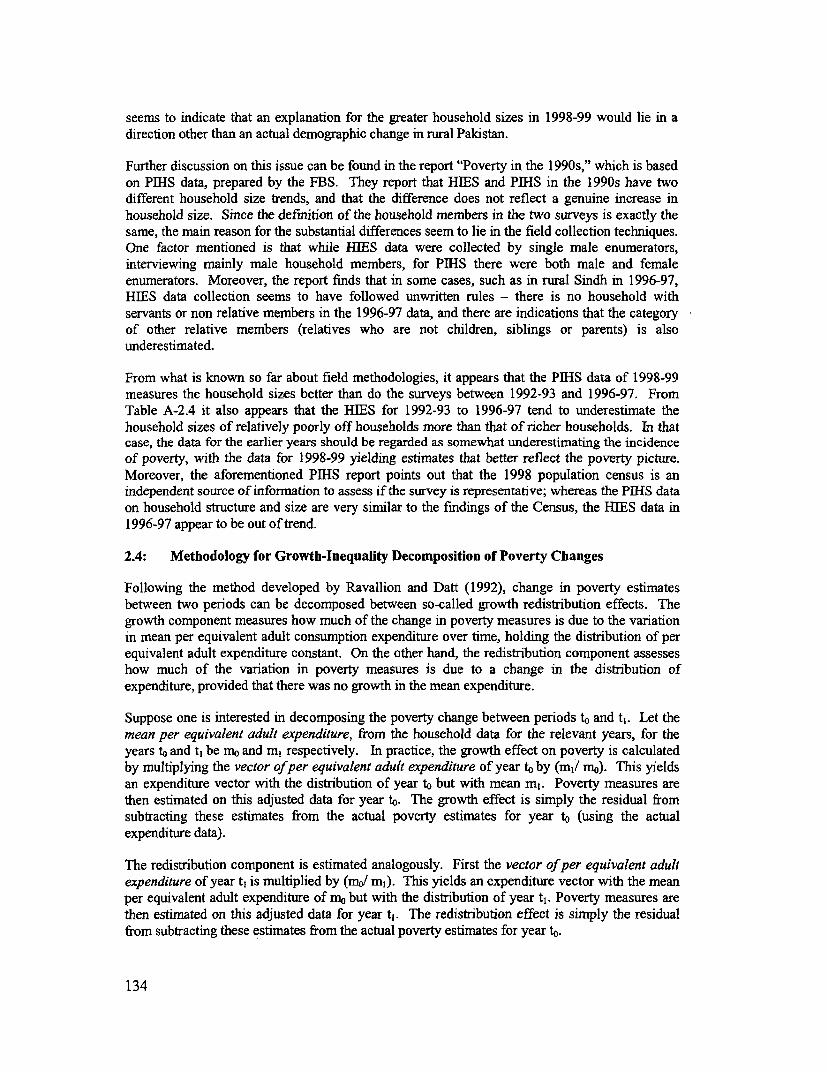
seems to indicate that an explanation for the greater household sizes in 1998-99 would lie in adirection other than an actual demographic change in rural Pakistan.
Further discussion on this issue can be found in the report "Poverty in the 1990s," which is basedon PIHS data, prepared by the FBS. They report that HEES and PIHS in the 1990s have twodifferent household size trends, and that the difference does not reflect a genuine increase inhousehold size. Since the definition of the household members in the two surveys is exactly thesame, the main reason for the substantial differences seem to lie in the field collection techniques.One factor mentioned is that while HEES data were collected by single male enumerators,interviewing mainly male household members, for PIHS there were both male and femaleenumerators. Moreover, the report finds that in some cases, such as in rural Sindh in 1996-97,HIES data collection seems to have followed unwritten rules - there is no household withservants or non relative members in the 1996-97 data, and there are indications that the categoryof other relative members (relatives who are not children, siblings or parents) is alsounderestimated.
From what is known so far about field methodologies, it appears that the PIHS data of 1998-99measures the household sizes better than do the surveys between 1992-93 and 1996-97. FromTable A-2.4 it also appears that the HIES for 1992-93 to 1996-97 tend to underestimate thehousehold sizes of relatively poorly off households more than that of richer households. In thatcase, the data for the earlier years should be regarded as somewhat underestimnating the incidenceof poverty, with the data for 1998-99 yielding estimates that better reflect the poverty picture.Moreover, the aforementioned PIHS report points out that the 1998 population census is anindependent source of information to assess if the survey is representative; whereas the PIHS dataon household structure and size are very similar to the findings of the Census, the HIES data in1996-97 appear to be out of trend.
2.4: Methodology for Growth-Inequality Decomposition of Poverty Changes
Following the method developed by Ravallion and Datt (1992), change in poverty estimatesbetween two periods can be decomposed between so-called growth redistribution effects. Thegrowth component measures how much of the change in poverty measures is due to the variationin mean per equivalent adult consumption expenditure over time, holding the distribution of perequivalent adult expenditure constant. On the other hand, the redistribution component assesseshow much of the variation in poverty measures is due to a change in the distribution ofexpenditure, provided that there was no growth in the mean expenditure.
Suppose one is interested in decomposing the poverty change between periods to and t1. Let themean per equivalent adult expenditure, from the household data for the relevant years, for theyears to and t1 be mo and ml respectively. In practice, the growth effect on poverty is calculatedby multiplying the vector ofper equivalent adult expenditure of year to by (ml mo). This yieldsan expenditure vector with the distribution of year to but with mean ml. Poverty measures arethen estimated on this adjusted data for year to. The growth effect is simply the residual fromsubtracting these estimates from the actual poverty estimates for year to (using the actualexpenditure data).
The redistribution component is estimated analogously. First the vector of per equivalent adultexpenditure of year t1 is multiplied by (mJ/ ml). This yields an expenditure vector with the meanper equivalent adult expenditure of mno but with the distribution of year tl. Poverty measures arethen estimated on this adjusted data for year t,. The redistribution effect is simply the residualfrom subtracting these estimates from the actual poverty estimates for year to.
134
2.5: Growth Incidence Analysis for Pakistan: 1990-91 to 1998-99
Rgure A-2.2: Growth Incidence Curve: 90-91:98-99
0.8-
0U) 0.4 -
10 20 30 40 60 60 -Y8T 90c 0-0.4-
CE
&(S -0.8 0
-1.2
Percentiles of population ranked by household expenditureper person
-growth rate of centile -mean of growth rates
2.6: Measurement of Vulnerability
Definition of the Vulnerability Measure: Consider a time horizon of three periods and let theinitial period be t. We need to find the probability that a household's expenditure level will fallbelow the poverty line at least once within the following three periods. This probability is givenby: Vit (T, Pline) = P(At least one period of poverty) = [1- P(No periods of poverty)] = [I - [(1
- P(poor in first period))* (I - P(poor in second period I not poor in first period))*(1 - P(poor in third period I not poor in first two periods))]]
A household i is then classified as vulnerable at time t if the vulnerability measure, Vit, exceedssome threshold value Vthresh. Vit is obtained by conditioning future probabilities of poverty onoutcomes in previous periods. In order to compute the probabilities for the vulnerability index, weestimate expenditures using household fixed-effects and the rainfall shock. This allows us todirectly estimate the change in expenditure due to the rainfall shock. We allow for persistence inthis shock so that the total variation in time t expenditures is the sum of variation due to pastshocks and variation due to the time t shock. By using estimated consumption we are also able toroughly correct for measurement error in the data. To account for heteroskedasticity in observedexpenditure, we ranked all households by mean absolute deviation in estimated expenditure,grouped households into deciles and computed the variance of estimated expenditure, as well asthe variance of consumption due to the exogenous shock separately for each decile.
It is important to note that the measure we develop does not require panel data. The panel allowsus to check the validity of our measure by comparing estimated vulnerability levels against theoccurrence of episodes of poverty over the 5 years of the panel. However, we estimatevulnerability at the cohort level by treating the panel as a series of cross sections and find that ourcohort based measure tracks actual transitions extremely well and is robust to changes in the timehorizon and the poverty line. This greatly enhances the usefulness of the measure for analyzingdifferentials in the intensity of vulnerability, as well as in its causative factors, in sub-populationsof interest. We intend to use the Household Income and Expenditure Survey series to estimate
135
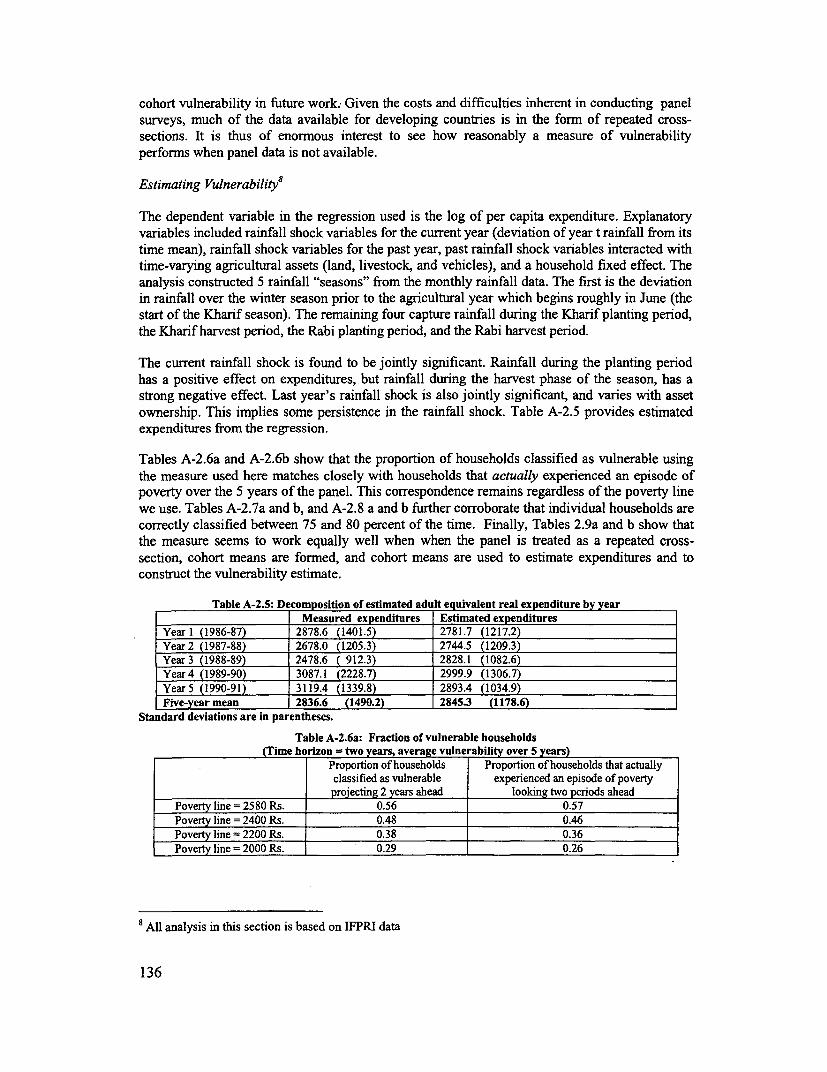
cohort vulnerability in future work; Given the costs and difficulties inherent in conducting panelsurveys, much of the data available for developing countries is in the form of repeated cross-sections. It is thus of enormous interest to see how reasonably a measure of vulnerabilityperforms when panel data is not available.
Estimating Vulnerability8
The dependent variable in the regression used is the log of per capita expenditure. Explanatoryvariables included rainfall shock variables for the current year (deviation of year t rainfall from itstime mean), rainfall shock variables for the past year, past rainfall shock variables interacted withtime-varying agricultural assets (land, livestock, and vehicles), and a household fixed effect. Theanalysis constructed 5 rainfall "seasons" from the monthly rainfall data. The first is the deviationin rainfall over the winter season prior to the agricultural year which begins roughly in June (thestart of the Kharif season). The remaining four capture rainfall during the Kharif planting period,the Kharif harvest period, the Rabi planting period, and the Rabi harvest period.
The current rainfall shock is found to be jointly significant. Rainfall during the planting periodhas a positive effect on expenditures, but rainfall during the harvest phase of the season, has astrong negative effect. Last year's rainfall shock is also jointly significant, and varies with assetownership. This implies some persistence in the rainfall shock. Table A-2.5 provides estimatedexpenditures from the regression.
Tables A-2.6a and A-2.6b show that the proportion of households classified as vulnerable usingthe measure used here matches closely with households that actually experienced an episode ofpoverty over the 5 years of the panel. This correspondence remains regardless of the poverty linewe use. Tables A-2.7a and b, and A-2.8 a and b further corroborate that individual households arecorrectly classified between 75 and 80 percent of the time. Finally, Tables 2.9a and b show thatthe measure seems to work equally well when when the panel is treated as a repeated cross-section, cohort means are formed, and cohort means are used to estimate expenditures and toconstruct the vulnerability estimate.
Table A-2.5: D composition of estimated adlt equivalent real expenditure by yearMeasured expenditures Estimated expenditures
Year 1 (1986-87) 2878.6 (1401.5) 2781.7 (1217.2)Year 2 (1987-88) 2678.0 (1205.3) 2744.5 (1209.3)Year 3 (1988-89) 2478.6 ( 912.3) 2828.1 (1082.6)Year 4 (1989-90) 3087.1 (2228.7) 2999.9 (1306.7)Year5 (1990-91) -3119.4 (1339.8) 2893.4 (1034.9)Five-year mean 2836.6 (1490.2) 2845.3 (1178.6)
Standard deviations are in parentheses.
Table A-2.6a: Fraction of vulnerable households(Time horizon = two years, average vulnerability over 5 years)
Proportion of households Proportion of households that actuallyclassified as vulnerable experienced an episode of poverty
projecting 2 years ahead looking two periods aheadPoverty line = 2580 Rs. 0.56 0.57Poverty line = 2400 Rs. 0.48 0.46Poverty line = 2200 Rs. 0.38 0.36Poverty line = 2000 Rs. 0.29 0.26
8 All analysis in this section is based on IFPRI data
136
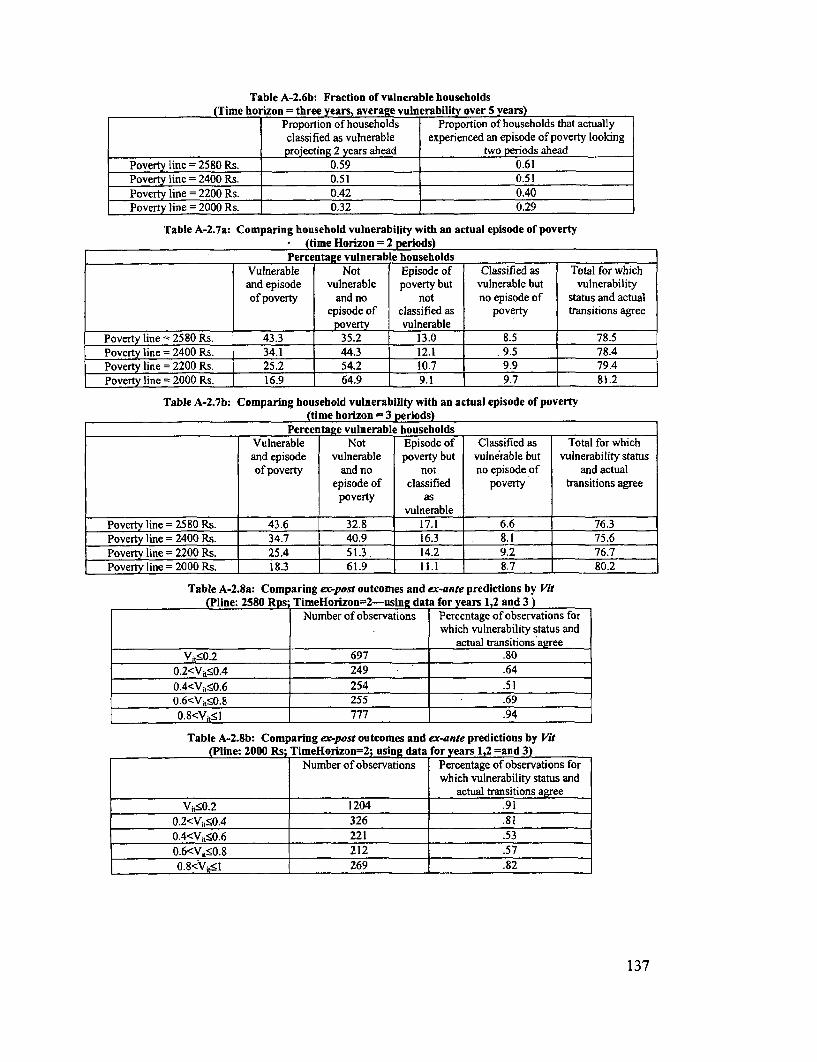
Table A-2.6b: Fraction of vulnerable households(Time ho izon = three years, average vuln erability over 5 years)
Proportion of households Proportion of households that actuallyclassified as vulnerable experienced an episode of poverty lookingprojecting 2 years ahead two periods ahead
Poverty line = 2580 Rs. 0.59 0.61Poverty line = 2400 Rs. 0.51 0.51Poverty line = 2200 Rs. 0.42 0.40Poverty line = 2000 Rs. 0.32 0.29
Table A-2.7a: Comparing household vulnerability with an actual episode of poverty(time Horizon = 2 periods)
Percentage vulnerab le householdsVulnerable Not Episode of Classified as Total for whichand episode vulnerable poverty but vulnerable but vulnerabilityof poverty and no not no episode of status and actual
episode of classified as poverty transitions agreepoverty vulnerable
Poverty line = 2580 Rs. 43.3 35.2 13.0 8.5 78.5Poverty line = 2400 Rs. 34.1 44.3 12.1 9.5 78.4Poverty line = 2200 Rs. 25.2 54.2 10.7 9.9 79.4Poverty line = 2000 Rs. 16.9 64.9 9.1 9.7 81.2
Table A-2.7b: Comparing household vulnerability with an actual episode of poverty(time horizon = 3 periods)
Percentage vulnerable householdsVulnerable Not Episode of Classified as Total for whichand episode vulnerable poverty but vulnerable but vulnerability statusof poverty and no not no episode of and actual
episode of classified poverty transitions agreepoverty as
vulnerablePovertyline = 2580 Rs. 43.6 32.8 17.1 6.6 76.3Poverty line = 2400 Rs. 34.7 40.9 16.3 8.1 75.6Poverty line = 2200 Rs. 25.4 51.3. 14.2 9.2 76.7Poverty line = 2000 Rs. 18.3 61.9 11.1 8.7 80.2
Table A-2.8a: Comparing er-post outcomes and ex-ante predictions by ra(Pline: 2580 Rps; TimeHorizon=2-using data for years 1,2 and 3 )
Number of observations Percentage of observations forwhich vulnerability status and
actual transitions agreeVk:0.2 697 .80
0.2<V^50.4 249 .640.4<Vj--0.6 254 .510.6<VjsO.8 255 .690.8<VhSl 777 .94
Table A-2.Sb: Comparing ec-pest outcomes and ex-ante predictions by Vit(Pline: 2000 Rs TlmeHorizon=2; using data for years 1,2 =and 3)
Number of observations Percentage of observations forwhich vulnerability status and
actual transitions agreeV1ts0.2 1204 .91
0.2<V11S0.4 326 .810.4<Vi,0.6 221 .530.6<Vj,g0.8 212 .570.8<V1 t•1 269 .82
137
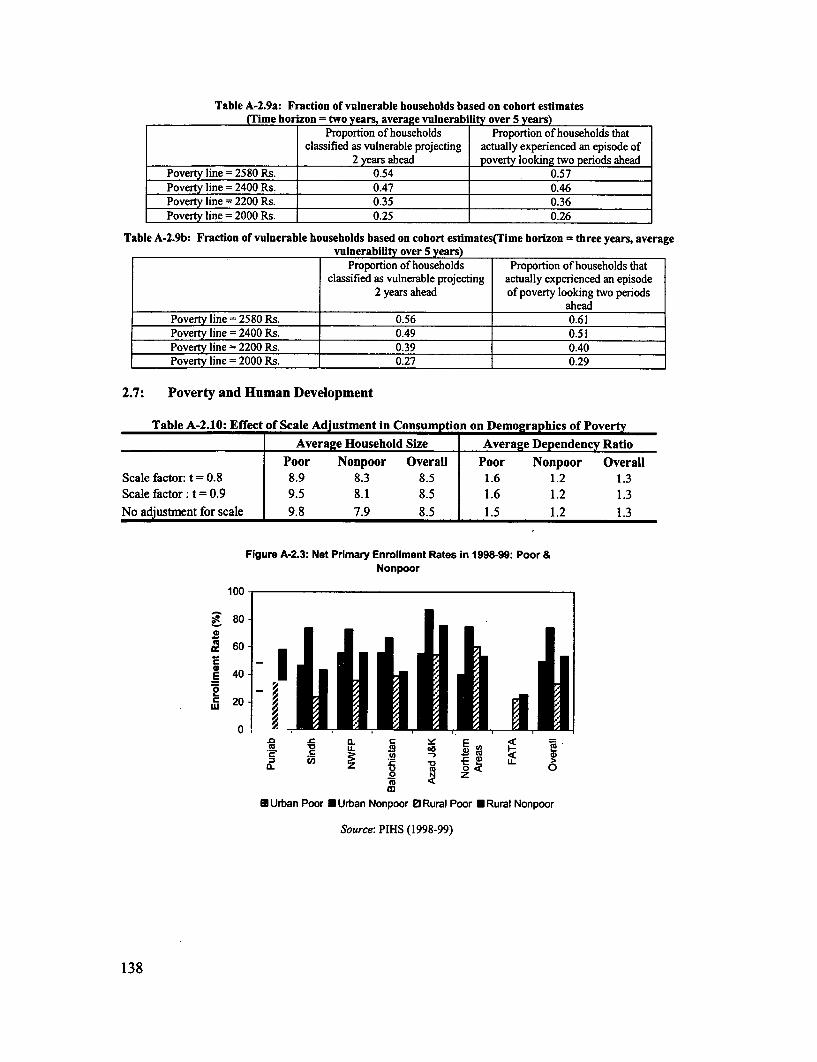
Table A-2.9a: Fraction of vulnerable households based on cohort estimates(Time horizon = two years, average vulnerability over 5 years)
Proportion of households Proportion of households thatclassified as vulnerable projecting actually experienced an episode of
2 years ahead poverty looking two periods aheadPoverty line = 2580 Rs. 0.54 0.57Poverty line = 2400 Rs. 0.47 0.46Poverty line = 2200 Rs. 0.35 0.36Poverty line = 2000 Rs. 0.25 0.26
Table A-2.9b: Fraction of vulnerable households based on cohort estimates(Time horizon = three years, averagevulnerabilUty over 5 years)
Proportion of households Proportion of households thatclassified as vulnerable projecting actually experienced an episode
2 years ahead of poverty looking two periodsahead
Poverty line = 2580 Rs. 0.56 0.61Poverty line = 2400 Rs. 0.49 0.51Poverty line = 2200 Rs. 0.39 0.40Poverty line = 2000 Rs. 0.27 0.29
2.7: Poverty and Human Development
Table A-2.10: Effect of Scale Adjustment in Consumption on Demographics of PovertyAverage Household Size Average Dependency Ratio
Poor Nonpoor Overall Poor Nonpoor OverallScale factor: t=0.8 8.9 8.3 8.5 1.6 1.2 1.3Scale factor: t =0.9 9.5 8.1 8.5 1.6 1.2 1.3No adjustment for scale 9.8 7.9 8.5 1.5 1.2 1.3
Figure A-2.3: Net Primary Enrollment Rates in 1998-99: Poor &Nonpoor
100
a 80-
60-
D 40 -
~20
0~~~~~~~~~~~~~
0~~~ - 0
U Urban Poor U Urban Nonpoor 0 Rural Poor * Rural Nonpoor
Source: PIHS (1998-99)
138
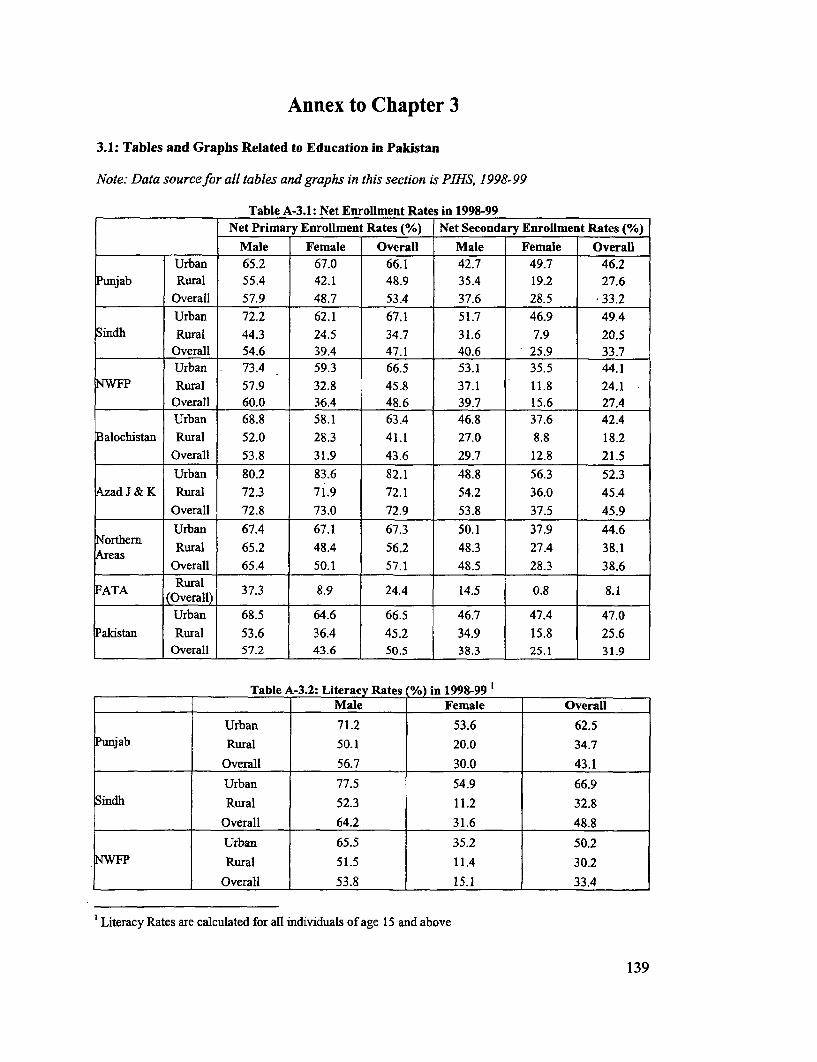
Annex to Chapter 3
3.1: Tables and Graphs Related to Education in Pakistan
Note: Data sourcefor all tables and graphs in this section is PIHS, 1998-99
Table A-3.1: Net Enrollment Rates in 1998-99Net Primary Enrollment Rates (%) Net Secondary Enrollment Rates (%)
Male Female Overall Male Female OverallUrban 65.2 67.0 66.1 42.7 49.7 46.2
unjab Rural 55.4 42.1 48.9 35.4 19.2 27.6Overall 57.9 48.7 53.4 37.6 28.5 33.2Urban 72.2 62.1 67.1 51.7 46.9 49.4
Sindh Rural 44.3 24.5 34.7 31.6 7.9 20.5
Overall 54.6 39.4 47.1 40.6 25.9 33.7Urban 73.4 59.3 66.5 53.1 35.5 44.1
NWFP Rural 57.9 32.8 45.8 37.1 11.8 24.1Overall 60.0 36.4 48.6 39.7 15.6 27.4Urban 68.8 58.1 63.4 46.8 37.6 42.4
Balochistan Rural 52.0 28.3 41.1 27.0 8.8 18.2
Overall 53.8 31.9 43.6 29.7 12.8 21.5
Urban 80.2 83.6 82.1 48.8 56.3 52.3Azad J & K Rural 72.3 71.9 72.1 54.2 36.0 45.4
Overall 72.8 73.0 72.9 53.8 37.5 45.9
Urban 67.4 67.1 67.3 50.1 37.9 44.6Northern Rural 65.2 48.4 56.2 48.3 27.4 38.1
AeasOverall 65.4 50.1 57.1 48.5 28.3 38.6
FATA Rural 37.3 8.9 24.4 14.5 0.8 8.1(Overall) Urban 68.5 64.6 66.5 46.7 47.4 47.0
Pakistan Rural 53.6 36.4 45.2 34.9 15.8 25.6Overall 57.2 43.6 50.5 38.3 25.1 31.9
Table A-3.2: Literacy Rates (%) in 1998-99'Male Female OveraD
Urban 71.2 53.6 62.5Punjab Rural 50.1 20.0 34.7
Overall 56.7 30.0 43.1
Urban 77.5 54.9 66.9Sindh Rural 52.3 11.2 32.8
Overall 64.2 31.6 48.8
Urban 65.5 35.2 50.2NWFP Rural 51.5 11.4 30.2
Overall 53.8 15.1 33.4
'Literacy Rates are calculated for all individuals of age 15 and above
139
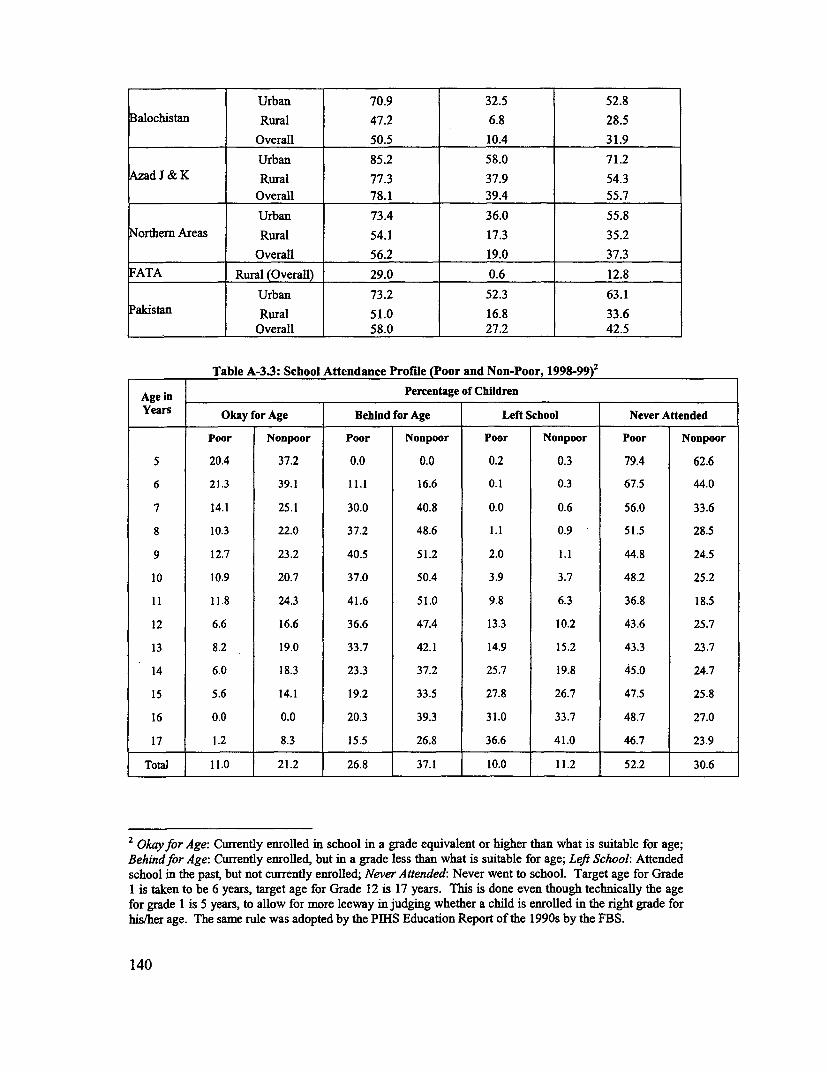
Urban 70.9 32.5 52.8Balochistan Rural 47.2 6.8 28.5
Overall 50.5 10.4 31.9Urban 85.2 58.0 71.2
Azad J & K Rural 77.3 37.9 54.3
Overall 78.1 39.4 55.7Urban 73.4 36.0 55.8
Northern Areas Rural 54.1 17.3 35.2
Overall 56.2 19.0 37.3FATA Rural (Overall) 29.0 0.6 12.8
Urban 73.2 52.3 63.1Pakistan Rural 51.0 16.8 33.6
Overall 58.0 27.2 42.5
Table A-3.3: School Attendance Profile (Poor and Non-Poor, 1998-99)2
Age in Percentage of ChildrenYears Okay for Age Behind for Age Left School Never Attended
Poor Nonpoor Poor Nonpoor Poor Nonpoor Poor Nonpoor
5 20.4 37.2 0.0 0.0 0.2 0.3 79.4 62.6
6 21.3 39.1 11.1 16.6 0.1 0.3 67.5 44.0
7 14.1 25.1 30.0 40.8 0.0 0.6 56.0 33.6
8 10.3 22.0 37.2 48.6 1.1 0.9 51.5 28.5
9 12.7 23.2 40.5 51.2 2.0 1.1 44.8 24.5
10 10.9 20.7 37.0 50.4 3.9 3.7 48.2 25.2
11 11.8 24.3 41.6 51.0 9.8 6.3 36.8 18.5
12 6.6 16.6 36.6 47.4 13.3 10.2 43.6 25.7
13 8.2 19.0 33.7 42.1 14.9 15.2 43.3 23.7
14 6.0 18.3 23.3 37.2 25.7 19.8 45.0 24.7
15 5.6 14.1 19.2 33.5 27.8 26.7 47.5 25.8
16 0.0 0.0 20.3 39.3 31.0 33.7 48.7 27.0
17 1.2 8.3 15.5 26.8 36.6 41.0 46.7 23.9
Total 11.0 21.2 26.8 37.1 10.0 11.2 52.2 30.6
2 Okay for Age: Currently enrolled in school in a grade equivalent or higher than what is suitable for age;Behindfor Age: Currently enrolled, but in a grade less than what is suitable for age; Left School: Attendedschool in the past, but not currently enrolled; Never Attended: Never went to school. Target age for Grade1 is taken to be 6 years, target age for Grade 12 is 17 years. This is done even though technically the agefor grade 1 is 5 years, to allow for more leeway in judging whether a child is enrolled in the right grade forhis/her age. The same rule was adopted by the PIHS Education Report of the 1990s by the FBS.
140
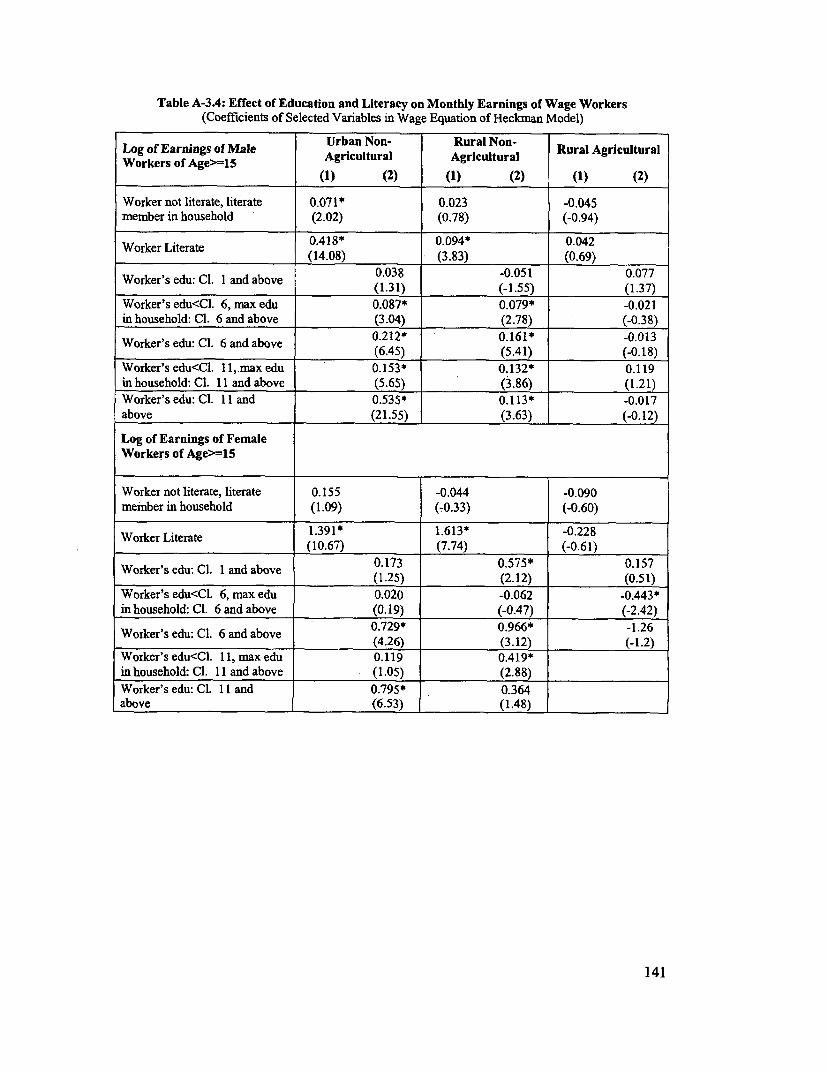
Table A-3.4: Effect of Education and Literacy on Monthly Earnings of Wage Workers(Coefficients of Selected Variables in Wage Equation of Heckman Model)
Log of Earnings of Male Agrbcuntural gRcutralNn Rural AgriculturalWorkers of Age>=15 Agricultural Agricultural
(1) (2) (1) (2) (1) (2)
Worker not literate, literate 0.071* 0.023 -0.045member in household (2.02) (0.78) (-0.94)
Worker Literate0.418* 0.094* 0.042Worker Literate (14.08) (3.83) (0.69)
Worker's edu: Cl. 1 and above 0.038 -0.051 0.077(1.31) (-1.55) (1.37)
Worker's edu<CI. 6, mnax edu 0.087* 0.079* -0.021in household: Cl. 6 and above (3.04) (2.78) (-0.38)
0.212* 0.161* -0.013Worker's edu: Cl. 6 and above (6.45) (5.41) (-0.18)
Worker's edu<Cl. l1,.max edu 0.153* 0.132* 0.119in household: Cl. 11 and above (5.65) (3.86) (1.21)
Worker'sedu:Cl. 11 and 0.535* 0.113* -0.017above (21.55) (3.63) (-0.12)
Log of Earnings of FemaleWorkers of Age>-15
Worker not literate, literate 0.155 -0.044 -0.090memnber in household (1.09) (-0.33) (-0.60)
Worker Literate 1.391* 1.613* -0.228Worker Literate (10.67) (7.74) (-0.61)
Worker's edu: Cl. 1 and above 0.173 0.575* 0.157(1.25) (2.12) (0.51)
Worker's edu<CI. 6, max edu 0.020 -0.062 -0.443*in household: Cl. 6 and above (0.1 9) (-0.47) (-2.42)
0.729* 0.966* -1.26Worker's edu: Cl. 6 and above (4.26) (3.12) (-1.2)
Worker's edu<C1. 11, max edu 0.119 0.419*in household: Cl. 11 and above (1.05) (2.88)
Worker's edu: Cl. 11 and 0.795* 0.364above (6.53) (1.48)
141
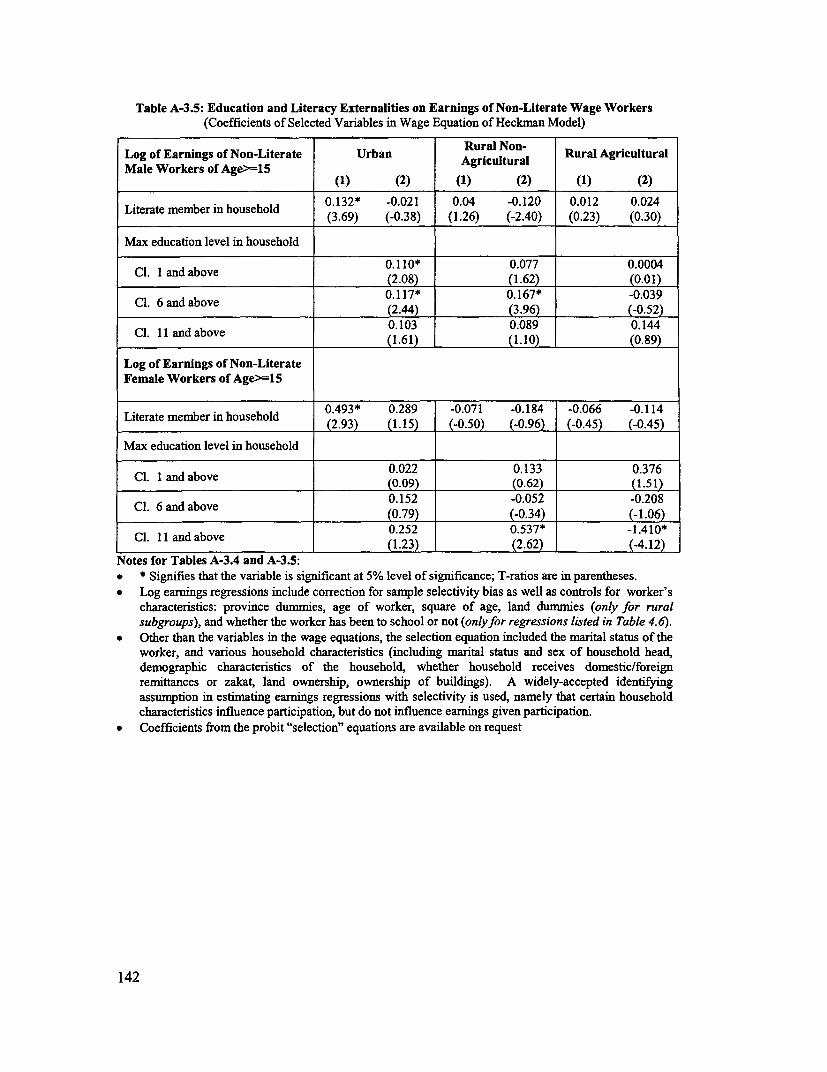
Table A-3.5: Education and Literacy Externalities on Earnings of Non-Literate Wage Workers(Coefficients of Selected Variables in Wage Equation of Heckman Model)
Log of Earnings of Non-Literate Urban Rural Non- Rural AgriculturalMale Workers of Age>=-15 Agricultural
(1) (2) (1) (2) (1) (2)
Literate member in household 0.132* -0.021 0.04 -0.120 0.012 0.024(3.69) (-0.38) (1.26) (-2.40) (0.23) (0.30)
Max education level in household
Cl. I and above 0.110* 0.077 0.0004(2.08) (1.62) (0.01)0.117* 0.167* -0.039Cl. 6 and above (2.44) (3.96) (-0.52)
Cl. II and above 0.103 0.089 0.144(1.61) (1.10) (0.89)
Log of Earnings of Non-LiterateFemale Workers of Age>=15
Literate member in household 0.493* 0.289 -0.071 -0.184 -0.066 -0.114Literate member in household (2.93) (1.15) (-0.50) (-0.96) (-0.45) (-0.45)
Max education level in household
0.022 0.133 0.376Cl. 1 and above (0.09) (0.62) (1.51)
Cl. 6 and above 0.152 -0.052 -0.208(0.79) (-0.34) (-1.06)
Cl. II and above 0.252 0.537* -1.410*Cl. 11 and above ~~~~(1.23) (2.62) (-4.12)Notes for Tables A-3.4 and A-3.5:
* Signifies that the variable is significant at 5% level of significance; T-ratios are in parentheses.* Log earnings regressions include correction for sample selectivity bias as well as controls for worker's
characteristics: province dummies, age of worker, square of age, land dummies (only for ruralsubgroups), and whether the worker has been to school or not (only for regressions listed in Table 4.6).
* Other than the variables in the wage equations, the selection equation included the marital status of theworker, and various household characteristics (including marital status and sex of household head,demographic characteristics of the household, whether household receives domestic/foreignremittances or zakat, land ownership, ownership of buildings). A widely-accepted identifyingassumption in estimating earnings regressions with selectivity is used, namely that certain householdcharacteristics influence participation, but do not influence earnings given participation.
* Coefficients from the probit "selection" equations are available on request
142
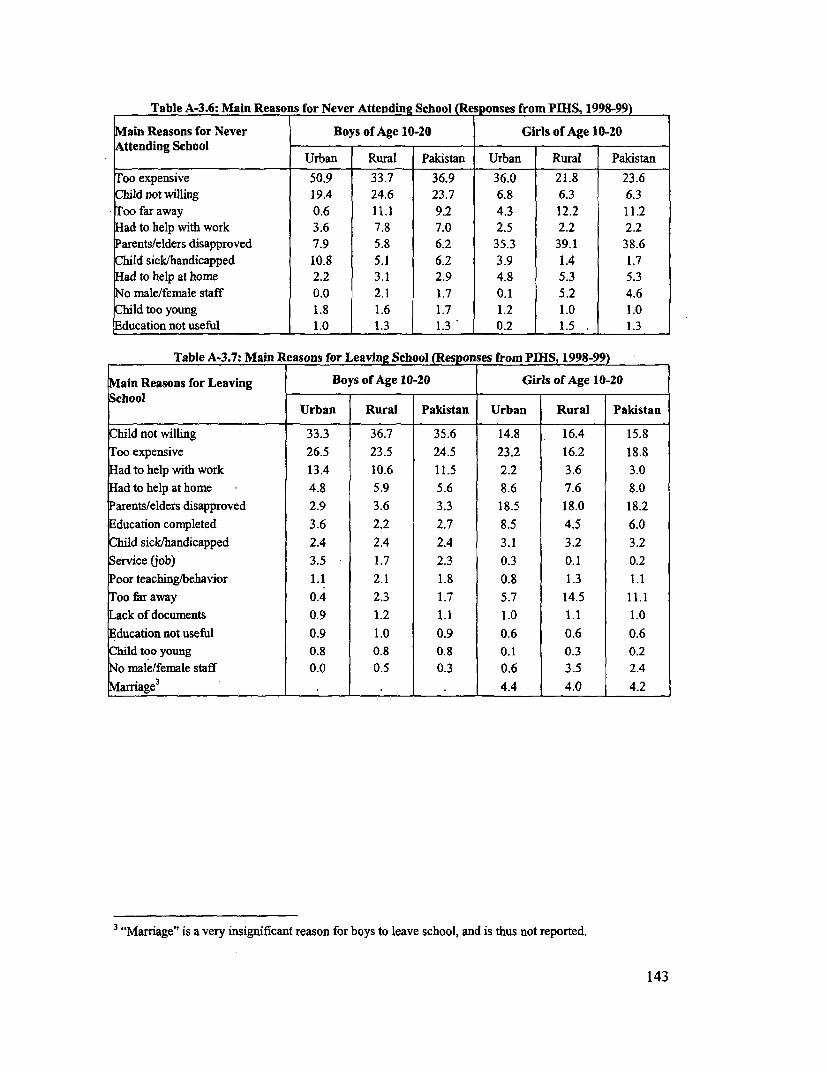
Table A-3.6: Main Reasons for Never Attending School (Responses from PIHS, 1998-99)
sain Reasons for Never Boys of Age 10-20 Girls of Age 10-20Attending 'School
Urban Rural Pakistan Urban Rural PakistanToo expensive 50.9 33.7 36.9 36.0 21.8 23.6Child not willing 19.4 24.6 23.7 6.8 6.3 6.3Too far away 0.6 11.1 9.2 4.3 12.2 11.2Had to help with work 3.6 7.8 7.0 2.5 2.2 2.2Parents/elders disapproved 7.9 5.8 6.2 35.3 39.1 38.6Child sick/handicapped 10.8 5.1 6.2 3.9 1.4 1.7Had to help at home 2.2 3.1 2.9 4.8 5.3 5.3No male/female staff 0.0 2.1 1.7 0.1 5.2 4.6Child too young 1.8 1.6 1.7 1.2 1.0 1.0Education not useful 1.0 1.3 1.3 0.2 1.5 . 1.3
Table A-3.7: Main Reasons for Leaving School (Respon ses from PIHS, 1998-99)
Main Reasons for Leaving Boys of Age 10-20 Girls of Age 10-20School
Urban Rural Pakistan Urban Rural Paldstan
Child not willing 33.3 36.7 35.6 14.8 16.4 15.8Too expensive 26.5 23.5 24.5 23.2 16.2 18.8Had to help with work 13.4 10.6 11.5 2.2 3.6 3.0Had to help at home 4.8 5.9 5.6 8.6 7.6 8.0Parents/elders disapproved 2.9 3.6 3.3 18.5 18.0 18.2
ducation cornpleted 3.6 2.2 2.7 8.5 4.5 6.0Child sick/handicapped 2.4 2.4 2.4 3.1 3.2 3.2Service (job) 3.5 1.7 2.3 0.3 0.1 0.2Poor teaching/behavior 1.1 2.1 1.8 0.8 1.3 1.1Too faraway 0.4 2.3 1.7 5.7 14.5 11.1Lack of documents 0.9 1.2 1.1 1.0 1.1 1.0Education not useful 0.9 1.0 0.9 0.6 0.6 0.6Child too young 0.8 0.8 0.8 0.1 0.3 0.2No male/female staff 0.0 0.5 0.3 0.6 3.5 2.4Marriage3
. . . 4.4 4.0 4.2
" "Marriage" is a very insignificant reason for boys to leave school, and is thus not reported.
143
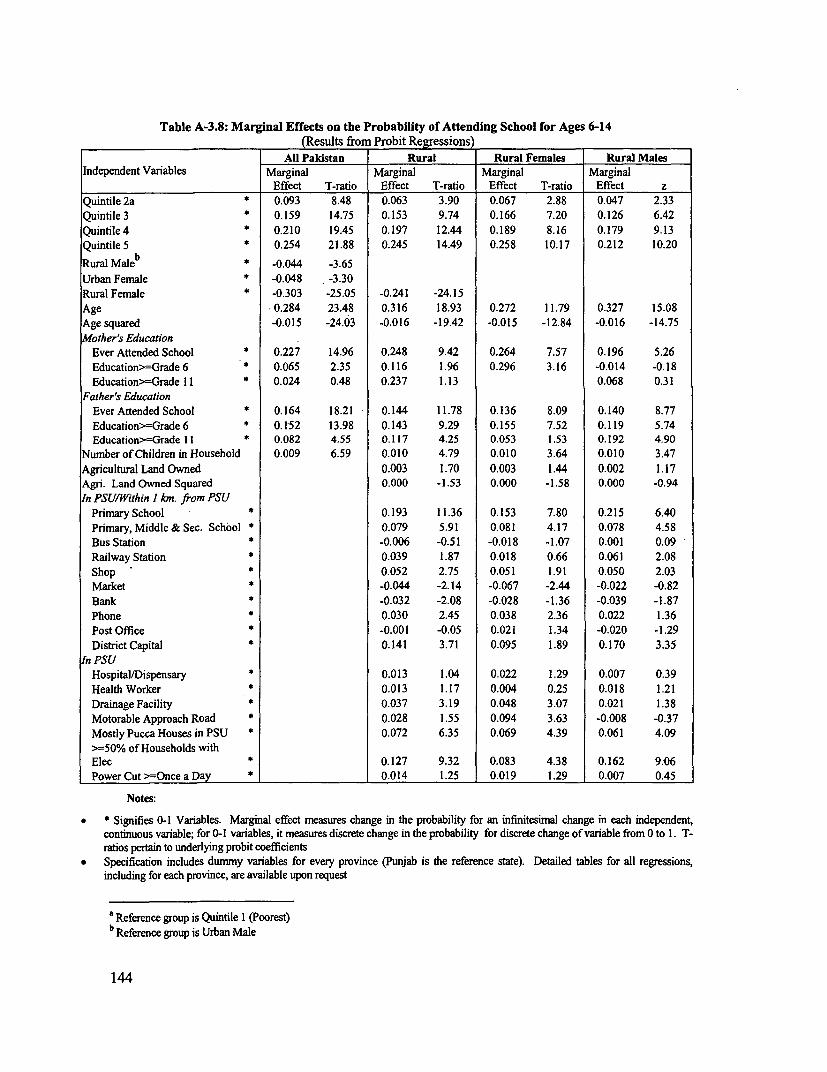
Table A-3.8: Marginal Effects on the Probability of Attending School for Ages 6-14(Results from Probit Regressions)
All Pakistan Rural Rural Females Rural MalesIndependent Variables Marginal Marginal Marginal Marginal
Effect T-ratio Effect T-ratio Effect T-ratio Effect zQuintile 2a * 0.093 8.48 0.063 3.90 0.067 2.88 0.047 2.33Quintile 3 * 0.159 14.75 0.153 9.74 0.166 7.20 0.126 6.42Quintile4 * 0.210 19.45 0.197 12.44 0.189 8.16 0.179 9.13Quinle 5 * 0.254 21.88 0.245 14.49 0.258 10.17 0.212 10.20Rural Male * -0.044 -3.65Urban Female * -0.048 -3.30Rural Female * -0.303 -25.05 -0.241 -24.15Age 0.284 23.48 0.316 18.93 0.272 11.79 0.327 15.08Age squared -0.015 -24.03 -0.016 -19.42 -0.015 -12.84 -0.016 -14.75Mother's Education
Ever Attended School * 0.227 14.96 0.248 9.42 0.264 7.57 0.196 5.26Education>=Grade6 0.065 2.35 0.116 1.96 0.296 3.16 -0.014 -0.18Education>-Grade I * 0.024 0.48 0.237 1.13 0.068 0.31
Father's EducationEver Attended School * 0.164 18.21 0.144 11.78 0.136 8.09 0.140 8.77Education>=Grade6 * 0.152 13.98 0.143 9.29 0.155 7.52 0.119 5.74Education>=Grade I * 0.082 4.55 0.117 4.25 0.053 1.53 0.192 4.90
Number of Children in Household 0.009 6.59 0.010 4.79 0.010 3.64 0.010 3.47Agricultural Land Owned 0.003 1.70 0.003 1.44 0.002 1.17Agri. Land Owned Squared 0.000 -1.53 0.000 -1.58 0.000 -0.94In PSU/Within I hn. from PSU
PrimarySchool * 0.193 11.36 0.153 7.80 0.215 6.40Primary, Middle & Sec. School * 0.079 5.91 0.081 4.17 0.078 4.58Bus Station * -0.006 -0.51 -0.018 -1.07 0.001 0.09Railway Station * 0.039 1.87 0.018 0.66 0.061 2.08Shop * 0.052 2.75 0.051 1.91 0.050 2.03Market * -0.044 -2.14 -0.067 -2.44 -0.022 -0.82Bank * -0.032 -2.08 -0.028 -1.36 -0.039 -1.87Phone * 0.030 2.45 0.038 2.36 0.022 1.36Post Office * -0.001 -0.05 0.021 1.34 -0.020 -1.29District Capital * 0.141 3.71 0.095 1.89 0.170 3.35
In PSUHospital/Dispensary * 0.013 1.04 0.022 1.29 0.007 0.39Health Worker * 0.013 1.17 0.004 0.25 0.018 1.21Drainage Facility * 0.037 3.19 0.048 3.07 0.021 1.38Motorable Approach Road * 0.028 1.55 0.094 3.63 -0.008 -0.37Mostly Pucca Houses in PSU * 0.072 6.35 0.069 4.39 0.061 4.09>=50% of Households withElec * 0.127 9.32 0.083 4.38 0.162 9:06Power Cut >=Once a Day * 0.014 1.25 0.019 1.29 0.007 0.45
Notes:
* Signifies 0-1 Variables. Marginal effect measures change in the probability for an infinitesimal change in each independent,continuous variable; for 0-1 variables, it measures discrete change in the probability for discrete change of variable from 0 to 1. T-ratios pertain to underlying probit coefficients
* Specification includes dummy variables for every province (Punjab is the reference state). Detailed tables for all regressions,including for each province, are available upon request
a Reference group is Quintile I (Poorest)b Reference group is Urban Male
144
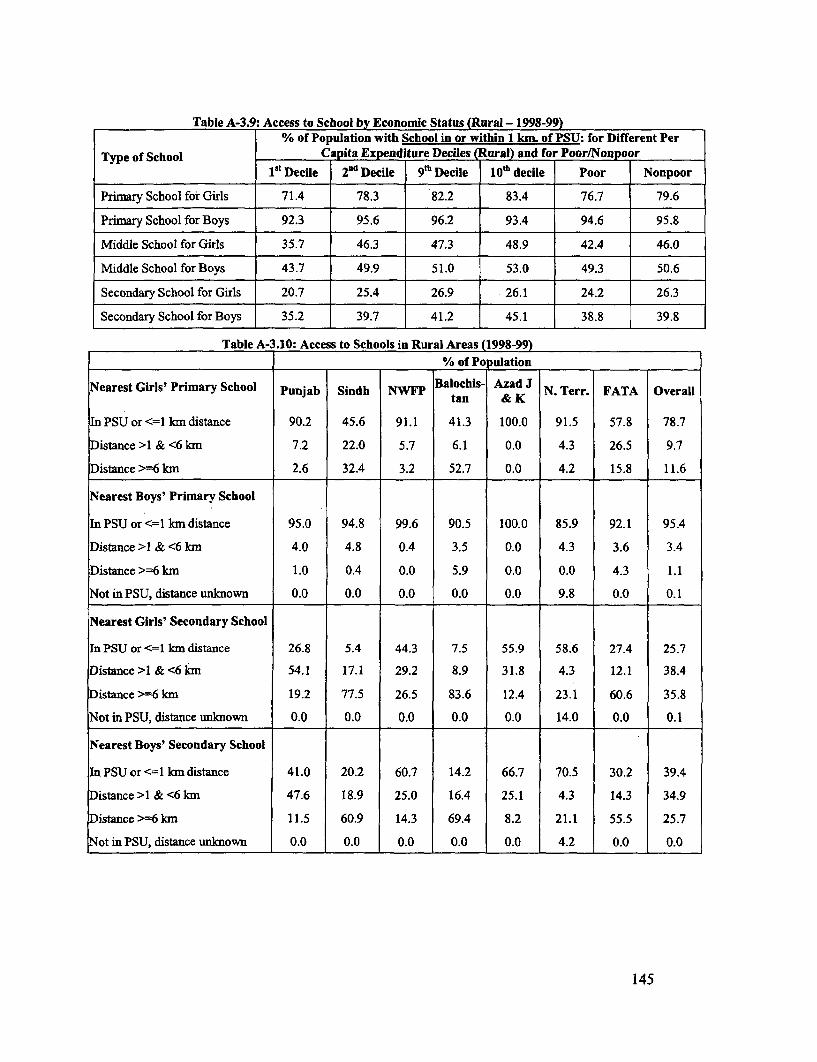
Table A-3.9: Access to School by Economic Status (Rural - 1998-99)% of Population with School in or within 1 km. of PSU: for Different Per
Type of School Capita Expend ture Deciles (Rural) and for Poor/Nonpoor1 5' Deeile 2nd Decile 9th Decile 10th decile Poor Nonpoor
Primary School for Girls 71.4 78.3 82.2 83.4 76.7 79.6
Primary School for Boys 92.3 95.6 96.2 93.4 94.6 95.8
Middle School for Girls 35.7 46.3 47.3 48.9 42.4 46.0
Middle School for Boys 43.7 49.9 51.0 53.0 49.3 50.6
Secondary School for Girls 20.7 25.4 26.9 26.1 24.2 26.3
Secondary School for Boys 35.2 39.7 41.2 45.1 38.8 39.8
Table A-3.10: Access to Schools in Rural Areas (1998-99)% of Population
Nearest Girls' Primary School Punjab Sindh NWFP Balochis- Azad J N. Terr. FATA Overalltan & K
In PSU or <=I kn distance 90.2 45.6 91.1 41.3 100.0 91.5 57.8 78.7
Distance >1 & <6 km 7.2 22.0 5.7 6.1 0.0 4.3 26.5 9.7
Distance >=6 kn 2.6 32.4 3.2 52.7 0.0 4.2 15.8 11.6
Nearest Boys' Primary School
In PSU or <=1 Ian distance 95.0 94.8 99.6 90.5 100.0 85.9 92.1 95.4
Distance >1 & <6 kn 4.0 4.8 0.4 3.5 0.0 4.3 3.6 3.4
Distance >=6 km 1.0 0.4 0.0 5.9 0.0 0.0 4.3 1.1
Not in PSU, distance unknown 0.0 0.0 0.0 0.0 0.0 9.8 0.0 0.1
Nearest Girls' Secondary School
In PSU or <=1 In distance 26.8 5.4 44.3 7.5 55.9 58.6 27.4 25.7
Distance >1 & <6 kn 54.1 17.1 29.2 8.9 31.8 4.3 12.1 38.4
Distance >=6 km 19.2 77.5 26.5 83.6 12.4 23.1 60.6 35.8
Not in PSU, distance unknown 0.0 0.0 0.0 0.0 0.0 14.0 0.0 0.1
Nearest Boys' Secondary School
In PSU or <=1 kIn distance 41.0 20.2 60.7 14.2 66.7 70.5 30.2 39.4
Distance >1 & <6 km 47.6 18.9 25.0 16.4 25.1 4.3 14.3 34.9
Distance >=6 km 11.5 60.9 14.3 69.4 8.2 21.1 55.5 25.7
Not in PSU, distance unknown 0.0 0.0 0.0 0.0 0.0 4.2 0.0 0.0
145
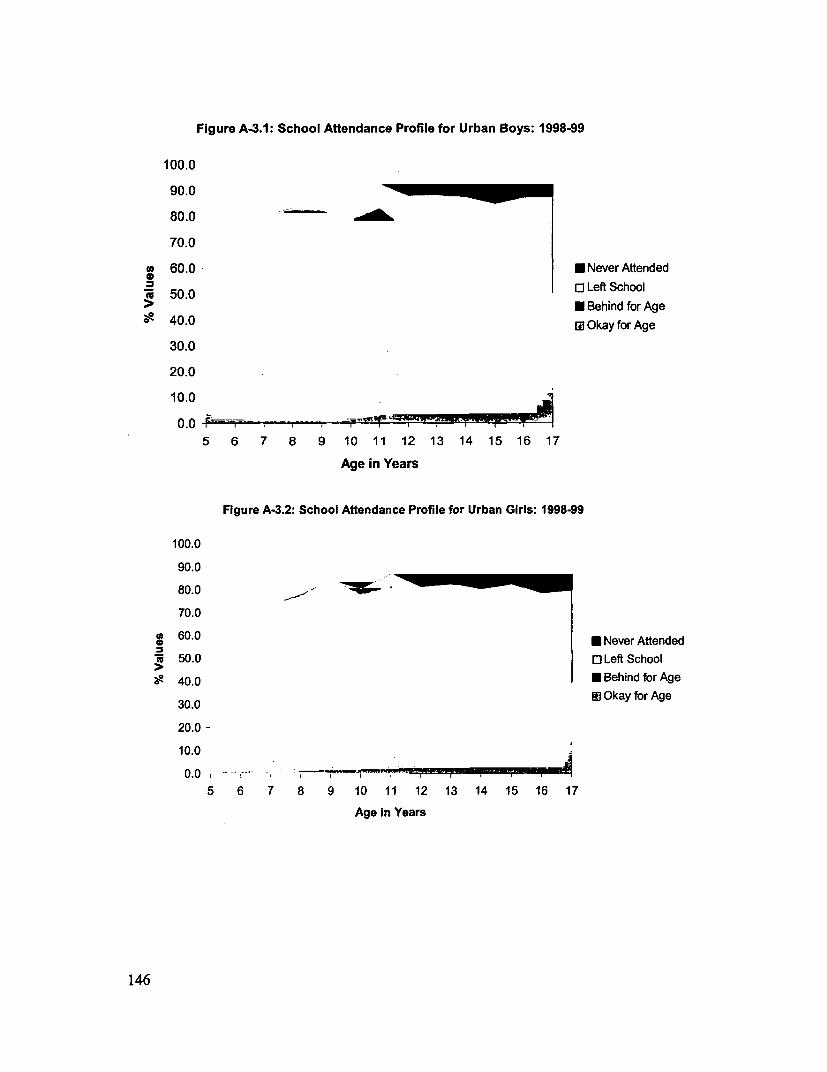
Figure A-3.1: School AKtendance Profile for Urban Boys: 1998-99
100.0
90.0
80.0 _
70.0
u 60.0 * Never Attended
0 Left School50.0 * Behind for Age
$ 40.0 al Okay for Age
30.0
20.0
10.0
0.0 5 6 7 8 9 10 11 12 13 14 15 16 17
Age in Years
Figure A-3.2: School Attendance Profile for Urban Girls: 1998-99
100.0
90.0
80.0
70.0
60.0 Never Attended
( 50.0 0 Left School
a 40.0 * Behind for Age
30.0 W Okay for Age
20.0 -
10.0
0.0 -
5 6 7 8 9 10 11 12 13 14 15 16 17
Age in Years
146
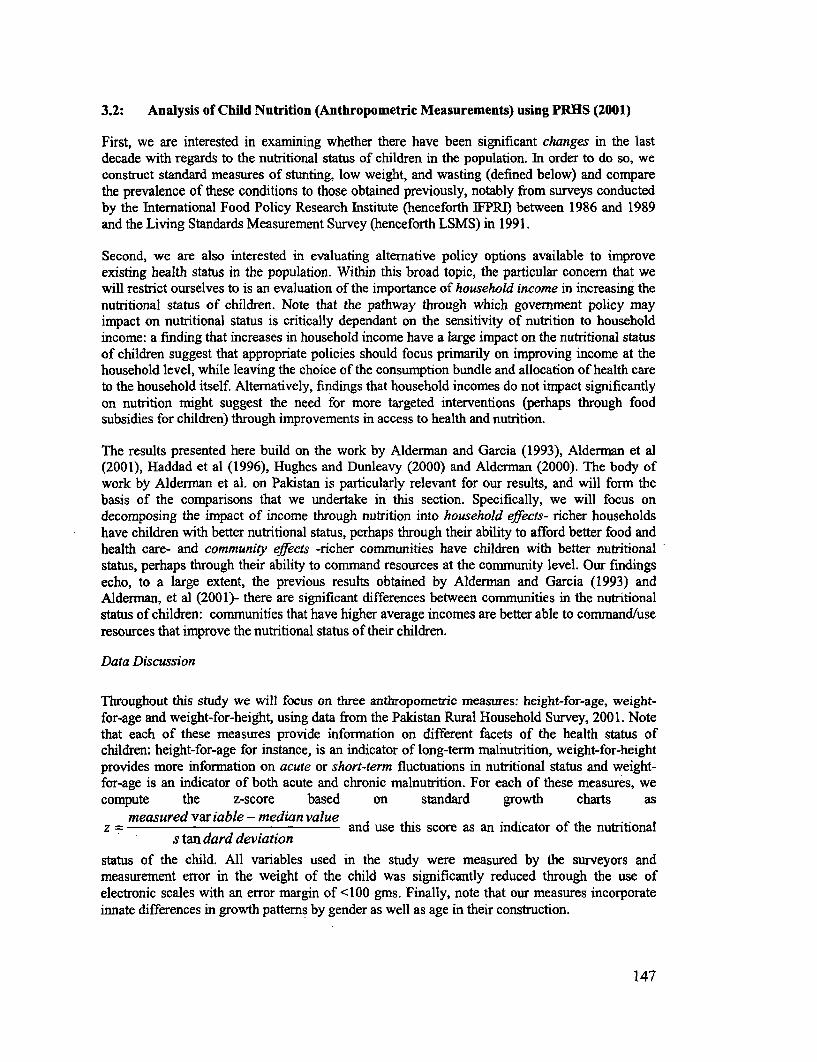
3.2: Analysis of Child Nutrition (Anthropometric Measurements) using PRHS (2001)
First, we are interested in examining whether there have been significant changes in the lastdecade with regards to the nutritional status of children in the population. In order to do so, weconstruct standard measures of stunting, low weight, and wasting (defined below) and comparethe prevalence of these conditions to those obtained previously, notably from surveys conductedby the International Food Policy Research Institute (henceforth IFPRI) between 1986 and 1989and the Living Standards Measurement Survey (henceforth LSMS) in 1991.
Second, we are also interested in evaluating alternative policy options available to improveexisting health status in the population. Within this broad topic, the particular concern that wewill restrict ourselves to is an evaluation of the importance of household income in increasing thenutritional status of children. Note that the pathway through which government policy mayimpact on nutritional status is critically dependant on the sensitivity of nutrition to householdincome: a finding that increases in household income have a large impact on the nutritional statusof children suggest that appropriate policies should focus primarily on improving income at thehousehold level, while leaving the choice of the consumption bundle and allocation of health careto the household itself. Alternatively, findings that household incomes do not impact significantlyon nutrition might suggest the need for more targeted interventions (perhaps through foodsubsidies for children) through improvements in access to health and nutrition.
The results presented here build on the work by Alderman and Garcia (1993), Alderman et al(2001), Haddad et al (1996), Hughes and Dunleavy (2000) and Alderman (2000). The body ofwork by Alderman et al. on Pakistan is particularly relevant for our results, and will form thebasis of the comparisons that we undertake in this section. Specifically, we will focus ondecomposing the impact of income through nutrition into household effects- richer householdshave children with better nutritional status, perhaps through their ability to afford better food andhealth care- and community effects -richer communities have children with better nutritionalstatus, perhaps through their ability to command resources at the community level. Our findingsecho, to a large extent, the previous results obtained by Alderman and Garcia (1993) andAlderman, et al (2001)- there are significant differences between communities in the nutritionalstatus of children: communities that have higher average incomes are better able to command/useresources that improve the nutritional status of their children.
Data Discussion
Throughout this study we will focus on three anthropometric measures: height-for-age, weight-for-age and weight-for-height, using data from the Palistan Rural Household Survey, 2001. Notethat each of these measures provide information on different facets of the health status ofchildren: height-for-age for instance, is an indicator of long-term malnutrition, weight-for-heightprovides more information on acute or short-term fluctuations in nutritional status and weight-for-age is an indicator of both acute and chronic malnutrition. For each of these measures, wecompute the z-score based on standard growth charts as
z measured variable - median value and use this score as an indicator of the nutritionals tan dard deviation
status of the child. All variables used in the study were measured by the surveyors andmeasurement error in the weight of the child was significantly reduced through the use ofelectronic scales with an error margin of <100 gms. Finally, note that our measures incorporateinnate differences in growth patterns by gender as well as age in their construction.
147
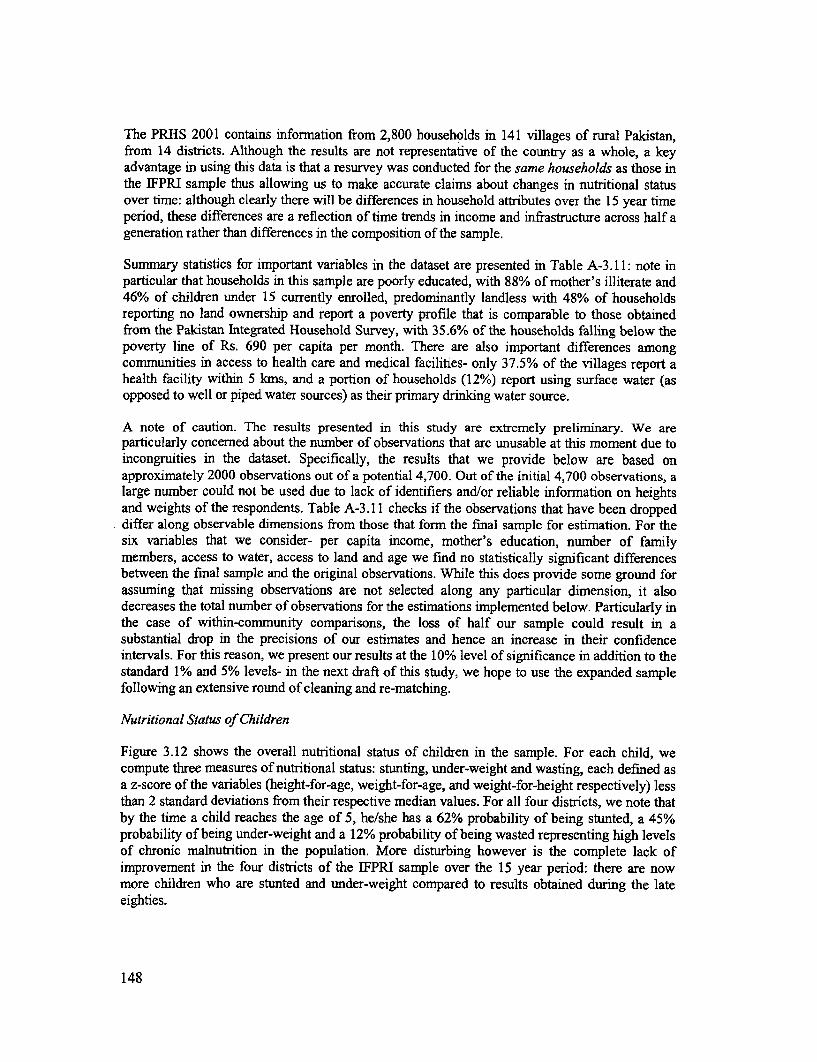
The PRHS 2001 contains information from 2,800 households in 141 villages of rural Pakistan,from 14 districts. Although the results are not representative of the country as a whole, a keyadvantage in using this data is that a resurvey was conducted for the same households as those inthe IFPRI sample thus allowing us to make accurate claims about changes in nutritional statusover time: although clearly there will be differences in household attributes over the 15 year timeperiod, these differences are a reflection of time trends in income and infrastructure across half ageneration rather than differences in the composition of the sample.
Summary statistics for important variables in the dataset are presented in Table A-3. 11: note inparticular that households in this sample are poorly educated, with 88% of mother's illiterate and46% of children under 15 currently enrolled, predominantly landless with 48% of householdsreporting no land ownership and report a poverty profile that is comparable to those obtainedfrom the Pakistan Integrated Household Survey, with 35.6% of the households falling below thepoverty line of Rs. 690 per capita per month. There are also important differences amongcommunities in access to health care and medical facilities- only 37.5% of the villages report ahealth facility within 5 kms, and a portion of households (12%) report using surface water (asopposed to well or piped water sources) as their primary drinking water source.
A note of caution. The results presented in this study are extremely preliminary. We areparticularly concerned about the number of observations that are unusable at this moment due toincongruities in the dataset. Specifically, the results that we provide below are based onapproximately 2000 observations out of a potential 4,700. Out of the initial 4,700 observations, alarge number could not be used due to lack of identifiers and/or reliable information on heightsand weights of the respondents. Table A-3.11 checks if the observations that have been droppeddiffer along observable dimensions from those that form the final sample for estimation. For thesix variables that we consider- per capita income, mother's education, number of familymembers, access to water, access to land and age we find no statistically significant differencesbetween the final sample and the original observations. While this does provide some ground forassuming that missing observations are not selected along any particular dimension, it alsodecreases the total number of observations for the estimations implemented below. Particularly inthe case of within-community comparisons, the loss of half our sample could result in asubstantial drop in the precisions of our estimates and hence an increase in their confidenceintervals. For this reason, we present our results at the 10% level of significance in addition to thestandard 1% and 5% levels- in the next draft of this study, we hope to use the expanded samplefollowing an extensive round of cleaning and re-matching.
Nutritional Status of Children
Figure 3.12 shows the overall nutritional status of children in the sample. For each child, wecompute three measures of nutritional status: stunting, under-weight and wasting, each defined asa z-score of the variables (height-for-age, weight-for-age, and weight-for-height respectively) lessthan 2 standard deviations from their respective median values. For all four districts, we note thatby the time a child reaches the age of 5, he/she has a 62% probability of being stunted, a 45%probability of being under-weight and a 12% probability of being wasted representing high levelsof chronic malnutrition in the population. More disturbing however is the complete lack ofimprovement in the four districts of the IFPRI sample over the 15 year period: there are nowmore children who are stunted and under-weight compared to results obtained during the lateeighties.
148
While the aggregated statistics provide an overview of childhood nutrition in Pakistan, they also
hide a significant amount of variation among the provinces. Table A-3.12 disaggregates each of
these measures by province and age in order to explore this variation further. We find that among
the four provinces surveyed, Balochistan and Sindh report the worst results, while Punjab and
NVWFP do significantly better in terms of weight-for-age and to a lesser extent, for height-for-age
as well. Interestingly however, weight-for-height results do not follow the same patterns with
Punjab reporting less than the 5% one would expect from a normally distributed variable, and
Sindh and NWFP reporting the highest proportion (14.6% and 12.1% respectively) among the
four provinces. Although it is hard to identify why this is so, one potential explanation is a
region-specific shock, such as a poor harvest that differentially impacted on these four provinces
immediately preceding the survey.
Table A-3.12 also shows the impact of age on the z-score of the child. From the table it appears
that there is a significant decline in the nutritional status of the child between birth and 2 years,
followed by a slight improvement. This relationship between the nutritional status and the age of
the child is confirmed in Figure 3.13, which show the z-scores of height-for-age, weight-for-age
and weight-for-height in the PRHS sample. As with Alderman and Garcia (1993), we find that
chronic malnutrition as measured through the z-scores of height-for-age and weight-for-age starts
early in childhood with the z-score dropping rapidly from one standard deviation below the
median (weight-for-age) and 1.5 standard deviations below the median (height-for-age) to longer
term values of between 2 and 1.5 standard deviations below (weight-for-age) and between 3 and
2.5 standard deviations below the median for height-for-age by the second year of the child. Our
findings at the cross-sectional level are in accordance with research from other countries that
show the importance of nutrition in early childhood and the relative inefficacy of interventions
beyond the second year of the child.
For instance, a number of studies now show that poor nutrition in early childhood has lasting
repercussions for the productive work-life of the adult: a longitudinal study in Guatemala
reported in Martorell et al. (1990 and 1995) showed that while supplements in the first two years
of the childhood had significant impacts on adolescent intelligence and adult work-capacity,
interventions during the later childhood years did not have any such benefits. These findings
reiterate the significance of policies that advocate targeted nutritional programs during pregnancy
and early childhood years: in areas with poor catch-up growth and in the presence of cumulativeeffects of poor early nutrition on long run growth, childhood nutrition programs can impact
powerfully on income growth through their impact on morbidity and future work capacity
(Scrimshaw, 1995).
The Figure A-3.3 also shows that there are important differences between the four provinces of
the study: while NWFP shows extremely strong catch-up growth with z-scores improving from
an average of less than -2.5 in the second year to an average of -1.5 in the 5 h year, Balochistan
shows a steep drop to -3.5 in the 2nd year, followed by fluctuations around this level till the 5h
year of the child. At this stage, we provide no explanations for why these provinces differ in the
growth pattern over the first 5 years of childhood, but these results point towards the need for a
more thorough enquiry into the inter-regional differences among provinces in the country.
Interestingly however, the gender of the child, which is typically important in several economic
variables (particularly enrollment) does not seem to lead to statistically significant differences in
nutritional status. As Figure A.3-4 shows, all three measures of nutritional status show similar
trends and levels, and are even slightly biased towards girls compared to boys. One potential
explanation for this result could be selection in the sample induced by higher mortality among
149
young girls compared to boys: if it is the case that infant mortality among girls is significantlyhigher, the sample of children observed for each cohort will select on 'more-healthy' girlscompared to boys, and this could lead us to (erroneously) conclude that there is no genderdiscrimination in nutrition status in our sample. While this is currently under investigation, at thispoint we are unable to say whether such patterns exist in the infant mortality data.
The basic description of our sample with regard to the nutritional status of children under sixprovides considerable information, both about changes over time and differences across provincesin Palistan. To summarize, we find that:
1. The anthropometric status of children in the population is indicative of chronic nutritionaldeficiencies, with half of the sample classified as 'stunted' or 'underweight'.
2. There are significant differences between provinces with Balochistan and Sindh reportingthe poorest nutritional levels, and NWFP reporting the highest.
3. Discouragingly, over the last 15 years there seems to have been almost no change in thenutritional status of children. Comparisons for the same households as those surveyedunder the IFPRI panel survey in 1986-89 show no significant differences, either in theheight or weight status of the child as measured through stunted and under-weightchildren.
4. As with the IFPRI panel, we find strong age effects for the nutritional status of the child:anthropometric measures decline steadily through the first two years of childhood, andthen remain steady (or improve slightly) around their long-term averages of 2.41 standarddeviations below the median (height-for-age) and 1.77 standard deviations below themedian (weight-for-age).
5. As opposed to chronic nutritional deficiencies, short-term nutritional problems asmeasured through weight-for-height do not seem to be severe. In Punjab and Balochistan,the number of wasted children follows the distributional norm, and although the numbersare slightly higher for NWFP and Sindh, they are still within reasonable bounds. Theseresults match up with those reported by Alderman and Garcia (1993) for the IFPRIsurvey.
The description we have provided so far points towards an important policy implication regardingthe implementation of targeted childhood nutrition programs during pregnancy and earlychildhood, that could improve the long term nutritional status of the child. In the next section, wenow turn to an analysis of the determinants of nutritional status, with a particular emphasis on therole of income. As argued previously, the sensitivity of nutritional status to household income iscritical for the targeting of policy programs: high sensitivity would argue for the placement ofprograms that generate more income for households, while the converse would argue for theplacement of programs that may be orthogonal to income with greater concentration of othercorrelates of nutritional status.
Nutritional Status and Household Expenditure
Figure 3.14 plots the impact of a measure of household income (as measured through householdconsumption expenditure) on the three measures that we are using as proxies for the nutritionalstatus of the child. For all three, we find a significant positive correlation with income: anincrease in the log of per-capita income from 6 to 9 improves the z-score of height-for-age by Istandard deviation and the z-scores of weight-for-age and weight-for-height by over 1.5 standarddeviations. In itself, these graphs would present strong conditional evidence for the importance ofthe economic status of the household for the well-being of the child. Note however, that in itself
150
these correlates do not allow us to draw any causal implications regarding the importance ofeconomic status in the determinant of childhood nutrition. In particular, there are two issues thatwe may be concerned about:
1. We may be concemed that average income in the community impacts on the nutritionalstatus of the child through other resources that the community may be able to command.For instance, it is entirely possible that richer communities are better able to implementnutritional programs/ensure higher quality medical care than poorer communities. In thiscase, what may look like a positive relationship between household income andnutritional status may be masking the true underlying determinant at the community levelsuch as better nutrition or sanitary provisions.
2. We may also be concerned about the endogenous nature of income at the householdlevel: households may differ in inherent characteristics such as 'entrepreneurship' that iscorrelated positively to both the economic status of the household, and to the well-beingof the child. For instance, entrepreneurial households may use more advance productiontechniques on their farms, but may also be more up-to-date with the benefits of earlychildhood nutrition for the child. In this case, income would proxy for an underlyingcharacteristic at the household level that is causally linked to better nutritional outcomesfor the child.
In the exercise below, we address the first of the problems, but not the second. Specifically, weexarmine whether there are attributes of communities that cause them to differ systematically inthe treatment of their children. Doing so yields surprising results that we discuss in some detail,with special emphasis on their policy implications.
For this exercise, we estimate four different model specifications, based on a reduced formhousehold maximization program as in Alderman, et al. (2001). For the first model, we estimateOrdinary Least Squares (OLS) with the z-score of all three measures as the dependant variable.Apart from the log of per capita income, we also control for child-specific characteristics, such asage and gender; household specific characteristics such as water source, land ownership andeducation of the mother, and community characteristics such as distance from the closest healthcenter. As a comparison to previous work in Pakistan, we also present results for the 4 districtsfrom the lFPRI sample, and compare them to results obtained previously. Since we are using thelog of per capita expenditure, we may be concerned that measurement error in this variable wouldbias our coefficients downwards due to an increase in the overall variance of the regression. Todeal with this attenuation bias, we present a second estimation using household assets asinstruments for consumption expenditure.
Our third model then introduces community fixed effects in the model. By doing so, we implicitlyargue that there may be attributes of communities that determine the nutritional status of thechild, and that may be correlated positively with income (since from the graphs, there is a positiverelationship between expenditure and z-scores). Finally, we present the same estimation withinstrumentation in model 4.
The results from these estimations are presented in Table A-3.13a,b and c. For both'height andweight-for-age, we find that the OLS estimates of log per capita income are significant andpositive, particularly so in the case of the four IFPRI districts. Further, the gradient of the z-scorewith expenditure increases substantially once we instrument consumption expenditure withhousehold assets. Specifically, in the case of height-for-age, a one standard deviation increase inlog per capita income improves the z-score of a child at the mean of the sample by 0.23 (0.11 for
151
OLS) and for weight-for-age by 0.14 (0.11 for OLS) at the mean of the sample. The results forthe IFPRI sample are far stronger, with equivalent numbers of 0.34 (0.18 for OLS) and 0.22 (0.12for OLS).
The estimation results from Model 3 and 4 show however that this strong relationship betweenincome and nutritional status, at least in the case of chronic malnutrition, is entirely driven bydifferences in the average per capita income across communities: richer communities have tallerand less underweight children, but once we control for the average per capita income of thecommunity, there is no impact of household expenditure on z-scores of height and weight-for-ageacross different households in the community. This implies that a child in a poor household in arich community will have a better nutritional status than a child in a rich household living in apoor community, pointing towards the presence of strong externality effects within communitiesin the child's well-being. Such results have been noted, both in Alderman, et al (2001) withregard to anthropometric and Hughes and Dunleavy (2000) for mortality data in Peru and Indiarespectively. One concern that we may have regarding this result is that it is an artifact of theincome characteristics of the sample: if most of the variation in income is across communities,then the lack of significance within communities could be indicative of the lack of variation,rather than the lack of a relationship. In our particular sample however, this is not a concern:decomposing the variation of income into within community and across community components,we find that over 70% of the variation in income is generated by within community differences,and less than 30% by differences across communities. In combination with our previous result,this provides strong evidence that most differences in nutritional status of children are driven bycommunity level rather than household level effects.
Community Level Characteristics: Health Facilities
At this stage, we might be interested in knowing more about what the community level fixedeffects proxy for. A reasonable hypothesis would be that that these community levelcharacteristics are a substitute for the availability of health facilities and services (see forinstance, Thomas, et al. (1992), with richer communities being in a better position to influencethe location of a health facility as well as ensure more regular, high quality operation compared toa poor village. From the OLS instrumented estimation in column 10 of Table A-3.13a, b, and c,we note that, at least as measured as distance to the closest facility, the presence (or not) of healthservices do not impact significantly on the nutritional status of the child. This leads us to worrythat what may matter for the well-being of a child is not the presence of a facility per se, but thepresence of a well-functioning facility close to the village.
Our preliminary results on this front shows that there are significant differences across facilitiesin the sample. We base these observations on the facility-level survey component of the PRHS, asa part of which facilities in the village were surveyed along with households. Due to this strategy,the total number of facilities in the sample are small, with only 12 Regional Health Centers(RHC's) and 38 BHIU's. In addition, it was found that record-keeping at the facility level was ofinsufficient quality to collect important data on availability of medicines and other processindicators. To depict at an anecdotal level the variation in the quality of the facility, we thus usethe number of OPD visits for a one year period (separated by month) for each of these facilities.
The figure in Box 3.6 shows the pattern of these visits for the median facility, for the average ofthe top 3 facilities, and for the average of the bottom 3 facilities. Note that both for the medianand the top 3 facilities visits follow a seasonal trend with declines during the winter months ofNovember to March and increases during the summer and monsoon months of April to October.
152
What is perhaps more striking however, is the vast difference in the number of visits across the
facilities: while the top 3 facilities regularly show more than 1,500 visits per month, the bottom 3
facilities consistently report 0 visits each month during the year preceding the survey. One
explanation could be that this graph actually captures variation within facilities as opposed to
variation across facilities: i.e., the number of OPD patients in each facility fluctuates with other
services (such as the availability of medicines) and hence the identity of the top 3 and the bottom
3 facilities changes across the sample period. The table in Box. 3.6 shows that this is not the case.
For each month, we see that less than 0.1 proportion of facilities change their relative ranking by
more than 4 points, and the standard deviation of each facilities rank is less than 2. These results
thus indicate that the health facilities in the sample differ considerably across communities, with
some facilities consistently catering to far higher OPD populations than others.
To a certain extent, these results could be due to the presence of health personnel in the facilities:
as Table 3.14 shows, better facilities tend to have a greater proportion of positions filled as a
fraction of positions sanctioned, although they have a lower proportion of personnel present over
positions filled. Apart from this, there seem to be no systematic differences across facilities in
terms of infrastructure: while the top facilities report more usable well water and more reliable
electricity, the differences remain insignificant in a sample of this size.
Conclusion
Both the discussion of the nutrition status of children and the state of health facilities in the
sample point towards the importance of effects at the community level in determining the health
status of the population. One way to disentangle this important effects would be to think of what
community level variables impact on the nutritional status of the child. Note however, that once
we include these fixed effects in our estimation, it is not possible to include any other variable
that does not vary within a community due to problems of multi-co linearity and thus the impact
of variables such as the average price of food, or the distance to the health facility can be included
in the estimation only if community fixed effects are removed. An altemative way to analyze the
differences between communities is to follow Islam (1995), in decomposing the fixed effect itself
with regard to various community level attributes. Figure A-3.5 presents the kemel densities of
the fixed effects for our three measures, and shows that there is significant variation across
communities. To decompose these fixed effects, we would use the estimated fixed effects from
the first stage regression as a dependent variable in the second-stage regression, with conmnunity
level variables as the relevant regressors, and this remains the focus of our continuing enterprise.
153
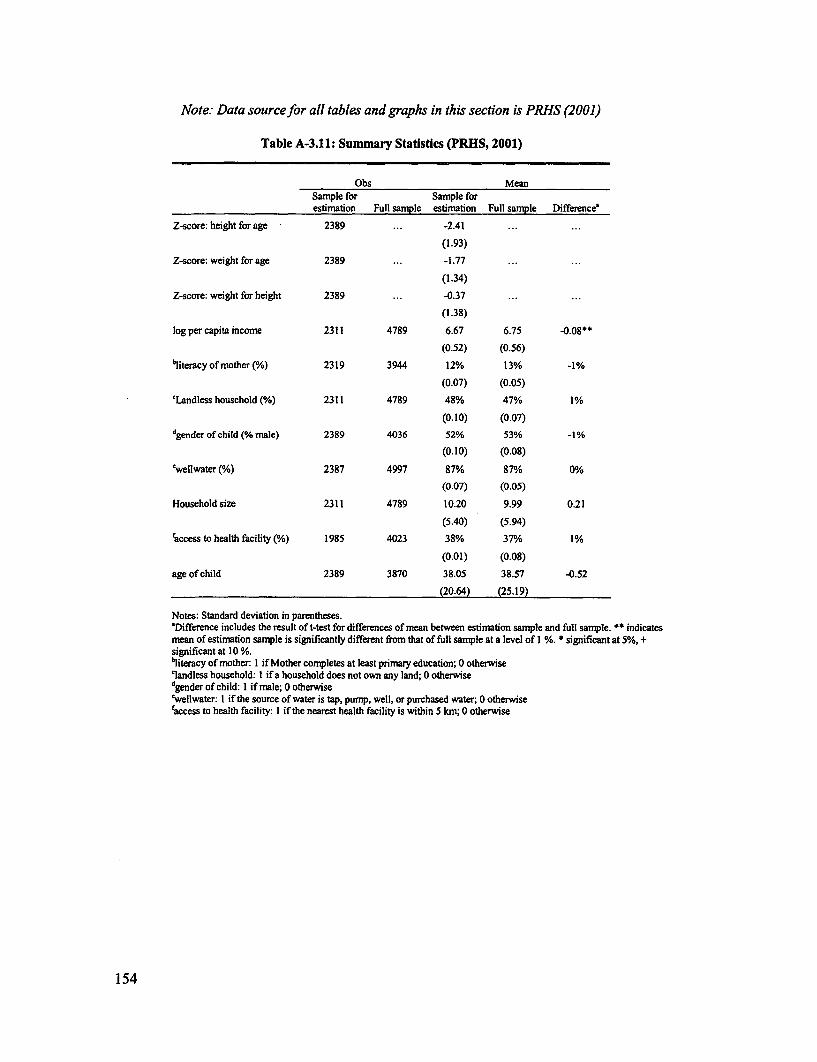
Note: Data source for all tables and graphs in this section is PRHS (2001)
Table A-3.11: Summary Statistics (PRHS, 2001)
Obs MeanSample for Sample forestimnation Full sample estimation Full sample Difference'
Z-score: height for age 2389 ... -2.41 ... ...
(1.93)
Z-score: weight for age 2389 ... -1.77 ... ...
(1.34)
Z-score: weight for height 2389 ... -0.37
(1.38)
log per capita income 2311 4789 6.67 6.75 -0.08**
(0.52) (0.56)
bliteracyofTnother(%) 2319 3944 12% 13% -1%
(0.07) (0.05)
'Landless household (%) 2311 4789 48% 47% 1%
(0.10) (0.07)
dgender of child (% rnale) 2389 4036 52% 53% -1%
(0.10) (0.08)
'wellwater (%) 2387 4997 87% 87% 0%
(0.07) (0.05)
Household size 2311 4789 10.20 9.99 0.21
(5.40) (5.94)
raccess to health facility (%) 1985 4023 38% 37% 1%
(0.01) (0.08)
age of child 2389 3870 38.05 38.57 -0.52
(20.64) (25.19)
Notes: Standard deviation in parentheses.'Difference includes the result of t-test for differences of mean between estimation sample and full sample. * indicatesmean of estimation sample is significantly different from that of full sample at a level of I %. * significant at 5%, +significant at 10 %.bliteracy of mother: I if Mother cornpletes at least prinmry education; 0 otherwiselandless household: I if a household does not own any land; 0 otherwisedgender of child: I if male; 0 otherwise'wellwater: I if the source of water is tap, pumnp, well, or purchased water; 0 otherwisefaccess to health facility: I if the nearest health facility is within 5 km, 0 otherwise
154
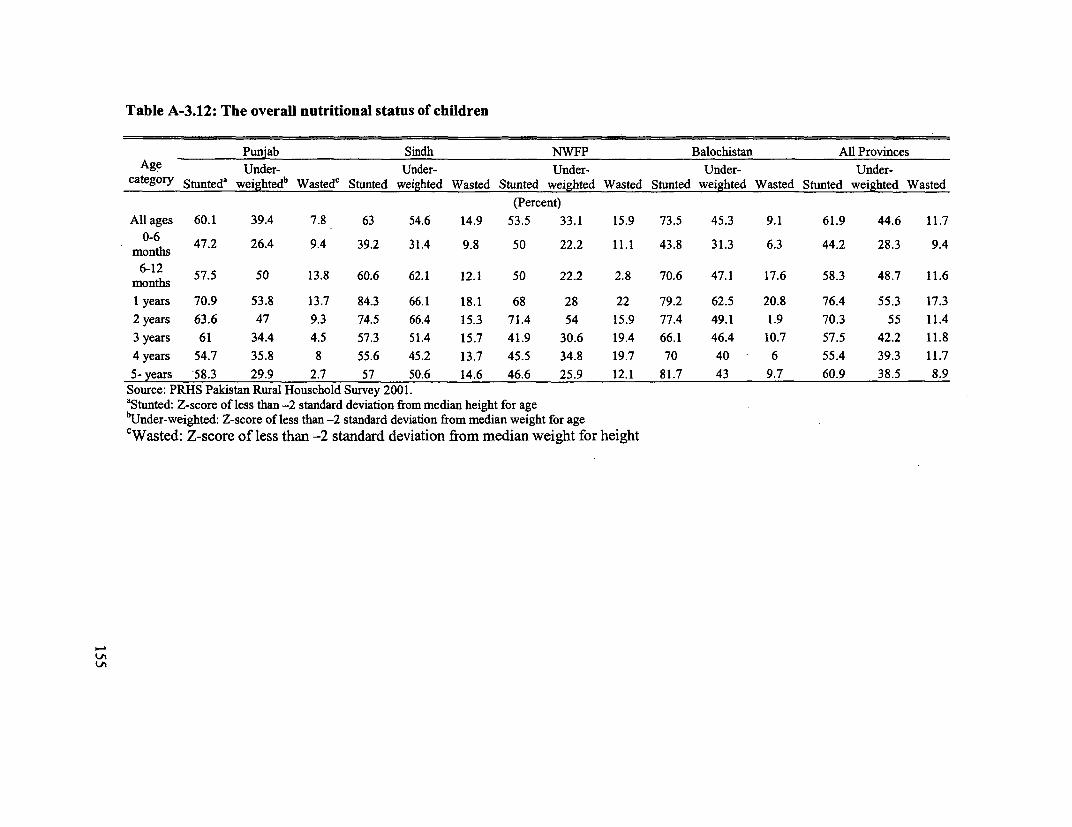
Table A-3.12: The overall nutritional status of children
Punjab Sindh NWFP Balochistan All ProvincesAge Under- Under- Under- Under- Under-
category Stunteda weightedb Wastedc Stunted weighted Wasted Stunted weighted Wasted Stunted weighted Wasted Stunted weighted Wasted
(Percent)
Allages 60.1 39.4 7.8 63 54.6 14.9 53.5 33.1 15.9 73.5 45.3 9.1 61.9 44.6 11.7
0-6 47.2 26.4 9.4 39.2 31.4 9.8 50 22.2 11.1 43.8 31.3 6.3 44.2 28.3 9.4months
6-12 57.5 50 13.8 60.6 62.1 12.1 50 22.2 2.8 70.6 47.1 17.6 58.3 48.7 11.6months1 years 70.9 53.8 13.7 84.3 66.1 18.1 68 28 22 79.2 62.5 20.8 76.4 55.3 17.3
2 years 63.6 47 9.3 74.5 66.4 15.3 71.4 54 15.9 77.4 49.1 1.9 70.3 55 11.4
3 years 61 34.4 4.5 57.3 51.4 15.7 41.9 30.6 19.4 66.1 46.4 10.7 57.5 42.2 11.8
4 years 54.7 35.8 8 55.6 45.2 13.7 45.5 34.8 19.7 70 40 6 55.4 39.3 11.7
5- years 58.3 29.9 2.7 57 50.6 14.6 46.6 25.9 12.1 81.7 43 9.7 60.9 38.5 8.9Source: PRHS Pakistan Rural Household Survey 2001.aStunted: Z-score of less than -2 standard deviation from median height for agebUnder-weighted: Z-score of less than -2 standard deviation from median weight for age
cWasted: Z-score of less than -2 standard deviation from median weight for height
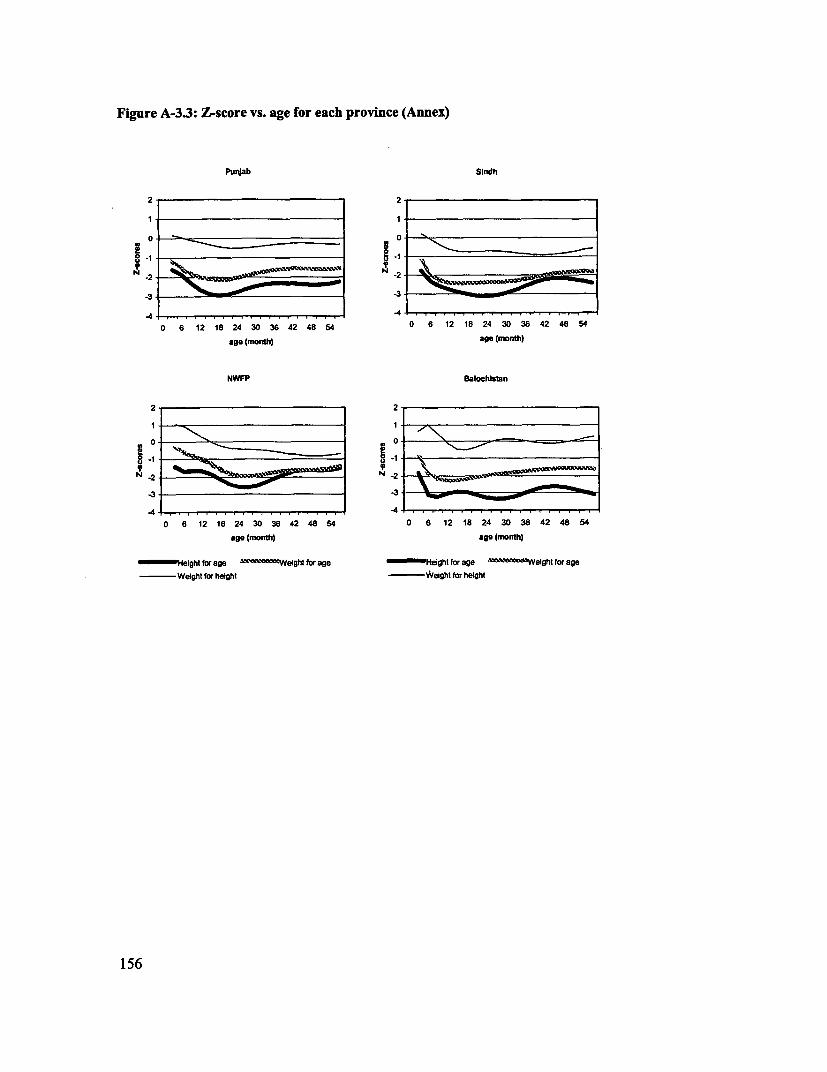
Figure A-3.3: Z-score vs. age for each province (Annex)
Punjab Sintdh
2 2
1 1
00
2 y-2
.3 -3
o 6 12 18 24 30 36 42 48 54 0 6 12 18 24 30 36 42 48 54age (nwoth) age (month)
NWFP Balochistan
2 2
I I l\
0-| -2 0 o 0
-3-N -2 ____________
-4 4.,. I.....
0 6 12 18 24 30 36 42 48 54 0 6 12 18 24 30 36 42 48 54age (month) age (month)
ght for age " eiW elght for age IHeight for age 0W eight for ageWeight for height - Weight for height
156
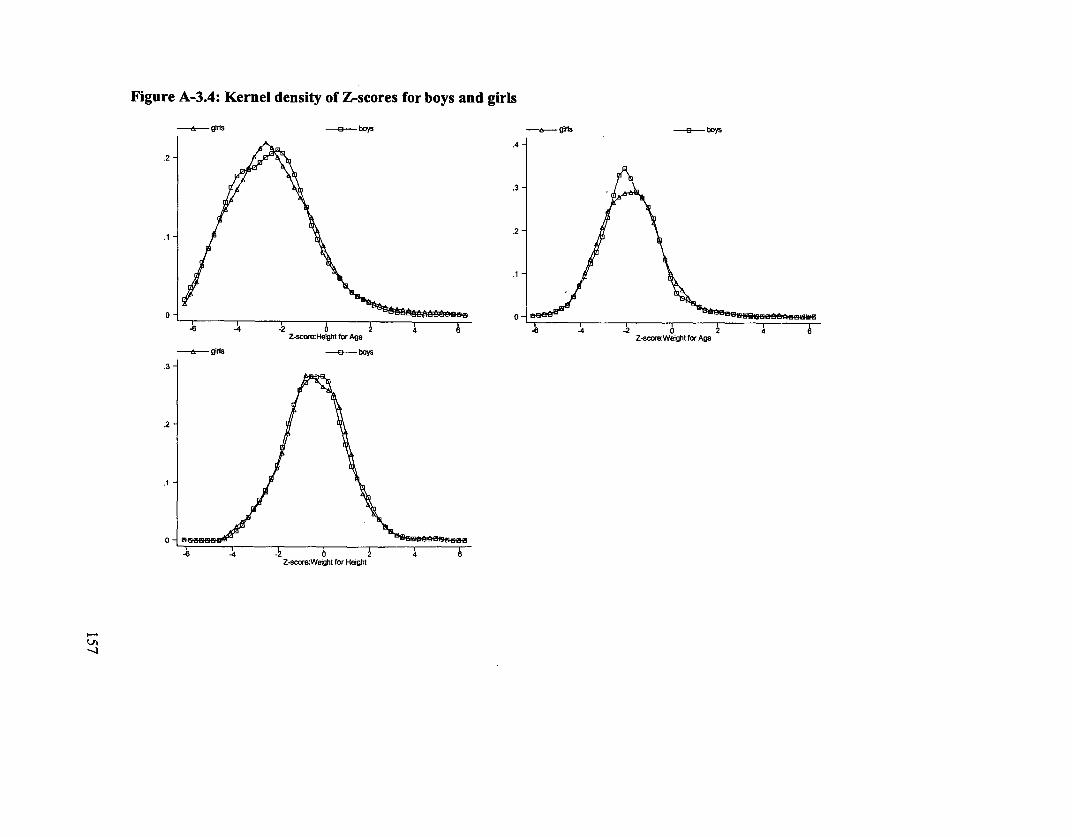
Figure A-3.4: Kernel density of Z-scores for boys and girls
----- girls ------ boys girls boys
.4-
.2-
Z-scorc:He!ght for Age Z-score:Weight for Age
girlts -E boyWs
.3 -
.2 -~~~~~~~~~~~~~~~~~~~~~~~~~~~~~~~~~.
.1-
- X -
Z-score:Weight for Height
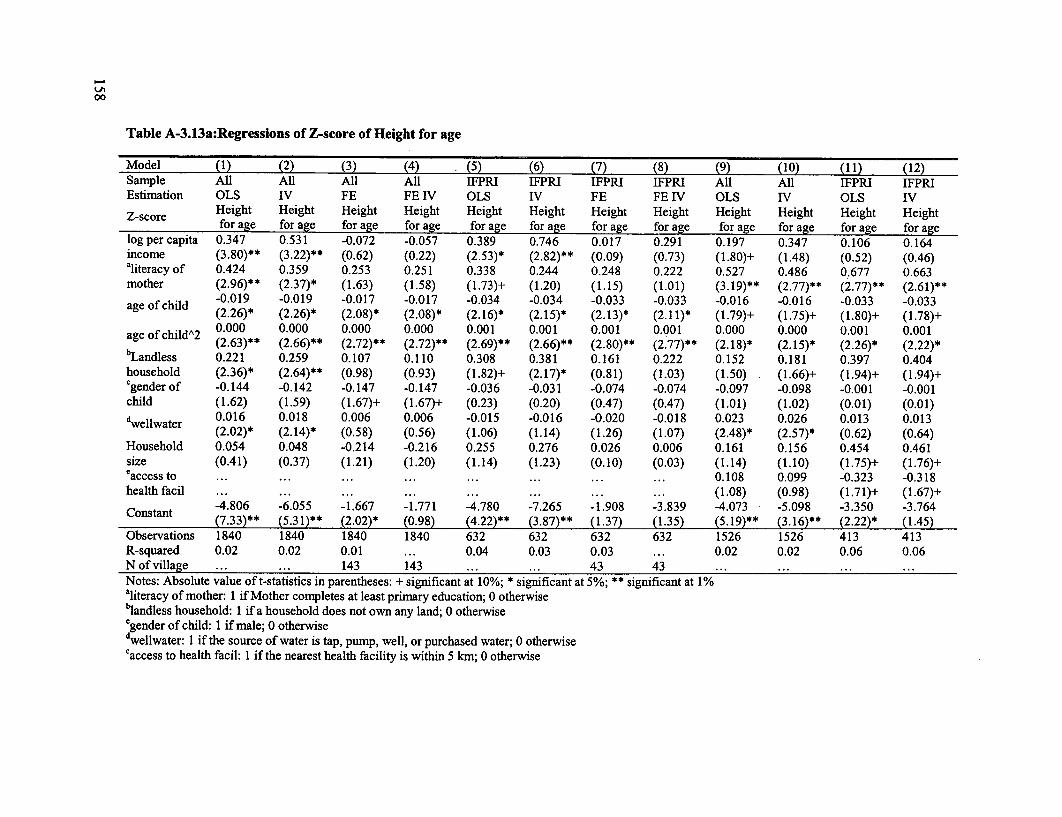
00
Table A-3.13a:Regressions of Z-score of Height for age
Model (1) (2) (3) (4) (5) (6) (7) (8) (9) (10) (11) (12)Sample All All All All IFPRI IFPRI IFPRI IFPRI All All IFPRI IFPRIEstimation OLS IV FE FE IV OLS IV FE FE IV OLS IV OLS IVZ-score Height Height Height Height Height Height Height Height Height Height Height Height
for age for age for age for age for age for age for age for age for age for age for age for agelog per capita 0.347 0.531 -0.072 -0.057 0.389 0.746 0.017 0.291 0.197 0.347 0.106 0.164income (3.80)** (3.22)** (0.62) (0.22) (2.53)* (2.82)** (0.09) (0.73) (1.80)+ (1.48) (0.52) (0.46)aliteracy of 0.424 0.359 0.253 0.251 0.338 0.244 0.248 0.222 0.527 0.486 0.677 0.663mother (2.96)** (2.37)* (1.63) (1.58) (1.73)+ (1.20) (1.15) (1.01) (3.19)** (2.77)** (2.77)** (2.61)**a eofchild -0.019 -0.019 -0.017 -0.017 -0.034 -0.034 -0.033 -0.033 -0.016 -0.016 -0.033 -0.033
age ofchild (2.26)* (2.26)* (2.08)* (2.08)* (2.16)* (2.15)* (2.13)* (2.1 1)* (1.79)+ (1.75)+ (1.80)+ (1.78)+of 0hild 2 000 0.000 0.000 0.000 0.001 0.001 0.001 0.001 0.000 0.000 0.001 0.001
(2.63)** (2.66)** (2.72)** (2.72)** (2.69)** (2.66)** (2.80)** (2.77)** (2.18)* (2.15)* (2.26)* (2.22)*bLandless 0.221 0.259 0.107 0.110 0.308 0.381 0.161 0.222 0.152 0.181 0.397 0.404household (2.36)* (2.64)** (0.98) (0.93) (1.82)+ (2.17)* (0.81) (1.03) (1.50) (1.66)+ (1.94)+ (1.94)+Cgender of -0.144 -0.142 -0.147 -0.147 -0.036 -0.031 -0.074 -0.074 -0.097 -0.098 -0.001 -0.001child (1.62) (1.59) (1.67)+ (1.67)+ (0.23) (0.20) (0.47) (0.47) (1.01) (1.02) (0.01) (0.01)dwellwater 0.016 0.018 0.006 0.006 -0.015 -0.016 -0.020 -0.018 0.023 0.026 0.013 0.013
(2.02)* (2.14)* (0.58) (0.56) (1.06) (1.14) (1.26) (1.07) (2.48)* (2.57)* (0.62) (0.64)Household 0.054 0.048 -0.214 -0.216 0.255 0.276 0.026 0.006 0.161 0.156 0.454 0.461size (0.41) (0.37) (1.21) (1.20) (1.14) (1.23) (0.10) (0.03) (1.14) (1.10) (1.75)+ (1.76)+'access to ... ... ... ... ... ... ... ... 0.108 0.099 -0.323 -0.318health facil ... ... ... ... ... ... ... (1.08) (0.98) (1.71)+ (1.67)+
-4.806 -6.055 -1.667 -1.771 -4.780 -7.265 -1.908 -3.839 -4.073 -5.098 -3.350 -3.764Constant (7.33)** (5.31)** (2.02)* (0.98) (4.22)** (3.87)** (1.37) (1.35) (5.19)** (3.16)** (2.22)* (1.45)Observations 1840 1840 1840 1840 632 632 632 632 1526 1526 413 413R-squared 0.02 0.02 0.01 ... 0.04 0.03 0.03 ... 0.02 0.02 0.06 0.06N of village ... ... 143 143 ... ... 43 43 ... ... ... ...Notes: Absolute value of t-statistics in parentheses: + significant at 10%; * significant at 5%; ** significant at 1%aliteracy of mother: 1 if Mother completes at least primary education; 0 otherwise"landless household: I if a household does not own any land; 0 otherwiseCgender of child: 1 if male; 0 otherwisedwellwater: I if the source of water is tap, pump, well, or purchased water; 0 otherwiseeaccess to health facil: 1 if the nearest health facility is within 5 kin; 0 otherwise
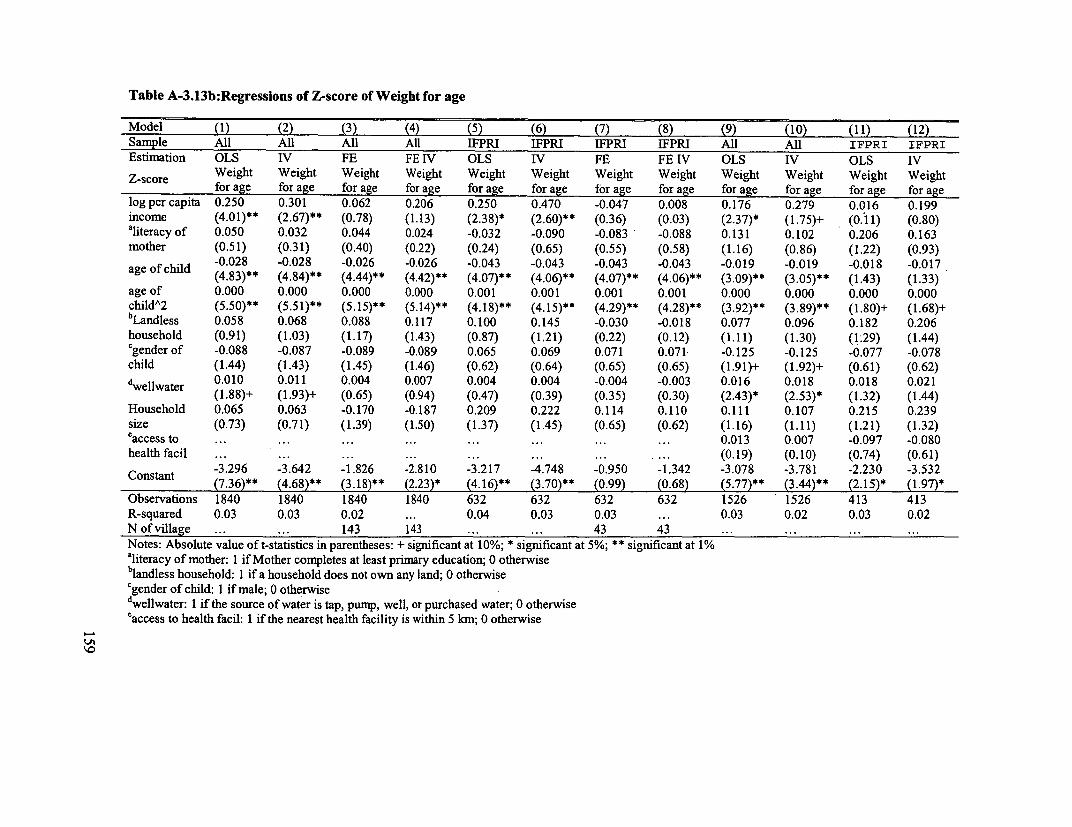
Table A-3.13b:Regressions of Z-score of Weight for age
Model (1) (2) (3) (4) (5) (6) (7) (8) (9) (10) (11) (12)Sarnple All All All AU IFPRI IFPRI IFPRI IFPRI All All IFPRI IFPRI
Estimation OLS IV FE FE IV OLS IV FE FE IV OLS IV OLS IV
Z-score Weight Weight Weight Weight Weight Weight Weight Weight Weight Weight Weight Weightfor age for age for age for age for age for age for age for age for age for age for age for age
log per capita 0.250 0.301 0.062 0.206 0.250 0.470 -0.047 0.008 0.176 0.279 0.016 0.199income (4.01)** (2.67)** (0.78) (1.13) (2.38)* (2.60)** (0.36) (0.03) (2.37)* (1.75)+ (0.11) (0.80)aliteracyof 0.050 0.032 0.044 0.024 -0.032 -0.090 -0.083 -0.088 0.131 0.102 0.206 0.163mother (0.51) (0.31) (0.40) (0.22) (0.24) (0.65) (0.55) (0.58) (1.16) (0.86) (1.22) (0.93)
-0.028 -0.028 -0.026 -0.026 -0.043 -0.043 -0.043 -0.043 -0.019 -0.019 -0.018 -0.017age of child (4.83)** (4.84)** (4.44)** (4.42)** (4.07)** (4.06)** (4.07)** (4.06)** (3.09)** (3.05)** (1.43) (1.33)
age of 0.000 0.000 0.000 0.000 0.001 0.001 0.001 0.001 0.000 0.000 0.000 0.000child^2 (5.50)** (5.51)** (5.15)** (5.14)** (4.18)** (4.15)** (4.29)** (4.28)** (3.92)** (3.89)** (1.80)+ (1.68)+bLandless 0.058 0.068 0.088 0.117 0.100 0.145 -0.030 -0.018 0.077 0.096 0.182 0.206household (0.91) (1.03) (1.17) (1.43) (0.87) (1.21) (0.22) (0.12) (1.11) (1.30) (1:29) (1.44)Cgender of -0.088 -0.087 -0.089 -0.089 0.065 0.069 0.071 0.071 -0.125 -0.125 -0.077 -0.078child (1.44) (1.43) (1.45) (1.46) (0.62) (0.64) (0.65) (0.65) (1.91)+ (1.92)+ (0.61) (0.62)dwellwater 0.010 0.011 0.004 0.007 0.004 0.004 -0.004 -0.003 0.016 0.018 0.018 0.021
(1.88)+ (1.93)+ (0.65) (0.94) (0.47) (0.39) (0.35) (0.30) (2.43)* (2.53)* (1.32) (1.44)Household 0.065 0.063 -0.170 -0.187 0.209 0.222 0.114 0.110 0.111 0.107 0.215 0.239size (0.73) (0.71) (1.39) (1.50) (1.37) (1.45) (0.65) (0.62) (1.16) (1.11) (1.21) (1.32)eaccess to ... ... ... ... ... ... ... ... 0.013 0.007 -0.097 -0.080health facil ... ... ... ... ... ... ... (0.19) (0.10) (0.74) (0.61)
-3.296 -3.642 -1.826 -2.810 -3.217 -4.748 -0.950 -1.342 -3.078 -3.781 -2.230 -3.532Constant (7.36)** (4.68)** (3.18)** (2.23)* (4.16)** (3.70)** (0.99) (0.68) (5.77)** (3.44)** (2.15)* (1.97)*
Observations 1840 1840 1840 1840 632 632 632 632 1526 1526 413 413R-squared 0.03 0.03 0.02 ... 0.04 0.03 0.03 ... 0.03 0.02 0.03 0.02N of village ... ... 143 143 ... ... 43 43 ... ... ... ...Notes: Absolute value of t-statistics in parentheses: + significant at 10%; * significant at 5%; ** significant at 1%'literacy of mother: 1 if Mother completes at least primnary education; 0 otherwiseblandless household: I if a household does not own any land; 0 otherwiseCgender of child: I if male; 0 otherwisedwellwater: I if the source of water is tap, pump, well, or purchased water; 0 otherwiseeaccess to health facil: I if the nearest health facility is within 5 km; 0 otherwise
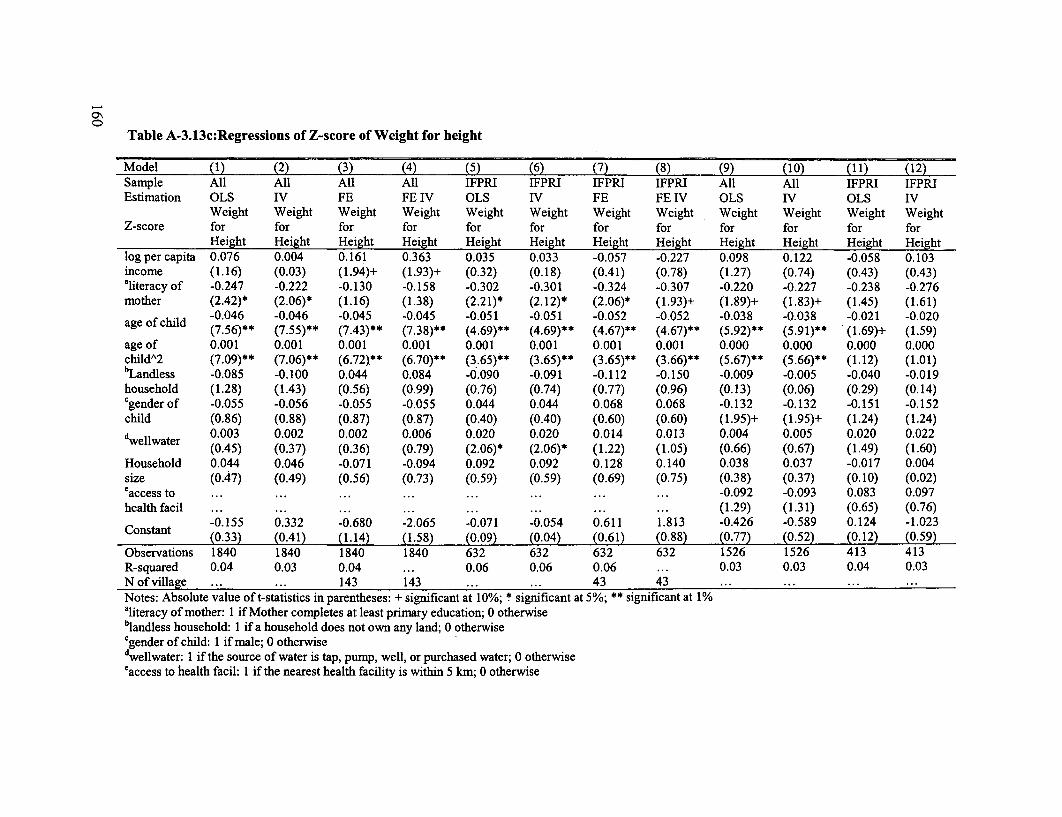
j
Table A-3.13c:Regressions of Z-score of Weight for height
Model (1) (2) (3) (4) (5) (6) (7) (8) (9) (10) (11) (12)Sample All All All All IFPRI IFPRI IFPRI IFPRI All All IFPRI IFPRIEstimation OLS IV FE FE IV OLS IV FE FE IV OLS IV OLS IV
Weight Weight Weight Weight Weight Weight Weight Weight Weight Weight Weight WeightZ-score for for for for for for for for for for for for
Height Height Height Height Height Height Height Height Height Height Height Heightlog per capita 0.076 0.004 0.161 0.363 0.035 0.033 -0.057 -0.227 0.098 0.122 -0.058 0.103income (1.16) (0.03) (1.94)+ (1.93)+ (0.32) (0.18) (0.41) (0.78) (1.27) (0.74) (0.43) (0.43)aliteracy of -0.247 -0.222 -0.130 -0.158 -0.302 -0.301 -0.324 -0.307 -0.220 -0.227 -0.238 -0.276mother (2.42)* (2.06)* (1.16) (1.38) (2.21)* (2.12)* (2.06)* (1.93)+ (1.89)+ (1.83)+ (1.45) (1.61)
-0.046 -0.046 -0.045 -0.045 -0.051 -0.051 -0.052 -0.052 -0.038 -0.038 -0.021 -0.020age of child (7.56)** (7.55)** (7.43)** (7.38)** (4.69)** (4.69)** (4.67)** (4.67)** (5.92)** (5.91)** (1.69)+ (1.59)age of 0.001 0.001 0.001 0.001 0.001 0.001 0.001 0.001 0.000 0.000 0.000 0.000childA2 (7.09)** (7.06)** (6.72).** (6.70)** (3.65)** (3.65)** (3.65)** (3.66)** (5.67)** (5.66)** (1.12) (1.01)bLandless -0.085 -0.100 0.044 0.084 -0.090 -0.091 -0.112 -0.150 -0.009 -0.005 -0.040 -0.019household (1.28) (1.43) (0.56) (0.99) (0.76) (0.74) (0.77) (0.96) (0.13) (0.06) (0.29) (0.14)Cgender of -0.055 -0.056 -0.055 -0.055 0.044 0.044 0.068 0.068 -0.132 -0.132 -0.151 -0.152child (0.86) (0.88) (0.87) (0.87) (0.40) (0.40) (0.60) (0.60) (1.95)+ (1.95)+ (1.24) (1.24)dwellwater 0.003 0.002 0.002 0.006 0.020 0.020 0.014 0.013 0.004 0.005 0.020 0.022
(0.45) (0.37) (0.36) (0.79) (2.06)* (2.06)* (1.22) (1.05) (0.66) (0.67) (1.49) (1.60)Household 0.044 0.046 -0.071 -0.094 0.092 0.092 0.128 0.140 0.038 0.037 -0.017 0.004size (0.47) (0.49) (0.56) (0.73) (0.59) (0.59) (0.69) (0.75) (0.38) (0.37) (0.10) (0.02)eaccess to ... ... ... ... ... ... ... ... -0.092 -0.093 0.083 0.097health facil ... ... ... ... ... ... ... (1.29) (1.31) (0.65) (0.76)
-0.155 0.332 -0.680 -2.065 -0.071 -0.054 0.611 1.813 -0.426 -0.589 0.124 -1.023Constant (0.33) (0.41) (1.14) (1.58) (0.09) (0.04) (0.61) (0.88) (0.77) (0.52) (0.12) (0.59)Observations 1840 1840 1840 1840 632 632 632 632 1526 1526 413 413R-squared 0.04 0.03 0.04 ... 0.06 0.06 0.06 ... 0.03 0.03 0.04 0.03N of village ... ... 143 143 ... ... 43 43 ... ... ... ...Notes: Absolute value of t-statistics in parentheses: + significant at 10%; * significant at 5%; ** significant at 1%aliteracy of mother: 1 if Mother completes at least primary education; 0 otherwiseblandless household: I if a household does not own any land; 0 otherwiseCgender of child: 1 if male; 0 otherwisedwellwater: 1 if the source of water is tap, pump, well, or purchased water; 0 otherwiseeaccess to health facil: I if the nearest health facility is within 5 km; 0 otherwise
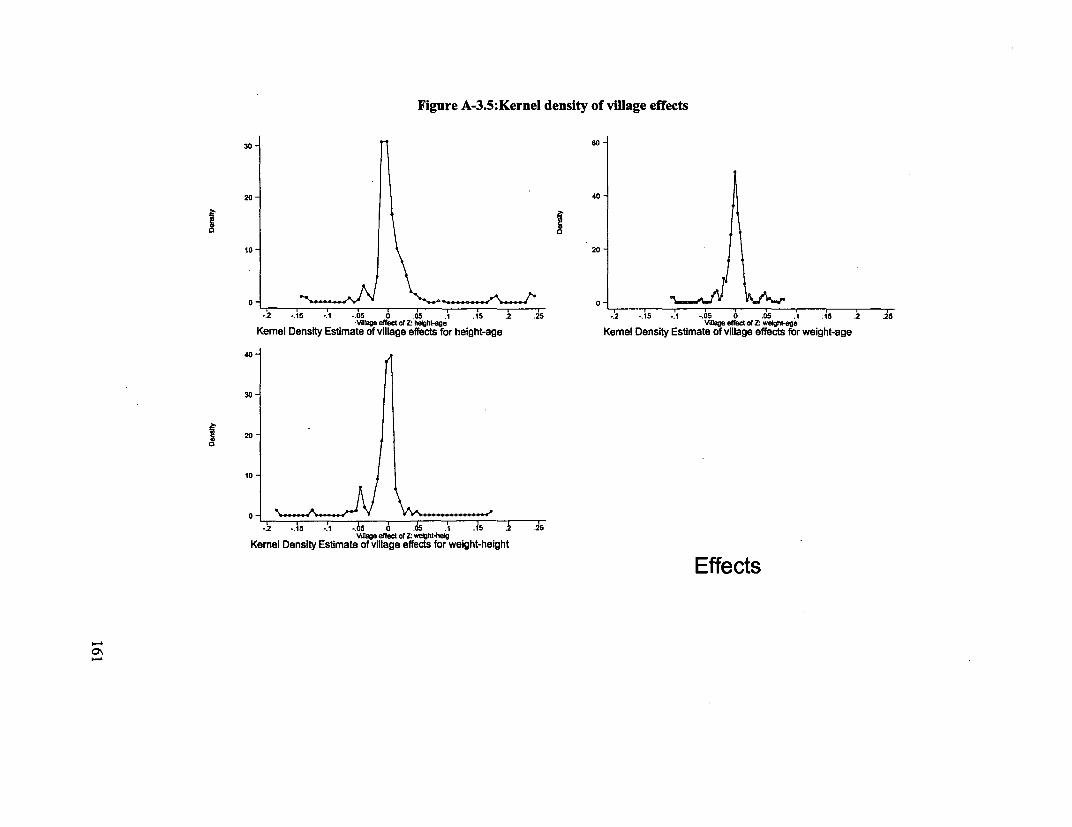
Figure A-3.5:Kernel density of village effects
20 -40-
10 20-
0 0
-.2 -.15 1 -.5 0 .05 .1 .15 .2 .25 -.2 -.15 . -5 0 .05 .1 .15 .2 .25
WVa1e effect of Z. height-age VOgage efec of i welghlt-age
Kemel Density Estimate of village effects for height-age Kemel Density Estimate of village effects for weight-age
40-
30-
20
00
10
.2 -.15 -.I -.65 t6 d .1i I1s .215Vage efec of 7Z welg4miel
Kernel Density Estimate of village effects for weight-height
Effects
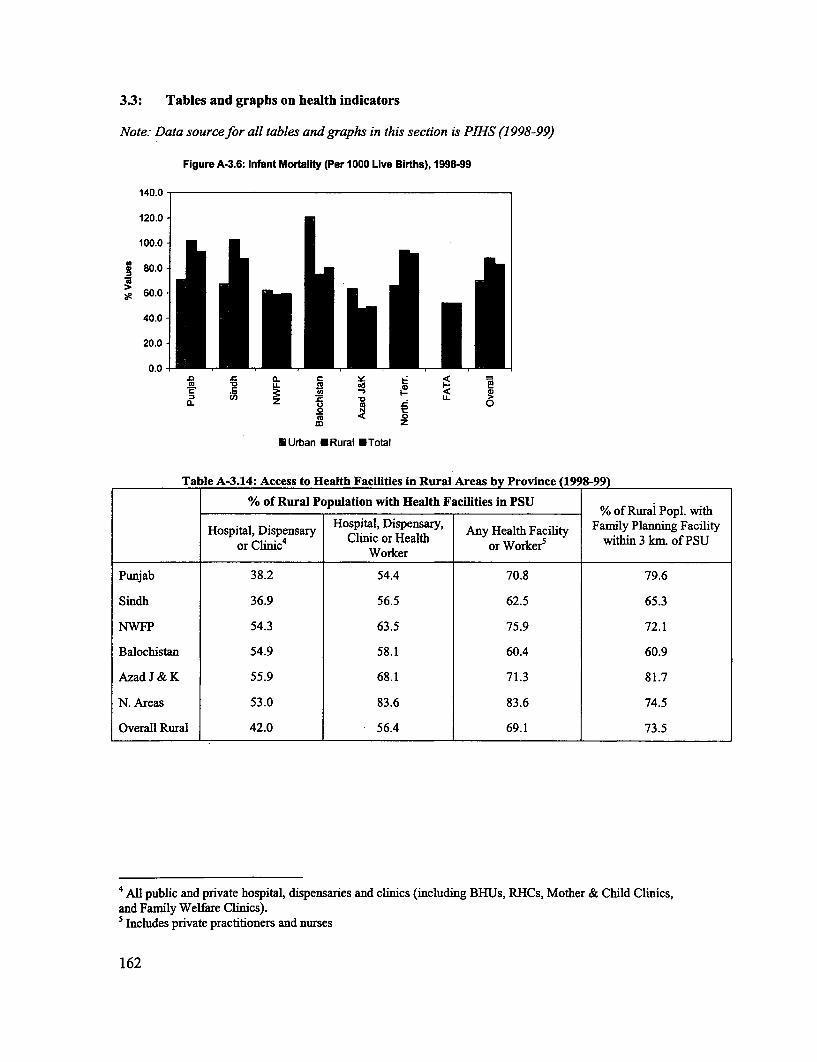
3.3: Tables and graphs on health indicators
Note: Data source for all tables and graphs in this section is PIHS (1998-99)
Figure A-3.6: Infant Mortality (Per 1000 Live Births), 1998-99
140.0
120.0 -
100.0
80.0-
60.0-
40.0-
20.0-
0.0.0 C
co U.Z .C
0~~~z
EUrban *Rural *Total
Table A-3.14: Access to Health Facilities in Rural Areas by Province (199 8-99)
% of Rural Population with Health Facilities in PSU % of Rural Popl. with
Hospital, Dispensary Hospital, Dispensary, Any Health Facility Famiily Planning Facilityor ClinC4 Clinic or Health c wihi 3 km. of PSUor Clinic Worker or Worker, ihn3k.o S
Punjab 38.2 54.4 70.8 79.6
Sindh 36.9 56.5 62.5 65.3
NWFP 54.3 63.5 75.9 72.1
Balochistan 54.9 58.1 60.4 60.9
Azad J & K 55.9 68.1 71.3 81.7
N. Areas 53.0 83.6 83.6 74.5
Overall Rural 42.0 56.4 69.1 73.5
4 All public and private hospital, dispensaries and clinics (including BHUs, RHCs, Mother & Child Clinics,and Family Welfare Clinics).5 Includes private practitioners and nurses
162
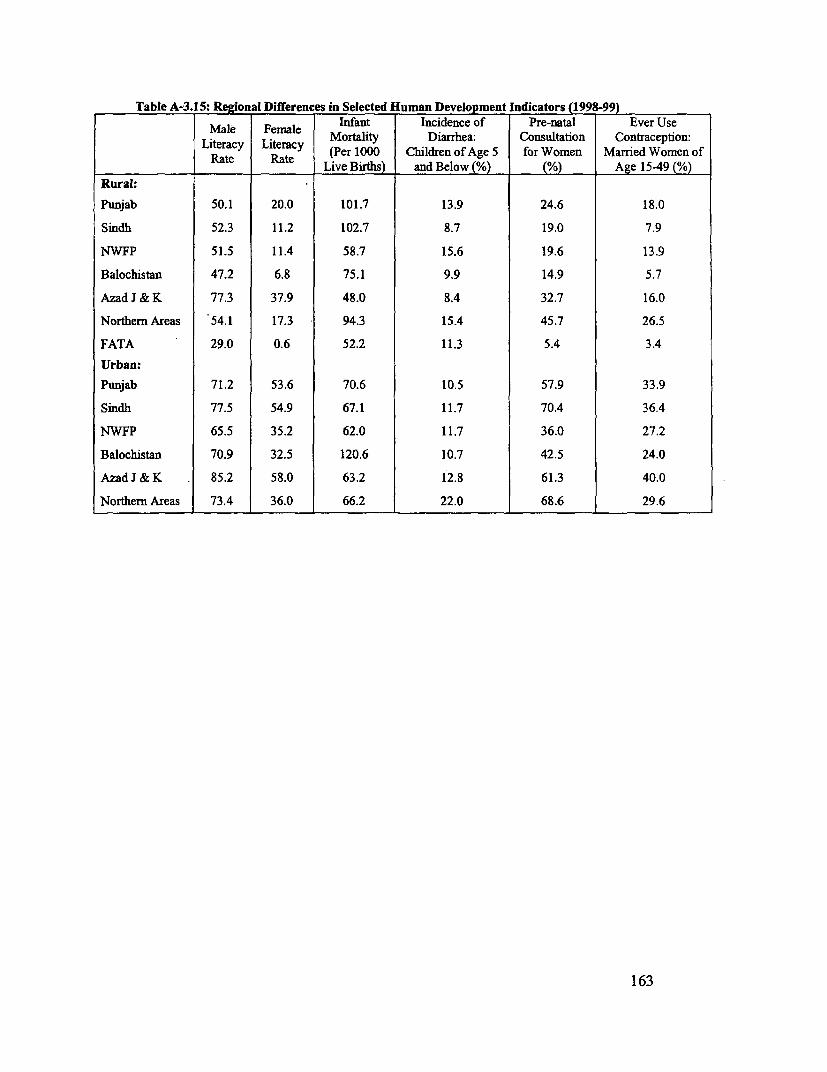
Table A-3. 5: Regional Differences in Selected Human Development Indicators (199899)Male Female Infant Incidence of Pre-natal Ever Use
Literacy Literacy Mortality Diarrhea: Consultation Contraception:Rate Rate (Per 1000 Children of Age 5 for Women Married Women of
Live Births) and Below (%) (%) Age 15-49 (%)Rural:
Punjab 50.1 20.0 101.7 13.9 24.6 18.0
Sindh 52.3 11.2 102.7 8.7 19.0 7.9
NWFP 51.5 11.4 58.7 15.6 19.6 13.9
Balochistan 47.2 6.8 75.1 9.9 14.9 5.7
Azad J & K 77.3 37.9 48.0 8.4 32.7 16.0
Northern Areas 54.1 17.3 94.3 15.4 45.7 26.5
FATA 29.0 0.6 52.2 11.3 5.4 3.4Urban:
Punjab 71.2 53.6 70.6 10.5 57.9 33.9
Sindh 77.5 54.9 67.1 11.7 70.4 36.4
NWFP 65.5 35.2 62.0 11.7 36.0 27.2
Balochistan 70.9 32.5 120.6 10.7 42.5 24.0
AzadJ&K 85.2 58.0 63.2 12.8 61.3 40.0
Northern Areas 73.4 36.0 66.2 22.0 68.6 29.6
163
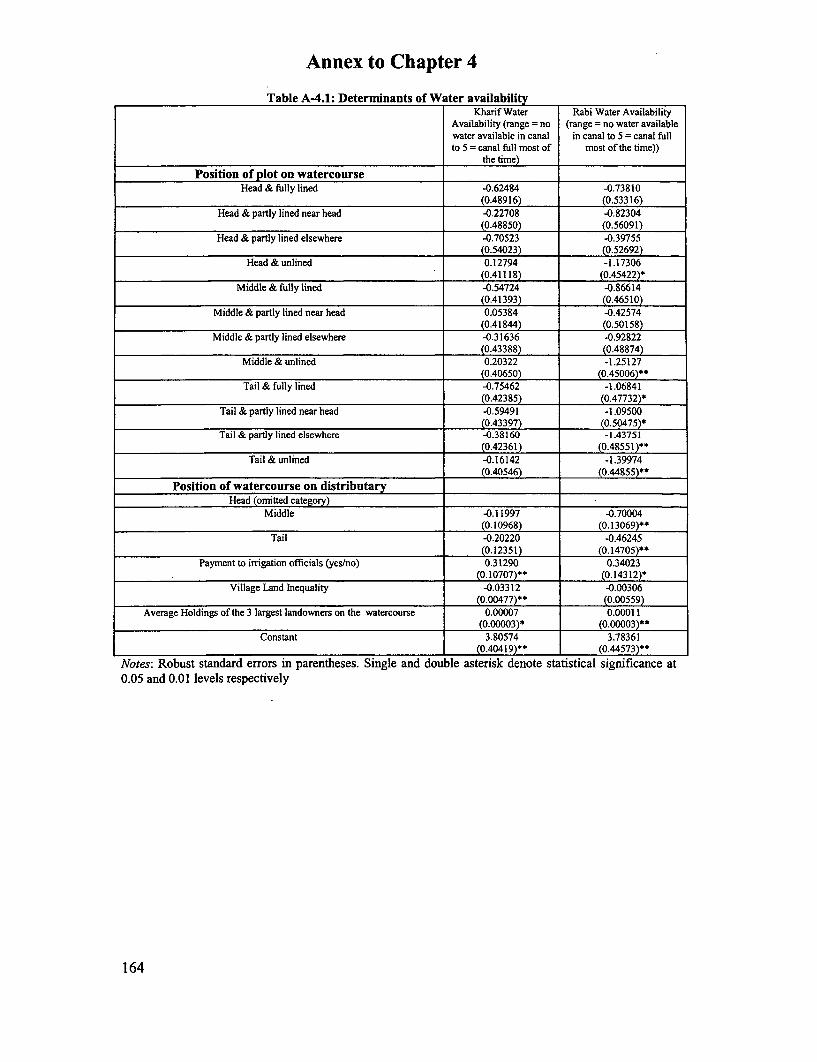
Annex to Chapter 4
Table A4.1: Determinants of Water availabilityKharif Water Rabi Water Availability
Availability (range = no (range = no water availablewater available in canal in canal to 5 = canal fullto 5 = canal full most of most of the time))
the time)
Position of plot on watercourseHead & fully lined -0.62484 -0.73810
(0.48916) (0.53316)Head & partly lined near head -0.22708 -0.82304
(0.48850) (0.56091)Head & partly lined elsewhere -0.70523 -0.39755
(0.54023) (0.52692)Head & unlined 0.12794 -1.17306
(0.41118) (0.45422)*Middle & fully lined -0.54724 -0.86614
(0.41393) (0.46510)Middle & partly lined near head 0.05384 -0.42574
(0.41844) (0.50158)Middle & partly lined elsewhere -0.31636 -0.92822
(0.43388) (0.48874)Middle & unlined 0.20322 -1.25127
(0.40650) (0.45006)*Tail & fully lined -0.75462 -1.06841
(0.42385) (0.47732)*Tail & partly lined near head -0.59491 -1.09500
(0.43397) (0.50475)*Tail & partly lined elsewhere -0.38160 -1.43751
(0.42361) (0.48551)**
Tail & unlined -0.16142 -1.39974(0.40546) (0.44855)**
Position of watercourse on distributaryHead (omitted category)
Middle -0.11997 -0.70004(0.10968) (0.13069)**
Tail -0.20220 -0.46245(0.12351) (0.14705)**
Payment to irrigation officials (yes/no) 0.31290 0.34023.______________________________________________________________ (0.10707)** (0.14312)*
Village Land Inequality -0.03312 -0.00306(0.00477)** (0.00559)
Average Holdings of the 3 largest landowners on the watercourse 0.00007 0.00011(0.00003)* (0.00003)**
Constant 3.80574 3.78361(0.40419)* (0.44573)**
Notes: Robust standard errors in parentheses. Single and double asterisk denote statistical significance at0.05 and 0.01 levels respectively
164
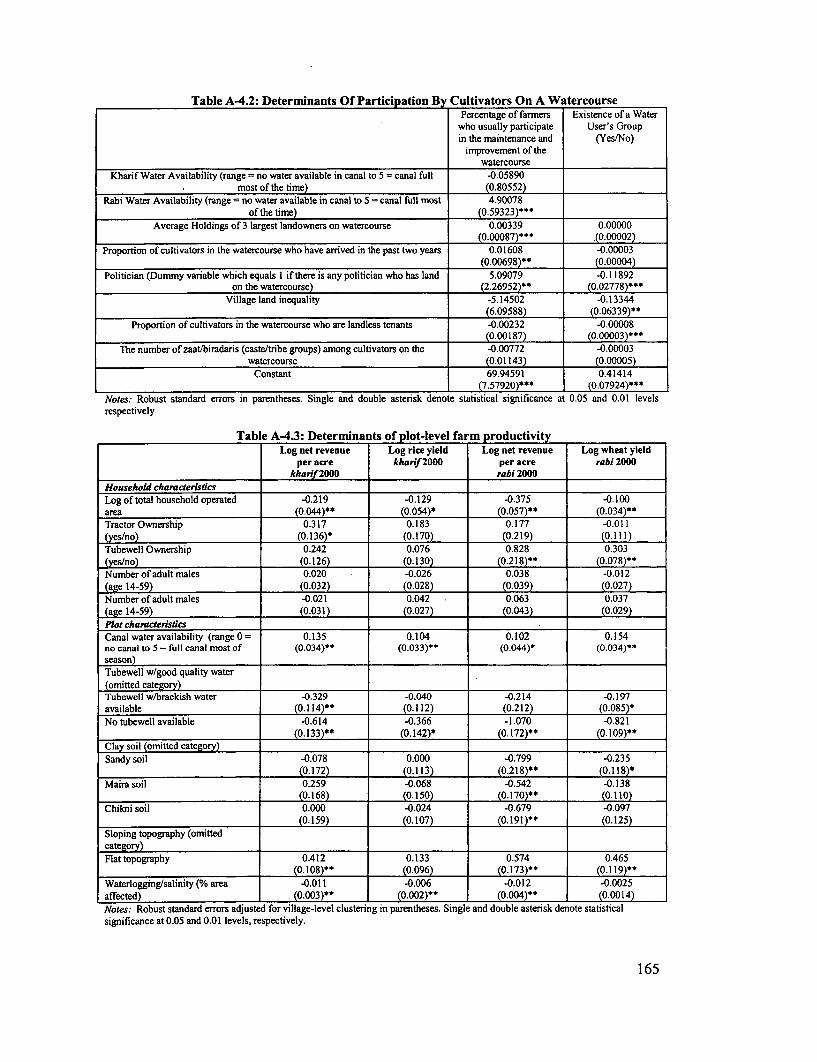
Table A4.2: Determinants Of Participation By Cultivators On A WatercoursePercentage of farmers Existence of a Water
who usually participate User's Groupin the maintenance and (Yes/No)
improvement of thewatercourse
Kharif Water Availability (range = no water available in canal to 5 = canal full -0.05890most of the time) (0.80552)
Rabi Water Availability (range = no water available in canal to 5 = canal full most 4.90078of the time) (0.59323)***
Average Holdings of 3 largest landowners on watercourse 0.00339 0.00000(0.00087)*** .(0.00002)
Proportion of cultivators in the watercourse who have arrived in the past two years 0.01608 -0.00003(0.00698)** (0.00004)
Politician (Dummy variable which equals I if there is any politician who has land 5.09079 -0.11892on the watercourse) (2.26952)** (0.02778)***
Village land inequality -5.14502 -0.13344.(6.09588) (0.06339)**
Proportion of cultivators in the watercourse who are landless tenants -0.00232 -0.00008(0.00187) (0.00003)***
The number of zaatibiradaris (caste/tribe groups) among cultivators on the -0.00772 -0.00003watercourse (0.01143) (0.00005)
Constant 69.94591 0.41414(7.57920)*** (0.07924)***
Notes: Robust standard errors in parentheses. Single and double asterisk denote statistical significance at 0.05 and 0.01 levelsrespectively
Table A43: Determinants of plot-level farm productivityLog net revenue Log rice yield Log net revenue Log wheat yield
per acre kharif 2000 per acre rabi 2000_ kharif 2000 rabi 2000
Household characterisdcsLog of total household operated -0.219 -0.129 -0.375 -0.100area (0.044)** (0.054)* (0.057)** (0.034)**Tractor Ownership 0.317 0.183 0.177 -0.011(yes/no) (0.136)* (0.170) (0.219) (0.111)Tubewell Ownership 0.242 0.076 0.828 0.303(yes/no) (0.126) (0.130) (0.218)** (0.078)**Number of adult males 0.020 -0.026 0.038 -0.012(age 14-59) (0.032) (0.028) (0.039) (0.027)Number of adult males -0.021 0.042 0.063 0.037(age 14-59) (0.031) (0.027) (0.043) (0.029)Plot characterisdcsCanal water availability (range 0 = 0.135 0.104 0.102 0.154no canal to 5 = full canal most of (0.034)** (0.033)*" (0.044)* (0.034)**season)Tubewell w/good quality water(omitted category)Tubewell w/brackish water -0.329 -0.040 -0.214 -0.197available (0.114)** (0.112) (0.212) (0.085)*No tubewell available -0.614 -0.366 -1.070 -0.821
(0.133)** (0.142)* (0.172)** (0.109)**Clay soil (omitted category) ._._. _. _.
Sandy soil -0.078 0.000 -0.799 -0.235(0.172) (0.113) (0.218)** (0.118)*
Maira soil 0.259 -0.068 -0.542 -0.138(0.168) (0.150) (0.170)** (0.110)
Chikni soil 0.000 -0.024 -0.679 -0.097(0.159) (0.107) (0.191)** (0.125)
Sloping topography (omittedcategory)_______ ____
Flat topography 0.412 0.133 0.574 0.465(0.108)** (0.096) (0.173)** (0.119)**
Waterlogging/salinity (% area -0.011 -0.006 -0.012 -0.0025affected) (0.003)** (0.002)** (0.004)** (0.0014)Notes: Robust standard errors adjusted for village-level clustering in parentheses. Single and double asterisk denote statisticalsignificance at 0.05 and 0.01 levels, respectively.
165
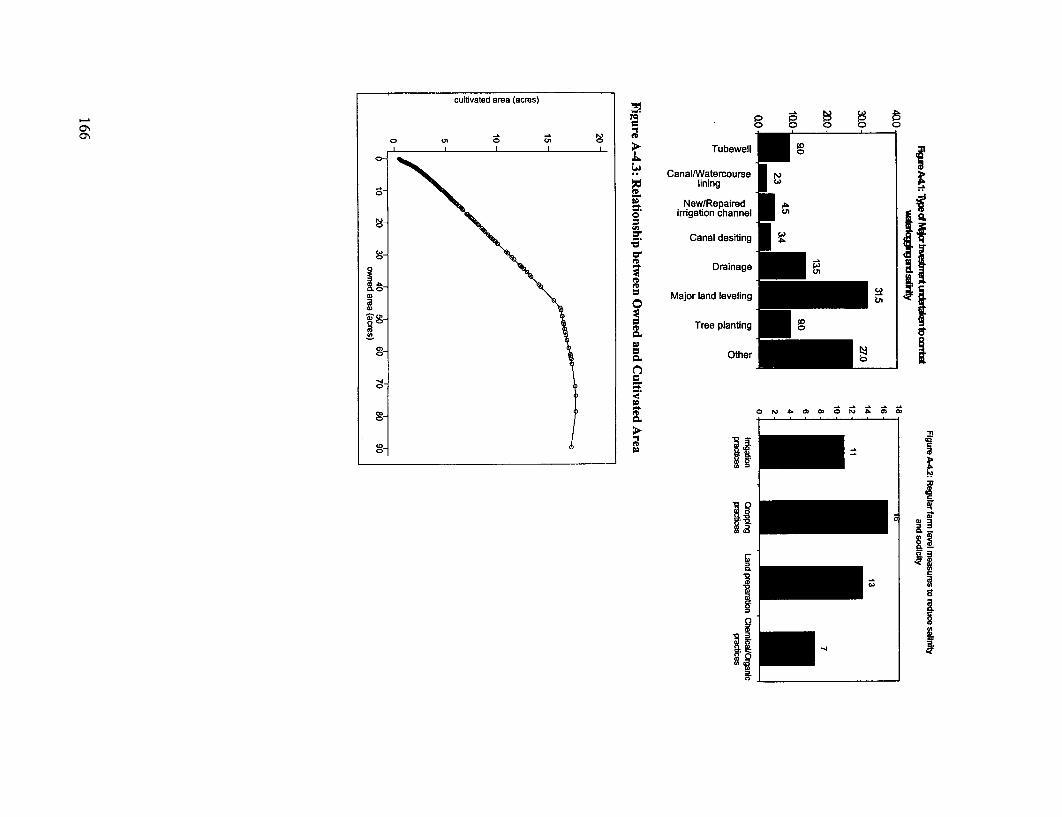
cultivated area (acres)
a. 0 0 0ON 0 fo~~~~~~~~~~ U
I o I o en o t Tubewell
CanalVWatercourse r
liningo- \ is New/Repaired
irrig!ation canl
Canal desiting _
8 \ a ~~~~~~~~~~~~~Drainage p
Major land leveling
3 \ \ Tree planting S
Other
0~~~~~~
o 4
0- _' t 00M
o~~~ F
| @ ~~~~~~~~~~~~~~i
Annex to Chapter 5
Table I below summarizes the Millennium Development Goals (MDGs) for Pakistan, and the long term indicators that will be tracked at thenational level, along with the sources (existing, or proposed) for these indicators.
Table A-5.1: Tracking Pakistan's Progress towards Millennium Development Goals (MDGs)
MDGs Long Term Indicators Baseline (1998-99)1 Medium-Term Targets (2004).______________ (Outcome) ._.
Economic well-being: reducing > Poverty headcount > 32.6% > Targets to be determinedthe proportion of poor living in > Poverty gap ratio > 7.0extreme poverty by at least half > Gini index of consumption > 30.6by 2015 > Percentage of rural
population with no > 61.4%ownership of agriculturalland
Social development &Empowerment of Women:Universal primary education by > Gross primary enrollment > 71% > 80%2015 > Net primary enrollment
> Literacy rate (15 and above) > 50.5% (urban: 66.5%, rural:45.2%)
> 42.5% (urban: 63%, rural: > 59%34%)
Reduce gender disparity in > Difference in primary > 13.6 % (net enrollment); > 12% gap (Grossprimary education by 2005 enrollments (net and gross) 18% (gross enrollment) enrollments:- Male: 87%,
between girls and boys female: 75%)> Differences in literacy rates > 30.8% (male: 58%, female:
between males and females 27.2%) > 21% (Male: 70%, female:49%)
'Data source for all long-term indicators, unless otherwise specified, are from PIHS (1998-99). Other sources are: Pakistan Reproductive Health and FamilyPlanning Survey (PRHFPS) 2000-01
00
Increase participation of women > Proportion of seats held by > Available after nationalin political decision-making women in national elections in October, 2002
parliamentReduce infant and child (below > Infant mortality rate > 83 per 1000 live births (127 > 65 per 1000 live birthsage 5) mortality rates by 2/3 of in 1991) > To be determinedthe 1990-91 rate, by 2015 > Under-5 child mortality rate > 116 per 1000 live births
> Immunization rate (% of > 49% > 62%children 12-23 months oldthat are fully immunized)
Reduce maternal mortality by > > Births attended by skilled > 19% > 25%between 1990 and 2015 health personnel
(doctor/nurse/ Lady HealthVisitor)
> Percentage of pregnantwomen using prenatal care > 31% > 50%
Provide access to reproductive > Contraceptive prevalence > 28% (PRHFPS); 19.5% > 39%health services through primary ratehealth care system for allindividuals of appropriate agesby 2015Improvements in Other > Population with access to > To be filledIndicators safe drinling water
> Total fertility rate> Life expectancy at birth > 4.5; 4.8 (PRHFPS) > 4.1> % of TB cure rate > To be filled
> Unknown
Measuring progress towards the MDGs will entail tracking some indicators that change over short
spans of time, are leading indicators for the goals, and provide feedback to policymakers about
the results of policy initiatives on the ground. Table A-5.2 provides a list of such indicators for
Pakistan, which has evolved from the monitoring framework provided by the I-PRSP.
Table A-5.2: Output indicators for poverty monitoring (measured annually)
Access:> Utilization Rates disaggregated by BHU/RHC and by curative
and preventive care; Source: HMIS>' % of population covered by LHWs; Source: LHWIMISQuality:> % of FLCF (BHUs/RHCs) that were out of stock of 5 essential
Leading indicators to drugs, or contraceptives for period of more than one month eachmonitor health outcomes in a given year; Source: HMIS
> % of FLCF (BHUs/RHCs) with doctors and/or female paramedicpresent; Source: Proposed Annual Facility Survey
> Number of female health providers trained in midwifery;Source:Ministry/Departments of Health
% of children aged 12-23 months fully immunized against DPT-3Source: Annual Surveys conducted by independent agenciesunder the GAVI initiativeNumber of functional schools: facilities with physical infrastructure- at least a building, toilet, drinking waterSource: NEMIS
Percentage of teachers with in-service trainingSource: Proposed Annual Facility Survey; NEMIS
Leading indicators to Quality of schooling:
monitor education outcomes > Availability of textbooks, blackboard and chalk, student-teacher
ratio; Source: NEMIS> Teacher absenteeism: teacher present or not at the time or
survey; Source: Proposed Annual Facility SurveyNumber of children of school age currently attending school;Source: Proposed Annual Household Survey
Social Protection/Safety Net Programs:> Employment generated through public works programs under
Khushal Paklstan Program; Source: Proposed AnnualHousehold Survey
> Number of beneficiaries of Zakat by type of assistance and
Leading indicators to provincemonitor anti-poverity > Number of borrowers and size of credit under PPAF andprograms Khushali Bank programs; Source: Proposed Annual
Household Survey> Number and composition of small infrastructure projects and
training supported by microcreditSk Number of beneficiaries by province (rural/urban) of the Food
Support Program; Source: Pakistan Bait-ul-Maal
169
List of Background Papers
Andrabi, Tahir, Jishnu Das and Asim Khwaja (2002), "The Rise of Private Schooling in Pakistan:Catering to the Urban Elite or Educating the Rural Poor?". Mimeo
Easterly, William (2001). "Pakistan's Critical Constraint: Not the Financing Gap but the SocialGap". Mimeo
Gazdar, Haris (2002). "A Qualitative Survey of Poverty in Rural Pakistan: Methodology, Data,and Main Findings". Mimeo
Hasnain, Zahid (2002). "Explaining Pakistan's Growth Slowdown: Fiscal deficits, Governance,and the Social Gap". Mimeo
Healy, Andrew and Ghazala Mansuri (2000). "Assessing Vulnerability: An Ex-Ante Measureand its Application Using Data From Rural Pakistan". Mimeo
Naseem, S. M. (2001). "Government and NGO Programs in the Alleviation of Poverty inPakistan: A Political Economy Survey". Mimeo
Narayan, Ambar and Tara Vishwanath (2001). "A Note on Education in Pakistan: PreliminaryFindings from PIHS 19998-99 and Related Issues". Mimeo
Narayan, A. and Tara Vishwanath (2001). "A Note on Poverty Estimates for Pakistan in the1990s: Issues and Preliminary Findings from Household Data". Mimeo
World Bank (2001). Poverty In Pakistan in the 1990s: An Interim Assessment. Draft(November). Summary prepared for Human Development Forum (Islamabad), January, 2002.
170
References
Ahmad, Mushtaq (1993). "Choice of a Norm of Poverty Threshold and Extent of Poverty in
Pakistan". Ministry of Finance, Islamabad, mimeo.
Alderman, H. and M.Garcia (1993) "Poverty, Household Food Security and Nutrition in Rural
Pakistan," Research Report 96. IFPRI Washington DC.
Alderman, Harold, Jooseop Kim and Peter Orazem (1999). "Can Private School Subsidies
Increase Enrollment for the Poor? The Quetta Urban Fellowship Program". World Bank
Economic Review, v. 13 (3).
Alderman, H. (2000) "Anthropometry," in Grosh M. and P.Glewwe ed. Designing Household
Survey Questionnaires for Developing Countries: Lessons from Ten Years of LSMS Experience,
Oxford: Osford University Press.
Alderman, H., Appleton, S., Haddad, L., Song, L. and Y. Yohannes (2001) "Reducing Child
Malnutrition: How Far Does Income Growth Take Us," mimeo.
Alderman, H., J. Hentschel and R. Sabates (2001) "With the Help of One's Neighbors:
Externalities in the Production of Nutrition in Peru." Forthcoming Social Science and Medicine.
Alesina, Alberto, Reza Baqir, and William Easterly (1999), "Public Goods and Ethnic Divisions".
Quarterly Journal of Economics, November.
Andrabi, Tahir, Jishnu Das and Asim Khwaja (2002), "The Rise of Private Schooling in Pakistan:
Catering to the Urban Elite or Educating the Rural Poor?". Mimeo
Barro, Robert (1998). Cross-country determninants of growth. Cambridge: MIT Press.
Basu, Kaushik, and James Foster (1998). "On Measuring Literacy". Economic Journal, v. 108.
Basu, K., Ambar Narayan and Martin Ravallion (2000). "Is Literacy Shared Within Households?
Theory and Evidence for Bangladesh". Labour Economics, v. 8: 649-65.
Baulch, Bob and Neil McCulloch (1998). "Being Poor and Becoming Poor: Poverty Status and
Poverty Transitions in Rural Pakistan". Working Paper No. 79, University of Sussex, Institute
of Development Studies.
Behrman, Jere and Anil Deolalikar (1995). "Are There Differential Returns to Schooling by
Gender? The Case of Indonesian Labor Markets" Oxford Bulletin of Economics and Statistics,
57: 97-118
Burnett, Nicholas (2002). "Pakistan: Working with the Private Sector in Primary and Middle
School Educaton". SASHD, World Bank, mimeo
Case, A. and A. Deaton (1998). "Large Cash Transfers to the Elderly in South Africa". Economic
Journal, 108: 1330-61
Chaudhuri, Shubham (2000). "Empirical Measures for Assessing Household Vulnerability to
Poverty", mimeo.
Chaudhuri, Shubham and Jyotsna Jalan (2001). "Assessing Household Vulnerability to Poverty:
A Methodology and Estimates for Indonesia", mimeo.
Datt, Gaurav and M. Ravallion (1992). "Growth and Redistribution Components of Changes in
Poverty Measures: A Decomposition with Applications to Brazil and India in the 1980s".
Journal of Development Economics (Netherlands), v. 38.
171
Dixit, Avinash and John Londregan (1996). 'The Determinants of Success of Special Interests inRedistributive Politics." The Journal of Politics, v. 58 (4).
Dow, W. et al. (1997). "Health Care Prices, Health and Labor Outcomes: ExperimentalEvidence". RAND Corporation report: DRU/1588/NIA.
Dreze, J., and M. Saran (1995). "Primary Education and Economic Development in China andIndia: Overview and Two Case Studies", in Choice, Welfare and Development (eds. K. Basu, P.K. Pattanaik and K. Suzumura). Oxford: Clarendon Press.
Easterly, W. and Ross Levine (1997). "Africa's Growth Tragedy: Policies and Ethnic Divisions".Quarterly Journal of Economics, November.
Ercelawn, Aly and S. Akbar Zaidi (1999). "Is the Social Action Program Working? Observationsfrom a field survey", Appendix 18.2 in Zaidi (1999), pp.4 20 -2 1.
Federal Bureau of Statistics (1998). PIHS Education Sector Performance in the 1990s: Analysisfrom the PIHS. Government of Pakistan, Islamabad.
Federal Bureau of Statistics (2001). Pakistan Integrated Household Survey: Poverty in the1990s. Government of Pakistan, Islaniabad (draft report).
Filmer, Deon, Elizabeth King, and Lant Pritchett (1998). "Gender Disparity in South Asia:Comparisons Within and Between Countries." Policy Research Working Paper No. 1867,World Bank Washington, DC.
Filmer, Deon and Lant Pritchett (1994). "Estimating Wealth Effects Without Expenditure Data,or Tears: an Application to Educational Enrollments in States of India". Policy ResearchWorking Paper, World Bank, Washington, DC.
Foster, A. (1995). "Nutrition and Health Investment". American Economic Review, 85: 148-52.Gazdar, Haris (2000). "State, Community, and Universal Education: A Political Economy of
Public Schooling in Rural Pakistan". Asia Research Centre, London School of Economics.
Gazdar, H., Stephen Howes and Salman Zaidi (1994). "Recent Trends in Poverty in Pakistari".STICERD, London School of Economics. Background Paper for the Pakistan PovertyAssessment 1995, nmineo.
Gazdar, H., Ayesha Khan and Themrise Khan (2002). "Land Tenure, Rural Livelihoods andInstitutional Innovation". Report prepared for DIFD (u.k.). Mimeo
Gertler, P. and J. Gruber (1997). "Insuring Consumption Against Illness". National Bureau ofEconomic Research Working Paper No. 6035.
Green, S. E., T. A. Rich, and E. G. Nesman (1985). 'Beyond Individual Literacy: the Role ofShared Literacy for Innovation in Guatemala', Human Organization, v. 44.
Haddad, L., Bhattarai, S., Immink, M. and S. Kumar (1996) "Managing Interacitons betweenHousehold Food Security and Preschooler Health," IFPRI
Howes, S. and Salman Zaidi (1994). "Notes on Some Household Surveys from Pakistan in theEighties and Nineties". STICERD, London School of Economics, and PRDPH, World Bank,mimeo.
Hughes, G. and M. Dunleavy (2000) "Why do Babies and Young Children Die in India. The Roleof the Household Environment," The World Bank.
Husain, Isbrat (1999a). Pakistan: The Economy of an Elitist State, Oxford University Press:Karachi.
172
Husain, Ishrat (1 999b). The Political Economy of Reforms: A Case Study of Pakistan, PakistanInstitute of Development Economics, Lectures in Development Economics No. 10.
Islam, N. (1995). "Growth Empirics: A Panel Data Approach," Quarterly Journal of Economics
110: 1127-1 170.
Jalan, J. and M. Ravallion (1997). "Are the Poor Less Well-Insured? Evidence on Vulnerabilityto Income Risk in Rural China". Policy Research Working Paper No. 1863, World Bank,Washington, DC.
Jalan, J. and M. Ravallion (1998). "Transient Poverty in Post-Reform Rural China". Journal ofComparative Economics, v. 26.
Jalan, J. and M. Ravallion (2001). "Household Income Dynamics in Rural China". World Bank,Washington, DC, mimeo.
Jehle, Geoffrey (1995). "Zakat and Inequality: Some Evidence from Pakistan". Review ofIncome and Wealth, 40 (2).
Johannes, John (1983). "Explaining Congressional Casework Styles". American Journal ofPolitical Science, v. 27(3).
Lanjouw, Peter and M. Ravallion (1995). "Poverty and Household Size". Economic Journal,v.105 (433)
Lokshin, Michael and M. Ravallion (2000). "Short-lived Shocks with Long-lived Impacts?household income dynamics in a transition economy". Policy Research Working Paper No.2459, World Bank, Washington, DC.
Martorell R., J. Rivera J. and H. Kaplowitz (1990a). "Consequences of stunting in earlychildhood for adult body size in rural Guatemala." Annales Nestl 48: 85-92.
Martorell R., J. Rivera and C. K. Lutter (1990b) "Interaction of diet and disease in child growth."In: Atkinson, S. A., Hanson, L.A. and R.K. Chandra, eds. Breastfeeding, Nutrition, Infectionand Infant Growth in Developed and Emerging Countries, St. John's, Newfoundland, Canada:ARTS Biomedical Publishers and Distributors, pp 307-321.
Martorell, R., Schroeder, D.G., Rivera, J.A., and H.J. Kaplowitz (1995) "Pattems of linear growthin rural Guatemalan adolescents and children," Journal of Nutrition 125(4S): 1060S-1067S.
Ministry of Finance and Planning (2001). "Interim-Poverty Reduction Strategy Paper (I-PRSP)".Govemment of Pakistan, Islamabad. Draft (October).
Ministry of Finance, Govemment of Pakistan. Pakistan Economic Survey.
Multi-Donor Support Unit (MSU), (2000). Social Action Programme: Analysis of ProvincialSAP Expenditure (FY 1992/93 to FY 1998/99). Islamabad.
Murray, C. and L. Chen (1992). "Understanding Morbidity Change". Population and
Development Review, 18: 481-503.
Pattie, Charles, Ronald Johnston and Edward Fieldhouse (1995). "Winning the Local Vote: TheEffectiveness of Constituency Campaign Spending in Great Britain, 1983-1992". The
American Political Science Review, v. 89 (4).
Quisumbing, Agnes (1996). "Male-Female Differences in Agricultural Productivity" World
Development, 24: 1579-95
Qureshi, Sarfraz Khan and Ghulam Arif (1999). "Profile of Poverty in Pakistan, 1998-99".
Pakistan Institute of Development Economics (PIDE), Islamabad, mimeo.
173
Schultz, P. and Tansel A. (1997). "Wage and Labor Supply Effects of Illness in Cote D'lvoire andGhana: Instrumental Variable Estimates for Days Disabled". Journal of DevelopmentEconomics, 53: 251-86.
Scrimshaw, N.S. (1995) "Community-based Longitudinal Nutrition and Health Studies: ClassicalExamples from Guatemala, Haiti and Mexico," INFDC Boston MA.
Shafqat, S. (1999). "Democracy in Pakistan: Value change and challenges of institutionbuilding." Human Development in South Asia 1999: The Crisis of Governance. HumanDevelopment Center, Karachi: Oxford University Press.
Social Policy and Development Centre (SPDC), (1999). Social Development in Pakistan: AnnualReview. Karachi. Oxford University Press.
SPDC (2000). Social Development in Pakistan: Annual Review. Karachi. Oxford UniversityPress.
Subbarao, Kalanidhi, Aniruddha Bonnerjee, Jeanine Braithwaite, Soniya Carvalho, KeneEzemenari, Carol Graham and Alan Thornpson (1997). Safety Net Programs and PovertyReduction: Lessons from Cross-Country Experience, World Bank. Washington, DC.
Talbot, Ian (1998). Pakistan: A Modern History. St. Martin's Press.
Thomas, D., V. Lavy, and 3. Strauss (1996) "Public Policy and Anthropometric Outcomes in Coted'Ivoire." Journal ofPublic Economics 61: 155-192.
Tinker, Anne (1998). Improving Women's Health in Pakistan. Human Development Network,World Bank.
Wilder, Andrew (1999). The Pakistani Voter: Electoral Politics and Voting Behavior in thePunjab. Karachi: Oxford University Press.
United Nations Development Programme (1998). Legal and Regulatory Framework for NGOsWith a View to Channelizing Community Savings into Credit, Islamabad.
World Bank (1995). Pakistan Poverty Assessment. Report No. 14397-PAK. South Asia Region.Washington, DC.
World Bank (1997). Pakistan: Fourth Highway Project. Implementation Completion Report.Washington, DC.
World Bank (1998a). A Framework for Civil Service Reform in Pakistan. Report No. 18386-PAK. Washington, DC.
World Bank (1998b). Pakistan: Highway Rehabilitation and Maintenance Project. ProjectInformation Document.
World Bank (1998c). Pakistan Economic Update: Adjustment and Reforms for a Better Future.South Asia Region, Washington, DC.
World Bank (1999). Strategic Reforms for Agricultural Growth in Pakistan. Washington, DC.
World Bank (2001a). Engendering Development: Through Gender Equality in Rights, Resources,and Voice. Policy Research Report, Oxford: Oxford University Press.
World Bank (200 lb). Pakistan: The Agriculture Sector Strategy. South Asia Rural DevelopmentUnit. Washington, DC.
World Bank (2001c). Reforning Punjab 's Public Finances and Institutions. Report No. 20981-PAK. Washington, DC.
174
World Bank (2001 d). "Risk Management in South Asia: A Poverty Focused Approach". Social
Protection Strategy Paper for South Asia Region. Report No. 23509-SAS. Washington, DC.
World Bank (2002). Pakistan Development Policy Review: A New Dawn?. Report No. 23916-
PAK. South Asia Region. Washington, DC.
Zaidi, S. A. (1999). Issues in Pakistan's Economy. Karachi, Pakistan: Oxford University Press
175


