Embed Size (px)
Citation preview
SEISMIC VULNERABILITIES AND RISKS FOR URBAN MITIGATION
PLANNING IN TURKEY
A THESIS SUBMITTED TO
THE GRADUATE SCHOOL OF NATURAL AND APPLIED SCIENCES
OF
MIDDLE EAST TECHNICAL UNIVERSITY
BY
TUĞÇE SÖNMEZ SANER
IN PARTIAL FULFILLMENT OF THE REQUIREMENTS
FOR
THE DEGREE OF DOCTOR OF PHILOSOPHY
IN
CITY AND REGIONAL PLANNING
FEBRUARY 2013

iii
Approval of the thesis:
SEISMIC VULNERABILITIES AND RISKS FOR URBAN MITIGATION
PLANNING IN TURKEY
submitted by TUĞÇE SÖNMEZ SANER in partial fulfillment of the requirements
for the degree of Doctor of Philosophy in City and Regional Planning
Department, Middle East Technical University by,
Prof. Dr. Canan Özgen
Dean, Graduate School of Natural and Applied Sciences
Prof. Dr. Melih Ersoy
Head of Department, City and Regional Planning
Prof. Dr. Melih Ersoy
Supervisor, City and Regional Planning Dept., METU
Prof. Dr. Murat Balamir
Co-Supervisor, City and Regional Planning Dept., METU
Examining Committee Members:
Assoc. Prof. Dr. Çağatay Keskinok
City and Regional Planning Dept., METU
Prof. Dr. Melih Ersoy
City and Regional Planning Dept., METU
Assoc. Prof. Dr. Tarık ġengül
Political Science and Public Administration Dept., METU
Assoc. Prof. Dr. Serap Kayasu
City and Regional Planning Dept.., METU
Assoc. Prof. Dr. Kübra Cihangir Çamur
City and Regional Planning Dept., Gazi University
Date: 01. 02. 2013
iii
I hereby declare that all information in this document has been obtained
and presented in accordance with academic rules and ethical conduct. I
also declare that, as required by these rules and conduct, I have fully
cited and referenced all material and results that are not original to this
work.
Name, Last name: Tuğçe SÖNMEZ SANER
Signature :

iv
ABSTRACT
SEISMIC VULNERABILITIES AND RISKS FOR URBAN MITIGATION
PLANNING IN TURKEY
Sönmez Saner, Tuğçe
Ph.D., Department of City and Regional Planning
Supervisor : Prof. Dr. Melih Ersoy
Co-Supervisor : Prof. Dr. Murat Balamir
February 2013, 237 pages
Chronic seismic hazards and resulting secondary impacts as natural conditions of
the country, and loss of robust building and prudent settlement practices as
aggravated by rapid population growth make cities the most vulnerable
geographical and social entities in Turkey. In contrast, Turkish disaster policy is
solely focused on post-disaster issues and no incentives or provision exist to
encourage risk analysis or risk mitigation approaches, despite current
international efforts.
For the development of risk reduction policies an essential step is to prioritize
settlements according to their vulnerability levels. This could be determined by
hazard probabilities and attributes of the building stock of each settlement.
Measurement of vulnerability levels allows the ordering of settlements into risk
categories.
Vulnerability levels of settlements are then assumed to depend on a number of
attributes of cities to explore if vulnerability could be related to a set of urban
properties. Results of statistical analyses indicate that total building loss is
related to the ratio of population over the total number of buildings in mid-range
settlements, and directly related to population in metropolitan cities. Relative
loss on the other hand is related with rate of agglomeration and development
index in almost every size category of settlements.
Observations provide guiding principles for effective mitigation practices in Turkey
by ordering settlements and offer means of differential implementation. These
could contribute to improved safety measures in urban standards, building codes,
building supervision procedures, insurance systems, investment priorities, and
Law (6306) on Redevelopment of Areas under Disaster Risk.
Keywords: Urban Seismic Risk, Seismic Vulnerabilities, Mitigation Planning, Risk
Assessment, Mitigation Policies
v
ÖZ
TÜRKİYE’DE SAKINIM PLANLAMASI İÇİN KENTSEL YERLEŞMELERİN
SİSMİK ZARAR GÖREBİLİRLİKLERİNİN VE RİSKLERİNİN BELİRLENMESİ
Sönmez Saner, Tuğçe
Doktora, ġehir ve Bölge Planlama Bölümü
Tez Yöneticisi : Prof. Dr. Melih Ersoy
Ortak Tez Yöneticisi : Prof. Dr. Murat Balamir
ġubat 2013, 237 sayfa
Türkiye, jeolojik konumu ve yetersiz yasal düzenlemeleri nedeniyle kronik sismik
tehlikeler ve ağır sonuçları olan afetlerle karĢı karĢıyadır. YerleĢimlerin yer
seçiminde yapılan yanlıĢlıklar, altyapının plansız olması, yapı stokunun yapım
aĢamasında ve sonrasında denetlenmemesi ile yaratılan kalitesiz yapılaĢma gibi
nedenler de afetler sonucunda yaĢanan can ve mal kayıplarını artırmıĢtır. Tüm bu
bileĢenler Türkiye‘de Ģehirleri coğrafi ve sosyal açıdan zarar görebilir duruma
getirmiĢtir. Yüksek risklere sahip Türkiye‘de uluslar arası politika değiĢikliklerine
büyük ölçüde yabancı kalınmıĢ, sakınım alanında yetersiz ve yanlıĢ uygulamalara
girilmiĢ ve afet politikaları afet-sonrası çalıĢmaları odaklanmıĢtır.
ÇalıĢma kapsamında yerleĢimlerin zarar görebilirlik önceliklerine göre sıralanması
sakınım politikalarının geliĢtirilebilmesi açısından en temel adım olarak
belirlenmiĢtir. YerleĢimlerin zarar görebilirliklerin belirlenmesi amacıyla bir
yandan tehlike olasılıkları ve bundan doğan kayıplar düzeyi incelenirken, diğer
yandan yerleĢimlerin temel özellikleri ve bina stoku değiĢkenleri ile bunların
kayıplar düzeyine olan etkileri incelenmiĢtir. Elde edilen zarar görebilirlik
değerleri yerleĢimlerin önceliklerine göre sıralanmasında kullanılmıĢtır.
Zarar görebilirlik seviyelerinin yerleĢimlerin hangi özellikleri ile iliĢkili olduğu
belirlemek amacıyla istatistiksel analizler yapılmıĢtır. Ġstatistiksel analizlerin
sonuçları incelendiğinde; toplam bina kaybının orta büyüklükteki yerleĢimlerde
nüfusun toplam bina sayısına oranı ile büyükĢehirlerde ise nüfus ile doğrudan
iliĢkili olduğu, bina kaybının bina stokuna oranının ise tüm yerleĢim gruplarında
kentleĢme oranı ve geliĢme indeksi ile iliĢkili olduğu görülmektedir.
ÇalıĢmanın sonuçları daha etkili sakınım politikaları geliĢtirmek için yerleĢimlerin
zarar görebilirliklerine göre sıralanması ve bu sıralamaya göre farklı uygulamalar
yapılması konularında yol gösterici nitelik taĢımaktadır. Kentsel standartların
geliĢtirilmesi, yapı yönetmelikleri ve denetim süreçleri, sigorta sistemleri, yatırım
öncelikleri ve Afet Riski Altındaki Alanların DönüĢtürülmesi (6306) Kanunu
konularında ise sakınım politikalarına katkı sağlamaktadır.
Anahtar Kelimeler: Kentsel Sismik Risk, Sismik Zarar Görebilirlik, Sakınım
Planlaması, Risk Değerlendirme, Sakınım Politikaları

vi
To My Parents

vii
ACKNOWLEDGMENTS
I wish to express my deepest gratitude to my supervisors Prof. Dr. Murat
Balamir and Prof. Dr. Melih Ersoy for their guidance, advice, criticism,
encouragements and insight throughout the research.
I would like to thank my jury members; Assoc. Prof. Dr. Çağatay Keskinok,
Assoc. Prof. Dr. Tarık ġengül, Assoc. Prof. Dr. Serap Kayasu and Assoc. Prof. Dr.
Kübra Cihangir Çamur for their advice and criticism.
I would like to thank my parents, Ġlgin and Kaya Sönmez, for their endless
patience and faith in every stage of my life. I am grateful to them for the feeling
of safety they offer. I would also like to thank my mother-in-law Suna Afacan for
her support and motivation throughout this research.
I am also very thankful to Dr. Ezgi Orhan for her friendship and support at every
stage of this study.
Above all, I am specifically grateful to my dear husband Serhan Saner for his
greatest support, motivation and encouragement in all parts of this study and
my life.
Also I offer sincere thanks to Prota Engineering for their support. The method
used by Prota Engineering in the ―Consultancy Services for Prioritization of High
Seismic Risk Provinces and Public Buildings‖ Project, which is supported by World
Bank, is adopted partially in this study and used for developing an algorithm for
prioritization.
viii
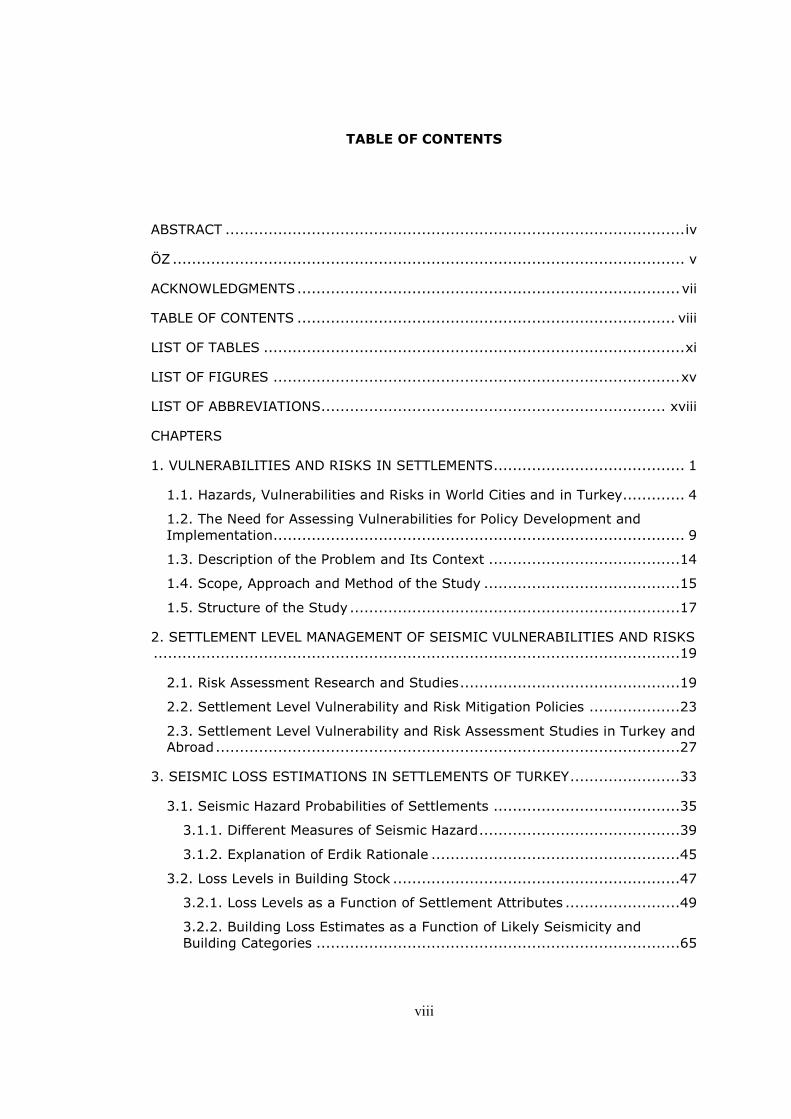
TABLE OF CONTENTS
ABSTRACT ................................................................................................ iv
ÖZ ........................................................................................................... v
ACKNOWLEDGMENTS ................................................................................ vii
TABLE OF CONTENTS ............................................................................... viii
LIST OF TABLES ........................................................................................ xi
LIST OF FIGURES ..................................................................................... xv
LIST OF ABBREVIATIONS ........................................................................ xviii
CHAPTERS
1. VULNERABILITIES AND RISKS IN SETTLEMENTS........................................ 1
1.1. Hazards, Vulnerabilities and Risks in World Cities and in Turkey............. 4 1.2. The Need for Assessing Vulnerabilities for Policy Development and
Implementation...................................................................................... 9 1.3. Description of the Problem and Its Context ........................................14 1.4. Scope, Approach and Method of the Study .........................................15 1.5. Structure of the Study .....................................................................17
2. SETTLEMENT LEVEL MANAGEMENT OF SEISMIC VULNERABILITIES AND RISKS
..............................................................................................................19
2.1. Risk Assessment Research and Studies ..............................................19 2.2. Settlement Level Vulnerability and Risk Mitigation Policies ...................23 2.3. Settlement Level Vulnerability and Risk Assessment Studies in Turkey and
Abroad .................................................................................................27
3. SEISMIC LOSS ESTIMATIONS IN SETTLEMENTS OF TURKEY .......................33
3.1. Seismic Hazard Probabilities of Settlements .......................................35 3.1.1. Different Measures of Seismic Hazard ..........................................39 3.1.2. Explanation of Erdik Rationale ....................................................45
3.2. Loss Levels in Building Stock ............................................................47 3.2.1. Loss Levels as a Function of Settlement Attributes ........................49 3.2.2. Building Loss Estimates as a Function of Likely Seismicity and
Building Categories ............................................................................65
ix
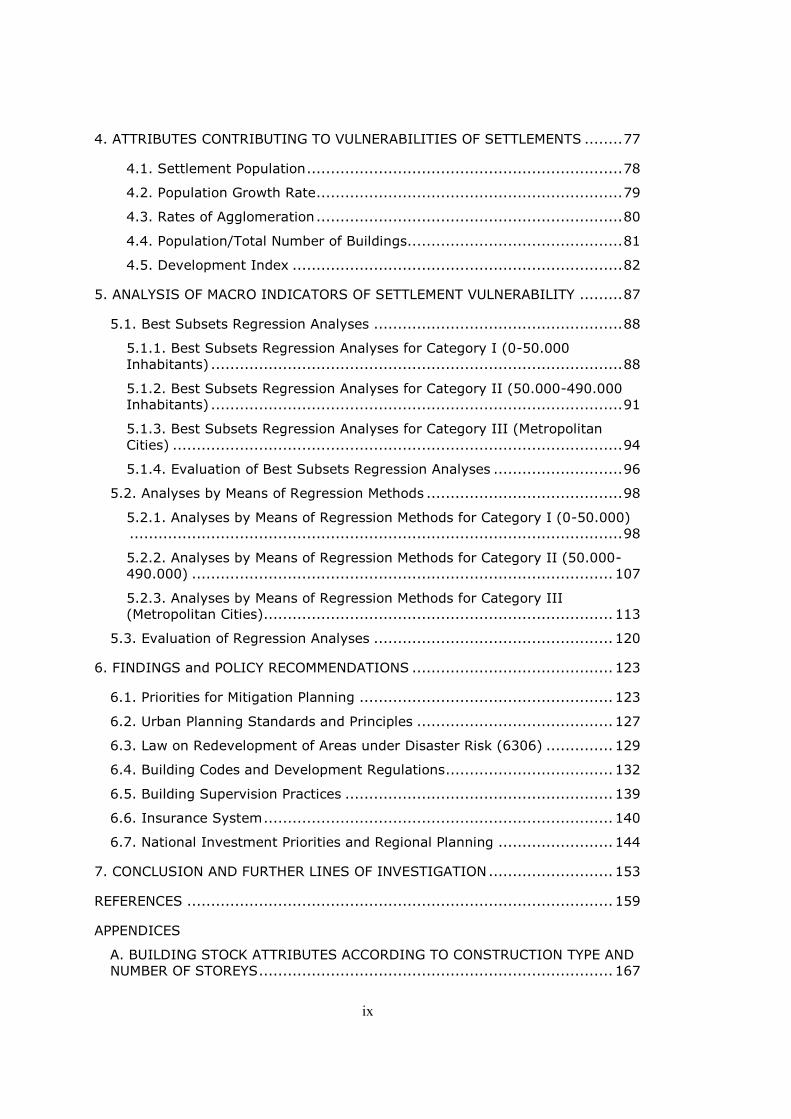
4. ATTRIBUTES CONTRIBUTING TO VULNERABILITIES OF SETTLEMENTS ........ 77
4.1. Settlement Population .................................................................. 78 4.2. Population Growth Rate ................................................................ 79 4.3. Rates of Agglomeration ................................................................ 80 4.4. Population/Total Number of Buildings............................................. 81 4.5. Development Index ..................................................................... 82
5. ANALYSIS OF MACRO INDICATORS OF SETTLEMENT VULNERABILITY ......... 87
5.1. Best Subsets Regression Analyses .................................................... 88 5.1.1. Best Subsets Regression Analyses for Category I (0-50.000
Inhabitants) ...................................................................................... 88 5.1.2. Best Subsets Regression Analyses for Category II (50.000-490.000
Inhabitants) ...................................................................................... 91 5.1.3. Best Subsets Regression Analyses for Category III (Metropolitan
Cities) .............................................................................................. 94 5.1.4. Evaluation of Best Subsets Regression Analyses ........................... 96
5.2. Analyses by Means of Regression Methods ......................................... 98 5.2.1. Analyses by Means of Regression Methods for Category I (0-50.000)
....................................................................................................... 98 5.2.2. Analyses by Means of Regression Methods for Category II (50.000-
490.000) ........................................................................................ 107 5.2.3. Analyses by Means of Regression Methods for Category III
(Metropolitan Cities)......................................................................... 113 5.3. Evaluation of Regression Analyses .................................................. 120
6. FINDINGS and POLICY RECOMMENDATIONS .......................................... 123
6.1. Priorities for Mitigation Planning ..................................................... 123 6.2. Urban Planning Standards and Principles ......................................... 127 6.3. Law on Redevelopment of Areas under Disaster Risk (6306) .............. 129 6.4. Building Codes and Development Regulations ................................... 132 6.5. Building Supervision Practices ........................................................ 139 6.6. Insurance System ......................................................................... 140 6.7. National Investment Priorities and Regional Planning ........................ 144
7. CONCLUSION AND FURTHER LINES OF INVESTIGATION .......................... 153
REFERENCES ......................................................................................... 159
APPENDICES
A. BUILDING STOCK ATTRIBUTES ACCORDING TO CONSTRUCTION TYPE AND
NUMBER OF STOREYS .......................................................................... 167
x
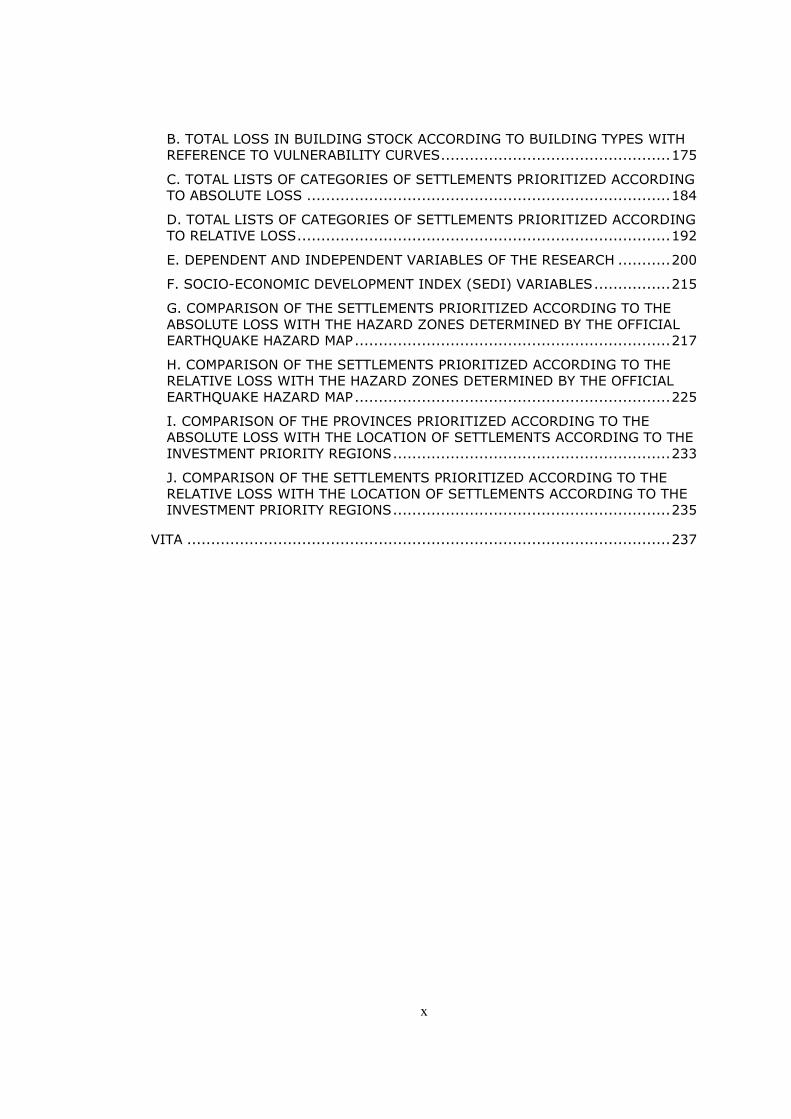
B. TOTAL LOSS IN BUILDING STOCK ACCORDING TO BUILDING TYPES WITH
REFERENCE TO VULNERABILITY CURVES ................................................ 175 C. TOTAL LISTS OF CATEGORIES OF SETTLEMENTS PRIORITIZED ACCORDING
TO ABSOLUTE LOSS ............................................................................ 184 D. TOTAL LISTS OF CATEGORIES OF SETTLEMENTS PRIORITIZED ACCORDING
TO RELATIVE LOSS .............................................................................. 192 E. DEPENDENT AND INDEPENDENT VARIABLES OF THE RESEARCH ........... 200 F. SOCIO-ECONOMIC DEVELOPMENT INDEX (SEDI) VARIABLES ................ 215 G. COMPARISON OF THE SETTLEMENTS PRIORITIZED ACCORDING TO THE
ABSOLUTE LOSS WITH THE HAZARD ZONES DETERMINED BY THE OFFICIAL
EARTHQUAKE HAZARD MAP .................................................................. 217 H. COMPARISON OF THE SETTLEMENTS PRIORITIZED ACCORDING TO THE
RELATIVE LOSS WITH THE HAZARD ZONES DETERMINED BY THE OFFICIAL
EARTHQUAKE HAZARD MAP .................................................................. 225 I. COMPARISON OF THE PROVINCES PRIORITIZED ACCORDING TO THE
ABSOLUTE LOSS WITH THE LOCATION OF SETTLEMENTS ACCORDING TO THE
INVESTMENT PRIORITY REGIONS .......................................................... 233 J. COMPARISON OF THE SETTLEMENTS PRIORITIZED ACCORDING TO THE
RELATIVE LOSS WITH THE LOCATION OF SETTLEMENTS ACCORDING TO THE
INVESTMENT PRIORITY REGIONS .......................................................... 235
VITA ..................................................................................................... 237
xi
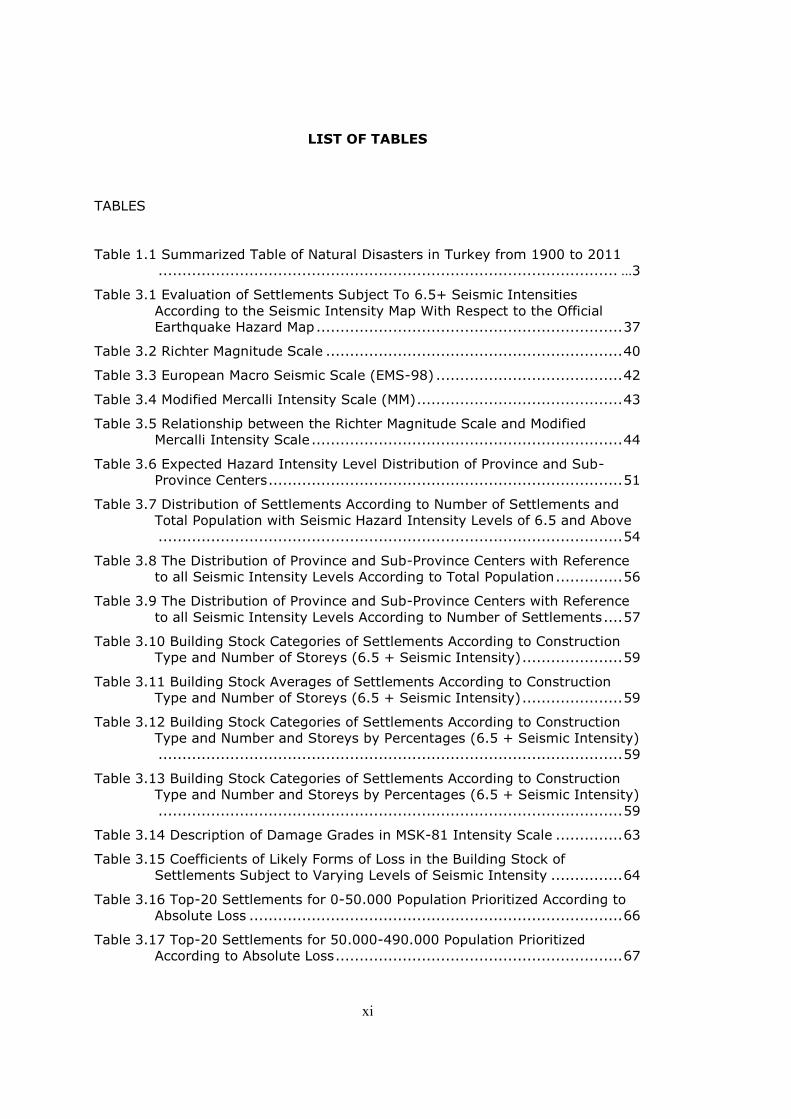
LIST OF TABLES
TABLES
Table 1.1 Summarized Table of Natural Disasters in Turkey from 1900 to 2011
................................................................................................ …3 Table 3.1 Evaluation of Settlements Subject To 6.5+ Seismic Intensities
According to the Seismic Intensity Map With Respect to the Official
Earthquake Hazard Map ................................................................ 37 Table 3.2 Richter Magnitude Scale .............................................................. 40 Table 3.3 European Macro Seismic Scale (EMS-98) ....................................... 42 Table 3.4 Modified Mercalli Intensity Scale (MM) ........................................... 43 Table 3.5 Relationship between the Richter Magnitude Scale and Modified
Mercalli Intensity Scale ................................................................. 44 Table 3.6 Expected Hazard Intensity Level Distribution of Province and Sub-
Province Centers .......................................................................... 51 Table 3.7 Distribution of Settlements According to Number of Settlements and
Total Population with Seismic Hazard Intensity Levels of 6.5 and Above
................................................................................................. 54 Table 3.8 The Distribution of Province and Sub-Province Centers with Reference
to all Seismic Intensity Levels According to Total Population .............. 56 Table 3.9 The Distribution of Province and Sub-Province Centers with Reference
to all Seismic Intensity Levels According to Number of Settlements .... 57 Table 3.10 Building Stock Categories of Settlements According to Construction
Type and Number of Storeys (6.5 + Seismic Intensity) ..................... 59 Table 3.11 Building Stock Averages of Settlements According to Construction
Type and Number of Storeys (6.5 + Seismic Intensity) ..................... 59 Table 3.12 Building Stock Categories of Settlements According to Construction
Type and Number and Storeys by Percentages (6.5 + Seismic Intensity)
................................................................................................. 59 Table 3.13 Building Stock Categories of Settlements According to Construction
Type and Number and Storeys by Percentages (6.5 + Seismic Intensity)
................................................................................................. 59 Table 3.14 Description of Damage Grades in MSK-81 Intensity Scale .............. 63 Table 3.15 Coefficients of Likely Forms of Loss in the Building Stock of
Settlements Subject to Varying Levels of Seismic Intensity ............... 64 Table 3.16 Top-20 Settlements for 0-50.000 Population Prioritized According to
Absolute Loss .............................................................................. 66 Table 3.17 Top-20 Settlements for 50.000-490.000 Population Prioritized
According to Absolute Loss ............................................................ 67
xii
Table 3.18 Metropolitan Provinces Prioritized According to Absolute Loss Levels.
.................................................................................................68 Table 3.19 Average Absolute Loss According to the Settlement Categories .......68 Table 3.20 Top-20 Settlements for 0-50.000 Population Prioritized According to
Relative Loss ...............................................................................70 Table 3.21 Top-20 Settlements for 50.000-490.000 Population Prioritized
According to Relative Loss .............................................................71 Table 3.22 Metropolitan Provinces Prioritized According to Relative Loss Levels 72 Table 3.23 Average Relative Loss According to the Settlement Categories .......72 Table 3.24 Dependent Variables of the top-20 Settlements for 0-50.000
Population ...................................................................................74 Table 3.25 Dependent Variables of the top-20 Settlements for 50.000 – 490.000
Population ...................................................................................75 Table 3.26 Dependent Variables of the Research for Metropolitan Cities ............75 Table 4.1 Average Values of Population in Settlement Categories ....................78 Table 4.2 Average Values of Population Growth Rates in Settlement Categories 79 Table 4.3 Average Values of Agglomeration Rates in Settlement Categories .....80 Table 4.4 Population Density in Settlement Categories ..................................81 Table 4.5 Average Values of Development Index in Settlement Categories .......82 Table 4.6 Independent Variables of the Top-20 Settlements for 0-50.000
Population ...................................................................................83 Table 4.7 Independent Variables of the Top-20 Settlements for 50.000 – 490.000
Population ...................................................................................84 Table 4.8 Independent Variables for Metropolitan Cities ..................................85 Table 5.1 Dependent and Independent Variables of the Top-20 Settlements for
Category I ...................................................................................89 Table 5.2 Best Subsets Regression 1: Y1 versus x1; x2; x3; x4; x5 ................90 Table 5.3 Best Subsets Regression 2: Y2 versus x1; x2; x3; x4; x5 ................90 Table 5.4 Dependent and Independent Variables of the Top-20 Settlements for
Category II .................................................................................92 Table 5.5 Best Subsets Regression 3: Y1 versus x1; x2; x3; x4; x5 ................93 Table 5.6 Best Subsets Regression 4: Y2 versus x1; x2; x3; x4; x5 ................93 Table 5.7 Dependent and Independent Variables of the Top-20 Settlements for
Category II .................................................................................94 Table 5.8 Best Subsets Regression 5: Y1 versus x1; x2; x3; x4; x5 ................95 Table 5.9 Best Subsets Regression 6: Y2 versus x1; x2; x3; x4; x5 ................96 Table 5.10 Evaluation of Best Subsets Regression Analyses ...........................97 Table 5.11 Regression Analysis 1: Y1 versus X1 ...........................................98 Table 5.12 Regression Analysis 2: Y1 versus X5 ......................................... 100
xiii
Table 5.13 Regression Analysis 3: Y2 versus X1 ......................................... 101 Table 5.14 Regression Analysis 4: Y2 versus X3 ......................................... 103 Table 5.15 Regression Analysis 5: Y2 versus X4 ......................................... 104 Table 5.16 Regression Analysis 6: Y2 versus X5 ......................................... 106 Table 5.17 Regression Analysis 7: Y1 versus X2 ......................................... 108 Table 5.18 Regression Analysis 8: Y1 versus X4 ......................................... 109 Table 5.19 Regression Analysis 9: Y2 versus X1 ......................................... 111 Table 5.20 Regression Analysis 10: Y2 versus X4 ....................................... 112 Table 5.21 Regression Analysis 11: Y1 versus X1 ....................................... 114 Table 5.22 Regression Analysis 12: Y1 versus X3 ....................................... 115 Table 5.23 Regression Analysis 13: Y1 versus X4 ....................................... 117 Table 5.24 Regression Analysis 14: Y2 versus X3 ....................................... 118 Table 5.25 Regression Analysis 15: Y2 versus X4 ....................................... 119 Table 5.26 Evaluation of Regression Analyses ............................................ 121 Table 6.1 Top-20 Settlements Prioritized According to Absolute Loss that
Mitigation Plans Should be Compulsory ......................................... 125 Table 6.2 Metropolitan Provinces Prioritized According to Absolute Loss that
Mitigation Plans Should be Compulsory ......................................... 125 Table 6.3 Top-20 Settlements Prioritized According to Relative Loss that
Mitigation Plans Should be Compulsory ......................................... 126 Table 6.4 Metropolitan Provinces Prioritized According to Relative Loss that
Mitigation Plans Should be Compulsory ......................................... 126 Table 6.5 Key events in the evolution of seismic design codes in Turkey ........ 132 Table 6.6 The Effective Ground Acceleration Coefficient ............................... 133 Table 6.7 Evaluation of the Top-20 Settlements Prioritized According to the
Absolute Loss with respect to the Hazard Zones Determined by the
Official Earthquake Hazard Map ................................................... 134 Table 6.8 Comparison of the Top-20 Settlements Prioritized According to the
Relative Loss with the Hazard Zones Determined by the Official
Earthquake Hazard Map .............................................................. 137 Table 6.9 Rates of Compulsory Earthquake Insurance Scheme ..................... 140 Table 6.10 Comparison of the Top-20 Settlements Prioritized According to the
Absolute Loss with the Hazard Zones Determined by the Official
Earthquake Hazard Map .............................................................. 142 Table 6.11 Comparison of the Top-20 Settlements Prioritized According to the
Relative Loss with the Hazard Zones Determined by the Official
Earthquake Hazard Map .............................................................. 143 Table 6.12 Comparisons of the Top-20 Settlements Prioritized According to the
Absolute Loss with the Location of Settlements According to the
Investment Priority Regions ........................................................ 146

xiv
Table 6.13 High Risk Settlements Located in the Region Six Prioritized According
to the Absolute Loss ................................................................... 149 Table 6.14 Comparison of the Top-20 Settlements Prioritized According to the
Relative Loss with the Location of Settlements According to the
Investment Priority Regions......................................................... 150
xv
LIST OF FIGURES
FIGURES
Figure 1.1 Trends in Occurrence and Victims ................................................. 1 Figure 1.2 Relative Vulnerability for Earthquakes 1980-2000........................... 3 Figure 1.3 Absolute and Relative Mortality Risk for Earthquakes ...................... 4 Figure 1.4 Vulnerabilities in Plan Making and Building Construction Functions .... 8 Figure 1.5 Chronology of International Disaster Management Policy Development
Process ....................................................................................... 10 Figure 1.6 Expected Outcome, Strategic Goals and Priorities for Action 2005-
2015 .......................................................................................... 12 Figure 1.7 Variables of the Research ........................................................... 16 Figure 1.8 Structure of the Study ............................................................... 18 Figure 2.1 Basic Stages in a Risk Assessment Process ................................... 20 Figure 2.2 Questions to Ask In a Risk Assessment Process ............................. 21 Figure 2.3 Priorities in Risk Management ..................................................... 22 Figure 3.1 Dependent and Independent Variables of the Research .................. 34 Figure 3.2 Earthquake Hazard Zoning Map of Turkey .................................... 35 Figure 3.3 Intensity Distributions for 72 Years and %50 Probability ................ 36 Figure 3.4 Evaluation of Settlements Subject To 6.5+ Seismic Intensities
According To the Seismic Intensity Map with Respect to the Official
Earthquake Hazard Map ................................................................ 38 Figure 3.5 The Richter, Modified Mercalli and the Moment Magnitude Scales .... 44 Figure 3.6 Flow Chart of Settlement Level Loss Determination ....................... 48 Figure 3.7 Intensity Distributions for 72 Years and %50 Probability ................ 49 Figure 3.8 Spatial distributions of 72-year return period intensity and 50%
probability and distribution of settlements ....................................... 50 Figure 3.9 Expected Hazard Intensity Level Distributions of Province and Sub-
Province Centers .......................................................................... 51 Figure 3.10 The Frequency Distribution of Province and Sub-Province Centers
According to Population ................................................................ 53 Figure 3.11 The Frequency Distribution of Province and Sub-Province Centers
According to Number of Settlements .............................................. 53 Figure 3.12 The Distribution of Province and Sub-Province Centers According to
Number of Settlements ................................................................. 54 Figure 3.13 The Distribution of Province and Sub-Province Centers According to
Total Population ........................................................................... 54 Figure 3.14 Spatial Distributions of Settlement Categories ............................. 55
xvi
Figure 3.15 The Distribution of Province and Sub-Province Centers with
Reference to all Seismic Intensity Levels According to Total Population
.................................................................................................56 Figure 3.16 The Distribution of Province and Sub-Province Centers with
Reference to all Seismic Intensity Levels According to Number of
Settlements .................................................................................57 Figure 3.17 Intensity Based Vulnerability Curves for Load-Bearing and Low-Rise
Reinforced Concrete Frame Type Buildings ......................................60 Figure 3.18 Intensity Based Vulnerability Curves for Mid-Rise Reinforced
Concrete Frame Type Buildings ......................................................61 Figure 3.19 Intensity Based Vulnerability Curves for High-Rise Reinforced
Concrete Frame Type Buildings ......................................................61 Figure 3.20 Classification of Damage to Reinforced Concrete Buildings ............62 Figure 3.21 Absolute Building Loss Distributions ...........................................69 Figure 3.22 Relative Building Loss/ Loss Rate Distributions ............................73 Figure 4.1 Urban Population Distributions ....................................................78 Figure 4.2 Population Growth Rates ............................................................79 Figure 4.3 Urban Agglomeration .................................................................80 Figure 4.4 Population per Buildings .............................................................81 Figure 4.5 Development Index ...................................................................82 Figure 5.1 Vulnerability Measures and Assumed Contributing Attributes Overview
.................................................................................................87 Figure 5.2 An Example For The Best Subset Regression Analyses ....................88 Figure 5.3 Regression Analysis 1: Y1 versus X1 ............................................99 Figure 5.4 Regression Analysis 2: Y1 versus X5 .......................................... 100 Figure 5.5 Regression Analysis 3: Y2 versus X1 .......................................... 102 Figure 5.6 Regression Analysis 4: Y2 versus X3 .......................................... 103 Figure 5.7 Regression Analysis 5: Y2 versus X4 .......................................... 105 Figure 5.8 Regression Analysis 6: Y2 versus X5 .......................................... 106 Figure 5.9 Regression Analysis 7: Y1 versus X2 .......................................... 108 Figure 5.10 Regression Analysis 8: Y1 versus X4 ........................................ 110 Figure 5.11 Regression Analysis 9: Y2 versus X1 ........................................ 111 Figure 5.12 Regression Analysis 10: Y2 versus X4 ...................................... 113 Figure 5.13 Regression Analysis 11: Y1 versus X1 ...................................... 114 Figure 5.14 Regression Analysis 12: Y1 versus X3 ...................................... 116 Figure 5.15 Regression Analysis 13: Y1 versus X4 ...................................... 117 Figure 5.16 Regression Analysis 14: Y2 versus X3 ...................................... 118 Figure 5.17 Regression Analysis 15: Y2 versus X4 ...................................... 120
xvii
Figure 6.1 Evaluation of the Top-20 Settlements Prioritized According to the
Absolute Loss with Respect to the Hazard Zones Determined by the
Official Earthquake Hazard Map ................................................... 135 Figure 6.2 Evaluation of the Top-20 Settlements Prioritized According to the
Relative Loss with Respect to the Hazard Zones Determined by the
Official Earthquake Hazard Map ................................................... 138 Figure 6.3 Investment Priority Regions ...................................................... 145 Figure 6.4 Evaluation of the Top-20 Settlements Prioritized According to the
Absolute Loss with Respect to Investment Priority Region ............... 148 Figure 6.5 Evaluation of the Top-20 Settlements Prioritized According to the
Relative Loss with Respect to Investment Priority Regions............... 151 Figure 6.6 Evaluation of Development Index Rates with Respect to the
Investment Priority Regions ........................................................ 152
xviii
LIST OF ABBREVIATIONS
ADPC Asian Disaster Preparedness Centre
AEL Annualized Earthquake Loss
AELR Annualized Earthquake Loss Ratio
AFDB African Development Bank
CGS California Geological Survey
CRED Centre for Research on the Epidemiology of Disasters
DMA-2000 Disaster Mitigation Act of America
DRM World Institute for Disaster Risk Management
DRR Disaster Risk Reduction
EM-DAT Emergency Events Database
EMPI Earthquake Master Plan of Istanbul
(Istanbul Deprem Master Planı - IDMP)
EMS European Macro Seismic Scale
FEMA Federal Emergency Management Agency
GAR Global Assessment Report on Disaster Risk Reduction
GDCD General Directorate of Civil Defense
(Sivil Savunma Genel Müdürlüğü - SSGM)
GDDA General Directorate of Disaster Affairs
(Afet ĠĢleri Genel Müdürlüğü - AIGM)
HAZUS Hazards United States
IATF/DR Inter-Agency Task Force on Disaster Reduction
ICPD International Conference on Population and Development
IDNDR International Decade for Natural Disaster Reduction
IFRC International Federation of Red Cross and Red Crescent Societies
ISDR International Strategy for Disaster Reduction
xix
ISMEP Istanbul Seismic Risk Mitigation and Emergency Preparedness
Project
JICA Japan International Cooperation Agency
KOERI Kandilli Observatory and Earthquake Research Institute
(Kandilli Rasathanesi ve Deprem AraĢtırma Enstitüsü)
LESSLOSS Risk Mitigation for Earthquakes and Landslides Project
MDG Millennium Development Goals
MEU Ministry of Environment and Urbanism
MSK Medvedev – Sponheuer - Karnik Scale
NAF North Anatolian Fault Line
(Kuzey Anadolu Fay Hattı - KAF)
NGO Non-governmental Organization
(Sivil Toplum Örgütleri - STK)
PGA Peak Ground Acceleration
R-Sq (adj.) Adjusted R-Square
SEDI Socio-Economic Development Index
SPO State Planning Organization
TCIP Turkish Catastrophe Insurance Pool
(Doğal Afet Sigortalar Kurumu - DASK)
TEFER Turkey Emergency Flood and Earthquake Recovery
TEMAD Turkish Emergency Management General Directorate
(Türkiye Acil Durum Yönetimi Genel Müdürlüğü - TAY)
TURKSTAT Turkish Statistical Institute
(Türkiye Ġstatistik Kurumu - TÜĠK)
UCTEA Union of Chambers of Turkish Engineers and Architects
(Türk Mühendis ve Mimar Odaları Birliği - TMMOB)
UN United Nations
UN/ISDR United Nations Inter-Agency Secretariat for the ISDR
UNDP United Nations Development Program
USGS United States Geological Survey

xx
WCDR Word Conference on Disaster Reduction
WSSD World Summit for Social Development
WSSD World Summit on Sustainable Development

xxi
1
CHAPTER 1
VULNERABILITIES AND RISKS IN SETTLEMENTS
Over the past decade, countries across the world have witnessed thousands of
major natural disasters that threaten the sustainability of cities, disrupting their
resources and affecting millions of people through losses of life, serious injury
and loss of assets and livelihoods. The number of reported natural disasters and
their impact on human and economic development worldwide has been
increasing yearly and shows a relentless upward movement. The well-known
statistical analysis of the Munich-Re Geo Risk Research Group shows a threefold
increase in the occurrence of extreme natural hazard events and an
approximately sixfold increase in associated economic damages over the last
three decades.
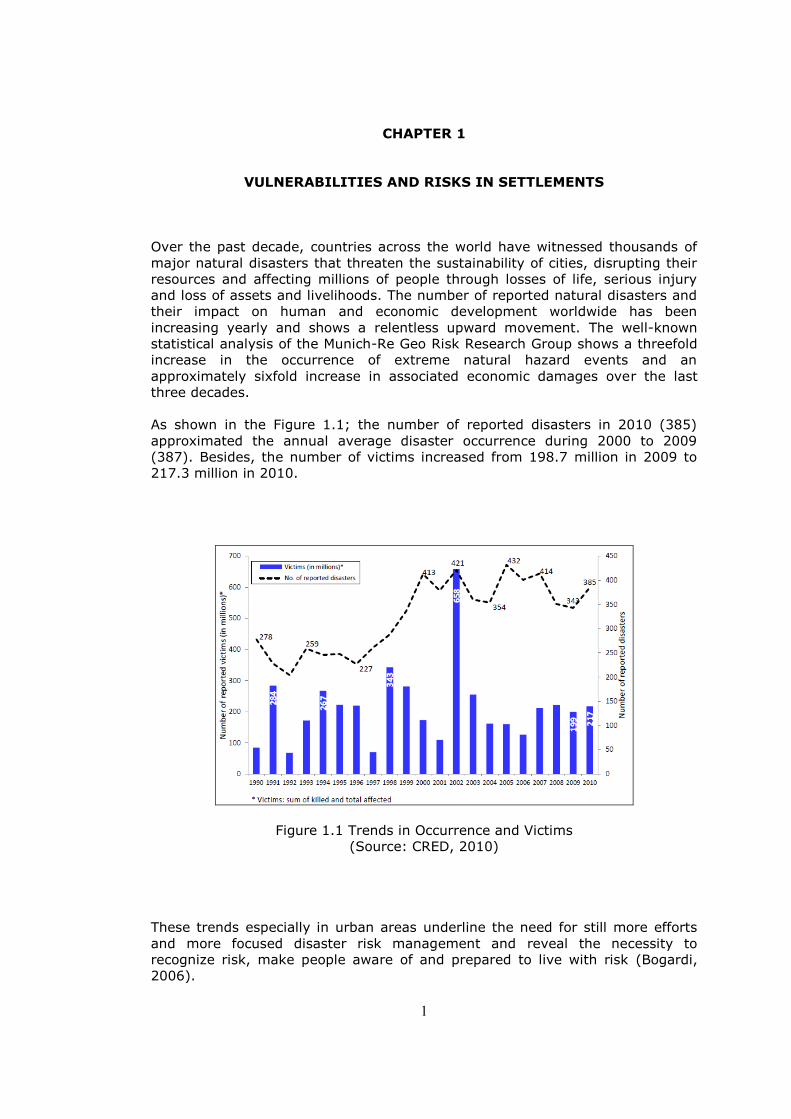
As shown in the Figure 1.1; the number of reported disasters in 2010 (385)
approximated the annual average disaster occurrence during 2000 to 2009
(387). Besides, the number of victims increased from 198.7 million in 2009 to
217.3 million in 2010.
Figure 1.1 Trends in Occurrence and Victims
(Source: CRED, 2010)
These trends especially in urban areas underline the need for still more efforts
and more focused disaster risk management and reveal the necessity to
recognize risk, make people aware of and prepared to live with risk (Bogardi,
2006).
2
―The ongoing impacts of disasters have contributed to an increasing perception
of human vulnerability to multiple hazards that can negatively impact assets and
livelihoods among many people in many places around the world. As a result,
there is increasing interest in how to build resilience to multiple hazards/risks at
individual, household, community, local, national and international levels‖
(Siegel, 2011).
According to McEntire (2001) our attitude toward disasters has evolved from a
fatalistic fear of ‗Acts of God‘ to a broader understanding of the role human
decisions play in determining our vulnerability and capacity to cope with the
consequences of extreme events. In fact, we can say that there has been a
major paradigm shift in the development community to increasingly focus
attention on causes of human vulnerability and on building resilience. In other
words the paradigm shifts from relief and response to mitigation, risk
assessment and disaster risk management.
Today, there is increasing recognition that risk and vulnerability are crucial
elements in reducing the negative impacts of hazards and thus essential to the
achievement of sustainable development. This makes natural disaster risk
reduction and mitigation ranks among the top 10 most important and urgent
global issues of the twenty-first century.
As the number of events and the losses from disasters are increasing worldwide,
natural disaster events occurred in Turkey are increasing as well. When we
examine the natural disaster profile of Turkey we can easily say that ―Turkey is a
disaster-prone country and has always been vulnerable to various kinds of
natural hazards, because of its geology, topography and meteorological
conditions. These hazards, coupled with high physical and social vulnerability,
have caused excessive losses of life, injury and damage to property‖ (Jica,
2004).
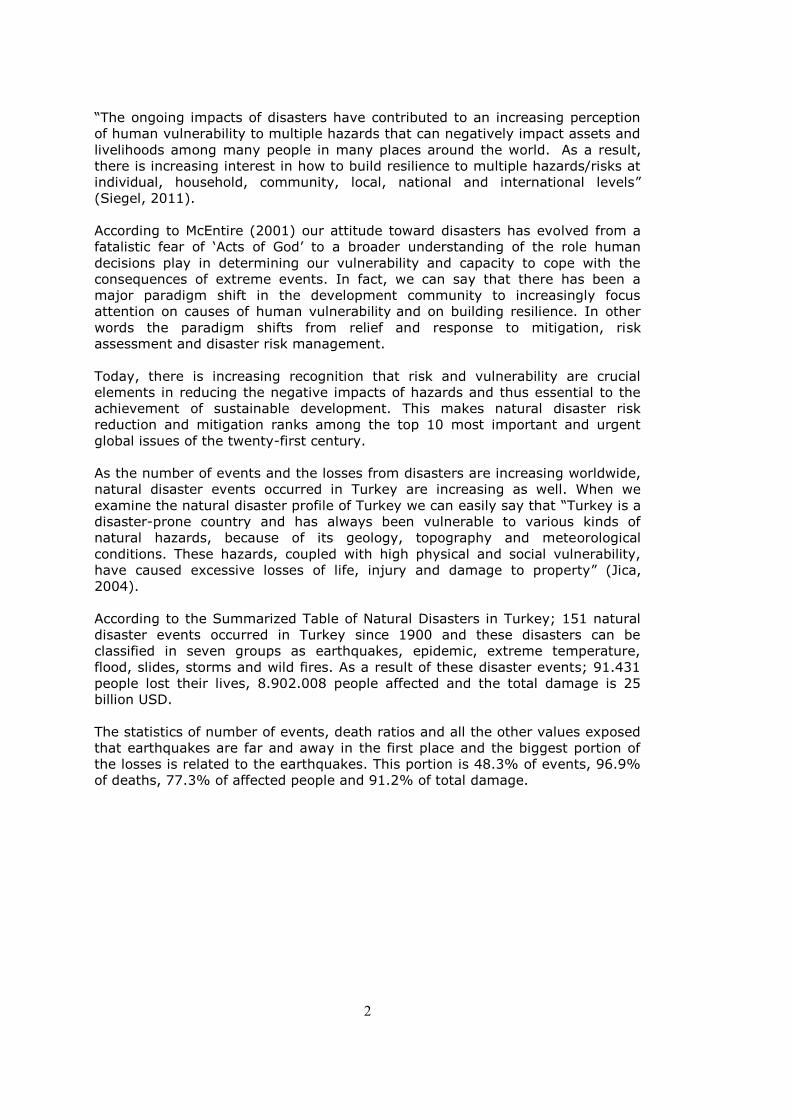
According to the Summarized Table of Natural Disasters in Turkey; 151 natural
disaster events occurred in Turkey since 1900 and these disasters can be
classified in seven groups as earthquakes, epidemic, extreme temperature,
flood, slides, storms and wild fires. As a result of these disaster events; 91.431
people lost their lives, 8.902.008 people affected and the total damage is 25
billion USD.
The statistics of number of events, death ratios and all the other values exposed
that earthquakes are far and away in the first place and the biggest portion of
the losses is related to the earthquakes. This portion is 48.3% of events, 96.9%
of deaths, 77.3% of affected people and 91.2% of total damage.
3
Table 1.1 Summarized Table of Natural Disasters in Turkey from 1900 to 2011
(Source: EM-DAT, 2011)
Number
of Events Killed
Total Affected
Damage US$ (000's)
Earthquake 73 88.589 6880841 22941400
Epidemic 8 613 204855 0
Extreme Temp. 7 100 8450 1000
Flood 37 1.321 1778517 2195500
Slides 12 693 14556 26000
Storm 9 100 13639
Wild Fires 5 15 1150 2200
As seen above, the disaster history of Turkey is dominated by earthquakes and
earthquake is a synonym with the concept of disaster in Turkey.
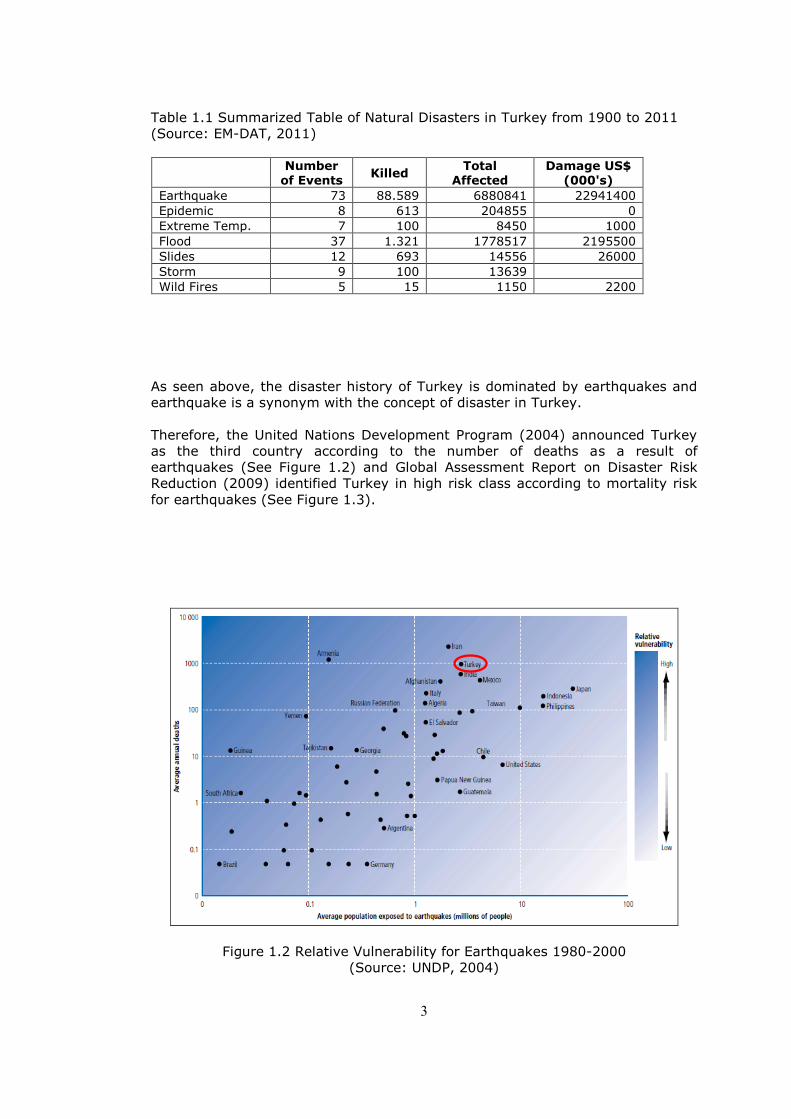
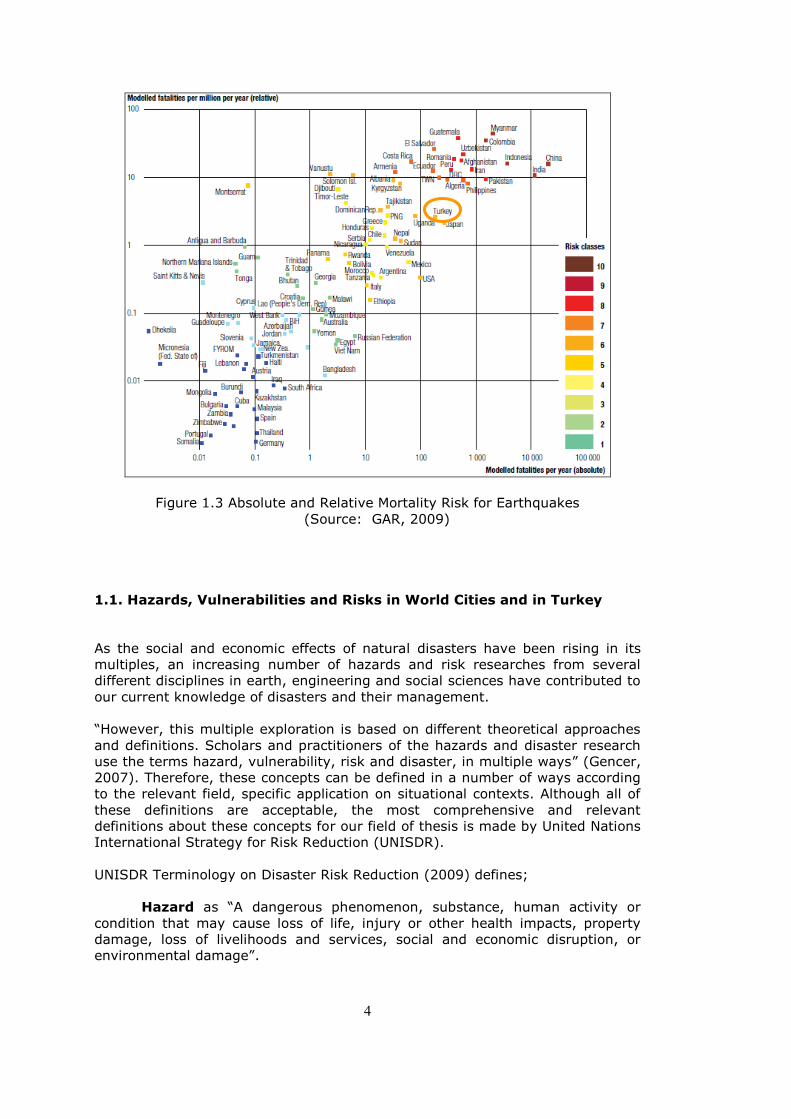
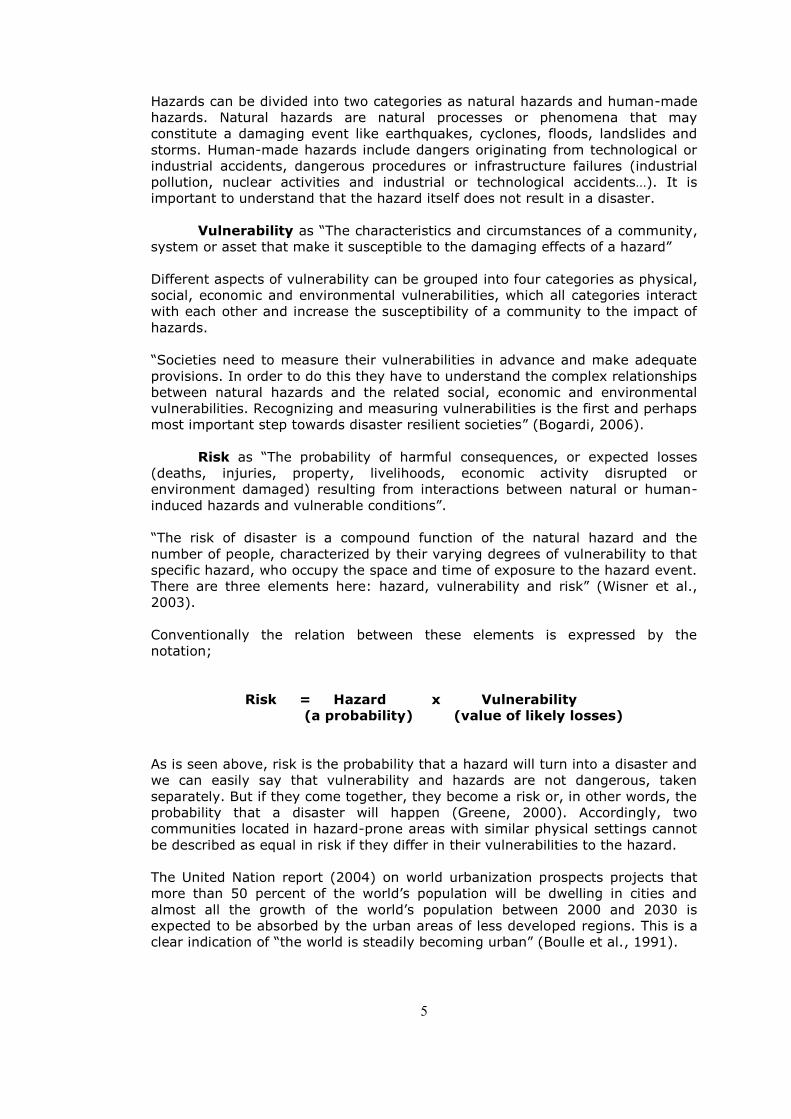
Therefore, the United Nations Development Program (2004) announced Turkey
as the third country according to the number of deaths as a result of
earthquakes (See Figure 1.2) and Global Assessment Report on Disaster Risk
Reduction (2009) identified Turkey in high risk class according to mortality risk
for earthquakes (See Figure 1.3).
Figure 1.2 Relative Vulnerability for Earthquakes 1980-2000
(Source: UNDP, 2004)
4
Figure 1.3 Absolute and Relative Mortality Risk for Earthquakes
(Source: GAR, 2009)
1.1. Hazards, Vulnerabilities and Risks in World Cities and in Turkey
As the social and economic effects of natural disasters have been rising in its
multiples, an increasing number of hazards and risk researches from several
different disciplines in earth, engineering and social sciences have contributed to
our current knowledge of disasters and their management.
―However, this multiple exploration is based on different theoretical approaches
and definitions. Scholars and practitioners of the hazards and disaster research
use the terms hazard, vulnerability, risk and disaster, in multiple ways‖ (Gencer,
2007). Therefore, these concepts can be defined in a number of ways according
to the relevant field, specific application on situational contexts. Although all of
these definitions are acceptable, the most comprehensive and relevant
definitions about these concepts for our field of thesis is made by United Nations
International Strategy for Risk Reduction (UNISDR).
UNISDR Terminology on Disaster Risk Reduction (2009) defines;
Hazard as ―A dangerous phenomenon, substance, human activity or
condition that may cause loss of life, injury or other health impacts, property
damage, loss of livelihoods and services, social and economic disruption, or
environmental damage‖.
5
Hazards can be divided into two categories as natural hazards and human-made
hazards. Natural hazards are natural processes or phenomena that may
constitute a damaging event like earthquakes, cyclones, floods, landslides and
storms. Human-made hazards include dangers originating from technological or
industrial accidents, dangerous procedures or infrastructure failures (industrial
pollution, nuclear activities and industrial or technological accidents…). It is
important to understand that the hazard itself does not result in a disaster.
Vulnerability as ―The characteristics and circumstances of a community,
system or asset that make it susceptible to the damaging effects of a hazard‖
Different aspects of vulnerability can be grouped into four categories as physical,
social, economic and environmental vulnerabilities, which all categories interact
with each other and increase the susceptibility of a community to the impact of
hazards.
―Societies need to measure their vulnerabilities in advance and make adequate
provisions. In order to do this they have to understand the complex relationships
between natural hazards and the related social, economic and environmental
vulnerabilities. Recognizing and measuring vulnerabilities is the first and perhaps
most important step towards disaster resilient societies‖ (Bogardi, 2006).
Risk as ―The probability of harmful consequences, or expected losses
(deaths, injuries, property, livelihoods, economic activity disrupted or
environment damaged) resulting from interactions between natural or human-
induced hazards and vulnerable conditions‖.
―The risk of disaster is a compound function of the natural hazard and the
number of people, characterized by their varying degrees of vulnerability to that
specific hazard, who occupy the space and time of exposure to the hazard event.
There are three elements here: hazard, vulnerability and risk‖ (Wisner et al.,
2003).
Conventionally the relation between these elements is expressed by the
notation;
Risk = Hazard x Vulnerability
(a probability) (value of likely losses)
As is seen above, risk is the probability that a hazard will turn into a disaster and
we can easily say that vulnerability and hazards are not dangerous, taken
separately. But if they come together, they become a risk or, in other words, the
probability that a disaster will happen (Greene, 2000). Accordingly, two
communities located in hazard-prone areas with similar physical settings cannot
be described as equal in risk if they differ in their vulnerabilities to the hazard.
The United Nation report (2004) on world urbanization prospects projects that
more than 50 percent of the world‘s population will be dwelling in cities and
almost all the growth of the world‘s population between 2000 and 2030 is
expected to be absorbed by the urban areas of less developed regions. This is a
clear indication of ―the world is steadily becoming urban‖ (Boulle et al., 1991).
6
―Urbanization process increases vulnerability to natural disasters through the
concentration of people and assets‖ (Quarantelli 2003). The increasing urban risk
results in vicious circle of disasters affecting urbanization and urbanization
affecting disasters (Pelling 2003).
By their nature, cities are particularly vulnerable to natural hazards. Many of the
elements that define cities also contribute to their vulnerability. One of the key
elements to reduce disaster risk is to better understand how urban areas are at
risk and how these patterns of risk differ from rural areas. ―Under conventional
understanding of disasters, public authorities and some of the professional
approaches tend to assume that cities are only agglomerations of individual
buildings and methods to achieve robust buildings would therefore suffice for
seismic safety in a city. This is a misconception. Cities as distinct physical
systems have their own complex functional integrity and are subject to failure
should any of the sub-components receive a natural or human-made hazard
impact. Cities are vulnerable in very many different ways, and manifest a
multitude of risks‖ (Balamir, 2007).
Factors contributing to the increasing vulnerability of urban areas are a complex
set of interrelated processes, including: the concentration of people and assets,
the location of urban centers, the rapid growth of urban areas and unplanned
urbanization, the modification of the built and natural environment through
human actions, poverty and other social vulnerabilities and weak urban
governance (ADPC, 2010).
―Urban stock texture, networks, distribution of land-uses, public facilities, their
interaction with hazard prone locations, size of population served and many
other factors have interdependent impacts on the vulnerabilities or resilience of
settlements‖ (Prota, 2011). The risk in urban centers is compounded due to
unplanned urbanization, development within high risk zones, lack of adherence
to building codes, deficient urban management practices and inappropriate
construction practices (Lewis and Mioch, 2005).
According to Pelling (2007), ―Cities are better described as hotspots of disaster
risk. Risk comes from increasing poverty and inequality and failures in
governance, high population density, crowded living conditions and the
residential areas close to hazardous industry or in places exposed to natural
hazard‖.
The way in which cities are planned and built also contributes to urban
vulnerability. Because resistance to natural hazards is rarely built into new
construction and redundancy schemes are rarely incorporated into infrastructure,
failure of a particular building or system in the event of a disaster can mean
tremendous losses. ―Nearsighted land-use planning puts people in harm‘s way,
while a lack of commitment to mitigation leaves inhabitants to bear the full
impact of disaster losses‖ (McBean and Henstra, 2003).
―Sectors of risk are distinctly manageable clusters of vulnerabilities at the city-
level for which a coordinated action is necessary. Different levels of spatial units
(national, regional, city, local) could have entirely different sets of vulnerability
and risk definitions, definitely different from risks at the building level‖ (Balamir,
2007). As cities have their own complex functional integrity, they are vulnerable
in very different ways and very different risk sectors. Risk sectors are areas of
causal relations on specific risks according to Earthquake Master Plan of Istanbul
(EMPI).
7
More than a dozen of city-level risk-sectors have been identified in Istanbul.
Risk-Sectors of EMPI are given below;
Risks in Macro-Form and Growth Tendencies (settlement configuration
alternatives)
Urban Fabric Risks (building height/proximity, plots, density, roads, car-
parks, etc.)
Incompatible Land-Use Risks (buildings and districts)
Risks of Productivity Loss (industrial plants)
Risks in the Building Stock, Infrastructure and Lifelines
Risks in Emergency Facilities and Lifelines (hospitals, schools, etc.)
Special Risk Areas/ Special Buildings (landslide, flooding/historic buildings)
Risks in Hazardous Uses (LPG and petrol stations, etc.)
Open Space Deficiency Risks
Besides these risk sectors Balamir (2009) defines some of the city level risks in
Turkey as;
―Hazardous locations of cities are historically inherited but it is the
manner of our urbanization and deceptively convenient reinforced concrete
structures produced at unprecedented rates without supervision that make them
deep risk pools. Deficient open spaces, haphazard infrastructure, dangerous
neighboring, illogical locationing of emergency facilities, uncontrolled industrial
units are some of the city level risks directly related to physical planning.
Administrative incapabilities and inert public attitudes are almost genetically
programmed.‖
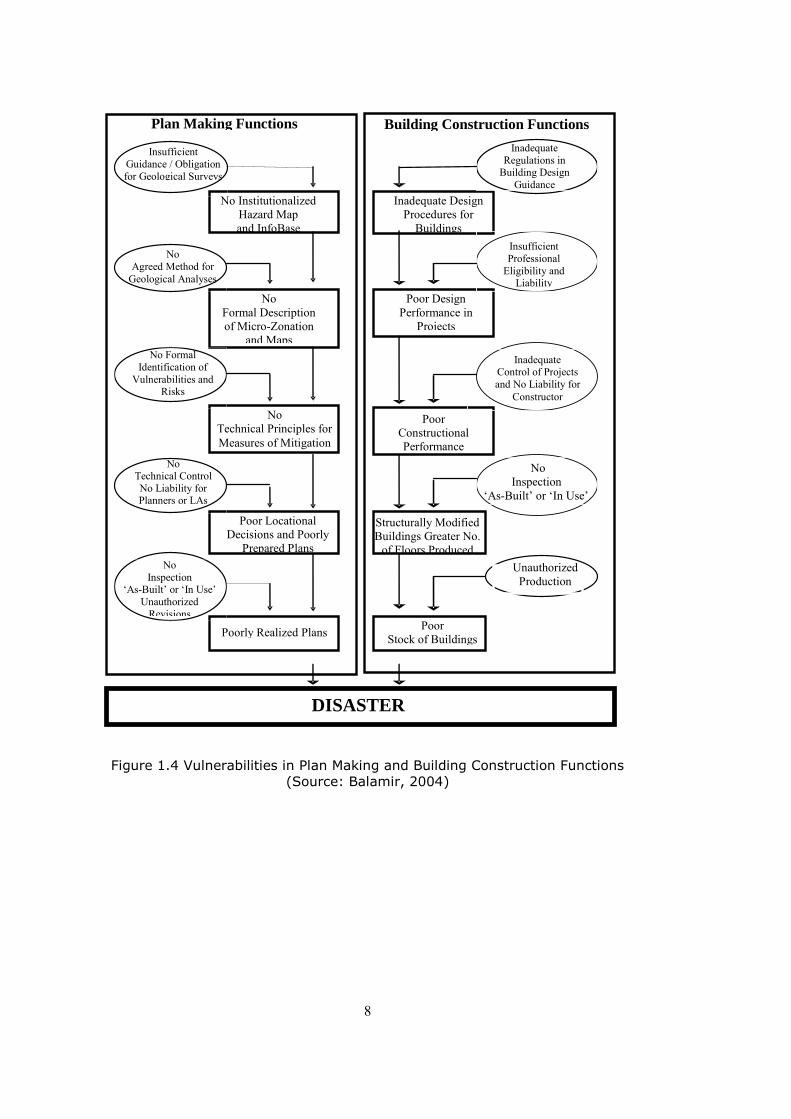
The deficiences in urban planning and building construction systems and the
factors that make these processes more vulnerable is defined by Balamir (2004)
as follows. It ―indicates how over the decades, the urban planning system in
Turkey has been left vacuously devoid of any concern in its provisions and
procedures of tools and means for maintaining seismic safety‖ (Balamir, 2004).
8
Figure 1.4 Vulnerabilities in Plan Making and Building Construction Functions
(Source: Balamir, 2004)
No Formal Identification of
Vulnerabilities and Risks
Inadequate Control of Projects and No Liability for
Constructor
Plan Making Functions
Building Construction Functions
No Institutionalized Hazard Map and InfoBase
Insufficient Guidance / Obligation for Geological Surveys
No Formal Description of Micro-Zonation
and Maps
No Technical Principles for Measures of Mitigation
Poor Locational Decisions and Poorly
Prepared Plans
No Technical Control No Liability for Planners or LAs
No Agreed Method for
Geological Analyses
Poorly Realized Plans
No Inspection
‘As-Built’ or ‘In Use’ Unauthorized
Revisions
Inadequate Design Procedures for
Buildings
Inadequate Regulations in
Building Design Guidance
No Inspection
‘As-Built’ or ‘In Use’
Poor Stock of Buildings
Poor Design Performance in
Projects
Structurally Modified Buildings Greater No.
of Floors Produced
Unauthorized Production
DISASTER
Poor Constructional Performance
Insufficient Professional
Eligibility and Liability
9
1.2. The Need for Assessing Vulnerabilities for Policy Development and
Implementation
Over the past 30 years, disaster reduction has become an increasingly important
issue on the international agenda and there has been a continuous evolution in
the practice of crisis or disaster management.
These bodies of practice have been known, variously, as civil defense,
emergency assistance, disaster response and relief, humanitarian assistance,
emergency management, civil protection, disaster mitigation and prevention and
total disaster risk management.
An increase in human casualties and property damage in the 1980‘s motivated
the United Nations General Assembly in 1989 to declare the 1990‘s the
International Decade for Natural Disaster Reduction (IDNDR).
With the effect of this declaration, the risk concept became popular in the
academic literature after 1990‘s and the rise of risk reduction concept begs our
understanding which accompanied a phenomenal quantitative growth in
references to risk.
During the 1990‘s, stimulated by the IDNDR, many researches dealing with risks
and disasters were developed around the world. The topic gained importance
and it is being increasingly recognized that the terms hazard, vulnerability and
risk have had different meanings and implications from both the methodological
and practical angles (Cardona, 2004).
The idea for conducting a global review of disaster reduction initiatives was born
in the millennium, following the United Nations International Decade for Natural
Disaster Reduction 1990-1999.
In 1999, UN decided to continue the activities on disaster prevention and
vulnerability reduction carried out during the IDNDR.
It thus established the International Strategy for Disaster Reduction (ISDR),
which is supported by the scientific and technical expertise and knowledge
accumulated during the IDNDR.
Following this idea, a series of declarations of interest and determination to
reduce risks have taken place at the international context (Balamir, 2005).
These are; World Conferences on ―Risk Reduction‖ in Yokohama, Japan-1994,
Toronto, Canada-2004 and Kobe, Japan-2005 have extended and sharpened this
awareness about natural hazard risks and efforts of risk reduction on global
agenda.
10
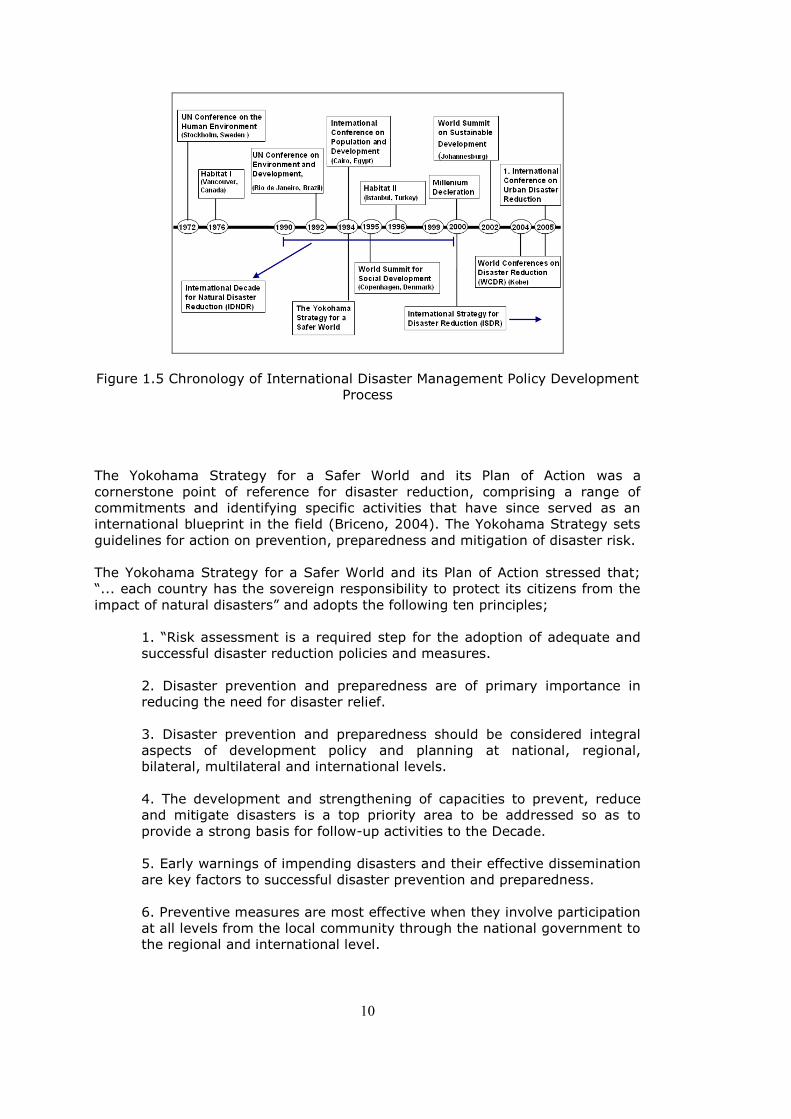
Figure 1.5 Chronology of International Disaster Management Policy Development
Process
The Yokohama Strategy for a Safer World and its Plan of Action was a
cornerstone point of reference for disaster reduction, comprising a range of
commitments and identifying specific activities that have since served as an
international blueprint in the field (Briceno, 2004). The Yokohama Strategy sets
guidelines for action on prevention, preparedness and mitigation of disaster risk.
The Yokohama Strategy for a Safer World and its Plan of Action stressed that;
―... each country has the sovereign responsibility to protect its citizens from the
impact of natural disasters‖ and adopts the following ten principles;
1. ―Risk assessment is a required step for the adoption of adequate and
successful disaster reduction policies and measures.
2. Disaster prevention and preparedness are of primary importance in
reducing the need for disaster relief.
3. Disaster prevention and preparedness should be considered integral
aspects of development policy and planning at national, regional,
bilateral, multilateral and international levels.
4. The development and strengthening of capacities to prevent, reduce
and mitigate disasters is a top priority area to be addressed so as to
provide a strong basis for follow-up activities to the Decade.
5. Early warnings of impending disasters and their effective dissemination
are key factors to successful disaster prevention and preparedness.
6. Preventive measures are most effective when they involve participation
at all levels from the local community through the national government to
the regional and international level.
11
7. Vulnerability can be reduced by the application of proper design and
patterns of development focused on target groups by appropriate
education and training of the whole community.
8. The international community accepts the need to share the necessary
technology to prevent, reduce and mitigate disaster.
9. Environmental protection as a component of sustainable development
consistent with poverty alleviation is imperative in the prevention and
mitigation of natural disasters.
10. Each country bears the primary responsibility for protecting its
people, infrastructure, and other national assets from the impact of
natural disasters‖ (UNISDR, 1994).
After the Yokohama Strategy for a Safer World and its Plan of Action, the World
Conference on Disaster Reduction (WCDR) in Kobe presents a milestone
opportunity to bring together local, national and international decision-makers
active in social and economic development and environmental management;
disaster risk managers and practitioners; civil society; and community groups,
setting a new international agenda to build disaster-resilient communities.
The WCDR in 2005 has the following five specific objectives;
1- ― To conclude and report on the review of the Yokohama Strategy and
its Plan of Action, with a view to updating the guiding framework on
disaster reduction for the twenty-first century;
2- To identify specific activities aimed at ensuring the implementation of
relevant provisions of the Johannesburg Plan of Implementation of the
World Summit on Sustainable Development (WSSD) on vulnerability, risk
assessment and disaster management;
3- To share good practices and lessons learned to further disaster
reduction within the context of attaining sustainable development, and to
identify gaps and challenges;
4- To increase awareness of the importance of disaster reduction policies,
thereby facilitating and promoting the implementation of those policies;
5- To increase the reliability and availability of appropriate disaster-
related information to the public and disaster management agencies in all
regions, as set out in relevant provisions of the Johannesburg Plan of
Implementation‖ (UNISDR, 2005).
12
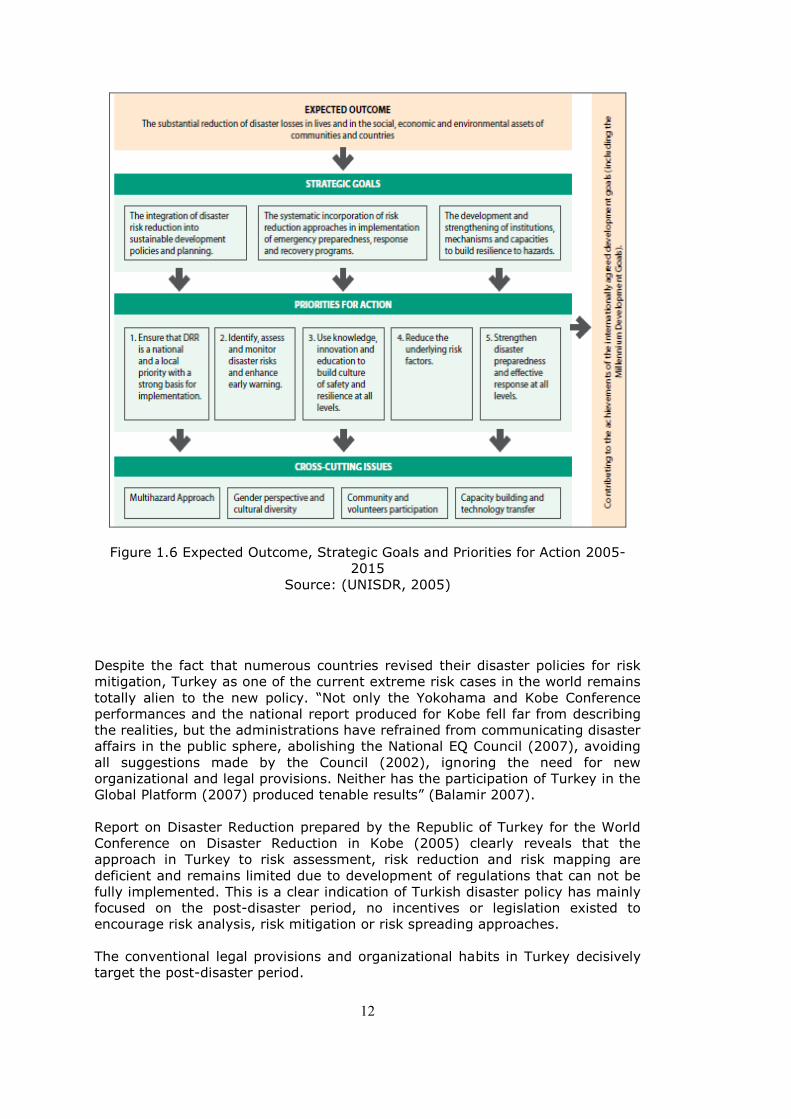
Figure 1.6 Expected Outcome, Strategic Goals and Priorities for Action 2005-
2015
Source: (UNISDR, 2005)
Despite the fact that numerous countries revised their disaster policies for risk
mitigation, Turkey as one of the current extreme risk cases in the world remains
totally alien to the new policy. ―Not only the Yokohama and Kobe Conference
performances and the national report produced for Kobe fell far from describing
the realities, but the administrations have refrained from communicating disaster
affairs in the public sphere, abolishing the National EQ Council (2007), avoiding
all suggestions made by the Council (2002), ignoring the need for new
organizational and legal provisions. Neither has the participation of Turkey in the
Global Platform (2007) produced tenable results‖ (Balamir 2007).
Report on Disaster Reduction prepared by the Republic of Turkey for the World
Conference on Disaster Reduction in Kobe (2005) clearly reveals that the
approach in Turkey to risk assessment, risk reduction and risk mapping are
deficient and remains limited due to development of regulations that can not be
fully implemented. This is a clear indication of Turkish disaster policy has mainly
focused on the post-disaster period, no incentives or legislation existed to
encourage risk analysis, risk mitigation or risk spreading approaches.
The conventional legal provisions and organizational habits in Turkey decisively
target the post-disaster period.

13
―The ‗Disasters Law‘ is a regulatory device primarily for ‗healing the wounds‘ and
the Development Law ignores the reality and risks of earthquakes and contains
no mechanism or procedure in itself to secure environmental, building and
implementation standards for mitigation control. Therefore, a double bias for
post-disasters has been the dominant nature of policy in Turkey‖ (Balamir,
2001).
However, ―the earthquakes of 1999 generated a strong national determination in
Turkey to devise new and effective methods of tackling disasters‖. Since then,
much effort and debate has been taking place in political, official and academic
circles to refresh the attitudes, management and structures of responsibilities, as
well as to revise the related legal framework (Balamir, 2002).
After the 1999 earthquakes, three important steps were taken by the
government and conventional approach in disaster policy has been restructured.
With the newly introduced `Obligatory Building Insurance', `Building Control',
and `Professional Proficiency' systems, greater emphasis is given to mitigation
efforts and the focus of attention have shifted towards risk management and the
pre-disaster period.
Despite its deficiencies, these will hopefully change the conventional policy in
building practice. ―These decisions may be interpreted as attempts to convert
the existing system that is over-occupied with crisis management and the
aftermath of disasters into some form of an overall strategy for disaster
mitigation‖ (Balamir, 2002).
On the other hand, risk reduction or mitigation policies demand new approaches,
new methods and expertise. ―The new policy requires a capacity for identifying
various types of risks at different levels, making projections for likely
consequences, and also a capacity for devising methods to ‗avoid, reduce, and
share‘ risks‖ (Balamir 2007).
―The disaster information system in Turkey need to concentrate on settlements,
and this system be managed by some central authority to maintain the high
standards and rigour in upkeep. Settlements under high risks have to revise
their development plans according to the micro-zonation information provided,
and update them as new information becomes accessible and as new
assessments of risks are made based on this set of data. ‗Integrated Disasters
Maps‘ need be institutionalized and incorporated in the Development Law,
making such maps a prerequisite for all plan preparations and revision activities
which in turn need be restructured to allow greater local community
participation‖ (Balamir, 2001).
―World experiences indicate that pre-disaster risk mitigation efforts always prove
to represent a more efficient use of resources, compared to costs born at the
aftermath of disasters. Investments in the mitigation of seismic risks are
particularly relevant in this context. There are numerous reasons why pre-
disaster use of resources may be more efficient than resources disposed of in the
post-disaster relief activities. Whereas former resources are employed in a
carefully planned, transparent and competitive environment, the latter use of
resources is often carried out in a panic environment and with the least of
accountability‖ (Balamir, 2011).
14
―Whereas the acquisition of former resources may be spread in time and
between various local donors and may have lower ‗opportunity costs‘, the need
for immediate use of resources in the emergency environment will often
represent random allocations, mistakes, unjustified expenditures, unavoidable
high costs for unknown causes. Whereas, the former is likely to generate greater
added values, the opportunity costs of immediately needed resources acquired,
borrowed or allocated in the emergency environment will have greater and
uncontrollable waste rates. The productive use of resources allocated for
mitigation would necessitate the determination of risk priorities on the one hand,
and different efficiency measures than used in market assessments on the other‖
(Balamir, 2011).
1.3. Description of the Problem and Its Context
Chronic seismic hazards and resulting secondary impacts are due to the
geological conditions of Turkey and the nature of current response mechanisms.
Local know-how of building and settlement that evolved over centuries eroded
with the growth in population, and the introduction of reinforced concrete
building economics. This makes cities the most vulnerable geographical and
social entities in Turkey.
On the contrary, Turkish disaster policy has mainly focused on the post-disaster
period and remains limited due to development of regulations that can not be
fully implemented. No incentives or legislations existed to encourage risk
analysis or risk mitigation approaches. This makes Turkey totally alien to the
new risk mitigation policies and risk mapping approaches.
Accordingly, the Earthquake Hazard Map of Turkey, prepared by the General
Directorate of Disaster Affairs (GDDA) in 1996, that is the basic premise of the
disaster management system in Turkey remains deficient to the new risk
mitigation policies.
Official Earthquake Hazard Zoning Map of Turkey segments the country into five
macro-level regions, as determined by the statistical occurrence of seismic
events and only indicates hazard exposure levels of provinces and settlements.
Although both of these two notions represent distinct concepts, such distinction
is not made in most policy orientations and hazard is often confused with the
notion of risk.
Yet, two communities located in hazard-prone areas with similar physical
settings cannot be described as of equal in risk if they differ in their
vulnerabilities to the hazard.
Consequently, the official hazard map does not consider primary factors of risk,
neither social vulnerabilities nor attributes of the building stock. It only indicates
hazard exposure levels without providing any information about risk levels and
does not specify any quantitative earthquake hazard parameters for any zone.
Besides it doesn‘t indicates any information about ordering and prioritization of
settlements in the same hazard zones, all settlements located in the same
hazard zones are accepted as of equal in risk apart from their physical settings
and vulnerabilities.
15
These deficiencies of the official earthquake hazard map and the necessity of
differentiations of locations should be made on risk-basis maps constitutes both
the most crucial problem in disaster management system of Turkey and the
main problematic of the study.
1.4. Scope, Approach and Method of the Study
The World Conferences on ‗Risk Reduction‘ in Yokohama and Kobe provided a
unique opportunity to promote a strategic and systematic approach to
determination and reducing seismic vulnerabilities and risks of settlements. The
principles and priorities determined by these conferences are a guiding framework
on disaster reduction for the twenty-first century.
The Hyogo Framework for Action 2005-2015: Building the Resilience of Nations
and Communities to Disasters determined five priorities for action:
1. Ensure that disaster risk reduction is a national and a local priority,
2. Identify, assess and monitor disaster risks and enhance early warning,
3. Reduce the underlying risk factors,
4. Use knowledge, innovation and education to build a culture of safety and
resilience,
5. Strengthen disaster preparedness for effective response at all levels.
These priorities constitute the starting point of the research and the overall
objective of this research is to evaluate how these priorities are served in the
settlements of Turkey especially; in the identification, assessment and monitoring
of disaster risks, the reduction of the risk factors and the use of knowledge to
build a culture of safety and resilience. The major purpose of this research is to
develop a method for the identification of vulnerabilities and prioritization of most
vulnerable settlements in anticipation of earthquake related hazards.
With this purpose, the aim of this research is to examine the factors that
determine seismic vulnerabilities and risks of settlements and establish analysis of
seismic risks in cities and living environments could be determined on the basis of
a set of attributes of the building stock. The scope is to exhibit and analytically
compare such factors in settlements of Turkey.
Quantitative information about a set of attributes of settlements is investigated
statistically to determine which of the factors contribute most to risk levels
described locally. The seismic hazard maps of the Kandilli Observatory and
Earthquake Research Institute (KOERI), Erdik estimations of seismicity and
statistics published by the Turkish Statistical Institute (TurkStat), like census and
housing data have a leading contribution to make. These secondary sources of
information help to compose the database for a series of comparisons in the
seismic vulnerabilities and risk levels of cities.
In order to determine the seismic vulnerabilities and risks of settlements,
disaster component that reveals the settlement level loss in building stock is
examined on one side and the basic attributes of settlements and their effects on
loss levels on the other side.
16
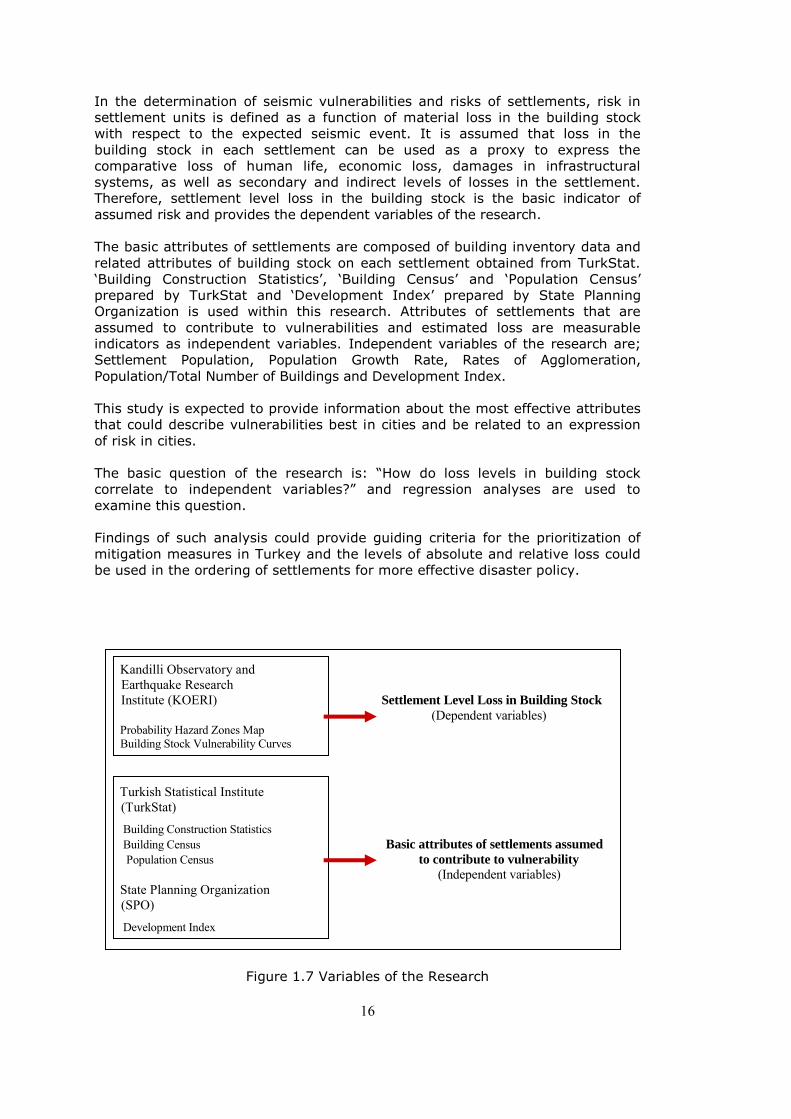
In the determination of seismic vulnerabilities and risks of settlements, risk in
settlement units is defined as a function of material loss in the building stock
with respect to the expected seismic event. It is assumed that loss in the
building stock in each settlement can be used as a proxy to express the
comparative loss of human life, economic loss, damages in infrastructural
systems, as well as secondary and indirect levels of losses in the settlement.
Therefore, settlement level loss in the building stock is the basic indicator of
assumed risk and provides the dependent variables of the research.
The basic attributes of settlements are composed of building inventory data and
related attributes of building stock on each settlement obtained from TurkStat.
‗Building Construction Statistics‘, ‗Building Census‘ and ‗Population Census‘
prepared by TurkStat and ‗Development Index‘ prepared by State Planning
Organization is used within this research. Attributes of settlements that are
assumed to contribute to vulnerabilities and estimated loss are measurable
indicators as independent variables. Independent variables of the research are;
Settlement Population, Population Growth Rate, Rates of Agglomeration,
Population/Total Number of Buildings and Development Index.
This study is expected to provide information about the most effective attributes
that could describe vulnerabilities best in cities and be related to an expression
of risk in cities.
The basic question of the research is: ―How do loss levels in building stock
correlate to independent variables?‖ and regression analyses are used to
examine this question.
Findings of such analysis could provide guiding criteria for the prioritization of
mitigation measures in Turkey and the levels of absolute and relative loss could
be used in the ordering of settlements for more effective disaster policy. Kandilli Observatory and Earthquake Research Institute (KOERI) Settlement Level Loss in Building Stock (Dependent variables) Probability Hazard Zones Map Building Stock Vulnerability Curves Turkish Statistical Institute (TurkStat)
Building Construction Statistics Building Census Basic attributes of settlements assumed Population Census to contribute to vulnerability
(Independent variables) State Planning Organization (SPO)
Development Index
Figure 1.7 Variables of the Research
17
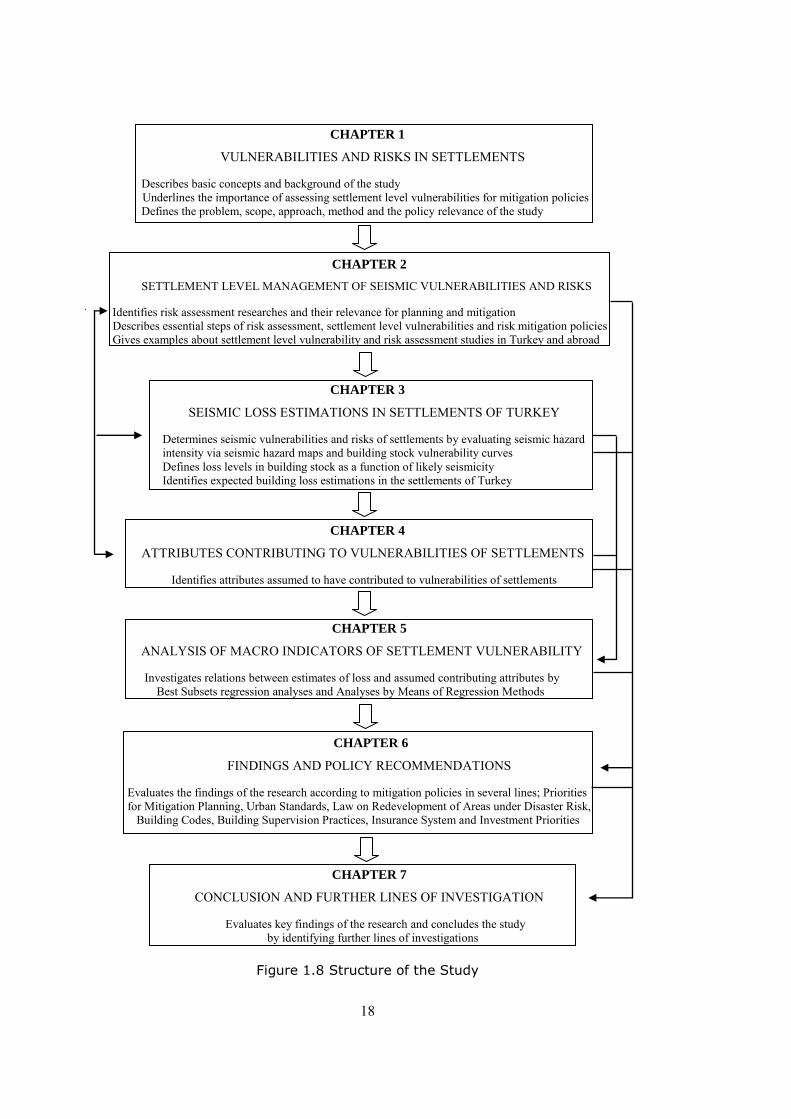
1.5. Structure of the Study
This study composed of seven chapters. The first chapter describes the basic
concepts and background of the study briefly, underlines the importance of
assessing settlement level vulnerabilities for mitigation policies and defines the
problem, scope, approach, method and the policy relevance of the study.
Second chapter identifies risk assessment researches and their relevance for
planning and development of mitigation strategies describes stages and essential
steps of risk assessment processes, settlement level vulnerabilities and risk
mitigation policies and gives examples about settlement level vulnerability and
risk assessment studies in Turkey and abroad.
Third chapter of the study determines seismic vulnerabilities and risks of
settlements by evaluating seismic hazard intensity via seismic hazard maps and
building stock vulnerability curves. Within the third chapter loss levels in building
stock is defined as a function of likely seismicity and expected building loss
estimations in the settlements of Turkey is identified.
Chapter four examines the attributes assumed to have contributed to
vulnerabilities of settlements.
Chapter five investigates relations between estimates of loss and assumed
contributing attributes by best subsets regression analyses and analyses by
means of regression methods.
Chapter six evaluates the findings of the research according to mitigation
policies and urban planning in several lines like Priorities for Mitigation Planning,
Urban Standards, Law on Redevelopment of Areas under Disaster Risk, Building
Codes, Building Supervision Practices, Insurance System and Investment
Priorities.
The last chapter of the study, Chapter seven, briefly evaluates the key findings
of the research and concludes the study by identifying further lines of
investigations.
18
CHAPTER 1
VULNERABILITIES AND RISKS IN SETTLEMENTS
Describes basic concepts and background of the study Underlines the importance of assessing settlement level vulnerabilities for mitigation policies
Defines the problem, scope, approach, method and the policy relevance of the study
CHAPTER 2
SETTLEMENT LEVEL MANAGEMENT OF SEISMIC VULNERABILITIES AND RISKS
Identifies risk assessment researches and their relevance for planning and mitigation Describes essential steps of risk assessment, settlement level vulnerabilities and risk mitigation policies Gives examples about settlement level vulnerability and risk assessment studies in Turkey and abroad
CHAPTER 3
SEISMIC LOSS ESTIMATIONS IN SETTLEMENTS OF TURKEY
Determines seismic vulnerabilities and risks of settlements by evaluating seismic hazard intensity via seismic hazard maps and building stock vulnerability curves Defines loss levels in building stock as a function of likely seismicity Identifies expected building loss estimations in the settlements of Turkey
CHAPTER 4
ATTRIBUTES CONTRIBUTING TO VULNERABILITIES OF SETTLEMENTS Identifies attributes assumed to have contributed to vulnerabilities of settlements
CHAPTER 5
ANALYSIS OF MACRO INDICATORS OF SETTLEMENT VULNERABILITY Investigates relations between estimates of loss and assumed contributing attributes by Best Subsets regression analyses and Analyses by Means of Regression Methods
CHAPTER 6
FINDINGS AND POLICY RECOMMENDATIONS
Evaluates the findings of the research according to mitigation policies in several lines; Priorities for Mitigation Planning, Urban Standards, Law on Redevelopment of Areas under Disaster Risk, Building Codes, Building Supervision Practices, Insurance System and Investment Priorities
CHAPTER 7
CONCLUSION AND FURTHER LINES OF INVESTIGATION
Evaluates key findings of the research and concludes the study by identifying further lines of investigations
Figure 1.8 Structure of the Study
19
CHAPTER 2
SETTLEMENT LEVEL MANAGEMENT OF SEISMIC VULNERABILITIES AND
RISKS
2.1. Risk Assessment Research and Studies
Risk assessment is the process of measuring the potential loss of life, injury and
property damage resulting from natural hazards by assessing the vulnerability of
people, buildings and infrastructure to natural hazards. It helps basically to point
out the fields has to be prioritized and to make better decisions in management
issues and provides to estimate probable losses in human life, economy and
infrastructure.
UNISDR Terminology on Disaster Risk Reduction (2009) defines Risk Assessment
as ―a methodology to determine the nature and extent of risk by analyzing
potential hazards and evaluating existing conditions of vulnerability that together
could potentially harm exposed people, property, services, livelihoods and the
environment on which they depend‖.
Risk assessments include detailed quantitative and qualitative understanding of
risk, its physical, social, economic and environmental factors and consequences.
It is a necessary first step for any serious consideration of disaster reduction
strategies.
Its relevance for planning and development of disaster risk reduction strategies
was explicitly addressed during the IDNDR. ―In the year 2000, all countries, as
part of their plans to achieve sustainable development should have in place
comprehensive national assessments of risks from natural hazards, with these
assessments taken into account in development plans.‖ This was also outlined in
Principle 1 of the 1994 Yokohama Strategy and Plan of Action for a Safer World.
―Risk assessment is a required step for the adoption of adequate and successful
disaster reduction policies and measures‖ (UNISDR, 2004).
Risk assessment researches are conducted at different levels from global to local
levels and for different purposes. But essentially, it provides a systematic
process to answer questions about the risks faced by the community or city.
The risk assessment process focuses attention on areas most in need by
evaluating which populations and facilities are most vulnerable to natural
hazards and to what extent injuries and damages may occur. It gives us the
answers about what these hazards can do to physical, social, and economic
assets; which areas are most vulnerable to damage from these hazards; and the
resulting cost of damages or costs avoided through future mitigation projects.
Risk assessment researches should not be undertaken as one-off analyses but as
an integral and regular element of the planning process and are essential for
disaster mitigation and preparedness (ADPC, 2010).
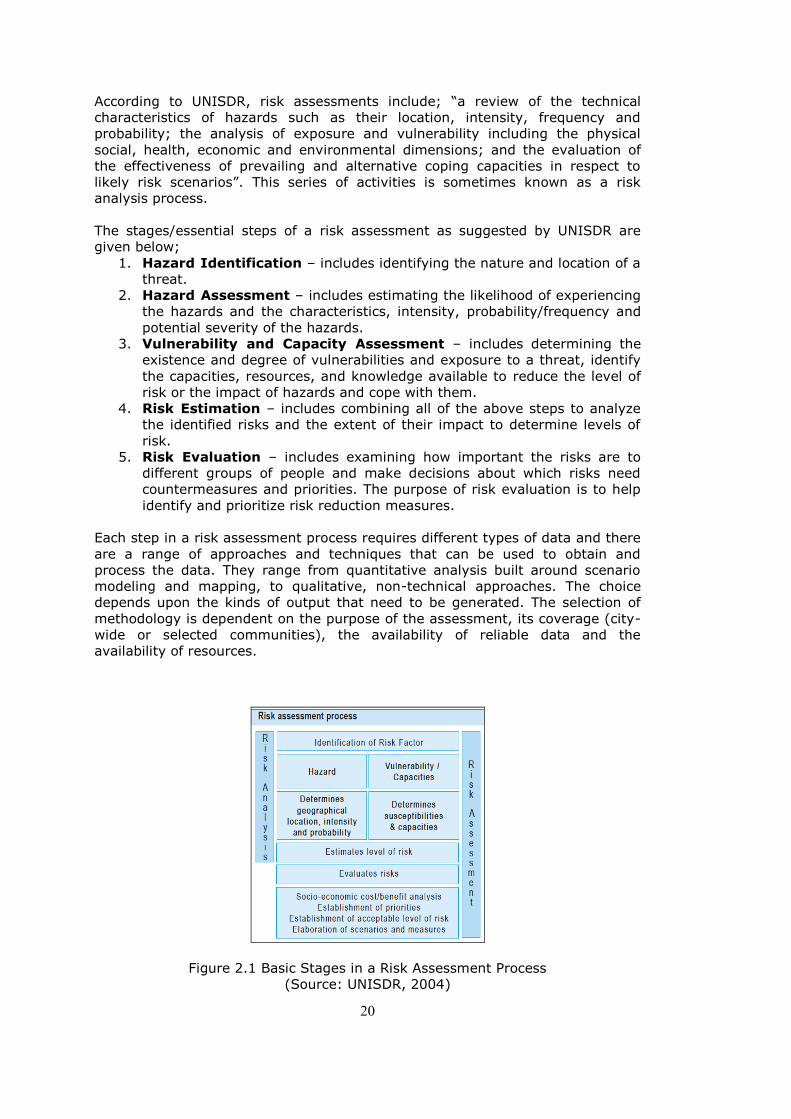
20
According to UNISDR, risk assessments include; ―a review of the technical
characteristics of hazards such as their location, intensity, frequency and
probability; the analysis of exposure and vulnerability including the physical
social, health, economic and environmental dimensions; and the evaluation of
the effectiveness of prevailing and alternative coping capacities in respect to
likely risk scenarios‖. This series of activities is sometimes known as a risk
analysis process.
The stages/essential steps of a risk assessment as suggested by UNISDR are
given below;
1. Hazard Identification – includes identifying the nature and location of a
threat.
2. Hazard Assessment – includes estimating the likelihood of experiencing
the hazards and the characteristics, intensity, probability/frequency and
potential severity of the hazards.
3. Vulnerability and Capacity Assessment – includes determining the
existence and degree of vulnerabilities and exposure to a threat, identify
the capacities, resources, and knowledge available to reduce the level of
risk or the impact of hazards and cope with them.
4. Risk Estimation – includes combining all of the above steps to analyze
the identified risks and the extent of their impact to determine levels of
risk.
5. Risk Evaluation – includes examining how important the risks are to
different groups of people and make decisions about which risks need
countermeasures and priorities. The purpose of risk evaluation is to help
identify and prioritize risk reduction measures.
Each step in a risk assessment process requires different types of data and there
are a range of approaches and techniques that can be used to obtain and
process the data. They range from quantitative analysis built around scenario
modeling and mapping, to qualitative, non-technical approaches. The choice
depends upon the kinds of output that need to be generated. The selection of
methodology is dependent on the purpose of the assessment, its coverage (city-
wide or selected communities), the availability of reliable data and the
availability of resources.
Figure 2.1 Basic Stages in a Risk Assessment Process
(Source: UNISDR, 2004)
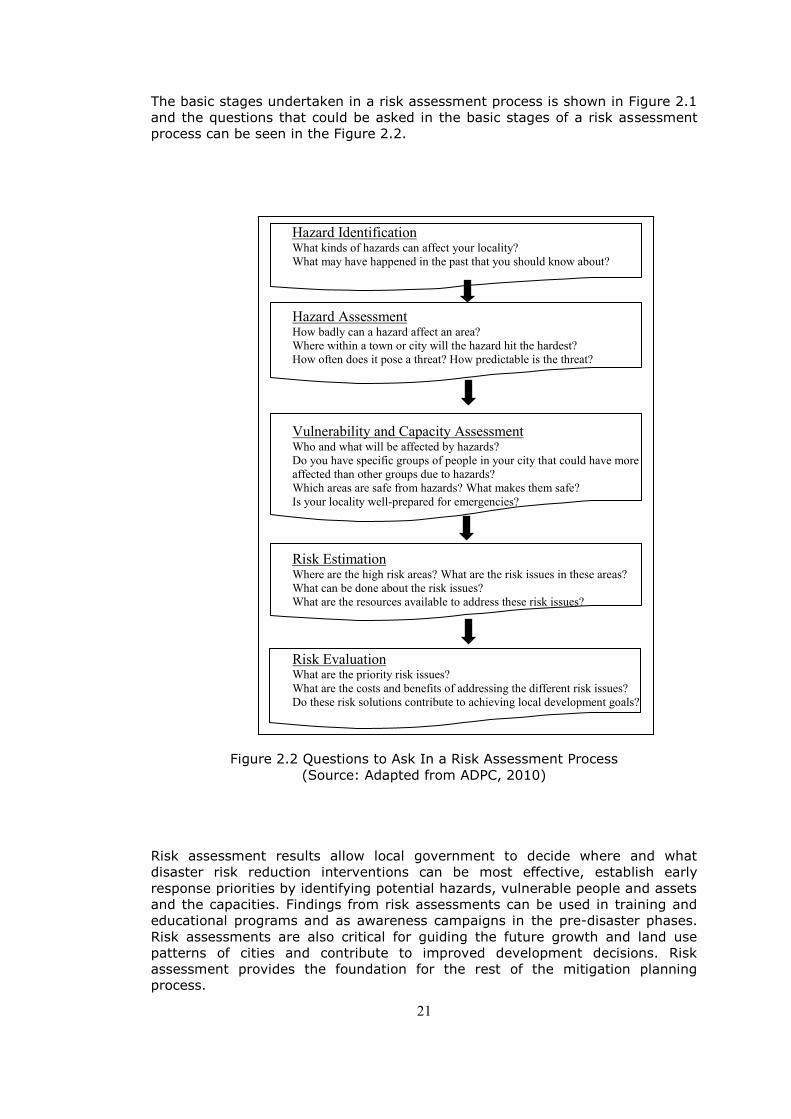
21
The basic stages undertaken in a risk assessment process is shown in Figure 2.1
and the questions that could be asked in the basic stages of a risk assessment
process can be seen in the Figure 2.2.
Hazard Identification What kinds of hazards can affect your locality? What may have happened in the past that you should know about?
Hazard Assessment How badly can a hazard affect an area? Where within a town or city will the hazard hit the hardest? How often does it pose a threat? How predictable is the threat?
Vulnerability and Capacity Assessment Who and what will be affected by hazards? Do you have specific groups of people in your city that could have more affected than other groups due to hazards? Which areas are safe from hazards? What makes them safe? Is your locality well-prepared for emergencies?
Risk Estimation Where are the high risk areas? What are the risk issues in these areas? What can be done about the risk issues? What are the resources available to address these risk issues?
Risk Evaluation What are the priority risk issues? What are the costs and benefits of addressing the different risk issues? Do these risk solutions contribute to achieving local development goals?
Figure 2.2 Questions to Ask In a Risk Assessment Process
(Source: Adapted from ADPC, 2010)
Risk assessment results allow local government to decide where and what
disaster risk reduction interventions can be most effective, establish early
response priorities by identifying potential hazards, vulnerable people and assets
and the capacities. Findings from risk assessments can be used in training and
educational programs and as awareness campaigns in the pre-disaster phases.
Risk assessments are also critical for guiding the future growth and land use
patterns of cities and contribute to improved development decisions. Risk
assessment provides the foundation for the rest of the mitigation planning
process.
22
Institutionalizing disaster risk assessment has many advantages and benefits
because the efforts involved are important development management tools on
its own. Disaster risk assessment is useful for several purposes, including:
making risk-responsive physical and economic policy, regulatory framework for
development, promoting participatory development through public education and
awareness, private sector and business decision-making and risk sharing and
transfer interventions (AFDB, 2004).
For a more effective bundle of mitigation measures, it is essential that the
various forms of risk management should be performed in a logical sequence.
This sequence is usually identified as the ‗priorities of risk management‘ in any
problem context, and is currently adopted by the World Bank (Kreimer, et. al.,
1999) and other authors (Burby, 1999).
―‗Avoidance of risks‘ has the foremost priority and largely to be maintained (in
the case of earthquakes) by means of renewed land-use planning practices and
regulations. ‗Minimization of risks‘ is a second set of tasks to be undertaken in
infrastructural networks and the design and production of buildings. Having
accomplished both of the former steps of risk management, the remainder
unavoidable risks are to be ‗shared‘ between the members of the society by
some explicitly preferred method and criteria. This set represents then the most
general family of rules to follow at every scale of physical design for safe
buildings and environments‖ (Balamir, 2001).
Figure 2.3 Priorities in Risk Management
Source: (Balamir, 2001)
23
Consequently, we can say that hazard assessment is an important first step in
reducing vulnerability, but in order to reduce future losses from natural hazards,
hazard assessment studies must be coordinated with settlement level risk
mitigation efforts and planning policies.
2.2. Settlement Level Vulnerability and Risk Mitigation Policies
Mitigation at all levels is the dominant paradigm today as promoted by
international organizations and academic circles since 1990s, which changed the
conventional mode of thinking focused on emergency and crisis management
policies since 1940s (Balamir, 2006).
The scope of mitigation in the new approach is best expressed in questions
directed during pre-Kobe Conference (2005) activities, to the national
representatives;
1. Political Commitment and Institutional Aspects: as revealed by legislation
addressing disaster risk reduction, incorporation of risk reduction
concepts, annual budget allocated for disaster risk reduction and
encouragement and active participation in disaster risk reduction efforts
by the private sector, civil society, NGOs, academia and media;
2. Risk Identification: as evident in hazard mapping, vulnerability and
capacity assessments, mechanisms for risk monitoring and risk mapping,
socio-economic and environmental impact analyses;
3. Knowledge Management: as practiced in risk information management
systems, academic and research communities dealing with disaster
reduction, educational programs related to disaster risk reduction,
training programs, indigenous knowledge and wisdom, and public
awareness programs;
4. Risk Management Applications and Instruments: as implemented through
environmental management and risk reduction practices, financial
instruments to reduce the impact of disasters, and technical measures or
programs on disaster risk reduction. (UNISDR, 2005).
The foregoing themes serve as a core set of principles to understand, guide and
monitor current status of disaster risk reduction and the information provided by
countries served as one of the main inputs for the ―Review of the Yokohama
Strategy and Plan of Action for a Safer World.
Information Reports on Disaster Reduction prepared by the governments for the
WCDR reveals the approaches of 113 countries to risk assessment, risk reduction
and risk mapping. Although these questions refer to activities at a national level,
similar issues could be rephrased at other (regional, city, local) levels as well.
Anti-risk regulatory devices have been a priority issue for a considerable number
of countries during the past few years either as new laws or amendments made
to existing ones (Balamir, 2006). Among these are USA (Disaster Mitigation Law,
2000), New Zealand (Civil Defense Law, 2002), South Africa (Disasters Law,
2002), Australia (COAG Report, 2002), UK (Civil Mitigation Law, 2004), Canada
(Risk Mitigation Projects Program, 2004), Greece (Civil Protection Law, 2003),
Armenia (2002) and others, apart from Japan which had such regulation in effect
since 1961.

24
Following the Kobe Conference, the Hyogo Framework for Action 2005-2015 was
announced which gave greater emphasis on mitigation and also in section four of
the declaration pointed to the need for ‗mainstreaming disaster risk
considerations into planning procedures‘, and ‗develop … tools for the reduction
of disaster risk in the context of land-use policy and planning … at the national
and local levels‘ (UNISDR, 2005).
Most relevant, but complicated and least studied among those is the city-level
mitigation practices. Formal analyses of risks and action for mitigation in cities
are the least mainstreamed of measures into the existing systems of city
planning or disaster management.
Concepts and methods of urban mitigation planning are entirely different from
those of conventional building-level risk mitigation. Earthquake engineering has
during the past 40 years developed an area of expertise that deals with the risk
of building collapse due lateral forces. The city however is not just an aggregate
of buildings, but a complex system comprising its own nested sets of ‗risk
sectors‘, as well as buildings of various categories to acquire different functions
and priorities in the context of urban mitigation planning. Cities are vulnerable
therefore in very many different ways, and manifest a multitude of risks
(Balamir, 2006).
On the other hand, mitigation is a most relevant and rewarding effort particularly
at the level of settlements. Cities as distinct physical systems have their own
complex functional integrity, and are subject to failure should any of the sub-
components receive a natural or man-made hazard impact.
Secondly, cities are usually managed in their totality by an authority explicitly
responsible for its functioning and safety. Risk avoidance/ reduction/ sharing as
part of such responsibilities is however, a recent awareness, and often an
imposed obligation. These are some of the reasons why seismic risk mitigation
should be streamlined into city planning functions and must have a formal basis
(Balamir, 2006).
Observing the need, Coburn and Spence (1992) claims that: ―Earthquake
protection should be seen as an additional element of normal urban planning. It
should not be a separate activity from other planning operations, but rather an
integral part of the planning process…‖ Despite the statement, no specific
method of mitigation planning in cities is offered by him in procedural or in
content terms, apart from a general indication to a number of related issues like
microzonation, building robustness, classification of uses at risk, etc.
However, awareness of the immense potential urban planning has for the
reduction of risks at city-level is expanding. More recently, Wamsler (2006)
indicated that city-level impacts of natural hazards could be worse than in
environments of other levels, and therefore urban planning with its existing and
potential tools could be developed as a proactive and preventive institution. Yet
there are external and internal impediments (Balamir, 2006).
Despite the recent international declarations and determination in the new policy
of mitigation, many of the international organizations still employ and fund
conventional wisdom, depriving mitigation planning from resources necessary for
explorations in city level risks.
25
Examining the ‗perceptions and practices of the international aid organizations‘,
Wamsler (2006) concludes that there exists a significant incompatibility between
the various professional disciplines. This is largely due to distinct tradition,
education, and experiences of these disciplines; different working priorities,
different concepts and terminologies, as well as separate legal-institutional
structures and financial resources they operate within. It is necessary to ‗create
new institutional and organizational structures at all levels, which favour
integrated risk reduction in urban planning‘ (Balamir, 2006).
City-level mitigation planning is therefore, universally at the stage of formulation
and consolidation in its methods and tools. Experience and know-how related to
seismic mitigation at city level is not widely recognized at the moment, nor
mainstreamed into the professional modes of conduct and the legal system,
despite a number of approaches in this area.
According to Balamir (2007), recent attempts at clarifying urban risks and
develop methods for city mitigation could be categorized in a number
approaches:
(a) Urban planning services are usually demanded for the post-disaster
reconstruction stages and rehabilitation works. Methodological know-how is
available in this area, based on case experiences and theoretical discourse
(Spangle Assoc., 1991, 1997; Schwab, 1998).
(b) Turning to risk mitigation efforts prior to disasters, one basic approach seems
to concentrate at macro assessments of loss. These usually focus at national
level policies (Godschalk et. al., 1999). In general, most of pre-disaster
management of seismic risks in settlements is either confined to engineering
tactics at the individual building level, or to the simulation modeling efforts
(as in the case of HAZUS) at system level (Coburn and Spence, 1992;
Coburn, 1995). Both approaches rely on expert decision-making and DSS in
the monitoring of city systems, rather than community action and local
participatory processes (Balamir, 2007).
(c) A third category often implicitly assumes that city-level risks could be
identified based on engineering concepts and tools employed in the analysis
of risks in building structures. City-level risks are equated to the sum of risks
of the urban building stock. The discourse to justify the approach claims that
―after all it is the buildings that kill people‖ (Sucuoğlu, 2006). For this reason
it is the robustness of buildings and life-lines in the city (engineering studies)
that need be investigated, and mitigation efforts focused in these systems
will suffice for the achievement of safety in the city (Scawthorn, et. al. 2006;
Cozzi, Menoni, 2006 et. al.; Rosetto, 2006).
(d) Another set of pre-disaster efforts could be identified to fall closer to
conventional land-use planning. Burby (1998) considers that land-use
planning could provide sufficient means for mitigation by itself.
It is most relevant to survey and register geological attributes of land and local
geographical features to determine the hazard zones and then the appropriate
zoning of uses and designation of types of buildings for safer city development
and functioning. Based on past experience, high hazard zones are avoided for
residential purposes, but buildings for storage or animal husbandry could be
permitted. Public buildings and emergency facilities must accordingly be
allocated to less hazardous zones.
26
Fault lines must have immediate strips of zones for total building ban, restricted
zones for specific uses further away, constraints relaxed with distance. Mitigation
decisions are confined to land-use impositions in this approach according to
estimations of local hazards (Balamir, 2007).
(e) Cases that directly confront the problem of seismic mitigation, and intend to
develop methods in comprehensive urban planning, rather than that of land-
use planning tools alone, are few and recent.
Two exercises undertaken by the Columbia International Urban Planning Studio
of the post-graduate program, in coordination with other research units, have
been dedicated to the seismic problems of highly vulnerable cities of Caracas and
Istanbul (Columbia University, 2001, 2002).
This approach does not only consider the city systems in their entirety, but
develops also a multi-disciplinary framework, reveal a more comprehensive
approach than conventional land-use planning, and define the boundaries of a
new form of planning practice.
The Columbia University planning program, following a research format
developed in the case of Caracas city, studied the earthquake prone Istanbul in
2002 with the intention of exploring planning and mitigation possibilities. The
time and data constraints have largely constrained the Istanbul analyses, and
reduced findings to a set of broad recommendations (Balamir, 2007).
Yet there are a number of significant elements within the scope of the study:
1. A post-event analysis focused on a prioritization of ‗essential facilities‘: (a)
medical, water, transportation, shelter, communication; (b) fuel, fire,
hazardous materials, electricity, food; (c) reserved space, sanitary facilities,
and identified the priority of urban activities that have greater contributions
as: ‗management‘, SAR, ‗law enforcement/security‘ (Balamir, 2007).
2. Safety implications of various macro-form alternatives were explored.
Comparisons were made between centralized metropolitan growth and
satellite settlements configurations. The latter was preferred, taking into
consideration also the impacts of alternatives on conservation policies
(Balamir, 2007).
3. A sample of neighborhoods were investigated, followed by
recommendations in infrastructure improvements, urban design propositions,
social policies, ‗resistance action plans‘, regulation of building densities and
restrictions, and disaster response plans (Balamir, 2007).
Even if the attempts were inconclusive in developing a methodology in mitigation
planning, the approach of the Columbia University is in the necessary direction.
The study is not trapped in a simple understanding of equating city-level risks
solely to those of the building stock. It is not either confined to the narrow scope
of conventional land-use planning. The approach considers the urban mitigation
issue in terms of a multi-disciplinary attitude in its determination of hazards,
specifying an array of risks, assessments of loss, and in its propositions of
policies.
27
―The major deficiency in this approach lies in the implicit assumption that
mitigation is a one-way technical and administrative project imposed by the local
authorities. Participation methods and interactive involvement processes, which
should have been the concomitant of each policy proposition, are omitted in the
urban mitigation planning. Temporary public awareness-raising programs are
obviously no substitutes for generating a total mobilization‖ (Balamir, 2007).
(f) The risk analyses and urban mitigation planning approach envisaged for the
Earthquake Master Plan of Istanbul (EMPI, 2003) is still another alternative
perhaps based on a methodology with wider implications (Balamir, 2006,
2004, 2001, 1999).
A survey of recent attempts in city-level mitigation reveals the nature of the
gaps in understanding settlement safety, and the need for the development of a
systematic response to risks in urban planning (Balamir, 2007).
The city however is not just an aggregate of buildings, but a complex system
comprising its own nested sets of ‗risk sectors‘, as well as buildings of various
categories to acquire different functions and priorities in the context of urban
mitigation planning. Sectors of risk are distinctly manageable clusters of
vulnerabilities at the city-level for which a coordinated action is necessary.
Different levels of spatial units (national, regional, and city) could have entirely
different sets of vulnerability and risk definitions, definitely different from risks at
the building level (Balamir, 2007).
As cities have their own complex functional integrity, they are vulnerable in very
different ways and very different risk sectors. Risk sectors are areas of causal
relations on specific risks according to Earthquake Master Plan of Istanbul
(EMPI). More than a dozen of city-level risk-sectors have been identified in
Istanbul. Risk-Sectors of EMPI are given below;
Risks in Macro-Form and Growth Tendencies (settlement configuration
alternatives)
Urban Fabric Risks (building height/proximity, plots, density, roads, car-
parks, etc.)
Incompatible Land-Use Risks (buildings and districts)
Risks of Productivity Loss (industrial plants)
Risks in the Building Stock, Infrastructure and Lifelines
Risks in Emergency Facilities and Lifelines (hospitals, schools, etc.)
Special Risk Areas/ Special Buildings (landslide, flooding/historic buildings)
Risks in Hazardous Uses (LPG and petrol stations, etc.)
Open Space Deficiency Risks
2.3. Settlement Level Vulnerability and Risk Assessment Studies in
Turkey and Abroad
Vulnerability assessment and seismic risk management using advanced
methodologies are of major importance for the reduction of seismic risk in urban
areas. Settlements are the most relevant geographical units for vulnerability and
risk assessment studies, since greater densities of population occur and most
intensive investments are made here, and most complex sets of vulnerabilities
prevail in this context.
28
Settlement vulnerabilities cannot be described simply in terms of robustness of
individual buildings, but as a complex system structured with interdependent
components. Urban stock texture, networks, distribution of land-uses, public
facilities, their interaction with hazard prone locations, size of population served
and many other factors have interdependent impacts on the vulnerabilities or
resilience of settlements.
A number of risk assessment studies have been carried out in Turkey both at
national and local levels after 1999. These studies that related to settlement
level risks are given below;
1. The first one is the Earthquake Master Plan of Istanbul (EMPI) tendered
by the Metropolitan Municipality of Istanbul and carried out by four
universities in 2003 (ITU, METU, BU and Yıldız Tech. Un.).
Earthquake Master Plan of Istanbul (EMPI) developed a comprehensive
framework for the determination of urban risks and methods of reducing them.
More than a dozen of ‗risk sectors‘ in the Metropolitan City were identified for
DRR organization and action. A participatory framework was envisaged in each
risk sector organizing the communications between stakeholders. Interrelated
set of projects and action were identified in each risk sector with their budgets,
responsible authorities, units, and NGOs within an overall implementation
program. Within EMPI, a method of seismic risk mitigation model was developed
for the high-risk sub-provinces of Istanbul.
Upon the request of the metropolitan municipality, this was followed by a
detailed analysis and assessment of risk mitigation measures based on
information obtained in extensive field surveys in the sub-province of
Zeytinburnu. This approach indicated the viability of comprehensive planning of
such high-risk areas, to incorporate the partial physical redevelopment of
districts by means of partnerships, to exclude the options of density increases,
gentrification, and excessive costs. The objective was to establish the possible
set of conditions to maintain residents and tenants, self-financing social
reorganization projects, testing the viability of physical rearrangements at higher
safety standards and environmental quality. Communities of approximately 1000
dwellings proved to meet all possible constraints and economies required.
2. The second one was tendered by the World Bank for the investigation of
risks in six different municipalities (Bakırköy, Bandırma, EskiĢehir,
Gemlik, Körfez and Tekirdag) and development of recommendations for
improvement in their capacities for Disaster Risk Mitigation.
Research and recommendations for the sample of six municipalities followed a
similar method in the determination of seismic risks in settlements of different
size and character. Having established the hazard probabilities and their
distribution in the city landscape by means of microzonation studies, the method
described a ‗community profile‘ followed by an identification of the high risk
areas. Further to loss estimation and urban risk analyses, municipality
capabilities are determined. The mitigation strategies for each of the
municipalities are then developed, and some prioritization proposed according to
needs for immediate attendance and effectiveness of action with reference to
costs of mitigation measures. Both of these studies provide insight into
identification of risks and methods of prioritization at settlement level (Prota,
2011).
29
3. A national level earthquake risk assessment study was carried out in
Boğaziçi University (Demircioglu, 2010). In this study, the national
hazard maps according to the several ground motion parameters have
been prepared and nationwide building damage; casualty and economic
losses have been estimated. Both the hazard and risk assessments were
grid based. These grids can be clustered into sub-provinces and provinces
as per the needs of project. The hazard maps constitute an updated
version of those associated with the infrastructure seismic design code
published in 2007 for application to transportation structures officially
administered by the Ministry of Transportation.
The risk maps produced in this thesis is analogous to the FEMA study entitled
Estimated Annualized Earthquake Losses for the United States (FEMA, 2008).
4. An earthquake risk model for Turkey has been developed under the WB
Turkish Emergency Flood and Earthquake Recovery Project (TEFER,
2000). An earthquake loss model for the Turkish Catastrophe Insurance
Pools (TCIP-DASK) to serve a basis for the making decision process with
respect to the pricing of its insure policy, risk control, the purchase of
reinsure, and the transfer of seismic risk. The project concluded in 2001
and the software is used for TCIP.
5. At the local level, several earthquake risk assessment studies carried out
by local municipalities can be cited. Further to the earthquake master
plan for the city of Istanbul (EMPI) a study developed in the year 2009
included a very comprehensive local soil characteristics investigation as
well as an updated building inventory development at geographical
location level.
This study was preceded and also used the information provided by three
other studies conducted for the city of Istanbul, these being:
The earthquake microzonation study for the city of Istanbul
conducted by JICA (JICA-IBB, 2002),
Earthquake risk assessment study for the Istanbul Metropolitan
Area conducted by Boğaziçi University (KOERI, 2002) and
The earthquake risk assessment methodology employed in the
Earthquake Master Plan of Istanbul (EMPI) study was updated in
2009.
6. At the local level, one of the recent projects is the Istanbul Seismic Risk
Mitigation and Emergency Preparedness (ISMEP) Project. The aim of this
project is to improve the city of Istanbul‘s preparedness for a potential
earthquake through enhancing the institutional and technical capacity for
disaster management and emergency response, strengthening critical
public facilities for earthquake resistance, and supporting measures for
better enforcement of building codes and land use plans. The Government
of Turkey has initiated, ISMEP, to transform Istanbul into a city resilient
to a major earthquake. The project is financed by a World Bank loan and
implemented through the Istanbul Special Provincial Administration
(ISMEP, 2010).
30
7. An earthquake master plan was also developed for the city of Izmir in the
year 2002 with the contribution of researchers from Boğaziçi and Istanbul
Technical Universities as well as the Chamber of Civil Engineers in Izmir.
During this study all the buildings in the Izmir metropolitan area were
visited by engineers and classified according to their structural
characteristics and vulnerability. The study also included risk assessment
for the major lifeline systems in the city (KOERI, 2000).
8. In connection with the DRM-MERM Project, the assessment of the seismic
hazard for Adapazarı, Gölcük, Değirmendere and Ġhsaniye regions have
been conducted. The project has involved a probabilistic estimate of the
expected ground motions at the sited locations for the next 50 years and
the associated seismic microzonation essentially intended for the land use
management for settlement (DRM, 2004).
9. Several academic researches were also carried out about settlement level
vulnerability and risk assessment fields in Turkey. One of the most
featured studies related to settlement level risks was carried out by Ezgi
Orhan and examines post-disaster recovery processes and location
choices of businesses in case of Adapazarı (Orhan, 2012). The second
study about settlement level vulnerabilities and risks was carried out by
Fikret Bayhan and examines the impacts of urban planning decisions on
earthquake vulnerable cities in the case of Adapazarı (Bayhan, 2010).
Apart from estimations of rates of loss in the building stock for an expected
seismic hazard, the world experience in this context is not rich with examples
and precedents.
Similar risk assessment studies in foreign countries that have been carried out
both at national and local levels related to settlement level risks are given below;
United States of America
The Disaster Mitigation Act 2000 (DMA-2000) encourages all units and city
administrations in USA to develop DRR plans and projects and submit them to
the Federal Administration. The Administration then decides whether there is a
justifiable case, and whether it is worth to subsidize the plan/project based on a
number of efficiency criteria. Such a competition environment demands and
generates a ranking system in itself.
In 2008 US Federal Emergency Management Agency (FEMA) has prepared a
study on the estimation of seismic risk in all regions of the United States by
using two interrelated risk indicators:
1. Annualized Earthquake Loss (AEL), which is the estimated long-term
value of earthquake losses to the general building stock in any single year in a
specified geographic area; and
2. Annualized Earthquake Loss Ratio (AELR), which expresses estimated
annualized loss as a fraction of the building inventory replacement value (FEMA,
2008).
31
Similar and more detailed studies have also conducted by California Geological
Survey (CGS) under the title ―Estimation of Future Earthquake Losses in
California‖.
In these studies losses from potential future earthquake are calculated both as
scenarios of potential earthquakes and as annualized losses considering all the
potential earthquake sources included in the national seismic hazard maps.
Italy
Crowley et al, (2008) have compared the various seismic risk maps which have
been proposed in Italy over the past 10 years.
These maps have been updated over the years following the publication of more
detailed seismic hazard and exposure data, and the updating of empirical
vulnerability functions. The recent publication of updated seismic hazard maps in
Italy has called for further seismic risk studies to be carried out using this state-
of-the-art data. These seismic hazard maps are in terms of acceleration and
displacement spectral ordinates and thus necessitate the use of more
sophisticated models of the vulnerability such that the frequency content of the
ground motion and the period of vibration of the building stock can be taken into
account (Prota, 2011).
Lisbon
The LESSLOSS (Risk mitigation for earthquakes and landslides) project
addressed natural disasters, risk and impact assessment, natural hazard
monitoring, mapping and management strategies, improved disaster
preparedness and mitigation, development of advanced methods for risk
assessment, methods of appraising environmental quality and relevant pre-
normative research. In the frame work of project, earthquake disaster scenario
prediction and loss modeling, finite-fault seismological models have been
proposed to compute the earthquake scenarios for three urban areas, Istanbul
(Turkey), Lisbon (Portugal), and Thessaloniki (Greece).
The overall aim of the project was to create a tool, based on state of the art
modeling software, to provide strong quantified statement about the benefits
and costs of a range of possible mitigation actions, to support decision-making
by city and regional authorities for seismic risk mitigation strategies (LESSLOSS,
2004).

32
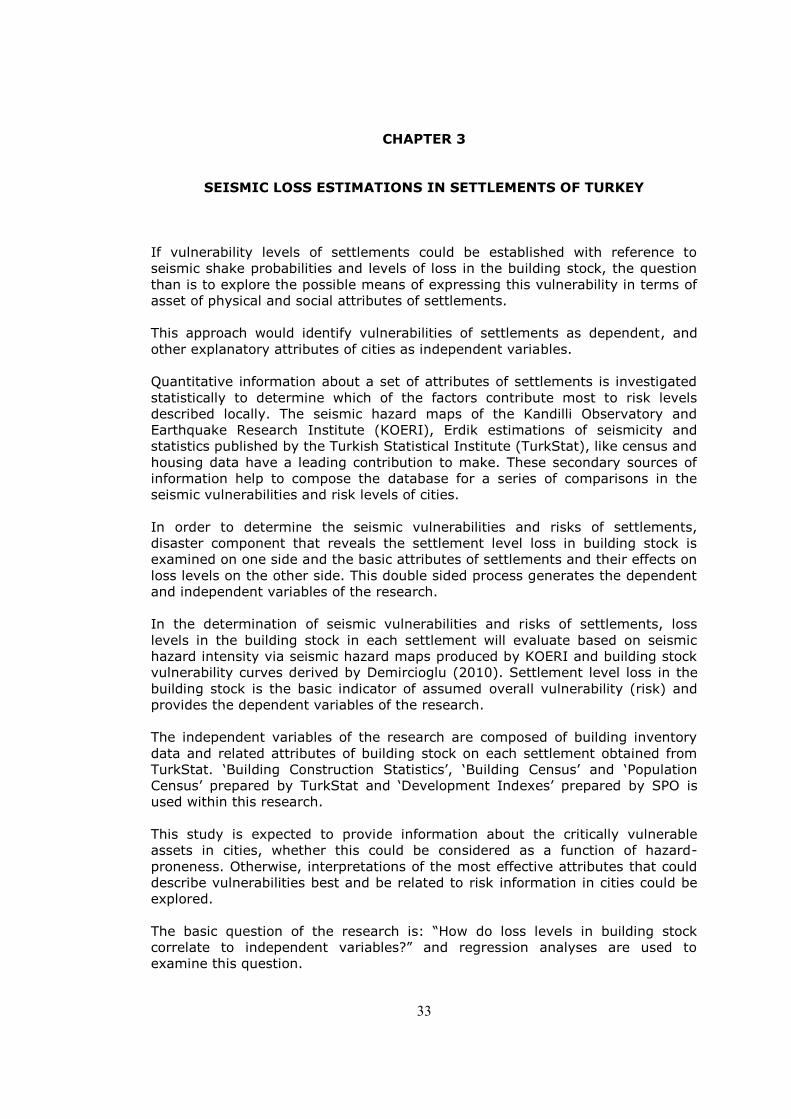
33
CHAPTER 3
SEISMIC LOSS ESTIMATIONS IN SETTLEMENTS OF TURKEY
If vulnerability levels of settlements could be established with reference to
seismic shake probabilities and levels of loss in the building stock, the question
than is to explore the possible means of expressing this vulnerability in terms of
asset of physical and social attributes of settlements.
This approach would identify vulnerabilities of settlements as dependent, and
other explanatory attributes of cities as independent variables.
Quantitative information about a set of attributes of settlements is investigated
statistically to determine which of the factors contribute most to risk levels
described locally. The seismic hazard maps of the Kandilli Observatory and
Earthquake Research Institute (KOERI), Erdik estimations of seismicity and
statistics published by the Turkish Statistical Institute (TurkStat), like census and
housing data have a leading contribution to make. These secondary sources of
information help to compose the database for a series of comparisons in the
seismic vulnerabilities and risk levels of cities.
In order to determine the seismic vulnerabilities and risks of settlements,
disaster component that reveals the settlement level loss in building stock is
examined on one side and the basic attributes of settlements and their effects on
loss levels on the other side. This double sided process generates the dependent
and independent variables of the research.
In the determination of seismic vulnerabilities and risks of settlements, loss
levels in the building stock in each settlement will evaluate based on seismic
hazard intensity via seismic hazard maps produced by KOERI and building stock
vulnerability curves derived by Demircioglu (2010). Settlement level loss in the
building stock is the basic indicator of assumed overall vulnerability (risk) and
provides the dependent variables of the research.
The independent variables of the research are composed of building inventory
data and related attributes of building stock on each settlement obtained from
TurkStat. ‗Building Construction Statistics‘, ‗Building Census‘ and ‗Population
Census‘ prepared by TurkStat and ‗Development Indexes‘ prepared by SPO is
used within this research.
This study is expected to provide information about the critically vulnerable
assets in cities, whether this could be considered as a function of hazard-
proneness. Otherwise, interpretations of the most effective attributes that could
describe vulnerabilities best and be related to risk information in cities could be
explored.
The basic question of the research is: ―How do loss levels in building stock
correlate to independent variables?‖ and regression analyses are used to
examine this question.
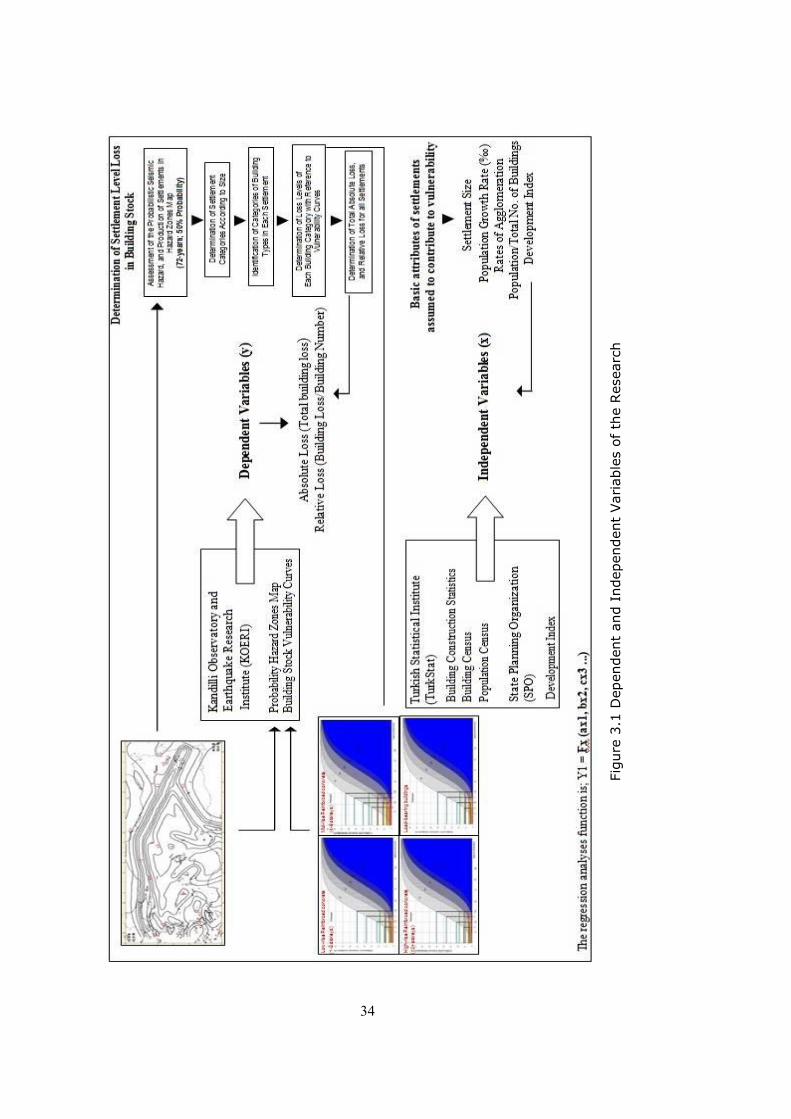
34
Figure 3.1 Dependent and Independent Variables of the Research
Fig
ure
3.1
Dependent
and I
ndependent
Variable
s o
f th
e R
esearc
h
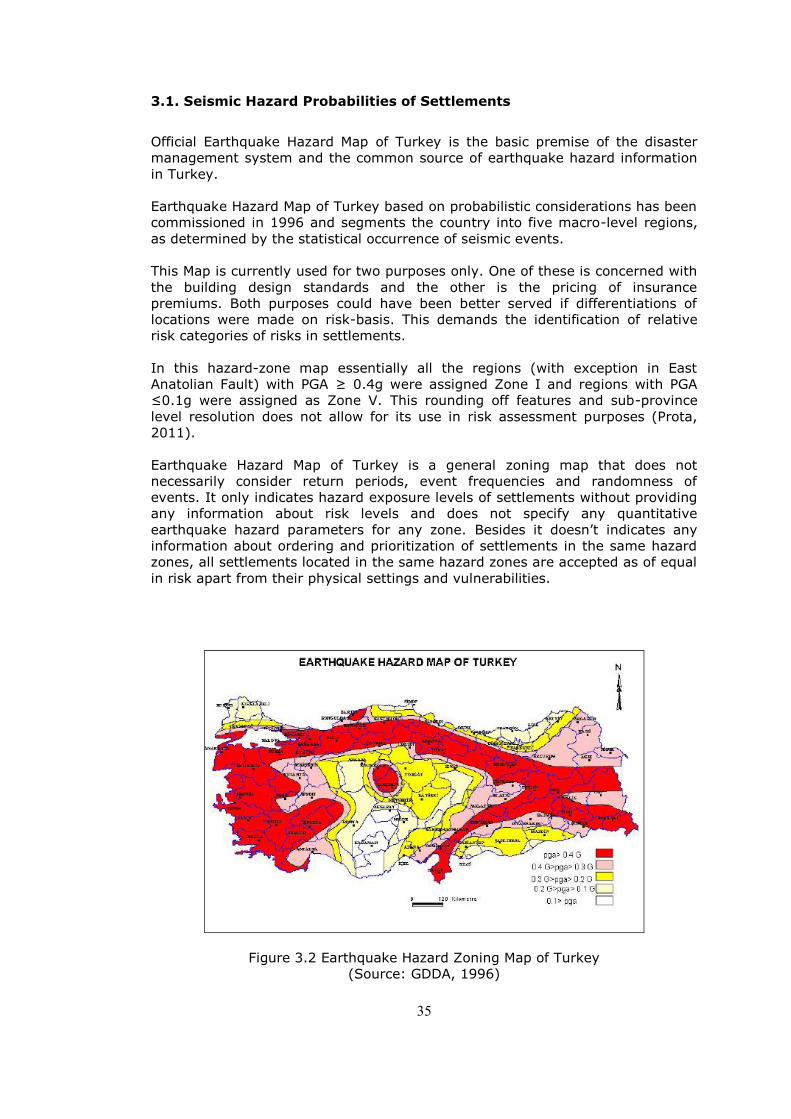
35
3.1. Seismic Hazard Probabilities of Settlements
Official Earthquake Hazard Map of Turkey is the basic premise of the disaster
management system and the common source of earthquake hazard information
in Turkey.
Earthquake Hazard Map of Turkey based on probabilistic considerations has been
commissioned in 1996 and segments the country into five macro-level regions,
as determined by the statistical occurrence of seismic events.
This Map is currently used for two purposes only. One of these is concerned with
the building design standards and the other is the pricing of insurance
premiums. Both purposes could have been better served if differentiations of
locations were made on risk-basis. This demands the identification of relative
risk categories of risks in settlements.
In this hazard-zone map essentially all the regions (with exception in East
Anatolian Fault) with PGA ≥ 0.4g were assigned Zone I and regions with PGA
≤0.1g were assigned as Zone V. This rounding off features and sub-province
level resolution does not allow for its use in risk assessment purposes (Prota,
2011).
Earthquake Hazard Map of Turkey is a general zoning map that does not
necessarily consider return periods, event frequencies and randomness of
events. It only indicates hazard exposure levels of settlements without providing
any information about risk levels and does not specify any quantitative
earthquake hazard parameters for any zone. Besides it doesn‘t indicates any
information about ordering and prioritization of settlements in the same hazard
zones, all settlements located in the same hazard zones are accepted as of equal
in risk apart from their physical settings and vulnerabilities.
Figure 3.2 Earthquake Hazard Zoning Map of Turkey
(Source: GDDA, 1996)
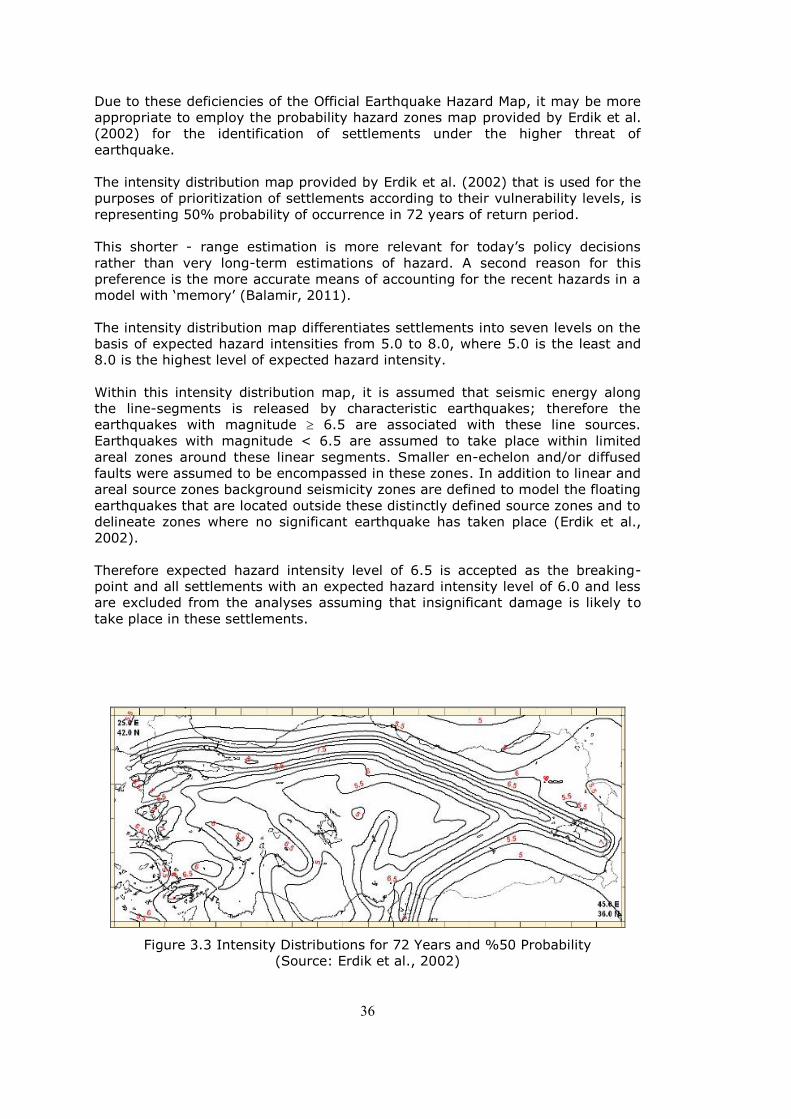
36
Due to these deficiencies of the Official Earthquake Hazard Map, it may be more
appropriate to employ the probability hazard zones map provided by Erdik et al.
(2002) for the identification of settlements under the higher threat of
earthquake.
The intensity distribution map provided by Erdik et al. (2002) that is used for the
purposes of prioritization of settlements according to their vulnerability levels, is
representing 50% probability of occurrence in 72 years of return period.
This shorter - range estimation is more relevant for today‘s policy decisions
rather than very long-term estimations of hazard. A second reason for this
preference is the more accurate means of accounting for the recent hazards in a
model with ‗memory‘ (Balamir, 2011).
The intensity distribution map differentiates settlements into seven levels on the
basis of expected hazard intensities from 5.0 to 8.0, where 5.0 is the least and
8.0 is the highest level of expected hazard intensity.
Within this intensity distribution map, it is assumed that seismic energy along
the line-segments is released by characteristic earthquakes; therefore the
earthquakes with magnitude 6.5 are associated with these line sources.
Earthquakes with magnitude < 6.5 are assumed to take place within limited
areal zones around these linear segments. Smaller en-echelon and/or diffused
faults were assumed to be encompassed in these zones. In addition to linear and
areal source zones background seismicity zones are defined to model the floating
earthquakes that are located outside these distinctly defined source zones and to
delineate zones where no significant earthquake has taken place (Erdik et al.,
2002).
Therefore expected hazard intensity level of 6.5 is accepted as the breaking-
point and all settlements with an expected hazard intensity level of 6.0 and less
are excluded from the analyses assuming that insignificant damage is likely to
take place in these settlements.
Figure 3.3 Intensity Distributions for 72 Years and %50 Probability
(Source: Erdik et al., 2002)
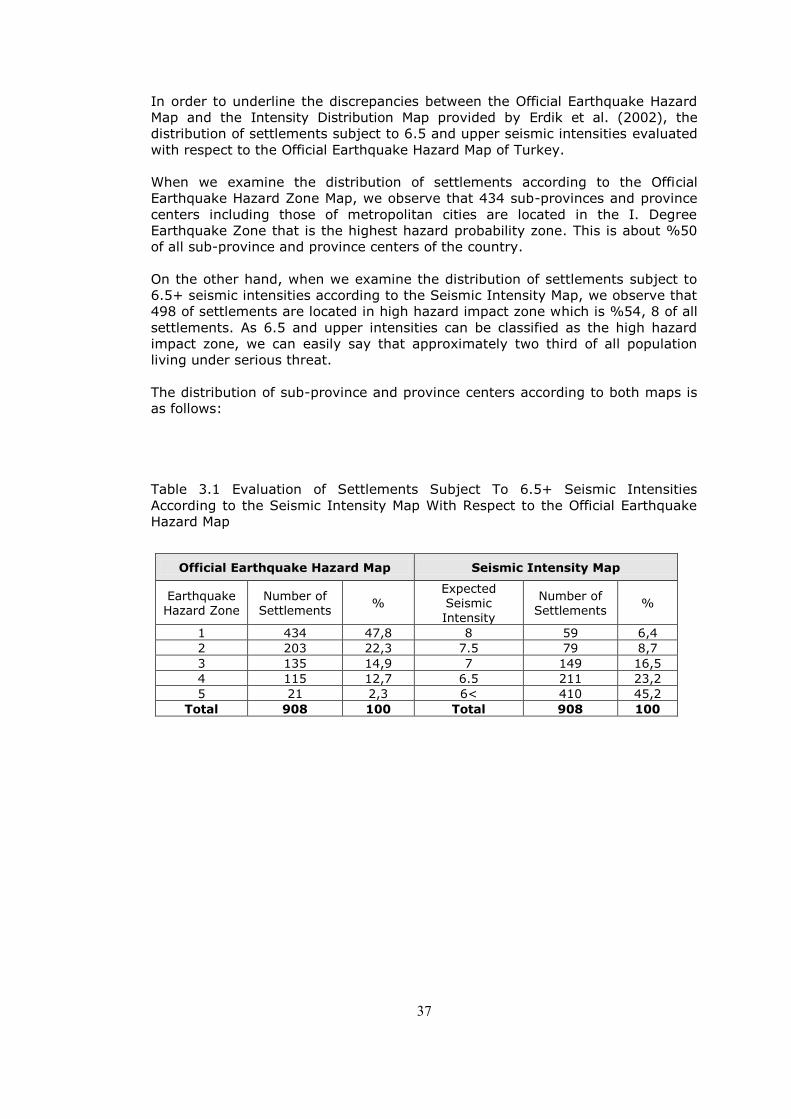
37
In order to underline the discrepancies between the Official Earthquake Hazard
Map and the Intensity Distribution Map provided by Erdik et al. (2002), the
distribution of settlements subject to 6.5 and upper seismic intensities evaluated
with respect to the Official Earthquake Hazard Map of Turkey.
When we examine the distribution of settlements according to the Official
Earthquake Hazard Zone Map, we observe that 434 sub-provinces and province
centers including those of metropolitan cities are located in the I. Degree
Earthquake Zone that is the highest hazard probability zone. This is about %50
of all sub-province and province centers of the country.
On the other hand, when we examine the distribution of settlements subject to
6.5+ seismic intensities according to the Seismic Intensity Map, we observe that
498 of settlements are located in high hazard impact zone which is %54, 8 of all
settlements. As 6.5 and upper intensities can be classified as the high hazard
impact zone, we can easily say that approximately two third of all population
living under serious threat.
The distribution of sub-province and province centers according to both maps is
as follows:
Table 3.1 Evaluation of Settlements Subject To 6.5+ Seismic Intensities
According to the Seismic Intensity Map With Respect to the Official Earthquake
Hazard Map
Official Earthquake Hazard Map Seismic Intensity Map
Earthquake Hazard Zone
Number of Settlements
% Expected Seismic
Intensity
Number of Settlements
%
1 434 47,8 8 59 6,4
2 203 22,3 7.5 79 8,7
3 135 14,9 7 149 16,5
4 115 12,7 6.5 211 23,2
5 21 2,3 6< 410 45,2
Total 908 100 Total 908 100
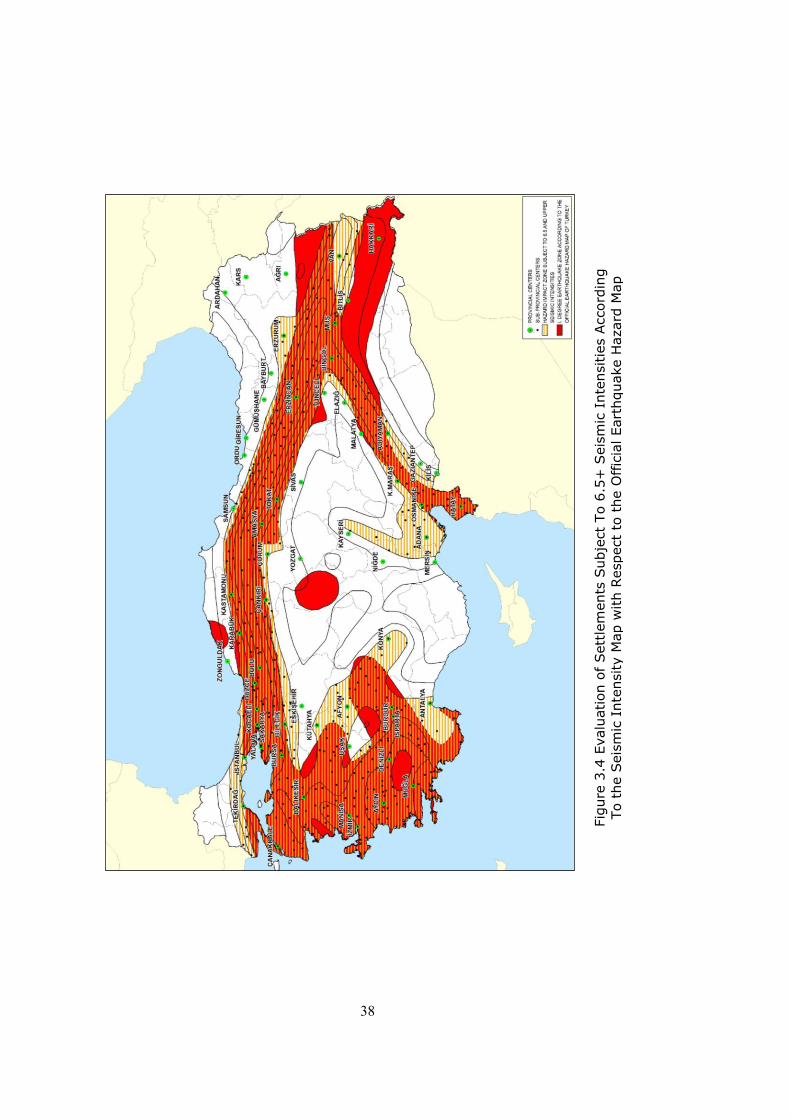
38
Figure 3.4 Evaluation of Settlements Subject To 6.5+ Seismic Intensities
According To the Seismic Intensity Map with Respect to the Official Earthquake
Hazard Map
Fig
ure
3.4
Evalu
ation o
f Sett
lem
ents
Subje
ct
To 6
.5+
Seis
mic
Inte
nsitie
s A
ccord
ing
To t
he S
eis
mic
Inte
nsity M
ap w
ith R
espect
to t
he O
ffic
ial Eart
hquake H
azard
Map
39
3.1.1. Different Measures of Seismic Hazard
Two different types of scales are commonly used to describe seismic hazards.
The original force or energy of an earthquake is measured on a magnitude scale,
while the intensity of shaking is measured on an intensity scale. However, these
two scales are quite different they are often confused.
Magnitude scale is related to the amount of seismic energy released at the
source/epicenter of the earthquake, is determined from measurements on
seismographs and is a measurement of the size of the earthquake. Intensity
scale measures the strength of shaking produced by the earthquake at a certain
location, is determined from effects on people, buildings, human structures and
the natural environment and is a measurement of the earthquake effects.
An earthquake has one magnitude, but many intensities, magnitude is a fixed
value independent of distance from the epicenter of the earthquake, whereas
intensity varies and is measured differently at different places depending upon
its distance from the epicenter.
Magnitude is quantitative and exact and it is expressed as a number; intensity is
qualitative and more subjective and it is expressed as a roman number.
Magnitude Scales
The Richter scale and The Moment Magnitude scale are both measures of the
magnitude of earthquakes. Although, both scales are still used the Moment
Magnitude scale is designed to overcome the problems of the Richter scale and is
gradually replacing the Richter scale. The numbers generated by the two scales
are usually very similar.
The Richter scale is used for the small size earthquakes while the Moment
Magnitude scale is used for the medium to large earthquakes mostly.
The Richter Magnitude Scale
The Richter magnitude scale was developed in 1935 by Charles F. Richter to
compare the size of earthquakes. It is a logarithmic scale and assigns values
from 1-10 to the magnitude of any earthquake.
Because of the logarithmic basis of the scale, each whole number increase in
magnitude represents a tenfold increase in measured amplitude; as an estimate
of energy, each whole number step in the magnitude scale corresponds to the
release of about 31 times more energy than the amount associated with the
preceding whole number value.
The Richter scale is not used to express damage. An earthquake in a densely
populated area which results in many deaths and considerable damage may
have the same magnitude as a shock in a remote area that doesn‘t affect
anything (USGS, 2012).
The following is an abbreviated description of the 10 levels of Richter Magnitude
Scale.
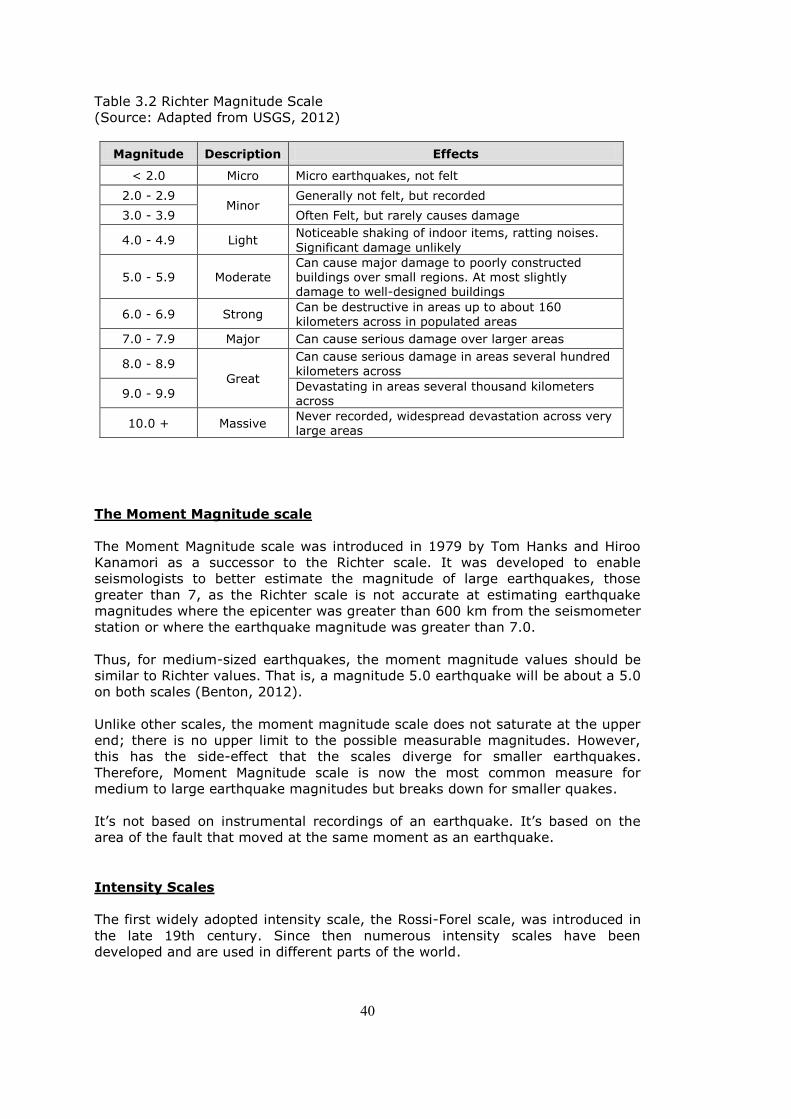
40
Table 3.2 Richter Magnitude Scale
(Source: Adapted from USGS, 2012)
Magnitude Description Effects
< 2.0 Micro Micro earthquakes, not felt
2.0 - 2.9 Minor
Generally not felt, but recorded
3.0 - 3.9 Often Felt, but rarely causes damage
4.0 - 4.9 Light Noticeable shaking of indoor items, ratting noises.
Significant damage unlikely
5.0 - 5.9 Moderate Can cause major damage to poorly constructed buildings over small regions. At most slightly damage to well-designed buildings
6.0 - 6.9 Strong Can be destructive in areas up to about 160 kilometers across in populated areas
7.0 - 7.9 Major Can cause serious damage over larger areas
8.0 - 8.9
Great
Can cause serious damage in areas several hundred
kilometers across
9.0 - 9.9 Devastating in areas several thousand kilometers across
10.0 + Massive Never recorded, widespread devastation across very large areas
The Moment Magnitude scale
The Moment Magnitude scale was introduced in 1979 by Tom Hanks and Hiroo
Kanamori as a successor to the Richter scale. It was developed to enable
seismologists to better estimate the magnitude of large earthquakes, those
greater than 7, as the Richter scale is not accurate at estimating earthquake
magnitudes where the epicenter was greater than 600 km from the seismometer
station or where the earthquake magnitude was greater than 7.0.
Thus, for medium-sized earthquakes, the moment magnitude values should be
similar to Richter values. That is, a magnitude 5.0 earthquake will be about a 5.0
on both scales (Benton, 2012).
Unlike other scales, the moment magnitude scale does not saturate at the upper
end; there is no upper limit to the possible measurable magnitudes. However,
this has the side-effect that the scales diverge for smaller earthquakes.
Therefore, Moment Magnitude scale is now the most common measure for
medium to large earthquake magnitudes but breaks down for smaller quakes.
It‘s not based on instrumental recordings of an earthquake. It‘s based on the
area of the fault that moved at the same moment as an earthquake.
Intensity Scales
The first widely adopted intensity scale, the Rossi-Forel scale, was introduced in
the late 19th century. Since then numerous intensity scales have been
developed and are used in different parts of the world.
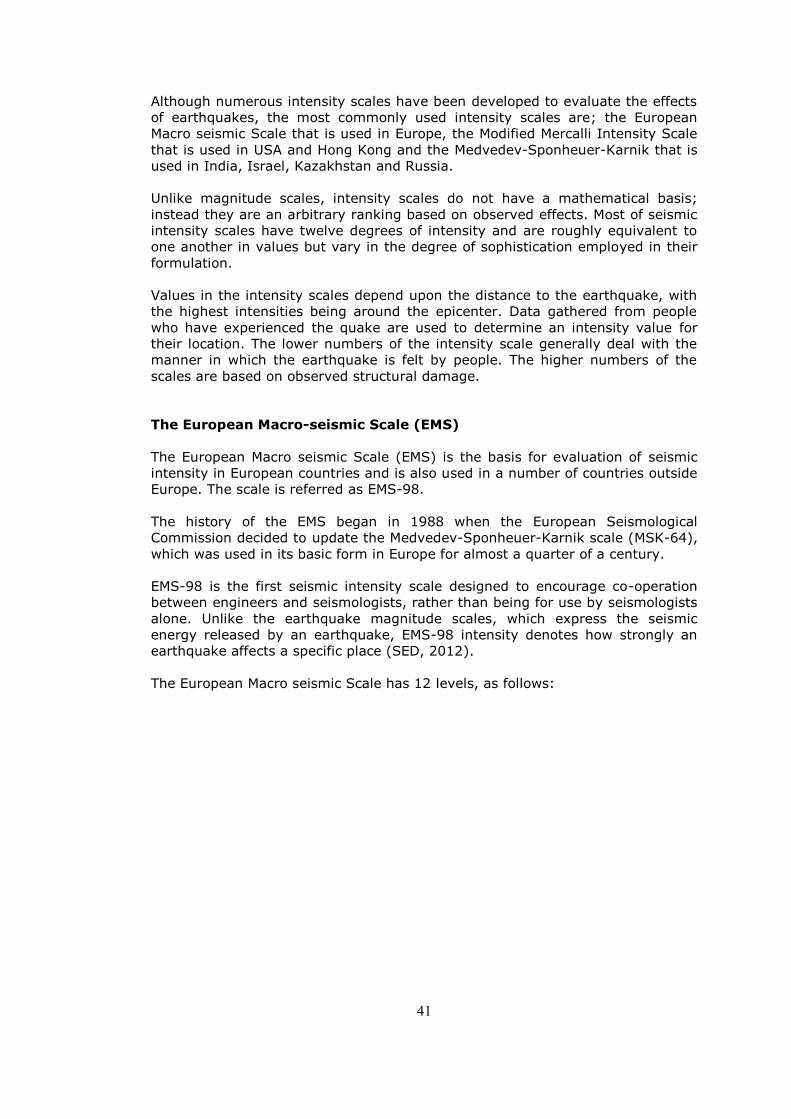
41
Although numerous intensity scales have been developed to evaluate the effects
of earthquakes, the most commonly used intensity scales are; the European
Macro seismic Scale that is used in Europe, the Modified Mercalli Intensity Scale
that is used in USA and Hong Kong and the Medvedev-Sponheuer-Karnik that is
used in India, Israel, Kazakhstan and Russia.
Unlike magnitude scales, intensity scales do not have a mathematical basis;
instead they are an arbitrary ranking based on observed effects. Most of seismic
intensity scales have twelve degrees of intensity and are roughly equivalent to
one another in values but vary in the degree of sophistication employed in their
formulation.
Values in the intensity scales depend upon the distance to the earthquake, with
the highest intensities being around the epicenter. Data gathered from people
who have experienced the quake are used to determine an intensity value for
their location. The lower numbers of the intensity scale generally deal with the
manner in which the earthquake is felt by people. The higher numbers of the
scales are based on observed structural damage.
The European Macro-seismic Scale (EMS)
The European Macro seismic Scale (EMS) is the basis for evaluation of seismic
intensity in European countries and is also used in a number of countries outside
Europe. The scale is referred as EMS-98.
The history of the EMS began in 1988 when the European Seismological
Commission decided to update the Medvedev-Sponheuer-Karnik scale (MSK-64),
which was used in its basic form in Europe for almost a quarter of a century.
EMS-98 is the first seismic intensity scale designed to encourage co-operation
between engineers and seismologists, rather than being for use by seismologists
alone. Unlike the earthquake magnitude scales, which express the seismic
energy released by an earthquake, EMS-98 intensity denotes how strongly an
earthquake affects a specific place (SED, 2012).
The European Macro seismic Scale has 12 levels, as follows:

42
Table 3.3 European Macro Seismic Scale (EMS-98)
(Source: SED, 2012)
The Modified Mercalli Intensity Scale
The Mercalli scale originated with the widely-used simple ten-degree Rossi-Forel
scale which was revised by Giuseppe Mercalli in 1884. In 1931 it was modified
by Harry Wood and Frank Neumann as the Mercalli-Wood-Neumann (MWN)
scale. The scale is known today as the Modified Mercalli scale (MM) Intensity
scale.
The Modified Mercalli Intensity scale quantifies the effects of an earthquake on
the Earth's surface, humans, objects of nature and man-made structures on a
scale from I (not felt) to XII (total destruction).
This scale, composed of 12 increasing levels of intensity that range from
imperceptible shaking to catastrophic destruction, is designated by Roman
numerals. It does not have a mathematical basis; instead it is an arbitrary
ranking based on observed effects.
The following is an abbreviated description of the 12 levels of Modified Mercalli
Intensity Scale.
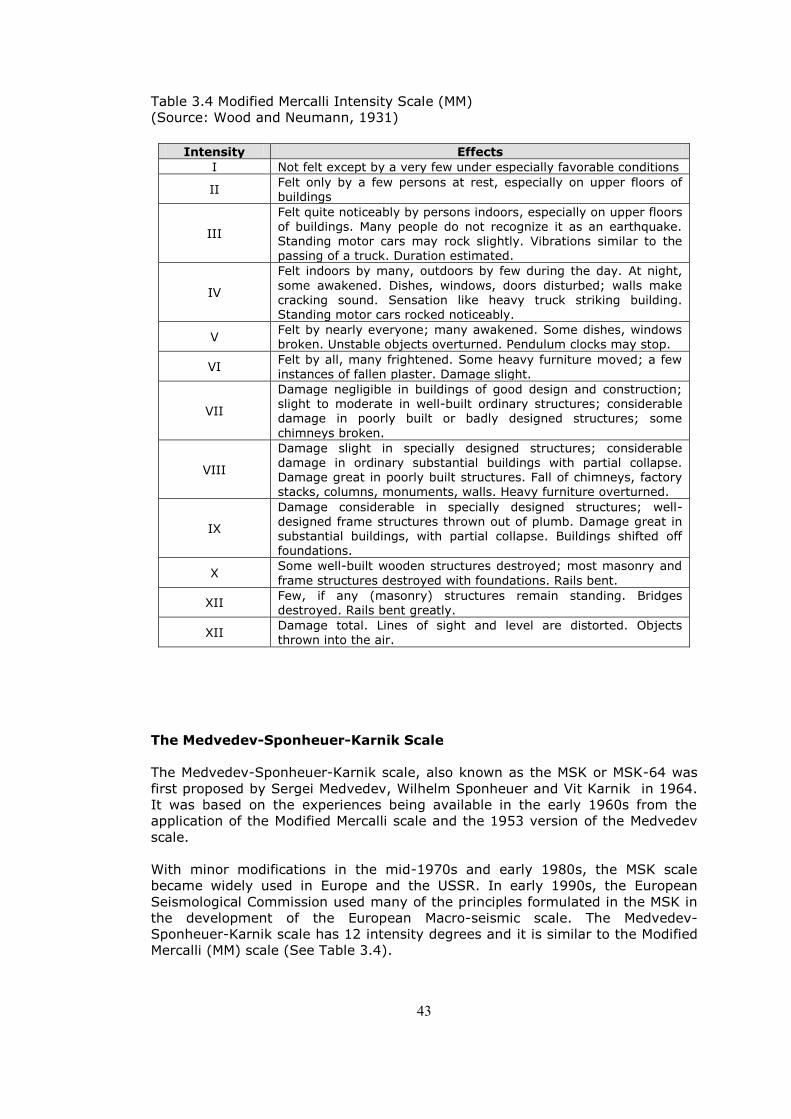
43
Table 3.4 Modified Mercalli Intensity Scale (MM)
(Source: Wood and Neumann, 1931)
Intensity Effects
I Not felt except by a very few under especially favorable conditions
II Felt only by a few persons at rest, especially on upper floors of buildings
III
Felt quite noticeably by persons indoors, especially on upper floors of buildings. Many people do not recognize it as an earthquake. Standing motor cars may rock slightly. Vibrations similar to the passing of a truck. Duration estimated.
IV
Felt indoors by many, outdoors by few during the day. At night,
some awakened. Dishes, windows, doors disturbed; walls make cracking sound. Sensation like heavy truck striking building. Standing motor cars rocked noticeably.
V Felt by nearly everyone; many awakened. Some dishes, windows broken. Unstable objects overturned. Pendulum clocks may stop.
VI Felt by all, many frightened. Some heavy furniture moved; a few
instances of fallen plaster. Damage slight.
VII
Damage negligible in buildings of good design and construction; slight to moderate in well-built ordinary structures; considerable damage in poorly built or badly designed structures; some
chimneys broken.
VIII
Damage slight in specially designed structures; considerable damage in ordinary substantial buildings with partial collapse. Damage great in poorly built structures. Fall of chimneys, factory stacks, columns, monuments, walls. Heavy furniture overturned.
IX
Damage considerable in specially designed structures; well-designed frame structures thrown out of plumb. Damage great in substantial buildings, with partial collapse. Buildings shifted off foundations.
X Some well-built wooden structures destroyed; most masonry and
frame structures destroyed with foundations. Rails bent.
XII Few, if any (masonry) structures remain standing. Bridges destroyed. Rails bent greatly.
XII Damage total. Lines of sight and level are distorted. Objects thrown into the air.
The Medvedev-Sponheuer-Karnik Scale
The Medvedev-Sponheuer-Karnik scale, also known as the MSK or MSK-64 was
first proposed by Sergei Medvedev, Wilhelm Sponheuer and Vit Karnik in 1964.
It was based on the experiences being available in the early 1960s from the
application of the Modified Mercalli scale and the 1953 version of the Medvedev
scale.
With minor modifications in the mid-1970s and early 1980s, the MSK scale
became widely used in Europe and the USSR. In early 1990s, the European
Seismological Commission used many of the principles formulated in the MSK in
the development of the European Macro-seismic scale. The Medvedev-
Sponheuer-Karnik scale has 12 intensity degrees and it is similar to the Modified
Mercalli (MM) scale (See Table 3.4).
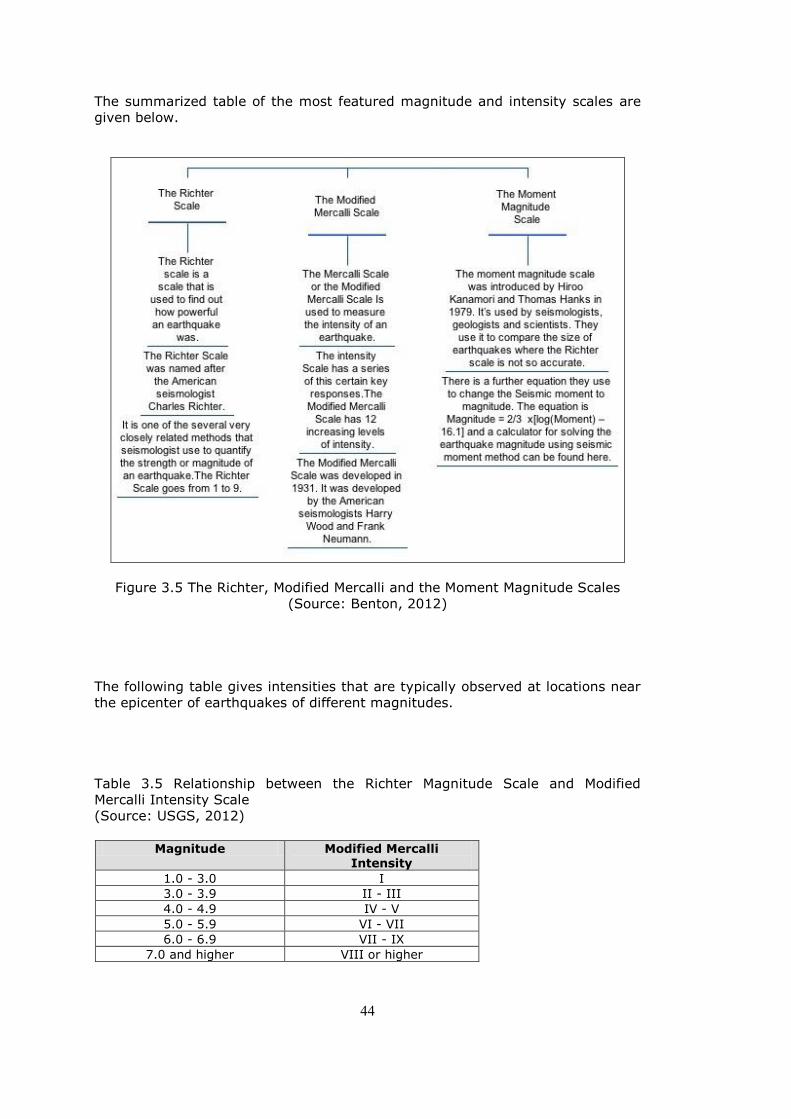
44
The summarized table of the most featured magnitude and intensity scales are
given below.
Figure 3.5 The Richter, Modified Mercalli and the Moment Magnitude Scales
(Source: Benton, 2012)
The following table gives intensities that are typically observed at locations near
the epicenter of earthquakes of different magnitudes.
Table 3.5 Relationship between the Richter Magnitude Scale and Modified
Mercalli Intensity Scale
(Source: USGS, 2012)
Magnitude Modified Mercalli
Intensity
1.0 - 3.0 I
3.0 - 3.9 II - III
4.0 - 4.9 IV - V
5.0 - 5.9 VI - VII
6.0 - 6.9 VII - IX
7.0 and higher VIII or higher
45
3.1.2. Explanation of Erdik Rationale
The technical approach used for the assessment and prioritization of the seismic
vulnerabilities in Turkey employed within the study is based on the particular
seismic intensity information derived by Erdik et al. (2002).
Two different methodologies have been used by Erdik et al. (2002) to compute
the probabilistic hazard in Turkey. These are ‗time-dependent approach‘ for the
Marmara region and ‗Poisson approach‘ for the remaining regions of the Turkey.
―Earthquake occurrence and fault segmentation data in the Marmara region are
adequate to constrain a time dependent characteristic model for the region. The
results of the study indicate a lower future hazard for the region of the 1999
earthquake and a higher hazard for the Central Marmara Sea region
corresponding to the un-ruptured segments of the Main Marmara Fault in the
Marmara Sea, when compared to Poisson, so-called memory-less models. This
finding is also in accordance with (Parsons et al, 2000) indicating heightened
probabilities for a major earthquake in the Marmara Sea region based on stress
transfer approach‖ (Erdik at al., 2010).
―In time-dependent models, the probability of earthquake occurrence increases
with the elapsed time since the last major earthquake on the fault that controls
the regional earthquake hazard. In the case of the main Marmara Fault this
earthquake is the 1999 Kocaeli event. This model is characterized by the
recurrence-interval probability-density function of the characteristic earthquakes.
Extensive paleoseismic and historical seismicity investigations on individual
strike-slip faults (especially in California and Northwestern Turkey) indicate a
quasi-periodic occurrence of characteristic earthquakes favoring the use of ‗time
dependent‘ stochastic models‖ (Erdik at al., 2010). The methodology, elaborated
in Erdik et al., is essentially very similar to the one developed and used by
United States Geological Survey - Working Group on California Earthquake
Probabilities (WGCEP) for the preparation of US National Seismic Hazard Maps.
The main physical ingredients of seismic hazard assessment are the tectonic
setting of the region, the earthquake occurrences and the local site conditions.
―While the Poisson process seems to be applicable in a global sense in a regional
scale, extensive paleoseismic and historical seismicity investigations on
individual faults indicate a somewhat periodic occurrence of large magnitude
earthquakes that necessitate the use of ‗time dependent‘ (or ‗renewal‘)
stochastic models (Schwartz and Coppersmith, 1984). The time dependent
model is based on the assumption that the occurrence of large earthquakes has
some periodicity. The conditional probability that an earthquake occurs in the
next T years, given that it has not occurred in the last T years is calculated by
and integral function. For the renewal model, the conditional probabilities for
each fault segment are calculated. These probabilities are said to be conditional
since they change as a function of the time elapsed since the last earthquake‖
(Erdik at al., 2010).
The time-independent probabilistic ‗Poissonian model‘ was used to assess the
seismic hazard in the remaining regions of the Turkey. For the earthquake
events to follow that model, the following assumptions are in order:
1- Earthquakes are spatially independent;
2- Earthquakes are temporally independent;
3- Probability that two seismic events will take place at the same time and at the
same place approaches zero.
46
―The historical and instrumental seismicity, tectonic models and the known slip
rates along the faults constitute the main ingredients of the hazard analysis.
Seismic Zonation has been implemented in three levels. The first level consists
of linear faults representing the North Anatolian Fault (NAF), the north and east
branches of NAF in the Marmara region, Bitlis – Zagros Suture Zone, Hatay
Fault, Ezinepazari Fault, East-Anatolian Fault, Goksun Fault, Ecemis Fault,
Tuzgolu Fault, Eskisehir Fault Zone, Simav-Sultandağ Fault Zone, Fethiye-Burdur
Fault Zone, Gokova Fault Zone, Menderes Fault Zone, Gediz Fault Zone and
Bergama Fault Zone. It is assumed that seismic energy along the line-segments
is released by characteristic earthquakes; therefore the earthquakes with
magnitude Mw 6.5 are associated with these line sources. The second level
consists of limited areal zones around these linear segments assuming that
earthquakes with magnitude Mw< 6.5 may take place within this zone. Smaller
en-echelon and/or diffused faults were assumed to be encompassed in these
zones. The third level considers the background seismicity, which represents the
diffused seismicity that cannot be associated with known faults‖ (Erdik et al.,
2010).
―Owing to the geological and geo-tectonic similarity of Anatolia to the California
(strike slip faults similar to North, Northeast and East Anatolian Faults), the
average of Boore et al. (1997), Sadigh et.al. (1997) and Campbell et al.(2003)
ground motion prediction models for Peak Ground Acceleration (PGA) and the
average of Boore et. al. (1997) and Sadigh et.al. (1997) ground motion
prediction models for Spectral accelerations at 0.2 sec. and 1.0 sec. periods
currently used for the assessment of earthquake hazard for the Western US were
utilized. Another reason for the selection of these models was the good
agreement between the instrumental intensities computed with these models
with the observed macro seismic intensity distribution‖ (Erdik et al., 2002).
―The influence of the local geological structure on damage distribution due to
ground-motion amplification (also called site effects) has been well known in the
literature (Borcherdt, 1994). The construction of the design basis response
spectrum for different Site Classes can be achieved through the modification of
the spectral acceleration (SA at 0.2s and at 1.0 sec) given by the hazard maps.
The Uniform Hazard Response Spectrum presented in NEHRP (2003) that is
employed as the appropriate spectral shape for a site is constructed with two
parameters: the site-specific short period (SMS); and medium-period (SM1)
spectral accelerations‖ (Erdik et al., 2002).
Site dependent peak ground acceleration (PGA) and peak ground velocities
(PGV) for each return period (72, 475 and 2475 years) inferred from site
dependent short and medium period spectral accelerations SMS and SM1 are
calculated using the site dependent spectral accelerations for T=0.2 sec and
T=1.0 sec. Based on the Wald et al (1999) methodology, the intensity
distributions corresponding to 50%, 10% and 2% probabilities of exceedence in
50 years (return period of 72, 475, and 2475 years) have been obtained from
both the site dependent PGA and PGV values (See Figure 3.7).
The intensity distribution of province and sub-province centers for 72 years
return period and %50 probability are thus determined with respect to this
research derived by Erdik et al. (2002) and is employed for the assessment and
prioritization of the seismic vulnerabilities in Turkey within the study.
47
3.2. Loss Levels in Building Stock
Observed or estimated loss in settlements experiencing earthquakes could be
measured by estimations with reference to the building stock. Risk in settlement
units is defined as a function of material loss in the building stock with respect to
the expected seismic event. It is assumed that loss in the building stock in each
settlement can be used as a proxy to express the comparative loss of human
life, economic loss, damages in infrastructural systems, as well as secondary and
indirect levels of losses in the settlement. Therefore, settlement level loss in the
building stock is the basic indicator of assumed risk and provides the dependent
variables of the research.
In the estimation of building stock loss of settlements, three basic information
components are employed:
1- The seismic hazard intensity of each settlement is likely to experience,
based on a common set of assumptions is the first component. The
particular seismic intensity information employed here is the 72-year
return intensity with 50% probability and derived by Erdik et al. (2002).
The map containing the spatial distribution of this information was used
to determine the hazard level of all sub-provincial and provincial centers
(See Figure 3.3).
2- Information concerning building stock properties in each settlement is
obtained from TurkStat. The Building Census 2000 provides information
on aspects of the building stock in each settlement. Following the
categorization of the building stock provided in Demircioğlu (2010), four
distinct groups of buildings have been identified in terms of number of
buildings and number of storeys in each settlement (See Table 3.10).
3- Vulnerability/Fragility curves for each category of the building stock in
Turkey, as empirically derived in Demircioğlu (2010) are employed here
to determine the likely loss levels in settlements. According to this
procedure, each of the four categories of the building stock in every
settlement is separately evaluated in their likely response to the
estimated intensity of shake (See Figures 3.17, 3.18 and 3.19).
By using three basic information components described above, determination of
settlement level loss in the building stock has been realized by the following steps:
1. Assessment of the probabilistic seismic hazard and production of
Settlements in Hazard Zones Map (72-years; 50% probability),
2. Determination of Settlement Categories According to Size,
3. Identification of Categories of Building Types in Each Settlement,
4. Determination of Loss Levels of Each Building Category with reference to
Vulnerability Curves,
5. Ordering of Settlements in Each Category According to Total Absolute Loss
and Relative Loss
Following above described procedure, identification of most vulnerable settlements
in each size-category and ‗provinces with high-risk‘ are accomplished.
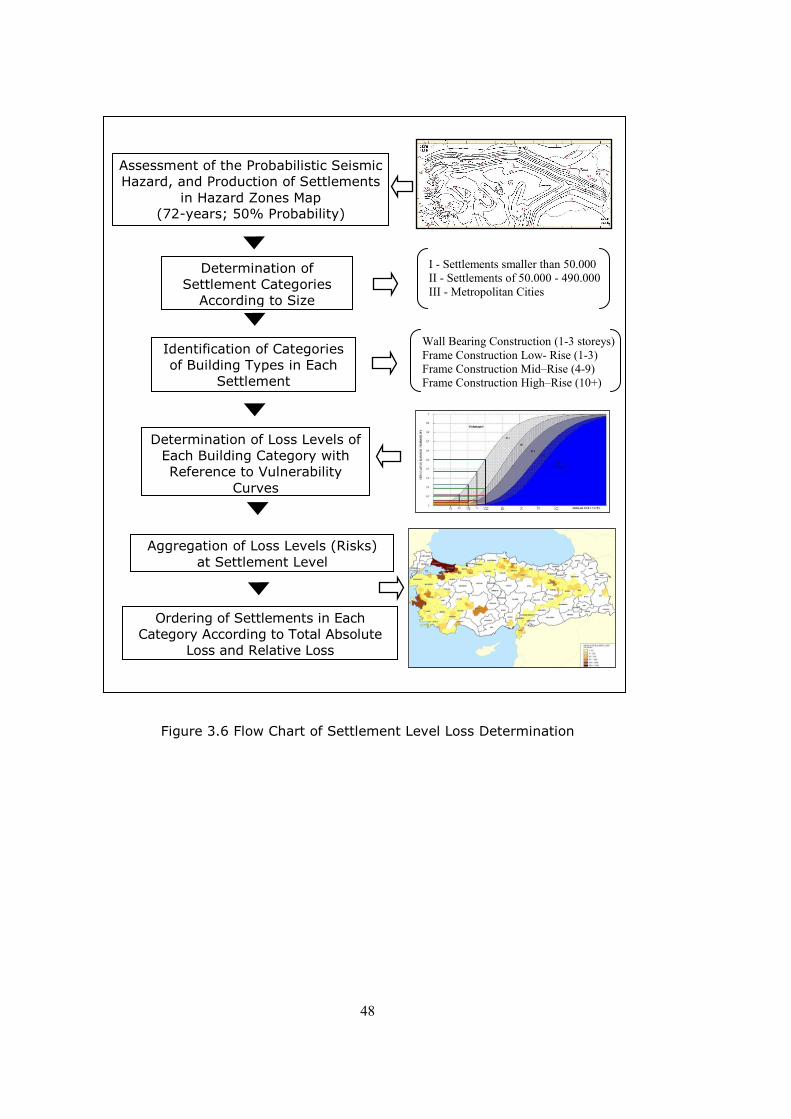
48
Figure 3.6 Flow Chart of Settlement Level Loss Determination
Assessment of the Probabilistic Seismic
Hazard, and Production of Settlements
in Hazard Zones Map (72-years; 50% Probability)
Determination of
Settlement Categories
According to Size
Identification of Categories
of Building Types in Each
Settlement
Determination of Loss Levels of
Each Building Category with
Reference to Vulnerability
Curves
Aggregation of Loss Levels (Risks)
at Settlement Level
Wall Bearing Construction (1-3 storeys) Frame Construction Low- Rise (1-3) Frame Construction Mid–Rise (4-9) Frame Construction High–Rise (10+)
Ordering of Settlements in Each
Category According to Total Absolute
Loss and Relative Loss
I - Settlements smaller than 50.000 II - Settlements of 50.000 - 490.000 III - Metropolitan Cities
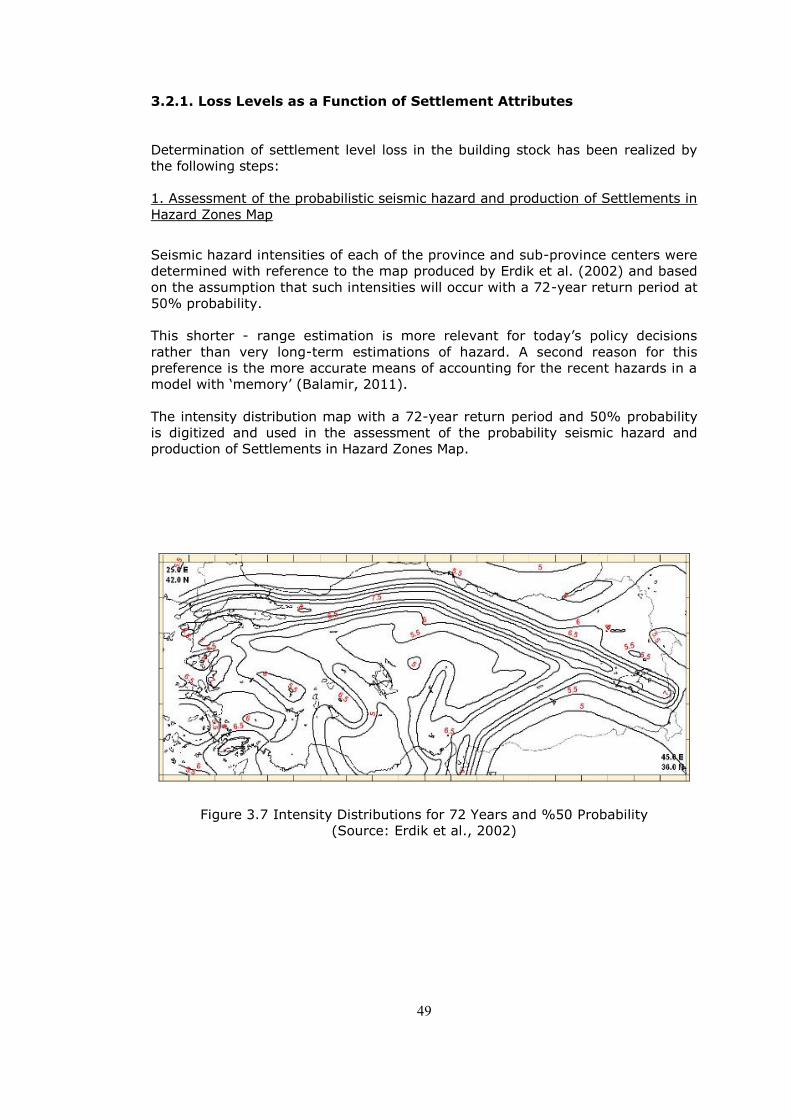
49
3.2.1. Loss Levels as a Function of Settlement Attributes
Determination of settlement level loss in the building stock has been realized by
the following steps:
1. Assessment of the probabilistic seismic hazard and production of Settlements in
Hazard Zones Map
Seismic hazard intensities of each of the province and sub-province centers were
determined with reference to the map produced by Erdik et al. (2002) and based
on the assumption that such intensities will occur with a 72-year return period at
50% probability.
This shorter - range estimation is more relevant for today‘s policy decisions
rather than very long-term estimations of hazard. A second reason for this
preference is the more accurate means of accounting for the recent hazards in a
model with ‗memory‘ (Balamir, 2011).
The intensity distribution map with a 72-year return period and 50% probability
is digitized and used in the assessment of the probability seismic hazard and
production of Settlements in Hazard Zones Map.
Figure 3.7 Intensity Distributions for 72 Years and %50 Probability
(Source: Erdik et al., 2002)
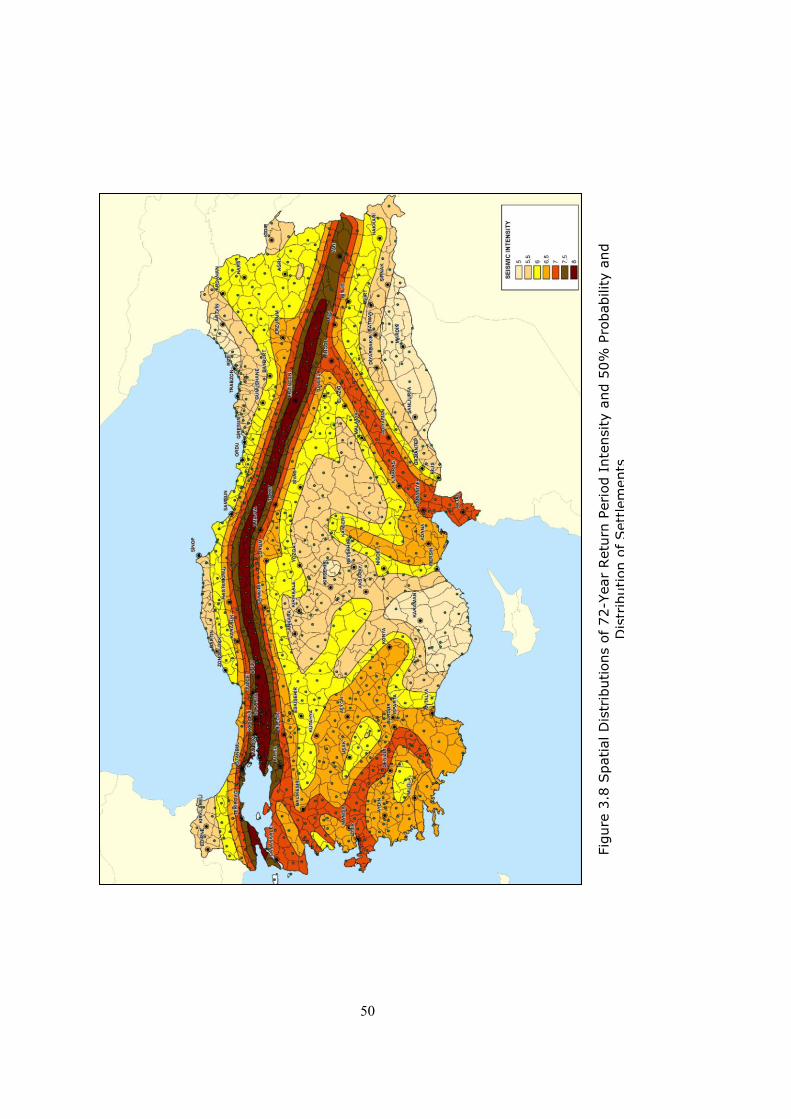
50
Figure 3.8 Spatial distributions of 72-year return period intensity and 50%
probability and distribution of settlements
Fig
ure
3.8
Spatial D
istr
ibutions o
f 72-Y
ear
Retu
rn P
eri
od I
nte
nsity a
nd 5
0%
Pro
bability a
nd
Dis
trib
ution o
f Sett
lem
ents
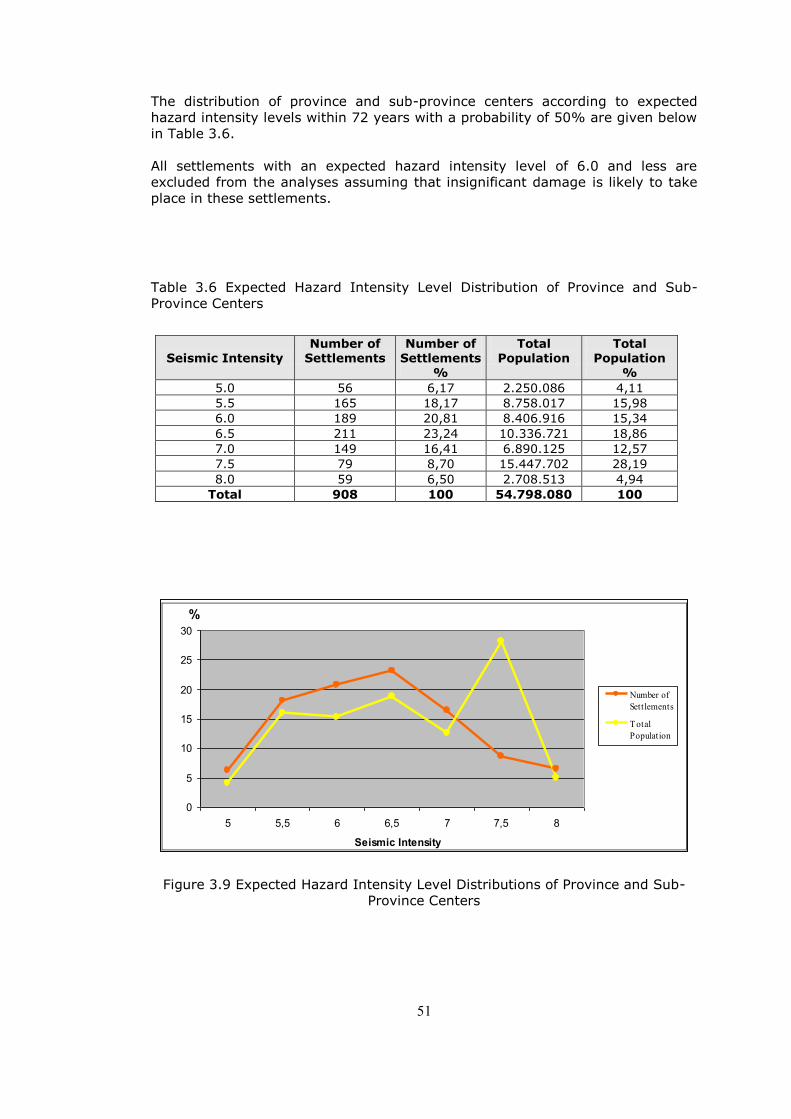
51
The distribution of province and sub-province centers according to expected
hazard intensity levels within 72 years with a probability of 50% are given below
in Table 3.6.
All settlements with an expected hazard intensity level of 6.0 and less are
excluded from the analyses assuming that insignificant damage is likely to take
place in these settlements.
Table 3.6 Expected Hazard Intensity Level Distribution of Province and Sub-
Province Centers
Seismic Intensity Number of
Settlements Number of
Settlements
%
Total Population
Total Population
%
5.0 56 6,17 2.250.086 4,11
5.5 165 18,17 8.758.017 15,98
6.0 189 20,81 8.406.916 15,34
6.5 211 23,24 10.336.721 18,86
7.0 149 16,41 6.890.125 12,57
7.5 79 8,70 15.447.702 28,19
8.0 59 6,50 2.708.513 4,94
Total 908 100 54.798.080 100
0
5
10
15
20
25
30
5 5,5 6 6,5 7 7,5 8
Seismic Intensity
%
Number ofSettlements
TotalPopulation
Figure 3.9 Expected Hazard Intensity Level Distributions of Province and Sub-
Province Centers
52
2. Determination of Settlement Categories According to Size
Seeking for settlement attributes that can express overall vulnerability levels of
cities could take into consideration the wide range of differences of settlements
which could in the first instance be specified by size.
Metropolitan cities, large settlements and a multitude of smaller towns may be
distinctly grouped both in terms of dependent and independent variables.
The rationale for categorization of settlements is the nature of vulnerabilities that
is likely to vary in each settlement according to many interdependent
components in physical and socio-economical terms. Yet settlements subject to
similar intensities will have different levels of loss and cannot be described as of
equal in vulnerabilities. One of the most featured reasons of this differentiation is
the size of settlements.
If absolute vulnerabilities are measured in terms of likely loss levels, a bias for
larger settlements and developed regions is inevitable. In order to avoid bias due
to size of larger settlements and developed regions, a method of sub-grouping is
to be employed. It may be appropriate to categorize the settlements in terms of
population size and a categorization of settlements with reference to population
is considered as an initial step.
Three groups of settlements are considered according to categorization of
settlements with reference to population.
i- Metropolitan cities are identified as a separate category at the upper
end. Irrespective of size and location, such province and sub-province centers
are considered as a single settlement unit.
The remaining smaller cities are distinguished in two parts, almost identical in
terms of total population. This marks the threshold size of 50.000.
ii- Sub-provincial and provincial centers of 50.000-490.000 are identified
as a second category of settlements. These are often well-established
settlements with higher rates of growth and expanding economies.
iii- Smaller sub-provincial and provincial centers with a population less
than 50.000 make the third group of urban centers. These are relatively
stagnant settlements.
The frequency distributions of province and sub-province centers subject to
seismic disturbance of 6.5+ within 72 years with a probability of 50% are given
below in terms of total population. The break-point of 50‘000 is indicated in red.
Population distribution of settlements with reference to categories identified in
the whole spectrum of seismic intensity levels is an overall indicator of exposure.
The distributions of settlements within each size-category are given in the Figure
3.14.
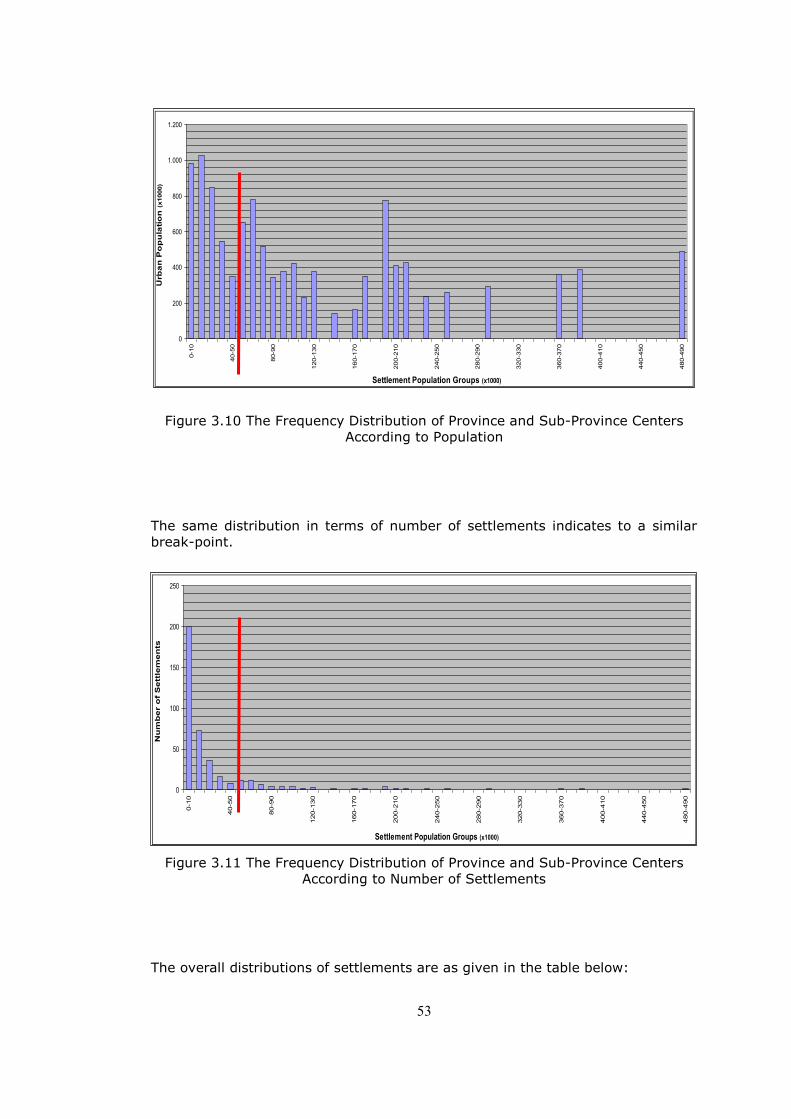
53
0
200
400
600
800
1.000
1.200
0-1
0
40-5
0
80-9
0
120-1
30
160-1
70
200-2
10
240-2
50
280-2
90
320-3
30
360-3
70
400-4
10
440-4
50
480-4
90
Settlement Population Groups (x1000)
Urb
an
Po
pu
lati
on
(x1000)
Figure 3.10 The Frequency Distribution of Province and Sub-Province Centers
According to Population
The same distribution in terms of number of settlements indicates to a similar
break-point.
0
50
100
150
200
250
0-1
0
40-5
0
80-9
0
120-1
30
160-1
70
200-2
10
240-2
50
280-2
90
320-3
30
360-3
70
400-4
10
440-4
50
480-4
90
Settlement Population Groups (x1000)
Nu
mb
er o
f S
ett
lem
en
ts
Figure 3.11 The Frequency Distribution of Province and Sub-Province Centers
According to Number of Settlements
The overall distributions of settlements are as given in the table below:
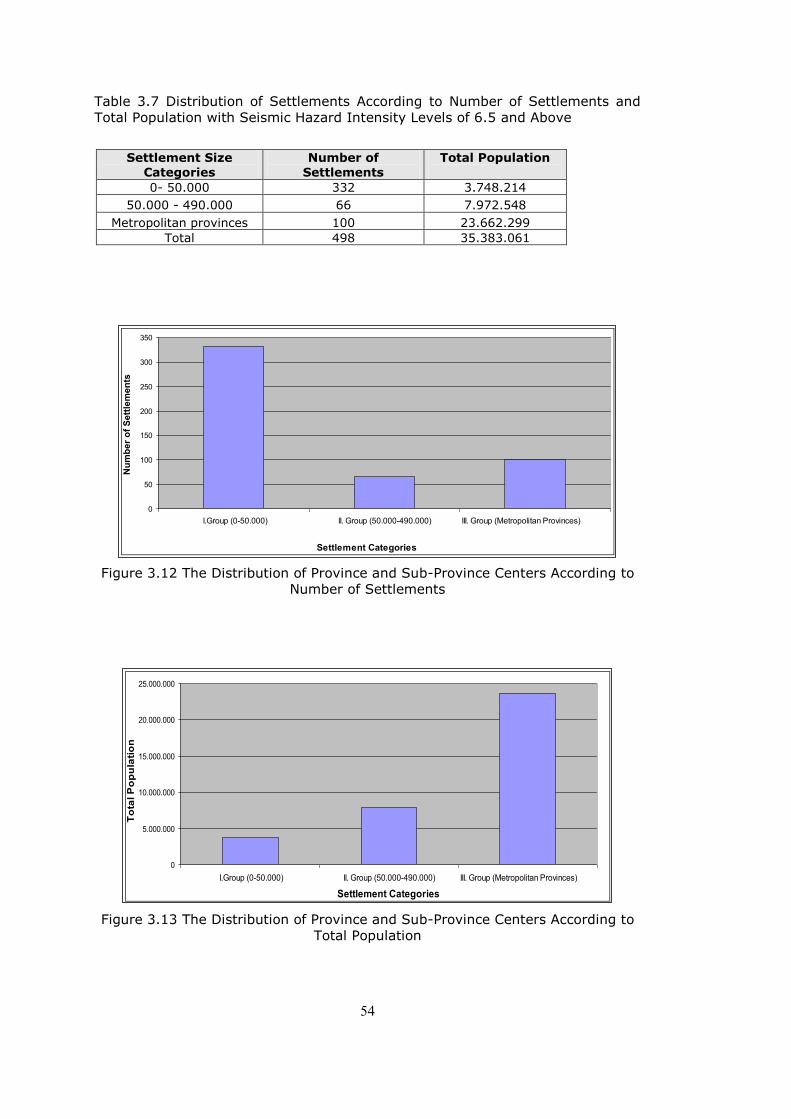
54
Table 3.7 Distribution of Settlements According to Number of Settlements and
Total Population with Seismic Hazard Intensity Levels of 6.5 and Above
Settlement Size
Categories
Number of
Settlements
Total Population
0- 50.000 332 3.748.214
50.000 - 490.000 66 7.972.548
Metropolitan provinces 100 23.662.299
Total 498 35.383.061
0
50
100
150
200
250
300
350
I.Group (0-50.000) II. Group (50.000-490.000) III. Group (Metropolitan Provinces)
Settlement Categories
Nu
mb
er
of
Sett
lem
en
ts
Figure 3.12 The Distribution of Province and Sub-Province Centers According to
Number of Settlements
0
5.000.000
10.000.000
15.000.000
20.000.000
25.000.000
I.Group (0-50.000) II. Group (50.000-490.000) III. Group (Metropolitan Provinces)
Settlement Categories
To
tal P
op
ula
tio
n
Figure 3.13 The Distribution of Province and Sub-Province Centers According to
Total Population

55
Figure
3.14 Spatial Distributions of Settlement Categories
Fig
ure
3.1
4 S
patial D
istr
ibutions o
f Sett
lem
ent
Cate
gories
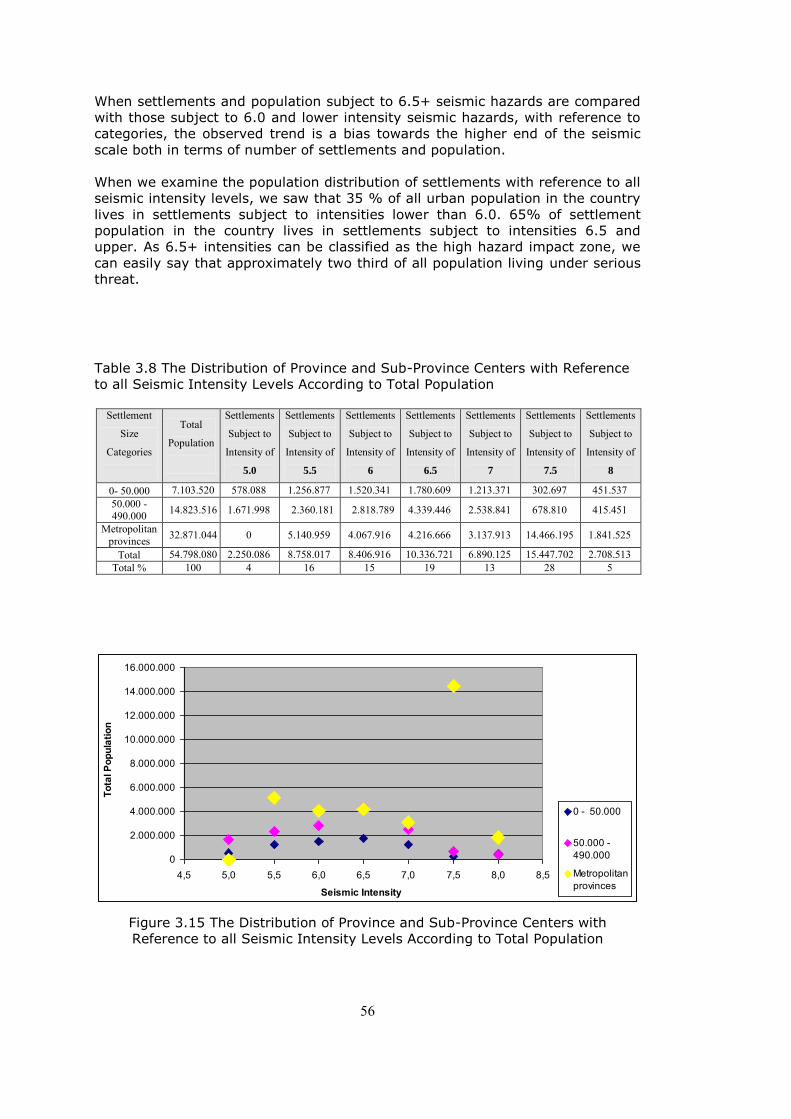
56
When settlements and population subject to 6.5+ seismic hazards are compared
with those subject to 6.0 and lower intensity seismic hazards, with reference to
categories, the observed trend is a bias towards the higher end of the seismic
scale both in terms of number of settlements and population.
When we examine the population distribution of settlements with reference to all
seismic intensity levels, we saw that 35 % of all urban population in the country
lives in settlements subject to intensities lower than 6.0. 65% of settlement
population in the country lives in settlements subject to intensities 6.5 and
upper. As 6.5+ intensities can be classified as the high hazard impact zone, we
can easily say that approximately two third of all population living under serious
threat.
Table 3.8 The Distribution of Province and Sub-Province Centers with Reference
to all Seismic Intensity Levels According to Total Population
Settlement
Size
Categories
Total
Population
Settlements
Subject to
Intensity of
5.0
Settlements
Subject to
Intensity of
5.5
Settlements
Subject to
Intensity of
6
Settlements
Subject to
Intensity of
6.5
Settlements
Subject to
Intensity of
7
Settlements
Subject to
Intensity of
7.5
Settlements
Subject to
Intensity of
8
0- 50.000 7.103.520 578.088 1.256.877 1.520.341 1.780.609 1.213.371 302.697 451.537 50.000 - 490.000 14.823.516 1.671.998 2.360.181 2.818.789 4.339.446 2.538.841 678.810 415.451
Metropolitan provinces 32.871.044 0 5.140.959 4.067.916 4.216.666 3.137.913 14.466.195 1.841.525
Total 54.798.080 2.250.086 8.758.017 8.406.916 10.336.721 6.890.125 15.447.702 2.708.513 Total % 100 4 16 15 19 13 28 5
0
2.000.000
4.000.000
6.000.000
8.000.000
10.000.000
12.000.000
14.000.000
16.000.000
4,5 5,0 5,5 6,0 6,5 7,0 7,5 8,0 8,5
Seismic Intensity
To
tal P
op
ula
tio
n
0 - 50.000
50.000 -
490.000
Metropolitan
provinces
Figure 3.15 The Distribution of Province and Sub-Province Centers with
Reference to all Seismic Intensity Levels According to Total Population
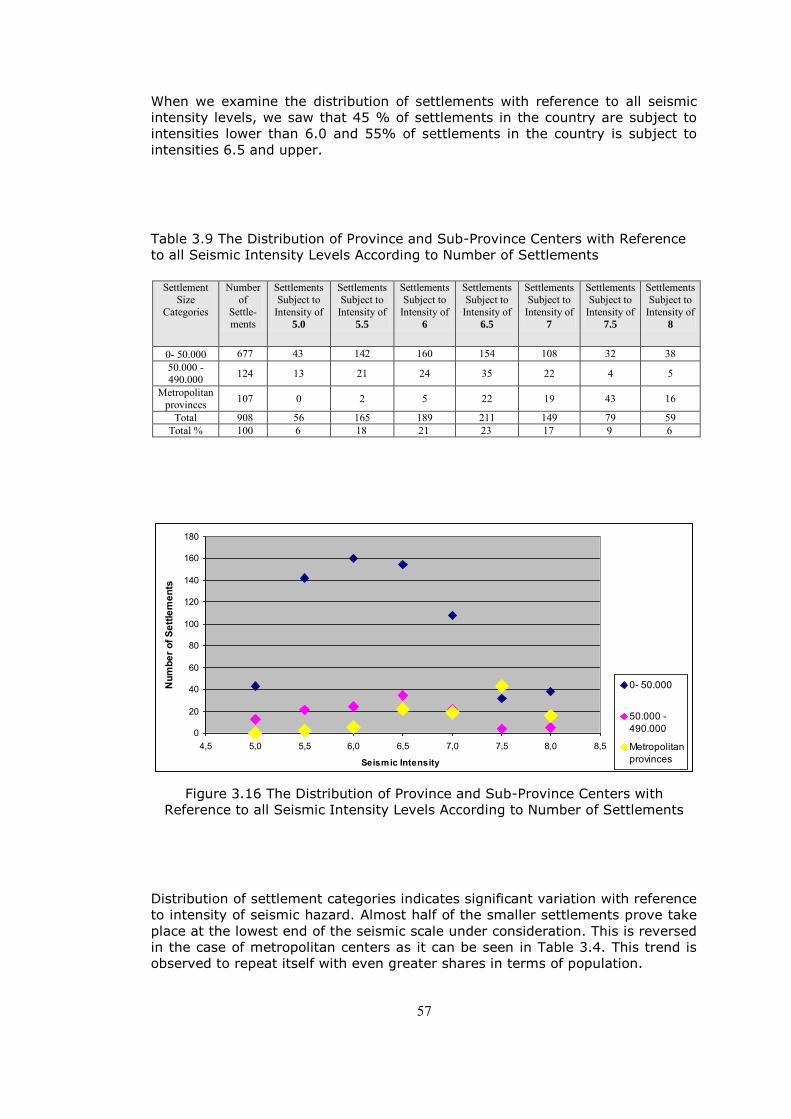
57
When we examine the distribution of settlements with reference to all seismic
intensity levels, we saw that 45 % of settlements in the country are subject to
intensities lower than 6.0 and 55% of settlements in the country is subject to
intensities 6.5 and upper.
Table 3.9 The Distribution of Province and Sub-Province Centers with Reference
to all Seismic Intensity Levels According to Number of Settlements
Settlement Size
Categories
Number of
Settle-ments
Settlements Subject to
Intensity of 5.0
Settlements Subject to
Intensity of 5.5
Settlements Subject to
Intensity of 6
Settlements Subject to
Intensity of 6.5
Settlements Subject to
Intensity of 7
Settlements Subject to
Intensity of 7.5
Settlements Subject to
Intensity of 8
0- 50.000 677 43 142 160 154 108 32 38 50.000 - 490.000 124 13 21 24 35 22 4 5
Metropolitan provinces 107 0 2 5 22 19 43 16
Total 908 56 165 189 211 149 79 59 Total % 100 6 18 21 23 17 9 6
0
20
40
60
80
100
120
140
160
180
4,5 5,0 5,5 6,0 6,5 7,0 7,5 8,0 8,5
Seismic Intensity
Nu
mb
er
of
Se
ttle
me
nts
0- 50.000
50.000 -
490.000
Metropolitan
provinces
Figure 3.16 The Distribution of Province and Sub-Province Centers with
Reference to all Seismic Intensity Levels According to Number of Settlements
Distribution of settlement categories indicates significant variation with reference
to intensity of seismic hazard. Almost half of the smaller settlements prove take
place at the lowest end of the seismic scale under consideration. This is reversed
in the case of metropolitan centers as it can be seen in Table 3.4. This trend is
observed to repeat itself with even greater shares in terms of population.
58
3. Identification of Categories of Building Types in Each Settlement
Following the categorization of the building stock provided in Demircioğlu et al.
(2010), four distinct groups of buildings have been identified. Load-bearing
buildings, reinforced concrete structures of low-rise, medium-rise, and high-rise
building categories are available in terms of number of buildings in each
settlement.
Information concerning building stock properties in each settlement is obtained
from Building Census-2000 produced by Turkish Statistical Institute. The
publication however of this source of information was not aggregated at the
settlement level. A special disaggregated version of the building census 2000 at
the level of settlements was accessed for this research.
Data available for the building stock in the TurkStat statistics at settlement level
provide information on number of buildings in each group separate from number
of storey. These statistics provide information on the structural properties of
buildings in Table 5 and the distribution of the number of storeys in Table 8 for
the same building stock in every municipality.
These two tables were integrated on the basis that almost all buildings of 4+
storey‘s were frame structures, residual numbers of frame structures were
attributed to lower storey buildings, and compositions of wall-bearing and frame
structures established for each municipality corresponding to province and sub-
province centers.
A re-aggregation based on number of storeys was necessary for an adjustment
for the use of the vulnerability curves of buildings. The number of storey
grouping has been organized so that 1-3 storey reinforced concrete buildings
and load-bearing buildings have been combined. The mid-rise group was
determined as 4-9 storey buildings. The 10+ storey buildings were identified as
the high-rise group of buildings.
The distribution of building stock attributes for all settlements according to
construction type and number of storeys is given in the Appendix A.
In this minor re-appointment procedure of building categories special
consideration was given to remain on the safer side, avoiding the likelihood of
under-estimations of building vulnerabilities. The redistribution of the building
stock thus maintained the compatibility with the definitions of the building
vulnerability/fragility curves developed for Turkey (Balamir, 2011).
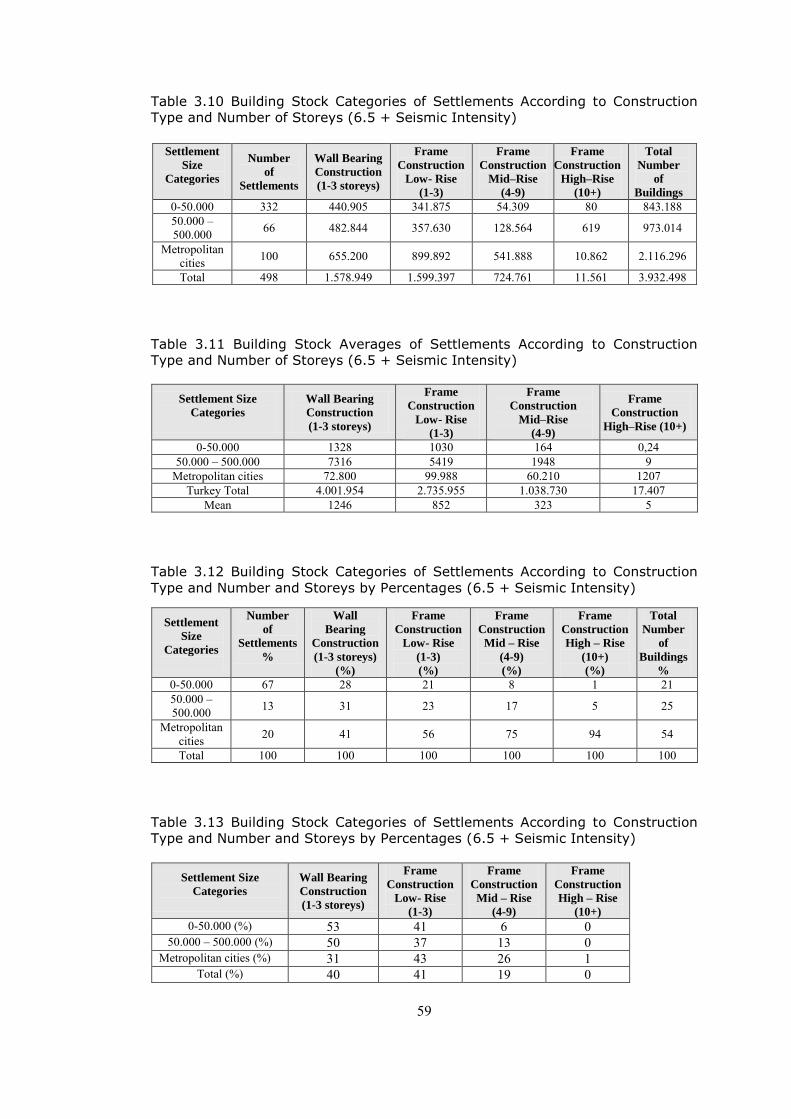
59
Table 3.10 Building Stock Categories of Settlements According to Construction
Type and Number of Storeys (6.5 + Seismic Intensity)
Settlement
Size
Categories
Number
of
Settlements
Wall Bearing
Construction
(1-3 storeys)
Frame
Construction
Low- Rise
(1-3)
Frame
Construction
Mid–Rise
(4-9)
Frame
Construction
High–Rise
(10+)
Total
Number
of
Buildings
0-50.000 332 440.905 341.875 54.309 80 843.188 50.000 – 500.000 66 482.844 357.630 128.564 619 973.014
Metropolitan cities 100 655.200 899.892 541.888 10.862 2.116.296
Total 498 1.578.949 1.599.397 724.761 11.561 3.932.498 Table 3.11 Building Stock Averages of Settlements According to Construction
Type and Number of Storeys (6.5 + Seismic Intensity)
Settlement Size
Categories
Wall Bearing
Construction
(1-3 storeys)
Frame
Construction
Low- Rise
(1-3)
Frame
Construction
Mid–Rise
(4-9)
Frame
Construction
High–Rise (10+)
0-50.000 1328 1030 164 0,24 50.000 – 500.000 7316 5419 1948 9
Metropolitan cities 72.800 99.988 60.210 1207 Turkey Total 4.001.954 2.735.955 1.038.730 17.407
Mean 1246 852 323 5
Table 3.12 Building Stock Categories of Settlements According to Construction
Type and Number and Storeys by Percentages (6.5 + Seismic Intensity)
Settlement
Size
Categories
Number
of
Settlements
%
Wall
Bearing
Construction
(1-3 storeys)
(%)
Frame
Construction
Low- Rise
(1-3)
(%)
Frame
Construction
Mid – Rise
(4-9)
(%)
Frame
Construction
High – Rise
(10+)
(%)
Total
Number
of
Buildings
%
0-50.000 67 28 21 8 1 21 50.000 – 500.000 13 31 23 17 5 25
Metropolitan cities 20 41 56 75 94 54
Total 100 100 100 100 100 100 Table 3.13 Building Stock Categories of Settlements According to Construction
Type and Number and Storeys by Percentages (6.5 + Seismic Intensity)
Settlement Size
Categories
Wall Bearing
Construction
(1-3 storeys)
Frame
Construction
Low- Rise
(1-3)
Frame
Construction
Mid – Rise
(4-9)
Frame
Construction
High – Rise
(10+)
0-50.000 (%) 53 41 6 0 50.000 – 500.000 (%) 50 37 13 0
Metropolitan cities (%) 31 43 26 1 Total (%) 40 41 19 0
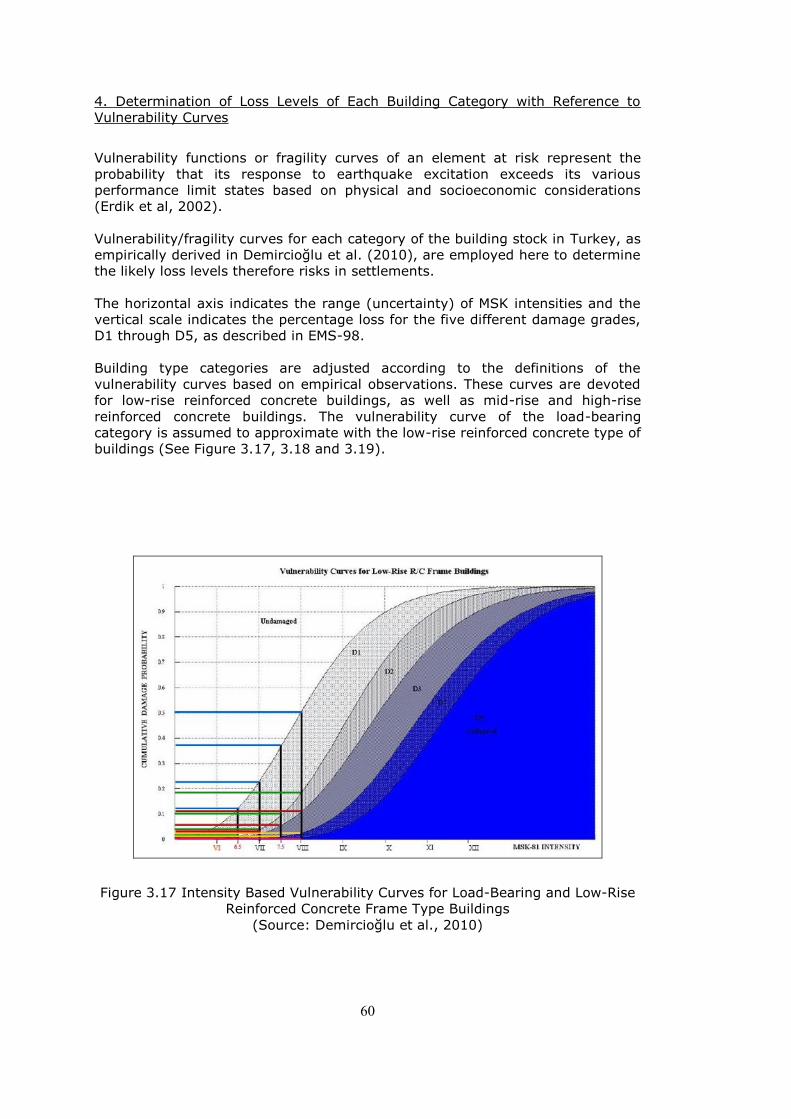
60
4. Determination of Loss Levels of Each Building Category with Reference to
Vulnerability Curves
Vulnerability functions or fragility curves of an element at risk represent the
probability that its response to earthquake excitation exceeds its various
performance limit states based on physical and socioeconomic considerations
(Erdik et al, 2002).
Vulnerability/fragility curves for each category of the building stock in Turkey, as
empirically derived in Demircioğlu et al. (2010), are employed here to determine
the likely loss levels therefore risks in settlements.
The horizontal axis indicates the range (uncertainty) of MSK intensities and the
vertical scale indicates the percentage loss for the five different damage grades,
D1 through D5, as described in EMS-98.
Building type categories are adjusted according to the definitions of the
vulnerability curves based on empirical observations. These curves are devoted
for low-rise reinforced concrete buildings, as well as mid-rise and high-rise
reinforced concrete buildings. The vulnerability curve of the load-bearing
category is assumed to approximate with the low-rise reinforced concrete type of
buildings (See Figure 3.17, 3.18 and 3.19).
Figure 3.17 Intensity Based Vulnerability Curves for Load-Bearing and Low-Rise
Reinforced Concrete Frame Type Buildings
(Source: Demircioğlu et al., 2010)
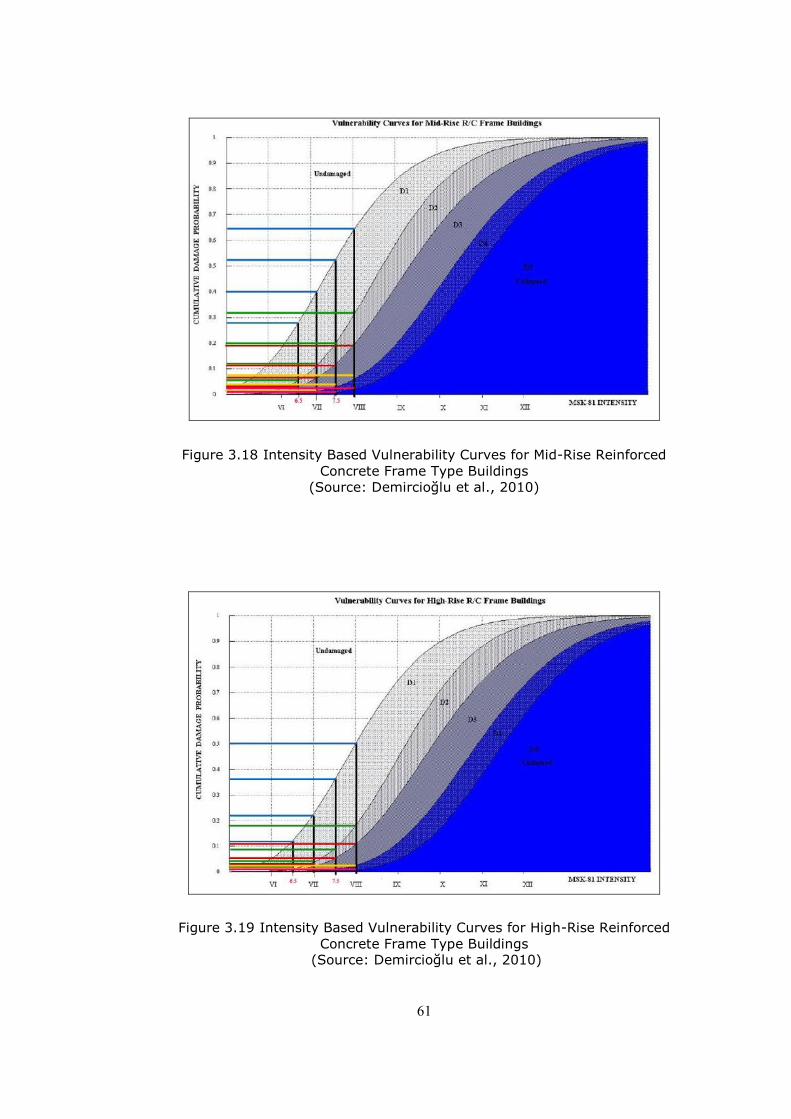
61
Figure 3.18 Intensity Based Vulnerability Curves for Mid-Rise Reinforced
Concrete Frame Type Buildings
(Source: Demircioğlu et al., 2010)
Figure 3.19 Intensity Based Vulnerability Curves for High-Rise Reinforced
Concrete Frame Type Buildings (Source: Demircioğlu et al., 2010)
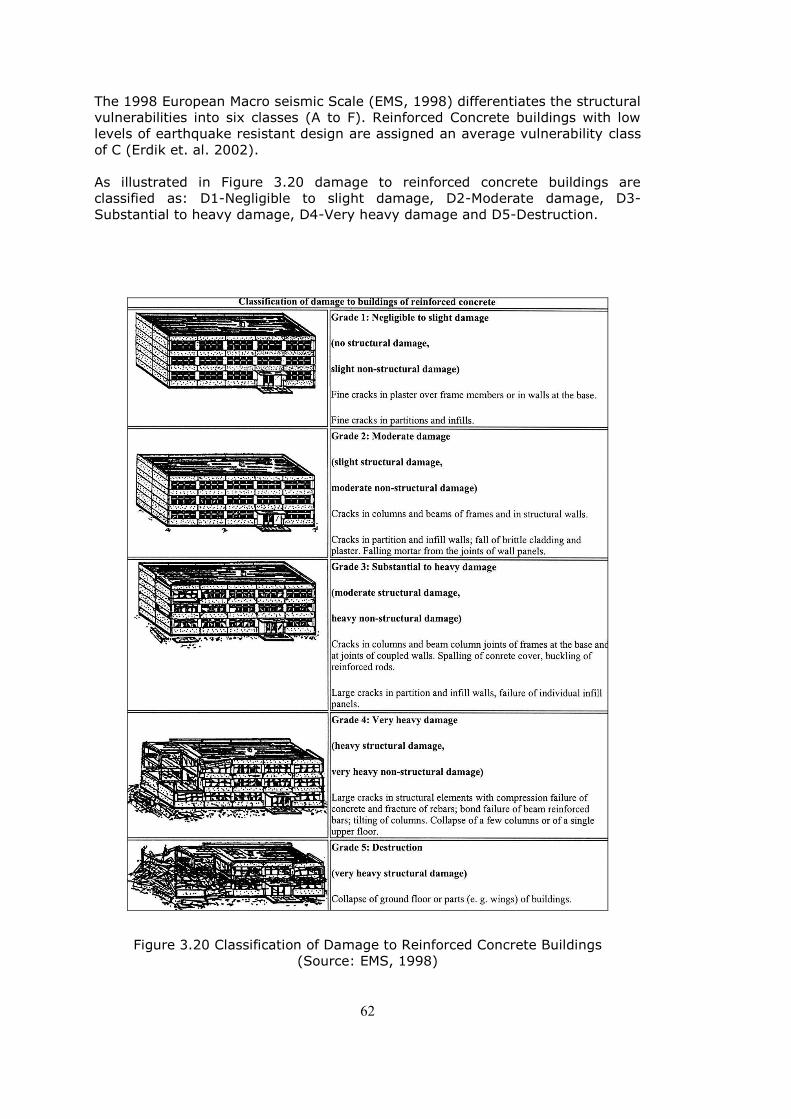
62
The 1998 European Macro seismic Scale (EMS, 1998) differentiates the structural
vulnerabilities into six classes (A to F). Reinforced Concrete buildings with low
levels of earthquake resistant design are assigned an average vulnerability class
of C (Erdik et. al. 2002).
As illustrated in Figure 3.20 damage to reinforced concrete buildings are
classified as: D1-Negligible to slight damage, D2-Moderate damage, D3-
Substantial to heavy damage, D4-Very heavy damage and D5-Destruction.
Figure 3.20 Classification of Damage to Reinforced Concrete Buildings
(Source: EMS, 1998)
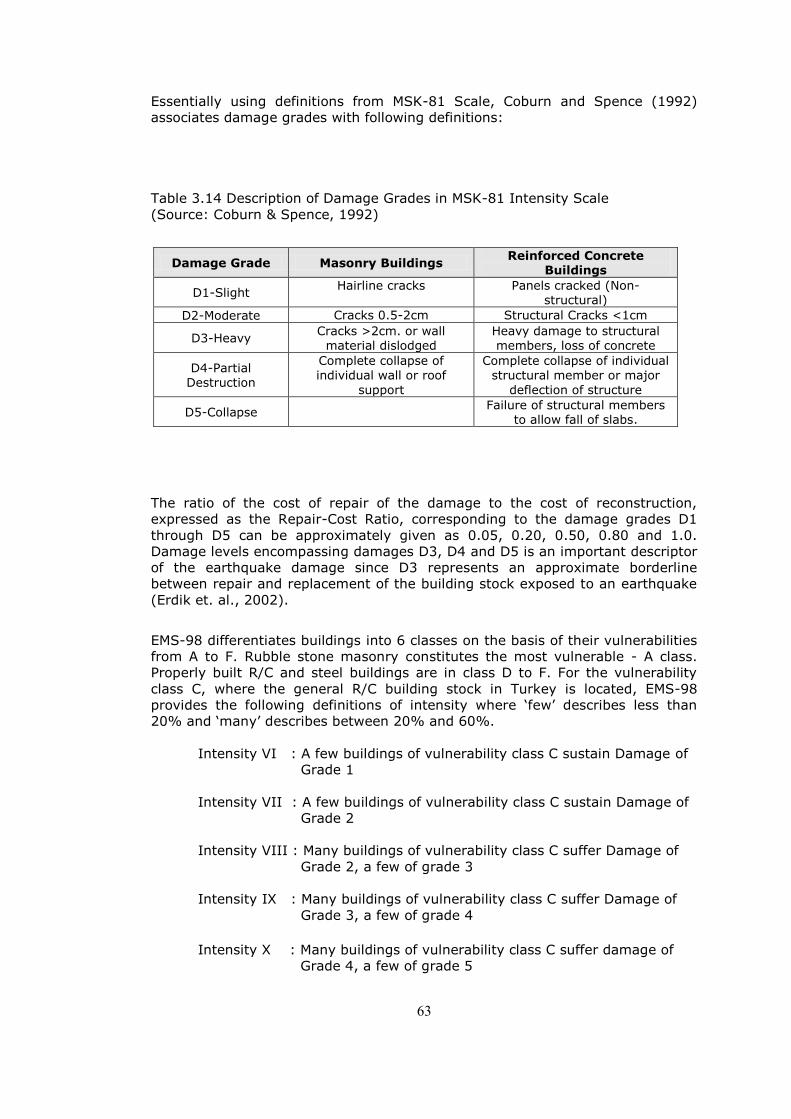
63
Essentially using definitions from MSK-81 Scale, Coburn and Spence (1992)
associates damage grades with following definitions:
Table 3.14 Description of Damage Grades in MSK-81 Intensity Scale
(Source: Coburn & Spence, 1992)
Damage Grade Masonry Buildings Reinforced Concrete
Buildings
D1-Slight Hairline cracks Panels cracked (Non-
structural)
D2-Moderate Cracks 0.5-2cm Structural Cracks <1cm
D3-Heavy Cracks >2cm. or wall
material dislodged Heavy damage to structural members, loss of concrete
D4-Partial
Destruction
Complete collapse of
individual wall or roof
support
Complete collapse of individual
structural member or major
deflection of structure
D5-Collapse Failure of structural members
to allow fall of slabs.
The ratio of the cost of repair of the damage to the cost of reconstruction,
expressed as the Repair-Cost Ratio, corresponding to the damage grades D1
through D5 can be approximately given as 0.05, 0.20, 0.50, 0.80 and 1.0.
Damage levels encompassing damages D3, D4 and D5 is an important descriptor
of the earthquake damage since D3 represents an approximate borderline
between repair and replacement of the building stock exposed to an earthquake
(Erdik et. al., 2002).
EMS-98 differentiates buildings into 6 classes on the basis of their vulnerabilities
from A to F. Rubble stone masonry constitutes the most vulnerable - A class.
Properly built R/C and steel buildings are in class D to F. For the vulnerability
class C, where the general R/C building stock in Turkey is located, EMS-98
provides the following definitions of intensity where ‗few‘ describes less than
20% and ‗many‘ describes between 20% and 60%.
Intensity VI : A few buildings of vulnerability class C sustain Damage of
Grade 1
Intensity VII : A few buildings of vulnerability class C sustain Damage of
Grade 2
Intensity VIII : Many buildings of vulnerability class C suffer Damage of
Grade 2, a few of grade 3
Intensity IX : Many buildings of vulnerability class C suffer Damage of
Grade 3, a few of grade 4
Intensity X : Many buildings of vulnerability class C suffer damage of
Grade 4, a few of grade 5
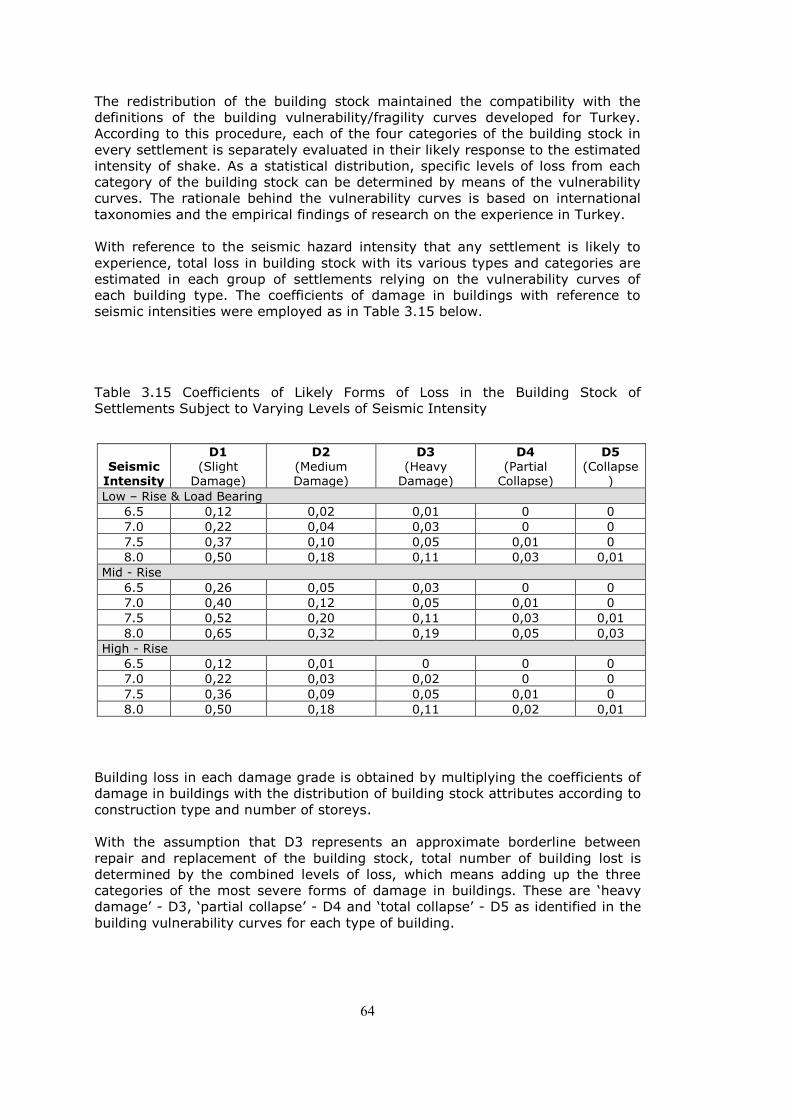
64
The redistribution of the building stock maintained the compatibility with the
definitions of the building vulnerability/fragility curves developed for Turkey.
According to this procedure, each of the four categories of the building stock in
every settlement is separately evaluated in their likely response to the estimated
intensity of shake. As a statistical distribution, specific levels of loss from each
category of the building stock can be determined by means of the vulnerability
curves. The rationale behind the vulnerability curves is based on international
taxonomies and the empirical findings of research on the experience in Turkey.
With reference to the seismic hazard intensity that any settlement is likely to
experience, total loss in building stock with its various types and categories are
estimated in each group of settlements relying on the vulnerability curves of
each building type. The coefficients of damage in buildings with reference to
seismic intensities were employed as in Table 3.15 below.
Table 3.15 Coefficients of Likely Forms of Loss in the Building Stock of
Settlements Subject to Varying Levels of Seismic Intensity
Seismic Intensity
D1 (Slight
Damage)
D2 (Medium Damage)
D3 (Heavy
Damage)
D4 (Partial
Collapse)
D5 (Collapse
)
Low – Rise & Load Bearing
6.5 0,12 0,02 0,01 0 0
7.0 0,22 0,04 0,03 0 0
7.5 0,37 0,10 0,05 0,01 0
8.0 0,50 0,18 0,11 0,03 0,01
Mid - Rise
6.5 0,26 0,05 0,03 0 0
7.0 0,40 0,12 0,05 0,01 0
7.5 0,52 0,20 0,11 0,03 0,01
8.0 0,65 0,32 0,19 0,05 0,03
High - Rise
6.5 0,12 0,01 0 0 0
7.0 0,22 0,03 0,02 0 0
7.5 0,36 0,09 0,05 0,01 0
8.0 0,50 0,18 0,11 0,02 0,01
Building loss in each damage grade is obtained by multiplying the coefficients of
damage in buildings with the distribution of building stock attributes according to
construction type and number of storeys.
With the assumption that D3 represents an approximate borderline between
repair and replacement of the building stock, total number of building lost is
determined by the combined levels of loss, which means adding up the three
categories of the most severe forms of damage in buildings. These are ‗heavy
damage‘ - D3, ‗partial collapse‘ - D4 and ‗total collapse‘ - D5 as identified in the
building vulnerability curves for each type of building.

65
Loss in each category of building types in each settlement is determined in
absolute terms (total number of building loss) and relative terms (ratio of loss to
the total building stock/ loss rate) with reference to the table above.
Total number of building loss = D3 + D4 + D5 Absolute Loss
Loss Rate = (D3 + D4 + D5) / Total Building Stock Relative Loss
The distribution of the total loss in building stock according to building types with
reference to vulnerability curves in each settlement is given in the Appendix B.
It is then possible to have priority lists in each category of settlement-size in
absolute and relative terms. Determination of loss could be interpreted by either
of these criteria of absolute and relative loss. Even though these ratios may
somewhat represent approximations, this may not represent a severe distortion
in the estimations of loss in relative terms in the prioritization exercise carried
out here.
3.2.2. Building Loss Estimates as a Function of Likely Seismicity and
Building Categories
5. Ordering of Settlements in Each Category According to Total Absolute Loss
and Relative Loss
Following above described procedure; loss in each settlement is determined,
identification of most vulnerable settlements in each size-category and ‗provinces
with high-risk‘ are accomplished. This level of loss can be expressed in absolute
terms (total number of buildings lost) or in relative terms (ratio of loss to the
total building stock).
Although absolute loss may represent a concrete measure of loss, relative loss in
settlements must also be taken into account. Small settlements with low values
of absolute loss, but with high ratios may indicate greater impact and
disturbance of hazard in urban life, than loss of similar or higher magnitude but
smaller ratios in the larger cities or metropolitan agglomerations (Balamir,
2011).
Therefore the level of loss is expressed both in absolute terms (total number of
buildings lost) and in relative terms (ratio of loss to the total building stock).
Total Lists of Categories of Settlements Prioritized According to Absolute Loss is
given in the Appendix C and Total Lists of Categories of Settlements Prioritized
According to Relative Loss is given in the Appendix D.
The top-20 settlements of the complete lists in each size category according to
absolute loss levels and relative loss levels are examined below.
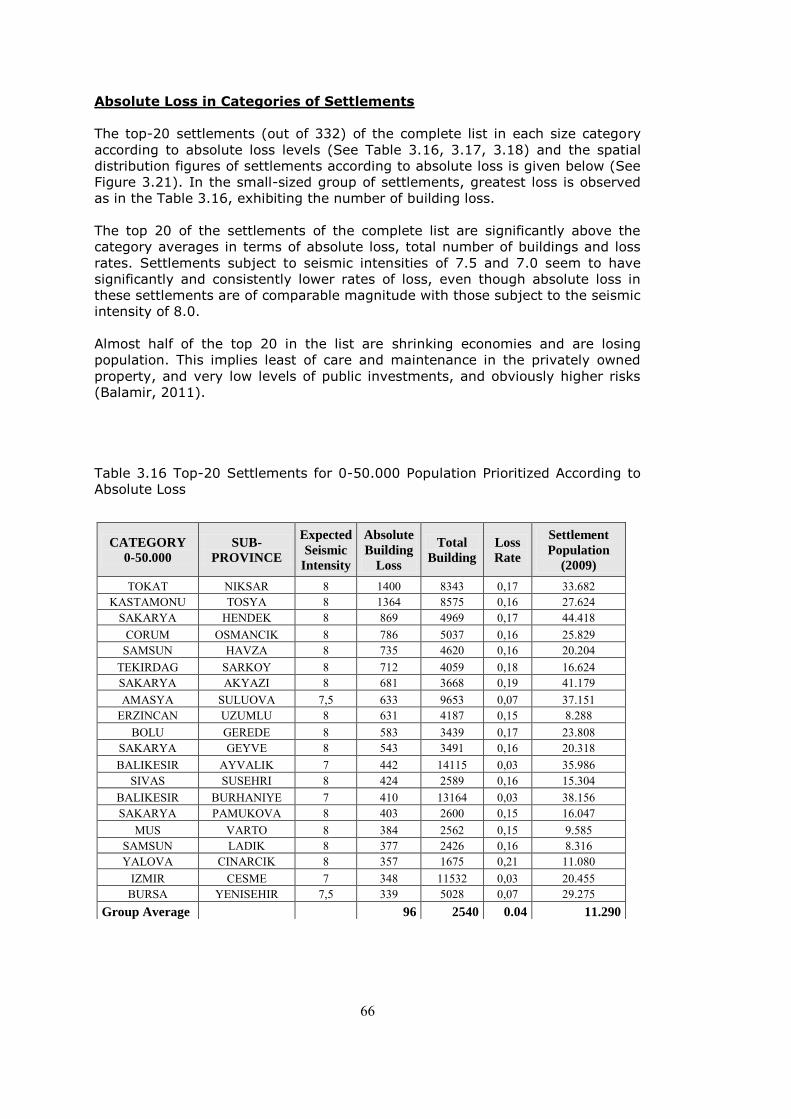
66
Absolute Loss in Categories of Settlements
The top-20 settlements (out of 332) of the complete list in each size category
according to absolute loss levels (See Table 3.16, 3.17, 3.18) and the spatial
distribution figures of settlements according to absolute loss is given below (See
Figure 3.21). In the small-sized group of settlements, greatest loss is observed
as in the Table 3.16, exhibiting the number of building loss.
The top 20 of the settlements of the complete list are significantly above the
category averages in terms of absolute loss, total number of buildings and loss
rates. Settlements subject to seismic intensities of 7.5 and 7.0 seem to have
significantly and consistently lower rates of loss, even though absolute loss in
these settlements are of comparable magnitude with those subject to the seismic
intensity of 8.0.
Almost half of the top 20 in the list are shrinking economies and are losing
population. This implies least of care and maintenance in the privately owned
property, and very low levels of public investments, and obviously higher risks
(Balamir, 2011).
Table 3.16 Top-20 Settlements for 0-50.000 Population Prioritized According to
Absolute Loss
CATEGORY
0-50.000
SUB-
PROVINCE
Expected
Seismic
Intensity
Absolute
Building
Loss
Total
Building
Loss
Rate
Settlement
Population
(2009)
TOKAT NIKSAR 8 1400 8343 0,17 33.682 KASTAMONU TOSYA 8 1364 8575 0,16 27.624
SAKARYA HENDEK 8 869 4969 0,17 44.418 CORUM OSMANCIK 8 786 5037 0,16 25.829
SAMSUN HAVZA 8 735 4620 0,16 20.204 TEKIRDAG SARKOY 8 712 4059 0,18 16.624 SAKARYA AKYAZI 8 681 3668 0,19 41.179 AMASYA SULUOVA 7,5 633 9653 0,07 37.151
ERZINCAN UZUMLU 8 631 4187 0,15 8.288 BOLU GEREDE 8 583 3439 0,17 23.808
SAKARYA GEYVE 8 543 3491 0,16 20.318 BALIKESIR AYVALIK 7 442 14115 0,03 35.986
SIVAS SUSEHRI 8 424 2589 0,16 15.304 BALIKESIR BURHANIYE 7 410 13164 0,03 38.156 SAKARYA PAMUKOVA 8 403 2600 0,15 16.047
MUS VARTO 8 384 2562 0,15 9.585 SAMSUN LADIK 8 377 2426 0,16 8.316 YALOVA CINARCIK 8 357 1675 0,21 11.080
IZMIR CESME 7 348 11532 0,03 20.455 BURSA YENISEHIR 7,5 339 5028 0,07 29.275
Group Average 96 2540 0.04 11.290
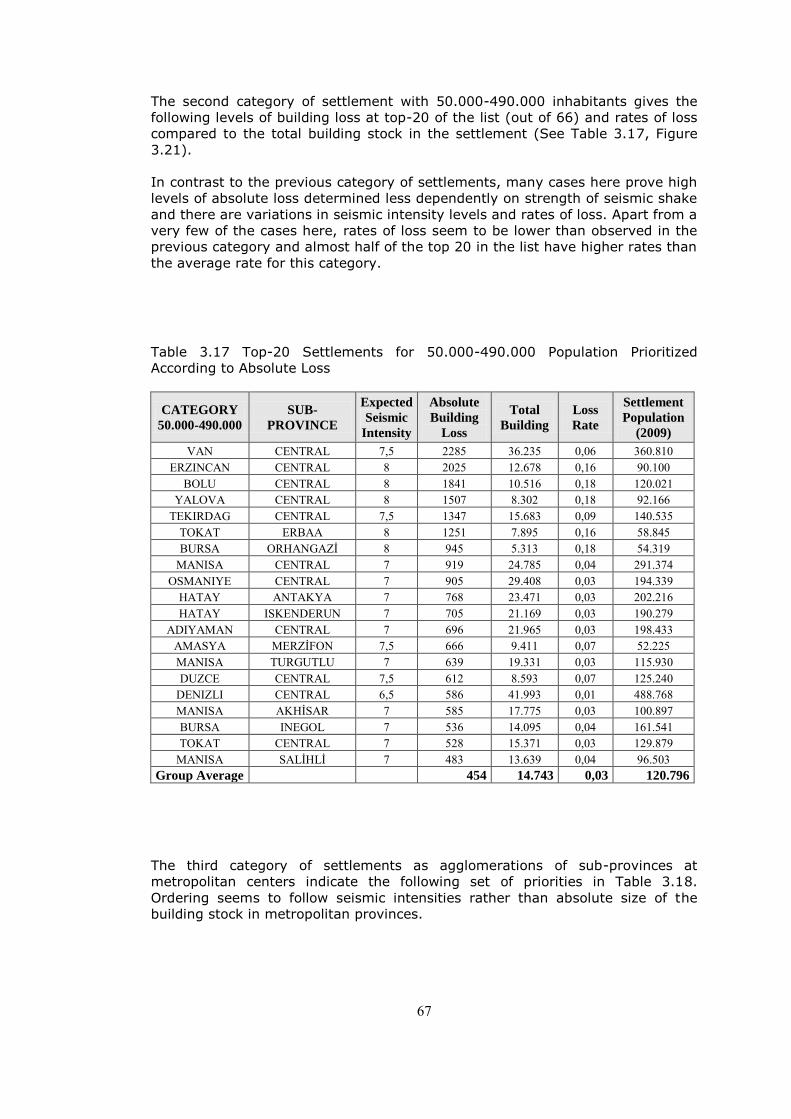
67
The second category of settlement with 50.000-490.000 inhabitants gives the
following levels of building loss at top-20 of the list (out of 66) and rates of loss
compared to the total building stock in the settlement (See Table 3.17, Figure
3.21).
In contrast to the previous category of settlements, many cases here prove high
levels of absolute loss determined less dependently on strength of seismic shake
and there are variations in seismic intensity levels and rates of loss. Apart from a
very few of the cases here, rates of loss seem to be lower than observed in the
previous category and almost half of the top 20 in the list have higher rates than
the average rate for this category.
Table 3.17 Top-20 Settlements for 50.000-490.000 Population Prioritized
According to Absolute Loss
CATEGORY
50.000-490.000
SUB-
PROVINCE
Expected
Seismic
Intensity
Absolute
Building
Loss
Total
Building
Loss
Rate
Settlement
Population
(2009)
VAN CENTRAL 7,5 2285 36.235 0,06 360.810 ERZINCAN CENTRAL 8 2025 12.678 0,16 90.100
BOLU CENTRAL 8 1841 10.516 0,18 120.021 YALOVA CENTRAL 8 1507 8.302 0,18 92.166
TEKIRDAG CENTRAL 7,5 1347 15.683 0,09 140.535 TOKAT ERBAA 8 1251 7.895 0,16 58.845 BURSA ORHANGAZİ 8 945 5.313 0,18 54.319
MANISA CENTRAL 7 919 24.785 0,04 291.374 OSMANIYE CENTRAL 7 905 29.408 0,03 194.339
HATAY ANTAKYA 7 768 23.471 0,03 202.216 HATAY ISKENDERUN 7 705 21.169 0,03 190.279
ADIYAMAN CENTRAL 7 696 21.965 0,03 198.433 AMASYA MERZİFON 7,5 666 9.411 0,07 52.225 MANISA TURGUTLU 7 639 19.331 0,03 115.930 DUZCE CENTRAL 7,5 612 8.593 0,07 125.240
DENIZLI CENTRAL 6,5 586 41.993 0,01 488.768 MANISA AKHİSAR 7 585 17.775 0,03 100.897 BURSA INEGOL 7 536 14.095 0,04 161.541 TOKAT CENTRAL 7 528 15.371 0,03 129.879
MANISA SALİHLİ 7 483 13.639 0,04 96.503 Group Average 454 14.743 0,03 120.796
The third category of settlements as agglomerations of sub-provinces at
metropolitan centers indicate the following set of priorities in Table 3.18.
Ordering seems to follow seismic intensities rather than absolute size of the
building stock in metropolitan provinces.
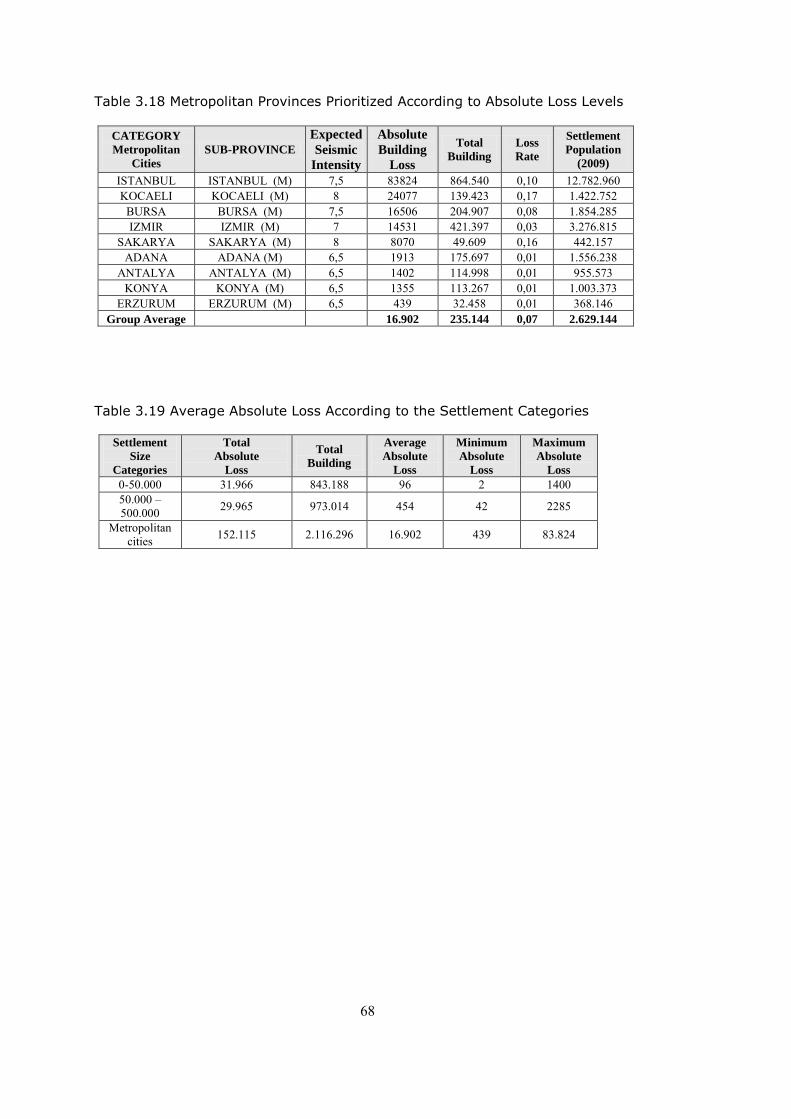
68
Table 3.18 Metropolitan Provinces Prioritized According to Absolute Loss Levels
CATEGORY
Metropolitan
Cities
SUB-PROVINCE
Expected
Seismic
Intensity
Absolute
Building
Loss
Total
Building
Loss
Rate
Settlement
Population
(2009)
ISTANBUL ISTANBUL (M) 7,5 83824 864.540 0,10 12.782.960 KOCAELI KOCAELI (M) 8 24077 139.423 0,17 1.422.752
BURSA BURSA (M) 7,5 16506 204.907 0,08 1.854.285 IZMIR IZMIR (M) 7 14531 421.397 0,03 3.276.815
SAKARYA SAKARYA (M) 8 8070 49.609 0,16 442.157 ADANA ADANA (M) 6,5 1913 175.697 0,01 1.556.238
ANTALYA ANTALYA (M) 6,5 1402 114.998 0,01 955.573 KONYA KONYA (M) 6,5 1355 113.267 0,01 1.003.373
ERZURUM ERZURUM (M) 6,5 439 32.458 0,01 368.146 Group Average 16.902 235.144 0,07 2.629.144
Table 3.19 Average Absolute Loss According to the Settlement Categories
Settlement
Size
Categories
Total
Absolute
Loss
Total
Building
Average
Absolute
Loss
Minimum
Absolute
Loss
Maximum
Absolute
Loss
0-50.000 31.966 843.188 96 2 1400 50.000 – 500.000 29.965 973.014 454 42 2285
Metropolitan cities 152.115 2.116.296 16.902 439 83.824

69
Figure 3.21 Absolute Building Loss Distributions
Fig
ure
3.2
1 A
bsolu
te B
uildin
g L
oss D
istr
ibutions
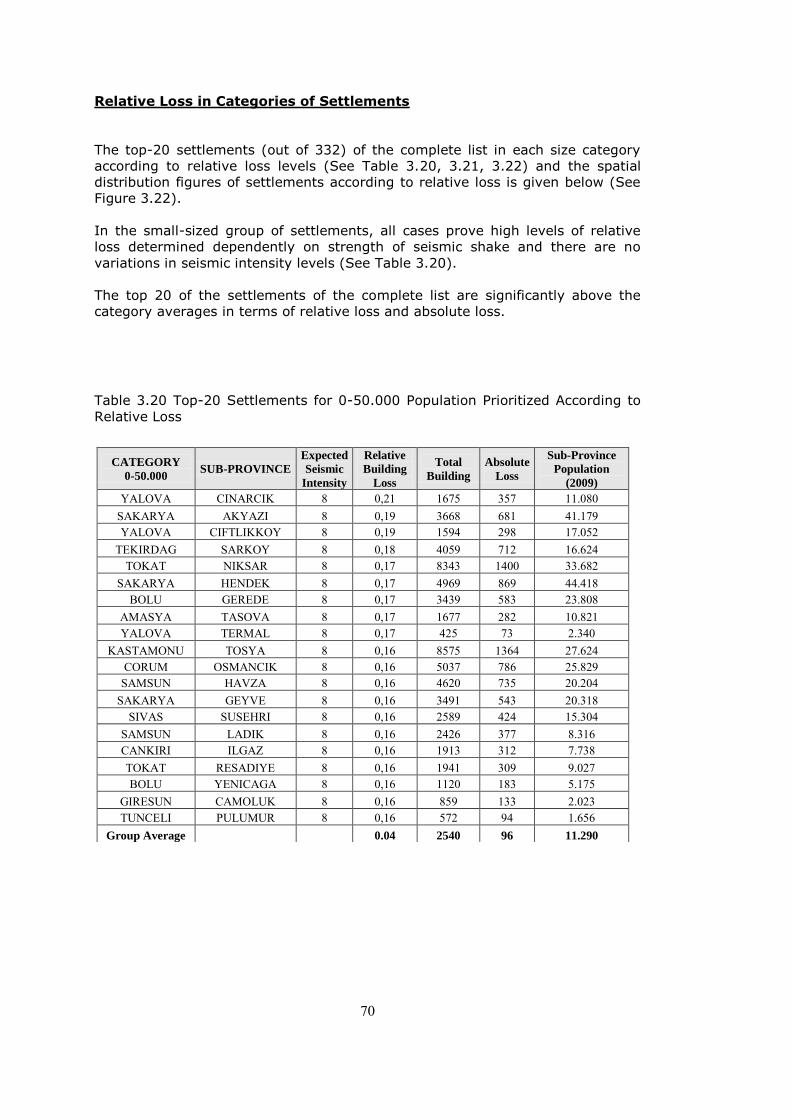
70
Relative Loss in Categories of Settlements
The top-20 settlements (out of 332) of the complete list in each size category
according to relative loss levels (See Table 3.20, 3.21, 3.22) and the spatial
distribution figures of settlements according to relative loss is given below (See
Figure 3.22).
In the small-sized group of settlements, all cases prove high levels of relative
loss determined dependently on strength of seismic shake and there are no
variations in seismic intensity levels (See Table 3.20).
The top 20 of the settlements of the complete list are significantly above the
category averages in terms of relative loss and absolute loss.
Table 3.20 Top-20 Settlements for 0-50.000 Population Prioritized According to
Relative Loss
CATEGORY
0-50.000 SUB-PROVINCE
Expected
Seismic
Intensity
Relative
Building
Loss
Total
Building
Absolute
Loss
Sub-Province
Population
(2009)
YALOVA CINARCIK 8 0,21 1675 357 11.080 SAKARYA AKYAZI 8 0,19 3668 681 41.179 YALOVA CIFTLIKKOY 8 0,19 1594 298 17.052
TEKIRDAG SARKOY 8 0,18 4059 712 16.624 TOKAT NIKSAR 8 0,17 8343 1400 33.682
SAKARYA HENDEK 8 0,17 4969 869 44.418 BOLU GEREDE 8 0,17 3439 583 23.808
AMASYA TASOVA 8 0,17 1677 282 10.821 YALOVA TERMAL 8 0,17 425 73 2.340
KASTAMONU TOSYA 8 0,16 8575 1364 27.624 CORUM OSMANCIK 8 0,16 5037 786 25.829
SAMSUN HAVZA 8 0,16 4620 735 20.204 SAKARYA GEYVE 8 0,16 3491 543 20.318
SIVAS SUSEHRI 8 0,16 2589 424 15.304 SAMSUN LADIK 8 0,16 2426 377 8.316 CANKIRI ILGAZ 8 0,16 1913 312 7.738 TOKAT RESADIYE 8 0,16 1941 309 9.027 BOLU YENICAGA 8 0,16 1120 183 5.175
GIRESUN CAMOLUK 8 0,16 859 133 2.023 TUNCELI PULUMUR 8 0,16 572 94 1.656
Group Average 0.04 2540 96 11.290
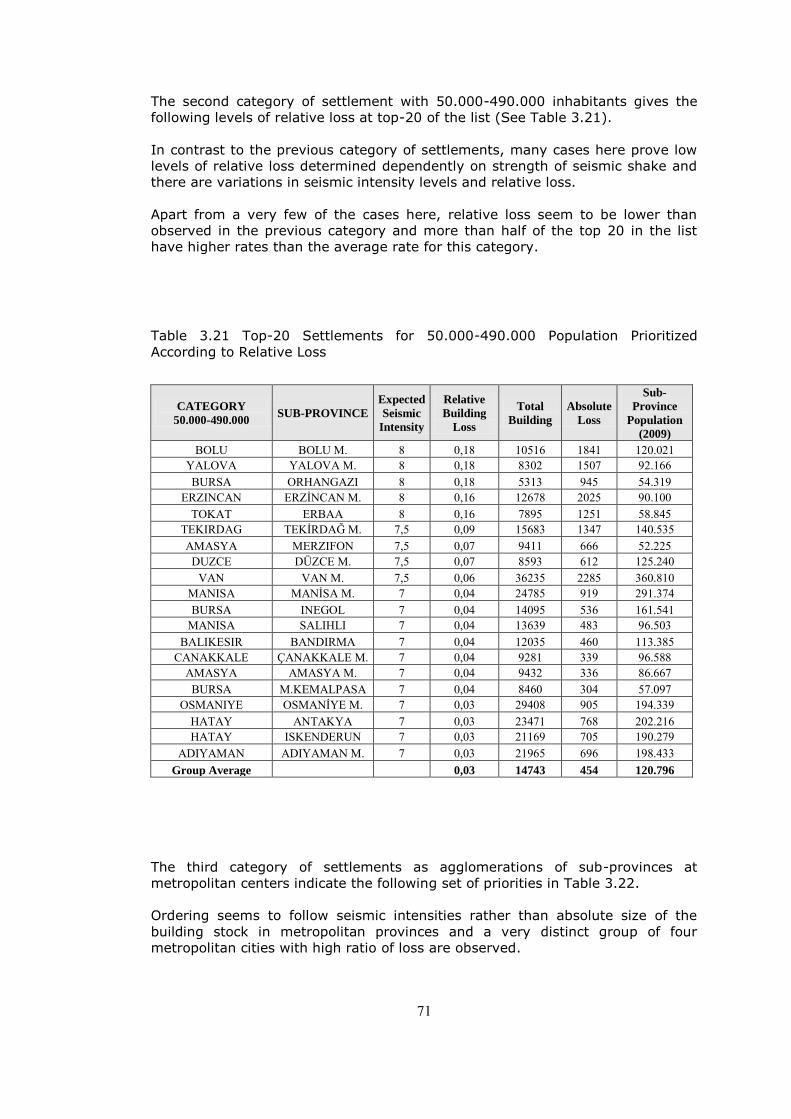
71
The second category of settlement with 50.000-490.000 inhabitants gives the
following levels of relative loss at top-20 of the list (See Table 3.21).
In contrast to the previous category of settlements, many cases here prove low
levels of relative loss determined dependently on strength of seismic shake and
there are variations in seismic intensity levels and relative loss.
Apart from a very few of the cases here, relative loss seem to be lower than
observed in the previous category and more than half of the top 20 in the list
have higher rates than the average rate for this category.
Table 3.21 Top-20 Settlements for 50.000-490.000 Population Prioritized
According to Relative Loss
CATEGORY
50.000-490.000 SUB-PROVINCE
Expected
Seismic
Intensity
Relative
Building
Loss
Total
Building
Absolute
Loss
Sub-
Province
Population
(2009)
BOLU BOLU M. 8 0,18 10516 1841 120.021 YALOVA YALOVA M. 8 0,18 8302 1507 92.166 BURSA ORHANGAZI 8 0,18 5313 945 54.319
ERZINCAN ERZİNCAN M. 8 0,16 12678 2025 90.100 TOKAT ERBAA 8 0,16 7895 1251 58.845
TEKIRDAG TEKİRDAĞ M. 7,5 0,09 15683 1347 140.535 AMASYA MERZIFON 7,5 0,07 9411 666 52.225
DUZCE DÜZCE M. 7,5 0,07 8593 612 125.240 VAN VAN M. 7,5 0,06 36235 2285 360.810
MANISA MANİSA M. 7 0,04 24785 919 291.374 BURSA INEGOL 7 0,04 14095 536 161.541
MANISA SALIHLI 7 0,04 13639 483 96.503 BALIKESIR BANDIRMA 7 0,04 12035 460 113.385
CANAKKALE ÇANAKKALE M. 7 0,04 9281 339 96.588 AMASYA AMASYA M. 7 0,04 9432 336 86.667
BURSA M.KEMALPASA 7 0,04 8460 304 57.097 OSMANIYE OSMANİYE M. 7 0,03 29408 905 194.339
HATAY ANTAKYA 7 0,03 23471 768 202.216 HATAY ISKENDERUN 7 0,03 21169 705 190.279
ADIYAMAN ADIYAMAN M. 7 0,03 21965 696 198.433 Group Average 0,03 14743 454 120.796
The third category of settlements as agglomerations of sub-provinces at
metropolitan centers indicate the following set of priorities in Table 3.22.
Ordering seems to follow seismic intensities rather than absolute size of the
building stock in metropolitan provinces and a very distinct group of four
metropolitan cities with high ratio of loss are observed.
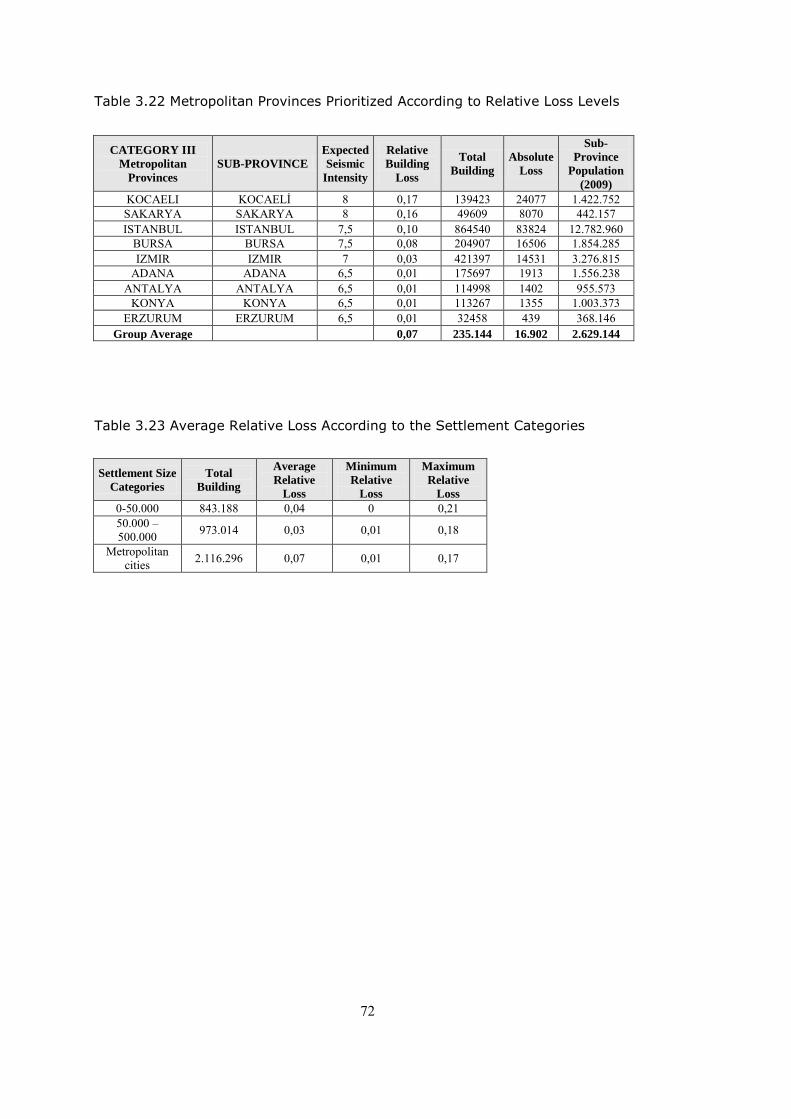
72
Table 3.22 Metropolitan Provinces Prioritized According to Relative Loss Levels
CATEGORY III
Metropolitan
Provinces
SUB-PROVINCE
Expected
Seismic
Intensity
Relative
Building
Loss
Total
Building
Absolute
Loss
Sub-
Province
Population
(2009)
KOCAELI KOCAELİ 8 0,17 139423 24077 1.422.752 SAKARYA SAKARYA 8 0,16 49609 8070 442.157 ISTANBUL ISTANBUL 7,5 0,10 864540 83824 12.782.960
BURSA BURSA 7,5 0,08 204907 16506 1.854.285 IZMIR IZMIR 7 0,03 421397 14531 3.276.815
ADANA ADANA 6,5 0,01 175697 1913 1.556.238 ANTALYA ANTALYA 6,5 0,01 114998 1402 955.573
KONYA KONYA 6,5 0,01 113267 1355 1.003.373 ERZURUM ERZURUM 6,5 0,01 32458 439 368.146
Group Average 0,07 235.144 16.902 2.629.144
Table 3.23 Average Relative Loss According to the Settlement Categories
Settlement Size
Categories
Total
Building
Average
Relative
Loss
Minimum
Relative
Loss
Maximum
Relative
Loss
0-50.000 843.188 0,04 0 0,21 50.000 – 500.000 973.014 0,03 0,01 0,18
Metropolitan cities 2.116.296 0,07 0,01 0,17
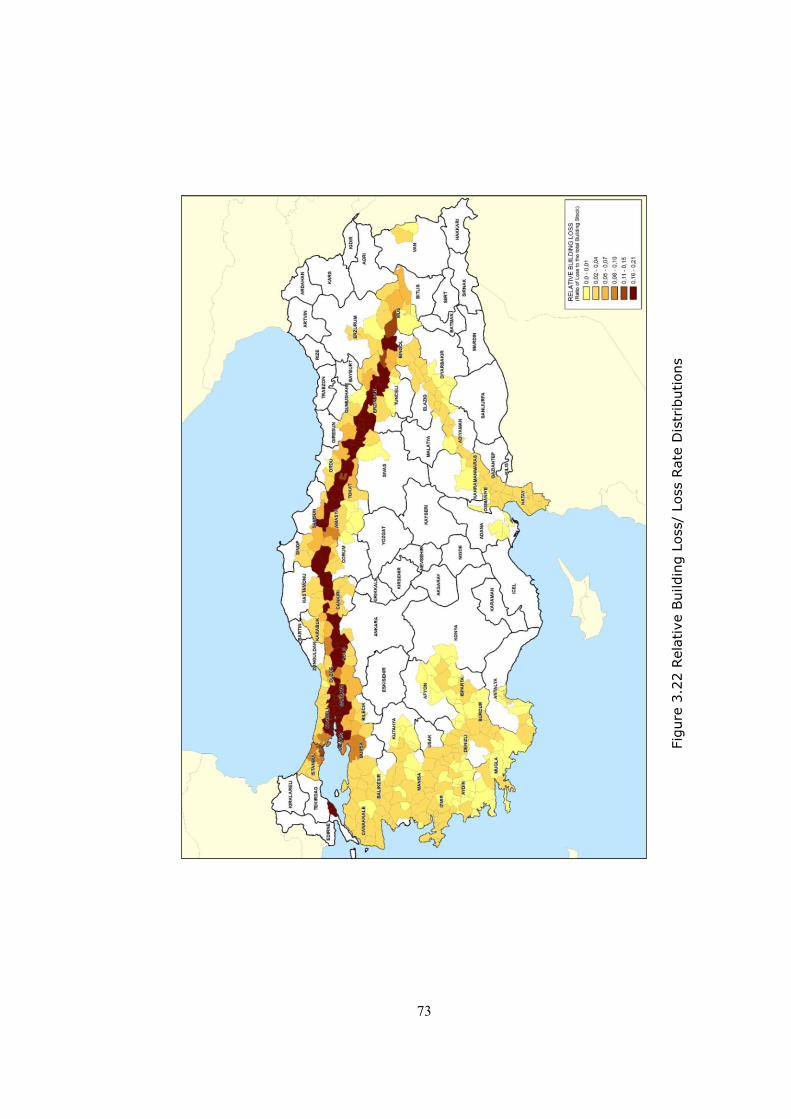
73
Figure 3.22 Relative Building Loss/ Loss Rate Distributions
Fig
ure
3.2
2 R
ela
tive B
uildin
g L
oss/
Loss R
ate
Dis
trib
utions
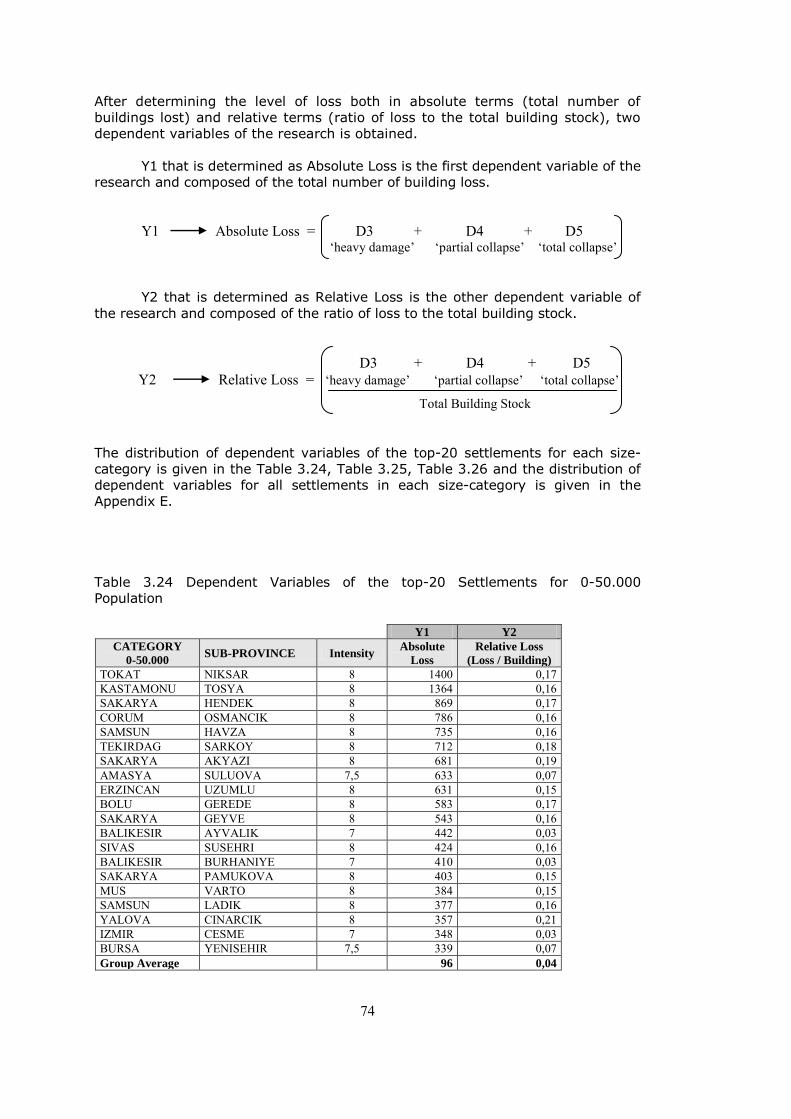
74
After determining the level of loss both in absolute terms (total number of
buildings lost) and relative terms (ratio of loss to the total building stock), two
dependent variables of the research is obtained.
Y1 that is determined as Absolute Loss is the first dependent variable of the
research and composed of the total number of building loss.
Y1 Absolute Loss = D3 + D4 + D5
‘heavy damage’ ‘partial collapse’ ‘total collapse’ Y2 that is determined as Relative Loss is the other dependent variable of
the research and composed of the ratio of loss to the total building stock.
D3 + D4 + D5 Y2 Relative Loss = ‘heavy damage’ ‘partial collapse’ ‘total collapse’
Total Building Stock
The distribution of dependent variables of the top-20 settlements for each size-
category is given in the Table 3.24, Table 3.25, Table 3.26 and the distribution of
dependent variables for all settlements in each size-category is given in the
Appendix E.
Table 3.24 Dependent Variables of the top-20 Settlements for 0-50.000
Population
Y1 Y2
CATEGORY
0-50.000 SUB-PROVINCE Intensity
Absolute
Loss
Relative Loss
(Loss / Building)
TOKAT NIKSAR 8 1400 0,17 KASTAMONU TOSYA 8 1364 0,16 SAKARYA HENDEK 8 869 0,17 CORUM OSMANCIK 8 786 0,16 SAMSUN HAVZA 8 735 0,16 TEKIRDAG SARKOY 8 712 0,18 SAKARYA AKYAZI 8 681 0,19 AMASYA SULUOVA 7,5 633 0,07 ERZINCAN UZUMLU 8 631 0,15 BOLU GEREDE 8 583 0,17 SAKARYA GEYVE 8 543 0,16 BALIKESIR AYVALIK 7 442 0,03 SIVAS SUSEHRI 8 424 0,16 BALIKESIR BURHANIYE 7 410 0,03 SAKARYA PAMUKOVA 8 403 0,15 MUS VARTO 8 384 0,15 SAMSUN LADIK 8 377 0,16 YALOVA CINARCIK 8 357 0,21 IZMIR CESME 7 348 0,03 BURSA YENISEHIR 7,5 339 0,07 Group Average 96 0,04
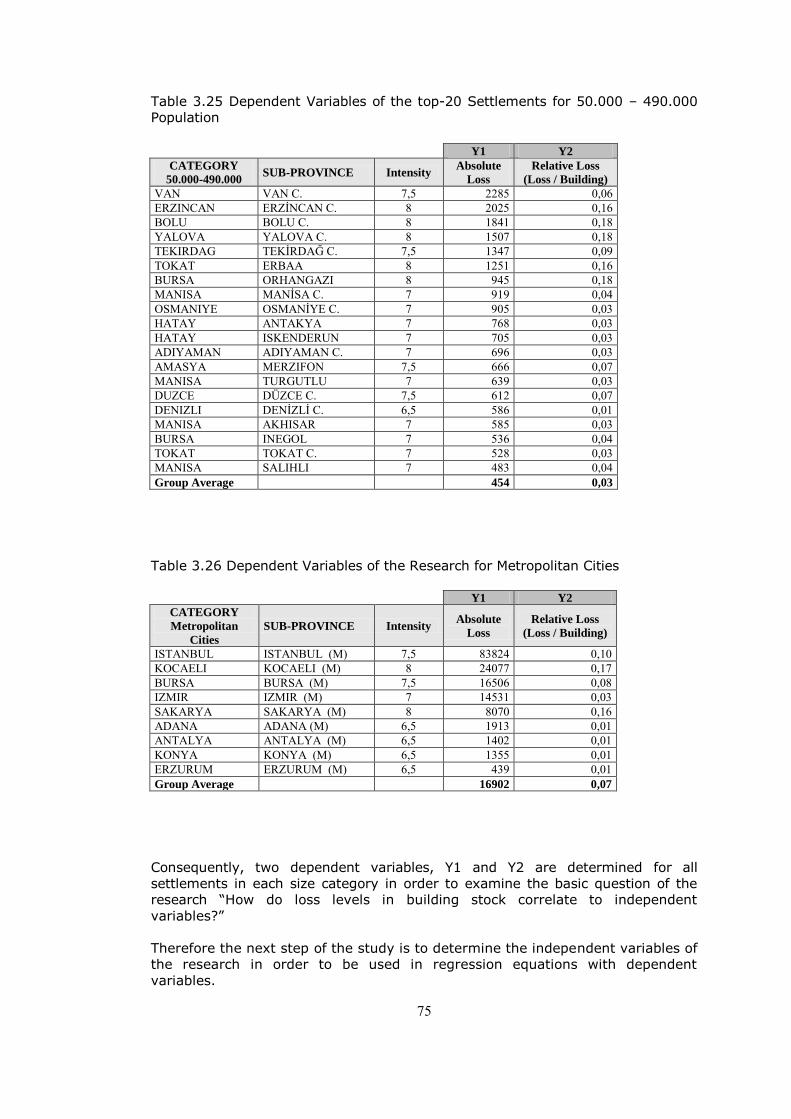
75
Table 3.25 Dependent Variables of the top-20 Settlements for 50.000 – 490.000
Population
Y1 Y2
CATEGORY
50.000-490.000 SUB-PROVINCE Intensity
Absolute
Loss
Relative Loss
(Loss / Building)
VAN VAN C. 7,5 2285 0,06 ERZINCAN ERZİNCAN C. 8 2025 0,16 BOLU BOLU C. 8 1841 0,18 YALOVA YALOVA C. 8 1507 0,18 TEKIRDAG TEKİRDAĞ C. 7,5 1347 0,09 TOKAT ERBAA 8 1251 0,16 BURSA ORHANGAZI 8 945 0,18 MANISA MANİSA C. 7 919 0,04 OSMANIYE OSMANİYE C. 7 905 0,03 HATAY ANTAKYA 7 768 0,03 HATAY ISKENDERUN 7 705 0,03 ADIYAMAN ADIYAMAN C. 7 696 0,03 AMASYA MERZIFON 7,5 666 0,07 MANISA TURGUTLU 7 639 0,03 DUZCE DÜZCE C. 7,5 612 0,07 DENIZLI DENİZLİ C. 6,5 586 0,01 MANISA AKHISAR 7 585 0,03 BURSA INEGOL 7 536 0,04 TOKAT TOKAT C. 7 528 0,03 MANISA SALIHLI 7 483 0,04 Group Average 454 0,03
Table 3.26 Dependent Variables of the Research for Metropolitan Cities
Y1 Y2
CATEGORY
Metropolitan
Cities
SUB-PROVINCE Intensity Absolute
Loss
Relative Loss
(Loss / Building)
ISTANBUL ISTANBUL (M) 7,5 83824 0,10 KOCAELI KOCAELI (M) 8 24077 0,17 BURSA BURSA (M) 7,5 16506 0,08 IZMIR IZMIR (M) 7 14531 0,03 SAKARYA SAKARYA (M) 8 8070 0,16 ADANA ADANA (M) 6,5 1913 0,01 ANTALYA ANTALYA (M) 6,5 1402 0,01 KONYA KONYA (M) 6,5 1355 0,01 ERZURUM ERZURUM (M) 6,5 439 0,01 Group Average 16902 0,07
Consequently, two dependent variables, Y1 and Y2 are determined for all
settlements in each size category in order to examine the basic question of the
research ―How do loss levels in building stock correlate to independent
variables?‖
Therefore the next step of the study is to determine the independent variables of
the research in order to be used in regression equations with dependent
variables.

76
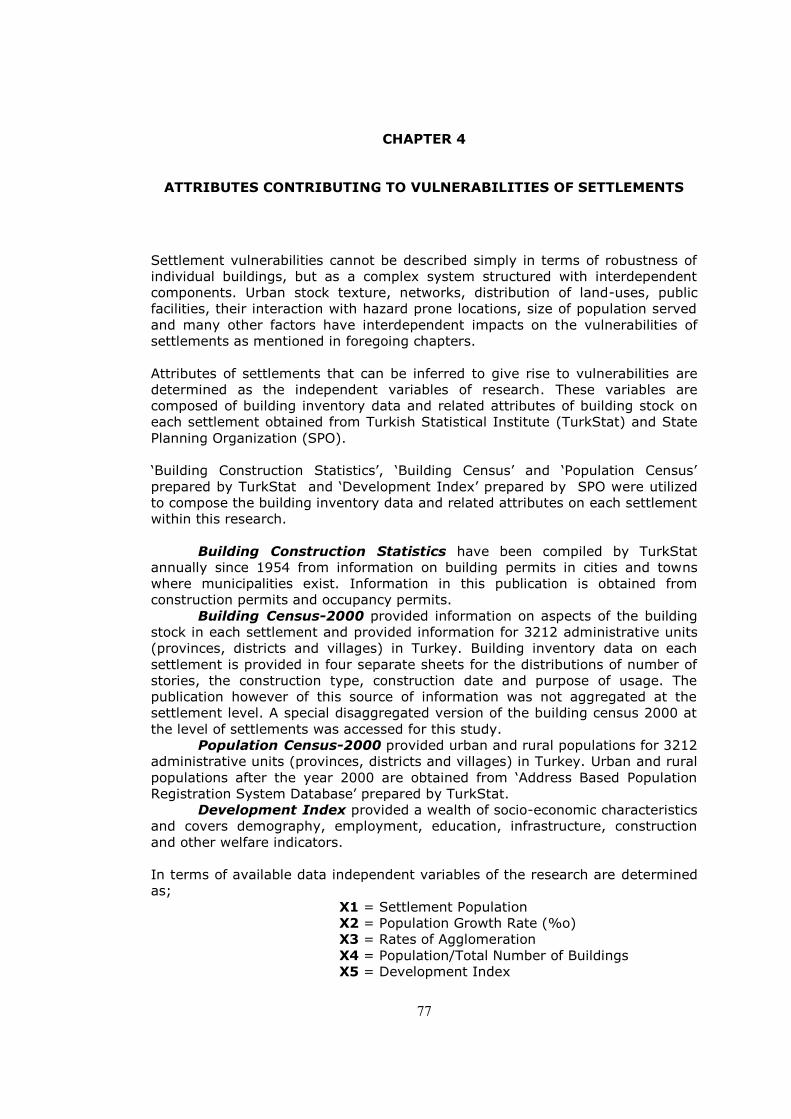
77
CHAPTER 4
ATTRIBUTES CONTRIBUTING TO VULNERABILITIES OF SETTLEMENTS
Settlement vulnerabilities cannot be described simply in terms of robustness of
individual buildings, but as a complex system structured with interdependent
components. Urban stock texture, networks, distribution of land-uses, public
facilities, their interaction with hazard prone locations, size of population served
and many other factors have interdependent impacts on the vulnerabilities of
settlements as mentioned in foregoing chapters.
Attributes of settlements that can be inferred to give rise to vulnerabilities are
determined as the independent variables of research. These variables are
composed of building inventory data and related attributes of building stock on
each settlement obtained from Turkish Statistical Institute (TurkStat) and State
Planning Organization (SPO).
‗Building Construction Statistics‘, ‗Building Census‘ and ‗Population Census‘
prepared by TurkStat and ‗Development Index‘ prepared by SPO were utilized
to compose the building inventory data and related attributes on each settlement
within this research.
Building Construction Statistics have been compiled by TurkStat
annually since 1954 from information on building permits in cities and towns
where municipalities exist. Information in this publication is obtained from
construction permits and occupancy permits.
Building Census-2000 provided information on aspects of the building
stock in each settlement and provided information for 3212 administrative units
(provinces, districts and villages) in Turkey. Building inventory data on each
settlement is provided in four separate sheets for the distributions of number of
stories, the construction type, construction date and purpose of usage. The
publication however of this source of information was not aggregated at the
settlement level. A special disaggregated version of the building census 2000 at
the level of settlements was accessed for this study.
Population Census-2000 provided urban and rural populations for 3212
administrative units (provinces, districts and villages) in Turkey. Urban and rural
populations after the year 2000 are obtained from ‗Address Based Population
Registration System Database‘ prepared by TurkStat.
Development Index provided a wealth of socio-economic characteristics
and covers demography, employment, education, infrastructure, construction
and other welfare indicators.
In terms of available data independent variables of the research are determined
as;
X1 = Settlement Population
X2 = Population Growth Rate (%o)
X3 = Rates of Agglomeration
X4 = Population/Total Number of Buildings
X5 = Development Index
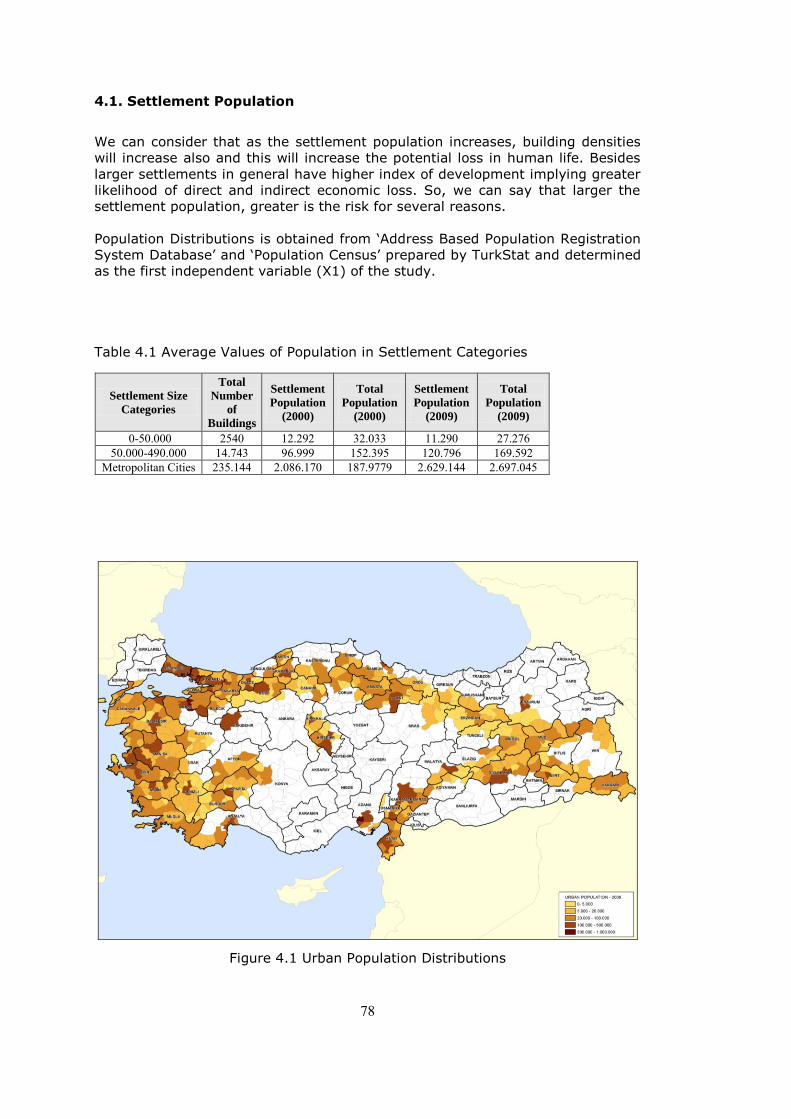
78
4.1. Settlement Population
We can consider that as the settlement population increases, building densities
will increase also and this will increase the potential loss in human life. Besides
larger settlements in general have higher index of development implying greater
likelihood of direct and indirect economic loss. So, we can say that larger the
settlement population, greater is the risk for several reasons.
Population Distributions is obtained from ‗Address Based Population Registration
System Database‘ and ‗Population Census‘ prepared by TurkStat and determined
as the first independent variable (X1) of the study.
Table 4.1 Average Values of Population in Settlement Categories
Figure 4.1 Urban Population Distributions
Settlement Size
Categories
Total
Number
of
Buildings
Settlement
Population
(2000)
Total
Population
(2000)
Settlement
Population
(2009)
Total
Population
(2009)
0-50.000 2540 12.292 32.033 11.290 27.276 50.000-490.000 14.743 96.999 152.395 120.796 169.592
Metropolitan Cities 235.144 2.086.170 187.9779 2.629.144 2.697.045
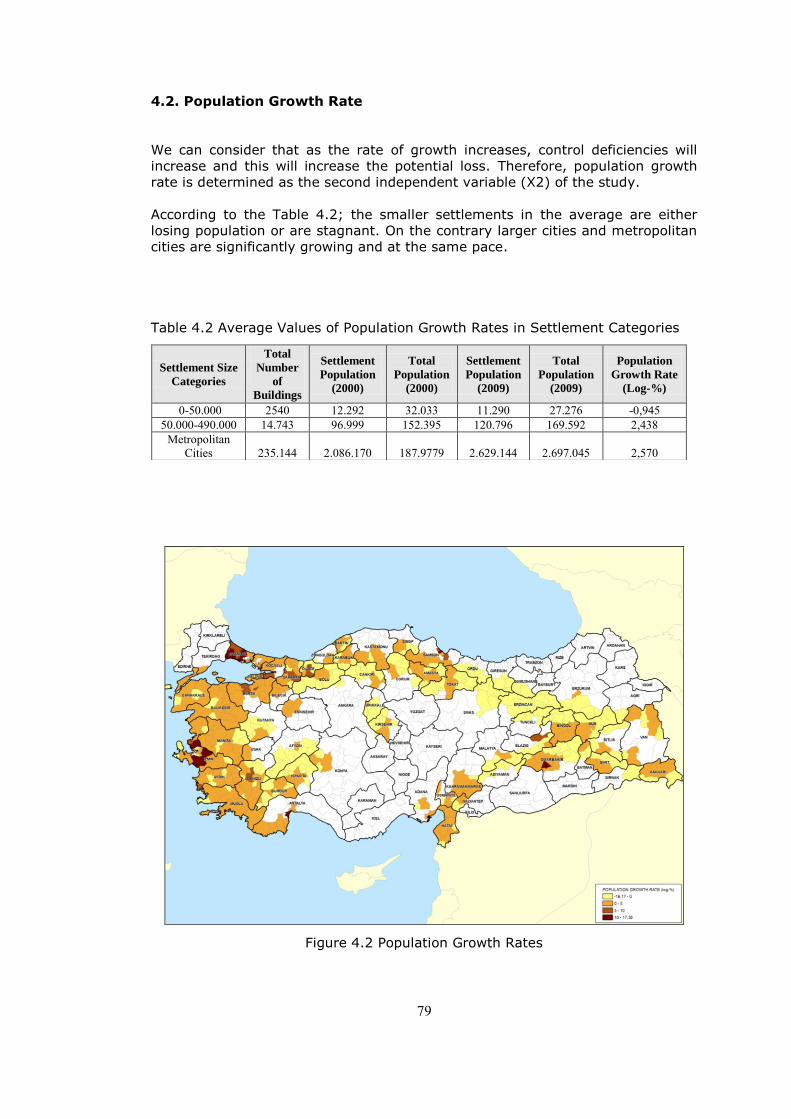
79
4.2. Population Growth Rate
We can consider that as the rate of growth increases, control deficiencies will
increase and this will increase the potential loss. Therefore, population growth
rate is determined as the second independent variable (X2) of the study.
According to the Table 4.2; the smaller settlements in the average are either
losing population or are stagnant. On the contrary larger cities and metropolitan
cities are significantly growing and at the same pace.
Table 4.2 Average Values of Population Growth Rates in Settlement Categories
Figure 4.2 Population Growth Rates
Settlement Size
Categories
Total
Number
of
Buildings
Settlement
Population
(2000)
Total
Population
(2000)
Settlement
Population
(2009)
Total
Population
(2009)
Population
Growth Rate
(Log-%)
0-50.000 2540 12.292 32.033 11.290 27.276 -0,945 50.000-490.000 14.743 96.999 152.395 120.796 169.592 2,438
Metropolitan Cities 235.144 2.086.170 187.9779 2.629.144 2.697.045 2,570
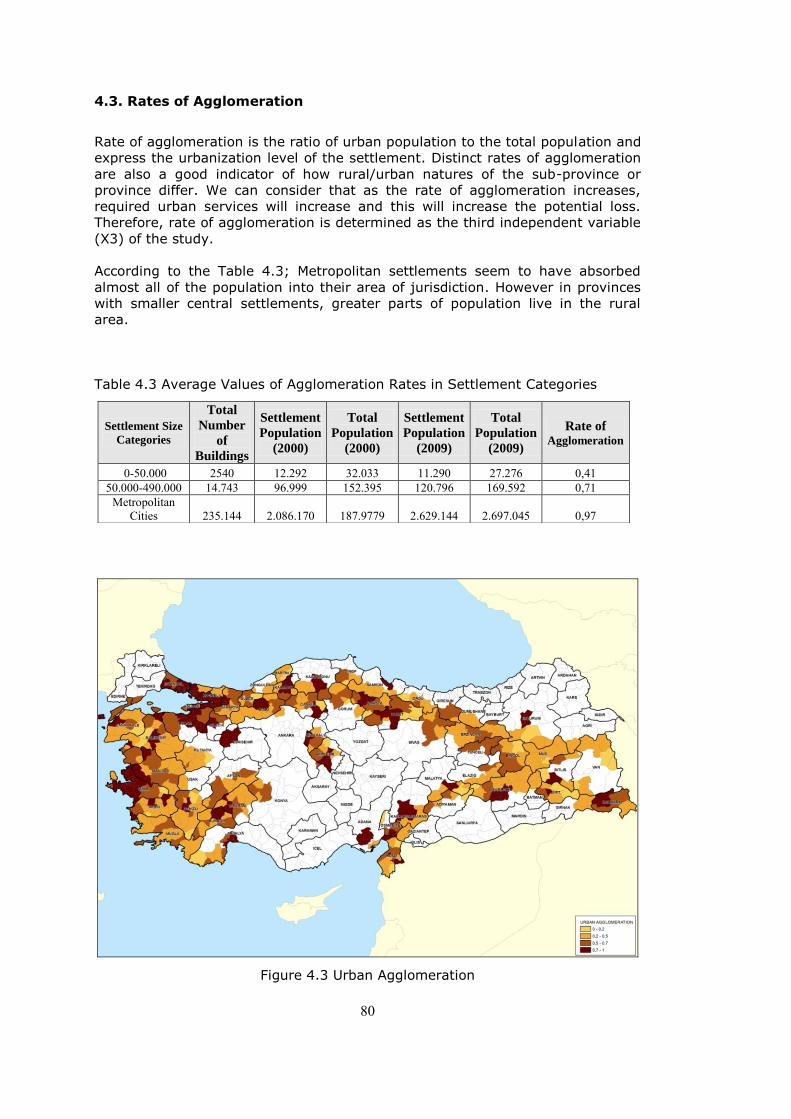
80
4.3. Rates of Agglomeration
Rate of agglomeration is the ratio of urban population to the total population and
express the urbanization level of the settlement. Distinct rates of agglomeration
are also a good indicator of how rural/urban natures of the sub-province or
province differ. We can consider that as the rate of agglomeration increases,
required urban services will increase and this will increase the potential loss.
Therefore, rate of agglomeration is determined as the third independent variable
(X3) of the study.
According to the Table 4.3; Metropolitan settlements seem to have absorbed
almost all of the population into their area of jurisdiction. However in provinces
with smaller central settlements, greater parts of population live in the rural
area.
Table 4.3 Average Values of Agglomeration Rates in Settlement Categories
Figure 4.3 Urban Agglomeration
Settlement Size
Categories
Total
Number
of
Buildings
Settlement
Population
(2000)
Total
Population
(2000)
Settlement
Population
(2009)
Total
Population
(2009)
Rate of Agglomeration
0-50.000 2540 12.292 32.033 11.290 27.276 0,41 50.000-490.000 14.743 96.999 152.395 120.796 169.592 0,71
Metropolitan Cities 235.144 2.086.170 187.9779 2.629.144 2.697.045 0,97
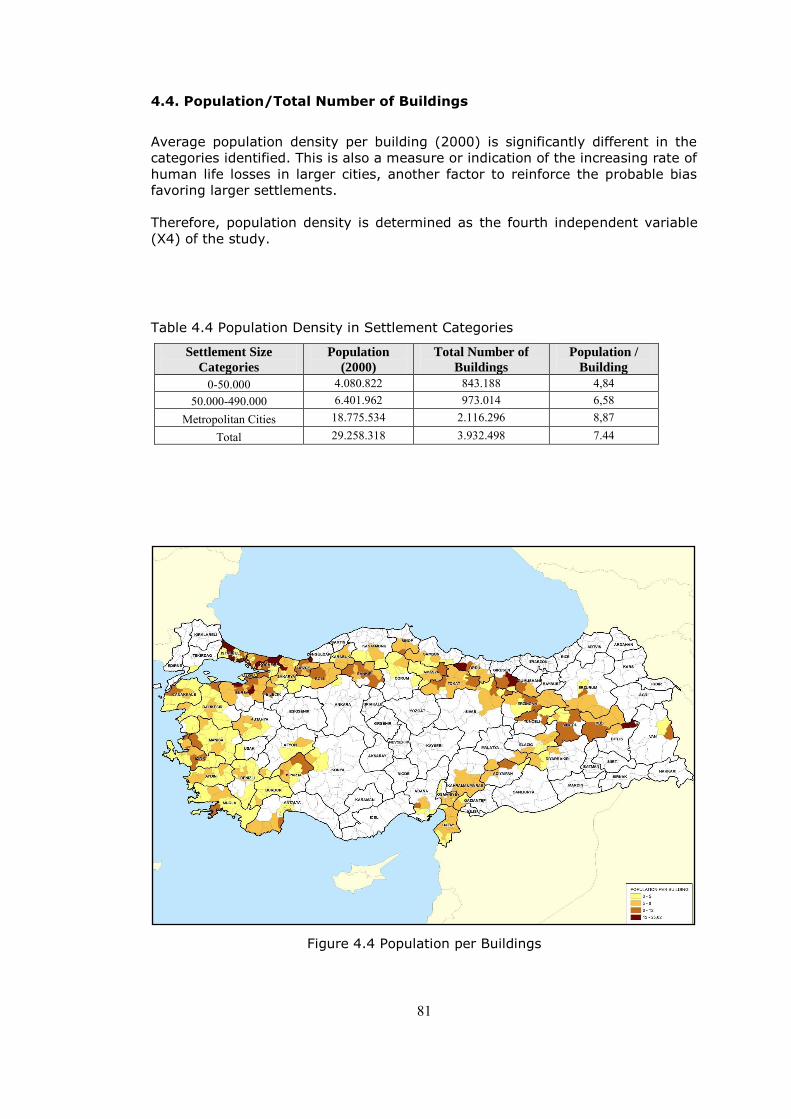
81
4.4. Population/Total Number of Buildings
Average population density per building (2000) is significantly different in the
categories identified. This is also a measure or indication of the increasing rate of
human life losses in larger cities, another factor to reinforce the probable bias
favoring larger settlements.
Therefore, population density is determined as the fourth independent variable
(X4) of the study.
Table 4.4 Population Density in Settlement Categories
Settlement Size
Categories
Population
(2000)
Total Number of
Buildings
Population /
Building
0-50.000 4.080.822 843.188 4,84 50.000-490.000 6.401.962 973.014 6,58
Metropolitan Cities 18.775.534 2.116.296 8,87
Total 29.258.318 3.932.498 7.44
Figure 4.4 Population per Buildings
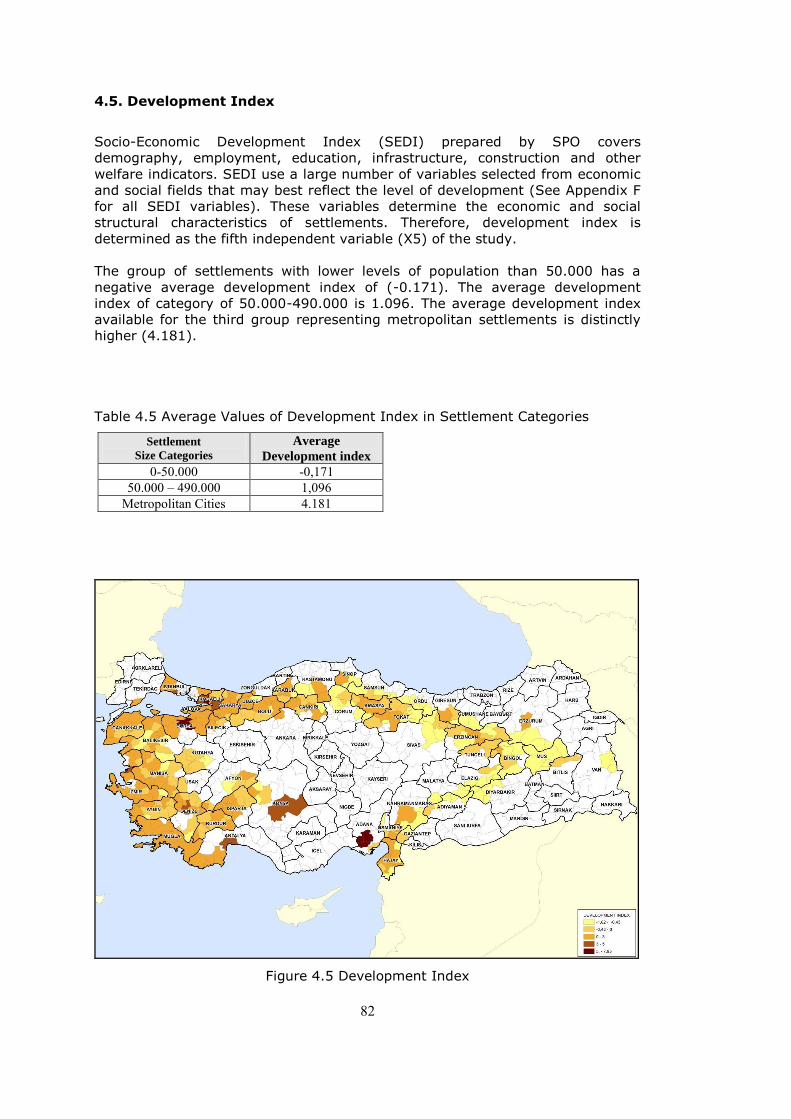
82
4.5. Development Index
Socio-Economic Development Index (SEDI) prepared by SPO covers
demography, employment, education, infrastructure, construction and other
welfare indicators. SEDI use a large number of variables selected from economic
and social fields that may best reflect the level of development (See Appendix F
for all SEDI variables). These variables determine the economic and social
structural characteristics of settlements. Therefore, development index is
determined as the fifth independent variable (X5) of the study.
The group of settlements with lower levels of population than 50.000 has a
negative average development index of (-0.171). The average development
index of category of 50.000-490.000 is 1.096. The average development index
available for the third group representing metropolitan settlements is distinctly
higher (4.181).
Table 4.5 Average Values of Development Index in Settlement Categories
Settlement
Size Categories Average
Development index
0-50.000 -0,171 50.000 – 490.000 1,096
Metropolitan Cities 4.181
Figure 4.5 Development Index
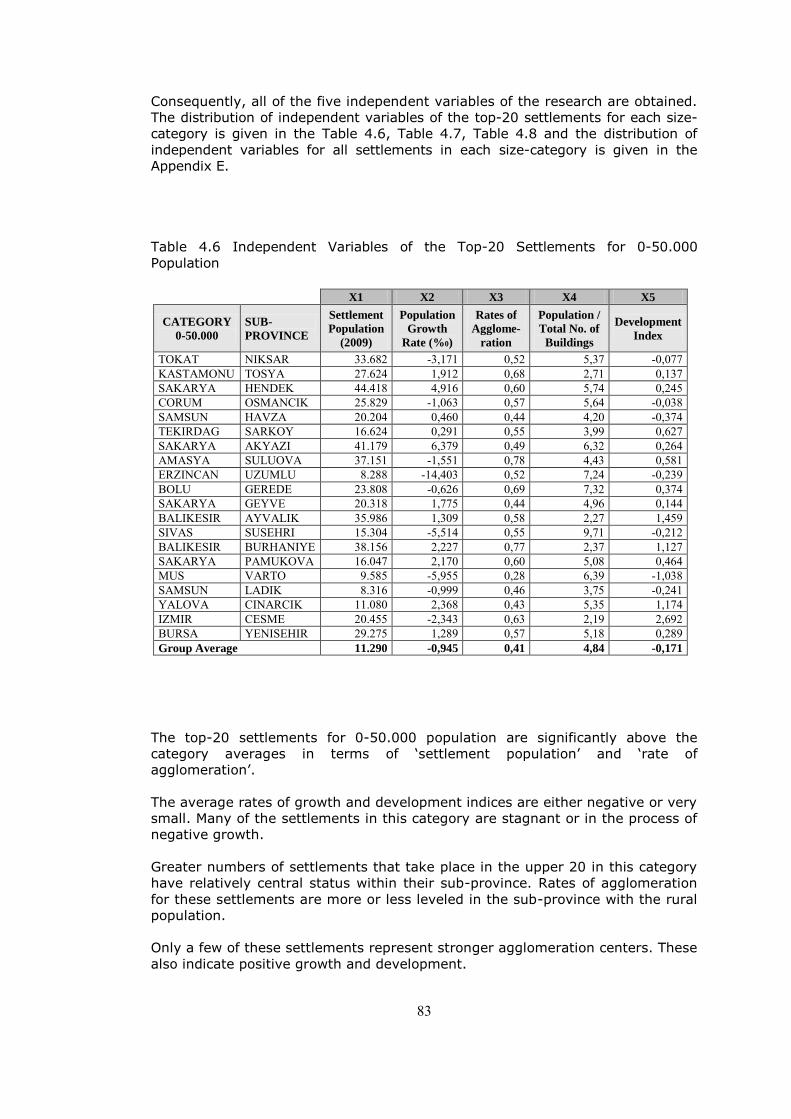
83
Consequently, all of the five independent variables of the research are obtained.
The distribution of independent variables of the top-20 settlements for each size-
category is given in the Table 4.6, Table 4.7, Table 4.8 and the distribution of
independent variables for all settlements in each size-category is given in the
Appendix E.
Table 4.6 Independent Variables of the Top-20 Settlements for 0-50.000
Population
X1 X2 X3 X4 X5
CATEGORY
0-50.000
SUB-
PROVINCE
Settlement
Population
(2009)
Population
Growth
Rate (%0)
Rates of
Agglome-
ration
Population /
Total No. of
Buildings
Development
Index
TOKAT NIKSAR 33.682 -3,171 0,52 5,37 -0,077 KASTAMONU TOSYA 27.624 1,912 0,68 2,71 0,137 SAKARYA HENDEK 44.418 4,916 0,60 5,74 0,245 CORUM OSMANCIK 25.829 -1,063 0,57 5,64 -0,038 SAMSUN HAVZA 20.204 0,460 0,44 4,20 -0,374 TEKIRDAG SARKOY 16.624 0,291 0,55 3,99 0,627 SAKARYA AKYAZI 41.179 6,379 0,49 6,32 0,264 AMASYA SULUOVA 37.151 -1,551 0,78 4,43 0,581 ERZINCAN UZUMLU 8.288 -14,403 0,52 7,24 -0,239 BOLU GEREDE 23.808 -0,626 0,69 7,32 0,374 SAKARYA GEYVE 20.318 1,775 0,44 4,96 0,144 BALIKESIR AYVALIK 35.986 1,309 0,58 2,27 1,459 SIVAS SUSEHRI 15.304 -5,514 0,55 9,71 -0,212 BALIKESIR BURHANIYE 38.156 2,227 0,77 2,37 1,127 SAKARYA PAMUKOVA 16.047 2,170 0,60 5,08 0,464 MUS VARTO 9.585 -5,955 0,28 6,39 -1,038 SAMSUN LADIK 8.316 -0,999 0,46 3,75 -0,241 YALOVA CINARCIK 11.080 2,368 0,43 5,35 1,174 IZMIR CESME 20.455 -2,343 0,63 2,19 2,692 BURSA YENISEHIR 29.275 1,289 0,57 5,18 0,289 Group Average 11.290 -0,945 0,41 4,84 -0,171
The top-20 settlements for 0-50.000 population are significantly above the
category averages in terms of ‗settlement population‘ and ‗rate of
agglomeration‘.
The average rates of growth and development indices are either negative or very
small. Many of the settlements in this category are stagnant or in the process of
negative growth.
Greater numbers of settlements that take place in the upper 20 in this category
have relatively central status within their sub-province. Rates of agglomeration
for these settlements are more or less leveled in the sub-province with the rural
population.
Only a few of these settlements represent stronger agglomeration centers. These
also indicate positive growth and development.
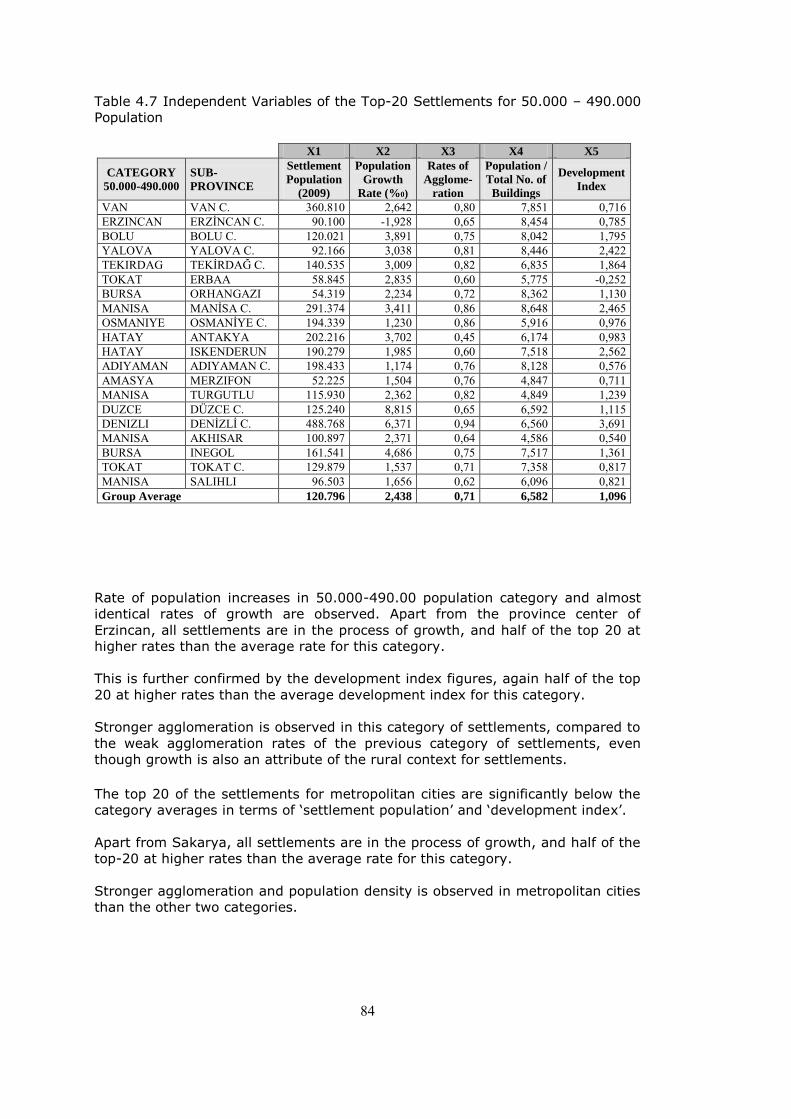
84
Table 4.7 Independent Variables of the Top-20 Settlements for 50.000 – 490.000
Population
X1 X2 X3 X4 X5
CATEGORY
50.000-490.000
SUB-
PROVINCE
Settlement
Population
(2009)
Population
Growth
Rate (%0)
Rates of
Agglome-
ration
Population /
Total No. of
Buildings
Development
Index
VAN VAN C. 360.810 2,642 0,80 7,851 0,716 ERZINCAN ERZİNCAN C. 90.100 -1,928 0,65 8,454 0,785 BOLU BOLU C. 120.021 3,891 0,75 8,042 1,795 YALOVA YALOVA C. 92.166 3,038 0,81 8,446 2,422 TEKIRDAG TEKİRDAĞ C. 140.535 3,009 0,82 6,835 1,864 TOKAT ERBAA 58.845 2,835 0,60 5,775 -0,252 BURSA ORHANGAZI 54.319 2,234 0,72 8,362 1,130 MANISA MANİSA C. 291.374 3,411 0,86 8,648 2,465 OSMANIYE OSMANİYE C. 194.339 1,230 0,86 5,916 0,976 HATAY ANTAKYA 202.216 3,702 0,45 6,174 0,983 HATAY ISKENDERUN 190.279 1,985 0,60 7,518 2,562 ADIYAMAN ADIYAMAN C. 198.433 1,174 0,76 8,128 0,576 AMASYA MERZIFON 52.225 1,504 0,76 4,847 0,711 MANISA TURGUTLU 115.930 2,362 0,82 4,849 1,239 DUZCE DÜZCE C. 125.240 8,815 0,65 6,592 1,115 DENIZLI DENİZLİ C. 488.768 6,371 0,94 6,560 3,691 MANISA AKHISAR 100.897 2,371 0,64 4,586 0,540 BURSA INEGOL 161.541 4,686 0,75 7,517 1,361 TOKAT TOKAT C. 129.879 1,537 0,71 7,358 0,817 MANISA SALIHLI 96.503 1,656 0,62 6,096 0,821 Group Average 120.796 2,438 0,71 6,582 1,096
Rate of population increases in 50.000-490.00 population category and almost
identical rates of growth are observed. Apart from the province center of
Erzincan, all settlements are in the process of growth, and half of the top 20 at
higher rates than the average rate for this category.
This is further confirmed by the development index figures, again half of the top
20 at higher rates than the average development index for this category.
Stronger agglomeration is observed in this category of settlements, compared to
the weak agglomeration rates of the previous category of settlements, even
though growth is also an attribute of the rural context for settlements.
The top 20 of the settlements for metropolitan cities are significantly below the
category averages in terms of ‗settlement population‘ and ‗development index‘.
Apart from Sakarya, all settlements are in the process of growth, and half of the
top-20 at higher rates than the average rate for this category.
Stronger agglomeration and population density is observed in metropolitan cities
than the other two categories.
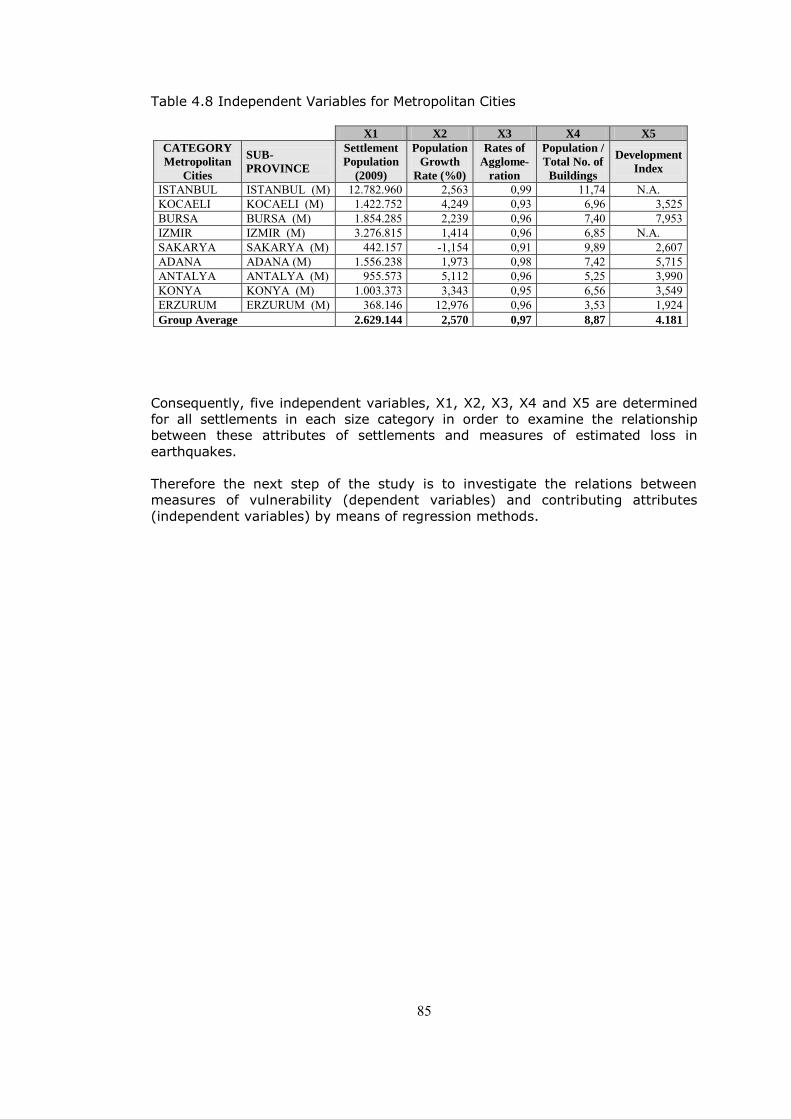
85
Table 4.8 Independent Variables for Metropolitan Cities
X1 X2 X3 X4 X5
CATEGORY
Metropolitan
Cities
SUB-
PROVINCE
Settlement
Population
(2009)
Population
Growth
Rate (%0)
Rates of
Agglome-
ration
Population /
Total No. of
Buildings
Development
Index
ISTANBUL ISTANBUL (M) 12.782.960 2,563 0,99 11,74 N.A. KOCAELI KOCAELI (M) 1.422.752 4,249 0,93 6,96 3,525 BURSA BURSA (M) 1.854.285 2,239 0,96 7,40 7,953 IZMIR IZMIR (M) 3.276.815 1,414 0,96 6,85 N.A. SAKARYA SAKARYA (M) 442.157 -1,154 0,91 9,89 2,607 ADANA ADANA (M) 1.556.238 1,973 0,98 7,42 5,715 ANTALYA ANTALYA (M) 955.573 5,112 0,96 5,25 3,990 KONYA KONYA (M) 1.003.373 3,343 0,95 6,56 3,549 ERZURUM ERZURUM (M) 368.146 12,976 0,96 3,53 1,924 Group Average 2.629.144 2,570 0,97 8,87 4.181
Consequently, five independent variables, X1, X2, X3, X4 and X5 are determined
for all settlements in each size category in order to examine the relationship
between these attributes of settlements and measures of estimated loss in
earthquakes.
Therefore the next step of the study is to investigate the relations between
measures of vulnerability (dependent variables) and contributing attributes
(independent variables) by means of regression methods.

86
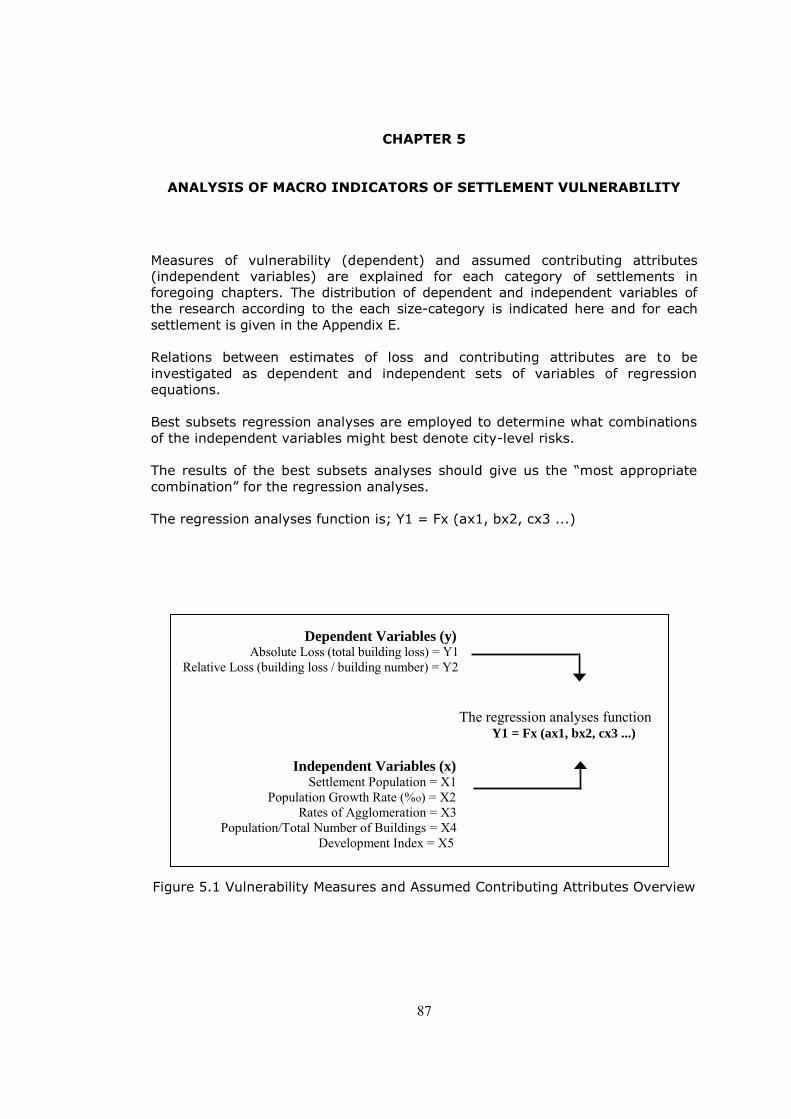
87
CHAPTER 5
ANALYSIS OF MACRO INDICATORS OF SETTLEMENT VULNERABILITY
Measures of vulnerability (dependent) and assumed contributing attributes
(independent variables) are explained for each category of settlements in
foregoing chapters. The distribution of dependent and independent variables of
the research according to the each size-category is indicated here and for each
settlement is given in the Appendix E.
Relations between estimates of loss and contributing attributes are to be
investigated as dependent and independent sets of variables of regression
equations.
Best subsets regression analyses are employed to determine what combinations
of the independent variables might best denote city-level risks.
The results of the best subsets analyses should give us the ―most appropriate
combination‖ for the regression analyses.
The regression analyses function is; Y1 = Fx (ax1, bx2, cx3 ...)
Dependent Variables (y) Absolute Loss (total building loss) = Y1 Relative Loss (building loss / building number) = Y2
The regression analyses function Y1 = Fx (ax1, bx2, cx3 ...)
Independent Variables (x) Settlement Population = X1
Population Growth Rate (%o) = X2 Rates of Agglomeration = X3
Population/Total Number of Buildings = X4 Development Index = X5
Figure 5.1 Vulnerability Measures and Assumed Contributing Attributes Overview
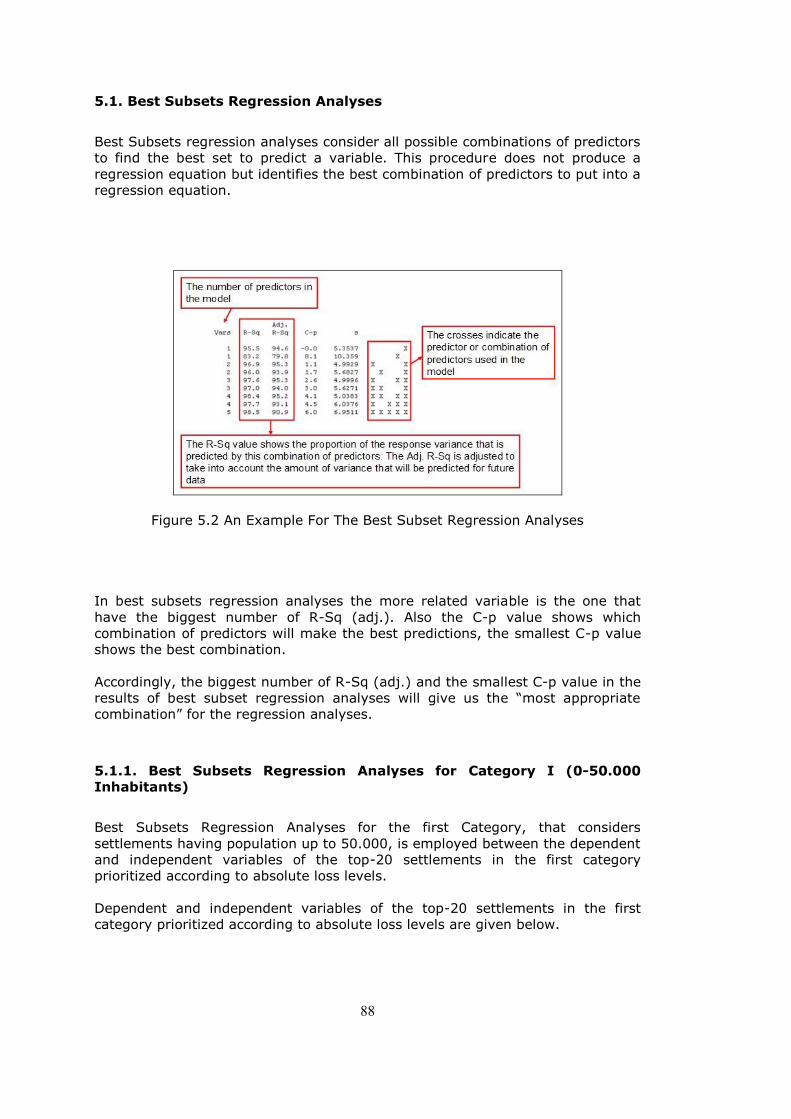
88
5.1. Best Subsets Regression Analyses
Best Subsets regression analyses consider all possible combinations of predictors
to find the best set to predict a variable. This procedure does not produce a
regression equation but identifies the best combination of predictors to put into a
regression equation.
Figure 5.2 An Example For The Best Subset Regression Analyses
In best subsets regression analyses the more related variable is the one that
have the biggest number of R-Sq (adj.). Also the C-p value shows which
combination of predictors will make the best predictions, the smallest C-p value
shows the best combination.
Accordingly, the biggest number of R-Sq (adj.) and the smallest C-p value in the
results of best subset regression analyses will give us the ―most appropriate
combination‖ for the regression analyses.
5.1.1. Best Subsets Regression Analyses for Category I (0-50.000
Inhabitants)
Best Subsets Regression Analyses for the first Category, that considers
settlements having population up to 50.000, is employed between the dependent
and independent variables of the top-20 settlements in the first category
prioritized according to absolute loss levels.
Dependent and independent variables of the top-20 settlements in the first
category prioritized according to absolute loss levels are given below.
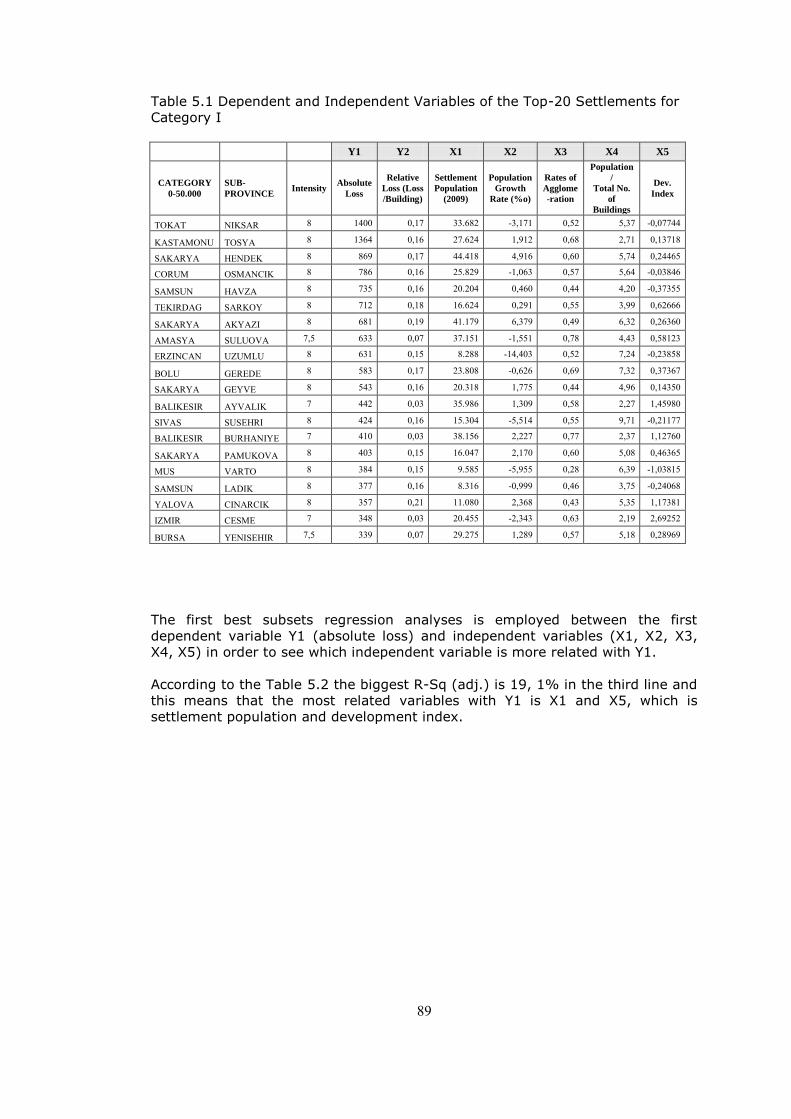
89
Table 5.1 Dependent and Independent Variables of the Top-20 Settlements for
Category I
Y1 Y2 X1 X2 X3 X4 X5
CATEGORY
0-50.000
SUB-
PROVINCE Intensity
Absolute
Loss
Relative
Loss (Loss
/Building)
Settlement
Population
(2009)
Population
Growth
Rate (%o)
Rates of
Agglome
-ration
Population
/
Total No.
of
Buildings
Dev.
Index
TOKAT NIKSAR 8 1400 0,17 33.682 -3,171 0,52 5,37 -0,07744
KASTAMONU TOSYA 8 1364 0,16 27.624 1,912 0,68 2,71 0,13718
SAKARYA HENDEK 8 869 0,17 44.418 4,916 0,60 5,74 0,24465
CORUM OSMANCIK 8 786 0,16 25.829 -1,063 0,57 5,64 -0,03846
SAMSUN HAVZA 8 735 0,16 20.204 0,460 0,44 4,20 -0,37355
TEKIRDAG SARKOY 8 712 0,18 16.624 0,291 0,55 3,99 0,62666
SAKARYA AKYAZI 8 681 0,19 41.179 6,379 0,49 6,32 0,26360
AMASYA SULUOVA 7,5 633 0,07 37.151 -1,551 0,78 4,43 0,58123
ERZINCAN UZUMLU 8 631 0,15 8.288 -14,403 0,52 7,24 -0,23858
BOLU GEREDE 8 583 0,17 23.808 -0,626 0,69 7,32 0,37367
SAKARYA GEYVE 8 543 0,16 20.318 1,775 0,44 4,96 0,14350
BALIKESIR AYVALIK 7 442 0,03 35.986 1,309 0,58 2,27 1,45980
SIVAS SUSEHRI 8 424 0,16 15.304 -5,514 0,55 9,71 -0,21177
BALIKESIR BURHANIYE 7 410 0,03 38.156 2,227 0,77 2,37 1,12760
SAKARYA PAMUKOVA 8 403 0,15 16.047 2,170 0,60 5,08 0,46365
MUS VARTO 8 384 0,15 9.585 -5,955 0,28 6,39 -1,03815
SAMSUN LADIK 8 377 0,16 8.316 -0,999 0,46 3,75 -0,24068
YALOVA CINARCIK 8 357 0,21 11.080 2,368 0,43 5,35 1,17381
IZMIR CESME 7 348 0,03 20.455 -2,343 0,63 2,19 2,69252
BURSA YENISEHIR 7,5 339 0,07 29.275 1,289 0,57 5,18 0,28969
The first best subsets regression analyses is employed between the first
dependent variable Y1 (absolute loss) and independent variables (X1, X2, X3,
X4, X5) in order to see which independent variable is more related with Y1.
According to the Table 5.2 the biggest R-Sq (adj.) is 19, 1% in the third line and
this means that the most related variables with Y1 is X1 and X5, which is
settlement population and development index.
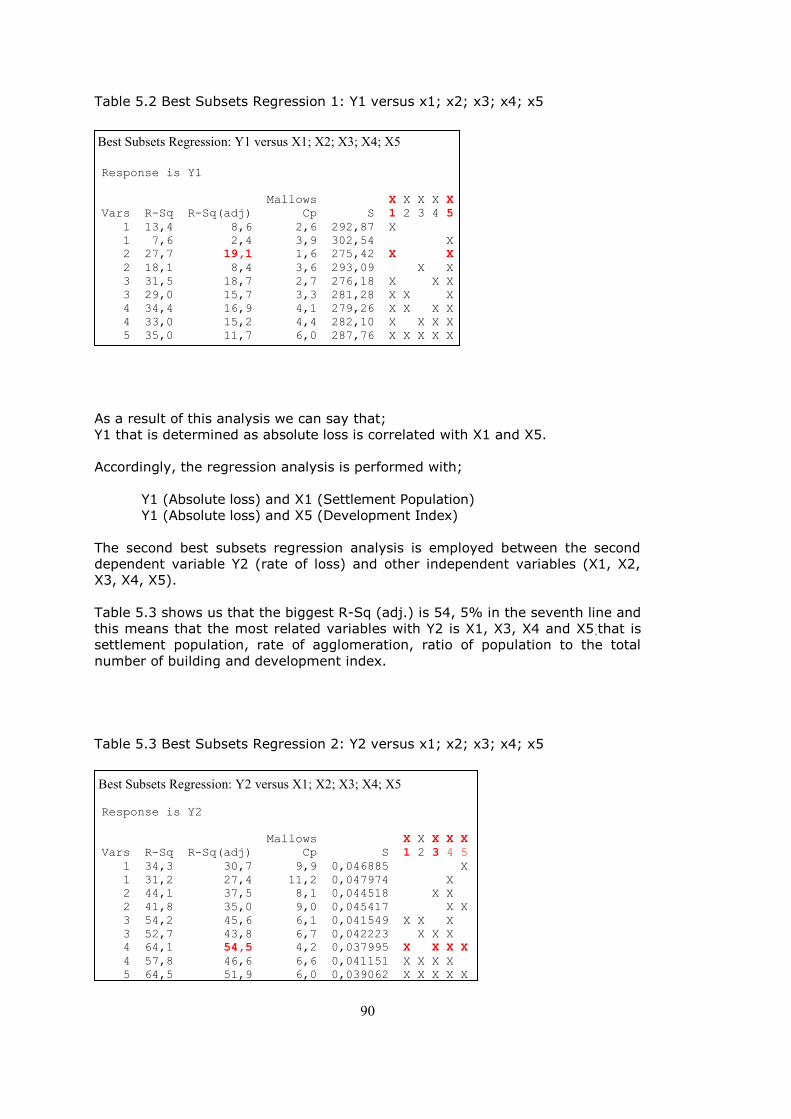
90
Table 5.2 Best Subsets Regression 1: Y1 versus x1; x2; x3; x4; x5 Best Subsets Regression: Y1 versus X1; X2; X3; X4; X5 Response is Y1
Mallows X X X X X
Vars R-Sq R-Sq(adj) Cp S 1 2 3 4 5
1 13,4 8,6 2,6 292,87 X
1 7,6 2,4 3,9 302,54 X
2 27,7 19,1 1,6 275,42 X X
2 18,1 8,4 3,6 293,09 X X
3 31,5 18,7 2,7 276,18 X X X
3 29,0 15,7 3,3 281,28 X X X
4 34,4 16,9 4,1 279,26 X X X X
4 33,0 15,2 4,4 282,10 X X X X
5 35,0 11,7 6,0 287,76 X X X X X
As a result of this analysis we can say that;
Y1 that is determined as absolute loss is correlated with X1 and X5.
Accordingly, the regression analysis is performed with;
Y1 (Absolute loss) and X1 (Settlement Population)
Y1 (Absolute loss) and X5 (Development Index)
The second best subsets regression analysis is employed between the second
dependent variable Y2 (rate of loss) and other independent variables (X1, X2,
X3, X4, X5).
Table 5.3 shows us that the biggest R-Sq (adj.) is 54, 5% in the seventh line and
this means that the most related variables with Y2 is X1, X3, X4 and X5.that is
settlement population, rate of agglomeration, ratio of population to the total
number of building and development index.
Table 5.3 Best Subsets Regression 2: Y2 versus x1; x2; x3; x4; x5 Best Subsets Regression: Y2 versus X1; X2; X3; X4; X5
Response is Y2
Mallows X X X X X
Vars R-Sq R-Sq(adj) Cp S 1 2 3 4 5
1 34,3 30,7 9,9 0,046885 X
1 31,2 27,4 11,2 0,047974 X
2 44,1 37,5 8,1 0,044518 X X
2 41,8 35,0 9,0 0,045417 X X
3 54,2 45,6 6,1 0,041549 X X X
3 52,7 43,8 6,7 0,042223 X X X
4 64,1 54,5 4,2 0,037995 X X X X
4 57,8 46,6 6,6 0,041151 X X X X
5 64,5 51,9 6,0 0,039062 X X X X X
91
As a result of this analysis we can say that;
Y2 that is determined as rate of loss is correlated with X1, X3, X4 and X5.
Accordingly, regression analysis is performed with;
Y2 (Rate of Loss) and X1 (Settlement Population)
Y2 (Rate of Loss) and X3 (Rates of Agglomeration)
Y2 (Rate of Loss) and X4 (Population/Total Number of Buildings)
Y2 (Rate of Loss) and X5 (Development Index)
The results of best subsets regression analyses of top-20 settlements for the first
category, that considers settlements having population up to 50.000, shows that
X1 (settlement population) and X5 (development index) are the most effective
independent variables that correlates with both dependent variables.
Six regression analyses are performed according to the results of best subsets
regression analyses for Category I, which considers settlements having
population up to 50.000. These are;
Regression Analysis: Y1 versus X1,
Y1 versus X5,
Y2 versus X1,
Y2 versus X3,
Y2 versus X4 and
Y2 versus X5.
5.1.2. Best Subsets Regression Analyses for Category II (50.000-
490.000 Inhabitants)
Best Subsets Regression Analyses for the second Category, that considers
settlements having population between 50.000 and 490.000, is employed
between the dependent and independent variables of the top-20 settlements in
the second category prioritized according to absolute loss levels.
Dependent and independent variables of the top-20 settlements in the second
category prioritized according to absolute loss levels are given below.
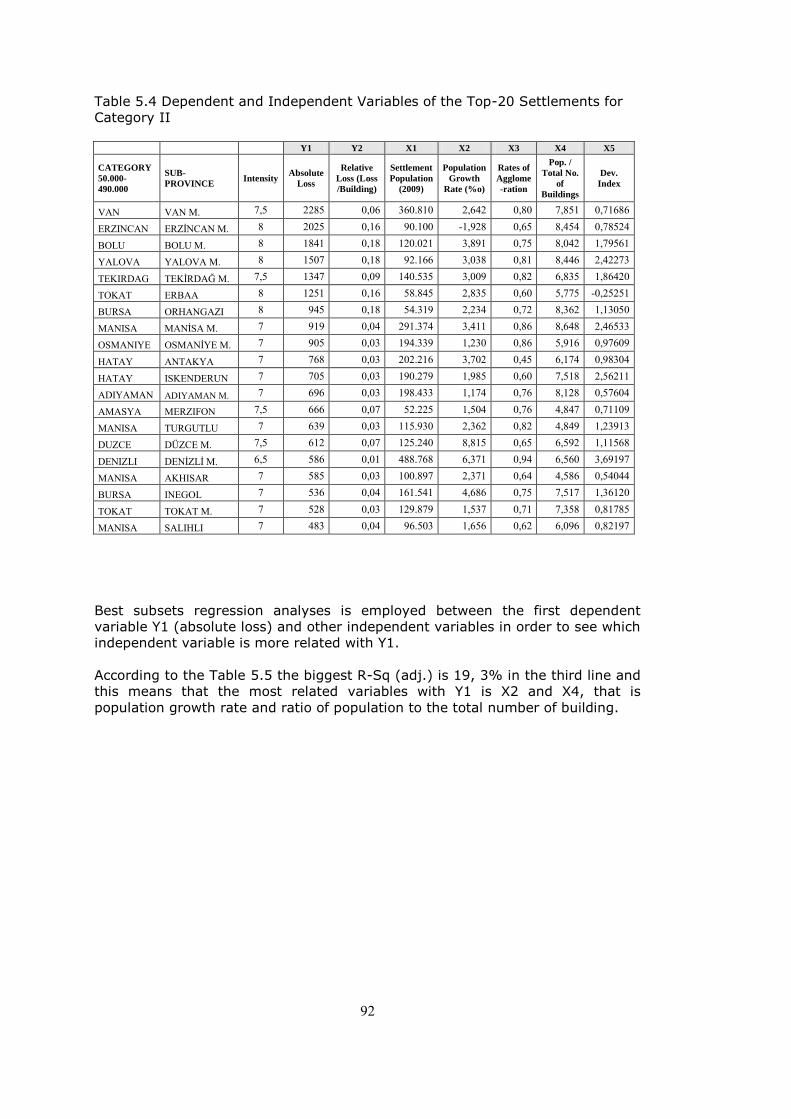
92
Table 5.4 Dependent and Independent Variables of the Top-20 Settlements for
Category II
Y1 Y2 X1 X2 X3 X4 X5
CATEGORY
50.000-
490.000
SUB-
PROVINCE Intensity
Absolute
Loss
Relative
Loss (Loss
/Building)
Settlement
Population
(2009)
Population
Growth
Rate (%o)
Rates of
Agglome
-ration
Pop. /
Total No.
of
Buildings
Dev.
Index
VAN VAN M. 7,5 2285 0,06 360.810 2,642 0,80 7,851 0,71686
ERZINCAN ERZİNCAN M. 8 2025 0,16 90.100 -1,928 0,65 8,454 0,78524
BOLU BOLU M. 8 1841 0,18 120.021 3,891 0,75 8,042 1,79561
YALOVA YALOVA M. 8 1507 0,18 92.166 3,038 0,81 8,446 2,42273
TEKIRDAG TEKİRDAĞ M. 7,5 1347 0,09 140.535 3,009 0,82 6,835 1,86420
TOKAT ERBAA 8 1251 0,16 58.845 2,835 0,60 5,775 -0,25251
BURSA ORHANGAZI 8 945 0,18 54.319 2,234 0,72 8,362 1,13050
MANISA MANİSA M. 7 919 0,04 291.374 3,411 0,86 8,648 2,46533
OSMANIYE OSMANİYE M. 7 905 0,03 194.339 1,230 0,86 5,916 0,97609
HATAY ANTAKYA 7 768 0,03 202.216 3,702 0,45 6,174 0,98304
HATAY ISKENDERUN 7 705 0,03 190.279 1,985 0,60 7,518 2,56211
ADIYAMAN ADIYAMAN M. 7 696 0,03 198.433 1,174 0,76 8,128 0,57604
AMASYA MERZIFON 7,5 666 0,07 52.225 1,504 0,76 4,847 0,71109
MANISA TURGUTLU 7 639 0,03 115.930 2,362 0,82 4,849 1,23913
DUZCE DÜZCE M. 7,5 612 0,07 125.240 8,815 0,65 6,592 1,11568
DENIZLI DENİZLİ M. 6,5 586 0,01 488.768 6,371 0,94 6,560 3,69197
MANISA AKHISAR 7 585 0,03 100.897 2,371 0,64 4,586 0,54044
BURSA INEGOL 7 536 0,04 161.541 4,686 0,75 7,517 1,36120
TOKAT TOKAT M. 7 528 0,03 129.879 1,537 0,71 7,358 0,81785
MANISA SALIHLI 7 483 0,04 96.503 1,656 0,62 6,096 0,82197
Best subsets regression analyses is employed between the first dependent
variable Y1 (absolute loss) and other independent variables in order to see which
independent variable is more related with Y1.
According to the Table 5.5 the biggest R-Sq (adj.) is 19, 3% in the third line and
this means that the most related variables with Y1 is X2 and X4, that is
population growth rate and ratio of population to the total number of building.
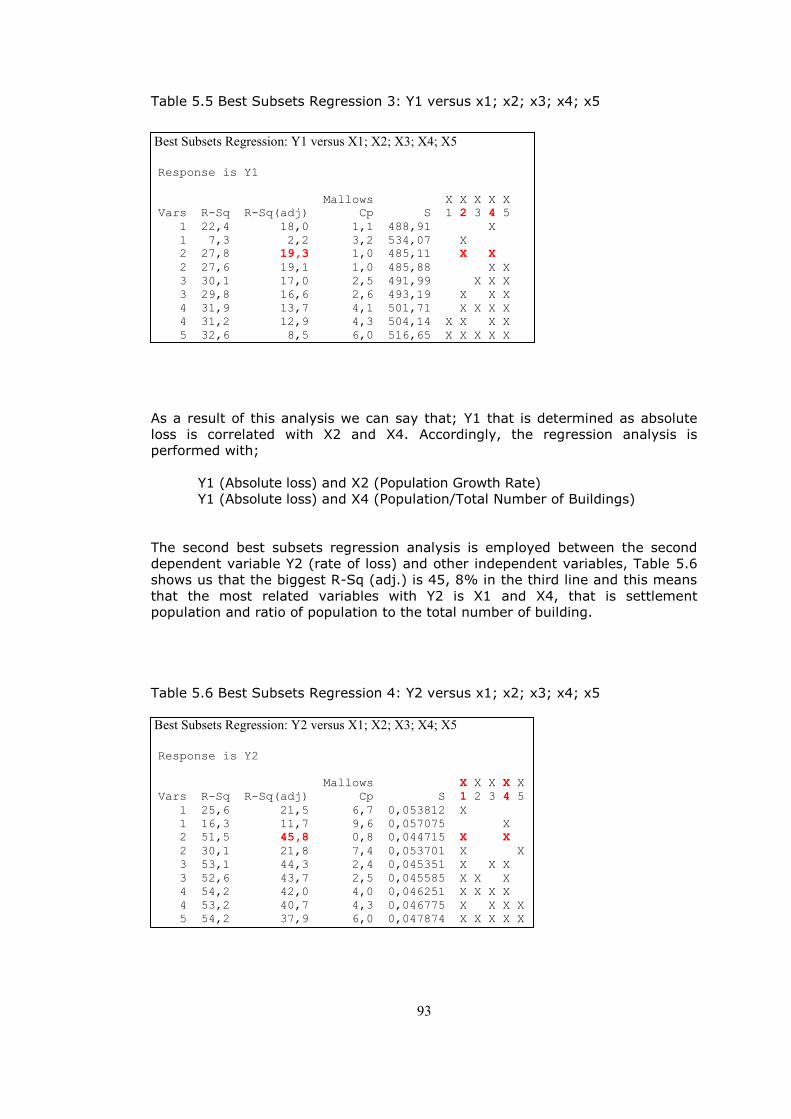
93
Table 5.5 Best Subsets Regression 3: Y1 versus x1; x2; x3; x4; x5
Best Subsets Regression: Y1 versus X1; X2; X3; X4; X5 Response is Y1
Mallows X X X X X
Vars R-Sq R-Sq(adj) Cp S 1 2 3 4 5
1 22,4 18,0 1,1 488,91 X
1 7,3 2,2 3,2 534,07 X
2 27,8 19,3 1,0 485,11 X X
2 27,6 19,1 1,0 485,88 X X
3 30,1 17,0 2,5 491,99 X X X
3 29,8 16,6 2,6 493,19 X X X
4 31,9 13,7 4,1 501,71 X X X X
4 31,2 12,9 4,3 504,14 X X X X
5 32,6 8,5 6,0 516,65 X X X X X
As a result of this analysis we can say that; Y1 that is determined as absolute
loss is correlated with X2 and X4. Accordingly, the regression analysis is
performed with;
Y1 (Absolute loss) and X2 (Population Growth Rate)
Y1 (Absolute loss) and X4 (Population/Total Number of Buildings)
The second best subsets regression analysis is employed between the second
dependent variable Y2 (rate of loss) and other independent variables, Table 5.6
shows us that the biggest R-Sq (adj.) is 45, 8% in the third line and this means
that the most related variables with Y2 is X1 and X4, that is settlement
population and ratio of population to the total number of building.
Table 5.6 Best Subsets Regression 4: Y2 versus x1; x2; x3; x4; x5
Best Subsets Regression: Y2 versus X1; X2; X3; X4; X5 Response is Y2
Mallows X X X X X
Vars R-Sq R-Sq(adj) Cp S 1 2 3 4 5
1 25,6 21,5 6,7 0,053812 X
1 16,3 11,7 9,6 0,057075 X
2 51,5 45,8 0,8 0,044715 X X
2 30,1 21,8 7,4 0,053701 X X
3 53,1 44,3 2,4 0,045351 X X X
3 52,6 43,7 2,5 0,045585 X X X
4 54,2 42,0 4,0 0,046251 X X X X
4 53,2 40,7 4,3 0,046775 X X X X
5 54,2 37,9 6,0 0,047874 X X X X X
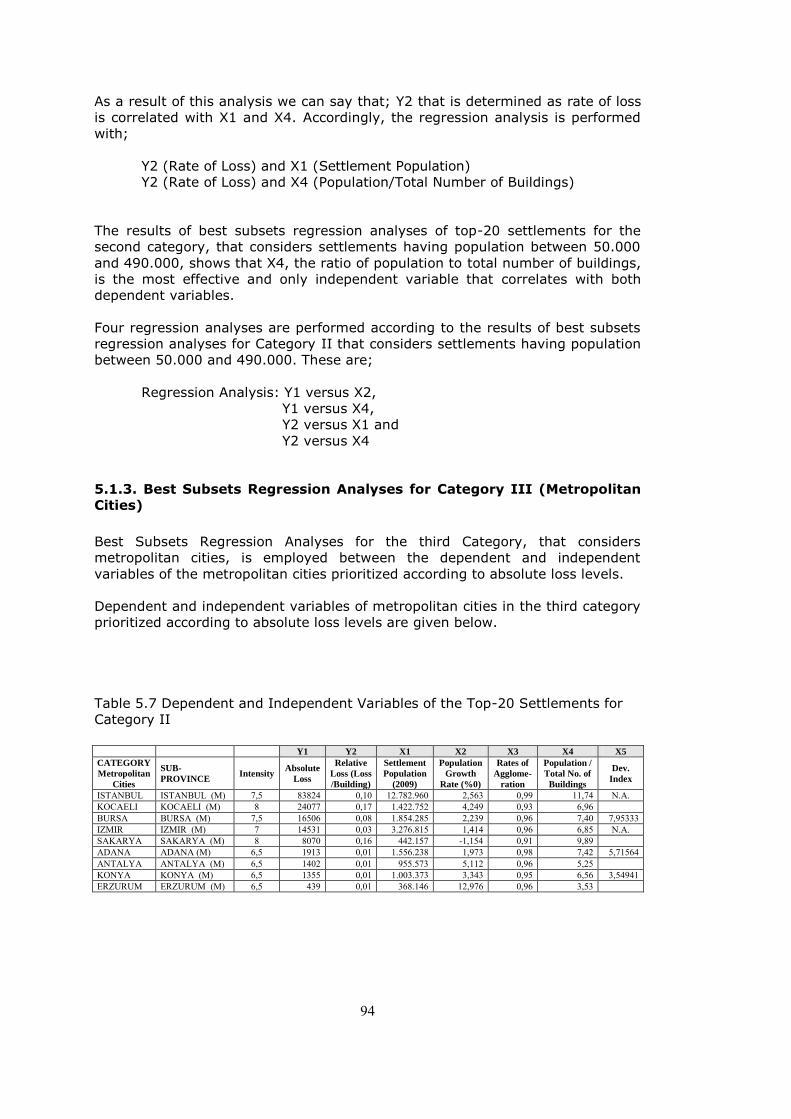
94
As a result of this analysis we can say that; Y2 that is determined as rate of loss
is correlated with X1 and X4. Accordingly, the regression analysis is performed
with;
Y2 (Rate of Loss) and X1 (Settlement Population)
Y2 (Rate of Loss) and X4 (Population/Total Number of Buildings)
The results of best subsets regression analyses of top-20 settlements for the
second category, that considers settlements having population between 50.000
and 490.000, shows that X4, the ratio of population to total number of buildings,
is the most effective and only independent variable that correlates with both
dependent variables.
Four regression analyses are performed according to the results of best subsets
regression analyses for Category II that considers settlements having population
between 50.000 and 490.000. These are;
Regression Analysis: Y1 versus X2,
Y1 versus X4,
Y2 versus X1 and
Y2 versus X4
5.1.3. Best Subsets Regression Analyses for Category III (Metropolitan
Cities)
Best Subsets Regression Analyses for the third Category, that considers
metropolitan cities, is employed between the dependent and independent
variables of the metropolitan cities prioritized according to absolute loss levels.
Dependent and independent variables of metropolitan cities in the third category
prioritized according to absolute loss levels are given below.
Table 5.7 Dependent and Independent Variables of the Top-20 Settlements for
Category II
Y1 Y2 X1 X2 X3 X4 X5
CATEGORY
Metropolitan
Cities
SUB-
PROVINCE Intensity
Absolute
Loss
Relative
Loss (Loss
/Building)
Settlement
Population
(2009)
Population
Growth
Rate (%0)
Rates of
Agglome-
ration
Population /
Total No. of
Buildings
Dev.
Index
ISTANBUL ISTANBUL (M) 7,5 83824 0,10 12.782.960 2,563 0,99 11,74 N.A. KOCAELI KOCAELI (M) 8 24077 0,17 1.422.752 4,249 0,93 6,96 BURSA BURSA (M) 7,5 16506 0,08 1.854.285 2,239 0,96 7,40 7,95333 IZMIR IZMIR (M) 7 14531 0,03 3.276.815 1,414 0,96 6,85 N.A. SAKARYA SAKARYA (M) 8 8070 0,16 442.157 -1,154 0,91 9,89 ADANA ADANA (M) 6,5 1913 0,01 1.556.238 1,973 0,98 7,42 5,71564 ANTALYA ANTALYA (M) 6,5 1402 0,01 955.573 5,112 0,96 5,25 KONYA KONYA (M) 6,5 1355 0,01 1.003.373 3,343 0,95 6,56 3,54941 ERZURUM ERZURUM (M) 6,5 439 0,01 368.146 12,976 0,96 3,53
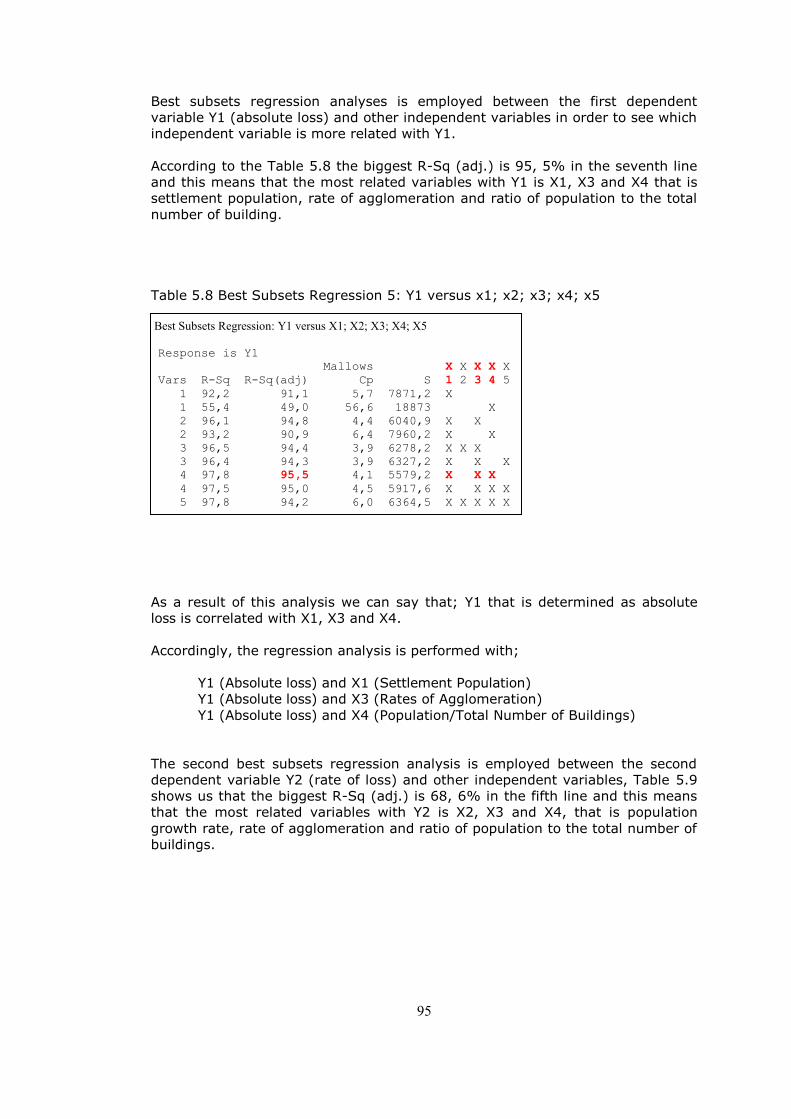
95
Best subsets regression analyses is employed between the first dependent
variable Y1 (absolute loss) and other independent variables in order to see which
independent variable is more related with Y1.
According to the Table 5.8 the biggest R-Sq (adj.) is 95, 5% in the seventh line
and this means that the most related variables with Y1 is X1, X3 and X4 that is
settlement population, rate of agglomeration and ratio of population to the total
number of building.
Table 5.8 Best Subsets Regression 5: Y1 versus x1; x2; x3; x4; x5
Best Subsets Regression: Y1 versus X1; X2; X3; X4; X5 Response is Y1
Mallows X X X X X
Vars R-Sq R-Sq(adj) Cp S 1 2 3 4 5
1 92,2 91,1 5,7 7871,2 X
1 55,4 49,0 56,6 18873 X
2 96,1 94,8 4,4 6040,9 X X
2 93,2 90,9 6,4 7960,2 X X
3 96,5 94,4 3,9 6278,2 X X X
3 96,4 94,3 3,9 6327,2 X X X
4 97,8 95,5 4,1 5579,2 X X X
4 97,5 95,0 4,5 5917,6 X X X X
5 97,8 94,2 6,0 6364,5 X X X X X
As a result of this analysis we can say that; Y1 that is determined as absolute
loss is correlated with X1, X3 and X4.
Accordingly, the regression analysis is performed with;
Y1 (Absolute loss) and X1 (Settlement Population)
Y1 (Absolute loss) and X3 (Rates of Agglomeration)
Y1 (Absolute loss) and X4 (Population/Total Number of Buildings)
The second best subsets regression analysis is employed between the second
dependent variable Y2 (rate of loss) and other independent variables, Table 5.9
shows us that the biggest R-Sq (adj.) is 68, 6% in the fifth line and this means
that the most related variables with Y2 is X2, X3 and X4, that is population
growth rate, rate of agglomeration and ratio of population to the total number of
buildings.
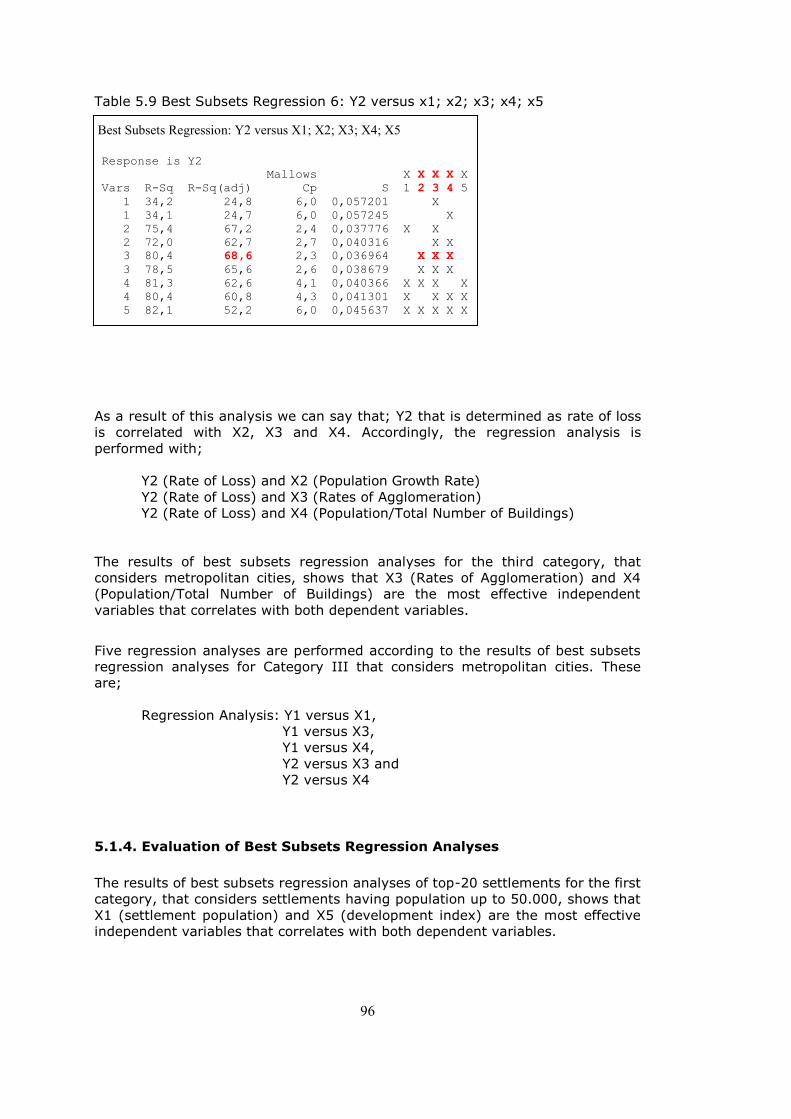
96
Table 5.9 Best Subsets Regression 6: Y2 versus x1; x2; x3; x4; x5
Best Subsets Regression: Y2 versus X1; X2; X3; X4; X5 Response is Y2
Mallows X X X X X
Vars R-Sq R-Sq(adj) Cp S 1 2 3 4 5
1 34,2 24,8 6,0 0,057201 X
1 34,1 24,7 6,0 0,057245 X
2 75,4 67,2 2,4 0,037776 X X
2 72,0 62,7 2,7 0,040316 X X
3 80,4 68,6 2,3 0,036964 X X X
3 78,5 65,6 2,6 0,038679 X X X
4 81,3 62,6 4,1 0,040366 X X X X
4 80,4 60,8 4,3 0,041301 X X X X
5 82,1 52,2 6,0 0,045637 X X X X X
As a result of this analysis we can say that; Y2 that is determined as rate of loss
is correlated with X2, X3 and X4. Accordingly, the regression analysis is
performed with;
Y2 (Rate of Loss) and X2 (Population Growth Rate)
Y2 (Rate of Loss) and X3 (Rates of Agglomeration)
Y2 (Rate of Loss) and X4 (Population/Total Number of Buildings)
The results of best subsets regression analyses for the third category, that
considers metropolitan cities, shows that X3 (Rates of Agglomeration) and X4
(Population/Total Number of Buildings) are the most effective independent
variables that correlates with both dependent variables.
Five regression analyses are performed according to the results of best subsets
regression analyses for Category III that considers metropolitan cities. These
are;
Regression Analysis: Y1 versus X1,
Y1 versus X3,
Y1 versus X4,
Y2 versus X3 and
Y2 versus X4
5.1.4. Evaluation of Best Subsets Regression Analyses
The results of best subsets regression analyses of top-20 settlements for the first
category, that considers settlements having population up to 50.000, shows that
X1 (settlement population) and X5 (development index) are the most effective
independent variables that correlates with both dependent variables.
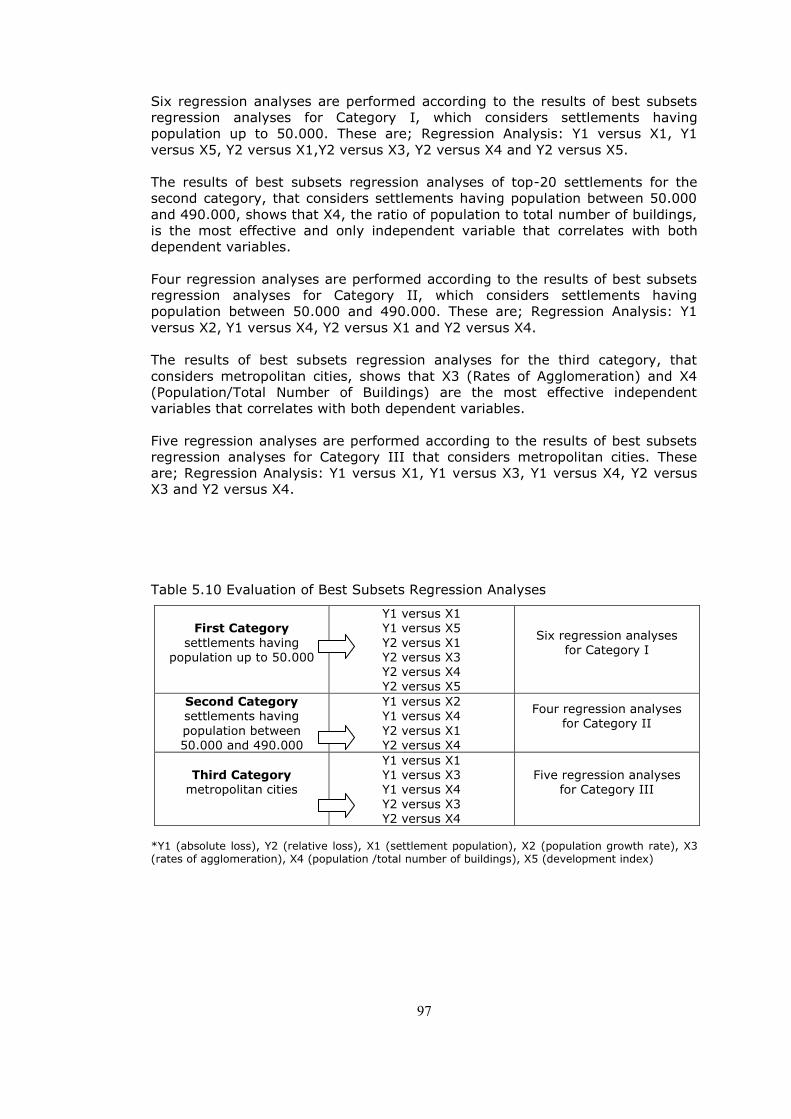
97
Six regression analyses are performed according to the results of best subsets
regression analyses for Category I, which considers settlements having
population up to 50.000. These are; Regression Analysis: Y1 versus X1, Y1
versus X5, Y2 versus X1,Y2 versus X3, Y2 versus X4 and Y2 versus X5.
The results of best subsets regression analyses of top-20 settlements for the
second category, that considers settlements having population between 50.000
and 490.000, shows that X4, the ratio of population to total number of buildings,
is the most effective and only independent variable that correlates with both
dependent variables.
Four regression analyses are performed according to the results of best subsets
regression analyses for Category II, which considers settlements having
population between 50.000 and 490.000. These are; Regression Analysis: Y1
versus X2, Y1 versus X4, Y2 versus X1 and Y2 versus X4.
The results of best subsets regression analyses for the third category, that
considers metropolitan cities, shows that X3 (Rates of Agglomeration) and X4
(Population/Total Number of Buildings) are the most effective independent
variables that correlates with both dependent variables.
Five regression analyses are performed according to the results of best subsets
regression analyses for Category III that considers metropolitan cities. These
are; Regression Analysis: Y1 versus X1, Y1 versus X3, Y1 versus X4, Y2 versus
X3 and Y2 versus X4.
Table 5.10 Evaluation of Best Subsets Regression Analyses
First Category
settlements having population up to 50.000
Y1 versus X1
Y1 versus X5
Y2 versus X1 Y2 versus X3 Y2 versus X4 Y2 versus X5
Six regression analyses for Category I
Second Category settlements having
population between 50.000 and 490.000
Y1 versus X2 Y1 versus X4
Y2 versus X1 Y2 versus X4
Four regression analyses for Category II
Third Category
metropolitan cities
Y1 versus X1 Y1 versus X3 Y1 versus X4
Y2 versus X3 Y2 versus X4
Five regression analyses for Category III
*Y1 (absolute loss), Y2 (relative loss), X1 (settlement population), X2 (population growth rate), X3 (rates of agglomeration), X4 (population /total number of buildings), X5 (development index)
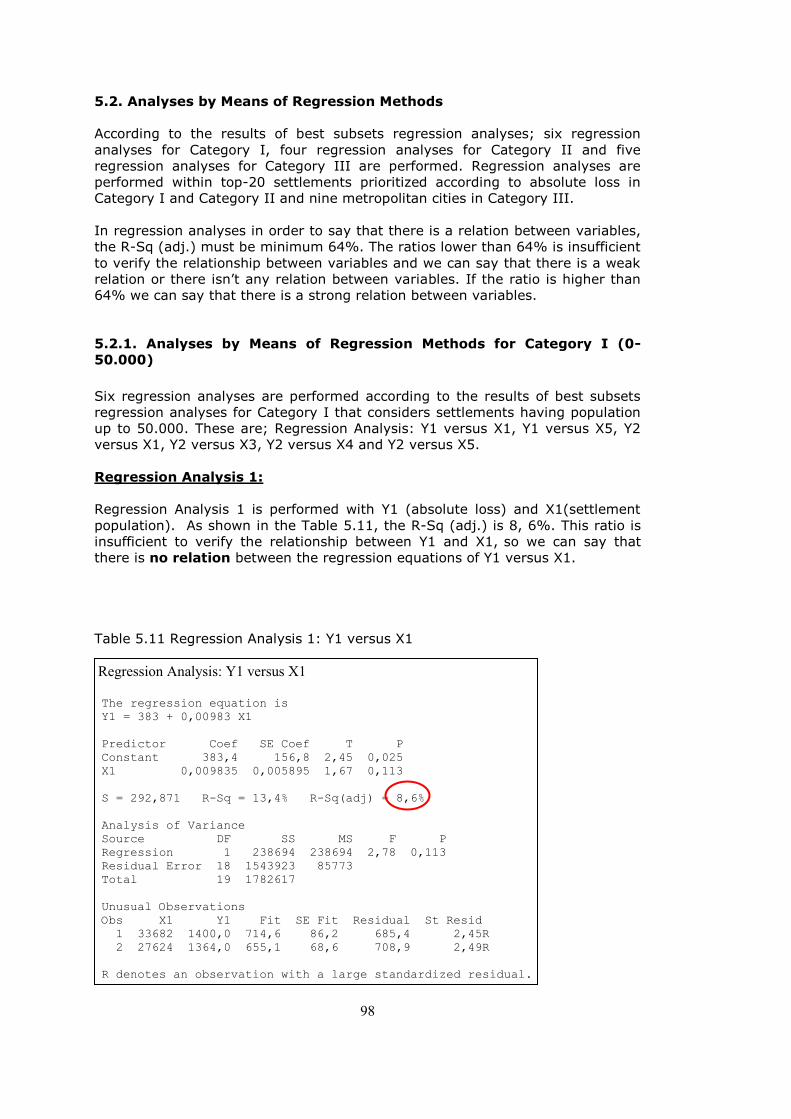
98
5.2. Analyses by Means of Regression Methods
According to the results of best subsets regression analyses; six regression
analyses for Category I, four regression analyses for Category II and five
regression analyses for Category III are performed. Regression analyses are
performed within top-20 settlements prioritized according to absolute loss in
Category I and Category II and nine metropolitan cities in Category III.
In regression analyses in order to say that there is a relation between variables,
the R-Sq (adj.) must be minimum 64%. The ratios lower than 64% is insufficient
to verify the relationship between variables and we can say that there is a weak
relation or there isn‘t any relation between variables. If the ratio is higher than
64% we can say that there is a strong relation between variables.
5.2.1. Analyses by Means of Regression Methods for Category I (0-
50.000)
Six regression analyses are performed according to the results of best subsets
regression analyses for Category I that considers settlements having population
up to 50.000. These are; Regression Analysis: Y1 versus X1, Y1 versus X5, Y2
versus X1, Y2 versus X3, Y2 versus X4 and Y2 versus X5.
Regression Analysis 1:
Regression Analysis 1 is performed with Y1 (absolute loss) and X1(settlement
population). As shown in the Table 5.11, the R-Sq (adj.) is 8, 6%. This ratio is
insufficient to verify the relationship between Y1 and X1, so we can say that
there is no relation between the regression equations of Y1 versus X1.
Table 5.11 Regression Analysis 1: Y1 versus X1 Regression Analysis: Y1 versus X1 The regression equation is
Y1 = 383 + 0,00983 X1
Predictor Coef SE Coef T P
Constant 383,4 156,8 2,45 0,025
X1 0,009835 0,005895 1,67 0,113
S = 292,871 R-Sq = 13,4% R-Sq(adj) = 8,6%
Analysis of Variance
Source DF SS MS F P
Regression 1 238694 238694 2,78 0,113
Residual Error 18 1543923 85773
Total 19 1782617
Unusual Observations
Obs X1 Y1 Fit SE Fit Residual St Resid
1 33682 1400,0 714,6 86,2 685,4 2,45R
2 27624 1364,0 655,1 68,6 708,9 2,49R
R denotes an observation with a large standardized residual.
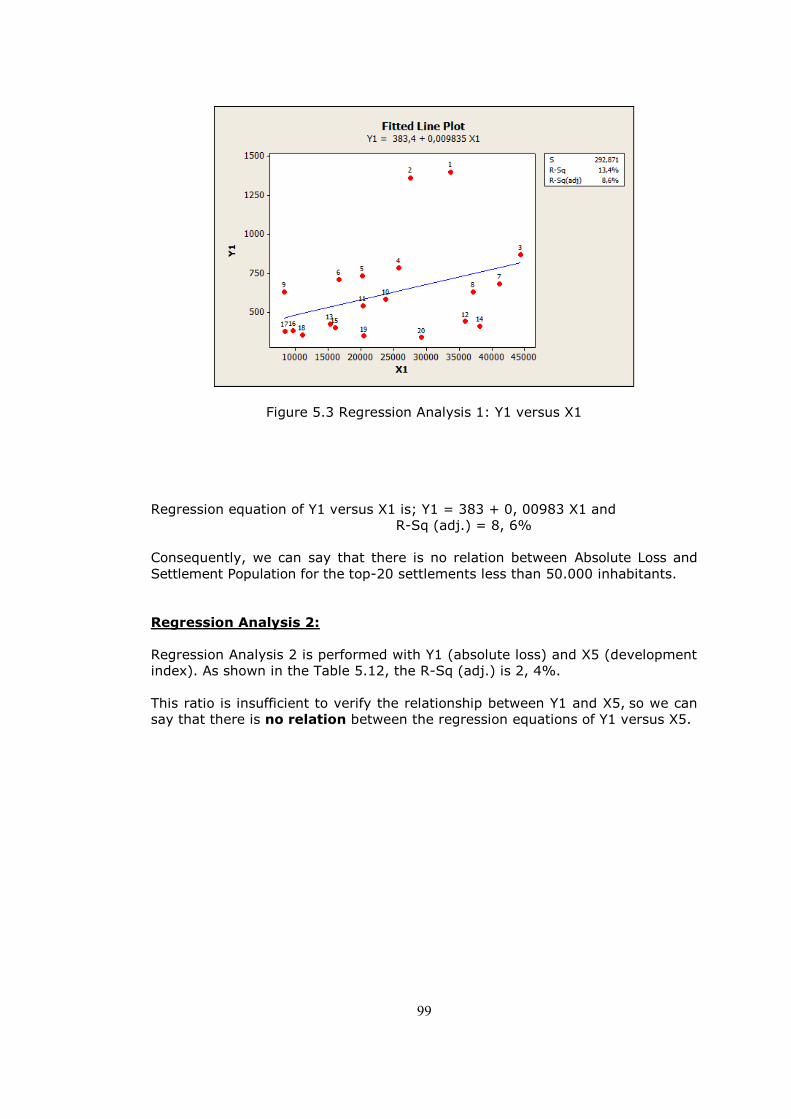
99
Figure 5.3 Regression Analysis 1: Y1 versus X1
Regression equation of Y1 versus X1 is; Y1 = 383 + 0, 00983 X1 and
R-Sq (adj.) = 8, 6%
Consequently, we can say that there is no relation between Absolute Loss and
Settlement Population for the top-20 settlements less than 50.000 inhabitants.
Regression Analysis 2:
Regression Analysis 2 is performed with Y1 (absolute loss) and X5 (development
index). As shown in the Table 5.12, the R-Sq (adj.) is 2, 4%.
This ratio is insufficient to verify the relationship between Y1 and X5, so we can
say that there is no relation between the regression equations of Y1 versus X5.
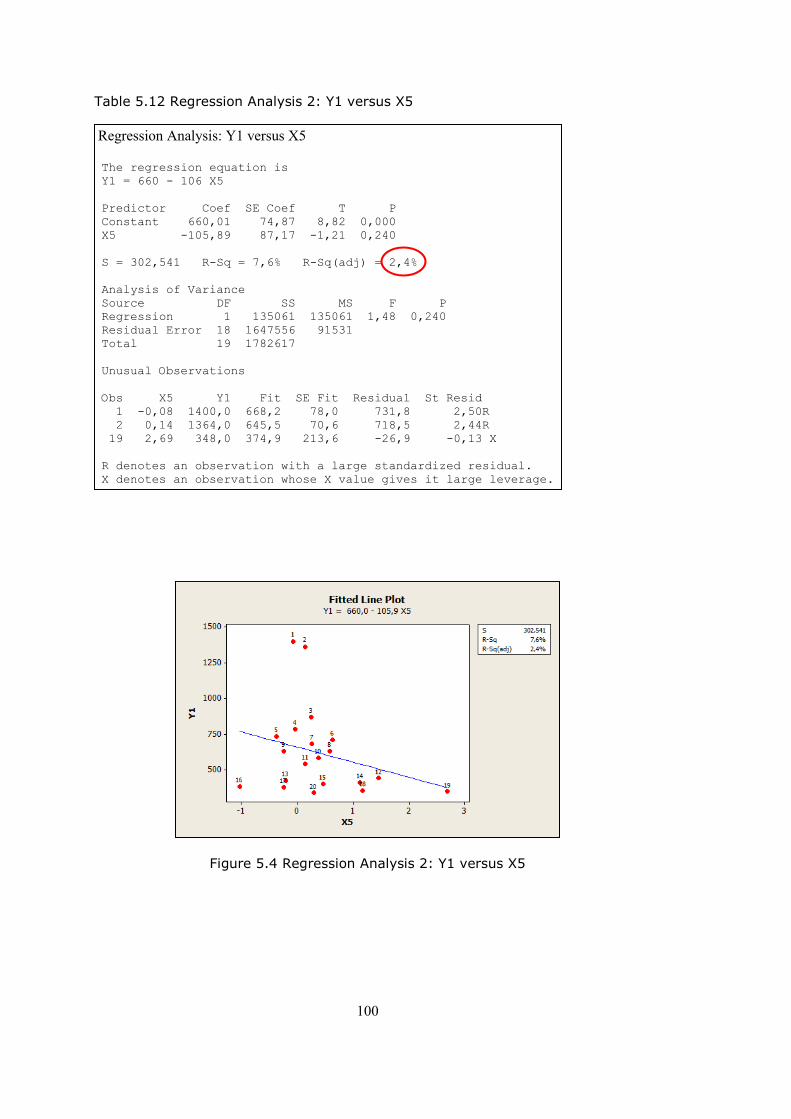
100
Table 5.12 Regression Analysis 2: Y1 versus X5
Regression Analysis: Y1 versus X5 The regression equation is
Y1 = 660 - 106 X5
Predictor Coef SE Coef T P
Constant 660,01 74,87 8,82 0,000
X5 -105,89 87,17 -1,21 0,240
S = 302,541 R-Sq = 7,6% R-Sq(adj) = 2,4%
Analysis of Variance
Source DF SS MS F P
Regression 1 135061 135061 1,48 0,240
Residual Error 18 1647556 91531
Total 19 1782617
Unusual Observations
Obs X5 Y1 Fit SE Fit Residual St Resid
1 -0,08 1400,0 668,2 78,0 731,8 2,50R
2 0,14 1364,0 645,5 70,6 718,5 2,44R
19 2,69 348,0 374,9 213,6 -26,9 -0,13 X
R denotes an observation with a large standardized residual.
X denotes an observation whose X value gives it large leverage.
Figure 5.4 Regression Analysis 2: Y1 versus X5
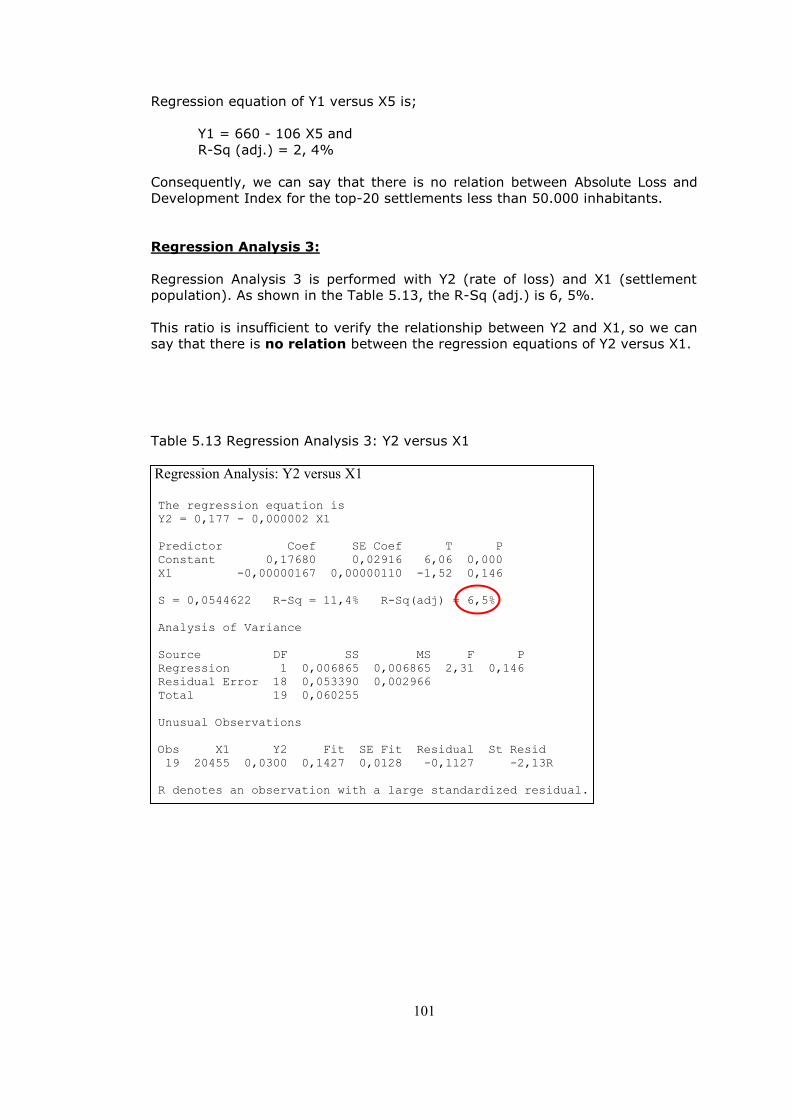
101
Regression equation of Y1 versus X5 is;
Y1 = 660 - 106 X5 and
R-Sq (adj.) = 2, 4%
Consequently, we can say that there is no relation between Absolute Loss and
Development Index for the top-20 settlements less than 50.000 inhabitants.
Regression Analysis 3:
Regression Analysis 3 is performed with Y2 (rate of loss) and X1 (settlement
population). As shown in the Table 5.13, the R-Sq (adj.) is 6, 5%.
This ratio is insufficient to verify the relationship between Y2 and X1, so we can
say that there is no relation between the regression equations of Y2 versus X1.
Table 5.13 Regression Analysis 3: Y2 versus X1
Regression Analysis: Y2 versus X1 The regression equation is
Y2 = 0,177 - 0,000002 X1
Predictor Coef SE Coef T P
Constant 0,17680 0,02916 6,06 0,000
X1 -0,00000167 0,00000110 -1,52 0,146
S = 0,0544622 R-Sq = 11,4% R-Sq(adj) = 6,5%
Analysis of Variance
Source DF SS MS F P
Regression 1 0,006865 0,006865 2,31 0,146
Residual Error 18 0,053390 0,002966
Total 19 0,060255
Unusual Observations
Obs X1 Y2 Fit SE Fit Residual St Resid
19 20455 0,0300 0,1427 0,0128 -0,1127 -2,13R
R denotes an observation with a large standardized residual.
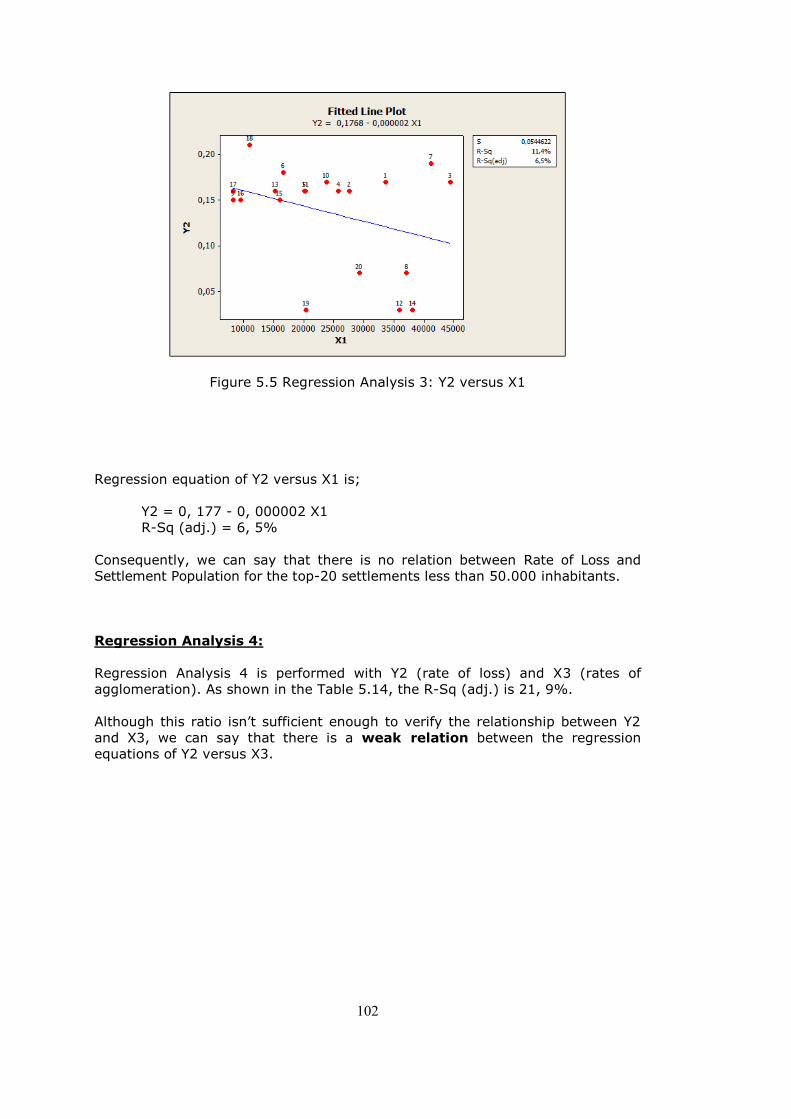
102
Figure 5.5 Regression Analysis 3: Y2 versus X1
Regression equation of Y2 versus X1 is;
Y2 = 0, 177 - 0, 000002 X1
R-Sq (adj.) = 6, 5%
Consequently, we can say that there is no relation between Rate of Loss and
Settlement Population for the top-20 settlements less than 50.000 inhabitants.
Regression Analysis 4:
Regression Analysis 4 is performed with Y2 (rate of loss) and X3 (rates of
agglomeration). As shown in the Table 5.14, the R-Sq (adj.) is 21, 9%.
Although this ratio isn‘t sufficient enough to verify the relationship between Y2
and X3, we can say that there is a weak relation between the regression
equations of Y2 versus X3.
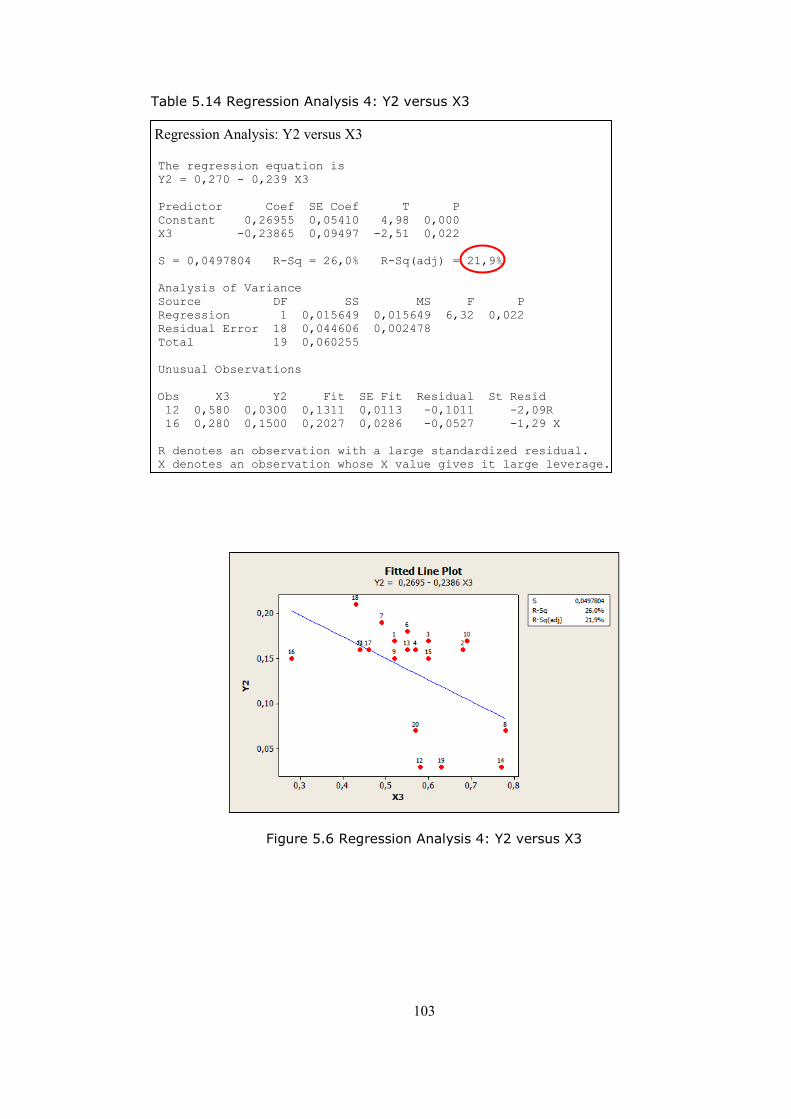
103
Table 5.14 Regression Analysis 4: Y2 versus X3 Regression Analysis: Y2 versus X3 The regression equation is
Y2 = 0,270 - 0,239 X3
Predictor Coef SE Coef T P
Constant 0,26955 0,05410 4,98 0,000
X3 -0,23865 0,09497 -2,51 0,022
S = 0,0497804 R-Sq = 26,0% R-Sq(adj) = 21,9%
Analysis of Variance
Source DF SS MS F P
Regression 1 0,015649 0,015649 6,32 0,022
Residual Error 18 0,044606 0,002478
Total 19 0,060255
Unusual Observations
Obs X3 Y2 Fit SE Fit Residual St Resid
12 0,580 0,0300 0,1311 0,0113 -0,1011 -2,09R
16 0,280 0,1500 0,2027 0,0286 -0,0527 -1,29 X
R denotes an observation with a large standardized residual.
X denotes an observation whose X value gives it large leverage.
Figure 5.6 Regression Analysis 4: Y2 versus X3
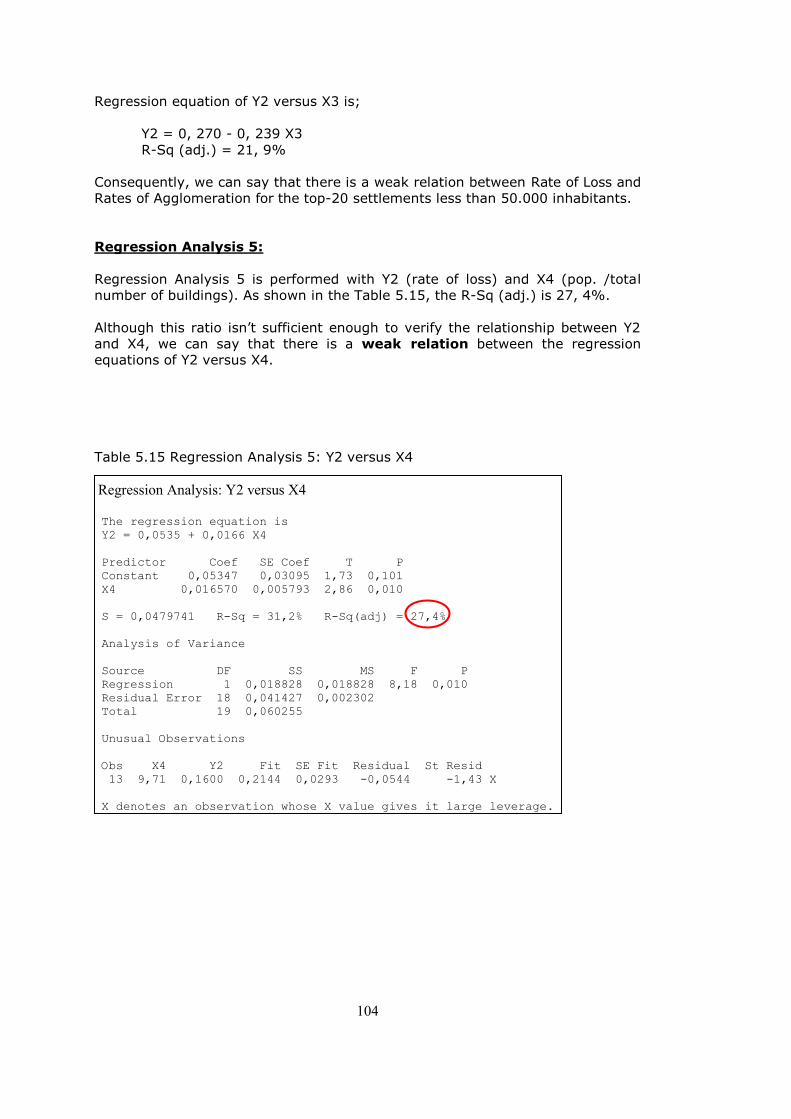
104
Regression equation of Y2 versus X3 is;
Y2 = 0, 270 - 0, 239 X3
R-Sq (adj.) = 21, 9%
Consequently, we can say that there is a weak relation between Rate of Loss and
Rates of Agglomeration for the top-20 settlements less than 50.000 inhabitants.
Regression Analysis 5:
Regression Analysis 5 is performed with Y2 (rate of loss) and X4 (pop. /total
number of buildings). As shown in the Table 5.15, the R-Sq (adj.) is 27, 4%.
Although this ratio isn‘t sufficient enough to verify the relationship between Y2
and X4, we can say that there is a weak relation between the regression
equations of Y2 versus X4.
Table 5.15 Regression Analysis 5: Y2 versus X4 Regression Analysis: Y2 versus X4 The regression equation is
Y2 = 0,0535 + 0,0166 X4
Predictor Coef SE Coef T P
Constant 0,05347 0,03095 1,73 0,101
X4 0,016570 0,005793 2,86 0,010
S = 0,0479741 R-Sq = 31,2% R-Sq(adj) = 27,4%
Analysis of Variance
Source DF SS MS F P
Regression 1 0,018828 0,018828 8,18 0,010
Residual Error 18 0,041427 0,002302
Total 19 0,060255
Unusual Observations
Obs X4 Y2 Fit SE Fit Residual St Resid
13 9,71 0,1600 0,2144 0,0293 -0,0544 -1,43 X
X denotes an observation whose X value gives it large leverage.
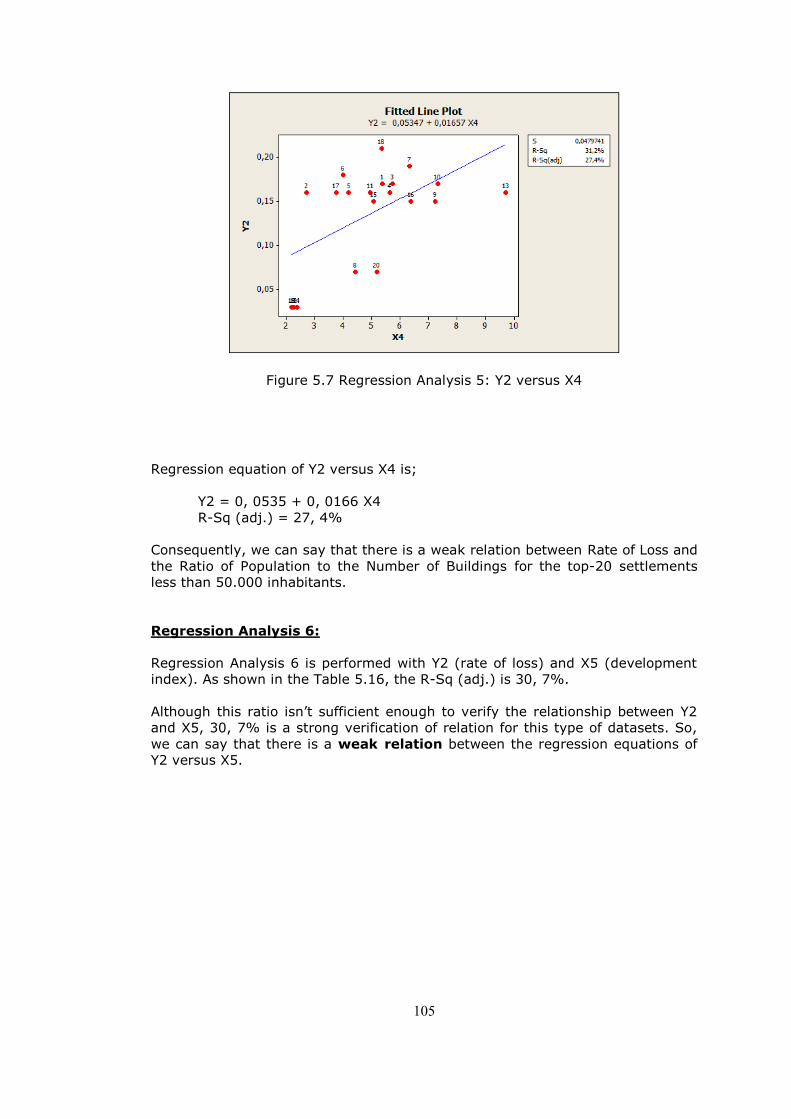
105
Figure 5.7 Regression Analysis 5: Y2 versus X4
Regression equation of Y2 versus X4 is;
Y2 = 0, 0535 + 0, 0166 X4
R-Sq (adj.) = 27, 4%
Consequently, we can say that there is a weak relation between Rate of Loss and
the Ratio of Population to the Number of Buildings for the top-20 settlements
less than 50.000 inhabitants.
Regression Analysis 6:
Regression Analysis 6 is performed with Y2 (rate of loss) and X5 (development
index). As shown in the Table 5.16, the R-Sq (adj.) is 30, 7%.
Although this ratio isn‘t sufficient enough to verify the relationship between Y2
and X5, 30, 7% is a strong verification of relation for this type of datasets. So,
we can say that there is a weak relation between the regression equations of
Y2 versus X5.
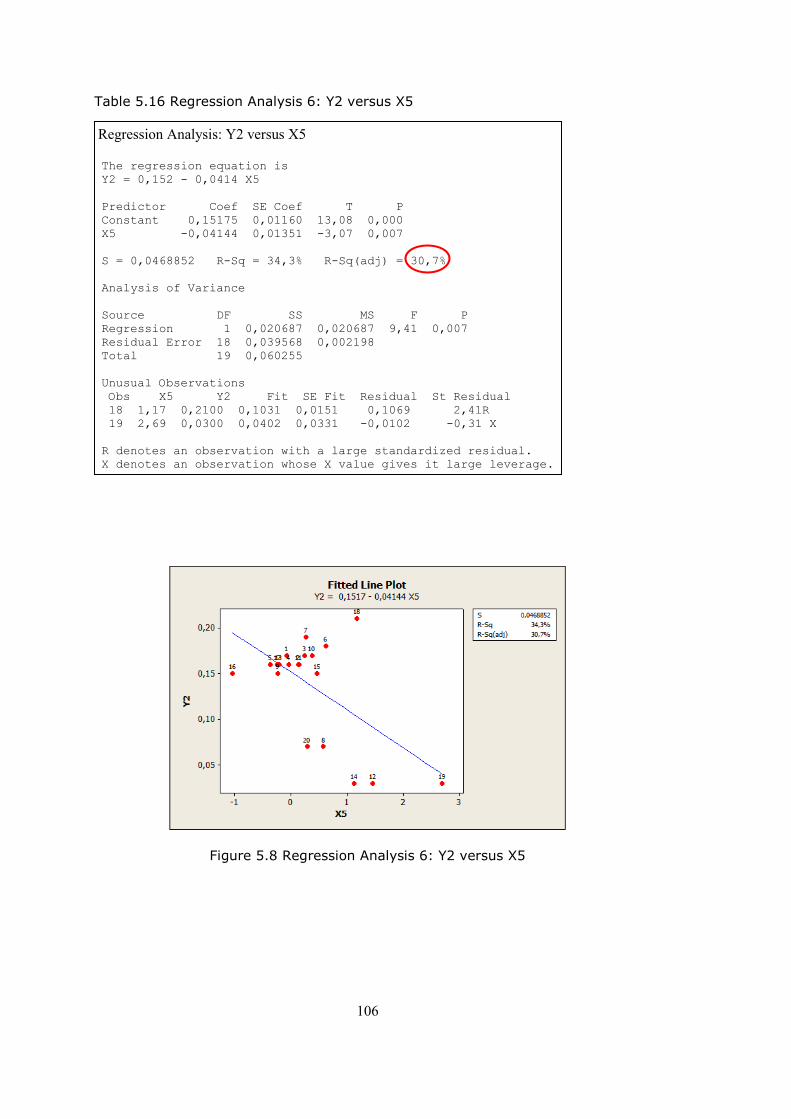
106
Table 5.16 Regression Analysis 6: Y2 versus X5 Regression Analysis: Y2 versus X5 The regression equation is
Y2 = 0,152 - 0,0414 X5
Predictor Coef SE Coef T P
Constant 0,15175 0,01160 13,08 0,000
X5 -0,04144 0,01351 -3,07 0,007
S = 0,0468852 R-Sq = 34,3% R-Sq(adj) = 30,7%
Analysis of Variance
Source DF SS MS F P
Regression 1 0,020687 0,020687 9,41 0,007
Residual Error 18 0,039568 0,002198
Total 19 0,060255
Unusual Observations
Obs X5 Y2 Fit SE Fit Residual St Residual
18 1,17 0,2100 0,1031 0,0151 0,1069 2,41R
19 2,69 0,0300 0,0402 0,0331 -0,0102 -0,31 X
R denotes an observation with a large standardized residual.
X denotes an observation whose X value gives it large leverage.
Figure 5.8 Regression Analysis 6: Y2 versus X5
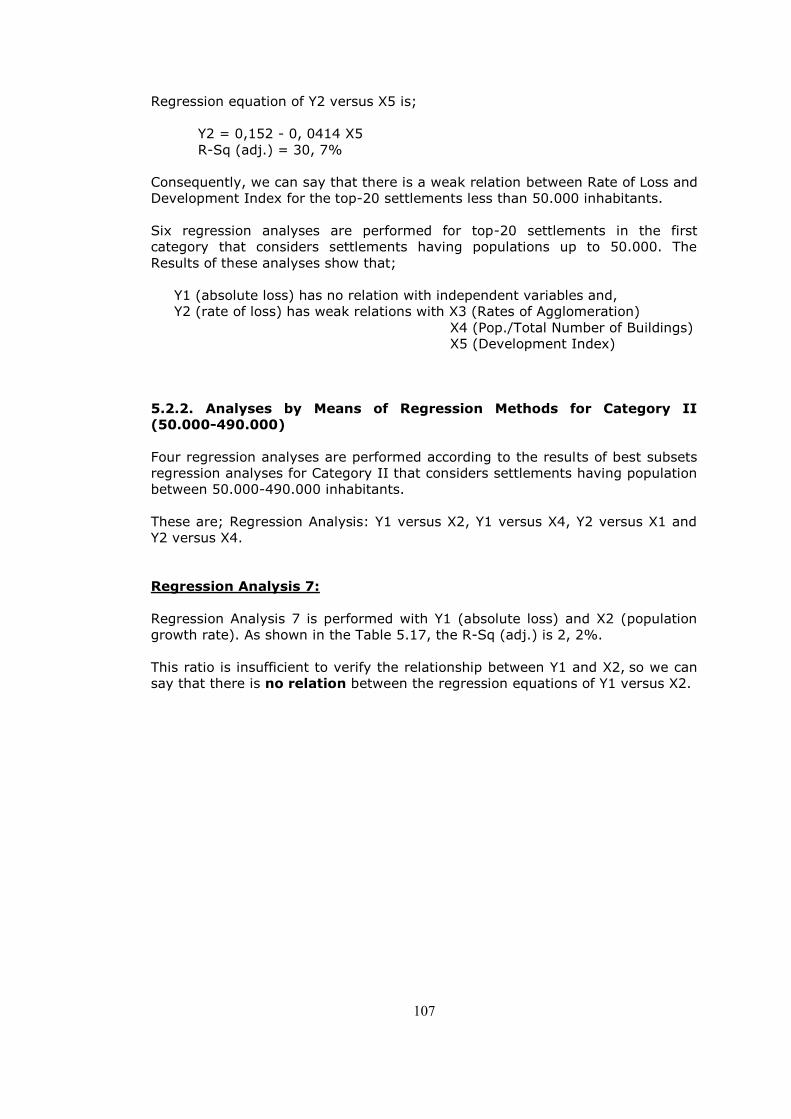
107
Regression equation of Y2 versus X5 is;
Y2 = 0,152 - 0, 0414 X5
R-Sq (adj.) = 30, 7%
Consequently, we can say that there is a weak relation between Rate of Loss and
Development Index for the top-20 settlements less than 50.000 inhabitants.
Six regression analyses are performed for top-20 settlements in the first
category that considers settlements having populations up to 50.000. The
Results of these analyses show that;
Y1 (absolute loss) has no relation with independent variables and,
Y2 (rate of loss) has weak relations with X3 (Rates of Agglomeration)
X4 (Pop./Total Number of Buildings)
X5 (Development Index)
5.2.2. Analyses by Means of Regression Methods for Category II
(50.000-490.000)
Four regression analyses are performed according to the results of best subsets
regression analyses for Category II that considers settlements having population
between 50.000-490.000 inhabitants.
These are; Regression Analysis: Y1 versus X2, Y1 versus X4, Y2 versus X1 and
Y2 versus X4.
Regression Analysis 7:
Regression Analysis 7 is performed with Y1 (absolute loss) and X2 (population
growth rate). As shown in the Table 5.17, the R-Sq (adj.) is 2, 2%.
This ratio is insufficient to verify the relationship between Y1 and X2, so we can
say that there is no relation between the regression equations of Y1 versus X2.
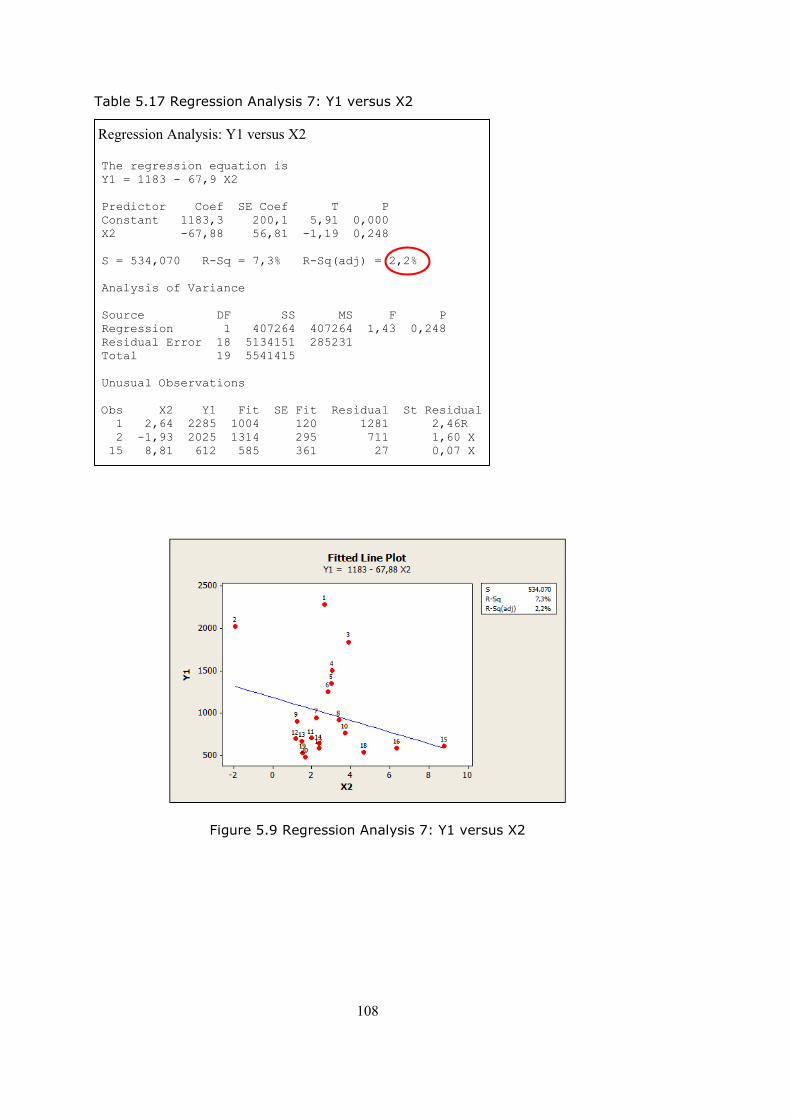
108
Table 5.17 Regression Analysis 7: Y1 versus X2 Regression Analysis: Y1 versus X2 The regression equation is
Y1 = 1183 - 67,9 X2
Predictor Coef SE Coef T P
Constant 1183,3 200,1 5,91 0,000
X2 -67,88 56,81 -1,19 0,248
S = 534,070 R-Sq = 7,3% R-Sq(adj) = 2,2%
Analysis of Variance
Source DF SS MS F P
Regression 1 407264 407264 1,43 0,248
Residual Error 18 5134151 285231
Total 19 5541415
Unusual Observations
Obs X2 Y1 Fit SE Fit Residual St Residual
1 2,64 2285 1004 120 1281 2,46R
2 -1,93 2025 1314 295 711 1,60 X
15 8,81 612 585 361 27 0,07 X
Figure 5.9 Regression Analysis 7: Y1 versus X2
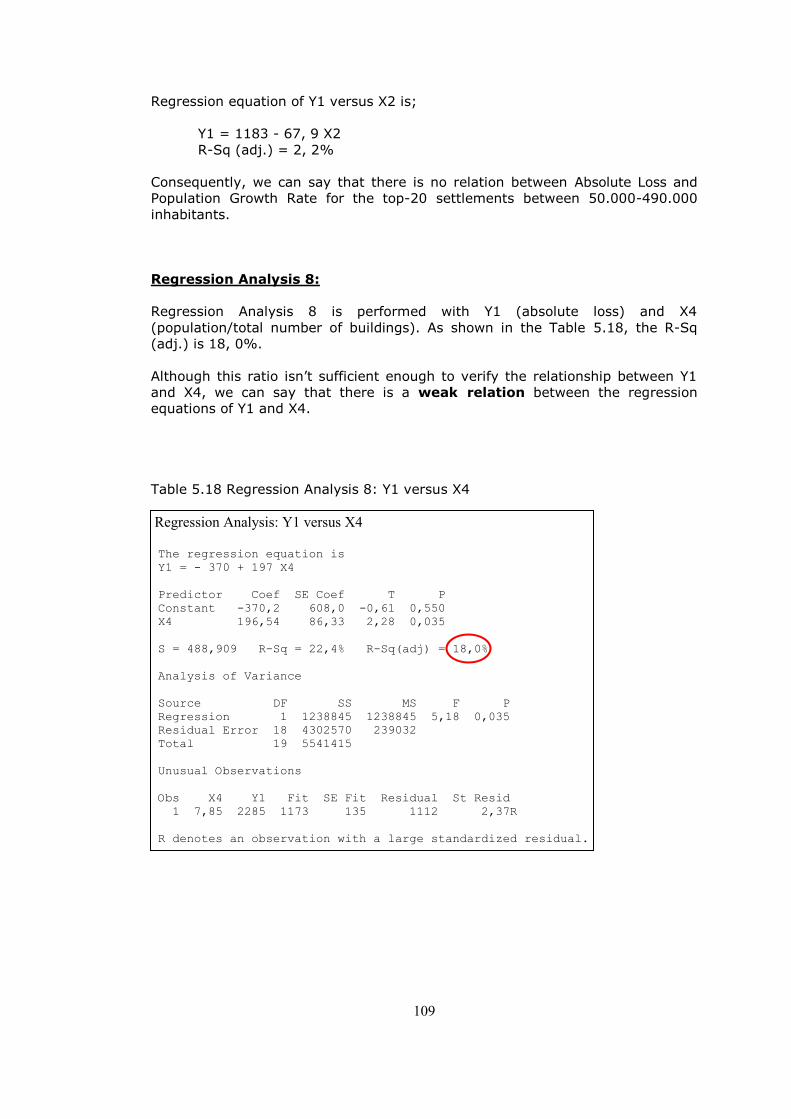
109
Regression equation of Y1 versus X2 is;
Y1 = 1183 - 67, 9 X2
R-Sq (adj.) = 2, 2%
Consequently, we can say that there is no relation between Absolute Loss and
Population Growth Rate for the top-20 settlements between 50.000-490.000
inhabitants.
Regression Analysis 8:
Regression Analysis 8 is performed with Y1 (absolute loss) and X4
(population/total number of buildings). As shown in the Table 5.18, the R-Sq
(adj.) is 18, 0%.
Although this ratio isn‘t sufficient enough to verify the relationship between Y1
and X4, we can say that there is a weak relation between the regression
equations of Y1 and X4.
Table 5.18 Regression Analysis 8: Y1 versus X4
Regression Analysis: Y1 versus X4 The regression equation is
Y1 = - 370 + 197 X4
Predictor Coef SE Coef T P
Constant -370,2 608,0 -0,61 0,550
X4 196,54 86,33 2,28 0,035
S = 488,909 R-Sq = 22,4% R-Sq(adj) = 18,0%
Analysis of Variance
Source DF SS MS F P
Regression 1 1238845 1238845 5,18 0,035
Residual Error 18 4302570 239032
Total 19 5541415
Unusual Observations
Obs X4 Y1 Fit SE Fit Residual St Resid
1 7,85 2285 1173 135 1112 2,37R
R denotes an observation with a large standardized residual.
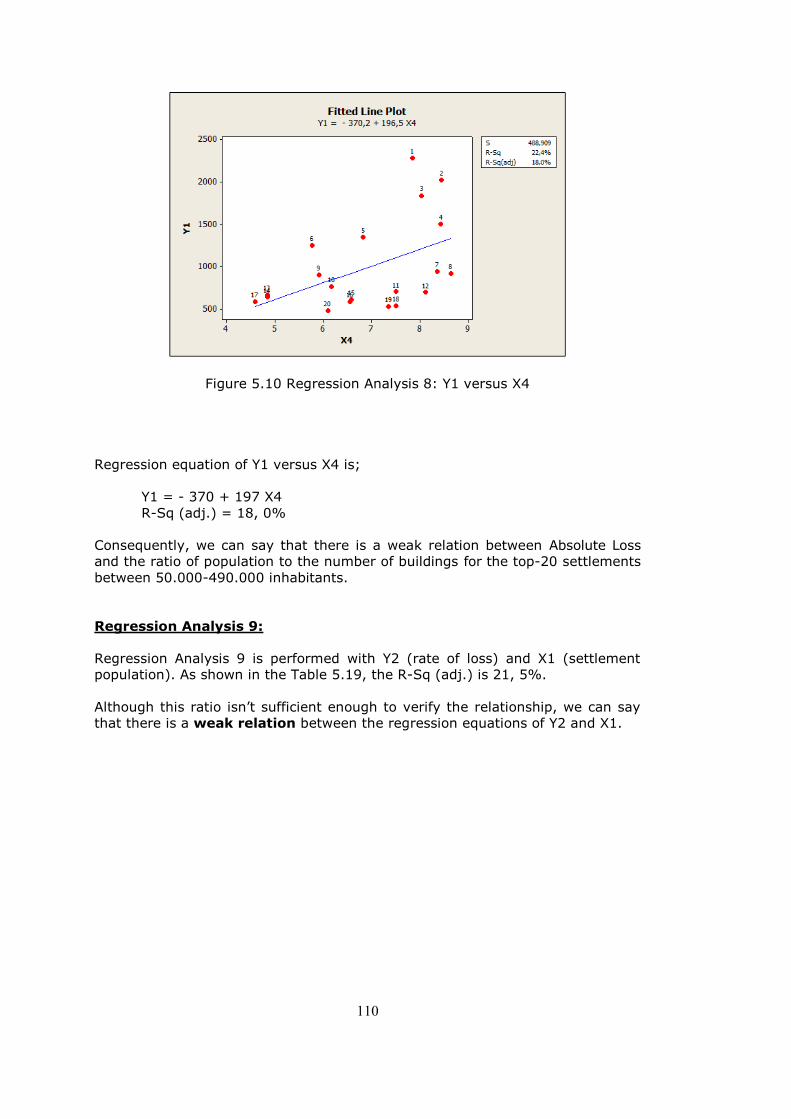
110
Figure 5.10 Regression Analysis 8: Y1 versus X4
Regression equation of Y1 versus X4 is;
Y1 = - 370 + 197 X4
R-Sq (adj.) = 18, 0%
Consequently, we can say that there is a weak relation between Absolute Loss
and the ratio of population to the number of buildings for the top-20 settlements
between 50.000-490.000 inhabitants.
Regression Analysis 9:
Regression Analysis 9 is performed with Y2 (rate of loss) and X1 (settlement
population). As shown in the Table 5.19, the R-Sq (adj.) is 21, 5%.
Although this ratio isn‘t sufficient enough to verify the relationship, we can say
that there is a weak relation between the regression equations of Y2 and X1.
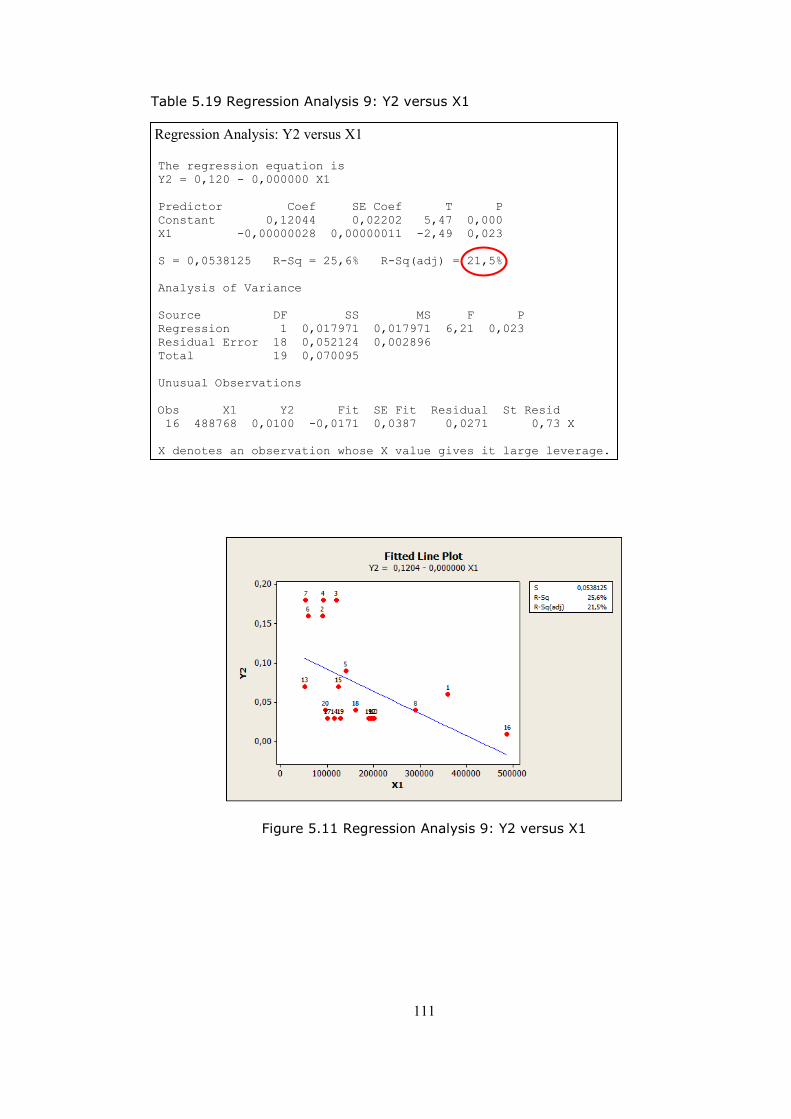
111
Table 5.19 Regression Analysis 9: Y2 versus X1
Regression Analysis: Y2 versus X1 The regression equation is
Y2 = 0,120 - 0,000000 X1
Predictor Coef SE Coef T P
Constant 0,12044 0,02202 5,47 0,000
X1 -0,00000028 0,00000011 -2,49 0,023
S = 0,0538125 R-Sq = 25,6% R-Sq(adj) = 21,5%
Analysis of Variance
Source DF SS MS F P
Regression 1 0,017971 0,017971 6,21 0,023
Residual Error 18 0,052124 0,002896
Total 19 0,070095
Unusual Observations
Obs X1 Y2 Fit SE Fit Residual St Resid
16 488768 0,0100 -0,0171 0,0387 0,0271 0,73 X
X denotes an observation whose X value gives it large leverage.
Figure 5.11 Regression Analysis 9: Y2 versus X1
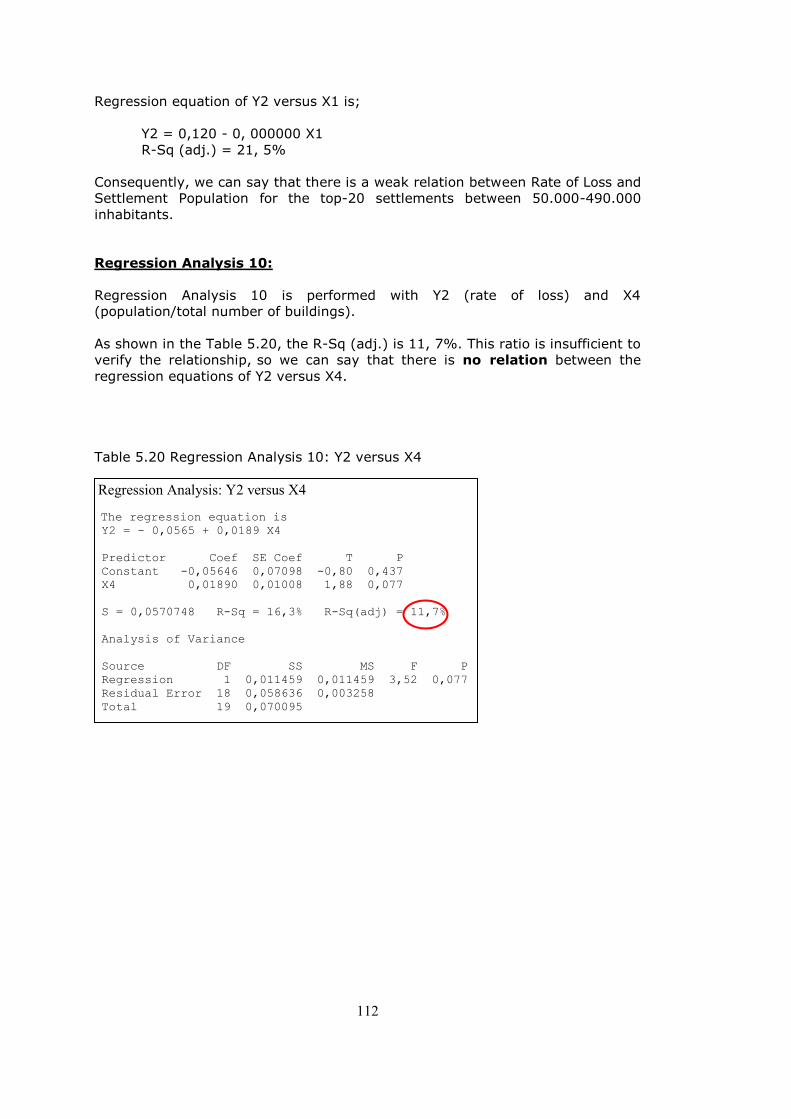
112
Regression equation of Y2 versus X1 is;
Y2 = 0,120 - 0, 000000 X1
R-Sq (adj.) = 21, 5%
Consequently, we can say that there is a weak relation between Rate of Loss and
Settlement Population for the top-20 settlements between 50.000-490.000
inhabitants.
Regression Analysis 10:
Regression Analysis 10 is performed with Y2 (rate of loss) and X4
(population/total number of buildings).
As shown in the Table 5.20, the R-Sq (adj.) is 11, 7%. This ratio is insufficient to
verify the relationship, so we can say that there is no relation between the
regression equations of Y2 versus X4.
Table 5.20 Regression Analysis 10: Y2 versus X4
Regression Analysis: Y2 versus X4
The regression equation is
Y2 = - 0,0565 + 0,0189 X4
Predictor Coef SE Coef T P
Constant -0,05646 0,07098 -0,80 0,437
X4 0,01890 0,01008 1,88 0,077
S = 0,0570748 R-Sq = 16,3% R-Sq(adj) = 11,7%
Analysis of Variance
Source DF SS MS F P
Regression 1 0,011459 0,011459 3,52 0,077
Residual Error 18 0,058636 0,003258
Total 19 0,070095
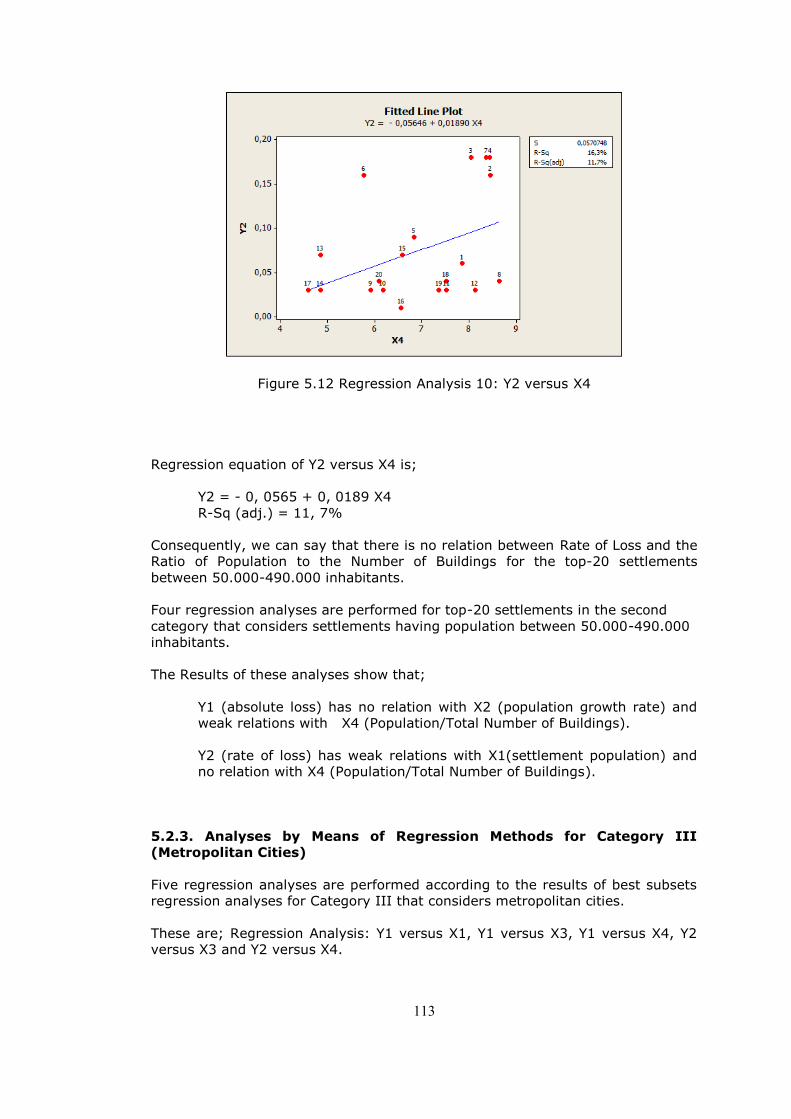
113
Figure 5.12 Regression Analysis 10: Y2 versus X4
Regression equation of Y2 versus X4 is;
Y2 = - 0, 0565 + 0, 0189 X4
R-Sq (adj.) = 11, 7%
Consequently, we can say that there is no relation between Rate of Loss and the
Ratio of Population to the Number of Buildings for the top-20 settlements
between 50.000-490.000 inhabitants.
Four regression analyses are performed for top-20 settlements in the second
category that considers settlements having population between 50.000-490.000
inhabitants.
The Results of these analyses show that;
Y1 (absolute loss) has no relation with X2 (population growth rate) and
weak relations with X4 (Population/Total Number of Buildings).
Y2 (rate of loss) has weak relations with X1(settlement population) and
no relation with X4 (Population/Total Number of Buildings).
5.2.3. Analyses by Means of Regression Methods for Category III
(Metropolitan Cities)
Five regression analyses are performed according to the results of best subsets
regression analyses for Category III that considers metropolitan cities.
These are; Regression Analysis: Y1 versus X1, Y1 versus X3, Y1 versus X4, Y2
versus X3 and Y2 versus X4.
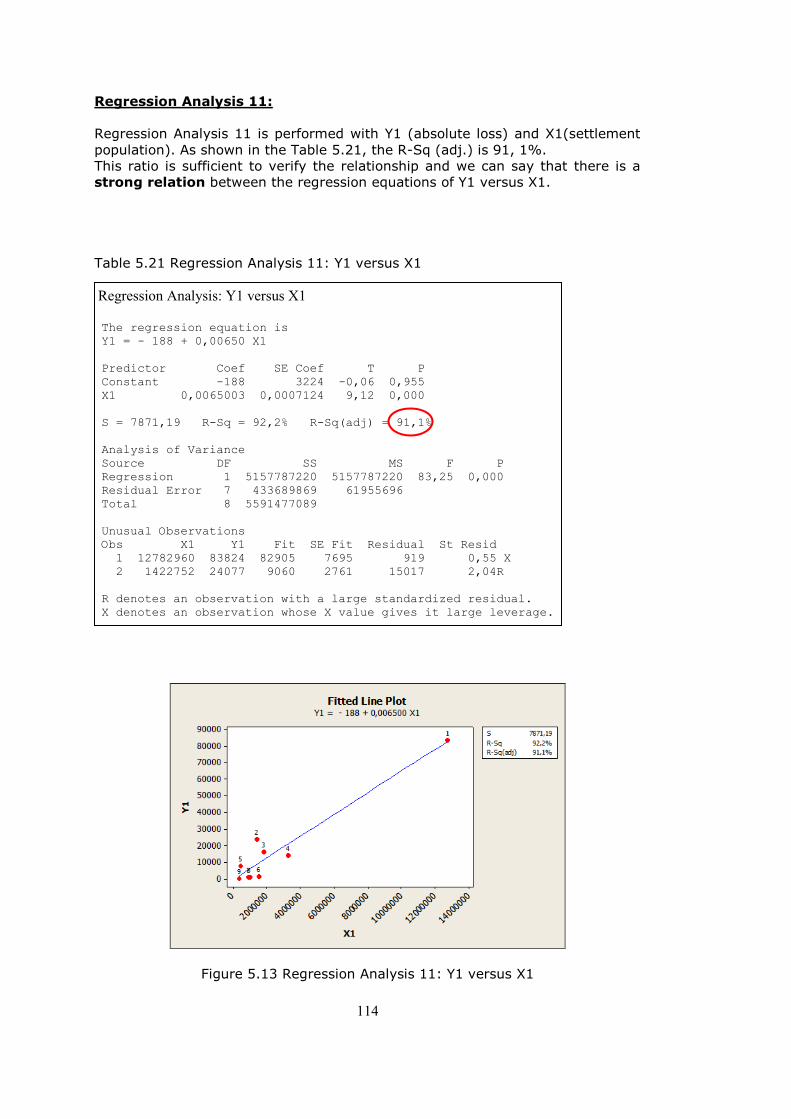
114
Regression Analysis 11:
Regression Analysis 11 is performed with Y1 (absolute loss) and X1(settlement
population). As shown in the Table 5.21, the R-Sq (adj.) is 91, 1%.
This ratio is sufficient to verify the relationship and we can say that there is a
strong relation between the regression equations of Y1 versus X1.
Table 5.21 Regression Analysis 11: Y1 versus X1 Regression Analysis: Y1 versus X1 The regression equation is
Y1 = - 188 + 0,00650 X1
Predictor Coef SE Coef T P
Constant -188 3224 -0,06 0,955
X1 0,0065003 0,0007124 9,12 0,000
S = 7871,19 R-Sq = 92,2% R-Sq(adj) = 91,1%
Analysis of Variance
Source DF SS MS F P
Regression 1 5157787220 5157787220 83,25 0,000
Residual Error 7 433689869 61955696
Total 8 5591477089
Unusual Observations
Obs X1 Y1 Fit SE Fit Residual St Resid
1 12782960 83824 82905 7695 919 0,55 X
2 1422752 24077 9060 2761 15017 2,04R
R denotes an observation with a large standardized residual.
X denotes an observation whose X value gives it large leverage.
Figure 5.13 Regression Analysis 11: Y1 versus X1
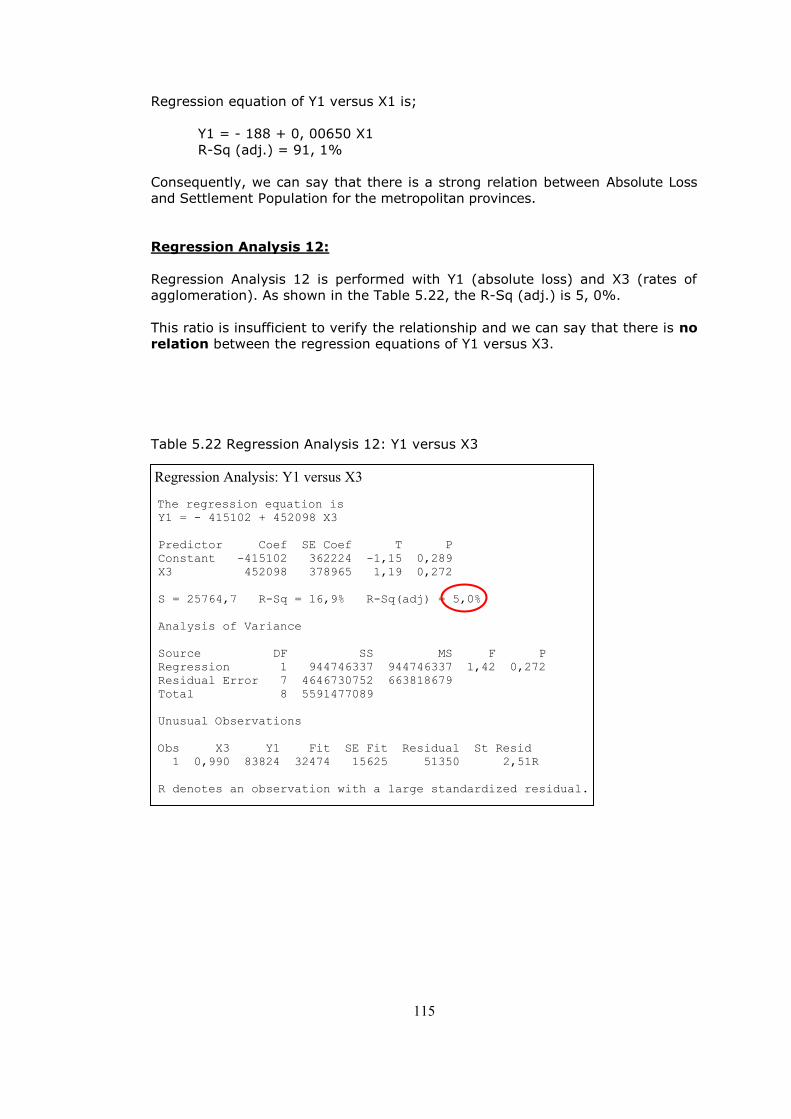
115
Regression equation of Y1 versus X1 is;
Y1 = - 188 + 0, 00650 X1
R-Sq (adj.) = 91, 1%
Consequently, we can say that there is a strong relation between Absolute Loss
and Settlement Population for the metropolitan provinces.
Regression Analysis 12:
Regression Analysis 12 is performed with Y1 (absolute loss) and X3 (rates of
agglomeration). As shown in the Table 5.22, the R-Sq (adj.) is 5, 0%.
This ratio is insufficient to verify the relationship and we can say that there is no
relation between the regression equations of Y1 versus X3. Table 5.22 Regression Analysis 12: Y1 versus X3
Regression Analysis: Y1 versus X3
The regression equation is
Y1 = - 415102 + 452098 X3
Predictor Coef SE Coef T P
Constant -415102 362224 -1,15 0,289
X3 452098 378965 1,19 0,272
S = 25764,7 R-Sq = 16,9% R-Sq(adj) = 5,0%
Analysis of Variance
Source DF SS MS F P
Regression 1 944746337 944746337 1,42 0,272
Residual Error 7 4646730752 663818679
Total 8 5591477089
Unusual Observations
Obs X3 Y1 Fit SE Fit Residual St Resid
1 0,990 83824 32474 15625 51350 2,51R
R denotes an observation with a large standardized residual.
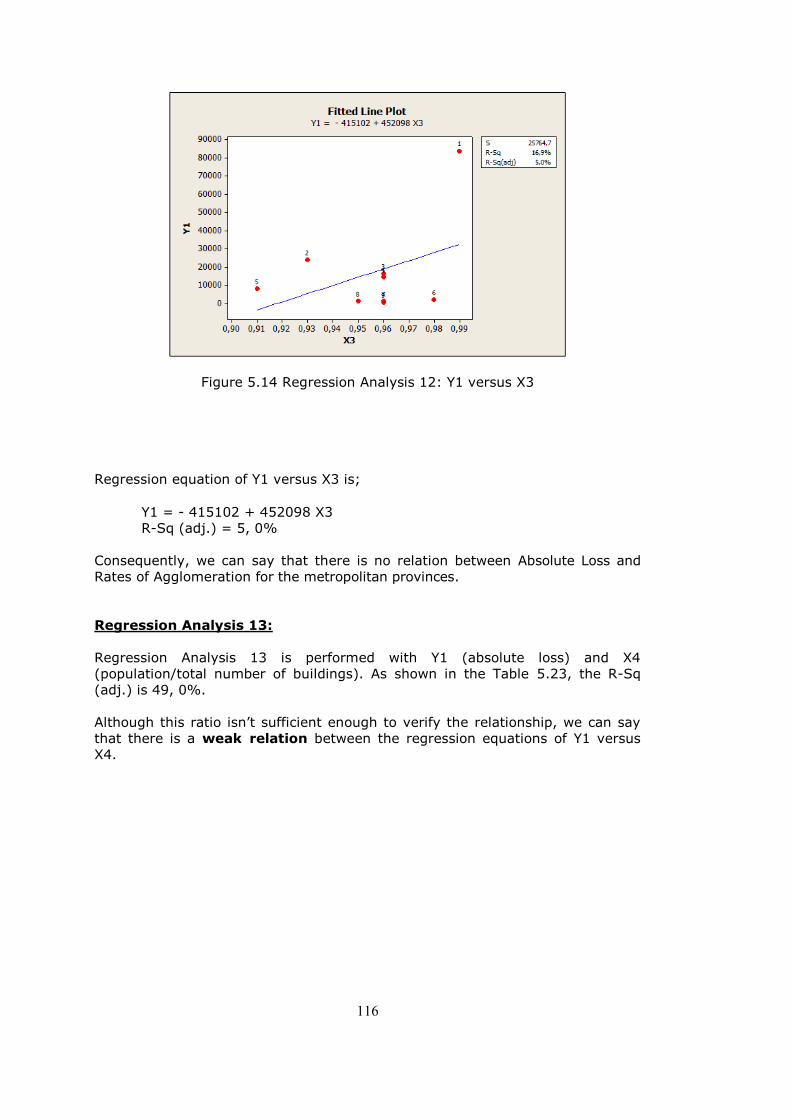
116
Figure 5.14 Regression Analysis 12: Y1 versus X3
Regression equation of Y1 versus X3 is; Y1 = - 415102 + 452098 X3
R-Sq (adj.) = 5, 0%
Consequently, we can say that there is no relation between Absolute Loss and
Rates of Agglomeration for the metropolitan provinces.
Regression Analysis 13:
Regression Analysis 13 is performed with Y1 (absolute loss) and X4
(population/total number of buildings). As shown in the Table 5.23, the R-Sq
(adj.) is 49, 0%.
Although this ratio isn‘t sufficient enough to verify the relationship, we can say
that there is a weak relation between the regression equations of Y1 versus
X4.
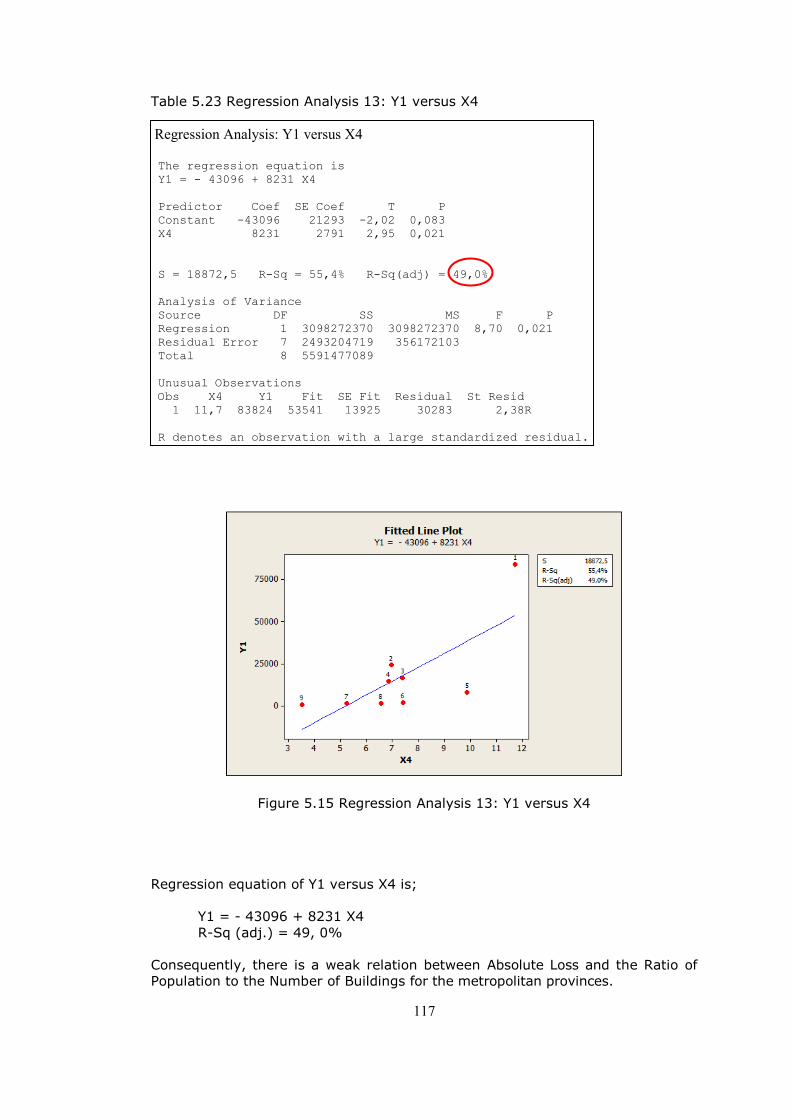
117
Table 5.23 Regression Analysis 13: Y1 versus X4 Regression Analysis: Y1 versus X4 The regression equation is
Y1 = - 43096 + 8231 X4
Predictor Coef SE Coef T P
Constant -43096 21293 -2,02 0,083
X4 8231 2791 2,95 0,021
S = 18872,5 R-Sq = 55,4% R-Sq(adj) = 49,0%
Analysis of Variance
Source DF SS MS F P
Regression 1 3098272370 3098272370 8,70 0,021
Residual Error 7 2493204719 356172103
Total 8 5591477089
Unusual Observations
Obs X4 Y1 Fit SE Fit Residual St Resid
1 11,7 83824 53541 13925 30283 2,38R
R denotes an observation with a large standardized residual.
Figure 5.15 Regression Analysis 13: Y1 versus X4
Regression equation of Y1 versus X4 is;
Y1 = - 43096 + 8231 X4
R-Sq (adj.) = 49, 0%
Consequently, there is a weak relation between Absolute Loss and the Ratio of
Population to the Number of Buildings for the metropolitan provinces.
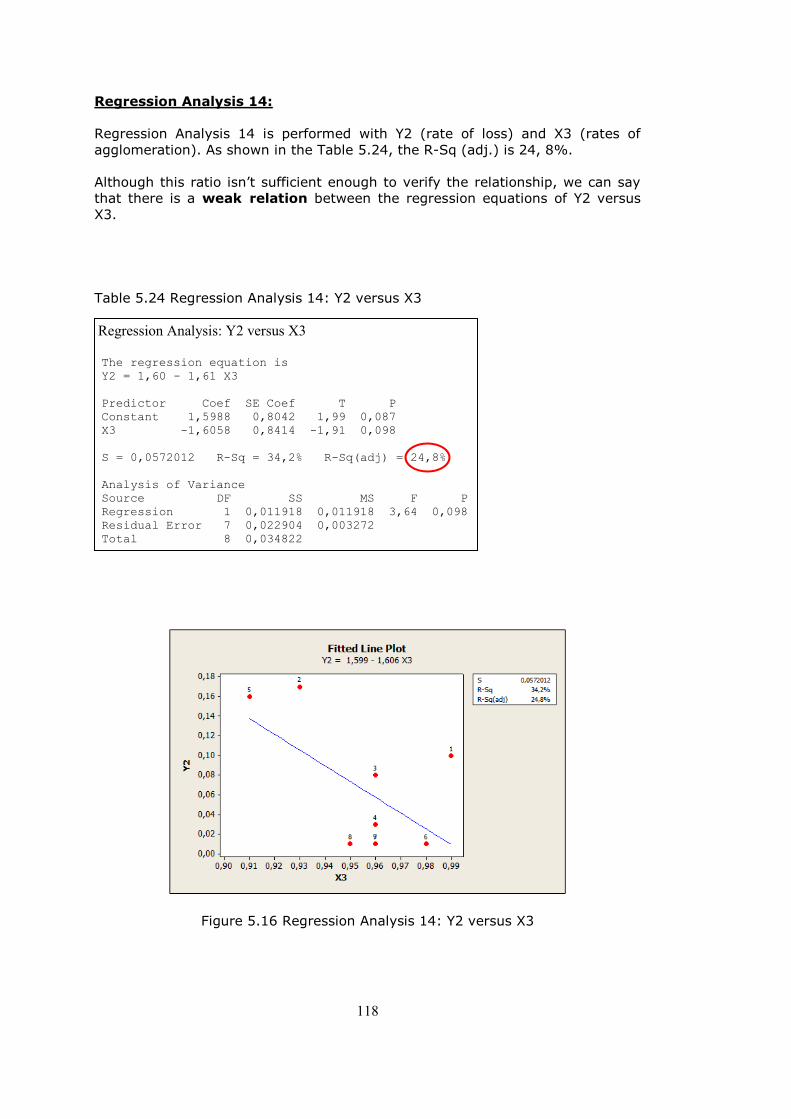
118
Regression Analysis 14:
Regression Analysis 14 is performed with Y2 (rate of loss) and X3 (rates of
agglomeration). As shown in the Table 5.24, the R-Sq (adj.) is 24, 8%.
Although this ratio isn‘t sufficient enough to verify the relationship, we can say
that there is a weak relation between the regression equations of Y2 versus
X3. Table 5.24 Regression Analysis 14: Y2 versus X3
Regression Analysis: Y2 versus X3 The regression equation is
Y2 = 1,60 - 1,61 X3
Predictor Coef SE Coef T P
Constant 1,5988 0,8042 1,99 0,087
X3 -1,6058 0,8414 -1,91 0,098
S = 0,0572012 R-Sq = 34,2% R-Sq(adj) = 24,8%
Analysis of Variance
Source DF SS MS F P
Regression 1 0,011918 0,011918 3,64 0,098
Residual Error 7 0,022904 0,003272
Total 8 0,034822
Figure 5.16 Regression Analysis 14: Y2 versus X3

119
Regression equation of Y2 versus X3 is;
Y2 = 1, 60 - 1, 61 X3
R-Sq (adj.) = 24, 8%
Consequently, we can say that there is a weak relation between Rate of Loss and
the Rates of Agglomeration for the metropolitan provinces.
Regression Analysis 15:
Regression Analysis 15 is performed with Y2 (rate of loss) and X4
(population/total number of buildings). As shown in the Table 5.25, the R-Sq
(adj.) is 24, 7%.
Although this ratio isn‘t sufficient enough to verify the relationship, we can say
that there is a weak relation between the regression equations of Y2 versus
X4.
Table 5.25 Regression Analysis 15: Y2 versus X4
Regression Analysis: Y2 versus X4 The regression equation is
Y2 = - 0,0531 + 0,0161 X4
Predictor Coef SE Coef T P
Constant -0,05306 0,06459 -0,82 0,438
X4 0,016121 0,008466 1,90 0,099
S = 0,0572449 R-Sq = 34,1% R-Sq(adj) = 24,7%
Analysis of Variance
Source DF SS MS F P
Regression 1 0,011883 0,011883 3,63 0,099
Residual Error 7 0,022939 0,003277
Total 8 0,034822
Unusual Observations
Obs X4 Y2 Fit SE Fit Residual St Resid
2 7,0 0,1700 0,0591 0,0193 0,1109 2,06R
R denotes an observation with a large standardized residual.
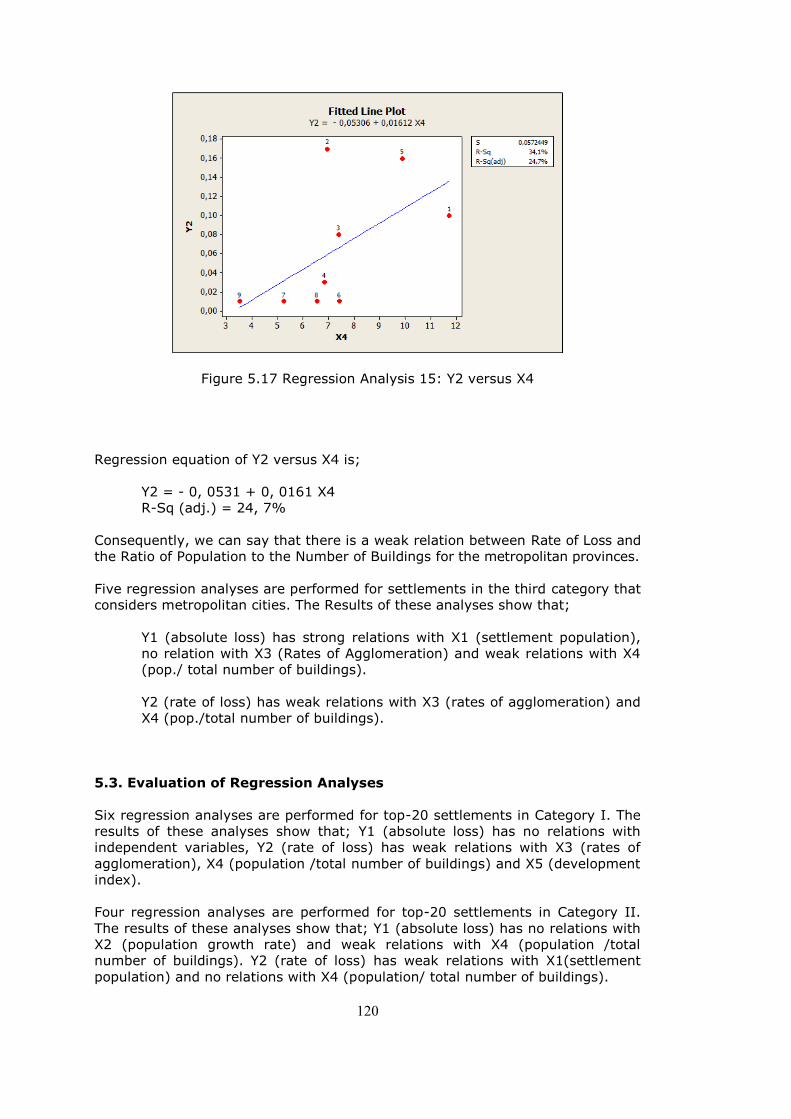
120
Figure 5.17 Regression Analysis 15: Y2 versus X4
Regression equation of Y2 versus X4 is;
Y2 = - 0, 0531 + 0, 0161 X4
R-Sq (adj.) = 24, 7%
Consequently, we can say that there is a weak relation between Rate of Loss and
the Ratio of Population to the Number of Buildings for the metropolitan provinces.
Five regression analyses are performed for settlements in the third category that
considers metropolitan cities. The Results of these analyses show that;
Y1 (absolute loss) has strong relations with X1 (settlement population),
no relation with X3 (Rates of Agglomeration) and weak relations with X4
(pop./ total number of buildings).
Y2 (rate of loss) has weak relations with X3 (rates of agglomeration) and
X4 (pop./total number of buildings).
5.3. Evaluation of Regression Analyses
Six regression analyses are performed for top-20 settlements in Category I. The
results of these analyses show that; Y1 (absolute loss) has no relations with
independent variables, Y2 (rate of loss) has weak relations with X3 (rates of
agglomeration), X4 (population /total number of buildings) and X5 (development
index).
Four regression analyses are performed for top-20 settlements in Category II.
The results of these analyses show that; Y1 (absolute loss) has no relations with
X2 (population growth rate) and weak relations with X4 (population /total
number of buildings). Y2 (rate of loss) has weak relations with X1(settlement
population) and no relations with X4 (population/ total number of buildings).
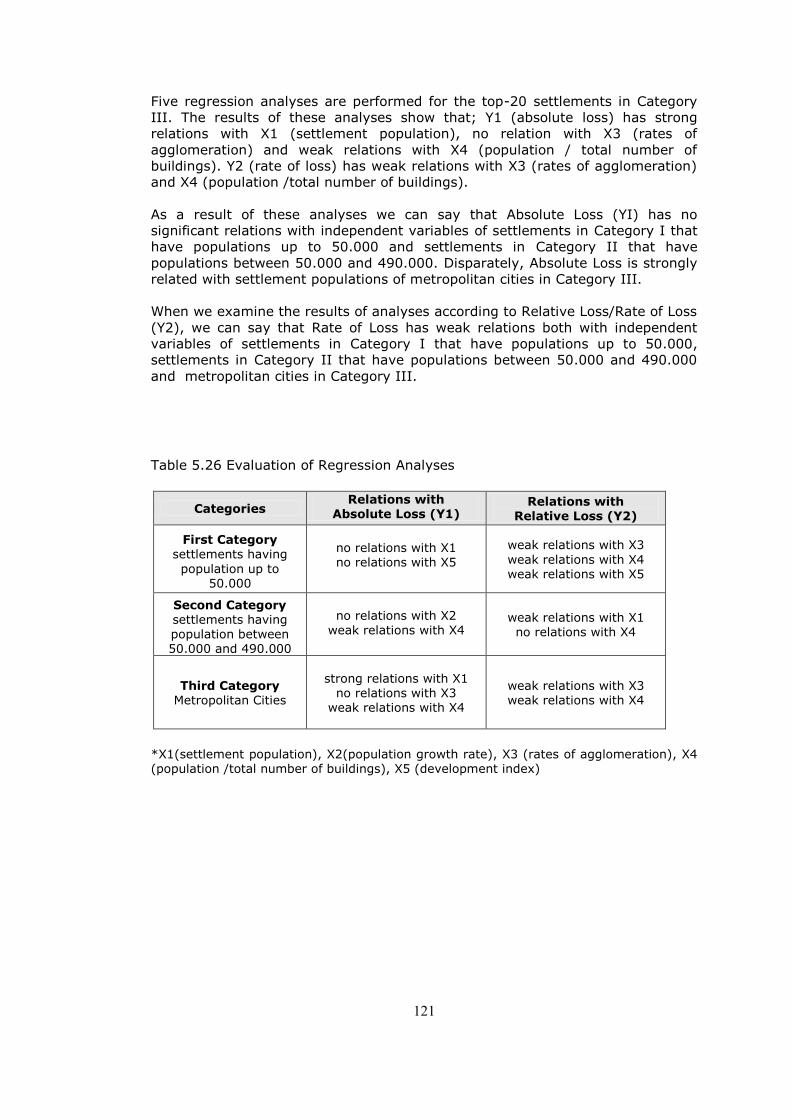
121
Five regression analyses are performed for the top-20 settlements in Category
III. The results of these analyses show that; Y1 (absolute loss) has strong
relations with X1 (settlement population), no relation with X3 (rates of
agglomeration) and weak relations with X4 (population / total number of
buildings). Y2 (rate of loss) has weak relations with X3 (rates of agglomeration)
and X4 (population /total number of buildings).
As a result of these analyses we can say that Absolute Loss (YI) has no
significant relations with independent variables of settlements in Category I that
have populations up to 50.000 and settlements in Category II that have
populations between 50.000 and 490.000. Disparately, Absolute Loss is strongly
related with settlement populations of metropolitan cities in Category III.
When we examine the results of analyses according to Relative Loss/Rate of Loss
(Y2), we can say that Rate of Loss has weak relations both with independent
variables of settlements in Category I that have populations up to 50.000,
settlements in Category II that have populations between 50.000 and 490.000
and metropolitan cities in Category III.
Table 5.26 Evaluation of Regression Analyses
Categories Relations with
Absolute Loss (Y1) Relations with
Relative Loss (Y2)
First Category settlements having
population up to 50.000
no relations with X1 no relations with X5
weak relations with X3
weak relations with X4 weak relations with X5
Second Category settlements having
population between 50.000 and 490.000
no relations with X2
weak relations with X4 weak relations with X1
no relations with X4
Third Category Metropolitan Cities
strong relations with X1 no relations with X3
weak relations with X4
weak relations with X3 weak relations with X4
*X1(settlement population), X2(population growth rate), X3 (rates of agglomeration), X4 (population /total number of buildings), X5 (development index)

122
123
CHAPTER 6
FINDINGS and POLICY RECOMMENDATIONS
The method and findings of this study may contribute to a more effective
disaster policy and urban planning in several lines of policy development.
Suggestions and recommendations are briefly explored in this chapter indicating
also areas of further research and policy development.
6.1. Priorities for Mitigation Planning
Mitigation planning is the process of figuring out how to reduce or eliminate the
loss of life and property damage resulting from natural hazards and described by
Kreimer et. al (1999) as an attempt to avoid, minimize, and share the costs of
likely disasters. Mitigation planning is necessarily based on the identification and
analysis of risks, and the development of methods for the management of urban
risks. ―An intensive collaboration of the disciplines is required, orchestrated
preferably by the planners‖ (Balamir, 2006).
The purpose of mitigation planning is to identify policies and actions that can be
implemented over the long term to reduce risk and future losses. Mitigation
Plans form the foundation for a community's long-term strategy to reduce
disaster losses and break the cycle of disaster damage, reconstruction, and
repeated damage (FEMA, 2012).
The planning process is as important as the plan itself. It creates a framework
for risk-based decision making to reduce damages to lives, property, and the
economy from future disasters and help communities to become more
sustainable and resilience by focusing efforts on the hazards, disaster-prone
areas and identifying appropriate mitigation actions (FEMA, 2012).
Mitigation Planning identifies cost effective actions for risk reduction that are
agreed upon by stakeholders and the public, focus resources on the greatest
risks and vulnerabilities, builds partnerships by involving people and
organizations, increases education and awareness of hazards and risk and aligns
risk reduction with other community objectives.
Mitigation planning refers to a process that leads a planning committee through
a framework of steps to develop a mitigation plan. The primary objective of the
planning process is to facilitate development of strategies that will reduce
damage, protect people and property, and improve resistance to natural
hazards.
124
According to FEMA (2012) this process involves four basic steps:
1. Organize Resources: communities should focus on the resources
needed for a successful mitigation planning process. Essential
steps include identifying and organizing interested members of the
community as well as the technical expertise required during the
planning process.
2. Identify Hazards and Assess Risks: communities need to
identify the characteristics and potential consequences of hazards.
It is important to understand how much of the community can be
affected by specific hazards and what the impacts would be on
important community assets.
3. Develop a Mitigation Plan: Armed with an understanding of the
risks posed by hazards, communities need to determine what their
priorities should be and then look at possible ways to avoid or
minimize the undesired effects. The result is a hazard mitigation
plan and strategy for implementation.
4. Implement Plan and Monitor Progress: Communities can bring
the plan to life in a variety of ways, ranging from implementing
specific mitigation projects to changes in day-to-day organizational
operations. To ensure the success of an ongoing program, it is
critical that the plan remains relevant. Thus, it is important to
conduct periodic evaluations and make revisions as needed.
Consequently, mitigation planning at all levels is the dominant paradigm today
as promoted by international organizations and academic circles since 1990s.
Observations of this study provide guiding principles for effective mitigation
practices in Turkey by ordering settlements and offer means of differential
implementation.
The prioritized list of settlements according to their vulnerability levels should be
accepted as the basis of the mitigation policies in higher-risk settlements and
these cities within the highest hazard zone should obviously be the object of
mitigation programs before those in areas of lower hazard.
Effective disaster mitigation strategies and more strict legal regulations about
preparation of mitigation plans should be executed in higher-risk settlements and
cities within the highest hazard zone.
Priorities of mitigation planning should be constituted with respect to the
prioritized list of settlements according to their vulnerability levels and it should be
compulsory to prepare mitigation plans for the settlements that have rank in the
top-20 high risk lists.
The top-20 high risk settlements and metropolitan cities prioritized according to
the absolute loss and relative loss that mitigation plans should be executed
compulsorily are given below in the Table 6.1, Table 6.2, Table 6.3 and Table
6.4.
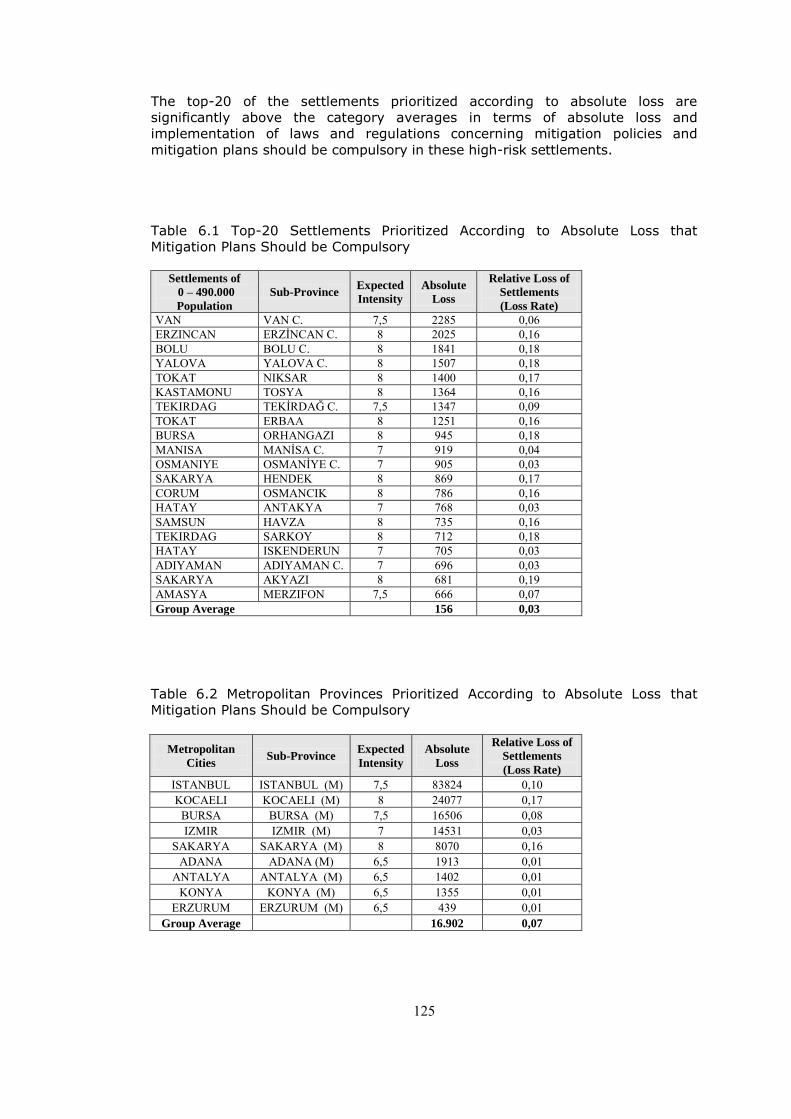
125
The top-20 of the settlements prioritized according to absolute loss are
significantly above the category averages in terms of absolute loss and
implementation of laws and regulations concerning mitigation policies and
mitigation plans should be compulsory in these high-risk settlements.
Table 6.1 Top-20 Settlements Prioritized According to Absolute Loss that
Mitigation Plans Should be Compulsory
Settlements of
0 – 490.000
Population
Sub-Province Expected
Intensity
Absolute
Loss
Relative Loss of
Settlements
(Loss Rate)
VAN VAN C. 7,5 2285 0,06 ERZINCAN ERZİNCAN C. 8 2025 0,16 BOLU BOLU C. 8 1841 0,18 YALOVA YALOVA C. 8 1507 0,18 TOKAT NIKSAR 8 1400 0,17 KASTAMONU TOSYA 8 1364 0,16 TEKIRDAG TEKİRDAĞ C. 7,5 1347 0,09 TOKAT ERBAA 8 1251 0,16 BURSA ORHANGAZI 8 945 0,18 MANISA MANİSA C. 7 919 0,04 OSMANIYE OSMANİYE C. 7 905 0,03 SAKARYA HENDEK 8 869 0,17 CORUM OSMANCIK 8 786 0,16 HATAY ANTAKYA 7 768 0,03 SAMSUN HAVZA 8 735 0,16 TEKIRDAG SARKOY 8 712 0,18 HATAY ISKENDERUN 7 705 0,03 ADIYAMAN ADIYAMAN C. 7 696 0,03 SAKARYA AKYAZI 8 681 0,19 AMASYA MERZIFON 7,5 666 0,07 Group Average 156 0,03
Table 6.2 Metropolitan Provinces Prioritized According to Absolute Loss that
Mitigation Plans Should be Compulsory
Metropolitan
Cities Sub-Province
Expected
Intensity
Absolute
Loss
Relative Loss of
Settlements
(Loss Rate)
ISTANBUL ISTANBUL (M) 7,5 83824 0,10 KOCAELI KOCAELI (M) 8 24077 0,17
BURSA BURSA (M) 7,5 16506 0,08 IZMIR IZMIR (M) 7 14531 0,03
SAKARYA SAKARYA (M) 8 8070 0,16 ADANA ADANA (M) 6,5 1913 0,01
ANTALYA ANTALYA (M) 6,5 1402 0,01 KONYA KONYA (M) 6,5 1355 0,01
ERZURUM ERZURUM (M) 6,5 439 0,01 Group Average 16.902 0,07

126
The top-20 of the settlements prioritized according to relative loss are
significantly above the category averages in terms of relative loss and
implementation of laws and regulations concerning mitigation policies and
mitigation plans should be compulsory in these high-risk settlements.
Table 6.3 Top-20 Settlements Prioritized According to Relative Loss that
Mitigation Plans Should be Compulsory
Settlements of
0 – 490.000
Population
Sub-Province Expected
Intensity
Relative Loss of
Settlements
(Loss Rate)
Absolute
Loss
YALOVA CINARCIK 8 0,21 357 SAKARYA AKYAZI 8 0,19 681 YALOVA CIFTLIKKOY 8 0,19 298 BOLU BOLU M. 8 0,18 1841 YALOVA YALOVA C. 8 0,18 1507 BURSA ORHANGAZI 8 0,18 945 TEKIRDAG SARKOY 8 0,18 712 TOKAT NIKSAR 8 0,17 1400 SAKARYA HENDEK 8 0,17 869 BOLU GEREDE 8 0,17 583 AMASYA TASOVA 8 0,17 282 YALOVA TERMAL 8 0,17 73 ERZINCAN ERZİNCAN C. 8 0,16 2025 KASTAMONU TOSYA 8 0,16 1364 TOKAT ERBAA 8 0,16 1251 CORUM OSMANCIK 8 0,16 786 SAMSUN HAVZA 8 0,16 735 SAKARYA GEYVE 8 0,16 543 SIVAS SUSEHRI 8 0,16 424 SAMSUN LADIK 8 0,16 377 Group Average 0,03 156
Table 6.4 Metropolitan Provinces Prioritized According to Relative Loss that
Mitigation Plans Should be Compulsory
Metropolitan
Cities Sub-Province
Expected
Intensity
Relative Loss
Of Settlements
(Loss Rate)
Absolute
Loss
KOCAELI KOCAELİ 8 0,17 24077 SAKARYA SAKARYA 8 0,16 8070 ISTANBUL ISTANBUL 7,5 0,10 83824
BURSA BURSA 7,5 0,08 16506 IZMIR IZMIR 7 0,03 14531
ADANA ADANA 6,5 0,01 1913 ANTALYA ANTALYA 6,5 0,01 1402
KONYA KONYA 6,5 0,01 1355 ERZURUM ERZURUM 6,5 0,01 439
Group Average 0,07 16.902
127
6.2. Urban Planning Standards and Principles
One of the key elements in disaster risk reduction is effective management of
land-use planning, urban planning standards and principles.
Global Assessment Report (GAR, 2011) recognized the opportunities of
mainstreaming disaster risk reduction into land use planning and urban planning
and the Hyogo Framework for Action 2005–2015 endorsed efforts in this field.
Therefore, land use planning and urban planning standards became effective
tools for disaster risk reduction by reducing risk factors, vulnerabilities and
potential losses. Through land use planning, disaster risk factors can be modified
to increase resilience.
―Land-use planning concerned with mitigation and equipped with the essential
tools of implementation, does not only imply wider streets, lower densities, and
larger open spaces in disaster-prone areas, but also a context in which
individuals and institutions are alertly responsive and explicitly responsible for all
eventualities‖ (Balamir, 2002).
Land use management is more than regulating development activities in the area
with laws, ordinances and regulations. It should be linked to comprehensive land
use plans and zoning ordinances to establish the bases for resilient development
of the city. Land use management should seriously be taken into consideration,
especially in cities with land use problems like high population density, high-rise
buildings or vulnerable buildings in earthquake hazard-prone areas (Banba et. al,
2004).
Settlements in Turkey exceedingly perform all of these problems and it may be
relevant to perform effective land-use planning and urban planning standards for
the implementation of more effective disaster policies in Turkey.
Planning for resilient cities involves more than being occupied with minimum
standards or widely-accepted spatial designs. Urban planning standards and
principles together with risk-minimizing planning systems could effectively serve
to mitigate risks and promote strict building supervision practices in disaster
prone cities. To this end, urban planning standards and principles could be
determined according to risk levels/zones determined by vulnerability maps and
more strict planning standards could be executed in higher-risk settlements.
Although, cities within the highest risk zones should obviously be the object of
more strict inspection mechanisms than those of lower risks.
Urban standards for land use management as well as building construction are
essential elements of disaster mitigation and it should be taken into
consideration that different seismic intensity levels have different requirements
of standards. Land-use planning and zoning, planning of open-spaces,
transportation and infrastructure planning are all distinct aspects of disaster
mitigation and all these systems are to be implemented at different standards
according to risk levels. Rigorous implementation and enforcement of
differentiated standards according to risk levels must be the highest priority for
reducing risk factors, vulnerabilities and potential losses.
The regulations of land-use planning and urban planning standards can reduce
the vulnerability of natural hazards by locational and/or design approaches.

128
The locational approach is to avoid and restrict development in high-risk areas in
order to reduce property loss and human casualties resulting from disasters.
Determination of less hazardous areas for the expansion and direction of urban
development is also used for reducing losses in this approach.
The design approach deals with the design and construction of buildings and
infrastructure to resist expected earthquake loads and encourage safe design in
order to make structures more resistant to disasters. Generally the locational
and design strategies is used together to reduce urban risks.
An increasingly popular locational approach is public purchase of hazardous
areas for use as recreational areas, parks and open spaces in high-risk
settlements.
Adequate amounts of open and green areas systems have enormous value both
during and after an earthquake event; they serve as potential evacuation places
and temporary dwelling areas. After a major earthquake, the open space
network becomes a kind of ‗second city‘, providing multiple complex functions
such as gathering and shelter, the distribution of goods and services and
temporary inhabitation (McGregor, 1998, Middleton, 2007).
Another locational approach should be implemented for schools and health
facilities not only because of the highly vulnerable population they
accommodate, but also because they provide essential social services and serve
as shelter sites for the community.
It is essential that these buildings function after a seismic event and special
attention must be paid to their safety. Risk reduction efforts must focus on
ensuring they can continue providing services when most needed. These facilities
should be located on safest areas and follow current seismic codes in
construction resistant to damage. These precautions should be implemented
other public facilities also.
Critical infrastructure and lifelines services such as electricity, energy,
telecommunication and water are systems that could serve for the emergency
response and recovery of a community in the post-disaster context.
Protecting these utilities from damage and avoiding these services to be located
in high-risk areas can minimize the economic and social disruptions caused by
natural disasters.
Underground systems for critical infrastructure and lifelines services in high-risk
settlements are effective measures against disaster. Another important point is
the accessibility options, roads and sites are designed to be accessible in case of
emergencies.
129
6.3. Law on Redevelopment of Areas under Disaster Risk (6306)
The Law No. 6306 on ―Redevelopment of Areas under Disaster Risk‖ put into
force by publication at the Official Gazette dated May 31, 2012. The governing
authority of the law is the Ministry of Environment and Urbanism (MEU). The Law
has the objective of ―determining the principles and methods of improvement,
liquidation and renewal geared towards the constitution of healthy and safe
living spaces in line with scientific and esthetic norms and standards in areas
under disaster risk and in any high risk development‖.
The Redevelopment Law is intended to regulate the improvement, settlement
and renovation of areas at risk of disaster and other lots which support risk-
bearing buildings, even if outside of a designated disaster risk area. The purpose
of the Redevelopment Law which is defined in Article 1 is determining all kinds of
principles, methods and processes in connection with rehabilitation, demolition
and reconstruction at areas under disaster risk and at other areas, whether
planned or not, where there are structures under risk, with the aim of providing
habitats conforming to technical, health, environmental and zoning plan
requirements.
The Law outlines the methods for the identification of such high risk areas and
structures, evacuation and demolition processes, development of projects after
demolition and it also lists the duties and responsibilities of public agencies.
The Law specifically focuses on the risk areas and defines ―risk area‖ as areas
that may cause loss of life or assets. These areas are identified by the Ministry,
Housing Development Administration or municipalities, by taking the opinions of
the Presidency of Management of Disaster and Emergency and decided by the
Council of Ministers upon proposal of the Ministry.
According to the Law, the buildings that are at risk (―risky buildings‖) are defined
as buildings within or outside risk areas that have completed their economic life,
or which are scientifically and technically proven to be at risk of demolition or
high damage. It should be underlined that if the Ministry deems necessary, a
building that is not specified as a property at risk may also be subject to
regeneration procedures for the purpose of maintaining the integrity of the
enforceability of the Law.
Besides, there are various ambiguous and grey areas regarding this Law and it is
likely that the Law is subject to objections in various aspects. The foremost of
these objections about the Law is the restrictions imposed on the ownership
rights and the granting of broad authority to the Ministry.
The Law noticeably brings all authorities under one institution - the Ministry of
Environment and Urbanism. MEU is authorized to expropriate the immovable or
exchange them with others; to transfer immovable property rights and zoning
rights to other areas; to divide and to allocate shares forming the immovable‘s;
and to establish rights on immovable‘s located within the risk areas" (Akalın and
Sürel, 2012).
In addition to above mentioned deficiencies, another criticism about the Law is
the Article 9. According to the Article 9 preventive provisions of other laws
contrary to the implementation of this law shall not be applicable.
130
These aspects of the law has already caused widespread protests from circles
such as Professional chambers and current residents of redevelopment areas due
to social, cultural and environmental concerns as it opens a way for new means
of maximum use of land at centrally located urban land through higher floor area
ratios which are to be determined by central and local administration institutions
such as Housing Development Administration of Turkey, metropolitan
municipalities and county municipalities (Akalın and Sürel, 2012).
Therefore, the law as proposed does not provide adequate protection
mechanisms to individuals, inadequate to reduce the destructive effects of
earthquakes and does not establish adequate and effective consultation
mechanisms with the owners and/or tenants of the buildings which may be
affected. Also, the language of the law is ambiguous and there are various points
in the law which may be open to arbitrary interpretation besides giving immense
powers to authorities.
The Union of Chambers of Turkish Engineers and Architects (UCTEA) stated their
opinion about the Disaster Law as ―All laws that protect the immunity of cities,
habitats, nature and professional fields are getting scrapped. The government is
rendering our cities more vulnerable to disasters through laws and
administrative regulations that amount to plundering nature and history and
which aim for 'profiteering' under the [disguise] of 'urban transformation‘‖.
The contradictions of the Law with basic human rights and the Constitution are
listed by the Chamber of City Planners under UCTEA as given below;
The law penalizes any objection to an imposed agreement on disaster
prevention
Risk-free buildings can be brought under the scope of law for the sake of
―practical coherence‖
The statement ―Buildings in high risk areas are not to be provided power,
water or natural gas, and all such services will be discontinued‖ is a clear
violation of basic rights
Obliging local residents to cover all infrastructure costs (including the cost
of identification and demolition of high risk buildings) will increase the debt
burden of these already impoverished populations
The authorization of the Ministry of Environment and Urban Planning
further enhances centralization
The few plots remaining in the public sector could be Privatized Real estate
owned by public agencies outside of the Treasury (schools, hospitals and
public housing) could be transferred to the Ministry, whether prone to
disasters or not
Laws protecting natural and historical riches are made null and void,
defined as ―inapplicable legislation‖
Development of grazing land is made easier

131
The temporary ban on all zoning and construction in reserve building areas
constitutes a violation of property rights
The authority to impose ―special‖ standards on planning resolutions could
make the renewed areas unlivable
Aside from these arguments, it is suggested in some circles that high risk areas
will be identified arbitrarily. Also, the Law on Disaster Prevention does not take
into account any disaster other than earthquakes. The condition of tenants is not
given due consideration, and no mechanism is designed for their protection,
except for a one-off rent allowance.
Besides, there are no price-control measures to prevent impoverished residents
from running into repayment problems or being obliged to sell their property for
immediate gain, and thus be uprooted from their communities. The participation
of local stakeholders was envisaged neither during the drafting of the law nor in
the aftermath – aside from bearing its costs.
Finally, the law in question centered on demolition does not approach
transformation comprehensively, in the light of healthy urban development,
ecological sustainability and social justice – the indisputable principles of urban
planning. Criticisms get only stronger once you add the fact that previous
transformation projects were far from exemplary in many aspects not least
design, and that market players focus on profit maximization and give a back
seat to public interest (Adanalı, 2012).
Consequently, all of above mentioned deficiencies should be improved in order to
provide adequate protection mechanisms to individuals, to reduce the
destructive effects of earthquakes and establish adequate and effective
consultation mechanisms with the owners and/or tenants of the buildings which
may be affected.
Observations of this study provide guiding principles for effective mitigation
practices in Turkey by ordering settlements and offer means of differential
implementation. These could contribute to improved safety measures in Law
(6306) on Redevelopment of Areas under Disaster Risk.
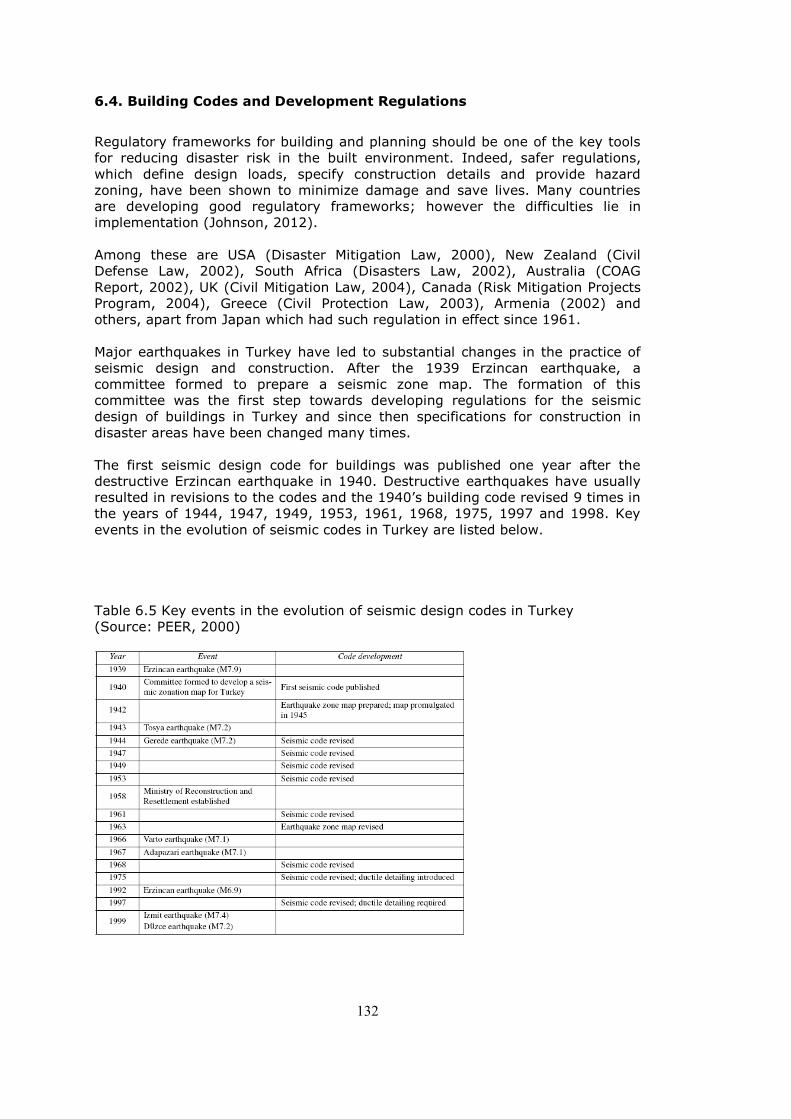
132
6.4. Building Codes and Development Regulations
Regulatory frameworks for building and planning should be one of the key tools
for reducing disaster risk in the built environment. Indeed, safer regulations,
which define design loads, specify construction details and provide hazard
zoning, have been shown to minimize damage and save lives. Many countries
are developing good regulatory frameworks; however the difficulties lie in
implementation (Johnson, 2012).
Among these are USA (Disaster Mitigation Law, 2000), New Zealand (Civil
Defense Law, 2002), South Africa (Disasters Law, 2002), Australia (COAG
Report, 2002), UK (Civil Mitigation Law, 2004), Canada (Risk Mitigation Projects
Program, 2004), Greece (Civil Protection Law, 2003), Armenia (2002) and
others, apart from Japan which had such regulation in effect since 1961.
Major earthquakes in Turkey have led to substantial changes in the practice of
seismic design and construction. After the 1939 Erzincan earthquake, a
committee formed to prepare a seismic zone map. The formation of this
committee was the first step towards developing regulations for the seismic
design of buildings in Turkey and since then specifications for construction in
disaster areas have been changed many times.
The first seismic design code for buildings was published one year after the
destructive Erzincan earthquake in 1940. Destructive earthquakes have usually
resulted in revisions to the codes and the 1940‘s building code revised 9 times in
the years of 1944, 1947, 1949, 1953, 1961, 1968, 1975, 1997 and 1998. Key
events in the evolution of seismic codes in Turkey are listed below.
Table 6.5 Key events in the evolution of seismic design codes in Turkey
(Source: PEER, 2000)
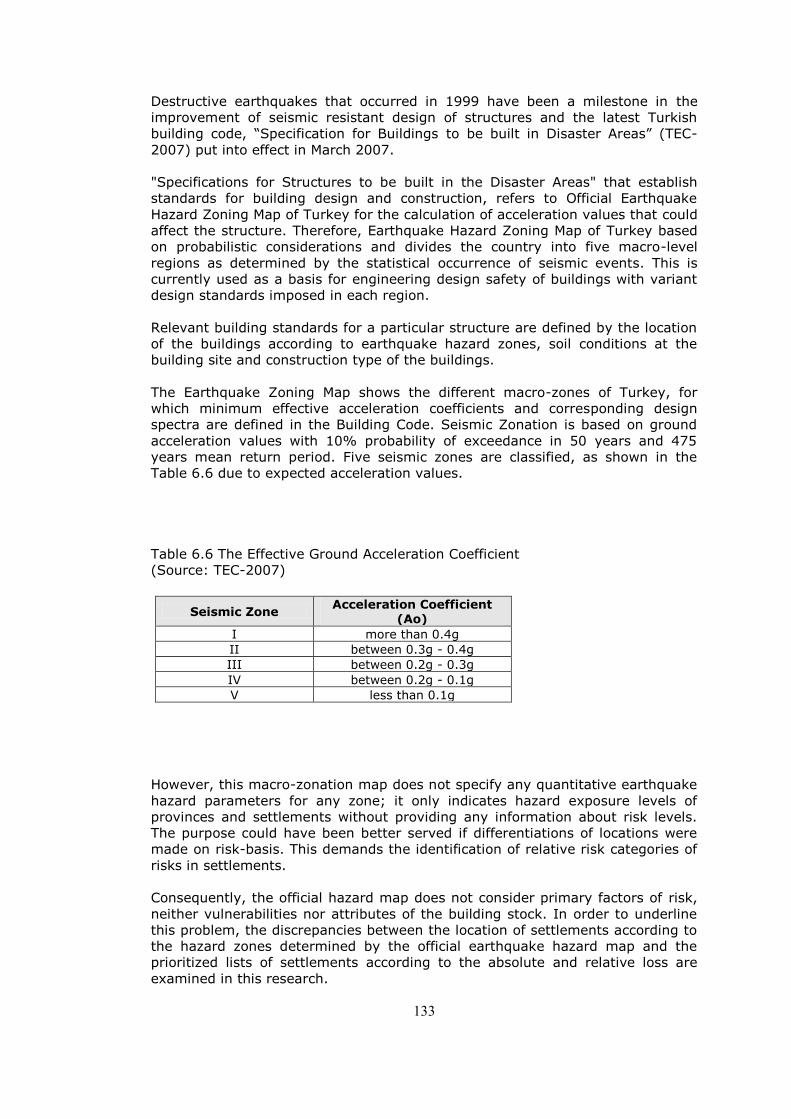
133
Destructive earthquakes that occurred in 1999 have been a milestone in the
improvement of seismic resistant design of structures and the latest Turkish
building code, ―Specification for Buildings to be built in Disaster Areas‖ (TEC-
2007) put into effect in March 2007.
"Specifications for Structures to be built in the Disaster Areas" that establish
standards for building design and construction, refers to Official Earthquake
Hazard Zoning Map of Turkey for the calculation of acceleration values that could
affect the structure. Therefore, Earthquake Hazard Zoning Map of Turkey based
on probabilistic considerations and divides the country into five macro-level
regions as determined by the statistical occurrence of seismic events. This is
currently used as a basis for engineering design safety of buildings with variant
design standards imposed in each region.
Relevant building standards for a particular structure are defined by the location
of the buildings according to earthquake hazard zones, soil conditions at the
building site and construction type of the buildings.
The Earthquake Zoning Map shows the different macro-zones of Turkey, for
which minimum effective acceleration coefficients and corresponding design
spectra are defined in the Building Code. Seismic Zonation is based on ground
acceleration values with 10% probability of exceedance in 50 years and 475
years mean return period. Five seismic zones are classified, as shown in the
Table 6.6 due to expected acceleration values.
Table 6.6 The Effective Ground Acceleration Coefficient
(Source: TEC-2007)
Seismic Zone
Acceleration Coefficient (Ao)
I more than 0.4g
II between 0.3g - 0.4g
III between 0.2g - 0.3g
IV between 0.2g - 0.1g
V less than 0.1g
However, this macro-zonation map does not specify any quantitative earthquake
hazard parameters for any zone; it only indicates hazard exposure levels of
provinces and settlements without providing any information about risk levels.
The purpose could have been better served if differentiations of locations were
made on risk-basis. This demands the identification of relative risk categories of
risks in settlements.
Consequently, the official hazard map does not consider primary factors of risk,
neither vulnerabilities nor attributes of the building stock. In order to underline
this problem, the discrepancies between the location of settlements according to
the hazard zones determined by the official earthquake hazard map and the
prioritized lists of settlements according to the absolute and relative loss are
examined in this research.
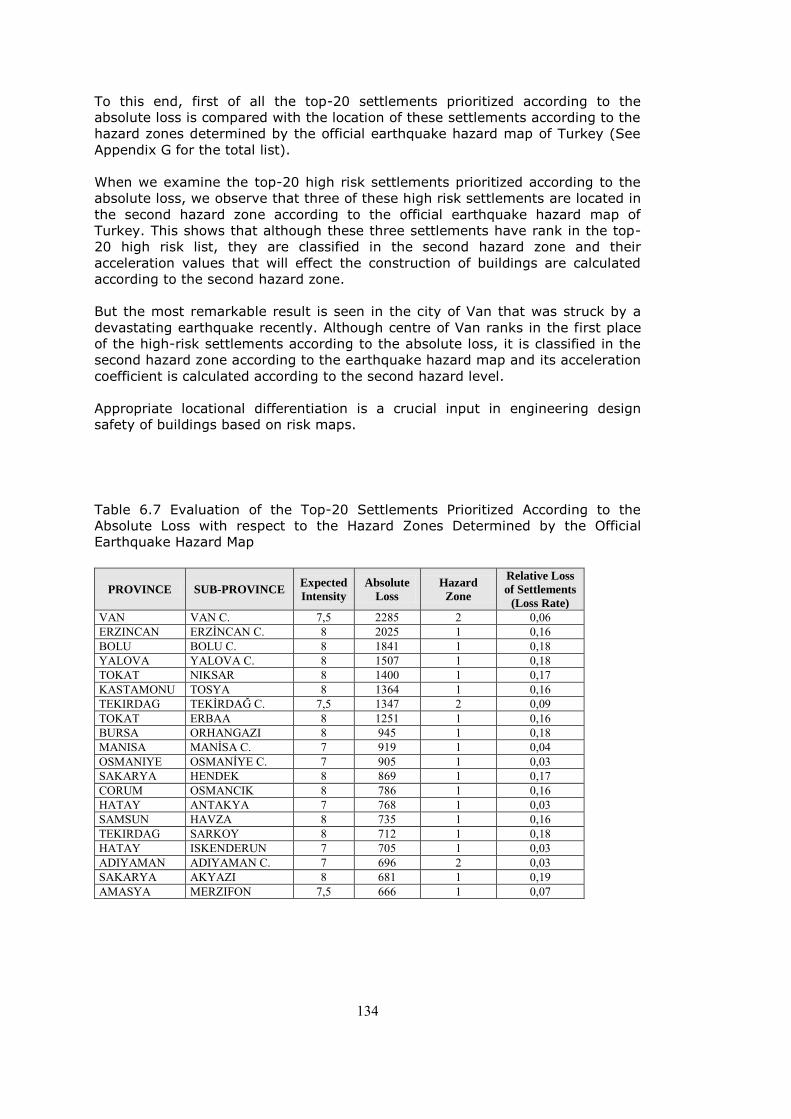
134
To this end, first of all the top-20 settlements prioritized according to the
absolute loss is compared with the location of these settlements according to the
hazard zones determined by the official earthquake hazard map of Turkey (See
Appendix G for the total list).
When we examine the top-20 high risk settlements prioritized according to the
absolute loss, we observe that three of these high risk settlements are located in
the second hazard zone according to the official earthquake hazard map of
Turkey. This shows that although these three settlements have rank in the top-
20 high risk list, they are classified in the second hazard zone and their
acceleration values that will effect the construction of buildings are calculated
according to the second hazard zone.
But the most remarkable result is seen in the city of Van that was struck by a
devastating earthquake recently. Although centre of Van ranks in the first place
of the high-risk settlements according to the absolute loss, it is classified in the
second hazard zone according to the earthquake hazard map and its acceleration
coefficient is calculated according to the second hazard level.
Appropriate locational differentiation is a crucial input in engineering design
safety of buildings based on risk maps.
Table 6.7 Evaluation of the Top-20 Settlements Prioritized According to the
Absolute Loss with respect to the Hazard Zones Determined by the Official
Earthquake Hazard Map
PROVINCE SUB-PROVINCE Expected
Intensity
Absolute
Loss
Hazard
Zone
Relative Loss
of Settlements
(Loss Rate)
VAN VAN C. 7,5 2285 2 0,06 ERZINCAN ERZİNCAN C. 8 2025 1 0,16 BOLU BOLU C. 8 1841 1 0,18 YALOVA YALOVA C. 8 1507 1 0,18 TOKAT NIKSAR 8 1400 1 0,17 KASTAMONU TOSYA 8 1364 1 0,16 TEKIRDAG TEKİRDAĞ C. 7,5 1347 2 0,09 TOKAT ERBAA 8 1251 1 0,16 BURSA ORHANGAZI 8 945 1 0,18 MANISA MANİSA C. 7 919 1 0,04 OSMANIYE OSMANİYE C. 7 905 1 0,03 SAKARYA HENDEK 8 869 1 0,17 CORUM OSMANCIK 8 786 1 0,16 HATAY ANTAKYA 7 768 1 0,03 SAMSUN HAVZA 8 735 1 0,16 TEKIRDAG SARKOY 8 712 1 0,18 HATAY ISKENDERUN 7 705 1 0,03 ADIYAMAN ADIYAMAN C. 7 696 2 0,03 SAKARYA AKYAZI 8 681 1 0,19 AMASYA MERZIFON 7,5 666 1 0,07

135
Figure 6.1 Evaluation of the Top-20 Settlements Prioritized According to the
Absolute Loss with Respect to the Hazard Zones Determined by the Official
Earthquake Hazard Map
Fig
ure
6.1
Evalu
ation o
f th
e T
op-2
0 S
ett
lem
ents
Prioritized A
ccord
ing t
o t
he A
bsolu
te L
oss w
ith
Respect
to t
he H
azard
Zones D
ete
rmin
ed b
y t
he O
ffic
ial Eart
hquake H
azard
Map
136
Other settlements rank in the Top-100 high risk list prioritized according to
absolute loss that shows discrepancy with the hazard zones determined by the
Official Earthquake Hazard Map are; centre of Kütahya that ranks in the 40th
place, Tarsus that ranks in the 43rd place, Çorum that ranks in the 59th place,
KeĢan that ranks in the 65th place, Afyon that ranks in the 72nd place, Çorlu
that ranks in the 76th place, Kozan that ranks in the 85th place, Ceyhan that
ranks in the 92nd place, Kadirli that ranks in the 94th place and Malkara that
ranks in the 100th place (See Appendix G for the total list).
In the examination of the metropolitan cities prioritized according to the absolute
loss, the most remarkable result is seen in the Istanbul metropolitan city.
Although it ranks in the first place of the high-risk metropolitan cities, it is
classified in the second hazard zone according to the earthquake hazard map.
As a result of this classification, acceleration coefficient of the most vulnerable
metropolitan city of the country is calculated according to the second hazard
level. This is another specific example that shows the inconsistency of using
official earthquake hazard zoning map as a basis for calculating acceleration
values for engineering design safety of buildings.
Other metropolitan cities prioritized according to the absolute loss are consistent
with hazard zones determined by the official earthquake hazard map (See
Appendix G).
Secondly, the top-20 settlements prioritized according to the relative loss is
compared with the location of these settlements according to the hazard zones
determined by the official earthquake hazard map of Turkey (See Appendix H for
the total list).
When we examine the top-20 high risk settlements prioritized according to the
relative loss, we observe that all of these high risk settlements are located in the
first hazard zone according to the official earthquake hazard map of Turkey.
This shows that the prioritization of settlements according to relative loss is
consistent with hazard zones determined by the official earthquake hazard map
and this also makes their acceleration values calculation consistent with our
prioritization.
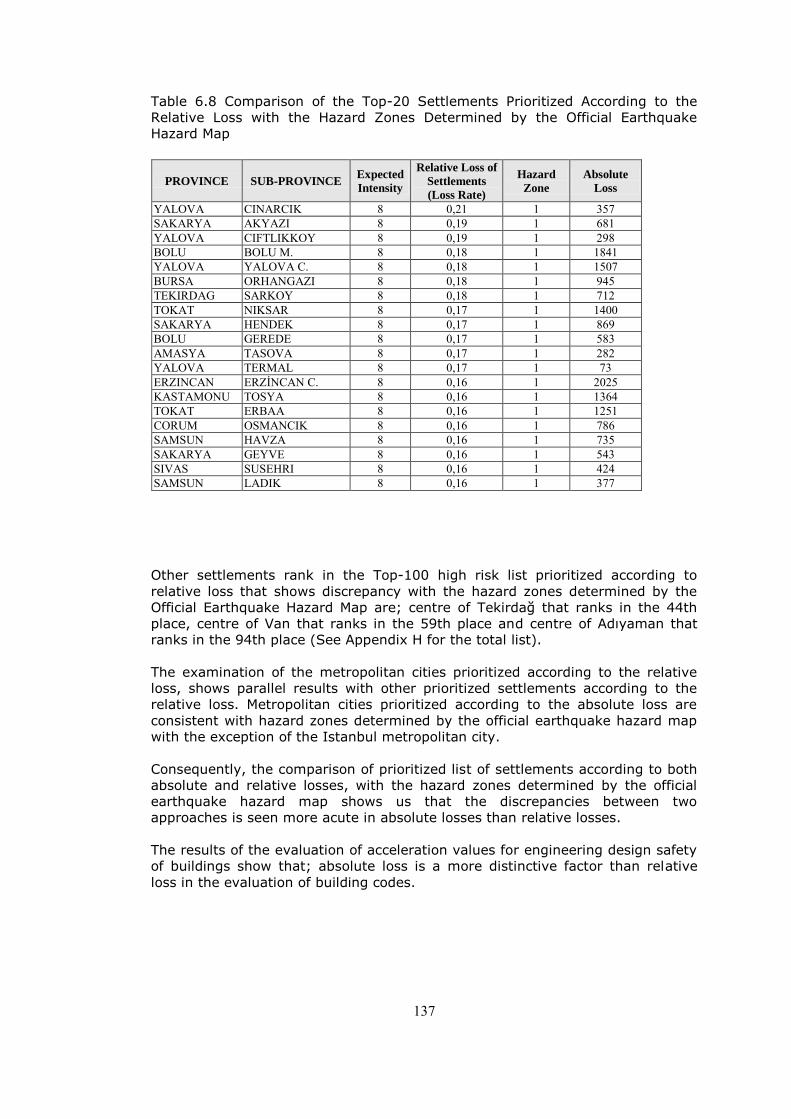
137
Table 6.8 Comparison of the Top-20 Settlements Prioritized According to the
Relative Loss with the Hazard Zones Determined by the Official Earthquake
Hazard Map
PROVINCE SUB-PROVINCE Expected
Intensity
Relative Loss of
Settlements
(Loss Rate)
Hazard
Zone
Absolute
Loss
YALOVA CINARCIK 8 0,21 1 357 SAKARYA AKYAZI 8 0,19 1 681 YALOVA CIFTLIKKOY 8 0,19 1 298 BOLU BOLU M. 8 0,18 1 1841 YALOVA YALOVA C. 8 0,18 1 1507 BURSA ORHANGAZI 8 0,18 1 945 TEKIRDAG SARKOY 8 0,18 1 712 TOKAT NIKSAR 8 0,17 1 1400 SAKARYA HENDEK 8 0,17 1 869 BOLU GEREDE 8 0,17 1 583 AMASYA TASOVA 8 0,17 1 282 YALOVA TERMAL 8 0,17 1 73 ERZINCAN ERZİNCAN C. 8 0,16 1 2025 KASTAMONU TOSYA 8 0,16 1 1364 TOKAT ERBAA 8 0,16 1 1251 CORUM OSMANCIK 8 0,16 1 786 SAMSUN HAVZA 8 0,16 1 735 SAKARYA GEYVE 8 0,16 1 543 SIVAS SUSEHRI 8 0,16 1 424 SAMSUN LADIK 8 0,16 1 377
Other settlements rank in the Top-100 high risk list prioritized according to
relative loss that shows discrepancy with the hazard zones determined by the
Official Earthquake Hazard Map are; centre of Tekirdağ that ranks in the 44th
place, centre of Van that ranks in the 59th place and centre of Adıyaman that
ranks in the 94th place (See Appendix H for the total list).
The examination of the metropolitan cities prioritized according to the relative
loss, shows parallel results with other prioritized settlements according to the
relative loss. Metropolitan cities prioritized according to the absolute loss are
consistent with hazard zones determined by the official earthquake hazard map
with the exception of the Istanbul metropolitan city.
Consequently, the comparison of prioritized list of settlements according to both
absolute and relative losses, with the hazard zones determined by the official
earthquake hazard map shows us that the discrepancies between two
approaches is seen more acute in absolute losses than relative losses.
The results of the evaluation of acceleration values for engineering design safety
of buildings show that; absolute loss is a more distinctive factor than relative
loss in the evaluation of building codes.
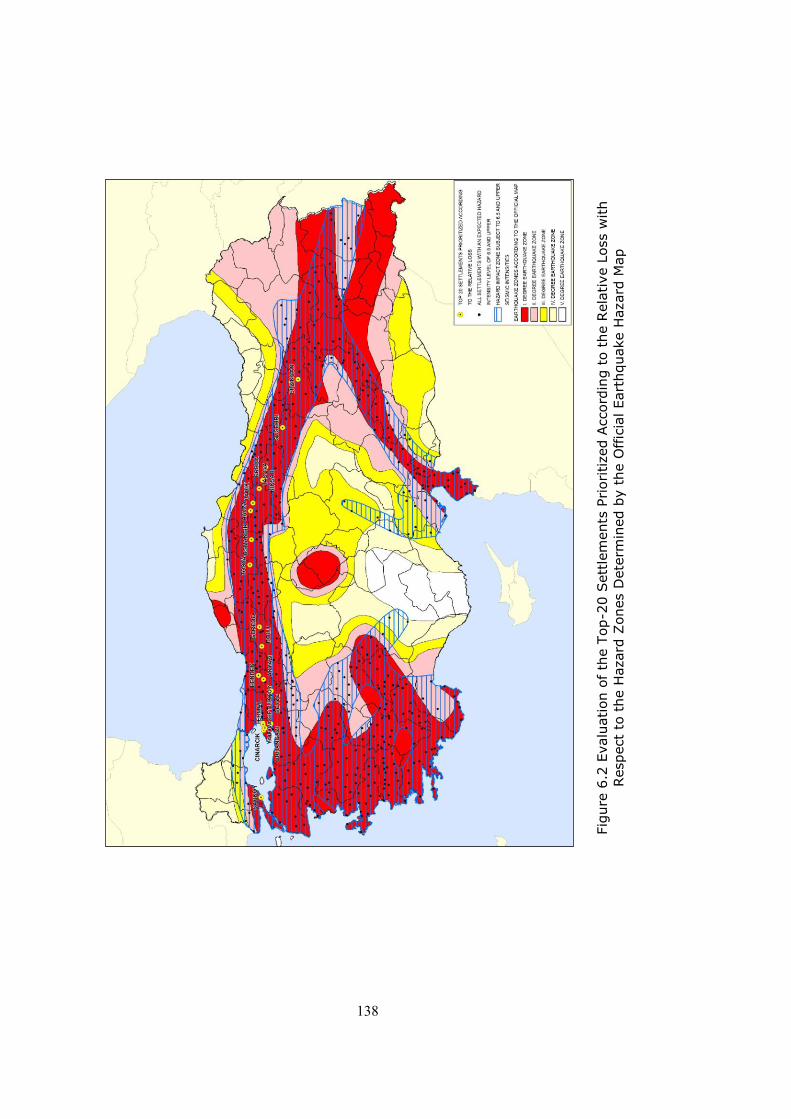
138
Figure 6.2 Evaluation of the Top-20 Settlements Prioritized According to the
Relative Loss with Respect to the Hazard Zones Determined by the Official
Earthquake Hazard Map
Fig
ure
6.2
Evalu
ation o
f th
e T
op-2
0 S
ett
lem
ents
Prioritized A
ccord
ing t
o t
he R
ela
tive L
oss w
ith
Respect
to t
he H
azard
Zones D
ete
rmin
ed b
y t
he O
ffic
ial Eart
hquake H
azard
Map
139
6.5. Building Supervision Practices
An effective disaster mitigation strategy must depend on two basic premises:
One is the effective planning system that considers risk-basis regulatory
frameworks and the second is the strict building supervision practices.
Many countries are developing good regulatory frameworks; however the
difficulties lie in implementation (Johnson, 2012). Enforcement of related codes
and standards during the construction of new buildings is as vital as devising
appropriate building codes and legislation to support enforcement processes.
Moreover, we must underline the fact that an effective construction supervision
system can not be created through the legal text alone. It should be supported
by such instruments as professional liability insurance, professional supervision
and licensing.
Turkey has deficiencies in both the nature and implementation of laws and
regulations concerning the planning system and the system of supervision. But
the lack of implementation and control of current regulations resulted further
devastating impacts than the regulations itself.
Although, the Turkish Building Code was updated in 1997 to include modern
earthquake provisions, weaknesses in construction which were exposed in the
1999 Marmara earthquake, revealed that compliance with the intent of the code
was poor and the effectiveness of the code enforcement was insufficient
(Yüzügüllü et. al, 2004).
The devastating results of the 1999 East Marmara Earthquakes have provided
tragic experiences of the ineffectiveness of the regulatory frameworks in
implementing building standards and proved the need to review and reduce the
deficiencies in the disaster management system and related legislations. Several
steps were taken by the government in order to reduce deficiencies in the pre-
disaster assessments.
Some of these steps are: the introduction of institutions of ‗construction
inspection functions‘ and provisions for the improvements in ‗professional
competence‘ (Keles, 2004; Balamir, 2001).
Within the scope of ‗construction inspection functions‘ the supervision of building
standards become mandatory and ―The Building Supervision Law‖ (4708) put
into force in 2001 ―for the aim of assuring the safety of health and property,
ensuring design and building inspection to construct buildings of good quality
appropriate with improvement plans, science, art and health rules and standards
and arranging the procedures and principles of building inspection‖.
"Specifications for Structures to be Built in the Disaster Areas" that established
standards for building design and construction is used as a basis for construction
inspection functions. As ―Specifications for Structures to be built in the Disaster
Areas‖ refers to Earthquake Hazard Zoning Map for the calculation of
acceleration values that will effect the construction, same criticisms as
mentioned in section 6.4 about the deficiencies of Hazard Zoning Map and the
discrepancies between this map and the prioritized lists of settlements according
to the absolute and relative loss are also valid for construction inspection
functions.
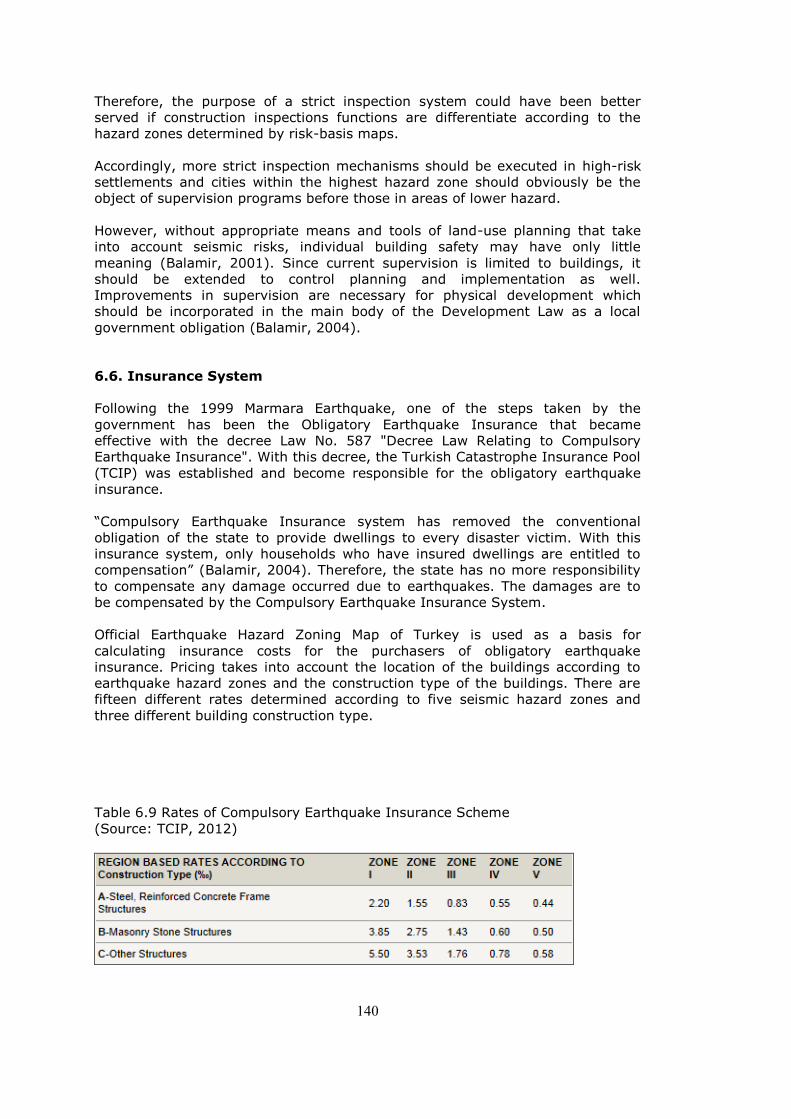
140
Therefore, the purpose of a strict inspection system could have been better
served if construction inspections functions are differentiate according to the
hazard zones determined by risk-basis maps.
Accordingly, more strict inspection mechanisms should be executed in high-risk
settlements and cities within the highest hazard zone should obviously be the
object of supervision programs before those in areas of lower hazard.
However, without appropriate means and tools of land-use planning that take
into account seismic risks, individual building safety may have only little
meaning (Balamir, 2001). Since current supervision is limited to buildings, it
should be extended to control planning and implementation as well.
Improvements in supervision are necessary for physical development which
should be incorporated in the main body of the Development Law as a local
government obligation (Balamir, 2004).
6.6. Insurance System
Following the 1999 Marmara Earthquake, one of the steps taken by the
government has been the Obligatory Earthquake Insurance that became
effective with the decree Law No. 587 "Decree Law Relating to Compulsory
Earthquake Insurance". With this decree, the Turkish Catastrophe Insurance Pool
(TCIP) was established and become responsible for the obligatory earthquake
insurance.
―Compulsory Earthquake Insurance system has removed the conventional
obligation of the state to provide dwellings to every disaster victim. With this
insurance system, only households who have insured dwellings are entitled to
compensation‖ (Balamir, 2004). Therefore, the state has no more responsibility
to compensate any damage occurred due to earthquakes. The damages are to
be compensated by the Compulsory Earthquake Insurance System.
Official Earthquake Hazard Zoning Map of Turkey is used as a basis for
calculating insurance costs for the purchasers of obligatory earthquake
insurance. Pricing takes into account the location of the buildings according to
earthquake hazard zones and the construction type of the buildings. There are
fifteen different rates determined according to five seismic hazard zones and
three different building construction type.
Table 6.9 Rates of Compulsory Earthquake Insurance Scheme
(Source: TCIP, 2012)
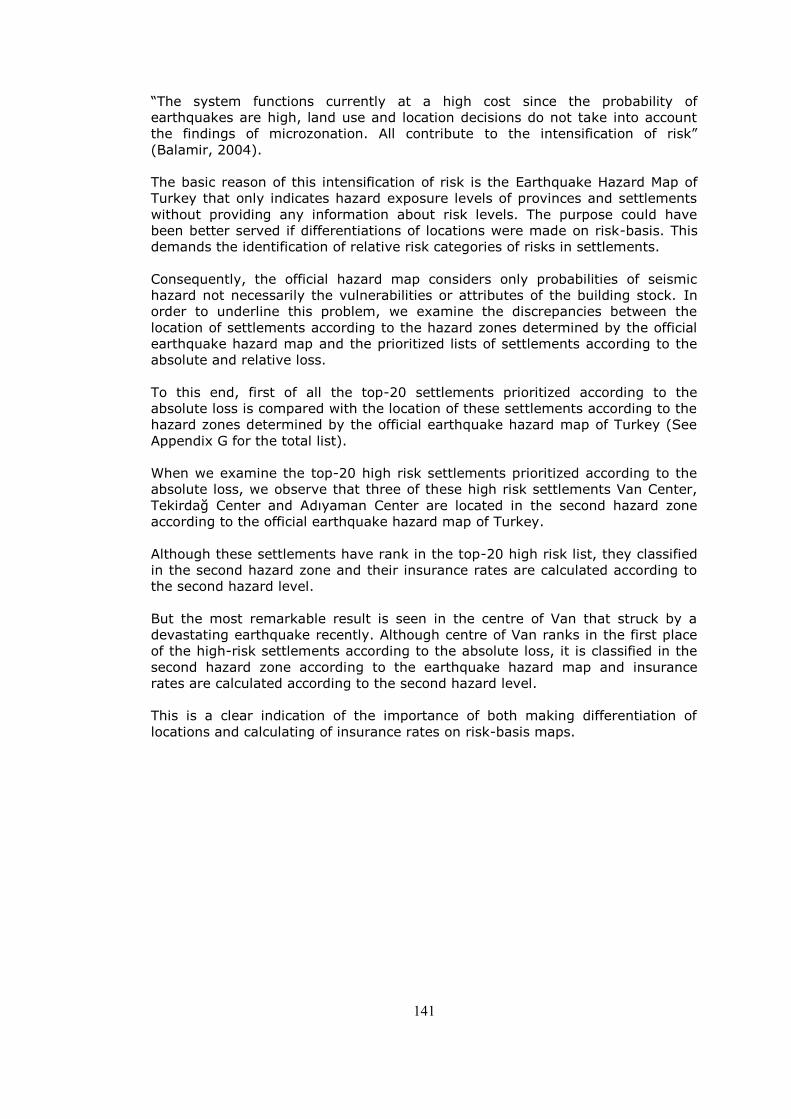
141
―The system functions currently at a high cost since the probability of
earthquakes are high, land use and location decisions do not take into account
the findings of microzonation. All contribute to the intensification of risk‖
(Balamir, 2004).
The basic reason of this intensification of risk is the Earthquake Hazard Map of
Turkey that only indicates hazard exposure levels of provinces and settlements
without providing any information about risk levels. The purpose could have
been better served if differentiations of locations were made on risk-basis. This
demands the identification of relative risk categories of risks in settlements.
Consequently, the official hazard map considers only probabilities of seismic
hazard not necessarily the vulnerabilities or attributes of the building stock. In
order to underline this problem, we examine the discrepancies between the
location of settlements according to the hazard zones determined by the official
earthquake hazard map and the prioritized lists of settlements according to the
absolute and relative loss.
To this end, first of all the top-20 settlements prioritized according to the
absolute loss is compared with the location of these settlements according to the
hazard zones determined by the official earthquake hazard map of Turkey (See
Appendix G for the total list).
When we examine the top-20 high risk settlements prioritized according to the
absolute loss, we observe that three of these high risk settlements Van Center,
Tekirdağ Center and Adıyaman Center are located in the second hazard zone
according to the official earthquake hazard map of Turkey.
Although these settlements have rank in the top-20 high risk list, they classified
in the second hazard zone and their insurance rates are calculated according to
the second hazard level.
But the most remarkable result is seen in the centre of Van that struck by a
devastating earthquake recently. Although centre of Van ranks in the first place
of the high-risk settlements according to the absolute loss, it is classified in the
second hazard zone according to the earthquake hazard map and insurance
rates are calculated according to the second hazard level.
This is a clear indication of the importance of both making differentiation of
locations and calculating of insurance rates on risk-basis maps.
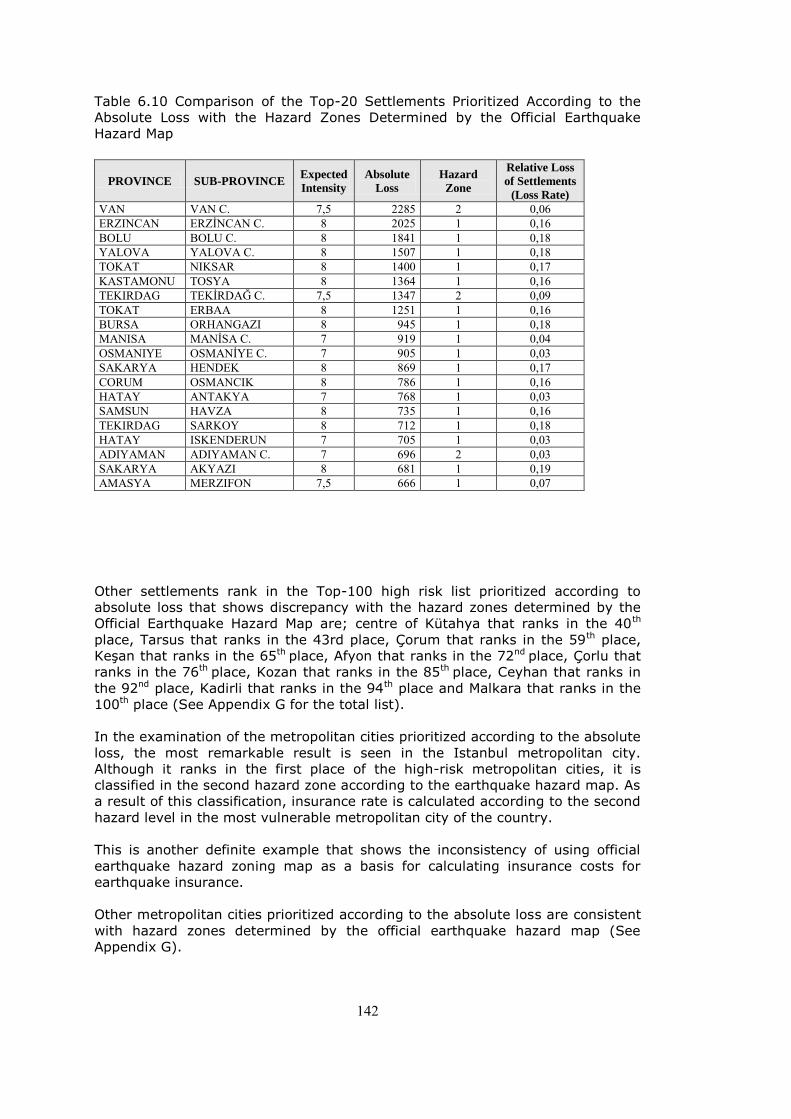
142
Table 6.10 Comparison of the Top-20 Settlements Prioritized According to the
Absolute Loss with the Hazard Zones Determined by the Official Earthquake
Hazard Map
PROVINCE SUB-PROVINCE Expected
Intensity
Absolute
Loss
Hazard
Zone
Relative Loss
of Settlements
(Loss Rate)
VAN VAN C. 7,5 2285 2 0,06 ERZINCAN ERZİNCAN C. 8 2025 1 0,16 BOLU BOLU C. 8 1841 1 0,18 YALOVA YALOVA C. 8 1507 1 0,18 TOKAT NIKSAR 8 1400 1 0,17 KASTAMONU TOSYA 8 1364 1 0,16 TEKIRDAG TEKİRDAĞ C. 7,5 1347 2 0,09 TOKAT ERBAA 8 1251 1 0,16 BURSA ORHANGAZI 8 945 1 0,18 MANISA MANİSA C. 7 919 1 0,04 OSMANIYE OSMANİYE C. 7 905 1 0,03 SAKARYA HENDEK 8 869 1 0,17 CORUM OSMANCIK 8 786 1 0,16 HATAY ANTAKYA 7 768 1 0,03 SAMSUN HAVZA 8 735 1 0,16 TEKIRDAG SARKOY 8 712 1 0,18 HATAY ISKENDERUN 7 705 1 0,03 ADIYAMAN ADIYAMAN C. 7 696 2 0,03 SAKARYA AKYAZI 8 681 1 0,19 AMASYA MERZIFON 7,5 666 1 0,07
Other settlements rank in the Top-100 high risk list prioritized according to
absolute loss that shows discrepancy with the hazard zones determined by the
Official Earthquake Hazard Map are; centre of Kütahya that ranks in the 40th
place, Tarsus that ranks in the 43rd place, Çorum that ranks in the 59th place,
KeĢan that ranks in the 65th place, Afyon that ranks in the 72nd place, Çorlu that
ranks in the 76th place, Kozan that ranks in the 85th place, Ceyhan that ranks in
the 92nd place, Kadirli that ranks in the 94th place and Malkara that ranks in the
100th place (See Appendix G for the total list).
In the examination of the metropolitan cities prioritized according to the absolute
loss, the most remarkable result is seen in the Istanbul metropolitan city.
Although it ranks in the first place of the high-risk metropolitan cities, it is
classified in the second hazard zone according to the earthquake hazard map. As
a result of this classification, insurance rate is calculated according to the second
hazard level in the most vulnerable metropolitan city of the country.
This is another definite example that shows the inconsistency of using official
earthquake hazard zoning map as a basis for calculating insurance costs for
earthquake insurance.
Other metropolitan cities prioritized according to the absolute loss are consistent
with hazard zones determined by the official earthquake hazard map (See
Appendix G).
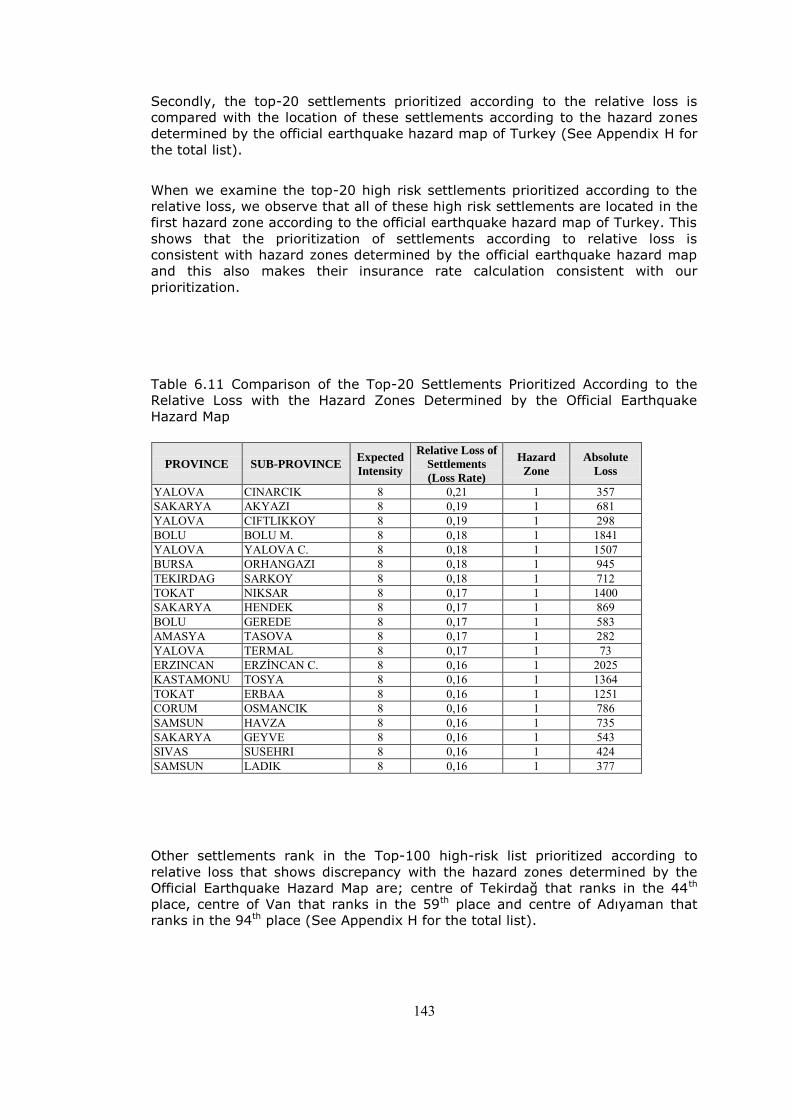
143
Secondly, the top-20 settlements prioritized according to the relative loss is
compared with the location of these settlements according to the hazard zones
determined by the official earthquake hazard map of Turkey (See Appendix H for
the total list).
When we examine the top-20 high risk settlements prioritized according to the
relative loss, we observe that all of these high risk settlements are located in the
first hazard zone according to the official earthquake hazard map of Turkey. This
shows that the prioritization of settlements according to relative loss is
consistent with hazard zones determined by the official earthquake hazard map
and this also makes their insurance rate calculation consistent with our
prioritization.
Table 6.11 Comparison of the Top-20 Settlements Prioritized According to the
Relative Loss with the Hazard Zones Determined by the Official Earthquake
Hazard Map
PROVINCE SUB-PROVINCE Expected
Intensity
Relative Loss of
Settlements
(Loss Rate)
Hazard
Zone
Absolute
Loss
YALOVA CINARCIK 8 0,21 1 357 SAKARYA AKYAZI 8 0,19 1 681 YALOVA CIFTLIKKOY 8 0,19 1 298 BOLU BOLU M. 8 0,18 1 1841 YALOVA YALOVA C. 8 0,18 1 1507 BURSA ORHANGAZI 8 0,18 1 945 TEKIRDAG SARKOY 8 0,18 1 712 TOKAT NIKSAR 8 0,17 1 1400 SAKARYA HENDEK 8 0,17 1 869 BOLU GEREDE 8 0,17 1 583 AMASYA TASOVA 8 0,17 1 282 YALOVA TERMAL 8 0,17 1 73 ERZINCAN ERZİNCAN C. 8 0,16 1 2025 KASTAMONU TOSYA 8 0,16 1 1364 TOKAT ERBAA 8 0,16 1 1251 CORUM OSMANCIK 8 0,16 1 786 SAMSUN HAVZA 8 0,16 1 735 SAKARYA GEYVE 8 0,16 1 543 SIVAS SUSEHRI 8 0,16 1 424 SAMSUN LADIK 8 0,16 1 377 Other settlements rank in the Top-100 high-risk list prioritized according to
relative loss that shows discrepancy with the hazard zones determined by the
Official Earthquake Hazard Map are; centre of Tekirdağ that ranks in the 44th
place, centre of Van that ranks in the 59th place and centre of Adıyaman that
ranks in the 94th place (See Appendix H for the total list).

144
The examination of the metropolitan cities prioritized according to the relative
loss, shows parallel results with other prioritized settlements according to the
relative loss. Metropolitan cities prioritized according to the absolute loss are
consistent with hazard zones determined by the official earthquake hazard map
with the exception of the Istanbul metropolitan city.
Consequently, the comparison of prioritized list of settlements according to both
absolute and relative losses, with the hazard zones determined by the official
earthquake hazard map shows us that the discrepancies is seen more in absolute
losses than relative losses.
The results of the evaluation of insurance schemes show that; absolute loss is a
more distinctive and important factor than relative loss in the evaluation of
insurance schemes.
6.7. National Investment Priorities and Regional Planning
Regional inequalities have been one of the major problems of regional
development policies in Turkey. Although various efforts have been made, socio-
economic disparities between regions have remained as an important
development problem.
First efforts to reduce regional disparities within the country are started with the
identification of Priority Provinces for Development (PPDs) in 1968. PPDs were
defined to address regional inequalities by the State Planning Organization and
over time its objectives have been revised and adjusted according to changing
socio-economic conditions. The scope of PPDs was broadened in 1990s and
reached 49 provinces and 2 districts in 2003. The failure of the PPD policies to
reduce regional inequalities is accepted in the 8th Five Year Development Plan
(2000-2005) and a new investment package is created with Law No. 5084 in
2004 and improved in 2006.
A completely new incentive system was improved in 2009 and the provinces of
Turkey were divided into four regions on the basis of NUTS 2 classification. This
system that support amounts were differentiated among regional groups didn‘t
solve the problems either. Accordingly the latest incentive system Degree No.
2012/3005 ―Concerning State Encouragement to Investment‖ that increases the
number of regions from four to six and differentiates the incentive amounts in
order to provide advantageous schemes for less developed regions is devised in
2012.
The new investment incentive program differentiates from the previous ones
with its province-based categorization. Provinces are divided into six regions in
terms of priority of incentives where the provinces in the Region 6 will take the
highest support and the provinces in Region 1 will take the lowest support.
145
Figure 6.3 Investment Priority Regions
(Source: Ministry of Economy, 2012)
The core of these investment incentive system is to reduce socio-economic and
regional inequalities by increasing the production and employment, providing
economic growth and social improvement. But this drive in economic growth and
social improvement will bring together rapid urbanization, informal settlements
and unstable living environments that will increase the vulnerabilities of cities
and raise the devastating effects of disaster risks.
Accordingly it is crucial to evaluate these investment incentives together with
risk-sensitive planning systems, effective disaster mitigation strategies and strict
building supervision practices in disaster prone cities. But neither the previous
encouragements for investment nor the latest degree ―Concerning State
Encouragement to Investment‖ considers any risk-basis regulatory frameworks.
Another remarkable point of the latest degree is the priorities given to
investments in industries such as defense, pharmaceuticals, mining, rail/sea
transportation, education, tourism and test facilities for automotive/space
industry.
Investments in these prioritized sectors will benefit from rates of the support
measures of Region 5 even they are made in Regions 1, 2, 3 and 4. Most of
these prioritized sectors can be classified as hazardous vulnerable facilities and
should be coordinated with effective disaster mitigation strategies in the risk
prone cities.
Besides, these sectoral priorities without discriminating disparities between
regions are away from to overcome regional disparities and have only
contributed the persistence of inequalities between regions despite the scope of
the system.
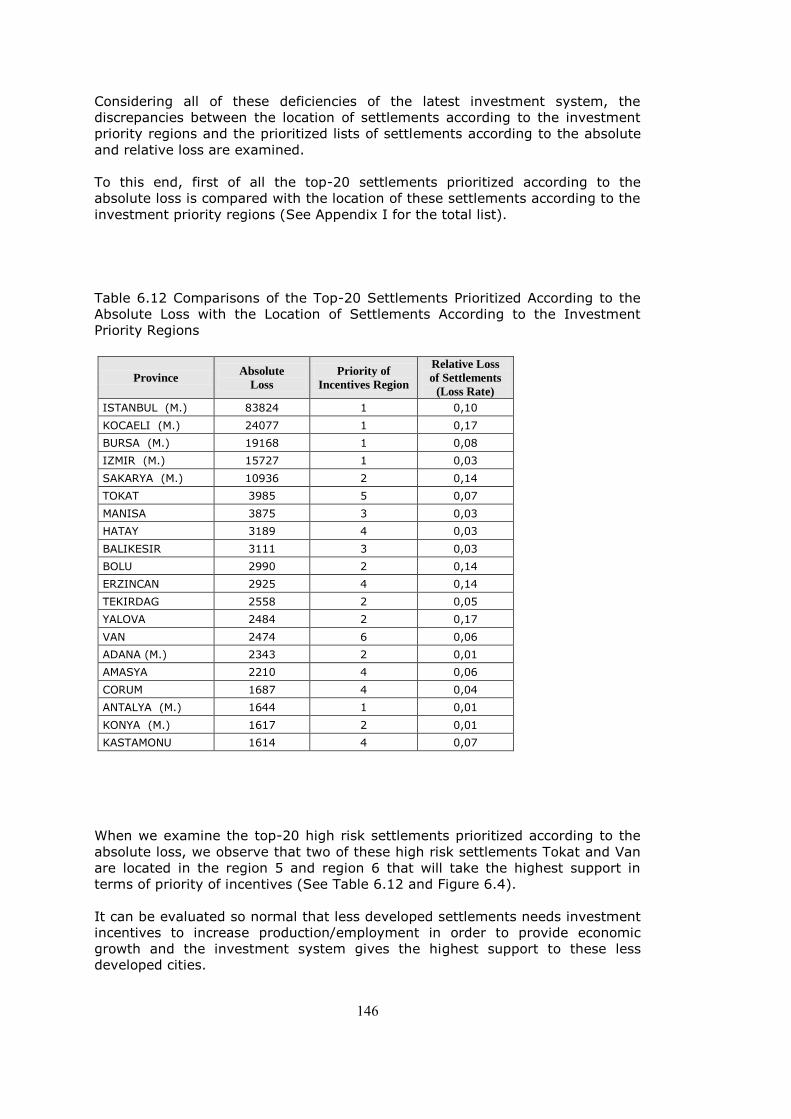
146
Considering all of these deficiencies of the latest investment system, the
discrepancies between the location of settlements according to the investment
priority regions and the prioritized lists of settlements according to the absolute
and relative loss are examined.
To this end, first of all the top-20 settlements prioritized according to the
absolute loss is compared with the location of these settlements according to the
investment priority regions (See Appendix I for the total list). Table 6.12 Comparisons of the Top-20 Settlements Prioritized According to the
Absolute Loss with the Location of Settlements According to the Investment
Priority Regions
Province Absolute
Loss
Priority of
Incentives Region
Relative Loss
of Settlements
(Loss Rate)
ISTANBUL (M.) 83824 1 0,10
KOCAELI (M.) 24077 1 0,17
BURSA (M.) 19168 1 0,08
IZMIR (M.) 15727 1 0,03
SAKARYA (M.) 10936 2 0,14
TOKAT 3985 5 0,07
MANISA 3875 3 0,03
HATAY 3189 4 0,03
BALIKESIR 3111 3 0,03
BOLU 2990 2 0,14
ERZINCAN 2925 4 0,14
TEKIRDAG 2558 2 0,05
YALOVA 2484 2 0,17
VAN 2474 6 0,06
ADANA (M.) 2343 2 0,01
AMASYA 2210 4 0,06
CORUM 1687 4 0,04
ANTALYA (M.) 1644 1 0,01
KONYA (M.) 1617 2 0,01
KASTAMONU 1614 4 0,07
When we examine the top-20 high risk settlements prioritized according to the
absolute loss, we observe that two of these high risk settlements Tokat and Van
are located in the region 5 and region 6 that will take the highest support in
terms of priority of incentives (See Table 6.12 and Figure 6.4).
It can be evaluated so normal that less developed settlements needs investment
incentives to increase production/employment in order to provide economic
growth and the investment system gives the highest support to these less
developed cities.

147
But the specious point of the system is; although these settlements have rank in
the top-20 high risk list, they classified in the highest support regions according
to investment priority regions without taking any effective disaster mitigation
and supervision strategies.
This inconsistent point of the system can be clearly seen in the example of Van,
although the centre of Van is struck by a devastating earthquake recently and
the city is highly vulnerable to seismic risks, the investors are supported
especially in such industries mentioned above by the government without any
mitigation and supervision strategies. This is a clear indication that the
government didn‘t take any lessons from the devastating effects of earlier
earthquakes.
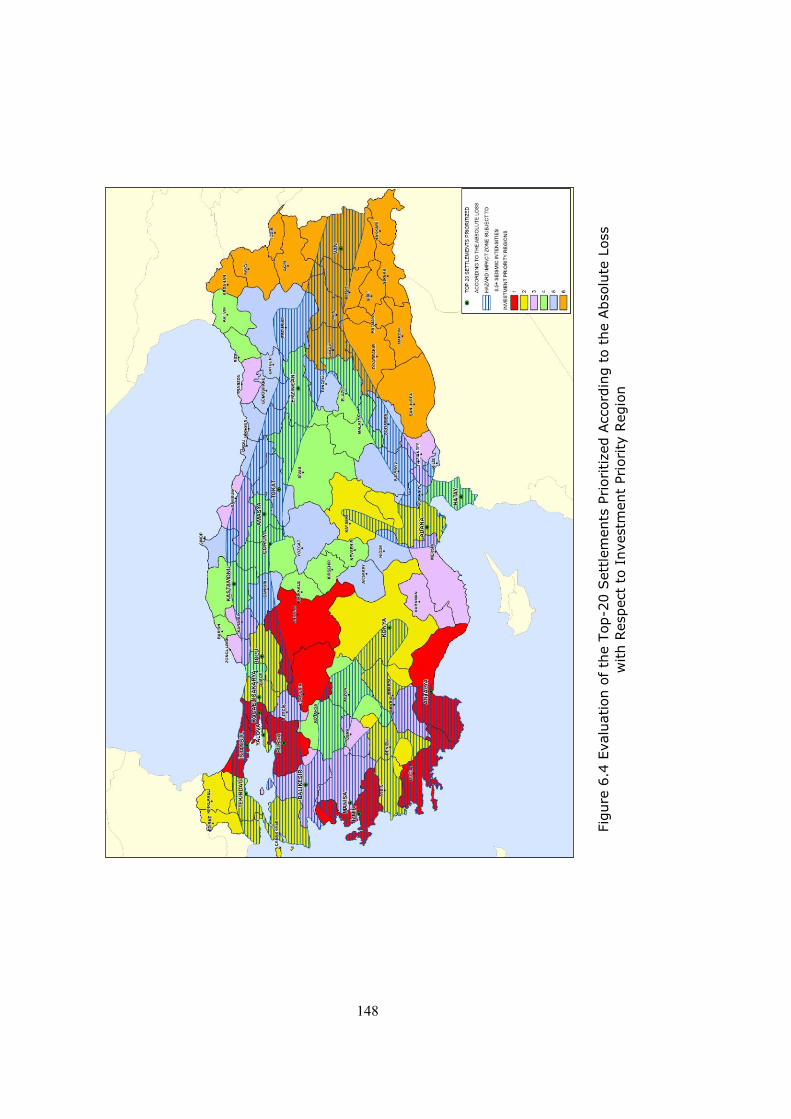
148
Figure 6.4 Evaluation of the Top-20 Settlements Prioritized According to the
Absolute Loss with Respect to Investment Priority Region
Fig
ure
6.4
Evalu
ation o
f th
e T
op-2
0 S
ett
lem
ents
Prioritized A
ccord
ing t
o t
he A
bsolu
te L
oss
with R
espect
to I
nvestm
ent
Pri
ority
Regio
n
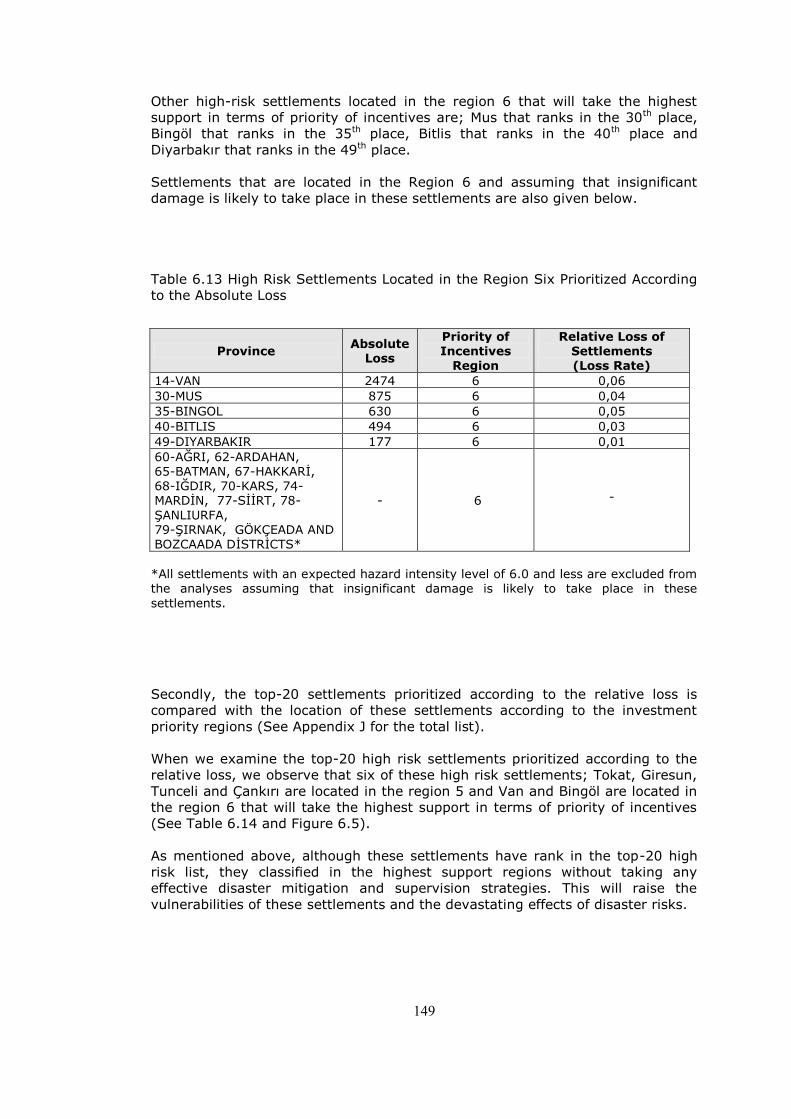
149
Other high-risk settlements located in the region 6 that will take the highest
support in terms of priority of incentives are; Mus that ranks in the 30th place,
Bingöl that ranks in the 35th place, Bitlis that ranks in the 40th place and
Diyarbakır that ranks in the 49th place.
Settlements that are located in the Region 6 and assuming that insignificant
damage is likely to take place in these settlements are also given below.
Table 6.13 High Risk Settlements Located in the Region Six Prioritized According
to the Absolute Loss
Province Absolute
Loss
Priority of Incentives
Region
Relative Loss of Settlements (Loss Rate)
14-VAN 2474 6 0,06
30-MUS 875 6 0,04
35-BINGOL 630 6 0,05
40-BITLIS 494 6 0,03
49-DIYARBAKIR 177 6 0,01
60-AĞRI, 62-ARDAHAN, 65-BATMAN, 67-HAKKARĠ, 68-IĞDIR, 70-KARS, 74-MARDĠN, 77-SĠĠRT, 78-
ġANLIURFA, 79-ġIRNAK, GÖKÇEADA AND BOZCAADA DĠSTRĠCTS*
- 6 -
*All settlements with an expected hazard intensity level of 6.0 and less are excluded from the analyses assuming that insignificant damage is likely to take place in these
settlements.
Secondly, the top-20 settlements prioritized according to the relative loss is
compared with the location of these settlements according to the investment
priority regions (See Appendix J for the total list).
When we examine the top-20 high risk settlements prioritized according to the
relative loss, we observe that six of these high risk settlements; Tokat, Giresun,
Tunceli and Çankırı are located in the region 5 and Van and Bingöl are located in
the region 6 that will take the highest support in terms of priority of incentives
(See Table 6.14 and Figure 6.5).
As mentioned above, although these settlements have rank in the top-20 high
risk list, they classified in the highest support regions without taking any
effective disaster mitigation and supervision strategies. This will raise the
vulnerabilities of these settlements and the devastating effects of disaster risks.
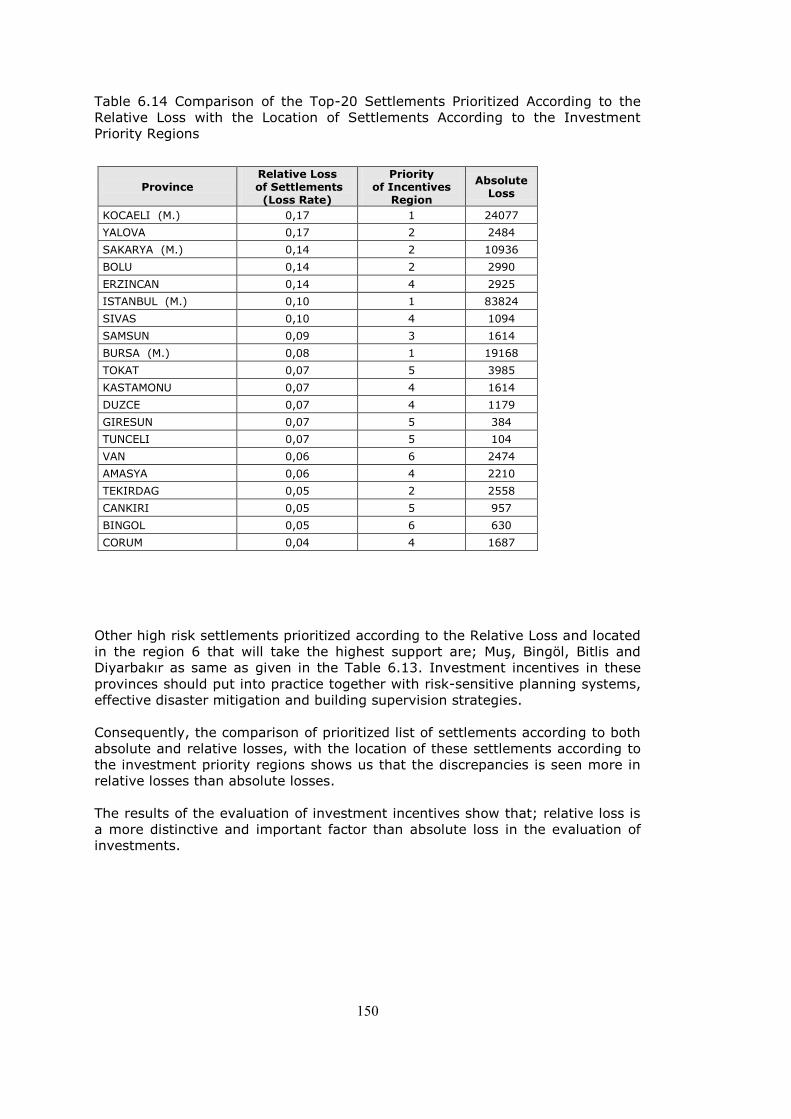
150
Table 6.14 Comparison of the Top-20 Settlements Prioritized According to the
Relative Loss with the Location of Settlements According to the Investment
Priority Regions
Province Relative Loss
of Settlements (Loss Rate)
Priority of Incentives
Region
Absolute Loss
KOCAELI (M.) 0,17 1 24077
YALOVA 0,17 2 2484
SAKARYA (M.) 0,14 2 10936
BOLU 0,14 2 2990
ERZINCAN 0,14 4 2925
ISTANBUL (M.) 0,10 1 83824
SIVAS 0,10 4 1094
SAMSUN 0,09 3 1614
BURSA (M.) 0,08 1 19168
TOKAT 0,07 5 3985
KASTAMONU 0,07 4 1614
DUZCE 0,07 4 1179
GIRESUN 0,07 5 384
TUNCELI 0,07 5 104
VAN 0,06 6 2474
AMASYA 0,06 4 2210
TEKIRDAG 0,05 2 2558
CANKIRI 0,05 5 957
BINGOL 0,05 6 630
CORUM 0,04 4 1687
Other high risk settlements prioritized according to the Relative Loss and located
in the region 6 that will take the highest support are; MuĢ, Bingöl, Bitlis and
Diyarbakır as same as given in the Table 6.13. Investment incentives in these
provinces should put into practice together with risk-sensitive planning systems,
effective disaster mitigation and building supervision strategies.
Consequently, the comparison of prioritized list of settlements according to both
absolute and relative losses, with the location of these settlements according to
the investment priority regions shows us that the discrepancies is seen more in
relative losses than absolute losses.
The results of the evaluation of investment incentives show that; relative loss is
a more distinctive and important factor than absolute loss in the evaluation of
investments.

151
Figure 6.5 Evaluation of the Top-20 Settlements Prioritized According to the
Relative Loss with Respect to Investment Priority Regions
Fig
ure
6.5
Evalu
ation o
f th
e T
op-2
0 S
ett
lem
ents
Prioritized A
ccord
ing t
o t
he R
ela
tive
Loss w
ith R
espect
to I
nvestm
ent
Priority
Regio
ns
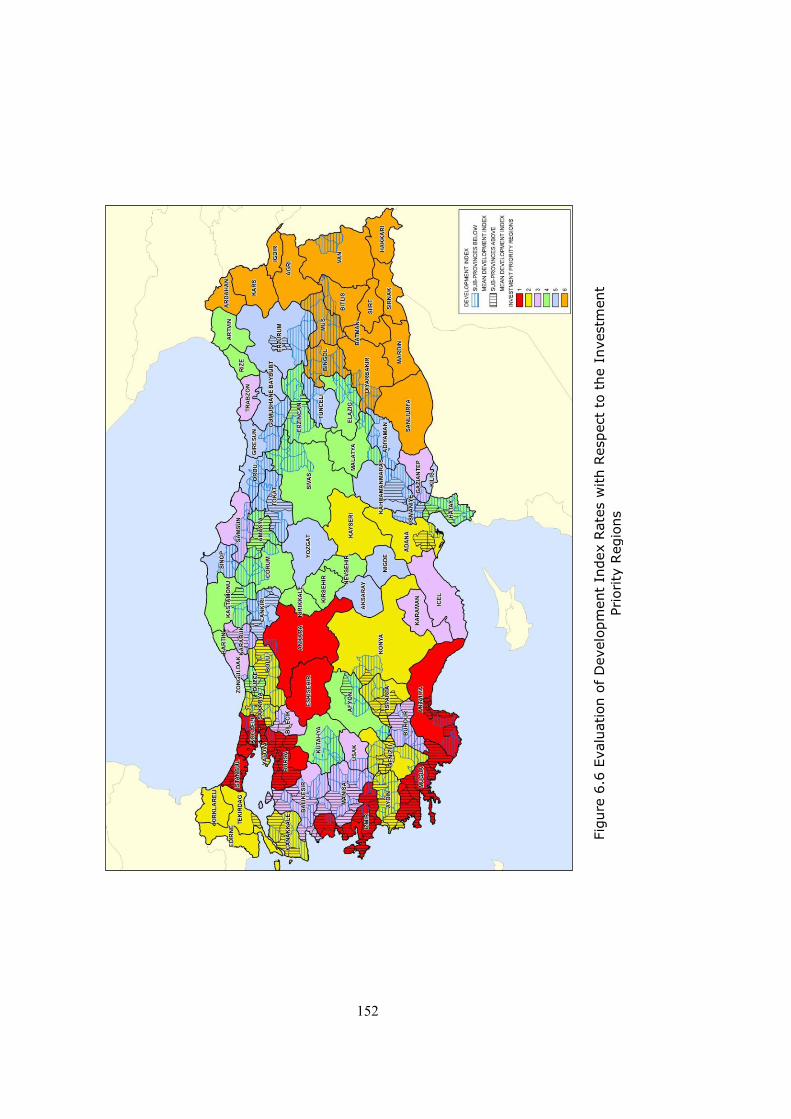
152
Figure 6.6 Evaluation of Development Index Rates with Respect to the
Investment Priority Regions
Fig
ure
6.6
Evalu
ation o
f D
evelo
pm
ent
Index R
ate
s w
ith R
espect
to t
he I
nvestm
ent
Priority
Regio
ns
153
CHAPTER 7
CONCLUSION AND FURTHER LINES OF INVESTIGATION
Chronic seismic hazards and resulting secondary impacts as natural conditions of
the country, and loss of robust building and prudent settlement practices as
aggravated by rapid population growth make cities the most vulnerable
geographical and social entities in Turkey. In contrast, Turkish disaster policy is
solely focused on post-disaster issues and no incentives or provision exist to
encourage risk analysis or risk mitigation approaches, despite current
international efforts.
For the development of risk reduction policies an essential step is to prioritize
settlements according to their vulnerability levels. This is determined by hazard
probabilities and attributes of the building stock of each settlement.
Measurement of vulnerability levels allows the ordering of settlements into risk
categories.
Quantitative information about a set of attributes of settlements is investigated
statistically to determine which of the factors contribute most to risk levels
described locally. The seismic hazard maps of the Kandilli Observatory and
Earthquake Research Institute (KOERI), Erdik estimations of seismicity and
statistics published by the Turkish Statistical Institute (TurkStat), like census and
housing data have a leading contribution to make.
In order to determine the seismic vulnerabilities and risks of settlements,
disaster component that reveals the settlement level loss in building stock is
examined on one side and the basic attributes of settlements and their effects on
loss levels on the other side. This double sided process generates the dependent
and independent variables of the research.
In the determination of seismic vulnerabilities and risks of settlements, loss
levels in the building stock in each settlement evaluated based on seismic hazard
intensity via seismic hazard maps produced by KOERI and building stock
vulnerability curves derived by Demircioglu. Settlement level loss in the building
stock is the basic indicator of assumed overall vulnerability (risk) and provides
the dependent variables of the research.
Y1 that is determined as Absolute Loss is the first dependent variable of the
research and composed of the total number of building loss. Y2 that is determined
as Relative Loss is the other dependent variable of the research and composed of
the ratio of loss to the total building stock
Vulnerability levels of settlements are then assumed to depend on a number of
attributes of cities to explore if vulnerability could be related to a set of urban
properties.
The basic attributes of settlements are composed of building inventory data and
related attributes of building stock on each settlement obtained from TurkStat.
154
‗Building Construction Statistics‘, ‗Building Census‘ and ‗Population Census‘
prepared by TurkStat and ‗Development Index‘ prepared by State Planning
Organization is used within this research.
Attributes of settlements that are assumed to contribute to vulnerabilities and
estimated loss are measurable indicators as independent variables. In terms of
available data independent variables of the research are determined as; X1 =
Settlement Population, X2 = Population Growth Rate (%o), X3 = Rates of
Agglomeration, X4 = Population/Total Number of Buildings, X5 = Development
Index.
Although absolute loss may represent a concrete measure of loss, relative loss in
settlements also is taken into account. Small settlements with low values of
absolute loss, but with high ratios may indicate greater impact and disturbance
of hazard in urban life, than loss of similar or higher magnitude but smaller
ratios in the larger cities or metropolitan agglomerations. Therefore the level of
loss in each category of building types in each settlement is expressed both in
absolute terms (total number of buildings lost) and in relative terms (ratio of loss
to the total building stock/loss rate).
After determining the level of loss both in absolute terms (total number of
buildings lost) and relative terms (ratio of loss to the total building stock), and
the attributes of settlements that are assumed to contribute to vulnerabilities, all
settlements in each size category are prioritized according to absolute and
relative losses.
The top-20 settlements for 0-50.000 population are significantly above the
category averages in terms of ‗settlement population‘ and ‗rate of
agglomeration‘. The average rates of growth and development indices are either
negative or very small. Many of the settlements in this category are stagnant or
in the process of negative growth.
Greater numbers of settlements that take place in the upper 20 in this category
have relatively central status within their sub-province. Rates of agglomeration
for these settlements are more or less leveled in the sub-province with the rural
population. Only a few of these settlements represent stronger agglomeration
centers. These also indicate positive growth and development.
Top-20 Settlements for 0-50.000 Population Prioritized According to
Absolute Loss are; 1-Niksar (Tokat), 2-Tosya (Kastamonu), 3-Hendek (Sakarya),
4-Osmancık (Çorum), 5-Havza (Samsun), 6-ġarköy (Tekirdag), 7-Akyazı
(Sakarya), 8-Suluova (Amasya), 9-Üzümlü (Erzincan), 10-Gerede (Bolu), 11-
Geyve (Sakarya), 12-Ayvalık (Balıkesir), 13-SuĢehri (Sivas), 14-Burhaniye
(Balıkesir), 15-Pamukova (Sakarya), 16-Varto (Mus), 17-Ladik (Samsun), 18-
Çınarcık (Yalova), 19-ÇeĢme (Ġzmir), 20-YeniĢehir (Bursa).
Top-20 Settlements for 0-50.000 Population Prioritized According to
Relative Loss are; 1-Çınarcık (Yalova), 2-Akyazı (Sakarya), 3-Çiftlikköy (Yalova),
4-ġarköy (Tekirdag), 5-Niksar (Tokat), 6-Hendek (Sakarya), 7-Gerede (Bolu), 8-
TaĢova (Amasya), 9-Termal (Yalova), 10-Tosya (Kastamonu), 11-Osmancık
(Corum), 12-Havza (Samsun), 13-Geyve (Sakarya), 14-SuĢehri (Sivas), 15-
Ladik (Samsun), 16-Ilgaz (Çankırı), 17-ReĢadiye (Tokat), 18-Yeniçağa (Bolu),
19-Çamoluk (Giresun), 20-Pülümür (Tunceli).
155
In contrast to the previous category of settlements, many cases in 50.000-
490.00 population categories prove high levels of absolute loss determined less
dependently on strength of seismic shake and there are variations in seismic
intensity levels and rates of loss. Apart from a very few of the cases here, rates
of loss seem to be lower than observed in the previous category and almost half
of the top 20 in the list have higher rates than the average rate for this
category.
Rate of population increases in 50.000-490.00 population category and almost
identical rates of growth are observed. Apart from the province center of
Erzincan, all settlements are in the process of growth, and half of the top 20 at
higher rates than the average rate for this category. This is further confirmed by
the development index figures, again half of the top 20 at higher rates than the
average development index for this category.
Stronger agglomeration is observed in this category of settlements, compared to
the weak agglomeration rates of the previous category of settlements, even
though growth is also an attribute of the rural context for settlements.
Top-20 Settlements for 50.000-490.000 Population Prioritized According
to Absolute Loss are; 1-Van Central, 2-Erzincan Central, 3-Bolu Central, 4-
Yalova Central, 5-Tekirdag Central, 6-Erbaa (Tokat), 7-Orhangazi (Bursa), 8-
Manisa Central, 9-Osmaniye Central, 10-Antakya (Hatay), 11-Ġskenderun
(Hatay), 12-Adiyaman Central, 13-Merzifon (Amasya), 14-Turgutlu (Manisa), 15-
Düzce Central, 16-Denizli Central, 17-Akhisar (Manisa), 18-Ġnegöl (Bursa), 19-
Tokat Central, 20-Salihli (Manisa).
Top-20 Settlements for 50.000-490.000 Population Prioritized According
to Relative Loss are; 1-Bolu Central, 2-Yalova Central, 3-Orhangazi (Bursa), 4-
Erzincan Central, 5-Erbaa (Tokat), 6-Tekirdağ Central, 7-Merzifon (Amasya), 8-
Düzce Central, 9-Van Central, 10-Manisa Central, 11-Ġnegöl (Bursa), 12-Salihli
(Manisa), 13-Bandirma (Balıkesir), 14-Çanakkale Central, 15-Amasya Central,
16-MustafakemalpaĢa (Bursa), 17- Osmaniye Central, 18-Antakya (Hatay), 19-
Ġskenderun (Hatay), 20-Adiyaman Central.
Ordering seems to follow seismic intensities rather than absolute size of the
building stock in metropolitan provinces and a very distinct group of four
metropolitan cities (Kocaeli, Sakarya, Ġstanbul, Ġzmir) with high ratio of loss are
observed.
The top 20 of the settlements for metropolitan cities are significantly below the
category averages in terms of ‗settlement population‘ and ‗development index‘.
Metropolitan Provinces Prioritized According to Absolute Loss Levels are;
Ġstanbul, Kocaeli Bursa, Ġzmir, Sakarya, Adana, Antalya, Konya, Erzurum.
Metropolitan Provinces Prioritized According to Relative Loss Levels are;
Kocaeli, Sakarya, Ġstanbul, Bursa, Ġzmir, Adana, Antalya, Konya, Erzurum.
These prioritized lists of settlements according to their vulnerability levels should
be accepted as the basis of the mitigation policies in higher-risk settlements and
these cities within the highest hazard zone should obviously be the object of
mitigation programs before those in areas of lower hazard.
156
Priorities of mitigation planning should be constituted with respect to these
prioritized lists of settlements according to their vulnerability levels and it should
be compulsory to prepare mitigation plans for the settlements that have rank in
the top-20 high risk lists.
Effective disaster mitigation strategies and more strict legal regulations about
preparation of mitigation plans should be executed in these higher-risk
settlements and cities within the highest hazard zone. Although, cities within the
highest risk zones should obviously be the object of more strict inspection
mechanisms than those of lower risks.
Urban standards for land use management as well as building construction are
essential elements of disaster mitigation and it should be taken into
consideration that different seismic intensity levels have different requirements
of standards.
Land-use planning and zoning, planning of open-spaces, transportation and
infrastructure planning are all distinct aspects of disaster mitigation and all these
systems are to be implemented at different standards according to risk levels.
Rigorous implementation and enforcement of differentiated standards according
to risk levels must be the highest priority for reducing risk factors, vulnerabilities
and potential losses.
Appropriate locational differentiation is a crucial input in engineering design
safety of buildings based on risk maps. Urban planning standards and principles
together with risk-minimizing planning systems could effectively serve to
mitigate risks and promote strict building supervision practices in these disaster
prone cities. To this end, urban planning standards and principles could be
determined according to risk levels/zones determined by vulnerability maps and
more strict planning standards could be executed in these higher-risk
settlements. Although, it is crucial to evaluate investment incentives together
with risk-sensitive planning systems, effective disaster mitigation strategies and
strict building supervision practices in disaster prone cities.
Besides providing guiding principles for effective mitigation practices in Turkey by
ordering settlements and offer means of differential implementation, another
purpose of the study is to investigate the relations between measures of
vulnerability (dependent variables) and contributing attributes (independent
variables) by means of regression methods.
Best subsets regression analyses are employed to determine what combinations
of the independent variables might best denote city-level risks. The results of the
best subsets analyses give us the ―most appropriate combination‖ for the
regression analyses.
The results of best subsets regression analyses of top-20 settlements for
the first category, that considers settlements having population up to 50.000,
shows that X1 (settlement population) and X5 (development index) are the most
effective independent variables that correlates with both dependent variables.
Six regression analyses are performed according to the results of best subsets
regression analyses for Category I, which considers settlements having
population up to 50.000.
157
These are; Regression Analysis: Y1 (absolute loss) versus X1 (settlement
population), Y1 versus X5 (development index), Y2 (rate of loss) versus X1
(settlement population), Y2 versus X3 (rates of agglomeration), Y2 versus X4
(population /total number of buildings) and Y2 versus X5 (development index).
The results of best subsets regression analyses of top-20 settlements for
the second category, that considers settlements having population between
50.000 and 490.000, shows that X4, the ratio of population to total number of
buildings, is the most effective and only independent variable that correlates
with both dependent variables.
Four regression analyses are performed according to the results of best subsets
regression analyses for Category II that considers settlements having population
between 50.000 and 490.000. These are; Regression Analysis: Y1 (absolute
loss) versus X2 (population growth rate), Y1 versus X4 (population /total
number of buildings), Y2 (rate of loss) versus X1 (settlement population), and Y2
versus X4 (population /total number of buildings.
The results of best subsets regression analyses for the third category,
that considers metropolitan cities, shows that X3 (Rates of Agglomeration) and
X4 (Population/Total Number of Buildings) are the most effective independent
variables that correlates with both dependent variables.
Five regression analyses are performed according to the results of best subsets
regression analyses for Category III that considers metropolitan cities. These
are; Regression Analysis: Y1 (absolute loss) versus X1 (settlement population),
Y1 versus X3 (rates of agglomeration), Y1 versus X4 (population /total number
of buildings), Y2 (rate of loss) versus X3 (rates of agglomeration) and Y2 versus
X4 (population /total number of buildings).
After obtaining the ―most appropriate combinations‖ for the regression analyses
by best subsets regression analyses, regression analyses are performed in all
settlements in each size category.
Six regression analyses are performed according to the results of best
subsets regression analyses for Category I, which considers settlements having
population up to 50.000. The results of these analyses show that; Y1 (absolute
loss) has no relations with independent variables, Y2 (rate of loss) has weak
relations with X3 (rates of agglomeration), X4 (population /total number of
buildings) and X5 (development index).
Four regression analyses are performed according to the results of best
subsets regression analyses for Category II, which considers settlements having
population between 50.000-490.000 inhabitants. The results of these analyses
show that; Y1 (absolute loss) has no relations with X2 (population growth rate)
and weak relations with X4 (population /total number of buildings). Y2 (rate of
loss) has weak relations with X1(settlement population) and no relations with X4
(population/ total number of buildings).
Five regression analyses are performed according to the results of best
subsets regression analyses for Category III, which considers metropolitan cities.
158
The results of these analyses show that; Y1 (absolute loss) has strong relations
with X1 (settlement population), no relation with X3 (rates of agglomeration)
and weak relations with X4 (population / total number of buildings). Y2 (rate of
loss) has weak relations with X3 (rates of agglomeration) and X4 (population
/total number of buildings).
As a result of these analyses we can say that Absolute Loss (YI) has no
significant relations with independent variables of settlements in Category I that
have populations up to 50.000 and settlements in Category II that have
populations between 50.000 and 490.000. Disparately, Absolute Loss is strongly
related with settlement populations of metropolitan cities in Category III.
When we examine the results of analyses according to Relative Loss/Rate of Loss
(Y2), we can say that Rate of Loss has weak relations both with independent
variables of settlements in Category I that have populations up to 50.000,
settlements in Category II that have populations between 50.000 and 490.000,
and metropolitan cities in Category III.
Consequently, results of statistical analyses indicate that total building loss is
related to the ratio of population over the total number of buildings in mid-range
settlements, and directly related to population in metropolitan cities. Relative
loss on the other hand is related with rate of agglomeration and development
index in almost every size category of settlements.
For further lines of investigation, the results of this study can be converted into
more precise information on actual volume of building stock by converting the
loss in number of buildings by estimations of building floor area. Still further, it is
possible to have an economic estimation of the loss in physical stock by taking
into consideration the building costs and values.
159
REFERENCES
Adanalı, Y.A., Urban transformation and law on disaster prevention: A pretext for
lucrative investment, Perspectives - Political Analysis and Commentary from
Turkey #3, Heinrich Böll Stiftung – Turkey Representation, 2012.
African Development Bank (AFDB), Guidelines for Mainstreaming Disaster Risk
Assessment in Development, 2004.
Akalın Ġ. and Sürel C.S., Turkey: The Biggest Construction Site on Earth: Turkey
What to Expect From the Urban Regeneration Law, Newsletter on Turkish Law
Developments - Hergüner Bilgen Özeke Attorney Partnership, 2012.
Asian Disaster Preparedness Centre (ADPC), Urban Governance and Community
Resilience Guides, World Disaster Reduction Campaign on Making Cities
Resilient, 2010.
Balamir M., Prioritization of High Seismic Risk Provinces and Public Buildings,
2011.
Balamir M., 1999 Depremlerinden 10 Yıl Sonra Türkiye Nerede? Uluslararası
Afetler Politikasındaki GeliĢmeler Açısından Bir Ġrdeleme, 2009.
Balamir M., Seismic Risks and Urban Mitigation Planning, chapter in the text
book entitled; Tomorrow at Risk: Disasters in Europe and Greece, edited by
Sapountzaki, HUA, TYPOTHETO - George Dardanos, Greece, 2007.
Balamir M., Seismic Mitigation Efforts in Istanbul: ISMEP Projects Short of
Mitigation Planning, DPRI-IIASA Meeting, Istanbul, 2006.
Balamir M., Challenges and Methodology for Preventing Major Urban Risks:
Designing a Prevention Policy, EUROPE-MENA Urban Network the Cities Meetings
Preventing Major Urban Risks, Amman, 2005.
Balamir M., Local Administration and Risk Management, The Role of Local
Governments in Reducing the Risk of Disasters, Demeter K., Guner A., Erkan N.
E. (eds.), Center of Local Government Studies and Training, Marmara University,
Istanbul, 2004.
160
Balamir M., Urban Seismic Risk Management: The Earthquake Master Plan of
Istanbul (EMPI), 13th World Conference on Earthquake Engineering, Vancouver,
Canada, 2004.
Balamir M., Painful Steps of Progress from Crisis Planning to Contingency
Planning: Proposed and Realized Changes for Disaster Preparedness in Turkey‘,
The Journal of Contingencies and Crisis Management, Leiden 10: 1, 2002.
Balamir M., Recent Changes in Turkish Disasters Policy: A Strategic
Reorientation, in Kleindorfer, Mitigation and Financing of Seismic Risks: Turkish
and International Perspectives, Paul and Sertel (eds.), Dordrecht: Kluwer
Academic Publishers, 2001.
Balamir M., Disaster Policies and Social Organisation, Disaster and Social Crisis
Research Network sessions: 5th Conference of ESA, Helsinki, 2001.
Balamir M., Reproducing the Fatalist Society: An Evaluation of the Disasters and
Development Laws and Regulations in Turkey, in Urban Settlements and Natural
Disasters, ed. E. Komut, UIA and Chamber of Architects of Turkey, 1999.
Banba M, et al., Analysis of Land Use Management for Earthquake Disaster
Reduction in the Asia Pacific Region, 2004.
Bayhan F., Impacts Of Planning Decisions in an Earthquake Vulnerable City: The
Case of Adapazarı, Unpublished Master Thesis, Middle East Technical University,
2010.
Benton M., The Richter, The Modified Mercalli and The Moment Magnitude Scale,
last accessed date December 2012.
Available at: http://studyoftheearth3.wikispaces.com/
Bogardi J.J., Measuring Vulnerability to Natural Hazards: Towards Disaster
Resilient Societies, edited by Jörn Birkmann, United Nations University Press,
2006.
Boulle P., Luc V and Elina P., Vulnerability Reduction for Sustainable Urban
Development, Disasters: 5, 1991.
Briceno S., Building Disaster Resilient Communities: The road to the World
Conference on Disaster Reduction January 2005, Kobe, Hyogo, Japan, 2004.
Burby J. R., Cooperating with Nature: Confronting natural hazards with land-use
planning for sustainable communities, Joseph Henry Press, Washington DC.
1998.
161
Cardona O.D., The Need for Rethinking the Concepts of Vulnerability and Risk
from a Holistic Perspective: A Necessary Review and Criticism for Effective Risk
Management in Mapping Vulnerability: Disasters, Development and People,
London, UK: Earthscan Publishers, 2004.
Centre for Research on the Epidemiology of Disasters (CRED), Annual Disaster
Statistical Review-2010, The numbers and trends, 2010.
Coburn A. and R. Spence, Factors Determining Human Casualty Levels in
Earthquakes: Mortality Prediction in Building Collapse, 10th World Conference on
Earthquake Engineering, Spain, 1992.
Coburn A. and Spence R., Earthquake Protection, John Wiley and Sons Ltd.,
England, 1992.
Coburn A., Disaster Prevention and Mitigation in Metropolitan Areas: Reducing
Urban Vulnerability in Turkey, in Informal Settlements, Environmental
Degradation and Disaster Vulnerability: The Turkey Case Study, eds. R. Parker,
A. Kreimer, M. Munasinghe, IDNDR and the World Bank, Washington, D.C., 1995.
Columbia University International Urban Planning Studio Disaster Resistant
Istanbul, Urban Planning Studio of Graduate School of Architecture, Planning and
Preservation, and Lamont-Doherty Earth Observatory, unpublished report, 2002.
Columbia University International Urban Planning Studio Disaster Resistant
Caracas, Urban Planning Studio of Graduate School of Architecture, Planning and
Preservation, and Lamont-Doherty Earth Observatory, unpublished report, 2001.
Cozzi S., Menoni S. et.al., Natural risk prevention and land-use planning in Italy:
Strengths and weaknesses of a system stretched between centralized and
decentralized authorities. In: Fleischhauer, M., Greiving, S. & Wanczura, S.
(editors), Natural hazards and planning in Europe, Dortmund, 2006.
Crowley H., Colombi M., Borzi B., Faravelli M., Onida M., Lopez M.,Polii D.,
Meroni F. and Pinho R., A Comparison of Seismic Risk Maps for Italy, BEE, 2008.
Demircioğlu M.B., Earthquake Hazard and Risk Assessment for Turkey,
Unpublished PhD Thesis, Boğaziçi University, 2010.
DRM, Seismic Microzonation for Municipalities Manual, World Institute for
Disaster Risk Management, last accessed date 22.09.2004
Available at: http://www.drmonline.net/drmlibrary.
162
EM-DAT, The OFDA/CRED International Disaster Database, Université Catholique
de Louvain, Brussels, Belgium, last accessed date 26.08.2011. Available at:
http://www.emdat.be/
EMS-98, European macroseismic scale 1998, Cahiers du Centre Européen de
Géodynamique et de Séismologie. Conseil de l'Europe. Luxembourg, Grünthal, G.
(editor), 1998.
Erdik, M. and N. Aydınoglu, Earthquake Performance and Vulnerability of
Buildings in Turkey, The World Bank Group Disaster Management Facility Report,
2002.
Earthquake Masterplan for Istanbul (EMPI), Bogazici University, Istanbul
Technical University, Middle East Technical University and Yildiz Technical
University, The Metropolitan Municipality of Istanbul, last accessed date
12.08.2003.
Available at: http://www.koeri.boun.edu.tr/depremmuh/IBB.IDMP.ENG.pdf
FEMA, Estimated Annualized Earthquake Losses for the United States, Federal
Emergency Management Agency, Washington DC, USA, 2008.
FEMA, Federal Emergency Management Agency, last accessed date December
2012. Available at: http://www.fema.gov/
Gencer E., Vulnerability in Hazard-Prone Megacities: An Overview of Global
Trends and the Case of the Istanbul Metropolitan Area, Summer Academy for
Social Vulnerability, 2007.
Global Assessment Report on Disaster Risk Reduction (GAR), United Nations
Inter-Agency Secretariat of the International Strategy for Disaster Reduction
UNISDR, 2011.
Global Assessment Report on Disaster Risk Reduction (GAR), United Nations
Inter-Agency Secretariat of the International Strategy for Disaster Reduction
UNISDR, 2009.
Godschalk D. R., Beatley T., Berke P., Brower D. J., Kaiser E. J., Natural Hazard
Mitigation: Recasting Disaster Policy and Planning, Island Press, Washington, D.
C. , 1999.
Greene A., A Process Approach to Project Risk Management, Doctoral research
workshop: Construction Process Research, Loughborough University, 2000.
163
Istanbul Seismic Risk Mitigation and Emergency Preparedness Project (ISMEP),
2010.
JICA, Country Strategy Paper for Natural Disasters in Turkey, Final Report,
Ankara, 2004.
JICA-IBB, The Study on A Disaster Prevention / Mitigation Basic Plan in Istanbul
including Seismic Microzonation in the Republic of Turkey, 2002.
Johnson C., Regulatory frameworks for reducing disaster risk through planning
and building, 2012.
Kandilli Observatory and Earthquake Research Institute (KOERI), Earthquake
Risk Assessment for Istanbul Metropolitan Area, Report prepared for American
Red Cross and Turkish Red Crescent, Bogaziçi University, 2002.
Kandilli Observatory and Earthquake Research Institute (KOERI), An Earthquake
Damage Scenario and Earthquake Master Plan for the city of Izmir, last accessed
date September 2000, Available at:
http://www.koeri.boun.edu.tr/depremmuh/izmir/izmirrapor2002.htm
Keles R., Turkish Government Structure from a Disaster Management
Perspective, The Role of Local Governments in Reducing the Risk of Disasters,
Demeter K., Guner A., Erkan N. E., (eds.), Center of Local Government Studies
and Training, Marmara University, Ġstanbul, 2004.
Kreimer et. al., Managing Disaster Risk in Mexico, Market Incentives for
Mitigation Investment, The World Bank, Washington, DC, 1999.
LESSLOSS, Risk Mitigation for Earthquakes and Landslides Project, last accessed
date November 2004. Available at: http://www.lessloss.org/
Lewis, D. and Mioch J., Urban Vulnerability and Good Governance, Journal of
Contingencies and Crisis Management, 2005.
McBean G. and Henstra D., Climate Change, Natural Hazards and Cities for
Natural Resources Canada, Institute for Catastrophic Loss Reduction (ICLR)
Research, Paper Series No. 31, 2003.
McEntire David A., Triggering Agents, Vulnerabilities and Disaster Reduction,
Disaster Prevention and Management, Volume 10, Number 3, 2001.
164
McGregor R., The Hawke's Bay earthquake: New Zealand's greatest natural
disaster, Napier, N.Z., Art Deco Trust, 1998.
Middleton D., A roof over their heads: The challenge of accommodation following
disasters, Emergency Management Conference, New Zealand, 2007.
Ministry of Economy, Investment Priority Regions, 2012.
Orhan E., Post-Disaster Recovery Processes and Location Choices of Businesses
In Case Of Adapazarı, Unpublished Doctorate Thesis, Middle East Technical
University, 2012
PEER (Pasific Earthquake Engineering Research Center), Structural Engineering
Reconnaissance of the August 17, 1999 Earthquake: Kocaeli (Izmit), Turkey,
University of California, Berkeley, 2000.
Pelling M., The Vulnerability of Cities: Natural Disaster and Social Resilience,
Earthscan Publications, 2003.
Pelling M., Urbanization and Disaster Risk, Population-Environment Research
Network Cyber seminar on Population and Natural Hazards, 2007.
Prota Engineering, Prioritization of High Seismic Risk Provinces and Public
Buildings, 2011.
Quarantelli, E L., Urban Vulnerability to Disasters in Developing Countries:
Managing Risks. In Building Safer Cities: The Future of Disaster Risk, edited by A.
Kreimer, M. Arnold and A. Carlin. Washington, DC: World Bank, 2003.
Rosetto, T. Construction Design, Building Standards and Land Use Planning,
Guidance Note No. 12, 2006.
Scawthorn, C. et.al. Earthquake Risk Reduction, developed for WBI DL, Course
by Kyoto University, Unpublished Report, 2006.
Schwab, J. et. al., Planning for Post-Disaster Recovery and Reconstruction, FEMA
and American Planning Association, Planning Advisory Service Report 483/484,
Chicago, 1998.
Siegel B., No Regrets Approach to Decision-Making in a Changing Climate:
Toward Adaptive Social Protection and Spatially Enabled Governance, World
Bank, 2011.
165
Spangle Associates, Rebuilding After Earthquakes: Lessons from Planners,
International Symposium on Rebuilding After Earthquakes, Stanford University,
August 12-15 1990, California. Spangle and Associates Inc., 1991.
Spangle Associates, The Recovery and Reconstruction Plan of the City of Los
Angeles: Evaluation of Its Use after the Northridge Earthquake, research report,
Portola Valley, 1997.
State Planning Organization (SPO), Ġlçelerin Sosyo-Ekonomik GeliĢmiĢlik
Sıralaması AraĢtırması, 2004.
Sucuoğlu H., Seismic risk mitigation studies in Istanbul, 8th National Conference
on Earthquake Engineering (8NCEE), 2006.
SED, The Swiss Seismological Service, last accessed date December 2012.
Available at: http://www.seismo.ethz.ch/index
TCIP, Turkish Compulsory Insurance Pool, last accessed date December 2012.
Available at: http://www.dask.gov.tr.
TEFER (Turkey Emergency Flood and Earthquake Recovery), A Probabilistic
Seismic Hazard Assessment For Turkey, Report prepared in connection with the
Improvement Of Natural Hazard Insurance And Disaster Funding Strategy
Project, 2000.
Thiruppugazh V., Urban Vulnerability Reduction: Regulations and Beyond, ASARC
Working Paper, 2007.
TURKSTAT, Building Census, 2000.
TURKSTAT, Building Construction Statistics, 2000.
TURKSTAT, Address Based Population Registration System Database, last
accessed date December 2012. Available at: http://www.turkstat.gov.tr/
UNISDR Terminology on Disaster Risk Reduction, United Nations Inter-Agency
Secretariat of the International Strategy for Disaster Reduction UNISDR, 2009.
United Nations Development Program UNDP, Reducing Disaster Risk: A
Challenge for Development, A Global Report, UNDP—Bureau for Crisis Prevention
and Recovery (BRCP), New York, last accessed date February 2004.
Available at: http://www.undp.org/bcpr/disred/rdr.htm.
166
United Nations Human Settlement Program UNDP, Urbanization: Facts and
Figures, 2002.
United Nations International Strategy for Disaster Reduction (UN/ISDR), Living
with Risk, A Global Review of Disaster Reduction Initiatives, 2004.
United Nations International Strategy for Disaster Reduction, UNISDR,
Yokohama Strategy and Plan of Action for a Safer World: Guidelines for Natural
Disaster Prevention, Preparedness and Mitigation, Resolution adopted by
delegates of the World Conference on Natural disaster Reduction, Yokohama,
Japan, 23-27 May, 1994.
United Nations International Strategy for Disaster Reduction, UNISDR, Hyogo
Declaration, Resolution adopted by delegates of the World Conference on
Disaster Reduction, Kobe, Hyogo, Japan, 18-22 January, 2005.
United States Geological Survey, USGS, last accessed date December 2012.
Available at: http://www.usgs.gov
Wamsler, C. Mainstreaming Risk Reduction in Urban Planning and Housing: A
Challenge for International Aid Organizations, Disasters (30:2), 2006.
Wisner B, Blaikie P, Cannon T, Davis I, At Risk: Natural Hazards, People‘s
Vulnerability and Disasters, London: Routledge, 2003.
Wood, H.O., and Neumann F., Modified Mercalli Intensity Scale, Seismological
Society of America Bulletin - 21, 1931.
Yüzügüllü Ö., Barbarosoglu G., Erdik M., Seismic Risk Mitigation Practices In
School Buildings In Istanbul, Turkey, Kandilli Observatory and Earthquake
Research Institute Bogaziçi University, Turkey, 2004.
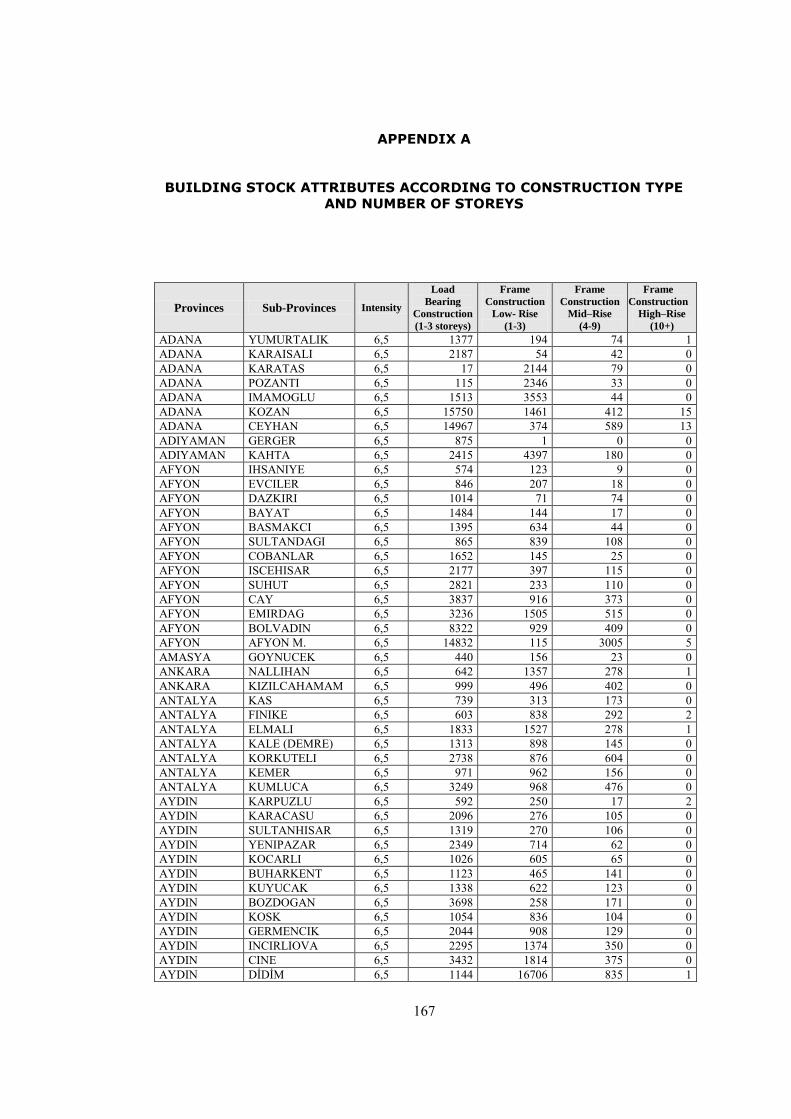
167
APPENDIX A
BUILDING STOCK ATTRIBUTES ACCORDING TO CONSTRUCTION TYPE
AND NUMBER OF STOREYS
Provinces Sub-Provinces Intensity
Load
Bearing
Construction
(1-3 storeys)
Frame
Construction
Low- Rise
(1-3)
Frame
Construction
Mid–Rise
(4-9)
Frame
Construction
High–Rise
(10+)
ADANA YUMURTALIK 6,5 1377 194 74 1 ADANA KARAISALI 6,5 2187 54 42 0 ADANA KARATAS 6,5 17 2144 79 0 ADANA POZANTI 6,5 115 2346 33 0 ADANA IMAMOGLU 6,5 1513 3553 44 0 ADANA KOZAN 6,5 15750 1461 412 15 ADANA CEYHAN 6,5 14967 374 589 13 ADIYAMAN GERGER 6,5 875 1 0 0 ADIYAMAN KAHTA 6,5 2415 4397 180 0 AFYON IHSANIYE 6,5 574 123 9 0 AFYON EVCILER 6,5 846 207 18 0 AFYON DAZKIRI 6,5 1014 71 74 0 AFYON BAYAT 6,5 1484 144 17 0 AFYON BASMAKCI 6,5 1395 634 44 0 AFYON SULTANDAGI 6,5 865 839 108 0 AFYON COBANLAR 6,5 1652 145 25 0 AFYON ISCEHISAR 6,5 2177 397 115 0 AFYON SUHUT 6,5 2821 233 110 0 AFYON CAY 6,5 3837 916 373 0 AFYON EMIRDAG 6,5 3236 1505 515 0 AFYON BOLVADIN 6,5 8322 929 409 0 AFYON AFYON M. 6,5 14832 115 3005 5 AMASYA GOYNUCEK 6,5 440 156 23 0 ANKARA NALLIHAN 6,5 642 1357 278 1 ANKARA KIZILCAHAMAM 6,5 999 496 402 0 ANTALYA KAS 6,5 739 313 173 0 ANTALYA FINIKE 6,5 603 838 292 2 ANTALYA ELMALI 6,5 1833 1527 278 1 ANTALYA KALE (DEMRE) 6,5 1313 898 145 0 ANTALYA KORKUTELI 6,5 2738 876 604 0 ANTALYA KEMER 6,5 971 962 156 0 ANTALYA KUMLUCA 6,5 3249 968 476 0 AYDIN KARPUZLU 6,5 592 250 17 2 AYDIN KARACASU 6,5 2096 276 105 0 AYDIN SULTANHISAR 6,5 1319 270 106 0 AYDIN YENIPAZAR 6,5 2349 714 62 0 AYDIN KOCARLI 6,5 1026 605 65 0 AYDIN BUHARKENT 6,5 1123 465 141 0 AYDIN KUYUCAK 6,5 1338 622 123 0 AYDIN BOZDOGAN 6,5 3698 258 171 0 AYDIN KOSK 6,5 1054 836 104 0 AYDIN GERMENCIK 6,5 2044 908 129 0 AYDIN INCIRLIOVA 6,5 2295 1374 350 0 AYDIN CINE 6,5 3432 1814 375 0 AYDIN DİDİM 6,5 1144 16706 835 1
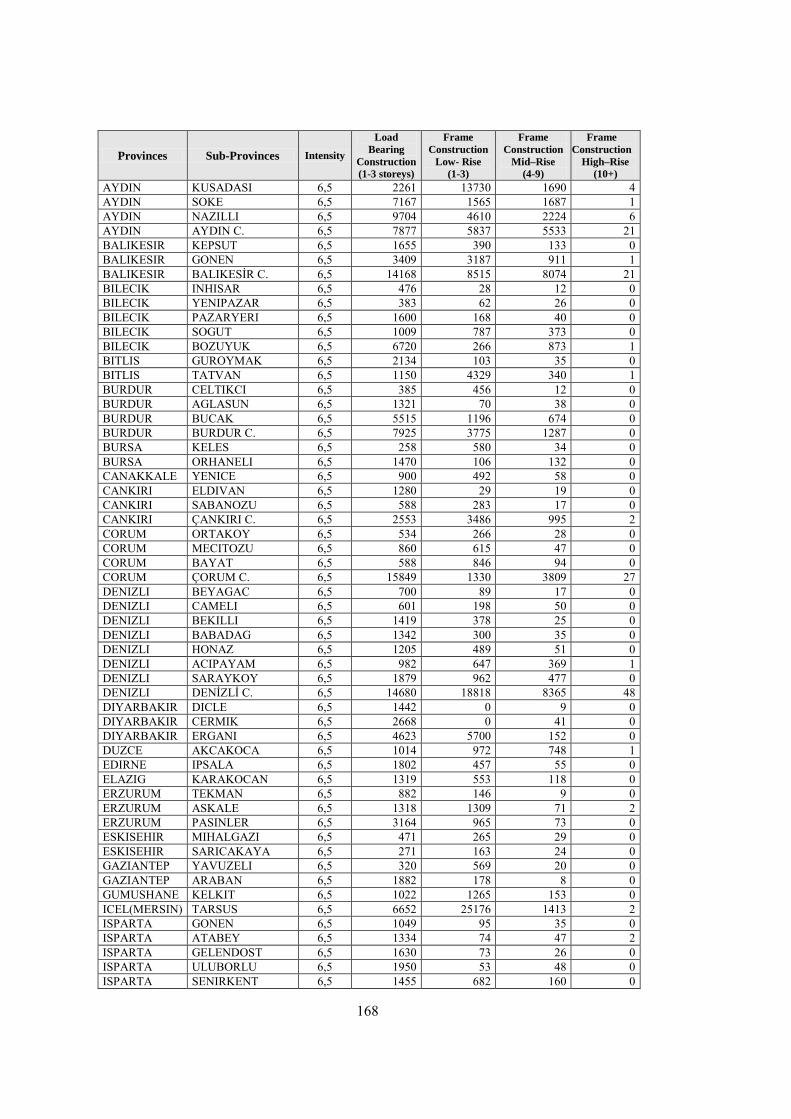
168
Provinces Sub-Provinces Intensity
Load
Bearing
Construction
(1-3 storeys)
Frame
Construction
Low- Rise
(1-3)
Frame
Construction
Mid–Rise
(4-9)
Frame
Construction
High–Rise
(10+)
AYDIN KUSADASI 6,5 2261 13730 1690 4 AYDIN SOKE 6,5 7167 1565 1687 1 AYDIN NAZILLI 6,5 9704 4610 2224 6 AYDIN AYDIN C. 6,5 7877 5837 5533 21 BALIKESIR KEPSUT 6,5 1655 390 133 0 BALIKESIR GONEN 6,5 3409 3187 911 1 BALIKESIR BALIKESİR C. 6,5 14168 8515 8074 21 BILECIK INHISAR 6,5 476 28 12 0 BILECIK YENIPAZAR 6,5 383 62 26 0 BILECIK PAZARYERI 6,5 1600 168 40 0 BILECIK SOGUT 6,5 1009 787 373 0 BILECIK BOZUYUK 6,5 6720 266 873 1 BITLIS GUROYMAK 6,5 2134 103 35 0 BITLIS TATVAN 6,5 1150 4329 340 1 BURDUR CELTIKCI 6,5 385 456 12 0 BURDUR AGLASUN 6,5 1321 70 38 0 BURDUR BUCAK 6,5 5515 1196 674 0 BURDUR BURDUR C. 6,5 7925 3775 1287 0 BURSA KELES 6,5 258 580 34 0 BURSA ORHANELI 6,5 1470 106 132 0 CANAKKALE YENICE 6,5 900 492 58 0 CANKIRI ELDIVAN 6,5 1280 29 19 0 CANKIRI SABANOZU 6,5 588 283 17 0 CANKIRI ÇANKIRI C. 6,5 2553 3486 995 2 CORUM ORTAKOY 6,5 534 266 28 0 CORUM MECITOZU 6,5 860 615 47 0 CORUM BAYAT 6,5 588 846 94 0 CORUM ÇORUM C. 6,5 15849 1330 3809 27 DENIZLI BEYAGAC 6,5 700 89 17 0 DENIZLI CAMELI 6,5 601 198 50 0 DENIZLI BEKILLI 6,5 1419 378 25 0 DENIZLI BABADAG 6,5 1342 300 35 0 DENIZLI HONAZ 6,5 1205 489 51 0 DENIZLI ACIPAYAM 6,5 982 647 369 1 DENIZLI SARAYKOY 6,5 1879 962 477 0 DENIZLI DENİZLİ C. 6,5 14680 18818 8365 48 DIYARBAKIR DICLE 6,5 1442 0 9 0 DIYARBAKIR CERMIK 6,5 2668 0 41 0 DIYARBAKIR ERGANI 6,5 4623 5700 152 0 DUZCE AKCAKOCA 6,5 1014 972 748 1 EDIRNE IPSALA 6,5 1802 457 55 0 ELAZIG KARAKOCAN 6,5 1319 553 118 0 ERZURUM TEKMAN 6,5 882 146 9 0 ERZURUM ASKALE 6,5 1318 1309 71 2 ERZURUM PASINLER 6,5 3164 965 73 0 ESKISEHIR MIHALGAZI 6,5 471 265 29 0 ESKISEHIR SARICAKAYA 6,5 271 163 24 0 GAZIANTEP YAVUZELI 6,5 320 569 20 0 GAZIANTEP ARABAN 6,5 1882 178 8 0 GUMUSHANE KELKIT 6,5 1022 1265 153 0 ICEL(MERSIN) TARSUS 6,5 6652 25176 1413 2 ISPARTA GONEN 6,5 1049 95 35 0 ISPARTA ATABEY 6,5 1334 74 47 2 ISPARTA GELENDOST 6,5 1630 73 26 0 ISPARTA ULUBORLU 6,5 1950 53 48 0 ISPARTA SENIRKENT 6,5 1455 682 160 0
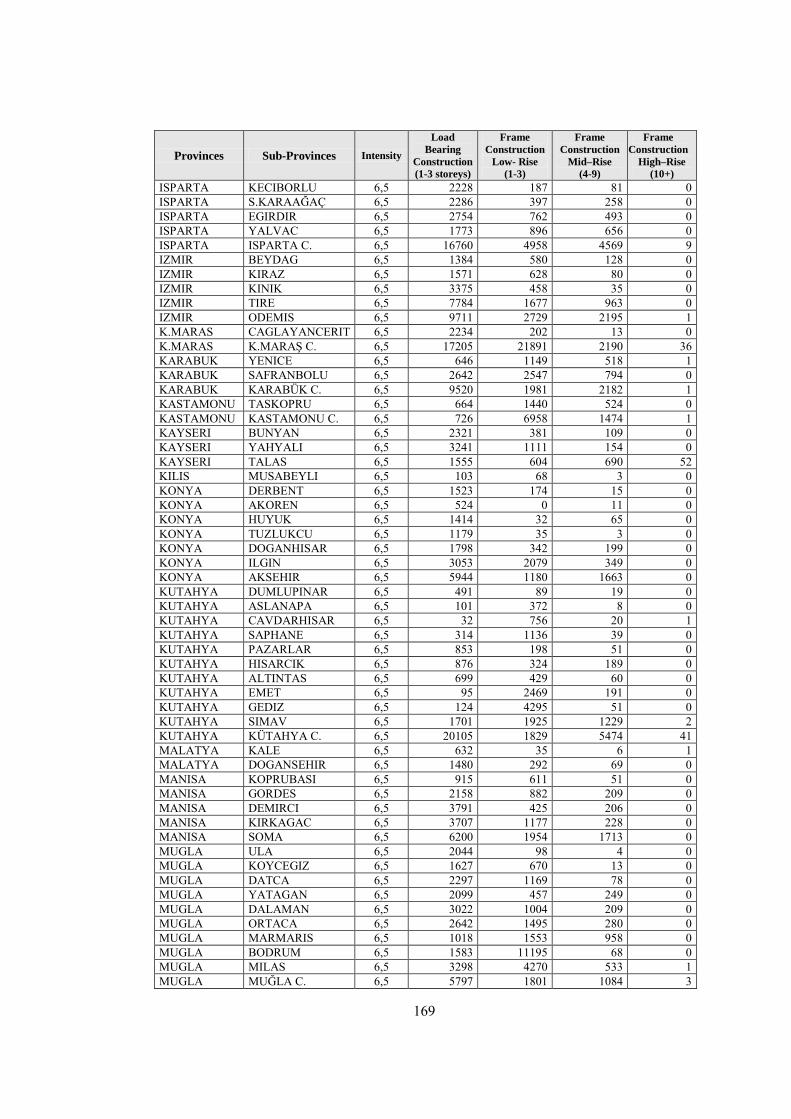
169
Provinces Sub-Provinces Intensity
Load
Bearing
Construction
(1-3 storeys)
Frame
Construction
Low- Rise
(1-3)
Frame
Construction
Mid–Rise
(4-9)
Frame
Construction
High–Rise
(10+)
ISPARTA KECIBORLU 6,5 2228 187 81 0 ISPARTA S.KARAAĞAÇ 6,5 2286 397 258 0 ISPARTA EGIRDIR 6,5 2754 762 493 0 ISPARTA YALVAC 6,5 1773 896 656 0 ISPARTA ISPARTA C. 6,5 16760 4958 4569 9 IZMIR BEYDAG 6,5 1384 580 128 0 IZMIR KIRAZ 6,5 1571 628 80 0 IZMIR KINIK 6,5 3375 458 35 0 IZMIR TIRE 6,5 7784 1677 963 0 IZMIR ODEMIS 6,5 9711 2729 2195 1 K.MARAS CAGLAYANCERIT 6,5 2234 202 13 0 K.MARAS K.MARAŞ C. 6,5 17205 21891 2190 36 KARABUK YENICE 6,5 646 1149 518 1 KARABUK SAFRANBOLU 6,5 2642 2547 794 0 KARABUK KARABÜK C. 6,5 9520 1981 2182 1 KASTAMONU TASKOPRU 6,5 664 1440 524 0 KASTAMONU KASTAMONU C. 6,5 726 6958 1474 1 KAYSERI BUNYAN 6,5 2321 381 109 0 KAYSERI YAHYALI 6,5 3241 1111 154 0 KAYSERI TALAS 6,5 1555 604 690 52 KILIS MUSABEYLI 6,5 103 68 3 0 KONYA DERBENT 6,5 1523 174 15 0 KONYA AKOREN 6,5 524 0 11 0 KONYA HUYUK 6,5 1414 32 65 0 KONYA TUZLUKCU 6,5 1179 35 3 0 KONYA DOGANHISAR 6,5 1798 342 199 0 KONYA ILGIN 6,5 3053 2079 349 0 KONYA AKSEHIR 6,5 5944 1180 1663 0 KUTAHYA DUMLUPINAR 6,5 491 89 19 0 KUTAHYA ASLANAPA 6,5 101 372 8 0 KUTAHYA CAVDARHISAR 6,5 32 756 20 1 KUTAHYA SAPHANE 6,5 314 1136 39 0 KUTAHYA PAZARLAR 6,5 853 198 51 0 KUTAHYA HISARCIK 6,5 876 324 189 0 KUTAHYA ALTINTAS 6,5 699 429 60 0 KUTAHYA EMET 6,5 95 2469 191 0 KUTAHYA GEDIZ 6,5 124 4295 51 0 KUTAHYA SIMAV 6,5 1701 1925 1229 2 KUTAHYA KÜTAHYA C. 6,5 20105 1829 5474 41 MALATYA KALE 6,5 632 35 6 1 MALATYA DOGANSEHIR 6,5 1480 292 69 0 MANISA KOPRUBASI 6,5 915 611 51 0 MANISA GORDES 6,5 2158 882 209 0 MANISA DEMIRCI 6,5 3791 425 206 0 MANISA KIRKAGAC 6,5 3707 1177 228 0 MANISA SOMA 6,5 6200 1954 1713 0 MUGLA ULA 6,5 2044 98 4 0 MUGLA KOYCEGIZ 6,5 1627 670 13 0 MUGLA DATCA 6,5 2297 1169 78 0 MUGLA YATAGAN 6,5 2099 457 249 0 MUGLA DALAMAN 6,5 3022 1004 209 0 MUGLA ORTACA 6,5 2642 1495 280 0 MUGLA MARMARIS 6,5 1018 1553 958 0 MUGLA BODRUM 6,5 1583 11195 68 0 MUGLA MILAS 6,5 3298 4270 533 1 MUGLA MUĞLA C. 6,5 5797 1801 1084 3
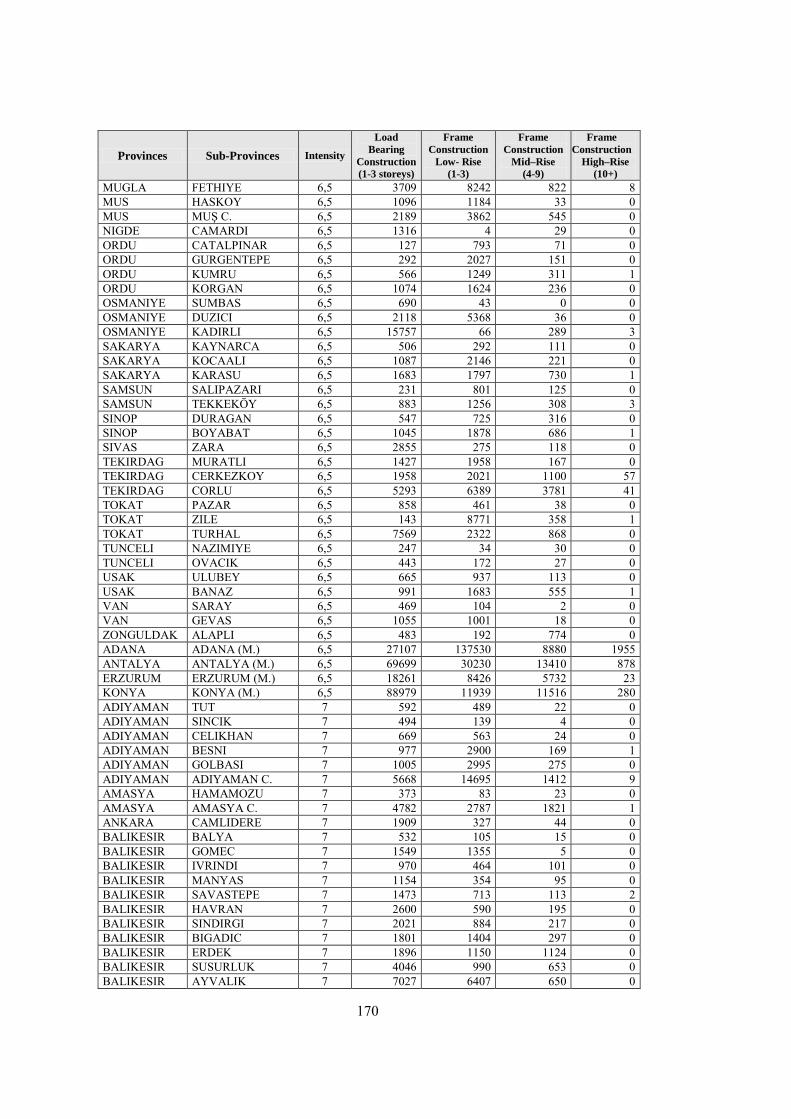
170
Provinces Sub-Provinces Intensity
Load
Bearing
Construction
(1-3 storeys)
Frame
Construction
Low- Rise
(1-3)
Frame
Construction
Mid–Rise
(4-9)
Frame
Construction
High–Rise
(10+)
MUGLA FETHIYE 6,5 3709 8242 822 8 MUS HASKOY 6,5 1096 1184 33 0 MUS MUŞ C. 6,5 2189 3862 545 0 NIGDE CAMARDI 6,5 1316 4 29 0 ORDU CATALPINAR 6,5 127 793 71 0 ORDU GURGENTEPE 6,5 292 2027 151 0 ORDU KUMRU 6,5 566 1249 311 1 ORDU KORGAN 6,5 1074 1624 236 0 OSMANIYE SUMBAS 6,5 690 43 0 0 OSMANIYE DUZICI 6,5 2118 5368 36 0 OSMANIYE KADIRLI 6,5 15757 66 289 3 SAKARYA KAYNARCA 6,5 506 292 111 0 SAKARYA KOCAALI 6,5 1087 2146 221 0 SAKARYA KARASU 6,5 1683 1797 730 1 SAMSUN SALIPAZARI 6,5 231 801 125 0 SAMSUN TEKKEKÖY 6,5 883 1256 308 3 SINOP DURAGAN 6,5 547 725 316 0 SINOP BOYABAT 6,5 1045 1878 686 1 SIVAS ZARA 6,5 2855 275 118 0 TEKIRDAG MURATLI 6,5 1427 1958 167 0 TEKIRDAG CERKEZKOY 6,5 1958 2021 1100 57 TEKIRDAG CORLU 6,5 5293 6389 3781 41 TOKAT PAZAR 6,5 858 461 38 0 TOKAT ZILE 6,5 143 8771 358 1 TOKAT TURHAL 6,5 7569 2322 868 0 TUNCELI NAZIMIYE 6,5 247 34 30 0 TUNCELI OVACIK 6,5 443 172 27 0 USAK ULUBEY 6,5 665 937 113 0 USAK BANAZ 6,5 991 1683 555 1 VAN SARAY 6,5 469 104 2 0 VAN GEVAS 6,5 1055 1001 18 0 ZONGULDAK ALAPLI 6,5 483 192 774 0 ADANA ADANA (M.) 6,5 27107 137530 8880 1955 ANTALYA ANTALYA (M.) 6,5 69699 30230 13410 878 ERZURUM ERZURUM (M.) 6,5 18261 8426 5732 23 KONYA KONYA (M.) 6,5 88979 11939 11516 280 ADIYAMAN TUT 7 592 489 22 0 ADIYAMAN SINCIK 7 494 139 4 0 ADIYAMAN CELIKHAN 7 669 563 24 0 ADIYAMAN BESNI 7 977 2900 169 1 ADIYAMAN GOLBASI 7 1005 2995 275 0 ADIYAMAN ADIYAMAN C. 7 5668 14695 1412 9 AMASYA HAMAMOZU 7 373 83 23 0 AMASYA AMASYA C. 7 4782 2787 1821 1 ANKARA CAMLIDERE 7 1909 327 44 0 BALIKESIR BALYA 7 532 105 15 0 BALIKESIR GOMEC 7 1549 1355 5 0 BALIKESIR IVRINDI 7 970 464 101 0 BALIKESIR MANYAS 7 1154 354 95 0 BALIKESIR SAVASTEPE 7 1473 713 113 2 BALIKESIR HAVRAN 7 2600 590 195 0 BALIKESIR SINDIRGI 7 2021 884 217 0 BALIKESIR BIGADIC 7 1801 1404 297 0 BALIKESIR ERDEK 7 1896 1150 1124 0 BALIKESIR SUSURLUK 7 4046 990 653 0 BALIKESIR AYVALIK 7 7027 6407 650 0

171
Provinces Sub-Provinces Intensity
Load
Bearing
Construction
(1-3 storeys)
Frame
Construction
Low- Rise
(1-3)
Frame
Construction
Mid–Rise
(4-9)
Frame
Construction
High–Rise
(10+)
BALIKESIR BURHANIYE 7 6182 6478 497 0 BALIKESIR EDREMIT 7 5153 1318 1133 0 BALIKESIR BANDIRMA 7 3658 5002 3320 31 BILECIK GOLPAZARI 7 911 862 86 0 BILECIK BİLECİK C. 7 2955 233 828 1 BINGOL YAYLADERE 7 776 9 27 0 BINGOL GENC 7 1086 480 109 0 BINGOL BİNGÖL C. 7 3143 2903 1157 1 BOLU KIBRISCIK 7 392 6 7 0 BOLU SEBEN 7 15 715 22 0 BURDUR KEMER 7 666 115 17 0 BURDUR CAVDIR 7 633 203 43 0 BURDUR ALTINYAYLA 7 1087 30 30 0 BURDUR TEFENNI 7 1417 124 61 0 BURDUR YESILOVA 7 920 595 67 0 BURDUR KARAMANLI 7 1575 222 109 0 BURDUR GOLHISAR 7 2773 536 179 0 BURSA KARACABEY 7 3772 2915 956 0 BURSA M.KEMALPASA 7 4386 2368 1688 0 BURSA INEGOL 7 3845 6469 3770 0 CANAKKALE AYVACIK 7 1242 556 50 0 CANAKKALE LAPSEKI 7 1330 539 301 0 CANAKKALE EZINE 7 2507 1120 209 3 CANAKKALE BAYRAMIC 7 2703 1293 154 0 CANAKKALE CAN 7 2022 2632 357 0 CANAKKALE BIGA 7 2363 2300 809 0 CANAKKALE ÇANAKKALE C. 7 3620 3533 2067 11 CANKIRI YAPRAKLI 7 218 538 18 0 CANKIRI ORTA 7 680 215 29 0 CORUM LACIN 7 505 6 8 0 CORUM OGUZLAR 7 193 1211 39 0 CORUM ISKILIP 7 1222 3407 470 0 DENIZLI BAKLAN 7 803 131 8 0 DENIZLI AKKOY 7 376 252 6 0 DENIZLI CAL 7 1456 256 24 0 DENIZLI BOZKURT 7 692 253 50 0 DENIZLI CARDAK 7 720 568 65 0 DENIZLI GUNEY 7 1178 629 40 0 DENIZLI BULDAN 7 2206 1718 324 1 DIYARBAKIR CUNGUS 7 787 65 13 0 DUZCE YIGILCA 7 77 368 110 0 EDIRNE ENEZ 7 1131 2322 31 0 EDIRNE KESAN 7 5460 1641 940 0 ELAZIG ALACAKAYA 7 626 193 7 0 ELAZIG ARICAK 7 513 0 19 0 ELAZIG SIVRICE 7 947 48 13 0 ELAZIG MADEN 7 1333 263 48 0 ELAZIG PALU 7 1619 142 38 0 ELAZIG KOVANCILAR 7 1500 99 428 16 ERZINCAN OTLUKBELI 7 341 81 9 0 ERZINCAN KEMAH 7 458 191 22 0 ERZINCAN TERCAN 7 1249 144 29 0 ERZURUM CAT 7 1101 122 9 0 ERZURUM KARACOBAN 7 2190 205 17 0 ERZURUM HINIS 7 1058 2467 17 1 GAZIANTEP NURDAGI 7 125 2132 14 0
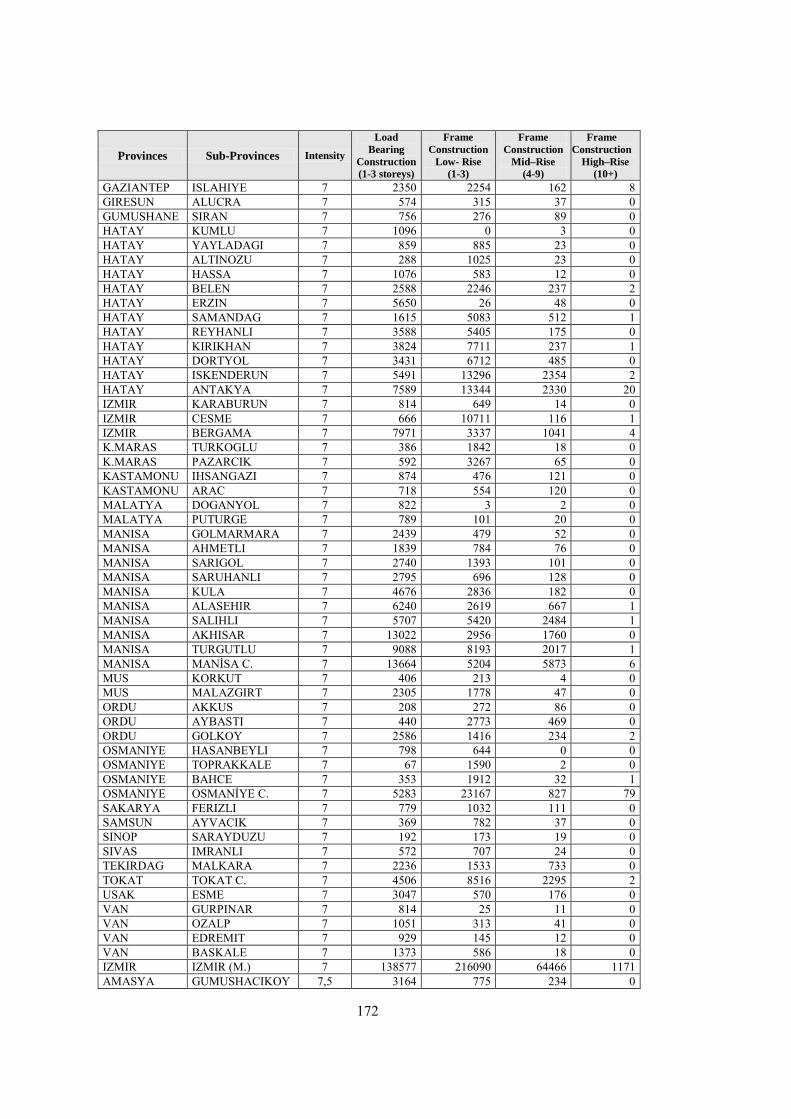
172
Provinces Sub-Provinces Intensity
Load
Bearing
Construction
(1-3 storeys)
Frame
Construction
Low- Rise
(1-3)
Frame
Construction
Mid–Rise
(4-9)
Frame
Construction
High–Rise
(10+)
GAZIANTEP ISLAHIYE 7 2350 2254 162 8 GIRESUN ALUCRA 7 574 315 37 0 GUMUSHANE SIRAN 7 756 276 89 0 HATAY KUMLU 7 1096 0 3 0 HATAY YAYLADAGI 7 859 885 23 0 HATAY ALTINOZU 7 288 1025 23 0 HATAY HASSA 7 1076 583 12 0 HATAY BELEN 7 2588 2246 237 2 HATAY ERZIN 7 5650 26 48 0 HATAY SAMANDAG 7 1615 5083 512 1 HATAY REYHANLI 7 3588 5405 175 0 HATAY KIRIKHAN 7 3824 7711 237 1 HATAY DORTYOL 7 3431 6712 485 0 HATAY ISKENDERUN 7 5491 13296 2354 2 HATAY ANTAKYA 7 7589 13344 2330 20 IZMIR KARABURUN 7 814 649 14 0 IZMIR CESME 7 666 10711 116 1 IZMIR BERGAMA 7 7971 3337 1041 4 K.MARAS TURKOGLU 7 386 1842 18 0 K.MARAS PAZARCIK 7 592 3267 65 0 KASTAMONU IHSANGAZI 7 874 476 121 0 KASTAMONU ARAC 7 718 554 120 0 MALATYA DOGANYOL 7 822 3 2 0 MALATYA PUTURGE 7 789 101 20 0 MANISA GOLMARMARA 7 2439 479 52 0 MANISA AHMETLI 7 1839 784 76 0 MANISA SARIGOL 7 2740 1393 101 0 MANISA SARUHANLI 7 2795 696 128 0 MANISA KULA 7 4676 2836 182 0 MANISA ALASEHIR 7 6240 2619 667 1 MANISA SALIHLI 7 5707 5420 2484 1 MANISA AKHISAR 7 13022 2956 1760 0 MANISA TURGUTLU 7 9088 8193 2017 1 MANISA MANİSA C. 7 13664 5204 5873 6 MUS KORKUT 7 406 213 4 0 MUS MALAZGIRT 7 2305 1778 47 0 ORDU AKKUS 7 208 272 86 0 ORDU AYBASTI 7 440 2773 469 0 ORDU GOLKOY 7 2586 1416 234 2 OSMANIYE HASANBEYLI 7 798 644 0 0 OSMANIYE TOPRAKKALE 7 67 1590 2 0 OSMANIYE BAHCE 7 353 1912 32 1 OSMANIYE OSMANİYE C. 7 5283 23167 827 79 SAKARYA FERIZLI 7 779 1032 111 0 SAMSUN AYVACIK 7 369 782 37 0 SINOP SARAYDUZU 7 192 173 19 0 SIVAS IMRANLI 7 572 707 24 0 TEKIRDAG MALKARA 7 2236 1533 733 0 TOKAT TOKAT C. 7 4506 8516 2295 2 USAK ESME 7 3047 570 176 0 VAN GURPINAR 7 814 25 11 0 VAN OZALP 7 1051 313 41 0 VAN EDREMIT 7 929 145 12 0 VAN BASKALE 7 1373 586 18 0 IZMIR IZMIR (M.) 7 138577 216090 64466 1171 AMASYA GUMUSHACIKOY 7,5 3164 775 234 0
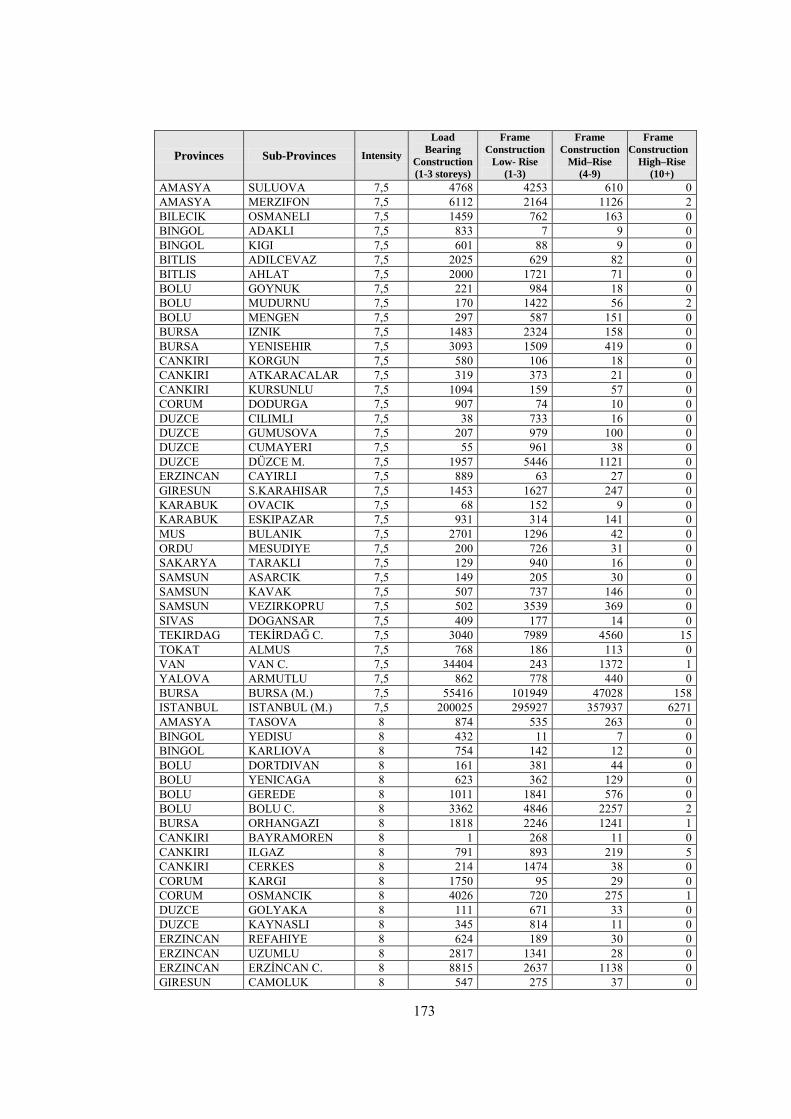
173
Provinces Sub-Provinces Intensity
Load
Bearing
Construction
(1-3 storeys)
Frame
Construction
Low- Rise
(1-3)
Frame
Construction
Mid–Rise
(4-9)
Frame
Construction
High–Rise
(10+)
AMASYA SULUOVA 7,5 4768 4253 610 0 AMASYA MERZIFON 7,5 6112 2164 1126 2 BILECIK OSMANELI 7,5 1459 762 163 0 BINGOL ADAKLI 7,5 833 7 9 0 BINGOL KIGI 7,5 601 88 9 0 BITLIS ADILCEVAZ 7,5 2025 629 82 0 BITLIS AHLAT 7,5 2000 1721 71 0 BOLU GOYNUK 7,5 221 984 18 0 BOLU MUDURNU 7,5 170 1422 56 2 BOLU MENGEN 7,5 297 587 151 0 BURSA IZNIK 7,5 1483 2324 158 0 BURSA YENISEHIR 7,5 3093 1509 419 0 CANKIRI KORGUN 7,5 580 106 18 0 CANKIRI ATKARACALAR 7,5 319 373 21 0 CANKIRI KURSUNLU 7,5 1094 159 57 0 CORUM DODURGA 7,5 907 74 10 0 DUZCE CILIMLI 7,5 38 733 16 0 DUZCE GUMUSOVA 7,5 207 979 100 0 DUZCE CUMAYERI 7,5 55 961 38 0 DUZCE DÜZCE M. 7,5 1957 5446 1121 0 ERZINCAN CAYIRLI 7,5 889 63 27 0 GIRESUN S.KARAHISAR 7,5 1453 1627 247 0 KARABUK OVACIK 7,5 68 152 9 0 KARABUK ESKIPAZAR 7,5 931 314 141 0 MUS BULANIK 7,5 2701 1296 42 0 ORDU MESUDIYE 7,5 200 726 31 0 SAKARYA TARAKLI 7,5 129 940 16 0 SAMSUN ASARCIK 7,5 149 205 30 0 SAMSUN KAVAK 7,5 507 737 146 0 SAMSUN VEZIRKOPRU 7,5 502 3539 369 0 SIVAS DOGANSAR 7,5 409 177 14 0 TEKIRDAG TEKİRDAĞ C. 7,5 3040 7989 4560 15 TOKAT ALMUS 7,5 768 186 113 0 VAN VAN C. 7,5 34404 243 1372 1 YALOVA ARMUTLU 7,5 862 778 440 0 BURSA BURSA (M.) 7,5 55416 101949 47028 158 ISTANBUL ISTANBUL (M.) 7,5 200025 295927 357937 6271 AMASYA TASOVA 8 874 535 263 0 BINGOL YEDISU 8 432 11 7 0 BINGOL KARLIOVA 8 754 142 12 0 BOLU DORTDIVAN 8 161 381 44 0 BOLU YENICAGA 8 623 362 129 0 BOLU GEREDE 8 1011 1841 576 0 BOLU BOLU C. 8 3362 4846 2257 2 BURSA ORHANGAZI 8 1818 2246 1241 1 CANKIRI BAYRAMOREN 8 1 268 11 0 CANKIRI ILGAZ 8 791 893 219 5 CANKIRI CERKES 8 214 1474 38 0 CORUM KARGI 8 1750 95 29 0 CORUM OSMANCIK 8 4026 720 275 1 DUZCE GOLYAKA 8 111 671 33 0 DUZCE KAYNASLI 8 345 814 11 0 ERZINCAN REFAHIYE 8 624 189 30 0 ERZINCAN UZUMLU 8 2817 1341 28 0 ERZINCAN ERZİNCAN C. 8 8815 2637 1138 0 GIRESUN CAMOLUK 8 547 275 37 0
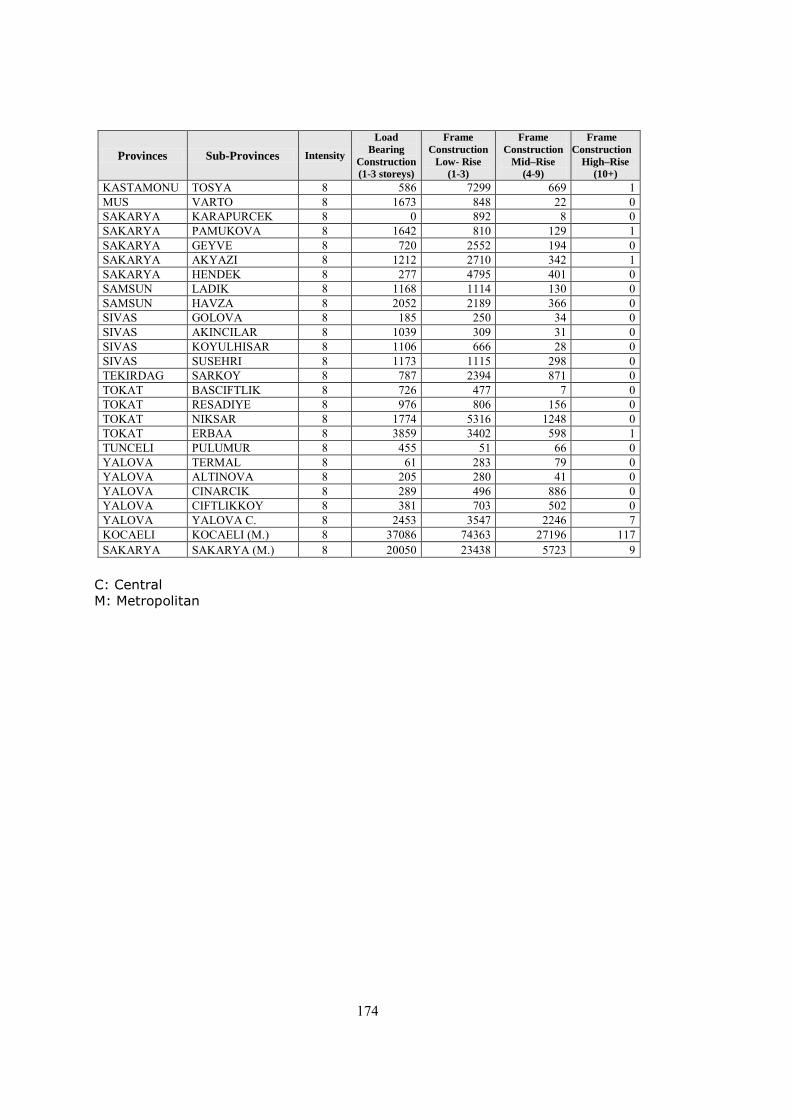
174
Provinces Sub-Provinces Intensity
Load
Bearing
Construction
(1-3 storeys)
Frame
Construction
Low- Rise
(1-3)
Frame
Construction
Mid–Rise
(4-9)
Frame
Construction
High–Rise
(10+)
KASTAMONU TOSYA 8 586 7299 669 1 MUS VARTO 8 1673 848 22 0 SAKARYA KARAPURCEK 8 0 892 8 0 SAKARYA PAMUKOVA 8 1642 810 129 1 SAKARYA GEYVE 8 720 2552 194 0 SAKARYA AKYAZI 8 1212 2710 342 1 SAKARYA HENDEK 8 277 4795 401 0 SAMSUN LADIK 8 1168 1114 130 0 SAMSUN HAVZA 8 2052 2189 366 0 SIVAS GOLOVA 8 185 250 34 0 SIVAS AKINCILAR 8 1039 309 31 0 SIVAS KOYULHISAR 8 1106 666 28 0 SIVAS SUSEHRI 8 1173 1115 298 0 TEKIRDAG SARKOY 8 787 2394 871 0 TOKAT BASCIFTLIK 8 726 477 7 0 TOKAT RESADIYE 8 976 806 156 0 TOKAT NIKSAR 8 1774 5316 1248 0 TOKAT ERBAA 8 3859 3402 598 1 TUNCELI PULUMUR 8 455 51 66 0 YALOVA TERMAL 8 61 283 79 0 YALOVA ALTINOVA 8 205 280 41 0 YALOVA CINARCIK 8 289 496 886 0 YALOVA CIFTLIKKOY 8 381 703 502 0 YALOVA YALOVA C. 8 2453 3547 2246 7 KOCAELI KOCAELI (M.) 8 37086 74363 27196 117 SAKARYA SAKARYA (M.) 8 20050 23438 5723 9
C: Central
M: Metropolitan
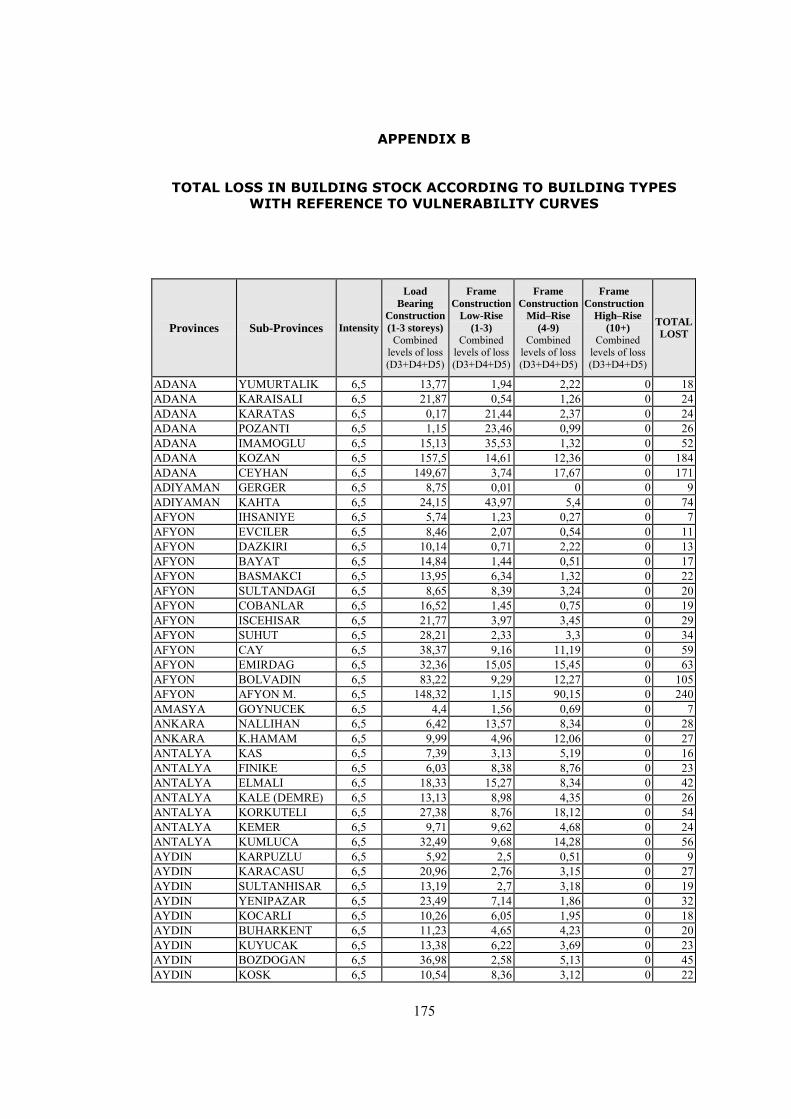
175
APPENDIX B
TOTAL LOSS IN BUILDING STOCK ACCORDING TO BUILDING TYPES
WITH REFERENCE TO VULNERABILITY CURVES
Provinces Sub-Provinces Intensity
Load
Bearing
Construction
(1-3 storeys)
Combined levels of loss (D3+D4+D5)
Frame
Construction
Low-Rise
(1-3) Combined
levels of loss (D3+D4+D5)
Frame
Construction
Mid–Rise
(4-9) Combined
levels of loss (D3+D4+D5)
Frame
Construction
High–Rise
(10+) Combined
levels of loss (D3+D4+D5)
TOTAL
LOST
ADANA YUMURTALIK 6,5 13,77 1,94 2,22 0 18 ADANA KARAISALI 6,5 21,87 0,54 1,26 0 24 ADANA KARATAS 6,5 0,17 21,44 2,37 0 24 ADANA POZANTI 6,5 1,15 23,46 0,99 0 26 ADANA IMAMOGLU 6,5 15,13 35,53 1,32 0 52 ADANA KOZAN 6,5 157,5 14,61 12,36 0 184 ADANA CEYHAN 6,5 149,67 3,74 17,67 0 171 ADIYAMAN GERGER 6,5 8,75 0,01 0 0 9 ADIYAMAN KAHTA 6,5 24,15 43,97 5,4 0 74 AFYON IHSANIYE 6,5 5,74 1,23 0,27 0 7 AFYON EVCILER 6,5 8,46 2,07 0,54 0 11 AFYON DAZKIRI 6,5 10,14 0,71 2,22 0 13 AFYON BAYAT 6,5 14,84 1,44 0,51 0 17 AFYON BASMAKCI 6,5 13,95 6,34 1,32 0 22 AFYON SULTANDAGI 6,5 8,65 8,39 3,24 0 20 AFYON COBANLAR 6,5 16,52 1,45 0,75 0 19 AFYON ISCEHISAR 6,5 21,77 3,97 3,45 0 29 AFYON SUHUT 6,5 28,21 2,33 3,3 0 34 AFYON CAY 6,5 38,37 9,16 11,19 0 59 AFYON EMIRDAG 6,5 32,36 15,05 15,45 0 63 AFYON BOLVADIN 6,5 83,22 9,29 12,27 0 105 AFYON AFYON M. 6,5 148,32 1,15 90,15 0 240 AMASYA GOYNUCEK 6,5 4,4 1,56 0,69 0 7 ANKARA NALLIHAN 6,5 6,42 13,57 8,34 0 28 ANKARA K.HAMAM 6,5 9,99 4,96 12,06 0 27 ANTALYA KAS 6,5 7,39 3,13 5,19 0 16 ANTALYA FINIKE 6,5 6,03 8,38 8,76 0 23 ANTALYA ELMALI 6,5 18,33 15,27 8,34 0 42 ANTALYA KALE (DEMRE) 6,5 13,13 8,98 4,35 0 26 ANTALYA KORKUTELI 6,5 27,38 8,76 18,12 0 54 ANTALYA KEMER 6,5 9,71 9,62 4,68 0 24 ANTALYA KUMLUCA 6,5 32,49 9,68 14,28 0 56 AYDIN KARPUZLU 6,5 5,92 2,5 0,51 0 9 AYDIN KARACASU 6,5 20,96 2,76 3,15 0 27 AYDIN SULTANHISAR 6,5 13,19 2,7 3,18 0 19 AYDIN YENIPAZAR 6,5 23,49 7,14 1,86 0 32 AYDIN KOCARLI 6,5 10,26 6,05 1,95 0 18 AYDIN BUHARKENT 6,5 11,23 4,65 4,23 0 20 AYDIN KUYUCAK 6,5 13,38 6,22 3,69 0 23 AYDIN BOZDOGAN 6,5 36,98 2,58 5,13 0 45 AYDIN KOSK 6,5 10,54 8,36 3,12 0 22

176
Provinces Sub-Provinces Intensity
Load
Bearing
Construction
(1-3 storeys)
Combined levels of loss (D3+D4+D5)
Frame
Construction
Low-Rise
(1-3) Combined
levels of loss (D3+D4+D5)
Frame
Construction
Mid–Rise
(4-9) Combined
levels of loss (D3+D4+D5)
Frame
Construction
High–Rise
(10+) Combined
levels of loss (D3+D4+D5)
TOTAL
LOST
AYDIN GERMENCIK 6,5 20,44 9,08 3,87 0 33 AYDIN INCIRLIOVA 6,5 22,95 13,74 10,5 0 47 AYDIN CINE 6,5 34,32 18,14 11,25 0 64 AYDIN DİDİM 6,5 11,44 167,06 25,05 0 204 AYDIN KUSADASI 6,5 22,61 137,3 50,7 0 211 AYDIN SOKE 6,5 71,67 15,65 50,61 0 138 AYDIN NAZILLI 6,5 97,04 46,1 66,72 0 210 AYDIN AYDIN C. 6,5 78,77 58,37 165,99 0 303 BALIKESIR KEPSUT 6,5 16,55 3,9 3,99 0 24 BALIKESIR GONEN 6,5 34,09 31,87 27,33 0 93 BALIKESIR BALIKESİR C. 6,5 141,68 85,15 242,22 0 469 BILECIK INHISAR 6,5 4,76 0,28 0,36 0 5 BILECIK YENIPAZAR 6,5 3,83 0,62 0,78 0 5 BILECIK PAZARYERI 6,5 16 1,68 1,2 0 19 BILECIK SOGUT 6,5 10,09 7,87 11,19 0 29 BILECIK BOZUYUK 6,5 67,2 2,66 26,19 0 96 BITLIS GUROYMAK 6,5 21,34 1,03 1,05 0 23 BITLIS TATVAN 6,5 11,5 43,29 10,2 0 65 BURDUR CELTIKCI 6,5 3,85 4,56 0,36 0 9 BURDUR AGLASUN 6,5 13,21 0,7 1,14 0 15 BURDUR BUCAK 6,5 55,15 11,96 20,22 0 87 BURDUR BURDUR C. 6,5 79,25 37,75 38,61 0 156 BURSA KELES 6,5 2,58 5,8 1,02 0 9 BURSA ORHANELI 6,5 14,7 1,06 3,96 0 20 CANAKKALE YENICE 6,5 9 4,92 1,74 0 16 CANKIRI ELDIVAN 6,5 12,8 0,29 0,57 0 14 CANKIRI SABANOZU 6,5 5,88 2,83 0,51 0 9 CANKIRI ÇANKIRI C. 6,5 25,53 34,86 29,85 0 90 CORUM ORTAKOY 6,5 5,34 2,66 0,84 0 9 CORUM MECITOZU 6,5 8,6 6,15 1,41 0 16 CORUM BAYAT 6,5 5,88 8,46 2,82 0 17 CORUM ÇORUM C. 6,5 158,49 13,3 114,27 0 286 DENIZLI BEYAGAC 6,5 7 0,89 0,51 0 8 DENIZLI CAMELI 6,5 6,01 1,98 1,5 0 9 DENIZLI BEKILLI 6,5 14,19 3,78 0,75 0 19 DENIZLI BABADAG 6,5 13,42 3 1,05 0 17 DENIZLI HONAZ 6,5 12,05 4,89 1,53 0 18 DENIZLI ACIPAYAM 6,5 9,82 6,47 11,07 0 27 DENIZLI SARAYKOY 6,5 18,79 9,62 14,31 0 43 DENIZLI DENİZLİ C. 6,5 146,8 188,18 250,95 0 586 DIYARBAKIR DICLE 6,5 14,42 0 0,27 0 15 DIYARBAKIR CERMIK 6,5 26,68 0 1,23 0 28 DIYARBAKIR ERGANI 6,5 46,23 57 4,56 0 108 DUZCE AKCAKOCA 6,5 10,14 9,72 22,44 0 42 EDIRNE IPSALA 6,5 18,02 4,57 1,65 0 24 ELAZIG KARAKOCAN 6,5 13,19 5,53 3,54 0 22 ERZURUM TEKMAN 6,5 8,82 1,46 0,27 0 11 ERZURUM ASKALE 6,5 13,18 13,09 2,13 0 28 ERZURUM PASINLER 6,5 31,64 9,65 2,19 0 43 ESKISEHIR MIHALGAZI 6,5 4,71 2,65 0,87 0 8 ESKISEHIR SARICAKAYA 6,5 2,71 1,63 0,72 0 5
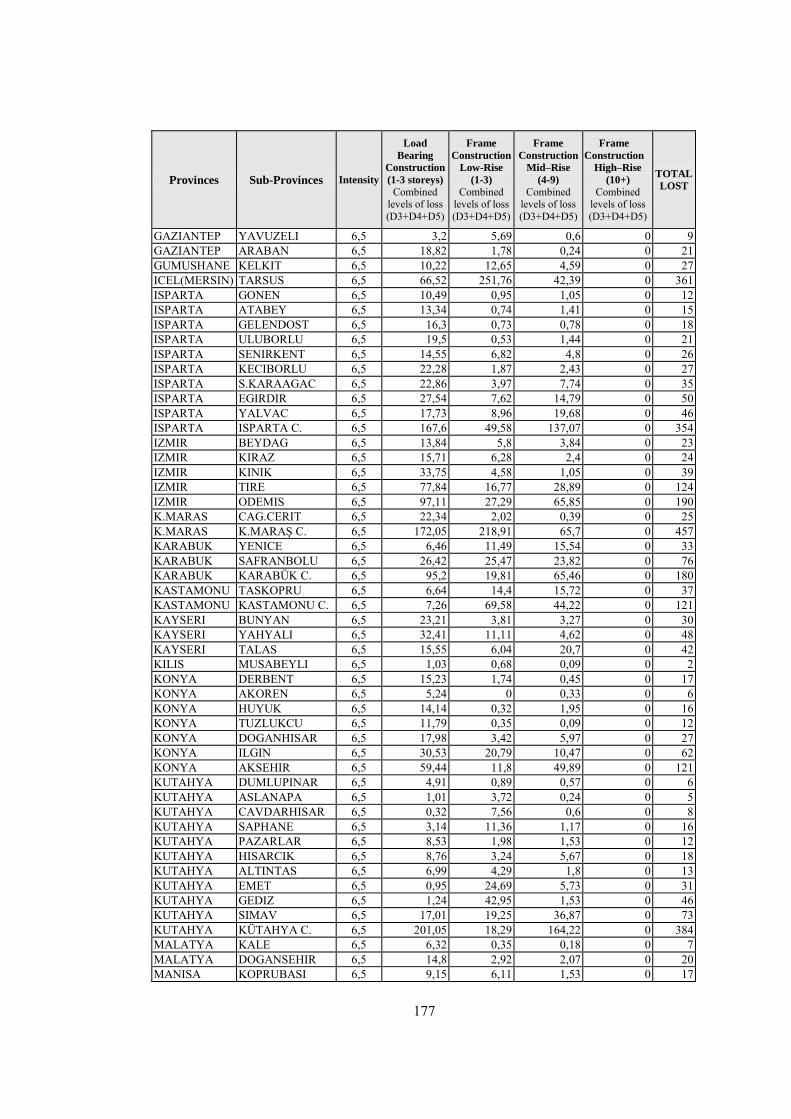
177
Provinces Sub-Provinces Intensity
Load
Bearing
Construction
(1-3 storeys)
Combined levels of loss (D3+D4+D5)
Frame
Construction
Low-Rise
(1-3) Combined
levels of loss (D3+D4+D5)
Frame
Construction
Mid–Rise
(4-9) Combined
levels of loss (D3+D4+D5)
Frame
Construction
High–Rise
(10+) Combined
levels of loss (D3+D4+D5)
TOTAL
LOST
GAZIANTEP YAVUZELI 6,5 3,2 5,69 0,6 0 9 GAZIANTEP ARABAN 6,5 18,82 1,78 0,24 0 21 GUMUSHANE KELKIT 6,5 10,22 12,65 4,59 0 27 ICEL(MERSIN) TARSUS 6,5 66,52 251,76 42,39 0 361 ISPARTA GONEN 6,5 10,49 0,95 1,05 0 12 ISPARTA ATABEY 6,5 13,34 0,74 1,41 0 15 ISPARTA GELENDOST 6,5 16,3 0,73 0,78 0 18 ISPARTA ULUBORLU 6,5 19,5 0,53 1,44 0 21 ISPARTA SENIRKENT 6,5 14,55 6,82 4,8 0 26 ISPARTA KECIBORLU 6,5 22,28 1,87 2,43 0 27 ISPARTA S.KARAAGAC 6,5 22,86 3,97 7,74 0 35 ISPARTA EGIRDIR 6,5 27,54 7,62 14,79 0 50 ISPARTA YALVAC 6,5 17,73 8,96 19,68 0 46 ISPARTA ISPARTA C. 6,5 167,6 49,58 137,07 0 354 IZMIR BEYDAG 6,5 13,84 5,8 3,84 0 23 IZMIR KIRAZ 6,5 15,71 6,28 2,4 0 24 IZMIR KINIK 6,5 33,75 4,58 1,05 0 39 IZMIR TIRE 6,5 77,84 16,77 28,89 0 124 IZMIR ODEMIS 6,5 97,11 27,29 65,85 0 190 K.MARAS CAG.CERIT 6,5 22,34 2,02 0,39 0 25 K.MARAS K.MARAŞ C. 6,5 172,05 218,91 65,7 0 457 KARABUK YENICE 6,5 6,46 11,49 15,54 0 33 KARABUK SAFRANBOLU 6,5 26,42 25,47 23,82 0 76 KARABUK KARABÜK C. 6,5 95,2 19,81 65,46 0 180 KASTAMONU TASKOPRU 6,5 6,64 14,4 15,72 0 37 KASTAMONU KASTAMONU C. 6,5 7,26 69,58 44,22 0 121 KAYSERI BUNYAN 6,5 23,21 3,81 3,27 0 30 KAYSERI YAHYALI 6,5 32,41 11,11 4,62 0 48 KAYSERI TALAS 6,5 15,55 6,04 20,7 0 42 KILIS MUSABEYLI 6,5 1,03 0,68 0,09 0 2 KONYA DERBENT 6,5 15,23 1,74 0,45 0 17 KONYA AKOREN 6,5 5,24 0 0,33 0 6 KONYA HUYUK 6,5 14,14 0,32 1,95 0 16 KONYA TUZLUKCU 6,5 11,79 0,35 0,09 0 12 KONYA DOGANHISAR 6,5 17,98 3,42 5,97 0 27 KONYA ILGIN 6,5 30,53 20,79 10,47 0 62 KONYA AKSEHIR 6,5 59,44 11,8 49,89 0 121 KUTAHYA DUMLUPINAR 6,5 4,91 0,89 0,57 0 6 KUTAHYA ASLANAPA 6,5 1,01 3,72 0,24 0 5 KUTAHYA CAVDARHISAR 6,5 0,32 7,56 0,6 0 8 KUTAHYA SAPHANE 6,5 3,14 11,36 1,17 0 16 KUTAHYA PAZARLAR 6,5 8,53 1,98 1,53 0 12 KUTAHYA HISARCIK 6,5 8,76 3,24 5,67 0 18 KUTAHYA ALTINTAS 6,5 6,99 4,29 1,8 0 13 KUTAHYA EMET 6,5 0,95 24,69 5,73 0 31 KUTAHYA GEDIZ 6,5 1,24 42,95 1,53 0 46 KUTAHYA SIMAV 6,5 17,01 19,25 36,87 0 73 KUTAHYA KÜTAHYA C. 6,5 201,05 18,29 164,22 0 384 MALATYA KALE 6,5 6,32 0,35 0,18 0 7 MALATYA DOGANSEHIR 6,5 14,8 2,92 2,07 0 20 MANISA KOPRUBASI 6,5 9,15 6,11 1,53 0 17
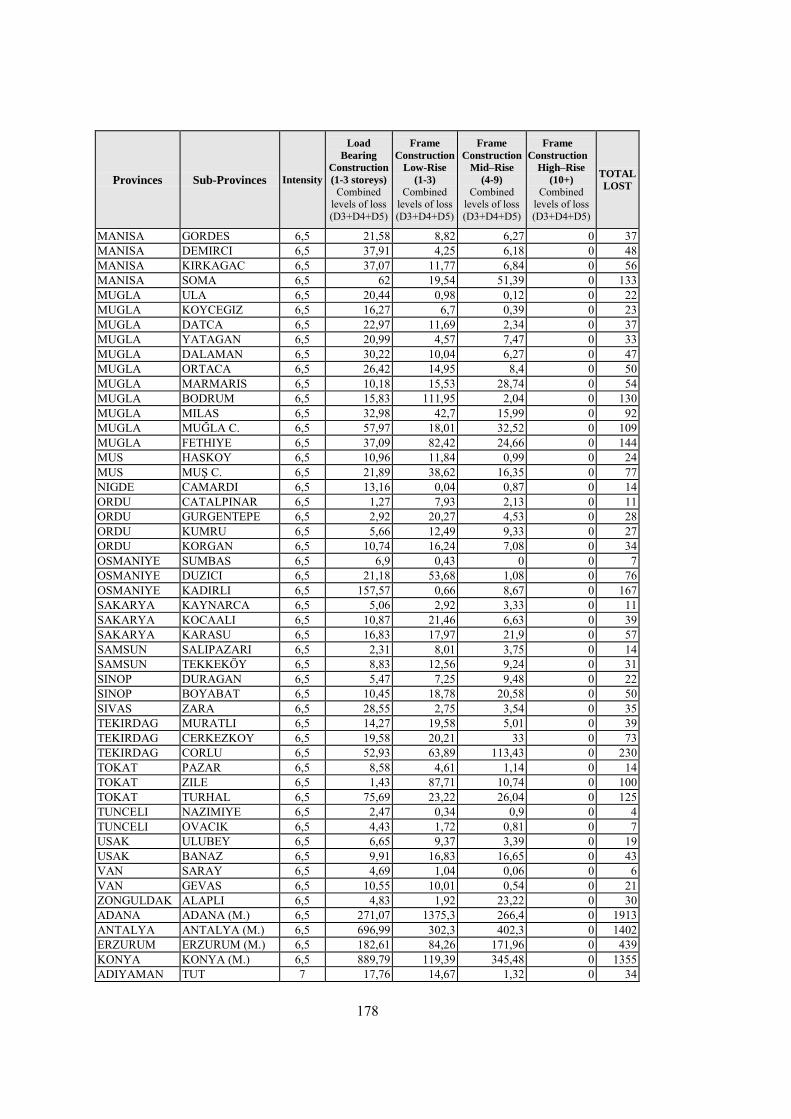
178
Provinces Sub-Provinces Intensity
Load
Bearing
Construction
(1-3 storeys)
Combined levels of loss (D3+D4+D5)
Frame
Construction
Low-Rise
(1-3) Combined
levels of loss (D3+D4+D5)
Frame
Construction
Mid–Rise
(4-9) Combined
levels of loss (D3+D4+D5)
Frame
Construction
High–Rise
(10+) Combined
levels of loss (D3+D4+D5)
TOTAL
LOST
MANISA GORDES 6,5 21,58 8,82 6,27 0 37 MANISA DEMIRCI 6,5 37,91 4,25 6,18 0 48 MANISA KIRKAGAC 6,5 37,07 11,77 6,84 0 56 MANISA SOMA 6,5 62 19,54 51,39 0 133 MUGLA ULA 6,5 20,44 0,98 0,12 0 22 MUGLA KOYCEGIZ 6,5 16,27 6,7 0,39 0 23 MUGLA DATCA 6,5 22,97 11,69 2,34 0 37 MUGLA YATAGAN 6,5 20,99 4,57 7,47 0 33 MUGLA DALAMAN 6,5 30,22 10,04 6,27 0 47 MUGLA ORTACA 6,5 26,42 14,95 8,4 0 50 MUGLA MARMARIS 6,5 10,18 15,53 28,74 0 54 MUGLA BODRUM 6,5 15,83 111,95 2,04 0 130 MUGLA MILAS 6,5 32,98 42,7 15,99 0 92 MUGLA MUĞLA C. 6,5 57,97 18,01 32,52 0 109 MUGLA FETHIYE 6,5 37,09 82,42 24,66 0 144 MUS HASKOY 6,5 10,96 11,84 0,99 0 24 MUS MUŞ C. 6,5 21,89 38,62 16,35 0 77 NIGDE CAMARDI 6,5 13,16 0,04 0,87 0 14 ORDU CATALPINAR 6,5 1,27 7,93 2,13 0 11 ORDU GURGENTEPE 6,5 2,92 20,27 4,53 0 28 ORDU KUMRU 6,5 5,66 12,49 9,33 0 27 ORDU KORGAN 6,5 10,74 16,24 7,08 0 34 OSMANIYE SUMBAS 6,5 6,9 0,43 0 0 7 OSMANIYE DUZICI 6,5 21,18 53,68 1,08 0 76 OSMANIYE KADIRLI 6,5 157,57 0,66 8,67 0 167 SAKARYA KAYNARCA 6,5 5,06 2,92 3,33 0 11 SAKARYA KOCAALI 6,5 10,87 21,46 6,63 0 39 SAKARYA KARASU 6,5 16,83 17,97 21,9 0 57 SAMSUN SALIPAZARI 6,5 2,31 8,01 3,75 0 14 SAMSUN TEKKEKÖY 6,5 8,83 12,56 9,24 0 31 SINOP DURAGAN 6,5 5,47 7,25 9,48 0 22 SINOP BOYABAT 6,5 10,45 18,78 20,58 0 50 SIVAS ZARA 6,5 28,55 2,75 3,54 0 35 TEKIRDAG MURATLI 6,5 14,27 19,58 5,01 0 39 TEKIRDAG CERKEZKOY 6,5 19,58 20,21 33 0 73 TEKIRDAG CORLU 6,5 52,93 63,89 113,43 0 230 TOKAT PAZAR 6,5 8,58 4,61 1,14 0 14 TOKAT ZILE 6,5 1,43 87,71 10,74 0 100 TOKAT TURHAL 6,5 75,69 23,22 26,04 0 125 TUNCELI NAZIMIYE 6,5 2,47 0,34 0,9 0 4 TUNCELI OVACIK 6,5 4,43 1,72 0,81 0 7 USAK ULUBEY 6,5 6,65 9,37 3,39 0 19 USAK BANAZ 6,5 9,91 16,83 16,65 0 43 VAN SARAY 6,5 4,69 1,04 0,06 0 6 VAN GEVAS 6,5 10,55 10,01 0,54 0 21 ZONGULDAK ALAPLI 6,5 4,83 1,92 23,22 0 30 ADANA ADANA (M.) 6,5 271,07 1375,3 266,4 0 1913 ANTALYA ANTALYA (M.) 6,5 696,99 302,3 402,3 0 1402 ERZURUM ERZURUM (M.) 6,5 182,61 84,26 171,96 0 439 KONYA KONYA (M.) 6,5 889,79 119,39 345,48 0 1355 ADIYAMAN TUT 7 17,76 14,67 1,32 0 34
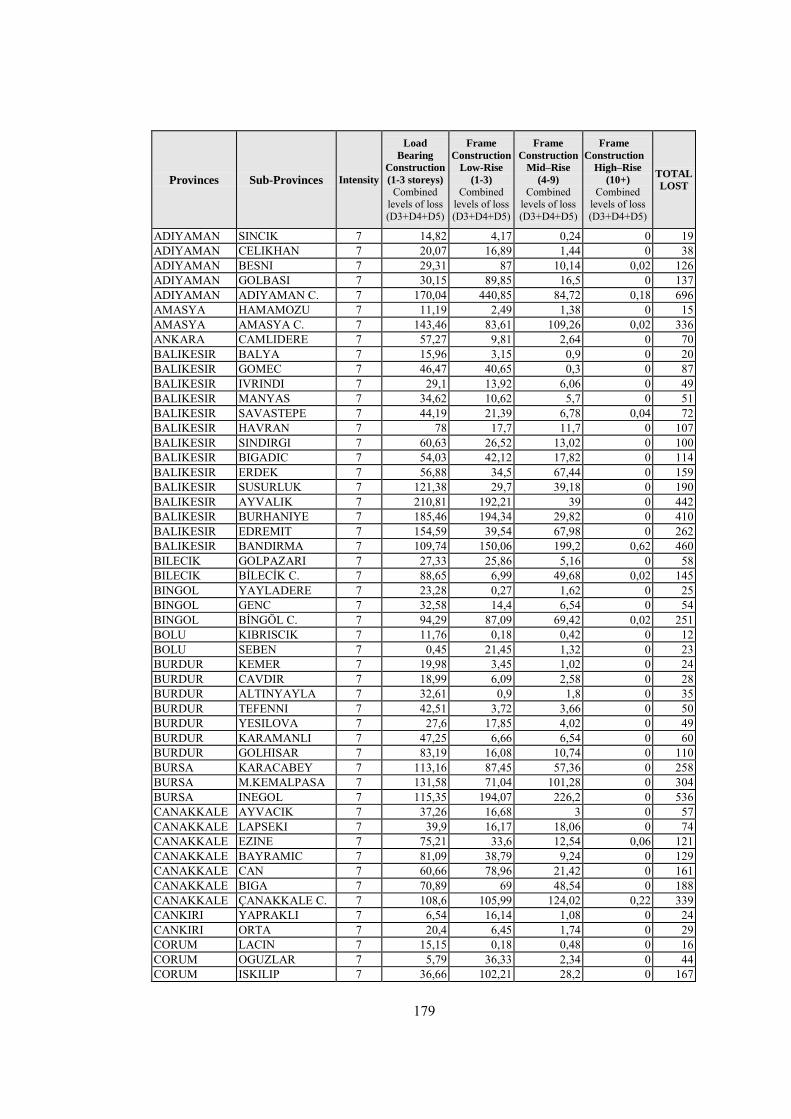
179
Provinces Sub-Provinces Intensity
Load
Bearing
Construction
(1-3 storeys)
Combined levels of loss (D3+D4+D5)
Frame
Construction
Low-Rise
(1-3) Combined
levels of loss (D3+D4+D5)
Frame
Construction
Mid–Rise
(4-9) Combined
levels of loss (D3+D4+D5)
Frame
Construction
High–Rise
(10+) Combined
levels of loss (D3+D4+D5)
TOTAL
LOST
ADIYAMAN SINCIK 7 14,82 4,17 0,24 0 19 ADIYAMAN CELIKHAN 7 20,07 16,89 1,44 0 38 ADIYAMAN BESNI 7 29,31 87 10,14 0,02 126 ADIYAMAN GOLBASI 7 30,15 89,85 16,5 0 137 ADIYAMAN ADIYAMAN C. 7 170,04 440,85 84,72 0,18 696 AMASYA HAMAMOZU 7 11,19 2,49 1,38 0 15 AMASYA AMASYA C. 7 143,46 83,61 109,26 0,02 336 ANKARA CAMLIDERE 7 57,27 9,81 2,64 0 70 BALIKESIR BALYA 7 15,96 3,15 0,9 0 20 BALIKESIR GOMEC 7 46,47 40,65 0,3 0 87 BALIKESIR IVRINDI 7 29,1 13,92 6,06 0 49 BALIKESIR MANYAS 7 34,62 10,62 5,7 0 51 BALIKESIR SAVASTEPE 7 44,19 21,39 6,78 0,04 72 BALIKESIR HAVRAN 7 78 17,7 11,7 0 107 BALIKESIR SINDIRGI 7 60,63 26,52 13,02 0 100 BALIKESIR BIGADIC 7 54,03 42,12 17,82 0 114 BALIKESIR ERDEK 7 56,88 34,5 67,44 0 159 BALIKESIR SUSURLUK 7 121,38 29,7 39,18 0 190 BALIKESIR AYVALIK 7 210,81 192,21 39 0 442 BALIKESIR BURHANIYE 7 185,46 194,34 29,82 0 410 BALIKESIR EDREMIT 7 154,59 39,54 67,98 0 262 BALIKESIR BANDIRMA 7 109,74 150,06 199,2 0,62 460 BILECIK GOLPAZARI 7 27,33 25,86 5,16 0 58 BILECIK BİLECİK C. 7 88,65 6,99 49,68 0,02 145 BINGOL YAYLADERE 7 23,28 0,27 1,62 0 25 BINGOL GENC 7 32,58 14,4 6,54 0 54 BINGOL BİNGÖL C. 7 94,29 87,09 69,42 0,02 251 BOLU KIBRISCIK 7 11,76 0,18 0,42 0 12 BOLU SEBEN 7 0,45 21,45 1,32 0 23 BURDUR KEMER 7 19,98 3,45 1,02 0 24 BURDUR CAVDIR 7 18,99 6,09 2,58 0 28 BURDUR ALTINYAYLA 7 32,61 0,9 1,8 0 35 BURDUR TEFENNI 7 42,51 3,72 3,66 0 50 BURDUR YESILOVA 7 27,6 17,85 4,02 0 49 BURDUR KARAMANLI 7 47,25 6,66 6,54 0 60 BURDUR GOLHISAR 7 83,19 16,08 10,74 0 110 BURSA KARACABEY 7 113,16 87,45 57,36 0 258 BURSA M.KEMALPASA 7 131,58 71,04 101,28 0 304 BURSA INEGOL 7 115,35 194,07 226,2 0 536 CANAKKALE AYVACIK 7 37,26 16,68 3 0 57 CANAKKALE LAPSEKI 7 39,9 16,17 18,06 0 74 CANAKKALE EZINE 7 75,21 33,6 12,54 0,06 121 CANAKKALE BAYRAMIC 7 81,09 38,79 9,24 0 129 CANAKKALE CAN 7 60,66 78,96 21,42 0 161 CANAKKALE BIGA 7 70,89 69 48,54 0 188 CANAKKALE ÇANAKKALE C. 7 108,6 105,99 124,02 0,22 339 CANKIRI YAPRAKLI 7 6,54 16,14 1,08 0 24 CANKIRI ORTA 7 20,4 6,45 1,74 0 29 CORUM LACIN 7 15,15 0,18 0,48 0 16 CORUM OGUZLAR 7 5,79 36,33 2,34 0 44 CORUM ISKILIP 7 36,66 102,21 28,2 0 167
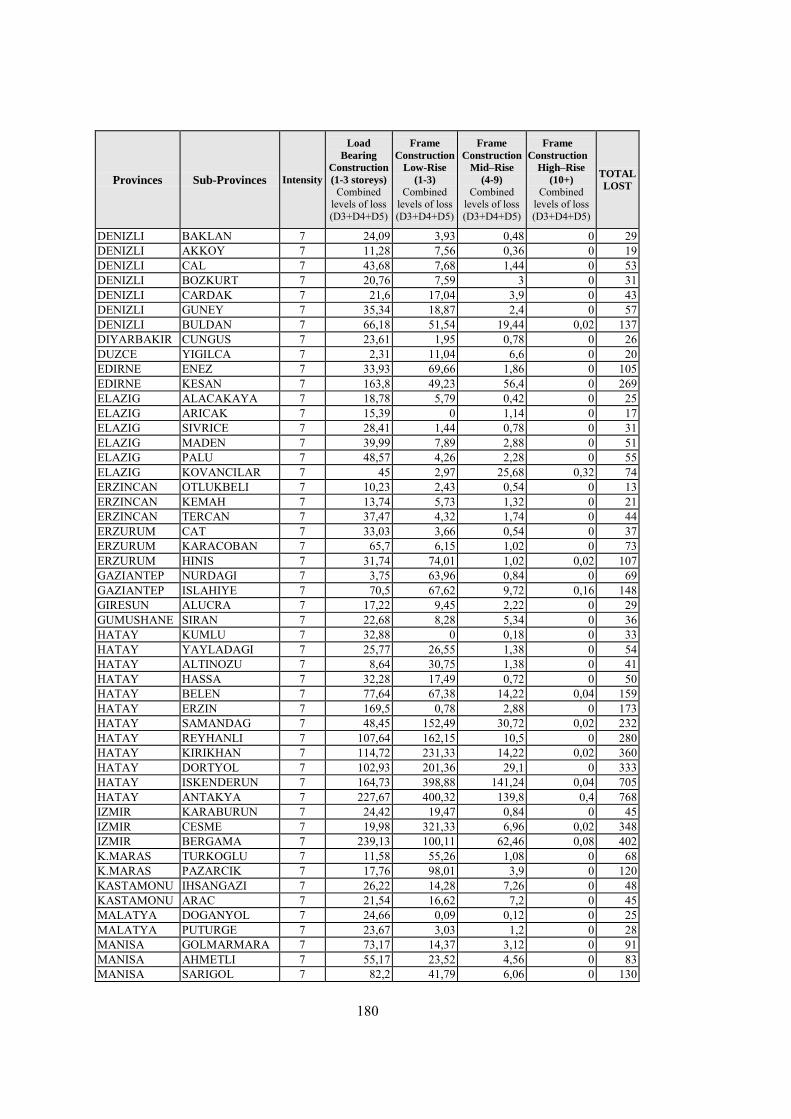
180
Provinces Sub-Provinces Intensity
Load
Bearing
Construction
(1-3 storeys)
Combined levels of loss (D3+D4+D5)
Frame
Construction
Low-Rise
(1-3) Combined
levels of loss (D3+D4+D5)
Frame
Construction
Mid–Rise
(4-9) Combined
levels of loss (D3+D4+D5)
Frame
Construction
High–Rise
(10+) Combined
levels of loss (D3+D4+D5)
TOTAL
LOST
DENIZLI BAKLAN 7 24,09 3,93 0,48 0 29 DENIZLI AKKOY 7 11,28 7,56 0,36 0 19 DENIZLI CAL 7 43,68 7,68 1,44 0 53 DENIZLI BOZKURT 7 20,76 7,59 3 0 31 DENIZLI CARDAK 7 21,6 17,04 3,9 0 43 DENIZLI GUNEY 7 35,34 18,87 2,4 0 57 DENIZLI BULDAN 7 66,18 51,54 19,44 0,02 137 DIYARBAKIR CUNGUS 7 23,61 1,95 0,78 0 26 DUZCE YIGILCA 7 2,31 11,04 6,6 0 20 EDIRNE ENEZ 7 33,93 69,66 1,86 0 105 EDIRNE KESAN 7 163,8 49,23 56,4 0 269 ELAZIG ALACAKAYA 7 18,78 5,79 0,42 0 25 ELAZIG ARICAK 7 15,39 0 1,14 0 17 ELAZIG SIVRICE 7 28,41 1,44 0,78 0 31 ELAZIG MADEN 7 39,99 7,89 2,88 0 51 ELAZIG PALU 7 48,57 4,26 2,28 0 55 ELAZIG KOVANCILAR 7 45 2,97 25,68 0,32 74 ERZINCAN OTLUKBELI 7 10,23 2,43 0,54 0 13 ERZINCAN KEMAH 7 13,74 5,73 1,32 0 21 ERZINCAN TERCAN 7 37,47 4,32 1,74 0 44 ERZURUM CAT 7 33,03 3,66 0,54 0 37 ERZURUM KARACOBAN 7 65,7 6,15 1,02 0 73 ERZURUM HINIS 7 31,74 74,01 1,02 0,02 107 GAZIANTEP NURDAGI 7 3,75 63,96 0,84 0 69 GAZIANTEP ISLAHIYE 7 70,5 67,62 9,72 0,16 148 GIRESUN ALUCRA 7 17,22 9,45 2,22 0 29 GUMUSHANE SIRAN 7 22,68 8,28 5,34 0 36 HATAY KUMLU 7 32,88 0 0,18 0 33 HATAY YAYLADAGI 7 25,77 26,55 1,38 0 54 HATAY ALTINOZU 7 8,64 30,75 1,38 0 41 HATAY HASSA 7 32,28 17,49 0,72 0 50 HATAY BELEN 7 77,64 67,38 14,22 0,04 159 HATAY ERZIN 7 169,5 0,78 2,88 0 173 HATAY SAMANDAG 7 48,45 152,49 30,72 0,02 232 HATAY REYHANLI 7 107,64 162,15 10,5 0 280 HATAY KIRIKHAN 7 114,72 231,33 14,22 0,02 360 HATAY DORTYOL 7 102,93 201,36 29,1 0 333 HATAY ISKENDERUN 7 164,73 398,88 141,24 0,04 705 HATAY ANTAKYA 7 227,67 400,32 139,8 0,4 768 IZMIR KARABURUN 7 24,42 19,47 0,84 0 45 IZMIR CESME 7 19,98 321,33 6,96 0,02 348 IZMIR BERGAMA 7 239,13 100,11 62,46 0,08 402 K.MARAS TURKOGLU 7 11,58 55,26 1,08 0 68 K.MARAS PAZARCIK 7 17,76 98,01 3,9 0 120 KASTAMONU IHSANGAZI 7 26,22 14,28 7,26 0 48 KASTAMONU ARAC 7 21,54 16,62 7,2 0 45 MALATYA DOGANYOL 7 24,66 0,09 0,12 0 25 MALATYA PUTURGE 7 23,67 3,03 1,2 0 28 MANISA GOLMARMARA 7 73,17 14,37 3,12 0 91 MANISA AHMETLI 7 55,17 23,52 4,56 0 83 MANISA SARIGOL 7 82,2 41,79 6,06 0 130

181
Provinces Sub-Provinces Intensity
Load
Bearing
Construction
(1-3 storeys)
Combined levels of loss (D3+D4+D5)
Frame
Construction
Low-Rise
(1-3) Combined
levels of loss (D3+D4+D5)
Frame
Construction
Mid–Rise
(4-9) Combined
levels of loss (D3+D4+D5)
Frame
Construction
High–Rise
(10+) Combined
levels of loss (D3+D4+D5)
TOTAL
LOST
MANISA SARUHANLI 7 83,85 20,88 7,68 0 112 MANISA KULA 7 140,28 85,08 10,92 0 236 MANISA ALASEHIR 7 187,2 78,57 40,02 0,02 306 MANISA SALIHLI 7 171,21 162,6 149,04 0,02 483 MANISA AKHISAR 7 390,66 88,68 105,6 0 585 MANISA TURGUTLU 7 272,64 245,79 121,02 0,02 639 MANISA MANİSA C. 7 409,92 156,12 352,38 0,12 919 MUS KORKUT 7 12,18 6,39 0,24 0 19 MUS MALAZGIRT 7 69,15 53,34 2,82 0 125 ORDU AKKUS 7 6,24 8,16 5,16 0 20 ORDU AYBASTI 7 13,2 83,19 28,14 0 125 ORDU GOLKOY 7 77,58 42,48 14,04 0,04 134 OSMANIYE HASANBEYLI 7 23,94 19,32 0 0 43 OSMANIYE TOPRAKKALE 7 2,01 47,7 0,12 0 50 OSMANIYE BAHCE 7 10,59 57,36 1,92 0,02 70 OSMANIYE OSMANİYE C. 7 158,49 695,01 49,62 1,58 905 SAKARYA FERIZLI 7 23,37 30,96 6,66 0 61 SAMSUN AYVACIK 7 11,07 23,46 2,22 0 37 SINOP SARAYDUZU 7 5,76 5,19 1,14 0 12 SIVAS IMRANLI 7 17,16 21,21 1,44 0 40 TEKIRDAG MALKARA 7 67,08 45,99 43,98 0 157 TOKAT TOKAT C. 7 135,18 255,48 137,7 0,04 528 USAK ESME 7 91,41 17,1 10,56 0 119 VAN GURPINAR 7 24,42 0,75 0,66 0 26 VAN OZALP 7 31,53 9,39 2,46 0 43 VAN EDREMIT 7 27,87 4,35 0,72 0 33 VAN BASKALE 7 41,19 17,58 1,08 0 60 IZMIR IZMIR (M.) 7 4157,31 6482,7 3867,96 23,42 14531 AMASYA GUMSHACIKOY 7,5 189,84 46,5 35,1 0 271 AMASYA SULUOVA 7,5 286,08 255,18 91,5 0 633 AMASYA MERZIFON 7,5 366,72 129,84 168,9 0,12 666 BILECIK OSMANELI 7,5 87,54 45,72 24,45 0 158 BINGOL ADAKLI 7,5 49,98 0,42 1,35 0 52 BINGOL KIGI 7,5 36,06 5,28 1,35 0 43 BITLIS ADILCEVAZ 7,5 121,5 37,74 12,3 0 172 BITLIS AHLAT 7,5 120 103,26 10,65 0 234 BOLU GOYNUK 7,5 13,26 59,04 2,7 0 75 BOLU MUDURNU 7,5 10,2 85,32 8,4 0,12 104 BOLU MENGEN 7,5 17,82 35,22 22,65 0 76 BURSA IZNIK 7,5 88,98 139,44 23,7 0 252 BURSA YENISEHIR 7,5 185,58 90,54 62,85 0 339 CANKIRI KORGUN 7,5 34,8 6,36 2,7 0 44 CANKIRI ATKARACALAR 7,5 19,14 22,38 3,15 0 45 CANKIRI KURSUNLU 7,5 65,64 9,54 8,55 0 84 CORUM DODURGA 7,5 54,42 4,44 1,5 0 60 DUZCE CILIMLI 7,5 2,28 43,98 2,4 0 49 DUZCE GUMUSOVA 7,5 12,42 58,74 15 0 86 DUZCE CUMAYERI 7,5 3,3 57,66 5,7 0 67 DUZCE DÜZCE M. 7,5 117,42 326,76 168,15 0 612 ERZINCAN CAYIRLI 7,5 53,34 3,78 4,05 0 61 GIRESUN S.KARAHISAR 7,5 87,18 97,62 37,05 0 222
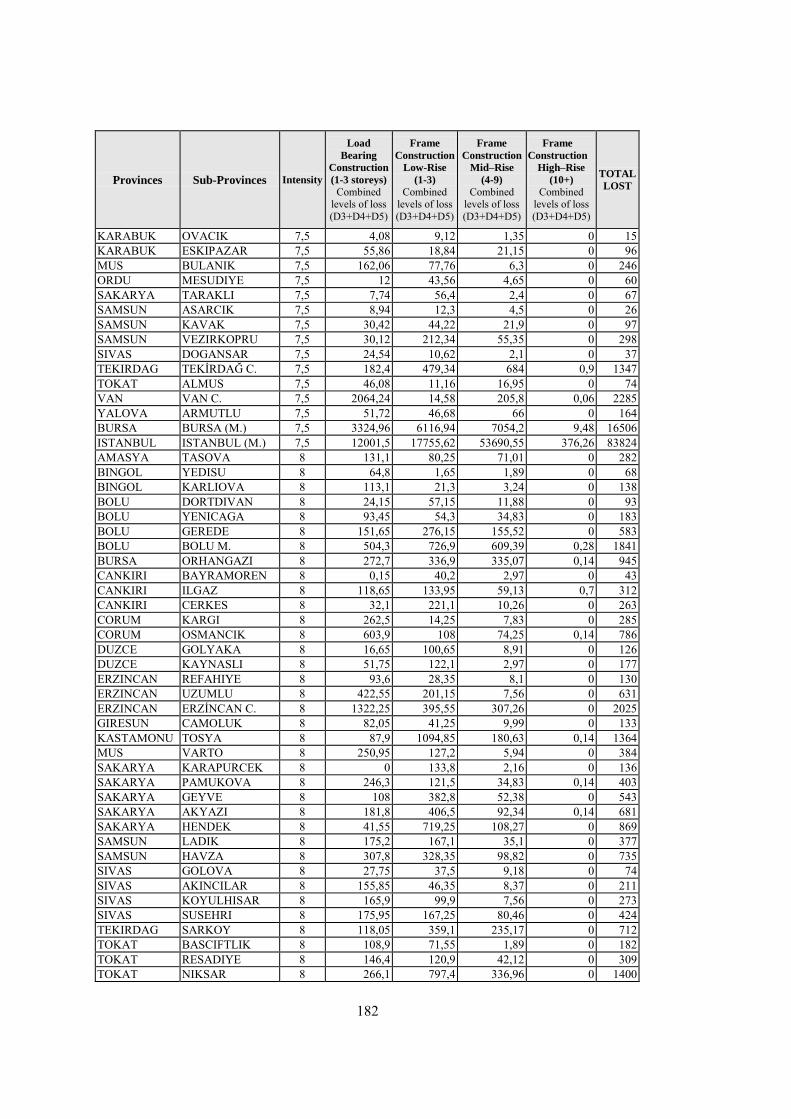
182
Provinces Sub-Provinces Intensity
Load
Bearing
Construction
(1-3 storeys)
Combined levels of loss (D3+D4+D5)
Frame
Construction
Low-Rise
(1-3) Combined
levels of loss (D3+D4+D5)
Frame
Construction
Mid–Rise
(4-9) Combined
levels of loss (D3+D4+D5)
Frame
Construction
High–Rise
(10+) Combined
levels of loss (D3+D4+D5)
TOTAL
LOST
KARABUK OVACIK 7,5 4,08 9,12 1,35 0 15 KARABUK ESKIPAZAR 7,5 55,86 18,84 21,15 0 96 MUS BULANIK 7,5 162,06 77,76 6,3 0 246 ORDU MESUDIYE 7,5 12 43,56 4,65 0 60 SAKARYA TARAKLI 7,5 7,74 56,4 2,4 0 67 SAMSUN ASARCIK 7,5 8,94 12,3 4,5 0 26 SAMSUN KAVAK 7,5 30,42 44,22 21,9 0 97 SAMSUN VEZIRKOPRU 7,5 30,12 212,34 55,35 0 298 SIVAS DOGANSAR 7,5 24,54 10,62 2,1 0 37 TEKIRDAG TEKİRDAĞ C. 7,5 182,4 479,34 684 0,9 1347 TOKAT ALMUS 7,5 46,08 11,16 16,95 0 74 VAN VAN C. 7,5 2064,24 14,58 205,8 0,06 2285 YALOVA ARMUTLU 7,5 51,72 46,68 66 0 164 BURSA BURSA (M.) 7,5 3324,96 6116,94 7054,2 9,48 16506 ISTANBUL ISTANBUL (M.) 7,5 12001,5 17755,62 53690,55 376,26 83824 AMASYA TASOVA 8 131,1 80,25 71,01 0 282 BINGOL YEDISU 8 64,8 1,65 1,89 0 68 BINGOL KARLIOVA 8 113,1 21,3 3,24 0 138 BOLU DORTDIVAN 8 24,15 57,15 11,88 0 93 BOLU YENICAGA 8 93,45 54,3 34,83 0 183 BOLU GEREDE 8 151,65 276,15 155,52 0 583 BOLU BOLU M. 8 504,3 726,9 609,39 0,28 1841 BURSA ORHANGAZI 8 272,7 336,9 335,07 0,14 945 CANKIRI BAYRAMOREN 8 0,15 40,2 2,97 0 43 CANKIRI ILGAZ 8 118,65 133,95 59,13 0,7 312 CANKIRI CERKES 8 32,1 221,1 10,26 0 263 CORUM KARGI 8 262,5 14,25 7,83 0 285 CORUM OSMANCIK 8 603,9 108 74,25 0,14 786 DUZCE GOLYAKA 8 16,65 100,65 8,91 0 126 DUZCE KAYNASLI 8 51,75 122,1 2,97 0 177 ERZINCAN REFAHIYE 8 93,6 28,35 8,1 0 130 ERZINCAN UZUMLU 8 422,55 201,15 7,56 0 631 ERZINCAN ERZİNCAN C. 8 1322,25 395,55 307,26 0 2025 GIRESUN CAMOLUK 8 82,05 41,25 9,99 0 133 KASTAMONU TOSYA 8 87,9 1094,85 180,63 0,14 1364 MUS VARTO 8 250,95 127,2 5,94 0 384 SAKARYA KARAPURCEK 8 0 133,8 2,16 0 136 SAKARYA PAMUKOVA 8 246,3 121,5 34,83 0,14 403 SAKARYA GEYVE 8 108 382,8 52,38 0 543 SAKARYA AKYAZI 8 181,8 406,5 92,34 0,14 681 SAKARYA HENDEK 8 41,55 719,25 108,27 0 869 SAMSUN LADIK 8 175,2 167,1 35,1 0 377 SAMSUN HAVZA 8 307,8 328,35 98,82 0 735 SIVAS GOLOVA 8 27,75 37,5 9,18 0 74 SIVAS AKINCILAR 8 155,85 46,35 8,37 0 211 SIVAS KOYULHISAR 8 165,9 99,9 7,56 0 273 SIVAS SUSEHRI 8 175,95 167,25 80,46 0 424 TEKIRDAG SARKOY 8 118,05 359,1 235,17 0 712 TOKAT BASCIFTLIK 8 108,9 71,55 1,89 0 182 TOKAT RESADIYE 8 146,4 120,9 42,12 0 309 TOKAT NIKSAR 8 266,1 797,4 336,96 0 1400
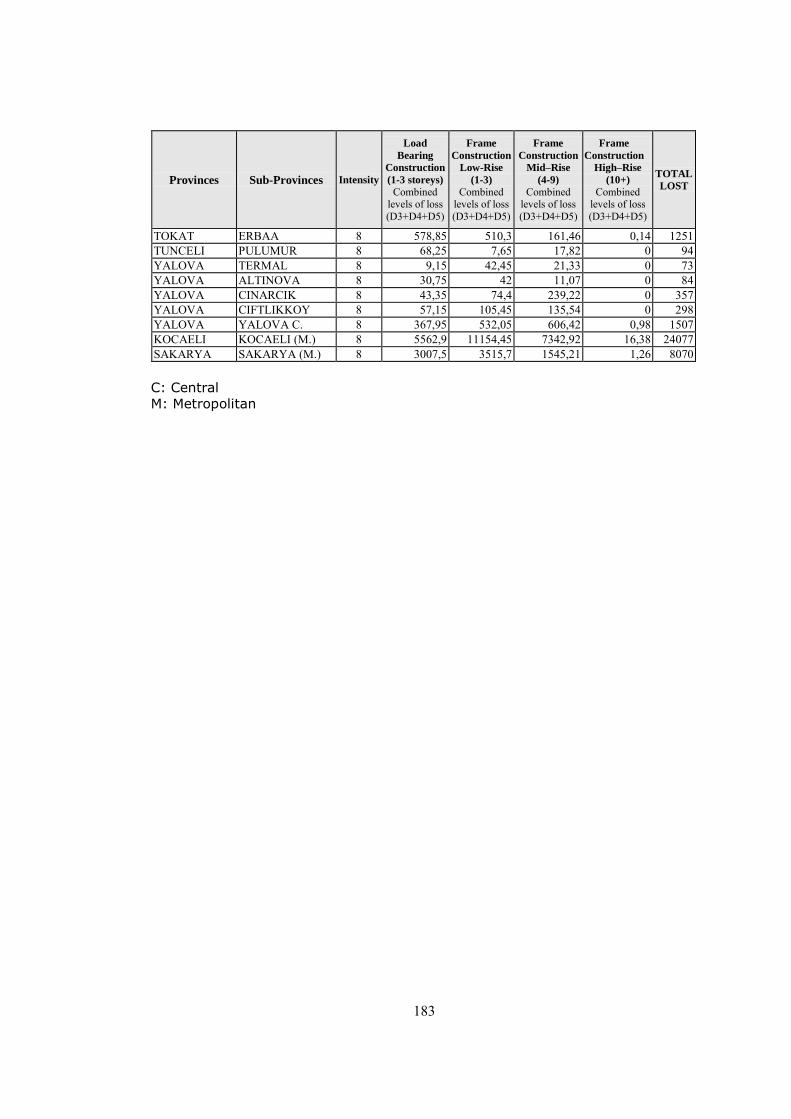
183
Provinces Sub-Provinces Intensity
Load
Bearing
Construction
(1-3 storeys)
Combined levels of loss (D3+D4+D5)
Frame
Construction
Low-Rise
(1-3) Combined
levels of loss (D3+D4+D5)
Frame
Construction
Mid–Rise
(4-9) Combined
levels of loss (D3+D4+D5)
Frame
Construction
High–Rise
(10+) Combined
levels of loss (D3+D4+D5)
TOTAL
LOST
TOKAT ERBAA 8 578,85 510,3 161,46 0,14 1251 TUNCELI PULUMUR 8 68,25 7,65 17,82 0 94 YALOVA TERMAL 8 9,15 42,45 21,33 0 73 YALOVA ALTINOVA 8 30,75 42 11,07 0 84 YALOVA CINARCIK 8 43,35 74,4 239,22 0 357 YALOVA CIFTLIKKOY 8 57,15 105,45 135,54 0 298 YALOVA YALOVA C. 8 367,95 532,05 606,42 0,98 1507 KOCAELI KOCAELI (M.) 8 5562,9 11154,45 7342,92 16,38 24077 SAKARYA SAKARYA (M.) 8 3007,5 3515,7 1545,21 1,26 8070
C: Central
M: Metropolitan
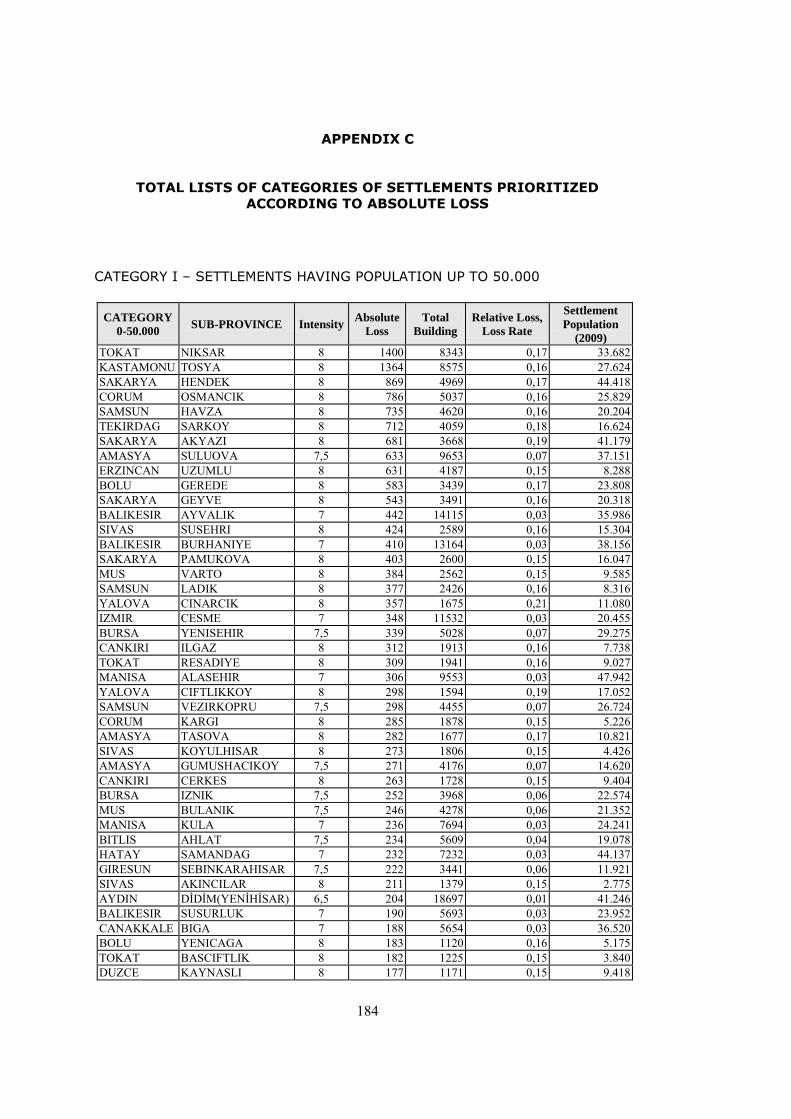
184
APPENDIX C
TOTAL LISTS OF CATEGORIES OF SETTLEMENTS PRIORITIZED
ACCORDING TO ABSOLUTE LOSS
CATEGORY I – SETTLEMENTS HAVING POPULATION UP TO 50.000
CATEGORY
0-50.000 SUB-PROVINCE Intensity Absolute
Loss Total
Building Relative Loss,
Loss Rate
Settlement
Population
(2009) TOKAT NIKSAR 8 1400 8343 0,17 33.682 KASTAMONU TOSYA 8 1364 8575 0,16 27.624 SAKARYA HENDEK 8 869 4969 0,17 44.418 CORUM OSMANCIK 8 786 5037 0,16 25.829 SAMSUN HAVZA 8 735 4620 0,16 20.204 TEKIRDAG SARKOY 8 712 4059 0,18 16.624 SAKARYA AKYAZI 8 681 3668 0,19 41.179 AMASYA SULUOVA 7,5 633 9653 0,07 37.151 ERZINCAN UZUMLU 8 631 4187 0,15 8.288 BOLU GEREDE 8 583 3439 0,17 23.808 SAKARYA GEYVE 8 543 3491 0,16 20.318 BALIKESIR AYVALIK 7 442 14115 0,03 35.986 SIVAS SUSEHRI 8 424 2589 0,16 15.304 BALIKESIR BURHANIYE 7 410 13164 0,03 38.156 SAKARYA PAMUKOVA 8 403 2600 0,15 16.047 MUS VARTO 8 384 2562 0,15 9.585 SAMSUN LADIK 8 377 2426 0,16 8.316 YALOVA CINARCIK 8 357 1675 0,21 11.080 IZMIR CESME 7 348 11532 0,03 20.455 BURSA YENISEHIR 7,5 339 5028 0,07 29.275 CANKIRI ILGAZ 8 312 1913 0,16 7.738 TOKAT RESADIYE 8 309 1941 0,16 9.027 MANISA ALASEHIR 7 306 9553 0,03 47.942 YALOVA CIFTLIKKOY 8 298 1594 0,19 17.052 SAMSUN VEZIRKOPRU 7,5 298 4455 0,07 26.724 CORUM KARGI 8 285 1878 0,15 5.226 AMASYA TASOVA 8 282 1677 0,17 10.821 SIVAS KOYULHISAR 8 273 1806 0,15 4.426 AMASYA GUMUSHACIKOY 7,5 271 4176 0,07 14.620 CANKIRI CERKES 8 263 1728 0,15 9.404 BURSA IZNIK 7,5 252 3968 0,06 22.574 MUS BULANIK 7,5 246 4278 0,06 21.352 MANISA KULA 7 236 7694 0,03 24.241 BITLIS AHLAT 7,5 234 5609 0,04 19.078 HATAY SAMANDAG 7 232 7232 0,03 44.137 GIRESUN SEBINKARAHISAR 7,5 222 3441 0,06 11.921 SIVAS AKINCILAR 8 211 1379 0,15 2.775 AYDIN DİDİM(YENİHİSAR) 6,5 204 18697 0,01 41.246 BALIKESIR SUSURLUK 7 190 5693 0,03 23.952 CANAKKALE BIGA 7 188 5654 0,03 36.520 BOLU YENICAGA 8 183 1120 0,16 5.175 TOKAT BASCIFTLIK 8 182 1225 0,15 3.840 DUZCE KAYNASLI 8 177 1171 0,15 9.418
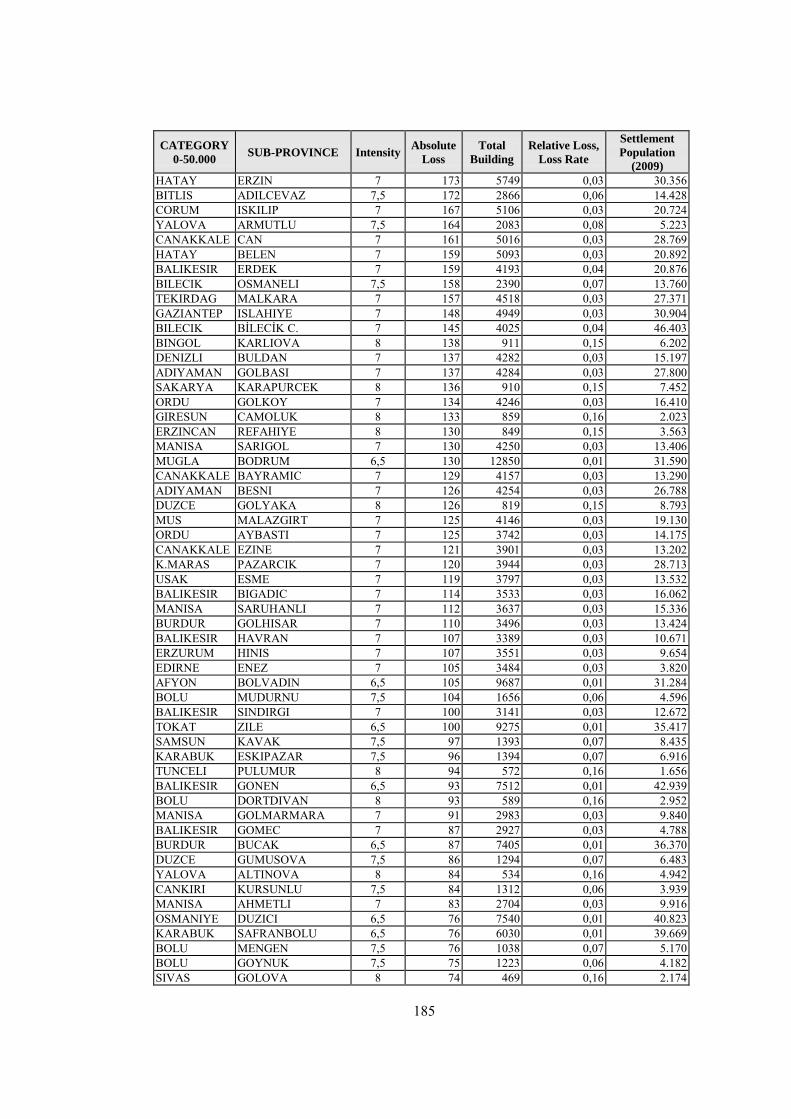
185
CATEGORY
0-50.000 SUB-PROVINCE Intensity Absolute
Loss Total
Building Relative Loss,
Loss Rate
Settlement
Population
(2009) HATAY ERZIN 7 173 5749 0,03 30.356 BITLIS ADILCEVAZ 7,5 172 2866 0,06 14.428 CORUM ISKILIP 7 167 5106 0,03 20.724 YALOVA ARMUTLU 7,5 164 2083 0,08 5.223 CANAKKALE CAN 7 161 5016 0,03 28.769 HATAY BELEN 7 159 5093 0,03 20.892 BALIKESIR ERDEK 7 159 4193 0,04 20.876 BILECIK OSMANELI 7,5 158 2390 0,07 13.760 TEKIRDAG MALKARA 7 157 4518 0,03 27.371 GAZIANTEP ISLAHIYE 7 148 4949 0,03 30.904 BILECIK BİLECİK C. 7 145 4025 0,04 46.403 BINGOL KARLIOVA 8 138 911 0,15 6.202 DENIZLI BULDAN 7 137 4282 0,03 15.197 ADIYAMAN GOLBASI 7 137 4284 0,03 27.800 SAKARYA KARAPURCEK 8 136 910 0,15 7.452 ORDU GOLKOY 7 134 4246 0,03 16.410 GIRESUN CAMOLUK 8 133 859 0,16 2.023 ERZINCAN REFAHIYE 8 130 849 0,15 3.563 MANISA SARIGOL 7 130 4250 0,03 13.406 MUGLA BODRUM 6,5 130 12850 0,01 31.590 CANAKKALE BAYRAMIC 7 129 4157 0,03 13.290 ADIYAMAN BESNI 7 126 4254 0,03 26.788 DUZCE GOLYAKA 8 126 819 0,15 8.793 MUS MALAZGIRT 7 125 4146 0,03 19.130 ORDU AYBASTI 7 125 3742 0,03 14.175 CANAKKALE EZINE 7 121 3901 0,03 13.202 K.MARAS PAZARCIK 7 120 3944 0,03 28.713 USAK ESME 7 119 3797 0,03 13.532 BALIKESIR BIGADIC 7 114 3533 0,03 16.062 MANISA SARUHANLI 7 112 3637 0,03 15.336 BURDUR GOLHISAR 7 110 3496 0,03 13.424 BALIKESIR HAVRAN 7 107 3389 0,03 10.671 ERZURUM HINIS 7 107 3551 0,03 9.654 EDIRNE ENEZ 7 105 3484 0,03 3.820 AFYON BOLVADIN 6,5 105 9687 0,01 31.284 BOLU MUDURNU 7,5 104 1656 0,06 4.596 BALIKESIR SINDIRGI 7 100 3141 0,03 12.672 TOKAT ZILE 6,5 100 9275 0,01 35.417 SAMSUN KAVAK 7,5 97 1393 0,07 8.435 KARABUK ESKIPAZAR 7,5 96 1394 0,07 6.916 TUNCELI PULUMUR 8 94 572 0,16 1.656 BALIKESIR GONEN 6,5 93 7512 0,01 42.939 BOLU DORTDIVAN 8 93 589 0,16 2.952 MANISA GOLMARMARA 7 91 2983 0,03 9.840 BALIKESIR GOMEC 7 87 2927 0,03 4.788 BURDUR BUCAK 6,5 87 7405 0,01 36.370 DUZCE GUMUSOVA 7,5 86 1294 0,07 6.483 YALOVA ALTINOVA 8 84 534 0,16 4.942 CANKIRI KURSUNLU 7,5 84 1312 0,06 3.939 MANISA AHMETLI 7 83 2704 0,03 9.916 OSMANIYE DUZICI 6,5 76 7540 0,01 40.823 KARABUK SAFRANBOLU 6,5 76 6030 0,01 39.669 BOLU MENGEN 7,5 76 1038 0,07 5.170 BOLU GOYNUK 7,5 75 1223 0,06 4.182 SIVAS GOLOVA 8 74 469 0,16 2.174
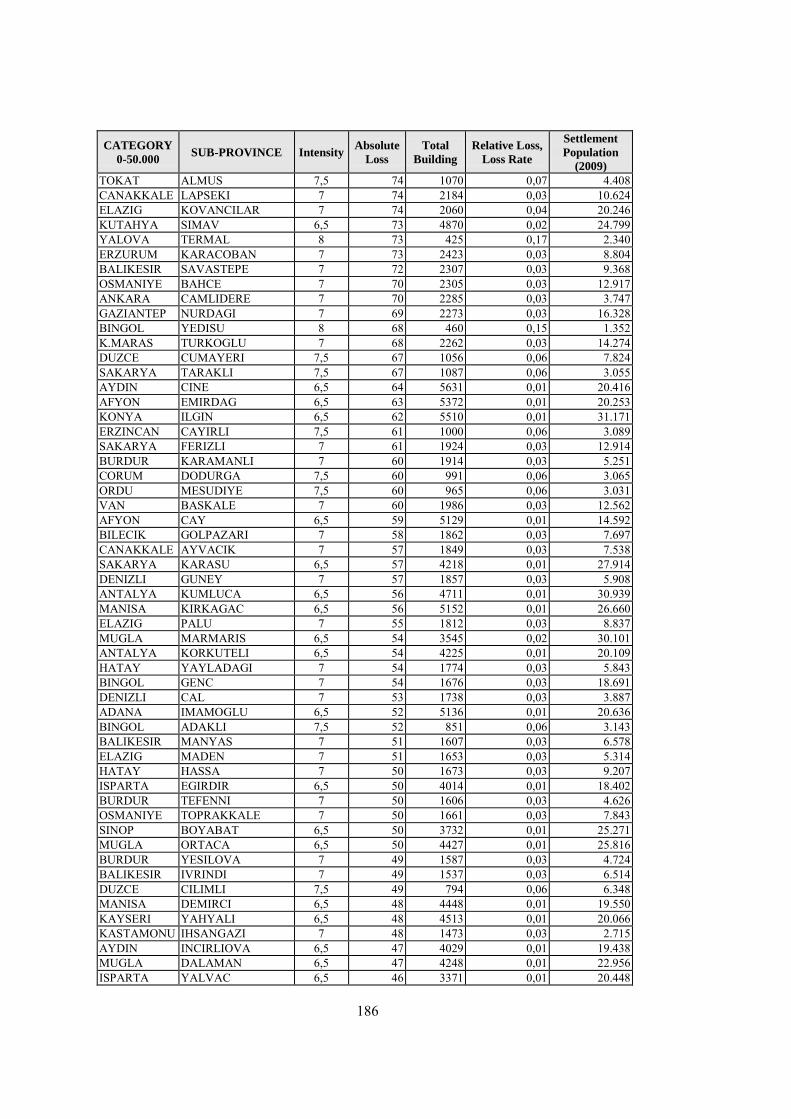
186
CATEGORY
0-50.000 SUB-PROVINCE Intensity Absolute
Loss Total
Building Relative Loss,
Loss Rate
Settlement
Population
(2009) TOKAT ALMUS 7,5 74 1070 0,07 4.408 CANAKKALE LAPSEKI 7 74 2184 0,03 10.624 ELAZIG KOVANCILAR 7 74 2060 0,04 20.246 KUTAHYA SIMAV 6,5 73 4870 0,02 24.799 YALOVA TERMAL 8 73 425 0,17 2.340 ERZURUM KARACOBAN 7 73 2423 0,03 8.804 BALIKESIR SAVASTEPE 7 72 2307 0,03 9.368 OSMANIYE BAHCE 7 70 2305 0,03 12.917 ANKARA CAMLIDERE 7 70 2285 0,03 3.747 GAZIANTEP NURDAGI 7 69 2273 0,03 16.328 BINGOL YEDISU 8 68 460 0,15 1.352 K.MARAS TURKOGLU 7 68 2262 0,03 14.274 DUZCE CUMAYERI 7,5 67 1056 0,06 7.824 SAKARYA TARAKLI 7,5 67 1087 0,06 3.055 AYDIN CINE 6,5 64 5631 0,01 20.416 AFYON EMIRDAG 6,5 63 5372 0,01 20.253 KONYA ILGIN 6,5 62 5510 0,01 31.171 ERZINCAN CAYIRLI 7,5 61 1000 0,06 3.089 SAKARYA FERIZLI 7 61 1924 0,03 12.914 BURDUR KARAMANLI 7 60 1914 0,03 5.251 CORUM DODURGA 7,5 60 991 0,06 3.065 ORDU MESUDIYE 7,5 60 965 0,06 3.031 VAN BASKALE 7 60 1986 0,03 12.562 AFYON CAY 6,5 59 5129 0,01 14.592 BILECIK GOLPAZARI 7 58 1862 0,03 7.697 CANAKKALE AYVACIK 7 57 1849 0,03 7.538 SAKARYA KARASU 6,5 57 4218 0,01 27.914 DENIZLI GUNEY 7 57 1857 0,03 5.908 ANTALYA KUMLUCA 6,5 56 4711 0,01 30.939 MANISA KIRKAGAC 6,5 56 5152 0,01 26.660 ELAZIG PALU 7 55 1812 0,03 8.837 MUGLA MARMARIS 6,5 54 3545 0,02 30.101 ANTALYA KORKUTELI 6,5 54 4225 0,01 20.109 HATAY YAYLADAGI 7 54 1774 0,03 5.843 BINGOL GENC 7 54 1676 0,03 18.691 DENIZLI CAL 7 53 1738 0,03 3.887 ADANA IMAMOGLU 6,5 52 5136 0,01 20.636 BINGOL ADAKLI 7,5 52 851 0,06 3.143 BALIKESIR MANYAS 7 51 1607 0,03 6.578 ELAZIG MADEN 7 51 1653 0,03 5.314 HATAY HASSA 7 50 1673 0,03 9.207 ISPARTA EGIRDIR 6,5 50 4014 0,01 18.402 BURDUR TEFENNI 7 50 1606 0,03 4.626 OSMANIYE TOPRAKKALE 7 50 1661 0,03 7.843 SINOP BOYABAT 6,5 50 3732 0,01 25.271 MUGLA ORTACA 6,5 50 4427 0,01 25.816 BURDUR YESILOVA 7 49 1587 0,03 4.724 BALIKESIR IVRINDI 7 49 1537 0,03 6.514 DUZCE CILIMLI 7,5 49 794 0,06 6.348 MANISA DEMIRCI 6,5 48 4448 0,01 19.550 KAYSERI YAHYALI 6,5 48 4513 0,01 20.066 KASTAMONU IHSANGAZI 7 48 1473 0,03 2.715 AYDIN INCIRLIOVA 6,5 47 4029 0,01 19.438 MUGLA DALAMAN 6,5 47 4248 0,01 22.956 ISPARTA YALVAC 6,5 46 3371 0,01 20.448
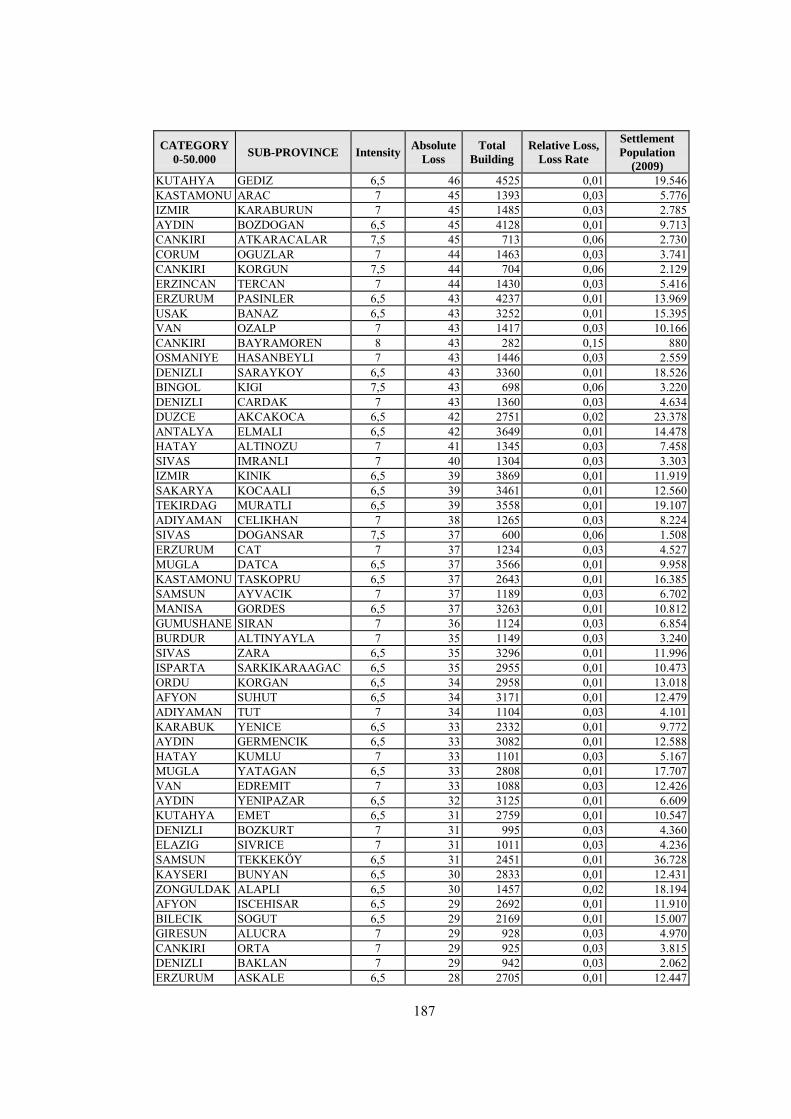
187
CATEGORY
0-50.000 SUB-PROVINCE Intensity Absolute
Loss Total
Building Relative Loss,
Loss Rate
Settlement
Population
(2009) KUTAHYA GEDIZ 6,5 46 4525 0,01 19.546 KASTAMONU ARAC 7 45 1393 0,03 5.776 IZMIR KARABURUN 7 45 1485 0,03 2.785 AYDIN BOZDOGAN 6,5 45 4128 0,01 9.713 CANKIRI ATKARACALAR 7,5 45 713 0,06 2.730 CORUM OGUZLAR 7 44 1463 0,03 3.741 CANKIRI KORGUN 7,5 44 704 0,06 2.129 ERZINCAN TERCAN 7 44 1430 0,03 5.416 ERZURUM PASINLER 6,5 43 4237 0,01 13.969 USAK BANAZ 6,5 43 3252 0,01 15.395 VAN OZALP 7 43 1417 0,03 10.166 CANKIRI BAYRAMOREN 8 43 282 0,15 880 OSMANIYE HASANBEYLI 7 43 1446 0,03 2.559 DENIZLI SARAYKOY 6,5 43 3360 0,01 18.526 BINGOL KIGI 7,5 43 698 0,06 3.220 DENIZLI CARDAK 7 43 1360 0,03 4.634 DUZCE AKCAKOCA 6,5 42 2751 0,02 23.378 ANTALYA ELMALI 6,5 42 3649 0,01 14.478 HATAY ALTINOZU 7 41 1345 0,03 7.458 SIVAS IMRANLI 7 40 1304 0,03 3.303 IZMIR KINIK 6,5 39 3869 0,01 11.919 SAKARYA KOCAALI 6,5 39 3461 0,01 12.560 TEKIRDAG MURATLI 6,5 39 3558 0,01 19.107 ADIYAMAN CELIKHAN 7 38 1265 0,03 8.224 SIVAS DOGANSAR 7,5 37 600 0,06 1.508 ERZURUM CAT 7 37 1234 0,03 4.527 MUGLA DATCA 6,5 37 3566 0,01 9.958 KASTAMONU TASKOPRU 6,5 37 2643 0,01 16.385 SAMSUN AYVACIK 7 37 1189 0,03 6.702 MANISA GORDES 6,5 37 3263 0,01 10.812 GUMUSHANE SIRAN 7 36 1124 0,03 6.854 BURDUR ALTINYAYLA 7 35 1149 0,03 3.240 SIVAS ZARA 6,5 35 3296 0,01 11.996 ISPARTA SARKIKARAAGAC 6,5 35 2955 0,01 10.473 ORDU KORGAN 6,5 34 2958 0,01 13.018 AFYON SUHUT 6,5 34 3171 0,01 12.479 ADIYAMAN TUT 7 34 1104 0,03 4.101 KARABUK YENICE 6,5 33 2332 0,01 9.772 AYDIN GERMENCIK 6,5 33 3082 0,01 12.588 HATAY KUMLU 7 33 1101 0,03 5.167 MUGLA YATAGAN 6,5 33 2808 0,01 17.707 VAN EDREMIT 7 33 1088 0,03 12.426 AYDIN YENIPAZAR 6,5 32 3125 0,01 6.609 KUTAHYA EMET 6,5 31 2759 0,01 10.547 DENIZLI BOZKURT 7 31 995 0,03 4.360 ELAZIG SIVRICE 7 31 1011 0,03 4.236 SAMSUN TEKKEKÖY 6,5 31 2451 0,01 36.728 KAYSERI BUNYAN 6,5 30 2833 0,01 12.431 ZONGULDAK ALAPLI 6,5 30 1457 0,02 18.194 AFYON ISCEHISAR 6,5 29 2692 0,01 11.910 BILECIK SOGUT 6,5 29 2169 0,01 15.007 GIRESUN ALUCRA 7 29 928 0,03 4.970 CANKIRI ORTA 7 29 925 0,03 3.815 DENIZLI BAKLAN 7 29 942 0,03 2.062 ERZURUM ASKALE 6,5 28 2705 0,01 12.447
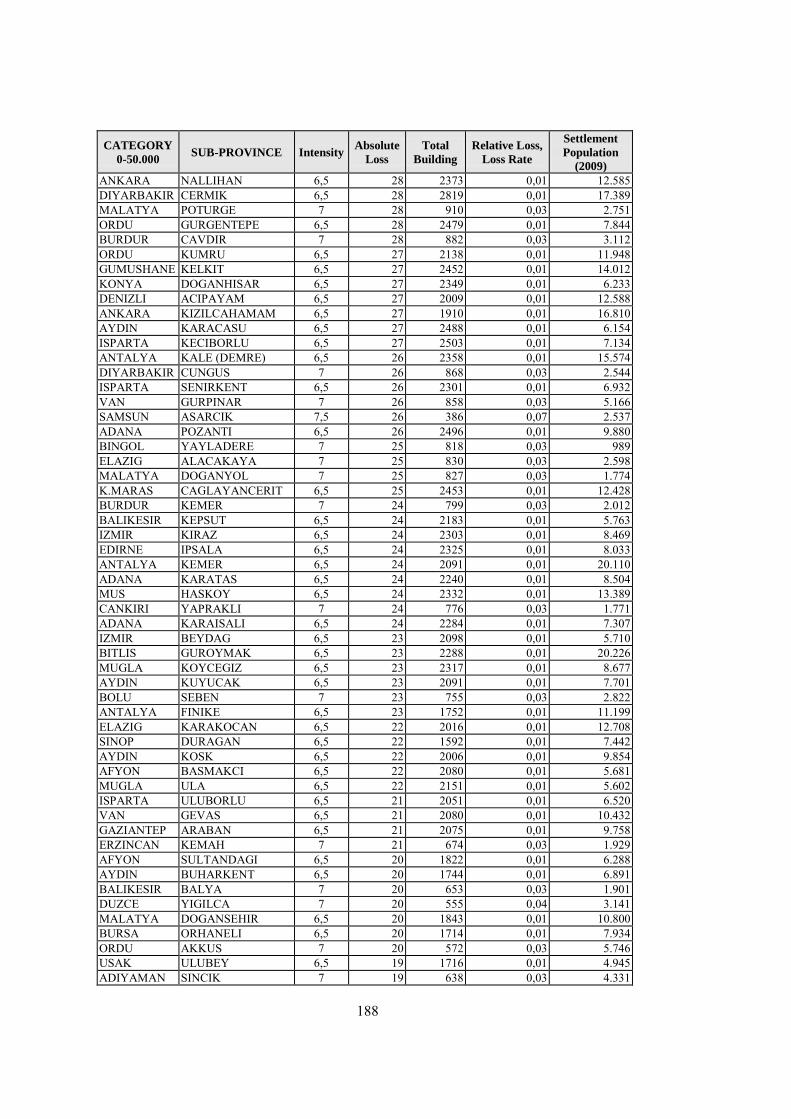
188
CATEGORY
0-50.000 SUB-PROVINCE Intensity Absolute
Loss Total
Building Relative Loss,
Loss Rate
Settlement
Population
(2009) ANKARA NALLIHAN 6,5 28 2373 0,01 12.585 DIYARBAKIR CERMIK 6,5 28 2819 0,01 17.389 MALATYA POTURGE 7 28 910 0,03 2.751 ORDU GURGENTEPE 6,5 28 2479 0,01 7.844 BURDUR CAVDIR 7 28 882 0,03 3.112 ORDU KUMRU 6,5 27 2138 0,01 11.948 GUMUSHANE KELKIT 6,5 27 2452 0,01 14.012 KONYA DOGANHISAR 6,5 27 2349 0,01 6.233 DENIZLI ACIPAYAM 6,5 27 2009 0,01 12.588 ANKARA KIZILCAHAMAM 6,5 27 1910 0,01 16.810 AYDIN KARACASU 6,5 27 2488 0,01 6.154 ISPARTA KECIBORLU 6,5 27 2503 0,01 7.134 ANTALYA KALE (DEMRE) 6,5 26 2358 0,01 15.574 DIYARBAKIR CUNGUS 7 26 868 0,03 2.544 ISPARTA SENIRKENT 6,5 26 2301 0,01 6.932 VAN GURPINAR 7 26 858 0,03 5.166 SAMSUN ASARCIK 7,5 26 386 0,07 2.537 ADANA POZANTI 6,5 26 2496 0,01 9.880 BINGOL YAYLADERE 7 25 818 0,03 989 ELAZIG ALACAKAYA 7 25 830 0,03 2.598 MALATYA DOGANYOL 7 25 827 0,03 1.774 K.MARAS CAGLAYANCERIT 6,5 25 2453 0,01 12.428 BURDUR KEMER 7 24 799 0,03 2.012 BALIKESIR KEPSUT 6,5 24 2183 0,01 5.763 IZMIR KIRAZ 6,5 24 2303 0,01 8.469 EDIRNE IPSALA 6,5 24 2325 0,01 8.033 ANTALYA KEMER 6,5 24 2091 0,01 20.110 ADANA KARATAS 6,5 24 2240 0,01 8.504 MUS HASKOY 6,5 24 2332 0,01 13.389 CANKIRI YAPRAKLI 7 24 776 0,03 1.771 ADANA KARAISALI 6,5 24 2284 0,01 7.307 IZMIR BEYDAG 6,5 23 2098 0,01 5.710 BITLIS GUROYMAK 6,5 23 2288 0,01 20.226 MUGLA KOYCEGIZ 6,5 23 2317 0,01 8.677 AYDIN KUYUCAK 6,5 23 2091 0,01 7.701 BOLU SEBEN 7 23 755 0,03 2.822 ANTALYA FINIKE 6,5 23 1752 0,01 11.199 ELAZIG KARAKOCAN 6,5 22 2016 0,01 12.708 SINOP DURAGAN 6,5 22 1592 0,01 7.442 AYDIN KOSK 6,5 22 2006 0,01 9.854 AFYON BASMAKCI 6,5 22 2080 0,01 5.681 MUGLA ULA 6,5 22 2151 0,01 5.602 ISPARTA ULUBORLU 6,5 21 2051 0,01 6.520 VAN GEVAS 6,5 21 2080 0,01 10.432 GAZIANTEP ARABAN 6,5 21 2075 0,01 9.758 ERZINCAN KEMAH 7 21 674 0,03 1.929 AFYON SULTANDAGI 6,5 20 1822 0,01 6.288 AYDIN BUHARKENT 6,5 20 1744 0,01 6.891 BALIKESIR BALYA 7 20 653 0,03 1.901 DUZCE YIGILCA 7 20 555 0,04 3.141 MALATYA DOGANSEHIR 6,5 20 1843 0,01 10.800 BURSA ORHANELI 6,5 20 1714 0,01 7.934 ORDU AKKUS 7 20 572 0,03 5.746 USAK ULUBEY 6,5 19 1716 0,01 4.945 ADIYAMAN SINCIK 7 19 638 0,03 4.331
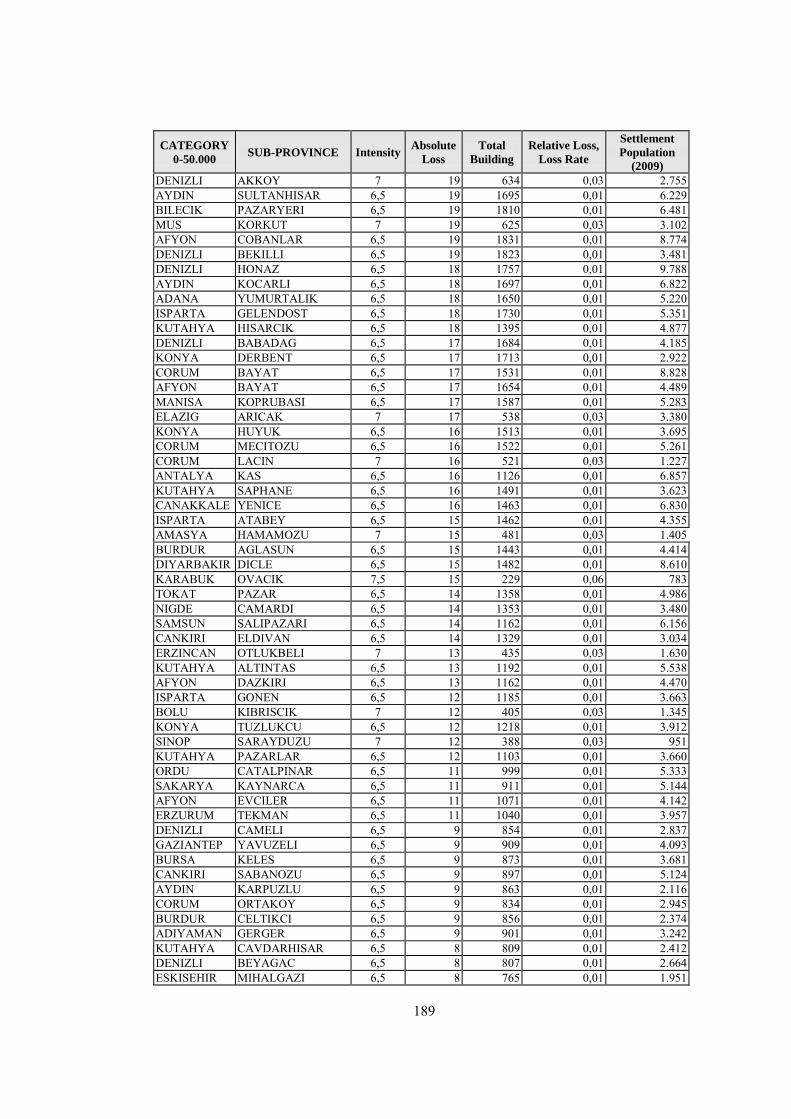
189
CATEGORY
0-50.000 SUB-PROVINCE Intensity Absolute
Loss Total
Building Relative Loss,
Loss Rate
Settlement
Population
(2009) DENIZLI AKKOY 7 19 634 0,03 2.755 AYDIN SULTANHISAR 6,5 19 1695 0,01 6.229 BILECIK PAZARYERI 6,5 19 1810 0,01 6.481 MUS KORKUT 7 19 625 0,03 3.102 AFYON COBANLAR 6,5 19 1831 0,01 8.774 DENIZLI BEKILLI 6,5 19 1823 0,01 3.481 DENIZLI HONAZ 6,5 18 1757 0,01 9.788 AYDIN KOCARLI 6,5 18 1697 0,01 6.822 ADANA YUMURTALIK 6,5 18 1650 0,01 5.220 ISPARTA GELENDOST 6,5 18 1730 0,01 5.351 KUTAHYA HISARCIK 6,5 18 1395 0,01 4.877 DENIZLI BABADAG 6,5 17 1684 0,01 4.185 KONYA DERBENT 6,5 17 1713 0,01 2.922 CORUM BAYAT 6,5 17 1531 0,01 8.828 AFYON BAYAT 6,5 17 1654 0,01 4.489 MANISA KOPRUBASI 6,5 17 1587 0,01 5.283 ELAZIG ARICAK 7 17 538 0,03 3.380 KONYA HUYUK 6,5 16 1513 0,01 3.695 CORUM MECITOZU 6,5 16 1522 0,01 5.261 CORUM LACIN 7 16 521 0,03 1.227 ANTALYA KAS 6,5 16 1126 0,01 6.857 KUTAHYA SAPHANE 6,5 16 1491 0,01 3.623 CANAKKALE YENICE 6,5 16 1463 0,01 6.830 ISPARTA ATABEY 6,5 15 1462 0,01 4.355 AMASYA HAMAMOZU 7 15 481 0,03 1.405 BURDUR AGLASUN 6,5 15 1443 0,01 4.414 DIYARBAKIR DICLE 6,5 15 1482 0,01 8.610 KARABUK OVACIK 7,5 15 229 0,06 783 TOKAT PAZAR 6,5 14 1358 0,01 4.986 NIGDE CAMARDI 6,5 14 1353 0,01 3.480 SAMSUN SALIPAZARI 6,5 14 1162 0,01 6.156 CANKIRI ELDIVAN 6,5 14 1329 0,01 3.034 ERZINCAN OTLUKBELI 7 13 435 0,03 1.630 KUTAHYA ALTINTAS 6,5 13 1192 0,01 5.538 AFYON DAZKIRI 6,5 13 1162 0,01 4.470 ISPARTA GONEN 6,5 12 1185 0,01 3.663 BOLU KIBRISCIK 7 12 405 0,03 1.345 KONYA TUZLUKCU 6,5 12 1218 0,01 3.912 SINOP SARAYDUZU 7 12 388 0,03 951 KUTAHYA PAZARLAR 6,5 12 1103 0,01 3.660 ORDU CATALPINAR 6,5 11 999 0,01 5.333 SAKARYA KAYNARCA 6,5 11 911 0,01 5.144 AFYON EVCILER 6,5 11 1071 0,01 4.142 ERZURUM TEKMAN 6,5 11 1040 0,01 3.957 DENIZLI CAMELI 6,5 9 854 0,01 2.837 GAZIANTEP YAVUZELI 6,5 9 909 0,01 4.093 BURSA KELES 6,5 9 873 0,01 3.681 CANKIRI SABANOZU 6,5 9 897 0,01 5.124 AYDIN KARPUZLU 6,5 9 863 0,01 2.116 CORUM ORTAKOY 6,5 9 834 0,01 2.945 BURDUR CELTIKCI 6,5 9 856 0,01 2.374 ADIYAMAN GERGER 6,5 9 901 0,01 3.242 KUTAHYA CAVDARHISAR 6,5 8 809 0,01 2.412 DENIZLI BEYAGAC 6,5 8 807 0,01 2.664 ESKISEHIR MIHALGAZI 6,5 8 765 0,01 1.951
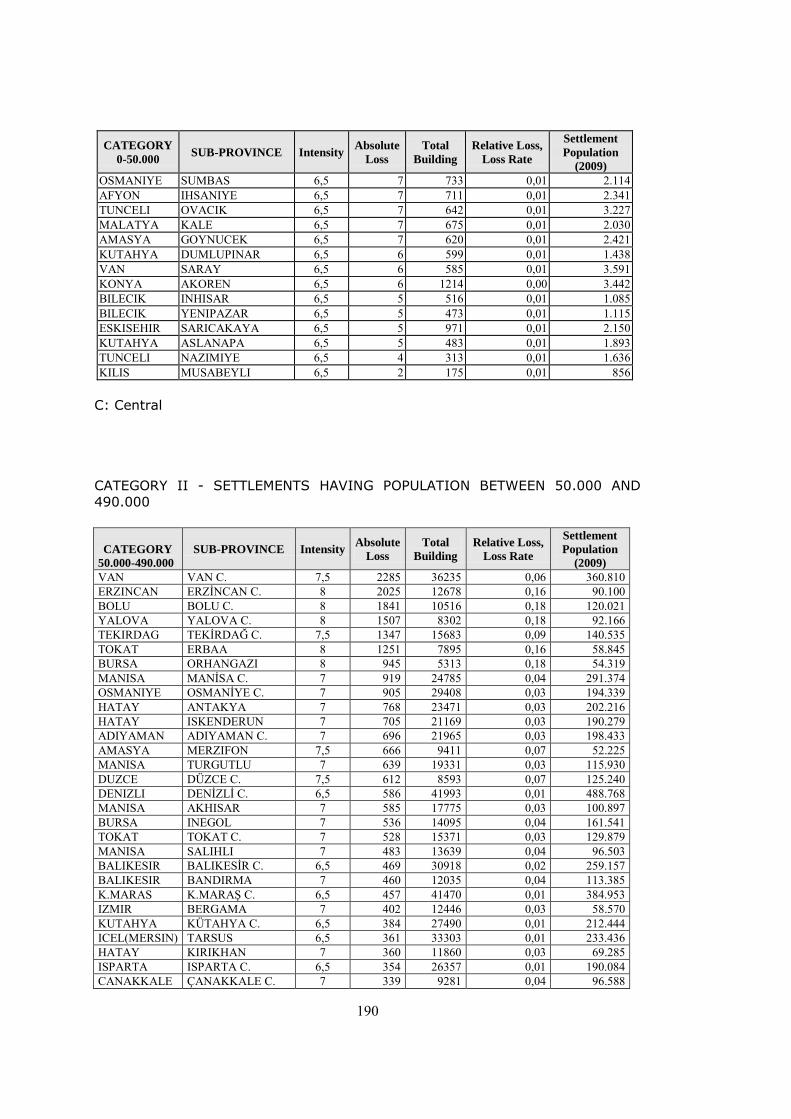
190
CATEGORY
0-50.000 SUB-PROVINCE Intensity Absolute
Loss Total
Building Relative Loss,
Loss Rate
Settlement
Population
(2009) OSMANIYE SUMBAS 6,5 7 733 0,01 2.114 AFYON IHSANIYE 6,5 7 711 0,01 2.341 TUNCELI OVACIK 6,5 7 642 0,01 3.227 MALATYA KALE 6,5 7 675 0,01 2.030 AMASYA GOYNUCEK 6,5 7 620 0,01 2.421 KUTAHYA DUMLUPINAR 6,5 6 599 0,01 1.438 VAN SARAY 6,5 6 585 0,01 3.591 KONYA AKOREN 6,5 6 1214 0,00 3.442 BILECIK INHISAR 6,5 5 516 0,01 1.085 BILECIK YENIPAZAR 6,5 5 473 0,01 1.115 ESKISEHIR SARICAKAYA 6,5 5 971 0,01 2.150 KUTAHYA ASLANAPA 6,5 5 483 0,01 1.893 TUNCELI NAZIMIYE 6,5 4 313 0,01 1.636 KILIS MUSABEYLI 6,5 2 175 0,01 856
C: Central
CATEGORY II - SETTLEMENTS HAVING POPULATION BETWEEN 50.000 AND
490.000
CATEGORY
50.000-490.000
SUB-PROVINCE Intensity Absolute
Loss
Total
Building
Relative Loss,
Loss Rate
Settlement
Population
(2009)
VAN VAN C. 7,5 2285 36235 0,06 360.810 ERZINCAN ERZİNCAN C. 8 2025 12678 0,16 90.100 BOLU BOLU C. 8 1841 10516 0,18 120.021 YALOVA YALOVA C. 8 1507 8302 0,18 92.166 TEKIRDAG TEKİRDAĞ C. 7,5 1347 15683 0,09 140.535 TOKAT ERBAA 8 1251 7895 0,16 58.845 BURSA ORHANGAZI 8 945 5313 0,18 54.319 MANISA MANİSA C. 7 919 24785 0,04 291.374 OSMANIYE OSMANİYE C. 7 905 29408 0,03 194.339 HATAY ANTAKYA 7 768 23471 0,03 202.216 HATAY ISKENDERUN 7 705 21169 0,03 190.279 ADIYAMAN ADIYAMAN C. 7 696 21965 0,03 198.433 AMASYA MERZIFON 7,5 666 9411 0,07 52.225 MANISA TURGUTLU 7 639 19331 0,03 115.930 DUZCE DÜZCE C. 7,5 612 8593 0,07 125.240 DENIZLI DENİZLİ C. 6,5 586 41993 0,01 488.768 MANISA AKHISAR 7 585 17775 0,03 100.897 BURSA INEGOL 7 536 14095 0,04 161.541 TOKAT TOKAT C. 7 528 15371 0,03 129.879 MANISA SALIHLI 7 483 13639 0,04 96.503 BALIKESIR BALIKESİR C. 6,5 469 30918 0,02 259.157 BALIKESIR BANDIRMA 7 460 12035 0,04 113.385 K.MARAS K.MARAŞ C. 6,5 457 41470 0,01 384.953 IZMIR BERGAMA 7 402 12446 0,03 58.570 KUTAHYA KÜTAHYA C. 6,5 384 27490 0,01 212.444 ICEL(MERSIN) TARSUS 6,5 361 33303 0,01 233.436 HATAY KIRIKHAN 7 360 11860 0,03 69.285 ISPARTA ISPARTA C. 6,5 354 26357 0,01 190.084 CANAKKALE ÇANAKKALE C. 7 339 9281 0,04 96.588
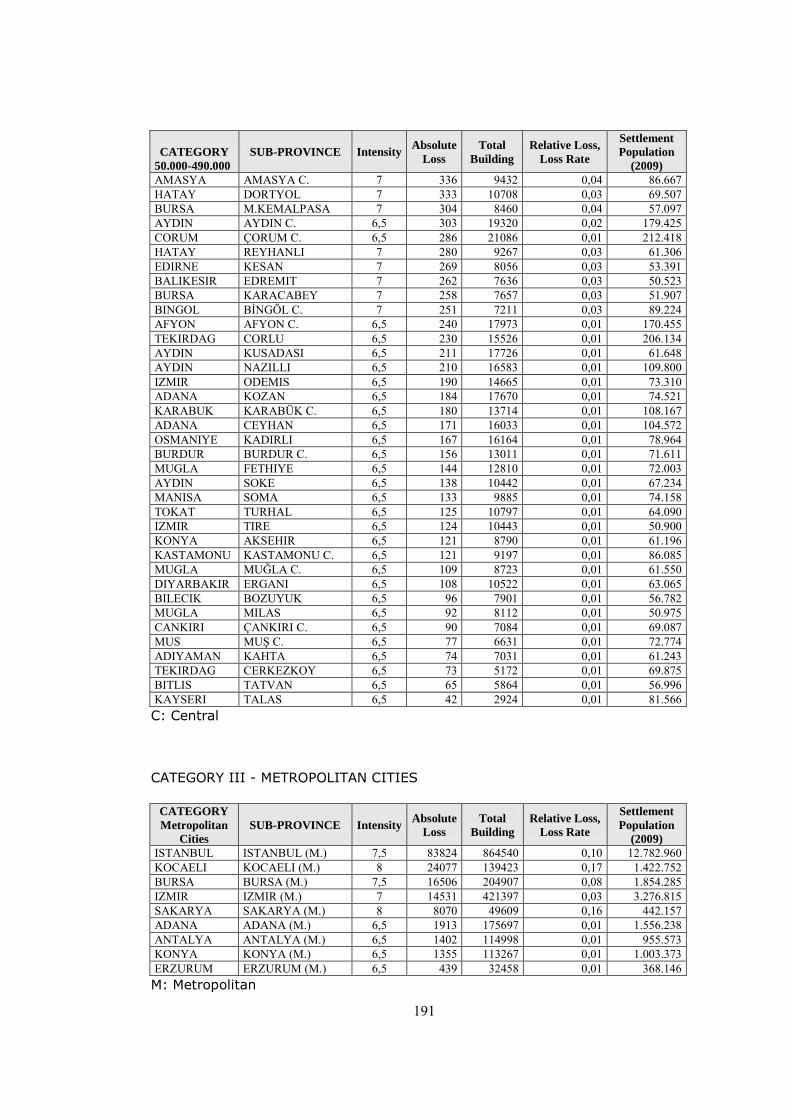
191
CATEGORY
50.000-490.000
SUB-PROVINCE Intensity Absolute
Loss
Total
Building
Relative Loss,
Loss Rate
Settlement
Population
(2009)
AMASYA AMASYA C. 7 336 9432 0,04 86.667 HATAY DORTYOL 7 333 10708 0,03 69.507 BURSA M.KEMALPASA 7 304 8460 0,04 57.097 AYDIN AYDIN C. 6,5 303 19320 0,02 179.425 CORUM ÇORUM C. 6,5 286 21086 0,01 212.418 HATAY REYHANLI 7 280 9267 0,03 61.306 EDIRNE KESAN 7 269 8056 0,03 53.391 BALIKESIR EDREMIT 7 262 7636 0,03 50.523 BURSA KARACABEY 7 258 7657 0,03 51.907 BINGOL BİNGÖL C. 7 251 7211 0,03 89.224 AFYON AFYON C. 6,5 240 17973 0,01 170.455 TEKIRDAG CORLU 6,5 230 15526 0,01 206.134 AYDIN KUSADASI 6,5 211 17726 0,01 61.648 AYDIN NAZILLI 6,5 210 16583 0,01 109.800 IZMIR ODEMIS 6,5 190 14665 0,01 73.310 ADANA KOZAN 6,5 184 17670 0,01 74.521 KARABUK KARABÜK C. 6,5 180 13714 0,01 108.167 ADANA CEYHAN 6,5 171 16033 0,01 104.572 OSMANIYE KADIRLI 6,5 167 16164 0,01 78.964 BURDUR BURDUR C. 6,5 156 13011 0,01 71.611 MUGLA FETHIYE 6,5 144 12810 0,01 72.003 AYDIN SOKE 6,5 138 10442 0,01 67.234 MANISA SOMA 6,5 133 9885 0,01 74.158 TOKAT TURHAL 6,5 125 10797 0,01 64.090 IZMIR TIRE 6,5 124 10443 0,01 50.900 KONYA AKSEHIR 6,5 121 8790 0,01 61.196 KASTAMONU KASTAMONU C. 6,5 121 9197 0,01 86.085 MUGLA MUĞLA C. 6,5 109 8723 0,01 61.550 DIYARBAKIR ERGANI 6,5 108 10522 0,01 63.065 BILECIK BOZUYUK 6,5 96 7901 0,01 56.782 MUGLA MILAS 6,5 92 8112 0,01 50.975 CANKIRI ÇANKIRI C. 6,5 90 7084 0,01 69.087 MUS MUŞ C. 6,5 77 6631 0,01 72.774 ADIYAMAN KAHTA 6,5 74 7031 0,01 61.243 TEKIRDAG CERKEZKOY 6,5 73 5172 0,01 69.875 BITLIS TATVAN 6,5 65 5864 0,01 56.996 KAYSERI TALAS 6,5 42 2924 0,01 81.566 C: Central
CATEGORY III - METROPOLITAN CITIES
CATEGORY
Metropolitan
Cities
SUB-PROVINCE Intensity Absolute
Loss
Total
Building
Relative Loss,
Loss Rate
Settlement
Population
(2009)
ISTANBUL ISTANBUL (M.) 7,5 83824 864540 0,10 12.782.960 KOCAELI KOCAELI (M.) 8 24077 139423 0,17 1.422.752 BURSA BURSA (M.) 7,5 16506 204907 0,08 1.854.285 IZMIR IZMIR (M.) 7 14531 421397 0,03 3.276.815 SAKARYA SAKARYA (M.) 8 8070 49609 0,16 442.157 ADANA ADANA (M.) 6,5 1913 175697 0,01 1.556.238 ANTALYA ANTALYA (M.) 6,5 1402 114998 0,01 955.573 KONYA KONYA (M.) 6,5 1355 113267 0,01 1.003.373 ERZURUM ERZURUM (M.) 6,5 439 32458 0,01 368.146 M: Metropolitan
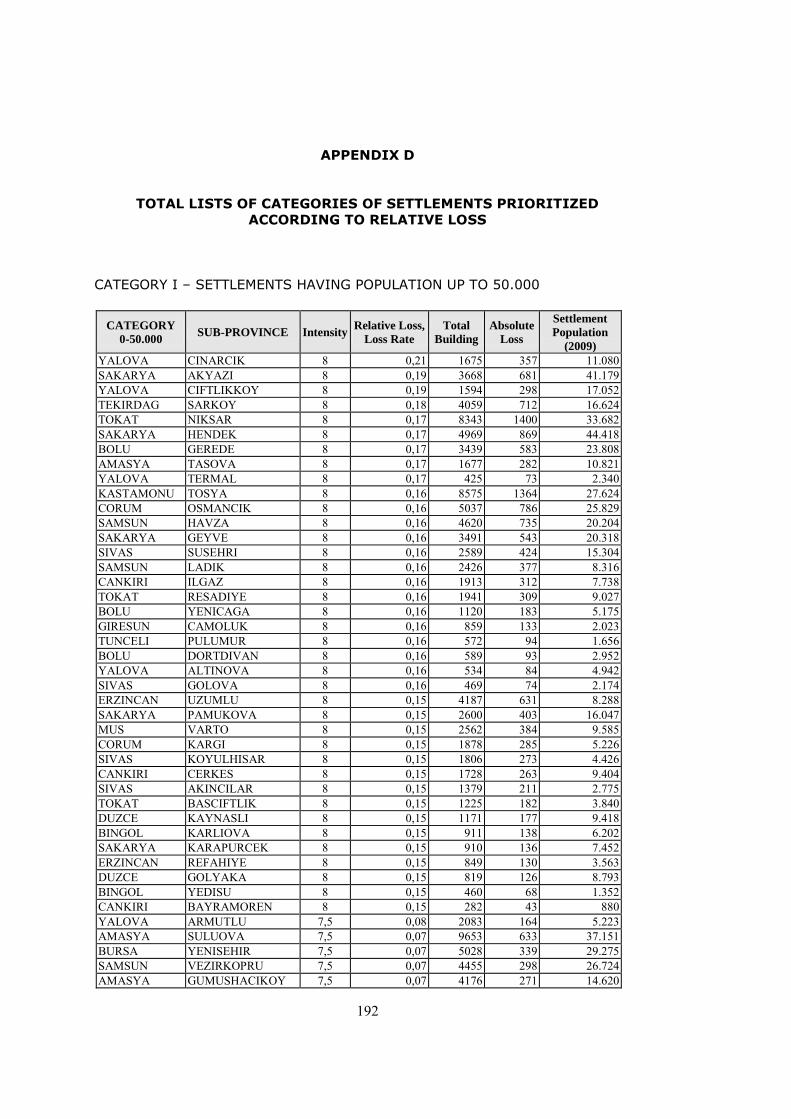
192
APPENDIX D
TOTAL LISTS OF CATEGORIES OF SETTLEMENTS PRIORITIZED
ACCORDING TO RELATIVE LOSS
CATEGORY I – SETTLEMENTS HAVING POPULATION UP TO 50.000
CATEGORY
0-50.000 SUB-PROVINCE Intensity Relative Loss,
Loss Rate
Total
Building Absolute
Loss
Settlement
Population
(2009) YALOVA CINARCIK 8 0,21 1675 357 11.080 SAKARYA AKYAZI 8 0,19 3668 681 41.179 YALOVA CIFTLIKKOY 8 0,19 1594 298 17.052 TEKIRDAG SARKOY 8 0,18 4059 712 16.624 TOKAT NIKSAR 8 0,17 8343 1400 33.682 SAKARYA HENDEK 8 0,17 4969 869 44.418 BOLU GEREDE 8 0,17 3439 583 23.808 AMASYA TASOVA 8 0,17 1677 282 10.821 YALOVA TERMAL 8 0,17 425 73 2.340 KASTAMONU TOSYA 8 0,16 8575 1364 27.624 CORUM OSMANCIK 8 0,16 5037 786 25.829 SAMSUN HAVZA 8 0,16 4620 735 20.204 SAKARYA GEYVE 8 0,16 3491 543 20.318 SIVAS SUSEHRI 8 0,16 2589 424 15.304 SAMSUN LADIK 8 0,16 2426 377 8.316 CANKIRI ILGAZ 8 0,16 1913 312 7.738 TOKAT RESADIYE 8 0,16 1941 309 9.027 BOLU YENICAGA 8 0,16 1120 183 5.175 GIRESUN CAMOLUK 8 0,16 859 133 2.023 TUNCELI PULUMUR 8 0,16 572 94 1.656 BOLU DORTDIVAN 8 0,16 589 93 2.952 YALOVA ALTINOVA 8 0,16 534 84 4.942 SIVAS GOLOVA 8 0,16 469 74 2.174 ERZINCAN UZUMLU 8 0,15 4187 631 8.288 SAKARYA PAMUKOVA 8 0,15 2600 403 16.047 MUS VARTO 8 0,15 2562 384 9.585 CORUM KARGI 8 0,15 1878 285 5.226 SIVAS KOYULHISAR 8 0,15 1806 273 4.426 CANKIRI CERKES 8 0,15 1728 263 9.404 SIVAS AKINCILAR 8 0,15 1379 211 2.775 TOKAT BASCIFTLIK 8 0,15 1225 182 3.840 DUZCE KAYNASLI 8 0,15 1171 177 9.418 BINGOL KARLIOVA 8 0,15 911 138 6.202 SAKARYA KARAPURCEK 8 0,15 910 136 7.452 ERZINCAN REFAHIYE 8 0,15 849 130 3.563 DUZCE GOLYAKA 8 0,15 819 126 8.793 BINGOL YEDISU 8 0,15 460 68 1.352 CANKIRI BAYRAMOREN 8 0,15 282 43 880 YALOVA ARMUTLU 7,5 0,08 2083 164 5.223 AMASYA SULUOVA 7,5 0,07 9653 633 37.151 BURSA YENISEHIR 7,5 0,07 5028 339 29.275 SAMSUN VEZIRKOPRU 7,5 0,07 4455 298 26.724 AMASYA GUMUSHACIKOY 7,5 0,07 4176 271 14.620
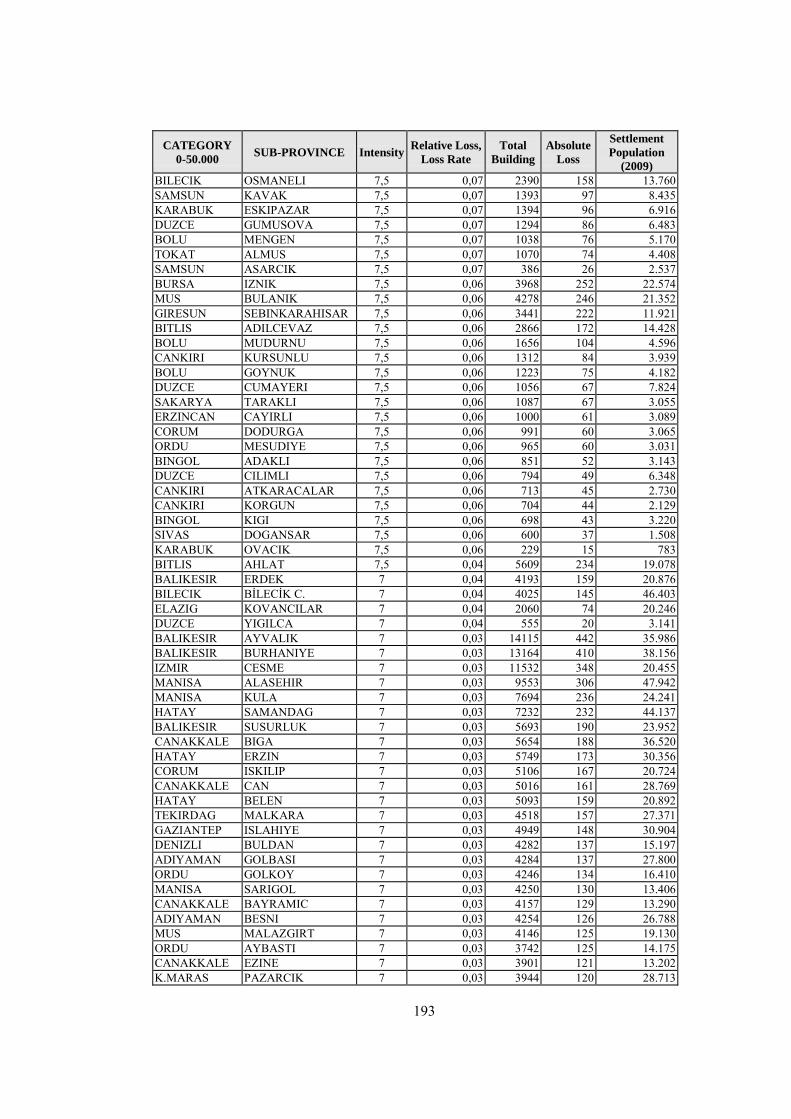
193
CATEGORY
0-50.000 SUB-PROVINCE Intensity Relative Loss,
Loss Rate
Total
Building Absolute
Loss
Settlement
Population
(2009) BILECIK OSMANELI 7,5 0,07 2390 158 13.760 SAMSUN KAVAK 7,5 0,07 1393 97 8.435 KARABUK ESKIPAZAR 7,5 0,07 1394 96 6.916 DUZCE GUMUSOVA 7,5 0,07 1294 86 6.483 BOLU MENGEN 7,5 0,07 1038 76 5.170 TOKAT ALMUS 7,5 0,07 1070 74 4.408 SAMSUN ASARCIK 7,5 0,07 386 26 2.537 BURSA IZNIK 7,5 0,06 3968 252 22.574 MUS BULANIK 7,5 0,06 4278 246 21.352 GIRESUN SEBINKARAHISAR 7,5 0,06 3441 222 11.921 BITLIS ADILCEVAZ 7,5 0,06 2866 172 14.428 BOLU MUDURNU 7,5 0,06 1656 104 4.596 CANKIRI KURSUNLU 7,5 0,06 1312 84 3.939 BOLU GOYNUK 7,5 0,06 1223 75 4.182 DUZCE CUMAYERI 7,5 0,06 1056 67 7.824 SAKARYA TARAKLI 7,5 0,06 1087 67 3.055 ERZINCAN CAYIRLI 7,5 0,06 1000 61 3.089 CORUM DODURGA 7,5 0,06 991 60 3.065 ORDU MESUDIYE 7,5 0,06 965 60 3.031 BINGOL ADAKLI 7,5 0,06 851 52 3.143 DUZCE CILIMLI 7,5 0,06 794 49 6.348 CANKIRI ATKARACALAR 7,5 0,06 713 45 2.730 CANKIRI KORGUN 7,5 0,06 704 44 2.129 BINGOL KIGI 7,5 0,06 698 43 3.220 SIVAS DOGANSAR 7,5 0,06 600 37 1.508 KARABUK OVACIK 7,5 0,06 229 15 783 BITLIS AHLAT 7,5 0,04 5609 234 19.078 BALIKESIR ERDEK 7 0,04 4193 159 20.876 BILECIK BİLECİK C. 7 0,04 4025 145 46.403 ELAZIG KOVANCILAR 7 0,04 2060 74 20.246 DUZCE YIGILCA 7 0,04 555 20 3.141 BALIKESIR AYVALIK 7 0,03 14115 442 35.986 BALIKESIR BURHANIYE 7 0,03 13164 410 38.156 IZMIR CESME 7 0,03 11532 348 20.455 MANISA ALASEHIR 7 0,03 9553 306 47.942 MANISA KULA 7 0,03 7694 236 24.241 HATAY SAMANDAG 7 0,03 7232 232 44.137 BALIKESIR SUSURLUK 7 0,03 5693 190 23.952 CANAKKALE BIGA 7 0,03 5654 188 36.520 HATAY ERZIN 7 0,03 5749 173 30.356 CORUM ISKILIP 7 0,03 5106 167 20.724 CANAKKALE CAN 7 0,03 5016 161 28.769 HATAY BELEN 7 0,03 5093 159 20.892 TEKIRDAG MALKARA 7 0,03 4518 157 27.371 GAZIANTEP ISLAHIYE 7 0,03 4949 148 30.904 DENIZLI BULDAN 7 0,03 4282 137 15.197 ADIYAMAN GOLBASI 7 0,03 4284 137 27.800 ORDU GOLKOY 7 0,03 4246 134 16.410 MANISA SARIGOL 7 0,03 4250 130 13.406 CANAKKALE BAYRAMIC 7 0,03 4157 129 13.290 ADIYAMAN BESNI 7 0,03 4254 126 26.788 MUS MALAZGIRT 7 0,03 4146 125 19.130 ORDU AYBASTI 7 0,03 3742 125 14.175 CANAKKALE EZINE 7 0,03 3901 121 13.202 K.MARAS PAZARCIK 7 0,03 3944 120 28.713
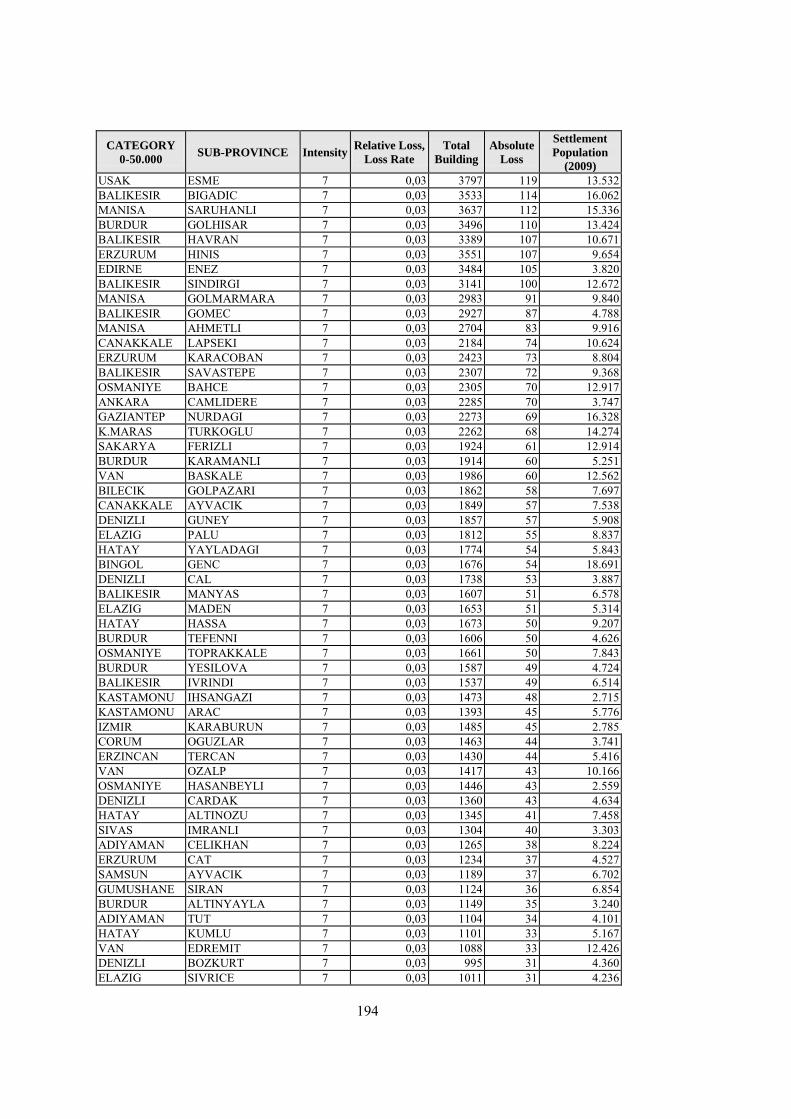
194
CATEGORY
0-50.000 SUB-PROVINCE Intensity Relative Loss,
Loss Rate
Total
Building Absolute
Loss
Settlement
Population
(2009) USAK ESME 7 0,03 3797 119 13.532 BALIKESIR BIGADIC 7 0,03 3533 114 16.062 MANISA SARUHANLI 7 0,03 3637 112 15.336 BURDUR GOLHISAR 7 0,03 3496 110 13.424 BALIKESIR HAVRAN 7 0,03 3389 107 10.671 ERZURUM HINIS 7 0,03 3551 107 9.654 EDIRNE ENEZ 7 0,03 3484 105 3.820 BALIKESIR SINDIRGI 7 0,03 3141 100 12.672 MANISA GOLMARMARA 7 0,03 2983 91 9.840 BALIKESIR GOMEC 7 0,03 2927 87 4.788 MANISA AHMETLI 7 0,03 2704 83 9.916 CANAKKALE LAPSEKI 7 0,03 2184 74 10.624 ERZURUM KARACOBAN 7 0,03 2423 73 8.804 BALIKESIR SAVASTEPE 7 0,03 2307 72 9.368 OSMANIYE BAHCE 7 0,03 2305 70 12.917 ANKARA CAMLIDERE 7 0,03 2285 70 3.747 GAZIANTEP NURDAGI 7 0,03 2273 69 16.328 K.MARAS TURKOGLU 7 0,03 2262 68 14.274 SAKARYA FERIZLI 7 0,03 1924 61 12.914 BURDUR KARAMANLI 7 0,03 1914 60 5.251 VAN BASKALE 7 0,03 1986 60 12.562 BILECIK GOLPAZARI 7 0,03 1862 58 7.697 CANAKKALE AYVACIK 7 0,03 1849 57 7.538 DENIZLI GUNEY 7 0,03 1857 57 5.908 ELAZIG PALU 7 0,03 1812 55 8.837 HATAY YAYLADAGI 7 0,03 1774 54 5.843 BINGOL GENC 7 0,03 1676 54 18.691 DENIZLI CAL 7 0,03 1738 53 3.887 BALIKESIR MANYAS 7 0,03 1607 51 6.578 ELAZIG MADEN 7 0,03 1653 51 5.314 HATAY HASSA 7 0,03 1673 50 9.207 BURDUR TEFENNI 7 0,03 1606 50 4.626 OSMANIYE TOPRAKKALE 7 0,03 1661 50 7.843 BURDUR YESILOVA 7 0,03 1587 49 4.724 BALIKESIR IVRINDI 7 0,03 1537 49 6.514 KASTAMONU IHSANGAZI 7 0,03 1473 48 2.715 KASTAMONU ARAC 7 0,03 1393 45 5.776 IZMIR KARABURUN 7 0,03 1485 45 2.785 CORUM OGUZLAR 7 0,03 1463 44 3.741 ERZINCAN TERCAN 7 0,03 1430 44 5.416 VAN OZALP 7 0,03 1417 43 10.166 OSMANIYE HASANBEYLI 7 0,03 1446 43 2.559 DENIZLI CARDAK 7 0,03 1360 43 4.634 HATAY ALTINOZU 7 0,03 1345 41 7.458 SIVAS IMRANLI 7 0,03 1304 40 3.303 ADIYAMAN CELIKHAN 7 0,03 1265 38 8.224 ERZURUM CAT 7 0,03 1234 37 4.527 SAMSUN AYVACIK 7 0,03 1189 37 6.702 GUMUSHANE SIRAN 7 0,03 1124 36 6.854 BURDUR ALTINYAYLA 7 0,03 1149 35 3.240 ADIYAMAN TUT 7 0,03 1104 34 4.101 HATAY KUMLU 7 0,03 1101 33 5.167 VAN EDREMIT 7 0,03 1088 33 12.426 DENIZLI BOZKURT 7 0,03 995 31 4.360 ELAZIG SIVRICE 7 0,03 1011 31 4.236
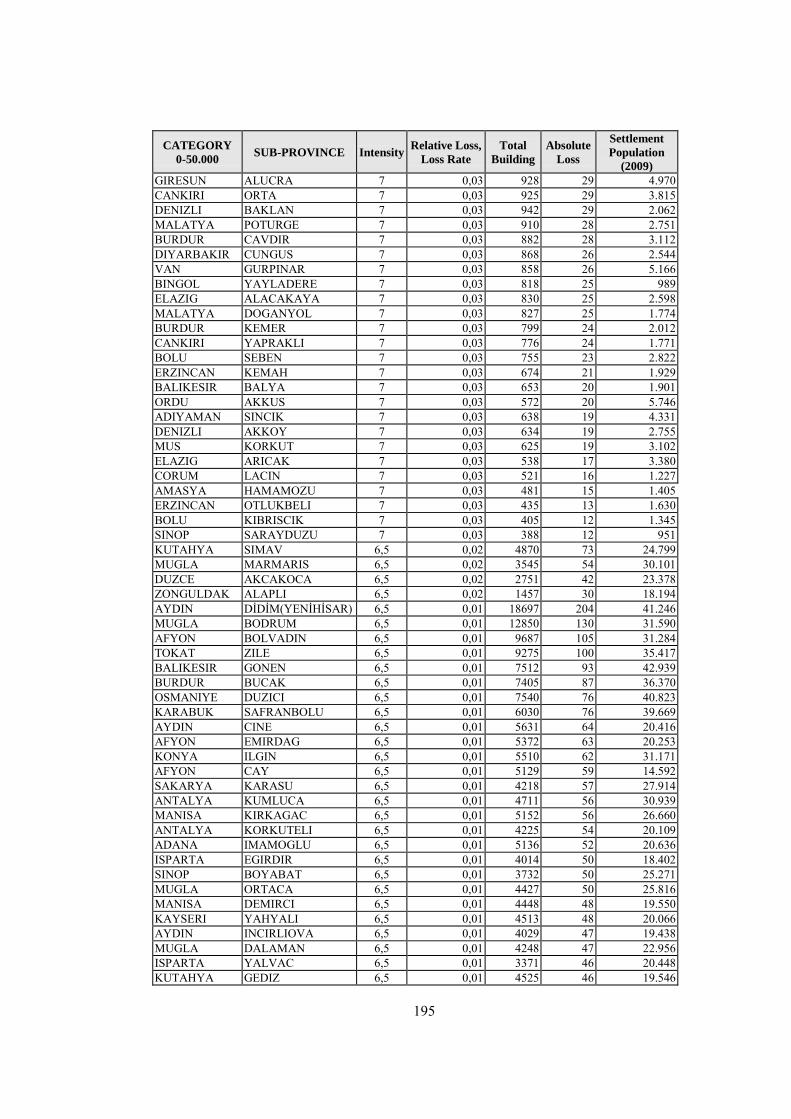
195
CATEGORY
0-50.000 SUB-PROVINCE Intensity Relative Loss,
Loss Rate
Total
Building Absolute
Loss
Settlement
Population
(2009) GIRESUN ALUCRA 7 0,03 928 29 4.970 CANKIRI ORTA 7 0,03 925 29 3.815 DENIZLI BAKLAN 7 0,03 942 29 2.062 MALATYA POTURGE 7 0,03 910 28 2.751 BURDUR CAVDIR 7 0,03 882 28 3.112 DIYARBAKIR CUNGUS 7 0,03 868 26 2.544 VAN GURPINAR 7 0,03 858 26 5.166 BINGOL YAYLADERE 7 0,03 818 25 989 ELAZIG ALACAKAYA 7 0,03 830 25 2.598 MALATYA DOGANYOL 7 0,03 827 25 1.774 BURDUR KEMER 7 0,03 799 24 2.012 CANKIRI YAPRAKLI 7 0,03 776 24 1.771 BOLU SEBEN 7 0,03 755 23 2.822 ERZINCAN KEMAH 7 0,03 674 21 1.929 BALIKESIR BALYA 7 0,03 653 20 1.901 ORDU AKKUS 7 0,03 572 20 5.746 ADIYAMAN SINCIK 7 0,03 638 19 4.331 DENIZLI AKKOY 7 0,03 634 19 2.755 MUS KORKUT 7 0,03 625 19 3.102 ELAZIG ARICAK 7 0,03 538 17 3.380 CORUM LACIN 7 0,03 521 16 1.227 AMASYA HAMAMOZU 7 0,03 481 15 1.405 ERZINCAN OTLUKBELI 7 0,03 435 13 1.630 BOLU KIBRISCIK 7 0,03 405 12 1.345 SINOP SARAYDUZU 7 0,03 388 12 951 KUTAHYA SIMAV 6,5 0,02 4870 73 24.799 MUGLA MARMARIS 6,5 0,02 3545 54 30.101 DUZCE AKCAKOCA 6,5 0,02 2751 42 23.378 ZONGULDAK ALAPLI 6,5 0,02 1457 30 18.194 AYDIN DİDİM(YENİHİSAR) 6,5 0,01 18697 204 41.246 MUGLA BODRUM 6,5 0,01 12850 130 31.590 AFYON BOLVADIN 6,5 0,01 9687 105 31.284 TOKAT ZILE 6,5 0,01 9275 100 35.417 BALIKESIR GONEN 6,5 0,01 7512 93 42.939 BURDUR BUCAK 6,5 0,01 7405 87 36.370 OSMANIYE DUZICI 6,5 0,01 7540 76 40.823 KARABUK SAFRANBOLU 6,5 0,01 6030 76 39.669 AYDIN CINE 6,5 0,01 5631 64 20.416 AFYON EMIRDAG 6,5 0,01 5372 63 20.253 KONYA ILGIN 6,5 0,01 5510 62 31.171 AFYON CAY 6,5 0,01 5129 59 14.592 SAKARYA KARASU 6,5 0,01 4218 57 27.914 ANTALYA KUMLUCA 6,5 0,01 4711 56 30.939 MANISA KIRKAGAC 6,5 0,01 5152 56 26.660 ANTALYA KORKUTELI 6,5 0,01 4225 54 20.109 ADANA IMAMOGLU 6,5 0,01 5136 52 20.636 ISPARTA EGIRDIR 6,5 0,01 4014 50 18.402 SINOP BOYABAT 6,5 0,01 3732 50 25.271 MUGLA ORTACA 6,5 0,01 4427 50 25.816 MANISA DEMIRCI 6,5 0,01 4448 48 19.550 KAYSERI YAHYALI 6,5 0,01 4513 48 20.066 AYDIN INCIRLIOVA 6,5 0,01 4029 47 19.438 MUGLA DALAMAN 6,5 0,01 4248 47 22.956 ISPARTA YALVAC 6,5 0,01 3371 46 20.448 KUTAHYA GEDIZ 6,5 0,01 4525 46 19.546
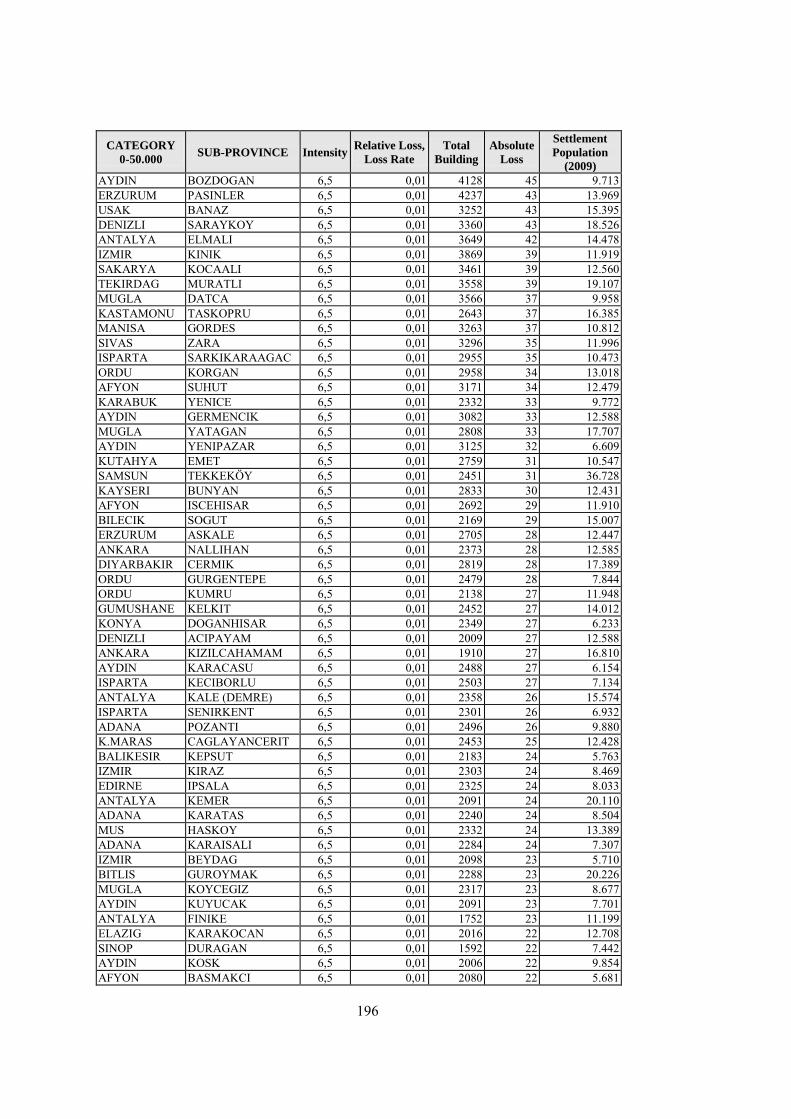
196
CATEGORY
0-50.000 SUB-PROVINCE Intensity Relative Loss,
Loss Rate
Total
Building Absolute
Loss
Settlement
Population
(2009) AYDIN BOZDOGAN 6,5 0,01 4128 45 9.713 ERZURUM PASINLER 6,5 0,01 4237 43 13.969 USAK BANAZ 6,5 0,01 3252 43 15.395 DENIZLI SARAYKOY 6,5 0,01 3360 43 18.526 ANTALYA ELMALI 6,5 0,01 3649 42 14.478 IZMIR KINIK 6,5 0,01 3869 39 11.919 SAKARYA KOCAALI 6,5 0,01 3461 39 12.560 TEKIRDAG MURATLI 6,5 0,01 3558 39 19.107 MUGLA DATCA 6,5 0,01 3566 37 9.958 KASTAMONU TASKOPRU 6,5 0,01 2643 37 16.385 MANISA GORDES 6,5 0,01 3263 37 10.812 SIVAS ZARA 6,5 0,01 3296 35 11.996 ISPARTA SARKIKARAAGAC 6,5 0,01 2955 35 10.473 ORDU KORGAN 6,5 0,01 2958 34 13.018 AFYON SUHUT 6,5 0,01 3171 34 12.479 KARABUK YENICE 6,5 0,01 2332 33 9.772 AYDIN GERMENCIK 6,5 0,01 3082 33 12.588 MUGLA YATAGAN 6,5 0,01 2808 33 17.707 AYDIN YENIPAZAR 6,5 0,01 3125 32 6.609 KUTAHYA EMET 6,5 0,01 2759 31 10.547 SAMSUN TEKKEKÖY 6,5 0,01 2451 31 36.728 KAYSERI BUNYAN 6,5 0,01 2833 30 12.431 AFYON ISCEHISAR 6,5 0,01 2692 29 11.910 BILECIK SOGUT 6,5 0,01 2169 29 15.007 ERZURUM ASKALE 6,5 0,01 2705 28 12.447 ANKARA NALLIHAN 6,5 0,01 2373 28 12.585 DIYARBAKIR CERMIK 6,5 0,01 2819 28 17.389 ORDU GURGENTEPE 6,5 0,01 2479 28 7.844 ORDU KUMRU 6,5 0,01 2138 27 11.948 GUMUSHANE KELKIT 6,5 0,01 2452 27 14.012 KONYA DOGANHISAR 6,5 0,01 2349 27 6.233 DENIZLI ACIPAYAM 6,5 0,01 2009 27 12.588 ANKARA KIZILCAHAMAM 6,5 0,01 1910 27 16.810 AYDIN KARACASU 6,5 0,01 2488 27 6.154 ISPARTA KECIBORLU 6,5 0,01 2503 27 7.134 ANTALYA KALE (DEMRE) 6,5 0,01 2358 26 15.574 ISPARTA SENIRKENT 6,5 0,01 2301 26 6.932 ADANA POZANTI 6,5 0,01 2496 26 9.880 K.MARAS CAGLAYANCERIT 6,5 0,01 2453 25 12.428 BALIKESIR KEPSUT 6,5 0,01 2183 24 5.763 IZMIR KIRAZ 6,5 0,01 2303 24 8.469 EDIRNE IPSALA 6,5 0,01 2325 24 8.033 ANTALYA KEMER 6,5 0,01 2091 24 20.110 ADANA KARATAS 6,5 0,01 2240 24 8.504 MUS HASKOY 6,5 0,01 2332 24 13.389 ADANA KARAISALI 6,5 0,01 2284 24 7.307 IZMIR BEYDAG 6,5 0,01 2098 23 5.710 BITLIS GUROYMAK 6,5 0,01 2288 23 20.226 MUGLA KOYCEGIZ 6,5 0,01 2317 23 8.677 AYDIN KUYUCAK 6,5 0,01 2091 23 7.701 ANTALYA FINIKE 6,5 0,01 1752 23 11.199 ELAZIG KARAKOCAN 6,5 0,01 2016 22 12.708 SINOP DURAGAN 6,5 0,01 1592 22 7.442 AYDIN KOSK 6,5 0,01 2006 22 9.854 AFYON BASMAKCI 6,5 0,01 2080 22 5.681
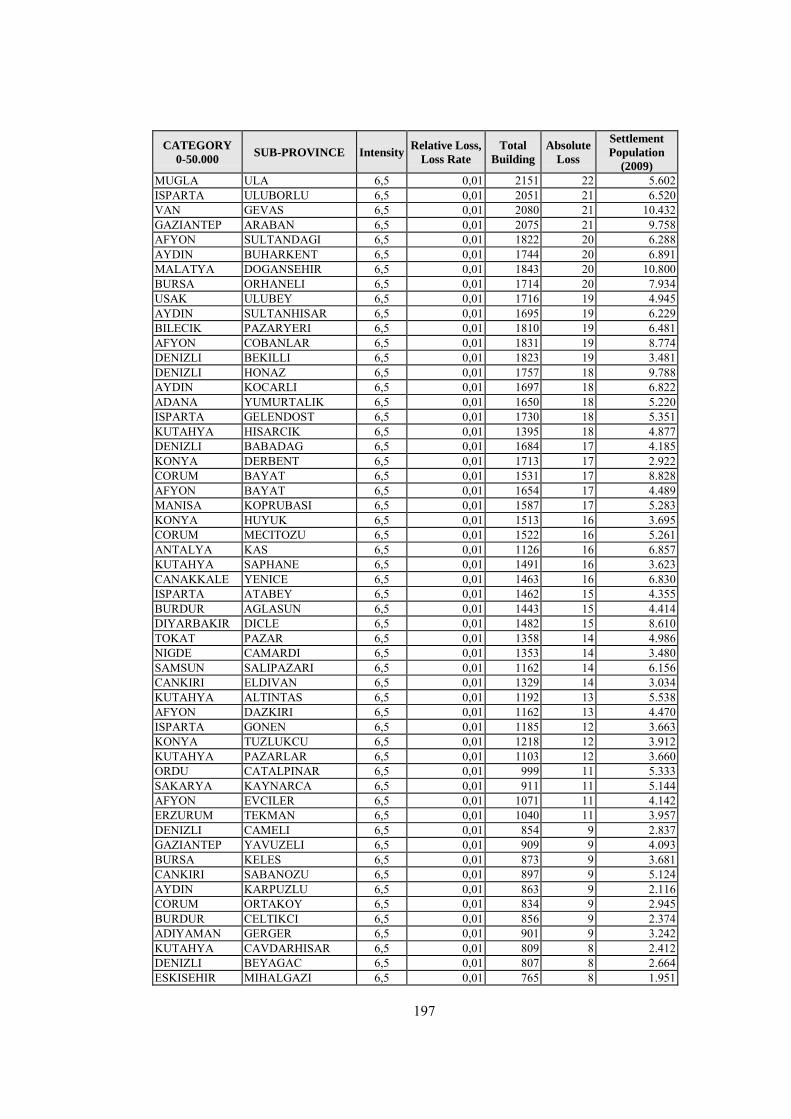
197
CATEGORY
0-50.000 SUB-PROVINCE Intensity Relative Loss,
Loss Rate
Total
Building Absolute
Loss
Settlement
Population
(2009) MUGLA ULA 6,5 0,01 2151 22 5.602 ISPARTA ULUBORLU 6,5 0,01 2051 21 6.520 VAN GEVAS 6,5 0,01 2080 21 10.432 GAZIANTEP ARABAN 6,5 0,01 2075 21 9.758 AFYON SULTANDAGI 6,5 0,01 1822 20 6.288 AYDIN BUHARKENT 6,5 0,01 1744 20 6.891 MALATYA DOGANSEHIR 6,5 0,01 1843 20 10.800 BURSA ORHANELI 6,5 0,01 1714 20 7.934 USAK ULUBEY 6,5 0,01 1716 19 4.945 AYDIN SULTANHISAR 6,5 0,01 1695 19 6.229 BILECIK PAZARYERI 6,5 0,01 1810 19 6.481 AFYON COBANLAR 6,5 0,01 1831 19 8.774 DENIZLI BEKILLI 6,5 0,01 1823 19 3.481 DENIZLI HONAZ 6,5 0,01 1757 18 9.788 AYDIN KOCARLI 6,5 0,01 1697 18 6.822 ADANA YUMURTALIK 6,5 0,01 1650 18 5.220 ISPARTA GELENDOST 6,5 0,01 1730 18 5.351 KUTAHYA HISARCIK 6,5 0,01 1395 18 4.877 DENIZLI BABADAG 6,5 0,01 1684 17 4.185 KONYA DERBENT 6,5 0,01 1713 17 2.922 CORUM BAYAT 6,5 0,01 1531 17 8.828 AFYON BAYAT 6,5 0,01 1654 17 4.489 MANISA KOPRUBASI 6,5 0,01 1587 17 5.283 KONYA HUYUK 6,5 0,01 1513 16 3.695 CORUM MECITOZU 6,5 0,01 1522 16 5.261 ANTALYA KAS 6,5 0,01 1126 16 6.857 KUTAHYA SAPHANE 6,5 0,01 1491 16 3.623 CANAKKALE YENICE 6,5 0,01 1463 16 6.830 ISPARTA ATABEY 6,5 0,01 1462 15 4.355 BURDUR AGLASUN 6,5 0,01 1443 15 4.414 DIYARBAKIR DICLE 6,5 0,01 1482 15 8.610 TOKAT PAZAR 6,5 0,01 1358 14 4.986 NIGDE CAMARDI 6,5 0,01 1353 14 3.480 SAMSUN SALIPAZARI 6,5 0,01 1162 14 6.156 CANKIRI ELDIVAN 6,5 0,01 1329 14 3.034 KUTAHYA ALTINTAS 6,5 0,01 1192 13 5.538 AFYON DAZKIRI 6,5 0,01 1162 13 4.470 ISPARTA GONEN 6,5 0,01 1185 12 3.663 KONYA TUZLUKCU 6,5 0,01 1218 12 3.912 KUTAHYA PAZARLAR 6,5 0,01 1103 12 3.660 ORDU CATALPINAR 6,5 0,01 999 11 5.333 SAKARYA KAYNARCA 6,5 0,01 911 11 5.144 AFYON EVCILER 6,5 0,01 1071 11 4.142 ERZURUM TEKMAN 6,5 0,01 1040 11 3.957 DENIZLI CAMELI 6,5 0,01 854 9 2.837 GAZIANTEP YAVUZELI 6,5 0,01 909 9 4.093 BURSA KELES 6,5 0,01 873 9 3.681 CANKIRI SABANOZU 6,5 0,01 897 9 5.124 AYDIN KARPUZLU 6,5 0,01 863 9 2.116 CORUM ORTAKOY 6,5 0,01 834 9 2.945 BURDUR CELTIKCI 6,5 0,01 856 9 2.374 ADIYAMAN GERGER 6,5 0,01 901 9 3.242 KUTAHYA CAVDARHISAR 6,5 0,01 809 8 2.412 DENIZLI BEYAGAC 6,5 0,01 807 8 2.664 ESKISEHIR MIHALGAZI 6,5 0,01 765 8 1.951
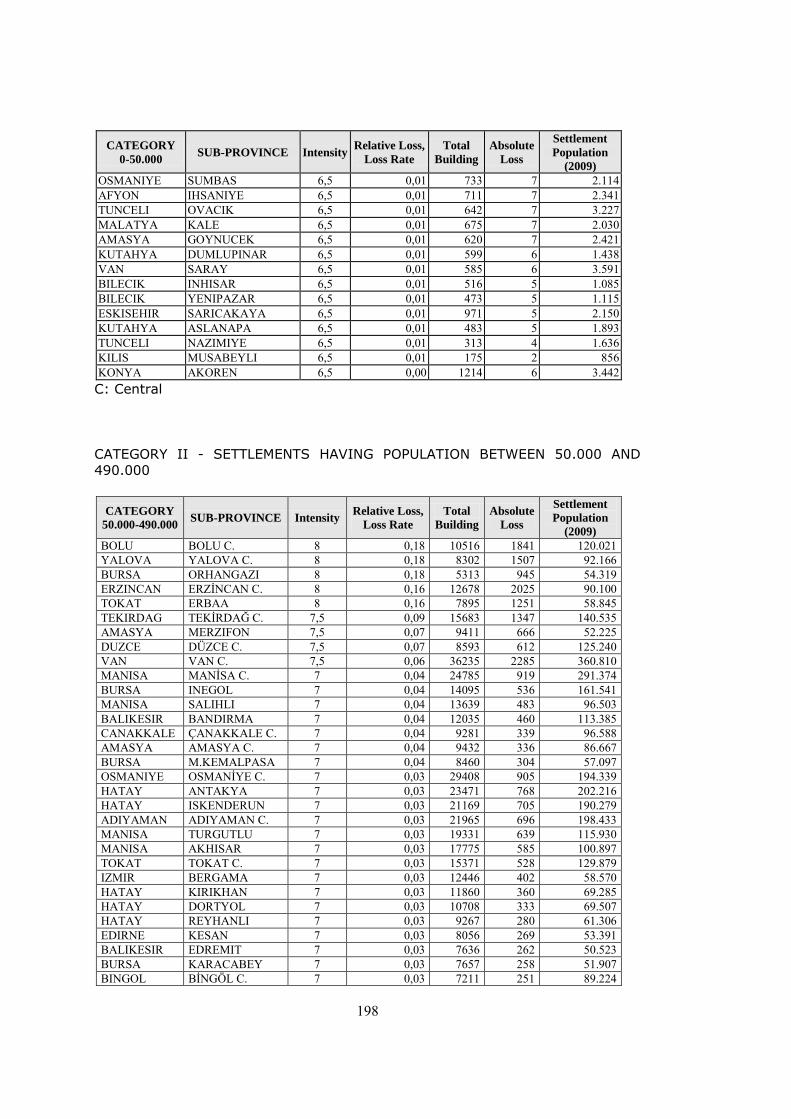
198
CATEGORY
0-50.000 SUB-PROVINCE Intensity Relative Loss,
Loss Rate
Total
Building Absolute
Loss
Settlement
Population
(2009) OSMANIYE SUMBAS 6,5 0,01 733 7 2.114 AFYON IHSANIYE 6,5 0,01 711 7 2.341 TUNCELI OVACIK 6,5 0,01 642 7 3.227 MALATYA KALE 6,5 0,01 675 7 2.030 AMASYA GOYNUCEK 6,5 0,01 620 7 2.421 KUTAHYA DUMLUPINAR 6,5 0,01 599 6 1.438 VAN SARAY 6,5 0,01 585 6 3.591 BILECIK INHISAR 6,5 0,01 516 5 1.085 BILECIK YENIPAZAR 6,5 0,01 473 5 1.115 ESKISEHIR SARICAKAYA 6,5 0,01 971 5 2.150 KUTAHYA ASLANAPA 6,5 0,01 483 5 1.893 TUNCELI NAZIMIYE 6,5 0,01 313 4 1.636 KILIS MUSABEYLI 6,5 0,01 175 2 856 KONYA AKOREN 6,5 0,00 1214 6 3.442 C: Central
CATEGORY II - SETTLEMENTS HAVING POPULATION BETWEEN 50.000 AND
490.000
CATEGORY
50.000-490.000 SUB-PROVINCE Intensity Relative Loss,
Loss Rate
Total
Building Absolute
Loss
Settlement
Population
(2009) BOLU BOLU C. 8 0,18 10516 1841 120.021 YALOVA YALOVA C. 8 0,18 8302 1507 92.166 BURSA ORHANGAZI 8 0,18 5313 945 54.319 ERZINCAN ERZİNCAN C. 8 0,16 12678 2025 90.100 TOKAT ERBAA 8 0,16 7895 1251 58.845 TEKIRDAG TEKİRDAĞ C. 7,5 0,09 15683 1347 140.535 AMASYA MERZIFON 7,5 0,07 9411 666 52.225 DUZCE DÜZCE C. 7,5 0,07 8593 612 125.240 VAN VAN C. 7,5 0,06 36235 2285 360.810 MANISA MANİSA C. 7 0,04 24785 919 291.374 BURSA INEGOL 7 0,04 14095 536 161.541 MANISA SALIHLI 7 0,04 13639 483 96.503 BALIKESIR BANDIRMA 7 0,04 12035 460 113.385 CANAKKALE ÇANAKKALE C. 7 0,04 9281 339 96.588 AMASYA AMASYA C. 7 0,04 9432 336 86.667 BURSA M.KEMALPASA 7 0,04 8460 304 57.097 OSMANIYE OSMANİYE C. 7 0,03 29408 905 194.339 HATAY ANTAKYA 7 0,03 23471 768 202.216 HATAY ISKENDERUN 7 0,03 21169 705 190.279 ADIYAMAN ADIYAMAN C. 7 0,03 21965 696 198.433 MANISA TURGUTLU 7 0,03 19331 639 115.930 MANISA AKHISAR 7 0,03 17775 585 100.897 TOKAT TOKAT C. 7 0,03 15371 528 129.879 IZMIR BERGAMA 7 0,03 12446 402 58.570 HATAY KIRIKHAN 7 0,03 11860 360 69.285 HATAY DORTYOL 7 0,03 10708 333 69.507 HATAY REYHANLI 7 0,03 9267 280 61.306 EDIRNE KESAN 7 0,03 8056 269 53.391 BALIKESIR EDREMIT 7 0,03 7636 262 50.523 BURSA KARACABEY 7 0,03 7657 258 51.907 BINGOL BİNGÖL C. 7 0,03 7211 251 89.224
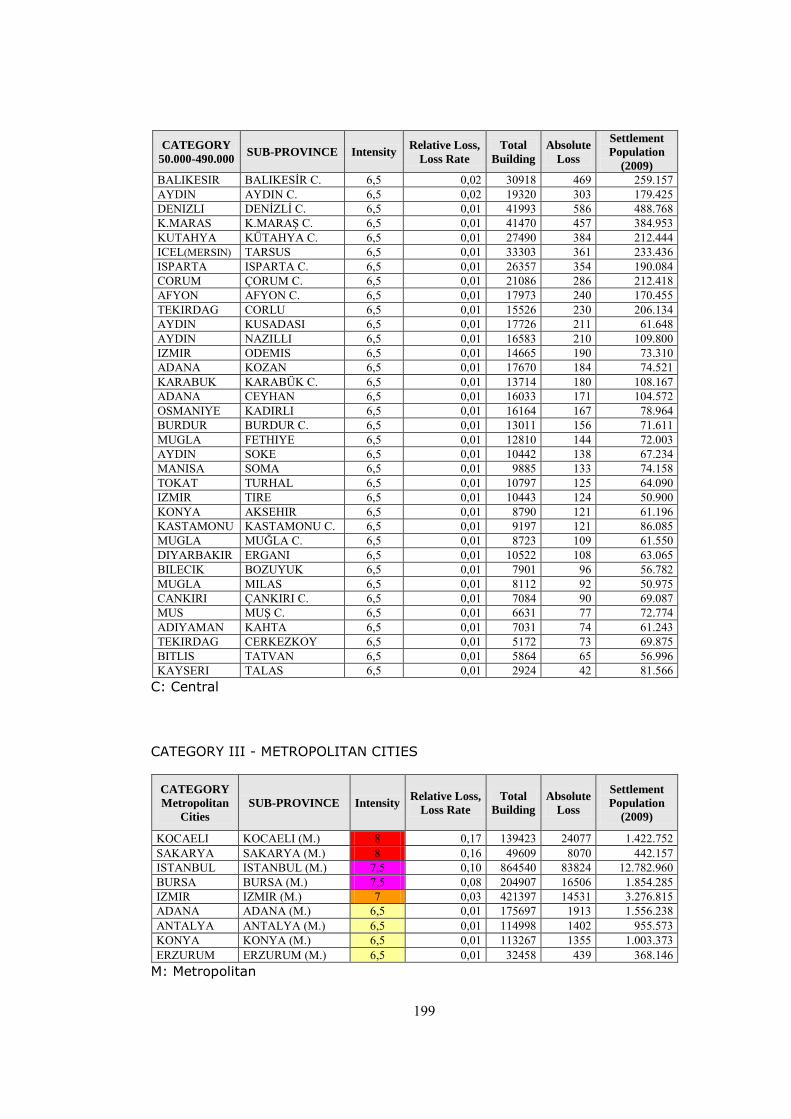
199
CATEGORY
50.000-490.000 SUB-PROVINCE Intensity Relative Loss,
Loss Rate
Total
Building Absolute
Loss
Settlement
Population
(2009) BALIKESIR BALIKESİR C. 6,5 0,02 30918 469 259.157 AYDIN AYDIN C. 6,5 0,02 19320 303 179.425 DENIZLI DENİZLİ C. 6,5 0,01 41993 586 488.768 K.MARAS K.MARAŞ C. 6,5 0,01 41470 457 384.953 KUTAHYA KÜTAHYA C. 6,5 0,01 27490 384 212.444 ICEL(MERSIN) TARSUS 6,5 0,01 33303 361 233.436 ISPARTA ISPARTA C. 6,5 0,01 26357 354 190.084 CORUM ÇORUM C. 6,5 0,01 21086 286 212.418 AFYON AFYON C. 6,5 0,01 17973 240 170.455 TEKIRDAG CORLU 6,5 0,01 15526 230 206.134 AYDIN KUSADASI 6,5 0,01 17726 211 61.648 AYDIN NAZILLI 6,5 0,01 16583 210 109.800 IZMIR ODEMIS 6,5 0,01 14665 190 73.310 ADANA KOZAN 6,5 0,01 17670 184 74.521 KARABUK KARABÜK C. 6,5 0,01 13714 180 108.167 ADANA CEYHAN 6,5 0,01 16033 171 104.572 OSMANIYE KADIRLI 6,5 0,01 16164 167 78.964 BURDUR BURDUR C. 6,5 0,01 13011 156 71.611 MUGLA FETHIYE 6,5 0,01 12810 144 72.003 AYDIN SOKE 6,5 0,01 10442 138 67.234 MANISA SOMA 6,5 0,01 9885 133 74.158 TOKAT TURHAL 6,5 0,01 10797 125 64.090 IZMIR TIRE 6,5 0,01 10443 124 50.900 KONYA AKSEHIR 6,5 0,01 8790 121 61.196 KASTAMONU KASTAMONU C. 6,5 0,01 9197 121 86.085 MUGLA MUĞLA C. 6,5 0,01 8723 109 61.550 DIYARBAKIR ERGANI 6,5 0,01 10522 108 63.065 BILECIK BOZUYUK 6,5 0,01 7901 96 56.782 MUGLA MILAS 6,5 0,01 8112 92 50.975 CANKIRI ÇANKIRI C. 6,5 0,01 7084 90 69.087 MUS MUŞ C. 6,5 0,01 6631 77 72.774 ADIYAMAN KAHTA 6,5 0,01 7031 74 61.243 TEKIRDAG CERKEZKOY 6,5 0,01 5172 73 69.875 BITLIS TATVAN 6,5 0,01 5864 65 56.996 KAYSERI TALAS 6,5 0,01 2924 42 81.566
C: Central
CATEGORY III - METROPOLITAN CITIES
CATEGORY
Metropolitan
Cities
SUB-PROVINCE Intensity Relative Loss,
Loss Rate
Total
Building
Absolute
Loss
Settlement
Population
(2009)
KOCAELI KOCAELI (M.) 8 0,17 139423 24077 1.422.752 SAKARYA SAKARYA (M.) 8 0,16 49609 8070 442.157 ISTANBUL ISTANBUL (M.) 7,5 0,10 864540 83824 12.782.960 BURSA BURSA (M.) 7,5 0,08 204907 16506 1.854.285 IZMIR IZMIR (M.) 7 0,03 421397 14531 3.276.815 ADANA ADANA (M.) 6,5 0,01 175697 1913 1.556.238 ANTALYA ANTALYA (M.) 6,5 0,01 114998 1402 955.573 KONYA KONYA (M.) 6,5 0,01 113267 1355 1.003.373 ERZURUM ERZURUM (M.) 6,5 0,01 32458 439 368.146
M: Metropolitan
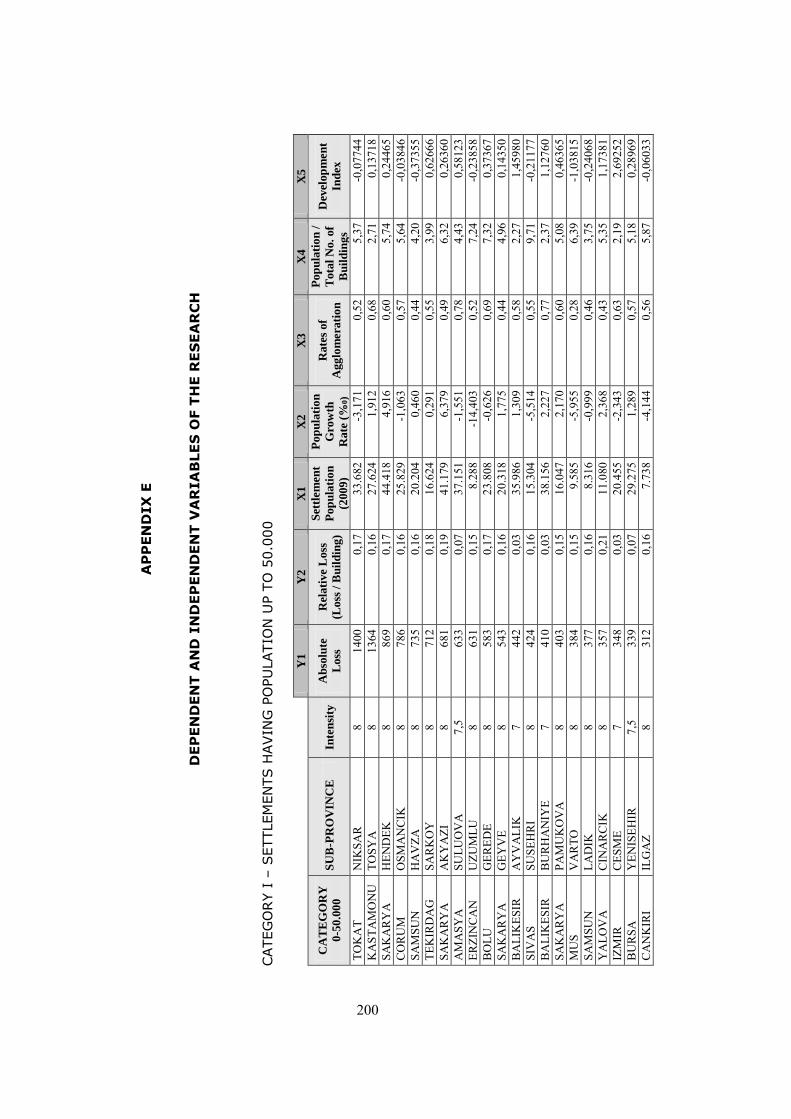
AP
PE
ND
IX
E
D
EP
EN
DE
NT
AN
D I
ND
EP
EN
DE
NT
VA
RIA
BLE
S O
F T
HE
RE
SE
AR
CH
CATEG
OR
Y I
– S
ETTLEM
EN
TS H
AVIN
G P
OPU
LATIO
N U
P T
O 5
0.0
00
Y1
Y
2
X1
X
2
X3
X
4
X5
CA
TE
GO
RY
0-5
0.0
00
SU
B-P
RO
VIN
CE
In
ten
sity
A
bso
lute
Loss
Rel
ati
ve
Loss
(Loss
/ B
uil
din
g)
Set
tlem
en
t
Pop
ula
tio
n
(200
9)
Pop
ula
tio
n
Gro
wth
Rate
(%
0)
Rate
s of
Ag
glo
mera
tio
n
Pop
ula
tio
n /
Tota
l N
o.
of
Bu
ild
ing
s
Dev
elop
men
t
Ind
ex
TOK
AT
NIK
SAR
8
1400
0,
17
33.6
82
-3,1
71
0,52
5,
37
-0,0
7744
K
AST
AM
ON
U
TOSY
A
8 13
64
0,16
27
.624
1,
912
0,68
2,
71
0,13
718
SAK
AR
YA
H
END
EK
8 86
9 0,
17
44.4
18
4,91
6 0,
60
5,74
0,
2446
5 C
OR
UM
O
SMA
NC
IK
8 78
6 0,
16
25.8
29
-1,0
63
0,57
5,
64
-0,0
3846
SA
MSU
N
HA
VZA
8
735
0,16
20
.204
0,
460
0,44
4,
20
-0,3
7355
TE
KIR
DA
G
SAR
KO
Y
8 71
2 0,
18
16.6
24
0,29
1 0,
55
3,99
0,
6266
6 SA
KA
RY
A
AK
YA
ZI
8 68
1 0,
19
41.1
79
6,37
9 0,
49
6,32
0,
2636
0 A
MA
SYA
SU
LUO
VA
7,
5 63
3 0,
07
37.1
51
-1,5
51
0,78
4,
43
0,58
123
ERZI
NC
AN
U
ZUM
LU
8 63
1 0,
15
8.28
8 -1
4,40
3 0,
52
7,24
-0
,238
58
BO
LU
GER
EDE
8 58
3 0,
17
23.8
08
-0,6
26
0,69
7,
32
0,37
367
SAK
AR
YA
G
EYV
E 8
543
0,16
20
.318
1,
775
0,44
4,
96
0,14
350
BA
LIK
ESIR
A
YV
ALI
K
7 44
2 0,
03
35.9
86
1,30
9 0,
58
2,27
1,
4598
0 SI
VA
S SU
SEH
RI
8 42
4 0,
16
15.3
04
-5,5
14
0,55
9,
71
-0,2
1177
B
ALI
KES
IR
BU
RH
AN
IYE
7 41
0 0,
03
38.1
56
2,22
7 0,
77
2,37
1,
1276
0 SA
KA
RY
A
PAM
UK
OV
A
8 40
3 0,
15
16.0
47
2,17
0 0,
60
5,08
0,
4636
5 M
US
VA
RTO
8
384
0,15
9.
585
-5,9
55
0,28
6,
39
-1,0
3815
SA
MSU
N
LAD
IK
8 37
7 0,
16
8.31
6 -0
,999
0,
46
3,75
-0
,240
68
YA
LOV
A
CIN
AR
CIK
8
357
0,21
11
.080
2,
368
0,43
5,
35
1,17
381
IZM
IR
CES
ME
7 34
8 0,
03
20.4
55
-2,3
43
0,63
2,
19
2,69
252
BU
RSA
Y
ENIS
EHIR
7,
5 33
9 0,
07
29.2
75
1,28
9 0,
57
5,18
0,
2896
9 C
AN
KIR
I IL
GA
Z 8
312
0,16
7.
738
-4,1
44
0,56
5,
87
-0,0
6033
200
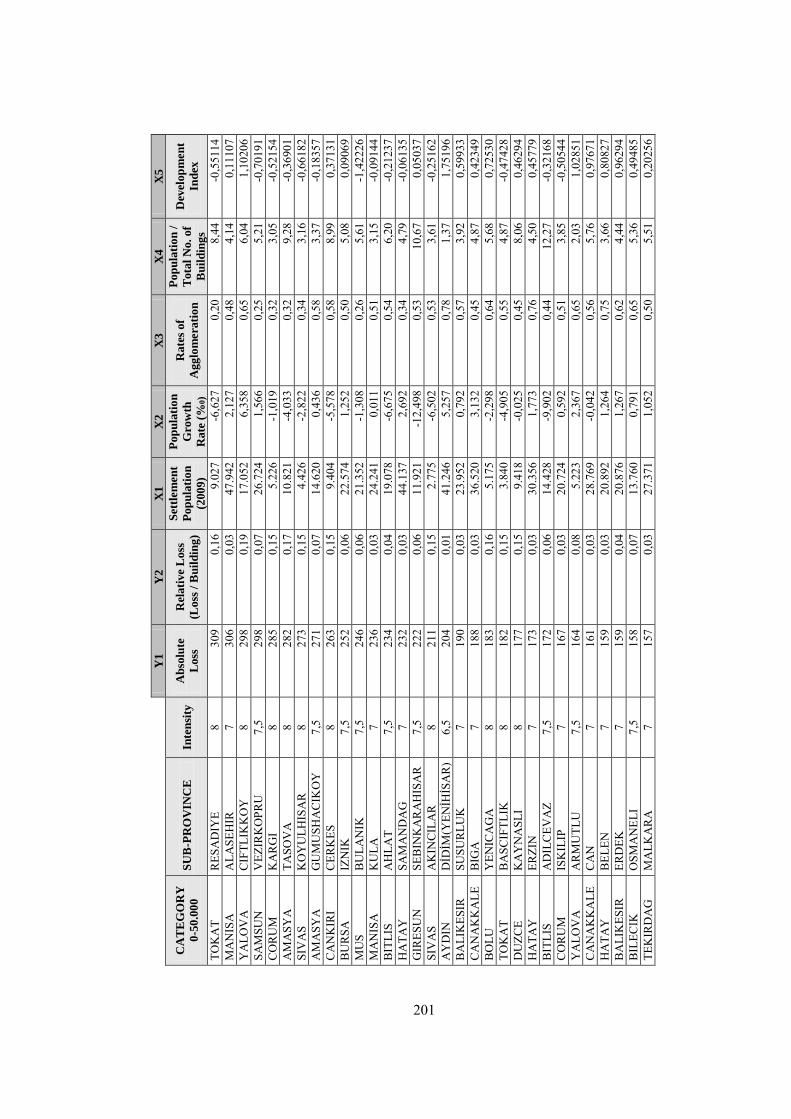
Y
1
Y2
X
1
X2
X
3
X4
X
5
CA
TE
GO
RY
0-5
0.0
00
SU
B-P
RO
VIN
CE
In
ten
sity
A
bso
lute
Loss
Rel
ati
ve
Loss
(Loss
/ B
uil
din
g)
Set
tlem
en
t
Pop
ula
tio
n
(200
9)
Pop
ula
tio
n
Gro
wth
Rate
(%
0)
Rate
s of
Ag
glo
mera
tio
n
Pop
ula
tio
n /
Tota
l N
o.
of
Bu
ild
ing
s
Dev
elop
men
t
Ind
ex
TOK
AT
RES
AD
IYE
8 30
9 0,
16
9.02
7 -6
,627
0,
20
8,44
-0
,551
14
MA
NIS
A
ALA
SEH
IR
7 30
6 0,
03
47.9
42
2,12
7 0,
48
4,14
0,
1110
7 Y
ALO
VA
C
IFTL
IKK
OY
8
298
0,19
17
.052
6,
358
0,65
6,
04
1,10
206
SAM
SUN
V
EZIR
KO
PRU
7,
5 29
8 0,
07
26.7
24
1,56
6 0,
25
5,21
-0
,701
91
CO
RU
M
KA
RG
I 8
285
0,15
5.
226
-1,0
19
0,32
3,
05
-0,5
2154
A
MA
SYA
TA
SOV
A
8 28
2 0,
17
10.8
21
-4,0
33
0,32
9,
28
-0,3
6901
SI
VA
S K
OY
ULH
ISA
R
8 27
3 0,
15
4.42
6 -2
,822
0,
34
3,16
-0
,661
82
AM
ASY
A
GU
MU
SHA
CIK
OY
7,
5 27
1 0,
07
14.6
20
0,43
6 0,
58
3,37
-0
,183
57
CA
NK
IRI
CER
KES
8
263
0,15
9.
404
-5,5
78
0,58
8,
99
0,37
131
BU
RSA
IZ
NIK
7,
5 25
2 0,
06
22.5
74
1,25
2 0,
50
5,08
0,
0906
9 M
US
BU
LAN
IK
7,5
246
0,06
21
.352
-1
,308
0,
26
5,61
-1
,422
26
MA
NIS
A
KU
LA
7 23
6 0,
03
24.2
41
0,01
1 0,
51
3,15
-0
,091
44
BIT
LIS
AH
LAT
7,5
234
0,04
19
.078
-6
,675
0,
54
6,20
-0
,212
37
HA
TAY
SA
MA
ND
AG
7
232
0,03
44
.137
2,
692
0,34
4,
79
-0,0
6135
G
IRES
UN
SE
BIN
KA
RA
HIS
AR
7,
5 22
2 0,
06
11.9
21
-12,
498
0,53
10
,67
0,05
037
SIV
AS
AK
INC
ILA
R
8 21
1 0,
15
2.77
5 -6
,502
0,
53
3,61
-0
,251
62
AY
DIN
D
İDİM
(YEN
İHİS
AR
) 6,
5 20
4 0,
01
41.2
46
5,25
7 0,
78
1,37
1,
7519
6 B
ALI
KES
IR
SUSU
RLU
K
7 19
0 0,
03
23.9
52
0,79
2 0,
57
3,92
0,
5993
3 C
AN
AK
KA
LE
BIG
A
7 18
8 0,
03
36.5
20
3,13
2 0,
45
4,87
0,
4234
9 B
OLU
Y
ENIC
AG
A
8 18
3 0,
16
5.17
5 -2
,298
0,
64
5,68
0,
7253
0 TO
KA
T B
ASC
IFTL
IK
8 18
2 0,
15
3.84
0 -4
,905
0,
55
4,87
-0
,474
28
DU
ZCE
KA
YN
ASL
I 8
177
0,15
9.
418
-0,0
25
0,45
8,
06
0,46
294
HA
TAY
ER
ZIN
7
173
0,03
30
.356
1,
773
0,76
4,
50
0,45
779
BIT
LIS
AD
ILC
EVA
Z 7,
5 17
2 0,
06
14.4
28
-9,9
02
0,44
12
,27
-0,3
2168
C
OR
UM
IS
KIL
IP
7 16
7 0,
03
20.7
24
0,59
2 0,
51
3,85
-0
,505
44
YA
LOV
A
AR
MU
TLU
7,
5 16
4 0,
08
5.22
3 2,
367
0,65
2,
03
1,02
851
CA
NA
KK
ALE
C
AN
7
161
0,03
28
.769
-0
,042
0,
56
5,76
0,
9767
1 H
ATA
Y
BEL
EN
7 15
9 0,
03
20.8
92
1,26
4 0,
75
3,66
0,
8082
7 B
ALI
KES
IR
ERD
EK
7 15
9 0,
04
20.8
76
1,26
7 0,
62
4,44
0,
9629
4 B
ILEC
IK
OSM
AN
ELI
7,5
158
0,07
13
.760
0,
791
0,65
5,
36
0,49
485
TEK
IRD
AG
M
ALK
AR
A
7 15
7 0,
03
27.3
71
1,05
2 0,
50
5,51
0,
2025
6
201
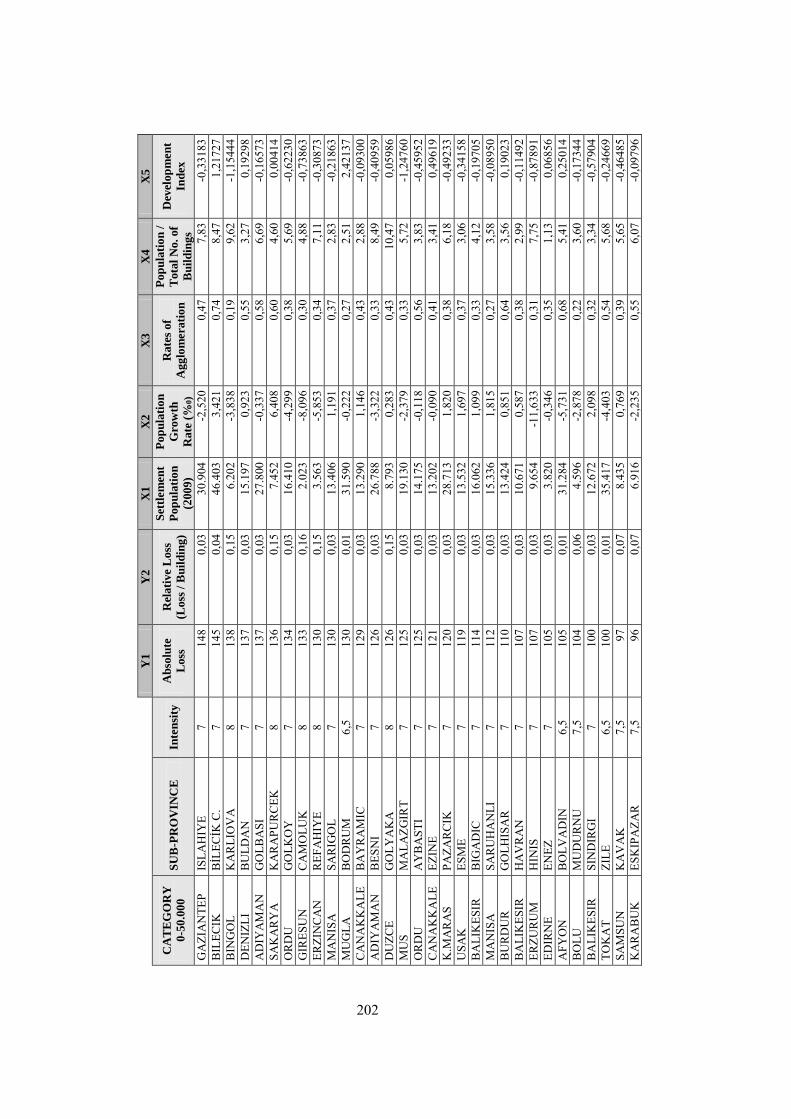
Y
1
Y2
X
1
X2
X
3
X4
X
5
CA
TE
GO
RY
0-5
0.0
00
SU
B-P
RO
VIN
CE
In
ten
sity
A
bso
lute
Loss
Rel
ati
ve
Loss
(Loss
/ B
uil
din
g)
Set
tlem
en
t
Pop
ula
tio
n
(200
9)
Pop
ula
tio
n
Gro
wth
Rate
(%
0)
Rate
s of
Ag
glo
mera
tio
n
Pop
ula
tio
n /
Tota
l N
o.
of
Bu
ild
ing
s
Dev
elop
men
t
Ind
ex
GA
ZIA
NTE
P IS
LAH
IYE
7 14
8 0,
03
30.9
04
-2,5
20
0,47
7,
83
-0,3
3183
B
ILEC
IK
BİL
ECİK
C.
7 14
5 0,
04
46.4
03
3,42
1 0,
74
8,47
1,
2172
7 B
ING
OL
KA
RLI
OV
A
8 13
8 0,
15
6.20
2 -3
,838
0,
19
9,62
-1
,154
44
DEN
IZLI
B
ULD
AN
7
137
0,03
15
.197
0,
923
0,55
3,
27
0,19
298
AD
IYA
MA
N
GO
LBA
SI
7 13
7 0,
03
27.8
00
-0,3
37
0,58
6,
69
-0,1
6573
SA
KA
RY
A
KA
RA
PUR
CEK
8
136
0,15
7.
452
6,40
8 0,
60
4,60
0,
0041
4 O
RD
U
GO
LKO
Y
7 13
4 0,
03
16.4
10
-4,2
99
0,38
5,
69
-0,6
2230
G
IRES
UN
C
AM
OLU
K
8 13
3 0,
16
2.02
3 -8
,096
0,
30
4,88
-0
,738
63
ERZI
NC
AN
R
EFA
HIY
E 8
130
0,15
3.
563
-5,8
53
0,34
7,
11
-0,3
0873
M
AN
ISA
SA
RIG
OL
7 13
0 0,
03
13.4
06
1,19
1 0,
37
2,83
-0
,218
63
MU
GLA
B
OD
RU
M
6,5
130
0,01
31
.590
-0
,222
0,
27
2,51
2,
4213
7 C
AN
AK
KA
LE
BA
YR
AM
IC
7 12
9 0,
03
13.2
90
1,14
6 0,
43
2,88
-0
,093
00
AD
IYA
MA
N
BES
NI
7 12
6 0,
03
26.7
88
-3,3
22
0,33
8,
49
-0,4
0959
D
UZC
E G
OLY
AK
A
8 12
6 0,
15
8.79
3 0,
283
0,43
10
,47
0,05
986
MU
S M
ALA
ZGIR
T 7
125
0,03
19
.130
-2
,379
0,
33
5,72
-1
,247
60
OR
DU
A
YB
AST
I 7
125
0,03
14
.175
-0
,118
0,
56
3,83
-0
,459
52
CA
NA
KK
ALE
EZ
INE
7 12
1 0,
03
13.2
02
-0,0
90
0,41
3,
41
0,49
619
K.M
AR
AS
PAZA
RC
IK
7 12
0 0,
03
28.7
13
1,82
0 0,
38
6,18
-0
,492
33
USA
K
ESM
E 7
119
0,03
13
.532
1,
697
0,37
3,
06
-0,3
4158
B
ALI
KES
IR
BIG
AD
IC
7 11
4 0,
03
16.0
62
1,09
9 0,
33
4,12
-0
,197
05
MA
NIS
A
SAR
UH
AN
LI
7 11
2 0,
03
15.3
36
1,81
5 0,
27
3,58
-0
,089
50
BU
RD
UR
G
OLH
ISA
R
7 11
0 0,
03
13.4
24
0,85
1 0,
64
3,56
0,
1902
3 B
ALI
KES
IR
HA
VR
AN
7
107
0,03
10
.671
0,
587
0,38
2,
99
-0,1
1492
ER
ZUR
UM
H
INIS
7
107
0,03
9.
654
-11,
633
0,31
7,
75
-0,8
7891
ED
IRN
E EN
EZ
7 10
5 0,
03
3.82
0 -0
,346
0,
35
1,13
0,
0685
6 A
FYO
N
BO
LVA
DIN
6,
5 10
5 0,
01
31.2
84
-5,7
31
0,68
5,
41
0,25
014
BO
LU
MU
DU
RN
U
7,5
104
0,06
4.
596
-2,8
78
0,22
3,
60
-0,1
7344
B
ALI
KES
IR
SIN
DIR
GI
7 10
0 0,
03
12.6
72
2,09
8 0,
32
3,34
-0
,579
04
TOK
AT
ZILE
6,
5 10
0 0,
01
35.4
17
-4,4
03
0,54
5,
68
-0,2
4669
SA
MSU
N
KA
VA
K
7,5
97
0,07
8.
435
0,76
9 0,
39
5,65
-0
,464
85
KA
RA
BU
K
ESK
IPA
ZAR
7,
5 96
0,
07
6.91
6 -2
,235
0,
55
6,07
-0
,097
96
202
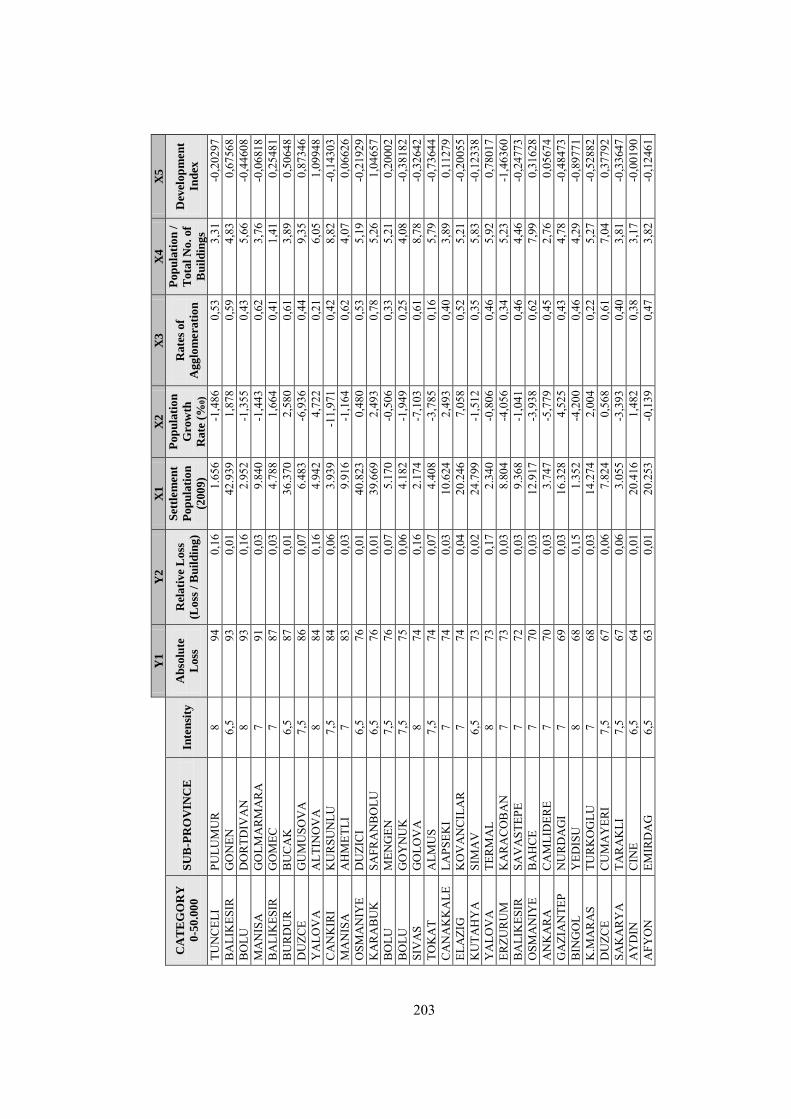
Y
1
Y2
X
1
X2
X
3
X4
X
5
CA
TE
GO
RY
0-5
0.0
00
SU
B-P
RO
VIN
CE
In
ten
sity
A
bso
lute
Loss
Rel
ati
ve
Loss
(Loss
/ B
uil
din
g)
Set
tlem
en
t
Pop
ula
tio
n
(200
9)
Pop
ula
tio
n
Gro
wth
Rate
(%
0)
Rate
s of
Ag
glo
mera
tio
n
Pop
ula
tio
n /
Tota
l N
o.
of
Bu
ild
ing
s
Dev
elop
men
t
Ind
ex
TUN
CEL
I PU
LUM
UR
8
94
0,16
1.
656
-1,4
86
0,53
3,
31
-0,2
0297
B
ALI
KES
IR
GO
NEN
6,
5 93
0,
01
42.9
39
1,87
8 0,
59
4,83
0,
6756
8 B
OLU
D
OR
TDIV
AN
8
93
0,16
2.
952
-1,3
55
0,43
5,
66
-0,4
4608
M
AN
ISA
G
OLM
AR
MA
RA
7
91
0,03
9.
840
-1,4
43
0,62
3,
76
-0,0
6818
B
ALI
KES
IR
GO
MEC
7
87
0,03
4.
788
1,66
4 0,
41
1,41
0,
2548
1 B
UR
DU
R
BU
CA
K
6,5
87
0,01
36
.370
2,
580
0,61
3,
89
0,50
648
DU
ZCE
GU
MU
SOV
A
7,5
86
0,07
6.
483
-6,9
36
0,44
9,
35
0,87
346
YA
LOV
A
ALT
INO
VA
8
84
0,16
4.
942
4,72
2 0,
21
6,05
1,
0994
8 C
AN
KIR
I K
UR
SUN
LU
7,5
84
0,06
3.
939
-11,
971
0,42
8,
82
-0,1
4303
M
AN
ISA
A
HM
ETLI
7
83
0,03
9.
916
-1,1
64
0,62
4,
07
0,06
626
OSM
AN
IYE
DU
ZIC
I 6,
5 76
0,
01
40.8
23
0,48
0 0,
53
5,19
-0
,219
29
KA
RA
BU
K
SAFR
AN
BO
LU
6,5
76
0,01
39
.669
2,
493
0,78
5,
26
1,04
657
BO
LU
MEN
GEN
7,
5 76
0,
07
5.17
0 -0
,506
0,
33
5,21
0,
2000
2 B
OLU
G
OY
NU
K
7,5
75
0,06
4.
182
-1,9
49
0,25
4,
08
-0,3
8182
SI
VA
S G
OLO
VA
8
74
0,16
2.
174
-7,1
03
0,61
8,
78
-0,3
2642
TO
KA
T A
LMU
S 7,
5 74
0,
07
4.40
8 -3
,785
0,
16
5,79
-0
,736
44
CA
NA
KK
ALE
LA
PSEK
I 7
74
0,03
10
.624
2,
493
0,40
3,
89
0,11
279
ELA
ZIG
K
OV
AN
CIL
AR
7
74
0,04
20
.246
7,
058
0,52
5,
21
-0,2
0055
K
UTA
HY
A
SIM
AV
6,
5 73
0,
02
24.7
99
-1,5
12
0,35
5,
83
-0,1
2338
Y
ALO
VA
TE
RM
AL
8 73
0,
17
2.34
0 -0
,806
0,
46
5,92
0,
7801
7 ER
ZUR
UM
K
AR
AC
OB
AN
7
73
0,03
8.
804
-4,0
56
0,34
5,
23
-1,4
6360
B
ALI
KES
IR
SAV
AST
EPE
7 72
0,
03
9.36
8 -1
,041
0,
46
4,46
-0
,247
73
OSM
AN
IYE
BA
HC
E 7
70
0,03
12
.917
-3
,938
0,
62
7,99
0,
3162
8 A
NK
AR
A
CA
MLI
DER
E 7
70
0,03
3.
747
-5,7
79
0,45
2,
76
0,05
674
GA
ZIA
NTE
P N
UR
DA
GI
7 69
0,
03
16.3
28
4,52
5 0,
43
4,78
-0
,484
73
BIN
GO
L Y
EDIS
U
8 68
0,
15
1.35
2 -4
,200
0,
46
4,29
-0
,897
71
K.M
AR
AS
TUR
KO
GLU
7
68
0,03
14
.274
2,
004
0,22
5,
27
-0,5
2882
D
UZC
E C
UM
AY
ERI
7,5
67
0,06
7.
824
0,56
8 0,
61
7,04
0,
3779
2 SA
KA
RY
A
TAR
AK
LI
7,5
67
0,06
3.
055
-3,3
93
0,40
3,
81
-0,3
3647
A
YD
IN
CIN
E 6,
5 64
0,
01
20.4
16
1,48
2 0,
38
3,17
-0
,001
90
AFY
ON
EM
IRD
AG
6,
5 63
0,
01
20.2
53
-0,1
39
0,47
3,
82
-0,1
2461
203

Y
1
Y2
X
1
X2
X
3
X4
X
5
CA
TE
GO
RY
0-5
0.0
00
SU
B-P
RO
VIN
CE
In
ten
sity
A
bso
lute
Loss
Rel
ati
ve
Loss
(Loss
/ B
uil
din
g)
Set
tlem
en
t
Pop
ula
tio
n
(200
9)
Pop
ula
tio
n
Gro
wth
Rate
(%
0)
Rate
s of
Ag
glo
mera
tio
n
Pop
ula
tio
n /
Tota
l N
o.
of
Bu
ild
ing
s
Dev
elop
men
t
Ind
ex
KO
NY
A
ILG
IN
6,5
62
0,01
31
.171
1,
721
0,51
4,
85
-0,1
5085
ER
ZIN
CA
N
CA
YIR
LI
7,5
61
0,06
3.
089
-8,3
46
0,31
6,
55
-0,6
6601
SA
KA
RY
A
FER
IZLI
7
61
0,03
12
.914
0,
470
0,54
6,
43
0,31
085
BU
RD
UR
K
AR
AM
AN
LI
7 60
0,
03
5.25
1 0,
544
0,67
2,
61
0,06
611
CO
RU
M
DO
DU
RG
A
7,5
60
0,06
3.
065
-1,2
53
0,40
3,
46
-0,2
9713
O
RD
U
MES
UD
IYE
7,5
60
0,06
3.
031
-6,9
49
0,21
5,
87
-0,5
2609
V
AN
B
ASK
ALE
7
60
0,03
12
.562
-1
,294
0,
20
7,11
-1
,555
37
AFY
ON
C
AY
6,
5 59
0,
01
14.5
92
-2,4
16
0,42
3,
54
-0,1
0024
B
ILEC
IK
GO
LPA
ZAR
I 7
58
0,03
7.
697
1,05
1 0,
62
3,76
-0
,169
45
CA
NA
KK
ALE
A
YV
AC
IK
7 57
0,
03
7.53
8 1,
689
0,25
3,
50
0,08
642
SAK
AR
YA
K
AR
ASU
6,
5 57
0,
01
27.9
14
1,37
2 0,
52
5,85
0,
1788
7 D
ENIZ
LI
GU
NEY
7
57
0,03
5.
908
-0,6
73
0,50
3,
38
-0,3
1210
A
NTA
LYA
K
UM
LUC
A
6,5
56
0,01
30
.939
2,
332
0,47
5,
32
0,20
565
MA
NIS
A
KIR
KA
GA
C
6,5
56
0,01
26
.660
0,
673
0,57
4,
87
-0,1
4244
EL
AZI
G
PALU
7
55
0,03
8.
837
-1,4
88
0,41
5,
58
-0,8
1209
M
UG
LA
MA
RM
AR
IS
6,5
54
0,02
30
.101
0,
545
0,40
8,
08
2,51
737
AN
TALY
A
KO
RK
UTE
LI
6,5
54
0,01
20
.109
2,
244
0,40
3,
89
0,01
904
HA
TAY
Y
AY
LAD
AG
I 7
54
0,03
5.
843
-3,0
91
0,26
4,
35
-0,5
5389
B
ING
OL
GEN
C
7 54
0,
03
18.6
91
0,20
8 0,
52
10,9
5 -1
,024
05
DEN
IZLI
C
AL
7 53
0,
03
3.88
7 -2
,632
0,
17
2,83
-0
,115
27
AD
AN
A
IMA
MO
GLU
6,
5 52
0,
01
20.6
36
-4,3
15
0,67
5,
92
-0,0
6441
B
ING
OL
AD
AK
LI
7,5
52
0,06
3.
143
-0,7
75
0,31
3,
96
-1,3
1228
B
ALI
KES
IR
MA
NY
AS
7 51
0,
03
6.57
8 2,
080
0,29
3,
39
-0,2
4757
EL
AZI
G
MA
DEN
7
51
0,03
5.
314
-3,3
11
0,36
4,
33
-0,5
3517
H
ATA
Y
HA
SSA
7
50
0,03
9.
207
0,16
5 0,
17
5,42
-0
,648
75
ISPA
RTA
EG
IRD
IR
6,5
50
0,01
18
.402
0,
943
0,51
4,
21
0,31
113
BU
RD
UR
TE
FEN
NI
7 50
0,
03
4.62
6 -1
,715
0,
45
3,36
-0
,132
55
OSM
AN
IYE
TOPR
AK
KA
LE
7 50
0,
03
7.84
3 -0
,780
0,
58
5,07
-0
,098
07
SIN
OP
BO
YA
BA
T 6,
5 50
0,
01
25.2
71
0,26
2 0,
59
6,61
0,
0726
6 M
UG
LA
OR
TAC
A
6,5
50
0,01
25
.816
4,
692
0,62
3,
82
1,07
099
BU
RD
UR
Y
ESIL
OV
A
7 49
0,
03
4.72
4 -3
,414
0,
27
4,05
-0
,236
27
204
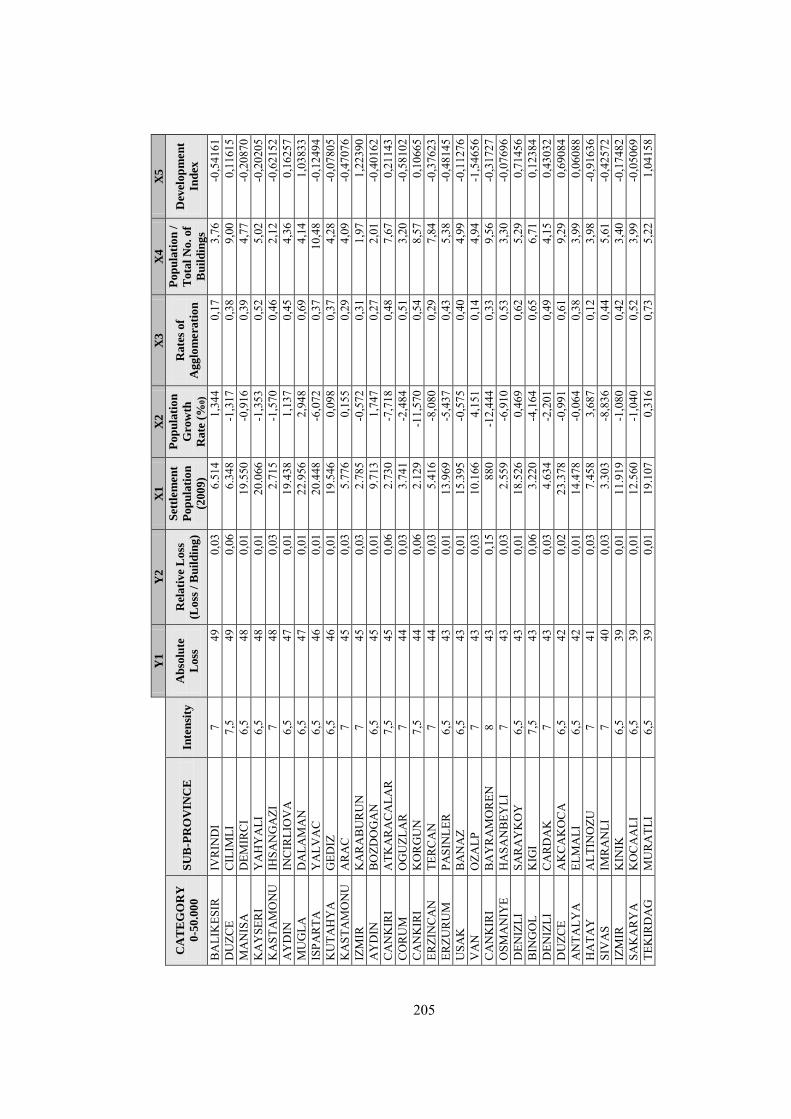
Y
1
Y2
X
1
X2
X
3
X4
X
5
CA
TE
GO
RY
0-5
0.0
00
SU
B-P
RO
VIN
CE
In
ten
sity
A
bso
lute
Loss
Rel
ati
ve
Loss
(Loss
/ B
uil
din
g)
Set
tlem
en
t
Pop
ula
tio
n
(200
9)
Pop
ula
tio
n
Gro
wth
Rate
(%
0)
Rate
s of
Ag
glo
mera
tio
n
Pop
ula
tio
n /
Tota
l N
o.
of
Bu
ild
ing
s
Dev
elop
men
t
Ind
ex
BA
LIK
ESIR
IV
RIN
DI
7 49
0,
03
6.51
4 1,
344
0,17
3,
76
-0,5
4161
D
UZC
E C
ILIM
LI
7,5
49
0,06
6.
348
-1,3
17
0,38
9,
00
0,11
615
MA
NIS
A
DEM
IRC
I 6,
5 48
0,
01
19.5
50
-0,9
16
0,39
4,
77
-0,2
0870
K
AY
SER
I Y
AH
YA
LI
6,5
48
0,01
20
.066
-1
,353
0,
52
5,02
-0
,202
05
KA
STA
MO
NU
IH
SAN
GA
ZI
7 48
0,
03
2.71
5 -1
,570
0,
46
2,12
-0
,621
52
AY
DIN
IN
CIR
LIO
VA
6,
5 47
0,
01
19.4
38
1,13
7 0,
45
4,36
0,
1625
7 M
UG
LA
DA
LAM
AN
6,
5 47
0,
01
22.9
56
2,94
8 0,
69
4,14
1,
0383
3 IS
PAR
TA
YA
LVA
C
6,5
46
0,01
20
.448
-6
,072
0,
37
10,4
8 -0
,124
94
KU
TAH
YA
G
EDIZ
6,
5 46
0,
01
19.5
46
0,09
8 0,
37
4,28
-0
,078
05
KA
STA
MO
NU
A
RA
C
7 45
0,
03
5.77
6 0,
155
0,29
4,
09
-0,4
7076
IZ
MIR
K
AR
AB
UR
UN
7
45
0,03
2.
785
-0,5
72
0,31
1,
97
1,22
390
AY
DIN
B
OZD
OG
AN
6,
5 45
0,
01
9.71
3 1,
747
0,27
2,
01
-0,4
0162
C
AN
KIR
I A
TKA
RA
CA
LAR
7,
5 45
0,
06
2.73
0 -7
,718
0,
48
7,67
0,
2114
3 C
OR
UM
O
GU
ZLA
R
7 44
0,
03
3.74
1 -2
,484
0,
51
3,20
-0
,581
02
CA
NK
IRI
KO
RG
UN
7,
5 44
0,
06
2.12
9 -1
1,57
0 0,
54
8,57
0,
1066
5 ER
ZIN
CA
N
TER
CA
N
7 44
0,
03
5.41
6 -8
,080
0,
29
7,84
-0
,376
23
ERZU
RU
M
PASI
NLE
R
6,5
43
0,01
13
.969
-5
,437
0,
43
5,38
-0
,481
45
USA
K
BA
NA
Z 6,
5 43
0,
01
15.3
95
-0,5
75
0,40
4,
99
-0,1
1276
V
AN
O
ZALP
7
43
0,03
10
.166
4,
151
0,14
4,
94
-1,5
4656
C
AN
KIR
I B
AY
RA
MO
REN
8
43
0,15
88
0 -1
2,44
4 0,
33
9,56
-0
,317
27
OSM
AN
IYE
HA
SAN
BEY
LI
7 43
0,
03
2.55
9 -6
,910
0,
53
3,30
-0
,076
96
DEN
IZLI
SA
RA
YK
OY
6,
5 43
0,
01
18.5
26
0,46
9 0,
62
5,29
0,
7145
6 B
ING
OL
KIG
I 7,
5 43
0,
06
3.22
0 -4
,164
0,
65
6,71
0,
1238
4 D
ENIZ
LI
CA
RD
AK
7
43
0,03
4.
634
-2,2
01
0,49
4,
15
0,43
032
DU
ZCE
AK
CA
KO
CA
6,
5 42
0,
02
23.3
78
-0,9
91
0,61
9,
29
0,69
084
AN
TALY
A
ELM
ALI
6,
5 42
0,
01
14.4
78
-0,0
64
0,38
3,
99
0,06
088
HA
TAY
A
LTIN
OZU
7
41
0,03
7.
458
3,68
7 0,
12
3,98
-0
,916
36
SIV
AS
IMR
AN
LI
7 40
0,
03
3.30
3 -8
,836
0,
44
5,61
-0
,425
72
IZM
IR
KIN
IK
6,5
39
0,01
11
.919
-1
,080
0,
42
3,40
-0
,174
82
SAK
AR
YA
K
OC
AA
LI
6,5
39
0,01
12
.560
-1
,040
0,
52
3,99
-0
,050
69
TEK
IRD
AG
M
UR
ATL
I 6,
5 39
0,
01
19.1
07
0,31
6 0,
73
5,22
1,
0415
8
205
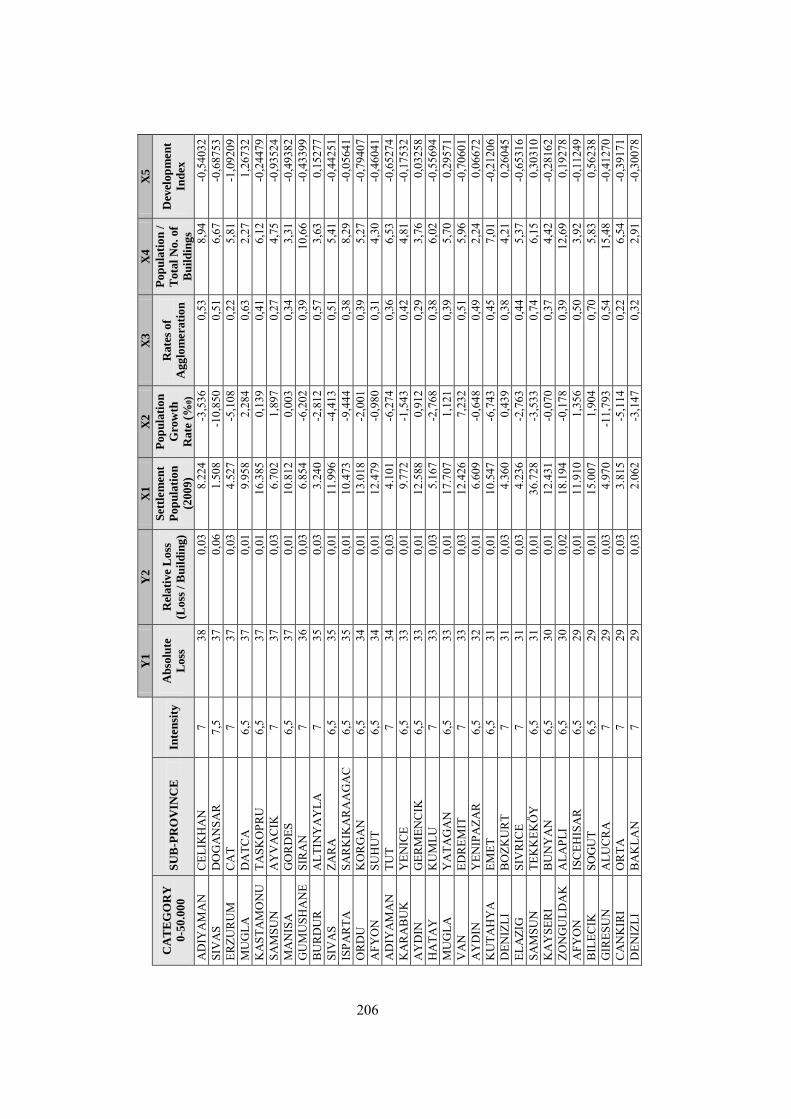
Y
1
Y2
X
1
X2
X
3
X4
X
5
CA
TE
GO
RY
0-5
0.0
00
SU
B-P
RO
VIN
CE
In
ten
sity
A
bso
lute
Loss
Rel
ati
ve
Loss
(Loss
/ B
uil
din
g)
Set
tlem
en
t
Pop
ula
tio
n
(200
9)
Pop
ula
tio
n
Gro
wth
Rate
(%
0)
Rate
s of
Ag
glo
mera
tio
n
Pop
ula
tio
n /
Tota
l N
o.
of
Bu
ild
ing
s
Dev
elop
men
t
Ind
ex
AD
IYA
MA
N
CEL
IKH
AN
7
38
0,03
8.
224
-3,5
36
0,53
8,
94
-0,5
4032
SI
VA
S D
OG
AN
SAR
7,
5 37
0,
06
1.50
8 -1
0,85
0 0,
51
6,67
-0
,687
53
ERZU
RU
M
CA
T 7
37
0,03
4.
527
-5,1
08
0,22
5,
81
-1,0
9209
M
UG
LA
DA
TCA
6,
5 37
0,
01
9.95
8 2,
284
0,63
2,
27
1,26
732
KA
STA
MO
NU
TA
SKO
PRU
6,
5 37
0,
01
16.3
85
0,13
9 0,
41
6,12
-0
,244
79
SAM
SUN
A
YV
AC
IK
7 37
0,
03
6.70
2 1,
897
0,27
4,
75
-0,9
3524
M
AN
ISA
G
OR
DES
6,
5 37
0,
01
10.8
12
0,00
3 0,
34
3,31
-0
,493
82
GU
MU
SHA
NE
SIR
AN
7
36
0,03
6.
854
-6,2
02
0,39
10
,66
-0,4
3399
B
UR
DU
R
ALT
INY
AY
LA
7 35
0,
03
3.24
0 -2
,812
0,
57
3,63
0,
1527
7 SI
VA
S ZA
RA
6,
5 35
0,
01
11.9
96
-4,4
13
0,51
5,
41
-0,4
4251
IS
PAR
TA
SAR
KIK
AR
AA
GA
C
6,5
35
0,01
10
.473
-9
,444
0,
38
8,29
-0
,056
41
OR
DU
K
OR
GA
N
6,5
34
0,01
13
.018
-2
,001
0,
39
5,27
-0
,794
07
AFY
ON
SU
HU
T 6,
5 34
0,
01
12.4
79
-0,9
80
0,31
4,
30
-0,4
6041
A
DIY
AM
AN
TU
T 7
34
0,03
4.
101
-6,2
74
0,36
6,
53
-0,6
5274
K
AR
AB
UK
Y
ENIC
E 6,
5 33
0,
01
9.77
2 -1
,543
0,
42
4,81
-0
,175
32
AY
DIN
G
ERM
ENC
IK
6,5
33
0,01
12
.588
0,
912
0,29
3,
76
0,03
258
HA
TAY
K
UM
LU
7 33
0,
03
5.16
7 -2
,768
0,
38
6,02
-0
,556
94
MU
GLA
Y
ATA
GA
N
6,5
33
0,01
17
.707
1,
121
0,39
5,
70
0,29
571
VA
N
EDR
EMIT
7
33
0,03
12
.426
7,
232
0,51
5,
96
-0,7
0601
A
YD
IN
YEN
IPA
ZAR
6,
5 32
0,
01
6.60
9 -0
,648
0,
49
2,24
0,
0667
2 K
UTA
HY
A
EMET
6,
5 31
0,
01
10.5
47
-6,7
43
0,45
7,
01
-0,2
1206
D
ENIZ
LI
BO
ZKU
RT
7 31
0,
03
4.36
0 0,
439
0,38
4,
21
0,26
045
ELA
ZIG
SI
VR
ICE
7 31
0,
03
4.23
6 -2
,763
0,
44
5,37
-0
,653
16
SAM
SUN
TE
KK
EKÖ
Y
6,5
31
0,01
36
.728
-3
,533
0,
74
6,15
0,
3031
0 K
AY
SER
I B
UN
YA
N
6,5
30
0,01
12
.431
-0
,070
0,
37
4,42
-0
,281
62
ZON
GU
LDA
K
ALA
PLI
6,5
30
0,02
18
.194
-0
,178
0,
39
12,6
9 0,
1927
8 A
FYO
N
ISC
EHIS
AR
6,
5 29
0,
01
11.9
10
1,35
6 0,
50
3,92
-0
,112
49
BIL
ECIK
SO
GU
T 6,
5 29
0,
01
15.0
07
1,90
4 0,
70
5,83
0,
5623
8 G
IRES
UN
A
LUC
RA
7
29
0,03
4.
970
-11,
793
0,54
15
,48
-0,4
1270
C
AN
KIR
I O
RTA
7
29
0,03
3.
815
-5,1
14
0,22
6,
54
-0,3
9171
D
ENIZ
LI
BA
KLA
N
7 29
0,
03
2.06
2 -3
,147
0,
32
2,91
-0
,300
78
206
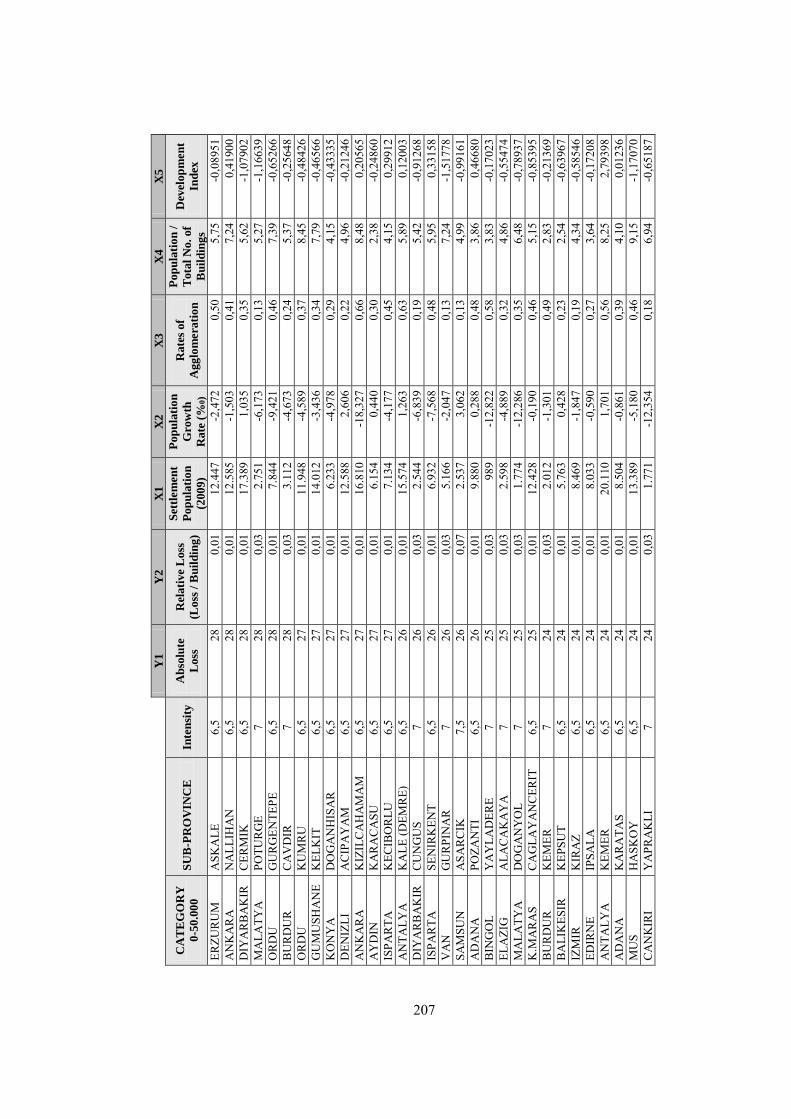
Y
1
Y2
X
1
X2
X
3
X4
X
5
CA
TE
GO
RY
0-5
0.0
00
SU
B-P
RO
VIN
CE
In
ten
sity
A
bso
lute
Loss
Rel
ati
ve
Loss
(Loss
/ B
uil
din
g)
Set
tlem
en
t
Pop
ula
tio
n
(200
9)
Pop
ula
tio
n
Gro
wth
Rate
(%
0)
Rate
s of
Ag
glo
mera
tio
n
Pop
ula
tio
n /
Tota
l N
o.
of
Bu
ild
ing
s
Dev
elop
men
t
Ind
ex
ERZU
RU
M
ASK
ALE
6,
5 28
0,
01
12.4
47
-2,4
72
0,50
5,
75
-0,0
8951
A
NK
AR
A
NA
LLIH
AN
6,
5 28
0,
01
12.5
85
-1,5
03
0,41
7,
24
0,41
900
DIY
AR
BA
KIR
C
ERM
IK
6,5
28
0,01
17
.389
1,
035
0,35
5,
62
-1,0
7902
M
ALA
TYA
PO
TUR
GE
7 28
0,
03
2.75
1 -6
,173
0,
13
5,27
-1
,166
39
OR
DU
G
UR
GEN
TEPE
6,
5 28
0,
01
7.84
4 -9
,421
0,
46
7,39
-0
,652
66
BU
RD
UR
C
AV
DIR
7
28
0,03
3.
112
-4,6
73
0,24
5,
37
-0,2
5648
O
RD
U
KU
MR
U
6,5
27
0,01
11
.948
-4
,589
0,
37
8,45
-0
,484
26
GU
MU
SHA
NE
KEL
KIT
6,
5 27
0,
01
14.0
12
-3,4
36
0,34
7,
79
-0,4
6566
K
ON
YA
D
OG
AN
HIS
AR
6,
5 27
0,
01
6.23
3 -4
,978
0,
29
4,15
-0
,433
35
DEN
IZLI
A
CIP
AY
AM
6,
5 27
0,
01
12.5
88
2,60
6 0,
22
4,96
-0
,212
46
AN
KA
RA
K
IZIL
CA
HA
MA
M
6,5
27
0,01
16
.810
-1
8,32
7 0,
66
8,48
0,
2056
5 A
YD
IN
KA
RA
CA
SU
6,5
27
0,01
6.
154
0,44
0 0,
30
2,38
-0
,248
60
ISPA
RTA
K
ECIB
OR
LU
6,5
27
0,01
7.
134
-4,1
77
0,45
4,
15
0,29
912
AN
TALY
A
KA
LE (D
EMR
E)
6,5
26
0,01
15
.574
1,
263
0,63
5,
89
0,12
003
DIY
AR
BA
KIR
C
UN
GU
S 7
26
0,03
2.
544
-6,8
39
0,19
5,
42
-0,9
1268
IS
PAR
TA
SEN
IRK
ENT
6,5
26
0,01
6.
932
-7,5
68
0,48
5,
95
0,33
158
VA
N
GU
RPI
NA
R
7 26
0,
03
5.16
6 -2
,047
0,
13
7,24
-1
,517
78
SAM
SUN
A
SAR
CIK
7,
5 26
0,
07
2.53
7 3,
062
0,13
4,
99
-0,9
9161
A
DA
NA
PO
ZAN
TI
6,5
26
0,01
9.
880
0,28
8 0,
48
3,86
0,
4668
0 B
ING
OL
YA
YLA
DER
E 7
25
0,03
98
9 -1
2,82
2 0,
58
3,83
-0
,170
23
ELA
ZIG
A
LAC
AK
AY
A
7 25
0,
03
2.59
8 -4
,889
0,
32
4,86
-0
,554
74
MA
LATY
A
DO
GA
NY
OL
7 25
0,
03
1.77
4 -1
2,28
6 0,
35
6,48
-0
,789
37
K.M
AR
AS
CA
GLA
YA
NC
ERIT
6,
5 25
0,
01
12.4
28
-0,1
90
0,46
5,
15
-0,8
5395
B
UR
DU
R
KEM
ER
7 24
0,
03
2.01
2 -1
,301
0,
49
2,83
-0
,213
69
BA
LIK
ESIR
K
EPSU
T 6,
5 24
0,
01
5.76
3 0,
428
0,23
2,
54
-0,6
3967
IZ
MIR
K
IRA
Z 6,
5 24
0,
01
8.46
9 -1
,847
0,
19
4,34
-0
,585
46
EDIR
NE
IPSA
LA
6,5
24
0,01
8.
033
-0,5
90
0,27
3,
64
-0,1
7208
A
NTA
LYA
K
EMER
6,
5 24
0,
01
20.1
10
1,70
1 0,
56
8,25
2,
7939
8 A
DA
NA
K
AR
ATA
S 6,
5 24
0,
01
8.50
4 -0
,861
0,
39
4,10
0,
0123
6 M
US
HA
SKO
Y
6,5
24
0,01
13
.389
-5
,180
0,
46
9,15
-1
,170
70
CA
NK
IRI
YA
PRA
KLI
7
24
0,03
1.
771
-12,
354
0,18
6,
94
-0,6
5187
207

Y
1
Y2
X
1
X2
X
3
X4
X
5
CA
TE
GO
RY
0-5
0.0
00
SU
B-P
RO
VIN
CE
In
ten
sity
A
bso
lute
Loss
Rel
ati
ve
Loss
(Loss
/ B
uil
din
g)
Set
tlem
en
t
Pop
ula
tio
n
(200
9)
Pop
ula
tio
n
Gro
wth
Rate
(%
0)
Rate
s of
Ag
glo
mera
tio
n
Pop
ula
tio
n /
Tota
l N
o.
of
Bu
ild
ing
s
Dev
elop
men
t
Ind
ex
AD
AN
A
KA
RA
ISA
LI
6,5
24
0,01
7.
307
0,66
4 0,
32
3,01
-0
,614
22
IZM
IR
BEY
DA
G
6,5
23
0,01
5.
710
0,37
4 0,
44
2,63
-0
,222
76
BIT
LIS
GU
RO
YM
AK
6,
5 23
0,
01
20.2
26
-1,1
94
0,46
9,
84
-1,1
9314
M
UG
LA
KO
YC
EGIZ
6,
5 23
0,
01
8.67
7 1,
586
0,26
3,
25
0,17
722
AY
DIN
K
UY
UC
AK
6,
5 23
0,
01
7.70
1 0,
622
0,26
3,
48
-0,1
0149
B
OLU
SE
BEN
7
23
0,03
2.
822
-4,7
67
0,44
5,
74
-0,1
6630
A
NTA
LYA
FI
NIK
E 6,
5 23
0,
01
11.1
99
1,54
4 0,
24
5,56
0,
3402
1 EL
AZI
G
KA
RA
KO
CA
N
6,5
22
0,01
12
.708
-7
,062
0,
44
11,9
0 -0
,503
82
SIN
OP
DU
RA
GA
N
6,5
22
0,01
7.
442
-2,9
73
0,34
6,
11
-1,0
2911
A
YD
IN
KO
SK
6,5
22
0,01
9.
854
1,84
2 0,
36
4,16
-0
,144
65
AFY
ON
B
ASM
AK
CI
6,5
22
0,01
5.
681
-3,5
45
0,52
3,
76
-0,0
8177
M
UG
LA
ULA
6,
5 22
0,
01
5.60
2 0,
706
0,23
2,
44
0,37
142
ISPA
RTA
U
LUB
OR
LU
6,5
21
0,01
6.
520
-6,5
13
0,86
5,
71
1,40
411
VA
N
GEV
AS
6,5
21
0,01
10
.432
-0
,577
0,
35
5,28
-0
,912
17
GA
ZIA
NTE
P A
RA
BA
N
6,5
21
0,01
9.
758
-0,9
89
0,31
5,
14
-0,7
4659
ER
ZIN
CA
N
KEM
AH
7
21
0,03
1.
929
-4,3
84
0,30
4,
25
-0,6
3593
A
FYO
N
SULT
AN
DA
GI
6,5
20
0,01
6.
288
-1,0
21
0,34
3,
78
-0,2
4347
A
YD
IN
BU
HA
RK
ENT
6,5
20
0,01
6.
891
-0,2
91
0,54
4,
06
0,31
566
BA
LIK
ESIR
B
ALY
A
7 20
0,
03
1.90
1 -0
,087
0,
12
2,93
-0
,683
18
DU
ZCE
YIG
ILC
A
7 20
0,
04
3.14
1 -1
,904
0,
17
6,72
-0
,788
58
MA
LATY
A
DO
GA
NSE
HIR
6,
5 20
0,
01
10.8
00
-2,4
93
0,26
7,
33
-0,6
1192
B
UR
SA
OR
HA
NEL
I 6,
5 20
0,
01
7.93
4 -0
,190
0,
33
4,71
-0
,226
01
OR
DU
A
KK
US
7 20
0,
03
5.74
6 -4
,696
0,
20
15,3
3 -1
,072
61
USA
K
ULU
BEY
6,
5 19
0,
01
4.94
5 -0
,412
0,
33
2,99
-0
,357
92
AD
IYA
MA
N
SIN
CIK
7
19
0,03
4.
331
-2,1
89
0,21
8,
27
-1,3
8337
D
ENIZ
LI
AK
KO
Y
7 19
0,
03
2.75
5 0,
158
0,50
4,
28
0,04
098
AY
DIN
SU
LTA
NH
ISA
R
6,5
19
0,01
6.
229
-0,0
48
0,29
3,
69
-0,0
0602
B
ILEC
IK
PAZA
RY
ERI
6,5
19
0,01
6.
481
-0,3
01
0,56
3,
68
0,20
538
MU
S K
OR
KU
T 7
19
0,03
3.
102
-7,5
77
0,11
9,
82
-1,4
5230
A
FYO
N
CO
BA
NLA
R
6,5
19
0,01
8.
774
0,59
7 0,
65
4,54
-0
,507
27
DEN
IZLI
B
EKIL
LI
6,5
19
0,01
3.
481
-1,3
51
0,42
2,
16
-0,2
3477
208
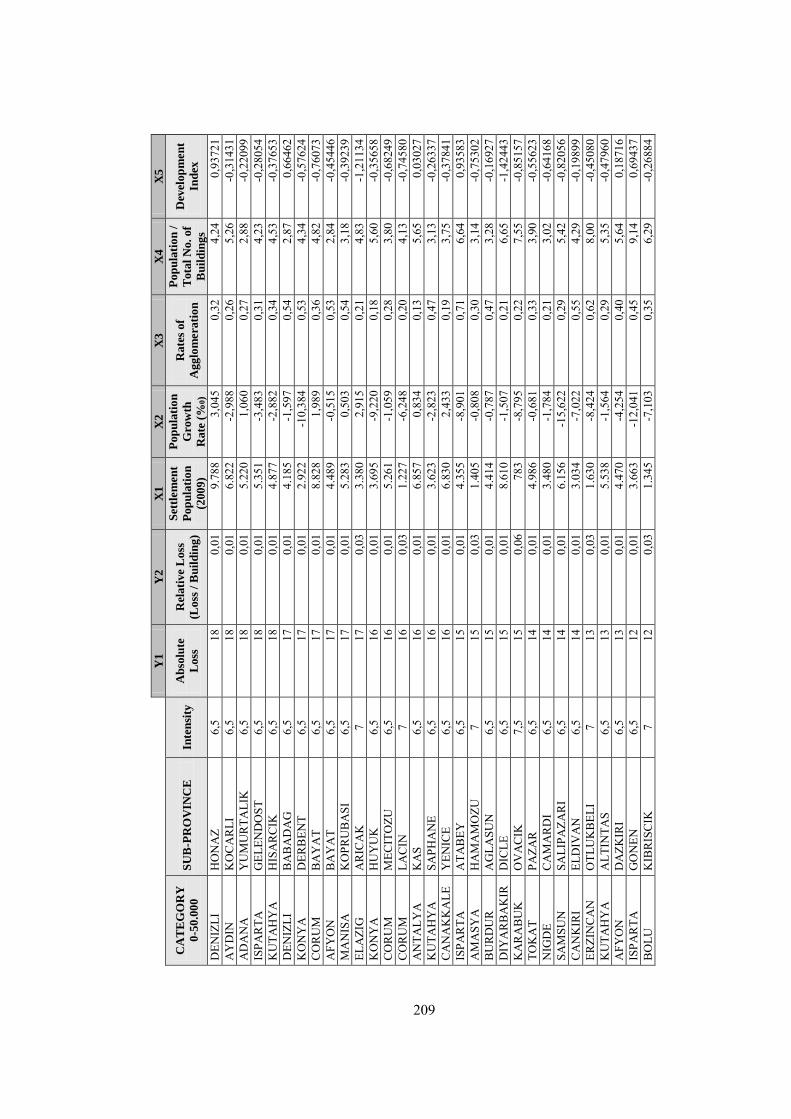
Y
1
Y2
X
1
X2
X
3
X4
X
5
CA
TE
GO
RY
0-5
0.0
00
SU
B-P
RO
VIN
CE
In
ten
sity
A
bso
lute
Loss
Rel
ati
ve
Loss
(Loss
/ B
uil
din
g)
Set
tlem
en
t
Pop
ula
tio
n
(200
9)
Pop
ula
tio
n
Gro
wth
Rate
(%
0)
Rate
s of
Ag
glo
mera
tio
n
Pop
ula
tio
n /
Tota
l N
o.
of
Bu
ild
ing
s
Dev
elop
men
t
Ind
ex
DEN
IZLI
H
ON
AZ
6,5
18
0,01
9.
788
3,04
5 0,
32
4,24
0,
9372
1 A
YD
IN
KO
CA
RLI
6,
5 18
0,
01
6.82
2 -2
,988
0,
26
5,26
-0
,314
31
AD
AN
A
YU
MU
RTA
LIK
6,
5 18
0,
01
5.22
0 1,
060
0,27
2,
88
-0,2
2099
IS
PAR
TA
GEL
END
OST
6,
5 18
0,
01
5.35
1 -3
,483
0,
31
4,23
-0
,280
54
KU
TAH
YA
H
ISA
RC
IK
6,5
18
0,01
4.
877
-2,8
82
0,34
4,
53
-0,3
7653
D
ENIZ
LI
BA
BA
DA
G
6,5
17
0,01
4.
185
-1,5
97
0,54
2,
87
0,66
462
KO
NY
A
DER
BEN
T 6,
5 17
0,
01
2.92
2 -1
0,38
4 0,
53
4,34
-0
,576
24
CO
RU
M
BA
YA
T 6,
5 17
0,
01
8.82
8 1,
989
0,36
4,
82
-0,7
6073
A
FYO
N
BA
YA
T 6,
5 17
0,
01
4.48
9 -0
,515
0,
53
2,84
-0
,454
46
MA
NIS
A
KO
PRU
BA
SI
6,5
17
0,01
5.
283
0,50
3 0,
54
3,18
-0
,392
39
ELA
ZIG
A
RIC
AK
7
17
0,03
3.
380
2,91
5 0,
21
4,83
-1
,211
34
KO
NY
A
HU
YU
K
6,5
16
0,01
3.
695
-9,2
20
0,18
5,
60
-0,3
5658
C
OR
UM
M
ECIT
OZU
6,
5 16
0,
01
5.26
1 -1
,059
0,
28
3,80
-0
,682
49
CO
RU
M
LAC
IN
7 16
0,
03
1.22
7 -6
,248
0,
20
4,13
-0
,745
80
AN
TALY
A
KA
S 6,
5 16
0,
01
6.85
7 0,
834
0,13
5,
65
0,03
027
KU
TAH
YA
SA
PHA
NE
6,5
16
0,01
3.
623
-2,8
23
0,47
3,
13
-0,2
6337
C
AN
AK
KA
LE
YEN
ICE
6,5
16
0,01
6.
830
2,43
3 0,
19
3,75
-0
,378
41
ISPA
RTA
A
TAB
EY
6,5
15
0,01
4.
355
-8,9
01
0,71
6,
64
0,93
583
AM
ASY
A
HA
MA
MO
ZU
7 15
0,
03
1.40
5 -0
,808
0,
30
3,14
-0
,753
02
BU
RD
UR
A
GLA
SUN
6,
5 15
0,
01
4.41
4 -0
,787
0,
47
3,28
-0
,169
27
DIY
AR
BA
KIR
D
ICLE
6,
5 15
0,
01
8.61
0 -1
,507
0,
21
6,65
-1
,424
43
KA
RA
BU
K
OV
AC
IK
7,5
15
0,06
78
3 -8
,795
0,
22
7,55
-0
,851
57
TOK
AT
PAZA
R
6,5
14
0,01
4.
986
-0,6
81
0,33
3,
90
-0,5
5623
N
IGD
E C
AM
AR
DI
6,5
14
0,01
3.
480
-1,7
84
0,21
3,
02
-0,6
4168
SA
MSU
N
SALI
PAZA
RI
6,5
14
0,01
6.
156
-15,
622
0,29
5,
42
-0,8
2056
C
AN
KIR
I EL
DIV
AN
6,
5 14
0,
01
3.03
4 -7
,022
0,
55
4,29
-0
,198
99
ERZI
NC
AN
O
TLU
KB
ELI
7 13
0,
03
1.63
0 -8
,424
0,
62
8,00
-0
,450
80
KU
TAH
YA
A
LTIN
TAS
6,5
13
0,01
5.
538
-1,5
64
0,29
5,
35
-0,4
7960
A
FYO
N
DA
ZKIR
I 6,
5 13
0,
01
4.47
0 -4
,254
0,
40
5,64
0,
1871
6 IS
PAR
TA
GO
NEN
6,
5 12
0,
01
3.66
3 -1
2,04
1 0,
45
9,14
0,
6943
7 B
OLU
K
IBR
ISC
IK
7 12
0,
03
1.34
5 -7
,103
0,
35
6,29
-0
,268
84
209

Y
1
Y2
X
1
X2
X
3
X4
X
5
CA
TE
GO
RY
0-5
0.0
00
SU
B-P
RO
VIN
CE
In
ten
sity
A
bso
lute
Loss
Rel
ati
ve
Loss
(Loss
/ B
uil
din
g)
Set
tlem
en
t
Pop
ula
tio
n
(200
9)
Pop
ula
tio
n
Gro
wth
Rate
(%
0)
Rate
s of
Ag
glo
mera
tio
n
Pop
ula
tio
n /
Tota
l N
o.
of
Bu
ild
ing
s
Dev
elop
men
t
Ind
ex
KO
NY
A
TUZL
UK
CU
6,
5 12
0,
01
3.91
2 -4
,462
0,
49
4,80
-0
,465
94
SIN
OP
SAR
AY
DU
ZU
7 12
0,
03
951
-14,
179
0,19
8,
78
-0,6
7727
K
UTA
HY
A
PAZA
RLA
R
6,5
12
0,01
3.
660
-4,4
34
0,58
4,
95
-0,3
8982
O
RD
U
CA
TALP
INA
R
6,5
11
0,01
5.
333
-7,2
76
0,33
10
,28
-0,5
6750
SA
KA
RY
A
KA
YN
AR
CA
6,
5 11
0,
01
5.14
4 0,
174
0,22
5,
56
-0,2
2225
A
FYO
N
EVC
ILER
6,
5 11
0,
01
4.14
2 -2
,386
0,
50
4,79
-0
,196
77
ERZU
RU
M
TEK
MA
N
6,5
11
0,01
3.
957
-5,2
55
0,13
6,
11
-1,6
2149
D
ENIZ
LI
CA
MEL
I 6,
5 9
0,01
2.
837
0,38
7 0,
14
3,21
-0
,701
80
GA
ZIA
NTE
P Y
AV
UZE
LI
6,5
9 0,
01
4.09
3 -7
,083
0,
47
8,52
-0
,900
75
BU
RSA
K
ELES
6,
5 9
0,01
3.
681
0,13
7 0,
24
4,16
-0
,516
16
CA
NK
IRI
SAB
AN
OZU
6,
5 9
0,01
5.
124
-1,7
46
0,44
6,
68
0,11
004
AY
DIN
K
AR
PUZL
U
6,5
9 0,
01
2.11
6 -1
,013
0,
17
2,69
-0
,628
09
CO
RU
M
OR
TAK
OY
6,
5 9
0,01
2.
945
-1,4
28
0,31
4,
02
-0,6
5301
B
UR
DU
R
CEL
TIK
CI
6,5
9 0,
01
2.37
4 -0
,725
0,
38
2,96
-0
,160
90
AD
IYA
MA
N
GER
GER
6,
5 9
0,01
3.
242
-2,9
37
0,13
4,
69
-1,4
6753
K
UTA
HY
A
CA
VD
AR
HIS
AR
6,
5 8
0,01
2.
412
-7,3
82
0,28
5,
79
-0,5
0739
D
ENIZ
LI
BEY
AG
AC
6,
5 8
0,01
2.
664
-0,5
09
0,37
3,
46
-0,3
6165
ES
KIS
EHIR
M
IHA
LGA
ZI
6,5
8 0,
01
1.95
1 -1
5,12
8 0,
48
9,95
0,
1638
5 O
SMA
NIY
E SU
MB
AS
6,5
7 0,
01
2.11
4 0,
058
0,13
2,
87
-0,8
6007
A
FYO
N
IHSA
NIY
E 6,
5 7
0,01
2.
341
-7,1
77
0,08
6,
28
-0,5
4316
TU
NC
ELI
OV
AC
IK
6,5
7 0,
01
3.22
7 -6
,721
0,
54
9,20
-0
,104
44
MA
LATY
A
KA
LE
6,5
7 0,
01
2.03
0 -7
,441
0,
30
5,88
-0
,778
07
AM
ASY
A
GO
YN
UC
EK
6,5
7 0,
01
2.42
1 -1
,520
0,
20
4,48
-0
,776
16
KU
TAH
YA
D
UM
LUPI
NA
R
6,5
6 0,
01
1.43
8 -9
,263
0,
44
5,53
-0
,230
04
VA
N
SAR
AY
6,
5 6
0,01
3.
591
-3,4
10
0,15
8,
34
-1,4
1712
K
ON
YA
A
KO
REN
6,
5 6
0,00
3.
442
0 0,
47
9,02
-0
,280
35
BIL
ECIK
IN
HIS
AR
6,
5 5
0,01
1.
085
-8,4
35
0,33
4,
49
-0,4
4544
B
ILEC
IK
YEN
IPA
ZAR
6,
5 5
0,01
1.
115
-2,2
80
0,30
2,
89
-0,5
5126
ES
KIS
EHIR
SA
RIC
AK
AY
A
6,5
5 0,
01
2.15
0 -1
4,51
9 0,
41
8,18
-0
,077
44
KU
TAH
YA
A
SLA
NA
PA
6,5
5 0,
01
1.89
3 -2
,393
0,
17
4,86
-0
,728
82
TUN
CEL
I N
AZI
MIY
E 6,
5 4
0,01
1.
636
-6,4
18
0,51
9,
31
-0,3
4895
210
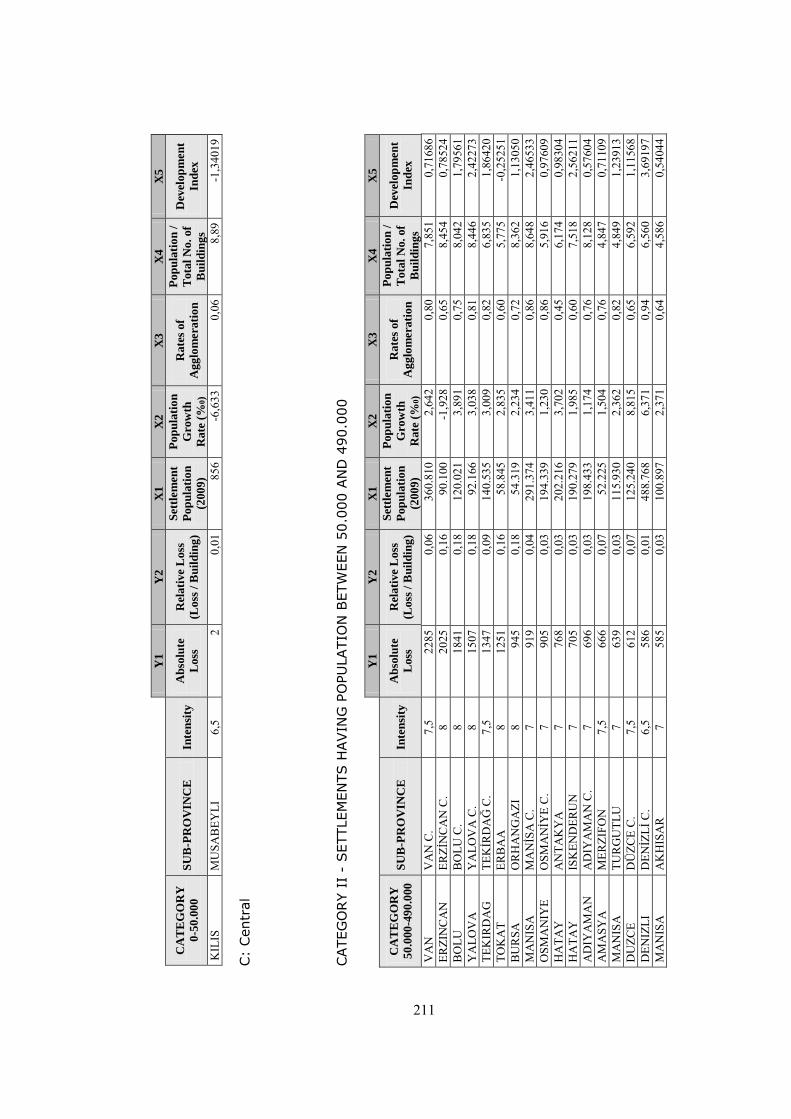
Y
1
Y2
X
1
X2
X
3
X4
X
5
CA
TE
GO
RY
0-5
0.0
00
SU
B-P
RO
VIN
CE
In
ten
sity
A
bso
lute
Loss
Rel
ati
ve
Loss
(Loss
/ B
uil
din
g)
Set
tlem
en
t
Pop
ula
tio
n
(200
9)
Pop
ula
tio
n
Gro
wth
Rate
(%
0)
Rate
s of
Ag
glo
mera
tio
n
Pop
ula
tio
n /
Tota
l N
o.
of
Bu
ild
ing
s
Dev
elop
men
t
Ind
ex
KIL
IS
MU
SAB
EYLI
6,
5 2
0,01
85
6 -6
,633
0,
06
8,89
-1
,340
19
C:
Centr
al
CATEG
OR
Y I
I -
SETTLEM
EN
TS H
AVIN
G P
OPU
LATIO
N B
ETW
EEN
50.0
00 A
ND
490.0
00
Y
1
Y2
X
1
X2
X
3
X4
X
5
CA
TE
GO
RY
50
.000
-49
0.0
00
SU
B-P
RO
VIN
CE
In
ten
sity
A
bso
lute
Loss
Rel
ati
ve
Loss
(Loss
/ B
uil
din
g)
Set
tlem
en
t
Pop
ula
tio
n
(200
9)
Pop
ula
tio
n
Gro
wth
Rate
(%
0)
Rate
s of
Ag
glo
mera
tio
n
Pop
ula
tio
n /
Tota
l N
o.
of
Bu
ild
ing
s
Dev
elop
men
t
Ind
ex
VA
N
VA
N C
. 7,
5 22
85
0,06
36
0.81
0 2,
642
0,80
7,
851
0,71
686
ERZI
NC
AN
ER
ZİN
CA
N C
. 8
2025
0,
16
90.1
00
-1,9
28
0,65
8,
454
0,78
524
BO
LU
BO
LU C
. 8
1841
0,
18
120.
021
3,89
1 0,
75
8,04
2 1,
7956
1 Y
ALO
VA
Y
ALO
VA
C.
8 15
07
0,18
92
.166
3,
038
0,81
8,
446
2,42
273
TEK
IRD
AG
TE
KİR
DA
Ğ C
. 7,
5 13
47
0,09
14
0.53
5 3,
009
0,82
6,
835
1,86
420
TOK
AT
ERB
AA
8
1251
0,
16
58.8
45
2,83
5 0,
60
5,77
5 -0
,252
51
BU
RSA
O
RH
AN
GA
ZI
8 94
5 0,
18
54.3
19
2,23
4 0,
72
8,36
2 1,
1305
0 M
AN
ISA
M
AN
İSA
C.
7 91
9 0,
04
291.
374
3,41
1 0,
86
8,64
8 2,
4653
3 O
SMA
NIY
E O
SMA
NİY
E C
. 7
905
0,03
19
4.33
9 1,
230
0,86
5,
916
0,97
609
HA
TAY
A
NTA
KY
A
7 76
8 0,
03
202.
216
3,70
2 0,
45
6,17
4 0,
9830
4 H
ATA
Y
ISK
END
ERU
N
7 70
5 0,
03
190.
279
1,98
5 0,
60
7,51
8 2,
5621
1 A
DIY
AM
AN
A
DIY
AM
AN
C.
7 69
6 0,
03
198.
433
1,17
4 0,
76
8,12
8 0,
5760
4 A
MA
SYA
M
ERZI
FON
7,
5 66
6 0,
07
52.2
25
1,50
4 0,
76
4,84
7 0,
7110
9 M
AN
ISA
TU
RG
UTL
U
7 63
9 0,
03
115.
930
2,36
2 0,
82
4,84
9 1,
2391
3 D
UZC
E D
ÜZC
E C
. 7,
5 61
2 0,
07
125.
240
8,81
5 0,
65
6,59
2 1,
1156
8 D
ENIZ
LI
DEN
İZLİ
C.
6,5
586
0,01
48
8.76
8 6,
371
0,94
6,
560
3,69
197
MA
NIS
A
AK
HIS
AR
7
585
0,03
10
0.89
7 2,
371
0,64
4,
586
0,54
044
211
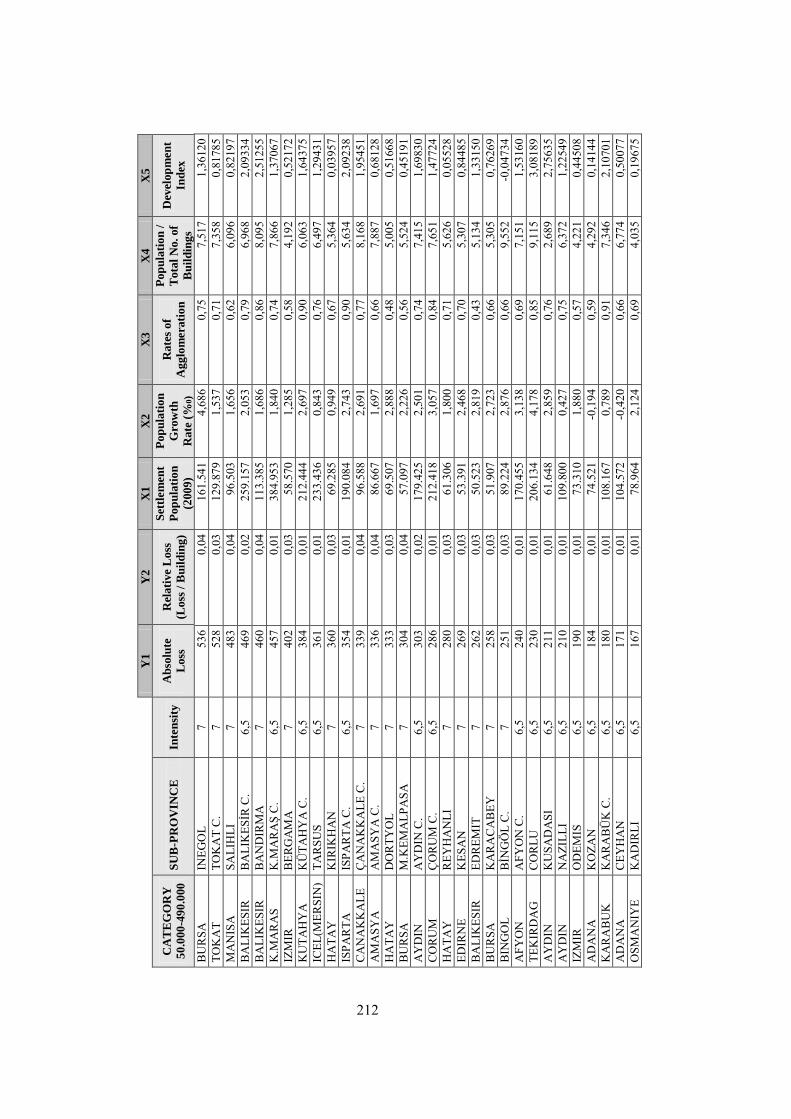
Y
1
Y2
X
1
X2
X
3
X4
X
5
CA
TE
GO
RY
50
.000
-49
0.0
00
SU
B-P
RO
VIN
CE
In
ten
sity
A
bso
lute
Loss
Rel
ati
ve
Loss
(Loss
/ B
uil
din
g)
Set
tlem
en
t
Pop
ula
tio
n
(200
9)
Pop
ula
tio
n
Gro
wth
Rate
(%
0)
Rate
s of
Ag
glo
mera
tio
n
Pop
ula
tio
n /
Tota
l N
o.
of
Bu
ild
ing
s
Dev
elop
men
t
Ind
ex
BU
RSA
IN
EGO
L 7
536
0,04
16
1.54
1 4,
686
0,75
7,
517
1,36
120
TOK
AT
TOK
AT
C.
7 52
8 0,
03
129.
879
1,53
7 0,
71
7,35
8 0,
8178
5 M
AN
ISA
SA
LIH
LI
7 48
3 0,
04
96.5
03
1,65
6 0,
62
6,09
6 0,
8219
7 B
ALI
KES
IR
BA
LIK
ESİR
C.
6,5
469
0,02
25
9.15
7 2,
053
0,79
6,
968
2,09
334
BA
LIK
ESIR
B
AN
DIR
MA
7
460
0,04
11
3.38
5 1,
686
0,86
8,
095
2,51
255
K.M
AR
AS
K.M
AR
AŞ
C.
6,5
457
0,01
38
4.95
3 1,
840
0,74
7,
866
1,37
067
IZM
IR
BER
GA
MA
7
402
0,03
58
.570
1,
285
0,58
4,
192
0,52
172
KU
TAH
YA
K
ÜTA
HY
A C
. 6,
5 38
4 0,
01
212.
444
2,69
7 0,
90
6,06
3 1,
6437
5 IC
EL(M
ERSI
N)
TAR
SUS
6,5
361
0,01
23
3.43
6 0,
843
0,76
6,
497
1,29
431
HA
TAY
K
IRIK
HA
N
7 36
0 0,
03
69.2
85
0,94
9 0,
67
5,36
4 0,
0395
7 IS
PAR
TA
ISPA
RTA
C.
6,5
354
0,01
19
0.08
4 2,
743
0,90
5,
634
2,09
238
CA
NA
KK
ALE
Ç
AN
AK
KA
LE C
. 7
339
0,04
96
.588
2,
691
0,77
8,
168
1,95
451
AM
ASY
A
AM
ASY
A C
. 7
336
0,04
86
.667
1,
697
0,66
7,
887
0,68
128
HA
TAY
D
OR
TYO
L 7
333
0,03
69
.507
2,
888
0,48
5,
005
0,51
668
BU
RSA
M
.KEM
ALP
ASA
7
304
0,04
57
.097
2,
226
0,56
5,
524
0,45
191
AY
DIN
A
YD
IN C
. 6,
5 30
3 0,
02
179.
425
2,50
1 0,
74
7,41
5 1,
6983
0 C
OR
UM
Ç
OR
UM
C.
6,5
286
0,01
21
2.41
8 3,
057
0,84
7,
651
1,47
724
HA
TAY
R
EYH
AN
LI
7 28
0 0,
03
61.3
06
1,80
0 0,
71
5,62
6 0,
0552
8 ED
IRN
E K
ESA
N
7 26
9 0,
03
53.3
91
2,46
8 0,
70
5,30
7 0,
8448
5 B
ALI
KES
IR
EDR
EMIT
7
262
0,03
50
.523
2,
819
0,43
5,
134
1,33
150
BU
RSA
K
AR
AC
AB
EY
7 25
8 0,
03
51.9
07
2,72
3 0,
66
5,30
5 0,
7626
9 B
ING
OL
BİN
GÖ
L C
. 7
251
0,03
89
.224
2,
876
0,66
9,
552
-0,0
4734
A
FYO
N
AFY
ON
C.
6,5
240
0,01
17
0.45
5 3,
138
0,69
7,
151
1,53
160
TEK
IRD
AG
C
OR
LU
6,5
230
0,01
20
6.13
4 4,
178
0,85
9,
115
3,08
189
AY
DIN
K
USA
DA
SI
6,5
211
0,01
61
.648
2,
859
0,76
2,
689
2,75
635
AY
DIN
N
AZI
LLI
6,5
210
0,01
10
9.80
0 0,
427
0,75
6,
372
1,22
549
IZM
IR
OD
EMIS
6,
5 19
0 0,
01
73.3
10
1,88
0 0,
57
4,22
1 0,
4450
8 A
DA
NA
K
OZA
N
6,5
184
0,01
74
.521
-0
,194
0,
59
4,29
2 0,
1414
4 K
AR
AB
UK
K
AR
AB
ÜK
C.
6,5
180
0,01
10
8.16
7 0,
789
0,91
7,
346
2,10
701
AD
AN
A
CEY
HA
N
6,5
171
0,01
10
4.57
2 -0
,420
0,
66
6,77
4 0,
5007
7 O
SMA
NIY
E K
AD
IRLI
6,
5 16
7 0,
01
78.9
64
2,12
4 0,
69
4,03
5 0,
1967
5
212
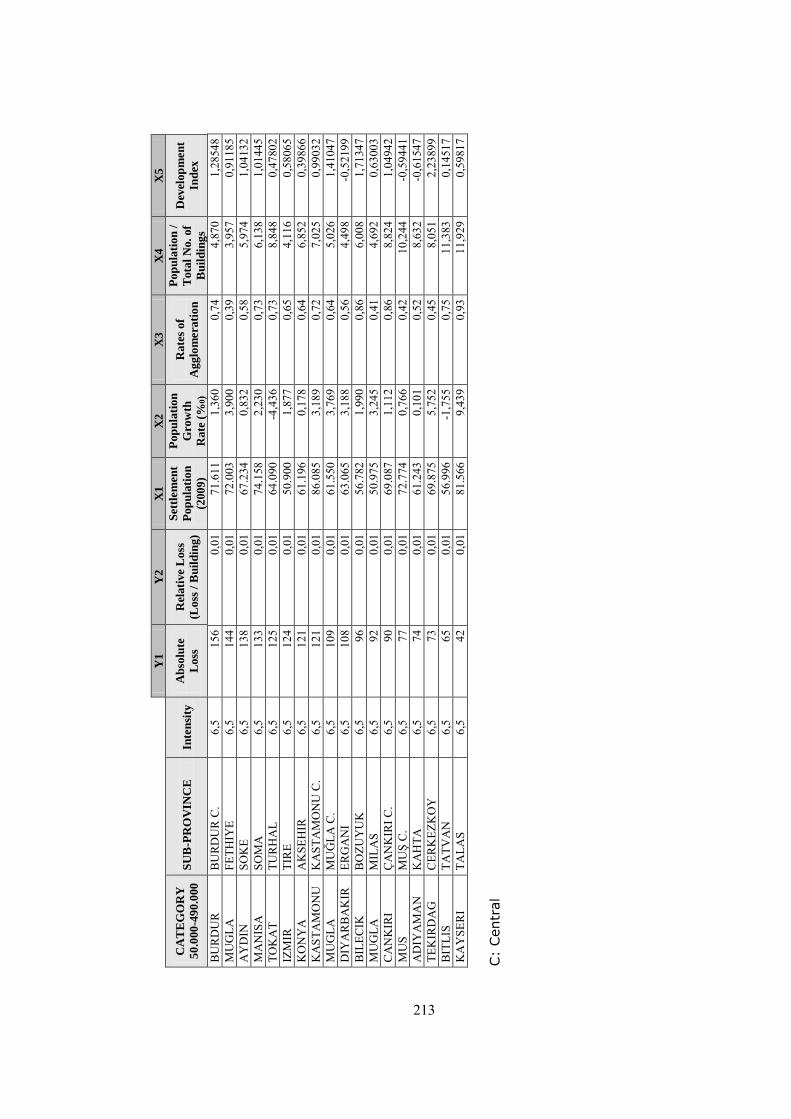
Y
1
Y2
X
1
X2
X
3
X4
X
5
CA
TE
GO
RY
50
.000
-49
0.0
00
SU
B-P
RO
VIN
CE
In
ten
sity
A
bso
lute
Loss
Rel
ati
ve
Loss
(Loss
/ B
uil
din
g)
Set
tlem
en
t
Pop
ula
tio
n
(200
9)
Pop
ula
tio
n
Gro
wth
Rate
(%
0)
Rate
s of
Ag
glo
mera
tio
n
Pop
ula
tio
n /
Tota
l N
o.
of
Bu
ild
ing
s
Dev
elop
men
t
Ind
ex
BU
RD
UR
B
UR
DU
R C
. 6,
5 15
6 0,
01
71.6
11
1,36
0 0,
74
4,87
0 1,
2854
8 M
UG
LA
FETH
IYE
6,5
144
0,01
72
.003
3,
900
0,39
3,
957
0,91
185
AY
DIN
SO
KE
6,5
138
0,01
67
.234
0,
832
0,58
5,
974
1,04
132
MA
NIS
A
SOM
A
6,5
133
0,01
74
.158
2,
230
0,73
6,
138
1,01
445
TOK
AT
TUR
HA
L 6,
5 12
5 0,
01
64.0
90
-4,4
36
0,73
8,
848
0,47
802
IZM
IR
TIR
E 6,
5 12
4 0,
01
50.9
00
1,87
7 0,
65
4,11
6 0,
5806
5 K
ON
YA
A
KSE
HIR
6,
5 12
1 0,
01
61.1
96
0,17
8 0,
64
6,85
2 0,
3986
6 K
AST
AM
ON
U
KA
STA
MO
NU
C.
6,5
121
0,01
86
.085
3,
189
0,72
7,
025
0,99
032
MU
GLA
M
UĞ
LA C
. 6,
5 10
9 0,
01
61.5
50
3,76
9 0,
64
5,02
6 1,
4104
7 D
IYA
RB
AK
IR
ERG
AN
I 6,
5 10
8 0,
01
63.0
65
3,18
8 0,
56
4,49
8 -0
,521
99
BIL
ECIK
B
OZU
YU
K
6,5
96
0,01
56
.782
1,
990
0,86
6,
008
1,71
347
MU
GLA
M
ILA
S 6,
5 92
0,
01
50.9
75
3,24
5 0,
41
4,69
2 0,
6300
3 C
AN
KIR
I Ç
AN
KIR
I C.
6,5
90
0,01
69
.087
1,
112
0,86
8,
824
1,04
942
MU
S M
UŞ
C.
6,5
77
0,01
72
.774
0,
766
0,42
10
,244
-0
,594
41
AD
IYA
MA
N
KA
HTA
6,
5 74
0,
01
61.2
43
0,10
1 0,
52
8,63
2 -0
,615
47
TEK
IRD
AG
C
ERK
EZK
OY
6,
5 73
0,
01
69.8
75
5,75
2 0,
45
8,05
1 2,
2389
9 B
ITLI
S TA
TVA
N
6,5
65
0,01
56
.996
-1
,755
0,
75
11,3
83
0,14
517
KA
YSE
RI
TALA
S 6,
5 42
0,
01
81.5
66
9,43
9 0,
93
11,9
29
0,59
817
C:
Centr
al
213
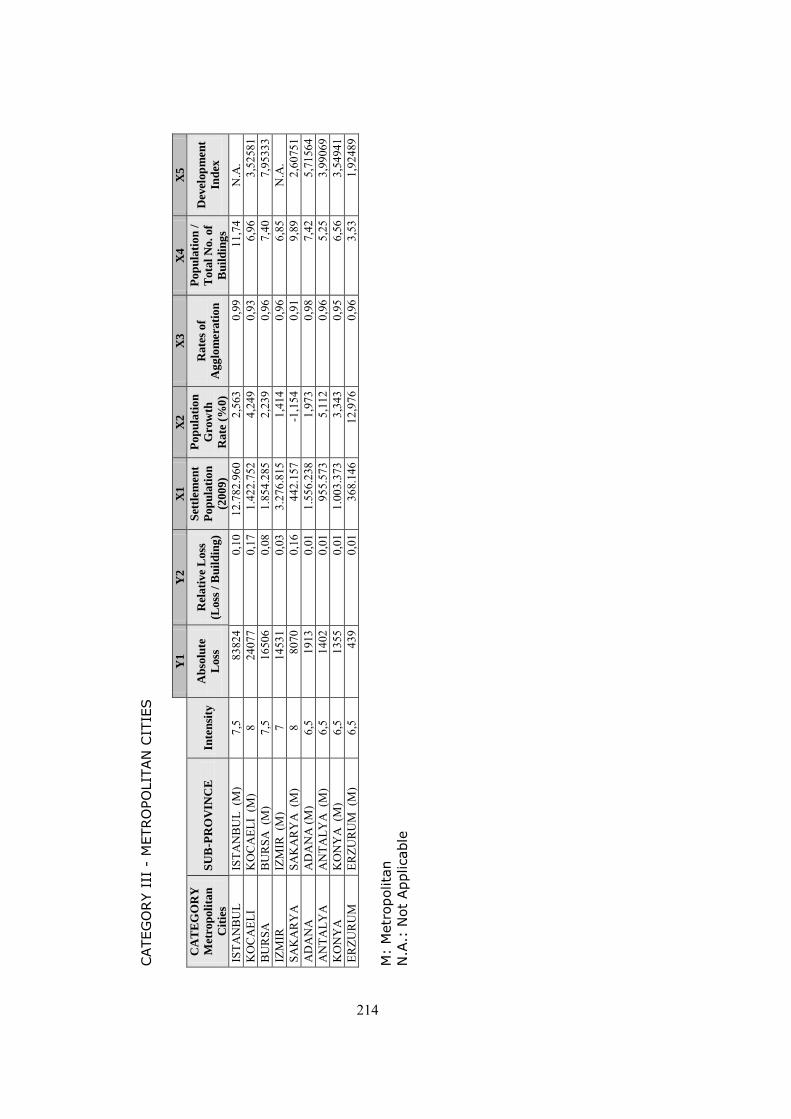
CATEG
OR
Y I
II -
METRO
PO
LIT
AN
CIT
IES
Y1
Y
2
X1
X
2
X3
X
4
X5
CA
TE
GO
RY
Met
rop
oli
tan
Cit
ies
SU
B-P
RO
VIN
CE
In
ten
sity
A
bso
lute
Loss
Rel
ati
ve
Loss
(Loss
/ B
uil
din
g)
Set
tlem
en
t
Pop
ula
tio
n
(200
9)
Pop
ula
tio
n
Gro
wth
Rate
(%
0)
Rate
s of
Ag
glo
mera
tio
n
Pop
ula
tio
n /
Tota
l N
o.
of
Bu
ild
ing
s
Dev
elop
men
t
Ind
ex
ISTA
NB
UL
ISTA
NB
UL
(M)
7,5
8382
4 0,
10
12.7
82.9
60
2,56
3 0,
99
11,7
4 N
.A.
KO
CA
ELI
KO
CA
ELI
(M)
8 24
077
0,17
1.
422.
752
4,24
9 0,
93
6,96
3
,525
81
BU
RSA
B
UR
SA (
M)
7,5
1650
6 0,
08
1.85
4.28
5 2,
239
0,96
7,
40
7,95
333
IZM
IR
IZM
IR (
M)
7 14
531
0,03
3.
276.
815
1,41
4 0,
96
6,85
N
.A.
SAK
AR
YA
SA
KA
RY
A (
M)
8 80
70
0,16
44
2.15
7 -1
,154
0,
91
9,89
2
,607
51
AD
AN
A
AD
AN
A (M
) 6,
5 19
13
0,01
1.
556.
238
1,97
3 0,
98
7,42
5,
7156
4 A
NTA
LYA
A
NTA
LYA
(M
) 6,
5 14
02
0,01
95
5.57
3 5,
112
0,96
5,
25
3,9
9069
K
ON
YA
K
ON
YA
(M
) 6,
5 13
55
0,01
1.
003.
373
3,34
3 0,
95
6,56
3,
5494
1 ER
ZUR
UM
ER
ZUR
UM
(M
) 6,
5 43
9 0,
01
368.
146
12,9
76
0,96
3,
53
1,9
2489
M
: M
etr
opolita
n
N.A
.: N
ot
Applicable
214
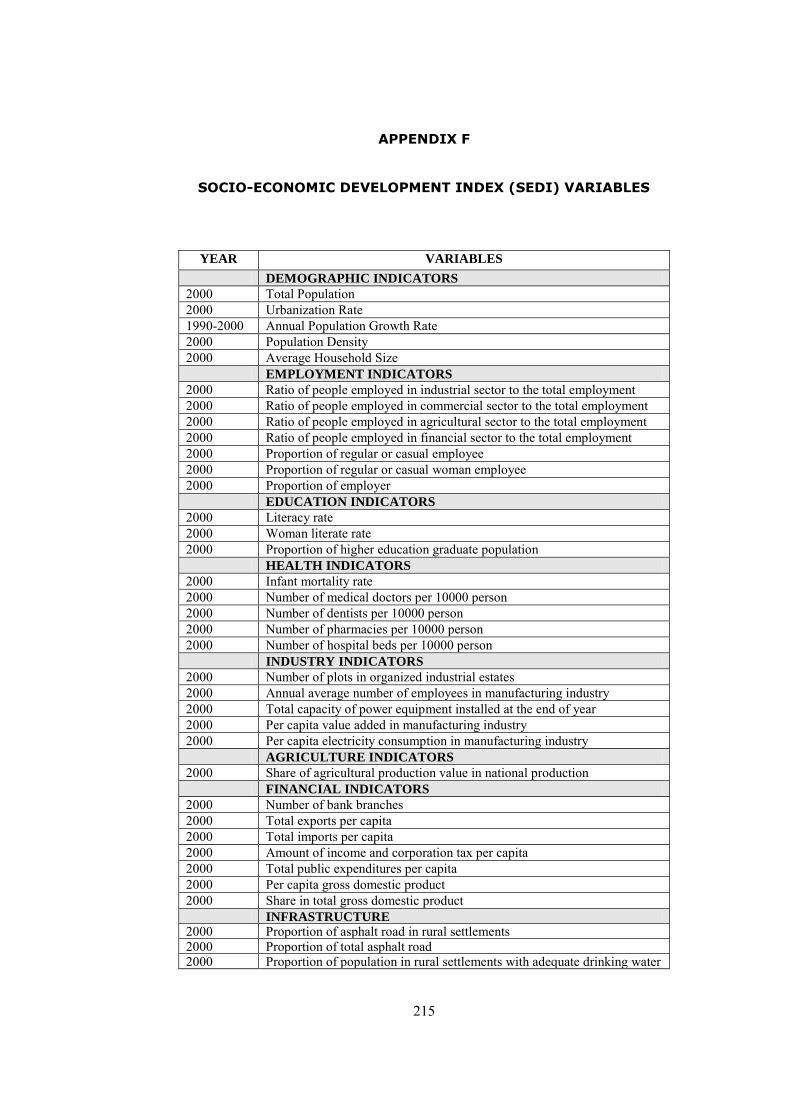
215
APPENDIX F
SOCIO-ECONOMIC DEVELOPMENT INDEX (SEDI) VARIABLES
YEAR VARIABLES
DEMOGRAPHIC INDICATORS
2000 Total Population 2000 Urbanization Rate 1990-2000 Annual Population Growth Rate 2000 Population Density 2000 Average Household Size
EMPLOYMENT INDICATORS
2000 Ratio of people employed in industrial sector to the total employment 2000 Ratio of people employed in commercial sector to the total employment 2000 Ratio of people employed in agricultural sector to the total employment 2000 Ratio of people employed in financial sector to the total employment 2000 Proportion of regular or casual employee 2000 Proportion of regular or casual woman employee 2000 Proportion of employer
EDUCATION INDICATORS
2000 Literacy rate 2000 Woman literate rate 2000 Proportion of higher education graduate population
HEALTH INDICATORS
2000 Infant mortality rate 2000 Number of medical doctors per 10000 person 2000 Number of dentists per 10000 person 2000 Number of pharmacies per 10000 person 2000 Number of hospital beds per 10000 person
INDUSTRY INDICATORS
2000 Number of plots in organized industrial estates 2000 Annual average number of employees in manufacturing industry 2000 Total capacity of power equipment installed at the end of year 2000 Per capita value added in manufacturing industry 2000 Per capita electricity consumption in manufacturing industry
AGRICULTURE INDICATORS
2000 Share of agricultural production value in national production FINANCIAL INDICATORS
2000 Number of bank branches 2000 Total exports per capita 2000 Total imports per capita 2000 Amount of income and corporation tax per capita 2000 Total public expenditures per capita 2000 Per capita gross domestic product 2000 Share in total gross domestic product INFRASTRUCTURE
2000 Proportion of asphalt road in rural settlements 2000 Proportion of total asphalt road 2000 Proportion of population in rural settlements with adequate drinking water
supply

216
OTHER WEALTH INDICATORS
2000 Total telephone counters per person 2000 Total electricity consumption per capita 2000 Number of private cars per 10000 population 2000 Number of motor vehicles per 10000 population 2000 Proportion of population having a card for free health services
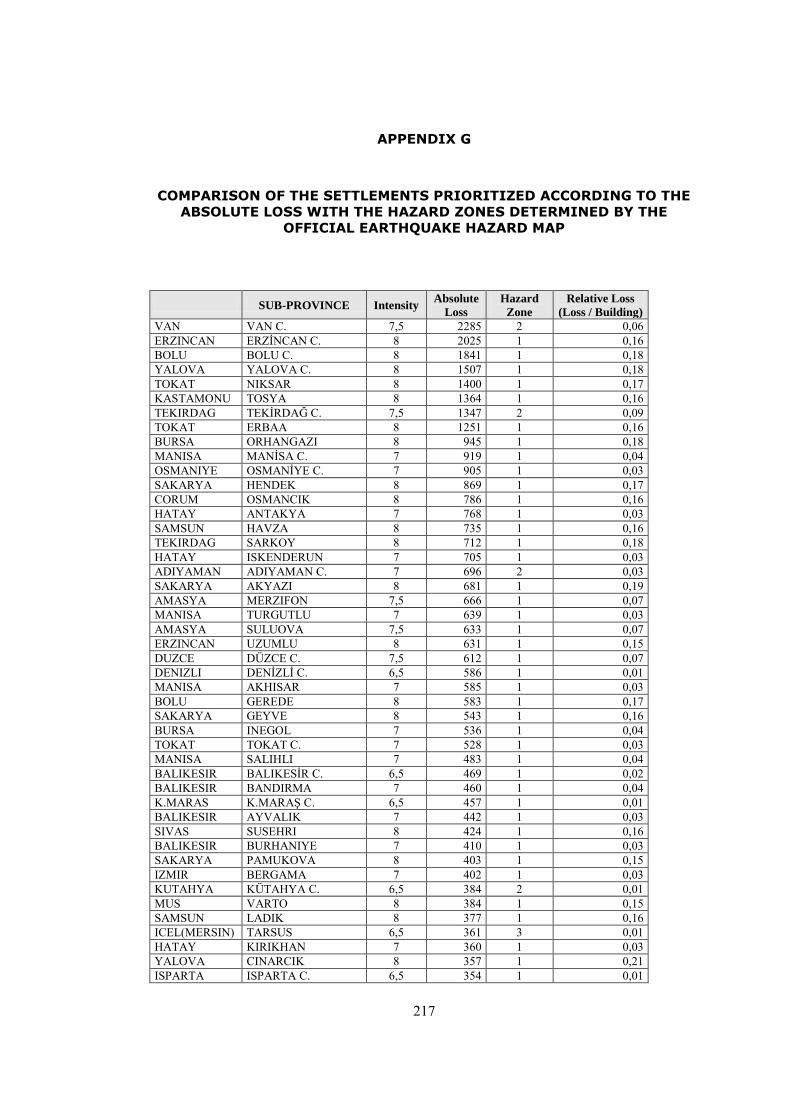
217
APPENDIX G
COMPARISON OF THE SETTLEMENTS PRIORITIZED ACCORDING TO THE
ABSOLUTE LOSS WITH THE HAZARD ZONES DETERMINED BY THE
OFFICIAL EARTHQUAKE HAZARD MAP
SUB-PROVINCE Intensity Absolute
Loss
Hazard
Zone
Relative Loss
(Loss / Building)
VAN VAN C. 7,5 2285 2 0,06 ERZINCAN ERZİNCAN C. 8 2025 1 0,16 BOLU BOLU C. 8 1841 1 0,18 YALOVA YALOVA C. 8 1507 1 0,18 TOKAT NIKSAR 8 1400 1 0,17 KASTAMONU TOSYA 8 1364 1 0,16 TEKIRDAG TEKİRDAĞ C. 7,5 1347 2 0,09 TOKAT ERBAA 8 1251 1 0,16 BURSA ORHANGAZI 8 945 1 0,18 MANISA MANİSA C. 7 919 1 0,04 OSMANIYE OSMANİYE C. 7 905 1 0,03 SAKARYA HENDEK 8 869 1 0,17 CORUM OSMANCIK 8 786 1 0,16 HATAY ANTAKYA 7 768 1 0,03 SAMSUN HAVZA 8 735 1 0,16 TEKIRDAG SARKOY 8 712 1 0,18 HATAY ISKENDERUN 7 705 1 0,03 ADIYAMAN ADIYAMAN C. 7 696 2 0,03 SAKARYA AKYAZI 8 681 1 0,19 AMASYA MERZIFON 7,5 666 1 0,07 MANISA TURGUTLU 7 639 1 0,03 AMASYA SULUOVA 7,5 633 1 0,07 ERZINCAN UZUMLU 8 631 1 0,15 DUZCE DÜZCE C. 7,5 612 1 0,07 DENIZLI DENİZLİ C. 6,5 586 1 0,01 MANISA AKHISAR 7 585 1 0,03 BOLU GEREDE 8 583 1 0,17 SAKARYA GEYVE 8 543 1 0,16 BURSA INEGOL 7 536 1 0,04 TOKAT TOKAT C. 7 528 1 0,03 MANISA SALIHLI 7 483 1 0,04 BALIKESIR BALIKESİR C. 6,5 469 1 0,02 BALIKESIR BANDIRMA 7 460 1 0,04 K.MARAS K.MARAŞ C. 6,5 457 1 0,01 BALIKESIR AYVALIK 7 442 1 0,03 SIVAS SUSEHRI 8 424 1 0,16 BALIKESIR BURHANIYE 7 410 1 0,03 SAKARYA PAMUKOVA 8 403 1 0,15 IZMIR BERGAMA 7 402 1 0,03 KUTAHYA KÜTAHYA C. 6,5 384 2 0,01 MUS VARTO 8 384 1 0,15 SAMSUN LADIK 8 377 1 0,16 ICEL(MERSIN) TARSUS 6,5 361 3 0,01 HATAY KIRIKHAN 7 360 1 0,03 YALOVA CINARCIK 8 357 1 0,21 ISPARTA ISPARTA C. 6,5 354 1 0,01
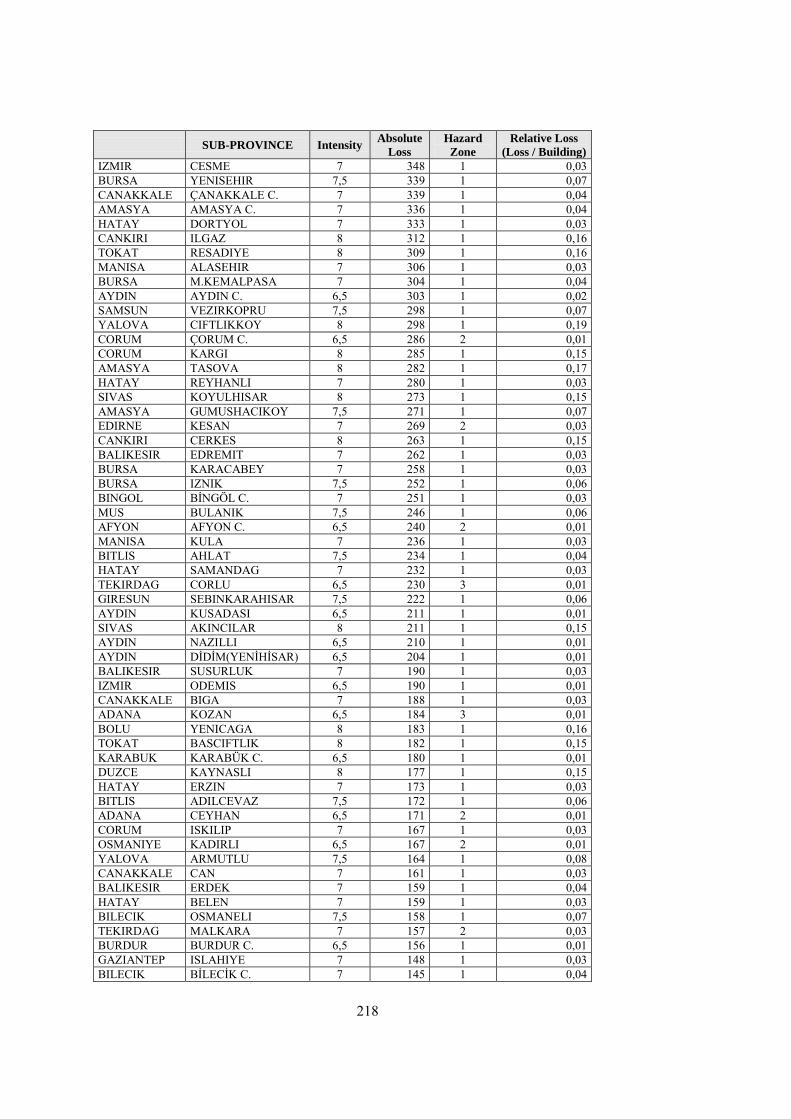
218
SUB-PROVINCE Intensity Absolute
Loss
Hazard
Zone
Relative Loss
(Loss / Building)
IZMIR CESME 7 348 1 0,03 BURSA YENISEHIR 7,5 339 1 0,07 CANAKKALE ÇANAKKALE C. 7 339 1 0,04 AMASYA AMASYA C. 7 336 1 0,04 HATAY DORTYOL 7 333 1 0,03 CANKIRI ILGAZ 8 312 1 0,16 TOKAT RESADIYE 8 309 1 0,16 MANISA ALASEHIR 7 306 1 0,03 BURSA M.KEMALPASA 7 304 1 0,04 AYDIN AYDIN C. 6,5 303 1 0,02 SAMSUN VEZIRKOPRU 7,5 298 1 0,07 YALOVA CIFTLIKKOY 8 298 1 0,19 CORUM ÇORUM C. 6,5 286 2 0,01 CORUM KARGI 8 285 1 0,15 AMASYA TASOVA 8 282 1 0,17 HATAY REYHANLI 7 280 1 0,03 SIVAS KOYULHISAR 8 273 1 0,15 AMASYA GUMUSHACIKOY 7,5 271 1 0,07 EDIRNE KESAN 7 269 2 0,03 CANKIRI CERKES 8 263 1 0,15 BALIKESIR EDREMIT 7 262 1 0,03 BURSA KARACABEY 7 258 1 0,03 BURSA IZNIK 7,5 252 1 0,06 BINGOL BİNGÖL C. 7 251 1 0,03 MUS BULANIK 7,5 246 1 0,06 AFYON AFYON C. 6,5 240 2 0,01 MANISA KULA 7 236 1 0,03 BITLIS AHLAT 7,5 234 1 0,04 HATAY SAMANDAG 7 232 1 0,03 TEKIRDAG CORLU 6,5 230 3 0,01 GIRESUN SEBINKARAHISAR 7,5 222 1 0,06 AYDIN KUSADASI 6,5 211 1 0,01 SIVAS AKINCILAR 8 211 1 0,15 AYDIN NAZILLI 6,5 210 1 0,01 AYDIN DİDİM(YENİHİSAR) 6,5 204 1 0,01 BALIKESIR SUSURLUK 7 190 1 0,03 IZMIR ODEMIS 6,5 190 1 0,01 CANAKKALE BIGA 7 188 1 0,03 ADANA KOZAN 6,5 184 3 0,01 BOLU YENICAGA 8 183 1 0,16 TOKAT BASCIFTLIK 8 182 1 0,15 KARABUK KARABÜK C. 6,5 180 1 0,01 DUZCE KAYNASLI 8 177 1 0,15 HATAY ERZIN 7 173 1 0,03 BITLIS ADILCEVAZ 7,5 172 1 0,06 ADANA CEYHAN 6,5 171 2 0,01 CORUM ISKILIP 7 167 1 0,03 OSMANIYE KADIRLI 6,5 167 2 0,01 YALOVA ARMUTLU 7,5 164 1 0,08 CANAKKALE CAN 7 161 1 0,03 BALIKESIR ERDEK 7 159 1 0,04 HATAY BELEN 7 159 1 0,03 BILECIK OSMANELI 7,5 158 1 0,07 TEKIRDAG MALKARA 7 157 2 0,03 BURDUR BURDUR C. 6,5 156 1 0,01 GAZIANTEP ISLAHIYE 7 148 1 0,03 BILECIK BİLECİK C. 7 145 1 0,04
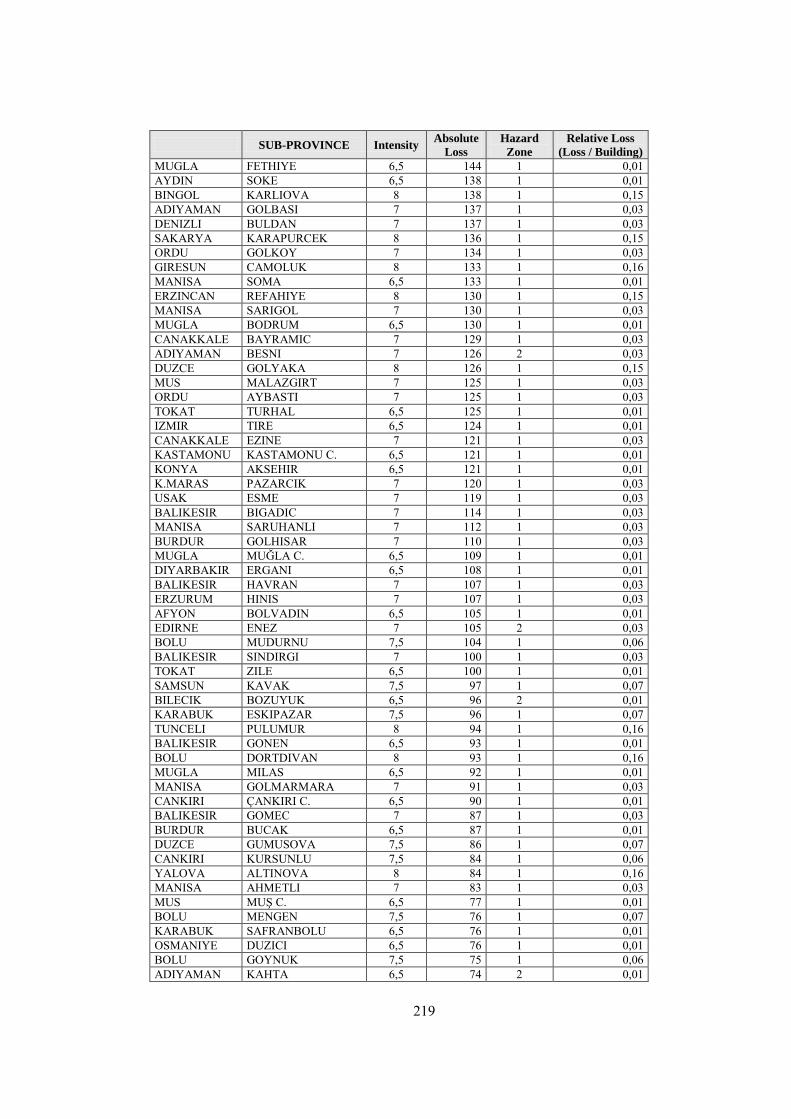
219
SUB-PROVINCE Intensity Absolute
Loss
Hazard
Zone
Relative Loss
(Loss / Building)
MUGLA FETHIYE 6,5 144 1 0,01 AYDIN SOKE 6,5 138 1 0,01 BINGOL KARLIOVA 8 138 1 0,15 ADIYAMAN GOLBASI 7 137 1 0,03 DENIZLI BULDAN 7 137 1 0,03 SAKARYA KARAPURCEK 8 136 1 0,15 ORDU GOLKOY 7 134 1 0,03 GIRESUN CAMOLUK 8 133 1 0,16 MANISA SOMA 6,5 133 1 0,01 ERZINCAN REFAHIYE 8 130 1 0,15 MANISA SARIGOL 7 130 1 0,03 MUGLA BODRUM 6,5 130 1 0,01 CANAKKALE BAYRAMIC 7 129 1 0,03 ADIYAMAN BESNI 7 126 2 0,03 DUZCE GOLYAKA 8 126 1 0,15 MUS MALAZGIRT 7 125 1 0,03 ORDU AYBASTI 7 125 1 0,03 TOKAT TURHAL 6,5 125 1 0,01 IZMIR TIRE 6,5 124 1 0,01 CANAKKALE EZINE 7 121 1 0,03 KASTAMONU KASTAMONU C. 6,5 121 1 0,01 KONYA AKSEHIR 6,5 121 1 0,01 K.MARAS PAZARCIK 7 120 1 0,03 USAK ESME 7 119 1 0,03 BALIKESIR BIGADIC 7 114 1 0,03 MANISA SARUHANLI 7 112 1 0,03 BURDUR GOLHISAR 7 110 1 0,03 MUGLA MUĞLA C. 6,5 109 1 0,01 DIYARBAKIR ERGANI 6,5 108 1 0,01 BALIKESIR HAVRAN 7 107 1 0,03 ERZURUM HINIS 7 107 1 0,03 AFYON BOLVADIN 6,5 105 1 0,01 EDIRNE ENEZ 7 105 2 0,03 BOLU MUDURNU 7,5 104 1 0,06 BALIKESIR SINDIRGI 7 100 1 0,03 TOKAT ZILE 6,5 100 1 0,01 SAMSUN KAVAK 7,5 97 1 0,07 BILECIK BOZUYUK 6,5 96 2 0,01 KARABUK ESKIPAZAR 7,5 96 1 0,07 TUNCELI PULUMUR 8 94 1 0,16 BALIKESIR GONEN 6,5 93 1 0,01 BOLU DORTDIVAN 8 93 1 0,16 MUGLA MILAS 6,5 92 1 0,01 MANISA GOLMARMARA 7 91 1 0,03 CANKIRI ÇANKIRI C. 6,5 90 1 0,01 BALIKESIR GOMEC 7 87 1 0,03 BURDUR BUCAK 6,5 87 1 0,01 DUZCE GUMUSOVA 7,5 86 1 0,07 CANKIRI KURSUNLU 7,5 84 1 0,06 YALOVA ALTINOVA 8 84 1 0,16 MANISA AHMETLI 7 83 1 0,03 MUS MUŞ C. 6,5 77 1 0,01 BOLU MENGEN 7,5 76 1 0,07 KARABUK SAFRANBOLU 6,5 76 1 0,01 OSMANIYE DUZICI 6,5 76 1 0,01 BOLU GOYNUK 7,5 75 1 0,06 ADIYAMAN KAHTA 6,5 74 2 0,01
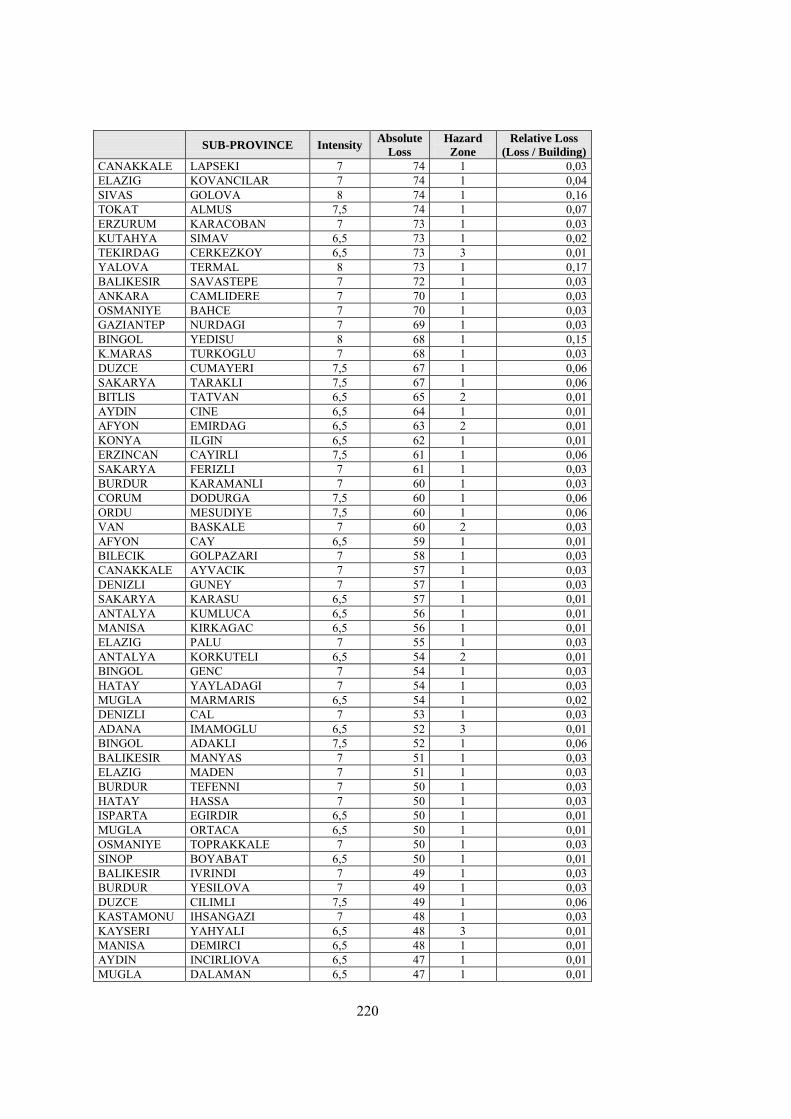
220
SUB-PROVINCE Intensity Absolute
Loss
Hazard
Zone
Relative Loss
(Loss / Building)
CANAKKALE LAPSEKI 7 74 1 0,03 ELAZIG KOVANCILAR 7 74 1 0,04 SIVAS GOLOVA 8 74 1 0,16 TOKAT ALMUS 7,5 74 1 0,07 ERZURUM KARACOBAN 7 73 1 0,03 KUTAHYA SIMAV 6,5 73 1 0,02 TEKIRDAG CERKEZKOY 6,5 73 3 0,01 YALOVA TERMAL 8 73 1 0,17 BALIKESIR SAVASTEPE 7 72 1 0,03 ANKARA CAMLIDERE 7 70 1 0,03 OSMANIYE BAHCE 7 70 1 0,03 GAZIANTEP NURDAGI 7 69 1 0,03 BINGOL YEDISU 8 68 1 0,15 K.MARAS TURKOGLU 7 68 1 0,03 DUZCE CUMAYERI 7,5 67 1 0,06 SAKARYA TARAKLI 7,5 67 1 0,06 BITLIS TATVAN 6,5 65 2 0,01 AYDIN CINE 6,5 64 1 0,01 AFYON EMIRDAG 6,5 63 2 0,01 KONYA ILGIN 6,5 62 1 0,01 ERZINCAN CAYIRLI 7,5 61 1 0,06 SAKARYA FERIZLI 7 61 1 0,03 BURDUR KARAMANLI 7 60 1 0,03 CORUM DODURGA 7,5 60 1 0,06 ORDU MESUDIYE 7,5 60 1 0,06 VAN BASKALE 7 60 2 0,03 AFYON CAY 6,5 59 1 0,01 BILECIK GOLPAZARI 7 58 1 0,03 CANAKKALE AYVACIK 7 57 1 0,03 DENIZLI GUNEY 7 57 1 0,03 SAKARYA KARASU 6,5 57 1 0,01 ANTALYA KUMLUCA 6,5 56 1 0,01 MANISA KIRKAGAC 6,5 56 1 0,01 ELAZIG PALU 7 55 1 0,03 ANTALYA KORKUTELI 6,5 54 2 0,01 BINGOL GENC 7 54 1 0,03 HATAY YAYLADAGI 7 54 1 0,03 MUGLA MARMARIS 6,5 54 1 0,02 DENIZLI CAL 7 53 1 0,03 ADANA IMAMOGLU 6,5 52 3 0,01 BINGOL ADAKLI 7,5 52 1 0,06 BALIKESIR MANYAS 7 51 1 0,03 ELAZIG MADEN 7 51 1 0,03 BURDUR TEFENNI 7 50 1 0,03 HATAY HASSA 7 50 1 0,03 ISPARTA EGIRDIR 6,5 50 1 0,01 MUGLA ORTACA 6,5 50 1 0,01 OSMANIYE TOPRAKKALE 7 50 1 0,03 SINOP BOYABAT 6,5 50 1 0,01 BALIKESIR IVRINDI 7 49 1 0,03 BURDUR YESILOVA 7 49 1 0,03 DUZCE CILIMLI 7,5 49 1 0,06 KASTAMONU IHSANGAZI 7 48 1 0,03 KAYSERI YAHYALI 6,5 48 3 0,01 MANISA DEMIRCI 6,5 48 1 0,01 AYDIN INCIRLIOVA 6,5 47 1 0,01 MUGLA DALAMAN 6,5 47 1 0,01
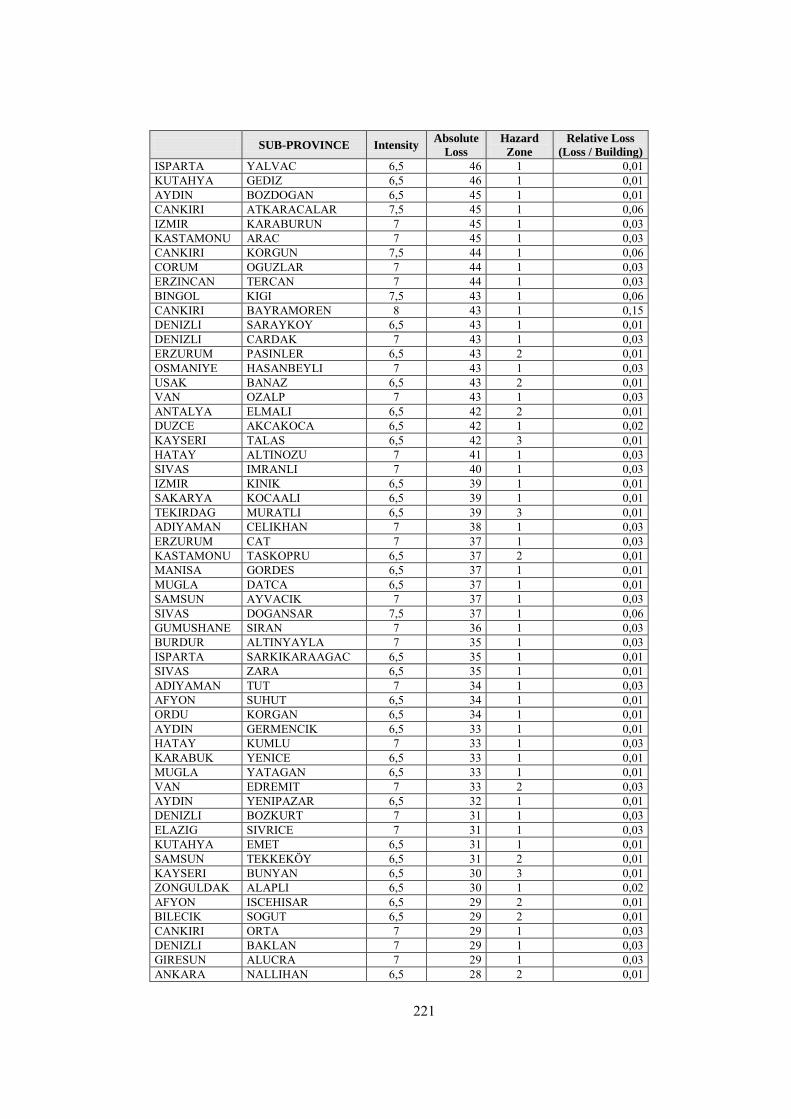
221
SUB-PROVINCE Intensity Absolute
Loss
Hazard
Zone
Relative Loss
(Loss / Building)
ISPARTA YALVAC 6,5 46 1 0,01 KUTAHYA GEDIZ 6,5 46 1 0,01 AYDIN BOZDOGAN 6,5 45 1 0,01 CANKIRI ATKARACALAR 7,5 45 1 0,06 IZMIR KARABURUN 7 45 1 0,03 KASTAMONU ARAC 7 45 1 0,03 CANKIRI KORGUN 7,5 44 1 0,06 CORUM OGUZLAR 7 44 1 0,03 ERZINCAN TERCAN 7 44 1 0,03 BINGOL KIGI 7,5 43 1 0,06 CANKIRI BAYRAMOREN 8 43 1 0,15 DENIZLI SARAYKOY 6,5 43 1 0,01 DENIZLI CARDAK 7 43 1 0,03 ERZURUM PASINLER 6,5 43 2 0,01 OSMANIYE HASANBEYLI 7 43 1 0,03 USAK BANAZ 6,5 43 2 0,01 VAN OZALP 7 43 1 0,03 ANTALYA ELMALI 6,5 42 2 0,01 DUZCE AKCAKOCA 6,5 42 1 0,02 KAYSERI TALAS 6,5 42 3 0,01 HATAY ALTINOZU 7 41 1 0,03 SIVAS IMRANLI 7 40 1 0,03 IZMIR KINIK 6,5 39 1 0,01 SAKARYA KOCAALI 6,5 39 1 0,01 TEKIRDAG MURATLI 6,5 39 3 0,01 ADIYAMAN CELIKHAN 7 38 1 0,03 ERZURUM CAT 7 37 1 0,03 KASTAMONU TASKOPRU 6,5 37 2 0,01 MANISA GORDES 6,5 37 1 0,01 MUGLA DATCA 6,5 37 1 0,01 SAMSUN AYVACIK 7 37 1 0,03 SIVAS DOGANSAR 7,5 37 1 0,06 GUMUSHANE SIRAN 7 36 1 0,03 BURDUR ALTINYAYLA 7 35 1 0,03 ISPARTA SARKIKARAAGAC 6,5 35 1 0,01 SIVAS ZARA 6,5 35 1 0,01 ADIYAMAN TUT 7 34 1 0,03 AFYON SUHUT 6,5 34 1 0,01 ORDU KORGAN 6,5 34 1 0,01 AYDIN GERMENCIK 6,5 33 1 0,01 HATAY KUMLU 7 33 1 0,03 KARABUK YENICE 6,5 33 1 0,01 MUGLA YATAGAN 6,5 33 1 0,01 VAN EDREMIT 7 33 2 0,03 AYDIN YENIPAZAR 6,5 32 1 0,01 DENIZLI BOZKURT 7 31 1 0,03 ELAZIG SIVRICE 7 31 1 0,03 KUTAHYA EMET 6,5 31 1 0,01 SAMSUN TEKKEKÖY 6,5 31 2 0,01 KAYSERI BUNYAN 6,5 30 3 0,01 ZONGULDAK ALAPLI 6,5 30 1 0,02 AFYON ISCEHISAR 6,5 29 2 0,01 BILECIK SOGUT 6,5 29 2 0,01 CANKIRI ORTA 7 29 1 0,03 DENIZLI BAKLAN 7 29 1 0,03 GIRESUN ALUCRA 7 29 1 0,03 ANKARA NALLIHAN 6,5 28 2 0,01

222
SUB-PROVINCE Intensity Absolute
Loss
Hazard
Zone
Relative Loss
(Loss / Building)
BURDUR CAVDIR 7 28 1 0,03 DIYARBAKIR CERMIK 6,5 28 1 0,01 ERZURUM ASKALE 6,5 28 2 0,01 MALATYA POTURGE 7 28 1 0,03 ORDU GURGENTEPE 6,5 28 1 0,01 ANKARA KIZILCAHAMAM 6,5 27 2 0,01 AYDIN KARACASU 6,5 27 1 0,01 DENIZLI ACIPAYAM 6,5 27 1 0,01 GUMUSHANE KELKIT 6,5 27 1 0,01 ISPARTA KECIBORLU 6,5 27 1 0,01 KONYA DOGANHISAR 6,5 27 1 0,01 ORDU KUMRU 6,5 27 1 0,01 ADANA POZANTI 6,5 26 3 0,01 ANTALYA KALE (DEMRE) 6,5 26 1 0,01 DIYARBAKIR CUNGUS 7 26 1 0,03 ISPARTA SENIRKENT 6,5 26 1 0,01 SAMSUN ASARCIK 7,5 26 1 0,07 VAN GURPINAR 7 26 2 0,03 BINGOL YAYLADERE 7 25 1 0,03 ELAZIG ALACAKAYA 7 25 1 0,03 K.MARAS CAGLAYANCERIT 6,5 25 1 0,01 MALATYA DOGANYOL 7 25 1 0,03 ADANA KARATAS 6,5 24 2 0,01 ADANA KARAISALI 6,5 24 3 0,01 ANTALYA KEMER 6,5 24 1 0,01 BALIKESIR KEPSUT 6,5 24 1 0,01 BURDUR KEMER 7 24 1 0,03 CANKIRI YAPRAKLI 7 24 1 0,03 EDIRNE IPSALA 6,5 24 3 0,01 IZMIR KIRAZ 6,5 24 1 0,01 MUS HASKOY 6,5 24 1 0,01 ANTALYA FINIKE 6,5 23 1 0,01 AYDIN KUYUCAK 6,5 23 1 0,01 BITLIS GUROYMAK 6,5 23 2 0,01 BOLU SEBEN 7 23 1 0,03 IZMIR BEYDAG 6,5 23 1 0,01 MUGLA KOYCEGIZ 6,5 23 1 0,01 AFYON BASMAKCI 6,5 22 1 0,01 AYDIN KOSK 6,5 22 1 0,01 ELAZIG KARAKOCAN 6,5 22 2 0,01 MUGLA ULA 6,5 22 1 0,01 SINOP DURAGAN 6,5 22 1 0,01 ERZINCAN KEMAH 7 21 1 0,03 GAZIANTEP ARABAN 6,5 21 3 0,01 ISPARTA ULUBORLU 6,5 21 1 0,01 VAN GEVAS 6,5 21 2 0,01 AFYON SULTANDAGI 6,5 20 1 0,01 AYDIN BUHARKENT 6,5 20 1 0,01 BALIKESIR BALYA 7 20 1 0,03 BURSA ORHANELI 6,5 20 2 0,01 DUZCE YIGILCA 7 20 1 0,04 MALATYA DOGANSEHIR 6,5 20 1 0,01 ORDU AKKUS 7 20 1 0,03 ADIYAMAN SINCIK 7 19 1 0,03 AFYON COBANLAR 6,5 19 1 0,01 AYDIN SULTANHISAR 6,5 19 1 0,01 BILECIK PAZARYERI 6,5 19 2 0,01
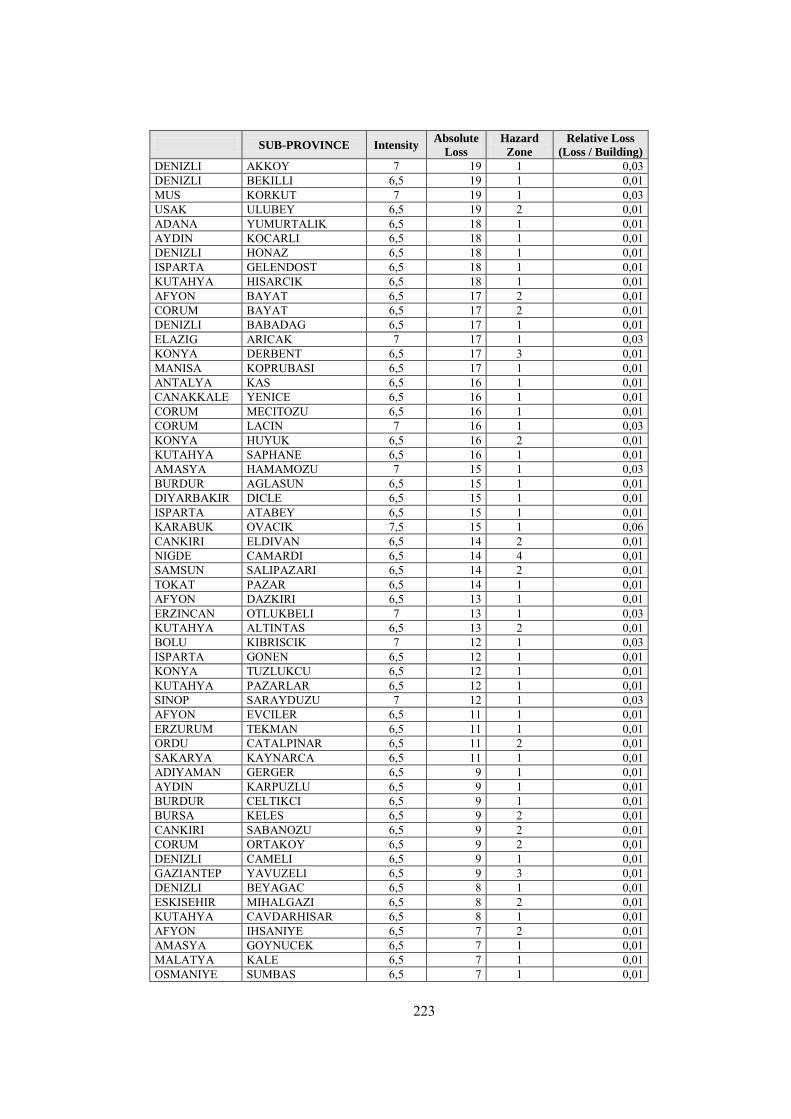
223
SUB-PROVINCE Intensity Absolute
Loss
Hazard
Zone
Relative Loss
(Loss / Building)
DENIZLI AKKOY 7 19 1 0,03 DENIZLI BEKILLI 6,5 19 1 0,01 MUS KORKUT 7 19 1 0,03 USAK ULUBEY 6,5 19 2 0,01 ADANA YUMURTALIK 6,5 18 1 0,01 AYDIN KOCARLI 6,5 18 1 0,01 DENIZLI HONAZ 6,5 18 1 0,01 ISPARTA GELENDOST 6,5 18 1 0,01 KUTAHYA HISARCIK 6,5 18 1 0,01 AFYON BAYAT 6,5 17 2 0,01 CORUM BAYAT 6,5 17 2 0,01 DENIZLI BABADAG 6,5 17 1 0,01 ELAZIG ARICAK 7 17 1 0,03 KONYA DERBENT 6,5 17 3 0,01 MANISA KOPRUBASI 6,5 17 1 0,01 ANTALYA KAS 6,5 16 1 0,01 CANAKKALE YENICE 6,5 16 1 0,01 CORUM MECITOZU 6,5 16 1 0,01 CORUM LACIN 7 16 1 0,03 KONYA HUYUK 6,5 16 2 0,01 KUTAHYA SAPHANE 6,5 16 1 0,01 AMASYA HAMAMOZU 7 15 1 0,03 BURDUR AGLASUN 6,5 15 1 0,01 DIYARBAKIR DICLE 6,5 15 1 0,01 ISPARTA ATABEY 6,5 15 1 0,01 KARABUK OVACIK 7,5 15 1 0,06 CANKIRI ELDIVAN 6,5 14 2 0,01 NIGDE CAMARDI 6,5 14 4 0,01 SAMSUN SALIPAZARI 6,5 14 2 0,01 TOKAT PAZAR 6,5 14 1 0,01 AFYON DAZKIRI 6,5 13 1 0,01 ERZINCAN OTLUKBELI 7 13 1 0,03 KUTAHYA ALTINTAS 6,5 13 2 0,01 BOLU KIBRISCIK 7 12 1 0,03 ISPARTA GONEN 6,5 12 1 0,01 KONYA TUZLUKCU 6,5 12 1 0,01 KUTAHYA PAZARLAR 6,5 12 1 0,01 SINOP SARAYDUZU 7 12 1 0,03 AFYON EVCILER 6,5 11 1 0,01 ERZURUM TEKMAN 6,5 11 1 0,01 ORDU CATALPINAR 6,5 11 2 0,01 SAKARYA KAYNARCA 6,5 11 1 0,01 ADIYAMAN GERGER 6,5 9 1 0,01 AYDIN KARPUZLU 6,5 9 1 0,01 BURDUR CELTIKCI 6,5 9 1 0,01 BURSA KELES 6,5 9 2 0,01 CANKIRI SABANOZU 6,5 9 2 0,01 CORUM ORTAKOY 6,5 9 2 0,01 DENIZLI CAMELI 6,5 9 1 0,01 GAZIANTEP YAVUZELI 6,5 9 3 0,01 DENIZLI BEYAGAC 6,5 8 1 0,01 ESKISEHIR MIHALGAZI 6,5 8 2 0,01 KUTAHYA CAVDARHISAR 6,5 8 1 0,01 AFYON IHSANIYE 6,5 7 2 0,01 AMASYA GOYNUCEK 6,5 7 1 0,01 MALATYA KALE 6,5 7 1 0,01 OSMANIYE SUMBAS 6,5 7 1 0,01

224
SUB-PROVINCE Intensity Absolute
Loss
Hazard
Zone
Relative Loss
(Loss / Building)
TUNCELI OVACIK 6,5 7 1 0,01 KONYA AKOREN 6,5 6 4 0 KUTAHYA DUMLUPINAR 6,5 6 2 0,01 VAN SARAY 6,5 6 1 0,01 BILECIK INHISAR 6,5 5 2 0,01 BILECIK YENIPAZAR 6,5 5 1 0,01 ESKISEHIR SARICAKAYA 6,5 5 2 0,01 KUTAHYA ASLANAPA 6,5 5 1 0,01 TUNCELI NAZIMIYE 6,5 4 1 0,01 KILIS MUSABEYLI 6,5 2 3 0,01 C: Central
Comparison of the Metropolitan Cities Prioritized According to the
Absolute Loss with the Hazard Zones Determined by the Official
Earthquake Hazard Map
Metropolitan
Cities SUB-PROVINCE Intensity
Absolute
Loss Hazard Zone Relative Loss
(Loss / Building)
ISTANBUL ISTANBUL (M) 7,5 83824 2* 0,10 KOCAELI KOCAELI (M) 8 24077 1 0,17 BURSA BURSA (M) 7,5 16506 1 0,08 IZMIR IZMIR (M) 7 14531 1 0,03 SAKARYA SAKARYA (M) 8 8070 1 0,16 ADANA ADANA (M) 6,5 1913 2 0,01 ANTALYA ANTALYA (M) 6,5 1402 2 0,01 KONYA KONYA (M) 6,5 1355 4 0,01 ERZURUM ERZURUM (M) 6,5 439 2 0,01
M: Metropolitan
* 22 settlements are located in the second degree hazard zone, 15 settlements
are located in the first degree hazard zone and 2 settlements are located in the
third degree hazard zone in Istanbul. Therefore, the hazard zone of Istanbul
Metropolitan city is accepted as second degree hazard zone.
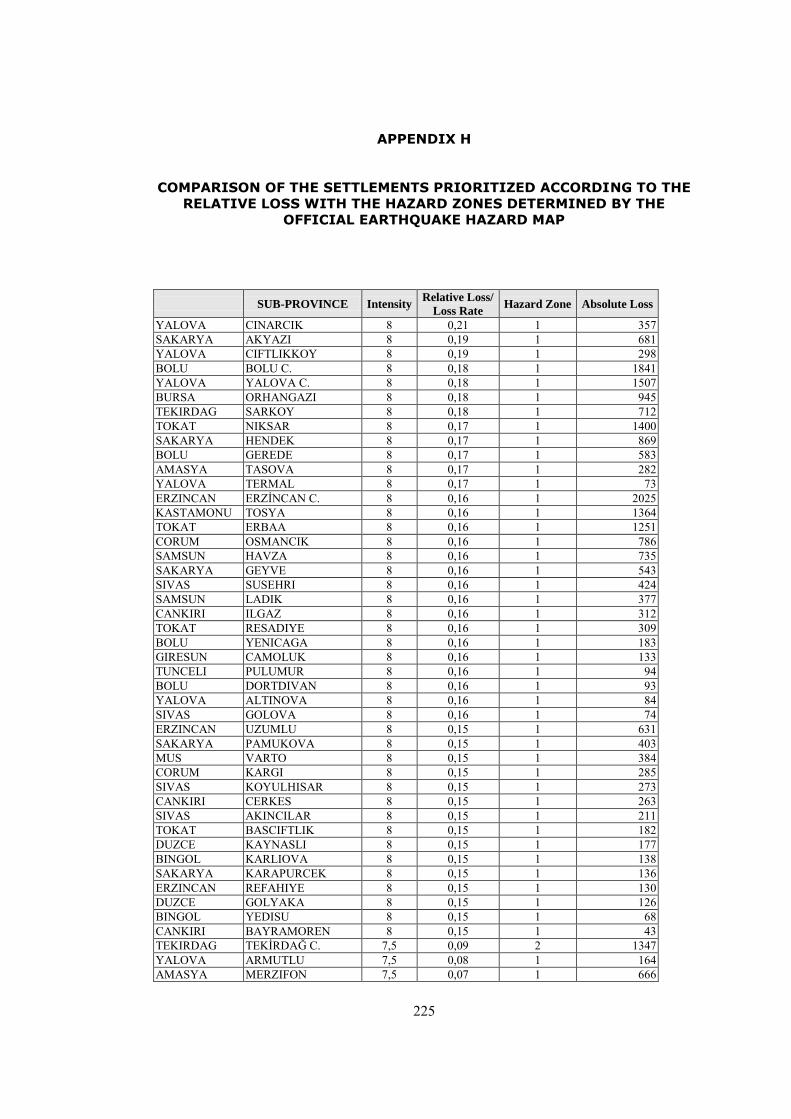
225
APPENDIX H
COMPARISON OF THE SETTLEMENTS PRIORITIZED ACCORDING TO THE
RELATIVE LOSS WITH THE HAZARD ZONES DETERMINED BY THE
OFFICIAL EARTHQUAKE HAZARD MAP
SUB-PROVINCE Intensity Relative Loss/
Loss Rate Hazard Zone Absolute Loss
YALOVA CINARCIK 8 0,21 1 357 SAKARYA AKYAZI 8 0,19 1 681 YALOVA CIFTLIKKOY 8 0,19 1 298 BOLU BOLU C. 8 0,18 1 1841 YALOVA YALOVA C. 8 0,18 1 1507 BURSA ORHANGAZI 8 0,18 1 945 TEKIRDAG SARKOY 8 0,18 1 712 TOKAT NIKSAR 8 0,17 1 1400 SAKARYA HENDEK 8 0,17 1 869 BOLU GEREDE 8 0,17 1 583 AMASYA TASOVA 8 0,17 1 282 YALOVA TERMAL 8 0,17 1 73 ERZINCAN ERZİNCAN C. 8 0,16 1 2025 KASTAMONU TOSYA 8 0,16 1 1364 TOKAT ERBAA 8 0,16 1 1251 CORUM OSMANCIK 8 0,16 1 786 SAMSUN HAVZA 8 0,16 1 735 SAKARYA GEYVE 8 0,16 1 543 SIVAS SUSEHRI 8 0,16 1 424 SAMSUN LADIK 8 0,16 1 377 CANKIRI ILGAZ 8 0,16 1 312 TOKAT RESADIYE 8 0,16 1 309 BOLU YENICAGA 8 0,16 1 183 GIRESUN CAMOLUK 8 0,16 1 133 TUNCELI PULUMUR 8 0,16 1 94 BOLU DORTDIVAN 8 0,16 1 93 YALOVA ALTINOVA 8 0,16 1 84 SIVAS GOLOVA 8 0,16 1 74 ERZINCAN UZUMLU 8 0,15 1 631 SAKARYA PAMUKOVA 8 0,15 1 403 MUS VARTO 8 0,15 1 384 CORUM KARGI 8 0,15 1 285 SIVAS KOYULHISAR 8 0,15 1 273 CANKIRI CERKES 8 0,15 1 263 SIVAS AKINCILAR 8 0,15 1 211 TOKAT BASCIFTLIK 8 0,15 1 182 DUZCE KAYNASLI 8 0,15 1 177 BINGOL KARLIOVA 8 0,15 1 138 SAKARYA KARAPURCEK 8 0,15 1 136 ERZINCAN REFAHIYE 8 0,15 1 130 DUZCE GOLYAKA 8 0,15 1 126 BINGOL YEDISU 8 0,15 1 68 CANKIRI BAYRAMOREN 8 0,15 1 43 TEKIRDAG TEKİRDAĞ C. 7,5 0,09 2 1347 YALOVA ARMUTLU 7,5 0,08 1 164 AMASYA MERZIFON 7,5 0,07 1 666

226
SUB-PROVINCE Intensity Relative Loss/
Loss Rate Hazard Zone Absolute Loss
AMASYA SULUOVA 7,5 0,07 1 633 DUZCE DÜZCE C. 7,5 0,07 1 612 BURSA YENISEHIR 7,5 0,07 1 339 SAMSUN VEZIRKOPRU 7,5 0,07 1 298 AMASYA GUMUSHACIKOY 7,5 0,07 1 271 BILECIK OSMANELI 7,5 0,07 1 158 SAMSUN KAVAK 7,5 0,07 1 97 KARABUK ESKIPAZAR 7,5 0,07 1 96 DUZCE GUMUSOVA 7,5 0,07 1 86 BOLU MENGEN 7,5 0,07 1 76 TOKAT ALMUS 7,5 0,07 1 74 SAMSUN ASARCIK 7,5 0,07 1 26 VAN VAN C. 7,5 0,06 2 2285 BURSA IZNIK 7,5 0,06 1 252 MUS BULANIK 7,5 0,06 1 246 GIRESUN SEBINKARAHISAR 7,5 0,06 1 222 BITLIS ADILCEVAZ 7,5 0,06 1 172 BOLU MUDURNU 7,5 0,06 1 104 CANKIRI KURSUNLU 7,5 0,06 1 84 BOLU GOYNUK 7,5 0,06 1 75 DUZCE CUMAYERI 7,5 0,06 1 67 SAKARYA TARAKLI 7,5 0,06 1 67 ERZINCAN CAYIRLI 7,5 0,06 1 61 CORUM DODURGA 7,5 0,06 1 60 ORDU MESUDIYE 7,5 0,06 1 60 BINGOL ADAKLI 7,5 0,06 1 52 DUZCE CILIMLI 7,5 0,06 1 49 CANKIRI ATKARACALAR 7,5 0,06 1 45 CANKIRI KORGUN 7,5 0,06 1 44 BINGOL KIGI 7,5 0,06 1 43 SIVAS DOGANSAR 7,5 0,06 1 37 KARABUK OVACIK 7,5 0,06 1 15 MANISA MANİSA C. 7 0,04 1 919 BURSA INEGOL 7 0,04 1 536 MANISA SALIHLI 7 0,04 1 483 BALIKESIR BANDIRMA 7 0,04 1 460 CANAKKALE ÇANAKKALE C. 7 0,04 1 339 AMASYA AMASYA C. 7 0,04 1 336 BURSA M.KEMALPASA 7 0,04 1 304 BITLIS AHLAT 7,5 0,04 1 234 BALIKESIR ERDEK 7 0,04 1 159 BILECIK BİLECİK C. 7 0,04 1 145 ELAZIG KOVANCILAR 7 0,04 1 74 DUZCE YIGILCA 7 0,04 1 20 OSMANIYE OSMANİYE C. 7 0,03 1 905 HATAY ANTAKYA 7 0,03 1 768 HATAY ISKENDERUN 7 0,03 1 705 ADIYAMAN ADIYAMAN C. 7 0,03 2 696 MANISA TURGUTLU 7 0,03 1 639 MANISA AKHISAR 7 0,03 1 585 TOKAT TOKAT C. 7 0,03 1 528 BALIKESIR AYVALIK 7 0,03 1 442 BALIKESIR BURHANIYE 7 0,03 1 410 IZMIR BERGAMA 7 0,03 1 402 HATAY KIRIKHAN 7 0,03 1 360 IZMIR CESME 7 0,03 1 348 HATAY DORTYOL 7 0,03 1 333
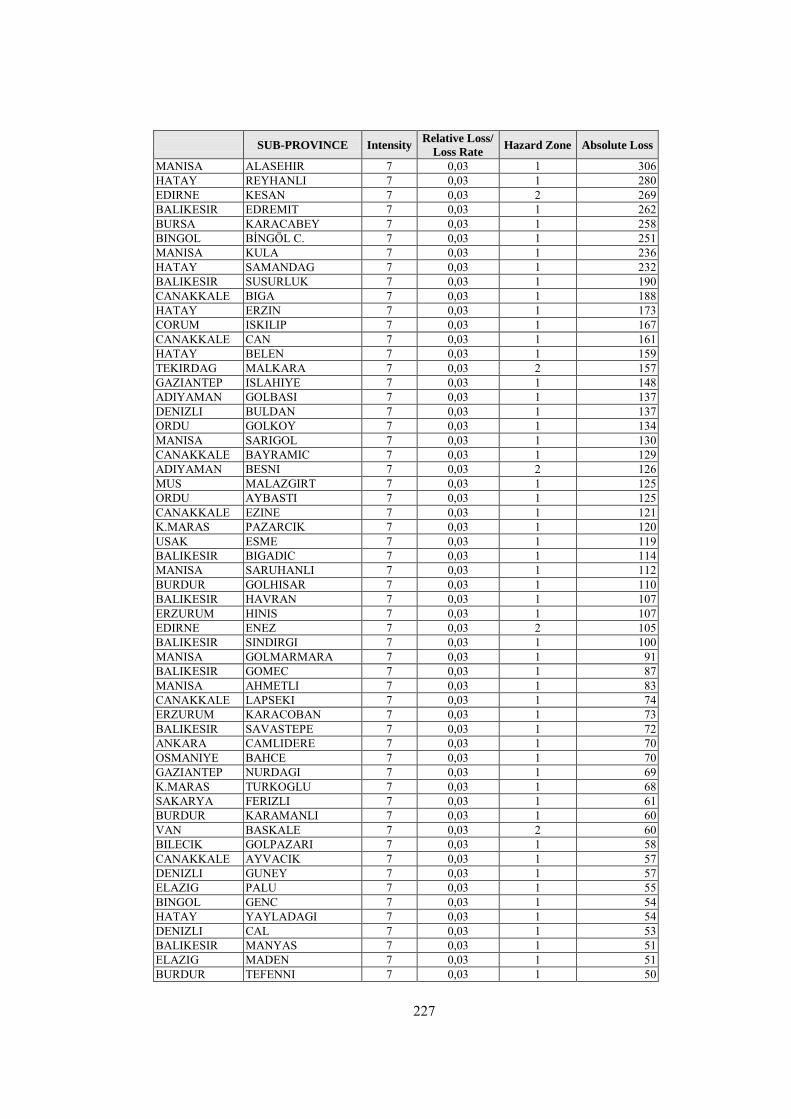
227
SUB-PROVINCE Intensity Relative Loss/
Loss Rate Hazard Zone Absolute Loss
MANISA ALASEHIR 7 0,03 1 306 HATAY REYHANLI 7 0,03 1 280 EDIRNE KESAN 7 0,03 2 269 BALIKESIR EDREMIT 7 0,03 1 262 BURSA KARACABEY 7 0,03 1 258 BINGOL BİNGÖL C. 7 0,03 1 251 MANISA KULA 7 0,03 1 236 HATAY SAMANDAG 7 0,03 1 232 BALIKESIR SUSURLUK 7 0,03 1 190 CANAKKALE BIGA 7 0,03 1 188 HATAY ERZIN 7 0,03 1 173 CORUM ISKILIP 7 0,03 1 167 CANAKKALE CAN 7 0,03 1 161 HATAY BELEN 7 0,03 1 159 TEKIRDAG MALKARA 7 0,03 2 157 GAZIANTEP ISLAHIYE 7 0,03 1 148 ADIYAMAN GOLBASI 7 0,03 1 137 DENIZLI BULDAN 7 0,03 1 137 ORDU GOLKOY 7 0,03 1 134 MANISA SARIGOL 7 0,03 1 130 CANAKKALE BAYRAMIC 7 0,03 1 129 ADIYAMAN BESNI 7 0,03 2 126 MUS MALAZGIRT 7 0,03 1 125 ORDU AYBASTI 7 0,03 1 125 CANAKKALE EZINE 7 0,03 1 121 K.MARAS PAZARCIK 7 0,03 1 120 USAK ESME 7 0,03 1 119 BALIKESIR BIGADIC 7 0,03 1 114 MANISA SARUHANLI 7 0,03 1 112 BURDUR GOLHISAR 7 0,03 1 110 BALIKESIR HAVRAN 7 0,03 1 107 ERZURUM HINIS 7 0,03 1 107 EDIRNE ENEZ 7 0,03 2 105 BALIKESIR SINDIRGI 7 0,03 1 100 MANISA GOLMARMARA 7 0,03 1 91 BALIKESIR GOMEC 7 0,03 1 87 MANISA AHMETLI 7 0,03 1 83 CANAKKALE LAPSEKI 7 0,03 1 74 ERZURUM KARACOBAN 7 0,03 1 73 BALIKESIR SAVASTEPE 7 0,03 1 72 ANKARA CAMLIDERE 7 0,03 1 70 OSMANIYE BAHCE 7 0,03 1 70 GAZIANTEP NURDAGI 7 0,03 1 69 K.MARAS TURKOGLU 7 0,03 1 68 SAKARYA FERIZLI 7 0,03 1 61 BURDUR KARAMANLI 7 0,03 1 60 VAN BASKALE 7 0,03 2 60 BILECIK GOLPAZARI 7 0,03 1 58 CANAKKALE AYVACIK 7 0,03 1 57 DENIZLI GUNEY 7 0,03 1 57 ELAZIG PALU 7 0,03 1 55 BINGOL GENC 7 0,03 1 54 HATAY YAYLADAGI 7 0,03 1 54 DENIZLI CAL 7 0,03 1 53 BALIKESIR MANYAS 7 0,03 1 51 ELAZIG MADEN 7 0,03 1 51 BURDUR TEFENNI 7 0,03 1 50
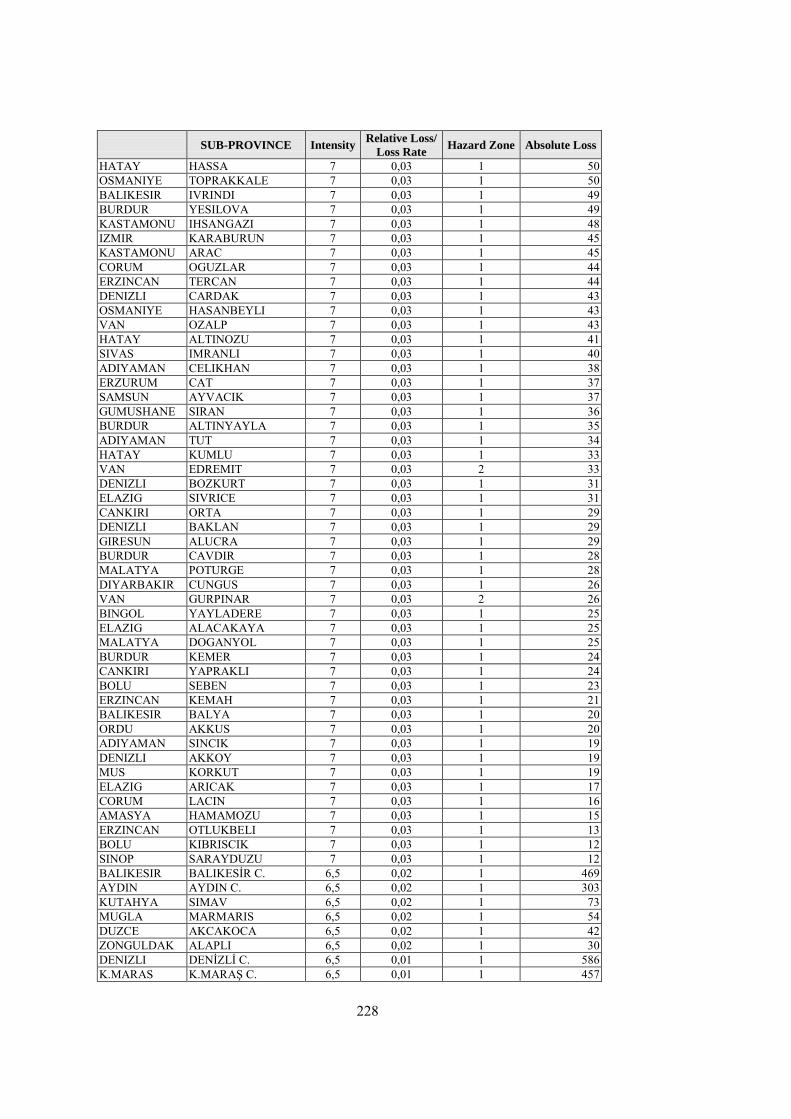
228
SUB-PROVINCE Intensity Relative Loss/
Loss Rate Hazard Zone Absolute Loss
HATAY HASSA 7 0,03 1 50 OSMANIYE TOPRAKKALE 7 0,03 1 50 BALIKESIR IVRINDI 7 0,03 1 49 BURDUR YESILOVA 7 0,03 1 49 KASTAMONU IHSANGAZI 7 0,03 1 48 IZMIR KARABURUN 7 0,03 1 45 KASTAMONU ARAC 7 0,03 1 45 CORUM OGUZLAR 7 0,03 1 44 ERZINCAN TERCAN 7 0,03 1 44 DENIZLI CARDAK 7 0,03 1 43 OSMANIYE HASANBEYLI 7 0,03 1 43 VAN OZALP 7 0,03 1 43 HATAY ALTINOZU 7 0,03 1 41 SIVAS IMRANLI 7 0,03 1 40 ADIYAMAN CELIKHAN 7 0,03 1 38 ERZURUM CAT 7 0,03 1 37 SAMSUN AYVACIK 7 0,03 1 37 GUMUSHANE SIRAN 7 0,03 1 36 BURDUR ALTINYAYLA 7 0,03 1 35 ADIYAMAN TUT 7 0,03 1 34 HATAY KUMLU 7 0,03 1 33 VAN EDREMIT 7 0,03 2 33 DENIZLI BOZKURT 7 0,03 1 31 ELAZIG SIVRICE 7 0,03 1 31 CANKIRI ORTA 7 0,03 1 29 DENIZLI BAKLAN 7 0,03 1 29 GIRESUN ALUCRA 7 0,03 1 29 BURDUR CAVDIR 7 0,03 1 28 MALATYA POTURGE 7 0,03 1 28 DIYARBAKIR CUNGUS 7 0,03 1 26 VAN GURPINAR 7 0,03 2 26 BINGOL YAYLADERE 7 0,03 1 25 ELAZIG ALACAKAYA 7 0,03 1 25 MALATYA DOGANYOL 7 0,03 1 25 BURDUR KEMER 7 0,03 1 24 CANKIRI YAPRAKLI 7 0,03 1 24 BOLU SEBEN 7 0,03 1 23 ERZINCAN KEMAH 7 0,03 1 21 BALIKESIR BALYA 7 0,03 1 20 ORDU AKKUS 7 0,03 1 20 ADIYAMAN SINCIK 7 0,03 1 19 DENIZLI AKKOY 7 0,03 1 19 MUS KORKUT 7 0,03 1 19 ELAZIG ARICAK 7 0,03 1 17 CORUM LACIN 7 0,03 1 16 AMASYA HAMAMOZU 7 0,03 1 15 ERZINCAN OTLUKBELI 7 0,03 1 13 BOLU KIBRISCIK 7 0,03 1 12 SINOP SARAYDUZU 7 0,03 1 12 BALIKESIR BALIKESİR C. 6,5 0,02 1 469 AYDIN AYDIN C. 6,5 0,02 1 303 KUTAHYA SIMAV 6,5 0,02 1 73 MUGLA MARMARIS 6,5 0,02 1 54 DUZCE AKCAKOCA 6,5 0,02 1 42 ZONGULDAK ALAPLI 6,5 0,02 1 30 DENIZLI DENİZLİ C. 6,5 0,01 1 586 K.MARAS K.MARAŞ C. 6,5 0,01 1 457
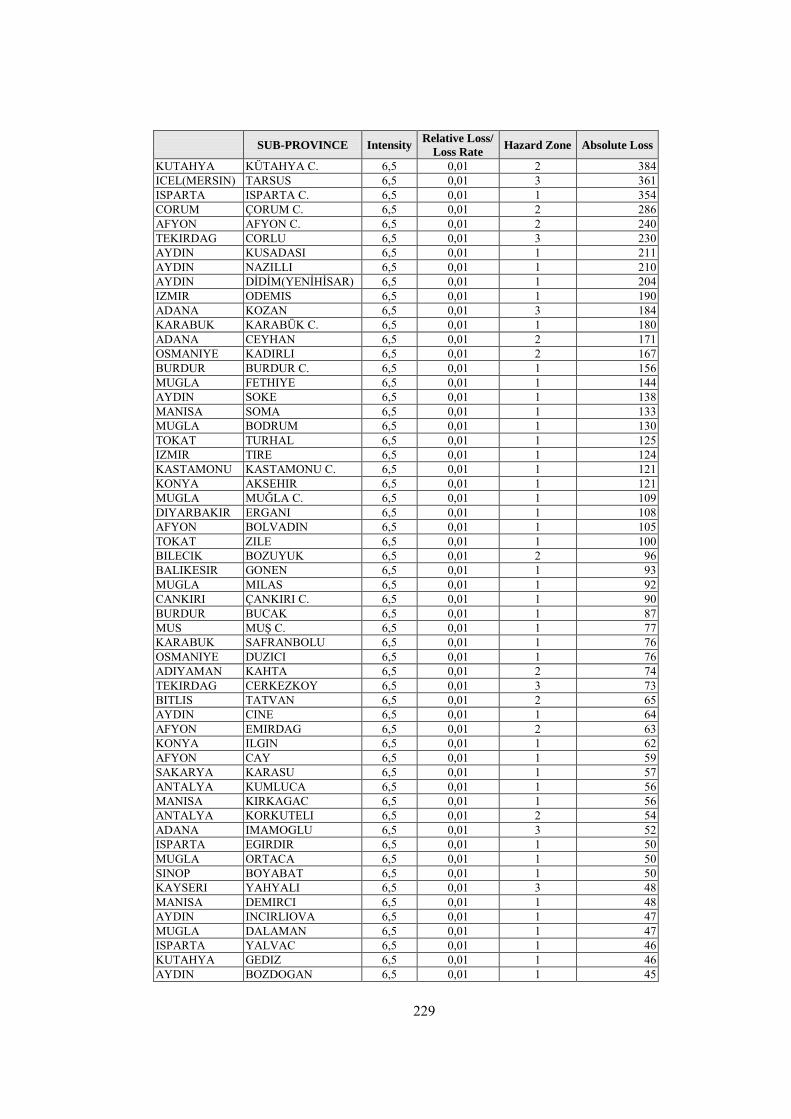
229
SUB-PROVINCE Intensity Relative Loss/
Loss Rate Hazard Zone Absolute Loss
KUTAHYA KÜTAHYA C. 6,5 0,01 2 384 ICEL(MERSIN) TARSUS 6,5 0,01 3 361 ISPARTA ISPARTA C. 6,5 0,01 1 354 CORUM ÇORUM C. 6,5 0,01 2 286 AFYON AFYON C. 6,5 0,01 2 240 TEKIRDAG CORLU 6,5 0,01 3 230 AYDIN KUSADASI 6,5 0,01 1 211 AYDIN NAZILLI 6,5 0,01 1 210 AYDIN DİDİM(YENİHİSAR) 6,5 0,01 1 204 IZMIR ODEMIS 6,5 0,01 1 190 ADANA KOZAN 6,5 0,01 3 184 KARABUK KARABÜK C. 6,5 0,01 1 180 ADANA CEYHAN 6,5 0,01 2 171 OSMANIYE KADIRLI 6,5 0,01 2 167 BURDUR BURDUR C. 6,5 0,01 1 156 MUGLA FETHIYE 6,5 0,01 1 144 AYDIN SOKE 6,5 0,01 1 138 MANISA SOMA 6,5 0,01 1 133 MUGLA BODRUM 6,5 0,01 1 130 TOKAT TURHAL 6,5 0,01 1 125 IZMIR TIRE 6,5 0,01 1 124 KASTAMONU KASTAMONU C. 6,5 0,01 1 121 KONYA AKSEHIR 6,5 0,01 1 121 MUGLA MUĞLA C. 6,5 0,01 1 109 DIYARBAKIR ERGANI 6,5 0,01 1 108 AFYON BOLVADIN 6,5 0,01 1 105 TOKAT ZILE 6,5 0,01 1 100 BILECIK BOZUYUK 6,5 0,01 2 96 BALIKESIR GONEN 6,5 0,01 1 93 MUGLA MILAS 6,5 0,01 1 92 CANKIRI ÇANKIRI C. 6,5 0,01 1 90 BURDUR BUCAK 6,5 0,01 1 87 MUS MUŞ C. 6,5 0,01 1 77 KARABUK SAFRANBOLU 6,5 0,01 1 76 OSMANIYE DUZICI 6,5 0,01 1 76 ADIYAMAN KAHTA 6,5 0,01 2 74 TEKIRDAG CERKEZKOY 6,5 0,01 3 73 BITLIS TATVAN 6,5 0,01 2 65 AYDIN CINE 6,5 0,01 1 64 AFYON EMIRDAG 6,5 0,01 2 63 KONYA ILGIN 6,5 0,01 1 62 AFYON CAY 6,5 0,01 1 59 SAKARYA KARASU 6,5 0,01 1 57 ANTALYA KUMLUCA 6,5 0,01 1 56 MANISA KIRKAGAC 6,5 0,01 1 56 ANTALYA KORKUTELI 6,5 0,01 2 54 ADANA IMAMOGLU 6,5 0,01 3 52 ISPARTA EGIRDIR 6,5 0,01 1 50 MUGLA ORTACA 6,5 0,01 1 50 SINOP BOYABAT 6,5 0,01 1 50 KAYSERI YAHYALI 6,5 0,01 3 48 MANISA DEMIRCI 6,5 0,01 1 48 AYDIN INCIRLIOVA 6,5 0,01 1 47 MUGLA DALAMAN 6,5 0,01 1 47 ISPARTA YALVAC 6,5 0,01 1 46 KUTAHYA GEDIZ 6,5 0,01 1 46 AYDIN BOZDOGAN 6,5 0,01 1 45
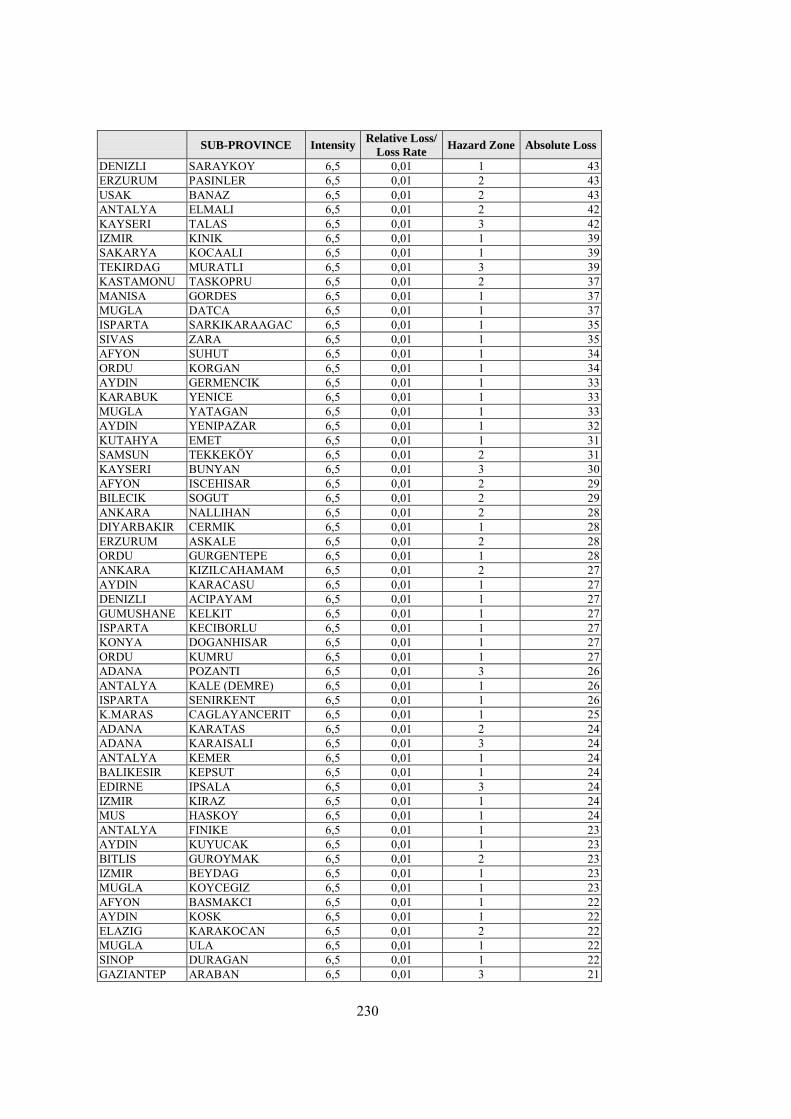
230
SUB-PROVINCE Intensity Relative Loss/
Loss Rate Hazard Zone Absolute Loss
DENIZLI SARAYKOY 6,5 0,01 1 43 ERZURUM PASINLER 6,5 0,01 2 43 USAK BANAZ 6,5 0,01 2 43 ANTALYA ELMALI 6,5 0,01 2 42 KAYSERI TALAS 6,5 0,01 3 42 IZMIR KINIK 6,5 0,01 1 39 SAKARYA KOCAALI 6,5 0,01 1 39 TEKIRDAG MURATLI 6,5 0,01 3 39 KASTAMONU TASKOPRU 6,5 0,01 2 37 MANISA GORDES 6,5 0,01 1 37 MUGLA DATCA 6,5 0,01 1 37 ISPARTA SARKIKARAAGAC 6,5 0,01 1 35 SIVAS ZARA 6,5 0,01 1 35 AFYON SUHUT 6,5 0,01 1 34 ORDU KORGAN 6,5 0,01 1 34 AYDIN GERMENCIK 6,5 0,01 1 33 KARABUK YENICE 6,5 0,01 1 33 MUGLA YATAGAN 6,5 0,01 1 33 AYDIN YENIPAZAR 6,5 0,01 1 32 KUTAHYA EMET 6,5 0,01 1 31 SAMSUN TEKKEKÖY 6,5 0,01 2 31 KAYSERI BUNYAN 6,5 0,01 3 30 AFYON ISCEHISAR 6,5 0,01 2 29 BILECIK SOGUT 6,5 0,01 2 29 ANKARA NALLIHAN 6,5 0,01 2 28 DIYARBAKIR CERMIK 6,5 0,01 1 28 ERZURUM ASKALE 6,5 0,01 2 28 ORDU GURGENTEPE 6,5 0,01 1 28 ANKARA KIZILCAHAMAM 6,5 0,01 2 27 AYDIN KARACASU 6,5 0,01 1 27 DENIZLI ACIPAYAM 6,5 0,01 1 27 GUMUSHANE KELKIT 6,5 0,01 1 27 ISPARTA KECIBORLU 6,5 0,01 1 27 KONYA DOGANHISAR 6,5 0,01 1 27 ORDU KUMRU 6,5 0,01 1 27 ADANA POZANTI 6,5 0,01 3 26 ANTALYA KALE (DEMRE) 6,5 0,01 1 26 ISPARTA SENIRKENT 6,5 0,01 1 26 K.MARAS CAGLAYANCERIT 6,5 0,01 1 25 ADANA KARATAS 6,5 0,01 2 24 ADANA KARAISALI 6,5 0,01 3 24 ANTALYA KEMER 6,5 0,01 1 24 BALIKESIR KEPSUT 6,5 0,01 1 24 EDIRNE IPSALA 6,5 0,01 3 24 IZMIR KIRAZ 6,5 0,01 1 24 MUS HASKOY 6,5 0,01 1 24 ANTALYA FINIKE 6,5 0,01 1 23 AYDIN KUYUCAK 6,5 0,01 1 23 BITLIS GUROYMAK 6,5 0,01 2 23 IZMIR BEYDAG 6,5 0,01 1 23 MUGLA KOYCEGIZ 6,5 0,01 1 23 AFYON BASMAKCI 6,5 0,01 1 22 AYDIN KOSK 6,5 0,01 1 22 ELAZIG KARAKOCAN 6,5 0,01 2 22 MUGLA ULA 6,5 0,01 1 22 SINOP DURAGAN 6,5 0,01 1 22 GAZIANTEP ARABAN 6,5 0,01 3 21
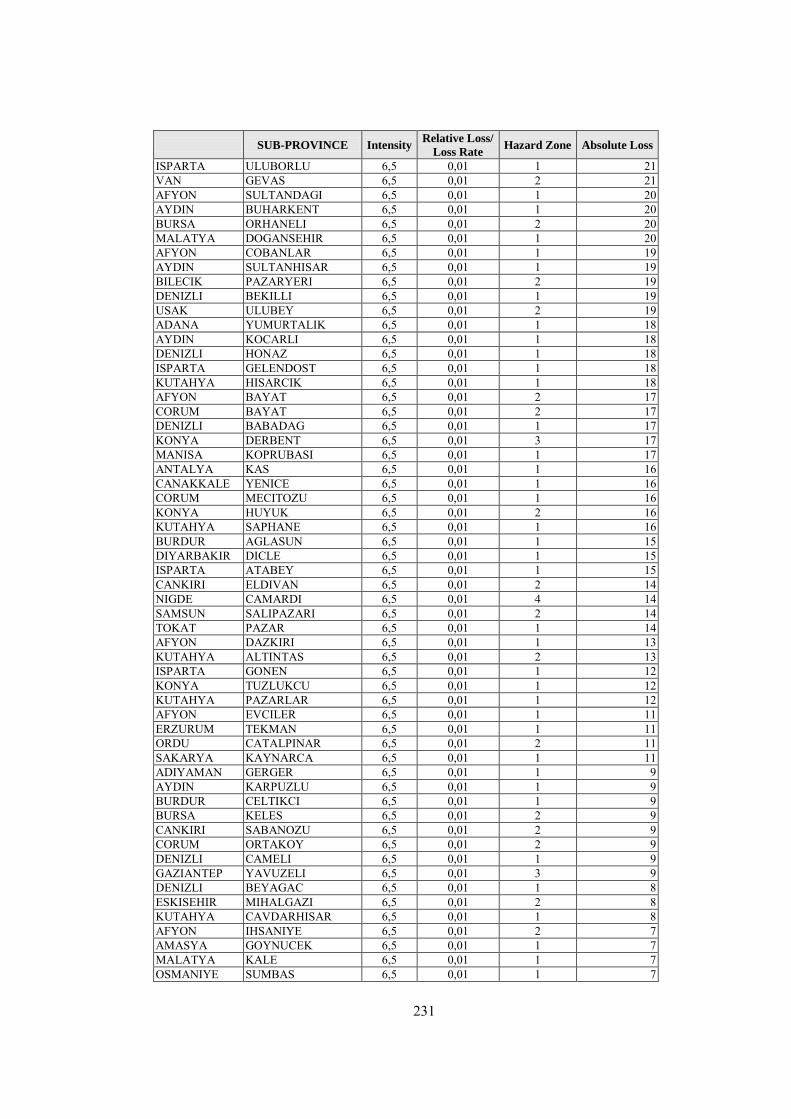
231
SUB-PROVINCE Intensity Relative Loss/
Loss Rate Hazard Zone Absolute Loss
ISPARTA ULUBORLU 6,5 0,01 1 21 VAN GEVAS 6,5 0,01 2 21 AFYON SULTANDAGI 6,5 0,01 1 20 AYDIN BUHARKENT 6,5 0,01 1 20 BURSA ORHANELI 6,5 0,01 2 20 MALATYA DOGANSEHIR 6,5 0,01 1 20 AFYON COBANLAR 6,5 0,01 1 19 AYDIN SULTANHISAR 6,5 0,01 1 19 BILECIK PAZARYERI 6,5 0,01 2 19 DENIZLI BEKILLI 6,5 0,01 1 19 USAK ULUBEY 6,5 0,01 2 19 ADANA YUMURTALIK 6,5 0,01 1 18 AYDIN KOCARLI 6,5 0,01 1 18 DENIZLI HONAZ 6,5 0,01 1 18 ISPARTA GELENDOST 6,5 0,01 1 18 KUTAHYA HISARCIK 6,5 0,01 1 18 AFYON BAYAT 6,5 0,01 2 17 CORUM BAYAT 6,5 0,01 2 17 DENIZLI BABADAG 6,5 0,01 1 17 KONYA DERBENT 6,5 0,01 3 17 MANISA KOPRUBASI 6,5 0,01 1 17 ANTALYA KAS 6,5 0,01 1 16 CANAKKALE YENICE 6,5 0,01 1 16 CORUM MECITOZU 6,5 0,01 1 16 KONYA HUYUK 6,5 0,01 2 16 KUTAHYA SAPHANE 6,5 0,01 1 16 BURDUR AGLASUN 6,5 0,01 1 15 DIYARBAKIR DICLE 6,5 0,01 1 15 ISPARTA ATABEY 6,5 0,01 1 15 CANKIRI ELDIVAN 6,5 0,01 2 14 NIGDE CAMARDI 6,5 0,01 4 14 SAMSUN SALIPAZARI 6,5 0,01 2 14 TOKAT PAZAR 6,5 0,01 1 14 AFYON DAZKIRI 6,5 0,01 1 13 KUTAHYA ALTINTAS 6,5 0,01 2 13 ISPARTA GONEN 6,5 0,01 1 12 KONYA TUZLUKCU 6,5 0,01 1 12 KUTAHYA PAZARLAR 6,5 0,01 1 12 AFYON EVCILER 6,5 0,01 1 11 ERZURUM TEKMAN 6,5 0,01 1 11 ORDU CATALPINAR 6,5 0,01 2 11 SAKARYA KAYNARCA 6,5 0,01 1 11 ADIYAMAN GERGER 6,5 0,01 1 9 AYDIN KARPUZLU 6,5 0,01 1 9 BURDUR CELTIKCI 6,5 0,01 1 9 BURSA KELES 6,5 0,01 2 9 CANKIRI SABANOZU 6,5 0,01 2 9 CORUM ORTAKOY 6,5 0,01 2 9 DENIZLI CAMELI 6,5 0,01 1 9 GAZIANTEP YAVUZELI 6,5 0,01 3 9 DENIZLI BEYAGAC 6,5 0,01 1 8 ESKISEHIR MIHALGAZI 6,5 0,01 2 8 KUTAHYA CAVDARHISAR 6,5 0,01 1 8 AFYON IHSANIYE 6,5 0,01 2 7 AMASYA GOYNUCEK 6,5 0,01 1 7 MALATYA KALE 6,5 0,01 1 7 OSMANIYE SUMBAS 6,5 0,01 1 7
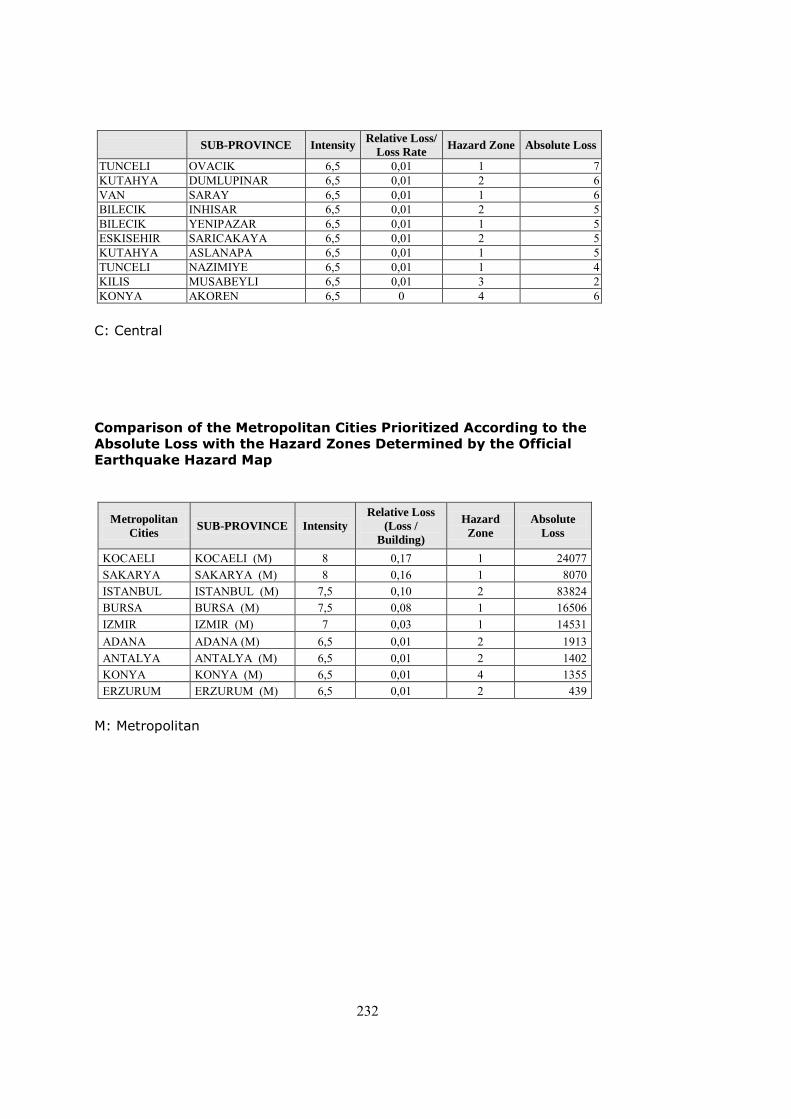
232
SUB-PROVINCE Intensity Relative Loss/
Loss Rate Hazard Zone Absolute Loss
TUNCELI OVACIK 6,5 0,01 1 7 KUTAHYA DUMLUPINAR 6,5 0,01 2 6 VAN SARAY 6,5 0,01 1 6 BILECIK INHISAR 6,5 0,01 2 5 BILECIK YENIPAZAR 6,5 0,01 1 5 ESKISEHIR SARICAKAYA 6,5 0,01 2 5 KUTAHYA ASLANAPA 6,5 0,01 1 5 TUNCELI NAZIMIYE 6,5 0,01 1 4 KILIS MUSABEYLI 6,5 0,01 3 2 KONYA AKOREN 6,5 0 4 6
C: Central
Comparison of the Metropolitan Cities Prioritized According to the
Absolute Loss with the Hazard Zones Determined by the Official
Earthquake Hazard Map
Metropolitan
Cities SUB-PROVINCE Intensity
Relative Loss
(Loss /
Building)
Hazard
Zone Absolute
Loss
KOCAELI KOCAELI (M) 8 0,17 1 24077 SAKARYA SAKARYA (M) 8 0,16 1 8070 ISTANBUL ISTANBUL (M) 7,5 0,10 2 83824 BURSA BURSA (M) 7,5 0,08 1 16506 IZMIR IZMIR (M) 7 0,03 1 14531 ADANA ADANA (M) 6,5 0,01 2 1913 ANTALYA ANTALYA (M) 6,5 0,01 2 1402 KONYA KONYA (M) 6,5 0,01 4 1355 ERZURUM ERZURUM (M) 6,5 0,01 2 439
M: Metropolitan
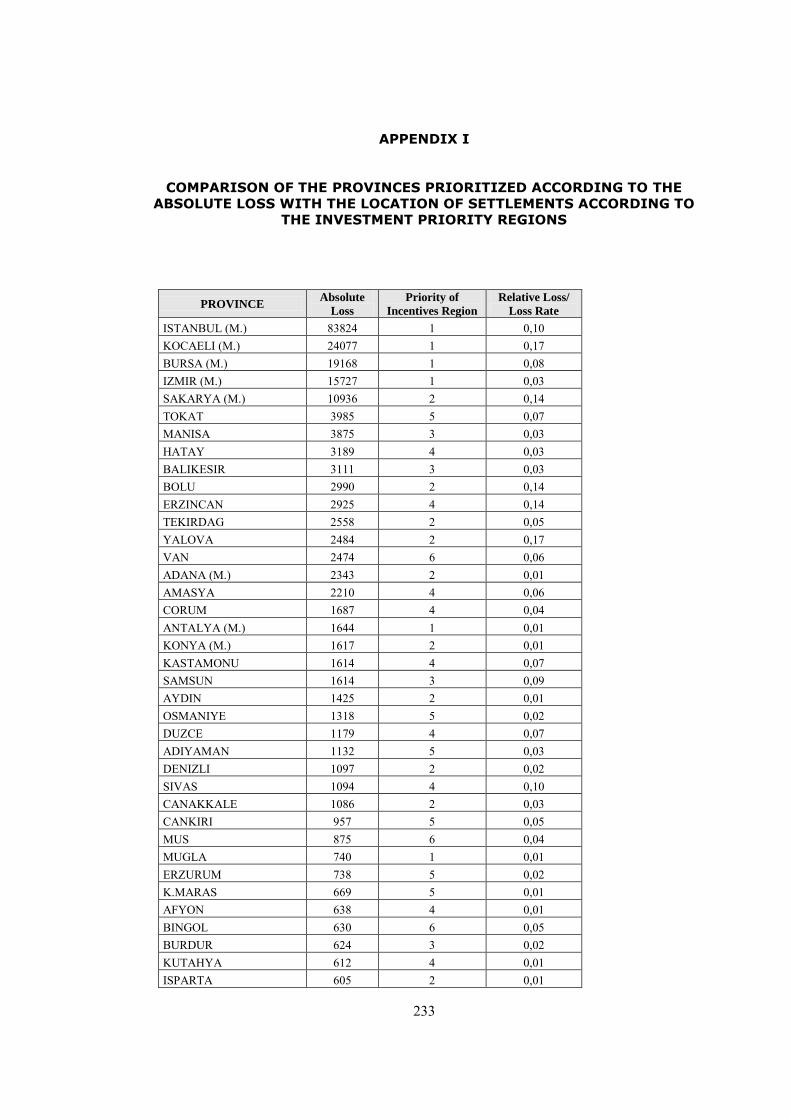
233
APPENDIX I
COMPARISON OF THE PROVINCES PRIORITIZED ACCORDING TO THE
ABSOLUTE LOSS WITH THE LOCATION OF SETTLEMENTS ACCORDING TO
THE INVESTMENT PRIORITY REGIONS
PROVINCE Absolute
Loss
Priority of
Incentives Region
Relative Loss/
Loss Rate
ISTANBUL (M.) 83824 1 0,10 KOCAELI (M.) 24077 1 0,17 BURSA (M.) 19168 1 0,08 IZMIR (M.) 15727 1 0,03 SAKARYA (M.) 10936 2 0,14 TOKAT 3985 5 0,07 MANISA 3875 3 0,03 HATAY 3189 4 0,03 BALIKESIR 3111 3 0,03 BOLU 2990 2 0,14 ERZINCAN 2925 4 0,14 TEKIRDAG 2558 2 0,05 YALOVA 2484 2 0,17 VAN 2474 6 0,06 ADANA (M.) 2343 2 0,01 AMASYA 2210 4 0,06 CORUM 1687 4 0,04 ANTALYA (M.) 1644 1 0,01 KONYA (M.) 1617 2 0,01 KASTAMONU 1614 4 0,07 SAMSUN 1614 3 0,09 AYDIN 1425 2 0,01 OSMANIYE 1318 5 0,02 DUZCE 1179 4 0,07 ADIYAMAN 1132 5 0,03 DENIZLI 1097 2 0,02 SIVAS 1094 4 0,10 CANAKKALE 1086 2 0,03 CANKIRI 957 5 0,05 MUS 875 6 0,04 MUGLA 740 1 0,01 ERZURUM 738 5 0,02 K.MARAS 669 5 0,01 AFYON 638 4 0,01 BINGOL 630 6 0,05 BURDUR 624 3 0,02 KUTAHYA 612 4 0,01 ISPARTA 605 2 0,01

234
PROVINCE Absolute
Loss
Priority of
Incentives Region
Relative Loss/
Loss Rate
BILECIK 516 3 0,02 BITLIS 494 6 0,03 ORDU 439 5 0,02 KARABUK 400 3 0,02 EDIRNE 399 2 0,03 GIRESUN 384 5 0,07 ICEL(MERSIN) 361 3 0,01 ELAZIG 274 4 0,03 GAZIANTEP 247 3 0,02 USAK 182 3 0,02 DIYARBAKIR 177 6 0,01 ANKARA 125 1 0,02 KAYSERI 121 2 0,01 TUNCELI 104 5 0,07 SINOP 84 5 0,01 MALATYA 79 4 0,02 GUMUSHANE 64 5 0,02 ZONGULDAK 30 3 0,02 NIGDE 14 5 0,01 ESKISEHIR 13 1 0,01 KILIS 2 5 0,01 AĞRI* - 6 - AKSARAY* - 5 - ARDAHAN* - 6 - ARTVİN* - 4 - BARTIN* - 4 - BATMAN* - 6 - BAYBURT* - 5 - HAKKARİ* - 6 - IĞDIR* - 6 - KARAMAN* - 3 - KARS* - 6 - KIRIKKALE* - 4 - KIRKLARELİ* - 2 - KIRŞEHİR* - 4 - MARDİN* - 6 - NEVŞEHİR* - 4 - RİZE* - 4 - SİİRT* - 6 - ŞANLIURFA* - 6 - ŞIRNAK* - 6 - TRABZON* - 3 - YOZGAT* - 5 - GÖKCEADA-BOZCADA DISTRICTS*
- 6 -
* All settlements with an expected hazard intensity level of 6.0 and less are excluded from the analyses assuming that insignificant damage is likely to take place in these settlements.

235
APPENDIX J
COMPARISON OF THE SETTLEMENTS PRIORITIZED ACCORDING TO THE
RELATIVE LOSS WITH THE LOCATION OF SETTLEMENTS ACCORDING TO
THE INVESTMENT PRIORITY REGIONS
PROVINCE Relative Loss/
Loss Rate
Priority of
Incentives Region
Absolute
Loss
KOCAELI (M.) 0,17 1 24077 YALOVA 0,17 2 2484 SAKARYA (M.) 0,14 2 10936 BOLU 0,14 2 2990 ERZINCAN 0,14 4 2925 ISTANBUL (M.) 0,10 1 83824 SIVAS 0,10 4 1094 SAMSUN 0,09 3 1614 BURSA (M.) 0,08 1 19168 TOKAT 0,07 5 3985 KASTAMONU 0,07 4 1614 DUZCE 0,07 4 1179 GIRESUN 0,07 5 384 TUNCELI 0,07 5 104 VAN 0,06 6 2474 AMASYA 0,06 4 2210 TEKIRDAG 0,05 2 2558 CANKIRI 0,05 5 957 BINGOL 0,05 6 630 CORUM 0,04 4 1687 MUS 0,04 6 875 IZMIR (M.) 0,03 1 15727 MANISA 0,03 3 3875 HATAY 0,03 4 3189 BALIKESIR 0,03 3 3111 ADIYAMAN 0,03 5 1132 CANAKKALE 0,03 2 1086 BITLIS 0,03 6 494 EDIRNE 0,03 2 399 ELAZIG 0,03 4 274 OSMANIYE 0,02 5 1318 DENIZLI 0,02 2 1097 ERZURUM 0,02 5 738 BURDUR 0,02 3 624 BILECIK 0,02 3 516 ORDU 0,02 5 439 KARABUK 0,02 3 400 GAZIANTEP 0,02 3 247
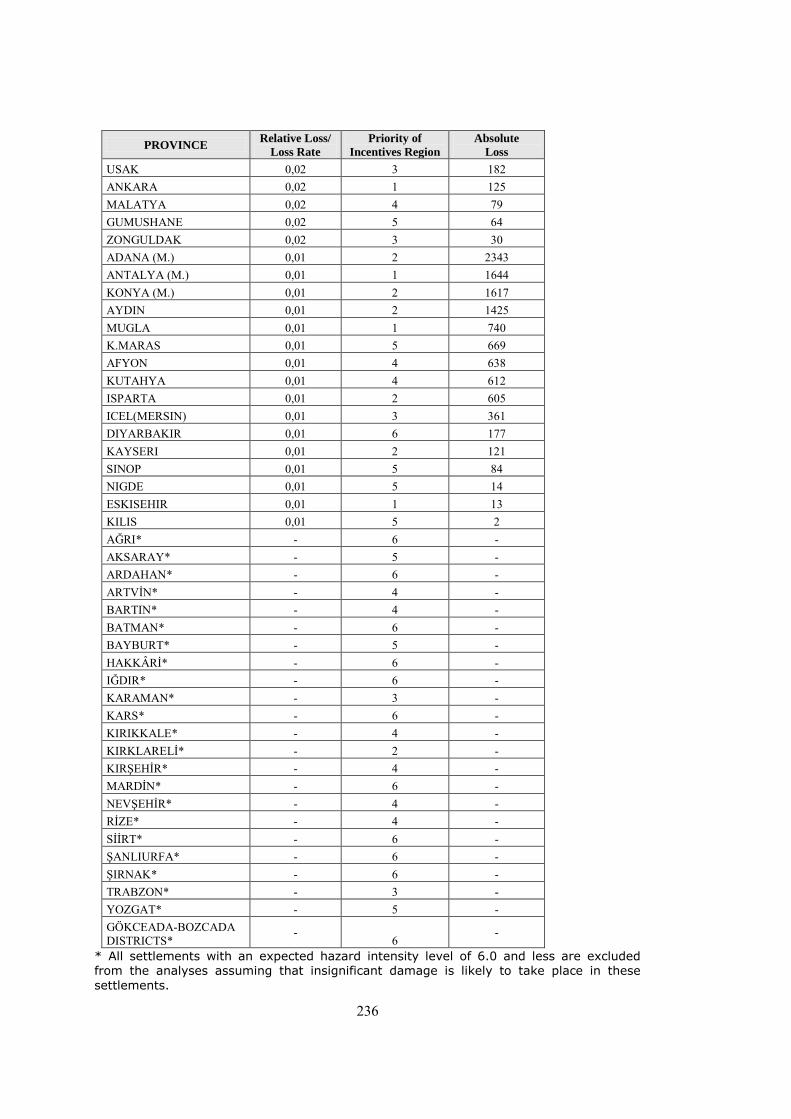
236
PROVINCE Relative Loss/
Loss Rate
Priority of
Incentives Region
Absolute
Loss
USAK 0,02 3 182 ANKARA 0,02 1 125 MALATYA 0,02 4 79 GUMUSHANE 0,02 5 64 ZONGULDAK 0,02 3 30 ADANA (M.) 0,01 2 2343 ANTALYA (M.) 0,01 1 1644 KONYA (M.) 0,01 2 1617 AYDIN 0,01 2 1425 MUGLA 0,01 1 740 K.MARAS 0,01 5 669 AFYON 0,01 4 638 KUTAHYA 0,01 4 612 ISPARTA 0,01 2 605 ICEL(MERSIN) 0,01 3 361 DIYARBAKIR 0,01 6 177 KAYSERI 0,01 2 121 SINOP 0,01 5 84 NIGDE 0,01 5 14 ESKISEHIR 0,01 1 13 KILIS 0,01 5 2 AĞRI* - 6 - AKSARAY* - 5 - ARDAHAN* - 6 - ARTVİN* - 4 - BARTIN* - 4 - BATMAN* - 6 - BAYBURT* - 5 - HAKKÂRİ* - 6 - IĞDIR* - 6 - KARAMAN* - 3 - KARS* - 6 - KIRIKKALE* - 4 - KIRKLARELİ* - 2 - KIRŞEHİR* - 4 - MARDİN* - 6 - NEVŞEHİR* - 4 - RİZE* - 4 - SİİRT* - 6 - ŞANLIURFA* - 6 - ŞIRNAK* - 6 - TRABZON* - 3 - YOZGAT* - 5 - GÖKCEADA-BOZCADA DISTRICTS*
- 6
-
* All settlements with an expected hazard intensity level of 6.0 and less are excluded from the analyses assuming that insignificant damage is likely to take place in these
settlements.
237
VITA
PERSONAL INFORMATION
Surname, Name: Sönmez Saner, Tuğçe
Nationality: Turkish (TC)
Date and Place of Birth: 1 November 1983, LefkoĢa
Email: [email protected]
EDUCATION
Degree Institution Year of Graduation
MS METU City Planning 2008
BS GAZI University City and Regional Planning 2005
High School 19 Mayıs TMK, Girne 2000
WORK EXPERINCE
Year Place Enrollment
2006-2008 InfoPlan GIS Planning City Planner
2003 Pamir Planning Intern Planner
2002 Nicosia Municipality Intern Planner
FOREIGN LANGUAGES
Advanced English, Intermediate German
PUBLICATIONS
1. Sönmez T., ―Determination of Seismic Vulnerabilities and Risks for Urban
Mitigation Planning in Turkey‖, The Association of European Schools of Planning
(AESOP) 26th Annual Congress, Ankara, July 2012.
2. Sönmez T., Türkiye‘de Sakınım Planlaması için Kentsel YerleĢmelerin Sismik
Zarar Görebilirliklerinin ve Risklerinin Belirlenmesi, Kentsel ve Bölgesel
AraĢtırmalar Ağı (KBAM) -2.Sempozyumu, Ankara, 2011.
3. Sönmez T., Türkiye BüyükĢehirlerinde Risk OluĢturan Etkenlerin
KarĢılaĢtırılması, Dünya ġehircilik Günü 34. Kolokyumu, Kayseri, 2010.
4. Sönmez T., Aspects of Urban Seismic Risks: A Comparison of Risk Factors in
the Metropolitan Cities of Turkey, Disaster Symposium, Chamber of Civil
Engineers -TMMOB, 2007, Ankara.


