Embed Size (px)
Citation preview
DOCUMENT RESUME
ED 466 651 TM 034 262
AUTHOR Brooks, Gordon P.; Kanyongo, Gibbs Y.; Kyei-Blankson, Lydia;Gocmen, Gulsah
TITLE Power and Reliability for Correlation and ANOVA.
PUB DATE 2002-04-00NOTE 23p.; Paper presented at the Annual Meeting of the American
Educational Research Association (New Orleans, LA, April 1-5,2002).
PUB TYPE Reports Research (143) Speeches/Meeting Papers (150)
EDRS PRICE EDRS Price MF01/PC01 Plus Postage.DESCRIPTORS *Analysis of Variance; *Correlation; *Reliability; *Sample
Size; *ScoresIDENTIFIERS *Power (Statistics)
ABSTRACTUnfortunately, researchers do not usually have measurement
instruments that provide perfectly reliable scores. Therefore, the researchermay want to account for the level of unreliability by appropriately increasingthe sample size. For example, the results of a pilot study may indicate that aparticular instrument is not as reliable with a given population as it hasbeen with other populations. A series of Monte Carlo analyses were conductedto determine the sample sizes required when measurements are not perfectlyreliable. The methods investigated were: (1) Pearson correlation; (2) Spearmanrank correlation; and (3) analysis of variance (ANOVA). Using thisinformation, a researcher can use the tables provided to determine anappropriate sample size for their study. Tables are also provided toillustrate the reduction in power from decreased reliability for given samplesizes. The computer program will be made available through the World Wide Webto help researchers determine the actual statistical power they can expect fortheir studies with less than perfect reliability. (Contains 1 figure, 6tables, 6 charts, and 27 references.) (Author/SLD)
Reproductions supplied by EDRS are the best that can be madefrom the original document.
U.S. DEPARTMENT OF EDUCATIONOff ice of Educational Research and Improvement
EDU ATIONAL RESOURCES INFORMATIONCENTER (ERIC)
This document has been reproduced asreceived from the person or organizationoriginating it.Minor changes have been made toimprove reproduction quality.
Points of view or opinions stated in thisdocument do not necessarily representofficial OERI position or policy.
Power and Reliability - 1
PERMISSION TO REPRODUCE ANDDISSEMINATE THIS MATERIAL HAS
BEEN GRANTED BY
G. 6t-00).45
TO THE EDUCATIONAL RESOURCESINFORMATION CENTER (ERIC)
1
Power and Reliability for Correlation and ANOVA
Gordon P. Brooks
Gibbs Y. Kanyongo
Lydia Kyei-Blankson
Gulsah Gocmen
Ohio University
Paper presented at the annual conference of the American Educational Research
Association, April 1-5, 2002, New Orleans, LA
BEST COPY AVAILABLE.2
Power and Reliability - 2
Abstract
Unfortunately, researchers do not usually have measurement instruments that
provide perfectly reliable scores. Therefore, the researcher may want to account for the
level of unreliability by appropriately increasing the sample size. For example, the results
of a pilot study may indicate that a particular instrument is not as reliable with a given
population as it has been with other populations. Using this information, a researcher can
use the tables provided to determine an appropriate sample size for their study. Tables are
also provided that illustrate the reduction in power from decreased reliability for given
sample sizes. Also, the computer program will be made available through the World
Wide Web to help researchers determine what the actual statistical power they can expect
for their studies with less-than-perfect reliability.
3
Power and Reliability - 3
Power and Reliability for Correlation and ANOVA
Students of statistics usually become familiar with the factors that affect
statistical power. For example, most students learn that sample size, level of significance,
and effect size all determine the power of a statistical analysis. Additionally, some know
that how effectively a particular design reduces error variance affects power, as does the
directionality of the alternative hypothesis. However, many students do not realize that
the reliability of measurements may also affect the statistical pOwer (Hopkins & Hopkins,
1979). The purpose of this paper is (1) to explain the relationship between reliability and
statistical power and (2) to provide sample size tables that account for reduced reliability.
A series of Monte Carlo analyses were conducted to determine the sample sizes required
when measurements are not perfectly reliable. Several statistical methods will be
investigated, including (1) Pearson correlation, (2) Spearman rank correlation, and (3)
analysis of variance.
Background
One of the chief functions of experimental design is to ensure that a study has
adequate statistical power to detect meaningful differences, if indeed they exist (Hopkins
& Hopkins, 1979). There is a very good reason researchers should worry about power a
priori. If researchers are going to invest a great amount of money and time in carrying out
a study, then they would certainly want to have a reasonable chance, perhaps 70% or
80%, to find a difference between groups if it does exist. Thus, a priori power (the
probability of rejecting a null hypothesis that is false) will inform researchers how many
subjects per group will be needed for adequate power.
Several factors affect statistical power. That is, once the statistical method and the
4
Power and Reliability - 4
alternative hypothesis have been set, the power of a statistical test is directly dependent
on the sample size, level of significance, and effect size (Stevens, 2002). Often
overlooked, however, is the relationship that variance has with power. Specifically,
variance influences power through the effect size. For example, Cohen (1988) defined the
effect for the t statistic as 8 = p.0) / An An applied example is that because
variance is reduced, analysis of covariance is more powerful than analysis of variance
when a useful covariate is utilized. Other variance reduction techniques include using a
more homogeneous population and improving the reliability of measurements (Aron &
Aron, 1997; Zimmerman, Williams, & Zumbo, 1993).
Reliability and Effect Size
Cleary and Lim (1969) reported that "in the derivation and interpretation of
statistical tests, the observations are generally considered to be free of error of
measurement" (p. 50). From a classical test theory perspective, an individual's observed
score (X) is the sum of true score (T) and error score (E); that is, X = T + E. Therefore,
if there is no error of measurement, then the observations are the true scores. For a set of
scores, measurements made without error occur only when the instruments provide
perfectly reliable scores. Observed score variance, o2x, is defined as the sum of true score
variance, a2T, and measurement error variance, 13E2. Because reliability, pxx,, is defined as
the ratio of true score variance to observed score variance, Rice = aT/ox = 1 crE/ox,
reliability can only be perfect (i.e., pxx, = 1.0) when there is no measurement error
(Lord & Novick, 1968).
Because ox can be written as or / Rice, the standardized effect size for the t test
can be written as S = / ar (Levin & Subkoviak, 1977; Williams &
5
Power and Reliability - 5
Zimmerman, 1989). Consequently, reliability affects statistical power indirectly through
effect sizes. Cohen (1988) reported that reduced reliability results in reduced effect sizes
in observed data (ES), which therefore reduces power. That is, observed effect sizes,
ES = ESP * rte,, where ESP is the population effect size. When reliability is perfect,
observed ES equals the true population ES; but when reliability is less than perfect,
ESP * is a value smaller than the true effect size. Therefore, effect sizes are reduced
when measurement error exists. Some introductory statistics textbooks discuss this
problem in reference to attenuation in correlation due to unreliability of measures (e.g.,
Glass & Hopkins, 1996).
Reliability and Power
Controversy surrounds the relationship between power and reliability (Williams
& Zimmerman, 1989). For example, good statistical power can exist with poor reliability
and a change in variance can be unrelated to reliability can change power. However,
there are persuasive reasons to consider reliability as an important factor in determining
statistical power.
There is no controversy that statistical power depends on observed variance.
Zimmerman and Williams (1986) noted that when speaking of statistical power it is
irrelevant whether the variance measured is true score variance or observed score
variance; that is, "the greater the observed variability of a dependent variable, whatever
its source, the less is the power of a statistical test" (p. 123). But because reliability is
defined by observed variance in conjunction with either true or error variance, one cannot
be certain which is changed when reliability improves. That is, if observed variance
increases, we cannot be certain whether the increase is due to an increase in true score
Power and Reliability - 6
variance or a increase in error variance, or both. Or as Zimmerman, Williams, & Zumbo
(1993) reported, power changes as reliability changes only if observed score variance
changes simultaneously.
However, if we assume (1) that true variance is a fixed value for the given
population and (2) that improved reliability results in less measurement error, then it
follows that a change in reliability will result in a change in observed score variance.
Indeed, statistical power is a mathematical function of reliability only if either true score
variance or error variance is a constant; otherwise power and reliability are simply related
(Cohen, 1988; Williams & Zimmerman, 1989). But improvement in reliability is usually
interpreted as a reduction in the measurement error variance that occurs from a more
precise measurement (Zimmerman & Williams, 1986). Therefore, a reduction in
reliability that is accompanied by an increase in observed score variance will indeed
reduce statistical power (Zimmerman, Williams, & Zumbo, 1993b). That is, if true score
variance remains constant but lower reliability leads to increased error variance, then
statistical power will be reduced because of the increased observed score variance (cf.
Humphreys, 1993). It becomes apparent then that "failure to reject the null hypothesis
with observed scores is obviously not equivalent to a failure to reject the null hypothesis
with true scores" (Cleary & Linn, 1969, p. 50).
Based on such an assumption, for example, Light, Singer and Willett (1990)
advised that when measurements are less than perfectly reliable, improving the power of
statistical tests involves a decision either to increase sample size or to increase
reliabilitythe researcher must compare the costs associated with instrument
improvement to the costs of adding study participants (see also Cleary & Linn, 1969;
7

Power and Reliability - 7
Fe ldt & Brennan, 1993). Researchers may encounter such a situation if an instrument
does not perform as reliably in a given study as it has elsewhere, leading to increased
variance in the current project. Assuming that the increased variance is not due to more
heterogeneity in the population and that the true score variance of the population hasn't
changed, the observed score variance will change as a consequence of the change in
reliability.
Power is a function of level of significance, sample size, and effect size only
under the assumption of no measurement error, but our measures in the social sciences
are typically not measured perfectly (Cleary & Linn, 1969; Levin & Subkoviak, 1977).
Indeed, the implicit assumption that our measures are perfectly reliable is not justified in
practice (Crocker & Algina, 1986; Sutcliffe, 1958). Measurement error in the dependent
variable should be considered a priori for sample size and post hoc for power (Subkoviak
& Levin, 1977).
Unfortunately, there are few easy ways to account for reliability when
determining sample sizes. The tables found in Cohen (1988) do not provide the option to
vary reliability. Computer programs such as SamplePower and PASS 2000 also assume
perfect reliability. Along the same lines of work done by Kanyongo, Kyei-Blankson, and
Brooks (2001), this paper will report on the impact of reliability on power as well as
provide tables to assist researchers in finding sample sizes necessary with fallible
measures.
Method
Two Monte Carlo programs, MC2G (Brooks, 2002) and MC3G (Brooks, 2002)
written in Delphi Pascal, were used to create normally distributed but unreliable data and
Power and Reliability - 8
perform analyses for several statistical methods, including Pearson correlation, Spearman
rank correlation, and analysis of variance (ANOVA) with three levels. The programs
were used to create power and sample size tables for these tests. Reliability was varied
from .70 to 1.0 in increments of 0.05. For power tables, power rates will vary from .70 to
.90 by .10. Population effect sizes were varied from small to large using Cohen's (1988)
conventional standards. Specifically, for correlations, a small effect was set at r = .10,
medium was r = .30, and a large effect was set to be r = .50; for ANOVA, a small
standardized difference effect was set at f = .10, medium was f = .25, and large was
f = .40.
Statistical power tables for given sample sizes are based on empirical Monte
Carlo results of 100,000 iterations; the sample size tables were based on 10,000
simulated samples. For the power tables, the sample sizes were obtained under the
assumption of perfect reliability. That is, the sample sizes were fixed at the values needed
to achieve power levels of .70, .80 and .90 when reliability was 1.0. The remaining
values in the power tables were determined by systematically varying the reliability with
that given sample size. For the sample sizes tables, power was fixed, reliability was
varied, and sample sizes were tried until the required power was achieved.
Data Generation
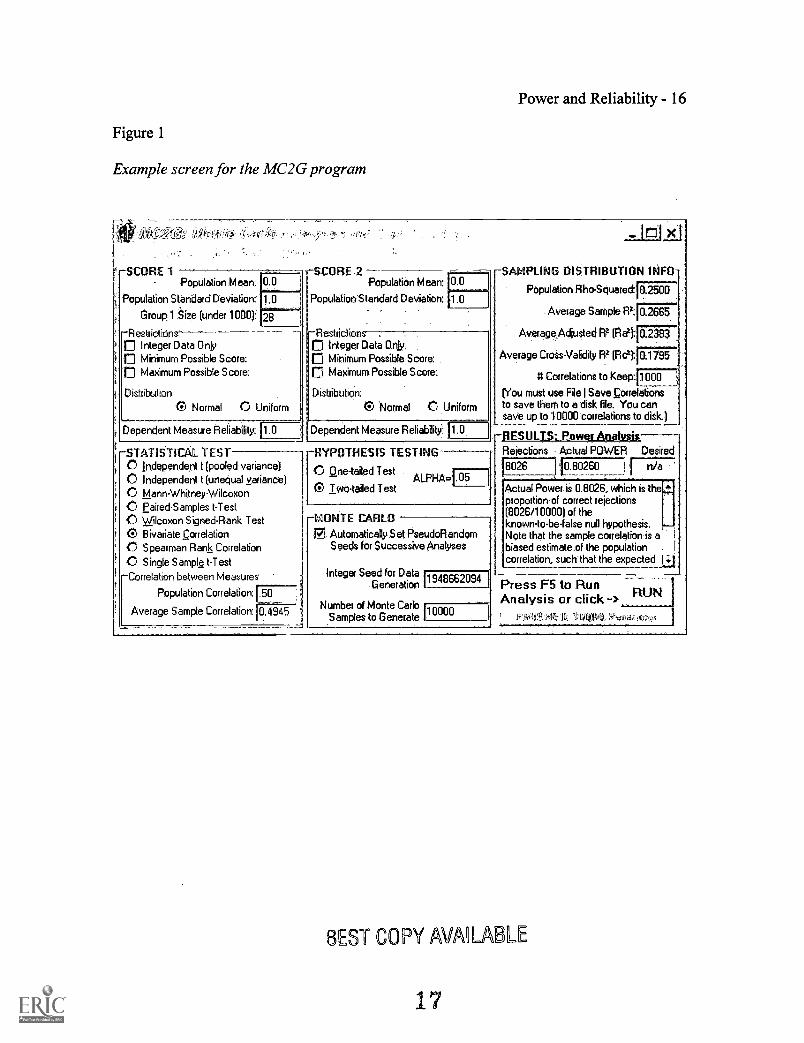
For each analysis, the researchers entered appropriate information into the
program. For example, the values for large effect size of r = .50 and reliability or .90
were provided as input to the program (see Figure 1). The programs generate uniformly
distributed pseudorandom numbers to be used as input to the procedure that will convert
9
Power and Reliability - 9
them into normally distributed data. For each sample, the appropriate statistical analysis
is performed. The number of correct rejections of the null hypothesis is stored and
reported by the program. These procedures were repeated as necessary for each sample
condition created.
The L'Ecuyer (1988) generator was chosen for the programs. Specifically, the
FORTRAN code of Press, Teukolsky, Vetterling, and Flannery (1992), was translated
into Delphi Pascal. The L'Ecuyer generator was chosen because of its large period and
because combined generators are recommended for use with the Box-Muller method for
generating random normal deviates, as will be the case in this study (Park & Miller,
1988). The computer algorithm for the Box-Muller method used in this study was
adapted for Delphi Pascal from the standard Pascal code provided by Press, Flannery,
Teukolsky, and Vetterling, 1989. Extended precision floating point variables were used,
providing the maximum possible range of significant digits. Simulated samples were
chosen randomly to test program function by comparison with results provided by SPSS
for Windows version 10.1.
The programs generate normally distributed data of varying reliability based on
classical test theory. That is, reliability is not defined using a particular measure of
reliability (e.g., split-half or internal consistency); rather it is defined as the proportion of
raw score variance explained by true score variance, or/ or or equivalently 1 aE/ax.
Each raw score generated is taken to be a total score. The program user enters (1) the
expected true score variance for the population and (2) a reliability estimate.
Consequently, as reliability decreases, raw score variance increases as compared to the
given true score variance. For correlation analyses, the same reliability was used for both
10
Power and Reliability - 10
measures.
Monte Carlo Simulations
The number of iterations for the study is based on the procedures provided by
Robey and Barcikowski (1992). Significance levels for both tests on which Robey and
Barcikowski's method is based were set at a = .05 with (1 (3) = .90 as the power
level; the magnitude of departure was chosen to be a ± .2a, which falls between their
intermediate and stringent criteria for accuracy. The magnitude of departure is justified
by the fact that at ±.2a, the accuracy range for a = .05 is .04 s a s .06. Based on the
calculations for these parameters (this set of values was not tabled), 5422 iterations
would be required to "confidently detect departures from robustness in Monte Carlo
results" (Robey & Barcikowski, 1992, p. 283), but applies to power studies also (Brooks,
Barcikowski, & Robey, 1999). However, to assure even greater stability in the results, a
larger number of simulations was chosen for each type of analysis. Specifically, 100,000
samples were used for the power tables, but because the determination of sample sizes is
a much slower process, only 10,000 simulated samples were used in creating those tables.
Results
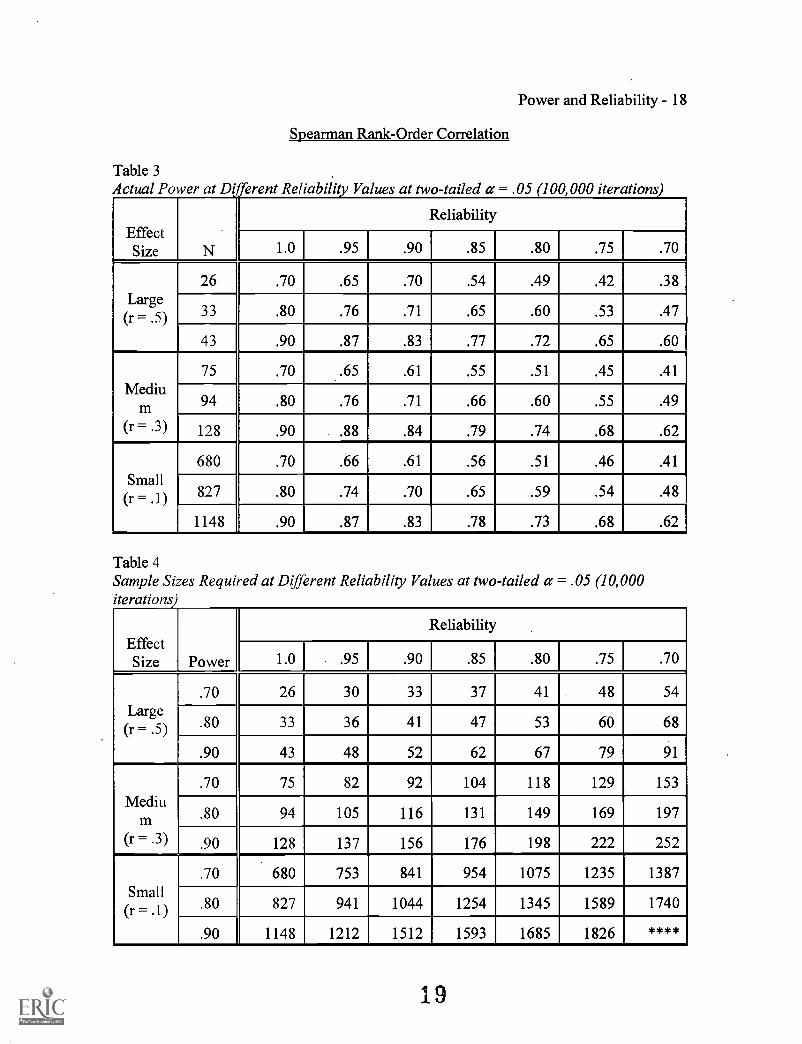
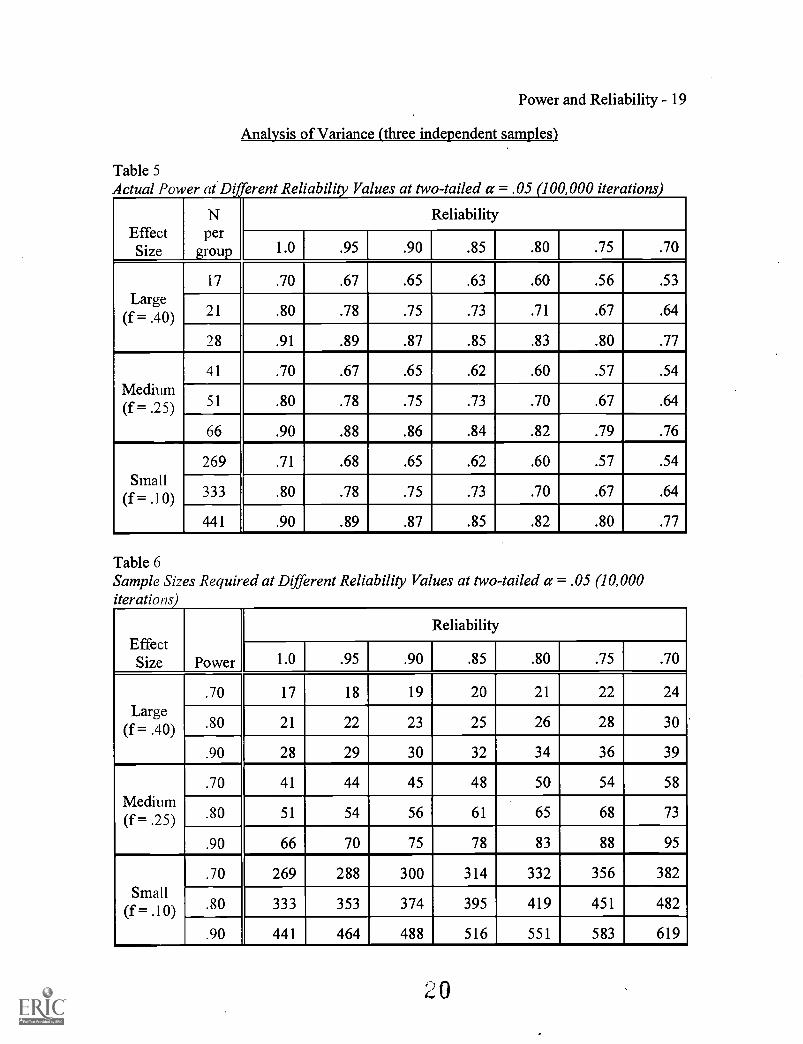
Table 1, Table 3, and Table 5 show the relationship between statistical power and
reliability for the Pearson product-moment correlation, Spearman rank-order correlation,
and ANOVA, respectively. There is a relatively linear relationship between the two when
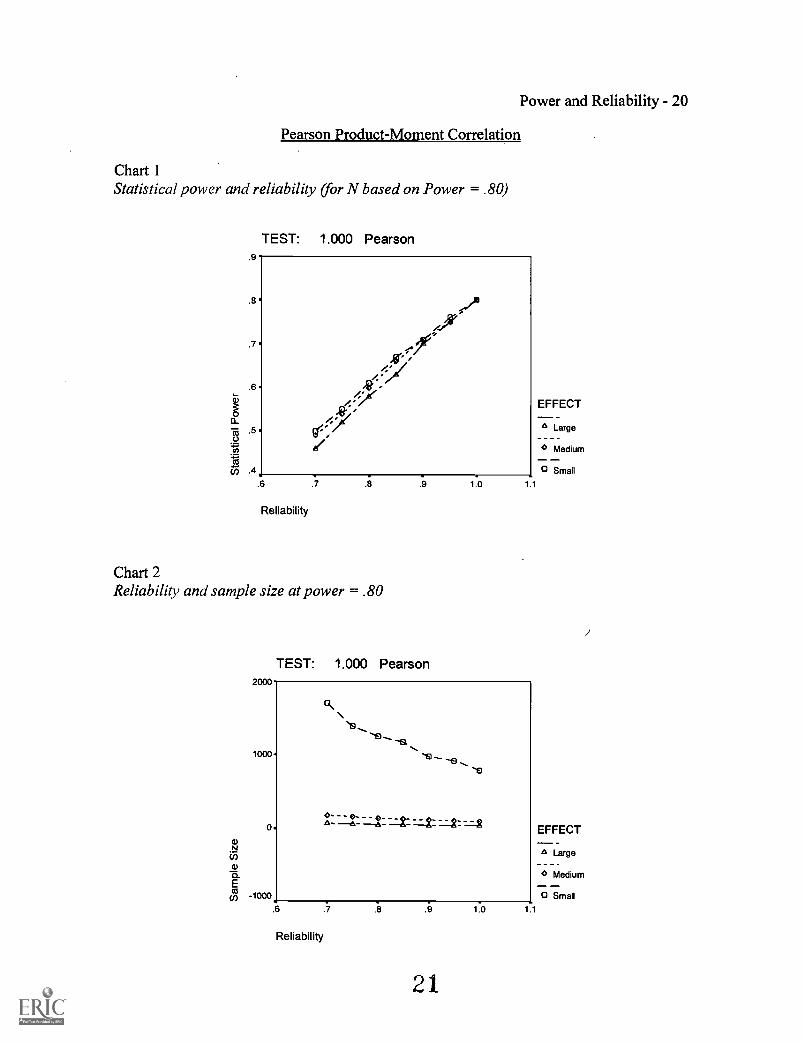
sample size is fixed (variations are due to the Monte Carlo sampling process). Chart 1,
Chart 3, and Chart 5 show graphical representations of these relationships. This
relationship is roughly the same for all tests at all effect sizes. When reliability changes,
the observed score variance changes, and any change in reliability that increases
11
Power and Reliability - 11
observed score variance reduces statistical power. Similarly, increasing reliability
increases power.
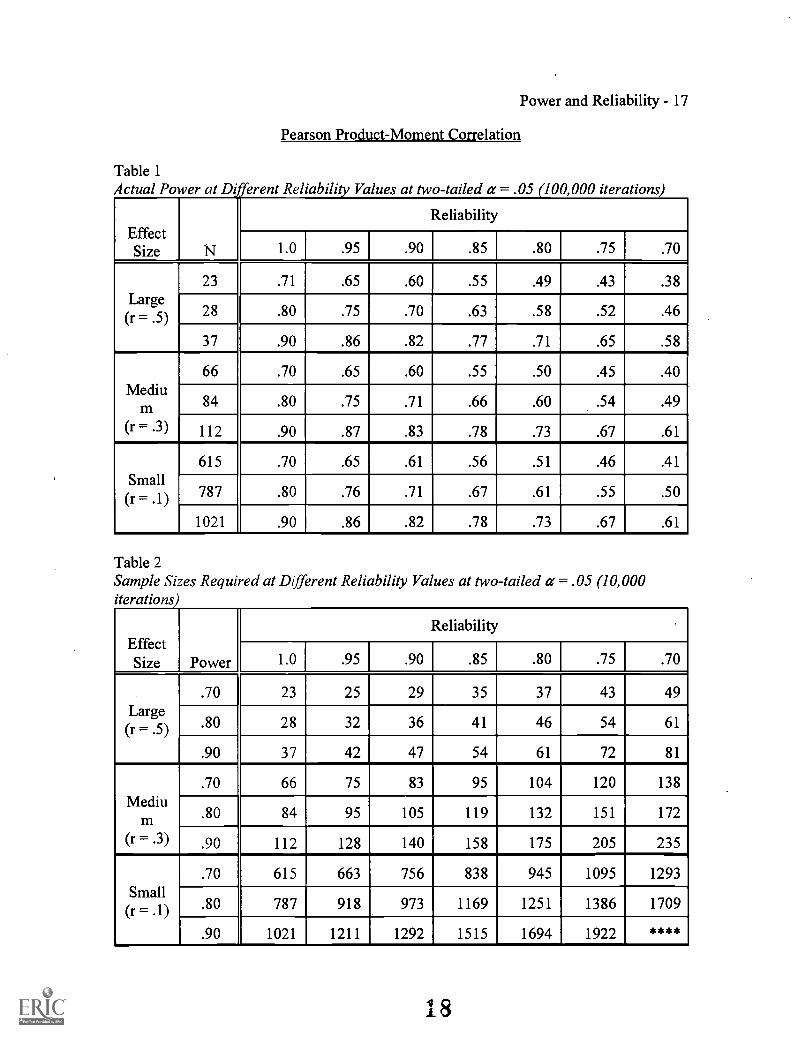
For example, Table 1 shows that when statistical power is chosen to be .80 for a
Pearson correlation, 28 cases are required when perfect reliability is assumed and a large
effect size (a correlation of .50) is expected. When reliability was changed to .90, the
actual statistical power was observed to be .70. Reliability set at .80 resulted in observed
statistical power of .58. Finally, actual power was .46 when reliability was set at .70.
Such depreciation of power occurs also with t-tests and their nonparametric alternatives.
Table 2, Table 4, and Table 6 show the change in sample size required for
analyses in order to maintain a given power level when reliability is less than perfect.
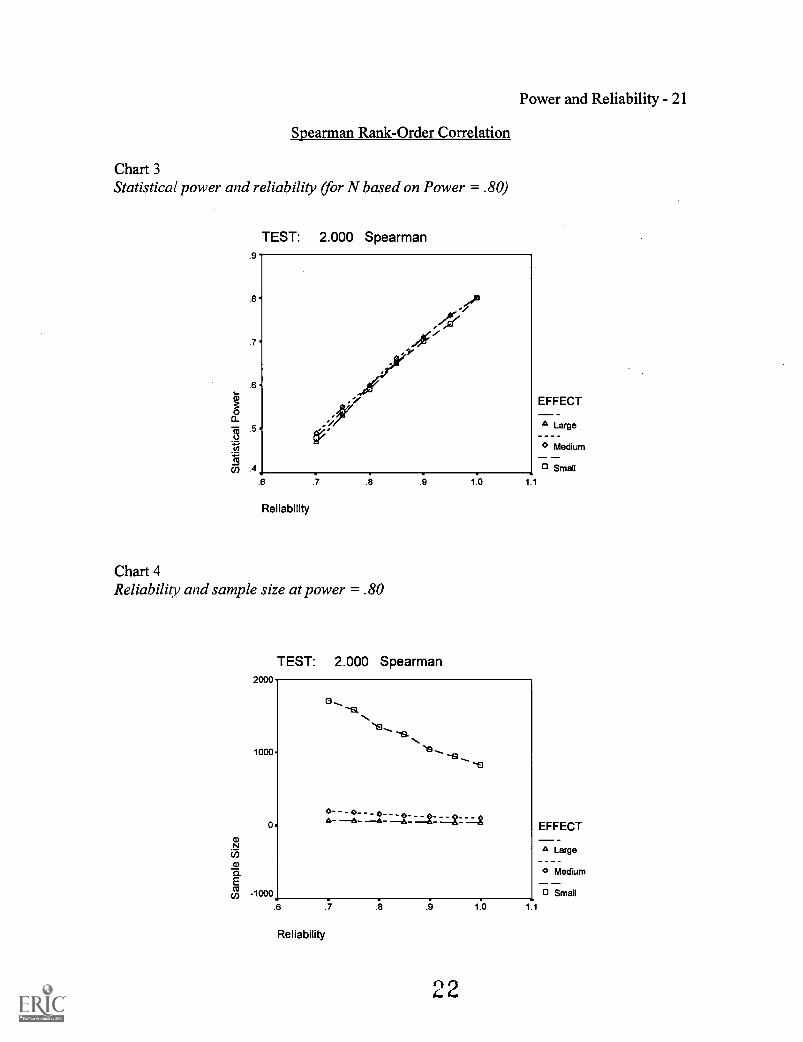
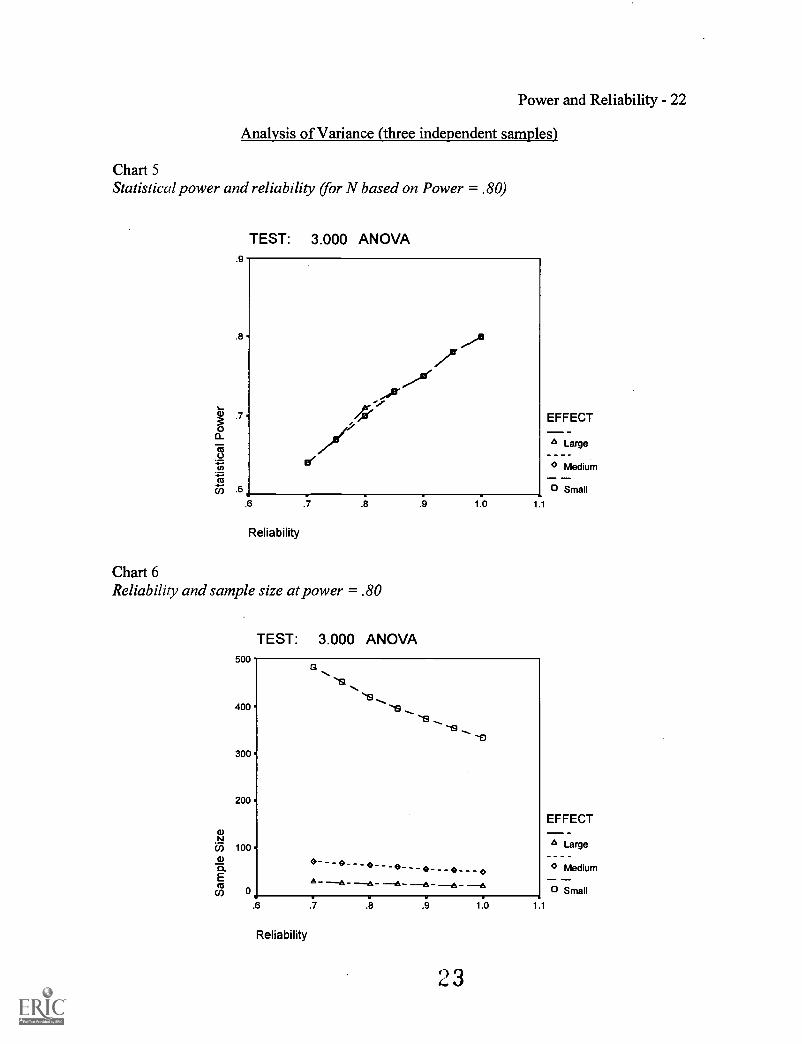
Again, there are relatively linear relationships for all tests at all power levels. Chart 2,
Chart 4, and Chart 6 show that sample sizes must increase much more dramatically for
smaller effect sizes. For example, Table 2 shows that when the desired statistical power
level is set at .80 and a large effect size (a correlation of .50) is expected, the use of 28
cases results in power of .80 when reliability is 1.0; but when reliability is reduced to .90,
36 cases are required. If reliability is .80, then the study needs 46 participants. Finally,
61 cases must be used to achieve power of .80 when reliability is .70.
Conclusions
In social sciences, few things are measured perfectly (Subkoviak & Levin, 1977).
However, by making judicious design decisions, one can improve the quality of his or her
measurements. To begin with, the researcher needs to understand what influences
measurement quality or helps to reduce measurement error. There are three main sources
of errors: (a) flaws in the instrument and its administration, (b) random fluctuations over
12
Power and Reliability - 12
time in subjects measured, and (c) disagreement among raters or scores (Light, Singer &
Willet, 1990). Knowing what the sources of error are and how they get into
measurements helps in improving the quality of measurement.
Researchers should make an effort to minimize the effects of measurement error.
There are several strategies that have been developed for minimizing the effects of
measurement error and increasing reliability. These include revising items, increasing the
number of items, lengthening item scales, administering the instrument systematically,
timing of data collection and use of multiple raters or scores (Light, Singer & Willet,
1990). Effect of measurement fallibility on power and on sample size is most dramatic
for small effect size.
Before one chooses a fmal sample size, the possibility of measurement error
should be considered. To determine sample sizes "without simultaneously considering
errors of measurement is to live in a 'fool's paradise" (Levin & Subkoviak, 1977, p.
337). If one suspects that measurement error exists and there is no viable means to reduce
it, sample size should be increased accordingly. Researchers can identify potential
problems with measurement error through pilot studies or previous research. Where
reliability information is lacking, the researcher should use cautious estimates, with a
preference toward more conservative values, when deciding sample sizes in the presence
of less-than-perfect reliability (Levin & Subkoviak, 1977). Light, Singer, and Willett
(1990) provided tables to illustrate the point. Unfortunately, their tables provide only a
very few situations and are therefore limited in their usefulness. The present study
extends their tables and provides such information for additional statistical methods.
13
Power and Reliability - 13
References
Aron, A., & Aron, E. N. (1997). Statistics for the behavioral and social sciences: A brief
course. Upper Saddle River, NJ: Prentice Hall.
Brooks, G. P. (2002). MC2G: Monte Carlo Analyses for 1 or 2 Groups (Version 2.2.3
AERA) [Computer software]. Retrieved from
http://oak.cats.ohiou.edui-brooksg/mc2g.htm
Brooks, G. P. (2002). MC3G: Monte Carlo Analyses for 3 Groups. (Version 1.1.1
AERA) [Computer software]. Retrieved from
http://oak.cats.ohiou.edu/e-brooksg/mc3g.htm
Brooks, G. P., Barcikowski, R. S., and Robey, R. R. (1999, April). Monte Carlo
simulation for perusal and practice. Paper presented at the meeting of the
American Educational Research Association, Montreal, Quebec, Canada.
Cleary, T. A., & Linn, R. L. (1969). Error of measurement and the power of a statistical
test. British Journal of Mathematical and Statistical Psychology, 22, 49-55.
Cohen, J. (1988). Statistical power analysis for the behavioral sciences (2nd ed.).
Hillsdale, NJ: Lawrence Erlbaum Associates.
Crocker, L. & Algina, J. (1986). Introduction to classical and modern test theory. Fort
Worth, TX: Holt, Rinehart, & Winston.
Feldt, L. S., & Brennan, R. L. (1993). Reliability. In R. L. Linn (Ed.). Educational
measurement (pp. 105-146). Phoenix, AZ: Oryx.
Glass, G. V., & Hopkins, K. D. (1996). Statistical methods in education and psychology
(3rd ed.). Boston: Allyn & Bacon.
Hopkins, K. D., & Hopkins, B. R. (1979). The effect of the reliability of the dependent
14
Power and Reliability - 14
variable on power. Journal of Special Education, 13, 463-466.
Humphreys, L. G. (1993). Further comments on reliability and power of significance
tests. Applied Psychological Measurement, 17, 11-14.
Kanyongo, G., Kyei-Blankson, L., & Brooks, G. P. (2001, October). The reliability of
power: How reliability affects statistical power. Paper presented at the meeting of
the Mid-Western Educational Research Association, Chicago, IL.
L'Ecuyer, P. (1988). Efficient and portable combined random number generators.
Communications of the ACM, 31, 742-749, 774.
Levin, J. R., & Subkoviak, M. J. (1977). Planning an experiment in the company of
measurement error. Applied Psychological Measurement, 1, 331-338.
Light, R. J., Singer, J. D., & Willett, J. B. (1990). By design: Planning research on
higher education. Cambridge, MA: Harvard University.
Lord, F. M., & Novick, M. R. (1968). Statistical theories of mental test scores. Reading,
MA: Addison-Wesley.
Nicewander, W. A. & Price J. M. (1983). Reliability of measurement and the power of
statistical tests: Some new results. Psychological Bulletin, 94, 524-533.
Park, S. K., & Miller, K. W. (1988). Random number generators: Good ones are hard to
find. Communications of the ACM, 31, 1192-1201.
Press, W. H., Flannery, B. P., Teukolsky, S. A., & Vetterling, W. T. (1989). Numerical
recipes in Pascal: The art of scientific computing. New York: Cambridge
University.
Press, W. H., Teukolsky, S. A., Vetterling, W. T., & Flannery, B. P. (1992). Numerical
recipes in FORTRAN: The art of scientific computing (2nd ed.). New York:
Power and Reliability - 15
Cambridge University.
Robey, R. R., & Barcikowski, R. S. (1992). Type I error and the number of iterations in
Monte Carlo studies of robustness. British Journal of Mathematical and
Statistical Psychology, 45, 283-288.
Stevens, J. (2002). Applied multivariate statistics for the social sciences (4th ed.).
Mahwah, NJ: Lawrence Erlbaum Associates.
Subkoviak, M. J., & Levin, J. R. (1977). Fallibility of measurement and the power of a
statistical test. Journal of Educational Measurement, 14, 47-52.
Sutcliffe, J. P. (1958). Error of measurement and the sensitivity of a test of significance.
Psychometrika, 23, 9-17.
Williams, R. H., & Zimmerman, D. W. (1989). Statistical power analysis and reliability
of measurement. Journal of General Psychology, 116, 359-369.
Zimmerman, D. W., & Williams, R. H. (1986). Note on the reliability of experimental
measures and the poser of significance tests. Psychological Bulletin, 100, 123-
124.
Zimmerman, D. W., Williams, R. H., & Zumbo, B. D. (1993). Reliability of
measurement and power of significance tests based on differences. Applied
Psychological Measurement, 17, 1-9.
16
Power and Reliability - 16
Figure 1
Example screen for the MC2G program
SCORE 1Population Mean:
Population Standard Deviation:
Group 1 Size (under 1000):
Restriction,Integer Data OnlyMinimum Possible Score:Maximum Possible Score:
4
Distribution,
0.0
1.0
28
SCORE 2Population Mean:
Population Standard Deviation:
G Normal 0 Uniform
Dependent Measure Reliability:11.0
RestrictionInteger Data OnlyMinimum Possible Score:
Cl Maximum Possible Score:
Distribution:
0.0
1.0
0 Normal Uniform
Dependent Measure Reliability: 11.0
STATISTICAL TESTC independent t (pooled variance)O Independent I (unequal variance)O Mann-Whitney-WilcoxonO Paired-Samples t-TestO Wilcoxon Signed-Rank TestO Bivariate CorrelationO Spearman Rank CorrelationO Single Sample t-Test
Correlation between Measures
Population Correlation:1.50
Average Sample Correlation: 0.4945
HYPOTHESIS TESTING
C) One-tailed Test
G Two-tailed TestALPHA= .05
MONTE CARLOAutomatically Set PseudoRandomSeeds for Successive Analyses
Integer Seed for DataGeneration
Number of Monte CarloSamples to Generate
11948662094
10000
SAMPLING DISTRIBUTION INFO
Population Rho - Squared: 0:2500
_ Average Sample F11: 1072T
Average, Adjusted (Ra2Y 0283
Average CroisVddity R= (Rca): 0.115
11 Correlations to Keep: 1000
(You must use File I Save Correlationsto save them to a" disk file. You cansave up to 10000 correlations to disk)
RESULTS: Power AnalysisRejections Actual POWER Desired
8=10.80260 J. 1"--ntrActual Power is 0.8026, which is theproportion of correct rejections(8026/10000) of theknown-to-be-false null hypothesis.Note that the sample correlation is abiased estimated the population ,
correlation, such that the expected I
Press F5 to RunRUNAnalysis or click ->
1.404..;10
BEST COPY AVAILABLE
17
Power and Reliability - 17
Pearson Product-Moment Correlation
Table 1Actual Power at Different Reliability Values at two-tailed a = .05 100,000 iterations
EffectSize N
Reliability
1.0 .95 .90 .85 .80 .75 .70
Large(r ...: .5)
23 .71 .65 .60 .55 .49 .43 .38
28 .80 .75 .70 .63 .58 .52 .46
37 .90 .86 .82 .77 .71 .65 .58
Medium
(I. .3)
66 .70 .65 .60 .55 .50 .45 .40
84 .80 .75 .71 .66 .60 .54 .49
112 .90 .87 .83 .78 .73 .67 .61
Small(r = .1)
615 .70 .65 .61 .56 .51 .46 .41
787 .80 .76 .71 .67 .61 .55 .50
1021 .90 .86 .82 .78 .73 .67 .61
Table 2Sample Sizes Required at Different Reliability Values at two-tailed a = .05 (10,000iterations)
EffectSize Power
Reliability
1.0 .95 .90 .85 .80 .75 .70
Large(r = .5)
.70 23 25 29 35 37 43 49
.80 28 32 36 41 46 54 61
.90 37 42 47 54 61 72 81
Medium
(1. .3)
.70 66 75 83 95 104 120 138
.80 84 95 105 119 132 151 172
.90 112 128 140 158 175 205 235
Small(r = .1)
.70 615 663 756 838 945 1095 1293
.80 787 918 973 1169 1251 1386 1709
.90 1021 1211 1292 1515 1694 1922 ****
18
Power and Reliability - 18
Spearman Rank-Order Correlation
Table 3Actual Power at Different Reliability Values at two-tailed a = .05 100,000 iterations
EffectSize N
Reliability
1.0 I .95 .90 .85 .80 .75 I .70
Large(r = .5)
26 .70 .65 .70 .54 .49 .42 .38
33 .80 .76 .71 .65 .60 .53 .47
43 .90 .87 .83 .77 .72 .65 .60
Medium
(I. = .3)
75 .70 .65 .61 .55 .51 .45 .41
94 .80 .76 .71 .66 .60 .55 .49
128 .90 .88 .84 .79 .74 .68 .62
Small(r = .1)
680 .70 .66 .61 .56 .51 .46 .41
827 .80 .74 .70 .65 .59 .54 .48
1148 .90 .87 .83 .78 .73 .68 .62
Table 4Sample Sizes Required at Different Reliability Values at two-tailed a = .05 (10,000iterations
EffectSize Power
Reliability
1.0 .95 .90 .85 .80 .75 .70
Large(r
.70 26 30 33 37 41 48 54
80 33 36 41 47 53 60 68
.90 43 48 52 62 67 79 91
Medium
(1. .3)
.70 75 82 92 104 118 129 153
.80 94 105 116 131 149 169 197
.90 128 137 156 176 198 222 252
Small(r = .1)
.70 680 753 841 954 1075 1235 1387
80 827 941 1044 1254 1345 1589 1740
.90 1148 1212 1512 1593 1685 1826 ****
19
Power and Reliability - 19
Analysis of Variance (three independent samples)
Table 5Actual Power at Different Reliability Values at two-tailed a = .05 (100,000 iterations
EffectSize
Nper
group
Reliability
1.0 .95 .90 .85 .80 .75 .70
Large(f = .40)
17 .70 .67 .65 .63 .60 .56 .53
21 .80 .78 .75 .73 .71 .67 .64
28 .91 .89 .87 .85 .83 .80 .77
Medium(f.= .25)
41 .70 .67 .65 .62 .60 .57 .54
)1 .80 .78 .75 .73 .70 .67 .64
66 .90 .88 .86 .84 .82 .79 .76
Small(f = .10)
269 .71 .68 .65 .62 .60 .57 .54
333 .80 .78 .75 .73 .70 .67 .64
441 .90 .89 .87 .85 .82 .80 .77
Table 6Sample Sizes Required at Different Reliability Values at two-tailed a = .05 (10,000iterations)
EffectSize Power
Reliability
1.0 .95 .90 .85 .80 .75 .70
Large(f = .40)
.70 17 18 19 20 21 22 24
.80 21 22 23 25 26 28 30
.90 28 29 30 32 34 36 39
Medium(f _
.70 41 44 45 48 50 54 58
.80 51 54 56 61 65 68 73
.90 66 70 75 78 83 88 95
Small(f
.70 269 288 300 314 332 356 382
.80 333 353 374 395 419 451 482
.90 441 464 488 516 551 583 619
TEST: 1.000 Pearson.9
.8
.7
.6
.5
Power and Reliability - 20
Pearson Product-Moment Correlation
Chart 1Statistical power and reliability (for N based on Power = .80)
.4
.6
Reliability
.7 .8
Chart 2Reliability and sample size at power = .80
.9
TEST: 1.000 Pearson2000
1.0
EFFECT-
A Large
0 Medium
Small
11
1000.
a- 6- 6_ _0. EFFECT
N A Large- - -
MediumE
-woo. 0 Small.6 .8
Reliability
.7 .9
21
1.0 11
TEST: 2.000 Spearman9
.8
.7
.6
.5
.4
.6
Reliability
Spearman Rank-Order Correlation
Chart 3Statistical power and reliability (for N based on Power = .80)
Power and Reliability - 21
.8
Chart 4Reliability and sample size at power = .80
.9
TEST: 2.000 Spearman2000
1000
1.0
EFFECT
A Large- - -
Medium
Small
1.1
0
4)N
E
co -1000
0,
-s-s
A- A- --A - --a- 2- =1: =2
.6 .7
Reliability
.9
22
1.0
EFFECT
A Large- - - -o Medium
o Small11
.9
.8
Power and Reliability - 22
Analysis of Variance (three independent samples)
Chart 5Statistical power and reliability (for N based on Power = .80)
TEST: 3.000 ANOVA
.7
.6
.6 .7
Reliability
Chart 6Reliability and sample size at power = .80
500
TEST: 3.000 ANOVA
.9 1.0
EFFECT
Large
0 Medium
0 Small11
400
300
200
'13
EFFECT
N6) 100 A Large
0 Medium
as os 0 Small.6 .7 1.0
A - --6 - - --6 - -
.9
Reliability
23
11
U.S. Department of EducationOffice of Educational Research and Improvement (OERI)
National Library of Education (NLE)Educational Resources Information Center (ERIC)
Reproduction Release(Specific Document)
I. DOCUMENT IDENTIFICATION:Title:
Power and Reliability for Correlation and ANOVA
Author(s):
TM034262
ERIC
Brooks, Gordon P., Kanyongo, Gibbs Y., Kyei-Blankson, Lydia, & Gocmen, Gulsah
Corporate Source: iPublication Date: April 2002 presentationa t. ion
II. REPRODUCTION RELEASE:In order to disseminate as widely as possible timely and significant materials of interest to the educational community, documentsannounced in the monthly abstract journal of the ERIC system, Resources in Education (RIE), are usually made available to users inmicrofiche, reproduced paper copy, and electronic media, and sold through the ERIC Document Reproduction Service (EDRS). Credit isgiven to the source of each document, and, if reproduction release is granted, one of the following notices is affixed to the document.
If permission is granted to reproduce and disseminate the identified document, please CHECK ONE of the following three options andsign in the indicated space following.
The sample sticker shownLevel
--,below will be affixed to all :
I documentsThe sample sticker shown below will be affixed to all
Level 2A documentsThe sample sticker shown below will be affixed to all
Level 2B documents. .
PERMISSION TO REPRODUCE ANDDISSEMINATE TALC :MATERIAL I IAS
filli-X431LAN i in'
PEpiissIoN TaltEPRODUCE ANDDISSEMINATE nirs NIATERIAL IN
tiIICROFIETIE. AND IN EL ECIAON/C MEII/Arolf:tRICCOLLEellt1N,SUIISCIOBERS ONLY,
ilAS BEEN URAN 1. BY
PERMISSION TO REPRODUCE; ANDDISsEmINATE TIIIS MATERIAL IN
MICROVICII P. ONLY OAS p IN GRANTlip BY
10111E:EDUCATIONAL RESOURCESINFORMATION CIINFER IERIC)
1'0'1 I i E MLR:A l'IONAL RESOURCESINFORMATION CIX11 ilf (liKtCy'CHIC' EDucoatkiNAL RESOURCES
INTDIOATIOfy; CCNTOtitititc)
Level 1 Level 2A.... .
Level 2B
t t tV _ II
Check here for Level I release, permitting reproductionand dissemination in microfiche or other ERIC archival :
media (e.g. electronic) and paper copy.:
..._ .
Check here for Level 2A release, permittingreproduction and dissemination in microfiche and in
electronic media for ERIC archival collection subscribersonly
Check here for Level 2B release, permitting reproductionand dissemination in microfiche only
Documents will be processed as indicated provided reproduction quality permits.If permission to reproduce is granted, but no box is checked, documents will be processed at Level I.
I hereby grant to the Educational Resources Information Center (ERIC) nonexclusive permission to reproduce and disseminate thisdocument as indicated above. Reproduction from the ERIC microfiche, or electronic media by persons other than ERIC employees andits system contractors requires permission from the copyright holder. Exception is made for non-profit reproduction by libraries andother service agencies to satisfy information needs of educators in response to discrete inquiries.
Printed Name/Position/Title:Signature:
1Y141144 Gordon P. Brooks/Assistant Professor
Organization/Address:
McCracken HallOhio UniversityAthens, OH 45701
Telephone:740-593-0880 Fax: 740-593-0477
E-mail Address:
May 27, 2002
4.,
III. DOCUMENT AVAILABILITY INFORMATION (FROM NON-ERIC SOURCE):
If permission to reproduce is not granted to ERIC, or, if you wish ERIC to cite the availability of the document from another source,please provide the following information regarding the availability of the document. (ERIC will not announce a document unless it ispublicly available, and a dependable source can be specified. Contributors should also be aware that ERIC selection criteria aresignificantly more stringent for documents that cannot be made available through EDRS.)
Publisher/Distributor:
Address:
Price:
IV. REFERRAL OF ERIC TO COPYRIGHT/REPRODUCTION RIGHTS HOLDER:
If the right to grant this reproduction release is held by someone other than the addressee, please provide the appropriate name and
address:
Name:
Address:
V. WHERE TO SEND THIS FORM:
Send this form to the following ERIC Clearinghouse:
ERIC Clearinghouse on Assessment and Evaluation1129 Shriver Laboratory (Bldg 075)
College Park, Maryland 20742
Telephone: 301-405-7449Toll Free: 800-464-3742
Fax: [email protected]://ericae.net
EFF-088 (Rev. 9/97)


