Embed Size (px)
Citation preview

Review: MR Physics for Clinicians
Practical Medical Applications of QuantitativeMR Relaxometry
Hai-Ling Margaret Cheng, PhD,1,2 Nikola Stikov, PhD,3 Nilesh R. Ghugre, PhD,4
and Graham A. Wright, PhD2,4,5*
This article is accredited as a journal-based CME activity.If you wish to receive credit for this activity, please refer tothe website: www.wileyblackwellcme.com
ACCREDITATION AND DESIGNATION STATEMENT
Blackwell Futura Media Services designates this journal-based CME activity for a maximum of 1 AMA PRA Category1 CreditTM. Physicians should only claim credit commensu-rate with the extent of their participation in the activity.
Blackwell Futura Media Services is accredited by the Ac-creditation Council for Continuing Medical Education toprovide continuing medical education for physicians.
EDUCATIONAL OBJECTIVES
Upon completion of this educational activity, participantswill be better able to describe the methods and challengesof acquiring accurate and precise quantitative MR maps.
ACTIVITY DISCLOSURES
No commercial support has been accepted related to thedevelopment or publication of this activity.
Faculty Disclosures:
The following contributors have no conflicts of interest todisclose:
Editor-in-Chief: C. Leon Partain, MD, PhD
CME Editor: Scott B. Reeder, MD, PhD
CME Committee: Scott Nagle, MD, PhD, Pratik Mukher-jee, MD, PhD, Shreyas Vasanawala, MD, PhD, Bonnie Joe,MD, PhD, Tim Leiner, MD, PhD, Sabine Weckbach, MD,Frank Korosec, PhD
Authors: Hai-Ling Margaret Cheng, PhD, Nikola Stikov,PhD, Nilesh R. Ghugre, PhD, Graham A. Wright, PhD
This manuscript underwent peer review in line withthe standards of editorial integrity and publication ethics
maintained by Journal of Magnetic Resonance Imaging. Thepeer reviewers have no relevant financial relationships. Thepeer review process for Journal of Magnetic ResonanceImaging is double-blinded. As such, the identities of thereviewers are not disclosed in line with the standardaccepted practices of medical journal peer review.
Conflicts of interest have been identified and resolvedin accordance with Blackwell Futura Media Services’s Policyon Activity Disclosure and Conflict of Interest. No relevant fi-nancial relationships exist for any individual in control of thecontent and therefore there were no conflicts to resolve.
INSTRUCTIONS ON RECEIVING CREDIT
For information on applicability and acceptance of CMEcredit for this activity, please consult your professionallicensing board.
This activity is designed to be completed within an hour;physicians should claim only those credits that reflect thetime actually spent in the activity. To successfully earncredit, participants must complete the activity during thevalid credit period.
Follow these steps to earn credit:
� Log on to www.wileyblackwellcme.com
� Read the target audience, educational objectives, and
activity disclosures.
� Read the article in print or online format.
� Reflect on the article.
� Access the CME Exam, and choose the best answer to
each question.
� Complete the required evaluation component of the
activity.
This activity will be available for CME credit for twelvemonths following its publication date. At that time, it willbe reviewed and potentially updated and extended for anadditional period.
1Physiology and Experimental Medicine, Research Institute, The Hospital for Sick Children, Toronto, ON, Canada.2Department of Medical Biophysics, University of Toronto, Toronto, ON, Canada.3McConnell Brain Imaging Centre, Montreal Neurological Institute, McGill University, Montreal, QC, Canada.4Imaging Research, Sunnybrook Research Institute, Toronto, ON, Canada.5Schulich Heart Program, Sunnybrook Health Sciences Centre, Toronto, ON, Canada.
*Address reprint requests to: G.A.W., Imaging Research, Sunnybrook Research Institute, 2075 Bayview Avenue, Rm. S656, Toronto, ON. Can-ada, M4N 3M5. E-mail: [email protected] November 11, 2011; Accepted May 2, 2012.DOI 10.1002/jmri.23718View this article online at wileyonlinelibrary.com.
JOURNAL OF MAGNETIC RESONANCE IMAGING 36:805–824 (2012)
CME
VC 2012 Wiley Periodicals, Inc. 805
Conventional MR images are qualitative, and their signalintensity is dependent on several complementary contrastmechanisms that are manipulated by the MR hardwareand software. In the absence of a quantitative metric forabsolute interpretation of pixel signal intensities, one thatis independent of scanner hardware and sequences, it isdifficult to perform comparisons of MR images acrosssubjects or longitudinally in the same subject. Quantita-tive relaxometry isolates the contributions of individualMR contrast mechanisms (T1, T2, T2*) and providesmaps, which are independent of the MR protocol andhave a physical interpretation often expressed in absoluteunits. In addition to providing an unbiased metric forcomparing MR scans, quantitative relaxometry uses therelationship between MR maps and physiology to providea noninvasive surrogate for biopsy and histology. Thisstudy provides an overview of some promising clinicalapplications of quantitative relaxometry, followed by adescription of the methods and challenges of acquiringaccurate and precise quantitative MR maps. It concludeswith three case studies of quantitative relaxometryapplied to studying multiple sclerosis, liver iron, andacute myocardial infarction.
Key Words: T1 relaxation; T2 relaxation; T2*; relaxation;multiple sclerosis; iron overload; myocardial infarctionJ. Magn. Reson. Imaging 2012;36:805–824.VC 2012 Wiley Periodicals, Inc.
CONVENTIONAL MR IMAGES provide excellent tissuecontrast, but the signal intensity at any pixel can onlybe interpreted qualitatively. It is difficult to assignmeaning in terms of underlying biophysical or physio-logical properties on the basis of image signal inten-sity alone. The reason is that the MR signal is influ-enced by several intrinsic contrast mechanisms, suchas the density of water protons and proton relaxationtimes (T1, T2, T2*). These are emphasized to differentdegrees depending on the image acquisition sequencechosen. Interpreting MR images, therefore, requiresselection of an appropriate sequence and a thoroughunderstanding of the corresponding signal contrast inrelation to underlying pathophysiology. That said, sig-nal intensity also depends on characteristics of theimaging system such as coil sensitivities. Therefore,evaluation remains qualitative and subjective, andcomparisons across different scanner hardware andacquisition sequences are difficult, typically being re-stricted to descriptions of relative contrast betweendifferent anatomical regions. To obtain information ontissue structure and function in a quantitative man-ner, independent of scanner hardware and sequenceparameters, we need to extract the contributions ofdifferent contrast mechanisms from the MR signal.Only with such decomposition may one considerusing MRI as a measuring device to probe tissueproperties on an absolute and quantitative level.Quantitative MRI refers to the measurement of bio-physical parameters through decoupling the differentcontrast mechanisms that contribute to the overallMR signal. Some of the fundamental quantitative MRIparameters reflecting the local tissue environment arethe relaxation times T1, T2, and T2*. Quantitative
measurement of relaxation parameters has a long andillustrious history in the study of nuclear magneticresonance going back to the first study on the subjectby Bloembergen et al (1). In 1986, Koenig and col-leagues introduced the term ‘‘relaxometry’’ for themeasurement of T1 as a function of magnet fieldstrength (2). The term has since been adopted by theMRI community to refer to relaxation measurement ingeneral. Recognizing the convenience of compact no-menclature, we follow this convention and henceforthrefer to the measurement of relaxation times in MRI asrelaxometry and images representing the spatial distri-bution of relaxation times as T1, T2, or T2* maps.
The advantages of quantitative imaging are varied.One obvious advantage is the removal of influencesunrelated to tissue properties, such as those involvingoperator dependency, differences in scan parameters,spatial variation in the magnetic field, and image scal-ing. Quantification, therefore, allows comparisonsacross different sites and MRI protocols, and enableslarge-scale multi-institutional studies on patientcohorts. Not only can comparisons be made betweendifferent patients, but measurements can be followedlongitudinally within the same patient, for example, tofollow the course of treatment. Problems of bias andreproducibility are greatly reduced, allowing biologicalchanges with disease progression and response totherapy to be probed in a more satisfactory manner.Ultimately, the value of quantification is fully reapedwhen MRI can provide ‘‘measurements’’ of biologicalproperties in a way similar to current gold-standardtechniques such as biopsy and histology. By providingquantitative physiologically relevant information in anoninvasive manner and throughout a three-dimen-sional (3D) volume at high spatial resolution, quanti-tative MRI can potentially serve as the ideal surrogate,unfettered by conventional limitations of limitedbiopsy sampling or the possibility of sampling error.
What follows is an overview of the clinical applica-tions of quantitative relaxometry, followed by adescription of the methods and challenges of acquir-ing accurate and precise quantitative MRI maps. Welimit the scope of this review to T1, T2 and T2* map-ping, as these are the fundamental MR quantities thatform the basis of quantitative relaxometry.
CLINICAL MOTIVATION
Quantitative relaxometry has been used extensively inresearch studies of pathophysiology in the brain, bodyand heart. Here, we briefly survey work in these areaswhere we believe quantitative MRI could have a signif-icant impact on clinical management.
Brain
Brain pathology is often associated with prolongationof the T1, T2, and T2* relaxation times. There havebeen several studies reporting a global increase in thebrain relaxation times in conditions as varied as au-tism (3), dementia (4), and Parkinson’s disease (5).The relaxation time increase presents as hyperinten-sity on T2-weighted images and hypointensity on T1-
806 Margaret Cheng et al.

weighted scans, but quantifying the T1 and T2 pa-rameter has been shown to increase pathologicalspecificity and to help differentiate between healthyand affected tissue locally within a subject. Relaxome-try also shows great promise for quantifying iron con-tent in the brain and understanding its role in disease(6). In this review, we focus on multiple sclerosis,brain tumors, stroke, and epilepsy—the four clinicalconditions that have seen the greatest exposure torelaxometry studies. For a more comprehensive reviewof brain relaxometry applications, please refer to (7).
Multiple Sclerosis
T2-weighted scans are commonly used to diagnosemultiple sclerosis, due to their sensitivity to alteredtissue water content in MS lesions. However, T2-weighted scans lack pathological specificity. In partic-ular, it is difficult to differentiate between inflamma-tion, edema, gliosis, demyelination, and axonal loss,and the relationship between T2 lesion load and thedisability measure is poor (8,9).
While classically regarded as a white matter dis-ease, multiple sclerosis is characterized by changes inthe relaxation times in both gray and white matter.There have been reported whole-brain T1 histogramshifts, which are more pronounced in secondary pro-gressive MS (10), but are also present in the primaryprogressive (11) and relapsing-remitting stages of thedisease (12). The histogram peak positions are corre-lated with clinical disability (10,11), but not with theT2 lesion load (10,12).
T1 contrast also contributes to increasing the localpathological specificity, particularly in studying T1-hypointense lesions called ‘‘black holes,’’ as well as instudying gray matter pathology. T1 hypointensity hasbeen correlated with axonal loss (13), and a correla-tion between T1 lesion load and disability has beendemonstrated using histopathology (14), and MRspectroscopy (15). A recent study that comparedrelaxometry against immunohistochemistry in fixedtissue also showed increases in the relaxation timesin gray matter cortical lesions compared with normalappearing gray matter (16). A T1 analysis in the hypo-thalamus shows the same trend, with significant fa-tigue severity correlation (17).
A quantitative T2 measure called myelin water frac-tion (MWF) is a useful MS biomarker that increases thepathological specificity to myelin loss (18). The myelinwater fraction is computed from a multi-exponential T2fit, where the short T2 component (T2 �10–50 ms) isassigned to water trapped between the myelin sheaths.The myelin water fraction correlation with myelin losshas been validated with histopathology (19). Recently,T2* mapping has shown great promise in characteriz-ing the role of veins and iron in MS (6,20).
For a more in-depth look at relaxometry in multiplesclerosis, the reader can refer to MacKay et al (20)and Ropele et al (21).
Tumors
While tumors are studied routinely using qualitativeMRI, quantification has the potential to eliminate the
need for invasive procedures to determine tumortypes. It is well-established that T1 values withintumors are longer than normal white matter values(22,23), but there are also differences in the T1 valuesacross tumor types. For example, meningiomas andpituitary tumors have the shortest T1 values, whichare still longer than in normal tissue. Glioblastomason the other hand, have the longest T1 values (24).
The fast uptake of contrast agents due to the break-down of the blood–brain barrier (BBB) is the founda-tion of dynamic contrast-enhanced MRI (DCE-MRI)(25,26). T1 and T2* relaxometry as part of the DCE-MRI protocol has been used for detection of primaryand metastatic tumors, inflammation, demyelination,and ischemia (27), as well as for noninvasive gradingof brain gliomas (28). DCE-MRI has also shown thatthere is a high correlation between microvascular per-meability and tumor grade (29).
Stroke
In stroke, ischemic areas and infarctions are charac-terized by T1 and T2 prolongation (30). While diffu-sion imaging remains the standard for determiningextent of damage, relaxometry maps can help differen-tiate between salvageable and non-salvageable tissue(3). While T1 mapping can be used for detecting hem-orrhagic change within infarcts (30), acquiring a T2map is useful for improving specificity in distinguish-ing infarction from ischemic penumbra (31). Lansberget al showed that T2 mapping helped differentiatenew lesions from lesions older than 36 hours, a taskwhich is difficult to do visually (32). DCE-MRI hasalso been used for evaluating stroke extent and sever-ity by generating cerebral blood flow (CBF) maps com-parable to those obtained from PET studies (33).
Epilepsy
Relaxometry maps reveal increased T1 and T2 values inthe temporal lobe, particularly in the hemisphere con-taining the seizure focus (34–36). Quantitative measure-ment of hippocampal T2 relaxation time (HCT2) providesadditional sensitivity in identifying brain abnormalitiesin temporal lobe epilepsy (37,38), especially in epilepsypatients with normal hippocampal volume (39).
Body
Applications of quantitative relaxometry in the bodyare varied and remain to be fully explored. To date,the value of quantification is established for the evalu-ation of iron overload and cartilage disease. Assess-ment of tumors, diffuse liver disease, and disorders ofthe kidney, spleen, and pancreas has also benefitedfrom quantitative relaxometry.
Iron Overload
One of the few widely used clinical applications ofquantitative relaxometry is measurement of iron over-load in the body (40). Iron is used in the production ofhemoglobin and is usually stored in the liver andspleen. In several pathologies, accumulation of iron
Applications of MR Relaxometry 807

occurs as a result of frequent blood transfusions totreat anemia (e.g., thalassemia, sickle cell disease) oras a result of excess iron absorption (e.g., hereditaryhemochromatosis). Without treatment, excess ironcan kill after injuring different body organs, and thegoal of treatment is to prevent liver damage and heartfailure. Relaxation times (T1, T2, T2*) shorten in thepresence of iron compared with those in normal tis-sue. Quantitative T2 and T2* relaxometry has provento be an accurate noninvasive means to measureabsolute iron content and has replaced gold-standardbiopsy procedures in many centers. In the liver, whereiron first accumulates in the body, absolute iron lev-els have been calibrated against both T2 (41) and T2*(42). MRI quantification has also been performed toevaluate iron loading in extra-hepatic organs such asthe pancreas, spleen (43,44) and kidney (45). A morerecent focus is the utility of MRI iron quantificationfor evaluating and comparing different chelation ther-apy regimes aimed at reducing iron burden (46).
Cartilage Disease
Osteoarthritis, rheumatoid arthritis, and other degen-erative conditions of the cartilage have benefited greatlyfrom quantitative relaxometry to detect early chondraldegeneration and biochemical changes before grossmorphological alterations occur (47). Early detection iskey to intervention when damage is still potentially re-versible (48,49). A variety of quantitative MRI parame-ters, including T1, T2, and T2*, have been used to mea-sure different biophysical and biochemical aspects ofcartilage disease. For example, proteoglycan depletioncan be quantified with T1 following the injection of agadolinium-based contrast agent (50). Changes in col-lagen content can be quantified using T2* and T2, withT2 providing additional information on collagen organi-zation (51,52). Multicomponent T2 analysis can givemore specific insight into changes in collagen content(53). Even T1 has recently been shown to be moderatelycorrelated with collagen (54). In addition to providingearly diagnosis, quantitative relaxometry has also beenused to follow cartilage repair treatment, such asmicrofracture, autologous cartilage transplantation, orosteochondral transplantation (55).
Injury and Infection
Although MRI relaxometry is not widely used in theclinic for assessment of injury and infection, severalstudies have indicated its potential for more specificdiagnosis. In diffuse liver disease, especially in fattyliver disease, T1 relaxation times vary depending onacuteness of injury, so that acute forms of fatty liverdisease prolong T1 while chronic forms of injury tendto shorten T1 (56). In the kidney, T1 has shownpotential as a reliable marker of injury, includingedema, inflammation, and fibrosis (57). In muscle,where inflammation can arise from injury or infection(58), T1 and T2 relaxation times can improve diagnos-tic specificity over conventional MRI of edema andinflammation. For example, T2 has been correlated tothe degree of muscle weakness and muscle enzymelevels (59), and T1 changes can be used to map the
distribution of contrast agent for early identification ofinflammation and response to therapy (60).
Cancer
Quantitative relaxometry is normally applied to deter-mine vascular patterns and malignant potential oftumors. This is performed through a dynamic con-trast-enhanced (DCE) protocol, where T1 quantifica-tion is necessary to estimate the perfusion andendothelial permeability of tumor blood vessels. DCE-MRI has demonstrated the best potential of all quanti-tative MRI methods for tumor characterization,staging, and therapy monitoring (61). However, quanti-tative relaxometry has value even outside of the DCE-MRI exam. Improved distinction of malignant lesionsfrom normal or benign tissue has been suggested, asin using T1 and T2 to differentiate colorectal metasta-ses from normal liver (62) or malignant and benignliver lesions (63). Tumor therapy can also benefit fromquantification in a variety of ways. For example, ther-mal ablation can be guided using T1-based MR ther-mometry for measuring temperature in real-time (64).Tumor hypoxia can be quantified using T2*, as demon-strated in experimental strategies to improve (65) ordecrease (66) tumor oxygenation. Posttherapy tissuechanges are also better distinguished. In this role,DCE-MRI is the traditional approach, used to distin-guish residual tumor from vascular granulation tissue(67). However, T1 and T2 changes without contrastagent are also useful, as in assessing radiation therapyin soft tissue sarcoma (68). Proton density has demon-strated even greater accuracy than T1 or T2 in the caseof imaging treated liver metastases (69) or liver radio-frequency-induced ablation (70).
Cardiac
The soft tissue contrast offered by intrinsic MRI relax-ation mechanisms has been well exploited to demon-strate differences between normal and pathologicalconditions in the heart muscle. In addition, quantita-tive relaxometry can help grade severity of diseaseand monitor treatment progress in severalcardiomyopathies.
Iron Overload
The utility of quantitative relaxometry has perhapsbeen best demonstrated in the management ofpatients suffering from cardiac iron overload (like tha-lassemia, sickle cell, and hereditary hemochromato-sis). A seminal study by Anderson et al described therelationship between myocardial T2* and left ventricu-lar ejection fraction in patients with thalassemiamajor (71). It was found that patients with myocardialT2* < 20 ms exhibited a proportional decline in ejec-tion fraction indicative of an association between ironconcentration and cardiac dysfunction. Unlike liver,where both T2 and T2* parameters have been cali-brated for tissue iron concentration by means of clini-cally ordered biopsy (41,42), in vivo validation for car-diac iron stores is challenging due to the risk involvedwith cardiac biopsy. However, recent human autopsy
808 Margaret Cheng et al.

studies (72,73) and preclinical studies (42) have sug-gested that similar relaxivity-iron calibrations can bederived for cardiac tissue as well. Recent preclinicalstudies have also demonstrated how relaxation meas-urements can help predict the clearance of iron basedon type of iron chelator and acuity of iron loading inthe heart (74,75).
Myocardial Infarction
In the case of acute myocardial infarction (AMI) orheart attack, early restoration of coronary blood flowis critical to limit cellular necrosis, maintain normalheart function and reduce adverse left ventricular (LV)remodeling and thereby prevent heart failure (76).Despite successful reperfusion, the in vivo pathophys-iological processes (necrosis, inflammation, hemor-rhage, fibrosis) occurring post-AMI have complicatedinteractions that are not well understood. MRI relaxa-tion times T1, T2, and T2* are accordingly alteredbased on the state of the tissue damage: acute, sub-acute, or chronic (77).
Edema/inflammation. The inflammatory state is typi-cally reflected by the presence of edema. T2-weightedsignal has been found to increase under edematousconditions due to short molecular correlation times infree water. Exploiting this effect, T2-weighted imaginghas been popular in the clinic (78) however it is disad-vantaged by issues with coil sensitivity correction andthe inability to monitor serial progress. Alternatively,several groups are slowly pushing toward quantitativeT2 mapping (79,80). Quantitative T2 allows monitor-ing the inflammatory state regionally and serially aswell as across subjects – this will be most instrumen-tal when interrogating novel anti-inflammatorystrategies.
Hemorrhage. The occurrence of intramyocardialhemorrhage as part of the reperfusion injury in AMIhas been well documented in both humans (81) andanimal models of myocardial infarction (82). Hemor-rhagic infarcts have also been shown to produce theworst clinical outcomes. Similar to the application ofiron overload, relaxation times are modulated in thepresence of hemorrhage, although in a more compli-cated manner depending on the form of the heme iron(77). In general, T2 shortening has been used to iden-tify hemorrhage (83), however, T2* is more sensitiveand specific to iron degradation products of hemor-rhage (80). Unlike brain hematoma/hemorrhage, thepathophysiology and evolution of myocardial hemor-rhage in the setting of AMI along with its clinicalimpact is currently not well understood.
Methemoglobin. Methemoglobin has been shown todemonstrate paramagnetic T1 shortening in brainhemorrhage. The effect has been attributed to struc-ture of the protein that allows nearby water moleculesto access the heme iron core (77). Presence of methe-moglobin has been found to be associated with oxida-tive stress, resulting in lipid oxidation (84). Quantita-tive T1 has been used to assess methemoglobin
formation after myocardial infarction (85) and maypotentially be useful to probe effects of novel thera-pies on disease progression.
Vasodilator function. Coronary vasodilator dysfunc-tion has been demonstrated in infarcted as well asremote myocardium in patients with acute coronarysyndrome (86). Blood-oxygen-level-dependent (BOLD)imaging with T2* and T2 offers a novel way to probemyocardial perfusion reserve and oxygenation stateby exploiting the paramagnetic properties of deoxyhe-moglobin in blood (87,88). It has recently been dem-onstrated that T2-based BOLD effects can identifyimpaired vasodilator function in infarcted and remotemyocardium after AMI (89).
Infarct and grayzone. Infarct characterization in is-chemic cardiomyopathy is routinely performed usingdelayed hyperenhancement (DHE) of myocardium fol-lowing contrast agent injection by acquiring inversion-recovery-based T1-weighted images. The DHE imagescan also provide information on infarct grayzone (mix-ture of viable and nonviable myocytes), which hasbeen correlated with mortality (90) and inducibility forventricular tachycardia (91). Because infarct andgrayzone sizes are determined from single images, thecalculations are prone to errors/variability arisingfrom manual contouring of blood, image noise andsubjectively chosen remote (uninfarcted) myocardium.It has been demonstrated that T1 quantification maybe advantageous in this scenario offering greaterreproducibility and reduced noise sensitivity (92,93).
Other Potential Applications
T1 and T2 relaxation times have been shown toreduce in chronic infarcts compared with remote myo-cardium as studied in human autopsy specimens(94); this behavior has been attributed to collagendeposition. Quantitative T1 has been used to estimatemyocardial blood volume and myocardial perfusionusing an intravascular contrast agent, allowing esti-mation of myocardial perfusion reserve (95). ElevatedT2 may potentially be useful to assess acute inflam-matory response in nonischemic cardiomyopathiessuch as acute myocarditis where edema is of diffusepattern rather than focal, hypertrophic cardiomyopa-thy and sarcoidosis (96,97). In heart transplants T2elevation has also been associated with transplantrejection (98). Myocardial fibrosis is the hallmark ofthe failing heart and has been associated with systolicdysfunction, abnormal remodeling and increased ven-tricular stiffness (99). More recently, pre- and post-contrast T1 mapping has shown promise for detectingdiffuse patterns of myocardial scarring/fibrosis invarious nonischemic cardiac pathologies such as dia-betic, hypertensive, dilated and hypertrophic cardio-myopathy as well as in heart transplant cases (100).Quantitative relaxometry has offered a novel path toreveal interesting patterns in many such clinicalapplications, however most are currently only in theresearch phase and translation to the clinic is pend-ing due to technical challenges.
Applications of MR Relaxometry 809

Summary
As illustrated in the clinical examples described,quantitative relaxometry enables a more specific diag-nosis of a wide range of diseases. This is due to therelationship between relaxation parameters and sev-eral fundamental pathophysiological properties thatare common to many conditions. The relaxation timeT1 is sensitive to macromolecular content, water con-tent, and dissolved oxygen. Therefore, it has provenvalue in evaluating the loss of myelin and axons inbrain, loss of proteoglycan in cartilage, collagen andmethemoglobin content in the heart, and edema inthe brain and heart. When an exogenous T1-reducingcontrast agent such as Gd-DTPA is injected intrave-nously, analyzing the T1 reduction and its distribu-tion in tissue enables assessment of tumor vesselblood flow and leakiness, breakdown of the blood–brain barrier, infarct and grayzone regions in theheart, and fibrosis.
The relaxation time T2 is sensitive to tissue compo-sition and structure, water content, and iron levels. Ithas been used to assess myelin content in the brain,collagen content and organization in cartilage andheart muscle, edema (i.e., inflammation), hemorrhage,and iron content in the liver and heart. The relaxationtime T2* is sensitive to deoxyhemoglobin, water con-tent, and has even better sensitivity than T2 to ironlevels. It has been used to assess brain function (dueto altered deoxyhemoglobin levels), myocardial oxy-genation, tumor hypoxia, hemorrhage, calcification inthe heart (low water content), and liver and cardiaciron. The following section describes the physicalmechanisms underlying T1, T2, and T2* to provide abetter understanding of their relationship to patho-physiological properties.
PHYSICS OF RELAXOMETRY
Physical Principles and Biological Basis
The relaxation times T1, T2, and T2* are physical pa-rameters determined by intrinsic biophysical proper-ties of tissue. The longitudinal relaxation time, T1, isa time constant describing the recovery of magnetiza-tion from a perturbed state to its equilibrium state.This recovery is influenced by the fluctuating mag-netic fields at the proton resonance frequency causedfrom neighboring atoms. Due to its proximity, thedominant source of fluctuations is typically the adja-cent proton on the water molecule; the random tum-bling of the water molecule, described by a rotationalcorrelation time alters the angle between the protonsover time and is the source of the magnetic fluctua-tion. When the rotational correlation time is equal tothe inverse of the proton resonance frequency, T1relaxation due to this interaction is fastest. Similarly,protons in lipids, particularly triglycerides, areaffected by adjacent protons. Because protons in lip-ids are less mobile, there tends to be more energy atthe proton resonance frequency, resulting in shorterT1s for lipids. Therefore, T1 provides an indication ofthe mobility of molecules (mainly water protons) and
their binding to macromolecules. It is used primarilyto assess macromolecular content, water binding, andwater content in a variety of pathologies, includingaltered myelin content in the brain and inflammation.Beyond intrinsic tissue effects on T1, T1 can bealtered through the introduction of a paramagneticmaterial, such Gd-DTPA, an intravenously adminis-tered contrast agent. The gadolinium in this agentforms a strong paramagnetic center, disrupting thelocal magnetic field. Water molecules tumbling anddiffusing past this molecule experience substantialmagnetic fluctuations; in particular, fluctuations atthe resonance frequency of the water protons drivemore rapid T1 relaxation. This application is particu-larly useful for quantifying properties of blood vessels,such as perfusion and blood volume.
The transverse relaxation time, T2, is a time con-stant describing the decay of magnetization that hasbeen ‘‘excited’’ by a radiofrequency (RF) pulse (i.e.,tipped into the transverse plane) that cannot bereversed by refocusing pulses. This effect is due torandom fluctuations in time of proton spins’ reso-nant frequencies. Because spins precessing at differ-ent frequencies no longer accumulate phase atexactly the same rate, phase coherence is lost (i.e.,dephasing) and the transverse magnetization decays.In biological tissue, a relatively rapid dephasingeffect is seen in solids due to the presence of rela-tively slow fluctuations, which cause a large netphase dispersion. Protons bound to slowly tumblingmacromolecules similarly experience rapid T2 decay,while relatively mobile protons (e.g., in water) decaymuch more slowly because rapid fluctuations tend toaverage out yielding a smaller net phase dispersionover time. In general, the random magnetic field fluc-tuations driving T2 decay are much slower (on theorder of a few cycles/s) than those driving T1 decay(where the driving fluctuations are on the order oftens of millions of cycles/sec corresponding to theresonance frequency).
The effective transverse relaxation time in the ab-sence of refocusing pulses, T2*, is essentially T2 plusan additional relaxation term describing additionaldephasing associated with variations in proton reso-nance frequencies within a volume that are constantover time; these variations cause dephasing within thevolume over a period t, which can be unwound by sud-denly changing the phase of all spins by 180 degreesusing refocusing pulses and then letting phase evolvefor another period t. This reversible dephasing acts ontop of the irreversible dephasing generated by randomthermally driven molecular tumbling which causes T2decay in the sample to create a net decay with theshorter time constant T2* in the absence of refocusingpulses. Any inhomogeneity in the local static field,such as those arising from imperfections in the magnetor from susceptibility differences at air-tissue interfa-ces or from the presence of paramagnetic or ferromag-netic substances, will result in such additional reversi-ble dephasing. For these reasons, T2* is particularlyuseful for assessing body iron levels, deoxyhemoglobincontent (blood oxygen), and imaging applications
810 Margaret Cheng et al.

involving the use of iron oxide contrast agents—ironparticles are substantial sources of local static mag-netic field inhomogeneities.
Acquisition Sequences for MeasuringRelaxation Times
Measurement of relaxation times is much moreinvolved than acquiring a single image that depictssignal contrast amongst different tissue types. Typi-cally, a series of images are acquired, each weightedslightly differently, to sample the recovery or decay ofMR signal. A large number of images is generallyrequired in this series to ensure adequate sampling ofsignal evolution and, therefore, accurate measure-ment of relaxation times. As a result, acquisitiontimes tend to be long. The following sections describethe basic relaxometry sequences and different var-iants tailored to specific clinical challenges.
T1 Mapping
The gold standard for T1 mapping is known as inver-sion recovery (IR) (Fig. 1a) and consists of invertingthe longitudinal magnetization Mz and sampling theMR signal as it recovers according to the Bloch Equa-tion:
d
dtMzðtÞ ¼ M0 �MzðtÞ½ �
T1: ½1�
The IR sequence consists of two RF pulses, sepa-rated by an inversion time TI (Fig. 2). This sequence isrepeated N times for each phase encode, varying theTI to produce N samples along the T1 recovery curve.The first RF pulse inverts the magnetization Mz,which then recovers with relaxation time T1. The sec-
ond pulse tips the recovered longitudinal magnetiza-tion into the transverse plane. A variation of thisapproach is a saturation recovery sequence, whereinstead of inversion, the first pulse is a saturationpulse that tips the magnetization into the transverseplane and there is no second pulse. For eitherapproach, the sequence is repeated several times,each time with a unique TI or TR as appropriate, tosample to recovery curve. The recovery curve is thenfitted to an exponential model, which is an accuraterepresentation only when several assumptions aremet, including a perfect inversion pulse, constanttemperature, or TR�T1. While these assumptions areoften justified, care must be taken to always pick amodel that corresponds to the acquisition scheme(101).
While inversion recovery and saturation recoveryoffer accurate and precise T1 measurements, bothtechniques are too slow to be used in clinical prac-tice because they require long TRs and acquire onlyone phase encode per TR. To speed up the acquisi-tion, several variants have been proposed, such asfollowing the inversion pulse by a fast spin-echo(FSE) (102) or echo-planar imaging (EPI) readout(103).
The Look-Locker (LL) method (104) is a rapid tech-nique that measures T1 from a single recovery oflongitudinal magnetization. It overcomes the limita-tion of the conventional IR method of requiring along delay (on the order of T1) for longitudinal mag-netization to recover until the next inversion pulseis played for subsequent readout. This novelapproach was first theorized by Look and Lockerand later implemented on a whole-body scanner byBrix et al in the form of TOMROP (T One by MultipleReadOut Pulses) (15). The basic sequence diagramis shown in Figure 1b. It consists of only a single
Figure 1. A schematic of T1 map-ping sequences: (a) Inversion Recov-ery, (b) Look-Locker, (c) VariableFlip Angle. [Color figure can beviewed in the online issue, which isavailable at wileyonlinelibrary.com.]
Applications of MR Relaxometry 811

inversion pulse followed by a series of very smallangle excitation (a) pulses with gradient echo read-outs to sample the T1 curve. Because small angleRF pulses are used, the longitudinal magnetizationis only minimally disrupted during T1 recovery andno wait-period is necessary until equilibrium isreached as sampling is performed in a continuousmanner. However, if the separation between a
pulses is less than T2, the T1 signal will be cor-rupted by residual transverse magnetization gath-ered from previous a pulses. To avoid this, eitherthe separation between the a pulses needs to be > 5� T2 or gradient spoiling needs to be used to crushany residual transverse magnetization. It is also im-portant to note that due to continuous perturbationof the magnetization by successive a pulses, the re-covery is driven into equilibrium more quickly,resulting in an ‘‘effective T1’’ or T1* given by,
T1� ¼ T1
1� T1TRln cos að Þ
h i ½2�
The T1* calculated from the recovery curve needs tobe converted to the ‘‘actual’’ T1 using the aboveequation. Recently, several other variants of the LLmethod have been developed targeted for specializedapplications. For example, in the case of cardiac T1mapping, basic LL cannot be applied due to severecardiac and respiratory motion. A MOdified LL Inver-sion recovery sequence (MOLLI) has been proposed byMessroghli et al for high resolution T1 mapping of theheart (105). Another variant using saturation recovery(MLLSR) instead of inversion recovery is also being investi-gated (106).
A different approach to rapid T1 measurement is tovary the flip angle of a gradient recalled sequence(107) (Fig. 1c). This method offers volumetric, high
spatial resolution 3D T1 mapping in significantly lesstime than conventional methods. The time gain stemsfrom the use of a short TR, unlike the conventionalapproach where TRs must be long to allow full signalrecovery. The main source of error, however, is imper-fect tipping of magnetization due to an inhomogene-ous RF field. This error can be corrected efficiently byincorporating rapid B1 measurement of the RF field,which maintains a short acquisition time but signifi-cantly improves measured T1 accuracy (108). Thepracticality of this method for large volumetric T1mapping has been recently demonstrated in variousquantitative body protocols (109–111).
T2 Mapping
The gold standard for T2 mapping is a Carr-Purcell-Meiboom-Gill (CPMG) spin-echo sequence (Fig. 3). Itinvolves taking measurements at different echo times(i.e., TE ¼ 2t) in an echo train to sample the T2 decaycurve. A 90-degree excitation pulse is followed by aseries of 180 degree refocusing pulses, and signal ismeasured at the mid-points between refocusingpulses where the spin-echo is formed and B0 inhomo-geneities are removed. While the number of echoes isarbitrary, for a single-exponential fit (S ¼ S0exp(�TE/T2)) it is necessary to acquire at least twoechoes. More echoes increase the accuracy and preci-sion of single component T2 mapping, with long echotrain lengths (32 and above) reserved for multicompo-nent T2 analysis (112).
A simpler implementation of the above method is toacquire a series of T2-weighted spin-echo datasets,each at a different TE. However, due to the long TRrequired, the acquisition time becomes prohibitivelylong for clinical practice. A much faster method wasrecently proposed by Sussman et al (113). Thismethod retains a conventional single-echo spin-echo
Figure 2. A schematic of an inversion recovery sequence (top) and the T1 relaxation curve (bottom). The relaxation curve issampled at several points TI, and then fitted to a single exponential. [Color figure can be viewed in the online issue, which isavailable at wileyonlinelibrary.com.]
812 Margaret Cheng et al.

acquisition but uses a constant difference of TR-TE(rather than a fixed long TR value) to reduce acquisi-tion time by a factor of at least 4 to 6. Another rapidT2 mapping approach is to use a fast SSFP acquisi-tion, which uses a fundamentally different contrastthat is derived from a gradient-echo formation (114).
Magnetization prepared T2 measurement is anothertechnique for efficient T2 mapping, particularly in thepresence of blood flow and motion. In a conventionalT2 spin echo sequence, signal contrast is primarily
determined by placing the data acquisition block atthe appropriate time (TE) following magnetization tipdown by the RF pulse (Fig. 4a). An alternative strategyis to prepare the longitudinal magnetization inadvance such that it represents the desired T2-weighted contrast and then sample it using any read-out strategy (Fig. 4b) (115). This approach is very effi-cient and especially useful for obtaining T2 measure-ments in organs, such as the heart, where flow andmotion produce undesirable artifacts. If a fast spin
Figure 4. a: Typical spin echosequence for T2 measurement. b:Magnetization preparation whereT2-weighted contrast is preparedin advance of excitation and read-out. c: Example of a sequenceusing T2-preparation with a spec-tro-spatial RF excitation and spiralreadout; TE is determined by thenumber of 180 refocusing pulses.[Color figure can be viewed in theonline issue, which is available atwileyonlinelibrary.com.]
Figure 3. A schematic of a multi-echo spin echo sequence (top) and the T2 relaxation curve (bottom). The relaxation curve issampled at several points TE, and then fitted to a single exponential with a relaxation time T2. [Color figure can be viewed inthe online issue, which is available at wileyonlinelibrary.com.]
Applications of MR Relaxometry 813

echo (FSE) approach is used, the readout is limited bytissue T2 relaxation time, which is generally short(�50 ms for the heart). On the other hand, the mag-netization prepared signal is maintained on the orderof time scale T1 (�1000 ms for the heart). In caseswhere relaxation properties of blood are to be interro-gated, FSE may be highly susceptible to flow artifactsand hence other readout strategies (like GRE or SSFP)may be preferable in conjunction with T2-preparedcontrast. Figure 4c shows an example of a sequenceusing T2-prepared contrast. In the preparation block,the magnetization is first tipped down by a 90-degreeRF pulse and then refocused by a specified number of180 pulses to obtain a desired TE. Then the T2-weighted magnetization is tipped back up onto thelongitudinal axis for subsequent readout. In this case,a spectro-spatial RF pulse has been shown (for fat sup-pression) with a spiral data acquisition strategy. TheT2-prepared spiral readout sequence has been recentlyadopted to measure myocardial edema by T2 quantifi-cation following acute myocardial infarction in bothclinical and preclinical models (80,116). Recently, a T2-prepared SSFP sequence has also been developed foredema detection in myocardial infarction (79).
T2* Mapping
T2* measurements are typically performed using aspoiled gradient echo sequence with multiple echoes(i.e., multi-echo gradient-echo) as illustrated in Figure5. Following a 90-degree RF excitation, signal issampled at gradient echo formation generated byapplying a series of alternating readout gradients; thephase encoding blip gradient determines the readoutlocation in k-space. Typically, eight echoes areacquired within a TR interval and each echo corre-sponds to a different T2*-weighted image as deter-mined by TE. Imaging is complete when the entire k-space is filled giving eight T2*-weighted images. Theacquisition strategy is also sometimes referred to asan echo-planar-imaging (EPI) type readout. However,in the EPI sequence used in functional brain studies,all the echoes acquired are assigned to the k-spacematrix of a single image where the effective TE is the
time at which the center of k-space is read. For car-diac applications, the sequence is cardiac-gated withthe eight echoes acquired in the diastolic phase with8–12 views per segment, i.e., k-space lines perheartbeat.
Factors Affecting Measurement Accuracy
There are several issues to consider in relation tomeasurement accuracy. One common source of erroris RF pulse inhomogeneity. This refers to imperfec-tions in the transmit field of the RF coil, which leadsto certain locations in the imaging volume experienc-ing more or less RF power and, therefore, an imperfectRF flip angle for tipping magnetization and for refo-cusing. RF inhomogeneity affects all types of relaxa-tion measurements. For T1 quantification, it repre-sents the most common cause of errors and has anespecially pronounced effect on the variable flip angleapproach. To correct for this error, the most straight-forward solution is to map the RF B1 field to deter-mine the true flip angles, and the correct flip anglescan then be used in calculating relaxation times(108). For T2 quantification, RF inhomogeneity resultsin suboptimal refocusing pulses, which introducesT1-weighted stimulated echo pathways that interferewith the formation of pure spin-echoes for T2 mea-surement (117). This problem is more pronounced at3 Tesla (T) and higher, where fitting exponentials tothe decay curves may not be appropriate. To achieveaccurate T2 measurements, the stimulated echo prob-lem needs to be addressed as described by Hennig(117) and in several recent reports (118,119).
Slice profile effects are another source of inaccur-acy. Ideally, all the spins in the selected imaging sliceshould be inverted (in the case of a 180-degree pulse),and all spins outside the slice should remain unper-turbed. In reality, the slice profile is never perfectlyrectangular, which means that the actual flip anglefalls off over a transition region at the edges of theslice. Hence, the effective flip angle is not the nominalangle but is the integral of the inversion profile overthe slice thickness. Slice profile imperfection affectsboth T1 and T2 measurements, even for gold standard
Figure 5. Multi-echo gradient echosequence with echo-planar-imaging(EPI-type) readout for the measurementof T2*. Eight echoes are typicallyacquired ranging from 2 to 15 ms withTR ¼ 20 ms. The free-induction-decay(FID) is shown with exponential timeconstant T2*. [Color figure can beviewed in the online issue, which isavailable at wileyonlinelibrary.com.]
814 Margaret Cheng et al.

measurements (120). This problem can be alleviatedsomewhat by using nonselective pulses or interleavingeven and odd slices in a multislice slice-selectiveexcitation.
Partial volume effects are a concern for all in vivoexperiments (121). This is especially problematicwhen different structures of interest all reside in closeproximity in an imaging voxel. Examples includebrain tissue (white and gray matter and CSF) and theinterventricular septum (where the posterior segmentsare affected by susceptibility artifacts generated bythe heart-lung interface and cardiac vein). Othersources of error include: magnetization transfereffects on T1 (122), exchange and diffusion effects onT2, temperature effects (T1 increases 2–3% per degreeCelsius (64), and movement due to actual subjectmotion or bulk flow (e.g., blood flow) that artifactuallyshortens T1. Organ motion is especially problematicin body and cardiac applications. Breath-holding isan effective way to remove respiratory motion, butthis is not feasible in some scenarios, such as inyoung children, where the only practical solution is toblur out motion artifacts by averaging (e.g., liver ironquantification) (123). Gating is another alternative toaddress respiratory motion. Organs with repetitivemotion, such as the heart, can also use gating of dataacquisitions. In organs where motion is not repetitiveor predictable, one should use the most rapid meth-ods possible for T1 and T2 mapping.
A final consideration to obtaining accurate meas-urements is having a good sense of target range of T1or T2 values, because acquisition parameters (e.g.,TR, TE, flip angles) can only be optimized for a limitedrange of relaxation times. For example, T2* accuracydepends critically on the minimum TE. For iron over-load applications, T2* measurements should use aminimum TE of at most 2 ms for most clinical cases(124). In the case of the liver, where iron stores canreach very high levels, even a TE of 0.8 ms, whichcorresponds to a maximum iron detection level of 40mg/g dry tissue, is not adequate to quantify iron bur-dens as high as 60 mg/g that can occur in somepatients.
Data Fitting to Extract Relaxation Parameters
To calculate relaxation times, the data acquired fromthe MRI experiment is fitted to some mathematicalmodel. In many cases, the exponential function isused, as it describes many biophysical phenomena,including T1 and T2 relaxation. Estimation of T1 orT2 generally involves fitting a monoexponential func-tion to the T1 or T2 relaxation curves. With conven-tional IR T1 measurement, an exponential fit to signalrecovery at various TIs is performed. With spin-echo(T2) or gradient-echo (T2*) measurements, an expo-nential fit to signal decay at various TEs is performed.In an ideal situation where there is no noise and thereexists a single relaxation time in the imaging voxel,data fitting theoretically can be achieved using twodata points on the monoexponential curve.
In the presence of noise, there is uncertainty ineach measured data point. Hence, at least three data
points need to be acquired, and there is also the ques-tion of how far apart they should be spaced to yieldreliable estimates of T1, T2, or T2*. To improve quan-tification accuracy, one may increase the number ofmeasured data points, repeat the measurement ateach data point to boost SNR, or combine both strat-egies. There is, however, a practical limit beyondwhich a greater number of measurements or averageswill not yield additional benefit; the optimal balancebetween these two considerations can be determinedthrough simulations. As a general rule, the lower andupper bounds of relaxation times to be measured arefirst identified. Then, for T2 or T2* measurement, thelowest TE at half the lower bound and the highest TEat twice the upper bound are chosen. Similarly, for T1measurement, the lowest and highest TIs to includethe lower and upper T1 bounds are chosen. Thesepoints can be equally spaced or logarithmicallyspaced. For a broader range of relaxation timesexpected, a higher number of data points is neces-sary. Once the required number of measurementpoints and their spacing are determined for modestlynoisy data, further improvement in measurement ac-curacy should be reaped by repeating measurementsto boost SNR, especially for the ‘‘noisy’’ data points.
However, the monoexponential model cannotdescribe all situations. It is valid only in an ideal sit-uation where a single T1 or T2 relaxation time existsin an imaging voxel. This assumption may not hold inseveral situations. For instance, a single T1 assump-tion is valid in most tissues due to relatively fastwater exchange amongst different compartments.However, when a high dose of contrast agent is pres-ent in the blood pool, exchange between the intra-and extra-vascular compartments is not necessarilyfast and, thus, the effects of water exchange need tobe considered. T2 decay may also deviate from amonoexponential model. For example, cartilage con-sists of several components (e.g., collagen and proteo-glycans in the extracellular matrix) that have differentinfluence on water, with the result that water may betightly bound, more loosely bound, or freely moving.Only multicomponent T2 analysis can distinguishthese components, as demonstrated in both cartilage(125) and collagen-based materials used for regenera-tion (53). Other models to describe T2 relaxationinclude: (i) nonexponential modeling of diffusion-mediated T2 relaxation, (ii) chemical exchange, nonex-ponential or biexponential modeling of liver iron (126),and (iii) biexponential modeling of blood oxygenationin muscle (127).
Multicomponent analysis, as alluded to above,refers to fitting multiple exponential components. Inreality, a multitude of relaxation times associatedwith different tissue components always exists in animaging voxel, but they generally cannot be resolvedwith the time scale of the MRI experiment. However, ifexchange is slow compared with the relaxation time,then it is possible to differentiate distinct T1 and T2components (128). For T1, multicomponent measure-ments are generally difficult to obtain, becauseexchange is fast compared with the T1 relaxation rate.On the other hand, multicomponent T2 analysis is
Applications of MR Relaxometry 815

much more common. For example, in the brain, T2mapping experiments are assumed to be in the slowexchange regime; so, a multicomponent analysis dif-ferentiates at least two water compartments: intra/extracellular water and water trapped between thelipid bilayers of the myelin sheath. This is useful formeasuring the myelin water fraction (MWF), which isa biomarker for myelin content. The most common ac-quisition sequence for multicomponent T2 measure-ment is based on the spin-echo (18). A more recentmethod is based on a SSFP sequence (129).
Once an appropriate model is chosen to describerelaxation, the method one adopts to perform the datafitting also affects measurement results. For example,in the analysis of multiexponential relaxation, thereare a couple of approaches one can adopt: (i) assumethe number of exponentials is known and fit to amodel with a fixed number of exponentials, (ii) use anonnegative least squares (NNLS) analysis that doesnot assume the number of exponentials is known.Although method (i) is easier to implement, method(ii) is generally preferred, as it does not place anyassumption on the nature of relaxation. Anotherexample is fitting T2* data from iron overload patients(especially very high burdens). Here, constant offsetcorrection is often used when fitting T2* signal decayto account for potential contributions from noise bias,
heterogenous iron distribution in myocytes, analog-to-digital signal offsets, or contributions from iron-poortissue such as fibroblasts, or myocardial blood vol-ume (73). Some investigators truncate the TE echopoints that are close to this ‘‘noise floor’’ and fit onlythe remaining exponential part of the curve; this hasbeen shown to provide better estimates when relaxa-tion rates are low, however, the method is subjective.
DETAILED CASE STUDIES
Brain: Multiple Sclerosis
Multiple sclerosis lesions contain a large number ofdifferent pathologies, including demyelination, axonalloss and inflammation. The MS lesions are visible onT1- and T2-weighted MRI scans, but these scans lackpathological specificity, making it difficult to differen-tiate pathologies and to track the evolution of thelesion from its acute gadolinium-enhancing stagethrough the process of remyelination. Recently, sev-eral quantitative MRI techniques have been proposedto study and track MS lesions. T1 and T2 mappingplay a major role in these techniques, either as indi-rect myelin biomarkers, or as the foundation for morecomplex myelin models.
Figure 6. (Top) Example of a7.0T TE ¼ 20.1 ms image andmyelin water fraction (MWF)map and corresponding luxolfast blue histology image ofthe parieto-occipital region ofa patient who has MS. A goodqualitative correspondence isobserved between the MWFmap and histology stain formyelin. The normal prominentmyelination of the deepercortical layers (arrows) is alsovisible on the myelin waterimage. (Bottom) Examples ofthe quantitative correlationbetween myelin water fraction(MWF) and luxol fast blue op-tical density (LFB OD) for graymatter (GM), lesion, dirty-appearing white matter(DAWM), and normal appear-ing white matter (NAWM) fortwo MS samples (fromMacKay et al., MR Relaxationin Multiple Sclerosis. Neuroi-maging Clin N Am 2009;19:1–26; reprinted with permissionfrom Elsevier). [Color figurecan be viewed in the onlineissue, which is available atwileyonlinelibrary.com.]
816 Margaret Cheng et al.

The myelin water fraction (MWF) is an indirect bio-marker for myelin that is sensitive to the watertrapped between the myelin sheaths. The restrictedmyelin water has short T2 values (T2mw � 10–50ms),whereas the free intra/extracellular water T2ie hasvalues of 100 ms or more. The myelin water fractionhas been shown to decrease in MS lesions (18,130–132), as well as in normal appearing white matter(NAWM) in the brain (132) and spinal cord of MSpatients (133). Figure 6 shows a myelin water fractionmap, obtained from a 32-echo spin-echo sequence(19). The MWF exhibits good correlation with a luxolfast blue stain in gray matter, white matter and MSlesions.
Until recently, myelin water fraction maps were dif-ficult to obtain in clinically feasible times, as the ac-quisition was restricted to a single slice and the scantime was prohibitively long. Recent work by Oh et alhas proposed multi-slice MWF mapping using a non-selective T2-prep sequence (134), while Deoni et alhave acquired MWF maps using steady state free pre-cession (SSFP) techniques (129). These techniques aresignificantly faster than the conventional multi-echospin-echo acquisition.
While myelin water fractions rely on computing theT2 relaxation time, T1 mapping can also play a role instudying Gadolinium enhancing lesions, which appearas hyperintense on postcontrast T1-weighted scans.Figure 7 shows a longitudinal study tracking the T1and T2 parameters in gadolinium-enhancing lesionsup to 12 months after the lesions’ appearance. In thefigure, the T1 parameter has significantly higher val-ues in the lesion compared with normal-appearingwhite matter (NAWM) and controls. This is mostobvious at initial gadolinium enhancement, but it per-sists up to 12 months after presentation. At the sametime, the T2 parameter is significantly increased. Inthe subsequent months, the relaxation parametersshow recovery toward NAWM values, and the trendsare consistent with the process of remyelinationoccurring in MS lesions.
T1 and T2 mapping also form the foundation of anadvanced quantitative MRI technique called quantita-tive magnetization transfer (qMT). In qMT, the T1 andT2 parameters are entered in a two-pool tissue modelthat computes the semi-solid ratio (f), defined as theproportion of protons bound to macromolecules. Inwhite matter, the semi-solid ratio has been shown to
Figure 7. a: Initial post-Gd T1-weighted scan of a single patient with outlines of enhancing region (green) and contralateralNAWM (cyan). b: T1 map of the same subject (units are s). c: Plot of T1, averaged across five subjects at eight time-points dis-tributed over 12 months, starting at initial Gd enhancement. Error bars indicate the standard error of the mean across sub-jects. d: T2-weighted image resampled to the lower resolution of the quantitative maps. e: T2 map of the same subject (unitsare s). f: Plot of T2, averaged across five subjects at eight time-points distributed over 12 months, starting at initial Gdenhancement. Error bars indicate the standard error of the mean across subjects (adapted from Levesque et al., Quantitativemagnetization transfer and myelin water imaging of the evolution of acute multiple sclerosis lesions. Magn Reson Med2010;63:633–640; reprinted with permission from Wiley). Gd ¼ Gadolinium.
Applications of MR Relaxometry 817

correlate with myelin content, and it is particularlyuseful for characterizing the T1 black holes (135). Dis-cussion of qMT is beyond the scope of this paper, butit provides an additional motivation for T1 and T2quantification.
Body: Liver Iron
Clinical adoption of MRI relaxometry in the body ismost evident for iron overload quantification, particu-larly in the liver where a diagnosis for total iron burdenis made and the efficacy of chelation therapy deter-mined. Recently, FDA approval was obtained for MRIliver iron assessment in place of biopsy for clinical diag-nosis. The main impetus behind the successful clinicaltranslation were the studies of St Pierre et al (41) andWood et al (136), which provided convincing liver-bi-opsy validation of noninvasive MRI measurements.Since that time, there has been a surge in MRI investi-gations for noninvasive iron quantification in the body.Quantifying iron overload in various disorders, particu-larly in transfusion-dependent thalassemia and insickle-cell patients or those with deficient iron metabo-lism, and in different patient groups, including youngchildren (137,138) and bone marrow transplants (139),has been reported. Figure 8 illustrates the use of rapidT2*-based MRI measurement of liver iron in a diversepediatric population with iron overload disorders. Thecorrelation obtained in these 151 children against gold-standard measurement is very high.
Another important objective from the perspective ofpatient management is to noninvasively monitor theeffectiveness of iron chelation therapy. This requiresthat MRI be able to follow iron levels on an individualbasis. To do so, several outstanding issues remain tobe addressed. Measurements must be reproducibleacross different MRI scanners, as the same patientmay be scanned on different platforms and at differentfield strengths throughout therapy. The mechanism bywhich a particular chelation therapy affects iron storesmust also be understood as well as its relation to MRIrelaxation times. It is unclear what differences toexpect amongst different chelation therapies, but aninitial step toward understanding the effect of iron dis-tribution on calibrating MRI relaxations times wasmade recently in a simulation study (140). Finally, cali-bration curves remain to be established in otherorgans (e.g., pancreas, spleen) to broaden the clinicaluse of MRI for quantifying iron overload.
Cardiac: Acute Myocardial Infarction
Myocardial infarction typically occurs due to pro-longed occlusion (> 30 min) of a major coronary ar-tery, commonly referred to as a heart attack (141).While restoration of blood supply (reperfusion) is gen-erally favorable following acute myocardial infarctionin the heart (76), additional myocardial damage fol-lowing reperfusion often presents itself as an adverseconsequence (142). This is associated with an expan-sion of the prior ischemic damage resulting in greatercell death, edema (i.e., inflammation) and microvascu-lar obstruction (MVO) or injury along with intramyo-
cardial hemorrhage in the most severe cases (81).Quantitative relaxometry is well suited to detect someof these underlying remodeling processes given thatrelaxation times are modulated in different waysbased on the state of the tissue.
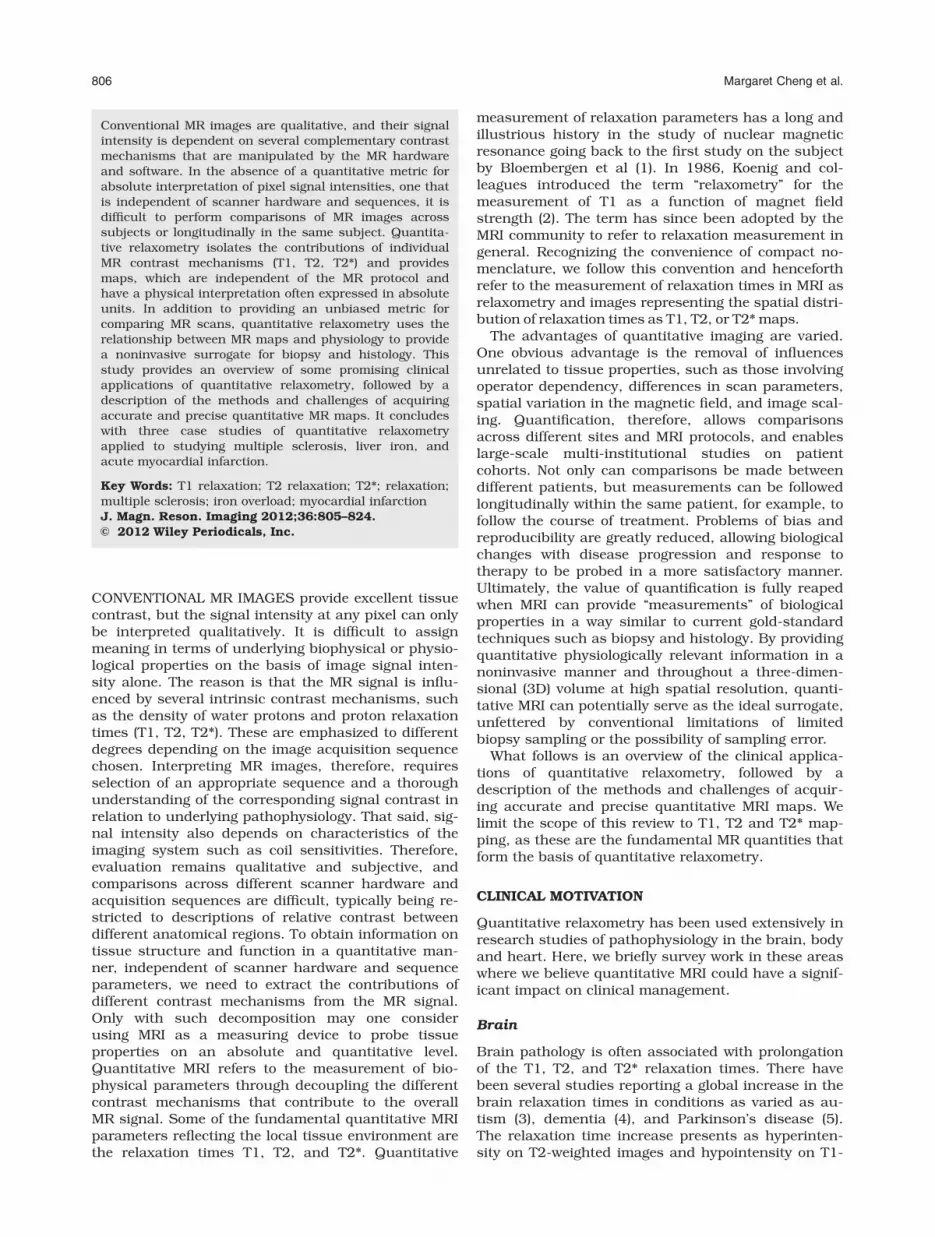
Figure 9 demonstrates T2 and T2* maps, along withearly contrast enhanced (CE) short axis images in aporcine model of myocardial infarction in which theleft anterior descending artery (LAD) was occluded for90 min followed by reperfusion (80). This model cre-ated large anteroseptal transmural infarcts character-ized by MVO and hemorrhage; the pattern of progres-sion of edema, hemorrhage and MVO are apparent inthe images. Figure 10a,b shows the cumulative timecourse of T2 and T2* relaxation parameters measuredin the infarct and remote territories. In the infarctzone, T2 was significantly elevated beyond day 2 andremained elevated up to week 6 (Fig. 10a) suggestingthat in severe infarcts, inflammatory responseremains active even in the chronic stage. At day 2,histology revealed that both edema and hemorrhagewere present in the infarct core and this is reflectedby a T2 value that is not very different from control
Figure 8. Absolute liver iron measurement in children. a:Coronal image slice showing the T2* relaxation time distribu-tion in the liver of a patient with iron overload. Red outlinewas manually drawn to contour the liver. b: Measured abso-lute liver iron from T2* relaxation times compared againstreference measurements in 151 pediatric patients (r ¼ 0.94).Line of identity is shown.
818 Margaret Cheng et al.
levels, i.e., edema and hemorrhage have counter-act-ing effects on T2. On the other hand, T2* was morespecific to hemorrhage (Fig. 10b) showing depressedvalues up to week 4; resolution of hemorrhage alsocoincided with resolution of MVO suggesting that thetwo phenomena are related. The hemorrhagic coresidentified on T2* maps were typically with T2* < 20ms which is also the threshold used to detect myocar-dial iron overload (71).
Despite reperfusion therapy, microvascular integ-rity and function may be compromised in theinfarcted as well as remote territories postinfarction(86). Myocardial BOLD imaging offers a novel meansto examine myocardial perfusion reserve underpathologic conditions (89,143). Myocardial T2 andT2* values have been shown to increase in thestress state (pharmacological vasodilation); differen-ces between rest and stress have been shown toreflect perfusion reserve. Figure 10c,d shows thestress-induced effect on T2 post-AMI in theinfarcted and remote myocardium. The infarct zonedemonstrated a reduced/null hyperemic response
indicative of damages and/or obstructed microvas-culature; any residual response may representpotentially salvageable myocardium. In remote myo-cardium, a subtle increase in resting T2 at week 1–2might suggest either edema or hyperemia while theaccompanied suppressed stress response might beindicative of a prior vasodilation or a resistive statearising from systemic inflammation or neurohormo-nal sympathetic activity.
Infarct remodeling postischemia is complex and theinteraction between different pathophysiologicalmechanisms is not completely understood. Further-more, regional, serial, and cross-subject monitoring ofthe remodeling processes is essential to understandthe effects of novel therapies; for example, in additionto simply detecting (say) edema, it would be equallyimportant to know the ‘‘degree’’ of edema (i.e., lower orhigher) in a particular treatment group. In this regard,quantitative relaxometry may be more specific thansingle images, providing a reliable and reproduciblemethod to assess the inherent state of myocardial tis-sue in vivo following AMI.
Figure 9. Longitudinal changes in edema, hemorrhage, and MVO. T2 and T2* maps are shown along with early contrastenhanced (CE) images at various time points post-AMI in a porcine model of myocardial infarction. Day 2: T2 elevation usu-ally associated with edema was not apparent in the infarct zone (39.2 ms versus 39.1 ms control) but T2 was slightly elevatedin the peripheral areas; Arrows indicate focal signal-void regions or T2* abnormalities (18.5 ms versus 34.2 ms control)within the MVO as delineated by the CE image. Week 1: T2 was elevated (arrows) in most of the infarct (51.1 ms) withreduced sub-endocardial T2* (15.8 ms) indicative of diffuse hemorrhagic by-products (arrows). Week 4: T2 was still elevated(50 ms) while normalization of T2* (35 ms) coincided with resolution of MVO. (Reproduced from Ghugre et al., Quantitativetracking of edema, hemorrhage, and microvascular obstruction in subacute myocardial infarction in a porcine model by MRI.Magn Reson Med 2011;66:1129–1141; with permission from Wiley).
Applications of MR Relaxometry 819

DISCUSSION
As demonstrated in the various case studies, quanti-tative relaxation information extends MRI beyond an-atomical mapping to characterization of the underly-ing pathophysiology in the tissue. Furthermore, theprocess of parameter estimation allows one to factorout hardware-driven fluctuations in signal intensity,notably those due to receive and transmit coil sensi-tivities, enabling focus on tissue characteristics. Forinstance, in the study of liver iron, biopsy is replacedwith T2* measurement, getting detailed informationabout the physical amount of iron that is not accessi-ble with conventional MRI. Indeed, this approach hasnumerous advantages over biopsy where one sparselysamples small tissue regions. Even exploratory sur-gery only reveals the characteristics of tissue surfa-ces. With relaxometry, spatial distributions of biologi-
cal factors are obtained over a 3D volume in the body.Furthermore, with the characterization of multiplerelaxation parameters (T1, T2, T2*), different proper-ties of the tissue can be probed, yielding multipledegrees of freedom for differentiating various patho-physiological changes using more sophisticated imageanalysis tools such as statistical pattern recognitioninvolving multiparametric clustering and higherdimensional border determination.
These advantages of quantification can be con-trasted with qualitative assessment of tissue charac-teristics in single relaxometry-weighted images. Ingeneral, T1-, T2-, or T2*-weighted images are oftenconsidered more sensitive to disease (fewer false nega-tives) while relaxometry maps may be consideredmore specific (fewer false positives). That is, if the goalis to detect disease such as that associated withincreased local deposition of iron, looking for local
Figure 10. Quantitative fluctuations in relaxation parameters after AMI. Plots (a) and (b) demonstrate longitudinal fluctua-tions in T2 and T2* in the infarct zone compared with remote myocardium averaged over all animals; day 0 represents valuesfrom healthy controls and error bars represent standard error. Plots (c) and (d) show evolution of T2 in the rest and stressstates (dipyridamole induced pharmacological vasodilation) in infarcted and remote myocardium, respectively; the differencebetween the two states is a reflection of vasodilatory function or myocardial perfusion reserve. yP < 0.05, compared with con-trol values; §P < 0.05, compared with the previous time point; ¶P < 0.05 compared with rest values. (Modified from Ghugreet al., Quantitative tracking of edema, hemorrhage, and microvascular obstruction in subacute myocardial infarction in aporcine model by MRI. Magn Reson Med 2011;66:1129–1141 and Ghugre et al., Myocardial BOLD imaging in a 3 T usingquantitative T2: application in a myocardial infarct model. Magn Reson Med 2011;66:1739–1747; with permission fromWiley).
820 Margaret Cheng et al.

regions of decreased signal in a T2*-weighted imagemay be particularly useful. However, many artifactsmay also appear as iron deposits leading to an over-estimation of the extent of disease. With a map of T2*values, one can more accurately identify those regionscontaining higher iron concentrations and even esti-mate the local iron concentration.
The trade-off in performing quantitative measure-ments versus qualitative review of relaxometry-weighted images follows the traditional MRI trade-offsamong imaging time, spatial resolution, and imagequality as determined by signal-to-noise ratios (SNR).Quantification requires the acquisition of multipleimages to facilitate subsequent curve fitting, which isdone at the expense of increasing the SNR or theresolution of a single relaxometry-weighted image.Furthermore, quantification requires the alignment ofthe underlying images and makes assumptions aboutthe nature of the signal behavior (e.g., exponentialdecay). Failure of these assumptions can introduceartifacts that can lead to misinterpretation.
How ‘‘good’’ the measurement of relaxation propertiesneeds to be depends on the question being asked. Insome cases, getting values that are accurate (i.e., con-sistent across individuals with the same underlyingcondition and across scanning platform) is less criticalthan getting values that are consistent within a givenpatient (i.e., the same for regions of similar pathology)and/or repeatable for the same patient with the samescanning set-up. Specifically, T1 maps following lategadolinium enhancement for cardiac scar assessmentwhere the T1 values are consistent within a given scanwould be sufficient for delineating scar volumes. Simi-larly, measuring repeatability (i.e., precision) is thegreatest concern for longitudinal studies aimed atmonitoring disease progression (e.g., comparison withMS studies tracking lesion evolution in a given subjectover a period of 12 months) or therapeutic response(e.g., monitoring the effect of iron chelators on liveriron concentration in a given patient) if one can repeatthe study with the same system.
Of course, measurement accuracy (consistencyacross patients and platforms) provides greater flexibil-ity if it can be achieved. Notably, with accurate meas-urements, one could compare disease progression indifferent patients against a gold standard calibrationperformed in a select population. The capacity to com-pare measurements across patients also facilitates pre-diction of subsequent clinical outcomes and effective-ness of various therapies in particular patient groups.Accurate measurements also facilitate more specificassessment of magnitude of changes in underlyingpathophysiology and comparison with target therapeu-tic endpoints (i.e., reduction of inflammation or ironconcentration). Furthermore, one can develop morespecific metrics for tissue classification if absoluterelaxometry values reflecting various underlying physi-ological conditions are known from population studies.
CONCLUSION
Quantitative MRI opens up the possibility of meas-uring biophysical and physiological properties on an
absolute level. Beyond the basic measurement ofrelaxation times as described in this review, otherquantitative metrics can be derived, such as contrastdynamics related to vascular function, diffusion,spectroscopy, and magnetization transfer. Numerousother mechanisms that can potentially be quantifiedremain to be explored, and these may require incorpo-rating intrinsic MRI parameters into complex tissuemodels. This review has described the key currentclinical applications of MR relaxometry and provideda basic understanding of why different pathologicalconditions are best probed with specific MR parame-ters. Clinicians and researchers are encouraged touse the rich set of information available from MRrelaxometry and to continue opening new frontiers forquantitative MRI.
ACKNOWLEDGMENTS
The authors would like to thank Dr. Doug Arnold forhis insights on relaxometry in MS, and Dr. Ives R.Levesque for helpful comments on the manuscriptand for providing additional data to supplement Fig.7. The authors would also like to thank Venkat Ram-anan for help with generation of sequence diagramsin Fig. 4.
REFERENCES
1. Bloembergen N, Purcell EM, Pound RV. Relaxation effects in nu-clear magnetic resonance absorbtion. Phys Rev 1948;73:679.
2. Koenig SH, Brown RD III, Gibson JF, Ward RJ, Peters TJ. Relax-ometry of ferritin solutions and the influence of the Fe3þ coreions. Magn Reson Med 1986;3:755–767.
3. Deoni S. Magnetic resonance relaxation and quantitative meas-urements in the brain. Methods Mol Biol 2011;711:65–108.
4. Erkinjuntti T, Ketonen L, Sulkava R, Sipponen J, Vuorialho M,Iivanainen M. Do white matter changes on MRI and CT differen-tiate vascular dementia from Alzheimer’s disease? J Neurol Neu-rosurg Psychiatry 1987;50:37–42.
5. Baudrexel S, Nurnberger L, Rub U, et al. Quantitative mappingof T1 and T2* discloses nigral and brainstem pathology in earlyParkinson’s disease. Neuroimage 2010;51:512–520.
6. Haacke EM, Cheng NY, House MJ, et al. Imaging iron stores inthe brain using magnetic resonance imaging. Magn Reson Imag-ing 2005;23:1–25.
7. Tofts P, editor. Quantitative MRI of the brain: measuringchanges caused by disease. Chichester, West Sussex: Wiley;2005.
8. Miller DH, Grossman RI, Reingold SC, McFarland HF. The roleof magnetic resonance techniques in understanding and manag-ing multiple sclerosis. Brain 1998;121:3–24.
9. McDonald WI, Miller DH, Thompson AJ. Are magnetic reso-nance findings predictive of clinical outcome in therapeutic tri-als in multiple sclerosis? The dilemma of interferon-beta. AnnNeurol 1994;36:14–18.
10. Vrenken H, Geurts JJ, Knol DL, et al. Whole-brain T1 mappingin multiple sclerosis: global changes of normal-appearing grayand white matter. Radiology 2006;240:811–820.
11. Manfredonia F, Ciccarelli O, Khaleeli Z, Tozer DJ, Sastre-Gar-riga J, Miller DH, Thompson AJ. Normal-appearing brain t1relaxation time predicts disability in early primary progressivemultiple sclerosis. Arch Neurol 2007;64:411–415.
12. Papadopoulos K, Tozer DJ, Fisniku L, et al. T1-relaxation timechanges over five years in relapsing-remitting multiple sclerosis.Mult Scler 2010;16:427–433.
13. Bitsch A, Kuhlmann T, Stadelmann C, Lassmann H, LucchinettiC, Bruck W. A longitudinal MRI study of histopathologicallydefined hypointense multiple sclerosis lesions. Ann Neurol2001;49:793–796.
Applications of MR Relaxometry 821

14. van Walderveen MA, Kamphorst W, Scheltens P, et al. Histopa-thologic correlate of hypointense lesions on T1-weighted spin-echo MRI in multiple sclerosis. Neurology 1998;50:1282–1288.
15. Brix G, Schad LR, Deimling M, Lorenz WJ. Fast and precise T1imaging using a TOMROP sequence. Magn Reson Imaging 1990;8:351–356.
16. Tardif CL, Collins DL, Eskildsen SF, Richardson JB, Pike GB.Segmentation of cortical MS lesions on MRI using automatedlaminar profile shape analysis. Med Image Comput ComputAssist Interv 2010;13(Pt 3):181–188.
17. Zellini F, Niepel G, Tench CR, Constantinescu CS. Hypothalamicinvolvement assessed by T1 relaxation time in patients withrelapsing-remitting multiple sclerosis. Mult Scler 2009;15:1442–1449.
18. MacKay A, Whittall K, Adler J, Li D, Paty D, Graeb D. In vivovisualization of myelin water in brain by magnetic resonance.Magn Reson Med 1994;31:673–677.
19. Laule C, Leung E, Lis DK, et al. Myelin water imaging in multi-ple sclerosis: quantitative correlations with histopathology. MultScler 2006;12:747–753.
20. MacKay AL, Vavasour IM, Rauscher A, et al. MR relaxation inmultiple sclerosis. Neuroimaging Clin N Am 2009;19:1–26.
21. Ropele S, Langkammer C, Enzinger C, Fuchs S, Fazekas F.Relaxation time mapping in multiple sclerosis. Expert Rev Neu-rother 2011;11:441–450.
22. Englund E, Brun A, Gyorffy-Wagner Z, Larsson E, Persson B.Relaxation times in relation to grade of malignancy and tissuenecrosis in astrocytic gliomas. Magn Reson Imaging 1986;4:425–429.
23. Kurki T, Komu M. Spin-lattice relaxation and magnetizationtransfer in intracranial tumors in vivo: effects of Gd-DTPA onrelaxation parameters. Magn Reson Imaging 1995;13:379–385.
24. Just M, Thelen M. Tissue characterization with T1, T2, and pro-ton density values: results in 160 patients with brain tumors.Radiology 1988;169:779–785.
25. Tofts PS, Brix G, Buckley DL, et al. Estimating kinetic parame-ters from dynamic contrast-enhanced T(1)-weighted MRI of adiffusable tracer: standardized quantities and symbols. J MagnReson Imaging 1999;10:223–232.
26. Sourbron S, Ingrisch M, Siefert A, Reiser M, Herrmann K. Quan-tification of cerebral blood flow, cerebral blood volume, andblood-brain-barrier leakage with DCE-MRI. Magn Reson Med2009;62:205–217.
27. Runge VM, Muroff LR, Wells JW. Principles of contrast enhance-ment in the evaluation of brain diseases: an overview. J MagnReson Imaging 1997;7:5–13.
28. Aronen HJ, Gazit IE, Louis DN, et al. Cerebral blood volumemaps of gliomas: comparison with tumor grade and histologicfindings. Radiology 1994;191:41–51.
29. Roberts HC, Roberts TP, Brasch RC, Dillon WP. Quantitativemeasurement of microvascular permeability in human braintumors achieved using dynamic contrast-enhanced MR imaging:correlation with histologic grade. AJNR Am J Neuroradiol 2000;21:891–899.
30. DeWitt LD, Kistler JP, Miller DC, Richardson EP Jr, BuonannoFS. NMR-neuropathologic correlation in stroke. Stroke 1987;18:342–351.
31. Bernarding J, Braun J, Hohmann J, et al. Histogram-basedcharacterization of healthy and ischemic brain tissues usingmultiparametric MR imaging including apparent diffusion coeffi-cient maps and relaxometry. Magn Reson Med 2000;43:52–61.
32. Lansberg MG, Thijs VN, O’Brien MW, et al. Evolution of appa-rent diffusion coefficient, diffusion-weighted, and T2-weightedsignal intensity of acute stroke. AJNR Am J Neuroradiol 2001;22:637–644.
33. Larsson HB, Hansen AE, Berg HK, Rostrup E, Haraldseth O.Dynamic contrast-enhanced quantitative perfusion measure-ment of the brain using T1-weighted MRI at 3T. J Magn ResonImaging 2008;27:754–762.
34. Conlon P, Trimble MR, Rogers D, Callicott C. Magnetic reso-nance imaging in epilepsy: a controlled study. Epilepsy Res1988;2:37–43.
35. Rugg-Gunn FJ, Boulby PA, Symms MR, Barker GJ, Duncan JS.Whole-brain T2 mapping demonstrates occult abnormalities infocal epilepsy. Neurology 2005;64:318–325.
36. Townsend TN, Bernasconi N, Pike GB, Bernasconi A. Quantita-tive analysis of temporal lobe white matter T2 relaxation time intemporal lobe epilepsy. Neuroimage 2004;23:318–324.
37. Baxendale SA, van Paesschen W, Thompson PJ, et al. The rela-tionship between quantitative MRI and neuropsychological func-tioning in temporal lobe epilepsy. Epilepsia 1998;39:158–166.
38. Van Paesschen W, Sisodiya S, Connelly A, et al. Quantitativehippocampal MRI and intractable temporal lobe epilepsy. Neu-rology 1995;45:2233–2240.
39. Bernasconi A, Bernasconi N, Caramanos Z, et al. T2 relaxome-try can lateralize mesial temporal lobe epilepsy in patients withnormal MRI. Neuroimage 2000;12:739–746.
40. Kaltwasser JP, Gottschalk R, Schalk KP, Hartl W. Non-invasivequantitation of liver iron-overload by magnetic resonance imag-ing. Br J Haematol 1990;74:360–363.
41. St Pierre TG, Clark PR, Chua-anusorn W, et al. Noninvasivemeasurement and imaging of liver iron concentrations usingproton magnetic resonance. Blood 2005;105:855–861.
42. Wood JC, Enriquez C, Ghugre N, et al. Physiology and patho-physiology of iron cardiomyopathy in thalassemia. Ann N YAcad Sci 2005;1054:386–395.
43. Papakonstantinou O, Alexopoulou E, Economopoulos N, et al.Assessment of iron distribution between liver, spleen, pancreas,bone marrow, and myocardium by means of R2 relaxometrywith MRI in patients with beta-thalassemia major. J MagnReson Imaging 2009;29:853–859.
44. Schwenzer NF, Machann J, Haap MM, et al. T2* relaxometry inliver, pancreas, and spleen in a healthy cohort of one hundredtwenty-nine subjects-correlation with age, gender, and serumferritin. Invest Radiol 2008;43:854–860.
45. Schein A, Enriquez C, Coates TD, Wood JC. Magnetic resonancedetection of kidney iron deposition in sickle cell disease: amarker of chronic hemolysis. J Magn Reson Imaging 2008;28:698–704.
46. Berdoukas V, Chouliaras G, Moraitis P, Zannikos K, Berdoussi E,Ladis V. The efficacy of iron chelator regimes in reducing cardiacand hepatic iron in patients with thalassaemia major: a clinicalobservational study. J Cardiovasc Magn Reson 2009;11:20.
47. Recht MP, Resnick D. Magnetic resonance imaging of articularcartilage: an overview. Top Magn Reson Imaging 1998;9:328–336.
48. Link TM, Stahl R, Woertler K. Cartilage imaging: motivation,techniques, current and future significance. Eur Radiol 2007;17:1135–1146.
49. Blumenkrantz G, Majumdar S. Quantitative magnetic resonanceimaging of articular cartilage in osteoarthritis. Eur Cell Mater2007;13:76–86.
50. Williams A, Gillis A, McKenzie C, et al. Glycosaminoglycan dis-tribution in cartilage as determined by delayed gadolinium-enhanced MRI of cartilage (dGEMRIC): potential clinical applica-tions. AJR Am J Roentgenol 2004;182:167–172.
51. Eckstein F, Burstein D, Link TM. Quantitative MRI of cartilageand bone: degenerative changes in osteoarthritis. NMR Biomed2006;19:822–854.
52. Kight AC, Dardzinski BJ, Laor T, Graham TB. Magnetic reso-nance imaging evaluation of the effects of juvenile rheumatoidarthritis on distal femoral weight-bearing cartilage. ArthritisRheum 2004;50:901–905.
53. Cheng HL, Islam SS, Loai Y, Antoon R, Beaumont M, FarhatWA. Quantitative magnetic resonance imaging assessment ofmatrix development in cell-seeded natural urinary bladdersmooth muscle tissue-engineered constructs. Tissue Eng Part CMethods 2010;16:643–651.
54. Stikov N, Keenan KE, Pauly JM, Smith RL, Dougherty RF, GoldGE. Cross-relaxation imaging of human articular cartilage.Magn Reson Med 2011;66:725–734.
55. Potter HG, Chong le R, Sneag DB. Magnetic resonance imagingof cartilage repair. Sports Med Arthrosc 2008;16:236–245.
56. Chai JW, Lin YC, Chen JH, et al. In vivo magnetic resonance(MR) study of fatty liver: importance of intracellular ultrastruc-tural alteration for MR tissue parameters change. J Magn ResonImaging 2001;14:35–41.
57. de Miguel MH, Yeung HN, Goyal M, et al. Evaluation of quantita-tive magnetic resonance imaging as a noninvasive technique formeasuring renal scarring in a rabbit model of antiglomerular
822 Margaret Cheng et al.

basement membrane disease. J Am Soc Nephrol 1994;4:1861–1868.
58. Johnson K, Davis PJ, Foster JK, McDonagh JE, Ryder CA,Southwood TR. Imaging of muscle disorders in children. PediatrRadiol 2006;36:1005–1018.
59. Maillard SM, Jones R, Owens C, et al. Quantitative assessmentof MRI T2 relaxation time of thigh muscles in juvenile dermato-myositis. Rheumatology (Oxford) 2004;43:603–608.
60. Workie DW, Graham TB, Laor T, et al. Quantitative MR charac-terization of disease activity in the knee in children with juvenileidiopathic arthritis: a longitudinal pilot study. Pediatr Radiol2007;37:535–543.
61. Verstraete KL, Lang P. Bone and soft tissue tumors: the role ofcontrast agents for MR imaging. Eur J Radiol 2000;34:229–246.
62. Gambarota G, Veltien A, van Laarhoven H, et al. Measurementsof T1 and T2 relaxation times of colon cancer metastases in ratliver at 7 T. Magma 2004;17:281–287.
63. Cieszanowski A, Szeszkowski W, Golebiowski M, Bielecki DK,Grodzicki M, Pruszynski B. Discrimination of benign from ma-lignant hepatic lesions based on their T2-relaxation times calcu-lated from moderately T2-weighted turbo SE sequence. EurRadiol 2002;12:2273–2279.
64. Rieke V, Butts Pauly K. MR thermometry. J Magn Reson Imag-ing 2008;27:376–390.
65. Winter JD, Estrada M, Cheng HL. Normal tissue quantitative T1and T2* MRI relaxation time responses to hypercapnic andhyperoxic gases. Acad Radiol 2011;18:1159–1167.
66. Rhee TK, Larson AC, Prasad PV, et al. Feasibility of blood oxy-genation level-dependent MR imaging to monitor hepatic trans-catheter arterial embolization in rabbits. J Vasc Interv Radiol2005;16:1523–1528.
67. Dyke JP, Panicek DM, Healey JH, et al. Osteogenic and Ewingsarcomas: estimation of necrotic fraction during inductionchemotherapy with dynamic contrast-enhanced MR imaging.Radiology 2003;228:271–278.
68. Krasin MJ, Xiong X, Reddick WE, et al. A model for quantitativechanges in the magnetic resonance parameters of muscle inchildren after therapeutic irradiation. Magn Reson Imaging2006;24:1319–1324.
69. Andersson T, Ericsson A, Eriksson B, et al. Relative proton den-sity and relaxation times in liver metastases during interferontreatment. Br J Radiol 1989;62:433–437.
70. Stoffner R, Schullian P, Widmann G, Bale R, Kremser C. [Mag-netic resonance imaging of radiofrequency current-inducedcoagulation zones in the ex vivo bovine liver]. Rofo 2010;182:690–697.
71. Anderson LJ, Holden S, Davis B, et al. Cardiovascular T2-star(T2*) magnetic resonance for the early diagnosis of myocardialiron overload. Eur Heart J 2001;22:2171–2179.
72. Carpenter JP, He T, Kirk P, Roughton M, et al. On T2* magneticresonance and cardiac iron. Circulation 2011;123:1519–1528.
73. Ghugre NR, Enriquez CM, Gonzalez I, Nelson MD Jr, Coates TD,Wood JC. MRI detects myocardial iron in the human heart.Magn Reson Med 2006;56:681–686.
74. Wood JC, Otto-Duessel M, Gonzalez I, et al. Deferasirox anddeferiprone remove cardiac iron in the iron-overloaded gerbil.Transl Res 2006;148:272–280.
75. Wood JC, Aguilar M, Otto-Duessel M, Nick H, Nelson MD, MoatsR. Influence of iron chelation on R1 and R2 calibration curvesin gerbil liver and heart. Magn Reson Med 2008;60:82–89.
76. Van de Werf F, Bax J, Betriu A, et al. Management of acute myo-cardial infarction in patients presenting with persistent ST-seg-ment elevation: the Task Force on the Management of ST-Segment Elevation Acute Myocardial Infarction of the EuropeanSociety of Cardiology. Eur Heart J 2008;29:2909–2945.
77. Bradley WG Jr. MR appearance of hemorrhage in the brain. Ra-diology 1993;189:15–26.
78. Friedrich MG, Abdel-Aty H, Taylor A, Schulz-Menger J, Mess-roghli D, Dietz R. The salvaged area at risk in reperfused acutemyocardial infarction as visualized by cardiovascular magneticresonance. J Am Coll Cardiol 2008;51:1581–1587.
79. Giri S, Chung YC, Merchant A, Mihai G, Rajagopalan S, RamanSV, Simonetti OP. T2 quantification for improved detection ofmyocardial edema. J Cardiovasc Magn Reson 2009;11:56.
80. Ghugre NR, Ramanan V, Pop M, et al. Quantitative tracking ofedema, hemorrhage, and microvascular obstruction in subacute
myocardial infarction in a porcine model by MRI. Magn ResonMed 2011;66:1129–1141.
81. Ganame J, Messalli G, Dymarkowski S, et al. Impact of myocar-dial haemorrhage on left ventricular function and remodelling inpatients with reperfused acute myocardial infarction. Eur HeartJ 2009;30:1440–1449.
82. Garcia-Dorado D, Theroux P, Solares J, et al. Determinants ofhemorrhagic infarcts. Histologic observations from experimentsinvolving coronary occlusion, coronary reperfusion, and reocclu-sion. Am J Pathol 1990;137:301–311.
83. Lotan CS, Miller SK, Bouchard A, et al. Detection of intramyo-cardial hemorrhage using high-field proton (1H) nuclear mag-netic resonance imaging. Cathet Cardiovasc Diagn 1990;20:205–211.
84. Leung G, Moody AR. MR imaging depicts oxidative stressinduced by methemoglobin. Radiology 2010;257:470–476.
85. Foltz WD, Yang Y, Graham JJ, Detsky JS, Wright GA, Dick AJ.MRI relaxation fluctuations in acute reperfused hemorrhagicinfarction. Magn Reson Med 2006;56:1311–1319.
86. Uren NG, Crake T, Lefroy DC, de Silva R, Davies GJ, Maseri A.Reduced coronary vasodilator function in infarcted and normalmyocardium after myocardial infarction. N Engl J Med 1994;331:222–227.
87. Wacker CM, Bock M, Hartlep AW, et al. Changes in myocardialoxygenation and perfusion under pharmacological stress withdipyridamole: assessment using T*2 and T1 measurements.Magn Reson Med 1999;41:686–695.
88. Foltz WD, Huang H, Fort S, Wright GA. Vasodilator responseassessment in porcine myocardium with magnetic resonancerelaxometry. Circulation 2002;106:2714–2719.
89. Ghugre NR, Ramanan V, Pop M, et al. Myocardial BOLD imag-ing at 3 T using quantitative T2: application in a myocardialinfarct model. Magn Reson Med 2011;66:1739–1747.
90. Yan AT, Shayne AJ, Brown KA, et al. Characterization of theperi-infarct zone by contrast-enhanced cardiac magnetic reso-nance imaging is a powerful predictor of post-myocardial infarc-tion mortality. Circulation 2006;114:32–39.
91. Schmidt A, Azevedo CF, Cheng A, et al. Infarct tissue heteroge-neity by magnetic resonance imaging identifies enhanced car-diac arrhythmia susceptibility in patients with left ventriculardysfunction. Circulation 2007;115:2006–2014.
92. Messroghli DR, Greiser A, Frohlich M, Dietz R, Schulz-Menger J.Optimization and validation of a fully-integrated pulse sequencefor modified look-locker inversion-recovery (MOLLI) T1 mappingof the heart. J Magn Reson Imaging 2007;26:1081–1086.
93. Detsky JS, Paul G, Dick AJ, Wright GA. Reproducible classifica-tion of infarct heterogeneity using fuzzy clustering on multicon-trast delayed enhancement magnetic resonance images. IEEETrans Med Imaging 2009;28:1606–1614.
94. Jackowski C, Christe A, Sonnenschein M, Aghayev E, Thali MJ.Postmortem unenhanced magnetic resonance imaging of myo-cardial infarction in correlation to histological infarction agecharacterization. Eur Heart J 2006;27:2459–2467.
95. Waller C, Kahler E, Hiller KH, et al. Myocardial perfusion andintracapillary blood volume in rats at rest and with coronarydilatation: MR imaging in vivo with use of a spin-labelingtechnique. Radiology 2000;215:189–197.
96. Vignaux O, Dhote R, Duboc D, et al. Clinical significance ofmyocardial magnetic resonance abnormalities in patients withsarcoidosis: a 1-year follow-up study. Chest 2002;122:1895–1901.
97. Abdel-Aty H, Simonetti O, Friedrich MG. T2-weighted cardiovas-cular magnetic resonance imaging. J Magn Reson Imaging2007;26:452–459.
98. Aherne T, Yee ES, Tscholakoff D, Gollin G, Higgins C, Ebert PA.Diagnosis of acute and chronic cardiac rejection by magneticresonance imaging: a non-invasive in-vivo study. J CardiovascSurg (Torino) 1988;29:587–590.
99. Conrad CH, Brooks WW, Hayes JA, Sen S, Robinson KG, BingOH. Myocardial fibrosis and stiffness with hypertrophy andheart failure in the spontaneously hypertensive rat. Circulation1995;91:161–170.
100. Mewton N, Liu CY, Croisille P, Bluemke D, Lima JA. Assessmentof myocardial fibrosis with cardiovascular magnetic resonance.J Am Coll Cardiol 2011;57:891–903.
Applications of MR Relaxometry 823

101. Barral JK, Gudmundson E, Stikov N, Etezadi-Amoli M, Stoica P,Nishimura DG. A robust methodology for in vivo T1 mapping.Magn Reson Med 2011;64:1057–1067.
102. Zhu DC, Penn RD. Full-brain T1 mapping through inversion re-covery fast spin echo imaging with time-efficient slice ordering.Magn Reson Med 2005;54:725–731.
103. Gowland PA, Leach MO. A simple method for the restoration ofsignal polarity in multi-image inversion recovery sequences formeasuring T1. Magn Reson Med 1991;18:224–231.
104. Look DC, Locker DR. Time saving in measurement of NMR andEPR relaxation times. Rev Sci Instrum 1970;41:250–251.
105. Messroghli DR, Radjenovic A, Kozerke S, Higgins DM, Sivanan-than MU, Ridgway JP. Modified Look-Locker inversion recovery(MOLLI) for high-resolution T1 mapping of the heart. MagnReson Med 2004;52:141–146.
106. Slavin GS, Gupta SN. Efficient T1 mapping of the heart usingan interleaved look-locker acquisition with saturation recovery.In: Proceeding of the Annual Meeting of SCMR, Rome, Italy,February 2–4, 2007. (abstract 324).
107. Deoni SC, Rutt BK, Peters TM. Rapid combined T1 and T2 map-ping using gradient recalled acquisition in the steady state.Magn Reson Med 2003;49:515–526.
108. Cheng HL, Wright GA. Rapid high-resolution T(1) mapping byvariable flip angles: accurate and precise measurements in thepresence of radiofrequency field inhomogeneity. Magn ResonMed 2006;55:566–574.
109. Kershaw LE, Cheng HL. A general dual-bolus approach forquantitative DCE-MRI. Magn Reson Imaging 2011;29:160–166.
110. Winter JD, Akens MK, Cheng HL. Quantitative MRI assessmentof VX2 tumour oxygenation changes in response to hyperoxiaand hypercapnia. Phys Med Biol 2011;56:1225–1242.
111. Winter JD, St Lawrence KS, Cheng HL. Quantification of renalperfusion: Comparison of arterial spin labeling and dynamic con-trast-enhanced MRI. J Magn Reson Imaging. 2011 Jul 14. doi:10.1002/jmri.22660. [Epub ahead of print] PMID: 21761490
112. Whittall KP, MacKay AL, Graeb DA, Nugent RA, Li DK, Paty DW.In vivo measurement of T2 distributions and water contents innormal human brain. Magn Reson Med 1997;37:34–43.
113. Sussman MS, Vidarsson L, Pauly JM, Cheng HL. A techniquefor rapid single-echo spin-echo T2 mapping. Magn Reson Med2010;64:536–545.
114. Deoni SC, Ward HA, Peters TM, Rutt BK. Rapid T2 estimationwith phase-cycled variable nutation steady-state free preces-sion. Magn Reson Med 2004;52:435–439.
115. Brittain JH, Hu BS, Wright GA, Meyer CH, Macovski A, Nishi-mura DG. Coronary angiography with magnetization-preparedT2 contrast. Magn Reson Med 1995;33:689–696.
116. Zia M, Ghugre N, Paul G, Stainsby J, et al. Characterizing myo-cardial edema and hemorrhage using T2, T2*, and diastolic wallthickness post acute myocardial infarction. Journal of Cardio-vascular Magnetic Resonance 2010;12(Suppl 1):P179.
117. Hennig J. Multiecho imaging sequences with low refocusing flipangles. J Magn Reson 1988;78:397–407.
118. Lebel RM, Wilman AH. Transverse relaxometry with stimulatedecho compensation. Magn Reson Med;64:1005–1014.
119. Prasloski T, Madler B, Xiang QS, Mackay A, Jones C. Applica-tions of stimulated echo correction to multicomponent T(2) anal-ysis. Magn Reson Med 2011 doi:101002/mrm23157 2011[Epub ahead of print].
120. Kingsley PB, Ogg RJ, Reddick WE, Steen RG. Correction oferrors caused by imperfect inversion pulses in MR imaging mea-surement of T1 relaxation times. Magn Reson Imaging 1998;16:1049–1055.
121. Rakow-Penner R, Daniel B, Yu H, Sawyer-Glover A, Glover GH.Relaxation times of breast tissue at 1.5T and 3T measuredusing IDEAL. J Magn Reson Imaging 2006;23:87–91.
122. Gochberg DF, Gore JC. Quantitative magnetization transferimaging via selective inversion recovery with short repetitiontimes. Magn Reson Med 2007;57:437–441.
123. Beaumont M, Odame I, Babyn PS, Vidarsson L, Kirby-Allen M,Cheng HL. Accurate liver T2 measurement of iron overload: a
simulations investigation and in vivo study. J Magn ResonImaging 2009;30:313–320.
124. Ghugre NR, Enriquez CM, Coates TD, Nelson MD Jr, Wood JC.Improved R2* measurements in myocardial iron overload.J Magn Reson Imaging 2006;23:9–16.
125. Reiter D, Roque R, Lin P, et al. Mapping proteoglycan-boundwater in cartilage: improved specificity of matrix assessmentusing multiexponential transverse relaxation analysis. MagnReson Med 2011;65:377–384.
126. Ghugre NR, Coates TD, Nelson MD, Wood JC. Mechanisms of tis-sue-iron relaxivity: nuclear magnetic resonance studies of humanliver biopsy specimens. Magn Reson Med 2005;54:1185–1193.
127. Noseworthy MD, Kim JK, Stainsby JA, Stanisz GJ, Wright GA.Tracking oxygen effects on MR signal in blood and skeletal mus-cle during hyperoxia exposure. J Magn Reson Imaging 1999;9:814–820.
128. Zimmerman J, Britten W. Nuclear magnetic resonance studiesin multiple phase systems: lifetimes of a water molecule in anabsorbing phase silica gel. J Phys Chem 1957;61(1328).
129. Deoni SC, Rutt BK, Arun T, Pierpaoli C, Jones DK. Gleaningmulticomponent T1 and T2 information from steady-state imag-ing data. Magn Reson Med 2008;60:1372–1387.
130. Tozer DJ, Davies GR, Altmann DR, Miller DH, Tofts PS. Correla-tion of apparent myelin measures obtained in multiple sclerosispatients and controls from magnetization transfer and multicom-partmental T2 analysis. Magn Reson Med 2005;53:1415–1422.
131. Vavasour IM, Whittall KP, MacKay AL, Li DK, Vorobeychik G,Paty DW. A comparison between magnetization transfer ratiosand myelin water percentages in normals and multiple sclerosispatients. Magn Reson Med 1998;40:763–768.
132. Laule C, Vavasour IM, Moore GR, et al. Water content and mye-lin water fraction in multiple sclerosis. A T2 relaxation study.J Neurol 2004;251:284–293.
133. Wu Y, Alexander AL, Fleming JO, Duncan ID, Field AS. Myelinwater fraction in human cervical spinal cord in vivo. J ComputAssist Tomogr 2006;30:304–306.
134. Oh J, Han ET, Pelletier D, Nelson SJ. Measurement of in vivomulti-component T2 relaxation times for brain tissue using multi-slice T2 prep at 1.5 and 3 T. Magn Reson Imaging 2006;24:33–43.
135. Levesque I, Sled JG, Narayanan S, et al. The role of edema anddemyelination in chronic T1 black holes: a quantitative magnet-ization transfer study. J Magn Reson Imaging 2005;21:103–110.
136. Wood JC, Enriquez C, Ghugre N, et al. MRI R2 and R2* mappingaccurately estimates hepatic iron concentration in transfusion-dependent thalassemia and sickle cell disease patients. Blood2005;106:1460–1465.
137. Argyropoulou MI, Kiortsis DN, Astrakas L, Metafratzi Z, Chalis-sos N, Efremidis SC. Liver, bone marrow, pancreas and pituitarygland iron overload in young and adult thalassemic patients: aT2 relaxometry study. Eur Radiol 2007;17:3025–3030.
138. Cheng HL, Holowka S, Moineddin R, Odame I. Liver iron over-load assessment by T2* magnetic resonance imaging in pediat-ric patients: an accuracy and reproducibility study. Am JHematol 2012;87:435-437.
139. Kornreich L, Horev G, Yaniv I, Stein J, Grunebaum M, Zaizov R.Iron overload following bone marrow transplantation in chil-dren: MR findings. Pediatr Radiol 1997;27:869–872.
140. Ghugre NR, Wood JC. Relaxivity-iron calibration in hepatic ironoverload: probing underlying biophysical mechanisms using aMonte Carlo model. Magn Reson Med 2011;65:837–847.
141. Reimer KA, Lowe JE, Rasmussen MM, Jennings RB. The wave-front phenomenon of ischemic cell death. 1. Myocardial infarctsize vs duration of coronary occlusion in dogs. Circulation1977;56:786–794.
142. Yellon DM, Hausenloy DJ. Myocardial reperfusion injury.N Engl J Med 2007;357:1121–1135.
143. Dharmakumar R, Arumana JM, Tang R, Harris K, Zhang Z, LiD. Assessment of regional myocardial oxygenation changes inthe presence of coronary artery stenosis with balanced SSFPimaging at 3.0 T: theory and experimental evaluation in can-ines. J Magn Reson Imaging 2008;27:1037–1045.
824 Margaret Cheng et al.


