Embed Size (px)
Citation preview
Prospects for the Rapid Detection of Mealiness in Apples by Nondestructive NMR Relaxometry
P. Barreiro1, A. Moya1, E. Correa1, M. Ruiz-AItisent1, M. Fernández-Valle2, A. Peirs3, K. M. Wright4, and B. P. Hills4
1 Departamento de Ingeniería Rural, Universidad Politécnica de Madrid, Madrid, Spain 2 Centro de Resonancia Magnética Nuclear, Universidad Complutense de Madrid, Madrid, Spain
3 Flanders Center/Laboratory of Postharvest Technology, Katholieke Universiteit Leuven, Leuven, Belgium
4 Institute of Food Research, Norwich Research Park, Norwich, UK.
Abstract. The potential of nuclear magnetic resonance (NMR) relaxometry for quantitative evalua-tion of apple mealiness has been investigated. The degree of "mealiness" was defined by several mechanical techniques, including penetration, compression and shear rupture as well as by the BRIX (soluble solids) and juiciness levéis. These data were correlated with both magnetic resonance imag-ing (MRI) and NMR water protón transverse relaxation time measurements on a fruit-by-fruit basis. It was found that increasing mealiness caused a systematic increase in the transverse relaxation rate. The potential for rapid, on-line NMR/MRI detection of apple mealiness is discussed.
1 Introduction
The idea of developing nuclear magnetic resonance (NMR) or magnetic resonance imaging (MRI) as sensors of infernal defects in fruit is an attractive one but first requires that the internal quality factor of interest, such as ripeness, mealiness or juiciness is strongly correlated with an NMR measureable parameter, such as a relaxation time or spin density. In this paper we focus on the internal quality of apples and explore whether there is a significant correlation between the water protón transverse relaxation behavior and quality factors such as mealiness. Pre-liminary reports by Barreiro et al. in 1999 and 2000 [1, 2] succeeded in estab-lishing a correlation between mealiness and changes in the spatially resolved T2
maps in apples derived from sequences of 20 spin-echo images. Unfortunately, acquiring 20 images of each apple is quite impractical for the purpose of sort-ing apples on the basis of their mealiness so, in this paper, we explore whether nonspatially resolved relaxation measurements can be correlated with spatially resolved relaxation time distributions and mealiness. This idea gains additional

credence from the earlier work by Hills and Remigereau [3], who showed that the distribution of water protón transverse relaxation times for parenchyma apple tissue was sensitive to the subcellular distribution of water. Nonspatially resolved relaxation time distributions can be acquired much faster than T2 maps and can also be acquired at low field. Significant correlations between mealiness and transverse relaxation times would therefore open up the possibility of rapid, low-cost on-line applications. In this paper we therefore investígate whether such correlations exist and also how they compare with the MRI T2 histograms. When deal-ing with fruit quality it is necessary to perform statistical correlations over large numbers of samples. For this reason the NMR measurements were shared between three centres, namely, the Flanders Laboratory of Postharvest Technology (VCBT), the Universidad Politécnica de Madrid (UPM), the Universidad Complutense de Madrid (UCM) and the Institute of Food Research in Norwich (IFR), who collaborated under an EC-funded project (FAIR CT 95-0302) [4-6].
Although the present study is confined to apples, similar NMR methods could be applied to other types of fruit, for example, the detection of woolliness (mealiness) in peaches. It would also be interesting to compare NMR methods and sensitivity with other spectroscopic methods such as near-infrared (NIR) spec-troscopy. Indeed Ortiz et al. [7] has already investigated the combination of NIR and nondestructive impacts for the identification of woolliness in peaches, but NMR methods remain to be applied and compared with the NIR data.
2 Experimental Methods
2.1 Magnetic Resonance Imaging (UCM-UPM)
MRI experiments were performed at UCM (Madrid) on a Bruker Biospec 47/40 (Ettlingen, Germany) spectrometer equipped with actively shielded imaging gra-dients capable of reaching 370 mT/m along all axes. The bore size of the mag-net was 40 cm, but with the gradient stack in place the internal bore diameter was reduced to 12 cm. A home-built high-pass birdcage coil (N = 8) with an inner diameter of 10.4 cm and a length of 14.0 cm was constructed to adapt the coil to the máximum size of our apples.
Apples were imaged as 128 by 128 matrices with the standard two-dimen-sional (2-D) spin echo sequence. 1 slice and 20 echoes were collected with an echo time, TE, of 9.5 ms and a fixed repetition time of 3000 ms. A 5 mm slice thickness and a 10 cm field of view (FOV) were used. Pulse gains, attenuator and shimming settings were previously adjusted for a 6 cm sphere fílled with doped water (copper sulphate, 1% w/w) and were held constant along the total experiment, in which several apples were imaged under these conditions. The field homogeneity was tested as the lack of change in the images of the spherical phantom before and after the apples recording. For comparison, all images were reconstructed with an identical scale factor. The magnitude of these multiecho images was fitted on a pixel-by-pixel basis with a two-parameter (T2 and the sig-

nal intensity at equilibrium) monoexponential function without baseline, with the standard Bruker imaging Fit Package, which uses the Levenberg-Marquart crite-rion for chi-square minimization operating on a Silicon Graphics Indy computer. The software package allows adjustment of the threshold so as to remove those pixels with low signal-to-noise (S/N) ratio. In this way T2 maps of all samples were obtained after removal of all pixels under the 15% of the máximum signal intensity, which successfully removed background pixels. Histograms were obtained by removing those pixels with T2 valúes (digitized at four bits) of zero corresponding to the core and background áreas of the apple images.
Following previous research work [2] these data were used to calcúlate the following subsidiary parameters: The average, standard deviation, máximum and minimum T2 valúes were calculated from the global T2 maps (disregarding those pixels corresponding to the background or the core). The T2 histograms were used to derive the lower quartile (T2 lower limit containing 25% of pixels of the his-togram), upper quartile (T2 upper limit containing 25% of pixels of the histogram), T2 mode (most frequent valúes), mode height (number of pixels with T2 valué equal to the mode), interquartile range (difference between upper and lower quar-tiles), first shape coefficient (mode height/interquartile range), and second shape coefficient (0.5 times the number of pixels of the histogram/interquartile range).
2.2 NMR Relaxation (IFR)
NMR protón transverse relaxation measurements were carried out on a Bruker MSL100 spectrometer operating at 100 MHz with a thermostated, high-power probé with a 90° pulse length of 2 us and the Carr-Purcell-Meiboom-Gill (CPMG) pulse sequence with a 90-180° pulse spacing of 200 us. Data were averaged over eight acquisitions at a recycle delay of 10 s to avoid saturation. This protocol has been extensively investigated on apples in earlier studies [6]. Each measure-ment was destructive because the probé only permirted 5 mm sample diameters. Two repetitions per fruit were performed on the blushed and green área of the fruits in the 1999 batch and 3 repetitions in the 2000 batch.
The CPMG echo-delay envelopes were analyzed as a continuous distribution of exponential relaxation times by the method described by Provencher and Dovi [8] and Provencher [9]. Thus the time domain signal is transformed into a T2 do-main signal. This continuous distribution of exponential relaxation times gives in-formation comparable to that of T2 histograms from MRI, though it is important to note that the CPMG echo decays have 1024 echoes with a short pulse spacing, while the MRI echo decays have 20 echoes and a longer pulse spacing.
2.3 NMR Relaxation (UCM-UPM)
The protón transverse relaxation behavior of the second apple batch was also analyzed at UCM with a Bruker Biospec 47/40 operating at 200 MHz with a

90° pulse length of 130 us on whole fruits. The CPMG pulse sequence was again used with a 90-180° pulse spacing of 200 us (1024 points per curve, total du-ration of 3 s). No data averaging was performed. Time delay between measure-ments was 10 s to avoid saturation. Note that the pulse spacing is equal to that of the IFR equipment, while the pulse length is far longer (130 us compared to 2 us). The spin-locking time is therefore a significant fraction of the acquisition time and the measurement assumes more the characteristics of a rirho (the rotat-ing frame relaxation time) measurement. The echo decay envelopes were ana-lyzed as a continuous distribution of exponential relaxation times [1, 6] at IFR. Because measurements were taken on the whole fruit three repetitions were performed per fruit and the 6 cm sphere filled with doped water (copper sulphate, 1% w/w) was used as a control with three repetitions both at the beginning and the end of each of the three test sessions.
2.4 Fruit
Cox's Orange Pippin apples were submitted by the Flanders Center/Laboratory of Postharvest Technology (VCBT) to an accelerated test to enhance mealiness [4] at three potential mealiness levéis (level 0, nonmealy apples; level 1, médium stag; level 2, mealy apples) in two consecutive seasons (1999 and 2000). In 2000, a fourth batch of fruit of unknown mealiness stage was gathered from three different commercial stores, in order to compare the textural properties with those of the apples submitted to the accelerated test. These samples were gener-ated with the support of the European Concerted Action ASTEQ.
Altogether 120 apples have been analyzed in this study over two growing seasons. The first set of measurements was undertaken at the IFR in 1999 and the second batch was analyzed at the VCBT in 2000. In the 2000 batch, duplícate samples were transported to IFR and UCM under controlled conditions be-cause NMR equipment was only located at these sites. Table 1 shows a sum-mary of the experimental design in both seasons.
2.5 Mechanical and Chemical Tests (UPM-VCBT)
To discover whether the NMR measurements correlate with apple quality, it is necessary to use independent non-NMR instrument methods to quantify the quality factors of interest. The following non-NMR techniques were used.
The Magness-Taylor penetration test was carried out with a Texture Analyzer XT2 (Norwich experiment) and with an LRX testing machine (Leuven experiment) on entire fruits. The Magness-Taylor fiesh penetration test was performed with an 8 mm diameter rod that penetrated the fruit over a máximum of 8 mm with a speed of 20 mm/min. The máximum penetration forcé was registered and was used as Magness-Taylor firmness. One repetition per fruit was performed.
The confined compression test was carried out with the same instrument as the Magness-Taylor test except that cylindncal cores of apple tissue (1.7 cm height and

Table 1. Summary of the experimental design performed in 1999 and 2000 season on Cox's Orange Pippin apples.
Norwich experiment Leuven experiment
Factorial experimental design: Factorial experimental design: mealiness stage (3 levéis) mealiness stage (3 levéis + 1 unknown) sample size: 8 fruits/sample General experiment: total number of fruits: 24 sample size: 20 fruits/sample
NMR relaxometry carried out sample codes for level i: ci-1 to ci-20, on same 24 fruits i = 0, 1, 2, unknown
total number of fruits: 80 NMR experiment:
duplícate sample for IFR: 12 fruits (4 per level) sample codes for level i: ci-21 to ci-24, i = 0, 1, 2, unknown duplícate sample for UPM: 16 fruits (4 per level + 4 of unknown level) sample codes for level i: ci-24 to ci-28, i = 0, 1,2, unknown
1.7 cm diameter) were used. These cores were placed inside a cylindrical holder of the same height and diameter and compressed with a metal rod with a diameter of 1.53 cm at a speed of 20 mm/min to give a máximum deformation of 2.5 mm. After reaching the máximum deformation, the rod returned at the same speed in the opposite direction. 1 repetition per fruit was performed for Norwich and Leuven general experiments, while 3 repetitions per fruit were performed in the NMR experiment held at UCM-UPM. The following parameters were registered: force-to-deformation ratio (N/mm) within the elastic regime which was denoted the "com-pression hardness", and the juice área (mm2) of the spot accumulated in a fílter paper placed underneath the probé during the test (denoted the "compression juici-ness"). The combination of both measurements was used to compute a texture degradation score (0-11) of which mealiness covers the last stages (6—11) [5].
For the shear rupture test cylindrical segments (1.4 cm diameter and 2 cm height) of fruit flesh were used to test the crispiness of the fruits. The segments were sheared laterally with a velocity of 20 mm/min until they ruptured. The máximum forcé at shear rupture point was registered as a valué for shear crispiness (N). Because this is a destructive test, only one repetition could be carried out on each fruit.
For the Brix valué (°Brix) the soluble-solid content was measured with a digital refractometer (PR-101 ATAGO) as a valué for the sugar content.
2.6 Metrology
The standard deviation (STD) of measurements with respect to the sample unit was used as an indicator of repeatability. The evaluation of accuracy implies the use of reproducible reference materials, with known true valúes for the param-eter under evaluation. For MRI and NMR relaxation a sphere filled with copper

sulphate (1% w/w) was used. The signal-to-noise (S/N) ratio was used within the sensor technology ambit as an indicator of the quality of measurements. In our study, the standard error (SE = STD^fñ) of a parameter for a sample unit was taken as an estimator for the noise (nonaddressed variation), while its aver-age valué refers to the signal level. Relating a reference measurement to a new developing technique results in a high S/N ratio, which may be insufficient. Thus, 12 4- 0.2 °Brix has an acceptable S/N valué (60), but we will probably fail in correlating soluble solids from apples varying from 11 to 12 °Brix to a new developing technique. This is due to the fact that the range of variation or mea-sured range (MR, máximum - mínimum valué for all analyzed sample units) for the reference measurements dramatically affects the results of comparison. There-fore there is need for defining new metrological features. The SE/MR ratio was proposed to check the feasibility of inter-technique comparison.
3 Results
3.2 Results of NMR Relaxometry at IFR
The protón transverse relaxation time spectrum obtained by deconvolution of the 1024 CPMG echoes showed a máximum of three relaxation time peaks (Fig. 1). These peaks have been assigned in ref. 3 to water in the vacuole, cell wall and cytoplasm, though there is some averaging of the water signal due to water diffu-sion between these subceliuiar compartments. The longest relaxation time peak is
16000 14000
_ 12000 2 10000 w 8000
6000 4000 2000
O- i 1 — - ^ .
0 2 4 6 8 10 T¡me(x106¡js)
c DI w
0.01 0.1 1 10 100 T2 (X105
MS)
Fig. 1. Example of relaxation curve on apple tissue (top) and result of continuous distribution fit-ting (bottom). The distance between consecutive points for the continuous distribution fit refers to 7", resolution of the results. In this case two peaks are clearly visualized corresponding to different
subceliuiar compartments [3].
L 2500
2000
1500
1000
500
n

• Ripe side a Unripe side
Fig. 2. Main T-, peak extracted from NMR relaxation curves on apple tissue. Average per batch is presented (8 fruits/batch); SE = ±13433 \is. Significant differences are found for mealiness level but
not for fruit side. 1999 Norwich general experiment.
dominant and this corresponds mainly to vacuolar water and it can be seen in Fig. 2 that this main relaxation time shows a significant decrease for increasing mealiness level (Fisher valué F — 83.01, probability p < 0.01) in the 1999 batch of samples analyzed at Norwich. Each of these NMR relaxation time measurements were repeated on the blushed (red) and green face of the apple, but the face of the apple made no significant difference. A fruit-by-fruit comparison of the tex-tural references versus the main T2 peak of the deconvoluted NMR relaxation curve of the 1999 Norwich batch was attempted without success (linear regression coef-ficient r < 0.45 with regard to Magness-Taylor firmness, to hardness, to crispness and to juiciness). This is understandable because of the low SE/MR ratio of the reference measurements (between 0.11 and 0.16 for hardness and juiciness respec-tively, see Table 2) but not because of a poor performance of the NMR relaxation parameter (SE/MR = 0.06 for main T2 peak). It was concluded that there was a need for either a broader measured range or a lower standard error in all refer-
Table 2. Metrological features per fruit on some reference measurements.
Feature and statistic parameter
Norwich experiment (February 99)
Leuven experiment (January 2000) General experiment NMR experiment at UPM
Hardness (N/mm) Range of variation SE SE/MR
Juiciness (mm2) Range of variation SE SE/MR
26.7 3.0a
0.11
677 110a
0.16
42.6 3.0» 0.07
1080 110a
0.10
30.71 1.9
0.06
764 66
0.09
a These valúes has been derived as SE*j3 from the experiments held at UPM, as only there three replicates of the measurements were performed per fruit.

10
9
8
7-
6
5
o o o o o o o o o o o o Mealiness
o o o o
Fig. 3. Main 7", peak extracted from NMR relaxation curves. Averages of three replicates per fruit are presented; SE = ±12483 us. As for Fig. 2, main T2 peak tends to decrease for increasing meali
ness. NMR experiment held at IFR is a reduced sample from General experiment 2000.
ence and devoted techniques. The three repetitions used in the 2000 batch experiment led to an improved SE/MR ratio of 0.11 on a per fruit basis. A similar trend was found (Fig. 3), namely, a systematic reduction in the main relaxation time with increasing mealiness.
3.2 Results of the MRI and NMR Relaxometry at UCM
The spectrometer performance was first checked with the copper sulphate phan-tom. The average T2 for the copper sulphate solution sphere was 67.9 ms. High spatial homogeneity (±205 us) as well as temporal stability (±820 LIS within a day and ±1090 us between days) was found.
Table 3 shows some metrological features of the NMR relaxometry performed at UCM. Of the three test sessions, two showed very good performance and high reproducibility of the main T2 peak (68.3 ms), while the second test session
Table 3. Accuracy and repeatability test carried out at UPM on the NMR relaxation curves by means of a copper sulphate phantom.
Test session nr. and parameter Beginning of test session End of test session
First main 7", peak (us) second 7", peak (us)
Second main T2 peak (us) second T2 peak (us)
Third main T2 peak (us) second 7", peak (us)
68335±0 2287±1981
97760 ±402 84 6284±324
68335±0 905 6 ±443 6
68335±0 3133±0
43430±0 4645 ±246
68335±0 3133 + 0

showed abnorraal variability. The relaxation data of the second session were íherefore discarded in subsequent correlations. The results for the second T2 peak showed less reproducibility than that of main one so they were also disregarded in all subsequent correlations. These results are not surprising given the longer pulse length and the increased contribution of the rotating fíame relaxation in this measurement. Note, however, that the average main T2 peak derived from deconvoluted NMR relaxometry curves (68.3 ms) was very near to that exíracted from T2 fitting on MRI images (68.0 ms).
Figure 4 shows examples of T2 maps for apples with a varying level of meali-ness; as before, T2 maps were fitted from 20 successive echoes and the mealiness stage was determined by the non-NMR instrumental references. As with the
Fig. 4. a Image of Cox apple labelled 0-23 with a mealiness score of 13; b hisiogram from me T2
map of the apple in a. c Image of Cox apple labelled 1-25 with a mealiness score of 7.9; d histo-gram from the T2 map of the apple in c. e Image of Cox apple labelled 2-26 with a mealiness score
of 10.7; f histogram from the T2 map of the apple in e.

nonspatially resolved relaxation data, it was found that the T2 decreased with increasing mealiness and that at a certain point a broad change in the histogram shape was observed and corresponds to a signifícant increase in the standard deviation of the T2 valúes within the apple. These MRI features therefore agreed with expectations on the basis of previous research work [1, 2]. It is interesting to note that the T2 map of apple CO-25 also features a tailed T2 histogram and this apple also showed an abnormal variability in texture reference valúes.
The analysis of the main T2 peak from continuous distribution fit of relaxation curves from UCM data on whole fruit reveáis similar features as those extracted at IFR for apple tissue, namely, a decreasing relaxation time for the main peak with increasing mealiness stage (from 458.6 to 104.4 ms). The abso-lute valué of the main T2 peak derived from NMR relaxometry in whole apples is much higher than the average T2 maps fitted from MRI images. This is ex-pected because the MRI data is derived from a smaller number of echoes so that the main relaxation time peak fails to clearly resolve the contributions from the different subcellular water compartments (vacuole. cytoplasm and cell wall) [3]. The T2 derived from MRI would therefore correspond to a weighed average of all three T2 peaks.
3.3 Characterization of Sample Mealiness with non-NMR Reference Measurements
Table 4 shows a comparison of apple batches submitted to the accelerated stor-age protocol chosen to induce three potential degrees of mealiness and described above. The degree of mealiness was characterized by five parameters, namely, the Magness-Taylor firmness, soluble-solid contení (°Brix), shear crispiness, com-pression hardness and juiciness [5].
Table 4 shows that the range of variation (max-minimum in average batch valúes) in Magness-Taylor firmness and shear crispiness was higher in the 1999 batch (5.3 and 10.2 N, respectively) than for the 2000 batch (2.7 and 4.8 N, re-spectively). However, the range of variation in hardness was similar for both 1999 and 2000 batches (5.8 N/mm in both cases). Surprisingly, both batches had a juiciness far above the conventional threshold for low juiciness (below 400 cm2). In-deed the 2000 batch was even more juicy than the 1999 batch. However, there is a slight increase in juiciness between mealiness level 0 (567 mm2) and mealiness level 1 (668 mrcr) which has also been reported in previous research studies [4]. The average valúes for the unknown batch lie between those of mealy level 0 and 1 (29.0±7.4 N/mm of hardness, 30.3±7.6 N of crispness and 718±180 mm2 of juiciness) though there was a high variability between the fruit.
The high intra-batch variability encountered in the general 2000 experiment -in comparison to 1999 - pointed to the presence of isolated mealy fruits. This was confirmed by computing the texture degradation score (0-11). A score exceeding 6 identifies the very mealy fruits and this identifíed 6 fruits out of 60 as being extremely mealy in the 2000 batch (C0-1, Cl-8, C2-12, C2-4, C2-5, C2-7). In the

Table 4. Characterization of batches with reference measurements (averages with standard deviations).
Mealiness parameter
Magness-Taylor firmness (N) Nr. of fruits F
Soluble solids (°Brix) Nr. of fruits F
Shear resistance (N) Nr. of fruits F
UPM hardness (N/mm) Nr. of fruits F
Juiciness (mm2)
Nr. of fruits F
Nr. of extremely mealy fruits
Norwich experiment (February 99)
Level 0
20.8 ±2.6
8 14.31'
15.5 ±1.1
8 —
27.2 ±6.5
8 9.81
30.3 ±5.2
8 4.78
504 ±54
8
0
Level 1
16.2 ±1.8
8 14.31'
14.9 ±0.7
8 —
19.3 ±3.5
8 9.81
24.6 ±4.5
8 4.78
424 ±54
8
0
Level 2
15.5 ±1.9
8 14.31'
14.8 ±0.9
8 —
17.0 ±4.0
8 9.81
24.5 ±2.9
8 4.78
479 ±113
8
0
Leuven experiment (January 2000) General experiment
Level 0
25.5 ±4.0 20
3.2"
13.2 ±1.0 20
4.19*
28.0 ±5.7 20
4.76
29.3 ±6.8 20
3.82
567 ±133
20
1
Level 1
24.1 ±3.1 20
3.2b
13.6 ±0.7 20
4.19'
26.1 ±4.7 20
4.76
27.4 ±7.4 20
3.82
668 ±188
20
1
Level 2
22.8 ±2.6 20
3.2b
12.8 ±0.8 20
4.19*
23.2 ±4.3 20
4.76
23.5 ±5.9 20
3.82
613 ±139
20
4
NMR experiment Level 0
21.1 ±2.8
4 —
31.0 ±1.9
4 6.30
918 ±178
4
0
Level 1
17.1 ±5.8
4 —
24.4 ±7.6
4 6.30
804 ±191
4
1
at UPM Level 2
14.3 ±7.4
4 —
17.2 ±9.5
4 6.30
778 ±317
4
2
* The Fisher valué for ANOVA valué, p < 0.05. b The Fisher valué for ANOVA valué, p < 0.01.
unknown batch only 1 apple out of 20 (CUK-15) was very mealy by this crite-rion, whereas there were several extremely nonmealy samples in the 1999 batch. This erratic behavior on the onset of mealiness is one of the reasons why this physi-ological disorder has been traditionally diffícult to address.
Table 4 also shows that the samples delivered to UPM showed a slight evo-lution, especially the samples of mealiness level 2 which achieved a batch aver-age of 14.3 N/mm, near the bottom limit known for hardness [4]. The high in-tra-UPM batch variability also points to the presence of fruits undergoing differ-ent physiological stages (see the number of extremely mealy fruits in Table 4). Three out of twelve samples where identifíed as extremely mealy (Cl-25, C2-26 and C2-27). None of the samples from the unknown batch were identifíed as extremely mealy.
Table 2 shows that the range of variation of the reference measurements carried out in 2000 at UPM was much higher when calculated on a fruit-by-fruit basis than in the batch averages: 30.7 N/mm compared to 13.8 N/mm for hard-
ness, and 764 mm2 compared to 140 mm2. The average of all the 16 standard errors per fruit for hardness and for juiciness are 31.9 N/mm and 66 mm2, re-spectively (see Table 2).
A useful comparison of a non-NMR reference measurement to MRI or NMR relaxometry, which has shown to work on a batch basis, can also be done on a fruit-by-fruit basis provided the standard error of a measurement per fruit is not too different from that for batches. Because there were limited numbers of fruit samples and no repetitions this is unlikely to be the case in the experiments at Norwich and Leuven (8 fruits per batch in Norwich and 20 fruits per batch in Leuven, one replicate per fruit). However it is expected to be valid in the UPM experiment where there were 3 replicates per fruit. A metrological parameter defíned as the ratio standard error over measured range (SE/MR) was defined to illustrate this point and is listed in the last line of Table 2.
3.4 Results: Multivariate Data Analysis
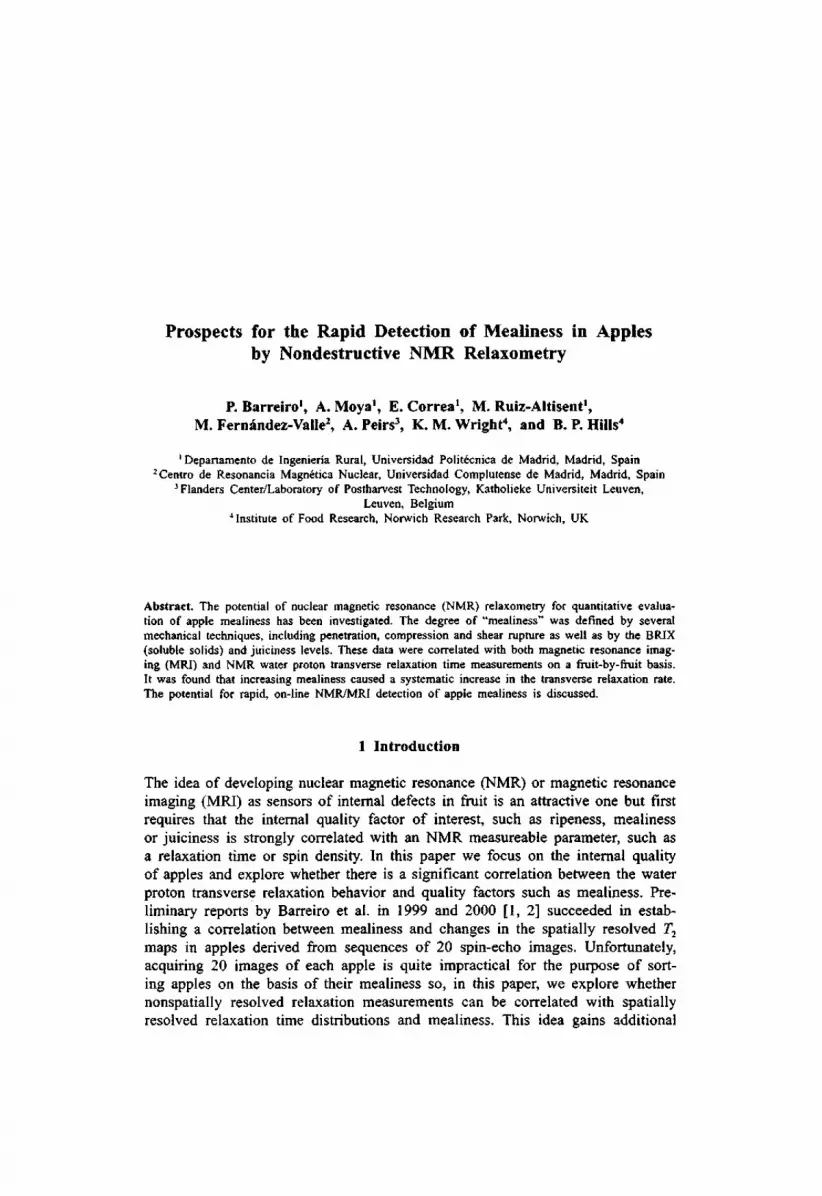
Principal component analysis has been carried out on selected textural and MRI parameters for the NMR experiment at UPM (number of cases equals the num-ber of fruits, 16, corresponding to the averages of three replicates per fruit). Figure 5 shows the projection of the variables on the first principal component plañe (factor 1 vs. factor 2). Juiciness (mm2) is seen to have a strong negative corre-lation with the standard deviation of T2 maps as well as with the interquartile range of T2 maps. These three parameters, which dominate the contribution to the first principal component, show no relationship with the second factor (T2
mode and lower quartile). Hardness (N/mm) and Magness-Taylor firmness (N) are seen to be related to both principal components.
0.8
Upper 0.6
0.4
0.2 Std
/ 0 1 X r, - ° 5
Range -0.2
9r4-
, Lower
Mode Hardness
Magness
Juice \
) 0.5 1
D
Factor 1
Fig. 5. PCA performed on textural and MRI parameters for the NMR experiment carried out at UPM. Explained variance at the first PCA plañe: 0.84.
20
_ 18
£ 16
I 14 H 12 £ Q 10 £0
8
6 2 4 6 8 10 12
Juiciness (mmz)
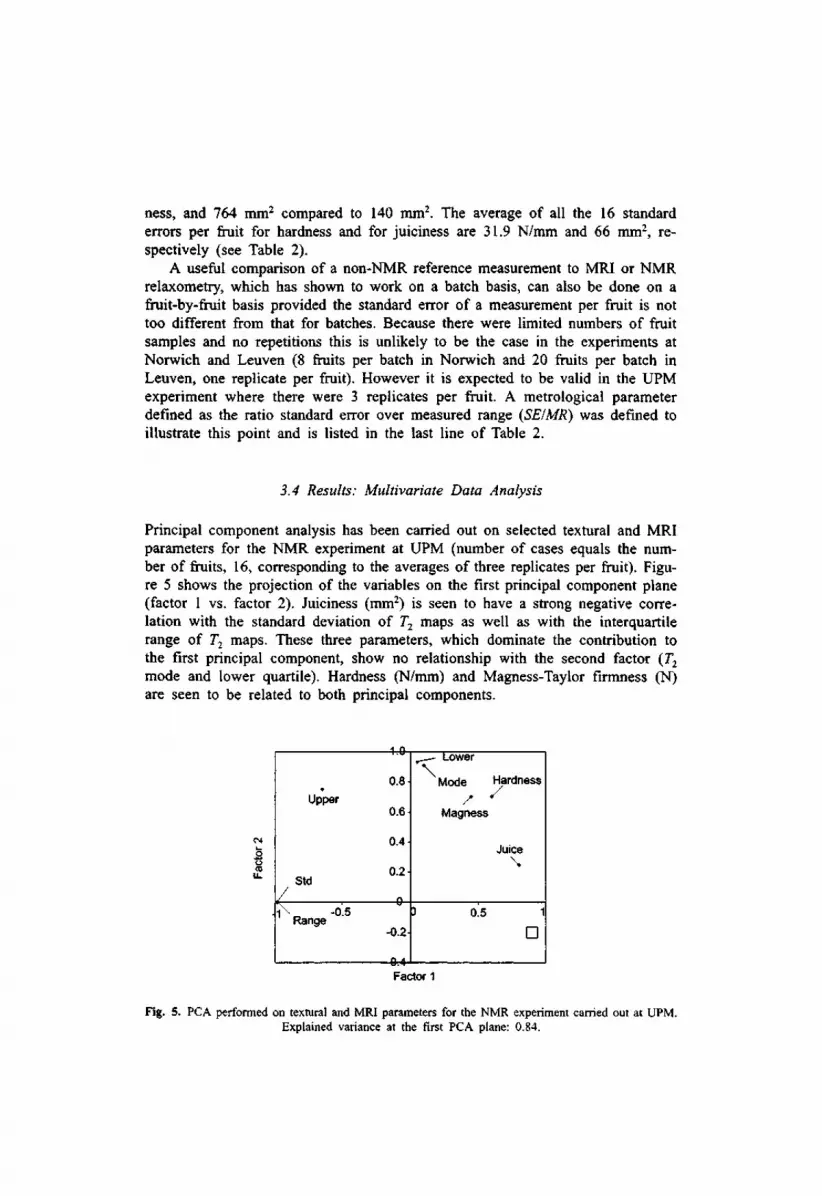
Fig. 6. Relationship between juiciness and standard deviation of T2 maps. Each point is the average of three replicates.
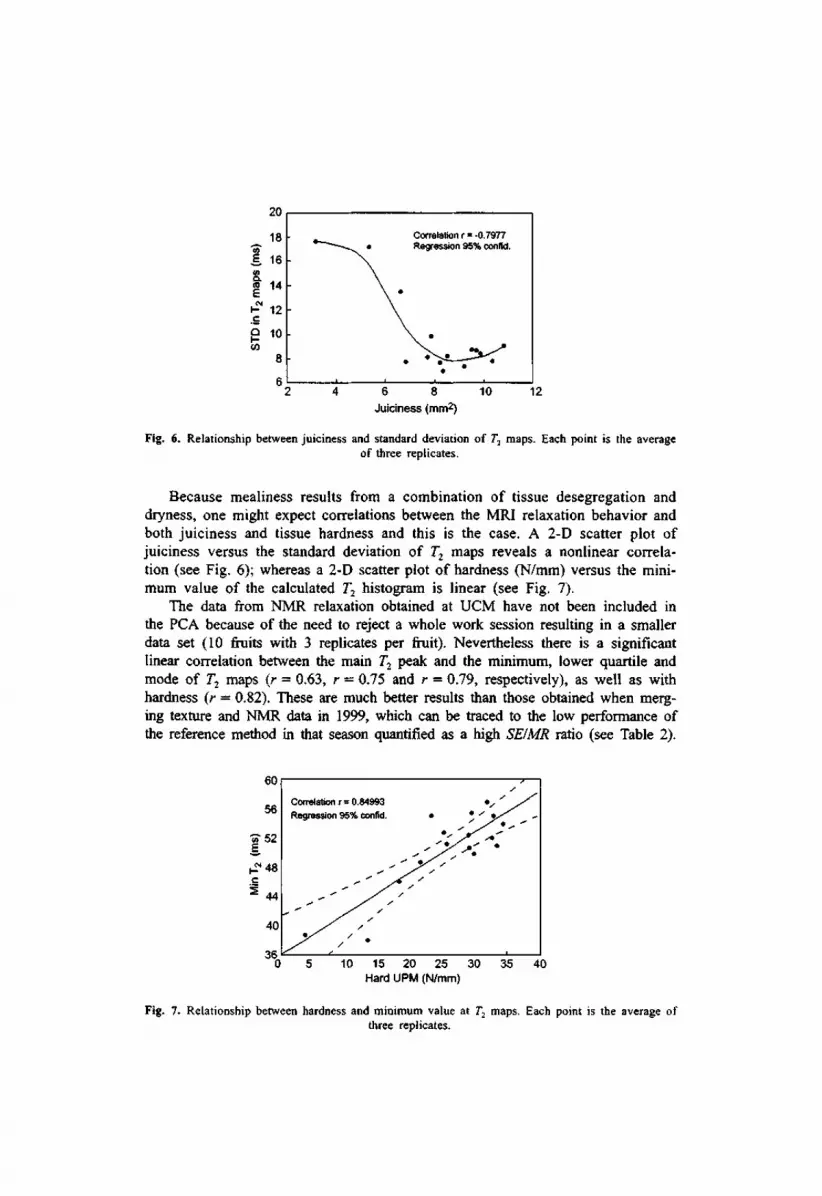
Because mealiness results from a combination of tissue desegregation and dryness, one might expect correlations between the MRI relaxation behavior and both juiciness and tissue hardness and this is the case. A 2-D scatter plot of juiciness versus the standard deviation of T2 maps reveáis a nonlinear correla-tion (see Fig. 6); whereas a 2-D scatter plot of hardness (N/mm) versus the minimum valué of the calculated T2 histogram is linear (see Fig. 7).
The data from NMR relaxation obtained at UCM have not been included in the PCA because of the need to reject a whole work session resulting in a smaller data set (10 fruits with 3 replicates per fruit). Nevertheless there is a signifícant linear correlation between the main T2 peak and the minimum, lower quartile and mode of T2 maps (r = 0.63, r — 0.75 and r = 0.79, respectively), as well as with hardness (r = 0.82). These are much better results than those obtained when merg-ing texture and NMR data in 1999, which can be traced to the low performance of the reference method in that season quantified as a high SE/MR ratio (see Table 2).
60
56
» 5 2
^ 4 8
^ 4 4
40
" 0 5 10 15 20 25 30 35 40 Hard UPM (N/mm)
Fig. 7. Relationship between hardness and minimum valué at T2 maps. Each point is the average of three replicates.
Correlation r = -0.7977 Regression 95% confid.

4 Conclusions
Our results have shown that the main water protón T2 peak in apple decreases from 458.6 to 104.4 ms for whole apples ranging from 1 to 11 in texture deg-radation score (máximum range 0-11) and that the T2 measurement has a repeat-ability of ±21.6 ms. This is an encouraging result and suggests that there is a good prospect of using nondestructive, nonspatially resolved NMR relaxation measurements for rapid on-line mealiness assessment in apples.
Our analysis has also shown that a number of key features in the MRI T2
maps of whole apples show significant correlations with the degree of mealiness. In particular, the histograms are non-Gaussian with extensive tails and the mini-mum T2, lower quartile limit and T2 mode are all smaller for mealy fruit than for fresh.
Our attempts to correlate different techniques such as texrural measurements, MRI and NMR relaxation have highlighted a number of difficulties. In particular, we have shown that the ratio standard error over measured range calculated on a per fruit basis for each of the parameters needs to be below 0.1 before significant correlations can be made. When this criterion is fulfilled, we have found significant correlations between the NMR relaxation behaviour and both the juiciness and hardness of the fruit. These correlations' are summarized in Figs. 6 and 7.
Acknowledgements
The EU is gratefully acknowledged (Project FAIR CT960302 and Concerted Action ASTEQ FAIRS CT97-3516) for financial support and J. Ruiz-Cabello for technical support on MRI.
References
1. Barreiro R, Ruiz-Cabello J., Fernandez-Valle M.E., Ortiz C , Ruiz-Altisent M.: Magn. Reson. Imaging 17, 275-281 (1999)
2. Barreiro P., Ortiz C , Ruiz-Altisent M., Ruiz-Cabello J., Fernández-Valle M.E., Recasens I., Asensio M.: Magn. Reson. Imaging 18, 1175-1181 (2000)
3. Hills B.P., Remigereau B.: Int. J. Food Sci. Technol. 32, 51-62 (1997) 4. Barreiro P., Ortiz C, Ruiz-Altisent M., De Smedt V, Schotte S., Bhanji Z., Wakeling I., Beyts
P.K.: J. Texture Studies 29, 509-525 (1998) 5. Ruiz-Altisent M., Barreiro P.: Human Based Instrumental Measurement of Mealiness. Workshop
on Mealiness in Fruits: Consumer Perception and Means for Detection. Katholike Universiteit Leuven, Belgium. 29th April 1999.
6. De Smedt V.: Ph.D. Thesis, Katholike Universiteit Leuven, Leuven, Belgium, 2000. 7. Ortiz C , Barreiro P., Correa E., Riquelme F., Ruiz-Altisent M.: Agrie. Eng. 1, 1-40 (2000) 8. Provencher S.W., Dovi V.G.: J. Biochem. Biophys. Methods 1, 313-318 (1979) 9. Provencher S.W.: Comput. Phys. Commun. 27, 213-227 (1982)
Authors' address: Brian P. Hills, Institute of Food Research, Norwich Research Park, Colney, Nor-wich NR4 7UA, UK


