Embed Size (px)
Citation preview

Oikos 120: 661–674, 2011 doi: 10.1111/j.1600-0706.2010.19469.x
© 2011 Th e Authors. Oikos © 2011 Nordic Society Oikos Subject Editor: Martin Solan. Accepted 12 November 2010
Predicted levels of future ocean acidifi cation and temperature rise could alter community structure and biodiversity in marine benthic communities
R. Hale , P. Calosi , L. McNeill , N. Mieszkowska and S. Widdicombe
R. Hale ([email protected]) and P. Calosi, Marine Biology and Ecology Research Centre, Univ. of Plymouth, Drake Circus, Plymouth, PL4 8AA, UK. RH, L. McNeill and S. Widdicombe, Plymouth Marine Laboratory, Prospect Place, West Hoe, Plymouth, PL1 3DH, UK. – N. Mieszkowska, Marine Biological Association of the UK, Th e Laboratory, Citadel Hill, Plymouth, PL1 2PB, UK.
A mesocosm experiment was conducted to quantify the eff ects of reduced pH and elevated temperature on an intact marine invertebrate community. Standardised faunal communities, collected from the extreme low intertidal zone using artifi cial substrate units, were exposed to one of eight nominal treatments (four pH levels: 8.0, 7.7, 7.3 and 6.7, crossed with two temperature levels: 12 and 16 ° C). After 60 days exposure communities showed signifi cant changes in structure and lower diversity in response to reduced pH. Th e response to temperature was more complex. At higher pH levels (8.0 and 7.7) elevated temperature treatments contained higher species abundances and diversity than the lower temperature treatments. In contrast, at lower pH levels (7.3 and 6.7), elevated temperature treatments had lower species abundances and diversity than lower temperature treatments. Th e species losses responsible for these changes in community structure and diversity were not randomly distributed across the diff erent phyla examined. Molluscs showed the greatest reduction in abundance and diversity in response to low pH and elevated temperature, whilst annelid abundance and diversity was mostly unaf-fected by low pH and was higher at the elevated temperature. Th e arthropod response was between these two extremes with moderately reduced abundance and diversity at low pH and elevated temperature. Nematode abundance increased in response to low pH and elevated temperature, probably due to the reduction of ecological constraints, such as predation and competition, caused by a decrease in macrofaunal abundance. Th is community-based mesocosm study supports previ-ous suggestions, based on observations of direct physiological impacts, that ocean acidifi cation induced changes in marine biodiversity will be driven by diff erential vulnerability within and between diff erent taxonomical groups. Th is study also illustrates the importance of considering indirect eff ects that occur within multispecies assemblages when attempting to predict the consequences of ocean acidifi cation and global warming on marine communities.
Atmospheric CO 2 concentrations have risen from 280 to 380 ppm since the start of the industrial revolution (Feely et al . 2004). Th is rise is estimated to have caused a 0.74 ° C � 0.18 ° C increase in global temperature over the past hundred years (Solomon et al. 2007) and a drop in the pH of ocean surface water of 0.1 units (Caldeira and Wickett 2003, Solomon et al. 2007). Th e rise in atmospheric CO 2 concentrations is predicted to continue, with estimates for the year 2100 ranging from 490 to 1260 ppm (Gitay et al. 2002). As a result of this, current temperature predic-tions forecast an additional warming of 2 to 6.4 ° C by 2099 (Solomon et al. 2007, Sokolov et al. 2009) and a drop in ocean pH of an additional 0.3 units by 2100 (Caldeira and Wickett 2003, Feely et al . 2004) and 0.7 units by 2250 (Caldeira and Wickett 2003) under the IS92a (the IPCC base case) (Gitay et al. 2002).
Decreased ocean pH and elevated temperature are likely to alter the dynamics, structure and biodiversity of marine eco-systems (Hiscock et al. 2004, Hall-Spencer et al. 2008, Wid-dicombe and Spicer 2008, Feng et al. 2009) due to changes in species abundance, distribution, predator vulnerability
and competitive fi tness. Temperature-adaptive physiologi-cal variation and ecological interactions are instrumental in structuring the biogeography and bathymetric distribution of many marine ectothermic species (Stillman 2002, Compton et al. 2007), including sub- to inter-tidal gradients in coastal marine ecosystems. Recent changes in global temperature have already resulted in poleward shifts in geographical dis-tributions (Mieszkowska et al. 2006) and changes in species interactions (P ö rtner 2008). Low pH high CO2 caused a reduction of infaunal diversity in a recent mesocosm study (Widdicombe et al. 2009a) and has also been observed to cause the loss of calcifying species such as echinoderms and molluscs from in situ communities (Hall-Spencer et al. 2008, Wootton et al. 2008). Not all species in these studies, however, showed a reduced abundance in response to low pH. Some species increased in abundance, indicating there may be a complex response to ocean acidifi cation and global warming due to indirect ecological eff ects. Th erefore, it can-not be assumed that an ecosystem-level response will sim-ply be a function of calcifi cation or reduction in organism performance (Wootton et al. 2008).
661

Presently, most studies of low pH hypercapnia have focused on individual species in isolation and very few exper-iments have investigated the eff ects of acidifi cation on an intact community or multispecies assemblage (Widdicombe et al. 2009a). Th e same can be said for temperature (Durance and Ormerod 2007), although in this case our understand-ing of likely responses of taxonomical assemblages and com-munities to global warming, are supported by the existence of numerous comparative and evolutionary studies (Stillman 2002), as well as predictive models (Cheung et al. 2009). Organisms do not naturally occur in monospecifi c assem-blages and the response of any individual to its environ-ment will be aff ected by interactions with other individuals of the community (Menge and Sutherland 1987). Th ere are also very few published community based experiments that have examined the potential for synergistic eff ects from the combined stresses of low pH hypercapnia and elevated tem-perature. Recently, Feng et al. (2009) and Rose et al. (2009) looked at changes in algal and microzooplankton communi-ties due to low pH and elevated temperature and observed a detrimental synergistic eff ect, suggesting that the combined eff ect of these factors may have signifi cant eff ects on marine communities.
Experiments on natural communities can often be com-plicated by the large variability in community structure and diversity caused by habitat heterogeneity. Th e use of artifi -cial substrate units (ASUs) overcomes such problems to an extent by allowing the collection of a standardised commu-nity in an area such as a rocky shore, where conventional means of sampling are not possible (Gobin and Warwick 2006) and are an eff ective method for collecting a naturally diverse community (Norderhaug et al. 2002). While the community collected may be slightly diff erent to that pres-ent on natural substrata (Smith and Rule 2002) it is suitable for experimental purposes as the same bias will be present in all samples (Gobin and Warwick 2006). One popular and proven method of creating ASUs is using aquarium grade nylon mesh pan scourers held together with a cable tie. Th is technique has been used in a number of previous studies to collect diverse communities of marine invertebrates (Gobin and Warwick 2006, Underwood and Chapman 2006).
In the current study ASUs have been used to collect suit-able replicate communities and placed within a controlled mesocosm experiment to test the null hypothesis that exposure to low pH hypercapnia and elevated temperature will have no signifi cant eff ect on the community structure and diversity of a benthic macrofaunal assemblage. In doing so, this study is the fi rst study of its kind to experi-mentally examine the potential interactive eff ects of both hypercapnia and elevated CO2 and temperature on a multi-species benthic community.
Methods
Fifty ASUs were constructed by attaching four aquarium grade nylon mesh pan scourers (9 cm ø , 2.5 cm thick) together using a marine cable tie. Th e ASUs were attached to stainless steel eyes screwed into the rock in a sheltered area of the rocky shore at Mount Batten, Plymouth, UK (50 ° 35 ′ 67 ′ ′ N, 4 ° 12 ′ 77 ′ ′ W). Th ey were attached between
662
0.6 m and 1 m above lowest chart datum (LCD), during the spring low tide on the 14 January at 14:00 h GMT, in an area where all ASUs would be exposed to similar conditions (temperature, sunlight, wave exposure, elevation). Th is area of shore has been described previously as a kelp habitat dom-inated by brown and red algae with a high level of diversity (MBA NaGISA Data 2008). iButtons attached to the shore adjacent to the ASUs took temperature readings every hour for the duration of the faunal collection period. Th e ASUs were left in the fi eld for twelve weeks to allow colonisation by a suitably diverse community (Underwood and Chapman 2006) before being collected on the 8 April at 11:00 GMT. Upon collection each ASU was placed inside a plastic bag which was then placed inside another plastic bag to retain any organisms which may be dislodged from the ASU dur-ing the one hour taken to transport them to the mesocosm facility at the Plymouth Marine Laboratory (PML). Once at PML, fi ve ASUs were randomly selected and preserved in 10% formaldehyde solution. Th ese ASUs were used to determine the community structure and diversity present at the start of the exposure period.
Forty of the remaining ASUs were each placed in separate food grade pre-seasoned 6 litre plastic buckets. Each bucket was then randomly allocated to one of eight treatments con-sisting of four pH levels crossed with two temperature levels with fi ve replicates for each combination. Control pH was 8.0 (the ambient seawater pH measured at the fauna collec-tion site), and the decreased pH levels used were 0.3 units below ambient (the predicted drop in ocean pH by 2100), 0.7 units below ambient (the predicted drop in pH by 2250; Gitay et al. 2002, Caldeira and Wickett 2003) and a pH of 6.7 (to simulate CO 2 storage site continuous point source leakage under already acidifi ed conditions, Blackford et al . 2009). Th e mesocosm was held at a control temperature of 12 ° C (the ambient temperature measured at the fauna col-lection site) and the elevated temperature treatment was 4 ° C above the control (simulating a rise in temperature mid-way within the range predicted, 2 to 6.4 ° C, as a result of increased atmospheric CO 2 by 2099 (Solomon et al. 2007, Sokolov et al. 2009). Th e elevated temperature was achieved using heaters to warm the water in water baths within which the elevated temperature treatment buckets were held.
Th e experiment was conducted following best practice procedures identifi ed by Widdicombe et al . (2009b). Seawa-ter acidifi cation was achieved by bubbling with 100% CO 2 gas following the methods described by Widdicombe and Needham (2007) and the experimental setup is shown in Fig. 1. Each 6-l bucket was continuously supplied with sea-water from one of the eight reservoir tanks at a rate of 8 – 10 ml min �1 using a peristaltic pump. Th is ensured complete water turnover approximately every 12 h and prevented the build-up of any waste products such as additional dissolved CO 2 from respiration (Widdicombe et al. 2009b). Once in the mesocosm, the communities were allowed to acclimate gradually to the pH and temperature treatment levels. Dur-ing transfer of ASUs to the exposure buckets, the buckets were half emptied and the ASUs placed inside with a small amount of ambient pH and temperature natural seawater. At the defi ned rate of water turnover the buckets reached the experimental pH and temperature after approximately 12 h with a pH change of 0.05 h �1 for the pH 6.7 treatment,

a change of 0.03 pH units h �1 for the pH 7.3 treatment and a change of 0.01 pH units h �1 for the 7.7 treatment and a temperature change of 0.16 ° C h �1 for the 16 ° C temperature treatment. A lip at the top of the bucket allowed the over-fl ow of excess water from the system and a gauze cover (0.5 mm mesh) prevented the loss of macrofauna species over the lip. Oxygen was bubbled through the water held within the buckets to assist with maintenance of the correct pH and to increase water mixing and oxygen levels.
Each bucket was fed 1.68 ml of shellfi sh feed once a week to approximate the nutrient levels available to a community located at Mount Batten in March (Plymouth Marine Laboratory unpublished nutrient data from 2008). No other food was provided for any larger or carnivorous organisms as the reactions of the natural community pro-cesses of predation and competition to acidifi ed condi-tions were under study. While in the mesocosm, natural conditions such as nutrient availability and light periodic-ity were approximated as closely as possible to reduce any experimental stress caused by maintenance of fauna in the laboratory (Widdicombe et al. 2009b). Th e natural light regime was approximated using daylight simulation lights within the mesocosm with an average 8-h photoperiod per day. No tidal cycle was applied to the buckets. While the ASUs were attached to the shore at Mount Batten they would have not been aff ected much by any tidal fl uctua-tions due to their location close to LCD.
Monitoring of experimental conditions
Th e water within each of the eight reservoir tanks and 40 buckets was monitored bi-weekly using a combined pH NIST and temperature ( ° C) probe calibrated before each use with 4, 7 and 10 pH NIST standards and a salinity probe. Th e reser-voir tank pH electrodes were calibrated once every two weeks using 4.0 and 10.0 pH NIST standards. Water samples were
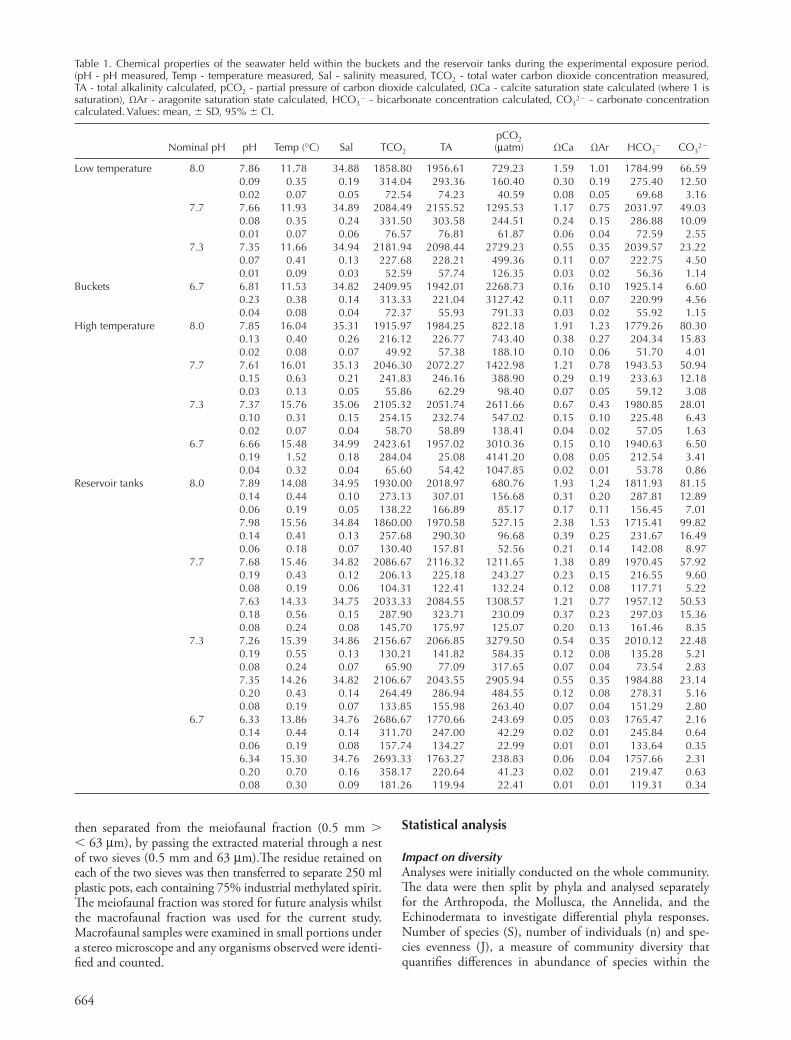
taken to obtain total CO 2 values using a DIC analyser calibrated with 2 g l �1 CO 2 standard reagent. From these data other carbonate parameters were calculated using the CO2SYS program (Pierrot et al. 2006) using constants from Mehrbach et al. (1973) refi tted by Dickson and Millero (1987) and the KSO 4 dissociation constant from Dickson (1990). Th e system maintained the nominated pH and temperature treatments throughout the experi-mental period with little variation (Table 1) and was therefore considered a suitable method for the artifi cial manipulation of seawater pH and temperature. Carbon-ate concentration declined with pH. Th e control pH 8.0 treatments were oversaturated with respect to both calcite and aragonite within the reservoir tanks and the 6-l buck-ets. Within the acidifi ed treatments those held at pH 7.7 and below were undersaturated with respect to aragonite and those held at pH 7.3 and below were undersaturated with respect to calcite.
After a period of 60 days, by which time it was thought that any changes to macrofaunal community structure and diversity caused by low pH hypercapnia and elevated water temperature would be evident, the cable tie was cut and the ASUs were separated into their four individual pan scourers. Th ese were then transferred from the expo-sure bucket into a 1-litre plastic pot. All the water con-tained within the buckets was passed through a 63 μ m mesh sieve and the bucket rinsed thoroughly. The resi-due retained on the sieve was transferred into the same 1-litre pot and the pots fi lled with diluted 10% formalin solution.
To identify the collected organisms the fauna were fi rst separated from the pan scourers in a fume hood by washing the scourers with water over a 63 μ m sieve. Each scourer was then cut into pieces and rinsed thoroughly, again over the sieve. After rinsing, each piece of scourer was transferred back into the original 1-l pot and checked again for larger organisms by eye. Th e macrofaunal fraction ( � 0.5 mm) was
Figure 1. Schematic diagram of the experimental setup used during the mesocosm experiment (adapted from Widdicombe and Needham 2007).
663
Nominal pH pH Temp ( ° C) Sal TCO 2 TApCO 2 (μ atm) ΩCa ΩA r HCO 3 � CO 3 2�
Low temperature 8.0 7.86 11.78 34.88 1858.80 1956.61 729.23 1.59 1.01 1784.99 66.590.09 0.35 0.19 314.04 293.36 160.40 0.30 0.19 275.40 12.500.02 0.07 0.05 72.54 74.23 40.59 0.08 0.05 69.68 3.16
7.7 7.66 11.93 34.89 2084.49 2155.52 1295.53 1.17 0.75 2031.97 49.030.08 0.35 0.24 331.50 303.58 244.51 0.24 0.15 286.88 10.090.01 0.07 0.06 76.57 76.81 61.87 0.06 0.04 72.59 2.55
7.3 7.35 11.66 34.94 2181.94 2098.44 2729.23 0.55 0.35 2039.57 23.220.07 0.41 0.13 227.68 228.21 499.36 0.11 0.07 222.75 4.500.01 0.09 0.03 52.59 57.74 126.35 0.03 0.02 56.36 1.14
Buckets 6.7 6.81 11.53 34.82 2409.95 1942.01 2268.73 0.16 0.10 1925.14 6.600.23 0.38 0.14 313.33 221.04 3127.42 0.11 0.07 220.99 4.560.04 0.08 0.04 72.37 55.93 791.33 0.03 0.02 55.92 1.15
High temperature 8.0 7.85 16.04 35.31 1915.97 1984.25 822.18 1.91 1.23 1779.26 80.300.13 0.40 0.26 216.12 226.77 743.40 0.38 0.27 204.34 15.830.02 0.08 0.07 49.92 57.38 188.10 0.10 0.06 51.70 4.01
7.7 7.61 16.01 35.13 2046.30 2072.27 1422.98 1.21 0.78 1943.53 50.940.15 0.63 0.21 241.83 246.16 388.90 0.29 0.19 233.63 12.180.03 0.13 0.05 55.86 62.29 98.40 0.07 0.05 59.12 3.08
7.3 7.37 15.76 35.06 2105.32 2051.74 2611.66 0.67 0.43 1980.85 28.010.10 0.31 0.15 254.15 232.74 547.02 0.15 0.10 225.48 6.430.02 0.07 0.04 58.70 58.89 138.41 0.04 0.02 57.05 1.63
6.7 6.66 15.48 34.99 2423.61 1957.02 3010.36 0.15 0.10 1940.63 6.500.19 1.52 0.18 284.04 25.08 4141.20 0.08 0.05 212.54 3.410.04 0.32 0.04 65.60 54.42 1047.85 0.02 0.01 53.78 0.86
Reservoir tanks 8.0 7.89 14.08 34.95 1930.00 2018.97 680.76 1.93 1.24 1811.93 81.150.14 0.44 0.10 273.13 307.01 156.68 0.31 0.20 287.81 12.890.06 0.19 0.05 138.22 166.89 85.17 0.17 0.11 156.45 7.017.98 15.56 34.84 1860.00 1970.58 527.15 2.38 1.53 1715.41 99.820.14 0.41 0.13 257.68 290.30 96.68 0.39 0.25 231.67 16.490.06 0.18 0.07 130.40 157.81 52.56 0.21 0.14 142.08 8.97
7.7 7.68 15.46 34.82 2086.67 2116.32 1211.65 1.38 0.89 1970.45 57.920.19 0.43 0.12 206.13 225.18 243.27 0.23 0.15 216.55 9.600.08 0.19 0.06 104.31 122.41 132.24 0.12 0.08 117.71 5.227.63 14.33 34.75 2033.33 2084.55 1308.57 1.21 0.77 1957.12 50.530.18 0.56 0.15 287.90 323.71 230.09 0.37 0.23 297.03 15.360.08 0.24 0.08 145.70 175.97 125.07 0.20 0.13 161.46 8.35
7.3 7.26 15.39 34.86 2156.67 2066.85 3279.50 0.54 0.35 2010.12 22.480.19 0.55 0.13 130.21 141.82 584.35 0.12 0.08 135.28 5.210.08 0.24 0.07 65.90 77.09 317.65 0.07 0.04 73.54 2.837.35 14.26 34.82 2106.67 2043.55 2905.94 0.55 0.35 1984.88 23.140.20 0.43 0.14 264.49 286.94 484.55 0.12 0.08 278.31 5.160.08 0.19 0.07 133.85 155.98 263.40 0.07 0.04 151.29 2.80
6.7 6.33 13.86 34.76 2686.67 1770.66 243.69 0.05 0.03 1765.47 2.160.14 0.44 0.14 311.70 247.00 42.29 0.02 0.01 245.84 0.640.06 0.19 0.08 157.74 134.27 22.99 0.01 0.01 133.64 0.356.34 15.30 34.76 2693.33 1763.27 238.83 0.06 0.04 1757.66 2.310.20 0.70 0.16 358.17 220.64 41.23 0.02 0.01 219.47 0.630.08 0.30 0.09 181.26 119.94 22.41 0.01 0.01 119.31 0.34
then separated from the meiofaunal fraction (0.5 mm � � 63 μ m), by passing the extracted material through a nest of two sieves (0.5 mm and 63 μ m).Th e residue retained on each of the two sieves was then transferred to separate 250 ml plastic pots, each containing 75% industrial methylated spirit. Th e meiofaunal fraction was stored for future analysis whilst the macrofaunal fraction was used for the current study. Macrofaunal samples were examined in small portions under a stereo microscope and any organisms observed were identi-fi ed and counted.
664
Statistical analysis
Impact on diversity Analyses were initially conducted on the whole community. Th e data were then split by phyla and analysed separately for the Arthropoda, the Mollusca, the Annelida, and the Echinodermata to investigate diff erential phyla responses. Number of species (S), number of individuals (n) and spe-cies evenness (J), a measure of community diversity that quantifi es diff erences in abundance of species within the
Table 1. Chemical properties of the seawater held within the buckets and the reservoir tanks during the experimental exposure period. (pH - pH measured, Temp - temperature measured, Sal - salinity measured, TCO 2 - total water carbon dioxide concentration measured, TA - total alkalinity calculated, pCO 2 - partial pressure of carbon dioxide calculated, Ω Ca - calcite saturation state calculated (where 1 is saturation), Ω Ar - aragonite saturation state calculated, HCO 3 � - bicarbonate concentration calculated, CO 3 2� - carbonate concentration calculated. Values: mean, � SD, 95% � CI.

Source DF SS MS F p
(a) Number of speciespH 3 2588.59 862.865 27.11 0.000 Temp 1 30.03 30.031 0.94 0.341pH � Temp 3 377.34 125.781 3.95 0.020 Error 24 763.75 31.823Total 31 3759.72
(b) Number of individualspH 3 377056 125685 4.27 0.015 Temp 1 158485 158485 5.38 0.029 pH � Temp 3 551825 183942 6.24 0.003 Error 24 707247 29469Total 31 1794612
(c) Species evenness (Pielou)pH 3 0.466667 0.155556 13.39 0.000 Temp 1 0.002343 0.002343 0.20 0.657pH � Temp 3 0.036321 0.012107 1.04 0.392Error 24 0.278767 0.011615Total 31 0.784098
community (Pielou 1975) were calculated for each sample. Th e Kolmogorov-Smirnov test for normality (Chakravarti et al. 1967) and Bartlett ’ s (1937) and Levene ’ s (1960) tests for homogeneity of variance were used to assess the normal-ity of the data and suitable transformations applied. Two-way ANOVAs or Kruskal-Wallis tests (for non-parametric data) were carried out using Minitab (ver. 15) to determine if these parameters were signifi cantly aff ected by pH, temperature and their interaction.
Impact on community structures Multivariate analysis to determine whether low pH hyper-capnia or elevated temperature caused signifi cant changes to macrofaunal community structure was performed on the data using PRIMER (ver. 6.1.5, Clarke and Gorley 2006, Plymouth Marine Laboratory, Plymouth, UK). In addition to using untransformed data, a presence/absence transfor-mation was conducted to downweight the infl uence of very abundant species and to upgrade the infl uence of rare ones (Clarke and Green 1988). Bray-Curtis similarity matrices were constructed for both the untransformed and presence/absence transformed data. Th e add-in ‘ PERMANOVA � rou-tines ’ (beta version, Anderson et al. 2008) was used to test for the main eff ects of low pH hypercapnia and temperature plus the presence of interactions between these main eff ects. To visualise the relative diff erences between samples, multidi-mensional scaling ordination (MDS) plots were constructed. Each point on the plot represents a single sample and the distance between any two points in three-dimensional space illustrates the relative similarity of their communities.
Again using PRIMER, SIMPER analysis was employed to determine which species were most responsible for the dis-similarity between treatment groups. Th e specifi c responses of these infl uential species were analysed with graphs drawn using Sigma-Plot (ver. 11.0, Univ. of Plymouth, Plymouth, UK).
Results
The experimental community and mesocosm effects
Of the 50 ASUs initially deployed, 49 were retrieved suc-cessfully indicating suffi cient attachment to the shore. After three months in the fi eld the ASUs had become colonised with macrofauna, were coated by a fi lm of microfl ora and many had large algal structures growing within them. Th e fi ve ASUs preserved immediately after collection from the fi eld and not transferred to the mesocosm were relatively similar in their macrofaunal diversity and contained 40.5 � 4.33 species from 313.75 � 45.43 individuals with an evenness value of 0.78 � 0.05. Th e communities contained fauna from a large number of major taxa (Annelida, Arthropoda, Mollusca, Nematoda, Nemertea, Echinodermata, Cnidaria, Ascidacea, Chaetognatha, Sipuncula and Platyhelminthes) demonstrating that this was a suitable method to collect rep-licated communities for experimentation. Th is diverse com-munity was successfully maintained within the mesocosm for the duration of the experiments. After two months of experimental exposure in the mesocosm, a total of 188 mac-rofaunal species categories were identifi ed consisting mainly of
arthropods (59 species categories), molluscs (44 species cat-egories) annelids (70 species categories) and the Nematoda (classifi ed to phyla only), with other representatives from the same taxa recovered from the initial ASUs not transferred to the mesocosm.
Effects on biodiversity
The whole community Two-way ANOVA analyses performed on diversity data for the whole community showed that the number of species in each community was signifi cantly reduced by lowered pH and the interaction between low pH and high temperature, but not by temperature in isolation (Table 2a, Fig. 2a). Th e number of individuals in each community was signifi cantly aff ected by pH, temperature and their interaction (Table 2b) and showed a varied response with more individuals found in the pH 8.0 and 7.3 treatments at the higher temperature, however, at pH 6.7 there were few organisms at both tempera-ture treatments (Fig. 2b). Species evenness in each community was signifi cantly lower at decreased pH (Table 2c, Fig. 2c).
Arthropoda Th e number of arthropod species was signifi cantly detri-mentally aff ected by pH, temperature and their interaction (Table 3ai, Fig. 3ai) with much fewer species found in the low pH and high temperature treatments than the high pH and low temperature treatments. Th e number of arthropod individuals in each community was only reduced signifi -cantly at low pH (Table 3aii, Fig. 3aii). Species evenness was unable to be analysed using a two-way ANOVA as one com-munity contained only one arthropod. Th e samples from pH 6.7 were therefore removed and the data normalised using the inverse function. Neither pH, temperature nor their interaction signifi cantly aff ected the species evenness of the arthropod community at the pHs 8.0, 7.7 and 7.3,
Table 2. Two-way ANOVAs for a) the total number of species, b) the total number of individuals and c) the total species evenness within the communities. Degrees of freedom (DF), sum of squares (SS), mean squares (MS), F-value (F) and probability value (p). (Bold p-values indicate signifi cance at p � 0.05.)
665

which was similar at all the pHs and both temperature treat-ments (Table 3aiii, Fig. 3aiii).
Mollusca Th e data were not normally distributed and could not be nor-malised by the square root function or the inverse or log 10 func-tions due to the presence of zeros. Th erefore the samples from pH 6.7 were removed from the diversity analyses. Th e num-ber of mollusc species in the ASUs held at the remaining pHs was signifi cantly reduced by lowered pH, elevated tem-perature and their interaction (Table 3bi, Fig. 3bi). Th e data for the number of mollusc individuals was normalised using the log 10 transformation and the number of individuals was then found to be signifi cantly less at low pHs (Table 3bii, Fig. 3bii). Analysis of species evenness required the addi-tional removal of the communities held at pH 7.3 due to low species numbers. No eff ect of pH, temperature or their interaction was found to be signifi cant in aff ecting the spe-cies evenness between the communities held at pH 8.0 and 7.7 (Table 3biii). Values of species evenness were similar at all pH and temperature treatments (Fig. 3biii).
Annelida Th e number of annelid species in the communities was sig-nifi cantly aff ected by both pH and temperature, however, their interaction did not exert a signifi cant eff ect (Table 3ci). Th e number of annelid species present in the communi-ties was slightly (but signifi cantly) lower at lower pHs and more annelid species were present at higher temperatures (Fig. 3ci). Th e number of individuals in each community was normalised using the inverse function and the eff ect of pH, temperature and their interaction was signifi cant in aff ecting the number of annelid individuals in a community (Table 3cii). Th e number of individuals was higher and was more variable at the higher temperature except for in the pH 6.7 treatment where the numbers were reduced. A similar number of annelids were found in all the 12 ° C treatments (Fig. 3cii). Th e evenness of the communities could not be normalised using any transformation and was analysed using the non-parametric Kruskal-Wallis test. Th e eff ects of pH or temperature were not signifi cant (Table 3ciii) and species evenness was similar at all pHs and temperatures except for one treatment at 7.3 and 16 ° C (Fig. 3ciii).
666
Echinodermata Th e data were not normally distributed and analysed using the Kruskal-Wallis test. Th e abundance of the echinoderms in the treatments was signifi cantly detrimentally aff ected by low pH high CO2 but not temperature (Table 3di), however, in the communities exposed to the higher tem-perature treatments there were more echinoderms found within the communities at the higher pH treatments (Fig. 3di).
Effects on community structure
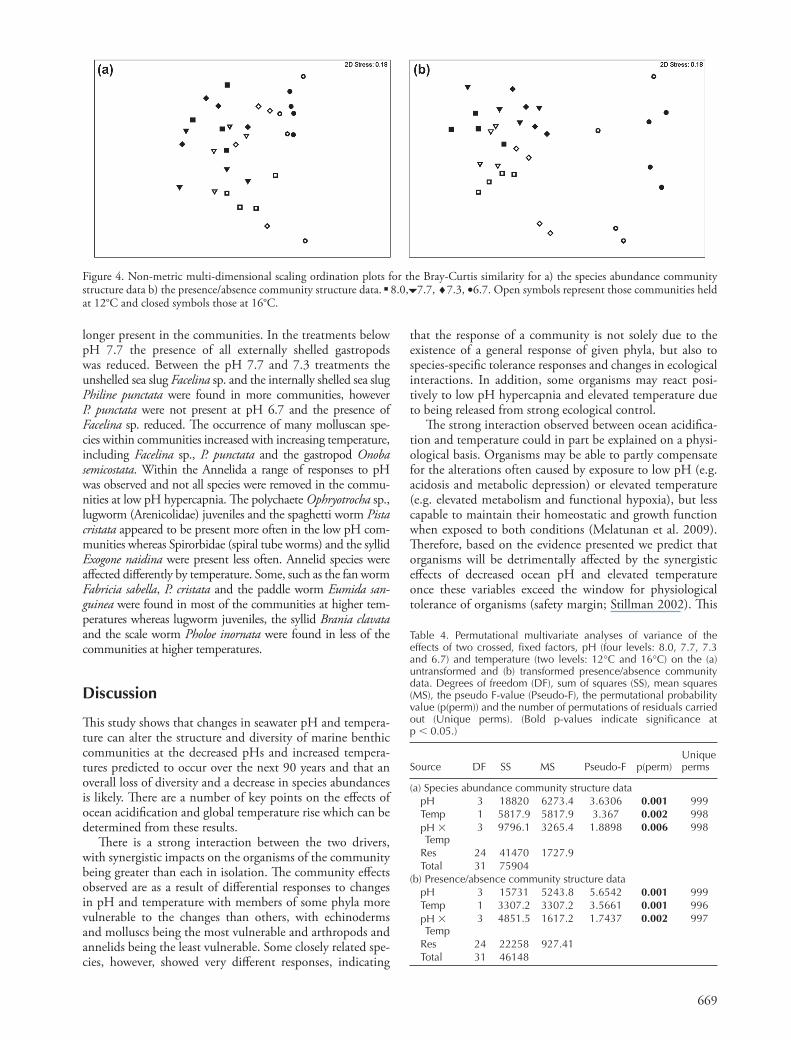
The whole community PERMANOVA analysis showed that the community struc-ture was signifi cantly aff ected by the main eff ects of low pH hypercapnia and elevated temperature and their interaction (Table 4). Th ese diff erences are a refl ection of the fact that at the ambient pH (8.0), communities held at the elevated temperature had higher species abundances and richness compared to those communities exposed to low pH hyper-capnia (pH 6.7) and elevated temperatures showing that there was a changing response to pH and temperature. Th e multi-dimensional scaling plots show loose clustering of the points representing communities exposed to the same treat-ments (Fig. 4). When examining species abundance changes in the whole community the multi-dimensional scaling plot shows clustering within each treatment except for those held at pH 6.7 and 12 ° C which are spread out (Fig. 4a). Th e transformed presence/absence data show a similar pattern in response to species richness having been detrimentally impacted by low pH hypercapnia and elevated temperature and their interaction (Fig. 4b). However the communities held at pH 6.7 are less similar to the other communities which are comparatively clustered together on the other side of the plot.
Arthropoda Th e identity and abundance of arthropod species was sig-nifi cantly aff ected by low pH hypercapnia, elevated tem-perature and their interaction (Table 5ai, 5aii). Th e MDS plots show separation of those communities held at a pH of 6.7 and within the other pH treatments the communities held at the same treatments are roughly grouped together (Fig. 5ai, 5aii).
Figure 2. Th e eff ects of pH (8.0, 7.7, 7.3, 6.7) and temperature (12 ° C open symbols, 16 ° C closed symbols) (a) the number of species, (b) the number of individuals and (c) the species evenness of the communities. Data points are mean values for communities exposed to the same experimental conditions.

Source DF SS MS F/H p
(a) Arthropoda (i) Number of species
pH 3 180.344 60.1146 11.52 0.000 Temp 1 52.531 52.5313 10.07 0.004 pH � Temp 3 53.344 17.7813 3.41 0.034 Error 24 125.250 5.2188Total 31 411.469
(ii) Number of individualspH 3 97947 32648.9 3.36 0.035 Temp 1 4632 4632.0 0.48 0.497pH � Temp 3 56013 18670.9 1.92 0.153Error 24 233229 9717.9Total 31 391821
(iii) Species evenness (Pielou)pH 2 0.00050 0.000248 0.00 0.999Temp 1 0.63919 0.639185 2.42 0.137pH � Temp 2 0.99372 0.496860 1.88 0.181Error 18 4.74987 0.263882Total 23 6.38327
(b) Mollusca (i) Number of species
pH 2 177.583 88.7917 12.22 0.000 Temp 1 40.042 40.0417 5.51 0.031 pH � Temp 2 75.583 37.7917 5.20 0.016 Error 18 130.750 7.2639Total 23 423.958
(ii) Number of individualspH 2 1.83932 0.919660 7.44 0.004 Temp 1 0.44916 0.449158 3.64 0.073pH � Temp 2 0.40836 0.204180 1.65 0.219Error 18 2.22398 0.123555Total 23 4.92082
(iii) Species evenness (Pielou)pH 1 0.003648 0.0036482 0.37 0.556Temp 1 0.000660 0.0006605 0.07 0.801pH � Temp 1 0.003475 0.0034751 0.35 0.566Error 12 0.119556 0.0099630Total 15 0.127340
(c) Annelida (i) Number of species
pH 3 76.625 25.5417 4.36 0.014 Temp 1 32.000 32.0000 5.47 0.028 pH � Temp 3 13.750 4.5833 0.78 0.515Error 24 140.500 5.8542Total 31 262.875
(ii) Number of individualspH 3 0.0011138 0.0003713 7.87 0.001 Temp 1 0.0002281 0.0002281 4.83 0.038 pH � Temp 3 0.0004521 0.0001507 3.19 0.042 Error 24 0.0011324 0.0000472Total 31 0.0029264
(iii) Species evenness (Pielou, Kruskal-Wallis)pH 3 2.22 0.529Temp 1 0.63 0.429
(d) Echinodermata (i)Number of individuals (Kruskal-Wallis)
pH 3 12.00 0.007Temp 1 2.60 0.107
Mollusca Th e identity and abundance of mollusc species was also signifi -cantly aff ected by low pH hypercapnia (Table 5bi, 5bii). Five of the communities held at pH 6.7 were very diff erent from all the others. Th ese communities have been removed from the MDS plot to enable visual analysis of the eff ects of low pH hypercap-nia and elevated temperature on the communities held at the other pHs. Communities held at the same pH were similar and are grouped together on the MDS plots (Fig. 5bi, 5bii).
Annelida Th e identity and abundance of annelid species was signifi -cantly aff ected by low pH hypercapnia, elevated temperature and their interaction (Table 5ci). Th e MDS plot shows the segregation of many of the communities held at 16 ° C from those held at 12 ° C. Th e communities held at 12 ° C and the others held at 16 ° C are clustered together (Fig. 5ci). Annelid species richness was signifi cantly lower in the low pH hyper-capnia and elevated temperature treatments (Table 5cii) and, on the MDS plot, the communities show loose groupings within their pH treatment (Fig. 5cii).
Individual species responses
When examining species abundance changes across the whole community, the species that had the greatest change in abundance among all pH and temperature combina-tions were those that were the most abundant overall. Th e round worms (Nematodes) increased in abundance in the low pH and low temperature treatments (Fig. 6a). Females of the gammaridean amphipod family Aoridae were greatly reduced at the pH 6.7 treatments but showed little response to elevated temperature (Fig. 6b), whilst juveniles of the annelid ragworm (Nereidae) had higher abundances at pH 7.3 and higher temperatures but were almost absent at pH 6.7 (Fig. 6f ). Within the Arthropoda, other large changes in abundance were observed in the gammaridean Stenothoe monoculoides which had lower abundances at lower pHs and was more detrimentally aff ected by the higher temperature at the lower pHs (Fig. 6d) and Calliopius laevisculus which showed higher abundances in the pH 8.0 and 6.7 treatments and at the lower temperature (Fig. 6c). Within the Molluscs the greatest changes in abundance were seen in the most com-mon mollusc species. Th e gastropods Rissoa parva (Fig. 6g) and Rissoa interrupta (Fig. 6h) were lower in abundance at the low pHs and had disappeared completely at the lowest pH treatments, but showed higher abundance at the higher temperature within the pH 8.0 treatments. Th ese species, although closely taxonomically related, showed diff erent responses to reduced pH hypercapnia and elevated tem-perature. Large changes in abundance of the bivalve species Musculus discors and the juvenile Mytilacea were observed between pH 7.3 and 6.7. Also, the number of gastropods that were unidentifi able due to shell damage was higher in the higher temperature treatments and was greatest in the pH 7.7 treatments. However, at the very low pHs no identifi -able or unidentifi able gastropods were found (Fig. 6i). Within the Annelida large changes in abundance were also seen for the ragworm Platynereis dumerlii which showed a highly variable response to both pH and temperature (Fig. 6e).
Table 3. Two-way ANOVAs and Kruskal-Wallis tests for (a) the Arthopoda, (b) the Mollusca and (c) the Annelida for i) the number of species, ii) the number of individuals and iii) the species evenness and d) the Echinodermata for i) the number of individuals within the communities. Degrees of freedom (DF), sum of squares (SS), mean squares (MS), F-value (F) or H-value (H) for a Kruskal-Wallis test and probability value (p). (Bold p-values indicate signifi cance at p � 0.05.)
667

When examining species richness changes across the whole community the diff erences between the high pH (8.0 and 7.7) and low pH (7.3 and 6.7) treatments were primarily due to the absence of calcifying mollusc species at low pHs. Th e species richness changes between temperatures was primarily due to the loss of Calliopius laevisculus and the skeleton shrimp Caprella acanthifera from the higher temperature treatments.
668
Within the Arthropoda species richness changes between many of the treatments were due to the loss of Stenothoe monoculoides , C. acanthifera and the gammaridean Gammaropsis maculata with decreasing pH. However, some species (e.g. the gam-maridean Microdeutopus chelifer and the isopod Munna sp.) were found more often in the pH 7.7 or 7.3 compared to the pH 8.0, although as the pH decreased to 6.7 they were no
Figure 3. Th e eff ects of pH (8.0, 7.7, 7.3, 6.7) and temperature (12 ° C open symbols, 16 ° C closed symbols) on (a) the Arthropoda, (b) the Mollusca and (c) the Annelida for (i) the number of species, (ii) the number of individuals and (iii) the species evenness of the communities and (d) the Echinodermata for (i) the number individuals. Data points are mean values for communities exposed to the same experimental conditions.
Source DF SS MS Pseudo-F p(perm) Unique perms
(a) Species abundance community structure datapH 3 18820 6273.4 3.6306 0.001 999Temp 1 5817.9 5817.9 3.367 0.002 998pH � Temp
3 9796.1 3265.4 1.8898 0.006 998
Res 24 41470 1727.9Total 31 75904
(b) Presence/absence community structure datapH 3 15731 5243.8 5.6542 0.001 999Temp 1 3307.2 3307.2 3.5661 0.001 996pH � Temp
3 4851.5 1617.2 1.7437 0.002 997
Res 24 22258 927.41Total 31 46148
longer present in the communities. In the treatments below pH 7.7 the presence of all externally shelled gastropods was reduced. Between the pH 7.7 and 7.3 treatments the unshelled sea slug Facelina sp. and the internally shelled sea slug Philine punctata were found in more communities, however P. punctata were not present at pH 6.7 and the presence of Facelina sp. reduced. Th e occurrence of many molluscan spe-cies within communities increased with increasing temperature, including Facelina sp., P. punctata and the gastropod Onoba semicostata . Within the Annelida a range of responses to pH was observed and not all species were removed in the commu-nities at low pH hypercapnia. Th e polychaete Ophryotrocha sp., lugworm (Arenicolidae) juveniles and the spaghetti worm Pista cristata appeared to be present more often in the low pH com-munities whereas Spirorbidae (spiral tube worms) and the syllid Exogone naidina were present less often. Annelid species were aff ected diff erently by temperature. Some, such as the fan worm Fabricia sabella , P. cristata and the paddle worm Eumida san-guinea were found in most of the communities at higher tem-peratures whereas lugworm juveniles, the syllid Brania clavata and the scale worm Pholoe inornata were found in less of the communities at higher temperatures.
Discussion
Th is study shows that changes in seawater pH and tempera-ture can alter the structure and diversity of marine benthic communities at the decreased pHs and increased tempera-tures predicted to occur over the next 90 years and that an overall loss of diversity and a decrease in species abundances is likely. Th ere are a number of key points on the eff ects of ocean acidifi cation and global temperature rise which can be determined from these results.
Th ere is a strong interaction between the two drivers, with synergistic impacts on the organisms of the community being greater than each in isolation. Th e community eff ects observed are as a result of diff erential responses to changes in pH and temperature with members of some phyla more vulnerable to the changes than others, with echinoderms and molluscs being the most vulnerable and arthropods and annelids being the least vulnerable. Some closely related spe-cies, however, showed very diff erent responses, indicating
that the response of a community is not solely due to the existence of a general response of given phyla, but also to species-specifi c tolerance responses and changes in ecological interactions. In addition, some organisms may react posi-tively to low pH hypercapnia and elevated temperature due to being released from strong ecological control.
Th e strong interaction observed between ocean acidifi ca-tion and temperature could in part be explained on a physi-ological basis. Organisms may be able to partly compensate for the alterations often caused by exposure to low pH (e.g. acidosis and metabolic depression) or elevated temperature (e.g. elevated metabolism and functional hypoxia), but less capable to maintain their homeostatic and growth function when exposed to both conditions (Melatunan et al. 2009). Th erefore, based on the evidence presented we predict that organisms will be detrimentally aff ected by the synergistic eff ects of decreased ocean pH and elevated temperature once these variables exceed the window for physiological tolerance of organisms (safety margin; Stillman 2002). Th is
Figure 4. Non-metric multi-dimensional scaling ordination plots for the Bray-Curtis similarity for a) the species abundance community structure data b) the presence/absence community structure data. 8.0, 7.7, ♦7.3, •6.7. Open symbols represent those communities held at 12 ° C and closed symbols those at 16 ° C.
Table 4. Permutational multivariate analyses of variance of the effects of two crossed, fi xed factors, pH (four levels: 8.0, 7.7, 7.3 and 6.7) and temperature (two levels: 12 ° C and 16 ° C) on the (a) untransformed and (b) transformed presence/absence community data. Degrees of freedom (DF), sum of squares (SS), mean squares (MS), the pseudo F-value (Pseudo-F), the permutational probability value (p(perm)) and the number of permutations of residuals carried out (Unique perms). (Bold p-values indicate signifi cance at p � 0.05.)
669

Source DF SS MS Pseudo-F p(perm) Unique perms
(a) Arthropoda (i) Untransformed species abundance community structure data
pH 3 22155 7385.1 3.1303 0.001 998Temp 1 5294.9 5294.9 2.2444 0.008 997pH � Temp
3 11731 3910.2 1.6574 0.024 999
Res 24 56621 2359.2Total 31 95801
(ii) Presence/absence species abundance community structure data
pH 3 8853.5 2951.2 2.3471 0.002 998Temp 1 4328.6 4328.6 3.4426 0.003 998pH � Temp
3 8414.7 2804.9 2.2308 0.003 996
Res 24 30176 1257.4Total 31 51773
(b) Mollusca (i) Species abundance community structure data
pH 3 25362 8454.2 3.8059 0.001 998Temp 1 3809.1 3809.1 1.7148 0.059 999pH � Temp
3 8693.7 2897.9 1.3046 0.144 998
Res 20 44426 2221.3Total 27 82854
(ii) Presence/absence community structure datapH 3 20539 6846.2 5.1833 0.001 997Temp 1 2467.2 2467.2 1.868 0.079 998pH � Temp
3 5361.6 1787.2 1.3531 0.180 997
Res 20 26416 1320.8Total 27 54478
(c) Annelida (i) Species abundance community structure data
pH 3 11936 3978.8 2.8727 0.003 999Temp 1 7967.8 7967.8 5.7527 0.002 997pH � Temp
3 8898.5 2966.2 2.1416 0.025 998
Res 24 33241 1385.1Total 31 62044
(ii) Presence/absence community structure datapH 3 12440 4146.8 3.924 0.001 998Temp 1 2805.7 2805.7 2.655 0.005 998pH � Temp
3 4340.2 1446.7 1.369 0.118 998
Res 24 25363 1056.8Total 31 44949
indicates that the changes in ocean pH predicted to occur over the next 90 years (Caldeira and Wickett 2003, Feely et al . 2004) may not aff ect the structure and diversity of the benthic intertidal communities in isolation, however, these communities will also be impacted by global warm-ing, the eff ects of which may be exacerbated by ocean acidi-fi cation occurring simultaneously (Feng et al. 2009, Rose et al. 2009). Th ese results are relevant to our understanding of likely responses of marine benthic communities to ocean
670
acidifi cation and global warming as our experiment was conducted under plausible future environmental scenarios, thus allowing for general conclusions.
Th e data presented here also suggests that diff erent phyla will respond in diff erent ways to low pH hypercapnia and elevated temperatures caused by increased atmospheric CO 2 as each possesses diff erent homeostatic abilities (Melzner et al. 2009). Th is would be expected due to the diff erent physiologi-cal capabilities and life strategies found in diff erent phyla (Wid-dicombe and Spicer 2008, Melzner et al. 2009, Widdicombe et al. 2009a). It is likely that some organisms can compensate for decreased ocean pH and increased temperature to an extent, however once the change in pH and temperature exceed the range of their ability to physiologically compensate these organisms will be aff ected. Th e molluscs and echinoderms were almost eradicated from the low pH treatments however, this could be expected as they are in general poor regulators (Michaelidis et al. 2005, Miles et al. 2007) and dependent on the production of a calcium carbonate shell (Orr et al. 2005). Under acidifi ed conditions decreased shell thickness (Bibby et al. 2007, Hall-Spencer et al. 2008), reduction of calcifi cation rate (Gazeau et al. 2007), absence of juveniles (Hall-Spencer et al. 2008), depressed growth (Shirayama and Th ornton 2005) and reduction in abundance (Wootton et al. 2008) have been observed in molluscs and echinoderms have been observed to show muscle wastage as a result of maintain-ing their skeleton in low pH seawater (Wood et al. 2008) and increased acidity of coelomic fl uid (Miles et al. 2007). Th us these phyla are likely to be aff ected more than most by the combined eff ect of ocean acidifi cation and global warming. Th e response of the arthropods appears more complicated. Previous work on low pH high CO2 eff ects in isolation in single species experiments has shown that arthropod mortal-ity rates are increased (Kurihara et al. 2008), but that they have better ionic regulation abilities when exposed to low pH hypercapnia (Melzner et al. 2009) than most gastropods or bivalves. For example, the swimming crab, Necora puber was shown to have the ability to buff er increasing extracellular acidosis, both in the mid and medium-term, within a broad range of pHs (Spicer et al. 2007, Small et al. 2010). Mol-luscs have shown no evidence they are able to compensate for increased acidity in this way and therefore are likely to be far more vulnerable to low pH conditions even though both phyla are reliant on the production of calcium carbonate. In this study the arthropods were more resilient to changes in pH and temperature and did not decrease in abundance or diversity as much as the molluscs. Th e annelids showed very little change in abundance or diversity with changing pH or temperature. Previous studies on the eff ect of reduced pH on the burrowing activity of Nereis virens indicated no eff ect on mortality due to reduced sediment pH (Widdi-combe and Needham 2007) and many annelids have the ability to adapt to highly polluted or anoxic conditions such that the presence of Capitella capitata , Nereis diversicolor and Tubifi coides benedii can be used as an indicator of these prob-lems (Barnett 1984). In general, our results confi rm the idea that a diff erent degree of vulnerability to global change in diff erent phyla exists (Widdicombe and Spicer 2008, Melzner et al. 2009). Furthermore, the vulnerability sequence identi-fi ed here (molluscs and echinoderms � arthropods � anne-lids), also corresponds to that already proposed for the eff ect
Table 5. Permutational multivariate analyses of variance of the effects of two crossed, fi xed factors, pH (fourlevels: 8.0, 7.7, 7.3 and 6.7) and temperature (two levels: 12 ° C and 16 ° C) on the (a) Arthropoda, (b) Mollusca and (c) Annelida (i) untransformed and (ii) transformed presence/absence. Degrees of freedom (DF), sum of squares (SS), mean squares (MS), the pseudo F-value (Pseudo-F), the permutational probability value (p(perm)) and the number of permuta-tions of residuals carried out (Unique perms). (Bold p-values indicate signifi cance at p � 0.05.)

of low pHs therefore this study suggests that a similar scale of vulnerability can be identifi ed for the synergistic detrimental eff ects of both temperature and pH.
Diff erent responses were also observed between phyloge-netically closely related species within each phylum. Within the annelids only a small reduction in abundance was caused by low pH hypercapnia and elevated temperature in the rag-worm Platynereis dumerlii while the syllid Exogone naidina was eradicated. A number of gammaridean amphipods showed extremely diff erent responses to low pH hypercapnia
and elevated temperature and even within the same genus the gastropods Rissoa parva and Rissoa interrupta , species that are considered phylogenetically very similar indeed, showed diff erent responses. Th is however, is not surprising as acute diff erences in the physiological capacities and tolerance lev-els of phylogenetically closely related species has been pre-viously documented (Stillman 2002, Calosi et al. 2007). It is therefore likely that changes in the species diversity of a community will partly depend on species tolerance levels, but may also be governed by changes in ecological pressure
Figure 5. Non-metric multi-dimensional scaling ordination plots for the Bray-Curtis similarity of the (a) Arthropoda, (b) Mollusca, and (c) Annelida (i) untransformed species abundance community structure data, (ii) presence/absence community structure data. 8.0, 7.7, ♦ 7.3, • 6.7. Open symbols represent those communities held at 12 ° C and closed symbols those at 16 ° C.
671

and diff erence in species lifestyle or activity (Widdicombe and Spicer 2008).
In addition, some of the responses observed here do not match previous predictions that the combined exposure to elevated temperature and low pH would exert a detrimental eff ect on taxa on a purely physiological basis. Some organ-isms within the communities benefi ted from a reduction in pH and an increase in temperature. Th e abundance of nematodes in the low pH treatments (7.3 and 6.7) was much greater than that in the high pH treatments (8.0 and 7.7). A previous study on the eff ect of carbon dioxide leakage on nematode communities in the deep sea showed a large decrease in nematode abundance with a reduction in pH of 0.5 to 1.0 units (Barry et al. 2004). In this experiment the reduction of pH to 1.3 units below ambient caused an increase in nematode abundance. Th is may be due to the removal of ecological pressures from the nematodes with the loss of other more vulnerable species from the communities which may be predators or competitors causing a positive indirect eff ect on the nematodes, whereas in the deep sea where the nematodes may have fewer predators or competi-tors the eff ect of pH may be negative. A number of other
672
organisms increased their abundance in the higher tempera-ture or slightly lower pH treatments which may also be due an indirect favourable eff ect caused by the removal of some ecological constraints. Mesocosm data from a single species experiment showed the barnacle Semibalanus balanoides to be detrimentally impacted by pH which caused adult mor-tality (Findlay et al. 2009) however, an increase in abundance of two barnacle species was observed in situ in response to slightly acidifi ed conditions due to a reduction in competi-tion and predation (Wootton et al. 2008). Some species may also be aff ected by the ecological indirect eff ects in a negative way as they may exhibit behavioural changes. Under low pH conditions the common periwinkle Littorina littorea showed a disruption of the induced defence of producing a thicker shell in the presence of predation cues (Bibby et al. 2007) making them potentially more vulnerable to predation. Th is response was also coupled with an increase in avoidance behaviour which may interfere with their grazing ability and aff ect their interactions with other organisms (Bibby et al. 2007). A disruption in shell investigation behaviour was also observed in the hermit crab Pagurus bernhardus under acidi-fi ed conditions (De La Haye et al. pers. obs.) and clownfi sh
Figure 6. Th e abundance responses to pH (8.0, 7.7, 7.3, 6.7) and temperature (12 ° C open symbols, 16 ° C closed symbols) of (a) the nema-todes, (b) gammaridean female Aoridae, (c) the gammaridean amphipod Calliopius laevisculus , (d) the gammaridean Stenothoe monoculoides , (e) the ragworm Platynereis dumerlii , (f ) ragworm nereid juveniles, (g) the gastropod Rissoa parva , (h) the gastropod Rissoa interrupta and (i) the unidentifi able gastropods.

showed impaired olfactory discrimination and homing abil-ity (Munday et al. 2009). When examining natural com-munities this means the eff ects of ocean acidifi cation and increased temperatures may be harder to predict due to the complexity of ecological interactions occurring in every eco-system. Community changes will not be solely dependent on the physiological responses of individuals but also as a result of the ecosystem as a whole and changes in ecological pressures. Th erefore changes in species abundances and com-munity diversity as a result of ocean acidifi cation and global warming are likely to be related to both their physiology and their ecology.
Th is study shows that when analysing ocean acidifi cation data from monospecifi c assemblage mesocosm experiments, the lack of accurate ecological representation must be taken into account. In addition to the loss of individual species the eff ects of the loss of important species within the community must also be considered. For example, the loss of ecosystem engineers such as mussels from some areas will lead to the loss of ecospace provided for other organisms and cause a greater eff ect on community diversity (Hiscock et al. 2004). Small changes in temperature that aff ect the performance of a key-stone predator may also cause large changes in community dynamics (Sanford 1999). In the wild these varied responses to global climate change will inevitably result in changes to ecosystem dynamics as species that are unable to acclimatise are lost from the community (due to extinction or distribu-tion changes) while others possessing broader safety margin will remain (Stillman 2002, Compton et al. 2007).
Th e communities in this study were held in a mesocosm system which cannot accurately simulate the conditions found in the natural environment but does provide a suffi -cient approximation and can illustrate some of the responses of a community under elevated temperature and low pH hypercapnia. Mesocosm exposure lasted two months and signifi cant detrimental eff ects of low pH hypercapnia and elevated temperature were demonstrated. Limitations of this study include the inability to take into account any subtle eff ects which may cause mortality over a greater time-scale, or any community level eff ects caused by the direct and indirect detrimental eff ects of pH and temperature on larval processes which could have even larger eff ects on the com-munity structure and diversity of the intertidal benthic com-munity. Juveniles have been shown to be aff ected directly by pH (Dupont et al. 2008, Hall-Spencer et al. 2008) and tem-perature (Storch et al. 2009) but they may also be aff ected indirectly via biotic interactions. Th e complex ecological dynamics present in every ecosystem means that global change may have far reaching consequences even if only a few organisms are aff ected.
Conclusions
Th is study suggests that increased ocean acidifi cation and global warming will alter rocky benthic macrofaunal com-munity structure and reduce biodiversity. Th ese changes will result from the wide range of diff erent responses observed across the species within natural assemblages. Whilst some general diff erences can be seen between major taxo-nomic groups (e.g. echinoderms, molluscs, crustaceans and
annelids), species responses may also depend on their life strategy or physiology and even those species that are taxo-nomically closely related may vary in their response. Th is indicates that a generic response model for elevated tempera-ture and reduced ocean pH based solely on phylogenetic-relatedness may not be realistic or relevant. In addition, alteration of ecological interactions will be important in determining community responses to global climate change, and some species could be positively aff ected due to the removal of ecological constraints. In conclusion, we advise that in order to improve future predictions of specifi c spe-cies and taxonomical assemblage responses to environmental changes, particularly within a relevant ecological framework, multispecies community studies should be employed.
Acknowledgements – Th is work is a contribution to the NERC-funded programme Oceans 2025 (PML Th eme 3 – Coastal and shelf processes) and the “European Project on Ocean Acidifi cation” (EPOCA) which received funding from the European Community’s Seventh Framework Programme (FP7/2007-2013) under grant agreement no. 211384. We thank Rob Ellis, Mike Kendall, Amanda Beesley, Sarah Dashfi eld, Helen Findlay, Th omas Vance, Paul Sut-ton, Michele Kiernan and Doug Jones for their help. Th is work was undertaken while RH was in receipt of a NERC Advanced Course Studentship and PC was in receipt of a RCUK Fellowship to inves-tigate ocean acidifi cation.
References
Anderson, M. J. et al. 2008. PERMANOVA � for PRIMER: guide to software and statistical methods. – PRIMER-E, Plymouth.
Barnett, B. E. 1984. Observations on the intertidal fauna of the South Bank of the Humber Estuary. – Mar. Environ. Res. 13: 33 – 53.
Barry, J. P. et al. 2004. Eff ects of direct ocean CO 2 injection on deep-sea meiofauna. – J. Oceanogr. 60: 759 – 766.
Bartlett, M. S. 1937. Properties of suffi ciency and statistical tests. – Proc. R. Stat. Soc. Ser. A 160: 268 – 282.
Bibby, R. et al. 2007 Ocean acidifi cation disrupts induced defences in the intertidal gastropod Littorina littorea . – Biol. Lett. 3: 699 – 701.
Blackford, J. et al. 2009. An initial assessment of the potential environmental impact of CO 2 escape from marine carbon cap-ture and storage systems. – J. Power Energy A. Mech. Eng. 223: 269 – 280.
Caldeira, K. and Wickett, M. 2003. Anthropogenic carbon and ocean pH. – Nature 425: 365.
Calosi, P. et al. 2007. Physiological capacity and environmental tolerance in two sandhopper species with contrasting geo-graphical ranges: Talitrus saltator and Talorchestia ugolinii . – Mar. Biol. 151: 1647 – 1655.
Chakravarti, I. M. et al. 1967. Handbook of methods of applied statistics. Vol. I. – Wiley.
Cheung, W. W. L. et al. 2009. Projecting global marine biodiversity impacts under climate change scenarios. – Fish. Fish. 10: 235 – 251.
Clarke, K. R. and Green, R. H. 1988. Statistical design and analy-sis for a ‘ biological eff ects ’ study. – Mar. Ecol. Prog. Ser. 46: 213 – 226.
Clarke, K. R. and Gorley, R. N. 2006. PRIMER v6: User manual/tutorial. – PRIMER-E, Plymouth.
Compton, T. J. et al. 2007. Th ermal tolerance ranges and climate variability: a comparison between bivalves from diff ering cli-mates. – J. Exp. Mar. Biol. Ecol. 352: 200 – 211.
673

Dickson, A. G. 1990. Standard potential of the reaction - AgCl (S) � 1/2H-2(g) � AG (S) � HCL (aq) and the standard acid-ity constant of the ion HSO 4 - in synthetic sea-water from 273.15-K to 318.15-K. – J. Chem. Th ermodyn. 22: 113 – 127.
Dickson, A. G. and Millero, F. J. 1987. Comparison of the equi-librium-constants for the dissociation of carbonic-acid in sea-water media. – Deep Sea. Res. 34: 1733 – 1743.
Dupont, S. et al. 2008. Near-future level of CO 2 -driven ocean acidifi cation radically aff ects larval survival and development in the brittlestar Ophiothrix fragilis . – Mar. Ecol. Prog. Ser. 373: 285 – 294.
Durance, I. and Ormerod, S. J. 2007. Climate change eff ects on upland stream macroinvertebrates over a 25-year period. – Global Change Biol. 13: 942 – 957.
Feely, R. A. et al. 2004. Impact of anthropogenic CO 2 on the CaCO 3 system in the oceans. – Science 305: 362 – 366.
Feng, Y. et al. 2009. Eff ects of increased pCO 2 and temperature on the North Atlantic spring bloom. I. Th e phytoplankton com-munity and biogeochemical response. – Mar. Ecol. Prog. Ser. 388: 13 – 25.
Findlay, H. S. et al. 2009. Future high CO 2 in the intertidal may compromise adult barnacle ( Semibalanus balanoides ) survival and embryonic development rate. – Mar. Ecol. Prog. Ser. 389: 193 – 202.
Gazeau, F. et al. 2007. Impact of elevated CO 2 on shellfi sh calcifi -cation. – Geophys. Res. Lett. 34: L07603.
Gitay, H. 2002. Technical paper V: climate change and biodiversity. – IPCC, Geneva, Switzerland.
Gobin, J. F. and Warwick, R. M. 2006. Geographical variation in species diversity: a comparison of marine polychaetes and nematodes. – J. Exp. Mar. Biol. Ecol. 330: 234 – 244.
Hall-Spencer, J. M. et al. 2008. Volcanic carbon dioxide vents show ecosystem eff ects of ocean acidifi cation. – Nature 454: 96 – 99.
Hiscock, K. et al. 2004. Eff ect of changing temperature on benthic marine life in Britain and Ireland. – Aquat. Conserv. 14: 333 – 362.
Kurihara, H. et al. 2008. Long-term eff ects of predicted future seawater CO 2 conditions on the survival and growth of the marine shrimp Palaemon pacifi cus . – J. Exp. Mar. Biol. Ecol. 367: 41 – 46.
Levene, H. 1960. Robust tests for equality of variances. – In: Olkin, I. et al. (eds), Contributions to probability and statis-tics: essays in honor of Harold Hotelling. Stanford Univ. Press, pp. 278 – 292.
Mehrbach, C. et al. 1973. Measurement of the apparent dissocia-tion constants of carbonic acid in seawater at atmospheric pres-sure. – Limnol. Oceanogr. 18: 897 – 907.
Melatunan, E. et al. 2009. Physiological and shell microstructural responses of an intertidal periwinkle Littorina littorea (Lin-naeus, 1758) to ocean acidifi cation and elevated temperature. – Comp. Biol. Physiol. Part A 153: S168 – S173.
Melzner, F. et al. 2009. Physiological basis for high CO 2 tolerance in marine ectothermic animals: pre-adaptation through life-style and ontogeny? – Biogeosciences 6: 2313-2331.
Menge, B. A. and Sutherland, J. P. 1987. Community regulation: variation in disturbance, competition and predation in relation to environmental stress and recruitment. – Am. Nat. 130: 730 – 757.
Michaelidis, B. et al. 2005. Eff ects of long-term moderate hypercap-nia on acid-base balance and growth rate in marine mussels Mytilus galloprovincialis . – Mar. Ecol. Prog. Ser. 293: 109 – 118.
Mieszkowska, N. et al. 2006. Changes in the range of some com-mon rocky shore species in Britain – a response to climate change? – Hydrobiologia 555: 241 – 251.
Miles, H. et al. 2007. Eff ects of anthropogenic seawater acidifi ca-tion on acid-base balance in the sea urchin Psammechinus mil-iaris . – Mar. Pollut. Bull. 54: 89 – 96.
Munday, P. L. et al. 2009. Ocean acidifi cation impairs olfactory discrimination and homing ability of a marine fi sh. – Proc. Natl Acad. Sci. USA 106: 1848 – 1852.
674
Norderhaug, K. M. et al. 2002. Colonisation of kelp imitations by epiphyte and holdfast fauna, a study of mobility patterns. – Mar. Biol. 141: 965 – 973.
Orr, J. C. et al. 2005. Anthropogenic ocean acidifi cation over the twenty-fi rst century and it ’ s impact on calcifying organisms. – Nature 437: 681 – 686.
Pielou, E. C. 1975. Ecological diversity. – Wiley. Pierrot, D. et al. 2006. CO2SYS Dos program developed for CO 2
system calculations. ORNL/CDIAC-105. Carbon Dioxide Information Analysis Center, Oak Ridge National Lab., US Dept of Energy, Oak Ridge, TN, USA.
P ö rtner, H.-O. 2008. Ecosystem eff ects of ocean acidifi cation in times of ocean warming: a physiologist ’ s view. – Mar. Ecol. Prog. Ser. 373: 203 – 217.
Rose, J. M. et al. 2009. Eff ects of increased pCO 2 and temperature on the North Atlantic spring bloom. II. Microzooplankton abundance and grazing. – Mar. Ecol. Prog. Ser. 388: 27 – 40.
Sanford, E. 1999. Regulation of keystone predation by small changes in ocean temperature. – Science 283: 2095 – 2097.
Shirayama, Y. and Th ornton, H. 2005. Eff ect of increased atmos-pheric CO 2 on shallow water marine benthos. – J. Geophys. Res. 110: C09S08.
Small, D. et al. 2010. Impact of medium-term exposure to CO 2 enriched seawater on the physiological functions of the velvet swimming crab Necora puber . – Aquat. Biol. 10: 11 – 21.
Smith, S. D. A. and Rule, M. J. 2002. Artifi cial substrata in a shallow sublittoral habitat: do they adequately represent natu-ral habitats or the local species pool? – J. Exp. Mar. Biol. Ecol. 277: 25 – 41.
Sokolov, A. P. et al. 2009. Probabilistic forecast for 21st century climate based on uncertainties in emissions (without policy) and climate parameters. – MIT Joint Program on the Science and Policy of Global Climate Change. Rep. No. 169.
Solomon, S. et al. 2007. Technical summary. – In: Solomon, S. et al. (eds), Climate change 2007: the physical science basis. Contrib. Working Grp I to the 4th Assess. Rep. Intergovern-mental Panel on Climate Change. Cambridge Univ. Press.
Spicer, J. I. et al. 2007. Infl uence of CO 2 -related seawater acidifi ca-tion on extracellular acid-base balance in the velvet swimming crab Necora puber . – Mar. Biol. 151: 1117 – 1125.
Stillman, J. H. 2002. Causes and consequences of thermal toler-ance limits in rocky intertidal porcelain crabs, genus Petrolisthes. – Integr. Comp. Biol. 42: 790 – 796.
Storch, D. et al. 2009. Th ermal tolerance of crustacean larvae (zoea I) in two diff erent populations of the kelp crab Taliepus dentatus (Milne-Edwards). – J. Exp. Biol. 212: 1371 – 1376.
Underwood, A. J. and Chapman, M. G. 2006. Early development of subtidal macrofaunal assemblages: relationships to period and timing of colonization. – J. Exp. Mar. Biol. Ecol. 330: 221 – 233.
Widdicombe, S. et al. 2009a. Eff ects of CO 2 induced seawater acidifi cation on infaunal diversity and sediment nutrient fl uxes. – Mar. Ecol. Prog. Ser. 379: 59-75.
Widdicombe, S. et al. 2009b. Experimental design of perturbation experiments: 7. Laboratory experiments and benthic meso-cosm studies. – In: Riebesell, U. et al. (eds), Guide for best practices in ocean acidifi cation research and data reporting. EPOCA, pp. 113 – 122.
Widdicombe, S. and Needham, H.R. 2007. Impact of CO 2 induced seawater acidifi cation on the burrowing activity of Nereis virens and sediment nutrient fl ux. – Mar. Ecol. Prog. Ser. 341: 111 – 122.
Widdicombe, S. and Spicer, J. I. 2008. Predicting the impact of Ocean acidifi cation on benthic biodiversity: what can physiol-ogy tell us? – J. Exp. Mar. Biol. Ecol. 366: 187 – 197.
Wood, H. L. et al. 2008. Ocean acidifi cation may increase calcifi ca-tion rates but at a cost. – Proc. R. Soc. B. 275: 1767 – 1773.
Wootton, J. T. et al. 2008. Dynamic patterns and ecological impacts of declining ocean pH in a high resolution multi-year dataset. – Proc. Natl Acad. Sci. 105: 18848 – 18853.


