Embed Size (px)
Citation preview

Illinois Wesleyan University
Digital Commons @ IWU Digital Commons @ IWU
Honors Projects Economics Department
Spring 2005
Predicting Olympic Medal Counts: the Effects of Economic Predicting Olympic Medal Counts: the Effects of Economic
Development on Olympic Performance Development on Olympic Performance
Xun Bian '05 Illinois Wesleyan University
Follow this and additional works at: https://digitalcommons.iwu.edu/econ_honproj
Part of the Economics Commons
Recommended Citation Bian '05, Xun, "Predicting Olympic Medal Counts: the Effects of Economic Development on Olympic Performance" (2005). Honors Projects. 13. https://digitalcommons.iwu.edu/econ_honproj/13
This Article is protected by copyright and/or related rights. It has been brought to you by Digital Commons @ IWU with permission from the rights-holder(s). You are free to use this material in any way that is permitted by the copyright and related rights legislation that applies to your use. For other uses you need to obtain permission from the rights-holder(s) directly, unless additional rights are indicated by a Creative Commons license in the record and/ or on the work itself. This material has been accepted for inclusion by faculty at Illinois Wesleyan University. For more information, please contact [email protected]. ©Copyright is owned by the author of this document.

Research Honor's Project
Predicting Olympic Medal Counts: the Effects of Economic
Development on Olympic Performance
Xun Bian
Research Honor's Project, Spring 2005
Adviser: Dr. Robert Leekley
Abstract:
This paper investigates the relationship between a country's Olympic performance and its overall economic condition, including population, economic resources, and political structures. A panel data set comprising the yearly data of 1996, 2000, and 2004 are estimated by using a fixed-effect Tobit regression model. Following previous studies on this topic, population size and economic resources are measured by using population and per capita GDP. One major focus of this research is the influence of political structure on national Olympic perfonnance. Instead of using a socialist and non-socialist dummy variable like most previous studies, I used continuous variables, political freedom (PF) and civil liberty (CL), to estimate the impact of political structure.
Consistent with previous studies on this topic, the regression results indicate that countries with a larger population and more abundant economic resources are more likely to perform better in the Olympic arena. Countries that are politically "Not Free" generally seem to perfonn better in the Olympics by winning more medals than the rest of the world. One interesting fmding is that the results suggest weakly that political freedom variables, both political freedom and civil liberty, display a V-shaped relationship with respect to medal shares. Being "Partly Free", has a negative effect on national Olympic performance as compared to countries that are "Free" and "Not Free".
- 1

Research Honor's Project
I. Introduction
The modern Olympics were conceived by their founder Pierre de Coubertin to be
a competition between individual athletes, not countries (IOC, 2000). The Olympic
Spirit emphasizes participation rather than winning. In reality, however, the success of
a country's athletes is held to be an important source of national prestige. By-country
medal tables are widely published. A glance at Olympic history will immediately tell
us that not all nations have an equal ability to win medals. In this past August, 199
countries participated in the Athens Olympics, and 124 countries did not win a single
medal. On the other hand, the top ten winners collectively took home 514 medals,
which is more than 50% of the medals available at the Athens Olympics. Therefore, a
natural question to ask is why some countries are able to enjoy a great success in the
Olympic arena, while some others are unable to do so.
The unequal distribution of Olympic Medal numbers might be explained by the
relative strength of countries in different sports. For example, with a large number of
high-quality basketball players, the United States should have a higher probability of
winning a medal in basketball. We could then generate a prediction for a national
medal total by summing across sports. However, this paper takes a different
perspective and attempts to predict a nation's Olympic performance by investigating
the socioeconomic variables that have a significant influence on a nation's Olympic
performance. The influence of population size, economic resources, political structure,
and hosting advantage are estimated by using several different models.
The paper is organized in the following structure. Section II introduces the
- 2

Research Honor's Project
theoretical framework of the research and reviews previous literature related to this
topic. The empirical model and data used to test the research hypothesis are described
in detail in Section III. Section IV presents the regression results. Finally, Section V
concludes the research by discussing avenues for future research.
II. Theoretical Framework and Review of Literatures
Starting with the post-World War II games, sociologists and economists began to
analyze the impact of social and economic conditions on the number of Olympic
medals won by different countries. Examples of those studies are Ball (1972), Grimes
et a1. (1974) and Levine (1974). Those early studies showed that population, income
per capita, hosting advantage, and political system have significant impacts on a
nation's medal counts. First, population is one the fundamental determinants of
Olympic success. A big population increases the group of potential athletes. As we can
see, China wins more medals than most other nations, because having 1.3 billion
people improves the odds of producing a Yao Ming. The second determinant is
economic resources. Richer countries can usually afford to train athletes better, to
provide better medical care, and to send a larger group of atWetes to the Olympic
Games. Hosting advantage is also significant. The hosting country is allowed to
participate in all events. In addition, the crowd of home spectators will support the
performing athletes. The fourth determinant is political and economic structure. There
is a large amount of evidence suggesting that communist countries perform better.
This is probably because a central-planned economic system allows more
- 3

Research Honor's Project
specialization in sports, and more resources can be distributed to training and
supporting athletes than in market-based economies. Moreover, the governments of
communist countries not only have a greater capability to channel economic resources
to sports, but also have a stronger incentive to do so. Because Olympic performances
are so closely connected with national prestige, winning a large number of Olympic
medals can defInitely help them obtain recognition internationally as well as stimulate
patriotism domestically. Without having a democratic political system, international
recognition and patriotism are extremely valuable to the government for maintaining
political stability.
Surprisingly enough, the literature that models Olympic performance did not
resume until the 1990's. An explanation of this might be that in the 1970's and 1980's
the Olympic Games were disturbed by the Cold War. The fIrst study that restarts the
performance analysis is Slughart et al (1993), which analyzes the Olympic
performance of transitional economies. Recently, two studies by Johnson and Ali
(2000) and Bernard and Busse (2000) revived attention on this issue. Johnson and Ali
(2000) assume the medal counts to be a linear function of GDP per capita, population,
and two dummy variables indicating hosting country and political system respectively.
They fInd that the home advantage adds a 12 percent chance of success, and
communist countries outperform the others by 12 medals (5 gold medals).
Bernard and Busse (2000) estimate Tobit models for medal shares using data
since 1960. They specify a Cobb-Douglas production function for national Olympic
talent, using population and economic resources (measured in GDP) as production
- 4
Research Honor's Project
factors. By specifying a Cobb-Douglas production function fonn, Bernard and Busse
assume that both population share and economic resources should be subject to
diminishing marginal returns. This assumption does make economic sense. Holding
economic resources constant, additional talented athletes will inevitably decrease the
funds available to each person, and some athletes might not be able to obtain the
training conditions that are necessary for them to fully reach their potential. Therefore,
the marginal contribution of population share to the Olympic medal winning process
tends to decline as the population size gets bigger. Conversely, holding population
constant, additional economic resources allocated to sports should also yield
diminishing returns as more athletes attain their potential. As we move down the list
of athletes, we encounter less-talented athletes. Spending economic resources in
training those average athletes will not produce any Olympic medals. In an extreme
case, once all the talented athletes who are capable of competing for Olympic medals
in a country reach their physical limits by having ideal training conditions, additional
funding would not increase the country's Olympic medal share at all. In addition,
Bernard and Busse also include a dummy variable for the hosting advantage, a soviet
dummy, and a non-soviet but planned economy dummy. The hosting advantage is
estimated to be 1.2 percentage point medal share. The effect of the soviet dummy
varies between 3-6 percentage points.
Some of the most recent studies go beyond medal counts and argue that not all
Olympic medals are alike, and countries with different characteristics specialize in
different sports. Tcha and Pershin (2003) investigate each country's performance and
- 5

Research Honor's Project
attempt to identify the detenninants of this perfonnance in each sport, and also
examine other issues related to specialization at these games, using the concept of
revealed comparative advantage (RCA). Each country's RCA is explained by
geographical, biological, and economic variables of the participating countries. The
analyses present the detenninants of each country's specialization in sports and the
patterns of RCA, which are substantially different from those obtained by analyzing
the medal total. The authors found that high-income countries specialize less; in other
words, they win medals in a more diversified range of sports.
This paper will follow the most recent studies on modeling national Olympic
perfonnance and will investigate the relationship between a country's Olympic
perfonnance and its overall socioeconomic condition, including population, economic
resources, and political structures. A panel data set comprising the yearly data of 1996,
2000, and 2004 are estimated by using the fixed-effect Tobit regression model. The
reason for using the Tobit model is that the majority of participating countries usually
do not win any medals, and this fact causes the existence of a large number of zero
values in my data.
A different approach from prevlOus studies is that instead of using a single
dummy variable (socialist or non-socialist), two continuous variables, (political
freedom and civil liberty), are used in this research. There are three reasons for this
change. First, although most socialist countries are not politically free, the incentives
for using good Olympic perfonnance to stimulate nationalism are not limited to
socialist countries. Many other capitalist countries with relatively low levels of
- 6

Research Honor's Project
political freedom can also take advantage of this effect. Second, using continuous
variables not only distinguishes countries that are extremely not free from others, but
also reveals the impact of political freedom on countries with moderate levels of
political freedom. Third, the level of political freedom varies over time. A nation's
rating might change drastically during a four-year period. Hence, continuous variables
will function better than a dummy variable in capturing the impact of the changes on
political freedom variables. Based on the results of previous studies, I expect
population size and economic resources to be positively correlated with a country's
medal share, and being a country with a low level of political freedom or being a
hosting country increases a country's medal share.
III. Empirical Model and Data
In this paper, I follow the empirical model constructed by Bernard and Busse
(2000), which uses a Cobb-Douglas production function for producing Olympic
talents. It assumes that producing Olympic talent (T) is intrinsically similar to the
process of producing other goods and services, and the two key inputs are population
size (N) and economic resources (Y), which are both subject to diminishing marginal
return. Hence, the medal winning process can be modeled in the following way:
(1)
where T is Olympic talent, N is population, Y is GDP, and A is organizational ability of a
particular country. The subscript i denotes a particular country, and the subscript t denotes a
particular year. For example T iJ represents the aggregate quantity of Olympic talent of
-7

Research Honor's Project
country i in year t. Obviously, we also have to assume that year t is one of the years in which
the Olympics were held. Medal share (Mit) is calculated by dividing the medal count of
country i at year t by the total number of medals available in that year. We assume that Mit
is a function of the Olympic talent within that country in that year; that is, Mil = g(Tit).
Guided by the research by Bernard and Busse (200 1), I use a log function for the translation
from relative Olympic talent to medal shares:
Mil = In(Tit / LjTjt ) (2)
Equation (2) assumes the medal share (Mil) equals the natural log of the Olympic talent
share (Til / LjTjt), which is a fraction of the Olympic talent of country i over the sum of
Olympic talents ofall participating countries at the year t. In Bernard and Busse's research,
both the linear (without the natural log) and the logarithmic functional are been tried in
order to find a better fit. It turns out that the logarithmic functional fonn does a much better
job than the linear one.
By substituting Til in equation (2) with N] Yile Ail, we obtain the following
specification for medal shares:
(3)
Because national income can be rewritten as the product ofpopulation and per capita GDP,
I will actually estimate the following equation:
- 8

Research Honor's Project
where ~l equals (y+B), and f3z equals 8. Because, Ail is organizational ability of country i in
year t, it is a function of all other variables except Nil and (Y1N)i/. In this paper, since I am
interested explicitly in the impacts of hosting advantage and political structure on national
Olympic perfonnance, Ai' can be represented by Hosti/, PSVil, and sets of dummy variables
for country (d j) and year (VI) to capture other differences among countries and years. Notice
that I:j Tjl is no longer in the equation, because I:j Tjl is the same for all participating countries
in a particular year, and its impact will be captured by the year dummy variables (v,).
Finally eilis the statistical error tenn.
Data used for this research are from three sources. Yearly data of Olympic medal
counts and infonnation on hosting countries are obtained by direct correspondence with the
International Olympic Committee (IOE). I do not distinguish between gold, silver, and
bronze medals, because the difference between the best and the second best is usually so
tiny that the rank of medalists depends more on luck rather than sport talents. The data on
population (measured in million people) and per capita GDP (measured in PPP 2004
international dollars) are extracted from the World Development Report (World Bank,
2004).
The political structure variables are extracted from Freedom House, a
non-governmental, non-profit organization founded sixty years ago. Every year,
Freedom House publishes "Freedom in the World," an annual report of the political
rights and civil liberties in countries and territories around the world. In this report,
each country is evaluated based on a checklist of questions evaluating political rights
- 9
Research Honor's Project
and civil liberties. According to Freedom House's definitions,
Political rights enable people to participate freely in the political process,
including the right to vote, compete for public office, and elect representatives who have a decisive impact on public policies and are accountable to the electorate. Civil liberties allow for the freedoms of expression and belief, associational and organizational rights, rule of law, and personal autonomy without interference from the state. (Freedom House)
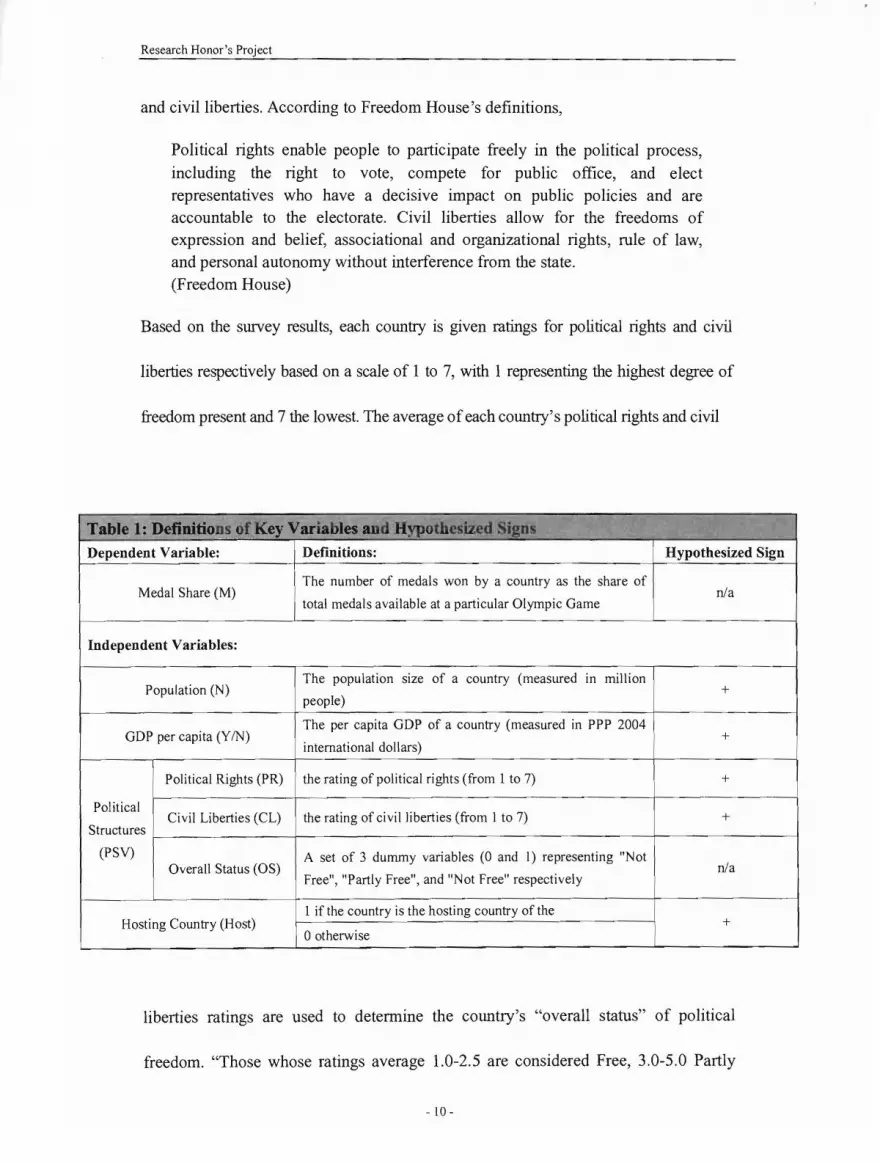
Based on the survey results, each country is given ratings for political rights and civil
liberties respectively based on a scale of 1 to 7, with 1 representing the highest degree of
freedom present and 7 the lowest. The average of each country's political rights and civil
Table 1: Definitions ofKey Variables and HypothesiZed$.gd~
Dependent Variable: Definitions: Hypothesized Sign
Medal Share (M) The number of medals won by a country as the share of
total medals available at a particular Olympic Game n/a
Independent Variables:
Population (N) The population
people)
size of a country (measured in million +
GOP per capita (YIN) The per capita GOP of a country (measured in PPP 2004
international dollars) +
Political Rights (PR) the rating of political rights (from 1 to 7) +
Political
Structures Civil Liberties (CL) the rating of civil liberties (from I to 7) +
(PSV) Overall Status (OS)
A set of 3 dummy variables (0 and I) representing "Not
Free", "Partly Free", and "Not Free" respectively n/a
Hosting Country (Host) 1 if the country is the hosting country of the
ootherwise +
liberties ratings are used to determine the country's "overall status" of political
freedom. "Those whose ratings average 1.0-2.5 are considered Free, 3.0-5.0 Partly
- 10

Research Honor's Project
Free, and 5.5-7.0 Not Free. (Freedom House) In this paper, the rating of political
rights (PR), the rating of civil liberties (CL), and the overall status (OS) are used
separately in equation (4) as PSV to fmd the best fit. I do not put more than one PSV
variable into the equation because of multicollinearity between these three variables.
Table 1 gives the defmition of each variable used.
I use data from the last three Olympics (1996, 2000, and 2004). I do not include
Olympics before 1996 because Olympic performances in many of those games were
twisted by non-socioeconomic factors. For example, due to the Cold War, the United
States did not attend the Moscow Olympics in 1980. Also along with many other
socialist countries, the Soviet Union boycotted the Los Angeles Olympics in 1984.
Moreover, the collapse of the Soviet Union in 1989 also significantly distorted the
performance of former Soviet countries.
It is reasonable to assume that a period of time is necessary for the impact of
population, economic resource, and other socioeconomic variables to be fully realized,
because training first-rate atWetes takes time. Data with a lag of 2 years and 3 years
are used to reflect this "time-to-build" effect. Descriptive statistics of the data used for
this research are provided in Table 2.
- 11

Research Honor's Project
Table 2:_Des~riptive Statisties of Key Variab les 0, . 0
Variables Observations Mean Std. Dev Min Max
Medal Shares (M) M, 600 0.5029167 1.401269 0 12.04
Population (N) N'_l 570 30,765 118,032 17 1,280,400
N'-3 569 30,415 116,714 16 1,271,850
GOP per capita (YIN) (YIN)'_2 483 246,206 856,826 317 10,300,000
(YIN)t-3 487 234,130 811,872 300
1
9,912,139
Political Rights (PL) PRt-2 555 3.466667 2.193745 7
PR;-3 554 3.519856 2.226051 1 7
Civil Liberties (CL) CLt-2 555 3.594595 1.837134 1 7
CI.-1-3 554 3.680505 1.844031 1 7
Overall Status (OS) Descriptive statistics omitted, because OS are dummy variables.
Descriptive statistics omitted, because Host is a dummy variable. Hosting Country (Host)
Note: the subscripts denote the lag. For example Nt-2 denotes population with a lag of two years
IV. Results
Fixed-effect Tobit regressions are applied to estimate equation 4, and the rating of
political rights CPR), the rating of civil liberty, and the overall status have been
plugged into the equation as political freedom variables. The regression results for the
models with a lag of three years are shown in Table 3, and the regression results for
the models with a lag of two years, which are essentially the same, are shown in
Appendix 1. As we can see from Table 3, population, per capita GDP, and hosting
advantage show highly significant, positive influences on national Olympic
performance. Moreover, the coefficients of these three variables are very stable across
different model. These results are consistent with previous research.
Also, as previous studies have revealed, countries that are politically "Not Free"
may perform somewhat better in the Olympics by winning more medals than the rest
of the world, though the difference between "Free" and "Not Free" is not significant.
However, an interesting fmding is that the overall status displays a V-shaped
- 12

Research Honor's Project
relationship with respect to medal shares. Being "Partly Free", has a negative effect
on national Olympic performance when compared to countries that are "Free" and
"Not Free". As we can see, the coefficient of "Partly Free" is negative and reasonably
significant. To further test this relationship, I replace the "Not Free", "Partly Free"
dummies with political rights (model 2) and civil liberties (model 3). In each case, the
addition of the square seems to improve the fit slightly, with the signs - positive for
the variable and negative for its square - suggesting a V-shaped curve.
[f~;.r-.'.\" 'r;' ,~~~'. :~-~7~,''-T.r···~··k'J~~·''\~''''')·1-;':'''- ~,:> " -:"- ::.... ,;.;,~~::-\y~..--.... ;- '.. 1. ~ \" ..,:..-;, ~~ ~:_I~~~~_j:o. \~'~.~l-~ ... ~~~J,:~ :~::~~~~.: ~~~~:~1~(~~--;_~""OO':!\A:~~~_.- ~ ~~"'! ~~
Variables Modell Model2-a Model2-b Mode13-a Model3-b In(Population) 0.4343 0.4244 0.4211 0.425 0.4249
(12.54)*** (11.52)*** (11.42)*** (11.54)*** (11.54)***
In(Per capita GDP) 0.4308 0.3906 0.3895 0.3932 0.3932
(7.63)*** (6.41)*** (6.40)*** (6.44)*** (6.44)***
Hosting (dummy) 2.1542 2.5753 2.5663 2.5623 2.5553
(5.07)*** (5.25)*** (5.24)*** (5.22)*** (5.20)***
Not Free (dummy) 0.022
(0.19)
Partly Free (dummy) -0.1841
(-1.70)**
Political Rights 0.0143 -0.1298
(0.66) (-1.l7)*
(Political Rightsi 0.0185
(1.33)*
Civil Liberty 0.0235 -0.0143
(0.92)* (-0.12)
(Civil Liberty)2 0.0049
(0.33)
Log Likelihood -564.6722 -519.7435 -518.8667 -519.5382 -519.4826
Note: Z-values are in the parenthesis. ***Significant at 0.05 level, **Significant at 0.1 level, *Significant at 0.5 level.
Again, some of the coefficients or PSVs are not strictly significant. Still, it is quite
- 13

Research Honor's Project
striking to see the consistency across different models. The results consistently
suggest a V-shaped relationship between PFV and Olympic performance.
One possible explanation of this V-shaped relationship might be that, for nations
that have a high to medium level of political freedom, its citizens usually have a pretty
high level of satisfaction with their political rights and civil liberty. Being already
quite proud of their homeland, the effect of a good Olympic performance in
stimulating nationalism becomes almost irrelevant. However, for nations which have a
less free political structure, a good Olympic performance functions almost like
steroids, which could tremendously enhance national prestige and enable its citizens
to feel extremely proud of their home country in the short-run.
To test the accuracy of my model, I calculate the predicted medal winning of each
country at the Athens Olympics. The predicted medal counts and the actual numbers
are listed in Appendix 2 for comparison. The predicted values are computed based on
Model 1 with a lag of 3 years. I used the Overall Status (OS) as my PFV simply
because it yields better results than the others. For the most part, the model does a
reasonably good job on predicting national Olympic performance. One measure is the
standard error of the forecast.
Lil(Xi~ _X[)2 =3.2018Sr=
n-k
This means the predicted values are on average off by 3.20 medals from the actual
values.
In fact, the model does a better job than this measure suggests. The inaccuracy is
largely due to the existence of outliers, e.g. Cuba and Russia, for which the predicted
- 14

Research Honor's Project
values are off by more than 20 medals. Generally, fonner Soviet countries and
socialist countries are systematically under-predicted. This shortcoming probably has
to do with my choice of using the political freedom index, which captures the
incentive for a nation to use a good Olympic perfonnance to stimulate patriotism and
enhance domestic political stability. However, this is only one side of the story. By
having a powerful national government, which governs the central-planned economy,
fonner Soviet countries and many other socialist countries may be more capable in
channeling funds to support sports than other nations with a low political freedom
index but a relatively weak government. In other words, although countries that are
politically not free have incentives to boost their Olympic perfonnance, not all of their
national governments have the same ability to achieve the goal like the powerful
governments of many socialist countries do.
In addition, many fonner Soviet countries have undergone a significant change of
political structure. Many of them, e.g. Russia and Ukraine, have shifted from "Not
Free" to "Partly Free." However, the infrastructures and facilities established during
the Soviet period still exist and continue to bring medals to those countries. In fact,
many excellent atWetes, trained during the Soviet period, are still competing in the
Olympic arena for their home countries, and that also contributes to the higher
number of Olympic medals won by fonner Soviet countries than my model's
prediction.
- 15

Research Honor's Project
V. Conclusion
Consistent with previous studies on national Olympic performance, this paper
finds that socioeconomic variables, including population, economic resources, and
hosting advantage, have significant impact on a country's Olympic performance. In
general, population and economic resources (per capita GDP) are positively
correlated with medal counts. The larger the population size, the more likely a
country is to do better in Olympics; the richer a country is, the more Olympic medals
it will likely win. Being a hosting nation also has a favorable influence on a country's
Olympic performance. In general, my results are consistent with those of the studies
carried out by Johnson and Ali (2000) and Bernard and Busse (2000). Most influential
factors identified by those previous studies are verified to be statistically significant.
One interesting fmding of my research is that the regression results, though somewhat
weakly, suggest that political freedom variables, both political freedom and civil
liberty, display a V-shaped relationship with respect to medal shares. Being "Partly
Free", has a negative effect on national Olympic performance when compared to
countries that are "Free" and "Not Free". Avenues for future research include
verifying this V-shaped relationship, and testing possible explanations.
- 16

Research Honor's Project
References:
Andrew B. Bernard and Meghan R. Busse. "Who Wins the Olympic Games: Economic Resource and Medal Totals". Unpublished working paper, 2000 August.
Daniel K.N. Johnson and Ayfer Ali. "A Tale of Two Seasons: Participation and Medal Counts at the Summer and Winter Olympic Games. Wellesley College Working Paper 2002-02. January, 2002.
Freedom House. Freedom in the World 2005. Published by Freedom House, 2005. < http://www.freedomhouse.org/research >
Elmer Sterken and Cerard Kuper. "Participation and Performance at the Olympic Summer Games." Department of Economics, University of Groningen. < http://www.eco.rug.nl/medewerk/sterkenldownload!economysports.pdf>
Robert Hoffmann, Lee Chew Ging, and Bala Ramasamy. "Public Policy and Olympic Success". Applied Economics Letter, 545-548. 2002.
Robert Hoffmann, Lee Chew Ging, and Bala Ramasamy. "Olympic Success and ASEAN Countries: Economic Analysis and Policy Implications". Nottingham University Business School, Malaysia Campus. 2004.
Shughart, William F., and Robert D. Tollison, "Going for the Gold: Property Rights and Athletic Effort in Transitional Economies" KYKLOS; v46 n2 1993, pp. 263-72. 1993.
Tcha, Moonjoong; Pershin, Vitaly. "Reconsidering Performance at the Summer Olympics and Revealed Comparative Advantage." Journal of Sports Economics, v. 4, pp. 216-39. August 2003.
Wallechinsky, David, The Complete Book of the Olympics, 1992 Edition, Little, Brown and Company, Boston. 1992.
Wing Suen, "Olympic Games and Economic Behavior" Working Paper. Department of Economics, University of Hong Kong. < http://www.econ.hku.hk/~hrneswc/games.pdf>
World Bank, World Development Indicators 2004 (CD ROM). Published by World Bank. 2004.
- 17

Research Honor's Project
Appendix 1:
~~ Variables Modell Model2-a Model2-b Model3-a Model3-b
In(Population) 0.4590 0.4261 0.4227 0.4261 0.4255
(13.77)*** (11.5)*** (11.39)*** (11.51)*** (11.49)***
In(Per capita GOP) 0.4737 0.4016 0.4001 0.4035 0.4028
(6.14)*** (6.5)*** (6.48)*** (6.53)*** (6.52)***
Hosting (dummy) 2.4095 2.5599 2.5388 2.5472 2.5340
(3.46)*** (5.2)*** (5.16)*** (5.18)*** (5.15)***
Not Free (dummy) 0.2137
(0.98)*
Partly Free (dummy) -0.3022
(-1.4)*
Political Rights 0.0142 -0.1161
(0.66) (-1.02)*
(Political Rights)2 0.0167
(1.16)*
Civil Liberty 0.0243 -0.0496
(0.96)* (-0.43)
(Civil Liberty)2 0.0095
(0.66)
Log Likelihood -584.7872 -517.2418 -516.5644 -516.9995 -516.7816
Note: Z-values are in the parenthesis. ***Significant at 0.05 level, **Significant at 0.1 level, *Significant at 0.5 level.
- 18 -

Appendix 1:
Free Not FreePardyFrte
Countries Actual Predicted Countries Actual Predicted Countries Actual Predicted American Samoa 0 o Albania 0 o Afghanistan 0 0 Andorra 0 o Antigua and Barbuda 0 o Algeria 0 0 Argentina 6 o Annenia 0 oAngola 0 0 Aruba 0 o Bahrain 0 oAzerbaijan 5 0 Australia 49 50 Bangladesh 0 o Belarus 15 20 Austria 7 14 Bolivia 0 oBhutan 0 0 Barbados 0 o Bosnia and Herzegovina 0 oBrunei 0 0 Belgium 3 o Burkina Faso 0 oCambodia 0 0 Belize 0 oBunmdi 0 oCameroon I 0 Benin 0 oColombia I oCayman Islands 0 0 Bermuda 0 oComoros 0 oCentral African Republic 0 0 Botswana 0 oCongo, Democratic Republic of the 0 oChad 0 0 Brazil 10 13 Djibouti 0 oChina 63 64 British Virgin Islands 0 oEcuador 0 oCongo, Republic of the 0 0 Bulgaria 12 16 Ethiopia 7 I J Cote d'ivoire 0 0 Canada 12 18 Fiji 0 oCuba 27 0 Cape Verde 0 oGabon 0 oEgypt 5 0 Chile 3 oGeorgia 4 o Equatorial Guinea 0 0 Cook Islands 0 oGuatemala 0 oEritrea I 0 Costa Rica 0 oGuinea-Bissau 0 oGuam 0 0 Croatia 5 o Honduras 0 oGuinea 0 0 Cyprus 0 o Indonesia 4 oHaiti 0 0 Czech Republic 8 12 Jordan 0 o Iran 6 0 Denmark 8 10 Kenya 7 12 Iraq 0 0 Dominica 0 o Kuwait 0 oKazakhstan 8 0 Dominican Republic I oMacedonia 0 oKorea, North 5 0 EI Salvador 0 o Madagascar 0 oKyrgyLStan 0 0 Estonia 3 o Malawi 0 oLaos 0 0 Finland 2 o Malaysia 0 oLebanon 0 0 France 33 38 Moldova 0 oLiberia 0 0 Germany 48 60 Morocco 3 o Libya 0 0 Ghana 0 o Mozambique 0 oMaldives 0 0 Greece 16 27 Nepal 0 oMauritania 0 0 Grenada 0 oNicaragua 0 o Netherlands Antilles 0 0 Guyana 0 o Niger 0 17 Oman 0 0 Hong Kong I o Nigeria 2 oPakistan 0 0 Hungary 18 22 Papua New Guinea 0 oPalestine 0 0 Iceland 0 oParaguay I oQatar 0 0 India I o Russia 91 69 Rwanda 0 0 Ireland I oSeychelles 0 oSaudi Arabia 0 26 Israel 2 oSierra Leone 0 oSomalia 0 0 Italy 33 33 Singapore 0 oSudan 0 0 Jamaica 5 oSolomon Islands 0 oSwaziland 0 0 Japan 37 26 Sri Lanka 0 oSyria I 0 Korea, South 30 30 Tanzania 0 oTajikistan 0 0 Latvia 4 oThe Gambia 0 oTogo 0 0 Lesotho 0 oTonga 0 oTunisia 0 0 Liechtenstein 0 oTrinidad and Tobago I oTurkmenistan 0 0 Lithuania 3 oTurkey 10 19 United Arab Emirates I 0 Luxembourg 0 o Uganda 0 o Uzbekistan 5 0 Mali 0 oUkraine 23 16 Vietnam 0 0 Malta 0 o Venezuela 2 o Yugoslavia 0 0 Mauritius 0 o Yemen 0 oZimbabwe 3 0 Mexico 4 10 Zambia 2 0 Micronesia, Federated States of 0 0 Monaco 0 0 Mongolia I 0 Myanmar (Boona) 0 0 Namibia 0 0 Nauru 0 0 Netherlands 22 24 New Zealand 5 0
19

Free "rtfy Free "NotFne
Countries Actual Predicted Countries Actual Predicted Countries Actual Predicted Norway 6 10 Palau 0 0 Panama 0 0 Peru 0 0 Philippines 0 0 Poland 10 16 Portugal 3 0 Puerto Rico 0 0 Romania 19 18 Saint Kitts and Nevis 0 0 Saint Lucia 0 0 Saint Vincent and the Grenadine: 0 0 Samoa 0 0 San Marino 0 0 Sao Tome and Principe 0 0 Senegal 0 0 Slovakia 6 0 Slovenia 4 0 South Africa 6 10 Spain 19 13 Suriname 0 0 Sweden 7 II Switzerland 5 0 Taiwan 5 0 Thailand 8 0 The Bahamas 2 0 United Kingdom 29 28 United States 103 87 Uruguay 0 II Vanuatu 0 0 Virgin Is lands 0 0
20


