Embed Size (px)
Citation preview
e Pergamon
0273·1223(9S)00420-3
Will. ScL r,ch. Vol. 31,No. 9, pp.181-19I,I99.5.Copyrigbt C 199.5 IAWQ
Printed in Oreat Britain. All rigbll relCfYOd.0273-1223~.5 $9'SO +(){)()
PREDICTING THE BED EXPANSION OFAN ANAEROBIC FLUIDISED-BEDBIOREACTOR
Tjandra Setiadi
Department ofChemical Engineering /TB, Inter University Centre onBiotechnology ITB, JL Ganesa 10, Bandung 40132, Indonesia
ABSTRACT
In this study, the bed expansion of an anaerobic f1uidised-bed bioreactor was investigated. The experimentswere conducted in a 4.4 em diameter colwnn with 0.152 mm sand as mediwn support of the bioftlm. Thetemperature was maintained at 30"C and synthetic wastewater was used. The bed expansion data from theprescnt study and literature data were used to evaluate the applicability of the correlations In predicting thebed expansion of the bioreactors. A correlation between bed expansion or voidage (e) and the particleReynold's (Re) and Gallileo's (Ga) numbers proposed by Setiadi (1989)
e= 1.72 ReO.203 Ga -0.179
was found to predict the bed expansion of anaerobic f1uidised-bed bioreactors with better accuracy than anypreviously published correlations.
KEYWORDS
Anaerobic; bed expansion; bed voidage; bioreactor; correlation; fluidised-bed.
INTRODUcnON
The application of anaerobic fluidised-bed bioreactors in treating various wastewaters has gainedconsiderable attention in the last two decades, although most of them have been operated only on laboratoryand pilot-plant scales. However. since 1983 full-scale anaerobic fluidised-bed reactors have been started upin the USA and The Netherlands (lza, 1991). With the increase in commercial application. deterministicmethods for the design of fluidised-bed bioreactors should be developed.
In the design of a fluidised-bed reactor, it is important to know the Stllte of bed expansion, as this influencesthe bed volume and hence the residence time of the liquid phase. The bed expansion has a close relationshipto bed voidage, therefore in the paper these terms are used interchangeably. Studies on bed expansion of thefluidi.o;ed-bed reactor have been made extensively for non-biological particles. However. with the increasingapplication of the reactor to biological· systems, several workers have investigated the bed expansion offluidised-bed bioreactors.
181
182 T.SETJADI
A fluidised-bed bioreactor is a novel biological system in which small. fluidised particles are used toimmobilise bjoma.~ within the reactor. This results in a high biomass concentration in the reactor, enablingit to (lperate at significantly higher liquid throughputs than stirred tank reactors with the absence ofsignificant loss of biomass. To model the kinetics or the dynamics of these biologically active fluidisedbeds, it is important to be able to establish relationships between the liquid superficial velocity UL and thebed voidage E.
A number of workers have investigated the relationship between the liquid velocity and the bed voidage £for anaerobic/anoxic fluidised-bed bioreactors (Ngian and Martin. 1980; Hermanowicz and GancZll!Czyk.1983; Timmermans and van Haute, 1984; Mulcahy and Shieh. 1987). The gas produced in the reactor mayinfluence the bed expansion behaviour of two-phase (liquid-solid) fluidised-bed reactors. However, none ofthe above workers hali reponed any effect of produced gas on the bioreactor systems. This was in accordancewith Davison (1988) who attempted to study the effect of low gas velocity up to 1.2 cmls on the bedexpansion of gel beads (particle density, Pp =1.1 g1cm3). It was found that the effect of gas flow rate on thebed voidage e was small. Thus, the bed voidage with a low gas velocity fluidised-bed bioreactor can beestimated from that of two-phase (L-S) fluidised-bed reactors.
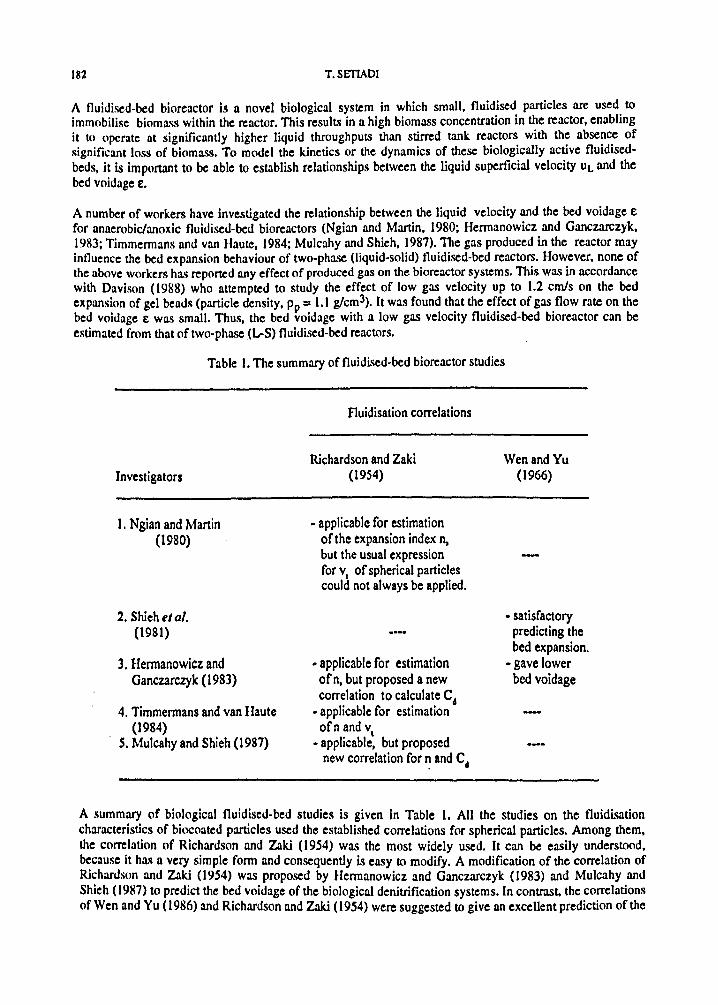
Table I. The summary of fluidised-bed bioreactor studies
f1uidisation correlations
Investigators
1. Ngian and Martin(1980)
2. Shieh e/ 01.(1981)
3.lIermanowicz andGanczarczyk (1983)
4. Timmermans and van Haute(1984)
S. Mulcahy and Shieh (1987)
Richardson and Zaki(1954)
• applicable for estimationof the expansion index n.but the usual expressionfor VI of spherical particlescould not always be applied.
• applicable for estimationofn, but proposed a newcorrelation to calculate C.
• applicable for estimationofn and VI
• applicable, but proposednew correlation for ~ and C.
Wen and Yu(1966)
• satisfactorypredicting thebed expansion.
• gave lowerbed voidage
A summary of biological fluidised-bed studies is given in Table 1. All the studies on the fluidisationcharacteristics of biocoated particles used the established correlations for spherical particles. Among them,the correlation of Richardson and Zllki (19j4) was the most widely used. It can be easily understood.because it hali a very simple form and consequently is easy to modify. A modification of the correlation ofRichardson and Zald (19j4) was proposed by Hermanowicz and GanczllrCzyk (1983) and Mulcahy andShieh (19H7) to predict the bed voidage of the biological denitrification systems. In contrast. the correlationsof Wen and Yu (1986) and Richardson and :zaki (1954) were suggested to give an excellent prediction of the
Predicting bed expansion of an anaerobic fluidised-bed bioreactor 183
bed voidage of fluidised-bed bioreactors by Shiehet al. (1981) and Timmermans and van Haute (1984),respectively.
From the design point of view, the equation of Wen and Yu (1966) is simpler to use, because the settlingvelocity of the panicle vt is not required. But the form of this correlation has discouraged researchers fromattempting to modify it. No study has used non-spherical particle correlations for predicting bed expansionbehaviour. The reason is that to determine the shape factor of biocoated particles is difficult. The simplemethod of measuring sphericity suggested by Cleasby and Fan (1981) can not be applied to biologicalparticles.
Table I also reveals that each correlation is specifically valid for its own data. No attempt has been made togeneralise the correlation to cover all sets of data. Additionally, bed expansion data of anaerobic fluidisedbed bioreactors are rather limited. Therefore, there is a need for further data on the bed expansion ofanaerobic fluidised-bed bioreactors. Moreover. it is desirable to have a general correlation to predict the bedexpansion of the bioreactor.
EXPERIMENTAL
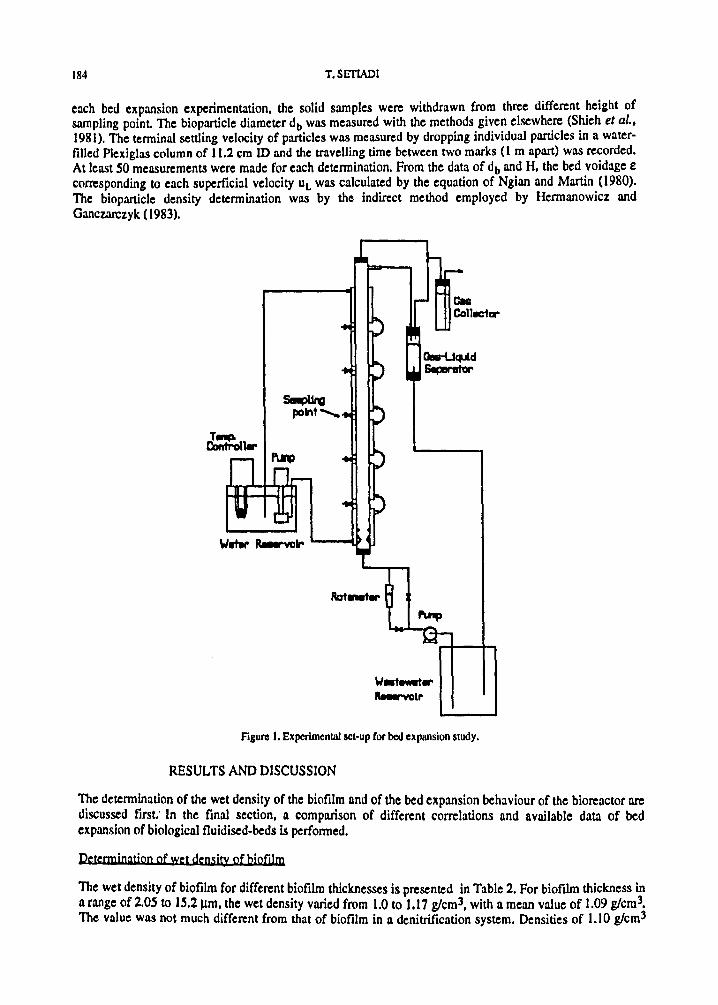
The experimental set up is shown in Fig. 1. The major components of the system were the reactor, gas-liquidseparator, gas coIlector, liquid pump and water bath with a temperature controIler.
The reactor was constructed from two concentric Plexiglas columns of different diameter. The inner columnhad 4.4 cm 10, 200 cm length, and 0.3 cm wall thickness and the outer had 5.7 cm 10, and 0.3 cm wallthickness. Scales graduated to one miIlimetre were fixed to the column. The water from a water bath wascirculated in the jacket space between the two columns to maintain the temperature inside the column ataround 30°C. At the bottom there was a 23 cmchigh calming section filled with glass beads of 1.5 mmdiameter.
Five equally spaced sampling points were installed along the column length to obtain both liquid and bedsamples. The first sampling point was located 35 cm from the bottom of the column and the others were atdistances of 30 cm from one to another. A 1 litre gaslIiquid separator was placed on the suction side of therecycle pump to facilitate the dissolution of gas from the recycled flow. The gas produced in the reactor wascollected in a I litre gas collector filled with acidified saturated NaCI solution. so that the volume of thedLl\placed salt solution was equal to the volume of gas produced. The experimental procedure was dividedinto three parts i.e., inoculum preparation. reactor start-up, and bed expansion experimentation.
Inoculum preparation. Cow dung was collected from a farm and screened through a sieve to remove coarsematerial. Then I litre of the sludge was transferred to a 2 litre flask containing 100 ml of syntheticwastewater (Chen et al., 1985) and purged with N2' The flask was placed in a temperature controlled roomof 30°C. Synthetic wastewater (100 ml) was added to the flask each day to finally obtain 2 litres in the flask.After the 2 litre volume was obtained, 100 ml sludge was removed each day from the flask and replacedwith 100 ml synthetic wastewater to maintain a constant volume. This practice wa.c; continued for about 2months to ensure that the inoculum was fuIly acclimatised to the synthetic wastewater.
Start-up of the anaerobic fluidised-bed bioreactor. The column was filled with 1350 g clean sand with anaverage diameter of 142.3 m, then 1 litre of inoculum was added, and the column was filled with syntheticwastewater. The column was operated in a total recycle, with initial bed expansion maintained at 30%. Tomaintain the reactor pH in the range of 6.8 to 7.2, sodium bicarbonate was added as necessary. 200 ml ofsynthetic wastewater was added to the reactor each day to promote and sustain the growth of biofilm on theparticles.
Bed expansion experimentation. Throughout the experimental period, the thickness of the biofilm on thesurface of the sand particles increased as a result of the growth of the mixed bacteria. At a certain biopaniclesize, the expanded bed height of the beds H at different superficial liquid velocity UL were measured. During
184 T.SETIADI
each bed expansion experimentation. the solid samples were withdrawn from three different height ofsampling poinL The bioparticle diameter db was measured with the methods given elsewhere (Shieh et al.,1981). The terminal settling velocity of particles was measured by dropping individual particles in a waterfilled Plexiglas column of 11.2 cm 10 and the travelling time between two marks (1 m apart) was recorded.At least SO measurements were made for each determination. From the data of db and H, the bed voidage £corresponding to each superficial velocity UL was calculated by the equation of Ngian and Martin (1980).The biopartic1e density determination was by the indirect method employed by Hermanowicz andGanczarezyk (1983).
~point "'"
d::on..
Figure I. EXperimental set-up for bed expansion study.
RESULTS AND DISCUSSION
The determination of the wet density of the biofilm nnd of the bed expansion behaviour of the bioreactor nrediscussed firsL' In the final section. n comparison of different correlations and available data of bedexpansion of biological fluidised·beds is performed.
Determinj1tion of wet density of biofilm
The wet density of biofilm for different biofilm thicknesses is presented in Table 2. For biofilm thickness in11 range of 2.05 to 15.21lrn, the wet density varied from 1.0 to 1.17 glcm3, with a mean value of 1.09 glcm3•The value was not much different from that of biofilm in 11 denitrification system. Densities of 1.10 glcm3
Predicting bed expansion oran anaerobic nuidised-bed bioreactor 18~
and 1.14 g1cm3have been reported by Ngian and Martin (1980) and Hermanowicz and Ganczarczyk (1983),respectively.
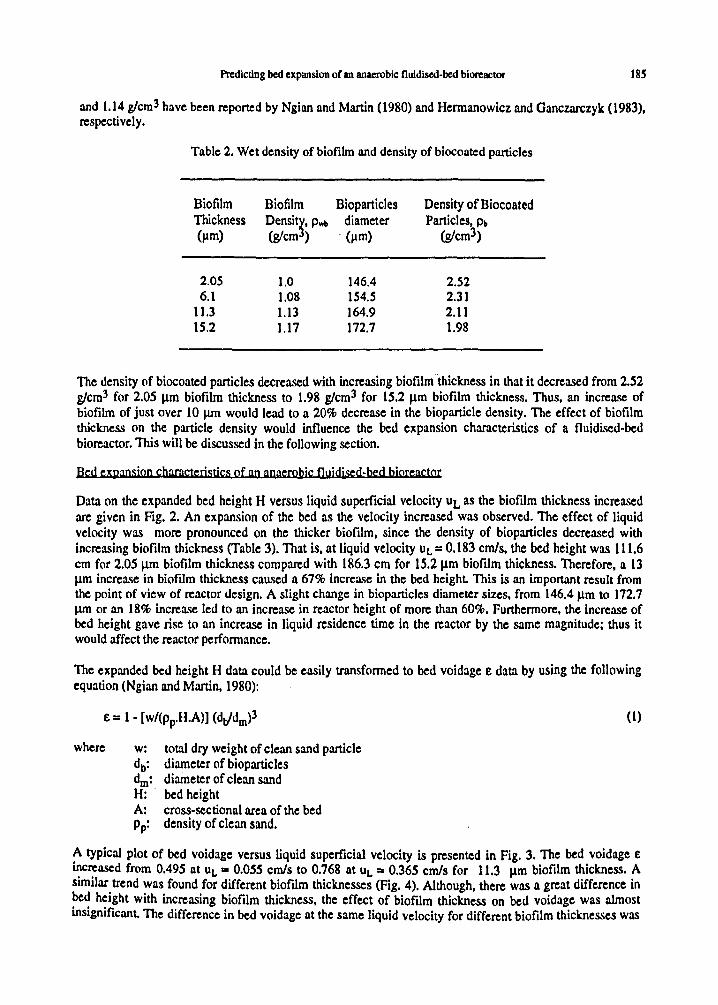
Table 2. Wet density of biofilm and density of biocoated particles
Biofilm Biofilm Bioparticles Density ofBiocoatedThickness Densit~, Pwb diameter Particles, Pb(J.Im) (g1cm ) > (J.Im) (glcm3)
2.05 1.0 146.4 2.526.1 1.08 154.5 2.31
11.3 1.13 164.9 2.1115.2 1.17 172.7 1.98
The density of biocoated particles decreased with increasing biofilm'thickness in that it decreased from 2.52g/cm3 for 2.05 11m biofilm thickness to 1.98 g/cm3 for 15.2 I!m biofilm thickness. Thus, an increase ofbiofilm of just over 10 I!m would lead to a 20% decrease in the bioparticle density. The effect of biofilmthickness on the particle density would influence the bed expansion characteristics of a fluidised-bedbioreactor. This will be discussed in the following section.
Bed expansion characteristics of an anaerobic fluidised.bed bioreactor
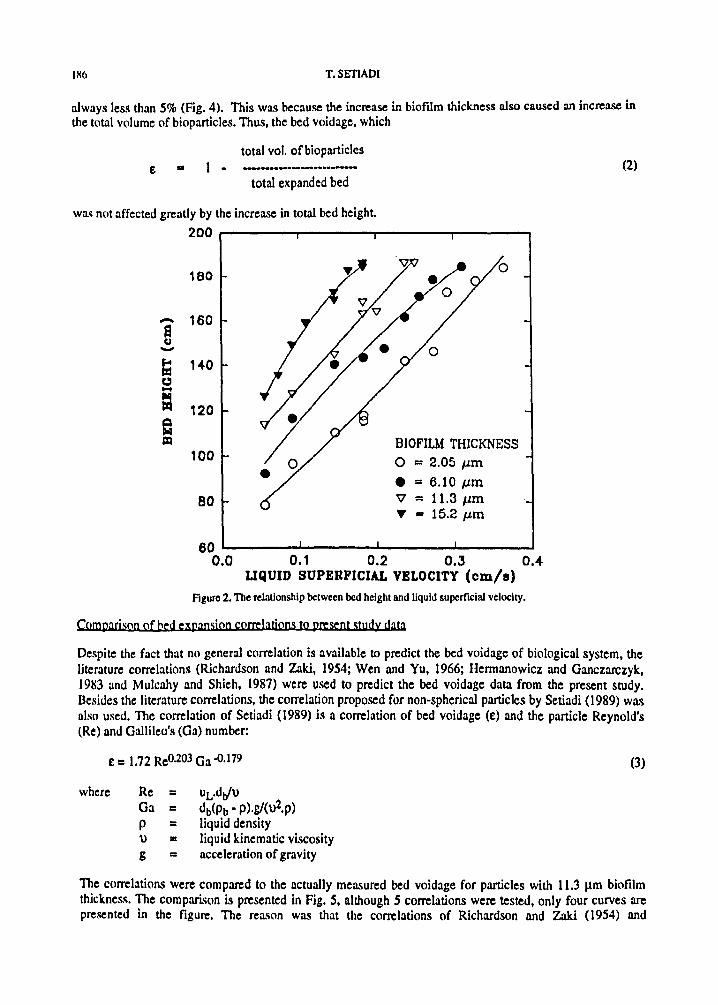
Data on the expanded bed height H versus liquid superficial velocity uL as the biofilm thickness increasedare given in Fig. 2. An expansion of the bed as the velocity increased was observed. The effect of liquidvelocity was more pronounced on the thicker biofilm, since the density of bioparticles decreased withincreasing biofllm thickness (Table 3). That is, at liquid velocity UL = 0.183 crn/s, the bed height was 111.6cm for 2.05 I!m biofilm thickness compared with 186.3 cm for IS.2I!m biofllm thickness. Therefore, a 13J.lffi increase in biofilm thickness caused a 67% increase in the bed height. This is an imporUnt result fromthe point of view of reactor design. A slight change in bioparticles diameter sizes. from 146.4l!m to 172.7J.lffi or an 18% increase led to an increase in reactor height of more than 60%. Furthermore. the increase ofbed height gave rise to an increase in liquid residence time in the reactor by the same magnitude; thus itwould affect the reactor performance.
The expanded bed height H data could be easily transformed to bed voidage e data by using the followingequation (Ngian and Martin, 1980):
(1)
where w: total dry weight of clean sand particledb: diameter of bioparticlesdm: diameter of clean sandH: . bed heightA: cross-sectional area of the bedPp: density of clean sand.
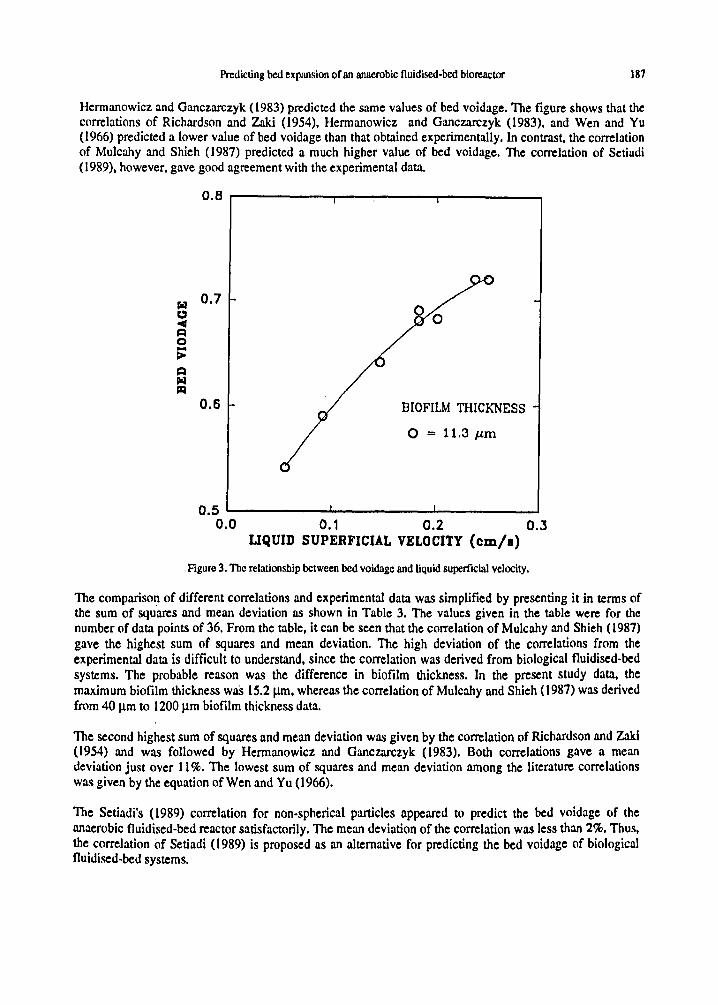
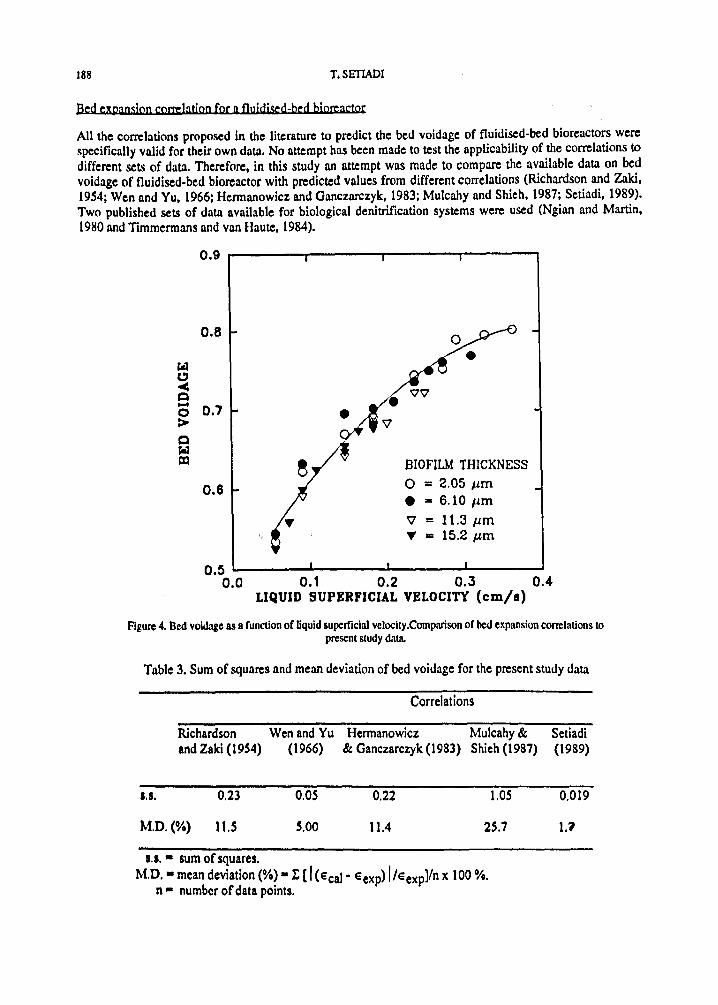
A typical plot of bed voidage versus liquid superficial velocity is presented in Fig. 3. The bed voidage ei~cr;ased from 0.495 at uL =0.055 cmls to 0.768 at UL =0.365 cmls for 11.3 11m biofllm thickness. ASimIlar trend was found for different biofllm thicknesses (Fig. 4). Although, there was a great difference inbed height with increasing biofllm thickness. the effect of biofllm thickness on bed voidage was almostinsignificant. The difference in bed voidage at the same liquid velocity for different biofilm thicknesses was
1116 T.SETlADl
nlways less than 5% (Fig. 4). This was because the increase in biofilm thickness also caused an increase inthe total volume of bioparticles. Thus, the bed voidage, which
total vol. ofbiopartic1es£ • 1· ._ _.__ . (2)
total expanded bed
wa.~ not affected greatly by the increase in total bed height.
200 ,.-----,------r----,------,
BIOFILM THICKNESSo = 2.05 /lm• = 6.10 /lm
80 'V = 11.3 p,my. = 15.2 p,m
180
- 160au-t 140t:IM
= 120QfatP3
100
60 '--__---'l....-__--' ..... --'
0.0 0.1 0.2 0.3 0.4LIQUID SUPERFICIAL VELOCITY (em/II)
Figure 2. The relationship between bed height and liquid superficial velocity.
Comparison of bed expansion correlations to present study data
Despite the fact that no general correlation is available to predict the bed voidage of biological system, theliterature correlations (Richardson and Zaki, 1954; Wen and Yu, 1966; Hennanowicz and Oanczarczyk,19H3 and Mulcahy and Shieh, 1987) were used to predict the bed voidage data from the present study.Desides the literature correlations, the correlation proposed for non-spherical particles by Setiadi (1989) wasalso used. The correlation of Setiadi (1989) is a correlation of bed voidage (e) and the particle Reynold's(Re) and Oa11i1eo's (Oa) number:
e=1.72 ReO.203 Oa -0.179 (3)
where Re =Oa =p =u =g III
UL·dt/udb(Pb. p).g!(U2.p)liquid densityliquid kinematic viscosityacceleration ofgravity
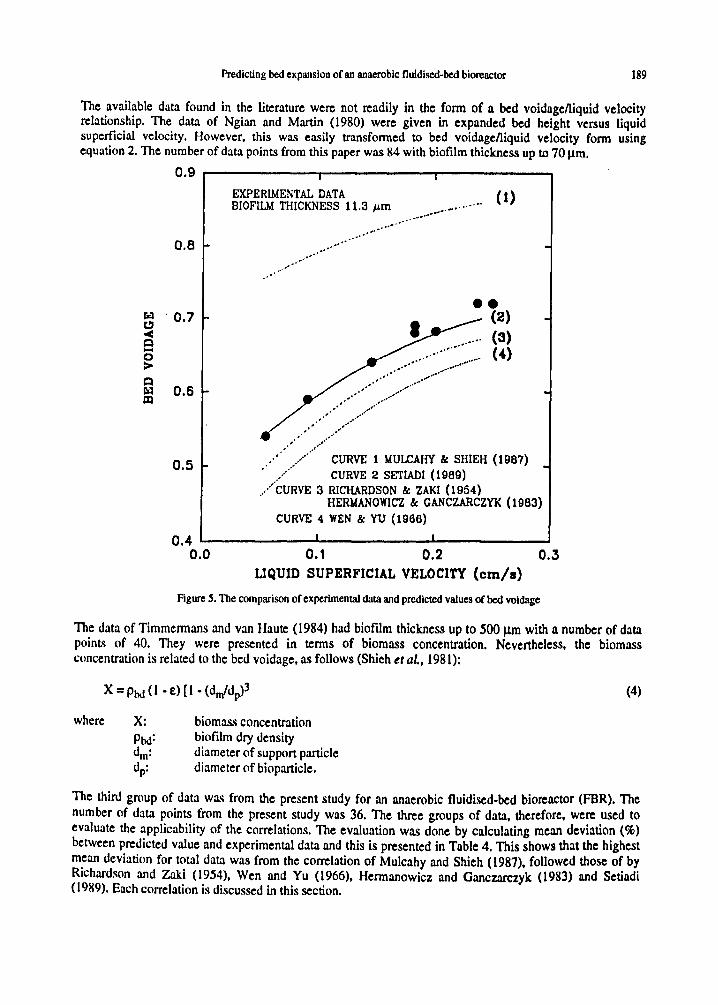
The correlations Were compared to the actually measured bed voidage for particles with 1l.3 ~m biofilmthicknes.". The comparison is presented in Fig. 5, although 5 correlations were tested, only four curves arepresented in the figure. The reason wa.'1 that the correlations of Richardson and Za1d (1954) and
Predicting bed expansion ofan anaerobic fluidised-bed bioreactor 187
Hermanowicz and Ganczarczyk (1983) predicted the same values of bed voidage. The figure shows that thecorrelations of Richardson and Zaki (1954), Hennanowicz and Ganczarczyk (1983), and Wen and Yu(1966) predicted a lower value of bed voidage than that obtained experimentally. In contrast, the correlationof Mulcahy and Shieh (1987) predicted a much higher value of bed voidage. The correlation of Setiadi(1989), however, gave good agreement with the experimental data.
O.B r---------r--~---_r___----_..
0.6 BIOFILM THICKNESS
o = 11.3 p.m
0.5 1....- ....1.- --1- --1
0.0 0.1 0.2 0.3LIQUID SUPERFICIAL VELOCITY (em/I)
.Figure 3. The relationship between bed voidage and liquid superficial velocity.
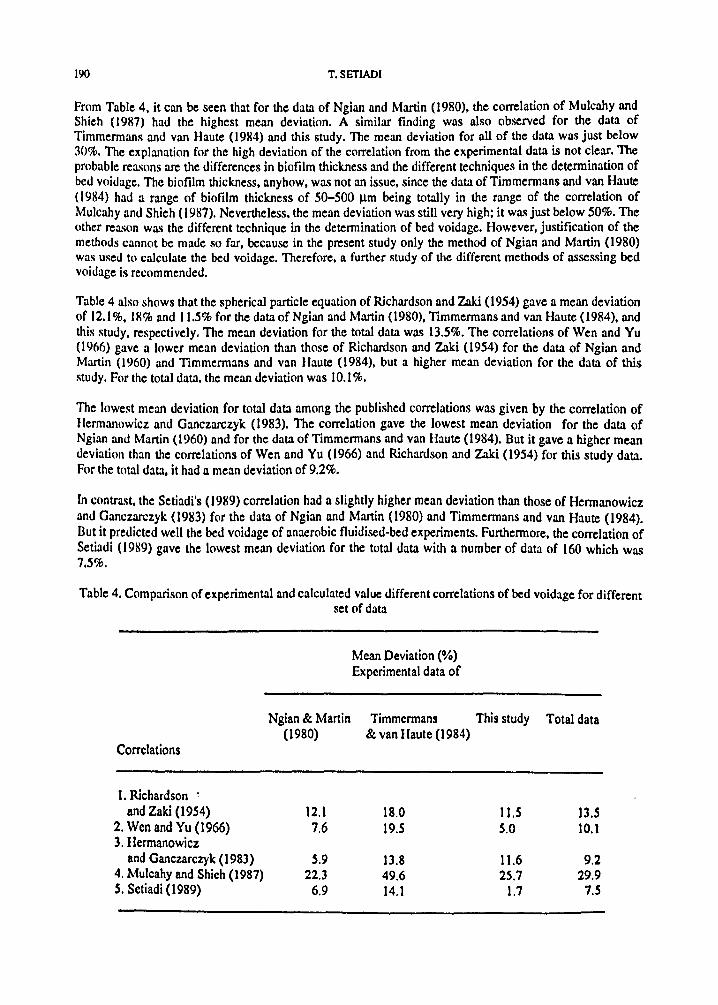
The comparison of different correlations and experimental data was simplified by presenting it in tenns ofthe sum of squares and mean deviation as shown in Table 3. The values given in the table were for thenumber of data points of 36. From the table, it can be seen that the correlation of Mulcahy and Shieh (1987)gave the highest sum of squares and mean deviation. The high deviation of the correlations from theexperimental data is difficult to understand, since the correlation was derived from biological f1uidised-bedsystems. The probable reason was the difference in biofilm thickness. In the present study data, themaximum biofilm thickness waS 15.2 J.Ull, whereas the correlation of Mulcahy and Shieh (1987) was derivedfrom 40 Ilm to 1200 I!m biofilm thickness data.
The second highest sum of squares and mean deviation was given by the correlation of Richardson and Zaki(1954) and was followed by Hermanowicz and Ganczarczyk (1983). Both correlations gave a meandeviation just over II %. The lowest sum of squares and mean deviation among the literature correlationswas given by the equation of Wen and Yu (1966).
The Setiadi's (1989) correlation for non-spherical particles appeared to predict the bed voidage of theanaerobic f1uidised-bed reactor satisfactorily. The mean deviation ofthe correlation was less than 2%. Thus,the correlation of Setiadi (1989) is proposed as an alternative for predicting the bed voidage of biologicalf1uidised-bed systems.
188 T.SETIADI
Bed expansion correlation foc !l fluidised-bed bio!'CactQC
All the correlations proposed in the literature to predict the bed voidage of fluidised-bed bioreactors werespecifically valid for their own data. No attempt has been made to test the applicability of the correlations todifferent sets of data. Therefore, in this study an attempt was made to compare the available data on bedvoidage of fluidised-bed bioreactor with predicted values from different correlations (Richardson and Zaki,1954; Wen and Yu, 1966; Hermanowicz and Gancznrczyk, 1983; Mulcahy and Shieh, 1987; Setiadi, 1989).Two published sets of data available for biological denitrification systems were used (Ngian and Martin,19110 and Timmermans and van Haute, 1984).
0.9 .----...,-----r-----,.----.....,
0.8
0.6
'"
BIOFILM THICKNESSo = 2.05 J.Lrn• = 6.10 J.Lrnt:l = 11.3 J.Lffi... "" 15,2 IJ.rn
0.5 L- oi- J.- ..L-__--I
0.0 0.1 0.2 0.3 0.4LIQUID SUPERFICIAL VELOCITY (em/e)
Figure 4. Bed voldage as a function of liquid superficial velocity.Comparison of bed expansion correlations topresent study data.
Table 3. Sum of squares ond mean deviation of bed voidage for the present study data
Correlations
Richardson Wen and Yu Hermanowicz Mu!cahy& Setiadiand Zaki (1954) (1966) & Ganczarczyk (1983) Shieh (1987) (1989)
I.S. 0.23 0.05 0.22 1.05 0.019
M.D. (%) 11.S S.OO 11.4 25.7 1.1
U.· sum ofsquares.M.D.· mean deviation (%). t [I (Eca!· Eexp) I/eexp]/n"100 %.
n· number ofdata points.
Predicting bed expansion of an anaerobic tluidised-bed bioreactor 189
The available data found in the literature were not readily in the fonn of a bed voidage/liquid velocityrelationship. The data of Ngian and Martin (1980) were given in expanded bed height versus liquidsuperficial velocity. However, this was easily transfonned to bed voidage/liquid velocity fonn usingequation 2. The number of data points from this paper was 84 with biofilm thickness up to 70 ~m.
0.9 r-------~-----,.....----___,EXPERIMENTAL DATABIOFILM THICKNESS 11.3 J.Lrn
(1)
0.8
1'0:1 ·0.7~~Q....o>Qf;&1 0.6l:Q
0.5
........
............................... ,. ....... 0",.••....",
,. -..... . ... " ..'
.. •.....".0"
, ..,.
," / ../ CURVE 1 MULCAHY &c SHIEH (1967)/./ CURVE 2 SETlADI (1989)
.. ··'·CURVE 3 RICHARDSON &: ZAKI (1954). HERMANOWICZ &c GANCZARCZYK (1983)
CURVE 4 WEN &c YU (1966)
0.1 0.2 0.3UQUID SUPERFICIAL VELOCITY (em/a)
0.4 '-- --11-- --" --'
0.0
Figure S, The comparison of experimental data and predicted values of bed voidage
The data of Timmennans and van Haute (1984) had biofUm thickness up to 500 Ilm with a number of datapoint" of 40. They were presented in terms of biomass concentration. Nevertheless, the biomassconcentration is related to the bed voidage, as follows (Shieh et al., 1981):
(4)
where biomass concentrationbiofilm dry densitydiameter of support particlediameter of bioparticle.
The third group of data wa." from the present study for an anaerobic fluidised-bed bioreactor (FBR). Thenumber of data points from the present study was 36. The three groups of data, therefore, were used toevaluate the applicability of the correlations. The evaluation was done by calculating mean deviation (%)between predicted value and experimental data and this is presented in Table 4. This shows that the highestmean deviation for total data was from the correlation of Mulcahy and Shieh (1987), followed those of byRichardson and Zaki (1954), Wen and Yu (1966), Hermanowicz and Ganczartzyk (1983) and Setiadi(1989). Each correlation is discussed in this section.
190 T.SETlADI
From Table 4. it can be seen that for the data of Ngian and Martin (1980). the correlation of Mulcahy andShieh (1987) had the highest mean deviation. A similar finding was also observed for the data ofTimmermans and van Haute (1984) and this study. The mean deviation for all of the data was just below30%. The explanation for the high deviation of the correlation from the experimental data is not clear. Theprobable reasons are the differences in biofilm thickness and the different techniques in the determination ofbed voidage. The biontm thickness. anyhow. was not an issue. since the data of Timmermans and van Haute(1984) had a range of biofilm thickness of 50-500 J.l.m being totally in the range of the correlation ofMulcahy and Shieh (1987). Nevertheless. the mean deviation was still very high: it was just below 50%. Theother reason was the different technique in the determination of bed voidage. However. justification of themethods cannot be made so far, because in the present study only the method of Ngian and Martin (1980)wa.~ used to calculate the bed voidage. Therefore. a further study of the different methods of assessing bedvoidage is recommended.
Table 4 also shows that the spherical particle equation of Richardson and Zaki (1954) gave a mean deviationof 12.1%. 18% and 11.5% for the data of Ngian and Martin (1980), Timmermans and van Haute (1984), andthis study. respectively. The mean deviation for the total data was 13.5%. The correlations of Wen and Yu(1966) gave a lower mean deviation than those of Richardson and Zaki (1954) for the data of Ngian andMartin (1960) and Timmermans and van Haute (1984), but a higher mean deviation for the data of thisstudy. For the total data, the mean deviation was 10.1%.
The lowest mean deviation for total data among the published correlations was given by the correlation ofHermanowicz and Ganczarczyk (1983). The correlation gave the lowest mean deviation for the data ofNgian and Martin (1960) and for the data of Timmermans and van Haute (1984). But it gave a higher meandeviation than the correlations of Wen and Yu (1966) and Richardson and Zaki (1954) for this study data.For the total data, it had a mean deviation of 9.2%.
In contrast, the Setiadi's (1989) correlation had a slightly higher mean deviation than those of Hermanowiczand Ganczarczyk (1983) for the data of Ngian and Martin (1980) and Timmermans and van Haute (1984).But it predicted well the bed voidage of anaerobic fluidised-bed experiments. Furthermore, the correlation ofSetiadi (1989) gave the lowest mean deviation for the total data with a number of data of 160 which was7.5%.
Table 4. Comparison of experimental and calculated value different correlations of bed voidage for differentset of data
Mean Deviation (%)Experimental data of
Ngian & Martin(1980)
Timmermans This study& van Haute (1984)
Total data
Correlations
1. Richardson ~
and Zaki (1954) 12.1 18.0 11.5 13.52. Wen and Yu (1966) 7.6 19.5 5.0 10.13.lIermanowicz
and Ganczarczyk (1983) 5.9 13.8 11.6 9.24. Mulcahy and Shieh (1987) 22.3 49.6 25.7 29.9S. Setiadi (1989) 6.9 14.1 1.7 7.5
Predicting bed expansion of an anaerobic fluidised-bed bioreactor 191
In summary, the correlation of Mulcahy and Shieh (1987) predicted much higher bed voidage than thoseexperimentally measured. The spherical correlation of Richardson and Zaki (1954) always gave a meandeviation of more than 10%. In contrast the other correlations predicted the experimental data reasonablywell, since the mean deviations for total data were always less than 10.5%. However, the correlation of Wenand Yu (1966) had a high mean deviation for Timmermans and van Haute (1984), it was just below 20%.The correlation of Hermanowicz and Ganczarczyk (1983) and Setiadi (1989) had a mean deviation for thetotal data less than 9.5% with the mean deviation for every set of data less than 15%. However, thecorrelation of Setiadi (1989) predicted the bed voidage of anaerobic fluidised-bed bioreactors with betteraccuracy than any previously published correlations.
CONCLUSIONS
1. The wet density of biofilm of anaerobic fluidised-bed for wastewater treatment was found to be 1.09g1cm3• It was not much different from that of biofilm in a denitrification (anoxic) system.2. The correlation of Setiadi (1989) predicted the bed expansion of anaerobic fluidised-bed bioreactors withbetter accuracy than any previously published correlations.
ACKNOWLEDGEMENT
The author wishes to acknowledge Dr. V. F. Larsen from the University of Strathclyde, Glasgow, UK for hisguidance and advice throughout the course of the study. The author is also grateful to the Commitee of ViceChancellors and Principals of the Universities of the United Kingdom, the University of Strathclyde, and theIndonesian Government for financial support.
REFERENCES
Chen, S. J., Li C. T., Shieh, W. K. (1985). Performance evaluation of the anaerobic fluidized bed system: I. Substrate utilizationand gas production. J. Chem. Tech. Biotechnol., 358, 101·109.
Cleasby, J. L., Fan, K. S. (1981). Predicting fluidization and expansion ofmter media. J. Enll. Eng Dill, ASCE. 107, No. EEJ, 455471.
Davison, B. H. (1988). Dispersion and holdup in a three phase fluidized bed bioreactor. Proc. 10th Symposium on Biotechnologyfor Fuels and Chemicals, Gatlinburg, Tennessee, May 16-20.
Hennanowicz, S. W., Ganczarczyk, J. J. (1983). Some fluidization characteristics of biological beds. Biottchnol. Bioeng.. 25,1321·1330.
lza, J. (1991). Fluidized bed reactors for anaerobic wastewater treatmenL Wat. Sci. Tech., 24, 109-132.Mulcahy, L. T., Shieh, W. K. (1987). Fluidization and reactor biomass characteristics of the denitrification fluidized bed biofiIm
reactor. Wat. Res., 21, 451458.Ngian,·K. F., Martin, W. R. B. (1980). Bed expansion characteristics of liquid fluidized particles with attached mierobial growth.
Riotec/moL Bioeng.. 22, 1843·1856.Richardson, J. F., Z1kl, w. N. (1954). Sedimentation and fluidisation part I. Trans. Instn. Chern. Eng., 32, 35-53.Setilld~ T. (1989). liquid mixinR and bed expansion in a jluidised·bed reactor with particular reference to gas producing
anaerobic systems., PbD.thesis, University of StraUlclyde, Glasgow.Shieh. W. K., Sutton, P. M.. Kos, P. (1981). Predicting reactor biomass concentration in a fluidized system, J.WPCF, 53, 1574·
1584.Tunmenn:ms, p.. van Haute, A. (1984). Biomass hold up in a fluidized bed reactor. App. MicrobiaL Biotech-nol.. 19,3643.Wen, C. Y., Yu, Y. H. (1966). Mechanics of fluidization. Chem. Eng. Progress Symp. Series, 62,100-111.


