Embed Size (px)
Citation preview

Atmospheric Environment 37 (2003) 3115–3124
.
Predicting the NO3 radical tropospheric degradability oforganic pollutants by theoretical molecular descriptors
P. Gramatica*, P. Pilutti, E. Papa
Department of Structural and Functional Biology, QSAR and Environmental Chemistry, Research Unit, University of Insubria,
via Dunant 3, 21100 Varese, Italy
Received 6 January 2003; received in revised form 12 March 2003; accepted 21 March 2003
Abstract
The rate constant for the nighttime degradation of 114 heterogeneous organic compounds, through reaction with
nitrate radicals in the troposphere, is predicted here by quantitative structure–activity relationships modelling. The
multiple linear regression approach is based on a variety of theoretical molecular descriptors, selected by the genetic
algorithms-variable subset selection procedure. The proposed model, calculated on a limited subset of compounds
selected by a D-optimal experimental design and checked for reliability and robustness, has good predictivity, verified
by internal (Q2LMO ¼ 89:6%) and ‘‘external’’ validation (Q2
EXT ¼ 95:7%). The model applicability domain was always
verified by the leverage approach in order to propose reliable predicted data. The average root-mean square error for
the prediction of log kNO3 was 0.57, similar to (and even smaller than) the typical experimental error range.
r 2003 Elsevier Science Ltd. All rights reserved.
Keywords: QSAR; Theoretical molecular descriptors; External validation; Prediction; Nitrate radical degradation
1. Introduction
The troposphere is the atmospheric layer into which
large numbers of chemicals of both anthropogenic and
biogenic origin are emitted, by either direct emission or
volatilisation from soils and aquatic systems. Such
chemicals are removed by physical processes (wet and
dry depositions), chemical degradation processes such as
photolysis, and by reaction with reactive atmospheric
compounds like OH radicals and ozone during the
daytime and NO3 radicals at night (G .usten, 1997). These
night-time NO3 free radical reactions are secondary, but
relevant degradative processes that remove trace gases
and organic pollutants from the troposphere, supple-
menting the more relevant daytime removal initiated by
OH radical reactions (Atkinson, 2000).
It is also to be noted that nitro-substituted com-
pounds occur as industrial products in a wide
range of use patterns, and as secondary pollutants from
reactions with hydroxyl radicals (OH�) and nitrate
radicals ðNO�3 Þ in an atmosphere under natural NOx
conditions; thus such compounds form an im-
portant class of pollutant chemicals. The presence of
various nitro-substituted chemicals in environmental
samples is a legitimate cause for concern because some
(nitro-arenes, nitro-PAH and their amino derivatives)
are known to be toxic (Wang et al., 2002) and
carcinogenic (Tejada et al., 1986), thus, there is a need
to identify and quantify these compounds to assess their
potential health hazard and their impact on the
environment. In the past two decades considerable
effort has been put into locating the source and
occurrence of these reaction products, studying their
chemical and physical properties, investigating their
mutagenic and carcinogenic activity (Jinhui and Lee,
2000), and developing new analytical methods for their
identification and quantification.
ARTICLE IN PRESS
*Corresponding author. Fax: +39-0332-421554.
E-mail address: [email protected]
(P. Gramatica).
URL: http://dipbsf.uninsubria.it/qsar.
1352-2310/03/$ - see front matter r 2003 Elsevier Science Ltd. All rights reserved.
doi:10.1016/S1352-2310(03)00293-0

The measurement of rate constants in the gas phase is
limited due to the difficulty of the necessary experiments
(many industrial organic chemicals have very low
volatility) that are, furthermore, both costly and time-
consuming. Thus, reliable risk assessment calls for
prediction methods that allow a quick estimation of
the abiotic degradability of chemicals. This need is
particularly urgent in view of the growing number of
organic compounds of anthropogenic origin, and such
methods could lead to the development of new safer
organic chemicals. One of the most successful ap-
proaches to the prediction of chemical properties,
starting only from molecular structure information, is
quantitative structure–activity/property relationships
modeling (QSAR/QSPR).
Some QSAR studies on predicting oxidation rate
constants with OH and NO3 radicals have been
published recently (Sabljic and G .usten, 1990; M .uller
and Klein, 1991; Klamt, 1996; Medven et al., 1996;
Bakken and Jurs, 1999; Gramatica et al., 1999; G .usten,
1999) but, while good models for OH� rate constants are
proposed for various chemical classes, the modelling of
reactivity with NO3 radicals is more problematic. All the
published QSAR models were obtained on separate
training sets for aliphatic and aromatic compounds: the
rate constants of aliphatic chemicals with NO3 radicals
were predicted successfully (Sabljic and G .usten, 1990;
M .uller and Klein, 1991; Gramatica et al., 1999),
however the models for aromatic compounds do not
appear to be so satisfactory, often being only local
models built on very small training sets and, conse-
quently, without any reasonable applicability for data
prediction.
This paper proposes a new QSAR model for
predicting oxidation rate constants (kNO3) for a hetero-
geneous set containing both aliphatic and aromatic
compounds (114 chemicals), based on theoretical
molecular descriptors. In order to fill the data gaps
and produce reliable predicted data, applicable to the
risk assessment of large groups of heterogeneous
chemicals, the model prediction performances and the
chemical domain are considered of primary importance
(Tropsha et al., 2003): thus, internal and ‘‘external’’
validation procedures and the leverage approach have
been applied. The molecular descriptors selected in the
model encode the structural features of the chemicals
related to reactivity with NO3 radicals.
2. Methods
2.1. Experimental data
The experimental data shown in Table 1 are the
degradation rate constants, due to NO3 radicals, of 114
heterogeneous organic compounds reported in the
literature (Atkinson, 1991; EPI Suite, 2001). The
selected data pertain to reactions at 25�C and
101.3 kPa; all the rate constants, reported in cm3 s�1
molecule�1, have been transformed to logarithmic units
and multiplied by �1 to obtain positive values.
2.2. Molecular descriptors
The molecular descriptors for the given compounds
were mainly calculated using DRAGON software
(Todeschini et al., 2002a) on the minimal energy
conformations determined by the MM+ method
(HYPERCHEM, 1995). A total of 1.150 molecular
descriptors of differing types were used to describe
compound chemical diversity. The descriptor typology
is: (a) 0D-47 constitutional (atom and group counts); (b)
1D-121 functional groups, (c) 1D-120 atom centred
fragments, (d) 1D-3 empirical; (e) 2D-262 topological,
(f) 2D-64 BCUTs, (g) 2D-21 Galvez Indices from the
adjacency matrix, (h) 2D-21 walk counts, (i) 2D-96
various autocorrelations from the molecular graph, (l)
3D-41 Randic molecular profiles from the geometry
matrix; (m) 3D-58 geometrical, (n) 3D-99 WHIMs
(Todeschini and Gramatica, 1997a, b) and (o) 197
recently proposed GETAWAY descriptors (Consonni
et al., 2002). The meaning of these molecular descrip-
tors, and the calculation procedure, is summarized in the
software DRAGON (free download from the web,
Todeschini et al., 2002a), and is explained in detail with
the related literature references in the Handbook of
Molecular Descriptors by Todeschini and Consonni
(2000). In addition, in order to provide energy informa-
tion, five quantum-chemical descriptors (highest occu-
pied molecular orbital (HOMO), lowest unoccupied
molecular orbital (LUMO) energies, HOMO–LUMO
gap, ionisation potential and heat of formation),
calculated by the semi-empirical molecular orbital
program MOPAC (PM3 Hamiltonian for geometry
optimisation) (CHEM 3D, 1997) are always added as
electronic descriptors. The values of the selected
descriptors for the studied compounds are reported in
Table 1.
Constant values and descriptors found to be corre-
lated pair-wise were excluded in a pre-reduction step
(one of any two descriptors with a K correlation greater
than 0.95 was removed to reduce redundant informa-
tion), thus 393 molecular descriptors underwent sub-
sequent variable selection.
2.3. Chemometric methods
Data exploration by principal component analysis of
molecular descriptors was performed on autoscaled data
by the SCAN (1995).
To have compounds for ‘‘external’’ validation, the
available set of 114 chemicals was split into a training set
ARTICLE IN PRESSP. Gramatica et al. / Atmospheric Environment 37 (2003) 3115–31243116

ARTICLE IN PRESS
Table 1
List of studied chemicals (test set in bold), experimental, predicted -log kNO3; residuals (r) and descriptor values
ID Chemicals CAS �log kNO3exp. �log kNO3
pred. r HOMO nBnz MATS1m
1 Formaldehyde 50-00-0 15.23 16.30 1.07 �10.63 0 0.96
2 Methanol 67-56-1 15.68 15.99 0.31 �11.14 0 0.88
3 2-Propanol 67-63-0 14.64 15.44 0.80 �11.04 0 0.87
4 Ethane 74-84-0 17.10 16.59 �0.51 �11.98 0 0.81
5 Ethene 74-85-1 15.91 14.62 �1.29 �10.64 0 0.87
6 Ethyne 74-86-2 16.29 16.89 0.60 �11.01 0 0.94
7 Chloromethane 74-87-3 16.51 16.26 �0.25 �10.48 0 0.97
8 Methanethiol 74-93-1 12.00 11.72 �0.28 �9.21 0 0.90
9 1-Propyne 74-99-7 15.76 15.94 0.18 �10.89 0 0.91
10 1-Chloroethene 75-01-4 15.37 14.83 �0.54 �9.84 0 0.98
11 Acetaldehyde 75-07-0 14.61 15.79 1.18 �10.70 0 0.92
12 Ethanethiol 75-08-1 11.92 11.62 �0.30 �9.25 0 0.89
13 Dichloromethane 75-09-2 17.30 17.33 0.03 �10.58 0 1.01
14 Dimethyl sulfide 75-18-3 12.00 10.85 �1.15 �8.88 0 0.90
15 2-Methylpropane 75-28-5 16.01 15.99 �0.02 �11.59 0 0.83
16 1,1-Dichloroethene 75-35-4 14.91 15.30 0.39 �9.74 0 1.01
17 2-Methylbutane 78-78-4 15.80 15.85 0.05 �11.50 0 0.83
18 2-Methyl-1,3-butadiene 78-79-5 12.23 11.65 �0.58 �9.31 0 0.88
19 1,1,2-Trichloroethene 79-01-6 15.55 14.77 �0.78 �9.38 0 1.03
20 2,3-Dimethylbutane 79-29-8 15.39 15.43 0.04 �11.30 0 0.84
21 Camphene 79-92-5 12.18 12.84 0.66 �9.92 0 0.87
22 a-Pinene 80-56-8 11.24 11.35 0.11 �9.30 0 0.87
23 b-Caryophyllene 87-44-5 10.72 11.75 1.03 �9.45 0 0.87
24 1,2-Dimethylbenzene 95-47-6 15.42 15.32 �0.10 �9.29 1 0.90
25 1,2,4-Trimethylbenzene 95-63-6 14.74 14.71 �0.03 �9.08 1 0.89
26 3-Methylpentane 96-14-0 15.69 15.78 0.09 �11.45 0 0.84
27 a-Phellandrene 99-83-2 10.07 10.35 0.28 �8.85 0 0.88
28 c-Terpinene 99-85-4 10.53 10.72 0.19 �9.00 0 0.88
29 a-Terpinene 99-86-5 9.74 9.80 0.06 �8.62 0 0.88
30 1,4-Methylisopropylbenzene 99-87-6 15.00 15.03 0.03 �9.26 1 0.89
31 Methoxybenzene 100-66-3 15.68 15.34 �0.34 �9.11 1 0.92
32 1,3,5-Trimethylbenzene 108-67-8 15.10 15.15 0.05 �9.27 1 0.89
33 Ethyl propionate 105-37-3 16.46 16.95 0.49 �11.36 0 0.90
34 1,4-Dimethylbenzene 106-42-3 15.34 15.07 �0.27 �9.18 1 0.90
35 n-Butane 106-97-8 16.18 15.42 �0.76 �11.35 0 0.83
36 1-Butene 106-98-9 13.91 13.17 �0.74 �10.15 0 0.86
37 1,3-Butadiene 106-99-0 13.01 12.21 �0.80 �9.47 0 0.89
38 1-Butyne 107-00-6 15.34 15.32 �0.02 �10.77 0 0.89
39 Acrolein 107-02-8 14.96 16.07 1.11 �10.69 0 0.94
40 3-Chloro-1-propene 107-05-1 15.27 15.28 0.01 �10.23 0 0.95
41 Methyl formate 107-31-3 17.52 17.20 �0.32 �11.15 0 0.94
42 2-Methylpentane 107-83-5 15.69 15.30 �0.39 �11.25 0 0.84
43 2,4-Dimethylpentane 108-08-7 15.84 15.34 �0.50 �11.25 0 0.84
44 1,3-Dimethylbenzene 108-38-3 15.63 15.37 �0.26 �9.31 1 0.90
45 1,3,5-Trimethylbenzene 108-67-8 15.10 15.15 0.05 �9.27 1 0.89
46 Methylbenzene 108-88-3 16.18 15.84 �0.34 �9.44 1 0.91
47 1-Propylacetate 109-60-4 16.30 16.68 0.38 �11.25 0 0.90
48 n-Pentane 109-66-0 16.09 15.37 �0.72 �11.30 0 0.83
49 Ethyl formate 109-94-4 16.70 16.89 0.19 �11.16 0 0.92
50 Pyrrole 109-97-7 10.34 11.41 1.07 �8.93 0 0.92
51 Tetrahydrofuran 109-99-9 14.31 13.90 �0.41 �10.27 0 0.88
52 Furan 110-00-9 11.84 12.89 1.05 �9.38 0 0.94
53 Thiophene 110-02-1 13.41 13.45 0.04 �9.54 0 0.95
54 n-Hexane 110-54-3 15.98 15.36 �0.62 �11.28 0 0.84
55 Propyl formate 110-74-7 16.27 16.65 0.38 �11.16 0 0.91
56 Cyclohexane 110-82-7 15.87 15.68 �0.19 �11.29 0 0.85
57 Cyclohexene 110-83-8 12.28 12.06 �0.22 �9.59 0 0.87
P. Gramatica et al. / Atmospheric Environment 37 (2003) 3115–3124 3117

ARTICLE IN PRESS
Table 1 (continued)
ID Chemicals CAS �log kNO3exp. �log kNO3
pred. r HOMO nBnz MATS1m
58 Pyridine 110-86-1 15.82 14.53 �1.29 �10.10 0 0.93
59 n-Octane 111-65-9 15.74 15.43 �0.31 �11.27 0 0.84
60 n-Nonane 111-84-2 15.62 15.46 �0.16 �11.28 0 0.84
61 1-Propene 115-07-1 14.13 13.15 �0.98 �10.11 0 0.86
62 Dimethyl ether 115-10-6 14.52 14.74 0.22 �10.69 0 0.87
63 2-Methyl-1-propene 115-11-7 12.50 12.34 �0.16 �9.80 0 0.86
64 Tetralin 119-64-2 14.06 15.23 1.17 �9.25 1 0.90
65 Bicyclo(2,2,1)-2,5-heptadiene 121-46-0 11.99 12.84 0.85 �9.66 0 0.90
66 N,N-Dimetyl-aniline 121-69-7 15.70 15.11 �0.59 �9.18 1 0.90
67 Myrcene 123-35-3 10.98 11.58 0.60 �9.32 0 0.88
68 Crotonaldehyde 123-73-9 14.29 15.18 0.89 �10.48 0 0.92
69 n-Decane 124-18-5 15.59 15.48 �0.11 �11.28 0 0.84
70 b-Pinene 127-91-3 11.63 12.32 0.69 �9.70 0 0.87
71 Ethyl acetate 141-78-6 16.85 16.85 0.00 �11.24 0 0.91
72 Cyclopentene 142-29-0 12.33 11.98 �0.35 �9.53 0 0.88
73 n-Heptane 142-82-5 15.86 15.39 �0.47 �11.27 0 0.84
74 cis-1,2-Dichloroethene 156-59-2 15.86 14.69 �1.17 �9.49 0 1.01
75 trans-1,2-Dichloroethene 156-60-5 15.97 14.75 �1.22 �9.52 0 1.01
76 Azulene 275-51-4 9.41 9.84 0.43 �8.17 0 0.93
77 Diethyl sulfide 352-93-2 11.38 10.50 �0.88 �8.86 0 0.88
78 2,2,3-Trimethylbutane 464-06-2 15.65 15.54 �0.11 �11.33 0 0.84
79 Longifolene 475-20-7 12.17 12.58 0.41 �9.82 0 0.87
80 1,4-Benzodioxan 493-09-4 15.22 15.39 0.17 �9.02 1 0.93
81 Bicyclo(2,2,1)-2-heptene 498-66-8 12.61 12.74 0.13 �9.78 0 0.88
82 2-Butyne 503-17-3 13.17 14.31 1.14 �10.35 0 0.89
83 2-Methyl-2-butene 513-35-9 11.02 11.31 0.29 �9.39 0 0.86
84 2,3-Dimethyl-1,3-butadiene 513-81-5 11.64 11.34 �0.30 �9.23 0 0.88
85 1,2,3-Trimethylbenzene 526-73-8 14.73 15.12 0.39 �9.25 1 0.89
86 2,2,4-Trimethylpentane 540-84-1 16.13 15.35 �0.78 �11.24 0 0.84
87 1,3,5-Cycloheptatriene 544-25-2 11.92 11.26 �0.66 �8.95 0 0.91
88 Methyl propionate 554-12-1 16.48 16.67 0.19 �11.17 0 0.91
89 2-Carene 554-61-0 10.73 11.22 0.49 �9.24 0 0.87
90 2,3-Dimethyl-2-butene 563-79-1 10.24 10.69 0.45 �9.15 0 0.86
91 Terpinolene 586-62-9 10.02 10.96 0.94 �9.10 0 0.88
92 cis-2-Butene 590-18-1 12.46 12.00 �0.46 �9.66 0 0.86
93 1-Methylcyclohexene 591-49-1 10.77 11.36 0.59 �9.33 0 0.87
94 1,3-Cyclohexadiene 592-57-4 10.91 10.91 0.00 �8.92 0 0.89
95 1,3-Ethylmethylbenzene 620-14-4 15.36 15.36 0.00 �9.35 1 0.89
96 1,4-Ethylmethylbenzene 622-96-8 15.21 15.11 �0.10 �9.25 1 0.89
97 trans-2-Butene 624-64-6 12.42 11.99 �0.43 �9.66 0 0.86
98 1-Pentyne 627-19-0 15.12 15.12 0.00 �10.76 0 0.88
99 1,4-Cyclohexadiene 628-41-1 12.27 11.56 �0.71 �9.19 0 0.89
100 Cycloheptene 628-92-2 12.32 12.30 �0.02 �9.73 0 0.87
101 1-Hexyne 693-02-7 14.80 14.80 0.00 �10.68 0 0.88
102 Bicyclo(2,2,2)-2-octene 931-64-6 12.84 12.94 0.10 �9.91 0 0.88
103 cis-1,3-Pentadiene 1574-41-0 11.85 11.34 �0.51 �9.18 0 0.88
104 trans-1,3-Pentadiene 2004-70-8 11.80 11.31 �0.49 �9.17 0 0.88
105 cis-Ocimene 3338-55-4 10.62 10.66 0.04 �8.94 0 0.88
106 Sabinene 3387-41-5 11.00 12.18 1.18 �9.64 0 0.87
107 trans-Ocimene 3779-61-1 10.98 10.91 �0.07 �9.05 0 0.88
108 1,3-Cycloheptadiene 4054-38-0 11.19 11.70 0.51 �9.31 0 0.89
109 trans-trans-2,4-Hexadiene 5194-51-4 10.80 10.59 �0.21 �8.92 0 0.88
110 Limonene 5989-27-5 10.95 11.48 0.53 �9.32 0 0.88
111 a-Humulene 6753-98-6 10.46 11.51 1.05 �9.33 0 0.88
112 3-Carene 13466-78-9 11.09 11.43 0.34 �9.33 0 0.87
113 Ocimene 13877-91-3 10.66 10.73 0.07 �8.97 0 0.88
114 Crotonaldehyde 4170-30-3 14.29 15.18 0.89 �10.48 0 0.92
P. Gramatica et al. / Atmospheric Environment 37 (2003) 3115–31243118

and an ‘‘external’’ validation set. The training set
selection was performed by the package DOLPHIN
(Todeschini and Mauri, 2002) using a D-optimal
experimental design (Marengo and Todeschini, 1992).
Multiple linear regression analysis and variable
selection were performed by the software Moby Digs
(Todeschini et al., 2002b) using the ordinary least-
squares regression (OLS) method; the genetic algo-
rithms-variable subset selection (GA-VSS) method
(Leardi et al., 1992) was applied to the input set of
molecular descriptors in order to set out the most
relevant variables in modelling the response of the
training set chemicals.
All the calculations were performed by maximising
the cross-validated R2 (Q2; leave-one-out), applying the
QUIK rule (Todeschini et al., 1999); the acceptable
models are only those with a global correlation of
[X þ y] block (KXY ) greater than the global correlation
of the X block (KXX ) variable, X being the molecular
descriptors and y the response variable. The collinearity
in the original set of molecular descriptors results in
many similar models that more or less yield the same
predictive power (in MOBY-DIGS software 100 models
of different dimensionality). Therefore, when there were
models of similar performance those with higher
DKðKXY � KXX Þ were selected, and, on these, stronger
validation proceeded via the leave-many-out validation
(Q2LMO) and response permutation testing (Y -scram-
bling). Standard deviation error in prediction (SDEP),
standard deviation error in calculation (SDEC), stan-
dard error of estimate (s), the F -value of the Fisher, the
inter-correlation of the selected descriptors (KXX ) and
the correlation of the X block with response (KXY ) are
also reported, together with the coefficient of determina-
tion (R2).
The predictive power of the regression model devel-
oped on the selected training set is estimated on the
predictions of validation set chemicals, by the external
Q2 that is defined (Shi et al., 2001):
Q2ext ¼ 1 �
Ptesti¼1ðyi � #yiÞ
2
Ptesti¼1ðyi � %ytrÞ
2;
where yi and #yi are respectively the measured and
predicted (over the validation set) values of the
dependent variable, and %ytr the averaged value of the
dependent variable for the training set; the summations
cover all the compounds in the validation set.
The presence of outliers (i.e. compounds with cross-
validated standardized residuals greater than two
standard deviation units), and chemicals very influential
in determining model parameters (i.e. compounds with
high leverage value (h) (Atkinson, 1985) greater than
3p0=n; where p0 is the number of model variables plus
one, and n the number of the objects used to calculate
the model) were verified by the Williams plot (SCAN,
1995).
3. Results and discussion
This work proposes a new QSAR model of the
reaction rate constant of nitrate radical (kNO3) for an
heterogeneous set containing both aliphatic and aro-
matic chemicals, without separating these two classes as
in previous modelling approaches.
In order to find a relationship between kNO3 and the
structural features of the chemicals, we calculated a wide
set of theoretical molecular descriptors, using the
software DRAGON (Todeschini et al., 2002a) for the
studied chemicals. Information regarding the energetics
of the studied reaction was also taken into account by
adding five quantum-chemical descriptors from among
those most commonly used (HOMO, LUMO, HOMO-
LUMO gap, ionisation potential and heat of formation).
The great advantage of theoretical descriptors is that
they are also calculable homogeneously for not yet
synthesised chemicals. As modelling input variables, we
used many different types of molecular descriptors; this
was to give us the possibility of capturing all the relevant
structural features really related to response.
The ultimate objective of developing models for the
prediction of degradation rate constants is to obtain
knowledge of the reactivity with NO3 radical of
substances not yet tested or for which reliable experi-
mental data are not available. Prediction reliability can
only be achieved through regression models that have
been validated both internally and externally (Tropsha
et al., 2003). The effective predictive capability of a
model is evaluated by an ‘‘external’’ validation proce-
dure, i.e. by comparing the predictions made for
molecules excluded from the model generation step with
their actual experimental activity. To have compounds
for use in external validation, the available set of 114
chemicals was split into a training set and an ‘‘external’’
validation set. The best splitting of the data set was
realised by the experimental design procedure, using the
software DOLPHIN of Todeschini and Mauri (2002).
Experimental Design (here D-optimal design, Marengo
and Todeschini, 1992) provides a strategy for selecting
the most dissimilar molecular structures in a data set,
taking into account the complete structural information
and also the response value. This guarantees that the
chemical composition of the training set is representative
of the structural diversity of the validation set and that
the entire range of response is represented.
Two different splittings were performed using 393
molecular descriptors and response: (a) 67% of the
chemicals in the training set (77 chemicals) and 33% in
the validation set (37 chemicals), and (b) 50% of the
chemicals in each set. Fig. 1 shows the principal
ARTICLE IN PRESSP. Gramatica et al. / Atmospheric Environment 37 (2003) 3115–3124 3119

components analysis of the data set, represented by the
molecular descriptors and split as in (a). In this view of
the first two principal components, explaining 38.2% of
the structural variance, the data set appears split into
two representative sets thus confirming the efficiency of
the applied experimental design in the splitting: in fact
the training set consists of representatives of the more
dissimilar structures.
Note that the validation chemicals are all included in
the chemical domain of the training set. In the data set
b-caryophyllene (23), longifolene (79) and a-humulene
(111) appear to be the most structurally diverse
chemicals, and are correctly included in the training
set. Regression models deriving from such chemicals can
have a wider range of applicability with regard to
chemical domain.
Fig. 2 shows the response histogram in the training
and validation sets, highlighting that the entire range of
response is covered in both sets in a way that is quite
well balanced.
The range of the response in the training set is 9.41–
17.52 log unit ( %y ¼ 14:02), while the range of validation
set response is 9.74–16.85 log unit ( %y ¼ 13:37).
Given the correlation of all the calculated descriptors,
and the impossibility of performing multilinear regres-
sion, a variable selection procedure was needed to select
the predictive variables. Genetic algorithms were applied
to select, from among all the calculated descriptors, only
the best combinations of those descriptors most relevant
to the obtaining of models with the highest predictive
power of the nitrate radical rate constant. Genetic
Algorithms, a powerful tool applied in recent years to
optimise many decisional problems (Davis, 1991;
Devillers, 1996) were initially proposed by Leardi et al.
(1992) as a strategy for variable subset selection in
multivariate analysis. This strategy is now widely and
successfully applied (in various modified versions,
depending on the way of performing reproduction,
crossover, mutation, etc.) in QSAR approaches (Rogers
and Hopfinger, 1994; Kubinyi, 1994; Todeschini and
Gramatica, 1997a, b; Gramatica and Papa, 2003;
Gramatica et al., 1998, 1999, 2000, 2002, 2003) in which
a high number of molecular descriptors are used as X-
variables.
The application of Genetic Algorithms to the set of
393 molecular descriptors for each chemical, and the
related response, yielded a population of regression
models, ordered according to their decreasing predictive
performance, verified by Q2 with particular attention to
the collinearity of the selected molecular descriptors. In
fact, to avoid multicollinearity without, or with ‘‘appar-
ent’’, prediction power (chance correlation), the regres-
sions were calculated only for variable subsets with an
acceptable multivariate correlation with response, by
applying the QUIK rule (Q Under Influence of K)
(Todeschini et al., 1999).
In addition, attention must be paid to the danger of
overfitting and the possibility of overestimating model
predictivity by Q2 (Shao, 1993; Golbraikh and Tropsha,
2002). For this reason, the predictivity stability of the
models must be verified using the leave-many-out (Q2LMO)
procedure (repeated 5000 times with 25–50% of
randomly selected objects left out from the training set
at each step and then predicted by the model) as is
strongly recommended for QSAR modelling (Wold and
Eriksson, 1995; Shi et al., 2001). The robustness of the
proposed models and their predictivity is guaranteed by
the stability of the Q2LMO; even when 50% of the training
compounds are randomly left out. Good predictive
properties are also an indication that chance correlation
among the molecular descriptors and the studied
response has been avoided.
Proposed models are also checked for reliability and
robustness by permutation testing: new models are
recalculated for randomly reordered response (Y scram-
bling). Evidence that the proposed model is well
founded, and not just the result of chance correlation,
is provided by obtaining new models on the set with
randomised response that have significantly lower R2
and Q2 than the original model. Thus our proposed
QSAR model was subjected to the Y scrambling
procedure to verify that this condition had been
achieved.
Finally, for a stronger evaluation of model applic-
ability to new chemicals not used in the training set,
‘‘external’’ validation (verified by Q2EXT) is performed:
the regression model, developed on the selected training
set, is applied to predict the rate constant for the
molecules remaining in the study and included in the
validation set.
The best predictive model obtained from the first
splitting is:
�log kðNO3Þ ¼ � 28:7 � 2:40HOMO þ 3:41nBnz
þ 20:41MATS1m;
nðtrainingÞ ¼ 77; nðvalidationÞ ¼ 37;
R2 ¼ 91:2%; Q2 ¼ 90:3%;
Q2LMOð50%Þ ¼ 89:6%; Q2
ext ¼ 95:7%;
s ¼ 0:650; F ¼ 253:3; SDEP ¼ 0:666;
SDEC ¼ 0:633; Kxx ¼ 23:2%; Kxy ¼ 34:4%:
The regression line of the above-proposed model is
reported in Fig. 3 and the data predicted by this model
are reported in Table 1.
Ethene (5), pyridine (58), tetralin (64), cis- and trans-
1,2-dichloroethene (74 and 75) are the outliers in this
model (highlighted in Fig. 3), while there are no
influential chemicals with high leverage value. There
could be two explanations for the outliers, either (a) the
ARTICLE IN PRESSP. Gramatica et al. / Atmospheric Environment 37 (2003) 3115–31243120

experimental data were wrong, in some cases for
experimental difficulties due to low vapour pressure or
(b) the descriptors in the model failed to capture some
relevant structural feature present in these molecules and
absent in others. At this stage it is impossible to verify
either statement.
As no chemical in the validation set is an outlier or
influential, the data predicted by the model can be
considered reliable, also for chemicals not participating
in the model construction.
The root-mean squared (RMS) error for this model is
0.663 log units for the training set chemicals and
ARTICLE IN PRESS
PC1
PC
2
1
2
3
4
5
6
7
89
10
1112
13
14
15
16
17
18
19
20
2122
23 2425
26
27
282930
3132
33
34
35
363738
3940
41
4243
444546
47
48
49
50
51
52
53
54
55 56
57
58
59
60
61
62
63
64 65
66
67
68
69
70
71
72
73
74
75
76
7778
79 80
81
82
83
84
85
86
87
88
89
90
91
92
93
9495
96
97
98
99100
101
102
103104
105
106
107
108
109
110111
112
113
114
-20
-15
-10
-5
0
5
10
15
20
25
-35 -25 -15 -5 5 15 25
Training setTest set
Fig. 1. Principal component analysis of the structural descriptors (EV%=38.2%) for the data set chemicals splitted in training (�) and
test set (n) by experimental design (Marengo and Todeschini, 1992).
N o
f obs
serv
atio
ns
0
2
4
6
8
10
12
14
16
18
20
22
24
26
28
<= 9 (10,11] (12,13] (14,15] (16,17] > 18
Training setTest set
Fig. 2. Distribution of the response in the training and test chemicals.
P. Gramatica et al. / Atmospheric Environment 37 (2003) 3115–3124 3121
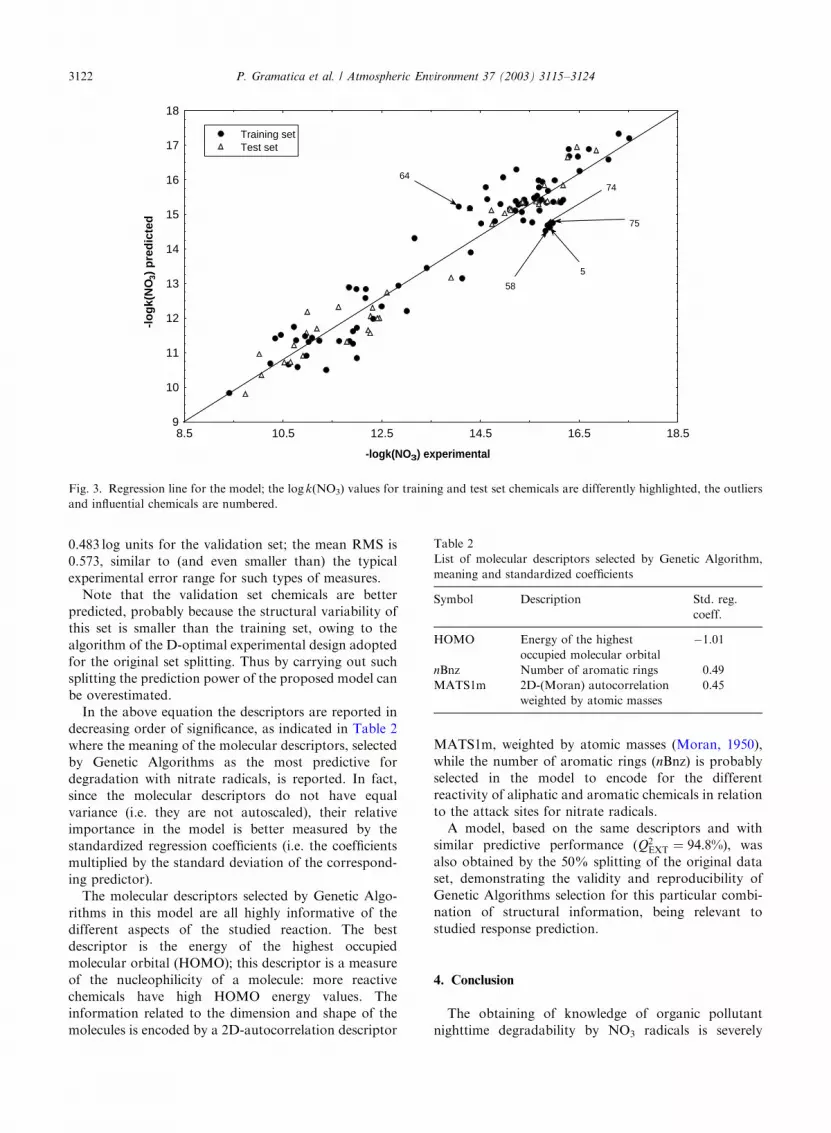
0.483 log units for the validation set; the mean RMS is
0.573, similar to (and even smaller than) the typical
experimental error range for such types of measures.
Note that the validation set chemicals are better
predicted, probably because the structural variability of
this set is smaller than the training set, owing to the
algorithm of the D-optimal experimental design adopted
for the original set splitting. Thus by carrying out such
splitting the prediction power of the proposed model can
be overestimated.
In the above equation the descriptors are reported in
decreasing order of significance, as indicated in Table 2
where the meaning of the molecular descriptors, selected
by Genetic Algorithms as the most predictive for
degradation with nitrate radicals, is reported. In fact,
since the molecular descriptors do not have equal
variance (i.e. they are not autoscaled), their relative
importance in the model is better measured by the
standardized regression coefficients (i.e. the coefficients
multiplied by the standard deviation of the correspond-
ing predictor).
The molecular descriptors selected by Genetic Algo-
rithms in this model are all highly informative of the
different aspects of the studied reaction. The best
descriptor is the energy of the highest occupied
molecular orbital (HOMO); this descriptor is a measure
of the nucleophilicity of a molecule: more reactive
chemicals have high HOMO energy values. The
information related to the dimension and shape of the
molecules is encoded by a 2D-autocorrelation descriptor
MATS1m, weighted by atomic masses (Moran, 1950),
while the number of aromatic rings (nBnz) is probably
selected in the model to encode for the different
reactivity of aliphatic and aromatic chemicals in relation
to the attack sites for nitrate radicals.
A model, based on the same descriptors and with
similar predictive performance (Q2EXT ¼ 94:8%), was
also obtained by the 50% splitting of the original data
set, demonstrating the validity and reproducibility of
Genetic Algorithms selection for this particular combi-
nation of structural information, being relevant to
studied response prediction.
4. Conclusion
The obtaining of knowledge of organic pollutant
nighttime degradability by NO3 radicals is severely
ARTICLE IN PRESS
-logk(NO3) experimental
-lo
gk(
NO
3) p
red
icte
d
9
10
11
12
13
14
15
16
17
18
8.5 10.5 12.5 14.5 16.5 18.5
Training setTest set
5
58
6474
75
Fig. 3. Regression line for the model; the log k(NO3) values for training and test set chemicals are differently highlighted, the outliers
and influential chemicals are numbered.
Table 2
List of molecular descriptors selected by Genetic Algorithm,
meaning and standardized coefficients
Symbol Description Std. reg.
coeff.
HOMO Energy of the highest
occupied molecular orbital
�1.01
nBnz Number of aromatic rings 0.49
MATS1m 2D-(Moran) autocorrelation
weighted by atomic masses
0.45
P. Gramatica et al. / Atmospheric Environment 37 (2003) 3115–31243122

hindered by the difficulty encountered in producing
experimental data for tropospheric reactions. Thus the
use of data predicted by QSAR models could overcome
this problem. ‘‘Ideal’’ QSAR models would be applic-
able throughout the chemical world, and would use
independent variables that are easily and homoge-
neously calculable for each chemical. Nevertheless, such
models must always be verified for prediction perfor-
mance. This paper proposes a new QSAR model based
on theoretical molecular descriptors that take into
account the different features of chemical structures
related to reactivity with nitrate radicals. The model is
validated for its predictivity on an ‘‘external’’ validation
set obtained by splitting the original data set by
experimental design. The possibility of having molecular
descriptors available for all chemicals (even those not yet
synthesized), the high prediction performance of a
model applicable to a wide typology of aromatic and
aliphatic chemicals, and the possibility of verifying the
chemical domain of applicability by the leverage
approach, makes this a useful model for producing
reliable, estimated NO3 radical rate constants when
experimental parameters are not available.
Acknowledgements
We wish to thank Prof. R. Todeschini for the software
for the molecular descriptor calculation and modeling,
and the University of Insubria for a fellowship granted
to Pamela Pilutti.
References
Atkinson, A.C., 1985. Plots, Transformations and Regression.
Clarendon Press, Oxford, pp. 282.
Atkinson, R., 1991. Kinetics and mechanisms of the gas-phase
reactions of the NO3 radical with organic compounds.
Journal of Physical and Chemical Reference Data 20, 459–
507.
Atkinson, R., 2000. Atmospheric chemistry of VOCs and NOx.
Atmospheric Environment 34, 2063–2101.
Bakken, G., Jurs, P., 1999. Prediction of hydroxyl radical rate
constants from molecular structure. Journal of Chemical
Information and Computer Sciences 39, 1064–1075.
CHEM 3D, 1997. Cambridge Soft, MA, USA.
Consonni, V., Todeschini, R., Pavan, M., 2002. Structure/
response correlation and similarity/diversity analysis by
GETAWAY descriptors. Part 1. Theory of the novel 3D
molecular descriptors. Journal of Chemical Information and
Computer Sciences 42, 693–705.
Davis, L., 1991. Handbook of Genetic Algorithms. Van
Nostrand Reinhold, New York, USA.
Devillers, J., 1996. Genetic Algorithms in Molecular Modelling.
Academic Press, London.
EPI Suite, 2001.Ver.3.10. Environmental Protection Agency,
USA.
Golbraikh, A., Tropsha, A., 2002. Beware of q2! Journal of
Molecular Graphics and Modelling 20, 269–276.
Gramatica, P., Navas, N., Todeschini, R., 1998. 3D-Modelling
and prediction by WHIM Descriptors. Part 9. Chromato-
graphic relative retention time and physico-chemical proper-
ties of polychlorinated biphenyls (PCBs). Chemometrics
and Intelligent Laboratory System 40, 53–63.
Gramatica, P., Consonni, V., Todeschini, R., 1999. QSAR
study on the tropospheric degradation of organic com-
pounds. Chemosphere 38, 1371–1378.
Gramatica, P., Corradi, M., Consonni, V., 2000. Modelling and
prediction of soil sorption coefficients of non-ionic organic
pesticides by different sets of molecular descriptors. Chemo-
sphere 41, 763–777.
Gramatica, P., Pilutti, P., Papa, E., 2002. Ranking of volatile
organic compounds for tropospheric degradability by
oxidants: a QSPR approach. SAR and QSAR in Environ-
mental Research 13 (7–8), 743–753.
Gramatica, P., Papa, E., 2003. QSAR modelling of bioconcen-
tration factor by theoretical molecular descriptors. Quanti-
tative Structure-Activity Relationships 22, 374–385.
Gramatica, P., Pilutti, P., Papa, E., 2003. QSAR prediction of
ozone tropospheric degradation. Quantitative Structure-
Activity Relationships 22, 364–373.
G .usten, H., 1997. Degradation of atmospheric pollutants by
tropospheric free radical reactions. In: Minisci, F. (Ed.),
Free Radicals in Biology and Environment. Kluwer
Academic Publishers, Dordrecht, Boston, London,
pp. 387–408.
G .usten, H., 1999. Predicting the abiotic degradability of
organic pollutants in the troposphere. Chemosphere 38
(6), 1361–1370.
HYPERCHEM, 1995. Rel. 4 for Windows. Autodesk, Inc.,
Sausalito, CA, USA.
Jinhui, X., Lee, F.S.C., 2000. Quantification of nitrated
polynuclear aromatic hydrocarbons in atmospheric parti-
culate matter. Analytica Chimica Acta 416, 111–115.
Klamt, A., 1996. Estimation of gas-phase hydroxyl radical rate
constants of oxygenated compounds based on molecular
orbital calculations. Chemosphere 32 (4), 717–726.
Kubinyi, H., 1994. Variable selection in QSAR studies. II. A
highly efficient combination of systematic search and
evolution. Quantitative Structure-Activity Relationships
13, 393–401.
Leardi, R., Boggia, R., Terrile, M., 1992. Genetic algorithms as
a strategy for feature selection. Journal of Chemometrics 6,
267–281.
Marengo, E., Todeschini, R., 1992. A new algorithm for
optimal distance—based experimental design. Chemo-
metrics and Intelligent Laboratory System 16, 37–44.
Medven, Z., G .usten, H., Sabljic, A., 1996. Comparative QSAR
study on hydroxyl radical reactivity with unsaturated
hydrocarbons: PLS versus MLR. Journal of Chemometrics
10, 135–147.
Moran, P.A.P., 1950. Notes on continuous stochastic phenom-
ena. Biometrika 37, 17–23.
M .uller, M., Klein, W., 1991. Estimating atmospheric degrada-
tion processes by SARs. The Science of the Total Environ-
ment 109, 261–273.
Rogers, D., Hopfinger, A.J., 1994. Application of genetic
function approximation to quantitative structure–activity
ARTICLE IN PRESSP. Gramatica et al. / Atmospheric Environment 37 (2003) 3115–3124 3123

relationships and quantitative structure–property relation-
ships. Journal of Chemical Information and Computer
Sciences 34, 854–866.
Sabljic, A., G .usten, H., 1990. Predicting the nighttime NO3
radical reactivity in the troposphere. Atmospheric Environ-
ment 24A, 73–78.
SCAN—Software for Chemometric Analysis, 1995. Rel. 1.1 for
Windows. Minitab, USA.
Shao, J., 1993. Linear model selection by cross-validation.
Journal of the American Statistical Association 88, 486–494.
Shi, L.M., Fang, H., Tong, W., Wu, J., Perkins, R., Blair,
R.M., Branham, W.S., Dial, S.L., Moland, C.L., Sheehan,
D.M., 2001. QSAR models using a large diverse set of
estrogens. Journal of Chemical Information and Computer
Science 41, 186–195.
Tejada, S.B., Zweidinger, R.B., Sigsby, J.E., 1986. Fluorescence
detection and identification of nitro derivatives of poly-
nuclear aromatic hydrocarbons by on-column catalytic
reduction to aromatic amines. Analytical Chemistry 58
(8), 1827–1834.
Todeschini, R., Consonni, V., 2000. Handbook of Molecular
Descriptors. Wiley-VCH, Weinheim, Germany, p. 667.
Todeschini, R., Gramatica, P., 1997a. The WHIM theory: new
3D molecular descriptors for QSAR in environmental
modelling. SAR and QSAR in Environmental Research 7,
89–115.
Todeschini, R., Gramatica, P., 1997b. 3D-Modelling and
prediction by WHIM descriptors. Part 6. Applications of
WHIM descriptors in QSAR studies. Quantitative Struc-
ture-Activity Relationships 16, 120–125.
Todeschini, R., Mauri, A., 2002. DOLPHIN-software for
optimal distance-based experimental design. Ver. 2.0 for
Windows. Talete srl, Milan, Italy.
Todeschini, R., Maiocchi, A., Consonni, V., 1999. The K
correlation index: theory development and its application in
chemometrics. Chemometrics and Intelligent Laboratory
System 46, 13–29.
Todeschini, R., Consonni, V., Pavan, M., 2002a. DRAGON-
software for the calculation of molecular descriptors. Ver.
2.1 for Windows. Free download available at: http://
www.disat.unimib/chm.
Todeschini, R., Consonni, V., Pavan, M., 2002b. MOBY DIGS-
software for multilinear regression analysis and variable
subset selection by genetic algorithm. Ver. 1.2 for Windows.
Talete srl, Milan, Italy.
Tropsha, A., Gramatica, P., Gombar, V.K., 2003. The
importance of being earnest: validation is the absolute
essential for successful application and interpretation of
QSPR models. Quantitative Structure-Activity Relation-
ships 22, 69–77.
Wang, X., Yin, C., Wang, L., 2002. Structure–activity relation-
ships and response-surface analysis of nitroaromatics
toxicity to the yeast (Saccharomyces cerevisiae). Chemo-
sphere 46, 1045–1051.
Wold, S., Eriksson, L., 1995. Chemometric Methods in
Molecular Design. VCH, Germany, pp. 309–318.
ARTICLE IN PRESSP. Gramatica et al. / Atmospheric Environment 37 (2003) 3115–31243124


![Noncovalent effects in the coordination and assembling of the[Fe(bpca)2][Er(NO3)3(H2O)4]NO3 system](https://img.pdfslide.net/doc/110x75/634a34cb7f48e5b45509f0c7/noncovalent-effects-in-the-coordination-and-assembling-of-thefebpca2erno33h2o4no3.jpg)


