Embed Size (px)
Citation preview

Agricultural and Forest Meteorology 111 (2002) 265–282
Predicting transpiration from forest stands inBelgium for the 21st century
Laurent Missona,∗, Daniel P. Rasseb, Caroline Vinckea,Marc Aubinetc, Louis Françoisb
a Université catholique de Louvain, Unite EFOR, Place Croix du Sud 2 bte 9, B-1348 Louvain-la-Neuve, Belgiumb Université de Liège, LPAP, 5 Avenue de Cointe, B-4000 Liege, Belgium
c Unité de Physique, Faculté Universitaire des Sciences Agronomiques, 8 Avenue de la Faculté, B-5030 Gembloux, Belgium
Received 16 August 2001; received in revised form 8 April 2002; accepted 11 April 2002
Abstract
Canopy transpiration is a major element of the hydrological cycle of temperate forests. Levels of water stress during the 21stcentury will be largely controlled by the response of canopy transpiration to changing environmental conditions. One year oftranspiration measurement in two stands (Quercus roburL. andFagus sylvaticaL.) was used to calibrate the ASPECTS modelona1 andD0, two parameters of a modified version of Leuning’s equation of stomatal conductance. A second year of data wasused to validate the model. The results indicate a higher sensitivity ofgsc to vapour pressure deficit (Ds) in oak than in beech(D0 (oak) < D0 (beech)). To simulate future forest transpiration, site specific weather data sets were constructed from GCMoutputs, spatially and temporally downscaled with local climatic data. Temperature increase between the end of the 20th and21st centuries was predicted to be 2.8◦C in the beech stand and 3.1◦C in the oak stand. Based solely on temperature change,ASPECTS predicted an increase in transpiration of 17% in the beech and 6% in the oak stand, the difference being due tovariation in local climate and the sensitivity of both species toDs. Based solely on increased atmospheric CO2 (355 ppm in1990 to 700 ppm in 2100), ASPECTS predicted that transpiration would decrease by 22% in beech and 19% in oak. With thecombined scenarios of climatic change and increased atmospheric CO2, ASPECTS showed a decrease of 7% in transpiredwater in the oak stand and only 4% in the beech stand, which are not significant differences from zero. Consequently, waterstress should not increase in either stand during the 21st century. © 2002 Elsevier Science B.V. All rights reserved.
Keywords:Transpiration; Stomatal conductance; Climate change; Downscaling;Fagus sylvatica; Quercus robur
1. Introduction
Several global circulation models (GCMs) predictan increase in the earth’s temperature, accompaniedwith a rise in carbon dioxide (CO2) concentration(Hougthon et al., 1993). For the Northern Hemisphere,the predicted increase in temperature between the 20th
∗ Corresponding author. Tel.:+32-10-47-37-04;fax: +1-32-10-47-36-97.E-mail address:[email protected] (L. Misson).
and 21st centuries ranges from 2 to 6◦C, dependingon the GCM. Forest ecosystems will be affected bythe changes in climate and chemical composition ofthe atmosphere (Mickler et al., 2000).
Water use by plants is linked to several biophysi-cal processes, such as mineral nutrition, maintenanceof turgor in cells and tissues, leaf cooling, stom-atal regulation and CO2 assimilation (Kramer et al.,1995). At the stand level, transpiration is closely con-trolled by canopy stomatal conductance (Jarvis andMcNaughton, 1985). Plants regulate their stomatal
0168-1923/02/$ – see front matter © 2002 Elsevier Science B.V. All rights reserved.PII: S0168-1923(02)00039-4

266 L. Misson et al. / Agricultural and Forest Meteorology 111 (2002) 265–282
conductance to satisfy the need for CO2 uptake whileminimising water loss by leaves (Cowan, 1982; Hariet al., 1986; Guehl and Aussenac, 1987). Stomatalcontrol of transpiration optimises plant water useand reduces the risks of drought-induced damage(Tenhunen et al., 1990; Tardieu and Davies, 1993;Sala and Tenhunen, 1996). Research on transpirationis essential to understand the modifications of physi-ological processes of trees subjected to elevated CO2and temperature.
The complexity of water exchanges between treesand the atmosphere renders the study of climatechange effects on plant transpiration difficult (Leuninget al., 1995; Baldocchi and Meyers, 1998). Long-termpredictions require detailed understanding of pro-cesses and realistic ecosystem descriptions. In thiscontext, process-based models are essential tools.Currently, many models can estimate CO2 and watervapour fluxes between forest canopies and the atmo-sphere. All these models include various complexitylevels and describe biophysical processes at differentspatial and temporal scales. Analysing the effects ofclimate change on stand transpiration requires an ap-proach that integrates short- and long-term processes(Baldocchi and Wilson, 2001; Rasse et al., 2001a,b,c).
Long-term predictions of the global change effectson forest ecosystems require climatic inputs for the21st century, which usually come from GCM. As arule, monthly averages of several simulated weatherdata are available through these models, for periodsextending to the end of the 21st century (Hougthonet al., 1993). Sub-monthly temporal variability simu-lated by GCM is usually not validated, which is a prob-lem for process-based forest models working on daily,hourly or half hourly time scales. The outputs of theseforest models are generally sensitive to the weatherdynamics at these sub-daily time scales. Therefore,predicting global change impacts on forest ecosys-tems with process-based models requires long-termsimulated climatic data at sub-daily time scales.
The purpose of this study is to analyse the effectsof potential climatic changes and increases in atmo-spheric CO2 on the transpiration of two deciduousBelgian forests composed of European beech (Fagussylvatica L.) and pedunculate oak (Quercus roburL.), respectively. We used transpiration flux measure-ments, with a process-based model (ASPECTS) andspecific climatic scenarios for the 20th and 21st cen-
turies. The ASPECTS model was designed to analyseboth short- and long-term variations of carbon andwater exchanges and reservoirs in temperate forests(Rasse et al., 2001a). The climatic scenarios werecalculated combining the Canadian Global CoupledModel (CGCM1; Flato et al., 2000) and an origi-nal procedure that allowed us to reconstruct realisticweather variability on a local scale at hourly and halfhourly time steps.
2. Materials and methods
2.1. The oak stand at Chimay
The experimental oak stand is located in the southof Belgium (50◦06′N, 4◦16′E) at an altitude of 260 masl in a flat landscape (Table 1). The stand consistsof a 1 ha even-aged 108-year-old plantation ofQ.robur L. The dominant species of the understorey arePrunus aviumL., Fraxinus excelsiorL., Q. rubra L.,Betulasp. andCrateagussp. The dominant height ofthe trees was 23.7 m in 1999.
The soil is classified as Dystric Cambisol (FAOclass) (Table 1). A transient water table is present fromlate fall to late spring and is revealed by the abun-dance of hygrophylous plants (Circaea lutetianaL.,Stachys sylvaticaL., Carex pendulaHuds.,Athyriumfilix femina (L.) Roth). The soil has vertic propertiesmanifested by summer drought cracks. The geologicalbedrock is composed of Famennian (upper Devonian)shales. The pH H2O of the 0–10 cm soil layer is 5.1.
Sap flux density (Fd, kg m−2 h−1) was monitoredduring the 1999 and 2000 growing season. We used
Table 1Selected characteristics of the experimental sites
Characteristics Oak stand(Chimay)
Beech stand(Vielsalm)
Mean annual precipitation (mm) 960 1000Mean annual temperature (◦C) 8.4 7.5Elevation (m) 260 495Soil type (FAO class) Dystric
cambisolDystriccambisol
Soil texture Silt clayloam
Silt loam
Soil pH (H2O) 5.1 4.0Soil depth (m) 1.7 1.5Stand basal area (m2 ha−1) 22.7 30.2

L. Misson et al. / Agricultural and Forest Meteorology 111 (2002) 265–282 267
the “Granier” thermal method (Granier, 1987) with2 cm long radial sap flowmeters. Each sensor had twoprobes, one was heated continuously at a constantpower and the other was not heated. All probes wereinstalled on the northern side of the trees to avoid directsolar heating and shielded with aluminium foil to min-imise temperature fluctuations in the sapwood. Thismethod was applied on six trees with a basal area closeto the stand average. The corresponding mean circum-ference of these trees was 122 cm in 1999. The sap fluxat the tree level (F, kg h−1) was calculated by the rela-tionF = F dS, whereS is the tree sapwood area (m2).This area was measured on stained cores extractedwith a Pressler auger. Upscaling from tree to stand wasbased on the estimation of the stand sapwood area.
Four automatic rain gauges were installed at aheight of 1.3 m. Ten piezometers were installed tostudy the time course of the ground water table. Volu-metric soil water contents were measured every 30 minwith four ThetaProbes (Delta-T Devices, Cambridge,UK) installed at depths of 10 and 45 cm. The leafarea index (LAI) was measured with the LAI-2000(Li-Cor Inc., Nebraska, USA) and directly by meansof 0.49 m2 leaf litter collectors, which were installedat a sampling density of 34 collectors ha−1. Becausethere were species other thanQ. robur in the stand,the litter sampling allowed us to quantify their contri-bution to the LAI. Using two types of measurements,the mean maximum LAI was estimated to be 2.7 forQ. roburand 1.3 for the combined other species. Twocarbon reservoirs (branch and stem) were calculatedusing allometric relationships determined for oak inBelgium (Dagnelie et al., 1999).
An automatic weather station (PAMESEB, Libra-mont, Belgium) located in an open field at a dis-tance of 500 m measured precipitation (tipping bucketat 1 m height), wind speed (anemometer thermistorat 1.8 m height), global radiation (photovoltaic sensorsolar Haeni 130 at a height of 1.5 m), air tempera-ture (resistance sensor thermistor at 1.5 m height) andrelative humidity (psychrometer thermistor at 1.5 mheight). The measurements, made at 12 min intervals,were averaged over an hour.
2.2. The beech stand at Vielsalm
The Vielsalm experimental forest is located in theBelgian Ardennes at 495 m asl (50◦18′N, 6◦00′E)
(Table 1). The region is hilly with a 3% northwesterlyslope. The climate is temperate maritime. The soil onthe site is about 125 cm deep and is classified as Dys-tric Cambisol (FAO class) (Table 1). Almost 80% ofthis stand of 8000 m2 consists of beech and Douglasfir, with the Douglas fir in the northeast quadrant fromthe instrument tower. InAubinet et al. (2000)a moredetailed description of the site and the other speciesgrowing there is given. The paper also includes anaerial photograph showing the spatial distributionof Douglas fir around the instrument tower. Thesespecies represent above 80% of the basal area and areassociated withAbies albaMiller, Picea abies(L.)Karst.,Pinus sylvestrisL. andQ. roburL. The under-storey vegetation is very sparse in the conifer sub-plotand non-existent in the beech sub-plot. Beeches wereplanted in 1908. Tree carbon reservoirs (branch, stemand root) were measured destructively in 1998 (Laitatet al., 1999). LAI was estimated as 4.0 by destructivesampling and light transmission through the canopy.The site provides a fetch of 1500 m in the southwestdirection and 500 m in the northeast direction, whichare the dominant wind directions.
Fluxes of CO2, water vapour and sensible heat weremeasured by an Eddy covariance system installed40 m above the forest floor. The system was builtaccording to the standard methodology as used inEUROFLUX network (Aubinet et al., 2000). It con-sisted of a fast response infrared gas analyser (IRGA)(model LI-6262, LI-COR Inc., Lincoln, NE, USA)and a three-dimensional sonic anemometer (modelSOLENT 1012R2, Gill Instruments, Lymington, UK).Air from above the canopy was drawn through an 8 mlong, 4 mm inner diameter PTFE tube and then passedinto the analyser. The pump (KNF NO22 AN18, Vil-lage Neuf, France) was installed downstream of theanalyser and provided a flow rate of 8.2 l min−1. Theresulting pressure drop in the chamber was 13–14 kPa.A pressure transducer (model LI-6262-03, LI-CORInc., Lincoln, NE, USA) continuously measuredthe pressure in the analyser chamber and the IRGAsoftware automatically applied a pressure correctionthe gas concentration. Two Teflon filters (GELMANACRO 50, 1 mm) were placed upstream of the gasanalyser in order to avoid contamination of the opticalchamber. The gas analyser was calibrated once ev-ery fortnight. As the calibration drift mainly affectedthe zero of the IRGA response, the slope remained

268 L. Misson et al. / Agricultural and Forest Meteorology 111 (2002) 265–282
practically constant. Consequently, the concentrationfluctuations and, hence, the covariances were not af-fected. Raw signals were recorded at a frequency of20.8 Hz. The software EDISOL was used for real timeas well as post-processing of the data. All the datatreatment procedure, including frequency corrections,are described inAubinet et al. (2000).
Complementary measurements were made on a halfhourly basis. They included above and within canopyair temperature (PT100, Unit of Physics, FUSAGx,Gembloux) and humidity (General Eastern RH2,Watertown, MA, USA). Global (Kipp and ZonenCM5, Delft, The Netherlands), net (8111 Schenck,Wien, Austria) and photosynthetically active radiation(SD101Q Delta-T Devices, Cambridge, UK) weremeasured above the canopy. Soil temperature (PT100)was measured at depths of 3, 5.5, 9, 26 and 56 cm.Soil moisture (ThetaProbes ML1, Delta-T Devices,Cambridge, UK) was measured at depths of 20, 44and 90 cm. Rainfall and mean atmospheric pressure(Motorola MPX 4115AP) were also measured on thesite. During the experiment, two soil heat flux plates(Hukseflux HFP01, Delft, The Netherlands) wereplaced at a depth of 2.5 cm. Air CO2 concentrationswere sampled at 8, 22 and 36 m and measured withan IRGA (WMA-2, PP systems).
Flux data were sorted into sub-plots, using a winddirection criterion (Aubinet et al., 2001). Two serieswere constituted, either corresponding to the beech orto the conifer sub-plot. In order to avoid any bias dueto anisotropy of meteorological conditions, the datagaps resulting from the sorting were filled in using aparameterisation of the flux response to the weatherconditions. The complete methodology and results ofthis procedure have been described in detail in a pre-vious publication (Aubinet et al., 2001).
2.3. Climate and atmospheric CO2 scenarios
ASPECTS predictions were based on both climateand atmospheric CO2 scenarios for the 20th and 21stcenturies. For climate, six meteorological variableswere reconstructed from outputs of a GCM for theperiod 1900–2100: precipitation; global radiation; airtemperature; relative humidity; wind speed; and at-mospheric pressure. The downscaling was conductedusing a simple and original two-step approach thatproduced climate scenarios at local scale and charac-
terised by realistic hourly and half hourly variability.As climatologists would expect, local correction fac-tors, as well as variability and frequency of extremevalues may change as climate changes. Nevertheless,the processes leading to such a change are neither fullycomprehended nor detectable at high temporal resolu-tion to allow them to be fully integrated into realisticdownscaling (Kidson and Thompson, 1998; Stott andTettn, 1998). We decided to keep these factors constantover time, based on contemporary measurements.
We used simulated weather data from the CGCM1(Flato et al., 2000) of the Canadian Centre for ClimateModelling and Analysis (CCCMA). The CGCM1model computes the atmospheric general circulationin response to a standard increase in the concentrationof atmospheric CO2 over the 20th and 21st centuries.The radiative forcing of the climate system includesa warming by greenhouse gases and a cooling by sul-phate aerosols (Boer et al., 2000a,b). The equilibriumclimate sensitivity of CGCM1, i.e. the global meantemperature response to a doubling of the effectiveCO2 concentration, is about 2.5◦C. Monthly resultsare available in a database maintained by the DataDistribution Center of the Intergovernmental Panel onClimate Change (DDC-IPCC). The spatial resolutionis 3.75◦ in longitude and about 3.7◦ in latitude.
Monthly averages of GCM simulated weather datawere extracted from two grid cells correspondingto the study sites. First, a spatial downscaling wasconducted because GCM outputs do not necessarilycorrespond to local measurements in specific altitudi-nal and latitudinal conditions within the grid cell. Foreach site and meteorological variable, correction fac-tors were calculated monthly as the ratio between themonthly average of observed and simulated value overa 2-year period (1997–1998). Then corrections wereapplied for the period 1900–2100 by multiplying themonthly GCM outputs by the correction factor of thecorresponding months. The period 1997–1998 cor-responds to the common measuring interval betweenthe two study sites.
The second step of the downscaling procedure con-sisted in adding the hourly (Chimay) and half hourly(Vielsalm) variability to the locally corrected GCMsimulations. The corrected GCM simulations of eachmonth during the period 1900–2100 were comparedwith the average measured data of the correspondingmonths (1997–1998). Next, the hourly and half hourly
L. Misson et al. / Agricultural and Forest Meteorology 111 (2002) 265–282 269
measured data which presented the closest monthlyaverage to that of the simulation were then ascribed toeach month of the GCM corrected simulation. Thesediurnal data were then multiplied by the ratio be-tween the monthly corrected GCM simulation and themonthly average measured data previously ascribed,this allows to keep the time course of locally correctedGCM outputs in the data set. The procedure poten-tially generates some non-realistic hourly and halfhourly values. Therefore, we constrained the hourlyand half hourly values to fall between the maximumand the minimum values of the measured data setfor the corresponding hour of every day of the samemonth.
Two years (1997–1998) is a short period in whichto calculate local correction factors, as well as toreproduce the temporal variability. However, to thebest of our knowledge, longer time series do not
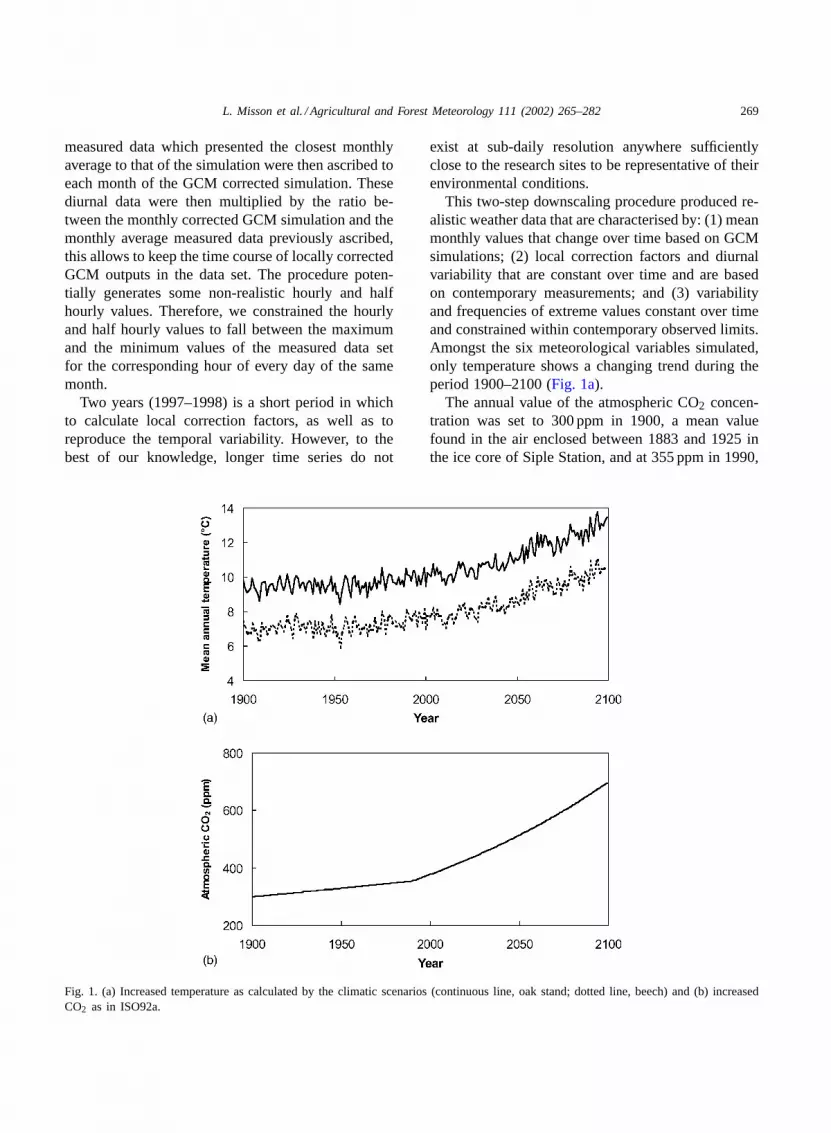
Fig. 1. (a) Increased temperature as calculated by the climatic scenarios (continuous line, oak stand; dotted line, beech) and (b) increasedCO2 as in ISO92a.
exist at sub-daily resolution anywhere sufficientlyclose to the research sites to be representative of theirenvironmental conditions.
This two-step downscaling procedure produced re-alistic weather data that are characterised by: (1) meanmonthly values that change over time based on GCMsimulations; (2) local correction factors and diurnalvariability that are constant over time and are basedon contemporary measurements; and (3) variabilityand frequencies of extreme values constant over timeand constrained within contemporary observed limits.Amongst the six meteorological variables simulated,only temperature shows a changing trend during theperiod 1900–2100 (Fig. 1a).
The annual value of the atmospheric CO2 concen-tration was set to 300 ppm in 1900, a mean valuefound in the air enclosed between 1883 and 1925 inthe ice core of Siple Station, and at 355 ppm in 1990,

270 L. Misson et al. / Agricultural and Forest Meteorology 111 (2002) 265–282
close to measurements at various sites in the NorthernHemisphere (Boden et al., 1994). The level of atmo-spheric CO2 concentration that will be reached in 2100has been estimated to 700 ppm, as calculated fromthe scenario ISO92a with the Bern model (Houghtonet al., 1995). The annual values of atmospheric CO2concentration were assumed to increase exponentiallybetween these values (Fig. 1b).
2.4. The ASPECTS model
2.4.1. General structureTranspiration rates under current and future envi-
ronmental conditions were simulated with ASPECTS(Rasse, 2002; Rasse et al., 2001a,b,c). The timecourse of carbon and water reservoirs is computedon hourly or half hourly time steps by solving alldifferential equations defined between incoming andoutgoing fluxes. Although the integration time stepis short, ASPECTS is designed to simulate the evo-lution of carbon and water reservoirs over periodslonger than a century. Initial conditions are definedfor forests of any age, i.e. from seedlings to maturestands, and ASPECTS simulates further tree growthand the time course of carbon reservoirs. ASPECTShas been widely described in several earlier publica-tions (Rasse, 2002; Rasse et al., 2001a,b,c). The mainparts will be summarised here.
2.4.2. PhenologyASPECTS simulates four phenological phases for
deciduous trees: (1) winter, no photosynthesis; (2) leafexpansion in the spring; (3) wood production duringsummer and early fall; and (4) leaf senescence. Budburst is triggered when degree days accumulated since10 February over a base temperature of 5◦C reach athermal time requirement specific to each tree species,as proposed byHoffman (1995). End of leaf growthfor each season is simulated when the LAI reaches amaximum value defined by an allometric relationshipbetween maximum leaf biomass and existing carbonin the stem reservoir (Rasse et al., 2001c):
L = Lmax − 1.3
2{(Sc−1000)/1000} (1)
whereL is the annual LAI,Lmax the absolute maxi-mum LAI (4.0 for the oak and beech stands) andScthe carbon mass in the stem reservoir (g m−2).
2.4.3. Photosynthesis and respirationASPECTS computes rates of photosynthesis
according to the theoretical model ofde Pury andFarquhar (1997), which is a big-leaf model with aseparate integration of sunlit- and shaded-leaf pho-tosynthesis. Canopy photosynthetic rate results fromthe integration of the leaf photosynthetic capacityover the entire canopy. Maintenance respiration costsare computed for each plant organ according to ageneralised version of the equation proposed byZogget al. (1996). This equation relates maintenance res-piration to the total carbon content of each plantorgan, the fraction of living tissue for the reservoir,the nitrogen concentration, and the plant tissue tem-perature. Growth respiration is computed as 20%of growth assimilates allocated to each reservoir, assuggested byHoffman (1995). In addition, growthrespiration of fine roots is increased proportionalto soil water and temperature stresses (Rasse et al.,2001b).
2.4.4. AllocationPhotosynthetically fixed carbon is allocated to
tree organs to satisfy their needs first for main-tenance respiration and then for growth, whichincludes both biomass increment and growth respi-ration. The ASPECTS model partitions assimilatesbetween above- and below-ground organs accordingto phase-dependent empirical ratios (Rasse et al.,2001a). During the leaf expansion phase, all assim-ilates are allocated to non-woody tissues, i.e. leavesand fine roots, as suggested byLüdeke et al. (1994).During the rest of the year, allocation in ASPECTSis stand-age dependent because studies have shownthat the root to shoot ratio of temperate trees de-creases asymptotically with time from saplings tomature stands (Vanninen et al., 1996; Lee et al.,1998). Growth assimilates allocated to above-groundorgans are then partitioned between leaves, branchesand stems, while the below-ground assimilates arepartitioned between coarse and fine roots. Thebelow-ground allocation sub-model of ASPECTS,named TRAP, was presented byRasse et al. (2001b).The previous paper also describes how ASPECTSsimulates three soil stress factors affecting root growthand distribution: (1) temperature; (2) soil strength,which limits soil penetrability to roots; and (3)aeration.
L. Misson et al. / Agricultural and Forest Meteorology 111 (2002) 265–282 271
2.4.5. Hydrological cycle and transpirationCanopy interception is calculated by resolving the
mass balance of a water interception reservoir as inViterbo and Beljaars (1995). The maximum size ofthe interception reservoir (mm) was set to 0.2L, whereL is LAI. The soil water content is computed for a se-ries of user defined soil layers. The net flux of waterbetween two adjacent soil horizons is computed bysolving the Richard’s equation for unsaturated flow.The relationship between the volumetric water contentof each layer and the soil water potential, as well asthe hydraulic conductivity, are parameterised accord-ing to Saxton et al. (1986). The bottom water flowboundary condition (deep drainage) is free drainage,i.e. dθ /dz = 0, whereθ is the soil water content, andz the depth. Evaporation from the soil surface, whichdefines the upper boundary condition, was computedusing an algorithm reported inMahfouf and Noilhan(1991).
The total soil water uptake by the trees is equal tothe transpiration rate (E, mm s−1), which is simulatedin the stomatal conductance subroutine described laterin this section. Water uptake is distributed among thevarious soil layers (El , mm s−1) according to the fineroot density (Rl , %) and the water stress (0≤ θstrs
l ≤1) of each individual layer (l):
El = E
[(Rlθ
strsl )∑layers
l=1 (Rlθstrsl )
](2)
Water stress in each soil layer (θstrsl ) is computed
as a linear function of the soil water potential at thatlayer (ψl , kPa), according to:
θstrsl = ψwp − ψl
ψwp − ψstrs(3)
θstrsl = 0.0, if ψl ≥ ψwp (4)
θstrsl = 1.0, if ψl ≤ ψstrs (5)
whereψwp is the soil water potential at wilting point(1500 kPa), andψstrsthe minimum soil water potentialfor soil water stress (500 kPa).
Stomatal conductance (gsc, mol m−2 s−1) is com-puted by a modified version of the semi-empiricalmodel ofLeuning (1995), as follows:
gsc = g0 +[
a1An
(Cs − Γ )(1 + (Ds/D0)2)
]θstrs (6)
whereg0 is the zero intercept (mol m−2 s−1), An thenet assimilation rate (�mol m−2 s−1), Cs the CO2 con-centration at the leaf surface (ppm),Γ the CO2 com-pensation point (ppm),Ds the water vapour pressuredeficit at the leaf surface (Pa),a1 andD0 the empiricalcoefficients, andθstrs the integrated soil water stressfactor (0≤ θstrs ≤ 1) described below. In ASPECTS,values ofCs andDs are considered equal to those ofcanopy air. The square term of theDs/D0 ratio is a dif-ference between the equation of stomatal conductanceas used in ASPECTS and the original form proposedby Leuning (1995). We introduced this square term be-cause model calibrations indicated that the predictionof transpiration was overly sensitive toDs when com-pared with estimates obtained by sap flow measurem-ents. Results are compared with the original equation(mentioned later). Theθstrs factor is computed as:
θstrs =∑layersl=1 (Rlθ
strsl )∑layers
l=1 (Rl)(7)
Stomatal conductance and transpiration are calcu-lated separately for sunlit- and shaded-leaf and thentranspiration is integrated over the whole canopy. Fortranspiration we used the following equation:
E = DsgT
RT(8)
where E is the transpiration rate per unit soil area(mm s−1), Ds the water vapour pressure deficit at theleaf surface (Pa),gT the total canopy conductance perunit soil area including the stomatal, leaf boundarylayer and canopy aerodynamic conductance (m s−1), Rthe gas constant for water vapour (461.89 J kg−1 K−1)and T the air temperature (K). Leaf boundary layerand canopy aerodynamic conductance are computedaccording toMonteith and Unsworth (1990)withheight of the reference level equal to 30 m, roughnesslength equal to 0.3 m and displacement height equalto 17.5 m.
Finally, other processes modelled by ASPECTS aredescribed in earlier publications: nitrogen uptake andallocation (Rasse, 2002), soil heat diffusion (Rasseet al., 2001a), litter production and removal of woodproducts (thinning) (Rasse et al., 2001c), and litterand soil organic matter decomposition (Rasse et al.,2001a,b). Although a nitrogen cycle is included inASPECTS, dynamic feedback to the carbon and water

272 L. Misson et al. / Agricultural and Forest Meteorology 111 (2002) 265–282
cycle were not considered in this study in order toreduce the number of model parameters.
3. Simulation settings
Calibration and validation runs were conducted bystarting the model simulations two years prior to theavailable measurement period. This time period rep-resents a trade-off between minimising the effects ofunknown initial conditions, such as soil water con-tents and temperatures, and remaining close enoughto the measured biomass initial conditions, whichwere set to the measured carbon reservoirs of theleaves, branches, stems and roots. For the calibrationand validation runs, the maximum LAI was set to 4.0for both stands. Modelled transpiration for the oakstand was then multiplied by 0.67 to account for theproportion of oak in the total stand LAI. The modelwas calibrated using the first year data, respectively1997 for the beech and 1999 for the oak forest. Val-idation was conducted on independent data measuredthe second year (1998 for beech, and 2000 for oak).The calibration was conducted on two parameters: (1)a1, the dimensionless coefficient linkinggsc to carbonassimilation; (2)D0, the coefficient (Pa) linkinggscto vapour pressure deficit. Calibration, conducted bytrial and error, suggested that the value of thea1 pa-rameter is approximately the same for oak and beech,so we used a common value of 5.5 for both species.After trial and error calibration, the value ofD0 was700 Pa for oak and 1500 Pa for beech. Other parame-ters for the phenology, photosynthesis, respiration andallocation sub-models have been considered as con-stant and were fixed at published values for temperatedeciduous forest (Rasse et al., 2001a).
Sap flow measurements at Chimay were a directestimate of tree transpiration. Eddy covariance mea-surements at Vielsalm were evapotranspiration mea-surements, i.e. the sum of tree transpiration, soiland foliage interception evaporations. Because thisresearch focuses on tree transpiration, we excludedrainy days from the data set and assumed that evap-oration on dry days is negligible as compared withcanopy transpiration. Therefore, ASPECTS estimatesof transpiration were compared with sap flow esti-mates at Chimay and Eddy covariance measurementson dry days at Vielsalm.
Long-term predictions were conducted simulatingcontinuous growth from seedlings. In other words, westarted the predictions with all the tree carbon reser-voirs equal to zero (leaf, branch, stem, root) and thewoody biomass was increased in response to chang-ing environmental conditions over a 200-year period.The ASPECTS model has been developed and cal-ibrated in several temperate forests for this purpose(Rasse et al., 2001a,b,c).
4. Results and discussions
4.1. Calibration
During several periods, predictions based onLeuning’s standard equation greatly overestimates themeasurement of transpired water from the oak stand(Fig. 2a). For the beech stand, this phenomenon isless frequent but is observed at the beginning of Juneand August (Fig. 2b). The ASPECTS model withLeuning’s standard equation systematically overes-timates real data during hot sunny days, whenDsand atmospheric evaporative demand are high. Inwarm weather, the control ofgsc by Ds as describedby Leuning’s standard equation does not seem tosufficiently reduce the transpiration as calculated incomparison to the measurement. Changing the valueof D0 in the Leuning’s equation did not allow us toobtain a better fit (data not shown). We modified theLeuning’s equation by introducing a square term tothe Ds/D0 ratio, with the aim of decreasing stomatalsensitivity to Ds. Fig. 2a and bshow that the AS-PECTS model with the modified Leuning’s equationof stomatal conductance calibrated ona1 andD0 ac-curately simulates the absolute values and variationsof the daily transpiration rates throughout the growingseason for both oak and beech.
Coefficients of determination (R2) between the ob-served and simulated transpiration rates obtained withthe unmodified version of Leuning’s equation are0.80 for oak (n = 168) and 0.79 for beech (n = 112)(Table 2). With the modified equation, theR2 reaches0.86 for oak and 0.82 for beech (Table 2, Fig. 3aand b). The modified version of the Leuning’s equa-tion was retained because it allows a better fit withmeasurements, correcting the stomatal sensitivity tovapour pressure deficit which is a key factor regulating

L. Misson et al. / Agricultural and Forest Meteorology 111 (2002) 265–282 273
Fig. 2. Measured and modelled daily transpiration by ASPECTS for the calibration period in (a) the oak stand and (b) the beech stand,using the standard and modified Leuning’s model of stomatal conductance.
Table 2Model fit on the calibration and validation period in the oak and beech stands
Model fit Calibration period Validation period
Oak (1999) Beech (1997) Oak (2000) Beech (1998)
R2—Leuning modified 0.86 0.82 0.50 0.75R2—Leuning standard 0.80 0.79 0.43 0.75Measured transpiration (mm) 103 142 60 152Mod. transpiration—Leuning modified (mm) 104 138 58 154Mod. transpiration—Leuning standard (mm) 114 131 61 154

274 L. Misson et al. / Agricultural and Forest Meteorology 111 (2002) 265–282
Fig. 3. Relationship between measured and modelled daily tran-spiration for the calibration period in (a) the oak stand and (b)the beech stand.
tree transpiration. Values ofR2 around 0.80 can beconsidered satisfactory and have been reported inseveral other studies (Granier and Loustau, 1994;Kellomäki and Wang, 1999; Baldocchi and Meyers,1998). For beech as for oak, linear regressions throughmeasured and simulated data are near the 1:1 rela-tionship with an almost zero intercept (Fig. 3a and b).
4.2. Validation
Validation runs conducted on independent data setsindicate that ASPECTS is capable of reproducing
satisfactory simulations of transpiration fluxes (Fig. 4aand b). For beech, theR2 is 0.75 (n = 85), whichmeans that the predictive power of the model is 7%lower for the validation than for the calibration pe-riod (Fig. 5b, Table 2). For oak, theR2 decreases to0.50 (n = 93) for the validation period, which is asubstantial drop in comparison with the calibrationperiod (R2 = 0.86) (Fig. 5a, Table 2). For oak, themodel greatly overestimates the measurements at thebeginning of the vegetation season, i.e. from 5 Juneto 21 June (Fig. 4a). A widespread worm attack ofTortrix viridina L. was reported during this period anddefoliation was substantial. Probably, the trees wereno longer able to transpire at their normal rate. Laterduring the growing season, oak trees produced theirsecond leaves. This could explain why since July weagain obtained a good agreement between observedand calculated transpiration rates. Disregarding theperiod of overestimation, theR2 increases from 0.50to 0.72 (n = 65). Since we considered these resultssatisfactory for a validation procedure, we have usedthe ASPECTS model to run predictions of transpira-tion rates during the 21st century.
4.3. Significance of parameters
The results of the calibration process indicate ahigher sensitivity ofgsc to Ds for the oak than for thebeech stand (D0 (oak) < D0 (beech)). TheD0 pa-rameter could be species dependent or influenced bysite characteristics such as local climate, soil prop-erties and/or stand management practices (Table 1).Our data do not allow us to make an in-depth anal-ysis of the variation ofgsc sensitivity toDs in rela-tion to these factors. Nevertheless,gsc sensitivity toDs is most probably species-dependent because, inour case, climate, soil properties and stand densitybetween the study sites are not significantly different(Table 1).
Furthermore, this result is supported by severalstudies.Cermák et al. (1980)andBréda et al. (1993a,b)have shown thatgsc of Q. petraeaand Q. robur de-creases rapidly when the predawn leaf water potentialdecreases from 0.0 to−1.0 MPa. Comparing differ-ent oak species,Dickson and Tomlinson (1996)haveclassifiedQ. robur as water stress sensitive becauseof this feature. Comparative studies in controlled en-vironments pointed out differences in physiological

L. Misson et al. / Agricultural and Forest Meteorology 111 (2002) 265–282 275
Fig. 4. Measured and modelled daily transpiration by ASPECTS for the validation period in (a) the oak stand and (b) the beech stand,using the modified Leuning’s model of stomatal conductance.
functioning between European beech and pedunculateoak (Kerstiens et al., 1995; Beerling et al., 1996; Heathet al., 1997; Heath and Kerstiens, 1997; Heath, 1998).Beerling et al. (1996)andHeath and Kerstiens (1997)measuredgsc and photosynthetic rates in young beechand oak submitted to differentDs and atmosphericCO2 concentration. In oak,gsc was consistently re-duced in elevated CO2 while beech displayed lessstomatal closing response.Heath (1998)has shownthat in contrast to oak, the stomata of beech trees
growing in elevated CO2 failed to close normally inresponse to increasedDs. During drought, beechgscscarcely responded to CO2, over a wide range of ambi-entDs, whereas in oakgsc was reduced by an averageof 50% in elevated CO2. Species-specificgsc responsesto CO2 andDs vary, due to differences in morphologi-cal (rooting depth, conductive tissue, etc.) and physio-logical adaptations (cellular mechanism) (Abrams,1990). Hence for beech, most of the additional car-bon gains in elevated CO2 are made at the expense of

276 L. Misson et al. / Agricultural and Forest Meteorology 111 (2002) 265–282
Fig. 5. Relationship between measured and modelled daily tran-spiration for the validation period in (a) the oak stand and (b) thebeech stand.
water economy. For oak, stomatal regulation undermoisture stress seems to be controlled in order tomaintain photosynthesis at a high level while min-imising water loss.
4.4. Predictions for the 21st century
First, the predictions of transpiration were com-puted using the combined scenario of climate and at-mospheric CO2 changes. For the oak stand, ASPECTSpredicts a linear decrease of annual transpiration ratesduring the 21st century (Fig. 6a and Table 3). Thistrend is highly significant (p < 0.001). The slope
of the regression between time and predicted annualtranspiration rates gives the mean annual change oftranspiration for the period (−0.16 mm per year). Themean of the last 10 years of transpired water is 169 mmper year for the 20th century and 157 mm per year forthe 21st century, which is a decrease of 7%. For thebeech stand, ASPECTS predicts that the annual tran-spiration will decreases during the 21st century at therate of 0.06 mm per year, which is not statistically sig-nificant (p = 0.121) (Fig. 6aandTable 3). The meanof the last 10 years of transpired water is 189 mm peryear for the 20th century and 181 mm per year forthe 21st century, which is a decrease of 4%. There-fore, ASPECTS predicts that transpiration from forestcanopies will decrease in the course of the 21st cen-tury for both the oak and the beech stands, althoughthe expected decrease will be more substantial andsignificant for oak than for beech.
Predictions were also conducted with single-effectscenarios in order to analyse separately the individ-ual effects of climatic change and rising atmosphericCO2 on transpiration. Predictions of transpirationbased solely on the scenario of an increase in air tem-perature were computed with a constant atmosphericCO2 concentration of 360 ppm (Fig. 6b). For beech,the predicted annual transpiration rates gradually in-crease in more or less linear fashion. The regressionis highly significant (p < 0.001) and the slope is0.33 mm per year (Table 3). The mean of the last 10years of transpiration is 189 mm per year for the 20thcentury and 221 mm per year for the 21st century,thus showing a 17% increase. For oak, the positiveresponse of transpiration to temperature trend is lesssignificant than for beech (p = 0.072) and the slopeis only 0.06 mm per year (Table 3). The 10-year meanof transpiration is 168 mm per year for the end ofthe 20th century and 178 mm per year for the 21stcentury, which corresponds to a 6% increase.
In the model, higher temperature corresponded toan increase inDs, with two contrasting effects on tran-spiration rates. On the one hand, the driving force forwater diffusion out of the leaves increases (Eq. (8)).On the other hand,gsc decreases in response to an in-crease inDs (Eq. (6)). The magnitude of this responseis species-dependent. In our study, we obtained spe-cific gsc regulation parameters for oak and beech asa result of the calibration process. In the model, thefact thatD0 is lower for oak than for beech implies

L. Misson et al. / Agricultural and Forest Meteorology 111 (2002) 265–282 277
Fig. 6. Simulation of transpiration for the 20th and 21st centuries in the oak stand (continuous line) and the beech stand (dotted line),for (a) increased temperature and CO2 concentration, (b) increased temperature, and (c) increased CO2. Regression line between annualsimulated transpiration and year (period 2000–2100) are shown for the (a and b) scenarios.

278 L. Misson et al. / Agricultural and Forest Meteorology 111 (2002) 265–282
Table 3Linear regression between year (Y) and annual transpiration rates (E, mm) for the period 2000–2100
Scenario Species Regression p (F > Fobs)
Increased temperature and CO2 Oak E = 170−0.16Y <0.001Beech E = 181−0.06Y 0.121
Increased temperature Oak E = 172 + 0.06Y 0.072Beech E = 184 + 0.33Y <0.001
Increased CO2 Oak E = 168−0.32Y <0.001Beech E = 182−0.41Y <0.001
that sensitivity ofgsc to Ds is higher for oak than forbeech. For oak, the temperature-induced increase inatmospheric evaporative demand is counterbalancedby a down regulation ofgsc, accompanied by increas-ing Ds. As a result, the mean annual transpirationremains fairly constant in spite of increased tempera-tures, which can be interpreted as a strategy for main-taining high photosynthetic rates while minimisingwater loss. In contrast to oak, beech responds to anincrease in evaporative demand by increasing transpi-ration, because beechgsc is less down-regulated byDsthan oak.
Temperature-response curves of transpiration ratesas obtained with ASPECTS differ for beech and oak(Fig. 7). These curves were obtained by plotting thestand’s daily transpiration outputted by the ASPECTS
Fig. 7. Predictions of the ASPECTS model for daily transpiration asa function of temperature (continuous line, oak; dotted line, beech).Thick line segments represent the range of annual mean maximumtemperature (meanTmax) and annual absolute maximum tempera-ture (absoluteTmax) over the 21st century. Predictions conductedwith global radiation= 400 W m−2; relative humidity = 0.85;wind speed= 2.5 m s−1; atmospheric pressure= 1000 kPa.
model for temperature varying from 1 to 40◦C, withother climatic factors remaining constant and assum-ing no water stress (θstrs = 1). Differences betweenthe curve for oak and beech are due to a differencein the calibrated parameterD0, which reflects sensi-tivity to the evaporative demand from the atmosphere.Throughout the range of temperatures, transpirationcalculated for the oak is lower than for the beech stand.The maximum transpiration is attained at a lower tem-perature for the oak stand.
Furthermore, climatic conditions are not the samein Chimay (oak) as in Vielsalm (beech). Our down-scaled synthetic weather data sets for the 21st centurytake this difference into account. The climate in Chi-may is warmer than Vielsalm by an average of 0.9◦C(Table 1). For the beech stand, the synthetic weatherdata set is characterised by the annual mean of thedaily maximum temperature of 18 and 22◦C at theend of the 20th and 21st centuries (+4◦C), respec-tively. For oak, the temperature increases over thesame period of time from 19 to 24◦C (+5◦C). Theseranges in temperature are still in the linear ascendingpart of the transpiration response curve for the beechstand but are already in the parabolic part for the oak(Fig. 7). Moreover, the annual absolute maximumtemperature predicted for the 21st century is 31◦C inVielsalm and 34◦C in Chimay (Fig. 7).
Due to the combined effects of local climate andspecies-specificgsc control, transpiration rates ofbeech trees in Vielsalm will respond more to a temper-ature increase than those of the oak trees in Chimay.These factors may exhaust the soil water content inthe beech stand during summer. Levels of soil wa-ter stress were computed by the ASPECTS model(Eqs. (3)–(5) and (7)) at an hourly or half hourly timestep during all the prediction period (Fig. 8). For thebeech stand, some stresses due to water shortage have

L. Misson et al. / Agricultural and Forest Meteorology 111 (2002) 265–282 279
Fig. 8. Summer mean soil water stress computed by the ASPECTS model during the 20th and 21st centuries (continuous line, oak; dottedline, beech) for (a) increase temperature and CO2 concentration and (b) increased temperature.
already been computed for the 20th century (θstrs ∼=0.95) and should rise at the end of the 21st century(θstrs ∼= 0.85) based on the temperature increase sce-nario (Fig. 8b). For the oak stand, the soil water con-tent is high during the entire prediction period becausetranspiration is lower than for the beech stand. As aconsequence, in the oak stand almost no water stresshas been computed for the entire prediction period.
Annual transpiration was also computed with asingle CO2 increase scenario (Fig. 6c). To do this, wetook the same year of climatic data, i.e. 1999, over a200-year period together with the CO2 increase sce-nario from 1900 to 2100. For both species, the modelpredicts that transpiration will decrease significantlywith increasing CO2 concentrations because of a de-crease in stomatal conductance (Fig. 6candTable 3).Such a process has been widely described in severalpapers (Mansfield et al., 1990; Ceulemans, 1997;Morison, 1998). Although this response has not provedto be universal, it is at least quite general as hundredsof experiments lead to this result (Morison, 1998).Since the ASPECTS model uses a modified version ofLeuning’s model (Eq. (6)), gsc is directly proportionalto carbon assimilation and inversely proportional toCO2 concentration at the leaf surface. The ASPECTSmodel predicts that with increased atmospheric CO2concentrations, the numerator ofEq. (6)will increaseat a slower rate than its denominator, which will pro-gressively reducegsc (Fig. 9). For the beech stand,the mean of the last 10 years of transpired water is
Fig. 9. Predictions of the ASPECTS model for daily transpira-tion as a function of atmospheric CO2 concentration (continuousline, oak; dotted line, beech). Predictions conducted with globalradiation= 400 W m−2; temperature= 18◦C; relative humidity=0.85; wind speed= 2.5 m s−1; atmospheric pressure= 1000 kPa.
184 mm per year for the 20th century and 143 mmpeer year for the 21st century, thus showing a decreaseof 22% (Fig. 6c). For oak, the predicted transpirationrates decrease from 167 mm per year for the end ofthe 20th century to 136 mm per year for the end of the21st century, which corresponds to a decrease of 19%.
As a result of the combined increase in temperatureand atmospheric CO2 concentration, the ASPECTSmodel predicts that transpiration rates will decreasefor both experimental stands, but less for the beechthan for the oak stand (Fig. 6a). The difference

280 L. Misson et al. / Agricultural and Forest Meteorology 111 (2002) 265–282
between the two forest stands reflects the influence ofspecies-specificgsc regulation as obtained through thecalibration process of the model as well as site-specificclimatic conditions. Therefore, our results suggestthat Belgian deciduous forests are not at risk fromincreased water stress due to environmental changesin the course of the 21st century.Fig. 8ashows that inthe oak and the beech stands the level of water stressas computed by ASPECTS (Eq. (7)) remains verylow during the entire prediction period (θstrs> 0.95).
5. Concluding remarks
In order to predict the transpiration rates in twotemperate forest stands in Belgium, we have usedthe ASPECTS process-based model combined withsite-specific downscaled synthetic weather data setsfor the 20th and 21st centuries. We have demonstratedthat the ASPECTS model accurately simulates themeasured transpiration rates of Belgian deciduousforests by process-based modelling of species-specificphysiological properties. The results of the calibra-tion process are consistent with numerous stomatalregulation and drought sensitivity studies conductedon European beech and pedunculate oak. The AS-PECTS model has predicted that reduction of stom-atal conductance due to increasing CO2 concentrationand temperature will more than compensate increas-ing transpiration rates due to increasing evaporativedemand in the course of the 21st century. Thesecombined effects will result in an overall decreaseof transpiration rates of deciduous Belgian forests.Transpiration rates in both forests stands studiedresponded similarly, although with a different magni-tude, transpiration in the Vielsalm beech stand beingmore sensitive to increased temperatures than in theChimay oak site. We believe that improving descrip-tion of spatial and temporal climate variability at highresolution under environmental changes constitutesone of the next steps for improving predictions ofa model such as ASPECTS. Furthermore, althoughecophysiological processes, such as acclimation andclimate change effects on reserve dynamics and car-bon allocation remain insufficiently understood at thispoint to be fully integrated in long-term predictions,they might play a substantial role in controlling theresponse of the vegetation to 21st century environ-
mental conditions (Drake et al., 1997; Leroux et al.,2001). Nevertheless, because we predict that the tran-spiration response of Belgian deciduous forests tofuture environmental conditions is conservative, i.e. areduction in transpiration, it is unlikely that processeslike acclimation will reverse this trend and result inincreased water stress for these forests. The overallconclusion of this study is that the combined effectof increases of temperature and CO2 concentrationover the next century, should result in an insignificantchange in the transpiration of these two forests, pre-dicting no change in water stress of these areas due toclimate change.
Acknowledgements
This research was funded by the Belgian FederalOffice for Scientific, Technical and Cultural Affairsthrough the BELFOR project (contract no. GC/DD/05E) and by the Communauté Française de Belgique—Direction de la Recherche Scientifique—Actions deRecherches Concertées (contract no.ARC 98/03-219).We would like to thank the two reviewers and JohnB. Stewart who contributed to the improvement of theoriginal manuscript.
References
Abrams, M.D., 1990. Adaptations and responses to drought inQuercus species of North America. Tree Physiol. 7, 227–238.
Aubinet, M., Grelle, A., Ibrom, A., Rannik, U., Moncrieff, J.,Foken, T., 2000. Estimates of the annual net carbon and waterexchange of forests: the EUROFLUX methodology. Adv. Ecol.Res. 30, 113–175.
Aubinet, M., Chermanne, B., Vandenhaute, M., Longdoz, B.,Yernaux, M., Laitat, E., 2001. Long-term carbon dioxideexchange above a mixed forest in the Belgian Ardennes. Agric.Forest Meteorol. 108, 293–315.
Baldocchi, D., Meyers, T., 1998. On using ecophysiological,micrometeorological and biogeochemical theory to evaluatecarbon dioxide, water vapour and trace gas fluxes overvegetation: a perspective. Agric. Forest Meteorol. 90, 1–25.
Baldocchi, D., Wilson, K.B., 2001. Modelling CO2 and watervapour exchange of a temperate broad-leaved forest acrosshourly to decadal time scales. Ecol. Model. 142, 155–184.
Beerling, D.J., Heath, J., Woodward, F.I., Mansfield, T.A.,1996. Drought–CO2 interactions in trees: observations andmechanisms. New Phytol. 134 (2), 235–242.
Boden, T.A., Kaiser, D.P., Sepanski, R.J., Stoss, F.W., 1994.Trends’ 93: A Compendium of Data on Global Change.

L. Misson et al. / Agricultural and Forest Meteorology 111 (2002) 265–282 281
ORNL/CDIAC-65. Carbon Dioxide Information AnalysisCenter, Oak Ridge National Laboratory, Oak Ridge, TN.
Boer, G.J., Flato, G.M., Reader, M.C., Ramsden, D., 2000a. Atransient climate change simulation with historical and projectedgreenhouse gas and aerosol forcing: experimental design andcomparison with the instrumental record for the 20th century.Climate Dyn. 16, 405–425.
Boer, G.J., Flato, G.M., Ramsde, D., 2000b. A transient climatechange simulation with historical and projected greenhouse gasand aerosol forcing: projected climate for the 21st century.Climate Dyn. 16, 427–450.
Bréda, N., Cochard, H., Dreyer, E., Granier, A., 1993a.Field comparison of transpiration, stomatal conductance andvulnerability to cavitation ofQuercus petraeaand Quercusrobur under water stress. Ann. Sci. Forestières 50, 571–582.
Bréda, N., Cochard, H., Dreyer, E., Granier, A., 1993b. Watertransfer in a mature oak stand (Quercus petraea): seasonalevolution and effects of a severe drought. Can. J. Forest Res.23, 1136–1143.
Cermák, J., Huzulak, J., Penka, M., 1980. Water potential and sapflow rate in adult trees with moist and dry soil as used for theassessment of root system depth. Biol. Plantarum 22, 34–41.
Ceulemans, R., 1997. Direct impacts of CO2 and temperatureon physiological processes in trees. In: Mohren, G.M.J (Ed.),Impacts of Global Change on Tree Physiology and ForestEcosystems. Kluwer Academic Publishers, Dordrecht, pp. 3–14.
Cowan, I.R., 1982. Regulation and water use in relation to carbongain in higher plants. In: Lange, O.L., Nobel, P.S., Osmond,C.B. (Eds.), Encyclopaedia of Plant Physiology. Springer,Berlin, pp. 589–613.
Dagnelie, P., Palm, R., Rondeux, J., Thill, A., 1999. Tables decubage des arbres et des peuplements forestiers. Les PressesAgronomiques de Gembloux, Gembloux, p. 126.
de Pury, D.G.G., Farquhar, G.D., 1997. Simple scaling ofphotosynthesis from leaves to canopies without the errors ofbig-leaf models. Plant Cell Environ. 20, 537–557.
Dickson, R.E., Tomlinson, P.T., 1996. Oak growth, developmentand carbon metabolism in response to water stress. Ann. Sci.Forestières 53, 181–196.
Drake, B.G., Gonzalez-Meler, M.A., Long, S.P., 1997. Moreefficient plants: a consequence of rising atmospheric CO2. Ann.Rev. Plant Physiol. Plant Mol. Biol. 48, 607–637.
Flato, G.M., Boer, G.J., Lee, W.G., McFarlane, N.A., Ramsden,D., Reader, M.C., Weaver, A.J., 2000. The Canadian Centre forClimate Modelling and Analysis Global Coupled Model andits climate. Climate Dyn. 16, 451–467.
Granier, A., 1987. Evaluation of transpiration in a Douglass-firstand by means of sap flow measurments. Tree Physiol. 3,309–320.
Granier, A., Loustau, D., 1994. Measuring and modelling thetranspiration of a maritime pine canopy from sap flow data.Agric. Forest Meteorol. 71, 61–81.
Guehl, J.M., Aussenac, G., 1987. Photosynthesis decrease andstomatal control of gas exchange inAbies albaMill. in responseto vapour pressure difference. Plant Physiol. 83, 316–322.
Hari, P., Mäkelä, A., Korpilahti, E., Holmberg, E., 1986. Optimalcontrol of gas exchange. Tree Physiol. 2, 169–175.
Heath, J., 1998. Stomata of trees growing in CO2-enriched airshow reduced sensitivity to vapour pressure deficit and drought.Plant Cell Environ. 21, 1077–1088.
Heath, J., Kerstiens, G., 1997. Effects of elevated CO2 on leaf gasexchange in beech and oak at two levels of nutrient supply:consequences for sensitivity to drought in beech. Plant CellEnviron. 20, 57–67.
Heath, J., Kerstiens, G., Tyree, M.T., 1997. Stem hydraulicconductance of European beech (Fagus sylvaticaL.) andpedunculate oak (Quercus roburL.) grown in elevated CO2. J.Exp. Bot. 48, 1487–1489.
Hoffman, F., 1995. FAGUS, a model for growth and developmentof beech. Ecol. Model. 83, 327–348.
Hougthon, J.T., Jenkins, G.J., Ephraums, J.J., 1993. Climatechange. The IPCC Scientific Assessment. Cambridge UniversityPress, Cambridge, pp. 364.
Houghton, J.T., Meira Filho, L.G., Bruce, J., Hoesung, L.,Callander, B.A., Haites, E., Harris, N., Maskell, K., 1995.Radiative Forcing of Climate Change and an Evaluation of theIPCC IS92 Emission Scenarios. Intergovernmental Panel onClimate Change.
Jarvis, P.G., McNaughton, K.G., 1985. Stomatal control oftranspiration: scaling up from leaf to region. Adv. Ecol. Res.15, 1–49.
Kellomäki, S., Wang, K.Y., 1999. Short-term environmentalcontrols of heat and water vapour fluxes above a boreal coni-ferous forest: model computation compared with measurmentsby Eddy correlation. Ecol. Model. 124, 145–173.
Kerstiens, G., Townend, J., Heath, J., Mansfield, T.A., 1995. Effectsof water and nutrient availability on physiological responses ofwoody species to elevated CO2. Forestry 68, 303–315.
Kidson, J.W., Thompson, C.S., 1998. A comparison of statisticaland model-based downscaling techniques for estimating localclimate variations. J. Climate 11, 735–753.
Kramer, P.J., Kozlowski, T.T., Pallardy, S.G., 1995. ThePhysiological Ecology of Woody Plants. Academic Press, SanDiego, p. 657.
Laitat, E., Chermanne, B., Portier, B., 1999. Biomass, carbon andnitrogen allocation in open top chambers under ambient andelevated CO2 and in a mixed forest stand. A tentative approachfor scaling up from the experiments of Vielsalm. In: Ceulemans,R., Veroustraete, F., Gond, V., Van Rensbergen, J. (Eds.), ForestEcosystem Modelling, Upscaling and Remote Sensing. SPBAcademic Publishing, The Hague, pp. 33–60.
Lee, H.S.J., Overdieck, D., Jarvis, P.G., 1998. Biomass, growthand carbon allocation. In: Jarvis, P.G. (Ed.), European Forestsand Global Change: The Likely Impacts of Rising CO2
and Temperature. Cambridge University Press, Cambridge,pp. 126–191.
Leroux, X., Lacointe, A., Escobar-Gutiérrez, A., Le Dizès, S.,2001. Carbon-based models of individual tree growth: A criticalappraisal. Ann. For. Sci. 58, 469–506.
Leuning, R., 1995. A critical appraisal of a combined stomatalphotosynthesis model for C3 plants. Plant Cell Environ. 18,339–355.
Leuning, R., Kelliher, F.M., de Pury, D.G.G., Schulze, E.D., 1995.Leaf nitrogen, photosynthesis, conductance and transpiration:

282 L. Misson et al. / Agricultural and Forest Meteorology 111 (2002) 265–282
scaling from leaves to canopies. Plant Cell Environ. 18, 1183–1200.
Lüdeke, M.K.B., Badeck, F.W., Otto, R.D., Häger, C., Dönges,S., Kindermann, J., Würth, G., Lang, T., Jäkel, U., Klaudius,A., Ramge, P., Habermehl, S., Kohlmaier, G.H., 1994. TheFrankfurt biosphere model: a global process-oriented modelof seasonal and long-term CO2 exchange between terrestrialecosystems and the atmosphere. I. Model description andillustrative results for cold deciduous and boreal forests. ClimateRes. 4, 143–166.
Mahfouf, J.F., Noilhan, J., 1991. Comparative study of variousformulations of evaporation from bare soil using in situ data.J. Appl. Meteorol. 30, 1354–1365.
Mansfield, T.A., Hetherington, A.M., Atkinson, C.J., 1990. Somecurrent aspects of stomatal physiology. Ann. Rev. Plant Physiol.Plant Mol. Biol. 41, 55–75.
Mickler, R.A., Birdsey, R.A., Hom, J., 2000. Responses of northernUS forests to environmental change. Ecological Studies, Vol.139. Springer, New York, 513 pp.
Monteith, J.L., Unsworth, M.H., 1990. Principles of EnvironmentalPhysics, 2nd Edition. Edward Arnold Press, London, p. 291.
Morison, J.I.L., 1998. Stomatal response to increased CO2
concentration. J. Exp. Bot. 49, 443–452.Rasse, D.P., 2002. Nitrogen deposition and atmospheric CO2
interactions on fine root dynamics in temperate forests: atheoretical model analysis. Global Change Biol. 8, 486–503.
Rasse, D.P., François, L., Aubinet, M., Kowalski, A.S., VandeWalle, I., Laitat, E., Gérard, J.C., 2001a. Modelling short-termCO2 fluxes and long-term tree growth in temperate forests withASPECTS. Ecol. Model. 141, 35–52.
Rasse, D.P., Longdoz, B., Ceulemans, R., 2001b. TRAP: amodelling approach to below-ground carbon allocation intemperate forests. Plant Soil 229, 281–293.
Rasse, D.P., Nemry, B., Ceulemans, R., 2001c. Stand thinningeffects on C fluxes in 20th and 21st century Scots pine forests: asensitivity analysis using ASPECTS. In: Carnus, J.-M., Dewar,R., Loustau, D., Tomé, M. (Eds.), Models for the SustainableManagement of Temperate Plantation Forests. European ForestInstitute, Joensuu, Finland, pp. 17–30.
Sala, A., Tenhunen, J.D., 1996. Simulations of canopy netphotosynthesis and transpiration inQuercus ilexL. under theinfluence of seasonal drought. Agric. Forest Meteorol. 78,203–222.
Saxton, K.E., Rawls, W.J., Romberger, J.S., Papendick, R.I., 1986.Estimating generalised soil–water characteristics from texture.Soil Sci. Soc., Am. J. 50, 1031–1036.
Stott, P.A., Tettn, S.F.B., 1998. Scale-dependent detection ofclimate change. J. Climate 11, 3282–3294.
Tardieu, J.D., Davies, W.J., 1993. Integration of hydraulic andchemical signalling in the control of stomatal conductanceand water status of droughted plants. Plant Cell Environ. 16,341–349.
Tenhunen, J.D., Sala, A., Harley, P.C., Dougherty, R., Reynolds,J.F., 1990. Factors influencing carbon fixation and water useby Mediterranean sclerophyll shrubs during summer drought.Oecologia 82, 381–393.
Vanninen, P., Ylitalo, H., Sievänen, R., Mäkelä, A., 1996. Effectsof age and site quality on the distribution of biomass in Scotspine (Pinus sylvestrisL.). Trees 10, 231–238.
Viterbo, P., Beljaars, C.M., 1995. An improved land surfaceparametrization scheme in the ECHWF model and itsvalidation. J. Climate 8, 2716–2748.
Zogg, G.P., Zak, D.R., Burton, A.J., Pregitzer, K.S., 1996. Fineroot respiration in northern hardwood forests in relation totemperature and nitrogen availability. Tree Physiol. 16, 719–725.