Embed Size (px)
Citation preview
Journal of Leukocyte Biology Volume 61, May 1997 637
Preliminary characterization of diacyiglycerol generation in
human basophils: temporal relationship to histamine
release and resolution of degranulationAlfonso Oriente, Thomas Hundley, Walter C. Hubbard, and Donald W. MacGlashan, Jr.
Johns Hopkins Asthma & Allergy Center, Baltimore, Maryland
Abstract: Purified human basophils were examined
for changes in diacylglycerollevels to determine whether
the transient nature of a N-formyl-methionyl-leucyl-
phenylalanine (fMLP) -stimulated elevation in mem-
brane protein kinase C (PKC) activity could be ex-
plained by the transient production of diacyiglycerol
(DAG). In preliminary experiments total 1MG levels
were measured by the DAG kinase assay. AltJ�ough ele-
vations followed stimulation with 1 tM fMLP (basal
levels of 15 pmol/106 basophils vs. 45 pmolIlO6 baso-
phils at the 3-mm time point), there were no detect-able changes in the first 60 s ofthe reaction. Histamine
release is typically complete by 30-45 s. Measurement
ofinositol trisphosphate indicated a rapid increase by
5 5 of2.5 pmolIlO6 basophils. IfDAG were produced
at similar levels, the DAG kinase assay would not havedetected the elevation. Consequently, fMLP-sthnulated
basophils were examined for changes in 1-stearoyl, 2-
arachidonoyl, 3-sn-glycerol (SA-DAG) and 1-oleoyl,2-arachidonoyl, 3-sn-glycerol by GC-NICIMS (nega-
five ion chemical ionization mass spectroscopy). A 5-s
elevation in these two species averaged 2 pmol/106basophils, consistent with the inositol trisphosphatelevels and occurring during the period of histaminerelease. However, a much more pronounced secondphase to the SA-DAG response also occurred, mirroring
the total DAG levels. This second phase of the DAG
response, either total or SA-DAG, was transient on a
time scale temporally coincident with the appearance
and resolution of degranulation sacs as measured byfluorescence microscopy. These data suggest that thereis selective generation of DAG species in the early re-
action and the later appearance ofDAG may be relatedto the formation and resolution of granule structures
that follow the secretion ofhistamine. J. Leukoc. Biol.
61: 637-642; 1997.
Key Words: signal transduction . lipids . molecular species
INTRODUCTION
As in most secretory cells, protein kinase C (PKC) appears
to participate in the early signal transduction of several re-
ceptor systems in human basophils [1, 2]. In studies per-
formed several years ago, we found that a kinase activity
that was dependent on Ca2� and phosphatidylserine in-
creased in the membranes of basophils stimulated with either
anti-IgE antibody or N-formyl-methionyl-leucyl-phenylalanine
(IMLP) 11, 2]. During fMLP stimulation the activity ap-
peared to translocate from the cytosol to the membrane in a
manner consistent with many other studies ofPKC 121. AfterIgE-mediated stimulation, membrane activity increased in
the absence of a loss in the cytosolic fraction �1, 2]. In both
cases, however, this enzymatic activity, which appeared to
be PKC, was transient. For IgE-mediated release, PKC ac-
tivity returned to resting levels after approximately 30 mm,
at a time when histamine release had ceased. For IMLP
the reaction resolved faster (< 5 mm), on a time scale con-
sistent with the faster histamine release (and its cessation)
and the faster generation of a cytosolic calcium elevation for
this secretagogue. We therefore became interested in which
factors were controlling the PKC reaction and whether known
PKC activators displayed a similar transient behavior.
Enzymatic activity of the classical PKC isozymes, both
calcium dependent and independent (type I and II), de-
pends on the presence of diacylglycerols f3, 4]. However,
many studies of diacylglycerol (DAG) generation find that
elevations of this second messenger persist for relatively
long periods of time. For example, in rat peritoneal mast
cells, histamine release is complete within the first 2-3 mmwhereas DAG remains elevated for at least 30 mm t�, 61.
If a similar pattern were to occur during either fMLP or
anti-IgE antibody-mediated stimulation of human baso-
phils, the transient nature of PKC activity would not result
from regulation of DAG but some other factor or process.
This study was begun to determine the pattern of DAG
generation in basophils stimulated with fMLP. The goal
was to determine whether DAG generation was transient on
a time scale that would appropriately explain the transient
activity of PKC.
Abbreviations: IMLP, N-formyl-methionyl-leucyl-phenylalanine; PKC.
protein kinase C; DAG. diacylglycerol; IP3, inositol trisphosphatase;
HPLC. high-performance liquid chromatography.
Correspondence: Donald W. MacGlashan, Jr. . Johns Hopkins
Asthma & Allergy Center. 5501 Hopkins Bayview Circle, Baltimore, MD
21224.Received November 25. 1996; revised February 5. 1997; accepted
February 6, 1997.
638 Journal of Leukocyte Biology Volume 61, May 1997
METHODS
Reagents
The suppliers for the following reagents were as follows: high-performance
liquid chromatography (HPLC) grade chloroform and HPLC grade water
(Burdick & Jackson, Muskegon, IL), HPLC grade hexane (Curtis & Mat-
theson, Houston, TX), HPLC grade methanol (J. T. Baker, Philippsburg,
NJ), hydrochloric acid (Fisher Scientific, Fair Lawn, NJ), anhydrous di-
ethyl ether (Mallinckrodt, Paris, KY), [32PJATP (DuPont Medical Prod-
ucts, Wilmington, DE), silica gel (Silicar type 60 A; Maffinckrodt), sn-
1,2-diacylglycerol assay (Amersham, Amersham, UK). glasswool (Pesti-
cide Grade, Supelco, Bellefonte, PA); and inositol trisphosphate assay
kit (Amersham).
Buffers
PAG buffer consisted of the following: 25 mM PIPES (Sigma Chemical
Co., St. Louis, MO), 140 mM NaC1, 5 mM KC1, 0.003% human serum
albumin (Miles Laboratories, Elkhart, IN), and 0.1% glucose. PAGCM
consisted of PAG with 1 mM CaC12 and 1 mM MgCI2.
Cell preparation
Basophils were purified from residual leukocytes, obtained from normal
donors undergoing plateletpheresis, using counter-current elutriation
and Percoll density gradients as previously described [7J. Basophils
were stained with alcian blue 181 and counted in a Spiers-Levy cy-
tometer. In the experiments presented, basophil purities ranged from
84 to 90% with an average of 87%. For both the assays of DAGs, a com-
parison was made between the responses observed in these purified
basophil preparations and cell preparations containing only the contam-
inant cells typically present. For these assays, changes in DAG in the
contaminant cells were found to range from 100 to 150% of the re-
sponse observed in the purified basophils. These results indicated that
only a small component of the observed responses in the purified baso-
phil preparations could be attributed to the contaminant cells.
Histamine release measurements
Histamine release was determined by the automated method of Siragan-
ian 191 and histamine release was calculated as the ratio of released his-
tamine to total histamine after subtracting the spontaneous release from
each value.
TotalDAG analysis
Cellular reactions were stopped by transferring the cells to a borosilicate
glass tube containing a mixture of chloroform/methanol/0.01 N hydro-
chloric acid (v/v; 0.5/1/0.4), which is a modification of the procedure
of Bligh and Dyer 1101. The chloroform was removed under a stream
of nitrogen, the lipids were resuspended in 5% etherfhexane, and the
samples passed through a silicic acid minicolumn ( � 75 �tL of silicic
acid in cut-off glass pipettes). Triglycerides were removed by eluting with
0.6 mL of 15% ether/hexane, and the DAGs removed with 0.6 mL of
35% ether/hexane. Phospholiplids were retained on the silicic acid.
These percentages were predetermined by testing the column elution
with radiolabeled triglycerides, 1-stearoyl, 2-arachidonoyl glycerol, or
1-stearoyl, 2-arachidonoyl phosphatidyl choline (New England Nuclear)
and are similar to those reported by Kennerly � The 35% fractions
were recovered in prewashed (methanol and ethyl ether/hexane 35%)
polypropylene tubes and evaporated under a stream of nitrogen. DAG
was measured according to the manufacturer’s protocol (Amersham).
The basis for this assay is the labeling of sample DAG with 32PO4 cat-
alyzed by Escherichia coli-derived DAG kinase �11, 121. 32P04-DAG
is separated from the ‘y-32P04 donor, ATP, by extraction. The assay is
linear for approximately 3 logs of sample or standard DAG. DAG recov-
eries were determined by including within each experiment cell samples
to which a small amount of DAG was added (two to three times more than
a typical stimulation level) to cells just before the Bligh-Dyer extraction.
Recoveries averaged 71 ± 16% (mean ± SD). The l32Plphosphatidic
acid generated was determined by liquid scintillation counting and the
amount of DAG generated was calculated against a standard curve. The
values plotted do not reflect the average 70% recoveries.
Inositol trisphosphate levels (1P3)
1P3 levels in basophils were measured with the commercially available
receptor-based assay from Amersham. The basis for this assay is the
competitive binding of radiolabeled IP3 with the unlabeled sample IP3
to a preparation of the 1P3 receptor. With the exception that the IP3 re-
ceptor was used to capture 1P3. rather than an antibody, this assay was
analyzed like a radioimmunoassay. There were a few modifications nec-
essary. It was previously noted 1131 that the granule proteoglycans pres-
ent in RBL cells would interfere with the measurement of 1P3 by this
method. The solution for the RBL cell studies, which we used, was to
filter the lysed basophil supernatants with Millipore 10,000 NMWL
Ultrafree#{174}-MC filter units. The procedure was to challenge 75 �tL of cell
suspension with 75 i�tL of stimulus, stop the reaction with 30 p1 of tn-
chloroacetic acid, and extract with 340 p1 of the recommended
TCE/tnioctylamine (see manufacturer’s protocol). This recovered enough
solution to filter with the Millipore units to recover a sample for the 1P3
assay. Centrifugation of the Millipore units was carried out at 2500 rpm
( � 1000 g) for 2 h at 4#{176}C.To determine the recovery of 1P3 in the con-
text of the entire assay, each experiment included resting cell samples
(resting cells only), which were spiked with levels of IP3 consistent with
the stimulated levels expected (1 and 3 pmol) just before lysis with TCA.
Recovery averaged 88 ± 25% (n = 7, mean ± SD).
Extraction, derivatization, and GC-NICIMS analysis ofthe 1-stearoyl-2-arachidonoyl-sn-3-glycerol
The procedures for the extraction, denivatization, and GC-NICIMS analy-
sis of the 1-stearoyl-2-arachidonoyl-sn-3-glycerol were performed as re-
cently described 1141. Briefly, the cells were initially processed as de-
scnibed above for the total DAG assay. However, a standard amount of
2H3-1-stearoyl-3-arachidonoyl-sn-2-glycerol (deuterated standard) was
added to the initial buffer-CHC13-methanol mixture of the Bligh-Dyer
extraction before phase separation. The mini-columns were run only to
remove phospholipids, therefore, the samples were resuspended in hex-
ane, run into the columns, and the columns eluted with 35% ether!
hexane. These samples were dried under nitrogen and derivatized with
pentafluorobenzoyl chloride for analysis by GC-NICIMS.
Morphometrics of basophil degranulation bymicroscopy
The procedures for determining the appearance of fluorescent-free re-
gions within basophils undergoing degranulation are complex and the
algorithms used are fully described in a prior publication from this lab-
oratory 1151. In these previous studies, the method to determine the size
of holes within the cell was presented but those studies did not spe-
cifically present the data concerning this parameter, focusing instead on
measurements of cell perimeter. However, the same algorithm gives a
pixel count that is the sum of all hole perimeters for a particular cell.
Briefly, as a stimulated basophil degranulates, fluorescent-free regions
appear within the cell. Similar regions appear in electron microscopic
images and are shown to be large degranulation sacs, the expansion of
normal granules during the resolution of the response f16J. To obtain
measurement of these regions with the use of light microscopy, basophils
were labeled with Fura-2!AM and changes in morphology (and calcium)
were monitored by fluorescence digital videomicroscopy. Applying the
aforementioned algorithms to the fluorescent images extracts the size of
the perimeters ofthese regions for each cell under observation. The data
for the m 50 cells under observation during a typical challenge was
averaged at each of 50-100 time points and is presented as the net
change in the hole perimeter above resting levels (although, in fact the
resting cells had no measurable holes).
U)
�30
2 25
� 20
�15
(�10
z0
Time After fMLP Addition, S Time After fMLP Addition, s
RESULTS noted in Methods, recovery of 1P3 was not statistically dif-
ferent than 100%, so this value should be approximately
Kinetics of total DAG generation correct. Resting levels averaged less than 0.25 pmol/106
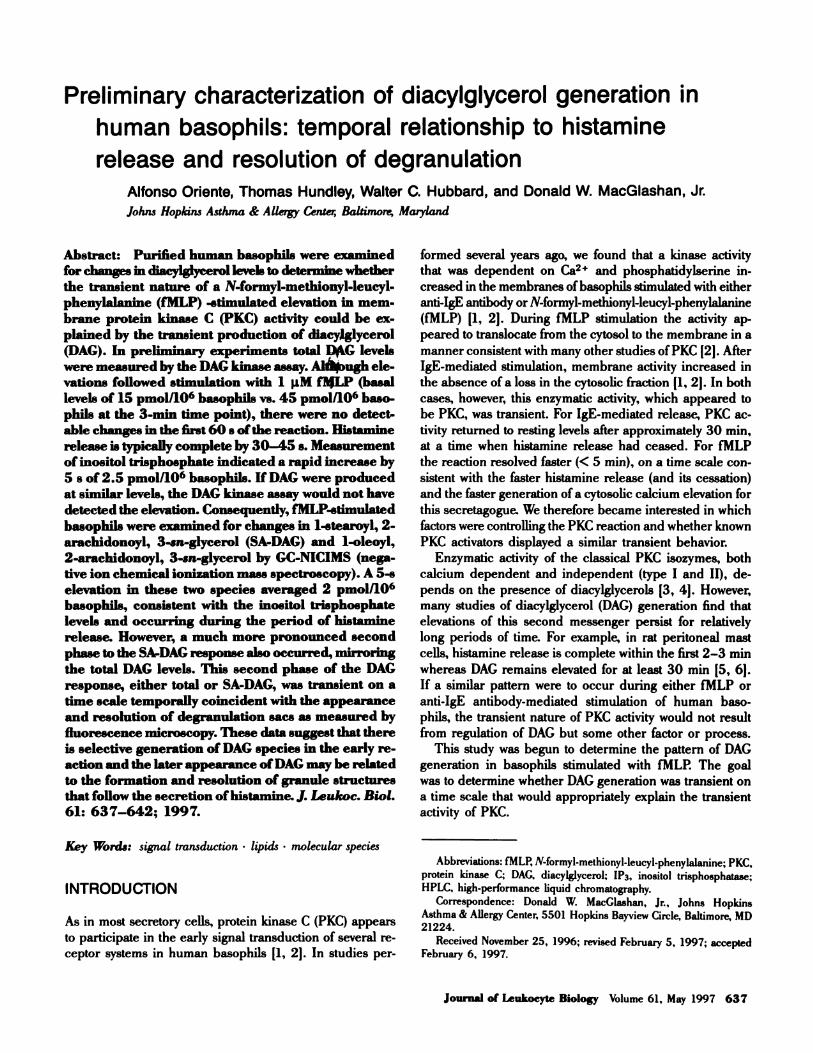
Total DAG generation was first examined by use of the total
DAG kinase assay described 15 years ago in studies of rat
mast cells �i1]. Figure 1 shows the kinetics of DAG gen-
eration following stimulation with 1 �tM fMLP. Figure 1,
left, shows the kinetics over a 20-mm period following stim-
ulation whereas Figure i, right, expands the early time
frame, placing the results in the context of the kinetics of
histamine release. The data show that elevations in total
DAG occurred with this stimulus, beginning with an aver-
age resting level of 15 pmol/i06 basophils; net peak eleva-
tions of 30 pmol/i06 basophils occurred between 3 and
5 mm after the addition of fMLP. However, as seen in Fig-
ure 1, right, no elevations were detectable before or during
histamine release. Therefore, although this stimulus could
cause elevations in DAG, no elevations were observable in
basophils. Comparing these results with the data in Figure 2,
it can be appreciated that if DAG were generated at similar
(instantaneous) steady state levels early in the reaction, the
elevations would not be measurable (a minimum of 3- to 5-
pmol elevation would be discernible given the intra-replicate
variation).
Previous studies in other cell types have noted that phos-
phatidylinositols have a prevalence of arachidonic acid in
the 2-acyl position [17]. Indeed, a predominant species
has stearic acid in the snl position and arachidonic acid
in the sn2 position, leading to the generation of 1-stearoyl,
2-arachidonoyl, sn-3-glycerol (SA-DAG) following hydro-
lysis with phospholipase C. We have recently developed an
extremely sensitive method of measuring DAG molecular
species but have thus far only applied it to the measure-
the time frame of histamine release.
Previous studies of PKC activation indicated that in- 2.5
creased membrane activity occurred within 5 s of stimula-
tion 121. Furthermore, previous studies of cytosolic calcium
demonstrated an increase that occurred within 1-2 s after 2
the addition of fMLP. It is highly likely that this initial ele-
vation of Ca2� results from the generation of 1P3, although
this hasn’t been formally proven for human basophils. fMLP-
mediated stimulation of basophils is pertussis toxin sensitive
and it is expected that this GTP-binding protein-mediated
reaction results in the activation of PLC�3, which should
.Ea.0� � .5Cl)
.�
0�a)� -iEa.
subsequently result in the generation of both IP3 and DAG
from phosphatidylinositols. Therefore, we examined IP3
cv�
0.5
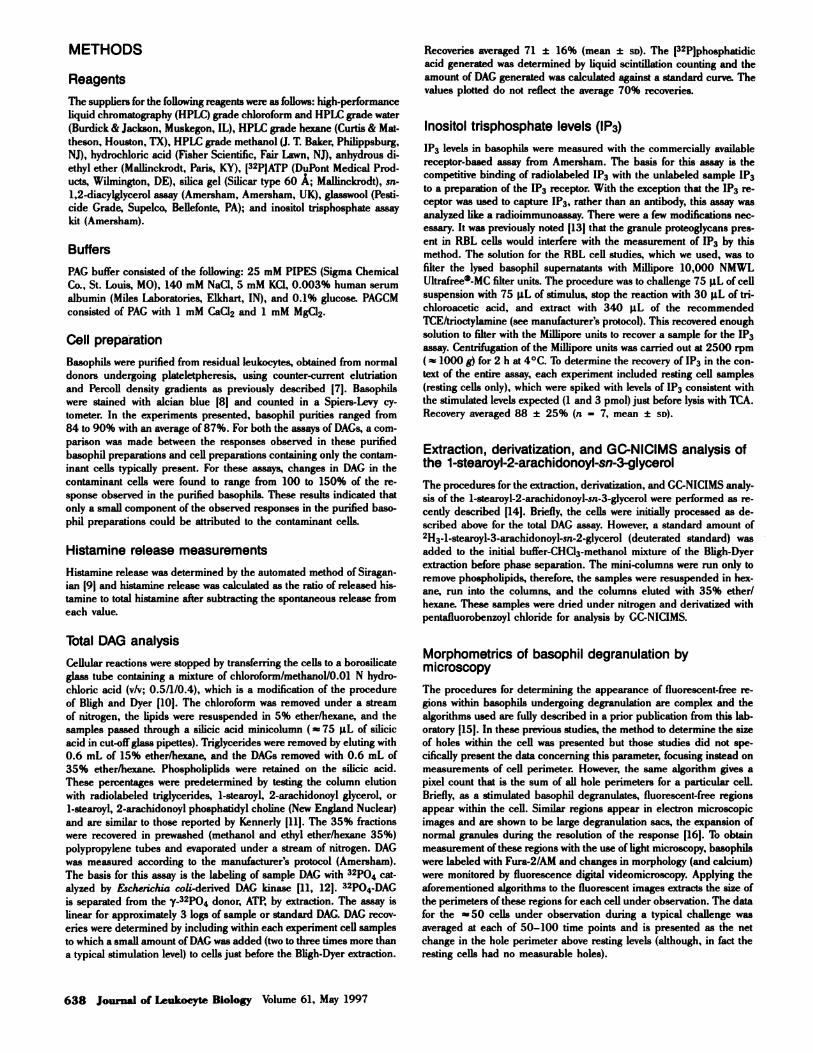
generation following stimulation of basophils with 1 �iM
fMLP. The results are shown in Figure 2. As expected,
1P3 levels increased at the earliest measured point, 5 s,
and decayed toward resting levels by 5 mm. There was sig-
nificant variation in the response of different basophil prep-
0� ....i....t....j.... I
0 50 100 150 200
Time After fMLP Stimulation, S
arations, which is reflected in the wide range of the data,
with a rapid decay occurring in some preparations and a
somewhat sustained response occurring in others. On aver-
age, the peak elevation was approximately 2.5 pmol/i06basophils (ranging from 1 to 5 pmol/i06 basophils). As
Fig. 2. 1P3 elevations: basophils were stimulated with 1 �tM IMLP,
cells extracted at the times shown, and 1P3 levels measured with a
receptor-based binding assay (n = 4). Basophil purity averaged 85 ±
2% and histamine release averaged 78 ± 28%. Basal levels of lP3 aver-
aged < 0.25 pmol/106 basophils (below the S!N of 2 in the 1P3 assay).
range = 1 -5 pmoIes/10� basophils n=4
35
Oriente et al. Diacyiglycerol changes in human basophils 639
Fig. 1. Total DAG elevations: basophils
were stimulated with 1 �tM fMLP, cells
extracted at the times shown, and total
DAG measured with the DAG kinase as-
say (n = 5). Basophil purity averaged 81
± 9% and histamine release averaged
63 ± 34%. (A) The entire time period ex-
amined; (B) the first � 2 mm. Basal levels
of DAG averaged 15 pmol!106 basophils.
Data is not adjusted for DAG recoveries
(see text). The sketched-in curve labeled
HR is the normal IMLP histamine release
kinetics as determined from numerous
previous studies, with a half-maximum at
15 s.
0 200 400 600 800 1000 1200
Time After fMLP, S
640 Journal of Leukocyte Biology Volume 61, May 1997
U)
0.
0
a0
Ea
a
c,J
‘9
az
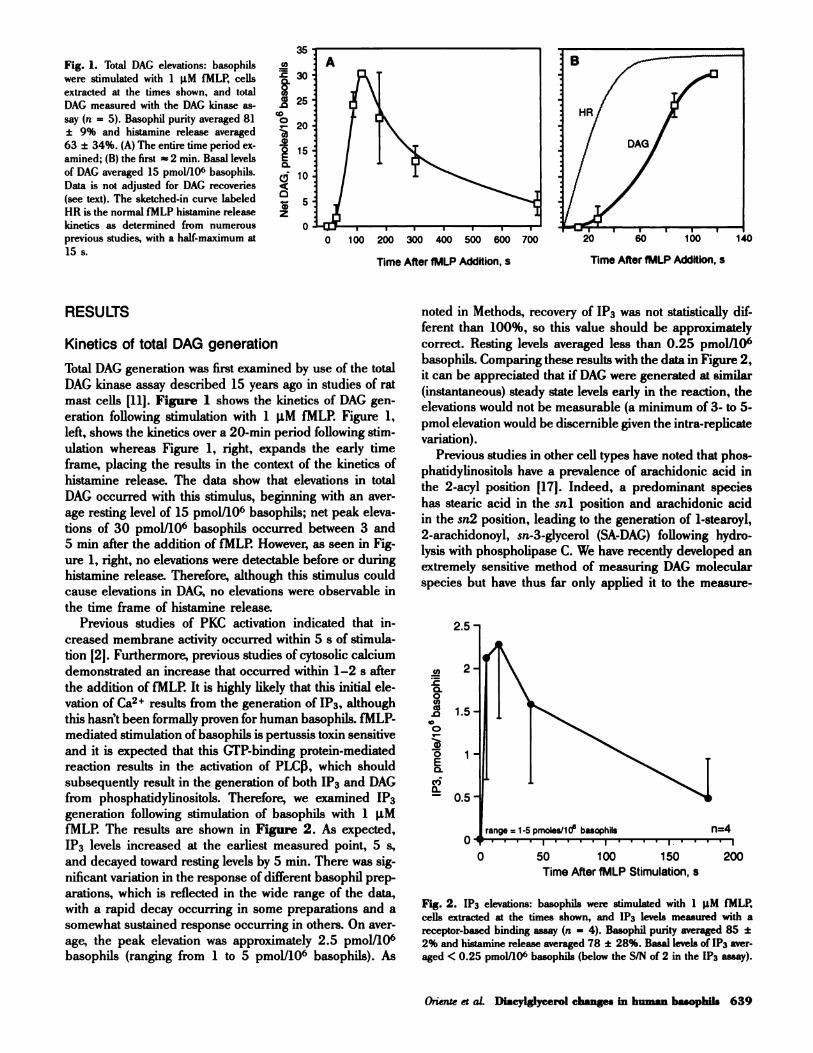
Fig. 3. Elevations in 1-stearoyl 2-arachidonoyl-sn-3-glycerol after stim-
ulation of basophils with 1 �iM fMLP (n = 5). Basophil punities aver-
aged 87 ± 2% and histamine release averaged 79 ± 18%. The gray
tracing represents the 1P3 data. derived from Figure 2, to demonstrate
the temporal relationship of the two kinetic curves.
ment of SA-DAG and two related species. Figure 3 shows
the changes in SA-DAG after stimulation with i �tM fMLP.
In these experiments, resting levels ofSA-DAG averaged 1.1
pmol/106 basophils. fMLP induced a biphasic response,
with a net average increase in SA-DAG, in the 5- to 60-s
time frame, of 1.5 pmol/i06 basophils. The range of this
increase varied among preparations from 0.9 to 4 pmol/
106 cells. A second much stronger increase occurred with
a peak at 3 mm. Indeed, approximately 98% of the SA-
DAG mass was generated in the time frame previously as-
sociated with the late increase in total DAG (measured with
the kinase assay). Like the total DAG, SA-DAG generation
subsided by 15-20 mm. The stimulation index (stimulated!
resting levels) for this species in the early time frame was
2.2 ± 0.3 and averaged 6.0 ± 1.1 for the 3-mm measure-
ment. Histamine release averaged 79% but calculated as a
stimulation index (stimulated release/spontaneous release)
was 6.4 ± 0.7. A close molecular relative, i-oleoyl, 2-
arachidonoyl-sn-3-glycerol is also generated, starting with
a resting level of 0.4 pmol/106 basophils and increasing to
an average net of 0.5 pmol/106, whereas 1-linoleoyl-2-
arachidonoyl-sn-3-glycerol was not detected in resting or
stimulated cells. It is of interest to note that the summation
of the two measured DAG species, � 2 pmol/i06 cells, was
close to the average IP3 increase of 2.5 pmol!i06 baso-
phils (see Discussion).
The above data indicate that SA-DAG generation occurs
within the proper time frame for histamine release, mirror-
ing the increase in IP3 and elevations in Ca. However, fol-
lowing stimulation with fMLP, the greatest increases in
both SA-DAG and total DAG levels occurred after the com-
pletion of histamine release. As noted in the Introduction,
our goal was to determine whether the generation of DAG
followed a time course that could explain the transient na-
ture of PKC activation. Membrane PKC activity following
stimulation with fMLP returns to resting levels within 5
mm, whereas DAG is actually peaking at this time point.
Clearly, the DAG data doesn’t support the transient nature
of the PKC activity curve. We have previously noted that
basophils undergo remarkable morphological changes dur-
ing stimulation with fMLP. These changes can be observed
and measured by fluorescent light microscopy. By fluo-
rescence microscopy, the cells develop cytoplasmic holes,
which by electron microscopy represent a stage in the res-
olution of the degranulation process. In particular, these
holes probably represent extremely large degranulation
sacs observed by electron microscopy. When these hole for-
mations are measured (see Methods) after stimulation with
fMLP, their appearance rises and falls on the same time
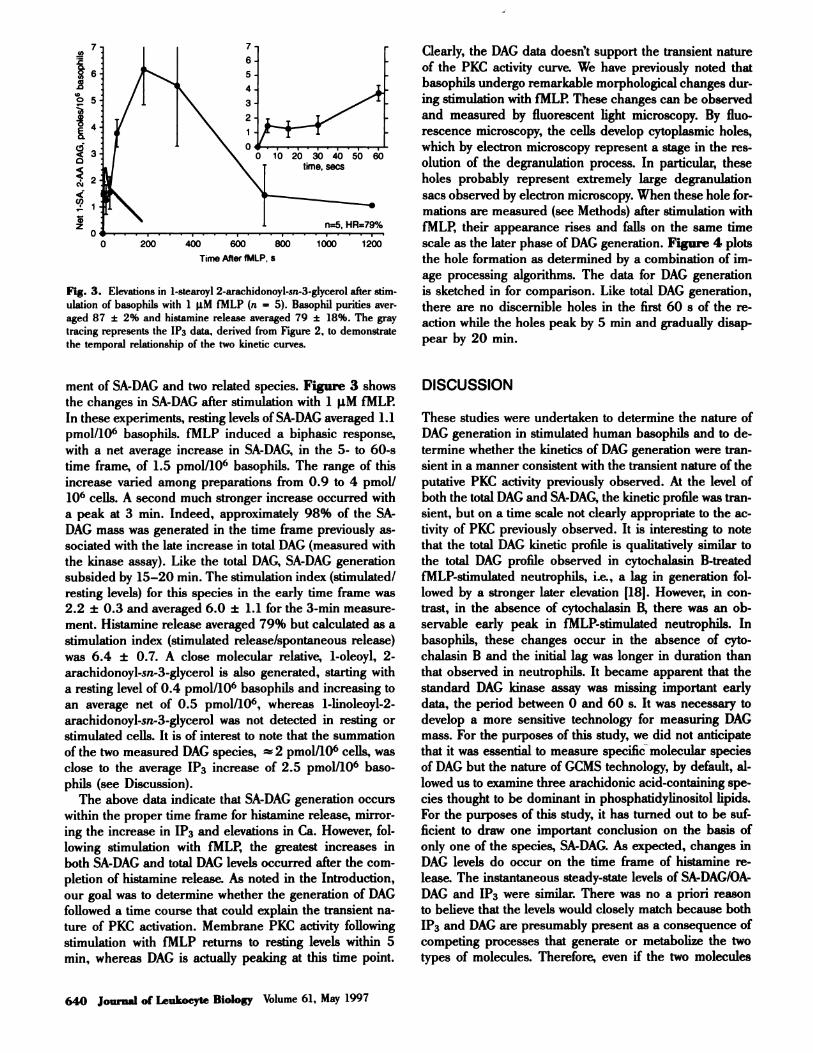
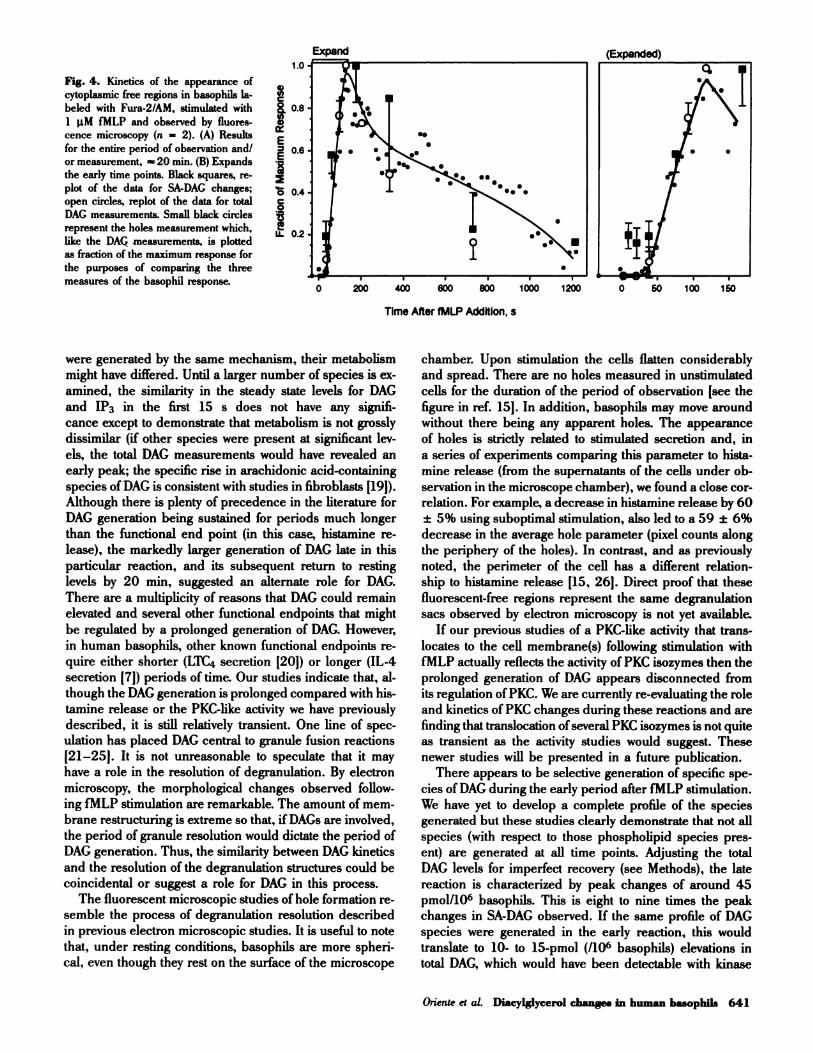
scale as the later phase of DAG generation. Figure 4 plots
the hole formation as determined by a combination of im-
age processing algorithms. The data for DAG generation
is sketched in for comparison. Like total DAG generation,
there are no discernible holes in the first 60 s of the re-
action while the holes peak by 5 mm and gradually disap-
pear by 20 mm.
DISCUSSION
These studies were undertaken to determine the nature of
DAG generation in stimulated human basophils and to de-
termine whether the kinetics of DAG generation were tran-
sient in a manner consistent with the transient nature of the
putative PKC activity previously observed. At the level of
both the total DAG and SA-DAG, the kinetic profile was tran-
sient, but on a time scale not clearly appropriate to the ac-
tivity of PKC previously observed. It is interesting to note
that the total DAG kinetic profile is qualitatively similar to
the total DAG profile observed in cytochalasin B-treated
fMLP-stimulated neutrophils, i.e., a lag in generation fol-
lowed by a stronger later elevation 1181. However, in con-
trast, in the absence of cytochalasin B, there was an ob-
servable early peak in fMLP-stimulated neutrophils. In
basophils, these changes occur in the absence of cyto-
chalasin B and the initial lag was longer in duration than
that observed in neutrophils. It became apparent that the
standard DAG kinase assay was missing important early
data, the period between 0 and 60 s. It was necessary to
develop a more sensitive technology for measuring DAG
mass. For the purposes of this study, we did not anticipate
that it was essential to measure specific molecular species
of DAG but the nature of GCMS technology, by default, al-
lowed us to examine three arachidonic acid-containing spe-
cies thought to be dominant in phosphatidylinositol lipids.
For the purposes of this study, it has turned out to be suf-
ficient to draw one important conclusion on the basis of
only one of the species, SA-DAG. As expected, changes in
DAG levels do occur on the time frame of histamine re-
lease. The instantaneous steady-state levels of SA-DAG/OA-
DAG and IP3 were similar. There was no a priori reason
to believe that the levels would closely match because both
1P3 and DAG are presumably present as a consequence of
competing processes that generate or metabolize the two
types of molecules. Therefore, even if the two molecules
C
aU)a
E
E
0
C0
aU.
200 400 600 800 1000 1200 0 50 100 150
Time After fMLP Addition, s
Oriente et al. Diacylglycerol changes in human basophils 641
Fig. 4. Kinetics of the appearance of
cytoplasmic free regions in basophils la-
beled with Fura-2!AM, stimulated with
1 �tM fMLP and observed by fluores-
cence microscopy (n = 2). (A) Results
for the entire period of observation and!
or measurement, � 20 mm. (B) Expands
the early time points. Black squares, re-
plot of the data for SA-DAG changes;
open circles, replot of the data for total
DAG measurements. Small black circles
represent the holes measurement which,
like the DAG measurements, is plotted
as fraction of the maximum response for
the purposes of comparing the three
measures of the basophil response.
were generated by the same mechanism, their metabolism
might have differed. Until a larger number of species is ex-
amined, the similarity in the steady state levels for DAG
and IP3 in the first 15 s does not have any signifi-
cance except to demonstrate that metabolism is not grossly
dissimilar (if other species were present at significant 1ev-
els, the total DAG measurements would have revealed an
early peak; the specific rise in arachidonic acid-containing
species of DAG is consistent with studies in fibroblasts 1191).Although there is plenty of precedence in the literature for
DAG generation being sustained for periods much longer
than the functional end point (in this case, histamine re-
lease), the markedly larger generation of DAG late in this
particular reaction, and its subsequent return to restinglevels by 20 mm, suggested an alternate role for DAG.
There are a multiplicity of reasons that DAG could remain
elevated and several other functional endpoints that might
be regulated by a prolonged generation of DAG. However,
in human basophils, other known functional endpoints re-
quire either shorter (LTC4 secretion 1201) or longer (IL-4
secretion [7J) periods of time. Our studies indicate that, al-
though the DAG generation is prolonged compared with his-
tamine release or the PKC-like activity we have previously
described, it is still relatively transient. One line of spec-
ulation has placed DAG central to granule fusion reactions
[21-251. It is not unreasonable to speculate that it may
have a role in the resolution of degranulation. By electron
microscopy, the morphological changes observed follow-
ing fMLP stimulation are remarkable. The amount of mem-
brane restructuring is extreme so that, if DAGs are involved,
the period of granule resolution would dictate the period of
DAG generation. Thus, the similarity between DAG kinetics
and the resolution of the degranulation structures could be
coincidental or suggest a role for DAG in this process.
The fluorescent microscopic studies of hole formation re-
semble the process of degranulation resolution described
in previous electron microscopic studies. It is useful to note
that, under resting conditions, basophils are more spheri-
cal, even though they rest on the surface of the microscope
chamber. Upon stimulation the cells flatten considerably
and spread. There are no holes measured in unstimulated
cells for the duration of the period of observation [see the
figure in ref. 15J. In addition, basophils may move around
without there being any apparent holes. The appearance
of holes is strictly related to stimulated secretion and, in
a series of experiments comparing this parameter to hista-
mine release (from the supernatants of the cells under ob-
servation in the microscope chamber), we found a close cor-
relation. For example, a decrease in histamine release by 60
± 5% using suboptimal stimulation, also led to a 59 ± 6%
decrease in the average hole parameter (pixel counts along
the periphery of the holes). In contrast, and as previously
noted, the perimeter of the cell has a different relation-
ship to histamine release [15, 26J. Direct proof that these
fluorescent-free regions represent the same degranulation
sacs observed by electron microscopy is not yet available.
If our previous studies of a PKC-like activity that trans-
locates to the cell membrane(s) following stimulation with
IMLP actually reflects the activity of PKC isozymes then the
prolonged generation of DAG appears disconnected from
its regulation of PKC. We are currently re-evaluating the role
and kinetics of PKC changes during these reactions and are
finding that translocation ofseveral PKC isozymes is not quite
as transient as the activity studies would suggest. These
newer studies will be presented in a future publication.
There appears to be selective generation of specific spe-
cies of DAG during the early period after fMLP stimulation.
We have yet to develop a complete profile of the species
generated but these studies clearly demonstrate that not all
species (with respect to those phospholipid species pres-
ent) are generated at all time points. Adjusting the total
DAG levels for imperfect recovery (see Methods), the late
reaction is characterized by peak changes of around 45
pmol/106 basophils. This is eight to nine times the peak
changes in SA-DAG observed. If the same profile of DAG
species were generated in the early reaction, this would
translate to 10- to 15-pmol (/106 basophils) elevations in
total DAG, which would have been detectable with kinase
642 Journal of Leukocyte Biology Volume 61, May 1997
assay. Therefore, the absence of observable changes in total
DAG but elevations in SA-DAG and OA-DAG suggest a se-
lective generation. As noted in Results, the early changes
in SA-DAG and OA-DAG were similar to the changes in
IP3 mass. This could be considered fortuitous because
there is no a priori reason to believe that the metabolic
rates of the two second messengers would be similar even
if they were derived from the same parent phospholipids.
This result also suggests that the predominant species of
phosphatidylinositol contain arachidonic acid in the sn2
position. We should be in a position to verify this predic-
tion in future studies of basophil phospholipid species with
the use of newly developed tandem mass spectroscopy tech-
niques [unpublished resultsl. These differences in the ki-
netics of SA-DAG and IP3 generation also suggest that SA-
DAG is derived from another source of phospholipids later
in the reaction. This appears to be a common theme be-
cause many other studies have noted that the source of
DAG appears to change during the course of a reaction.
It has been noted in rat peritoneal mast cells where it ap-
pears that the early phase of the reaction is dominated by
DAG derived from phosphatidylinositol [27J. In the later
phase of the reaction, a larger component of the DAG gen-
erated appears to be derived from phosphatidylcholine. As
noted, similar conclusions have been drawn from studies
in other cell types Ifor example, see refs. 19 and 281. In
addition to changes in the sources of DAG, the enzymes
responsible for its generation may also change 129-311.
To summarize, DAG generation in basophils is pro-
longed in a manner not consistent with an exclusive role
in histamine release or PKC (-like) activity measurements
but temporally more consistent with the phenomenon of de-
granulation resolution. Selective generation of DAG spe-
cies appears to occur early in signal transduction.
REFERENCES
1. Warner. J. A., MacGlashan, D. W., Jr. (1989) Protein kinase C (PKC)
changes in human basophils. IgE-mediated activation is accompanied by
an increase in total PKC activity. J. Immunol. 142, 1669-1677.2. Warner. J. A.. MacGlashan, D. W.. Jr. (1990) Signal transduction events in
human basophils-A comparative study of the role of protein kinase-C
in ba.sophils activated by anti-IgE antibody and formyl.methionyl-leucyl-
phenylalanine. J Immunol. 145, 1897-1905.3. Bishop. W. R., Bell, R. M. (1988) Functions ofdiacylglycerol in glycerolipid
metabolism. sjgnal transduction and cellular transformation. Oncogene Res.
2, 205-218.4. Bell, R. M., Hannun, Y. A., Loomis, C. R. (1986) Mechanism of regulation
of protein kinase C by lipid second messengers. Symp. Fundamental Cancer
Res. 39, 145-156.5. Kennerly. D. A., Sullivan, T. J., Sylvester, P., Parker, C. W. (1979) Diacyl-
glycerol metabolism in mast cells: a potential role in membrane fusion andarachidonic acid release. j Exp� Med. 150. 1039-1044.
6. Kennerly, D. A. (1987) Diacylglycerol metabolism in mast cells. Analysisof lipid metabolic pathways using molecular species analysis of intermedi-
ates. J. Biol. C/tern. 262. 16305-16313.7. MacGlashan, D. W., Jr., White, J. M., Huang, S. K., Ono, S. J., Schroeder,
J.. Lichtenstein, L. M. (1994) Secretion of interleukin-4 from human baso-phils: The relationship between IL-4 mRNA and protein in resting and stim-ulated basophils. J. Immunol. 152. 3006-3016.
8. Gilbert, H. S., Ornstein, L. (1975) Basophil counting with a new stainingmethod using alcian blue. Blood 46, 279-286.
9. Siraganian. R. P. (1974) An automated continuous-flow system for the cx-traction and fluorometric analysis of histamine. Anal. Bloc/tam. 57,383-394.
10. Bligh, E. G.. Dyer. W. J. (1959) A rapid method oftotal lipid extraction andpurification. Can. J. Biochem. Physiol. 37, 911-917.
1 1 . Kennerly. D. A., Parker, C. W., Sullivan, T. J. (1979) Use of diacylglycerolkinase to quantitate picomole levels of 1,2.diacylglycerol. Anal. Biochem.
98. 123-131.12. Preiss, J. E., Loomis, C. R., Bell, R. M., Niedel, J. E. (1987) Quantitative
measurement of sn-1,2,diacylglycerols. Met/i. Enzymol. 141, 294-301.13. Yamada, K., Jelsema, C. L.. Beaven. M. A. (1992) Certain inhibitors of pro-
tein serine/threonine kinases also inhibit tyrosine.phosphorylation of phos-pholipase Cgl and other proteins and reveal distinct roles for tyrosinekinase(s) and protein kinase C in stimulated rat basophilic RBL-2H3 cells.
J. Immunol. 149, 1031-1037.14. Hubbard, W. C., Hundley. T. H.. Oniente. A., MacGlashan. D. W.. Jr.
(1996) Quantitation of 1-stearoyl-2-arachidonyl.sn-3-glycerol in humanbasophils via gas chromatography-negative ion chemical ionization massspectrometry. Anal. Biochem. 236. 309-321.
15. MacGlashan, D. W., Jr., Bochner, B., Warner. J. A. (1994) Graded changesin the response of individual human basophils to stimulation: Distributionalbehavior of early activation events. J. Leukoc. Biol. 55, 13-23.
16. Dvorak, A. M., Warner, J. A., Kissell, S., Lichtenstein, L. M.. MacGlashan,D. W.. Jr. (1991) F-met peptide-induced degranulation of human basophils.
Lab. Invest. 64, 234-253.17. Lee, C.. Hajra. A. K. (1991) Molecular species of diacylglycerols and phos-
phoglycerides and the postmortem changes in the molecular species of di-
acylglycerols in rat brains. J Neurochem. 56. 370-379.18. Honeycutt, P. J., Niedel, J. E. (1986) Cytochalasin B enhancement of the
diacylglycerol response in formyl peptide-stimulated neutrophils. J. Blot.
Chem. 261. 15900-15905.19. Pessin, M. S., Raben, D. M. (1989) Molecular species analysis of
1.2-diglycerides stimulated by thrombin in cultured fibroblasts. J. Biol.Chem. 264, 8729-8738.
20. MacGlashan. D. W.. Jr., Peters. S. P.. Warner. J.. Lichtenstein, L. M. (1986)
Characteristics of human basophil sulfidopeptide leukotriene release: re-leasability defined as the ability ofthe basophil to respond to dimeric cross-links. J. Immunol. 136. 2231-2239.
21. Das, S., Rand, R. P. (1984) Diacylglycerol causes major structural transi-tions in phospholipid bilayer membranes. Biochem. Biophys. Res. Commun.124. 491-496.
22. Coorssen, J. R. , Rand, R. P. (1990) Effects of cholesterol on the structuraltransitions induced by diacylglycerol in phosphatidylcholine and phospha-tidylethanolamine bilayer systems. Biochem. Cell Biol. 68. 65-69.
23. Burger. K. N., Nieva. J. L.. Alonso, A.. Verkleij, A. J. (1991) Phospholipase
C activity-induced fusion of pure lipid model membranes. A freeze fracturestudy. Biochim. Bioph)s. Acta 1068. 249-253.
24. Francis, J. W., Balazovich. K. J. . Smolen, J. E., Margolis. D. I.. Boxer. L. A.(1992) Human neutrophil annexin I promotes granule aggregation and mod-ulates Ca(2+)-dependent membrane fusion. .1 Clin. Invest. 90. 537-544.
25. Agwu, D. E.. McPhail. L. C.. Wykle. R. L.. McCall. C. E. (1989) Mass de-termination of receptor-mediated accumulation of phosphatidate and diglyc-erides in human neutrophils measured by coomassie blue staining and den-sitometry. Bwchem. Bioplrps. Res. Commun. 159. 79-86.
26. MacGlashan, D. W.. Jr. (1995) Graded changes in the response of individ-
ual human basophils to stimulation: Distributional behavior of events tem-porally coincident with degranulation. .1 Leukoc. Biol. 58. 177-188.
27. Kennerly, D. A. (1990) Phosphatidylcholine is a quantitatively more impor-
tant source of increased 1,2-diacylglycerol than is phosphatidylinositol in
mast cells. J. Immunol. 144, 3912-3919.28. Lee, C.. Fisher. S. K., Agranoff. B. W., Hajra. A. K. (1991) Quantitative
analysis of molecular species of diacylglycerol and phosphatidate formed
upon muscaninic receptor activation of human SK-N-SH neuroblastomacells. J. Bail. Chem. 266, 22837-22846.
29. Mullmann, T. J., Cheewatrakoopong, B., Anthes, J. C.. Siegel, M. I., Egan.R. W., Billah, M. M. (1993) Phospholipase C and phospholipase D are ac-tivated independently of each other in chemotactic peptide-stimulated hu-man neutrophils. J. Leukoc. BiOL 53, 630-635.
30. Gruchalla, R. S., Dinh, T. T., Kennerly. D. A. (1990) An indirect pathway
of receptor-mediated 1.2-diacylglycerol formation in mast cells. I. IgEreceptor-mediated activation of phospholipase D. J. Immunol. 144. 2334-.
31. Dinh, T. T., Kennerly, D. A. (1991) Assessment of receptor-dependent ac-tivation of phosphatidylcholine hydrolysis by both phospholipase D andphospholipase C. Cell Reg. 2, 299-309.


