Embed Size (px)
Citation preview
Alaska Resources Library & Information Services
Susitna‐Watana Hydroelectric Project Document ARLIS Uniform Cover Page
Title: Site-specific seismic hazard study plan Section 16.6, Study Completion Report. Attachment 11. Preliminary reservoir triggered seismicity SuWa 289
Author(s) – Personal: Dina Hunt, Roland LaForge, Dean Ostenna
Author(s) – Corporate:
MWH
AEA‐identified category, if specified:
November 2015; Study Completion and 2014/2015 Implementation Reports
AEA‐identified series, if specified:
NTP ; 11 Technical memorandum ; no. 10
Series (ARLIS‐assigned report number): Susitna-Watana Hydroelectric Project document number 289
Existing numbers on document:
AEA11-022 TM-11-0010-030113
Published by:
[Anchorage : Alaska Energy Authority, 2015] Date published: March 29, 2013
Published for: Alaska Energy Authority
Date or date range of report:
Volume and/or Part numbers: Study plan Section 16.6
Final or Draft status, as indicated:
v3.0 Document type:
Pagination:
iv, 2, 53 pages + [31] pages of plates
Related works(s):
Pages added/changed by ARLIS:
Notes:
All other parts of Section 16.6 (the main report and Attachments 1-10) are in separate electronic files due to large file sizes.
All reports in the Susitna‐Watana Hydroelectric Project Document series include an ARLIS‐produced cover page and an ARLIS‐assigned number for uniformity and citability. All reports are posted online at http://www.arlis.org/resources/susitna‐watana/

STUDY COMPLETION REPORT SITE-SPECIFIC SEISMIC HAZARD STUDY (16.6)
Susitna-Watana Hydroelectric Project Alaska Energy Authority FERC Project No. 14241 October 2015
ATTACHMENT 11: PRELIMINARY RESERVOIR TRIGGERED SEISMICITY
NTP 11 Technical Memorandum No. 10
v3.0
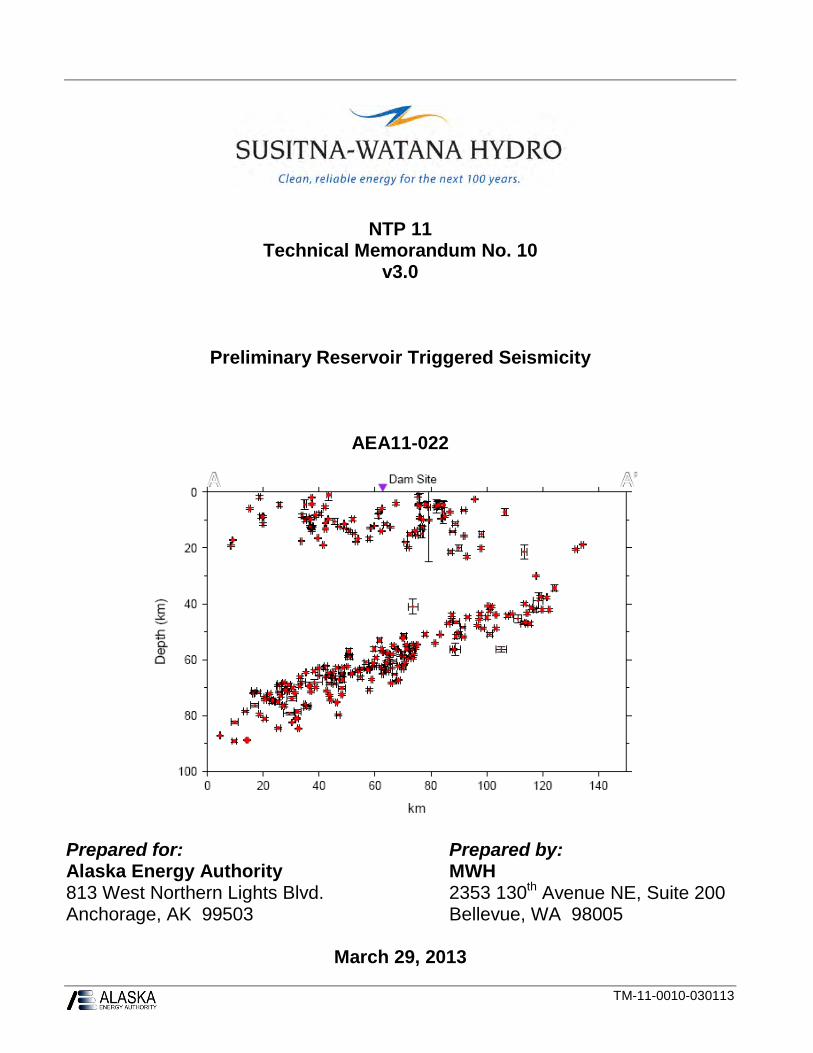
Preliminary Reservoir Triggered Seismicity
AEA11-022
Prepared for: Prepared by: Alaska Energy Authority MWH 813 West Northern Lights Blvd. 2353 130th Avenue NE, Suite 200 Anchorage, AK 99503 Bellevue, WA 98005
March 29, 2013
TM-11-0010-030113
ALASKA ENERGY AUTHORITY AEA11-022 TM-11-0010-030113 TABLE OF CONTENTS
EXECUTIVE SUMMARY ................................................................................................................ ES-1
1.0 INTRODUCTION ........................................................................................................................ 1
1.1 Background of Project ................................................................................................................ 1 1.2 Purpose of Study ........................................................................................................................ 1
2.0 PREVIOUS STUDIES ................................................................................................................. 2
2.1 Terminology ............................................................................................................................... 2 2.2 Prefeasibility Studies .................................................................................................................. 2
2.2.1 Input Parameters ................................................................................................................................................ 3 2.2.2 Previous Study Results ........................................................................................................................................ 4
2.3 Current Knowledge of Reservoir Triggered Seismicity ............................................................. 5 2.3.1 Causes of Reservoir Triggered Seismicity .......................................................................................................... 5 2.3.2 Characteristics of Reservoir Triggered Seismicity ............................................................................................. 6 2.3.3 Current Understanding and Cases of Reservoir Triggered Seismicity ............................................................... 6 2.3.4 Physical Mechanisms of Reservoir Triggered Seismicity and Selected Cases ................................................... 7
2.3.4.1 Introduction .................................................................................................................................................................7 2.3.4.2 Physical Mechanisms ...................................................................................................................................................8 2.3.4.3 Analysis Techniques and Case studies ....................................................................................................................... 10 2.3.4.3.1 Nurek Dam and Reservoir, Tajikistan ........................................................................................................................ 11 2.3.4.3.2 Zipingu Reservoir, Sichuan, China ............................................................................................................................ 12
2.3.5 State of the Practice for Determining the Potential for Reservoir Triggered Seismicity ...................................13 2.3.6 Database of Reservoir Triggered Seismicity .....................................................................................................14
3.0 GEOLOGIC AND TECTONIC SETTING OF THE RESERVOIR .................................... 16
3.1 Regional Geology and Tectonics ............................................................................................. 17 3.2 Reservoir Geology .................................................................................................................... 19
3.2.1 Detailed Geologic Data from the Watana Dam Site ..........................................................................................20 3.2.2 Quaternary Fault Evaluations and Lineament Mapping in the Project Area ....................................................21
3.3 Seismicity in the Reservoir Area .............................................................................................. 21 3.3.1 Watana Seismic Network ...................................................................................................................................22 3.3.2 Seismicity in the Watana Region .......................................................................................................................22
4.0 RESERVOIR TRIGGERED SEISMICITY FACTORS ........................................................ 23
4.1 General Reservoir Parameters (Depth and Volume) ................................................................ 23 4.2 Geologic Parameters................................................................................................................. 24 4.3 Stress Regime ........................................................................................................................... 25 4.4 Faulting Parameters .................................................................................................................. 25 4.5 Hydrologic Parameters ............................................................................................................. 25
4.5.1 Rock Mass Permeability ....................................................................................................................................25
Page i 03/29/13
ALASKA ENERGY AUTHORITY AEA11-022 TM-11-0010-030113
4.5.2 Fracture Orientation and Density .....................................................................................................................26 4.5.3 Proposed Reservoir Inflows/Outflows ...............................................................................................................26
5.0 POTENTIAL FOR RTS ............................................................................................................ 27
5.1 Empirical Approach ................................................................................................................. 27 5.1.1 Calculation of Likelihood of Occurrence ..........................................................................................................31
5.1.1.1 Single Attribute Analysis ........................................................................................................................................... 32 5.1.1.2 Multi-Attribute Analysis ............................................................................................................................................ 35
5.1.2 Independent Discrete Results ............................................................................................................................38 5.1.3 Dependent Discrete Results ...............................................................................................................................38 5.1.4 Dependent Mixed Results ..................................................................................................................................38
5.2 Empirical Approach Results ..................................................................................................... 38
6.0 RECOMMENDATIONS FOR ADDITIONAL STUDIES .................................................... 39
6.1 Seismic Monitoring and Seismological Analysis ..................................................................... 40 6.2 Coulomb Stress Modeling ........................................................................................................ 40 6.3 Local Geologic Field Investigations......................................................................................... 41 6.4 Estimation of Maximum Magnitude of a RTS Event............................................................... 41 6.5 Empirically-based Analysis ...................................................................................................... 42 6.6 Deterministic Comparisons to the Largest non-RTS Earthquake ............................................ 42
7.0 SUMMARY AND CONCLUSIONS ......................................................................................... 42
8.0 REFERENCES ........................................................................................................................... 44
Page ii 3/29/2013
ALASKA ENERGY AUTHORITY AEA11-022 TM-11-0010-030113 List of Tables
Table 1 Previously Proposed Reservoir Parameters (WCC, 1982) ........................................................... 3
Table 2 Proposed Watana Reservoir Parameters .................................................................................... 28
Table 3 Dams with Reported Reservoir Triggered Seismicity that have Similar Water Depths and Reservoir Volumes ................................................................................................................................... 29
Table 4 Definitions for Reservoir Attribute States .................................................................................. 32
Table 5 Single Attribute Analysis – Conditional Probability of RTS Given Only One Attribute .......... 34
Table 6 Data Bins for Deep or Very Deep Dataset – Current Study....................................................... 34
Table 7 Summary of RTS and Non-RTS Data for each State ................................................................. 34
Table 8 Revised Single Attribute Analysis – Conditional Probability of RTS Given Only One Attribute - Current Study ......................................................................................................................................... 34
Table 9a Comparison of Previous and Current Probabilities of RTS using a Multi-attribute Analysis – Independent and Dependent Discrete –Currently Proposed Configuration ............................................. 36
List of Figures
Figure 1 Temporal variations in seismicity within the reservoir area and daily water level at Nurek
Figure 2 Simulated change in effective Coulomb stress due to Zipingpu Reservoir (Ge et al., 2009)
Figure 3 Simulated change in effective Coulomb stress due to Zipingpu Reservoir (Zhou and Deng, 2011)
Figure 4 Relationship between depth and volume and reported cases of RTS
Figure 5 Major physiographic provinces
Figure 6 Tectonic overview of central interior Alaska
Figure 7 Tectonostratigraphic terrain map of the Talkeetna block
Figure 8A Site region geology
Figure 8B Site region geology legend
Page iii 3/29/2013
ALASKA ENERGY AUTHORITY AEA11-022 TM-11-0010-030113 Figure 9 Simplified geologic map and cross section – Fog Lakes Graben
Figure 10 Site geology
Figure 11 Map and cross section of seismicity in south central Alaska
Figure 12 Watana Seismic Network
Figure 13 Seismicity in the Watana region
Figure 14 Seismicity of all magnitudes near Watana dam site
Figure 15 Seismicity in site area, 2010 – November 15, 2012
Figure 16 NW-SE cross-section, seismicity 2010 – November 15, 2012
Figure 17 Seismicity in site area, November 16, 2012 – February 28, 2013
Figure 18 NW-SE cross-section, November 16, 2012 – February 28, 2013
Figure 19 Summary of crustal stress field in south-central Alaska
Figure 20 Summary of permeability values from Watana site boreholes
Figure 21 Summary of permeability values from Devil Canyon site boreholes
Figure 22 Frequency of earthquakes and water heights versus time for Almendra Dam
Appendix
Appendix A Database of Reservoir Triggered Seismicity
Acronyms and Abbreviations
° degrees
2-D two-dimensional
Acres Acres American Incorporated
AEA Alaska Energy Authority
AEIC Alaska Earthquake Information Center
Page iv 3/29/2013
ALASKA ENERGY AUTHORITY AEA11-022 TM-11-0010-030113 atm atmosphere, unit of pressure
cm/sec centimeters per second
El. elevation in feet
FCL Fugro Consultants, Inc.
FERC Federal Energy Regulatory Commission
ft/s feet per second
ft2 square feet
ft3 cubic feet
ft3/s cubic feet per second
H:V horizontal, vertical
ICOLD International Committee on Large Dams
in/sec inches per second
INSAR Interferometric Synthetic Aperture Radar
IRIS Incorporated Research Intuitions for Seismology
km kilometers
ks seismogenic permeability as defined by Talwani et al. (2007)
LiDAR Light Detection and Ranging
M magnitude, is assumed equivalent to Mw
M million
Mw moment magnitude
m2 square meters
m3 cubic meters
m3/s cubic meters per second
Page v 3/29/2013

ALASKA ENERGY AUTHORITY AEA11-022 TM-11-0010-030113 Ma million years from the present
MatSu Matanuska-Susitna Borough
meters meters
mi miles
Mpa megapascals
psi pound-force per square inch
RCC roller-compacted concrete
RTS Reservoir Triggered Seismicity
SAB Southern Alaska Block
TM Technical Memorandum
WCC Woodward-Clyde Consultants
Page vi 3/29/2013
ALASKA ENERGY AUTHORITY AEA11-022 TM-11-0010-030113 Executive Summary
The purpose of this report is to provide a preliminary assessment of the potential for reservoir triggered seismicity (RTS) in the vicinity of the proposed Susitna-Watana reservoir, and to provide recommendations for studies designed to improve current estimations of potential RTS probability and the maximum RTS magnitude. Relevant large impoundment case studies are discussed and compared to the planned facility. Regional tectonics and geology in the planned reservoir and dam site area are also summarized based on previous studies at the project site and vicinity. The recently-installed seismic network is discussed, and initial pre and post network seismicity cross sections of the subducting slab and interface are presented.
The term reservoir triggered seismicity (RTS) is now the accepted term used to describe the phenomena of earthquakes occurring in the vicinity of man-made water reservoirs. This report builds on and updates studies performed in the 1980s, with the difference that the 1980s studies were completed for a planned two-impoundment system in contrast to the envisioned single Watana structure. Because it is a relatively large-volume and very deep reservoir, Watana reservoir has a higher RTS potential than shallower, lower-volume ones.
Several case studies are examined to update the historic RTS catalog from the 1980s, as well as incorporate more recent research into the phenomenon of RTS. Case studies, while useful, generally provide an empirical dataset that may not necessarily predict the magnitude and distribution of RTS for other sites. Key insights from case studies include the timing of RTS occurrence (i.e., generally within 10 years following impoundment) and the influence of reservoir filling and operational water level fluctuations on observed seismicity.
The two principal triggers of RTS are added weight stresses and pore pressure propagation. Physical theories of stress changes due to reservoir loading and the percolation of water into the upper crust are sound, but make many simplifying assumptions. The most important of these assumptions is that the physical properties of the upper crust are isotropic. This memorandum summarily reviews the physical triggers of RTS, as well as some quantitative frameworks for assessing potential RTS based on physical state changes (e.g., stress, rock permeability). However, numerical theory may not necessarily agree with, or predict, case study history in all instances.
Analyses within this memorandum include updated statistical calculations, updated seismicity maps and seismicity cross sections, as well as synthesis of recent research and computational advances. An update to the previous empirically-based probability analysis found the probability of RTS for the proposed Watana reservoir ranges from 16 to 46 percent; this is much lower than the previously proposed project configuration that was about 160 feet higher and more than twice the reservoir volume (probabilities range from 30 to 95 percent).
Page ES-1 03/29/13
ALASKA ENERGY AUTHORITY AEA11-022 TM-11-0010-030113 The location and magnitude of any future RTS event associated with the Watana Reservoir are highly uncertain. Empirical data suggest that most RTS events will have relatively small magnitudes and would most likely occur within 10 years of initial filling. From these types of observations, ICOLD (2011) and Allen (1982) suggest that maximum RTS magnitudes may be on the order of 6.3 and 6.5, respectively. Other investigators (e.g., Klose, 2011; Ge et al., 2009) have proposed that the Mw 7.9 Wenchaun earthquake should be considered an RTS event, which would increase the magnitude estimates from empirical data. In contrast, other investigators (e.g., Zhou et al., 2010; Galahut and Galahut, 2010) have argued that this event could not have been triggered by the reservoir. The status of the Wenchuan earthquake as an RTS event is controversial, and future research on it will continue to be monitored.
Mapping of existing faults and discontinuities (e.g., fractures) within and near the reservoir, regional hydraulic conductivity surrounding these faults, and regional tectonic stress provide the physical constraints which determine potential RTS locations and the physical limits for earthquake magnitudes. From existing seismic hazard studies, a possible maximum can be Mw 7.3, which was judged by the USGS to be the largest crustal event that could randomly occur in the region. This is a conservative estimate, made in consideration of no prior knowledge of seismogenic crustal thickness, hydraulic properties of rocks beneath the reservoir area, orientation of the local tectonic stress field, and the possible existence of local faults in the vicinity of the reservoir that may be favorably oriented to the local stress field.
A significant aspect of the RTS record from case studies is the fact that of the verified RTS cases large enough to be potentially damaging, only four events have exceeded magnitude M 6, and only 13 events were in the range M 5.0 to M 5.9 (USCOLD, 1997; Yeats et al, 1997). The largest reported RTS earthquake was the 1967, magnitude M 6.5, Koyna, India event. These observations contrast with the presumption that maximum RTS would not exceed maximum earthquake magnitudes from existing fault sources (i.e. “naturally occurring” sources), which in most reported cases of RTS has not been consistently evaluated. Thus, the emphasis of further recommended evaluations of RTS for the Watana site is focused on improving the understanding of the local geologic and tectonic characteristics that are significant to RTS assessment.
Page ES-2 3/29/2013
ALASKA ENERGY AUTHORITY AEA11-022 TM-11-0010-030113
1.0 INTRODUCTION The proposed Susitna-Watana dam and reservoir are part of a hydroelectric power development project planned to be constructed on the upper Susitna River. The proposed hydroelectric plan for the Watana site is a 735 feet (224 m) high roller-compacted concrete (RCC) dam and surface powerhouse, with a reservoir elevation of 2050 feet and a depth of about 595 feet (182 m). The total volume of the reservoir is planned to be 5.2 million acre feet (6.4 billion cubic meters).
1.1 Background of Project The feasibility of an earlier configuration of the Susitna-Watana Dam site was studied in the early 1980’s by Woodward Clyde Consultants. The initial design of the Susitna Hydroelectric project included impoundment of two reservoirs, one at the Devil Canyon site and another at the upstream Watana site; both located on the Susitna River. The combined reservoir parameters were a depth of approximately 725 feet and a reservoir volume of 10.67 million acre feet. In early 2011, MWH was retained by Alaska Energy Authority (AEA) – Alaska Railbelt Large Hydro Engineering Services to perform geological and geotechnical engineering studies in support of Engineering Studies of the Watana Dam to more fully define the Project for the Federal Energy Regulatory Commission (FERC) License Application, and to support the License Application. Under subcontract to MWH, Fugro Consultants, Inc.(FCL) assisted in the preparation of this report including text, tables and graphics.
1.2 Purpose of Study The purpose of this study is to provide a preliminary assessment of the potential for reservoir triggered seismicity (RTS) in the vicinity of the proposed dam and reservoir. It does not alter the seismic hazard results as presented in Fugro Consultants, Inc. (FCL) (2012). An RTS earthquake is likely to be treated as deterministic in nature, and as such will need to be incorporated as a separate element in the seismic hazard analysis. This study will build upon the initial geologic and seismic studies completed by Acres American Incorporated (Acres), Woodward-Clyde Consultants (WCC), Harza-Ebasco, and MWH in support of conceptual dam design studies. A literature review, discussion of case studies, a statistical analysis of accepted RTS cases, and discussion of physical theories of RTS and recent modeling studies are included in this report. This comprises an important expansion and update to the previously published assessment (WCC, 1982). The objectives of this study include:
• Literature review of RTS cases worldwide
• Comparison with other large reservoirs with similar geologic conditions, tectonic setting, and having or suspected of having RTS events
• Identify and assess characteristics of the proposed dam and reservoir, and the geologic and geophysical environment that indicate a potential for RTS
Page 1 03/29/13
ALASKA ENERGY AUTHORITY AEA11-022 TM-11-0010-030113
• Review research into the physical mechanisms of RTS, and discuss representative cases of both empirical analysis and modeling of RTS using finite-element techniques.
• Provide recommendations for further RTS analysis activities.
2.0 PREVIOUS STUDIES This section will discuss current terminology, previous RTS studies completed for the project, regulatory guidelines, current knowledge, and new approaches for assessing RTS.
2.1 Terminology The term reservoir triggered seismicity (RTS) is now the accepted term used to describe the phenomena of earthquakes occurring in the vicinity of artificial water reservoirs. McGarr and Simpson (1977) deliberated on the terms “induced” versus ”triggered”. They proposed that the term “triggered” be used to describe earthquakes that occur due to a small fraction of the stress change causing the event, whereas “induced” be used to describe earthquakes that are mostly caused by human-caused stress changes. Examples of induced events would include those that closely associate with hydraulic fracturing at a site with no known faults or seismicity, as compared to triggered events, which would be an event that occurred on a known fault near a reservoir after a significant change in water depth. The International Committee on Large Dams (ICOLD, 2011), in their draft “Reservoirs and Seismicity – State of Knowledge” accept reservoir triggered seismicity as the most adequate term. Therefore, for this report the term reservoir triggered seismicity (RTS) will be used.
2.2 Prefeasibility Studies During initial prefeasibility studies in the early 1980s for the Susitna-Watana Hydroelectric project Woodward-Clyde Consultants (WCC, 1980) completed an assessment of RTS. The scope of this study is summarized below:
• A comparison of the depth, volume, regional stress, geologic setting, and faulting at the Devil Canyon and Watana sites with the same parameters at comparable reservoirs worldwide
• Assessment of the likelihood of RTS at the sites based on the above comparison
• A review of the relationship between reservoir filling and the length of time to the onset of induced events and the length of time to the maximum earthquake
• An evaluation of the significance of these time periods for the sites
• The development of a model to assess the impact of RTS and method of reservoir filling
Page 2 3/29/2013
ALASKA ENERGY AUTHORITY AEA11-022 TM-11-0010-030113 Data compilation of RTS events began in the early 1940’s with a study completed at Hoover Dam (Carder, 1945). Several studies were completed over the next 30 years that gained recognition of RTS as a real phenomenon; the Packer et al. (1979) study which was first published in 1977 for Auburn Dam significantly contributed to the increase in awareness. The study completed for Susitna in 1982 by WCC includes empirical data with calculations of likelihood of occurrence and mean number of RTS events. This study was based on the work by Packer et al, (1979) and Perman et al. (1981).
At the time the study was completed for Susitna, there were 68 cases that were classified as RTS. The studies showed that RTS is influenced by the depth and volume of the reservoir, the state of tectonic stresses in the shallow crust beneath the reservoir, and the existing pore pressures and permeability of the rock under the reservoir. The WCC (1980) report presents probability calculations based on empirical knowledge related to the depth and volume of the reservoir.
2.2.1 Input Parameters
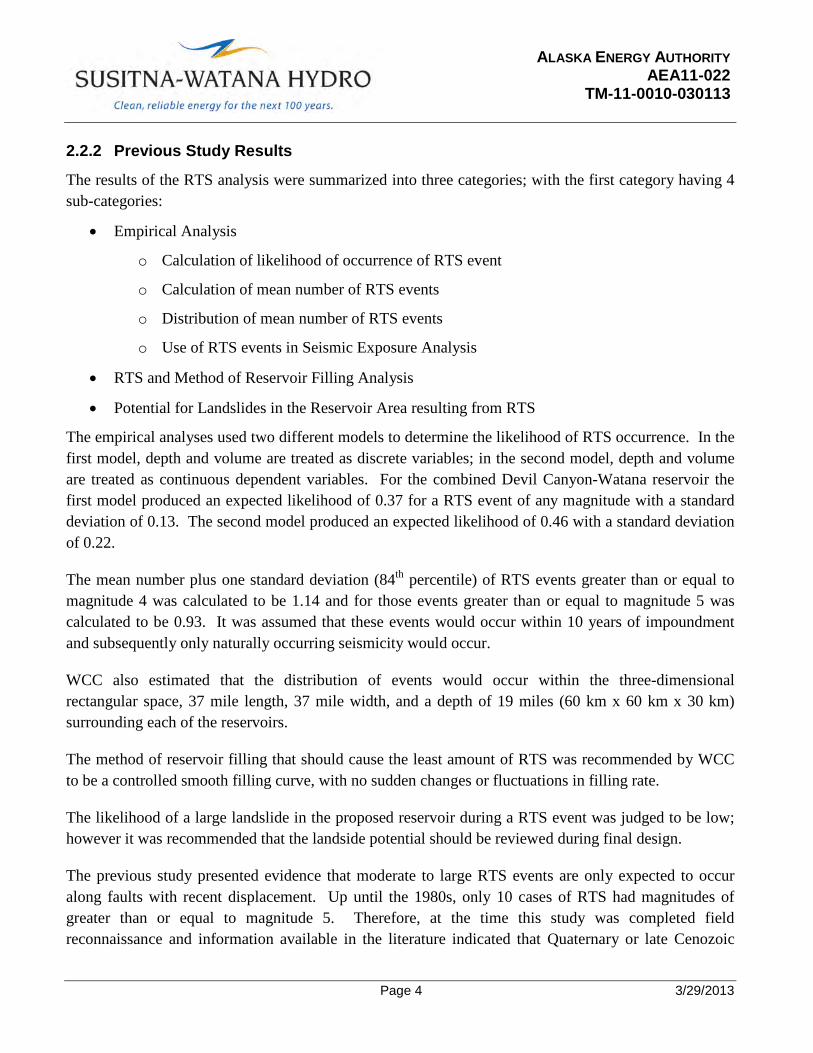
The initial design of the Susitna Hydroelectric project included impoundment of two reservoirs, one at the Devil Canyon site and another at the Watana site. The study completed by WCC treated both reservoirs as one, but a separate RTS analysis was performed for each site. In other words, the input parameters for the reservoir were the same but the potential sources and distances were analyzed independently of each other. The parameters for the two sites are summarized in Table 1 below. It should be noted that the previous configuration had a maximum reservoir at El. 2185, whereas the current proposed configuration has a maximum reservoir at El. 2050.
Table 1 Previously Proposed Reservoir Parameters (WCC, 1982)
Parameter Devil Canyon Watana Combined
Maximum Water Depth 551 feet (168 meters) 725 (221) 725 (221)
Maximum Reservoir Elevation
2185 N/A
Maximum Water Volume
1.05 million acre feet
(1,296 million cubic meters)
9.62 million acre feet
(11,876 million cubic meters)
10.67 million acre feet
(13,172 million cubic meters)
Stress Regime Compressional Compressional Compressional
Bedrock Metamorphic Igneous Igneous
Page 3 3/29/2013
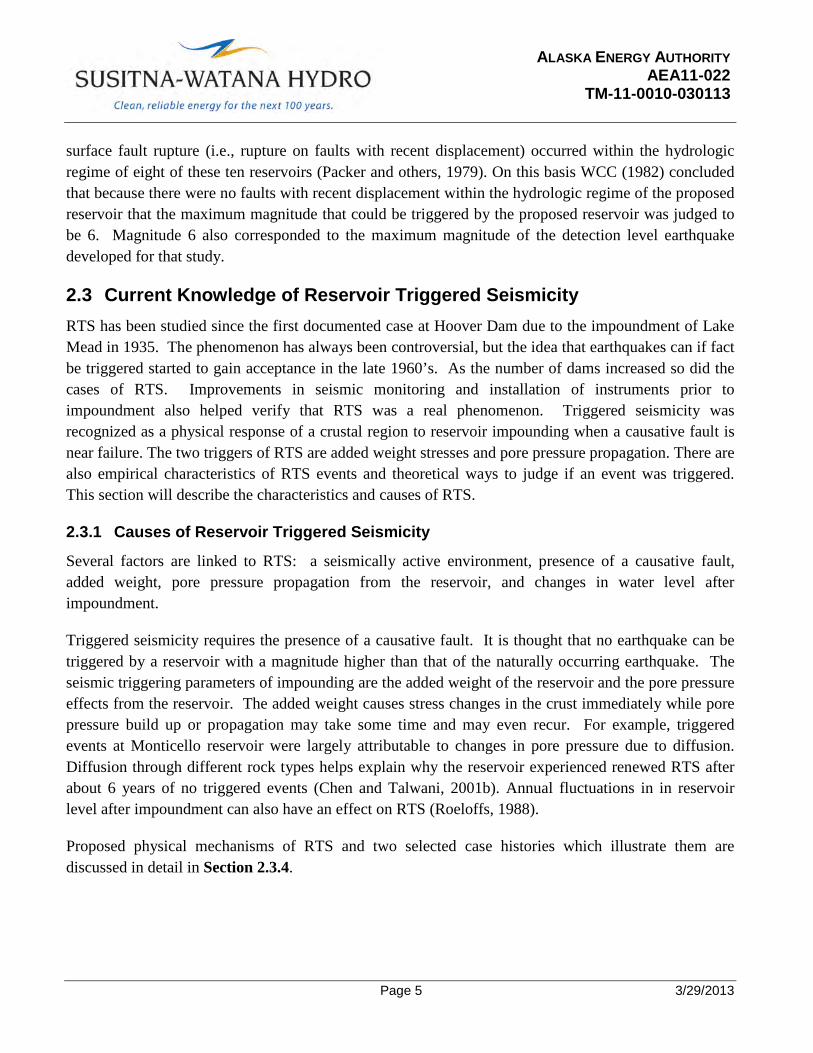
ALASKA ENERGY AUTHORITY AEA11-022 TM-11-0010-030113 2.2.2 Previous Study Results
The results of the RTS analysis were summarized into three categories; with the first category having 4 sub-categories:
• Empirical Analysis
o Calculation of likelihood of occurrence of RTS event
o Calculation of mean number of RTS events
o Distribution of mean number of RTS events
o Use of RTS events in Seismic Exposure Analysis
• RTS and Method of Reservoir Filling Analysis
• Potential for Landslides in the Reservoir Area resulting from RTS
The empirical analyses used two different models to determine the likelihood of RTS occurrence. In the first model, depth and volume are treated as discrete variables; in the second model, depth and volume are treated as continuous dependent variables. For the combined Devil Canyon-Watana reservoir the first model produced an expected likelihood of 0.37 for a RTS event of any magnitude with a standard deviation of 0.13. The second model produced an expected likelihood of 0.46 with a standard deviation of 0.22.
The mean number plus one standard deviation (84th percentile) of RTS events greater than or equal to magnitude 4 was calculated to be 1.14 and for those events greater than or equal to magnitude 5 was calculated to be 0.93. It was assumed that these events would occur within 10 years of impoundment and subsequently only naturally occurring seismicity would occur.
WCC also estimated that the distribution of events would occur within the three-dimensional rectangular space, 37 mile length, 37 mile width, and a depth of 19 miles (60 km x 60 km x 30 km) surrounding each of the reservoirs.
The method of reservoir filling that should cause the least amount of RTS was recommended by WCC to be a controlled smooth filling curve, with no sudden changes or fluctuations in filling rate.
The likelihood of a large landslide in the proposed reservoir during a RTS event was judged to be low; however it was recommended that the landside potential should be reviewed during final design.
The previous study presented evidence that moderate to large RTS events are only expected to occur along faults with recent displacement. Up until the 1980s, only 10 cases of RTS had magnitudes of greater than or equal to magnitude 5. Therefore, at the time this study was completed field reconnaissance and information available in the literature indicated that Quaternary or late Cenozoic
Page 4 3/29/2013
ALASKA ENERGY AUTHORITY AEA11-022 TM-11-0010-030113 surface fault rupture (i.e., rupture on faults with recent displacement) occurred within the hydrologic regime of eight of these ten reservoirs (Packer and others, 1979). On this basis WCC (1982) concluded that because there were no faults with recent displacement within the hydrologic regime of the proposed reservoir that the maximum magnitude that could be triggered by the proposed reservoir was judged to be 6. Magnitude 6 also corresponded to the maximum magnitude of the detection level earthquake developed for that study.
2.3 Current Knowledge of Reservoir Triggered Seismicity RTS has been studied since the first documented case at Hoover Dam due to the impoundment of Lake Mead in 1935. The phenomenon has always been controversial, but the idea that earthquakes can if fact be triggered started to gain acceptance in the late 1960’s. As the number of dams increased so did the cases of RTS. Improvements in seismic monitoring and installation of instruments prior to impoundment also helped verify that RTS was a real phenomenon. Triggered seismicity was recognized as a physical response of a crustal region to reservoir impounding when a causative fault is near failure. The two triggers of RTS are added weight stresses and pore pressure propagation. There are also empirical characteristics of RTS events and theoretical ways to judge if an event was triggered. This section will describe the characteristics and causes of RTS.
2.3.1 Causes of Reservoir Triggered Seismicity
Several factors are linked to RTS: a seismically active environment, presence of a causative fault, added weight, pore pressure propagation from the reservoir, and changes in water level after impoundment.
Triggered seismicity requires the presence of a causative fault. It is thought that no earthquake can be triggered by a reservoir with a magnitude higher than that of the naturally occurring earthquake. The seismic triggering parameters of impounding are the added weight of the reservoir and the pore pressure effects from the reservoir. The added weight causes stress changes in the crust immediately while pore pressure build up or propagation may take some time and may even recur. For example, triggered events at Monticello reservoir were largely attributable to changes in pore pressure due to diffusion. Diffusion through different rock types helps explain why the reservoir experienced renewed RTS after about 6 years of no triggered events (Chen and Talwani, 2001b). Annual fluctuations in in reservoir level after impoundment can also have an effect on RTS (Roeloffs, 1988).
Proposed physical mechanisms of RTS and two selected case histories which illustrate them are discussed in detail in Section 2.3.4.
Page 5 3/29/2013
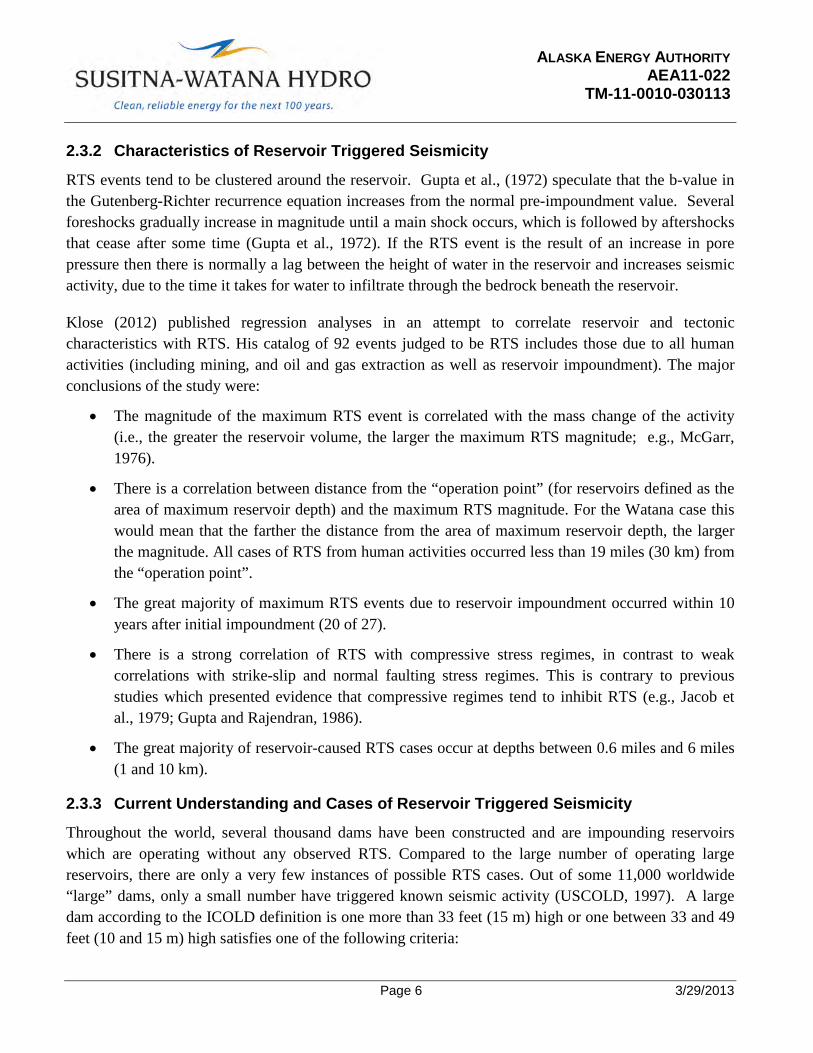
ALASKA ENERGY AUTHORITY AEA11-022 TM-11-0010-030113 2.3.2 Characteristics of Reservoir Triggered Seismicity
RTS events tend to be clustered around the reservoir. Gupta et al., (1972) speculate that the b-value in the Gutenberg-Richter recurrence equation increases from the normal pre-impoundment value. Several foreshocks gradually increase in magnitude until a main shock occurs, which is followed by aftershocks that cease after some time (Gupta et al., 1972). If the RTS event is the result of an increase in pore pressure then there is normally a lag between the height of water in the reservoir and increases seismic activity, due to the time it takes for water to infiltrate through the bedrock beneath the reservoir.
Klose (2012) published regression analyses in an attempt to correlate reservoir and tectonic characteristics with RTS. His catalog of 92 events judged to be RTS includes those due to all human activities (including mining, and oil and gas extraction as well as reservoir impoundment). The major conclusions of the study were:
• The magnitude of the maximum RTS event is correlated with the mass change of the activity (i.e., the greater the reservoir volume, the larger the maximum RTS magnitude; e.g., McGarr, 1976).
• There is a correlation between distance from the “operation point” (for reservoirs defined as the area of maximum reservoir depth) and the maximum RTS magnitude. For the Watana case this would mean that the farther the distance from the area of maximum reservoir depth, the larger the magnitude. All cases of RTS from human activities occurred less than 19 miles (30 km) from the “operation point”.
• The great majority of maximum RTS events due to reservoir impoundment occurred within 10 years after initial impoundment (20 of 27).
• There is a strong correlation of RTS with compressive stress regimes, in contrast to weak correlations with strike-slip and normal faulting stress regimes. This is contrary to previous studies which presented evidence that compressive regimes tend to inhibit RTS (e.g., Jacob et al., 1979; Gupta and Rajendran, 1986).
• The great majority of reservoir-caused RTS cases occur at depths between 0.6 miles and 6 miles (1 and 10 km).
2.3.3 Current Understanding and Cases of Reservoir Triggered Seismicity
Throughout the world, several thousand dams have been constructed and are impounding reservoirs which are operating without any observed RTS. Compared to the large number of operating large reservoirs, there are only a very few instances of possible RTS cases. Out of some 11,000 worldwide “large” dams, only a small number have triggered known seismic activity (USCOLD, 1997). A large dam according to the ICOLD definition is one more than 33 feet (15 m) high or one between 33 and 49 feet (10 and 15 m) high satisfies one of the following criteria:
Page 6 3/29/2013
ALASKA ENERGY AUTHORITY AEA11-022 TM-11-0010-030113
• more than 1640 feet (500 m) long;
• reservoir capacity exceeding 811 acre-feet (1 Mm3, or 1 x 10⁶ m3); or
• spillway capacity exceeding 70,629 ft3/s (2,000 m3/s)
Gupta (2002) reports that, over 90 sites have been globally identified where earthquakes have been triggered by filling of water reservoirs. Although it is uncommon for a reservoir to experience RTS (0.08%, based on 11,000 reservoirs of which 90 experienced RTS) it cannot be precluded from occurring at the planned Susitna-Watana site.
At those reservoirs where RTS has been suspected, the maximum reported earthquake magnitudes for RTS events are primarily much less than M 6.0 (M is assumed equivalent to Mw), and typically in the micro earthquake, or small macro earthquake range (i.e., < M 4.0). These are nearly all below the range felt by humans and are only detectable by local seismographs.
The most significant aspect of the RTS record is the fact that of the verified RTS cases large enough to be potentially damaging, only four events have exceeded magnitude M 6 and only 13 events were in the range M 5.0 to M 5.9 (USCOLD, 1997; Yeats et al, 1997). The largest reported RTS earthquake was the 1967, magnitude M 6.5, Koyna, India event. The other three events were: Hsinfengkiang (China, 1962) M 6.1; Kariba (Zambia, 1963) M 6.0; and Kremasta (Greece, 1966) M 6.3. It is still disputed whether the May 12, 2008 Mw 7.9 Wenchuan earthquake in China was influenced by the impoundment of nearby Zipingpu Dam (see section 2.3.4.3).
The state of the practice on understanding and being able to predict RTS is quite primitive, and likely to remain so for the near future. Physical theories of stress changes due to reservoir loading and the percolation of water into the upper crust are sound, but make many simplifying assumptions. The most important assumption is that the physical properties of the upper crust are isotropic. This is nearly always not the case, and the determination of these properties in the volume of crust affected by reservoir impoundment is usually not practically possible, not financially possible, or both. A fault plane can be modeled with properties that deviate from the isotropic case, but the location of the fault and its properties are usually impossible to determine with the required accuracy.
2.3.4 Physical Mechanisms of Reservoir Triggered Seismicity and Selected Cases
2.3.4.1 Introduction
Early studies of RTS for the most part focused on documenting the phenomenon and compiling empirical data on its occurrence. These observations consisted of parameters such as reservoir depth, volume and filling history, and tectonic parameters such as geology of the region, historic seismicity, crustal stress state and direction, and presence or absence of faults, active or not, in the vicinity of the reservoir. These observations were then treated in a statistical manner to obtain probabilities of future
Page 7 3/29/2013
ALASKA ENERGY AUTHORITY AEA11-022 TM-11-0010-030113 RTS occurrence. The earlier analysis of RTS for the Watana site (WCC, 1980) relies completely on such an empirically-based statistical approach.
Because RTS is a physical process, the ideal method of forecasting RTS behavior would be to accurately model and calculate the stress changes in the volume of upper crust beneath the reservoir and determine whether these changes exceed the failure strength of faults that exist in the volume. However, because very little is known about the detailed physical, mechanical, and hydraulic properties of the rocks beneath the planned reservoir, as well as the existence of faults and their properties, this method will not be possible, in most cases, for the foreseeable future.
In spite of these practical difficulties, it has been recognized that the production of earthquakes from stress changes due to reservoir impoundment has two causes: the weight of water on the crust (reservoir loading), and pore pressure changes on fault surfaces due to downward diffusion of water (e.g., Simpson et al., 1988).
The following discussions of reservoir loading and pore pressure changes highlight representative studies and conclusions, but are not an exhaustive review of the literature.
2.3.4.2 Physical Mechanisms
Carder (1945) was one of the first studies relating reservoir loading to enhanced seismicity. Coincident with the filling of Lake Mead behind Hoover Dam in the late 1930’s, local seismograph stations documented increases in seismicity correlated with reservoir level. A prominent spike in activity rate was observed about 6 months after the reservoir reached maximum height. He applied the Richter (1958) formula relating magnitude of all observed earthquakes to energy
Log E = 11.3 + 1.8 * M (1)
Where E is energy in ergs, and M is magnitude, and then calculated the depression of the crust due to weight of the water by dividing the energy from the earthquakes by the reservoir load (12 x 109 tons). He arrived at a “settlement” of the crust of about 10 inches. Later geodetic studies (Lara and Sanders, 1970) found the maximum settlement to be about 8 inches, a reasonable agreement.
Gough and Gough (1970) proposed that RTS is caused by either 1) the direct increase of shear stress on a fault caused by the added surface load, 2) the indirect effect of the added stress in triggering the release of stress on an already stressed fault, or 3) the increase in pore pressure due to the water load and its downward diffusion. Bell and Nur (1978) ruled out 1) as an independent mechanism since at 1 bar/10 m water depth, a deep (200 m) reservoir would provide a stress of only about 20 bars, insufficient to cause fault rupture, and also rule out 2), since water load alone leads to fault strengthening. Simpson (1976) also rules out 2) based on Mohr circle analysis, showing that increased normal stress on either normal, thrust, or strike-slip faults moves the stress state away from failure.
Page 8 3/29/2013
ALASKA ENERGY AUTHORITY AEA11-022 TM-11-0010-030113 A number of publications describe the technical details of 3) above. The discussion below is abstracted or paraphrased from Snow (1972), Bell and Nur (1978), Simpson (1976), Simpson et al. (1988), Roeloffs (1988), Kisslinger (1976), Scholz (1990), Talwani (1997), and Ge et al. (2009).
As discussed above, RTS has been ascribed to two mechanisms: 1) the direct effect of reservoir loading, through increased elastic shear stress; and (2) the effect of increased pore pressure, through decreased effective normal stress across a fault. Increased pore pressure at depth can either be due to the volumetric strain component of the elastic field producing a decrease in pore volume, or result from diffusion of pore pressure from the reservoir at the surface.
These effects can be expressed by the change in effective Coulomb stress ∆Se:
∆𝑆𝑒 = ∆𝜏 − 𝜇(∆𝜎 + ∆𝑃) (2)
where µ is the coefficient of friction on the fault, τ is shear stress in the fault slip direction, σ is normal stress perpendicular to the fault, and P is pore pressure (Ge et al., 2009). Hence positive change in ∆Se promotes failure, and negative change inhibits failure. Coulomb stress increases of >= 1.45 pounds per square inch (psi) (0.01 MPa) have been shown to be associated with seismicity rate increase and in many cases triggering earthquakes (Reasenberg and Simpson, 1992; Stein, 1999).
The fluid diffusion term, ∆P, in equation (2) accounts for two effects: 1) the instantaneous pore pressure response to the volumetric stress resulting from the static load of the reservoir pool, known as the ‘‘undrained’’ response, and 2) the time-dependent pore pressure diffusion due to the permanent presence of water pressure at the bottom of the reservoir (Roeloffs, 1988). “Undrained” means that the water does not have time to migrate away from the fault. The magnitude of the undrained pressure change depends on rock compressibility and is proportional to the mean stress, is largest upon initial loading, and decays through time due to pore pressure diffusion. The rate of pore pressure change depends on the hydraulic diffusivity of the rocks.
Thus there are two fundamental physical mechanisms of RTS, both of which are time-dependent. The first begins almost immediately following the first filling of the reservoir. In the second, increases in seismicity are not observed until a number of seasonal filling cycles have passed. These differences in response may correspond to two fundamental mechanisms by which a reservoir can modify the strength of the crust - one related to rapid increases in elastic stress due to the load of the reservoir, and the other to the more gradual diffusion of water from the reservoir to hypocentral depths. Decreased strength can arise from changes in either elastic stress (decreased normal stress or increased shear stress) or from decreased normal stress due to increased pore pressure. Pore pressure at hypocentral depths can rise rapidly, from a coupled elastic response due to compaction of pore space, or more slowly, with the diffusion of water from the surface. Talwani (1997) refers to this as a coupled response.
Page 9 3/29/2013
ALASKA ENERGY AUTHORITY AEA11-022 TM-11-0010-030113 There are substantial differences in the temporal and spatial characteristics of the response of the crust to these processes and it should be possible to identify the dominant mechanism, through a comparison of changes in seismicity with water level in the reservoir.
Talwani et al. (2007) concluded that hydraulic parameters could be directly related to RTS. The hydrologic property controlling pore pressure diffusion is hydraulic diffusivity c, which is directly related to intrinsic permeability k. By analyzing more than 90 case histories of induced seismicity, they determined the hydraulic diffusivity value of fractures associated with seismicity to lie between 1.1 ft2/s and 108 ft2/s (0.1 and 10 m2/s). This range of values of c corresponds to a range of intrinsic permeability values between 5 x 10-15 and 5 x 10-13 ft2 (5 x 10-16 and 5 x 10-14 m2). They call this range the seismogenic permeability kS. Fractures with permeability less than kS were aseismic, as the pore pressure increase was negligible.
Schaeffer (1991) published observations relating joint intensity to RTS at Lake Keowee, South Carolina. He found a negative correlation between joint intensity (measured as joint surface area per unit rock volume at surface exposures) and location of RTS. His explanation is that low joint density implies low permeability, inhibiting fluid flow and thus increasing pore pressure which in turn promotes RTS. Borehole data showed that the fracture density did not change significantly through depths up to 350 m. It has been shown in other studies (e.g., Rice and Cleary, 1976) that fracture characteristics are the primary controlling factor in fluid flow through the crust.
Saxena et al. (1988), through modeling studies involving changes in effective stress (equation 2), in situ stress, and water level variations, concluded that high permeability is associated with high RTS activity during initial filling, but low activity after reservoir level stabilizes. In contrast, they found that low permeability is associated with low initial RTS but continuous RTS afterward.
In summary, this section discusses a limited number of representative studies that have presented RTS physical theory and relate hydraulic parameters and rock fracture characteristics to its occurrence. While the theory and mechanisms have a sound basis and correlate with well-documented RTS cases, it must be emphasized that for the purposes of this report they have little predictive value. This is because they are forensic in nature, and present hydraulic parameters and physical conditions in the top few kilometers of crust that are not practically possible to measure through conventional sampling methods. For example, the Talwani et al. (2007) ks parameter can only be determined after the time-dependent behavior of RTS has been observed.
2.3.4.3 Analysis Techniques and Case studies
While most case studies of RTS have consisted of attempts to explain observations in light of the above mechanisms, recent studies, particularly of the Mw 7.9 Wenchuan, Sichuan, China earthquake, have been analyzed with dynamic 2-D finite element techniques. While these methods have been unable to
Page 10 3/29/2013
ALASKA ENERGY AUTHORITY AEA11-022 TM-11-0010-030113 definitively state whether the earthquake was a case of RTS, they represent a new technique with which future RTS cases will be analyzed. These modeling efforts are used in conjunction with traditional observational and statistical techniques.
Below, two cases are discussed in detail to give a sense of how similar analyses for the Watana site might be conducted. The first is for Nurek Dam and reservoir, Tajikistan (Simpson and Negmatullaev; 1981). This dam and reservoir have important similarities to the proposed Watana dam: it is 1033 feet (315 m) high, 2624 feet (800 m) long, with a maximum reservoir depth of 984 feet (300 m). The reservoir contains 8.5 x 10⁶ acre-feet (10.5 x 10⁹ m3) of water, and extends 25 miles (40 km) upstream with a maximum width of 4 miles (6 km). In comparison, the proposed Watana dam will be 735 feet (224 m) high and 1640 feet (500 m) long, with a maximum reservoir depth of 595 feet (183 m). The reservoir will contain 5.2 x 10⁶ acre-feet (6.4 x 10⁹ m3) of water, extend 44 miles (70 km) upstream, with a maximum width of 1.2 miles (2 km). Both lie within seismically active, compressive tectonic environments. The region surrounding Nurek Dam had adequate seismic monitoring before and after initial filling, as will be the case for Watana Dam.
The second is the case of Zipingu reservoir, Sichuan, China. With a volume 811,000 acre-feet (1 x 10⁹ m3) this reservoir has less capacity than Nurek or Watana, is not as deep at 426 feet (130 m), but also lies within a seismically active, compressive tectonic environment. The Mw 7.9 earthquake occurred 2 ½ years after initial impoundment on a previously identified fault. Though the epicenter was only 12 miles (20 km) from the reservoir, the rupture initiation depth was 12 miles (20 km), deeper than that usually attributed to RTS. The magnitude is significantly greater than that (~ 6.5) associated with RTS historically (Allen, 1982).
2.3.4.3.1 Nurek Dam and Reservoir, Tajikistan
In the Nurek area more than 1800 earthquakes with magnitude less than 4.6 were recorded in the 9 years after initial filling in 1971, which was four times the pre-impoundment rate. Increased seismicity coinciding with initial filling was located 6-9 miles (10-15 km) away from the reservoir, but migrated to beneath the reservoir and upstream, as the reservoir area increased with time. An important observation was that bursts of seismicity (including the largest events) coincided with changes in filling and drawdown rates. These changes (in terms of reservoir elevation) were as small as 0.66 ft/day (0.2 m/day), and seismicity response times were short, on the order of 1-4 days.
As shown in Figure 1 (from Simpson and Negmatullaev, 1981), the initial filling of the reservoir was accompanied by increased seismicity and again four years later when the water depth was raised over 200 m.
Simpson and Negmatullaev (1981) attributed these observations to the physical mechanisms described above operating dynamically as follows:
Page 11 3/29/2013
ALASKA ENERGY AUTHORITY AEA11-022 TM-11-0010-030113 “Raising the water level immediately increases the vertical stress which opposes the natural horizontal compression and stabilizes faults. The diffusion of increasing pore pressure into fault zones gradually decreases the effective stress, weakening the faults. As long as the water level continues to rise and the load effect exceeds the pore pressure, the net effect is one of increased stability. If the water level decreases rapidly, however, the stabilizing effect of the increased vertical stress is removed immediately, whereas high pore pressure persists until it can diffuse away. Thus, rapid decreases in water level can lead to immediate instability (Simpson, 1976). Lateral variations in permeability (e.g., along faults) can produce zones of increased pore pressure where net weakening can occur (Bell and Nur, 1978).
The opposing nature of the effects of load and pore pressure in regions of maximum horizontal compression can explain the relationship between loading rate and seismicity at Nurek. As the water level rises, the load effect initially dominates causing lower seismicity. When the filling rate decreases, rising pore pressure exceeds the load effect, resulting in increased seismicity as a peak in water level is reached. If the water level remains constant, pore pressure and load equilibrate and seismicity decreases. When the water level drops, the load is removed before pore pressure can disperse and activity increases with little or no time delay. If changes in the rate of filling take place slowly compared to the diffusion time constant, the effect is small. When they occur rapidly the effect on seismicity is much greater.”
2.3.4.3.2 Zipingu Reservoir, Sichuan, China
The epicenter of Mw 7.9 Wenchuan earthquake that occurred after filling of the reservoir was located 12 miles (20 km) from the reservoir, but is postulated to have occurred on the Yinxiu-Beichuan fault, part of a belt of northwest-dipping thrust faults which forms the edge of the Tibetan Plateau.
Ge et al. (2009) constructed a 2-D finite-element model across the fault and reservoir, in order to dynamically model the physical mechanisms described above. The results are shown in Figure 2. Parameters in the model include fault geometry, coefficient of friction on the fault (µ), diffusivity (D), Skempton’s constant (B) (which relates pore pressure to mean stress; see Roeloffs; 1988), and Poisson’s ratio (ν) (an rock elasticity parameter, e.g., Jaeger and Cook, 2007). Panel (a) shows the stress changes due only to the static reservoir load, (b) shows the stress changes due to diffusion of pore pressure, and (c) shows the combined effects of (a) and (b) at the time of the Mw 7.9 earthquake. The blue areas are where stresses are increased, therefore inhibiting slip, and red areas are where stresses are decreased, thus promoting slip. Because the earthquake location is within the region of decreased stress, Ge et al. proposed that the earthquake can be attributed to the influence of Zipingu reservoir, which elevated the Coulomb stress (equation 2) by 1.45 -7.25 psi (0.01 – 0.05 Mpa [megapascals]).
A similar analysis was published by Klose (2011), who supported the hypothesis that the earthquake was most likely triggered by lithostatic and poroelastic stress changes on the fault plane.
Page 12 3/29/2013
ALASKA ENERGY AUTHORITY AEA11-022 TM-11-0010-030113 Lei (2011) studied both local seismicity and Coulomb stress changes, and while concluding that microseismicity in the vicinity was caused by reservoir effects, reserved judgment on whether the Mw 7.9 event was directly caused by reservoir operations.
Similar analyses by Deng et al. (2010), Zhou et al. (2010), and Galahaut and Galahaut (2010) came to the opposite conclusion; that it is unlikely that the reservoir played a role in the Mw 7.9 earthquake.
All of these studies applied the same physical theory described in Section 2.3.4.2. A comment and reply between Ge and Zhou and Deng (Ge, 2011; Zhou and Deng, 2011) provided a debate regarding their conclusions and details of the modeling technique and analyses. Figure 3, from Zhou and Deng (2011) provides an alternative analysis, and a conclusion contrary to that of Ge et al. (2009).
A recent inversion for rupture history using teleseismic body waves, strong motion data ,and geodetic observations by Hartzell et al. (2013) resulted in a complex, interacting faulting model on three spatially separated fault planes; a more complicated geometry than was assumed in the Coulomb stress models. The hypocentral depth and fault dip angles he used were also different, due to the availability of more recent geophysical data.
A primary cause of the discrepancy in the conclusions of the various studies is the uncertainty in the location of the fault plane at depth, and in the hypocentral location of the earthquake. As seen in Figure 2, the dashed fault plane location implies that it is an estimate, and the two hypocentral positions, in addition to discussion by Zhou et al. (2010) indicates that the uncertainty in the earthquake location may be on the order of several kilometers.
These analyses of the Wenchuan earthquake reveal the strengths and weaknesses of Coulomb stress change modeling. While long-accepted and confirmed formulations of stress changes due to reservoir impoundment and finite element computer codes allow for numerical modeling of the phenomenon in both 2-D and 3-D, the conclusions are inescapably sensitive to knowledge of hydraulic parameters, and detailed knowledge of the existence of and geometry of faults beneath the reservoir.
Due to its size, the massive destruction it caused, the quantity of geological and geophysical data collected before and after the earthquake, and its status as a suggested RTS event, the Wenchuan earthquake has been, and will continue to be, the subject of further research. The purpose of this discussion is not to judge whether or not it can be classified as an RTS event, but to illustrate current modeling techniques and sources of associated uncertainties.
2.3.5 State of the Practice for Determining the Potential for Reservoir Triggered Seismicity
To assess the potential and monitor RTS, especially for dams of greater height, ICOLD recommends that the following sets of data be evaluated:
Page 13 3/29/2013
ALASKA ENERGY AUTHORITY AEA11-022 TM-11-0010-030113
• tectonic conditions and data on structural geology, supported by study of aerial photographs
• macroseismic data pertinent for the reservoir under study
• detailed information on active faults in a wider region especially all available data on recent fault activity in the dam and reservoir region
• assessment of the seismic capability of all known faults in the dam and reservoir region
• the regimes of underground water
Based on the current state of the practice and in consideration of ICOLD’s recommendations on assessing the potential and monitoring RTS the following recommendations are made for this project: 1) statistical comparisons to cases of accepted RTS, 2) measurement of hydraulic properties of rocks beneath the reservoir, 3) measurement of joint density and orientation of rocks at the dam site and deeper parts of the reservoir, 4) numerical modeling of stress changes due to loading and pore pressure changes due to downward diffusion of water, 5) monitoring and analysis of pre- and post-impoundment seismicity, and 6) identification of faults favorably oriented to the current stress field as potential locations of RTS.
2.3.6 Database of Reservoir Triggered Seismicity
A database was compiled of all the reported RTS cases worldwide. This database, included in Appendix A, was completed by combining the following studies:
• Appendix A and Appendix B from the Woodward Clyde Consultants (WCC 1977) study for Auburn Dam. Appendix A consists of summaries of the reservoir impoundment data and information regarding the geology and seismicity that were compiled during this study for the 55 reported cases of RTS. Appendix B consists of summaries of the data compiled regarding reservoir impoundment and geologic conditions at the very deep reservoirs of the world. For the purposes of this study, a very deep reservoir was defined as being 492 feet (150 m) deep or more.
• The International Commission on Large Dams (ICOLD or CIGB) list of dams was sorted as follows:
o ICOLD-CIGB 2012 database was obtained and all dams with a height of 328 feet (100 m) were selected. (see calculation for water depth based on dam height below)
o Dams that were under construction or abandoned were removed
o All dams classified as “Secondary” were removed.
o Database was sorted by reservoir name and those reservoirs with more than the main dam listed were removed.
Page 14 3/29/2013
ALASKA ENERGY AUTHORITY AEA11-022 TM-11-0010-030113
o Database was sorted by reservoir capacity and those reservoirs with more than the main dam listed were removed (after cross checking for similar locations).
o Database was sorted by reservoir area and those reservoirs with more than the main dam listed were removed (after checking for similar locations).
o Dams built after 2002 were not included in the study, which gives approximately 10 years for a RTS event to occur and be reported.
This database from ICOLD was presented as a listing of dams, because several dams exist for a single reservoir every effort was made to remove duplicate reservoirs.
• This database was also compared to Table 10-1 in the WCC (1980) Study for Susitna and additional Reported Cases of RTS were added. The classification of RTS was also edited.
• A literature review was completed and the database was updated with references as needed. A report by Gupta (2002), titled “A review of recent studies of triggered earthquakes by artificial water reservoirs with special emphasis on earthquakes in Koyna, India”, was used extensively.
• A list of RTS published by International Rivers (internationalrivers.com) was compared to the existing list. Dams that were not already included in the database were investigated to evaluate the validity of the reported RTS.
• A final review of ICOLD’s document was performed and cases that were not RTS were edited
It should be noted that no determination was made whether a case was accepted, questionable, or reported, other than removing non-RTS events as clarified by the ICOLD (2011). In addition, the height of the dam was used to estimate the maximum water depth because water depth is directly related to the stress imposed by a reservoir. The depth was estimated from dam height and type as done by Packer et al. (1977). The following was formulas were used:
• Concrete dams greater than 492 feet (150 meters) in height, 98 feet (30 meters) was subtracted from the dam height
• Concrete dams between 328-492 feet (100-150 meters) in height, 59 feet (18 meters) was subtracted from the dam height
• Concrete dams less than 328 feet (100 meters) in height, the height was multiplied by 0.9
• Earth or rock dams greater than or equal to 328 feet (100 meters) in height, the dam height was multiplied by 0.95
• Earth or rock dams less than 328 feet (100 meters) in height, the dam height was multiplied by 0.90.
Based on this research a total of 109 dams were classified as having reported RTS. The following references were used to classify a case as RTS:
Page 15 3/29/2013

ALASKA ENERGY AUTHORITY AEA11-022 TM-11-0010-030113
• Anglin, F. M., & Buchbinder, G. G. (1985). Induced seismicity at the LG3 Reservoir, James Bay, Quebec, Canada. Bulletin of the Seismological Society of America, 75(4), 1067-1076.
• Chen, L., & Talwani, P. (1998). Reservoir-induced Seismicity in China. Pure and Applied Geophysics, 133-149.
• Gupta, H. K. (2002). A review of recent studies of triggered earthquakes by artificial water reservoirs with special emphasis on earthquakes in Koyna, India. Earth-Science Reviews.
• ICOLD Committe on Seismic Aspects of Dam Design. (2011). Reservoirs and Seismicity - State of Knowledge- Bulletin 137. Bulletin 137.
• Leblanc, G., & Anglin, F. (1978, October). Induced seismicity at the Manic 3 reservoir, Quebec. Bulletin of the Seismological Society of America, 68, 1469-1485.
• Lei, X. (2011). Possible Roles of the Zipingpu Reservoir in triggering the 2008 Wenchuan earthquake. Journal of Asian Earth Sciences, 844-854.
• Packer, D. R., Cluff, L. S., Knuepfer, P. L., & Withers, R. J. (1979). Study of Reservoir Induced Seismicity. San Francisco: Woodward-Clyde Consultants. WCC Auburn Report Appendix A:
• Plotnikova, L. M., Makhmudova, V. I., & Sigalova, O. B. (1992). Seismicity Associated with the Charvak Reservoir, Uzbekistan. PAGEOPH, Vol. 139, No. 3/4.
• Woodward-Clyde Consultants. (1977). Reservoir Induced Seismicity- Auburn Dam. San Francisco.
ICOLD (2011) states that the range is likely between 40 and 100. However, for conservatism reported or questionable cases were used in the statistical analysis and only those as determined non-RTS were removed from this list. Figure 4, is a plot showing all of the dams with water depths greater than 300 feet (92 m)) and reservoir volumes greater than 8.1 x10⁵ acre-feet (1 x10⁹ m3) used in this study.
3.0 GEOLOGIC AND TECTONIC SETTING OF THE RESERVOIR TM-4 (Fugro Consultants, 2012) provided an updated summary of the geologic and tectonic setting of the project for use in the seismic hazard evaluation. Discussions of geology and tectonics that follow in this section are largely abstracted from that report. South-central Alaska experiences rapid rates of tectonic deformation driven by the obliquely convergent northwestward motion of the Pacific plate relative to the North American plate. In southern and south-eastern Alaska the convergent and oblique relative plate motion is caused by subduction of the Pacific Plate at the Alaska-Aleutian megathrust and dextral (right-lateral) transform faulting along the Queen Charlotte and Fairweather fault zones. The transition from subduction to transform tectonics is complicated by the Yakutat microplate which is colliding with southern Alaska along the eastern edge of the subducting slab. The collision of the
Page 16 3/29/2013
ALASKA ENERGY AUTHORITY AEA11-022 TM-11-0010-030113 Yakutat microplate is considered to have substantial influence on the deformation and counter-clockwise rotation in the interior of south-central Alaska (Haeussler, 2008). In the interior of south-central Alaska, transpressional deformation primarily is accommodated by dextral slip along the Denali and Castle Mountain faults, as well as by horizontal crustal shortening to the north of the Denali Fault. The crustal stress data in the site region, south of the Denali fault and north of the Castle Mountain fault, is heterogeneous and appears to rotate in orientation from west to east, but largely seems to be consistent with a transpressional tectonic setting and dominantly reverse and dextral strike-slip faulting (Figures 5 and 6).
3.1 Regional Geology and Tectonics The Susitna-Watana dam site is located within a distinct crustal and geologic domain referred to in this report as the Talkeetna block. The Talkeetna block is bounded by the Denali fault system to the north, the Castle Mountain fault to the south, the Wrangell Mountains to the east and the northern Aleutians and Tordrillo Mountains volcanic ranges to the west (Figure 5). The Talkeetna block encompasses the north-central portion of the Southern Alaska Block (SAB) of Haeussler (2008) (Figure 6). Major strain release occurs on northern and southern block boundaries (i.e., Denali and Castle Mountains bounding faults), but mechanisms of strain accommodation are less well defined to the east and west. There is a relative absence of large historical earthquakes within the Talkeetna block, as well as a lack of mapped faults with documented Quaternary displacement within the Talkeetna block (Fugro Consultants, 2012, TM-4).
The Talkeetna block is comprised of three principal physiographic provinces: the Susitna basin, Talkeetna Mountains, and the Copper River basin (Figure 5). The Susitna-Watana dam site is located within the Talkeetna Mountains province. The Copper River basin is an intermontane basin surrounded by the Alaska, Talkeetna, Chugach and Wrangell mountains. The basin is characterized by flat lying to hummocky topography and is overlain by extensive glacial, glacio-fluvial, and glacial-lacustrine deposits. The Susitna basin is a somewhat north south trending basin and is the principal depocenter for alluvium transported by numerous major river systems which originate in the surrounding mountains. The Talkeetna Mountains are an elevated block which lies between the Copper River and Susitna basins, with glaciated peaks between 6560 feet and 9840 feet (2000 m and 3000 m) elevation. The Susitna River heads in the ranges north of the Copper River basin and flows westward through the northern Copper River basin and through the Talkeetna Range following a deeply incised canyon. Downstream, sediments from the river contribute to alluvial deposition in the Susitna Basin.
The Talkeetna Mountains consist of an assemblage of northeast trending tectnostratigraphic terranes including the North Talkeetna Flysch Basin, the Wrangellia Terrane, and the Peninsular Terrane (Glen et al., 2007b). The Wrangellia and Peninsular Terranes are comprised of largely late-Paleozoic to early Mesozoic metavolcanic and metasedimentary rocks that originated well south of their current position
Page 17 3/29/2013
ALASKA ENERGY AUTHORITY AEA11-022 TM-11-0010-030113 (~30° latitude), and likely were sutured together in the Late Jurassic (Csejtey, et al. 1982). The terranes were accreted onto North America in the mid- to late-Cretaceous and translated northward to approximately their current location via strike-slip faults on the continental margin (i.e. Fairweather fault) (Ridgway et al., 2002). The North Talkeetna Flysch Basin contains part of the Kahiltna assemblage, which consists of argillaceous strata deposited in an oceanic basin between the Wrangellia Terrane and North America prior to and during the early stages of accretion. The North Talkeetna flysh basin consists of sediments shed to the northwest from the Wrangellia Terrane (Glen et al., 2007a). Following deposition, the basin sediments were obducted on to the continent during Wrangellia emplacement. The north-east striking Talkeetna thrust fault is the principal terrane-bounding structure in the dam site region, separating the North Talkeetna flysch basin in the northwest from the Wrangellia Terrane in the southeast (Figures 7 and 8). In addition to the three principal tectonostratigraphic terranes, numerous narrow, fault bounded terranes are tectonically intermixed within the Kahiltna Assemblage between the Denali fault and the Talkeetna thrust fault (i.e. Chulitna Terrane) (Nokleberg et al., 1994). Late Cretaceous through Tertiary intrusive and extrusive volcanic rocks are found throughout the Talkeetna Mountains, and often intrude or overlie the Cretaceous accretionary structures.
Early tectonic studies of the Talkeetna Mountains described the Talkeetna thrust fault as a southeast dipping thrust that accommodated the middle to late Cretaceous emplacement of the Wrangellia Terrane (Csejtey, et al., 1982; Nokleberg et al., 1994). The fault trace is recognized by the juxtaposition of the Triassic and Permian metavolcanic and metasedimentary Wrangellia terrain rocks on the south and Late Jurassic through Cretaceous sedimentary rocks of the Kahiltna Assemblage on the north. The approximate fault trace follows a broad topographic trend striking northeast across the Talkeetna Mountains (Figure 8). On older maps, the southwestern margin of the fault is mapped as overlain or terminated by Tertiary intrusive and volcanic rocks (Csejtey and others, 1978); to the northeast the fault is interpreted to terminate or merge against the younger, north-dipping Broxson Gulch fault (Nokleberg et al., 1994).
Mapping by O’Neill et al. (2003a) along the northeastern reaches of the Talkeetna thrust fault found little evidence for penetrative deformation adjacent to the fault and stratigraphic relationships which suggest limited displacement along the fault. Based on these observations they concluded that major contractional displacement has not occurred along the Talkeetna thrust fault. O’Neill et al. (2003a) further propose that the principal suture zone is located to the northwest near Broad Pass where miniterranes of uplifted Wrangellia terrane basement rocks are exposed. They characterize the Talkeetna thrust fault as a deep crustal structure bounding the northwestern edge of the Wrangellia Terrane, overlain by a wide zone (0.5-12 mi [1-20 km]) of Tertiary or younger faults. Glen et al. (2007b) use tectonic analysis of gravity and magnetic data to propose replacement of the term Talkeetna thrust fault with the Talkeetna suture zone. Glen et al. (2007b) and O’Neill et al. (2003b) propose that the surface fault structures may have been reactivated in the late Tertiary as a broad dextral shear zone associated with movement along the Denali fault. As depicted on Figure 9, these interpretations likely
Page 18 3/29/2013
ALASKA ENERGY AUTHORITY AEA11-022 TM-11-0010-030113 imply that near-surface structures of the Talkeetna suture zone, termed the Fog Lakes Graben by Glen et al. (2007b) would have much different shallow geometries than the southeastern-dipping thrust fault implied from earlier mapping.
3.2 Reservoir Geology The topography of the Watana Reservoir and adjacent slopes is characterized by a narrow, V-shaped, stream-cut valley superimposed on a broad, glaciated basin. Late Quaternary glacial deposits overlie bedrock throughout much of the area, such that bedrock units are only intermittently exposed along the lower canyon walls and the upper elevations of the reservoir will overlie or onlap the Quaternary glacial deposits (Figures 8 and 10).
Generally, the upper slopes of the reservoir, and the broad flats adjacent to the Susitna River are covered by a stratified sequence of glacial till, outwash, and lacustrine deposits. These deposits were investigated extensively in the 1980’s near the dam site and along the southern reservoir rim to assess the water holding capabilities of the reservoir and as potential borrow sources (Acres, 1982; Harza-Ebasco, 1984). Two main types of till have been identified in this area: ablation and basal tills. The basal till is predominately overconsolidated, with a fine grain matrix (more silt and clay) and low permeability. The ablation till has fewer fines and a somewhat higher permeability. Outwash units consist of gravels, and sands, with higher permeabilities. Lacustrine deposits consist primarily of poorly graded fine grained sands and silts, with lesser amounts of gravel and clay, and exhibit a crude stratification.
The deepest portions of the planned reservoir, from just upstream of the dam site to Watana Creek (Figure 10) are mostly underlain by bedrock units comprised of a sequence of Cretaceous shales (regionally altered to argillite) and lithic greywacke sandstone of the Kahiltna assemblage (Csejtey et al., 1978). The Kahiltna assemblage is regionally intruded by small bodies of Paleocene granite units with interfingering migmatite and pelitic schists, and granodiorites with minor diorite (Csejtey et al., 1978). The intrusive rocks are part of a large suite of igneous (largely granitic and granodioritic) rocks which intruded between 53.2 Ma to 64 Ma during the late stages of accretionary tectonics. At the planned damsite, and for a short distance upstream within the reservoir extent, diorite and quartz diorite bedrock which is likely part of this regional intrusive suite underlies the reservoir (Acres, 1982). Other rock units, present as relatively small areas in the deeper portions of the reservoir include Paleocene to Miocene subaerial volcanic rocks and related shallow intrusives that may be related to the Paleocene plutons (WCC, 1980). At the dam site, these young volcanic rocks include andesite porphyry and numerous felsic through mafic dikes (Acres, 1982). Basalt flows outcropping in Deadman Creek, to the east of the dam site have an early-mid Eocene age (approximately 48 Ma, based on Argon isotope analyses AR40/39) (Schmidt et al., 2002).
Page 19 3/29/2013
ALASKA ENERGY AUTHORITY AEA11-022 TM-11-0010-030113 The main structural feature known within the Watana Reservoir is the Talkeetna thrust, which trends northeast-southwest and crosses the Susitna River approximately 8 miles (13 km) upstream from the Watana dam site (Figures 8 and 10). The Talkeetna thrust fault is a major terrane bounding structure associated with continental accretion in the Late-Cretaceous and Early Tertiary. The extension of this feature northeast of the reservoir is along Watana Creek. A sequence of folded and faulted Tertiary sediments is exposed along Watana Creek, elongated along the presumed trend of the Talkeetna thrust fault. These Tertiary sediments are in turn overlain by Quaternary glacial deposits and widespread landslides and slumps. To the southwest, prior site investigations (Acres, 1982; Harza-Ebasco, 1984) defined a buried channel of the Susitna River, filled with Quaternary glacial sediment that generally follows the trend of the Talkeetna thrust fault to the southwest towards Fog Creek (Figure 10).
Upstream of Watana Creek and the Talkeetna thrust fault, there is little detailed mapping information on the bedrock units or structures that would underlie the reservoir. Regional mapping (Figure 8) depicts these rocks as folded and deformed Paleozoic age shales, and limestones which are part of the Wrangellia Terrain (Figure 7). Older intrusive rocks may also underlie the shallow, upper reaches of the reservoir.
3.2.1 Detailed Geologic Data from the Watana Dam Site
The Watana dam site is primarily underlain by an intrusive dioritic body which varies in composition from diorite to granodiorite to quartz diorite (Figure 10). These intrusive rocks are part of a large suite of igneous rocks which intruded between 53 Ma to 64 Ma. These intrusive rocks are massive and they are generally hard, competent, and fresh except within locally developed fractured, sheared, and altered zones. These rocks have been subsequently intruded by mafic and felsic dikes which are generally only a few feet wide. The rock contacts are healed and competent. Bedrock immediately downstream and south of the dam site is Tertiary volcanic rocks that locally is a volcanic flow, an andesite porphyry but varies in composition to include dacite and basalt. The andesite is similar in chemical composition to the diorite. The andesite is generally slightly weathered, strong to very strong, competent and in places contains inclusions of the diorite. The nature of the contact zone of the andesite with the diorite is poorly understood. However, where mapped or drilled through, the contact zone is generally weathered and fractured over an interval of up to 10 to 15 feet. Detailed discussion of the andesite porphyry/diorite contact is presented in the Acres (1982) report.
In a number of boreholes, alteration zones were penetrated, zones where hydrothermal solutions have caused the chemical breakdown of the feldspars and mafic minerals in the host rock. The degree of alteration encountered is highly variable across the site. These zones are rarely seen in outcrop as where alteration is moderate to severe, bedrock is easily eroded into gullies, but were encountered in many of the boreholes. The transition between fresh and altered rock is gradational. The thickness of these zones in boreholes range up to 20 feet but are usually less than 5 feet and are often associated with close
Page 20 3/29/2013
ALASKA ENERGY AUTHORITY AEA11-022 TM-11-0010-030113 fracturing, fracture zones, or shear zones. The degree and character of rock fractures and joints farther upstream of the dam site is not known.
The two most prominent structural geologic features are located upstream and downstream of the Watana dam site (GF1 and GF7 on Figure 8). A detailed discussion of the significant upstream and downstream geologic features is presented in the Harza-Ebasco (1984) report along with permeability and hydraulic conductivity testing information from site drilling.
3.2.2 Quaternary Fault Evaluations and Lineament Mapping in the Project Area
Regional mapping is being performed by Fugro Consultants, Inc. for MWH using recently-acquired, detailed, topographic data (i.e., INSAR and LiDAR). Results of these evaluations are being documented as separate technical memorandum. As of February 2013, no new features which are strongly suggestive of Quaternary faulting have been identified, however additional field evaluations are planned to further evaluate several features within the region, including those that may lie within the planned reservoir. These evaluations are expected to include additional mapping and characterization of bedrock faults within the reservoir area, including along the Talkeetna thrust fault near Watana Creek. Additional analyses will be required to further evaluate the mapped lineaments, at which time the RTS study will also need to be updated.
3.3 Seismicity in the Reservoir Area The Watana Dam site lies in a seismically active area associated with the Pacific-North American plate boundary. Figure 11 shows a map and cross section of seismicity in south central Alaska. The seismicity clearly outlines the location and geometry of the subducting Pacific plate. The zone of contact between the two plates, termed the interface, is marked by an almost flat plane at a depth of 19 miles (30 km). About 37 miles (60 km) southeast of the site the plate starts to dip more steeply as the Pacific plate loses contact with the North American plate and begins its descent into the upper mantle. While interface earthquakes have thrust mechanisms reflecting underthrusting of the Pacific plate, earthquakes in the downgoing plate (termed intraslab) are largely due to the dynamic forces of gravitational pull and push from the spreading ridge that generates the Pacific plate. From the cross-section, the downgoing plate lies about 31 miles (50 km) beneath the site. This plate collision system comprises the primary seismic hazard at the site. The 1964 Mw 9.2 Alaska earthquake occurred on the plate interface.
In addition to these primary plate interactions, crustal faults have formed in response to stresses are transmitted to the crust above and landward of the plate interface. The oblique angle at which the Pacific plate intersects the North American plate has given rise to a transpressional environment in the crust, in effect causing the movement of south central Alaska to the southwest. The major expression of this environment is the Denali fault, which lies 43 miles (70 km) north of the site. The fault exhibits a slip
Page 21 3/29/2013
ALASKA ENERGY AUTHORITY AEA11-022 TM-11-0010-030113 rate of about 1 cm/year, and a Mw 7.9 earthquake occurred on it in 2002. The Castle Mountain fault is a similar but lower slip rate feature that lies 62 miles (100 km) to the south of the site. Although these are the most active and easily identified crustal faults, geomorphic evidence shows that less active, but potentially hazardous faults may exist in the vicinity of the dam and reservoir. These are the subject of ongoing investigations.
3.3.1 Watana Seismic Network
The Alaska Earthquake Information Center (AEIC), part of the Geophysical Institute of University of Alaska Fairbanks, has operated a seismic network in the state of Alaska since the 1970’s. During the planning phases for the Watana Dam project, it was recognized that increased seismograph station density would be required to adequately locate and analyze pre and post impoundment seismicity in the reservoir area. To that end, a four-station microseismic network was installed in late 2012 (August 12- November 16) by AEIC. The four stations are WAT1, WAT2, WAT3, WAT4. WAT1 is a 6-component, broadband-and-strong-motion station located near the proposed Watana Dam site. WAT2 and WAT3 are 3-component broadband stations located about 10 miles to the north and south of WAT1, respectively. WAT4 is a broadband station about 20 miles east of WAT1, on the north side of the proposed Watana Reservoir (Figure 12).
The data from the Watana network are integrated into the Alaska regional seismic network. Waveform data can be accessed via Incorporated Research Intuitions for Seismology (IRIS, www.iris.edu). Hypocenter data for a region around the site will be accessible on a monthly basis via an ftp site. With a station separation on the order of 16 km, this sub-network (in addition to surrounding AEIC stations) has greatly improved earthquake detection and location precision. One of the reasons this network was set up prior to dam construction was to monitor microseismicity in the area, as recommended by ICOLD (2011).
3.3.2 Seismicity in the Watana Region
Figure 13 shows all seismicity of magnitude greater than or equal to 3 from 1898 through 2010 from the AEIC catalog. There are about 4000 earthquakes on this figure, many of them being aftershocks of the Mw 7.9 Denali fault event. Another magnitude 7 event occurred in 1912, seen in the northeast part of the figure. There are five magnitude 6 events, and about 50 of magnitude 5.
Figure 14 shows local seismicity of all magnitudes from the AEIC catalog in an area within about 19 miles (30 km) of the dam and reservoir within the “RTS Zone” as defined in Section 4.1 below. There are 2716 earthquakes with magnitudes of 1 through 6. There are six magnitude 5 earthquakes in this data set. The pattern shows that the site lies within a relatively dense zone that abruptly decreases in intensity about 12 miles (20 km) east of the site.
Page 22 3/29/2013
ALASKA ENERGY AUTHORITY AEA11-022 TM-11-0010-030113 Figure 15 shows local seismicity from 2010 through November 16, 2012, the date the WAT stations in Figure 12 were integrated into the AEIC routine location process. Hypocenters with depth greater than 19 miles (30 km) are plotted in blue, those shallower in red. Figure 16 shows a cross-section through the A – A’ line on Figure 15, replicating the section shown in Figure 11, but local to the site area. The delineation between crustal seismicity and seismicity occurring within the downgoing North American plate is distinct.
Figures 17 and 18 show similar plots, but for the 3 ½ month period after deployment of the Watana sub-network. Comparing Figures 14, 15, and 17, the epicentral pattern appears stable over the 3 ½ year period. Comparing Figure 16 to Figure 18, the limit of crustal seismicity at about a 12 mile (20 km) depth, and the linear nature of intraslab seismicity appear better defined after deployment of the Watana sub-network. The cluster of crustal seismicity seen about 6 miles (10 km) northeast of the site in Figure 15 appears to be a persistent feature.
4.0 RESERVOIR TRIGGERED SEISMICITY FACTORS Several parameters can be useful when looking at the potential for RTS. These parameters are the depth, volume, stress state, geology, and fault activity (Baecher and Keeney, 1982). Empirical procedures for determining RTS will be presented in this report. However based on current research it is now believed that hydrology plays a more important role in determining a site’s susceptibly to RTS (Talwani et al., 2007)
4.1 General Reservoir Parameters (Depth and Volume) In the vicinity of the proposed Watana Dam site, the Susitna River has incised a narrow, steep-walled, east-west valley up to 800-feet deep into the broad Fog Lakes upland formed by repeated glaciations and surrounded by mountains of 3,000 to 6,300 feet in elevation. On the right bank (north) the valley rises at about a 2:1 slope from river level at El. 1,450 for approximately 600 feet, then flattens to a maximum elevation of 2,350 feet. Conversely, the left bank (south) rises more steeply from the river for about 450 feet at a slope of 1.4H:1V, then flattens to a 3H:1V or less to approximately El. 2,600 feet.
The proposed reservoir has a depth of about 600 feet (183 m). The total volume of the reservoir is planned to be 5.2 million acre feet (6 billion cubic meters). In comparison, the previously proposed reservoirs had a total volume of 10.7 million acre feet (13 billion cubic meters). The proposed reservoir’s dimensions would be approximately 41 miles (70 km) long and 2 miles (3 km) wide, following the general topography of a narrow steep-walled valley.
The previous study performed by WCC in 1982 used 3 times the reservoir width as the radius of the bottom of half-pipe in three-dimensional space (Withers, 1977). Then this was converted into rectangular three-dimensional space, with a length and width of 37 miles by 37 miles (60 km x60 km)
Page 23 3/29/2013
ALASKA ENERGY AUTHORITY AEA11-022 TM-11-0010-030113 and a depth of 19 miles (30 km). This rectangular space was centered about each site, such that the distance from the site to the edge of the space in all three dimensions was 19 miles (30 km). It was also assumed that the effects of ground motion from a RTS event outside of the 19 miles (30 km) would be negligible, based on their maximum RTS event and ground motion attenuation relations available at the time.
It is envisioned that the currently proposed configuration of the Watana Reservoir could experience RTS in a rectangular space defined as regions at least 30 km of the shoreline of the maximum reservoir level (Figure 14), with dimensions 75 miles (118 km) east to west and 54 miles (85 km) north. The 30 km distance is based on the Klose (2012) observation that all RTS cases occurred within 30 km of the “operation point”. The “operation point” is conservatively defined as the reservoir shoreline at maximum height. The fact that the WCC (1982) rectangle was also defined as points 30 km from the reservoir is coincidental.
This rectangle is shown as the “RTS Zone” in Figures 14, 15 and 17. The depth of the volume will be restricted to that defined by crustal seismicity, exclusive of subduction zone seismicity. From the cross sections in Figures 16 and 18 this depth appears to be about 20 km, but will be refined as more accurate hypocenters are developed. It is assumed that any RTS processes will be confined to the upper crust and mechanically decoupled from subduction zone processes.
4.2 Geologic Parameters The Watana Reservoir will straddle the Talkeetna thrust fault, a major terrane boundary in central Alaska (Section 3.1; Figures 7 through 10). Bedrock beneath the reservoir is dominantly metamorphic sediments, although the Watana dam site is in igneous and shallow volcanic rocks (Figures 7 through 10). The reservoir topography is long and narrow, with only relatively small arms along Deadman and Watana Creeks. Through most of the reservoir, the higher reservoir elevations will be in Quaternary glacial deposits which overlie the bedrock units in the lower and deeper sections of the reservoir.
Major known bedrock structures include the Talkeetna thrust fault which traverses the reservoir along Watana Creek, and where a folded and deformed trough of Tertiary sedimentary deposits is elongated to the northeast along the zone (Figure 10). Existing mapping of these features are primarily reconnaissance in nature and the detailed characteristics of this zone of bedrock fractures are unknown. Based on the more extensive geotechnical investigations near the Watana dam site some local structures have been mapped and described in intrusive rocks (Section 3.2.1). Some detailed descriptions of fractures and hydraulic parameters are available for these features; however, the applicability of these measurements to the non-igneous rocks and fracture systems within the proposed reservoir area is uncertain. Elsewhere in the proposed reservoir extent, existing mapping is primarily regional in nature, and additional bedrock faults are likely present, but not depicted on existing maps.
Page 24 3/29/2013
ALASKA ENERGY AUTHORITY AEA11-022 TM-11-0010-030113 4.3 Stress Regime RTS analysis requires knowledge of the local crustal stress field, because the larger earthquakes associated with reservoir operations have occurred on faults with a favorable orientation for re-activation. Figure 19, adapted from Ruppert (2008), summarizes an interpretation of the crustal stress field in south-central Alaska from earthquake focal mechanisms. Because this region is dominantly a compressive tectonic environment, the direction of maximum compressive stress, (σ1), is the important parameter in the azimuthal diagrams. The figure shows five polygons, selected on the basis of consistent stress directions indicated by the individual earthquakes in each polygon. Stresses in the three easterly polygons show a consistent counterclockwise rotation of σ1 from northeast-southwest to east-west. The “South of Denali” zone, which contains the Watana site, shows east-west compression in the southern Talkeetna Mountains, but rotates to northwest – southeast azimuth in the northern Talkeetna Mountains. This suggests that northeast-trending compressional structures may be favorably oriented for RTS. Variations in the least compressive stress, σ3, appear to imply a mix of strike-slip and thrust faulting. This zone covers a fairly large region, and it is not known if this pattern can be spatially discriminated on a finer scale within the zone. Additional seismograph stations installed in the region, including those specifically for the Watana Project, should be useful for this task, since the Rupert (2008)-type of analysis will provide the ability to obtain finer resolution of the patterns of shallow crustal stress in the reservoir region. Preliminary data for one crustal M 2.0 earthquake located about 15 km southwest of the Watana site appears to support the northwest – southeast orientation of compressive stress in the reservoir region (AEIC, 2013).
4.4 Faulting Parameters Studies to date have not identified evidence of Quaternary faults near the proposed reservoir with evidence of Quaternary faulting nor any existing zones of ongoing seismicity that define potentially active structural features (FCL, 2012). Additional detailed mapping of lineaments, faults, and evaluations of seismicity are part of ongoing efforts to confirm and further characterize the existence and potential for seismically active structures in the reservoir region, generally shown as the “RTS zone” area on Figure 14, at which time the RTS study will also need to be updated.
Potentially undiscovered faults in the region are most likely to have either low slip rates or long return periods between events. However, it is very important to identify these faults with low slip rates or long return periods that fall within the dam or reservoir area, to correctly define the design earthquake.
4.5 Hydrologic Parameters
4.5.1 Rock Mass Permeability
Rock mass permeability, the transmissibility of water through the bedrock, does not vary significantly within the site area, and is generally characterized as low to very low permeability, ranging between 0 to
Page 25 3/29/2013
ALASKA ENERGY AUTHORITY AEA11-022 TM-11-0010-030113 50 lugeons or 6.6 x 10⁻⁴ ft/sec to 8.7 x 10⁻⁶ ft/sec, but appears to be generally less than 15 lugeons. Transmissibility is controlled by a degree of fractures within the rock, with the higher rock mass permeability occurring in the more sheared and fractured zone (e.g., 30 – 50 lugeons. Rock mass permeability tends to decrease with depth. However, with the potential for frozen ground and ice-filled discontinuities, the low to very low rock mass permeability determined on the left (south) abutment may be influenced by ground temperature below freezing.
Earlier drilling programs at the Watana site, and also the Devil Canyon sites (30 km downstream of the Watana site) (Acres America; 1981; Harza-Ebasco; 1984) performed permeability tests in a number of boreholes. Figure 20 taken from Acres America (1981) for the Watana site shows average permeabilities of 2 x 10⁻⁶ to 1 x 10⁻⁵ in/sec (5 x 10⁻⁶ to 3 x 10⁻⁵ cm/sec) at bedrock depths of 200 – 800 ft. At the Devil Canyon site the values are more variable, ranging from 1 x 10⁻⁶ to 2 x 10⁻⁵ inches/sec (3 x 10⁻⁶ to 5 x 10⁻⁵ cm/sec) over the same depth range (Figure 21). The greater variability at Devil Canyon may reflect differences the argillite-graywacke rock properties compared to the metamorphosed igneous diorite at the Watana site.
4.5.2 Fracture Orientation and Density
The Acres America (1981) report summarized fracture orientations at the two sites. At Watana “…The prominent jointing and shearing direction is northwest trending with steep dips. Many fractures have thin clay gouge seams and slickensides”. At the Devil Canyon site “…Three joint sets were defined with the master set striking approximately 335o and dip 80o to vertical…Joint spacing ranges about 4 to 5 feet apart.” These were based on surface observations.
In the borehole summary logs for both sites the number of joints per 10 feet of core is highly variable from hole to hole, but generally varies between 5 and 25.
In summary, at both sites the dominant fracture and joint pattern appears to be northwest trending. The fact that this pattern is observed in two different rock types 30 km apart suggests that it may be a conceptual framework for jointing and fracturing over a larger regional area (i.e., the proposed reservoir). However, the continuation of this fracture pattern to rocks that underlie the reservoir area needs to be confirmed.
4.5.3 Proposed Reservoir Inflows/Outflows
The proposed reservoir inflows and outflows are cyclic; the water is stored from May through October and then released November through April. A significant portion of the inflows from May through October (5,340,000 acre-feet average inflow) are stored to be released during the months of November through April, when the inflows are at the lowest level (510,000 acre-feet average inflow). The total active storage or reservoir storage in acre-feet between the maximum normal pool level and the minimum power pool level is 3,500,000 acre-feet. The proposed maximum normal pool level is El
Page 26 3/29/2013
ALASKA ENERGY AUTHORITY AEA11-022 TM-11-0010-030113 2050, with a water depth of 595 feet (183 meters) and the power pool level would be El. 1850, which means there is 200 feet of annual drawdown..
5.0 POTENTIAL FOR RTS
5.1 Empirical Approach An empirical approach was developed similar to that previously performed for the project by WCC in 1982. The empirical RTS approach includes a comparison of reservoirs that have experienced RTS with comparable depths, volumes and bedrock. A statistical analysis is also presented that is a revision of the work completed by WCC (1982). The statistical analysis will look at probabilities of RTS for the previous and current proposed reservoir configurations using the statistical analysis developed by Baecher and Keeney (1982). However, the database used in the statistical analysis by Bacher and Keeney (1982) is approximately 31 years old and with any statistical analysis, the results depend on the current understanding of the historical record. Therefore, this analysis included additional data on RTS, gathered to date and focused on updating two of the reservoir parameters that are the most discriminating in determining the probability of RTS, depth and volume. Appendix A, presents the database.
The empirical approach is presented to serve as basis for communication and to better understand the phenomenon of RTS, not a substitute for professional judgment or a physically based approach. As it is generally agreed in the scientific community, the occurrence of RTS is also affected by the filling history of the reservoir, existing pore pressures and permeability of the rock beneath the reservoir.
It should also be noted that the previous configuration had a maximum reservoir at El. 2185, whereas the current proposed configuration has a maximum reservoir at El. 2050.General Reservoir Parameters that are significant to RTS
Table 2 summarizes the maximum water depth, maximum water volume, stress regime, bedrock and fault activity located at the proposed Watana Reservoir.
Page 27 3/29/2013
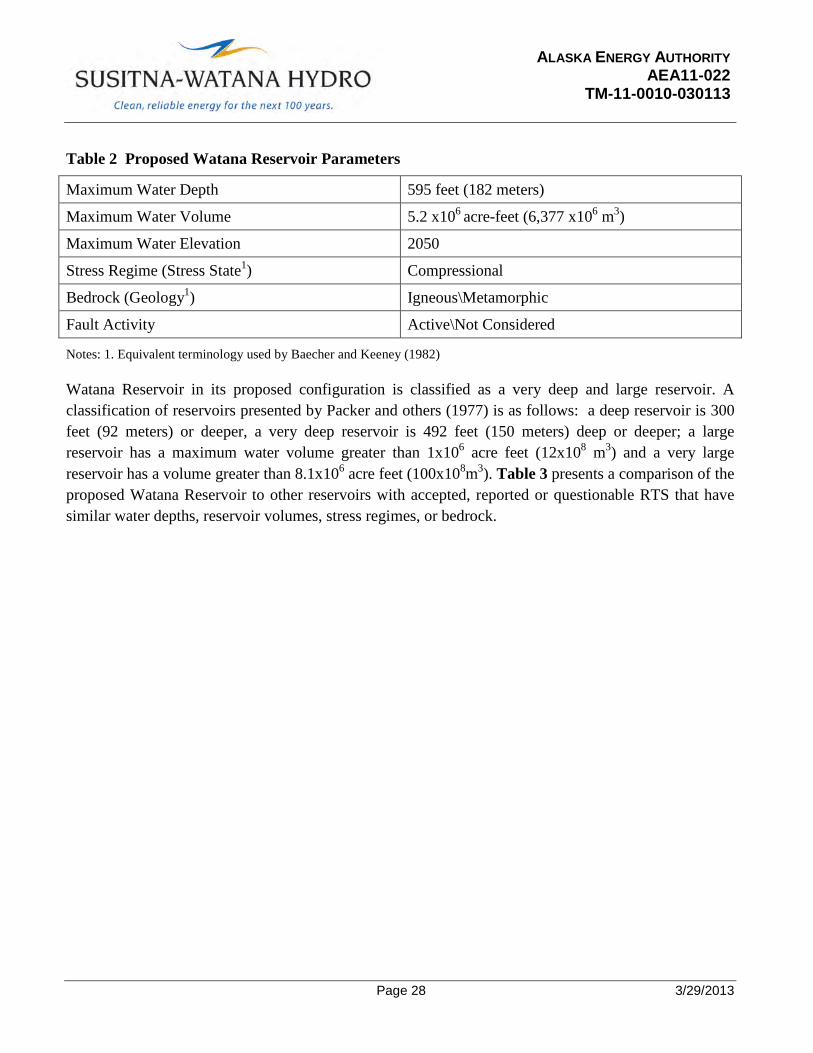
ALASKA ENERGY AUTHORITY AEA11-022 TM-11-0010-030113 Table 2 Proposed Watana Reservoir Parameters
Maximum Water Depth 595 feet (182 meters)
Maximum Water Volume 5.2 x10⁶ acre-feet (6,377 x106 m3)
Maximum Water Elevation 2050
Stress Regime (Stress State1) Compressional
Bedrock (Geology1) Igneous\Metamorphic
Fault Activity Active\Not Considered
Notes: 1. Equivalent terminology used by Baecher and Keeney (1982)
Watana Reservoir in its proposed configuration is classified as a very deep and large reservoir. A classification of reservoirs presented by Packer and others (1977) is as follows: a deep reservoir is 300 feet (92 meters) or deeper, a very deep reservoir is 492 feet (150 meters) deep or deeper; a large reservoir has a maximum water volume greater than 1x10⁶ acre feet (12x108 m3) and a very large reservoir has a volume greater than 8.1x10⁶ acre feet (100x108m3). Table 3 presents a comparison of the proposed Watana Reservoir to other reservoirs with accepted, reported or questionable RTS that have similar water depths, reservoir volumes, stress regimes, or bedrock.
Page 28 3/29/2013
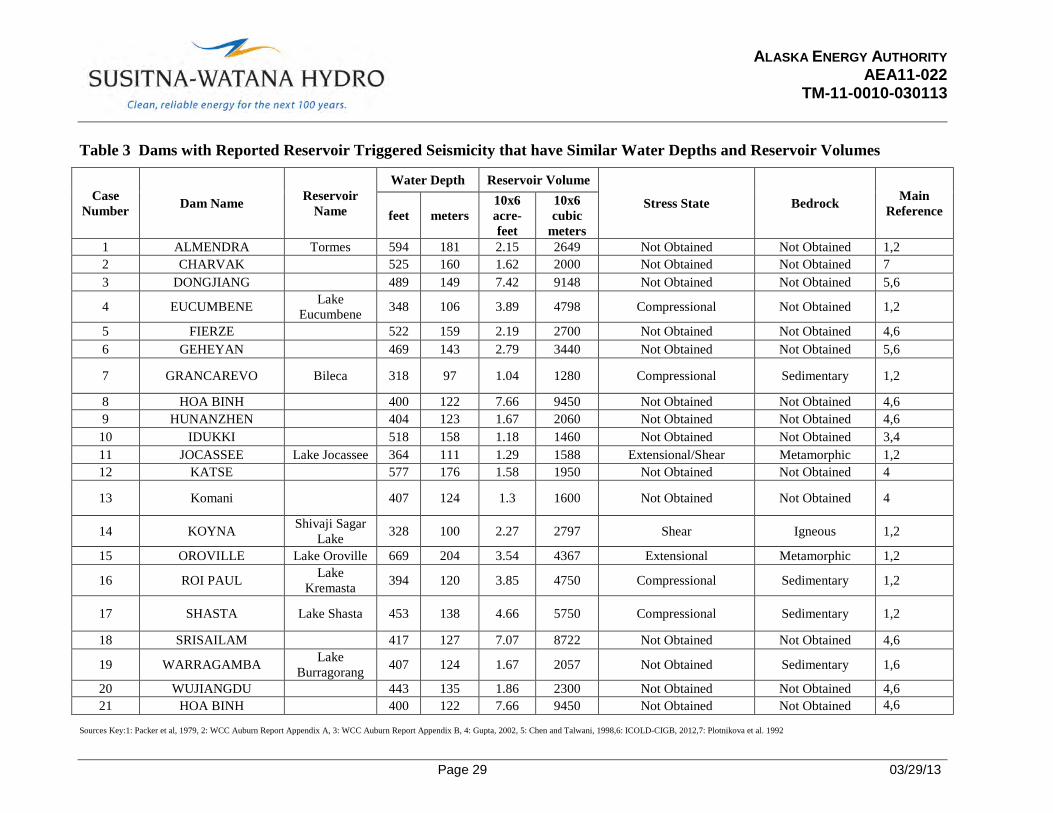
ALASKA ENERGY AUTHORITY AEA11-022 TM-11-0010-030113 Table 3 Dams with Reported Reservoir Triggered Seismicity that have Similar Water Depths and Reservoir Volumes
Case Number Dam Name Reservoir
Name
Water Depth Reservoir Volume
Stress State Bedrock Main Reference feet meters
10x6 acre- feet
10x6 cubic
meters 1 ALMENDRA Tormes 594 181 2.15 2649 Not Obtained Not Obtained 1,2 2 CHARVAK 525 160 1.62 2000 Not Obtained Not Obtained 7 3 DONGJIANG 489 149 7.42 9148 Not Obtained Not Obtained 5,6
4 EUCUMBENE Lake Eucumbene 348 106 3.89 4798 Compressional Not Obtained 1,2
5 FIERZE 522 159 2.19 2700 Not Obtained Not Obtained 4,6 6 GEHEYAN 469 143 2.79 3440 Not Obtained Not Obtained 5,6
7 GRANCAREVO Bileca 318 97 1.04 1280 Compressional Sedimentary 1,2
8 HOA BINH 400 122 7.66 9450 Not Obtained Not Obtained 4,6 9 HUNANZHEN 404 123 1.67 2060 Not Obtained Not Obtained 4,6 10 IDUKKI 518 158 1.18 1460 Not Obtained Not Obtained 3,4 11 JOCASSEE Lake Jocassee 364 111 1.29 1588 Extensional/Shear Metamorphic 1,2 12 KATSE 577 176 1.58 1950 Not Obtained Not Obtained 4
13 Komani 407 124 1.3 1600 Not Obtained Not Obtained 4
14 KOYNA Shivaji Sagar Lake 328 100 2.27 2797 Shear Igneous 1,2
15 OROVILLE Lake Oroville 669 204 3.54 4367 Extensional Metamorphic 1,2
16 ROI PAUL Lake Kremasta 394 120 3.85 4750 Compressional Sedimentary 1,2
17 SHASTA Lake Shasta 453 138 4.66 5750 Compressional Sedimentary 1,2
18 SRISAILAM 417 127 7.07 8722 Not Obtained Not Obtained 4,6
19 WARRAGAMBA Lake Burragorang 407 124 1.67 2057 Not Obtained Sedimentary 1,6
20 WUJIANGDU 443 135 1.86 2300 Not Obtained Not Obtained 4,6 21 HOA BINH 400 122 7.66 9450 Not Obtained Not Obtained 4,6
Sources Key:1: Packer et al, 1979, 2: WCC Auburn Report Appendix A, 3: WCC Auburn Report Appendix B, 4: Gupta, 2002, 5: Chen and Talwani, 1998,6: ICOLD-CIGB, 2012,7: Plotnikova et al. 1992
Page 29 03/29/13
ALASKA ENERGY AUTHORITY AEA11-022 TM-11-0010-030113 A total of 120 reservoirs located around the world have deep or very deep water depths 300 feet deep or deeper, and have a large reservoir but not a very large reservoir (between 1x10⁶ acre-feet and 8.1x10⁶ acre-feet)(ICOLD-CIGB, 2012). Of these 120 reservoirs 21 cases have reported, accepted or questionable RTS. The determination of acceptable or questionable RTS was based on the classification by Packer et al 1979 and Gupta, 2002 and reservoir and depth dimensions were given by ICOLD-CIGB, 2012. Because the classification of RTS can change overtime as more data is acquired the ICOLD-CIGB report was used as the final reference. These 21 cases are presented in Table 3. Of those 21 cases only four are located in a compressional stress regime and one case has igneous bedrock. Therefore no cases exactly match all four reservoir parameters, as shown in Table 2, of the proposed Watana reservoir. However, based on the data compiled it can be gathered that the frequency of RTS is 18 percent (or 21/120) based on the depth and volume of the reservoir.
As shown in Table 3, Lake Shasta has the closest reservoir capacity and depth to the proposed Watana Reservoir and also lies in a compressional tectonic regime. The bedrock or geology for Lake Shasta is sedimentary whereas the bedrock at the proposed Watana Reservoir is igneous. The classification of RTS for Lake Shasta was reported as questionable in the WCC Auburn Report due to the ambiguity of the reporting of the maximum size event (reported as 3.0, Simpson, 1976). The next closest reservoir with a similar stress state would be Lake Eucumbene with a reservoir depth of approximately 348 feet (106 meters) and a reservoir volume of 4,000 acre-feet (4,798 x106 m3). The reservoir was completed in 1958, and in May of 1959 a magnitude 5 event occurred within 6 km of the reservoir. Aftershocks occurred within 12 miles (20 km) of the main event and focal depths ranged from 8 to 17 miles (12 to 27 km). The classification of RTS was reported as questionable in the WCC Auburn Report due to poor accuracy of epicenters and the correlation between impoundment and activity as not being clear.
The best match with an accepted case of RTS was observed at Tomes reservoir (Almendra Dam) in western Spain approximately 10 km from the Portuguese border. The reservoir depth is 594 feet (181 meter) which is almost an exact match to the proposed Watana reservoir (595 feet or 182 meters). The reservoir volume of Tomes, 2.15 million acre-feet, is less than half of Watana’s proposed volume, 5 million acre-feet. Nonetheless, it is still an important case history with a similar depth. Almendra’s Dam construction was completed in 1970 and in January of 1972 a magnitude 2.0 event was recorded (Packer et al., 1979), a magnitude of 3.2 was later reported by USSD in 1997 as referenced in ICOLD, 2011. The Tomes reservoir (Almendra Dam) is located in an area characterized by low historical seismicity (Buforn and Udias, 1979). The region is described as being seismically quiet with no tectonic movements since Miocene; from 1800 to 1970 only 6 earthquakes greater than magnitude 5 occurred within a 62 mile (100 km) radius of the dam. The dam was fitted with three seismometers and seismic monitoring was recorded between November 1971 (first filling) and March 1973. Over that time frame 181 events were recorded. During rapid filling early in 1972, microearthquake activity increased (a total of 56 events were recorded), reaching a peak 45 days after the water level peaked (Figure 22). The
Page 30 03/29/13
ALASKA ENERGY AUTHORITY AEA11-022 TM-11-0010-030113 magnitude of largest event is 3.2; the rest of them have very small magnitudes (M < 3) (Buforn and Udias, 1979). As the reservoir water level decreased, microseismic activity also lessened. All events were within 16 miles (25 km) of the dam and most were adjacent to or under the reservoir and had very shallow focal depths. Although the period of microearthquake monitoring is limited, the study by Buforn and Udias (1979) indicates a strong correlation between the impoundment of the Almendra (Tomes) reservoir and microearthquake activity.
Case histories can give a general idea of what types of events happened after impoundment of similar reservoir depths and volumes, however if RTS were to occur at the proposed reservoir, it cannot be assumed the results would be comparable.
5.1.1 Calculation of Likelihood of Occurrence
The likelihood of occurrence performed in the WCC (1982) study looked at four parameters or reservoir attribute states to statistically calculate the probability of RTS. This work was based on the methodology developed by Baecher and Keeney (1982). Baecher and Keeney (1982) completed a statistical examination on deep, very deep, and very large reservoirs, and considering those reservoirs with RTS. In order to complete their study, the authors gathered information on all dams that fell within the deep, very deep, or very large reservoir (234 in total) and each of the five reservoir attributes were recorded. This compilation performed by Baecher and Keeney (1982) took several person years of effort to complete. Four of the five parameters were used in the WCC (1982) study: depth, volume, stress state and geology, as shown in Table 1. Two data sets were evaluated: 1) a data set that included reservoirs that were deep, very deep or very large, and 2) a data set that included reservoirs that were deep or very deep. The second subset (deep or very deep reservoirs) of data was chosen for the study presented herein because the proposed reservoir is not very large. The same approach was used for the evaluation performed by Baecher and Keeney (1982) for Auburn dam which had similar dimensions as the new proposed Watana reservoir. The definitions for reservoir attribute states from Baecher and Keeney (1982) are presented in Table 4 below.
Page 31 3/29/2013
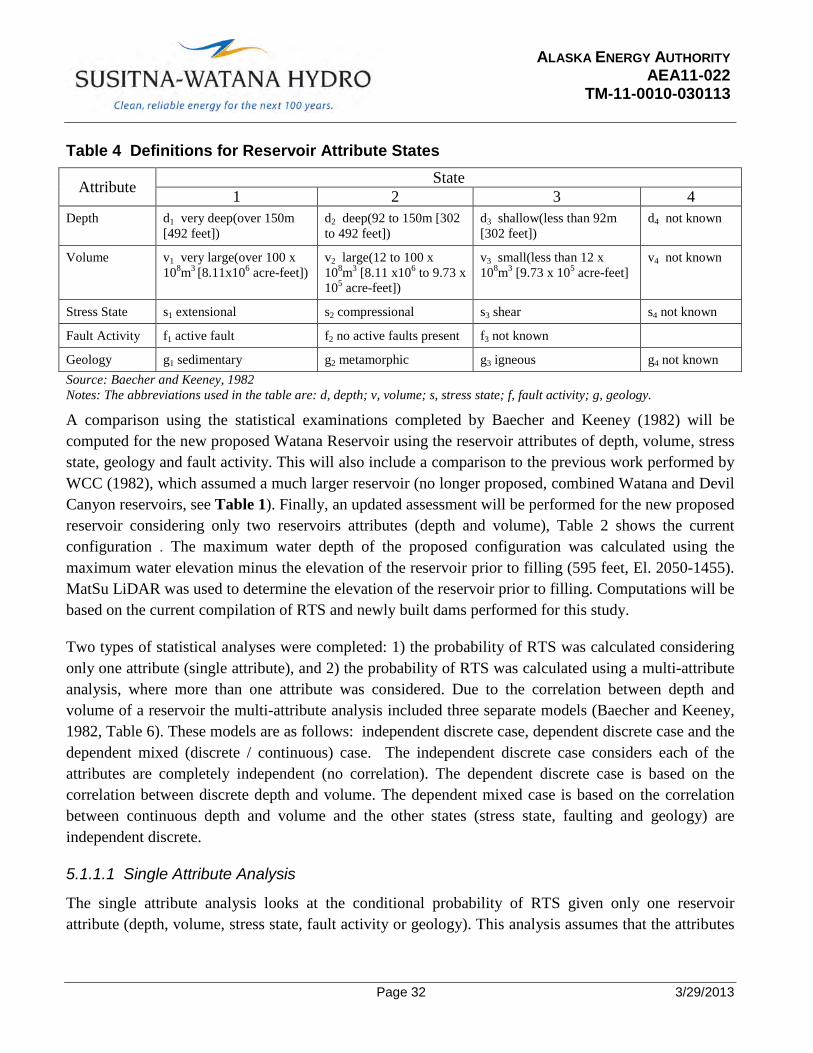
ALASKA ENERGY AUTHORITY AEA11-022 TM-11-0010-030113 Table 4 Definitions for Reservoir Attribute States
Attribute State 1 2 3 4
Depth d1 very deep(over 150m [492 feet])
d2 deep(92 to 150m [302 to 492 feet])
d3 shallow(less than 92m [302 feet])
d4 not known
Volume v1 very large(over 100 x 108m3 [8.11x10⁶ acre-feet])
v2 large(12 to 100 x 108m3 [8.11 x10⁶ to 9.73 x 10⁵ acre-feet])
v3 small(less than 12 x 108m3 [9.73 x 10⁵ acre-feet]
v4 not known
Stress State s1 extensional s2 compressional s3 shear s4 not known
Fault Activity f1 active fault f2 no active faults present f3 not known
Geology g1 sedimentary g2 metamorphic g3 igneous g4 not known Source: Baecher and Keeney, 1982 Notes: The abbreviations used in the table are: d, depth; v, volume; s, stress state; f, fault activity; g, geology.
A comparison using the statistical examinations completed by Baecher and Keeney (1982) will be computed for the new proposed Watana Reservoir using the reservoir attributes of depth, volume, stress state, geology and fault activity. This will also include a comparison to the previous work performed by WCC (1982), which assumed a much larger reservoir (no longer proposed, combined Watana and Devil Canyon reservoirs, see Table 1). Finally, an updated assessment will be performed for the new proposed reservoir considering only two reservoirs attributes (depth and volume), Table 2 shows the current configuration . The maximum water depth of the proposed configuration was calculated using the maximum water elevation minus the elevation of the reservoir prior to filling (595 feet, El. 2050-1455). MatSu LiDAR was used to determine the elevation of the reservoir prior to filling. Computations will be based on the current compilation of RTS and newly built dams performed for this study.
Two types of statistical analyses were completed: 1) the probability of RTS was calculated considering only one attribute (single attribute), and 2) the probability of RTS was calculated using a multi-attribute analysis, where more than one attribute was considered. Due to the correlation between depth and volume of a reservoir the multi-attribute analysis included three separate models (Baecher and Keeney, 1982, Table 6). These models are as follows: independent discrete case, dependent discrete case and the dependent mixed (discrete / continuous) case. The independent discrete case considers each of the attributes are completely independent (no correlation). The dependent discrete case is based on the correlation between discrete depth and volume. The dependent mixed case is based on the correlation between continuous depth and volume and the other states (stress state, faulting and geology) are independent discrete.
5.1.1.1 Single Attribute Analysis
The single attribute analysis looks at the conditional probability of RTS given only one reservoir attribute (depth, volume, stress state, fault activity or geology). This analysis assumes that the attributes
Page 32 3/29/2013

ALASKA ENERGY AUTHORITY AEA11-022 TM-11-0010-030113 are independent of each other. The results are presented based on the deep or very deep reservoir criteria, as used in WCC (1982). Table 5 summarizes single attribute analysis for the previous study with data gathered up until 1982. Table 6 shows how the data was binned into depth and volume categories for the current study. For example, five (5) reservoirs fell into the d1: very deep (over 492 feet or 150 m) and v1 : very large(over 8.11x10⁶ acre-feet or 100 x 108 m3) or the d1v1 bin. Table 7 is a summary of the RTS and non-RTS date for each state. Table 8 shows the results of the single attribute analysis for the current study with data gathered up until 2012. The calculation sheet provides additional data on the equations used to perform the calculations. The updated current study does not include the stress state, fault activity or the geology; therefore only depth and volume are shown. The results are summarized in Tables 5 and 6 below.
Page 33 3/29/2013
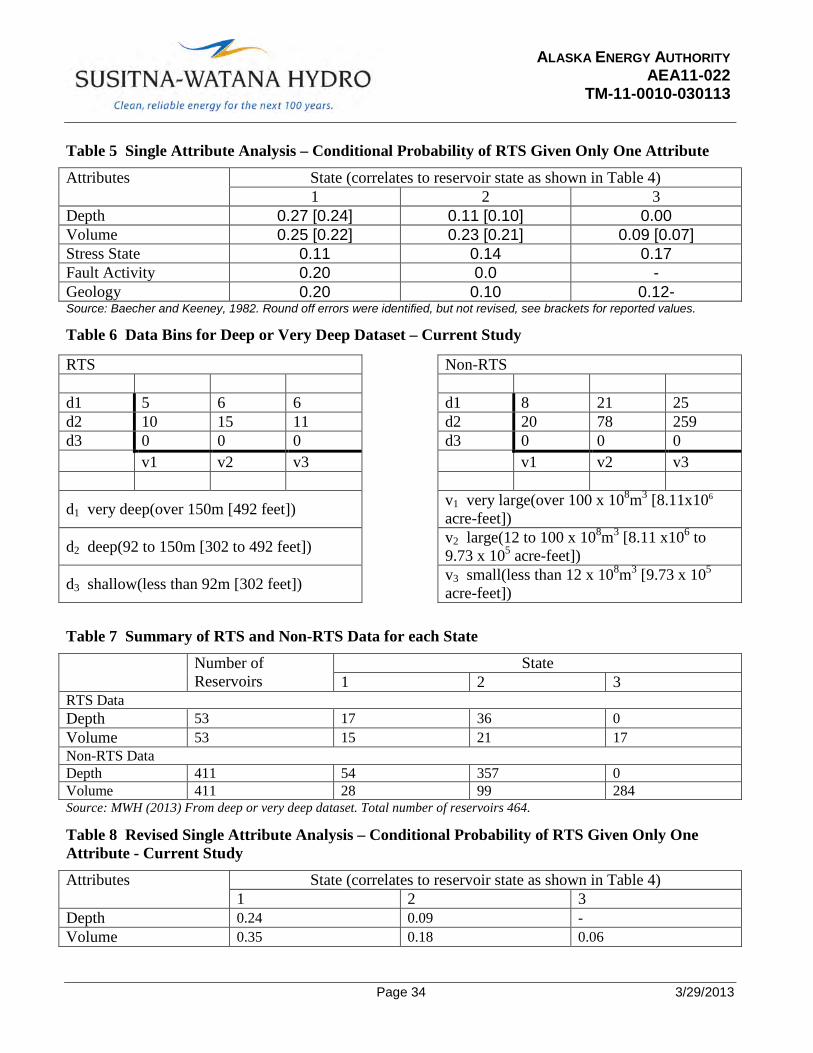
ALASKA ENERGY AUTHORITY AEA11-022 TM-11-0010-030113 Table 5 Single Attribute Analysis – Conditional Probability of RTS Given Only One Attribute
Attributes State (correlates to reservoir state as shown in Table 4) 1 2 3
Depth 0.27 [0.24] 0.11 [0.10] 0.00 Volume 0.25 [0.22] 0.23 [0.21] 0.09 [0.07] Stress State 0.11 0.14 0.17 Fault Activity 0.20 0.0 - Geology 0.20 0.10 0.12- Source: Baecher and Keeney, 1982. Round off errors were identified, but not revised, see brackets for reported values.
Table 6 Data Bins for Deep or Very Deep Dataset – Current Study
RTS Non-RTS d1 5 6 6 d1 8 21 25 d2 10 15 11 d2 20 78 259 d3 0 0 0 d3 0 0 0 v1 v2 v3 v1 v2 v3
d1 very deep(over 150m [492 feet]) v1 very large(over 100 x 108m3 [8.11x10⁶
acre-feet])
d2 deep(92 to 150m [302 to 492 feet]) v2 large(12 to 100 x 108m3 [8.11 x10⁶ to
9.73 x 10⁵ acre-feet])
d3 shallow(less than 92m [302 feet]) v3 small(less than 12 x 108m3 [9.73 x 10⁵
acre-feet])
Table 7 Summary of RTS and Non-RTS Data for each State
Number of Reservoirs
State 1 2 3
RTS Data Depth 53 17 36 0 Volume 53 15 21 17 Non-RTS Data Depth 411 54 357 0 Volume 411 28 99 284 Source: MWH (2013) From deep or very deep dataset. Total number of reservoirs 464.
Table 8 Revised Single Attribute Analysis – Conditional Probability of RTS Given Only One Attribute - Current Study
Attributes State (correlates to reservoir state as shown in Table 4) 1 2 3
Depth 0.24 0.09 - Volume 0.35 0.18 0.06
Page 34 3/29/2013
ALASKA ENERGY AUTHORITY AEA11-022 TM-11-0010-030113 The single attribute analysis for the proposed Watana Reservoir configuration has a Depth State of 1(d1) and a Volume State of 2 (v2). This means that the conditional probability of RTS given only the depth attribute would have a probability of RTS of about 24 percent (24 percent based on previous analysis). Considering only the volume attribute would have a conditional probability of RTS of approximately 18 percent (21 percent based on previous analysis). In the previous work completed by Baecher and Keeney (1982), the depth was the most discriminating and then volume. This analysis shows that the volume is the most discriminating factor. The current analysis included a total of 464 dams, whereas the study performed by Baecher and Keeney (1982) only included 199 dams. Baecher and Keeney (1982) also noted that results depend on current understanding of the historical record and, as that understanding changes (potentially resulting in a reassignment of RTS), the results of these statistical analyses could change as more data is gathered.
5.1.1.2 Multi-Attribute Analysis
Independent discrete, dependent discrete and dependent mixed (discrete / continuous) cases were calculated using a multi-attribute analysis. The first analysis, independent discrete, calculates the probability of RTS assuming independence between the attributes. The second analysis, dependent discrete, calculates the probability of RTS based on correlations between discrete volume and depth. The third analysis, dependent mixed case, is based on the correlation between continuous depth and volume and the other states (stress state, faulting and geology) are independent discrete.
In the work completed by Baecher and Keeney (1982), the likelihood if all five attributes were to occur (depth, volume, stress state, faulting and geology) was evaluated. The analysis for the study performed by MWH (2013) only considered two of the attributes, depth and volume; the other attributes were assumed to have a probability of one. The results for the multi-attribute analyses are shown in Tables 9a and 9b and discussed in the following subsections. Table 9a is based on the currently proposed dam and reservoir configuration and Table 9b is based on the previously proposed configuration.
A sensitivity analysis was performed to gain some insight to the range of probabilities that could be expected if the geology changed from igneous to metamorphic and if the fault activity were considered to be active. Calculations were performed for each of the three cases.
Page 35 3/29/2013
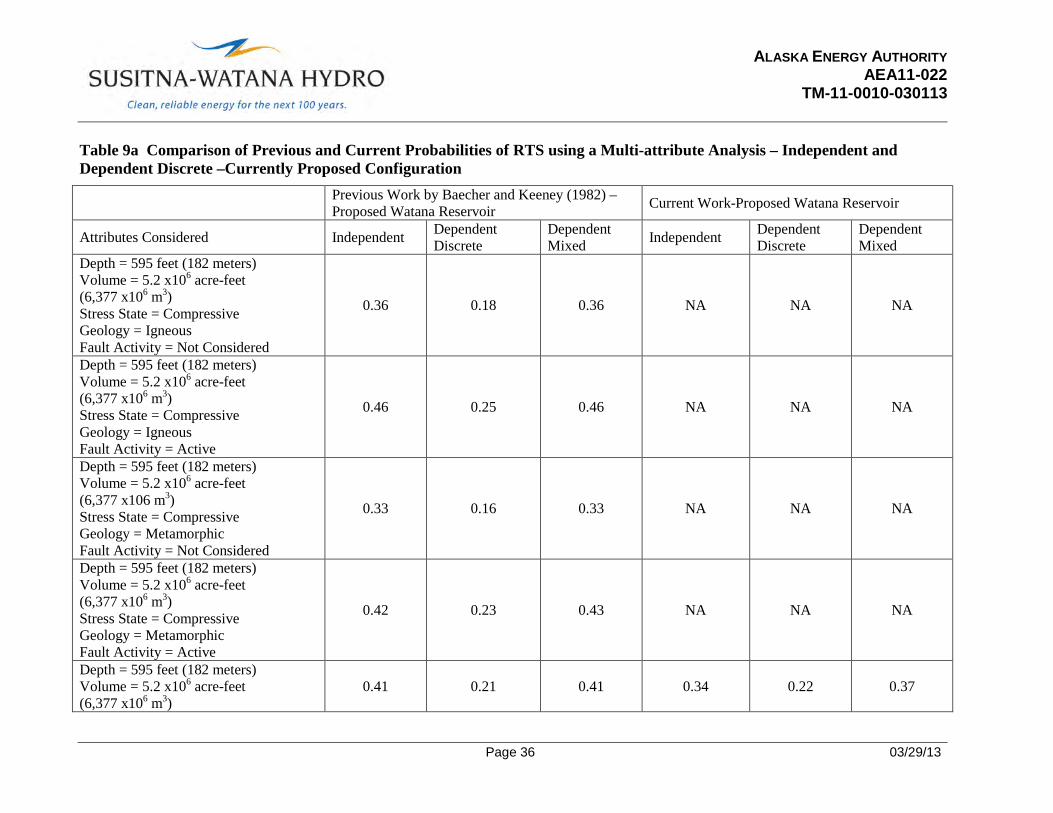
ALASKA ENERGY AUTHORITY AEA11-022 TM-11-0010-030113 Table 9a Comparison of Previous and Current Probabilities of RTS using a Multi-attribute Analysis – Independent and Dependent Discrete –Currently Proposed Configuration
Previous Work by Baecher and Keeney (1982) – Proposed Watana Reservoir Current Work-Proposed Watana Reservoir
Attributes Considered Independent Dependent Discrete
Dependent Mixed Independent Dependent
Discrete Dependent Mixed
Depth = 595 feet (182 meters) Volume = 5.2 x10⁶ acre-feet (6,377 x106 m3) Stress State = Compressive Geology = Igneous Fault Activity = Not Considered
0.36 0.18 0.36 NA NA NA
Depth = 595 feet (182 meters) Volume = 5.2 x10⁶ acre-feet (6,377 x106 m3) Stress State = Compressive Geology = Igneous Fault Activity = Active
0.46 0.25 0.46 NA NA NA
Depth = 595 feet (182 meters) Volume = 5.2 x10⁶ acre-feet (6,377 x106 m3) Stress State = Compressive Geology = Metamorphic Fault Activity = Not Considered
0.33 0.16 0.33 NA NA NA
Depth = 595 feet (182 meters) Volume = 5.2 x10⁶ acre-feet (6,377 x106 m3) Stress State = Compressive Geology = Metamorphic Fault Activity = Active
0.42 0.23 0.43 NA NA NA
Depth = 595 feet (182 meters) Volume = 5.2 x10⁶ acre-feet (6,377 x106 m3)
0.41 0.21 0.41 0.34 0.22 0.37
Page 36 03/29/13
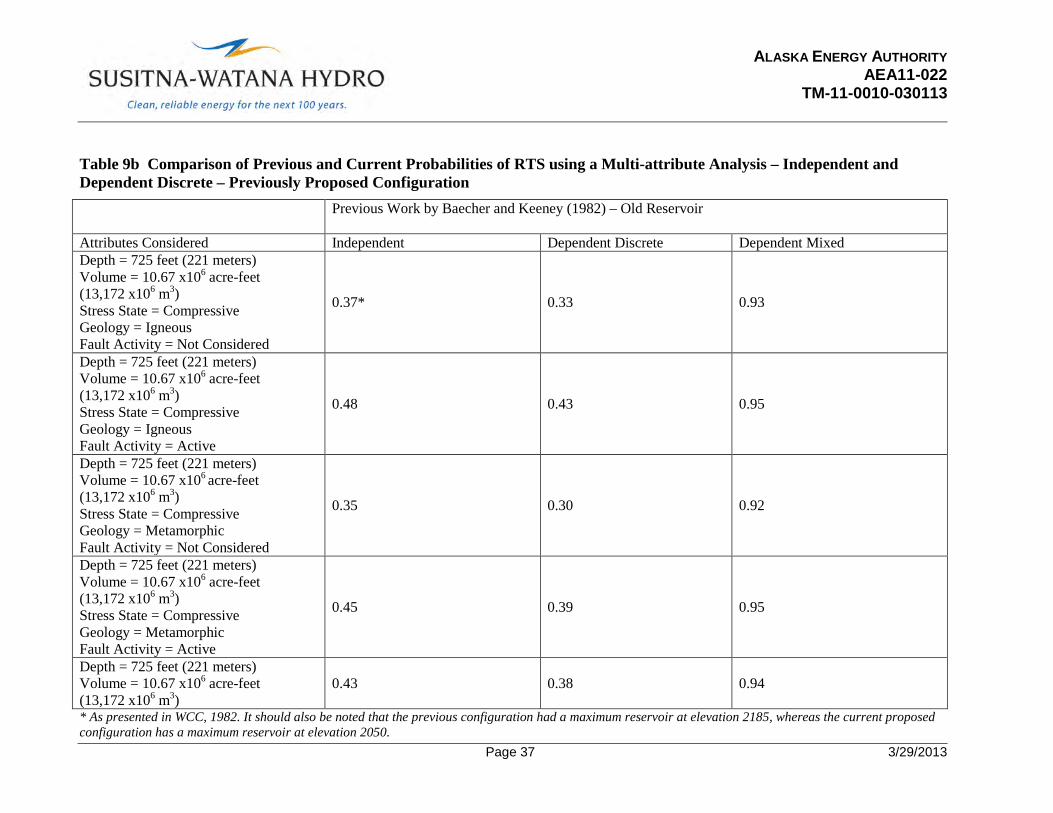
ALASKA ENERGY AUTHORITY AEA11-022 TM-11-0010-030113 Table 9b Comparison of Previous and Current Probabilities of RTS using a Multi-attribute Analysis – Independent and Dependent Discrete – Previously Proposed Configuration Previous Work by Baecher and Keeney (1982) – Old Reservoir
Attributes Considered Independent Dependent Discrete Dependent Mixed Depth = 725 feet (221 meters) Volume = 10.67 x10⁶ acre-feet (13,172 x106 m3) Stress State = Compressive Geology = Igneous Fault Activity = Not Considered
0.37* 0.33 0.93
Depth = 725 feet (221 meters) Volume = 10.67 x10⁶ acre-feet (13,172 x106 m3) Stress State = Compressive Geology = Igneous Fault Activity = Active
0.48 0.43 0.95
Depth = 725 feet (221 meters) Volume = 10.67 x10⁶ acre-feet (13,172 x106 m3) Stress State = Compressive Geology = Metamorphic Fault Activity = Not Considered
0.35 0.30 0.92
Depth = 725 feet (221 meters) Volume = 10.67 x10⁶ acre-feet (13,172 x106 m3) Stress State = Compressive Geology = Metamorphic Fault Activity = Active
0.45 0.39 0.95
Depth = 725 feet (221 meters) Volume = 10.67 x10⁶ acre-feet (13,172 x106 m3)
0.43 0.38 0.94
* As presented in WCC, 1982. It should also be noted that the previous configuration had a maximum reservoir at elevation 2185, whereas the current proposed configuration has a maximum reservoir at elevation 2050. Page 37 3/29/2013
ALASKA ENERGY AUTHORITY AEA11-022 TM-11-0010-030113
5.1.2 Independent Discrete Results
The results of the previous work for Susitna (very deep and large reservoir) included the four attributes – depth, volume, stress state, and geology – and the probability for these four attributes was 37 percent (WCC, 1982). Using the previous database developed by Baecher and Keeney (1982) and the same four attributes, the newly proposed reservoir’s probability of RTS was estimated to be about 36 percent. Finally, using the new database and considering only attributes of depth and volume, the probability of RTS was calculated to be about 34 percent; this can be compared to the probability calculated using the old database for the proposed reservoir of about 41 percent.
A sensitivity analysis was performed holding the known parameters, depth, volume, stress state constant and varying the geology and fault activity. The results show that for the proposed dam the classification of geology from igneous to metamorphic would decrease the probability of RTS from 0.36 to 0.33. However, if the fault activity is considered to be active then the probabilities increase about 10 percent. The classification of geology as igneous and fault activity as active is the highest probability 46 percent, whereas the classification of geology as metamorphic and activity of faults as “not considered” would be about 33 percent.
5.1.3 Dependent Discrete Results
The dependent discrete cases for the newly proposed reservoir with the Baecher & Keeney database show that the results are about 50 percent lower than the independent discrete results. Again we see the same trend in lower probabilities for the igneous geology and when the fault activity is not considered. Using only the attributes of depth and volume, the dependent discrete results considering the old database for the proposed reservoir were estimated to have a probability of RTS of about 21 percent. This can be compared to the evaluation performed using the new database, which resulted in a probability of RTS of approximately 22 percent.
5.1.4 Dependent Mixed Results
The dependent mixed cases for the newly proposed reservoir with the Baecher & Keeney database show that the results are the same as the independent discrete analysis (41 percent). In comparison, the current work for the proposed reservoir increases about 3 percent (34 to 37 percent) when comparing the independent to the dependent mixed for the specific case only considering depth and volume.
5.2 Empirical Approach Results Based on the newly developed database the empirical results show a decrease in the likelihood of RTS occurring at the reservoir site in two of the three models considered; this is most likely due to the increase in the amount of deep and very deep dams (greater than 92 meters but less than 150 meters
03/29/13
ALASKA ENERGY AUTHORITY AEA11-022 TM-11-0010-030113 [greater than 302 feet but less than 492 feet]) without reported RTS. Overall, the probability calculations for the proposed Watana reservoir fall between 16 to 46 percent; this is explainably much lower than the previously proposed configuration that was about 160 feet higher and more than double the reservoir volume (30 to 95 percent). The lowest probability of RTS would be 16 percent from the old dataset for the dependent discrete case, where the geology was classified as metamorphic and the fault activity is not considered. The highest probability of RTS (46 percent) is also from the old database for the independent or dependent mixed cases, where the geology is classified as igneous and the fault activity is considered to be active.
Based upon an evaluation and application of the historical and current datasets for RTS and non-RTS reservoirs, it is concluded that the probability of RTS at the proposed Watana Reservoir is in the range 16 to 46 percent. These probabilities do not consider the magnitude or significance of the induced events, but only reflect a probability that some RTS may occur.
Every effort was made to insure the accuracy of the data, but errors or omissions are possible. These results should be used with caution as the likelihoods are very sensitive to changes in data classification (i.e. determination of RTS). This study varies from the previous by using all events with reported RTS in the calculations. If the classifications were changed to use only those events with accepted RTS the results could be different.
The potential maximum magnitude of an RTS event is difficult to estimate. The largest accepted event within the empirical database is 6.5 and most events are less than magnitude 4. Based on empirical data and understanding at the time, Allen (1982) suggested that a reasonable maximum event for RTS should be about magnitude 6.5. Similarly, ICOLD (2011) recommends consideration of a maximum magnitude of 6.3. However, uncertainty in a maximum magnitude estimate based on the empirical approach arises due to the differing conclusions of prior investigators on whether events such as Wenchaun may have been induced or triggered.
6.0 RECOMMENDATIONS FOR ADDITIONAL STUDIES This section presents recommendations for additional studies to further explore and evaluate the potential range in plausible RTS. The approach recommended is to further assess the size of and potential for an RTS event by synthesizing geologic field investigations, seismological analysis, deterministic ground motion analyses of RTS vs. natural earthquakes, and stress modeling. Specifically, additional studies recommended to refine the potential for and size of an RTS event include: 1) analysis of seismological data from the recently installed Watana seismic network in order to determine the local stress field and possibly identify favorable orientations to re-active features; 2) integration with planned field studies to further define the characteristics of faults and fracture systems within the reservoir
Page 39 3/29/2013

ALASKA ENERGY AUTHORITY AEA11-022 TM-11-0010-030113 vicinity to constrain estimates of fault geometry and hydraulic parameters; 3) preliminary Coulomb stress modeling to build and test physical models that combine loading of the crust from reservoir impoundment with pore pressure changes at depth; and 4) development of deterministic ground motions from the dominant naturally occurring earthquake to provide upper bounding ground motions to which various RTS magnitude-distance scenarios can be compared. These are described in the sections below.
6.1 Seismic Monitoring and Seismological Analysis Seismic monitoring in the vicinity of the reservoir is a necessary task for analyzing pre and post-impoundment seismicity. An improved instrumentation program has been implemented through the University of Alaska whereby several stations in the vicinity of the dam site and reservoir area have been integrated into their larger regional network and seismicity occurring in the dam and reservoir region will be monitored and analyzed on a regular basis. Analyses will include examination of spatial and seismicity rate patterns in light of RTS cases observed worldwide. In particular, seismicity variations associated with changes in filling and drawdown rates, as was observed at Nurek, Kazakhstan will be looked at once reservoir operations begin.
High quality earthquake data will permit more advanced seismological analyses such as inversion for 3-D velocity structure to expedite more accurate hypocenter locations, focal mechanism analysis and local stress orientations, and possible identification of faults in the vicinity of the reservoir.
Specific tasks should include investigation of accurately located shallow crustal seismicity in the site and reservoir area seen in Figures 15 and 17. Development of single or composite focal mechanisms from this seismicity may be critical in determining the tectonic stress orientation near the site.
6.2 Coulomb Stress Modeling It is recommended that preliminary Coulomb stress modeling be performed. Studies of this type have become an accepted technique for quantitatively analyzing stress changes, and resulting seismicity, due to reservoir operations.
Measurements of rock mechanical and hydraulic parameters obtained as part of the geotechnical data collection program will be helpful in constraining these values in a Coulomb stress model. Such measurements should include parameters such as permeability, and joint density and orientation, at locations in the reservoir area as well as at the dam site. The model can be refined in the future, when and if improved knowledge of subsurface fault structures becomes available through seismicity analysis, geologic field studies, and structural analysis of surficial geologic features.
Page 40 3/29/2013
ALASKA ENERGY AUTHORITY AEA11-022 TM-11-0010-030113 6.3 Local Geologic Field Investigations Because RTS events are most likely to occur on faults favorably oriented to the local stress field, it is important that 1) local faults, and 2) the local stress field, be identified to the best of our ability. Identification of local faults requires detailed field studies focused on gathering structural and kinematic data from faults, and geomorphic analyses. Evaluation of stress fields requires further analysis, similar to that shown in Figure 19, but focusing on the vicinity of the Watana Reservoir. Focal mechanism analysis of local earthquakes as part of the seismological analysis will play a key role in this characterizing the local stress field.
Although permeability and fracture and joint analyses have been conducted in the local Watana site area, most of the measurements were made in rock types that will underlie a small percentage of the reservoir area. No such measurements or observations have been made upstream of the site. Although such drilling activities at representative sites in the entire reservoir area may be impractical, reconnaissance field investigations can resolve questions such as what rock types exist upstream, the characteristics of significant faults, and whether the joint pattern seen at the Watana and Devil Canyon sites persists along the entire reservoir length.
6.4 Estimation of Maximum Magnitude of a RTS Event ICOLD (2011) recommends a maximum RTS magnitude of 6.3, and Allen (1981) recommends magnitude 6.5. These were based on consideration of the largest RTS events observed worldwide from empirical data, and did not consider the potential for more recent events, such as Wenchuan to be included as potential RTS events.
FCL (2012) set the upper limit to background seismicity (i.e., that not associated with an identified fault) as Mw 7.3, based on U.S. Geological Survey estimates from Wesson et al. (2007). This value is designed to account for the fact that the shallow seismogenic crust in central Alaska can be thick (20+ km), the region is a tectonically active area, and surface or hidden faults that are capable of producing such magnitudes may not have been identified. Thus, it is a relatively high earthquake magnitude value and may not necessarily be the final maximum RTS magnitude evaluated, chiefly because the fault source and characterization studies for the dam site are not yet completed.
Physical concepts would link the occurrence and magnitude of potential RTS events to the tectonic stress and characteristics of faults in the area of reservoir influence. Thus, reservoirs transected by faults which may be subject to RTS would be considered to have maximum RTS events which reflect potential maximum events on these nearby faults or other identified seismic sources. For the Watana site, no faults have been identified in the reservoir area with Quaternary displacement from the ongoing studies, but regional seismic source models do allow for potential earthquakes much larger than magnitude 6.3 or 6.5 as suggested from empirical data by ICOLD (2011) and Allen (1982).
Page 41 3/29/2013
ALASKA ENERGY AUTHORITY AEA11-022 TM-11-0010-030113 Refinement of the local maximum RTS event for the Watana site should include specific information on the local geologic structures and potential seismic sources that may exist in the RTS Zone (encompassing regions within 30 km of the reservoir). This would include consideration of whether geologic structures are favorably oriented to the current tectonic stress field as well as consideration of the geometry (fault location, length, and dip) with respect to the reservoir and dam site.
6.5 Empirically-based Analysis As additional data regarding RTS cases are gathered, the inputs of the empirically-based analyses should be revised. Revisions may include stress state, geology, and fault activity. No specific recommendations on gathering this data are suggested. However, during the proposed local geological field investigations and seismological analysis the stress state, geology and fault activity will be further refined and the study should be updated to reflect this.
6.6 Deterministic Comparisons to the Largest non-RTS Earthquake For a deterministic assessment, comparisons can be made between deterministic ground motions from RTS magnitude-distance scenarios and the dominant natural earthquake in the preliminary seismic source model. In other words, it is possible that the dam will ultimately be designed to withstand earthquake ground motions greater than those from the expected maximum RTS event. From the FCL (2012) preliminary seismic source model, this is currently a Mw 7.5 intraslab event about 31 miles (50 km) beneath the site. Deterministic response spectra from the dominant natural earthquake may be large enough to supersede all but very conservative RTS magnitude assessments. It is possible that certain RTS magnitude-distance scenarios developed under Recommendations 6.2, 6.3, and 6.4 above may be eliminated on the basis of being exceeded by ground motions from the dominant naturally occurring design earthquake.
7.0 SUMMARY AND CONCLUSIONS RTS is a phenomenon that is accepted by the scientific community but is not well understood, and difficult to predict. Both empirical and physical modeling approaches were discussed in this document. Both approaches should be employed to further assess the potential for RTS.
An update to the previous empirically-based probability analysis computed by WCC (1982) was performed. The results show that the probability of RTS occurring at the proposed Watana reservoir, using the new proposed depth of 595 feet and volume of 5.2 x10⁶ acre-feet, range between 16 to 46 percent; this is lower than the previously proposed project configuration that was about 160 feet higher and more than double the reservoir volume (probabilities range from 30 to 95 percent). The lowest probability of RTS would be 16 percent from the old dataset for the dependent discrete case, where the
Page 42 3/29/2013
ALASKA ENERGY AUTHORITY AEA11-022 TM-11-0010-030113 geology was classified as metamorphic and the fault activity is not considered. The highest probability of RTS (46 percent) is also from the old database for the independent or dependent mixed cases, where the geology is classified as igneous and the fault activity is considered to be active. Only considering the attributes of depth and volume and using an updated database from the 1980s the probability of RTS was calculated to be between 22 and 36 percent. The lowest probability is for the dependent discrete at 22 percent and the highest is for the dependent mixed case at 36 percent. These results for the currently proposed reservoir configuration are lower than previous analyses. These results may be attributed to: the somewhat shallower and lower volume of the presently proposed reservoir compared to the 1980s dual impoundment configuration; the increased number of large impounded reservoirs since the 1980s that have not experienced RTS; and improvements in the understanding of physical RTS mechanisms.
The location and magnitude of any future RTS events associated with the Watana Reservoir are highly uncertain. Most empirical data suggest that most RTS events will have relatively small magnitudes and would most likely occur within 10 years of initial filling. ICOLD (2011) and Allen (1982) suggest that maximum RTS magnitudes may be on the order of 6.3 and 6.5, respectively. Other investigators (e.g., Klose, 2011; Ge et al., 2009) have proposed that the Mw 7.9 Wenchaun earthquake should be considered as an RTS event, which would increase the magnitude estimates from empirical data. In contrast, other investigators (e.g., Zhou et al., 2010; Galahut and Galahut, 2010) have argued that this event could not have been triggered by the reservoir. Although the Wenchuan earthquake was included in the updated empirical analysis as a “questionable” case, its status as an RTS event is controversial. For conservatism “questionable” cases were chosen to be included in the RTS empirical analysis. Although in this report judgment has been withheld on its status, future research on this event will continue to be monitored.
The mapping of existing faults and fractures within and near the reservoir, regional hydraulic conductivity surrounding these faults, and regional tectonic stress provide the physical constraints which determine potential RTS locations and the physical limits for earthquake magnitudes. From existing seismic hazard studies, a possible maximum can be Mw 7.3, defined in prior hazard studies to be the largest crustal event that could randomly occur in the region. This is a conservative estimate, made in consideration of no prior knowledge of seismogenic crustal thickness, hydraulic properties of rocks beneath the reservoir, orientation of the local tectonic stress field, and the possible existence of local faults in the vicinity of the reservoir that may be favorably oriented to the local stress field. Further evaluations of these factors will provide a basis for refinement of the site-specific conclusions for the Watana site.
Page 43 3/29/2013
ALASKA ENERGY AUTHORITY AEA11-022 TM-11-0010-030113 8.0 REFERENCES Acres America Inc. (1981). Susitna Hydroelectric Project, 1980-1981 Geotechnical Report, vol. 1, Final
Draft.
Acres America Inc. (1982). Susitna Hydroelectric Project, Feasibility Report.
AEIC (2013). Susitna-Watana Seismic Monitoring Project, August-December 2012 Quarterly Report, AEIC-11-0001-022813.
Allen, C.R. (1982), Reservoir-induced seismicity and public policy, California Geology, November, 248-250.
Anglin, F. M., and Buchbinder, G. G. (1985). Induced seismicity at the LG3 Reservoir, James Bay, Quebec, Canada. Bulletin of the Seismological Society of America, 75(4), 1067-1076.
Baecher, G. B., and Keeney, R. L. (1982). Statistical Examination of Reservoir-Induced Seismicity. Bulletin of the Seismological Society of America, 72(2), 553-569.
Beck, J. L. (1976). Weight-induced stresses at the recent seismicity at Lake Oroville, California. Bulletin of the Seismological Society of America, 72(2), 1121-1131.
Bell, M. L., and Nur, A. (1978). Strength changes due to reservoir-induced pore pressure and stresses an application to Lake Oroville, Journal of Geophysical Research, 83, 4469-4483.
Bolt, B. A., and Cloud, W. K. (1974). Recorded strong motion on the Hsifengkiang dam, China. Bulletin of the Seismological Society of America, 64(4), 1337-1342.
Buforn, E., and Udias, A. (1979). A note on induced seismicity in dams and reservoirs in Spain. Bulletin of the Seismological Society of America, 69(5), 1629-1623.
Carder, D. S. (1945). Seismic Investigations in the Boulder Dam Area 1940-44 and the Influence of Reservoir Loading on Local Earthquake Activity. Bulletin of Seismological Society America, 35(4), 175–192.
Chen, L., & Talwani, P. (1998). Reservoir-induced Seismicity in China. Pure and Applied Geophysics, 133-149.
Chen, L., and Talwani, P. (2001a). Mechanism of inital seismicity following impoundment of the Monticello Reservoir South Carolina. Bulletin of the Seismological Society of America, 91(6), 1582-1594.
Page 44 3/29/2013
ALASKA ENERGY AUTHORITY AEA11-022 TM-11-0010-030113 Chen, L., and Talwani, P. (2001b). Renewed seismicity near Monticello Reservoir, South Carolina.
Bulletin of the Seismological Society of America, 91(1), 94-101.
Csejtey, B., Jr., Nelson, W.H., Hones, D.L., Silberling, N.J., Dean, R.M., Morris, M.S., Lanphere, M.A., Smith, J.G., and Silberman, M.L. (1978). Reconnaissance geologic map and geochronology, Talkeetna Mountains quadrangle, northern part of Anchorage quadrangle, and southwest corner of Healy quadrangle: Alaska U.S. Geological Survey, Open-File Report 78-558A, 60 p.
Csejtey, B., D.P. Cox, R.C Evarts, G.D.Stricke , and H.L.Foster (1982). The Cenozoic Denali fault system and the Cretaceous accretionary development of southern Alaska, Journal of Geophysical Research, v. 87, no. B5, p. 3741–3754.
Dahm, T. E. and 12 others (2012). Recommendation for the discrimination of human-related earthquakes. Journal of Seismology, DOI 10.1007/s10950-012-9295-6.
Deng, K., S. Zhou, R. Wang, R. Robinson, C. Zhao, and W. Cheng (2010). Evidence that the 2008 Mw 7.9 Wenchuan Earthquake Could Not Have Been Induced by the Zipingpu Reservoir, Bulletin of the Seismological Society of America, 100(5b), 2805-2814.
Denlinger, R. P., and C. G. Bufe (1982). Reservoir conditions related to induced seismicity at The Geysers steam reservoir, Northern California. Bulletin of the Seismological Society of America, 72(4), 1317-1327.
do Nascimento, A. F., Lunn, R. J., and Cowie, P. A. (2005). Modeling the heterogenous hydraulic properties of faults using constraints from reservoir-induced seismicity. Journal of Geophysical Research, 110(B09201), 17.
Ferreira, J. M., De Oliveria, R. T., Assumpcao, M., Moreira, J. A., Pearce, R. G., and Takeya, M. K. (1995). Correlation of seismicity and water level in the Acu reservoir --An example from northeast Brazil. Bulletin of the Seismological Society of America, 85(5), 1483-1489.
Fletcher, J. B. (1982). A comparison between the tetonic stress measured in situ and stress parameters from induced seismicity at Monticello Reservoir, South Carolina. Journal of Geophysical Research, 87(B8), 6931-6944.
Fletcher, J. B., Boatwright, J., and Joyner, W. B. (1983). Depth dependence of source parameters at Monticello, South Carolina. Bulletin of the Seismological Society of America, 73(6), 1735-1751.
Fugro Consultants, Inc. (FCL) (2012). NPT 6: Seismic Studies, Draft Technical Memorandum.
Page 45 3/29/2013
ALASKA ENERGY AUTHORITY AEA11-022 TM-11-0010-030113 Galahut, K., and V.K. Galahut (2010). Effect of the Zipingpu reservoir impoundment on the occurrence
of the 2008 Wenchuan earthquake and local seismicity, Geophysical Journal International , doi: 10.1111/j.1365-246X.2010.04715.x.
Ge, S., M. Liu, N. Lu, J. Godt, and G. Luo (2009), Did the Zipingpu Reservoir trigger the 2008 Wenchuan earthquake?, Geophysical Research Letters, Vol. 36, L20315, doi:10.1029/2009GL040349.
Ge, S. (2011). Comment on “Evidence that the 2008 Mw 7.9 Wenchuan Earthquake Could Not Have Been Induced by the Zipingpu Reservoir” by Kai Deng, Shiyong Zhou, Rui Wang, Russell Robinson, Cuiping Zhao, and Wanzheng Cheng, Bulletin of the Seismological Society of America, 101(6), 3117-3118.
Glen, J.M.G., Schmidt, J., Pellerin, L., McPhee, D.K., and O’Neill, J.M. (2007a). Crustal structure of Wrangellia and adjacent terranes inferred from geophysical studies along a transect through the northern Talkeetna Mountains, in Ridgway, K.D., Trop, J.M., Glen, J.M.G., and O’Neill, J.M., eds., Tectonic Growth of a Collisional Continental Margin: Crustal Evolution of Southern Alaska: Geological Society of America Special Paper 431, p. 21–41.
Glen, J.M.G., Schmidt, J., and Morin, R. (2007b). Gravity and magnetic character of southcentral Alaska: Constraints on geologic and tectonic interpretations, and implications for mineral exploration, in Ridgway, K.D., Trop, J.M., Glen, J.M.G., and O’Neill, J.M., eds., Tectonic Growth of a Collisional Continental Margin: Crustal Evolution of Southern Alaska: Geological Society of America Special Paper 431, p. 593–622.
Gough. D. K. and W. I. Gough (1970). Stress and deflection in the lithosphere near Lake Kariba--1, Geophys.J. 21, 65-78.
Gupta, H. K. (1983). Induced seismicity hazard mitigation through water level manipulation at Koyna, India: a suggestion. Bulletin of the Seismological Society of America, 73(2), 679-682.
Gupta, H. K. (1992). Are RIS events of M>=5 preceded by a couple of foreshocks of M>=4?, Bulletin of the Seismological Society of America, 82(1), 517-520.
Gupta, H. K., Rastogi, B. K., and Narain, H. (1972). Common Features of the Reservoir-Associated Seismic Activities. Bulletin of the Seismological Society of America, 62(2), 481-492.
Gupta, H. K., and Iyer, H. M. (1984). Are reservoir-induced earthquakes of magnitude >=5.0 at Koyna, India, preceded by pairs of eathquakes >=4.0? Bulletin of the Seismological Society of America, 74(3), 863-873.
Page 46 3/29/2013
ALASKA ENERGY AUTHORITY AEA11-022 TM-11-0010-030113 Gupta, H. K., and Rajendran, K. (1986). Large artificial water reservoirs in the vicinity of the
Himalayan foothills and reservoir-induced seismicity. Bulletin of the Seismological Society of America, 76(1), 205-215.
Gupta, H. K. (2002), A review of recent studies of triggered earthquakes by artificial water reservoirs with special emphasis on earthquakes in Koyna, India. Earth-Science Reviews, 58 , 279–310.
Haeussler, P.J. (2008). An overview of the neotectonics of interior Alaska—Far-field deformation from the Yakutat Microplate collision, in Freymueller, J.T., Haeussler, P.J., Wesson, R.L., and Ekstrom, Goran, eds., 2008, Active tectonics and seismic potential of Alaska: American Geophysical Union, Geophysical Monograph 179, p. 83–108.
Hartzell, S., C Mendoza, L. Ramirez-Guzman, Y. Zeng, and W. Mooney (2013). Rupture History of the 2008 Mw 7.9 Wenchuan, China, Earthquake: Evaluation of Separate and Joint Inversions of Geodetic, Teleseismic, and Strong-Motion Data, Bulletin of the Seismological Society of America, 103(1), 353–370.
Harza-Ebasco (1984), 1984 Geotechnical Exploration Program Watana Damsite, Document no. 1734,
Final Report. Hickman, S., and M.D. Zoback (1982). In Situ Study of the Physical Mechanisms Controlling Induced
Seismicity at Monticello Reservoir, South Carolina. Journal of Geophysical Research, 87(B8), 6959-6974.
Houquin, C., Zeping, X., and Ming, L. (2010). The Relationships between Large Reservoirs and Seismicity. Water Power Magazine, 29-33.
ICOLD (2011). Committe on Seismic Aspects of Dam Design, Reservoirs and Seismicity - State of Knowledge- Bulletin 137.
ICOLD (2010). Committee on Seimic Aspects of Dam Design.Selecting Seismic Parameters for Large Dams - Guidelines. Bulletin 72.
Jacob, K. H., Pennington, W. D., Ambruster, J., Seeber, L., and Farhatulla, S. (1979). Tarbela Reservoir, Pakistan: a region of compressional tectonics with reduced seismicity upon inital reservoir filling. Bulletin of the Seismological Society of America, 69(4), 1175-1192.
Jaeger, J.C., and N. Cook (2007), Fundamentals of Rock Mechanics, Chapman and Hall, Ltd.
Kalpna, & Chander, R. (1997). On some microearthquakes near Tarbela Reservoir during three low water stands. Bulletin of the Seismological Society of America, 8(1), 265-271.
Page 47 3/29/2013
ALASKA ENERGY AUTHORITY AEA11-022 TM-11-0010-030113 Keith, C. M., Simpson, D. W., and Soboleva, O. V. (1982). Induced seismicity and style of deformation
at Nurek Reservoir, Tadjik SSR. Journal of Geophysical Research, 87(B6), 4609-4624.
Klose, C. D. (2011). Evidence for Anthropogenic Surface Loading as Trigger Mechanism of the 2008 Wenchuan Earthquake Environmental Earth Sciences DOI 10.1007/s12665-011-1355-7.
Klose, C. D. (2012). Mechanical and statistical evidence of the causality of human-made mass shifts on the Earth’s upper crust and the occurrence of earthquakes. Journal of Seismology, DOI 10.1007/s10950-012-9321-8.
Lahr, K. M., Lahr, J. C., Lindh, A. G., Bufe, C. G., & Lester, F. W. (1976). The August 1975 Oroville earthquakes. Bulletin of the Seismological Society of America, 66(4), 1085-1099.
Lamontagne, M., Hammamji, Y., and Peci, V. (2008). Reservoir-triggered seismicity at the Toulnustouc hydroelectric project, Quebec Northshore, Canada. Bulletin of the Seismological Society of America, 98(5), 2543-2552.
Langston, C. A.,and Franco-Spera, M. (1985). Modeling of the Koyna, India aftershock of 12 December 1967. Bulletin of the Seismological Society of America, 75(3), 651-660.
Lara, J. M. and J. I. Sanders (1970). The 1963-1964 Lake Mead Survey, Bur. Reclamation Rep. REC-OCE-70-21,174 pp.
Leblanc, G., and Anglin, F. (1978). Induced seismicity at the Manic 3 reservoir, Quebec. Bulletin of the Seismological Society of America, 68, 1469-1485.
Lei. X. (2008). Possible roles of the Zipingpu Reservoir in triggering the 2008 Wenchuan earthquake, Journal of Asian Earth Sciences, 40, 844-854.
Liu, Y., Zhu, C., Wang, C., Lu, R., and Chen, J. (1982). Modeling focal parameters for the magnitude 5.3 earthquake of the Xingengjiang reservoir area, People's Republic of China. Bulletin of the Seismological Society of America, 72(4), 1085-1092.
Mandal, P., Rastogi, B. K., and Sarma, C. S. (1998). Source Parameters of Koyna earthquakes, India. Bulletin of the Seismological Society of America, 88(3), 833-842.
Marion, G. E.,and Long, L. T. (1980). Microearthquakes spectra in the southeastern United States. Bulletin of the Seismological Society of America, 70(4), 1037-1054.
McGarr, A. (1976). Seismic moments and volume changes. Journal of Geophysical Research, 81, n8, 1487-1494.
Page 48 3/29/2013
ALASKA ENERGY AUTHORITY AEA11-022 TM-11-0010-030113 McGarr, A., Simpson, D. (1997). Keynote lecture: A broad look at induced and triggered seismicity,
‘‘Rockbursts and seismicity in mines’’. In: Gibowicz, S.J., Lasocki, S. (Eds.), Proc. of 4th Int. Symp. On Rockbursts and Seismicity in Mines, Poland, 11–14 Aug, 1997. A.A. Balkema, Rotterdam, pp. 385–396.
Mekkawi, M., Grasso, J. R., & Schnegg, P. A. (2004). A long-lasting relaxation of seismicity at Aswan Reservoir, Egypt 1982-2001. Bulletin of the Seismological Society of America, 94(2), 479-492.
MWH (2011). Briefing Document on Reservoir Triggered Seismicity.
O’Neill, J.M., Ridgway, K.D., and Eastham, K.R. (2003a) Mesozoic sedimentation and deformation along the Talkeetna thrust fault, south-central Alaska: New insights and their regional tectonic significance, in Galloway, J.P., ed., Studies by the U.S. Geological Survey in Alaska, 2001: U.S. Geological Survey Professional Paper 1678, 83–92.
Nokleberg, W.J., Plafker, George, and Wilson, F.H. (1994). Geology of south-central Alaska, in
Plafker, George, and Berg, H.C., eds., The geology of Alaska, v. G–1 of The geology of North America: Boulder, Colo., Geological Society of America, p. 311–366.
Packer, D. R., Cluff, L. S., Knuepfer, P. L., and Withers, R. J. (1979). Study of Reservoir Induced Seismicity. San Francisco: Woodward-Clyde Consultants.
Packer, D. R., Lovegreen, J. R., and J.L. Born (1977). Earthquake Evaluation Studies of the Auburn Dam Area. Denver, CO, USA: U.S. Bureau of Reclamation.
Pavlis, G. B., & Langston, C. A. (1983). Source depth determination using multi-modal Rayleight spectral ratios and linear discriminate analysis: a study of the reservoir-induced seismicity sequence at Lake Kariba, Africa (September 1963 to August 1974). Bulletin of the Seismological Society of America, 73(1), 59-82.
Perman, R. C., Packer, D. R., Coppersmith, K. J., P.L. Knuepfer (1981). Collection of data for data bank on reservoir induced seismicity. Report to the U.S. Geological Survey, Contract Nol 14-08-0001-19132.
Plotnikova, L. M., V.I. Makhmudova,, and O.B. Sigalova (1992). Seismicity Associated with the Charvak Reservoir, Uzbekistan. PAGEOPH, 139, No. 3/4.
Ratchkovski, N. and R. Hansen (2002). New Evidence for Segmentation of the Alaska Subduction Zone, Bulletin of the Seismological Society of America, 95(5), 1754–1765.
Page 49 3/29/2013
ALASKA ENERGY AUTHORITY AEA11-022 TM-11-0010-030113 Rajendran, K., and Talwani, P. (1992). The role of elastic, undrained, and drained responses in
triggering earthquakes at Monticello Reservoir, South Carolina. Bulletin of the Seismological Society of America, 82, 1867-1888.
Rastogi, B. K., and Talwani, P. (1980). Relocation of Koyna earthquakes. Bulletin of the Seismological Society of America, 70(5), 1849-1868.
Rastogi, B. K., and Talwani, P. (1980). Spatial and temporal variations in ts/tp at Monticello Reservoir, South Carolina. Geophysical Research Letters, 7(10), 781-784.
Rastogi, B. K., Chadha, R. K., Sarma, C. P., Mandal, P., Satyanarayana, H. S., Raju, I. P. (1997). Seismicity at Warna Reservoir (near Koyna) through 1995. Bulletin of the Seismological Society of America, 87(6), 1484-1494.
Reasenburg, P., and D.W. Simpson (1992), Response of regional seismicity to the static stress change produced by the Loma Prieta earthquake, Science, 255, 1687-1690.
Rice, J.R., and M.P. Cleary (1976), Some basic diffusion solutions for fluid-saturated elastic porous media with compressible constituents, Reviews of Geophysics and Space Physics, 14, 227-241.
Richter, C.F. (1958). Elementary Seismology, W.H. Freeman and Co., 768 pp.
Ridgway, K. D., J. M. Trop, W. J. Nokleberg, C. M. Davidson, and K. R. Eastham (2002). Mesozoic and Cenozoic tectonics of the eastern and central Alaska Range: Progressive basin development and deformation in a suture zone, Geol. Soc. Am. Bull., 114, 1480-1504.
Roeloffs, E. A. (1988). Fault stability changes beneath a reservoir with cyclic variations in water level. Journal of Geophysical Research, 93(B3), 2107-2124.
Rogers, A. M., & Lee, W. K. (1976). Seismic study of earthquakes in the Lake Mead, Nevada-Arizona region. Bulletin of the Seismological Society of America, 1657-1681.
Ruppert, N. (2008). Stress Map for Alaska From Earthquake Focal Mechanisms, Active Tectonics and Seismic Potential of Alaska Geophysical Monograph Series 179, 351-367.
Saxena, S.K., A. Ger, and A. Sengupta (1988), Reservoir-induced seismicity- a new model, International Journal for Numerical and Analytical Methods in Geomechanics, v. 12, 263-281.
Schaeffer, M. (1991), A relationship between joint intensity and induced seismicity at Lake Keowee, northwestern South Carolina, Bulletin of the Association of Engineering Geologists, vol. XXVIII, no. 1, 7-30.
Page 50 3/29/2013
ALASKA ENERGY AUTHORITY AEA11-022 TM-11-0010-030113 Schmidt, J.M., Oswald, P.J., and Snee, L.W. (2002). The Deadman and Clark Creek fields: Indicators of
early Tertiary volcanism in an extensional tectonic setting in the northern Talkeetna Mountains, Alaska: Geological Society of America Abstracts with Programs, v. 34, no. 5, p. A-101.
Scholz, C.H. (2002). The mechanics of earthquake faulting, Columbia University, New York, 496 pp.
Schwartz, D. P., Joyner, W. B., Stein, R. S., Brown, R. D., McGarr, A. F., Hickman, S. H., et al. (1996). Review of seismic - hazard issues associated with the Auburn Dam Project, Sierra Nevada. U.S. Geological Survey Open File Report 96-0011.
Secor, D. T., Peck, L. S., Pitcher, D. M., Simpson, D. H., Smith, W. A., & Snoke, A. W. (1982). Geology of the area of induced seismic activity at Monticello Reservoir, South Carolina. Journal of Geophysical Research, 87(B8), 6945-6957.
Secor, Jr., D. T. (1981). Geological Studies in an area of Induced Seismicity, Monticello Reservoir. US Geological Survey.
Seeber, L., Ambruster, J. G., and Kim, W.-Y. (2004). A fluid-injection-triggered earthquake sequence in Ashtabula, Ohio: implication for seismogensis in stable continetal regions. Bulletin of the Seismological Society of America, 94(1), 76-87.
Shirley, J. E. (1980). Tasmanian seismicity -- natural and reservoir induced. Bulletin of the Seismological Society of America, 70(6), 2203-2220.
Simpson, D. W. (1976). Seismicity Changes associated with reservoir loading. Engineering Geology , 10, 123-150.
Simpson, D. W., & Hamburger, M. W. (1981). Tectonics and seismicity of the Toktogul reservoir region, Kirgizia, USSR. Journal of Geophysical Research, 86(B1), 345-358.
Simpson, D. W., & Negmatullaev, S. K. (1981). Induced seismicity at Nurek Reservoir Tadjikistan, USSR. Bulletin of the Seismological Society of America, 71(5), 1561-1586.
Simpson, D. W., & Negnatullaev, S. H. (1978). Induced Seismicity studies in Central Asia. Earthquake Information Bulletin, 10, 209-213.
Simpson, D. W., Leith, W. S., and Scholz, C. H. (1988). Two types of reservoir induced seismicity. Bulletin of the Seismological Society of America, 78(6), 2025-2040.
Singh, C., Bhattacharya, P. M., and Chadha , R. K. (2008). Seismicity in the Koyna-Warna reservoir site in western Indian: fractal and b-value mapping. Bulletin of the Seismological Society of America, 98(1), 476-482
Page 51 3/29/2013
ALASKA ENERGY AUTHORITY AEA11-022 TM-11-0010-030113 Snow, D. T. (1972). Geodynamics of seismic reservoirs, Proc. Symp. Percolation through Fissured
Rock, Stuttgart: Ges. Erd- und Grundbau, T2J: 1-19.
Stein, R.S. (1999), The role of stress transfer in earthquake occurrence, Nature, 402, 605-609.
Stuart-Alexander, D. E., and Mark, R. K. (1976). Impounded-induced seismicity associated with large reservoirs. USGS OFR 76-770.
Talwani, P. (1997). On the Nature of Reservoir-induced Seismicity. Pure and Applied Geophysics, 473-492.
Talwani, P., Chen, L., and Gahalaut, K. (2007). Seismogenic permeability, ks. Journal of Geophysical Research, 112(B07309), 18.
Talwani, P., Cobb, J. S., and Schaeffer, M. F. (1999). In situ measurements of hydraulic properties of a shear zone in northwestern South Carolina. Journal of Geophysical Research, 107(B7), 14,993-15,003.
Tarr, A. C., Talwani, P., Rhea, S., Carver, D., and Amick, D. (1981). Results of recent South Carolina seismological studies. Bulletin of the Seismological Society of America, 71(6), 1883-1902.
US Committee on Large Dams (USCOLD) (1997). Reservoir Triggered Seismicity.
Wells, D. and K. Coppersmith. (1994). New empirical relationships among magnitude, rupture length, rupture width, rupture area and surface displacement. Bulletin of the Seismological Society of America Vol. 84 No.4.
Wesson, R. L., Boyd, O. S., Mueller, C. S., Bufe, C. G., Frankel, A. D., Petersen, M. D. (2007). Revision of time-Independent probabilistic seismic hazard maps for Alaska: U.S. Geological Survey Open-File Report 2007-1043.
Withers, R. J. (1977). Seismicity and stress determination at manmade lakes: PhD Dissertation. University of Alberta, Canada.
Withers, R. J., and Nylan, E. (1978). Time evolution of stress under an artifical lake and its implication for induced seismicity. Canadian Journal of Earth Sciences, 15, 1526-1534.
Woodward-Clyde Consultants (WCC) (1980). Interim Report on Seismic Studies at Susitna Hydroelectric Project: Report prepared for Acres America Inc. Orange: Woodward-Clyde Consultants.
Woodward Clyde Consultants (WCC) (1982). Final Report on Seismic Studies for Susitna Hydroelectric Project.
Page 52 3/29/2013
ALASKA ENERGY AUTHORITY AEA11-022 TM-11-0010-030113 Yagi, Y., Nishimura, N., and Kasahara, A. (2012). Source process of the 12 May 2008 Wenchuan,
China, earthquake determined. Earth Planets Space, e13-e16.
Yeats, R. S., Sieh, K. E., and Allen, C. A. (1997). Geology of Earthquakes. New York, NY: Oxford University Press.
Zhang, Y., WP Feng, LS Xu, CH Zhou, and YT Chen (2009), Spatio-temporal rupture process of the 2008 great Wenchuan earthquake, Science in China Series D-Earth Sciences, 52(2), 145.
Zhou, S., K. Deng, and W. Cheng (2010), Discussion on ‘Was the 2008 Wenchuan earthquake triggered by Zipingpu Reservoir?’, Earthquake Science, 23, 577-581.
Zhou, S. and K. Deng (2011). Reply to “Comment on ‘Evidence that the 2008 Mw 7.9 Wenchuan Earthquake Could Not Have Been Induced by the Zipingpu Reservoir’ by Kai Deng, Shiyong Zhou, Rui Wang, Russell Robinson, Cuiping Zhao, and Wanzheng Cheng” by Shemin Ge, Bulletin of the Seismological Society of America, 101(6), 3119-3120.
Zoback, M. D., and Hickman, S. (1982). In situ study of the physical mechanisms controlling induced seismicity at Monticello Reservoir, South Carolina. Journal of Geophysical Research, 87(B8), 6959-6974.
Page 53 3/29/2013

ALASKA ENERGY AUTHORITY AEA11-022 TM-11-0010-030113
FIGURES
03/29/13
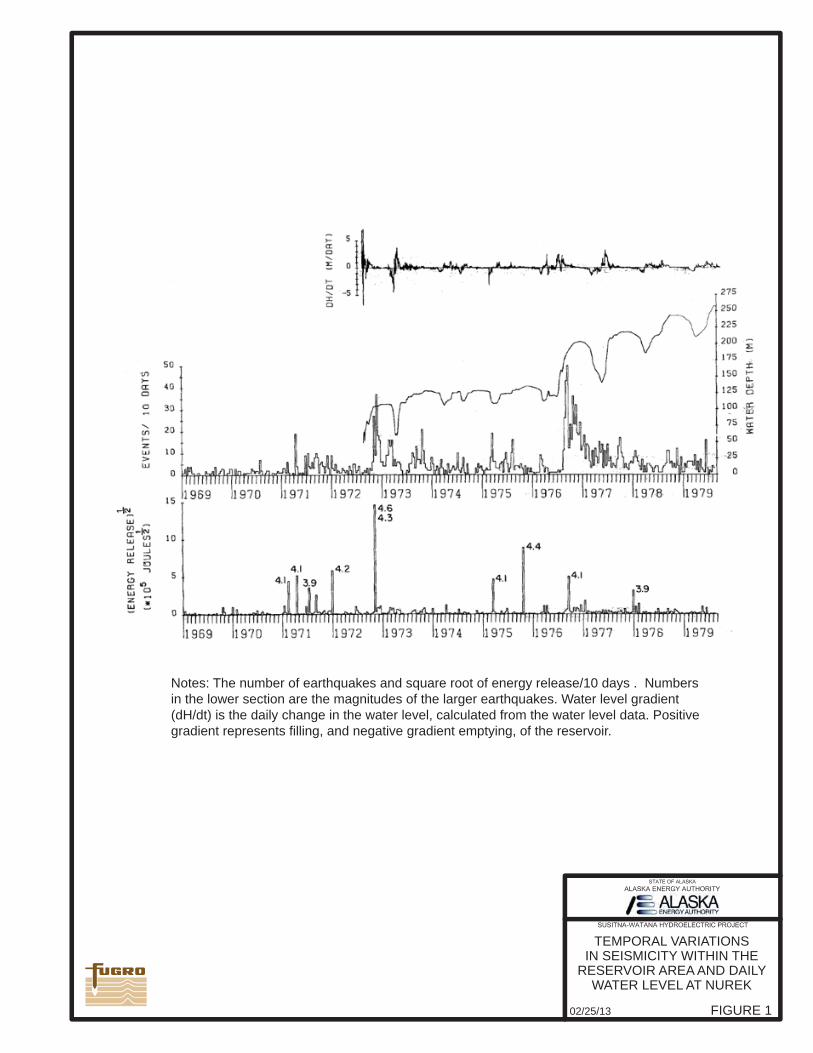
FIGURE 102/25/13
TEMPORAL VARIATIONSIN SEISMICITY WITHIN THE
RESERVOIR AREA AND DAILY WATER LEVEL AT NUREK
Notes: The number of earthquakes and square root of energy release/10 days . Numbers in the lower section are the magnitudes of the larger earthquakes. Water level gradient (dH/dt) is the daily change in the water level, calculated from the water level data. Positive gradient represents filling, and negative gradient emptying, of the reservoir.
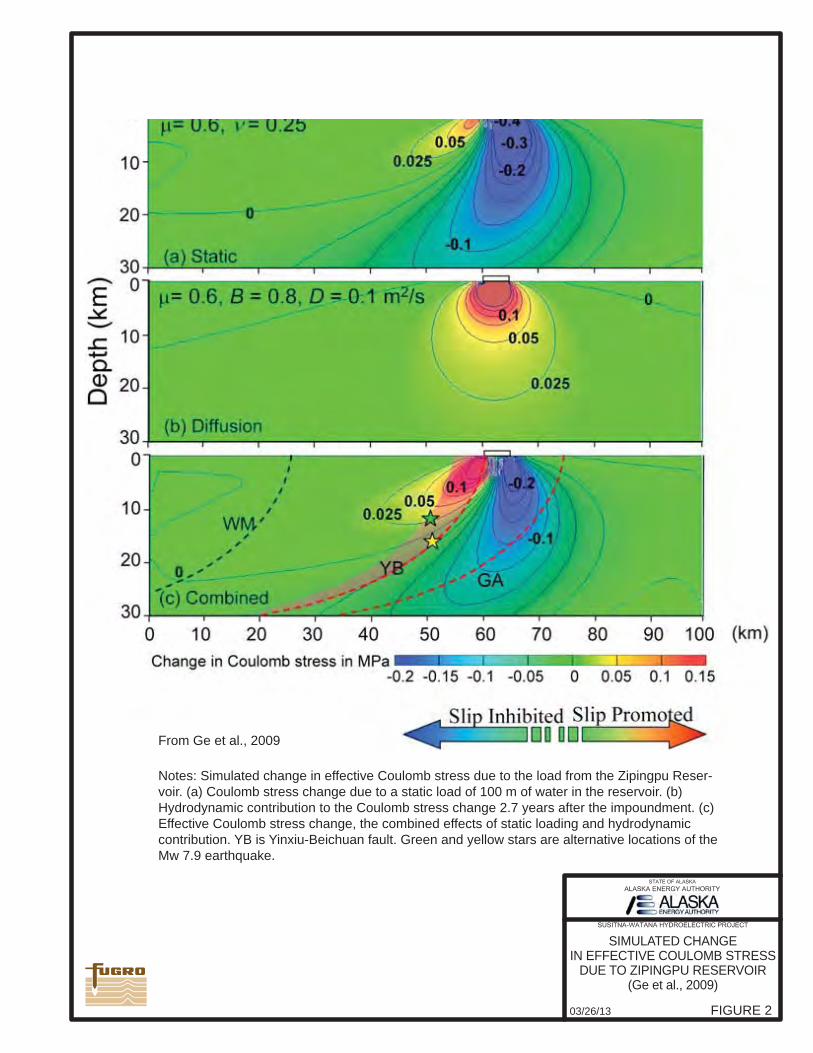
SIMULATED CHANGEIN EFFECTIVE COULOMB STRESS
DUE TO ZIPINGPU RESERVOIR(Ge et al., 2009)
FIGURE 203/26/13
Notes: Simulated change in effective Coulomb stress due to the load from the Zipingpu Reser-voir. (a) Coulomb stress change due to a static load of 100 m of water in the reservoir. (b) Hydrodynamic contribution to the Coulomb stress change 2.7 years after the impoundment. (c) Effective Coulomb stress change, the combined effects of static loading and hydrodynamic contribution. YB is Yinxiu-Beichuan fault. Green and yellow stars are alternative locations of the Mw 7.9 earthquake.
From Ge et al., 2009
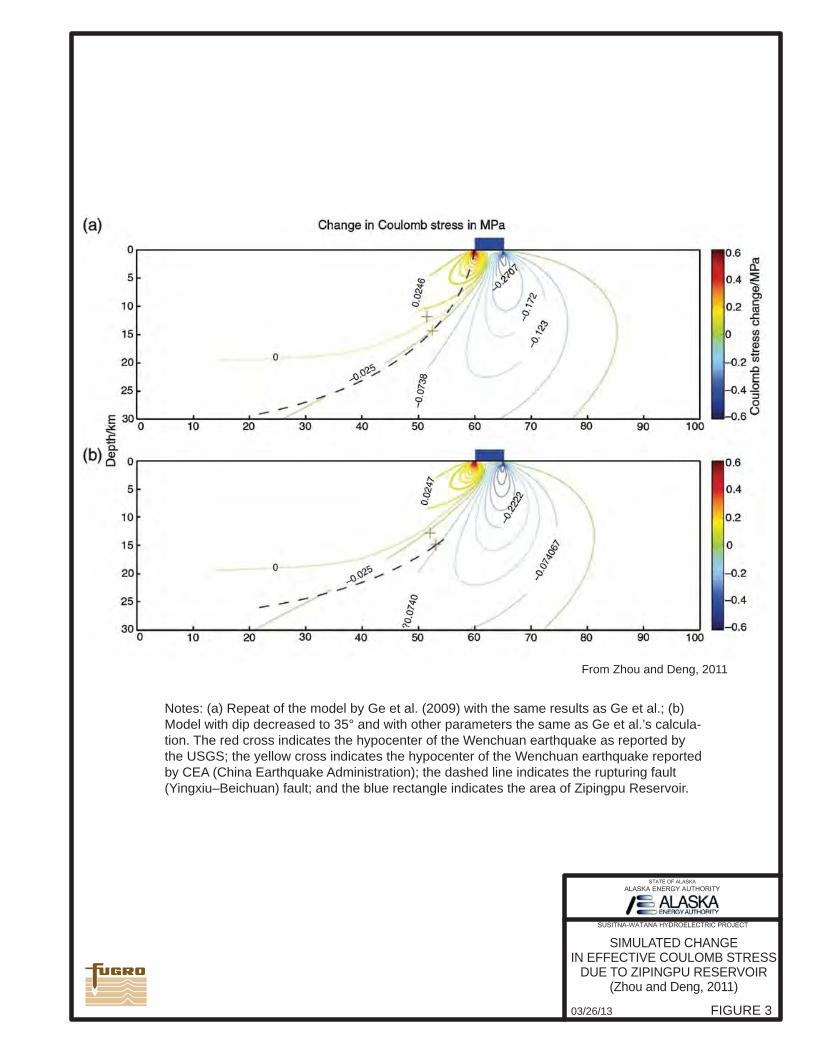
Notes: (a) Repeat of the model by Ge et al. (2009) with the same results as Ge et al.; (b) Model with dip decreased to 35° and with other parameters the same as Ge et al.’s calcula-tion. The red cross indicates the hypocenter of the Wenchuan earthquake as reported by the USGS; the yellow cross indicates the hypocenter of the Wenchuan earthquake reported by CEA (China Earthquake Administration); the dashed line indicates the rupturing fault (Yingxiu–Beichuan) fault; and the blue rectangle indicates the area of Zipingpu Reservoir.
From Zhou and Deng, 2011
FIGURE 303/26/13
SIMULATED CHANGEIN EFFECTIVE COULOMB STRESS
DUE TO ZIPINGPU RESERVOIR(Zhou and Deng, 2011)
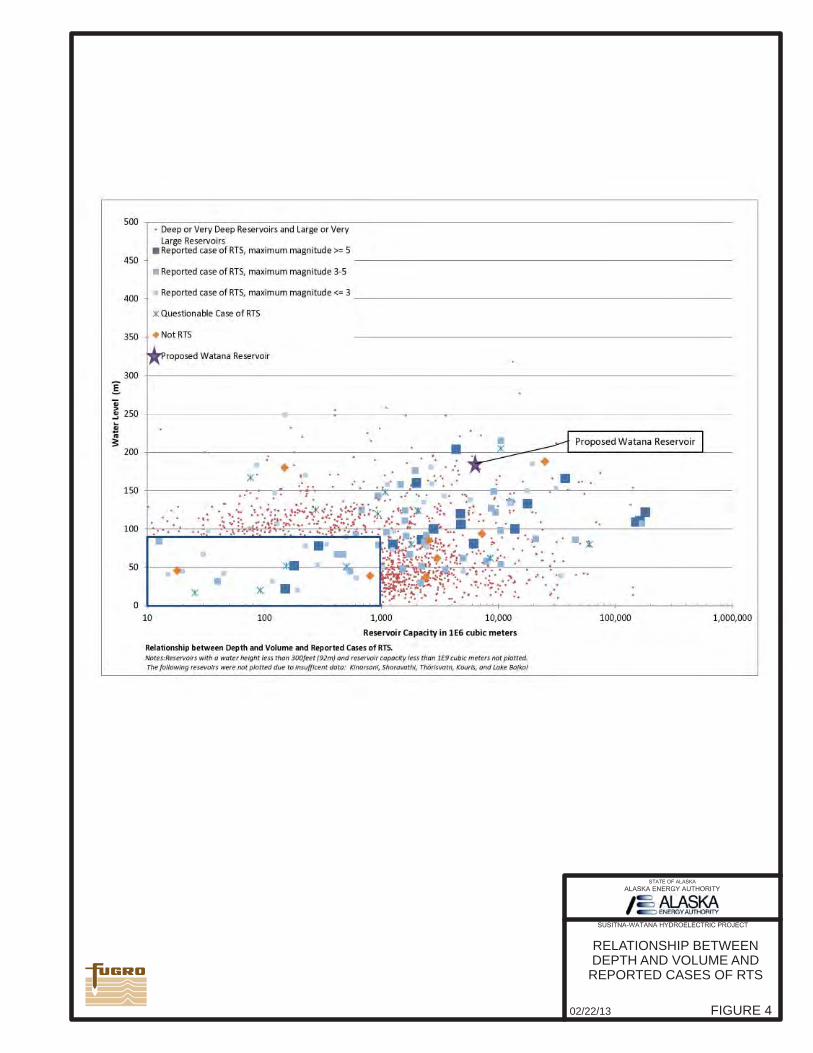
FIGURE 402/22/13
RELATIONSHIP BETWEEN DEPTH AND VOLUME AND
REPORTED CASES OF RTS
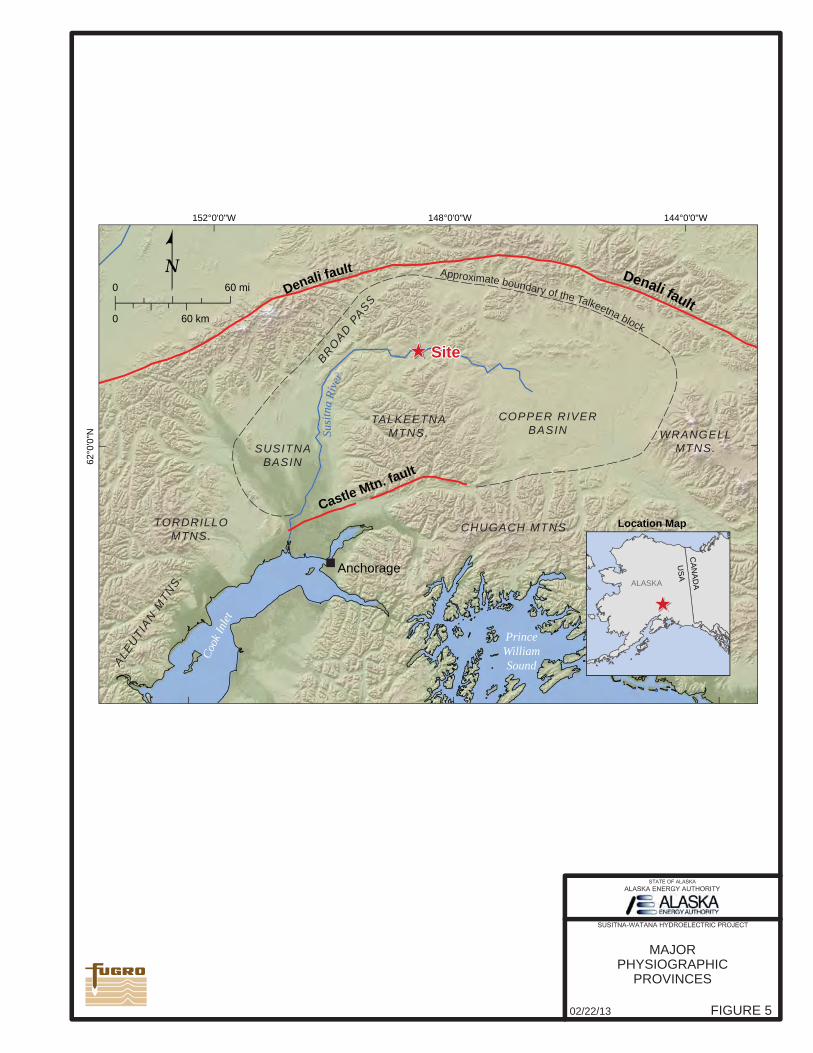
"
144°0'0"W148°0'0"W152°0'0"W
62°0
'0"N
TALKEETNAMTNS.
COPPER RIVERBASIN
ALE
UT
IAN
MT
NS
.
TORDRILLOMTNS.
SUSITNABASIN
WRANGELLMTNS.
Castle Mtn. fault
Denali fault Denali faultB
RO
AD
PA
SS
Cook
Inlet
PrinceWilliamSound
Susit
na R
iver
CHUGACH MTNS.
Anchorage
Location Map
ALASKA
CAN
ADA
USA
Approximate boundary of the Talkeetna block
0 60 mi
0 60 km
NSiteSite
MAJORPHYSIOGRAPHIC
PROVINCES
02/22/13 FIGURE 5
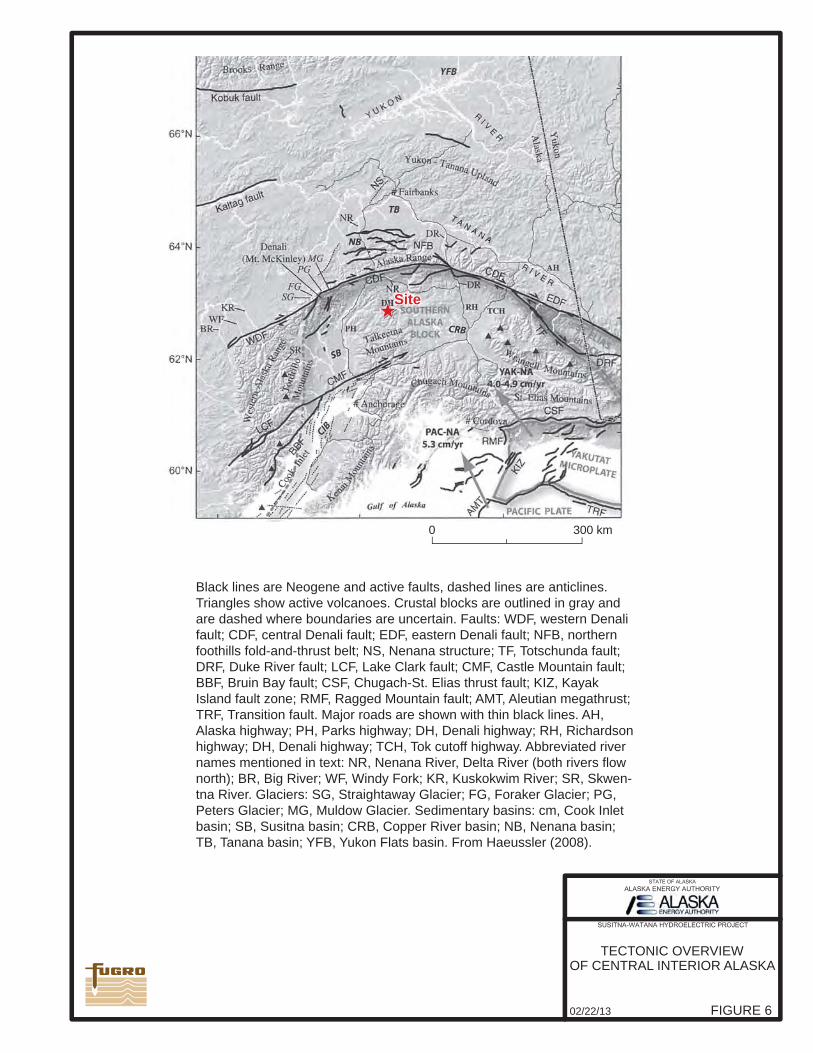
Black lines are Neogene and active faults, dashed lines are anticlines. Triangles show active volcanoes. Crustal blocks are outlined in gray and are dashed where boundaries are uncertain. Faults: WDF, western Denali fault; CDF, central Denali fault; EDF, eastern Denali fault; NFB, northern foothills fold-and-thrust belt; NS, Nenana structure; TF, Totschunda fault; DRF, Duke River fault; LCF, Lake Clark fault; CMF, Castle Mountain fault; BBF, Bruin Bay fault; CSF, Chugach-St. Elias thrust fault; KIZ, Kayak Island fault zone; RMF, Ragged Mountain fault; AMT, Aleutian megathrust; TRF, Transition fault. Major roads are shown with thin black lines. AH, Alaska highway; PH, Parks highway; DH, Denali highway; RH, Richardson highway; DH, Denali highway; TCH, Tok cutoff highway. Abbreviated river names mentioned in text: NR, Nenana River, Delta River (both rivers flow north); BR, Big River; WF, Windy Fork; KR, Kuskokwim River; SR, Skwen-tna River. Glaciers: SG, Straightaway Glacier; FG, Foraker Glacier; PG, Peters Glacier; MG, Muldow Glacier. Sedimentary basins: cm, Cook Inlet basin; SB, Susitna basin; CRB, Copper River basin; NB, Nenana basin; TB, Tanana basin; YFB, Yukon Flats basin. From Haeussler (2008).
SiteSite
TECTONIC OVERVIEWOF CENTRAL INTERIOR ALASKA
02/22/13 FIGURE 6
0 300 km
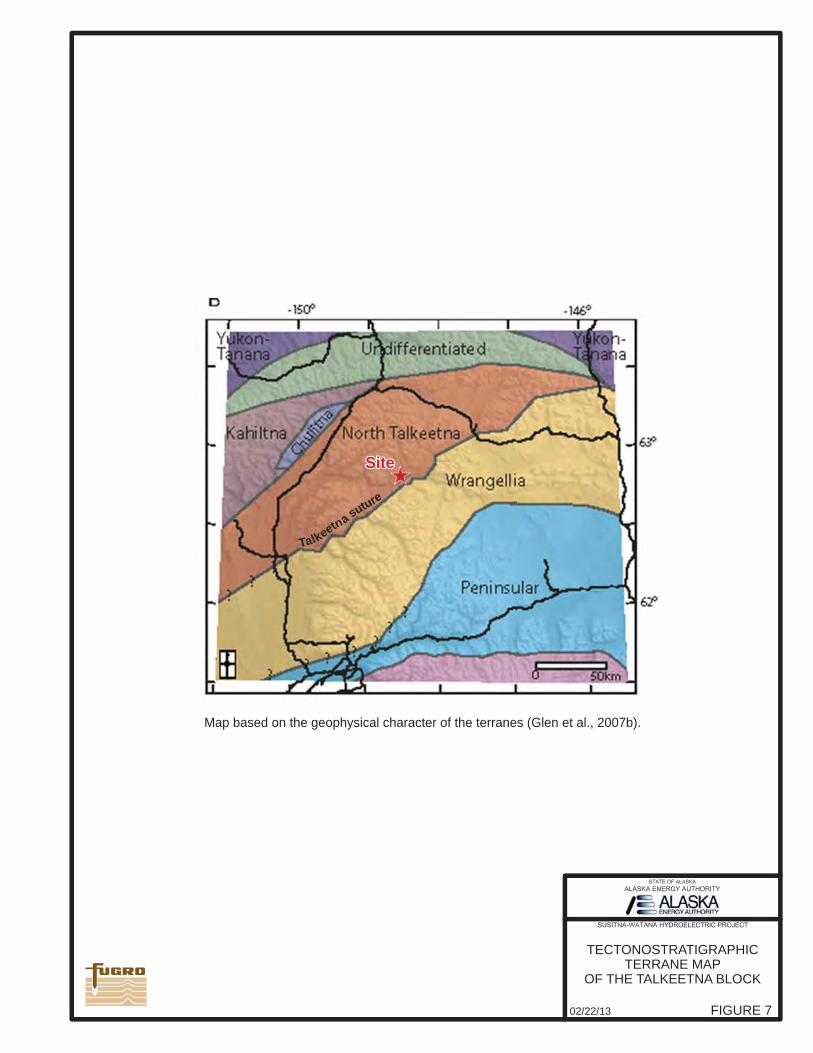
SiteSite
Talkeetna suture
TECTONOSTRATIGRAPHICTERRANE MAP
OF THE TALKEETNA BLOCK
02/22/13 FIGURE 7
Map based on the geophysical character of the terranes (Glen et al., 2007b).
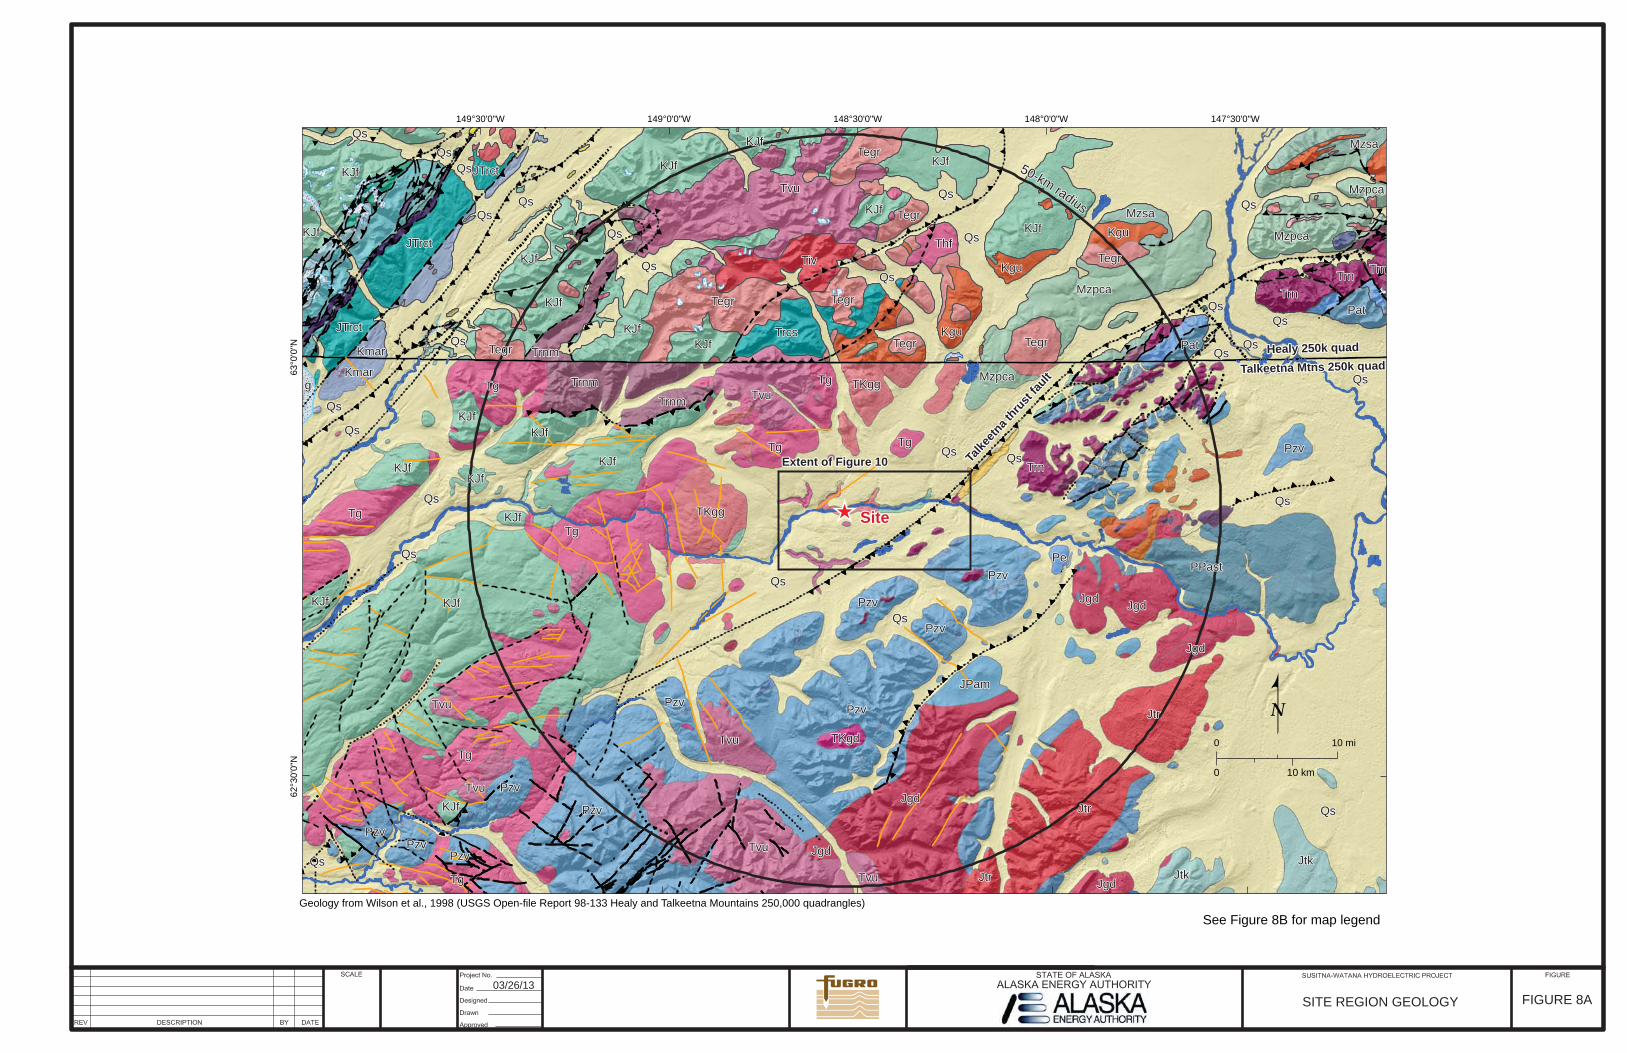
(( ((((
((
((
((
((
+
+
++++ ++++
+
+
++++
+ + +++ + ++++
((
((((+ +
+
++
((+
((
+
((((+
((
((((
((((
+
+
((
+ +
+++ +
(((((( ((
((
+
++((+
((
++++
+++((
((((
+
+
+++
(((((( +
+
((
+
((+ +
+
((
((
+ +
++
(((( +
++++
+
((
((((
((
+
((
+
+
++
((
((
((
((
++
+
+
+++ +
+
+
++
(( +
((+
+ ((((
((+
+
++ +(( +
+ + + +
((
+
+ +((
+
((
((
((
((
(( +((
((
+
++
+
+(( +
((
((
((((
+ +
+((
+
++
+
+
+
++++
((
+
((
+
+++
+++++++
((
((+
((
((
+ +((
((
((
((
++
+ ((
+++ +++++++
(( ((
++
!!
!
!!
!
!!
!
(((((( !!
!!
!
((((
!
((((((
((
((
!
!
((
(((((((((((((( !
!!
((
((((
((((((((((
!
!((
((
(( (( (( (( (( ((
((((((((((((
((
!!
!!
!
((((((
!!
@@
!
!
!!
((((((
((((((((((((((
((((((
@@
!
((((
!!
((!
!!
!!
!!((((
!
((
!!
!!
!!!
!!!
1
((((((
!!
_̂
QsQs
QsQs
QsQsKJfKJf
QsQs
QsQs
TgTg
QsQs
PzvPzv
QsQs
PzvPzv
QsQs
JtrJtr
TgTg
JgdJgd
TvuTvu
TvuTvu
QsQs
JtrJtr
PPastPPast
QsQs
KJfKJf
KJfKJf
KJfKJf
QsQs
TgTg
TgTg
KJfKJf
PzvPzv
QsQs
MzpcaMzpca
KJfKJf
JgdJgd
QsQs
TegrTegr
TivTiv
KJfKJf
TgTg
KJfKJf
QsQs
JtkJtk
TgTg
TvuTvu
JTrctJTrct
TrnmTrnm
QsQs
KJfKJf
QsQs
KJfKJf
TKggTKgg
TvuTvu
TrcsTrcs
JtkJtk
QsQs
KJfKJf
KJfKJf
QsQs
PzvPzv
PzvPzv
MzpcaMzpca
TrnTrn
TgTg
KJfKJf
TrnTrn
QsQs
QsQs
QsQs
QsQs
KguKgu
PzvPzv
PzvPzv
JgdJgd
TKggTKgg
TegrTegr
TrnmTrnm
MzsaMzsa
JTrctJTrctTegrTegr
JtrJtr
KJfKJf
PatPat
PzvPzv
JPamJPam
TrnTrn
TegrTegr
KJfKJf
JgdJgd
PzvPzv
KJfKJf
TvuTvu
KguKgu
TrnmTrnm
JgdJgd
PzvPzv
ThfThf
QsQsQsQsTegrTegr
KmarKmar
QsQs
KJfKJf
QsQs
KguKguTegrTegr
TvuTvu
gg
TegrTegr MzsaMzsa
MzpcaMzpca
TrnTrn
TgTg
PatPatQsQs
KJfKJf
KJfKJf
QsQs
TvuTvu
JTrctJTrct
PzvPzv
KmarKmar
JgdJgd
TKgdTKgd
PePe
MzpcaMzpca
TegrTegr
KJfKJf
147°30'0"W148°0'0"W148°30'0"W149°0'0"W149°30'0"W
63°0
'0"N
62°3
0'0"
N
Extent of Figure 10Extent of Figure 10
50-km radius
50-km radius
See Figure 8B for map legend
N0 10 mi
0 10 km
Geology from Wilson et al., 1998 (USGS Open-file Report 98-133 Healy and Talkeetna Mountains 250,000 quadrangles)
Healy 250k quadHealy 250k quad
Talke
etna t
hrust
fault
Talke
etna t
hrust
fault
Talkeetna Mtns 250k quadTalkeetna Mtns 250k quad
03/26/13FIGURE 8ASITE REGION GEOLOGY
SiteSite
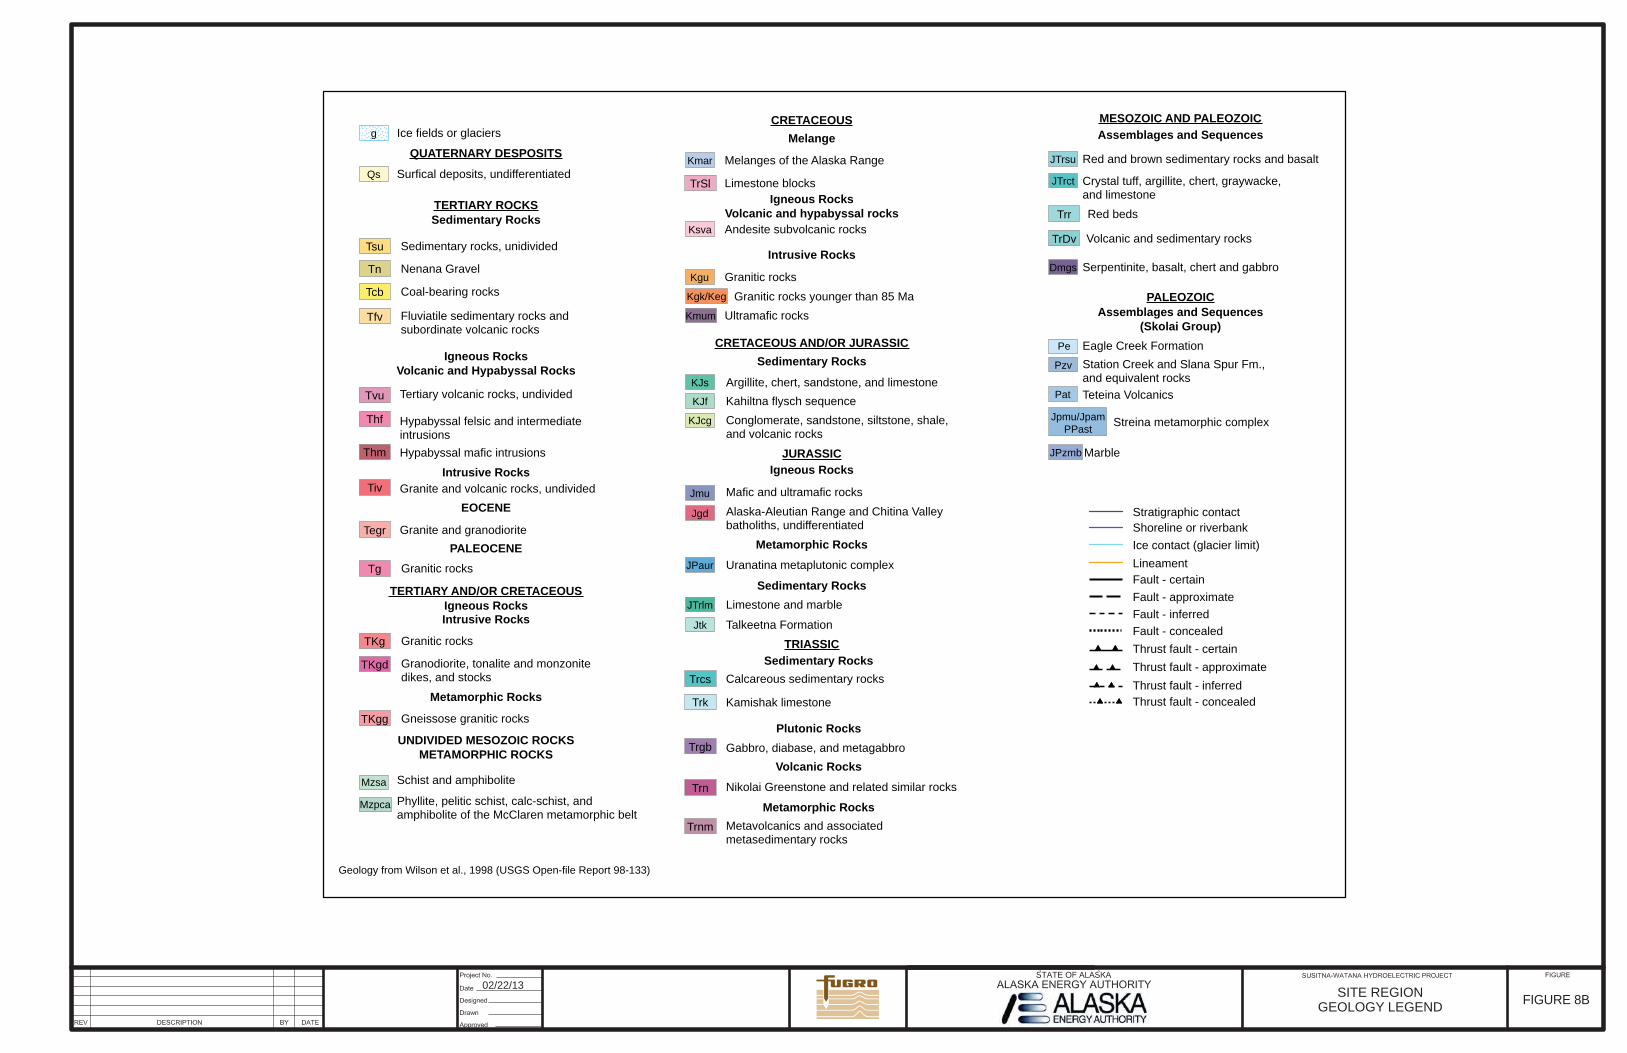
g
Qs
Ice fields or glaciers
Surfical deposits, undifferentiated
QUATERNARY DESPOSITS
UNDIVIDED MESOZOIC ROCKSMETAMORPHIC ROCKS
Schist and amphibolite
Phyllite, pelitic schist, calc-schist, andamphibolite of the McClaren metamorphic belt
CRETACEOUS
Kmar Melanges of the Alaska Range
Intrusive Rocks
Granitic rocksGranitic rocks younger than 85 Ma
Ultramafic rocks
Melange
CRETACEOUS AND/OR JURASSICSedimentary Rocks
KJs
KJf
Argillite, chert, sandstone, and limestoneKahiltna flysch sequenceConglomerate, sandstone, siltstone, shale,and volcanic rocks
JURASSICIgneous Rocks
Jmu
Jgd
Metamorphic Rocks
JTrlm
Jtk
JTrsu
JTrct
Dmgs
Mafic and ultramafic rocksAlaska-Aleutian Range and Chitina Valleybatholiths, undifferentiated
JPaur Uranatina metaplutonic complex
Sedimentary RocksLimestone and marble
Talkeetna Formation
MESOZOIC AND PALEOZOICAssemblages and Sequences
Red and brown sedimentary rocks and basalt
Crystal tuff, argillite, chert, graywacke,and limestone
Serpentinite, basalt, chert and gabbro
PALEOZOICAssemblages and Sequences
(Skolai Group)
Jpmu/JpamPPast
Eagle Creek FormationStation Creek and Slana Spur Fm., and equivalent rocksTeteina Volcanics
Streina metamorphic complex
Marble
Ksva Andesite subvolcanic rocks
Geology from Wilson et al., 1998 (USGS Open-file Report 98-133)
Stratigraphic contact
Fault - concealed
Thrust fault - concealed
Fault - approximateFault - certain
Thrust fault - inferred
Ice contact (glacier limit)Lineament
Fault - inferred
Shoreline or riverbank
Thrust fault - certain
(( (((( ((
( (
(( ((
Thrust fault - approximate
Mzsa
Mzpca
Kgu
Kgk/Keg
KJcg
Pzv
Pe
Pat
JPzmb
TERTIARY ROCKSSedimentary Rocks
Igneous RocksVolcanic and Hypabyssal Rocks
Intrusive Rocks
EOCENE
Tfv
TRIASSICSedimentary Rocks
Trcs
Plutonic RocksTrgb
Trr
TrDv
Volcanic Rocks
Trn
Metamorphic RocksTrnm
Igneous RocksVolcanic and hypabyssal rocks
TrSl
TERTIARY AND/OR CRETACEOUSIgneous RocksIntrusive Rocks
TKg
TKgd
Metamorphic Rocks
TKgg
PALEOCENETg
Trk Kamishak limestone
Tn
Tcb
Sedimentary rocks, unidividedTsu
Nenana Gravel
Coal-bearing rocks
Fluviatile sedimentary rocks andsubordinate volcanic rocks
Tertiary volcanic rocks, undivided
Hypabyssal felsic and intermediateintrusions
Thm
Thf
Tvu
Hypabyssal mafic intrusions
Tiv
Tegr
Granite and volcanic rocks, undivided
Granite and granodiorite
Granitic rocks
Granitic rocks
Granodiorite, tonalite and monzonitedikes, and stocks
Gneissose granitic rocks
Limestone blocks
Calcareous sedimentary rocks
Gabbro, diabase, and metagabbro
Nikolai Greenstone and related similar rocks
Metavolcanics and associatedmetasedimentary rocks
Red beds
Volcanic and sedimentary rocks
Kmum
02/22/13FIGURE 8BSITE REGION
GEOLOGY LEGEND
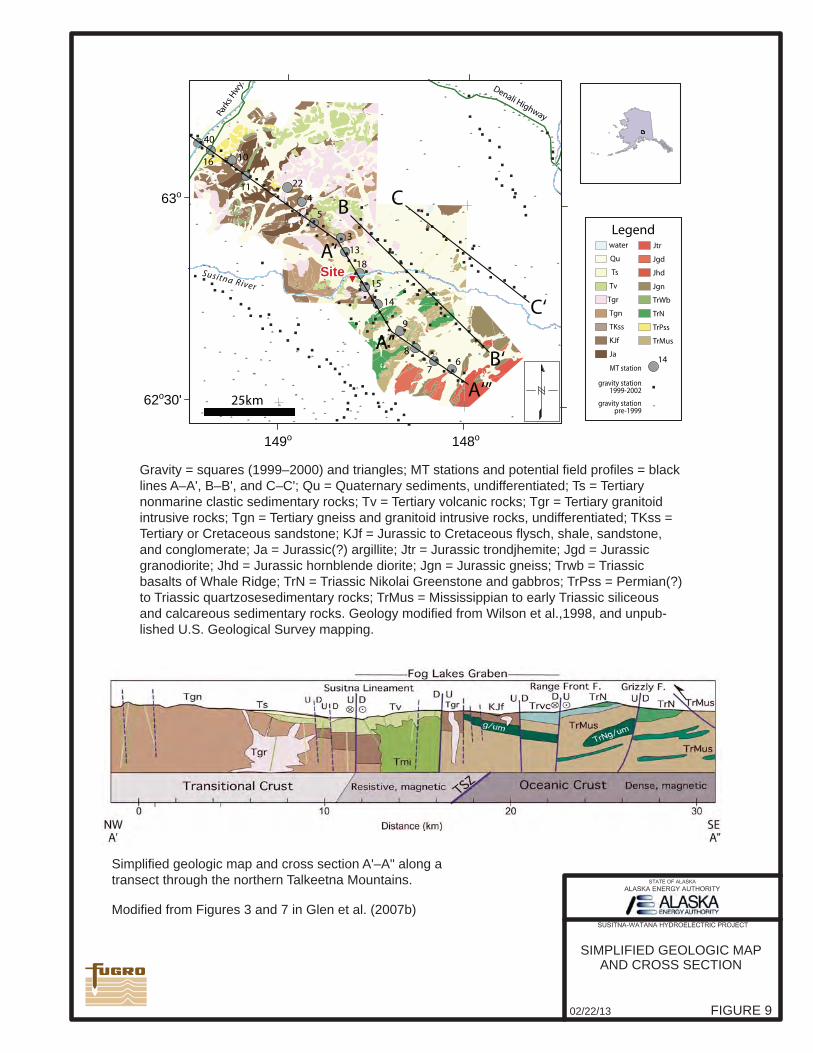
02/22/13 FIGURE 9
SIMPLIFIED GEOLOGIC MAP AND CROSS SECTION
148o149o
62o30'
63o
Qu
Ts
TKss
Jhd
Jgd
Jtrwater
Tgn
Tv
TrMus
TrPss
Ja
KJf
Jgn
TrWb
TrN
Tgr
Legend
40
16 10
11 22
4
5
313
18
15
14
9
8
76 14
MT station
gravity station1999-2002
gravity stationpre-1999
Denali Highway
Susitna River
Park
s Hw
y.
C
A‘’’
B
B‘
C‘
A‘
A“
25km
SiteSite
Gravity = squares (1999–2000) and triangles; MT stations and potential field profiles = black lines A–A', B–B', and C–C'; Qu = Quaternary sediments, undifferentiated; Ts = Tertiary nonmarine clastic sedimentary rocks; Tv = Tertiary volcanic rocks; Tgr = Tertiary granitoid intrusive rocks; Tgn = Tertiary gneiss and granitoid intrusive rocks, undifferentiated; TKss = Tertiary or Cretaceous sandstone; KJf = Jurassic to Cretaceous flysch, shale, sandstone, and conglomerate; Ja = Jurassic(?) argillite; Jtr = Jurassic trondjhemite; Jgd = Jurassic granodiorite; Jhd = Jurassic hornblende diorite; Jgn = Jurassic gneiss; Trwb = Triassic basalts of Whale Ridge; TrN = Triassic Nikolai Greenstone and gabbros; TrPss = Permian(?) to Triassic quartzosesedimentary rocks; TrMus = Mississippian to early Triassic siliceous and calcareous sedimentary rocks. Geology modified from Wilson et al.,1998, and unpub-lished U.S. Geological Survey mapping.
Simplified geologic map and cross section A'–A" along a transect through the northern Talkeetna Mountains.
Modified from Figures 3 and 7 in Glen et al. (2007b)
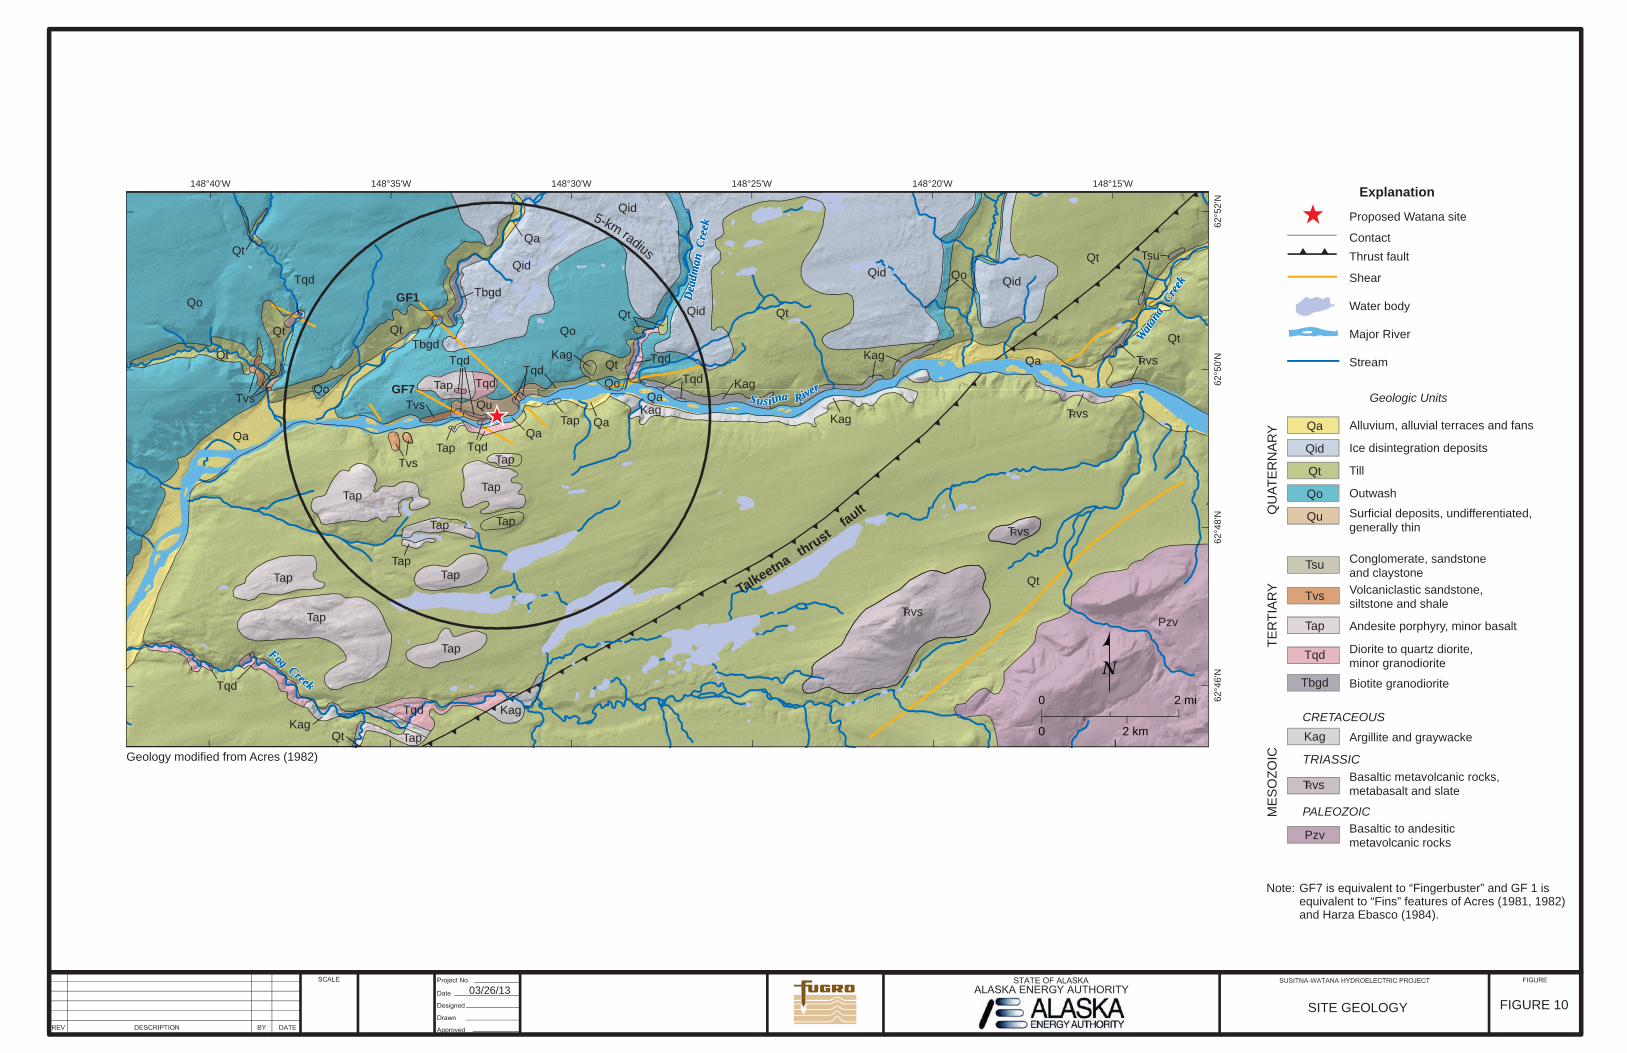
5-km radius
148°15'W148°20'W148°25'W148°30'W148°35'W148°40'W
62°5
2'N
62°5
0'N
62°4
8'N
62°4
6'N
Qt
Qo
Qt
Qt
Pzv
Qo
Qid
Qid
Qid
Qid
Qa
Qt
Tap
Qt
Qid
Tap
Qt
Tap
Tap
Qt
Qt
Tap
Tap
Tqd
QuTap
Kag
Kag
Qo
Qa
Kag
Kag
Tap
Tqd
Tap
Tbgd
Tap
Qa
Tqd
Tqd
Qt
Tap
Qo Qo
QaQa
Kag
Tvs
KagTvs
Tqd
Tap
Tvs
Kag
Qt
Tsu
Tqd
Tbgd
Qa
Tap
Tap
TqdTqd
Tqd
Qt
03/26/13FIGURE 10SITE GEOLOGY
Geology modified from Acres (1982)
Talkeetna thrust
fault
0 2 mi
0 2 km
NTRvs
TRvs
TRvs
TRvs
ContactThrust fault
Andesite porphyry, minor basalt
Argillite and graywacke
Basaltic metavolcanic rocks,metabasalt and slate
Basaltic to andesiticmetavolcanic rocks
Biotite granodiorite
Conglomerate, sandstoneand claystone
Diorite to quartz diorite, minor granodiorite
Volcaniclastic sandstone, siltstone and shale
QU
ATE
RN
AR
YTE
RTI
AR
YM
ES
OZO
IC
CRETACEOUS
TRIASSIC
PALEOZOIC
Qa
Qid
Qt
Qo
Tsu
Kag
Pzv
Tvs
Tap
Tqd
Tbgd
Qu
Alluvium, alluvial terraces and fans
Ice disintegration deposits
Till
Outwash
Surficial deposits, undifferentiated,generally thin
Shear
Water body
Major River
Stream
Geologic Units
Proposed Watana site
Explanation
Note: GF7 is equivalent to “Fingerbuster” and GF 1 is equivalent to “Fins” features of Acres (1981, 1982) and Harza Ebasco (1984).
TRvs
Watana
Cre
ek
Watana
Cre
ek
Watana
Cre
ek
Fog Creek
Fog Creek
Fog CreekD
eadm
an C
reek
Dea
dman
Cre
ekD
eadm
an C
reek
Susi tna RiverSusi tna RiverSusi tna River
GF1
GF7
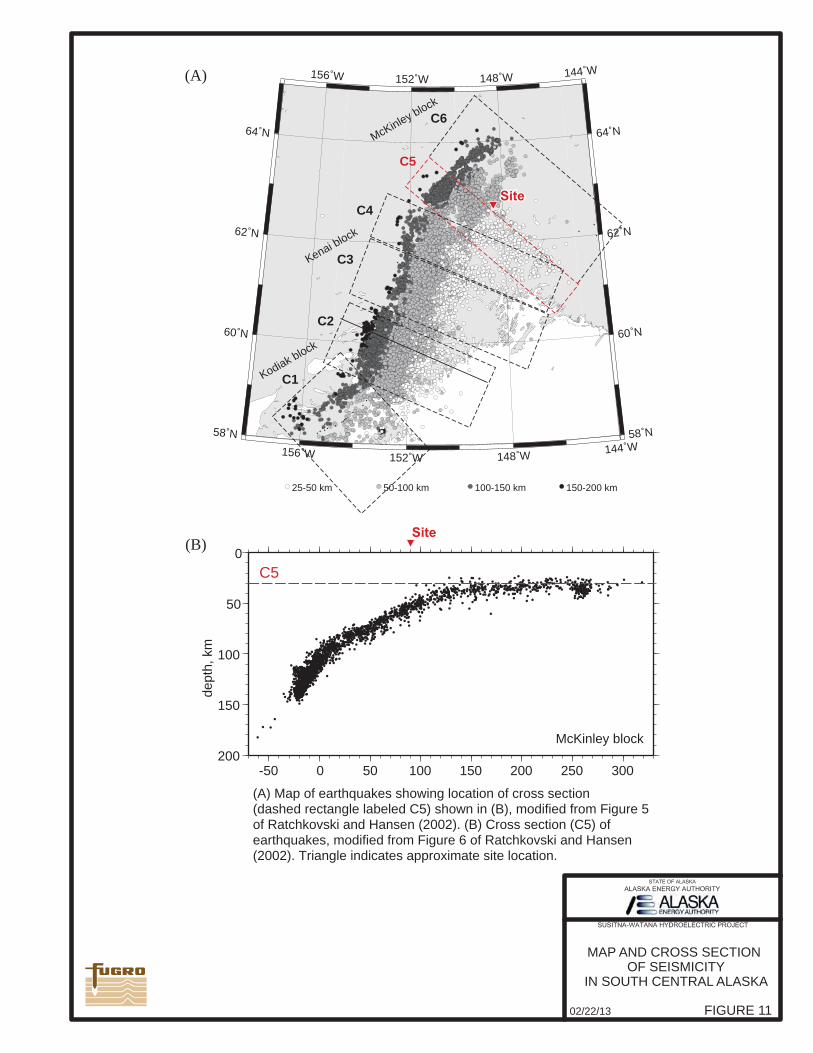
25-50 km 50-100 km 100-150 km 150-200 km
156 W
156 W
152 W
152 W
148 W
148 W
144 W
144 W
58 N 58 N
60 N 60 N
62 N 62 N
64 N 64 N
C1
C5
C2
C4
C3
C6
Kodiak block
Kenai block
McKinley block
0
50
100
150
200
dept
h, k
m
-50 0 50 100 150 200 250 300
C5
McKinley block
(A)
(B)
Figure 14. (A) Map of earthquakes showing location of cross section (dashed rectangle labeled C5) shown in (B), modified from Figure 5 of Ratchkovski and Hansen (2002). (B) Cross section (C5) of earthquakes, modified from Figure 6 of Ratchkovski and Hansen (2002). Triangle indicates approximate site location.
(A) Map of earthquakes showing location of cross section(dashed rectangle labeled C5) shown in (B), modified from Figure 5of Ratchkovski and Hansen (2002). (B) Cross section (C5) ofearthquakes, modified from Figure 6 of Ratchkovski and Hansen(2002). Triangle indicates approximate site location.
MAP AND CROSS SECTION OF SEISMICITY
IN SOUTH CENTRAL ALASKA
FIGURE 1102/22/13
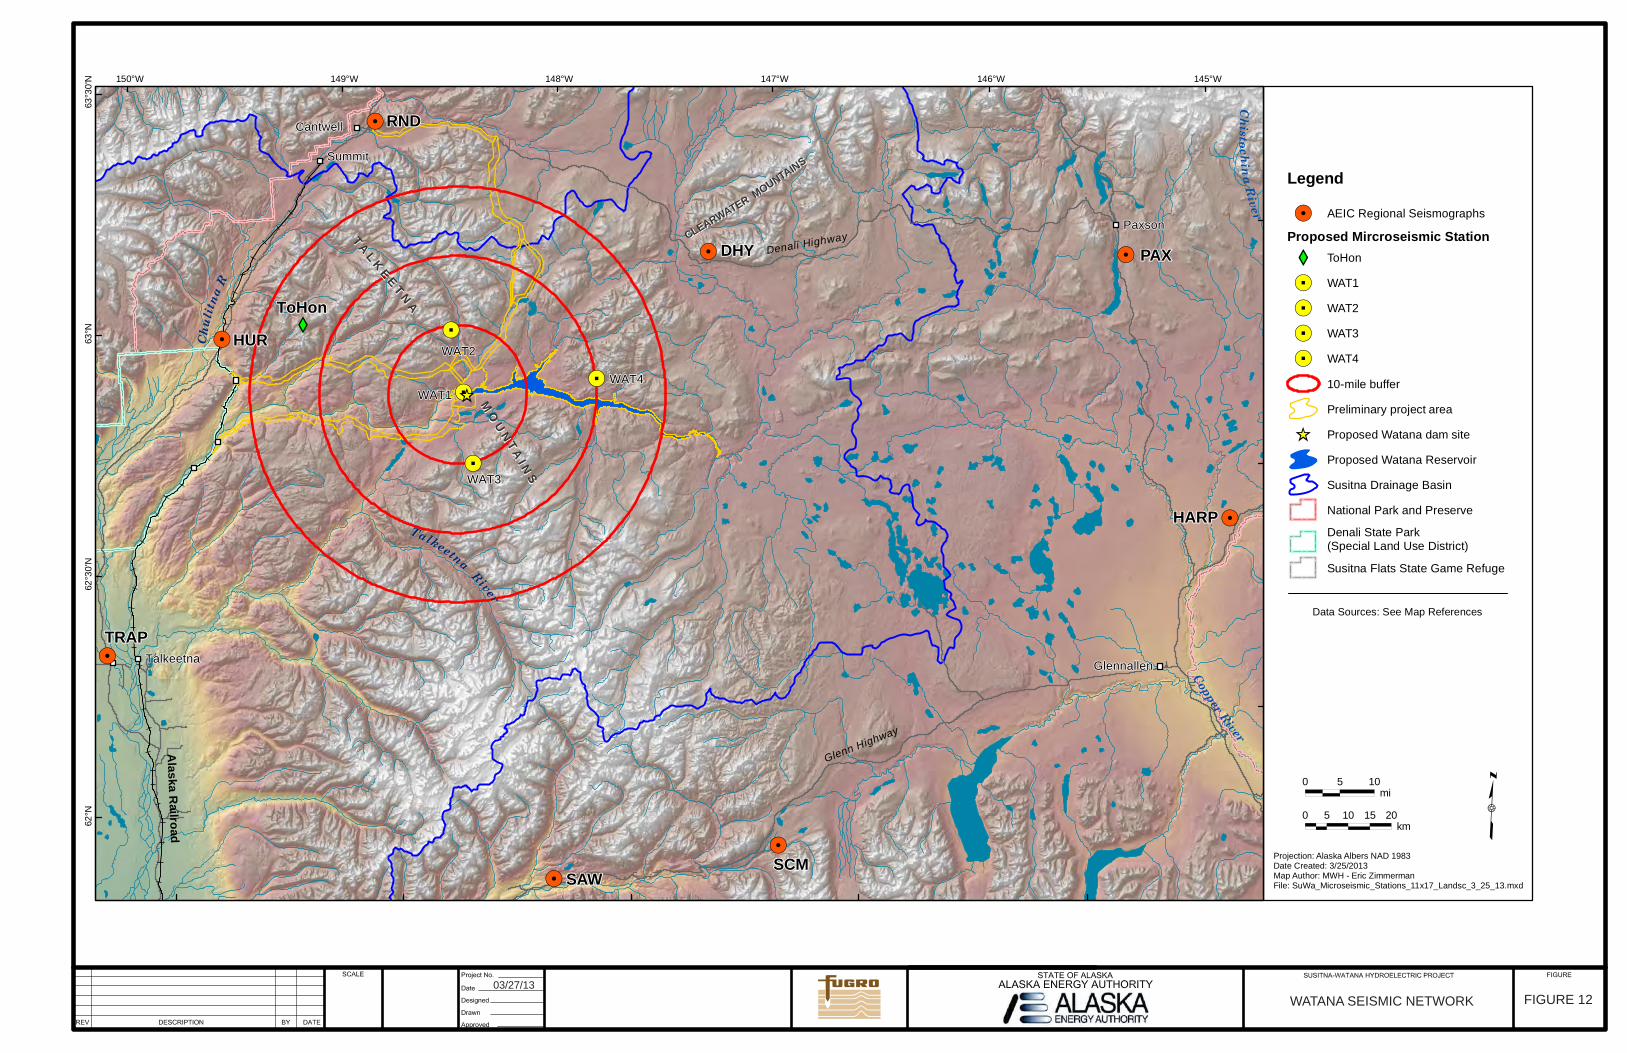
Legend
!. AEIC Regional Seismographs
Proposed Mircroseismic Station
XY ToHon
!5 WAT1
!5 WAT2
!5 WAT3
!5 WAT4
10-mile buffer
Preliminary project area
^̂ Proposed Watana dam site
Proposed Watana Reservoir
Susitna Drainage Basin
National Park and Preserve
Denali State Park(Special Land Use District)
Susitna Flats State Game Refuge
Projection: Alaska Albers NAD 1983Date Created: 3/25/2013Map Author: MWH - Eric ZimmermanFile: SuWa_Microseismic_Stations_11x17_Landsc_3_25_13.mxd
0 5 10 15 20kmkm
0 5 10mimi
!5
!5
!5
XY!.
!.
!. !.
!.
!.
!.
!.
Glenn Highway
Denali Highway
Alaska R
ailroad
TT AALL
KKEE
EETT
NNAA
MMOO
UUNN
TTAA
IINNSS
PaxsonPaxson
TalkeetnaTalkeetna GlennallenGlennallen
Copper
River
CCLL EEAARRWWAATTEERRMMOOUUNNTTAA IINN
SS
Chisto
chinaRiver
SummitSummit
CantwellCantwell
TTaallkkeeeettnnaa
RRiivveerr
CChhuull iitt nnaaRR
SAWSAWSCMSCM
PAXPAXDHYDHY
RNDRND
HURHUR
HARPHARP
TRAPTRAP
WAT1WAT1
WAT3WAT3
WAT2WAT2
WAT4WAT4
ToHonToHon
145°W146°W147°W148°W149°W150°W63
°30'
N63
°N62
°30'
N62
°N r
Data Sources: See Map References
!5̂̂
03/27/13FIGURE 12WATANA SEISMIC NETWORK
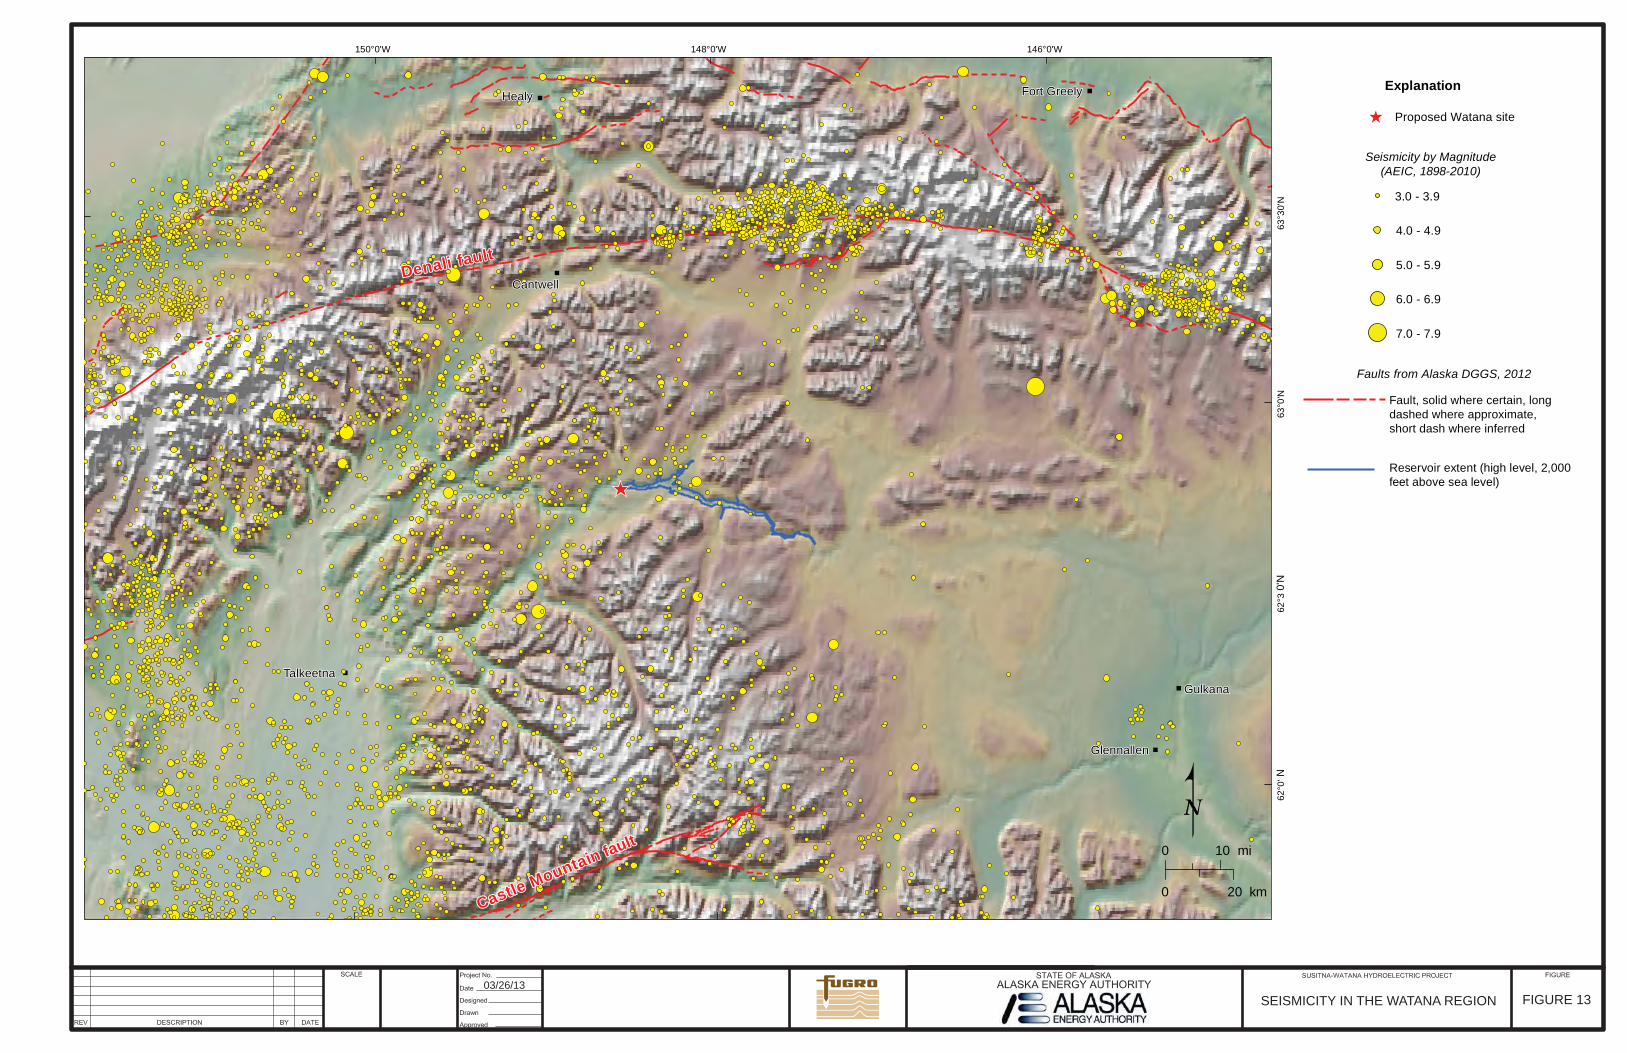
146°0'W148°0'W150°0'W
63°3
0'N
63°0
'N62
°30'
N62
°0' N
0 10 mi
0 20 km
03/26/13FIGURE 13SEISMICITY IN THE WATANA REGION
Castle Mountain fault
Castle Mountain fault
GulkanaGulkanaGulkana
CantwellCantwellCantwell
TalkeetnaTalkeetnaTalkeetna
GlennallenGlennallenGlennallen
HealyHealyHealy Fort GreelyFort GreelyFort Greely
Denali faultDenali fault
Explanation
Proposed Watana site
3.0 - 3.9
4.0 - 4.9
5.0 - 5.9
6.0 - 6.9
7.0 - 7.9
Seismicity by Magnitude(AEIC, 1898-2010)
Faults from Alaska DGGS, 2012
Fault, solid where certain, longdashed where approximate, short dash where inferred
Reservoir extent (high level, 2,000feet above sea level)
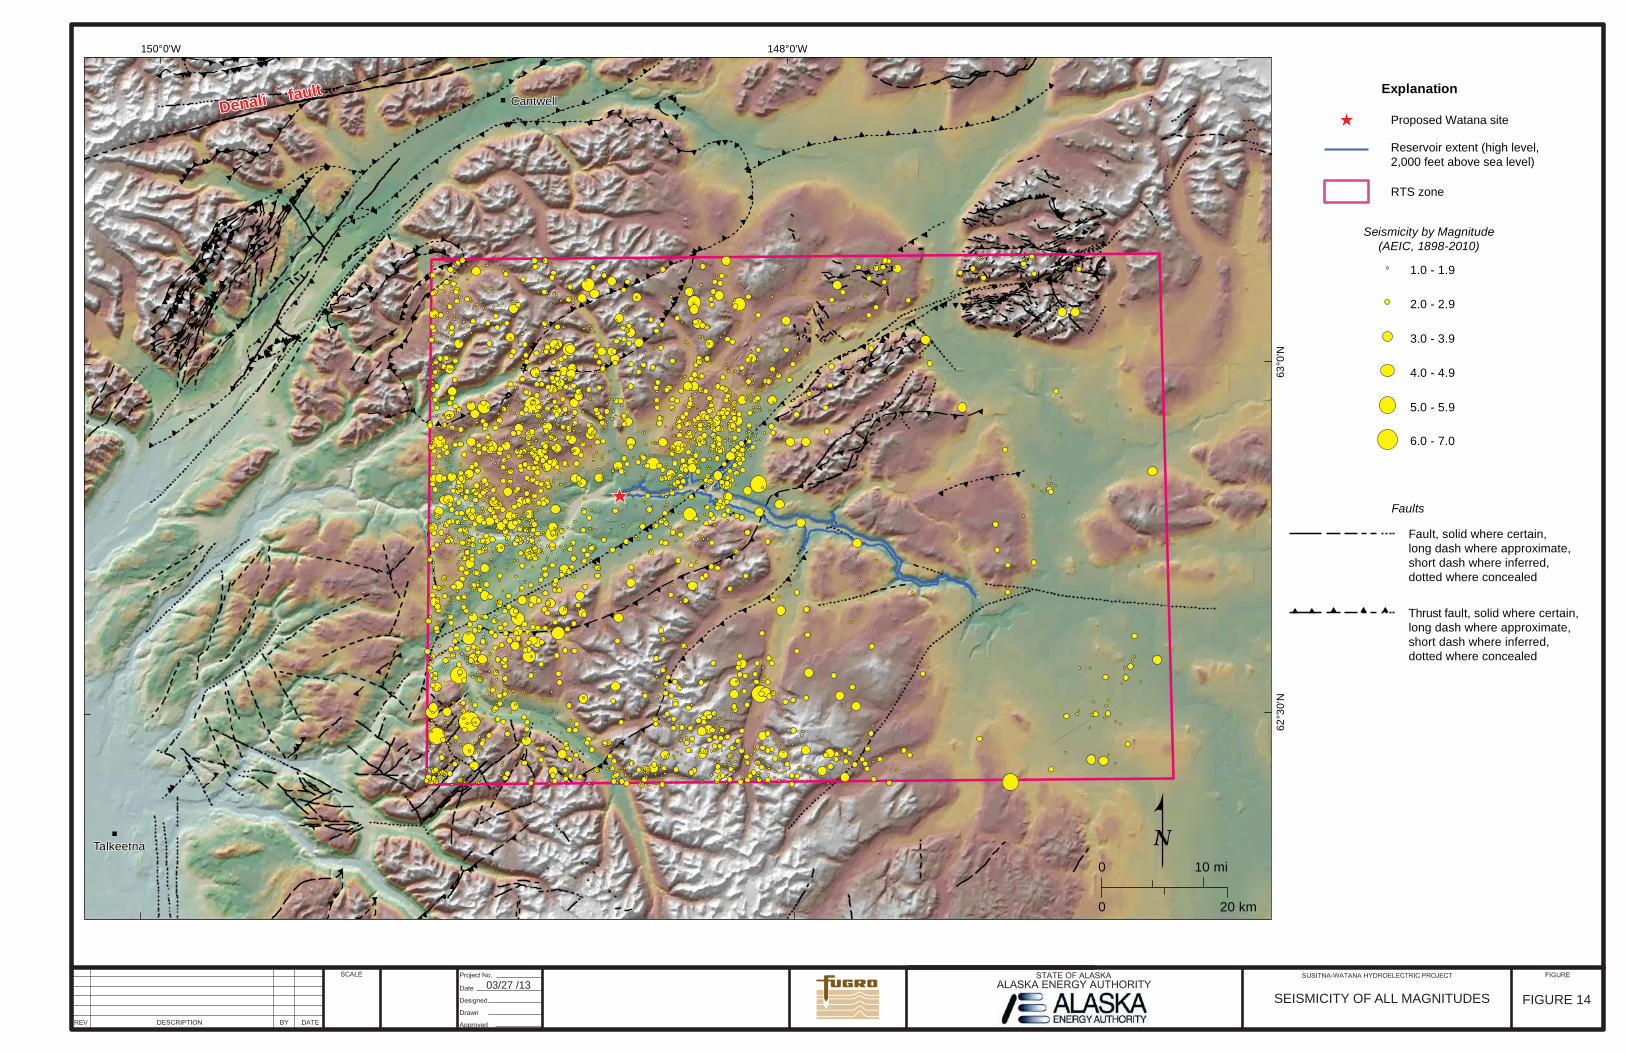
Explanation
148°0'W150°0'W
63°0
'N62
°30'
N
Proposed Watana site
Reservoir extent (high level, 2,000 feet above sea level)
1.0 - 1.9
2.0 - 2.9
3.0 - 3.9
4.0 - 4.9
5.0 - 5.9
6.0 - 7.0
Seismicity by Magnitude(AEIC, 1898-2010)
RTS zone
Faults
Fault, solid where certain,long dash where approximate,short dash where inferred, dotted where concealed
Thrust fault, solid where certain,long dash where approximate,short dash where inferred, dotted where concealed
03/27 /13 FIGURE 14SEISMICITY OF ALL MAGNITUDES
0 10 mi
0 20 km
TalkeetnaTalkeetna
Denali faultDenali fault
CantwellCantwell
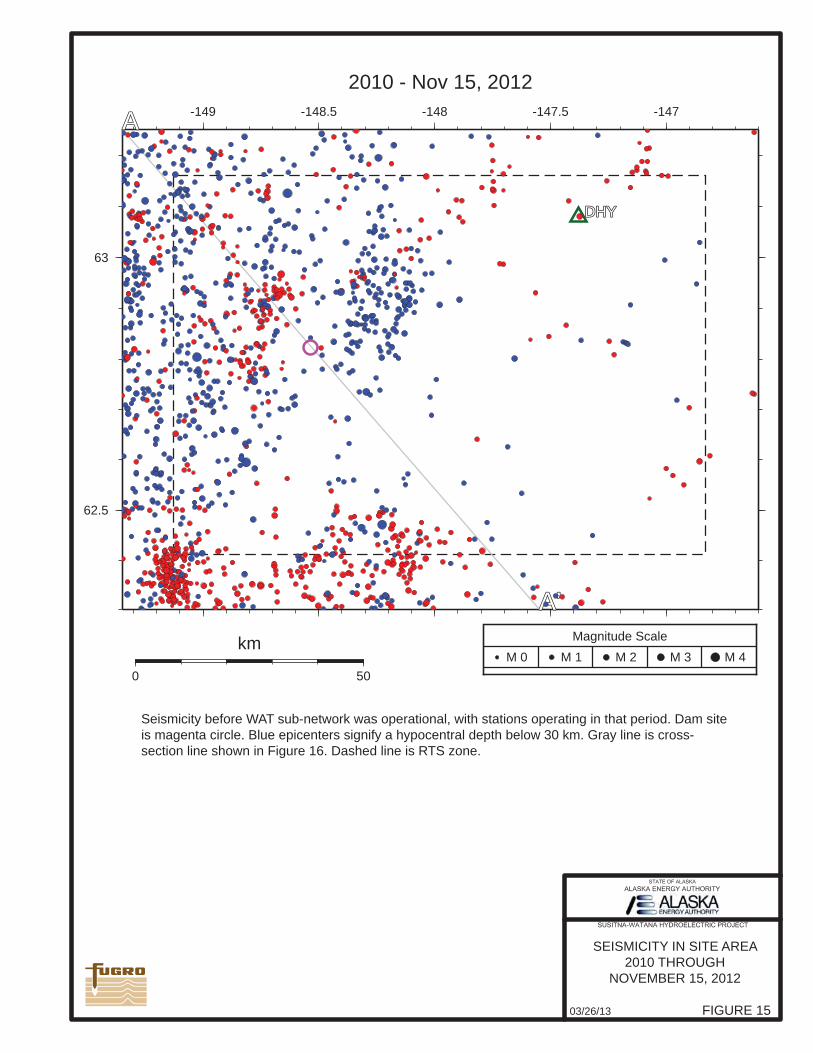
FIGURE 1503/26/13
SEISMICITY IN SITE AREA 2010 THROUGH
NOVEMBER 15, 2012
2010 - Nov 15, 2012-149 -148.5 -148 -147.5 -147
62.5
63
0 50
km
AA
A’A’
DHYDHY
Magnitude Scale
M 0 M 1 M 2 M 3 M 4
Seismicity before WAT sub-network was operational, with stations operating in that period. Dam site is magenta circle. Blue epicenters signify a hypocentral depth below 30 km. Gray line is cross-section line shown in Figure 16. Dashed line is RTS zone.
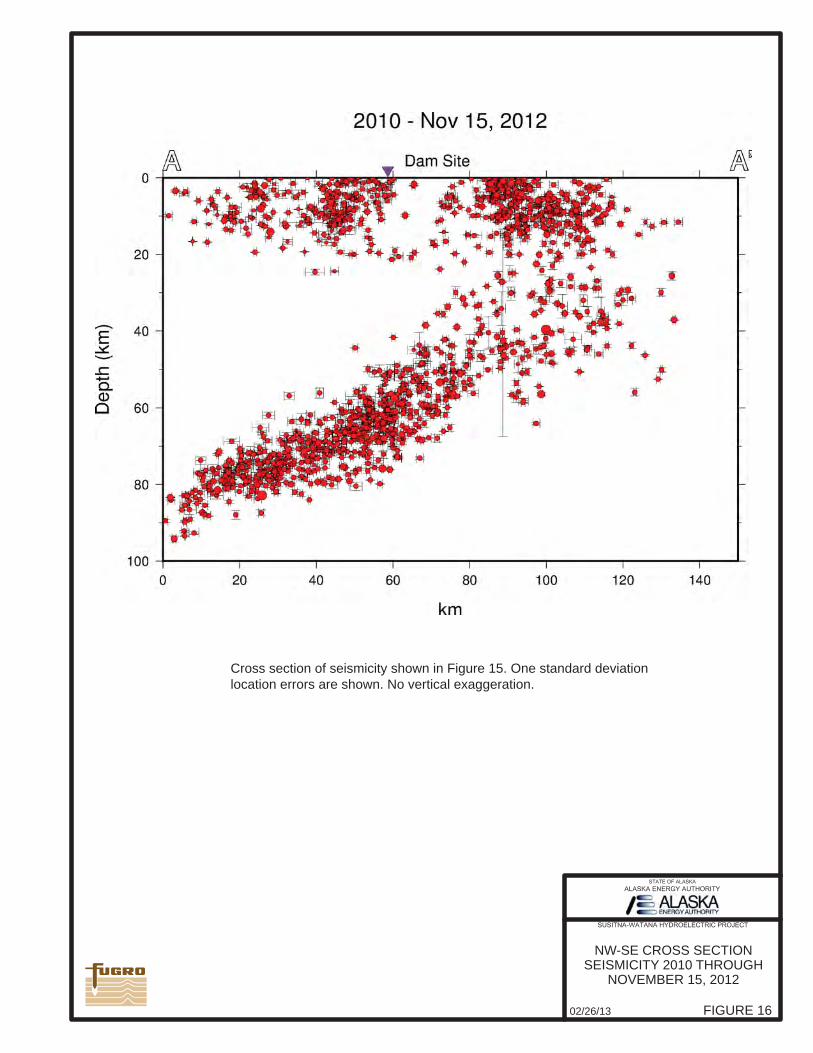
FIGURE 1602/26/13
NW-SE CROSS SECTIONSEISMICITY 2010 THROUGH
NOVEMBER 15, 2012
Cross section of seismicity shown in Figure 15. One standard deviation location errors are shown. No vertical exaggeration.
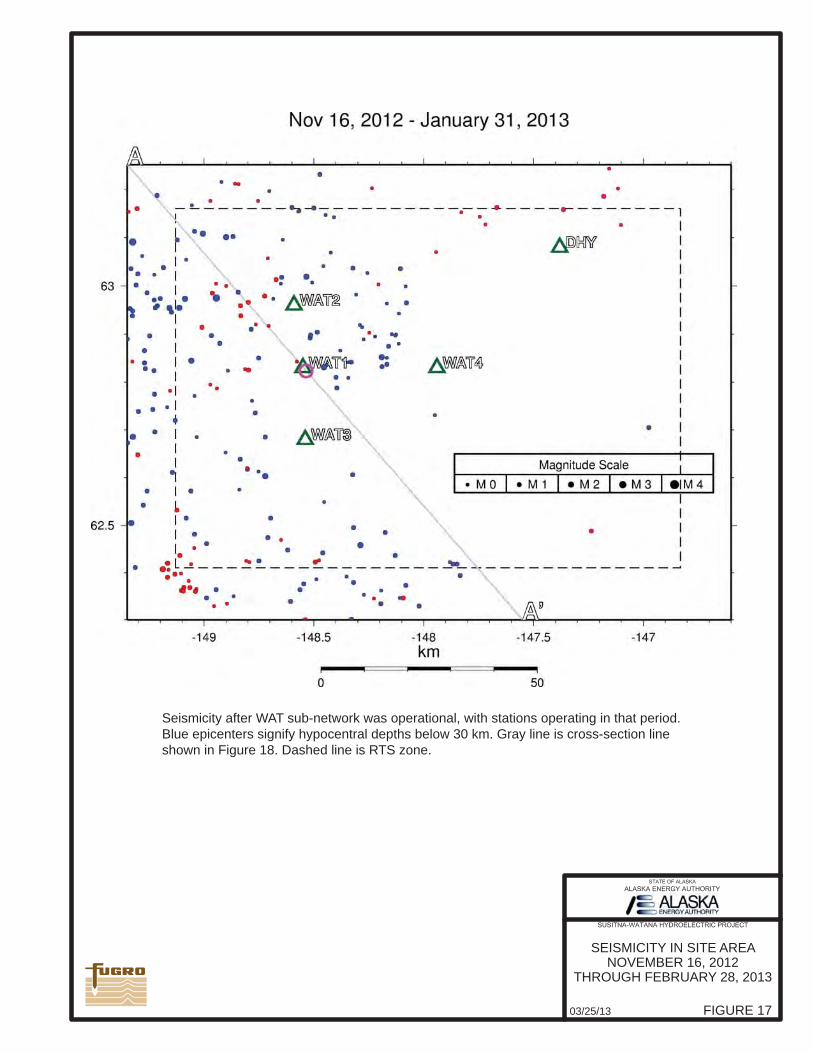
FIGURE 1703/25/13
SEISMICITY IN SITE AREA NOVEMBER 16, 2012
THROUGH FEBRUARY 28, 2013
Seismicity after WAT sub-network was operational, with stations operating in that period. Blue epicenters signify hypocentral depths below 30 km. Gray line is cross-section line shown in Figure 18. Dashed line is RTS zone.
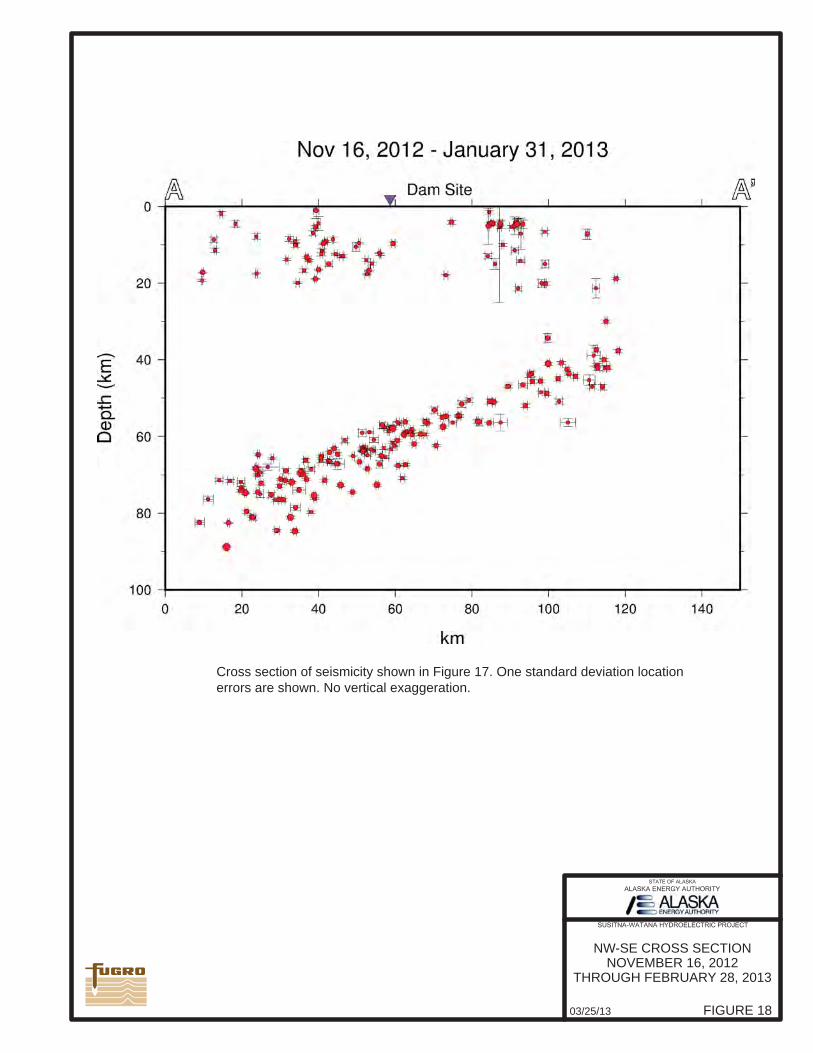
FIGURE 1803/25/13
Cross section of seismicity shown in Figure 17. One standard deviation location errors are shown. No vertical exaggeration.
NW-SE CROSS SECTION NOVEMBER 16, 2012
THROUGH FEBRUARY 28, 2013
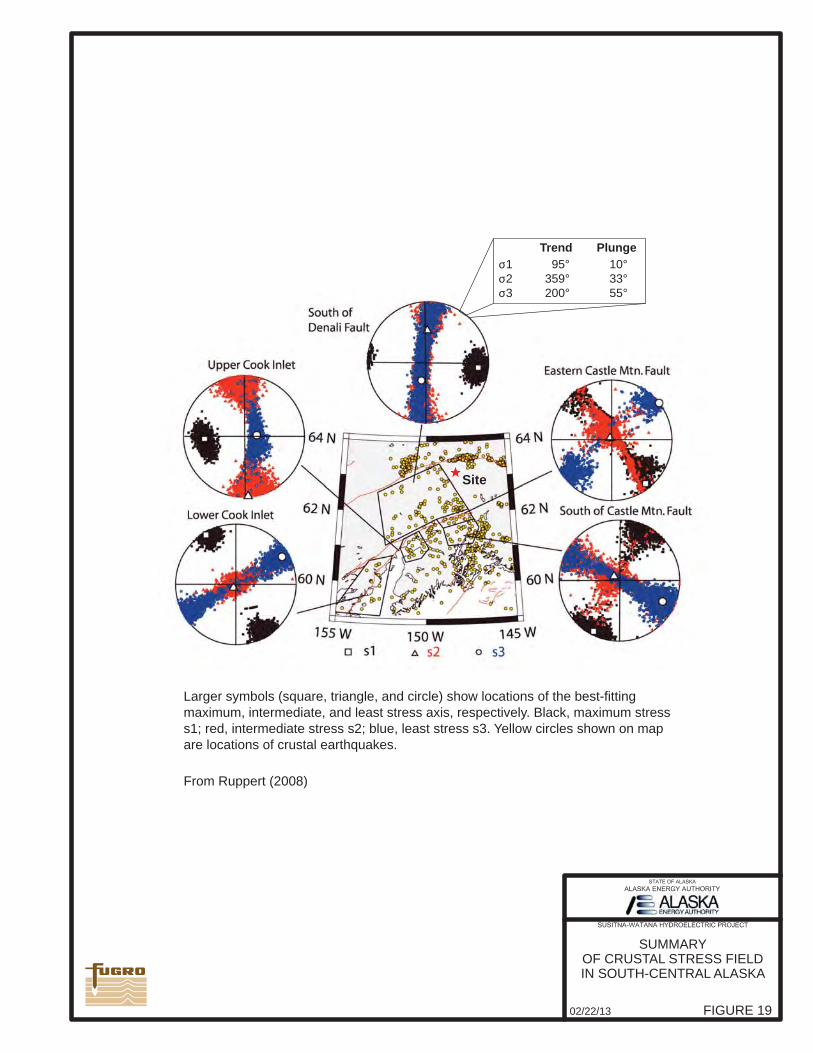
Trend Plunge95°
359°200°
σ1σ2σ3
10°33°55°
Larger symbols (square, triangle, and circle) show locations of the best-fitting maximum, intermediate, and least stress axis, respectively. Black, maximum stress s1; red, intermediate stress s2; blue, least stress s3. Yellow circles shown on map are locations of crustal earthquakes.
From Ruppert (2008)
Site
FIGURE 1902/22/13
SUMMARYOF CRUSTAL STRESS FIELDIN SOUTH-CENTRAL ALASKA
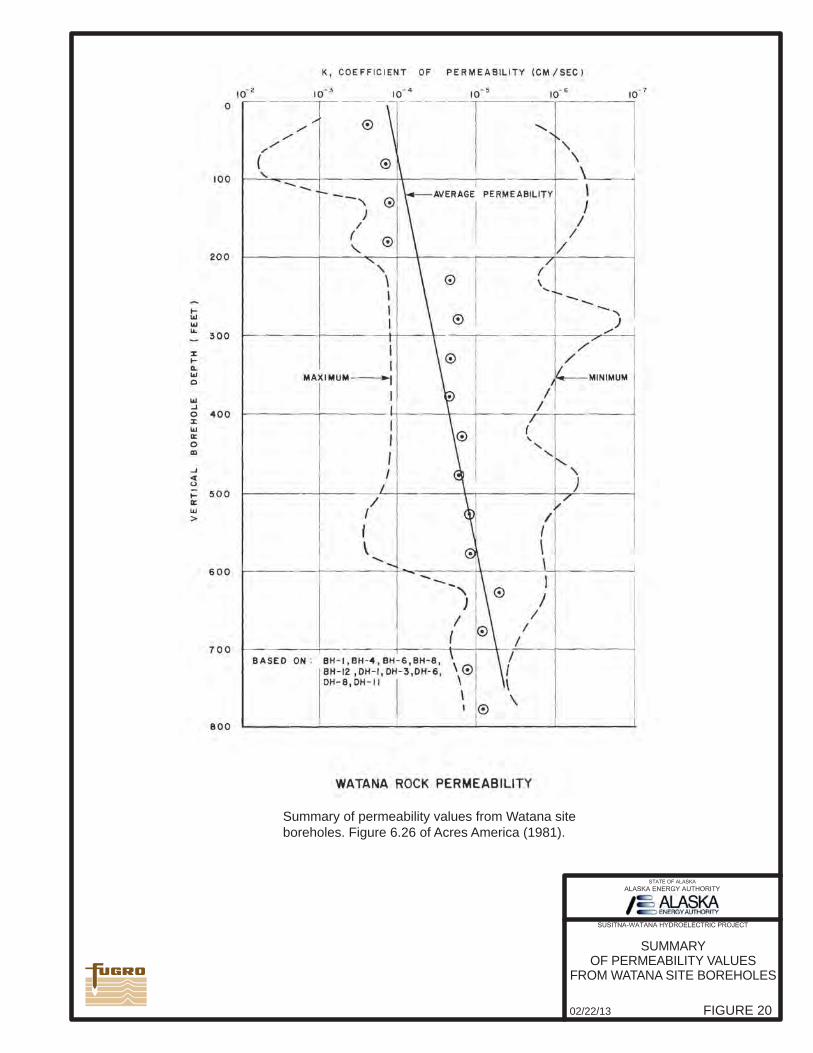
FIGURE 2002/22/13
SUMMARYOF PERMEABILITY VALUES
FROM WATANA SITE BOREHOLES
Summary of permeability values from Watana site boreholes. Figure 6.26 of Acres America (1981).
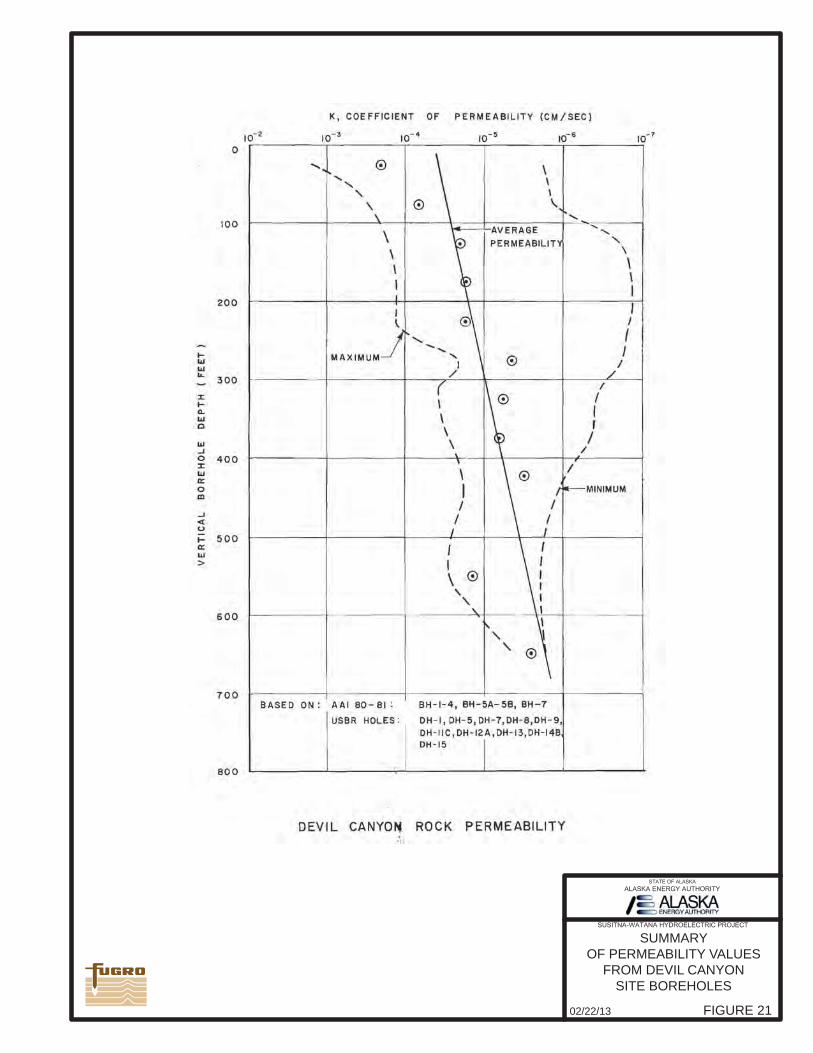
FIGURE 2102/22/13
SUMMARYOF PERMEABILITY VALUES
FROM DEVIL CANYONSITE BOREHOLES
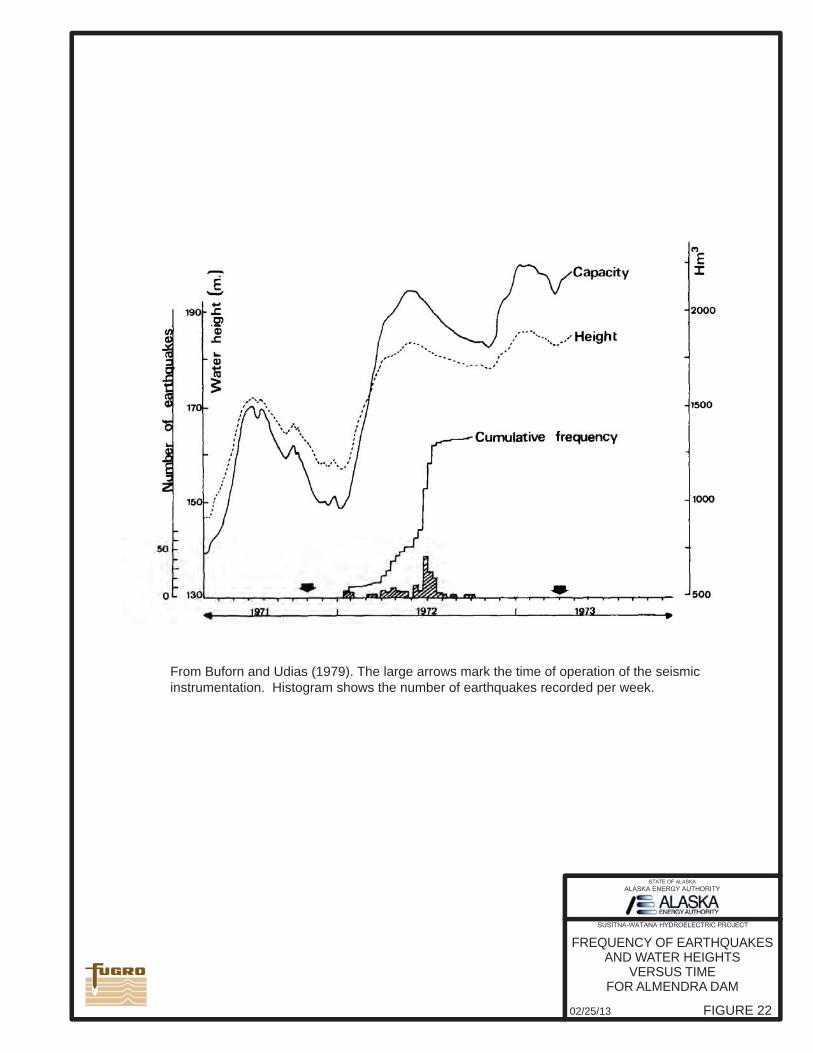
FIGURE 2202/25/13
FREQUENCY OF EARTHQUAKES AND WATER HEIGHTS
VERSUS TIMEFOR ALMENDRA DAM
From Buforn and Udias (1979). The large arrows mark the time of operation of the seismic instrumentation. Histogram shows the number of earthquakes recorded per week.

ALASKA ENERGY AUTHORITY AEA11-022 TM-11-0010-030113
Appendix A
03/29/13
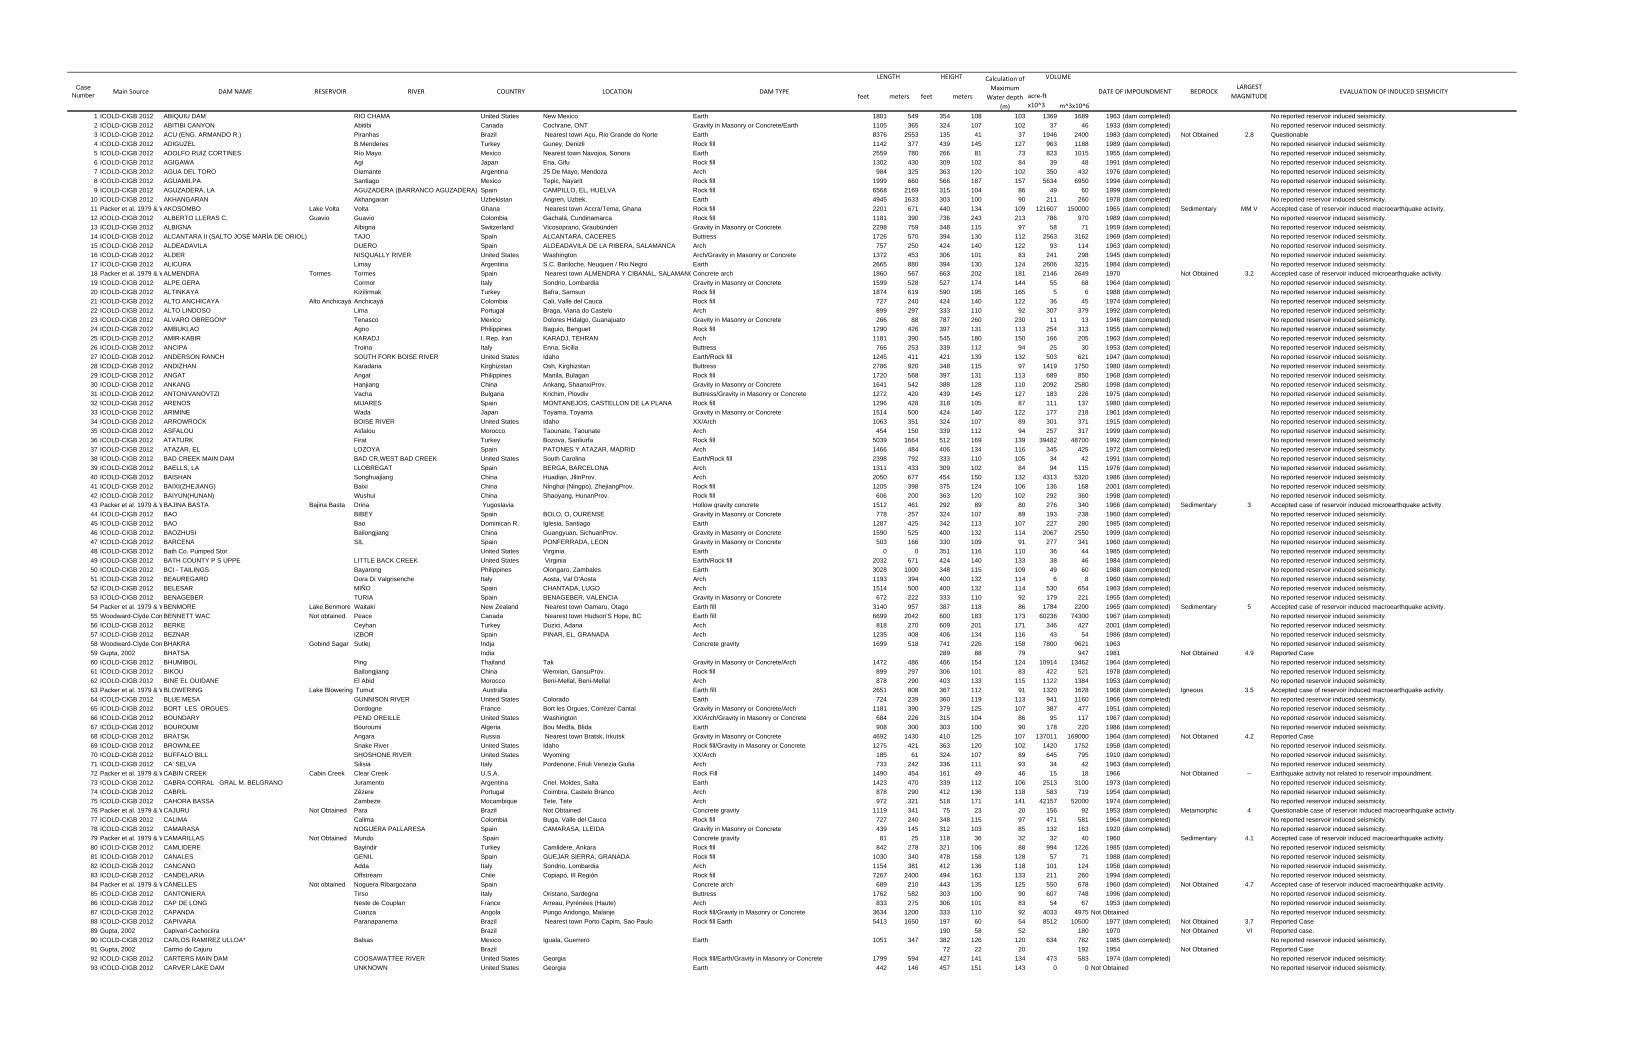
feet meters feet meters acre‐ft x10^3 m^3x10^6
1 ICOLD-CIGB 2012 ABIQUIU DAM RIO CHAMA United States New Mexico Earth 1801 549 354 108 103 1369 1689 1963 (dam completed) No reported reservoir induced seismicity.2 ICOLD-CIGB 2012 ABITIBI CANYON Abitibi Canada Cochrane, ONT Gravity in Masonry or Concrete/Earth 1105 365 324 107 102 37 46 1933 (dam completed) No reported reservoir induced seismicity.3 ICOLD-CIGB 2012 ACU (ENG. ARMANDO R.) Piranhas Brazil Nearest town Açu, Rio Grande do Norte Earth 8376 2553 135 41 37 1946 2400 1983 (dam completed) Not Obtained 2.8 Questionable4 ICOLD-CIGB 2012 ADIGUZEL B.Menderes Turkey Guney, Denizli Rock fill 1142 377 439 145 127 963 1188 1989 (dam completed) No reported reservoir induced seismicity.5 ICOLD-CIGB 2012 ADOLFO RUIZ CORTINES Río Mayo Mexico Nearest town Navojoa, Sonora Earth 2559 780 266 81 73 823 1015 1955 (dam completed) No reported reservoir induced seismicity.6 ICOLD-CIGB 2012 AGIGAWA Agi Japan Ena, Gifu Rock fill 1302 430 309 102 84 39 48 1991 (dam completed) No reported reservoir induced seismicity.7 ICOLD-CIGB 2012 AGUA DEL TORO Diamante Argentina 25 De Mayo, Mendoza Arch 984 325 363 120 102 350 432 1976 (dam completed) No reported reservoir induced seismicity.8 ICOLD-CIGB 2012 AGUAMILPA Santiago Mexico Tepic, Nayarit Rock fill 1999 660 566 187 157 5634 6950 1994 (dam completed) No reported reservoir induced seismicity.9 ICOLD-CIGB 2012 AGUZADERA, LA AGUZADERA (BARRANCO AGUZADERA) Spain CAMPILLO, EL, HUELVA Rock fill 6568 2169 315 104 86 49 60 1999 (dam completed) No reported reservoir induced seismicity.
10 ICOLD-CIGB 2012 AKHANGARAN Akhangaran Uzbekistan Angren, Uzbek. Earth 4945 1633 303 100 90 211 260 1978 (dam completed) No reported reservoir induced seismicity.11 Packer et al. 1979 & WAKOSOMBO Lake Volta Volta Ghana Nearest town Accra/Tema, Ghana Rock fill 2201 671 440 134 109 121607 150000 1965 (dam completed) Sedimentary MM V Accepted case of reservoir induced macroearthquake activity.12 ICOLD-CIGB 2012 ALBERTO LLERAS C. Guavio Guavio Colombia Gachalá, Cundinamarca Rock fill 1181 390 736 243 213 786 970 1989 (dam completed) No reported reservoir induced seismicity.13 ICOLD-CIGB 2012 ALBIGNA Albigna Switzerland Vicosoprano, Graubünden Gravity in Masonry or Concrete 2298 759 348 115 97 58 71 1959 (dam completed) No reported reservoir induced seismicity.14 ICOLD-CIGB 2012 ALCANTARA II (SALTO JOSÉ MARÍA DE ORIOL) TAJO Spain ALCANTARA, CACERES Buttress 1726 570 394 130 112 2563 3162 1969 (dam completed) No reported reservoir induced seismicity.15 ICOLD-CIGB 2012 ALDEADAVILA DUERO Spain ALDEADAVILA DE LA RIBERA, SALAMANCA Arch 757 250 424 140 122 93 114 1963 (dam completed) No reported reservoir induced seismicity.16 ICOLD-CIGB 2012 ALDER NISQUALLY RIVER United States Washington Arch/Gravity in Masonry or Concrete 1372 453 306 101 83 241 298 1945 (dam completed) No reported reservoir induced seismicity.17 ICOLD-CIGB 2012 ALICURA Limay Argentina S.C. Bariloche, Neuquen / Rio Negro Earth 2665 880 394 130 124 2606 3215 1984 (dam completed) No reported reservoir induced seismicity.18 Packer et al. 1979 & WALMENDRA Tormes Tormes Spain Nearest town ALMENDRA Y CIBANAL, SALAMANCConcrete arch 1860 567 663 202 181 2146 2649 1970 Not Obtained 3.2 Accepted case of reservoir induced microearthquake activity. 19 ICOLD-CIGB 2012 ALPE GERA Cormor Italy Sondrio, Lombardia Gravity in Masonry or Concrete 1599 528 527 174 144 55 68 1964 (dam completed) No reported reservoir induced seismicity.20 ICOLD-CIGB 2012 ALTINKAYA Kizilirmak Turkey Bafra, Samsun Rock fill 1874 619 590 195 165 5 6 1988 (dam completed) No reported reservoir induced seismicity.21 ICOLD-CIGB 2012 ALTO ANCHICAYA Alto Anchicayá Anchicayá Colombia Cali, Valle del Cauca Rock fill 727 240 424 140 122 36 45 1974 (dam completed) No reported reservoir induced seismicity.22 ICOLD-CIGB 2012 ALTO LINDOSO Lima Portugal Braga, Viana do Castelo Arch 899 297 333 110 92 307 379 1992 (dam completed) No reported reservoir induced seismicity.23 ICOLD-CIGB 2012 ALVARO OBREGON* Tenasco Mexico Dolores Hidalgo, Guanajuato Gravity in Masonry or Concrete 266 88 787 260 230 11 13 1946 (dam completed) No reported reservoir induced seismicity.24 ICOLD-CIGB 2012 AMBUKLAO Agno Philippines Baguio, Benguet Rock fill 1290 426 397 131 113 254 313 1955 (dam completed) No reported reservoir induced seismicity.25 ICOLD-CIGB 2012 AMIR-KABIR KARADJ I. Rep. Iran KARADJ, TEHRAN Arch 1181 390 545 180 150 166 205 1963 (dam completed) No reported reservoir induced seismicity.26 ICOLD-CIGB 2012 ANCIPA Troina Italy Enna, Sicilia Buttress 766 253 339 112 94 25 30 1953 (dam completed) No reported reservoir induced seismicity.27 ICOLD-CIGB 2012 ANDERSON RANCH SOUTH FORK BOISE RIVER United States Idaho Earth/Rock fill 1245 411 421 139 132 503 621 1947 (dam completed) No reported reservoir induced seismicity.28 ICOLD-CIGB 2012 ANDIZHAN Karadaria Kirghizstan Osh, Kirghizstan Buttress 2786 920 348 115 97 1419 1750 1980 (dam completed) No reported reservoir induced seismicity.29 ICOLD-CIGB 2012 ANGAT Angat Philippines Manila, Bulagan Rock fill 1720 568 397 131 113 689 850 1968 (dam completed) No reported reservoir induced seismicity.30 ICOLD-CIGB 2012 ANKANG Hanjiang China Ankang, ShaanxiProv. Gravity in Masonry or Concrete 1641 542 388 128 110 2092 2580 1998 (dam completed) No reported reservoir induced seismicity.31 ICOLD-CIGB 2012 ANTONIVANOVTZI Vacha Bulgaria Krichim, Plovdiv Buttress/Gravity in Masonry or Concrete 1272 420 439 145 127 183 226 1975 (dam completed) No reported reservoir induced seismicity.32 ICOLD-CIGB 2012 ARENOS MIJARES Spain MONTANEJOS, CASTELLON DE LA PLANA Rock fill 1296 428 318 105 87 111 137 1980 (dam completed) No reported reservoir induced seismicity.33 ICOLD-CIGB 2012 ARIMINE Wada Japan Toyama, Toyama Gravity in Masonry or Concrete 1514 500 424 140 122 177 218 1961 (dam completed) No reported reservoir induced seismicity.34 ICOLD-CIGB 2012 ARROWROCK BOISE RIVER United States Idaho XX/Arch 1063 351 324 107 89 301 371 1915 (dam completed) No reported reservoir induced seismicity.35 ICOLD-CIGB 2012 ASFALOU Asfalou Morocco Taounate, Taounate Arch 454 150 339 112 94 257 317 1999 (dam completed) No reported reservoir induced seismicity.36 ICOLD-CIGB 2012 ATATURK Firat Turkey Bozova, Sanliurfa Rock fill 5039 1664 512 169 139 39482 48700 1992 (dam completed) No reported reservoir induced seismicity.37 ICOLD-CIGB 2012 ATAZAR, EL LOZOYA Spain PATONES Y ATAZAR, MADRID Arch 1466 484 406 134 116 345 425 1972 (dam completed) No reported reservoir induced seismicity.38 ICOLD-CIGB 2012 BAD CREEK MAIN DAM BAD CR,WEST BAD CREEK United States South Carolina Earth/Rock fill 2398 792 333 110 105 34 42 1991 (dam completed) No reported reservoir induced seismicity.39 ICOLD-CIGB 2012 BAELLS, LA LLOBREGAT Spain BERGA, BARCELONA Arch 1311 433 309 102 84 94 115 1976 (dam completed) No reported reservoir induced seismicity.40 ICOLD-CIGB 2012 BAISHAN Songhuajiang China Huadian, JilinProv. Arch 2050 677 454 150 132 4313 5320 1986 (dam completed) No reported reservoir induced seismicity.41 ICOLD-CIGB 2012 BAIXI(ZHEJIANG) Baixi China Ninghai (Ningpo), ZhejiangProv. Rock fill 1205 398 375 124 106 136 168 2001 (dam completed) No reported reservoir induced seismicity.42 ICOLD-CIGB 2012 BAIYUN(HUNAN) Wushui China Shaoyang, HunanProv. Rock fill 606 200 363 120 102 292 360 1998 (dam completed) No reported reservoir induced seismicity.43 Packer et al. 1979 & WBAJINA BASTA Bajina Basta Drina Yugoslavia Hollow qravity concrete 1512 461 292 89 80 276 340 1966 (dam completed) Sedimentary 3 Accepted case of reservoir induced microearthquake activity. 44 ICOLD-CIGB 2012 BAO BIBEY Spain BOLO, O, OURENSE Gravity in Masonry or Concrete 778 257 324 107 89 193 238 1960 (dam completed) No reported reservoir induced seismicity.45 ICOLD-CIGB 2012 BAO Bao Dominican R. Iglesia, Santiago Earth 1287 425 342 113 107 227 280 1985 (dam completed) No reported reservoir induced seismicity.46 ICOLD-CIGB 2012 BAOZHUSI Bailongjiang China Guangyuan, SichuanProv. Gravity in Masonry or Concrete 1590 525 400 132 114 2067 2550 1999 (dam completed) No reported reservoir induced seismicity.47 ICOLD-CIGB 2012 BARCENA SIL Spain PONFERRADA, LEON Gravity in Masonry or Concrete 503 166 330 109 91 277 341 1960 (dam completed) No reported reservoir induced seismicity.48 ICOLD-CIGB 2012 Bath Co. Pumped Stor United States Virginia Earth 0 0 351 116 110 36 44 1985 (dam completed) No reported reservoir induced seismicity.49 ICOLD-CIGB 2012 BATH COUNTY P S UPPE LITTLE BACK CREEK United States Virginia Earth/Rock fill 2032 671 424 140 133 38 46 1984 (dam completed) No reported reservoir induced seismicity.50 ICOLD-CIGB 2012 BCI - TAILINGS Bayarong Philippines Olongaro, Zambales Earth 3028 1000 348 115 109 49 60 1988 (dam completed) No reported reservoir induced seismicity.51 ICOLD-CIGB 2012 BEAUREGARD Dora Di Valgrisenche Italy Aosta, Val D'Aosta Arch 1193 394 400 132 114 6 8 1960 (dam completed) No reported reservoir induced seismicity.52 ICOLD-CIGB 2012 BELESAR MIÑO Spain CHANTADA, LUGO Arch 1514 500 400 132 114 530 654 1963 (dam completed) No reported reservoir induced seismicity.53 ICOLD-CIGB 2012 BENAGEBER TURIA Spain BENAGEBER, VALENCIA Gravity in Masonry or Concrete 672 222 333 110 92 179 221 1955 (dam completed) No reported reservoir induced seismicity.54 Packer et al. 1979 & WBENMORE Lake Benmore Waitaki New Zealand Nearest town Oamaru, Otago Earth fill 3140 957 387 118 86 1784 2200 1965 (dam completed) Sedimentary 5 Accepted case of reservoir induced macroearthquake activity.55 Woodward-Clyde Con BENNETT WAC Not obtained. Peace Canada Nearest town Hudson'S Hope, BC Earth fill 6699 2042 600 183 173 60236 74300 1967 (dam completed) No reported reservoir induced seismicity.56 ICOLD-CIGB 2012 BERKE Ceyhan Turkey Duzici, Adana Arch 818 270 609 201 171 346 427 2001 (dam completed) No reported reservoir induced seismicity.57 ICOLD-CIGB 2012 BEZNAR IZBOR Spain PINAR, EL, GRANADA Arch 1235 408 406 134 116 43 54 1986 (dam completed) No reported reservoir induced seismicity.58 Woodward-Clyde Con BHAKRA Gobind Sagar Sutlej Indja Concrete gravity 1699 518 741 226 158 7800 9621 1963 No reported reservoir induced seismicity.59 Gupta, 2002 BHATSA India 289 88 79 947 1981 Not Obtained 4.9 Reported Case60 ICOLD-CIGB 2012 BHUMIBOL Ping Thailand Tak Gravity in Masonry or Concrete/Arch 1472 486 466 154 124 10914 13462 1964 (dam completed) No reported reservoir induced seismicity.61 ICOLD-CIGB 2012 BIKOU Bailongjiang China Wenxian, GansuProv. Rock fill 899 297 306 101 83 422 521 1978 (dam completed) No reported reservoir induced seismicity.62 ICOLD-CIGB 2012 BINE EL OUIDANE El Abid Morocco Beni-Mellal, Beni-Mellal Arch 878 290 403 133 115 1122 1384 1953 (dam completed) No reported reservoir induced seismicity.63 Packer et al. 1979 & WBLOWERING Lake Blowering Tumut Australia Earth fill 2651 808 367 112 91 1320 1628 1968 (dam completed) Igneous 3.5 Accepted case of reservoir induced macroearthquake activity.64 ICOLD-CIGB 2012 BLUE MESA GUNNISON RIVER United States Colorado Earth 724 239 360 119 113 941 1160 1966 (dam completed) No reported reservoir induced seismicity.65 ICOLD-CIGB 2012 BORT LES ORGUES Dordogne France Bort les Orgues, Corrèze/ Cantal Gravity in Masonry or Concrete/Arch 1181 390 379 125 107 387 477 1951 (dam completed) No reported reservoir induced seismicity.66 ICOLD-CIGB 2012 BOUNDARY PEND OREILLE United States Washington XX/Arch/Gravity in Masonry or Concrete 684 226 315 104 86 95 117 1967 (dam completed) No reported reservoir induced seismicity.67 ICOLD-CIGB 2012 BOUROUMI Bouroumi Algeria Bou Medfa, Blida Earth 908 300 303 100 90 178 220 1986 (dam completed) No reported reservoir induced seismicity.68 ICOLD-CIGB 2012 BRATSK Angara Russia Nearest town Bratsk, Irkutsk Gravity in Masonry or Concrete 4692 1430 410 125 107 137011 169000 1964 (dam completed) Not Obtained 4.2 Reported Case69 ICOLD-CIGB 2012 BROWNLEE Snake River United States Idaho Rock fill/Gravity in Masonry or Concrete 1275 421 363 120 102 1420 1752 1958 (dam completed) No reported reservoir induced seismicity.70 ICOLD-CIGB 2012 BUFFALO BILL SHOSHONE RIVER United States Wyoming XX/Arch 185 61 324 107 89 645 795 1910 (dam completed) No reported reservoir induced seismicity.71 ICOLD-CIGB 2012 CA' SELVA Silisia Italy Pordenone, Friuli Venezia Giulia Arch 733 242 336 111 93 34 42 1963 (dam completed) No reported reservoir induced seismicity.72 Packer et al. 1979 & WCABIN CREEK Cabin Creek Clear Creek U.S.A. Rock Fill 1490 454 161 49 46 15 18 1966 Not Obtained -- Earthquake activity not related to reservoir impoundment.73 ICOLD-CIGB 2012 CABRA CORRAL GRAL M. BELGRANO Juramento Argentina Cnel. Moldes, Salta Earth 1423 470 339 112 106 2513 3100 1973 (dam completed) No reported reservoir induced seismicity.74 ICOLD-CIGB 2012 CABRIL Zêzere Portugal Coimbra, Castelo Branco Arch 878 290 412 136 118 583 719 1954 (dam completed) No reported reservoir induced seismicity.75 ICOLD-CIGB 2012 CAHORA BASSA Zambeze Mocambique Tete, Tete Arch 972 321 518 171 141 42157 52000 1974 (dam completed) No reported reservoir induced seismicity.76 Packer et al. 1979 & WCAJURU Not Obtained Para Brazil Not Obtained Concrete gravity 1119 341 75 23 20 156 92 1953 (dam completed) Metamorphic 4 Questionable case of reservoir induced macroearthquake activity.77 ICOLD-CIGB 2012 CALIMA Calima Colombia Buga, Valle del Cauca Rock fill 727 240 348 115 97 471 581 1964 (dam completed) No reported reservoir induced seismicity.78 ICOLD-CIGB 2012 CAMARASA NOGUERA PALLARESA Spain CAMARASA, LLEIDA Gravity in Masonry or Concrete 439 145 312 103 85 132 163 1920 (dam completed) No reported reservoir induced seismicity.79 Packer et al. 1979 & WCAMARILLAS Not Obtained Mundo Spain Concrete gravity 81 25 118 36 32 32 40 1960 Sedimentary 4.1 Accepted case of reservoir induced macroearthquake activity.80 ICOLD-CIGB 2012 CAMLIDERE Bayindir Turkey Camlidere, Ankara Rock fill 842 278 321 106 88 994 1226 1985 (dam completed) No reported reservoir induced seismicity.81 ICOLD-CIGB 2012 CANALES GENIL Spain GUEJAR SIERRA, GRANADA Rock fill 1030 340 478 158 128 57 71 1988 (dam completed) No reported reservoir induced seismicity.82 ICOLD-CIGB 2012 CANCANO Adda Italy Sondrio, Lombardia Arch 1154 381 412 136 118 101 124 1956 (dam completed) No reported reservoir induced seismicity.83 ICOLD-CIGB 2012 CANDELARIA Offstream Chile Copiapó, III Región Rock fill 7267 2400 494 163 133 211 260 1994 (dam completed) No reported reservoir induced seismicity.84 Packer et al. 1979 & WCANELLES Not obtained Noguera Ribargozana Spain Concrete arch 689 210 443 135 125 550 678 1960 (dam completed) Not Obtained 4.7 Accepted case of reservoir induced macroearthquake activity.85 ICOLD-CIGB 2012 CANTONIERA Tirso Italy Oristano, Sardegna Buttress 1762 582 303 100 90 607 748 1996 (dam completed) No reported reservoir induced seismicity.86 ICOLD-CIGB 2012 CAP DE LONG Neste de Couplan France Arreau, Pyrénées (Haute) Arch 833 275 306 101 83 54 67 1953 (dam completed) No reported reservoir induced seismicity.87 ICOLD-CIGB 2012 CAPANDA Cuanza Angola Pungo Andongo, Malanje Rock fill/Gravity in Masonry or Concrete 3634 1200 333 110 92 4033 4975 Not Obtained No reported reservoir induced seismicity.88 ICOLD-CIGB 2012 CAPIVARA Paranapanema Brazil Nearest town Porto Capim, Sao Paulo Rock fill Earth 5413 1650 197 60 54 8512 10500 1977 (dam completed) Not Obtained 3.7 Reported Case89 Gupta, 2002 Capivari-Cachociira Brazil 190 58 52 180 1970 Not Obtained VI Reported case.90 ICOLD-CIGB 2012 CARLOS RAMIREZ ULLOA* Balsas Mexico Iguala, Guerrero Earth 1051 347 382 126 120 634 782 1985 (dam completed) No reported reservoir induced seismicity.91 Gupta, 2002 Carmo do Cajuru Brazil 72 22 20 192 1954 Not Obtained Reported Case92 ICOLD-CIGB 2012 CARTERS MAIN DAM COOSAWATTEE RIVER United States Georgia Rock fill/Earth/Gravity in Masonry or Concrete 1799 594 427 141 134 473 583 1974 (dam completed) No reported reservoir induced seismicity.93 ICOLD-CIGB 2012 CARVER LAKE DAM UNKNOWN United States Georgia Earth 442 146 457 151 143 0 0 Not Obtained No reported reservoir induced seismicity.
BEDROCKLARGEST
MAGNITUDEEVALUATION OF INDUCED SEISMICITYCase
Number Main Source DAM NAME RESERVOIR RIVER
LENGTH HEIGHT Calculation of Maximum
Water depth (m)
DATE OF IMPOUNDMENTCOUNTRY LOCATION DAM TYPE
VOLUME
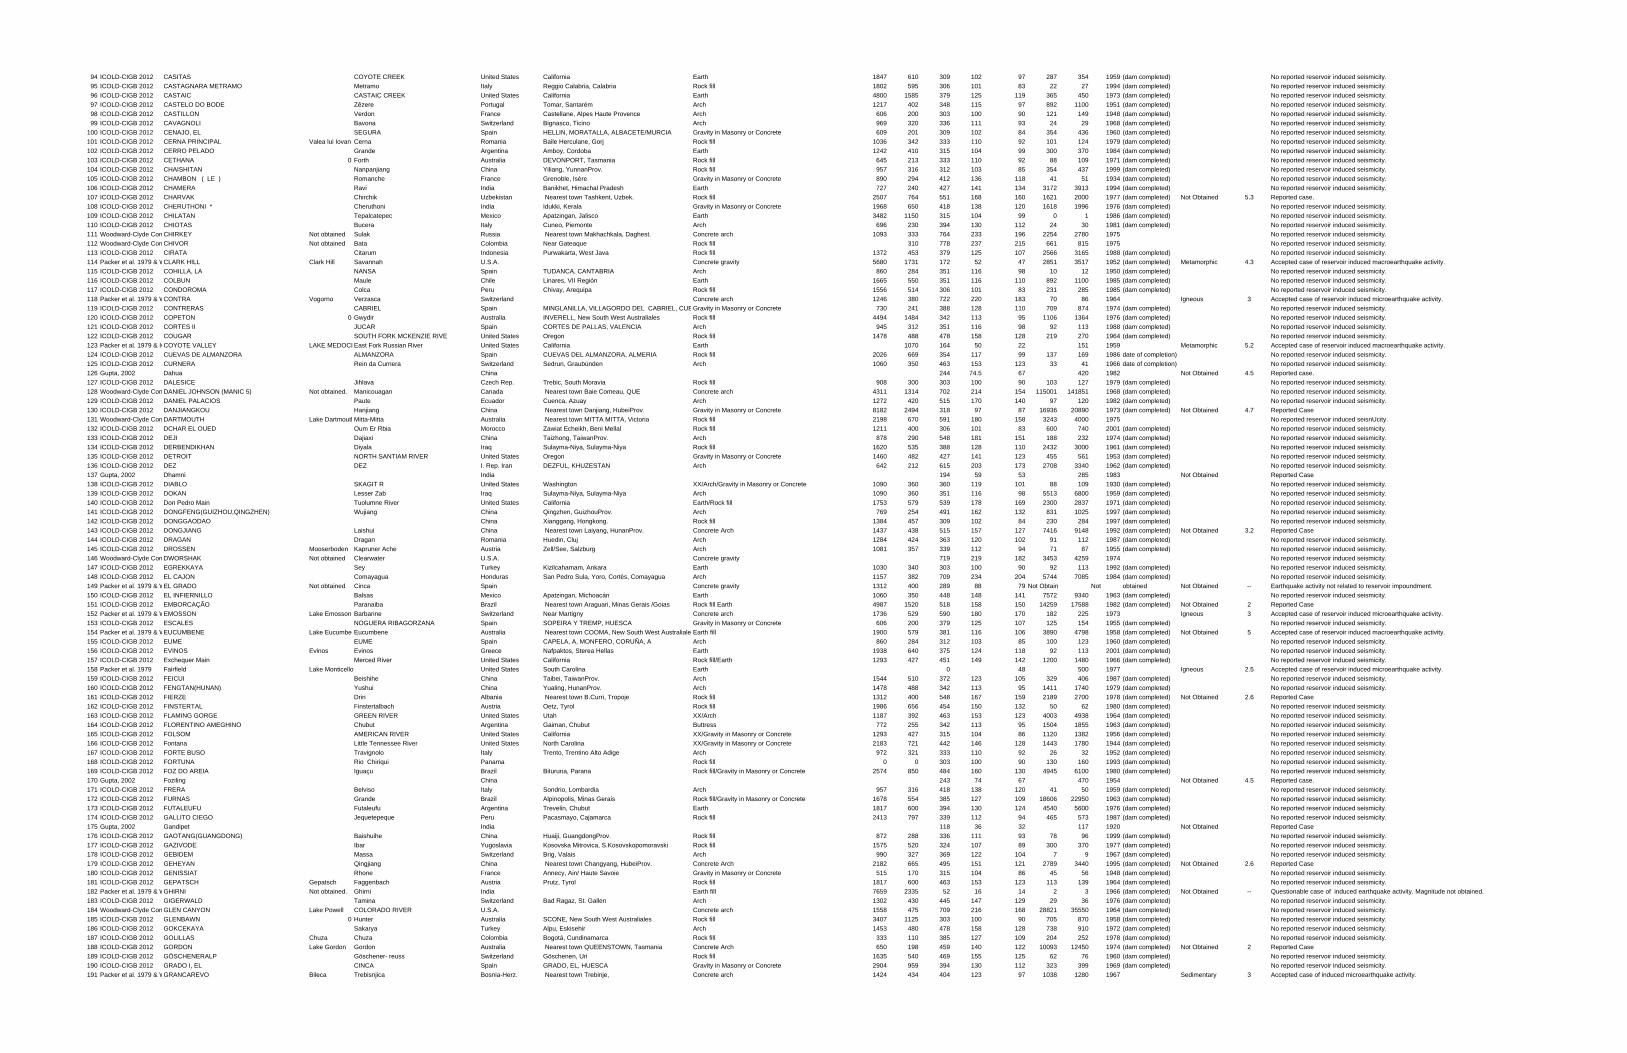
94 ICOLD-CIGB 2012 CASITAS COYOTE CREEK United States California Earth 1847 610 309 102 97 287 354 1959 (dam completed) No reported reservoir induced seismicity.95 ICOLD-CIGB 2012 CASTAGNARA METRAMO Metramo Italy Reggio Calabria, Calabria Rock fill 1802 595 306 101 83 22 27 1994 (dam completed) No reported reservoir induced seismicity.96 ICOLD-CIGB 2012 CASTAIC CASTAIC CREEK United States California Earth 4800 1585 379 125 119 365 450 1973 (dam completed) No reported reservoir induced seismicity.97 ICOLD-CIGB 2012 CASTELO DO BODE Zêzere Portugal Tomar, Santarém Arch 1217 402 348 115 97 892 1100 1951 (dam completed) No reported reservoir induced seismicity.98 ICOLD-CIGB 2012 CASTILLON Verdon France Castellane, Alpes Haute Provence Arch 606 200 303 100 90 121 149 1948 (dam completed) No reported reservoir induced seismicity.99 ICOLD-CIGB 2012 CAVAGNOLI Bavona Switzerland Bignasco, Ticino Arch 969 320 336 111 93 24 29 1968 (dam completed) No reported reservoir induced seismicity.
100 ICOLD-CIGB 2012 CENAJO, EL SEGURA Spain HELLIN, MORATALLA, ALBACETE/MURCIA Gravity in Masonry or Concrete 609 201 309 102 84 354 436 1960 (dam completed) No reported reservoir induced seismicity.101 ICOLD-CIGB 2012 CERNA PRINCIPAL Valea lui Iovan Cerna Romania Baile Herculane, Gorj Rock fill 1036 342 333 110 92 101 124 1979 (dam completed) No reported reservoir induced seismicity.102 ICOLD-CIGB 2012 CERRO PELADO Grande Argentina Amboy, Cordoba Earth 1242 410 315 104 99 300 370 1984 (dam completed) No reported reservoir induced seismicity.103 ICOLD-CIGB 2012 CETHANA 0 Forth Australia DEVONPORT, Tasmania Rock fill 645 213 333 110 92 88 109 1971 (dam completed) No reported reservoir induced seismicity.104 ICOLD-CIGB 2012 CHAISHITAN Nanpanjiang China Yiliang, YunnanProv. Rock fill 957 316 312 103 85 354 437 1999 (dam completed) No reported reservoir induced seismicity.105 ICOLD-CIGB 2012 CHAMBON ( LE ) Romanche France Grenoble, Isère Gravity in Masonry or Concrete 890 294 412 136 118 41 51 1934 (dam completed) No reported reservoir induced seismicity.106 ICOLD-CIGB 2012 CHAMERA Ravi India Banikhet, Himachal Pradesh Earth 727 240 427 141 134 3172 3913 1994 (dam completed) No reported reservoir induced seismicity.107 ICOLD-CIGB 2012 CHARVAK Chirchik Uzbekistan Nearest town Tashkent, Uzbek. Rock fill 2507 764 551 168 160 1621 2000 1977 (dam completed) Not Obtained 5.3 Reported case.108 ICOLD-CIGB 2012 CHERUTHONI * Cheruthoni India Idukki, Kerala Gravity in Masonry or Concrete 1968 650 418 138 120 1618 1996 1976 (dam completed) No reported reservoir induced seismicity.109 ICOLD-CIGB 2012 CHILATAN Tepalcatepec Mexico Apatzingan, Jalisco Earth 3482 1150 315 104 99 0 1 1986 (dam completed) No reported reservoir induced seismicity.110 ICOLD-CIGB 2012 CHIOTAS Bucera Italy Cuneo, Piemonte Arch 696 230 394 130 112 24 30 1981 (dam completed) No reported reservoir induced seismicity.111 Woodward-Clyde Con CHIRKEY Not obtained Sulak Russia Nearest town Makhachkala, Daghest. Concrete arch 1093 333 764 233 196 2254 2780 1975 No reported reservoir induced seismicity.112 Woodward-Clyde Con CHIVOR Not obtained Bata Colombia Near Gateaque Rock fill 310 778 237 215 661 815 1975 No reported reservoir induced seismicity.113 ICOLD-CIGB 2012 CIRATA Citarum Indonesia Purwakarta, West Java Rock fill 1372 453 379 125 107 2566 3165 1988 (dam completed) No reported reservoir induced seismicity.114 Packer et al. 1979 & WCLARK HILL Clark Hill Savannah U.S.A. Concrete gravity 5680 1731 172 52 47 2851 3517 1952 (dam completed) Metamorphic 4.3 Accepted case of reservoir induced macroearthquake activity.115 ICOLD-CIGB 2012 COHILLA, LA NANSA Spain TUDANCA, CANTABRIA Arch 860 284 351 116 98 10 12 1950 (dam completed) No reported reservoir induced seismicity.116 ICOLD-CIGB 2012 COLBUN Maule Chile Linares, VII Región Earth 1665 550 351 116 110 892 1100 1985 (dam completed) No reported reservoir induced seismicity.117 ICOLD-CIGB 2012 CONDOROMA Colca Peru Chivay, Arequipa Rock fill 1556 514 306 101 83 231 285 1985 (dam completed) No reported reservoir induced seismicity.118 Packer et al. 1979 & WCONTRA Vogorno Verzasca Switzerland Concrete arch 1246 380 722 220 183 70 86 1964 Igneous 3 Accepted case of reservoir induced microearthquake activity.119 ICOLD-CIGB 2012 CONTRERAS CABRIEL Spain MINGLANILLA, VILLAGORDO DEL CABRIEL, CUEGravity in Masonry or Concrete 730 241 388 128 110 709 874 1974 (dam completed) No reported reservoir induced seismicity.120 ICOLD-CIGB 2012 COPETON 0 Gwydir Australia INVERELL, New South West Australiales Rock fill 4494 1484 342 113 95 1106 1364 1976 (dam completed) No reported reservoir induced seismicity.121 ICOLD-CIGB 2012 CORTES II JUCAR Spain CORTES DE PALLAS, VALENCIA Arch 945 312 351 116 98 92 113 1988 (dam completed) No reported reservoir induced seismicity.122 ICOLD-CIGB 2012 COUGAR SOUTH FORK MCKENZIE RIVE United States Oregon Rock fill 1478 488 478 158 128 219 270 1964 (dam completed) No reported reservoir induced seismicity.123 Packer et al. 1979 & ICCOYOTE VALLEY LAKE MEDOCI East Fork Russian River United States California Earth 1070 164 50 22 151 1959 Metamorphic 5.2 Accepted case of reservoir induced macroearthquake activity.124 ICOLD-CIGB 2012 CUEVAS DE ALMANZORA ALMANZORA Spain CUEVAS DEL ALMANZORA, ALMERIA Rock fill 2026 669 354 117 99 137 169 1986 date of completion) No reported reservoir induced seismicity.125 ICOLD-CIGB 2012 CURNERA Rein da Curnera Switzerland Sedrun, Graubünden Arch 1060 350 463 153 123 33 41 1966 date of completion) No reported reservoir induced seismicity.126 Gupta, 2002 Dahua China 244 74.5 67 420 1982 Not Obtained 4.5 Reported case.127 ICOLD-CIGB 2012 DALESICE Jihlava Czech Rep. Trebic, South Moravia Rock fill 908 300 303 100 90 103 127 1979 (dam completed) No reported reservoir induced seismicity.128 Woodward-Clyde Con DANIEL JOHNSON (MANIC 5) Not obtained. Manicouagan Canada Nearest town Baie Comeau, QUE Concrete arch 4311 1314 702 214 154 115001 141851 1968 (dam completed) No reported reservoir induced seismicity.129 ICOLD-CIGB 2012 DANIEL PALACIOS Paute Ecuador Cuenca, Azuay Arch 1272 420 515 170 140 97 120 1982 (dam completed) No reported reservoir induced seismicity.130 ICOLD-CIGB 2012 DANJIANGKOU Hanjiang China Nearest town Danjiang, HubeiProv. Gravity in Masonry or Concrete 8182 2494 318 97 87 16936 20890 1973 (dam completed) Not Obtained 4.7 Reported Case131 Woodward-Clyde Con DARTMOUTH Lake DartmouthMitta-Mitta Australia Nearest town MITTA MITTA, Victoria Rock fill 2198 670 591 180 158 3243 4000 1975 No reported reservoir induced seisnUcity.132 ICOLD-CIGB 2012 DCHAR EL OUED Oum Er Rbia Morocco Zawiat Echeikh, Beni Mellal Rock fill 1211 400 306 101 83 600 740 2001 (dam completed) No reported reservoir induced seismicity.133 ICOLD-CIGB 2012 DEJI Dajiaxi China Taizhong, TaiwanProv. Arch 878 290 548 181 151 188 232 1974 (dam completed) No reported reservoir induced seismicity.134 ICOLD-CIGB 2012 DERBENDIKHAN Diyala Iraq Sulayma-Niya, Sulayma-Niya Rock fill 1620 535 388 128 110 2432 3000 1961 (dam completed) No reported reservoir induced seismicity.135 ICOLD-CIGB 2012 DETROIT NORTH SANTIAM RIVER United States Oregon Gravity in Masonry or Concrete 1460 482 427 141 123 455 561 1953 (dam completed) No reported reservoir induced seismicity.136 ICOLD-CIGB 2012 DEZ DEZ I. Rep. Iran DEZFUL, KHUZESTAN Arch 642 212 615 203 173 2708 3340 1962 (dam completed) No reported reservoir induced seismicity.137 Gupta, 2002 Dhamni India 194 59 53 285 1983 Not Obtained Reported Case138 ICOLD-CIGB 2012 DIABLO SKAGIT R United States Washington XX/Arch/Gravity in Masonry or Concrete 1090 360 360 119 101 88 109 1930 (dam completed) No reported reservoir induced seismicity.139 ICOLD-CIGB 2012 DOKAN Lesser Zab Iraq Sulayma-Niya, Sulayma-Niya Arch 1090 360 351 116 98 5513 6800 1959 (dam completed) No reported reservoir induced seismicity.140 ICOLD-CIGB 2012 Don Pedro Main Tuolumne River United States California Earth/Rock fill 1753 579 539 178 169 2300 2837 1971 (dam completed) No reported reservoir induced seismicity.141 ICOLD-CIGB 2012 DONGFENG(GUIZHOU,QINGZHEN) Wujiang China Qingzhen, GuizhouProv. Arch 769 254 491 162 132 831 1025 1997 (dam completed) No reported reservoir induced seismicity.142 ICOLD-CIGB 2012 DONGGAODAO China Xianggang, Hongkong. Rock fill 1384 457 309 102 84 230 284 1997 (dam completed) No reported reservoir induced seismicity.143 ICOLD-CIGB 2012 DONGJIANG Laishui China Nearest town Laiyang, HunanProv. Concrete Arch 1437 438 515 157 127 7416 9148 1992 (dam completed) Not Obtained 3.2 Reported Case144 ICOLD-CIGB 2012 DRAGAN Dragan Romania Huedin, Cluj Arch 1284 424 363 120 102 91 112 1987 (dam completed) No reported reservoir induced seismicity.145 ICOLD-CIGB 2012 DROSSEN Mooserboden Kapruner Ache Austria Zell/See, Salzburg Arch 1081 357 339 112 94 71 87 1955 (dam completed) No reported reservoir induced seismicity.146 Woodward-Clyde Con DWORSHAK Not obtained Clearwater U.S.A. Concrete gravity 719 219 182 3453 4259 1974 No reported reservoir induced seismicity.147 ICOLD-CIGB 2012 EGREKKAYA Sey Turkey Kizilcahamam, Ankara Earth 1030 340 303 100 90 92 113 1992 (dam completed) No reported reservoir induced seismicity.148 ICOLD-CIGB 2012 EL CAJON Comayagua Honduras San Pedro Sula, Yoro, Cortès, Comayagua Arch 1157 382 709 234 204 5744 7085 1984 (dam completed) No reported reservoir induced seismicity.149 Packer et al. 1979 & WEL GRADO Not obtained Cinca Spain Concrete gravity 1312 400 289 88 79 Not Obtain Not obtained Not Obtained -- Earthquake activity not related to reservoir impoundment.150 ICOLD-CIGB 2012 EL INFIERNILLO Balsas Mexico Apatzingan, Michoacán Earth 1060 350 448 148 141 7572 9340 1963 (dam completed) No reported reservoir induced seismicity.151 ICOLD-CIGB 2012 EMBORCAÇÃO Paranaiba Brazil Nearest town Araguari, Minas Gerais /Goias Rock fill Earth 4987 1520 518 158 150 14259 17588 1982 (dam completed) Not Obtained 2 Reported Case152 Packer et al. 1979 & WEMOSSON Lake Emosson Barbarine Switzerland Near Martigny Concrete arch 1736 529 590 180 170 182 225 1973 Igneous 3 Accepted case of reservoir induced microearthquake activity.153 ICOLD-CIGB 2012 ESCALES NOGUERA RIBAGORZANA Spain SOPEIRA Y TREMP, HUESCA Gravity in Masonry or Concrete 606 200 379 125 107 125 154 1955 (dam completed) No reported reservoir induced seismicity.154 Packer et al. 1979 & WEUCUMBENE Lake EucumbenEucumbene Australia Nearest town COOMA, New South West AustralialesEarth fill 1900 579 381 116 106 3890 4798 1958 (dam completed) Not Obtained 5 Accepted case of reservoir induced macroearthquake activity.155 ICOLD-CIGB 2012 EUME EUME Spain CAPELA, A, MONFERO, CORUÑA, A Arch 860 284 312 103 85 100 123 1960 (dam completed) No reported reservoir induced seismicity.156 ICOLD-CIGB 2012 EVINOS Evinos Evinos Greece Nafpaktos, Sterea Hellas Earth 1938 640 375 124 118 92 113 2001 (dam completed) No reported reservoir induced seismicity.157 ICOLD-CIGB 2012 Exchequer Main Merced River United States California Rock fill/Earth 1293 427 451 149 142 1200 1480 1966 (dam completed) No reported reservoir induced seismicity.158 Packer et al. 1979 Fairfield Lake Monticello United States South Carolina Earth 0 48 500 1977 Igneous 2.5 Accepted case of reservoir induced microearthquake activity.159 ICOLD-CIGB 2012 FEICUI Beishihe China Taibei, TaiwanProv. Arch 1544 510 372 123 105 329 406 1987 (dam completed) No reported reservoir induced seismicity.160 ICOLD-CIGB 2012 FENGTAN(HUNAN) Yushui China Yualing, HunanProv. Arch 1478 488 342 113 95 1411 1740 1979 (dam completed) No reported reservoir induced seismicity.161 ICOLD-CIGB 2012 FIERZE Drin Albania Nearest town B.Curri, Tropoje Rock fill 1312 400 548 167 159 2189 2700 1978 (dam completed) Not Obtained 2.6 Reported Case162 ICOLD-CIGB 2012 FINSTERTAL Finstertalbach Austria Oetz, Tyrol Rock fill 1986 656 454 150 132 50 62 1980 (dam completed) No reported reservoir induced seismicity.163 ICOLD-CIGB 2012 FLAMING GORGE GREEN RIVER United States Utah XX/Arch 1187 392 463 153 123 4003 4938 1964 (dam completed) No reported reservoir induced seismicity.164 ICOLD-CIGB 2012 FLORENTINO AMEGHINO Chubut Argentina Gaiman, Chubut Buttress 772 255 342 113 95 1504 1855 1963 (dam completed) No reported reservoir induced seismicity.165 ICOLD-CIGB 2012 FOLSOM AMERICAN RIVER United States California XX/Gravity in Masonry or Concrete 1293 427 315 104 86 1120 1382 1956 (dam completed) No reported reservoir induced seismicity.166 ICOLD-CIGB 2012 Fontana Little Tennessee River United States North Carolina XX/Gravity in Masonry or Concrete 2183 721 442 146 128 1443 1780 1944 (dam completed) No reported reservoir induced seismicity.167 ICOLD-CIGB 2012 FORTE BUSO Travignolo Italy Trento, Trentino Alto Adige Arch 972 321 333 110 92 26 32 1952 (dam completed) No reported reservoir induced seismicity.168 ICOLD-CIGB 2012 FORTUNA Rio Chiriqui Panama Rock fill 0 0 303 100 90 130 160 1993 (dam completed) No reported reservoir induced seismicity.169 ICOLD-CIGB 2012 FOZ DO AREIA Iguaçu Brazil Bituruna, Parana Rock fill/Gravity in Masonry or Concrete 2574 850 484 160 130 4945 6100 1980 (dam completed) No reported reservoir induced seismicity.170 Gupta, 2002 Foziling China 243 74 67 470 1954 Not Obtained 4.5 Reported case.171 ICOLD-CIGB 2012 FRERA Belviso Italy Sondrio, Lombardia Arch 957 316 418 138 120 41 50 1959 (dam completed) No reported reservoir induced seismicity.172 ICOLD-CIGB 2012 FURNAS Grande Brazil Alpinopolis, Minas Gerais Rock fill/Gravity in Masonry or Concrete 1678 554 385 127 109 18606 22950 1963 (dam completed) No reported reservoir induced seismicity.173 ICOLD-CIGB 2012 FUTALEUFU Futaleufu Argentina Trevelin, Chubut Earth 1817 600 394 130 124 4540 5600 1976 (dam completed) No reported reservoir induced seismicity.174 ICOLD-CIGB 2012 GALLITO CIEGO Jequetepeque Peru Pacasmayo, Cajamarca Rock fill 2413 797 339 112 94 465 573 1987 (dam completed) No reported reservoir induced seismicity.175 Gupta, 2002 Gandipet India 118 36 32 117 1920 Not Obtained Reported Case176 ICOLD-CIGB 2012 GAOTANG(GUANGDONG) Baishuihe China Huaiji, GuangdongProv. Rock fill 872 288 336 111 93 78 96 1999 (dam completed) No reported reservoir induced seismicity.177 ICOLD-CIGB 2012 GAZIVODE Ibar Yugoslavia Kosovska Mitrovica, S.Kosovskopomoravski Rock fill 1575 520 324 107 89 300 370 1977 (dam completed) No reported reservoir induced seismicity.178 ICOLD-CIGB 2012 GEBIDEM Massa Switzerland Brig, Valais Arch 990 327 369 122 104 7 9 1967 (dam completed) No reported reservoir induced seismicity.179 ICOLD-CIGB 2012 GEHEYAN Qingjiang China Nearest town Changyang, HubeiProv. Concrete Arch 2182 665 495 151 121 2789 3440 1995 (dam completed) Not Obtained 2.6 Reported Case180 ICOLD-CIGB 2012 GENISSIAT Rhone France Annecy, Ain/ Haute Savoie Gravity in Masonry or Concrete 515 170 315 104 86 45 56 1948 (dam completed) No reported reservoir induced seismicity.181 ICOLD-CIGB 2012 GEPATSCH Gepatsch Faggenbach Austria Prutz, Tyrol Rock fill 1817 600 463 153 123 113 139 1964 (dam completed) No reported reservoir induced seismicity.182 Packer et al. 1979 & WGHIRNI Not obtained. Ghirni India Earth fill 7659 2335 52 16 14 2 3 1966 (dam completed) Not Obtained -- Questionable case of induced earthquake activity. Magnitude not obtained.183 ICOLD-CIGB 2012 GIGERWALD Tamina Switzerland Bad Ragaz, St. Gallen Arch 1302 430 445 147 129 29 36 1976 (dam completed) No reported reservoir induced seismicity.184 Woodward-Clyde Con GLEN CANYON Lake Powell COLORADO RIVER U.S.A. Concrete arch 1558 475 709 216 168 28821 35550 1964 (dam completed) No reported reservoir induced seismicity.185 ICOLD-CIGB 2012 GLENBAWN 0 Hunter Australia SCONE, New South West Australiales Rock fill 3407 1125 303 100 90 705 870 1958 (dam completed) No reported reservoir induced seismicity.186 ICOLD-CIGB 2012 GOKCEKAYA Sakarya Turkey Alpu, Eskisehir Arch 1453 480 478 158 128 738 910 1972 (dam completed) No reported reservoir induced seismicity.187 ICOLD-CIGB 2012 GOLILLAS Chuza Chuza Colombia Bogotá, Cundinamarca Rock fill 333 110 385 127 109 204 252 1978 (dam completed) No reported reservoir induced seismicity.188 ICOLD-CIGB 2012 GORDON Lake Gordon Gordon Australia Nearest town QUEENSTOWN, Tasmania Concrete Arch 650 198 459 140 122 10093 12450 1974 (dam completed) Not Obtained 2 Reported Case189 ICOLD-CIGB 2012 GÖSCHENERALP Göschener- reuss Switzerland Göschenen, Uri Rock fill 1635 540 469 155 125 62 76 1960 (dam completed) No reported reservoir induced seismicity.190 ICOLD-CIGB 2012 GRADO I, EL CINCA Spain GRADO, EL, HUESCA Gravity in Masonry or Concrete 2904 959 394 130 112 323 399 1969 (dam completed) No reported reservoir induced seismicity.191 Packer et al. 1979 & WGRANCAREVO Bileca Trebisnjica Bosnia-Herz. Nearest town Trebinje, Concrete arch 1424 434 404 123 97 1038 1280 1967 Sedimentary 3 Accepted case of induced microearthquake activity.
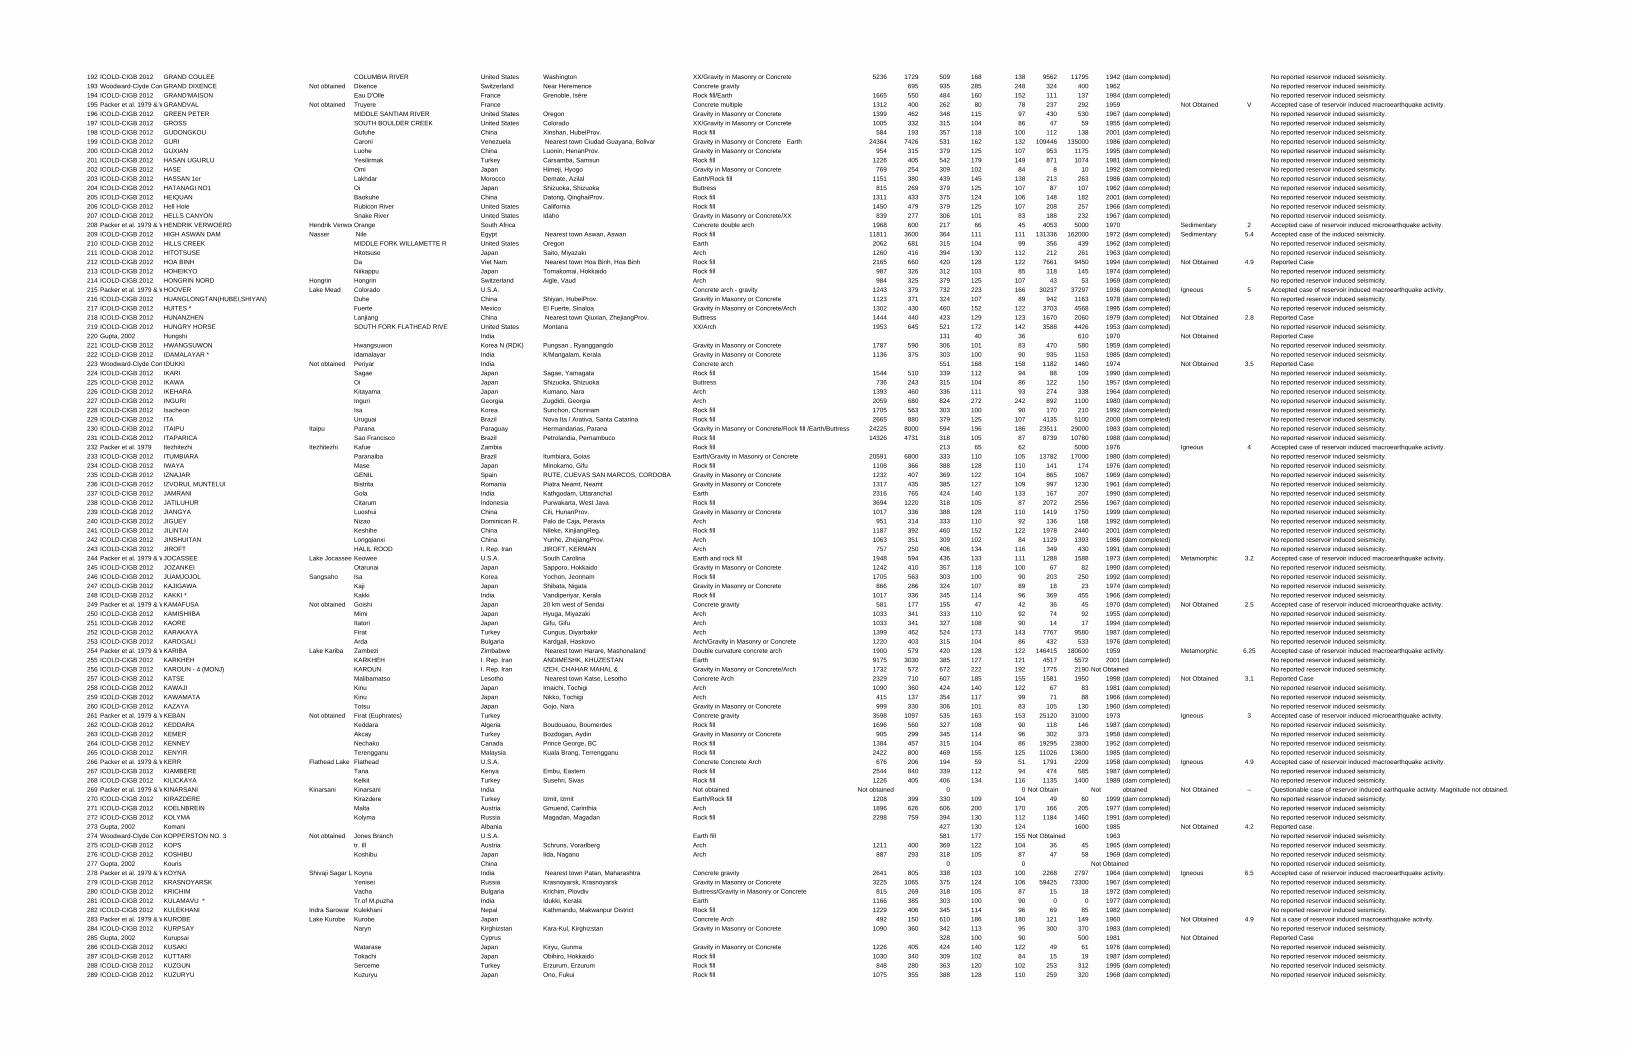
192 ICOLD-CIGB 2012 GRAND COULEE COLUMBIA RIVER United States Washington XX/Gravity in Masonry or Concrete 5236 1729 509 168 138 9562 11795 1942 (dam completed) No reported reservoir induced seismicity.193 Woodward-Clyde Con GRAND DIXENCE Not obtained Dixence Switzerland Near Heremence Concrete gravity 695 935 285 248 324 400 1962 No reported reservoir induced seismicity.194 ICOLD-CIGB 2012 GRAND'MAISON Eau D'Olle France Grenoble, Isère Rock fill/Earth 1665 550 484 160 152 111 137 1984 (dam completed) No reported reservoir induced seismicity.195 Packer et al. 1979 & WGRANDVAL Not obtained Truyere France Concrete multiple 1312 400 262 80 78 237 292 1959 Not Obtained V Accepted case of reservoir induced macroearthquake activity.196 ICOLD-CIGB 2012 GREEN PETER MIDDLE SANTIAM RIVER United States Oregon Gravity in Masonry or Concrete 1399 462 348 115 97 430 530 1967 (dam completed) No reported reservoir induced seismicity.197 ICOLD-CIGB 2012 GROSS SOUTH BOULDER CREEK United States Colorado XX/Gravity in Masonry or Concrete 1005 332 315 104 86 47 59 1955 (dam completed) No reported reservoir induced seismicity.198 ICOLD-CIGB 2012 GUDONGKOU Gufuhe China Xinshan, HubeiProv. Rock fill 584 193 357 118 100 112 138 2001 (dam completed) No reported reservoir induced seismicity.199 ICOLD-CIGB 2012 GURI Caroni Venezuela Nearest town Ciudad Guayana, Bolivar Gravity in Masonry or Concrete Earth 24364 7426 531 162 132 109446 135000 1986 (dam completed) No reported reservoir induced seismicity.200 ICOLD-CIGB 2012 GUXIAN Luohe China Luonin, HenanProv. Gravity in Masonry or Concrete 954 315 379 125 107 953 1175 1995 (dam completed) No reported reservoir induced seismicity.201 ICOLD-CIGB 2012 HASAN UGURLU Yesilirmak Turkey Carsamba, Samsun Rock fill 1226 405 542 179 149 871 1074 1981 (dam completed) No reported reservoir induced seismicity.202 ICOLD-CIGB 2012 HASE Omi Japan Himeji, Hyogo Gravity in Masonry or Concrete 769 254 309 102 84 8 10 1992 (dam completed) No reported reservoir induced seismicity.203 ICOLD-CIGB 2012 HASSAN 1er Lakhdar Morocco Demate, Azilal Earth/Rock fill 1151 380 439 145 138 213 263 1986 (dam completed) No reported reservoir induced seismicity.204 ICOLD-CIGB 2012 HATANAGI NO1 Oi Japan Shizuoka, Shizuoka Buttress 815 269 379 125 107 87 107 1962 (dam completed) No reported reservoir induced seismicity.205 ICOLD-CIGB 2012 HEIQUAN Baokuhe China Datong, QinghaiProv. Rock fill 1311 433 375 124 106 148 182 2001 (dam completed) No reported reservoir induced seismicity.206 ICOLD-CIGB 2012 Hell Hole Rubicon River United States California Rock fill 1450 479 379 125 107 208 257 1966 (dam completed) No reported reservoir induced seismicity.207 ICOLD-CIGB 2012 HELLS CANYON Snake River United States Idaho Gravity in Masonry or Concrete/XX 839 277 306 101 83 188 232 1967 (dam completed) No reported reservoir induced seismicity.208 Packer et al. 1979 & WHENDRIK VERWOERD Hendrik VerwoeOrange South Africa Concrete double arch 1968 600 217 66 45 4053 5000 1970 Sedimentary 2 Accepted case of reservoir induced microearthquake activity.209 ICOLD-CIGB 2012 HIGH ASWAN DAM Nasser Nile Egypt Nearest town Aswan, Aswan Rock fill 11811 3600 364 111 111 131336 162000 1972 (dam completed) Sedimentary 5.4 Accepted case of the induced seismicity.210 ICOLD-CIGB 2012 HILLS CREEK MIDDLE FORK WILLAMETTE R United States Oregon Earth 2062 681 315 104 99 356 439 1962 (dam completed) No reported reservoir induced seismicity.211 ICOLD-CIGB 2012 HITOTSUSE Hitotsuse Japan Saito, Miyazaki Arch 1260 416 394 130 112 212 261 1963 (dam completed) No reported reservoir induced seismicity.212 ICOLD-CIGB 2012 HOA BINH Da Viet Nam Nearest town Hoa Binh, Hoa Binh Rock fill 2165 660 420 128 122 7661 9450 1994 (dam completed) Not Obtained 4.9 Reported Case213 ICOLD-CIGB 2012 HOHEIKYO Niikappu Japan Tomakomai, Hokkaido Rock fill 987 326 312 103 85 118 145 1974 (dam completed) No reported reservoir induced seismicity.214 ICOLD-CIGB 2012 HONGRIN NORD Hongrin Hongrin Switzerland Aigle, Vaud Arch 984 325 379 125 107 43 53 1969 (dam completed) No reported reservoir induced seismicity.215 Packer et al. 1979 & WHOOVER Lake Mead Colorado U.S.A. Concrete arch - gravity 1243 379 732 223 166 30237 37297 1936 (dam completed) Igneous 5 Accepted case of reservoir induced macroearthquake activity.216 ICOLD-CIGB 2012 HUANGLONGTAN(HUBEI,SHIYAN) Duhe China Shiyan, HubeiProv. Gravity in Masonry or Concrete 1123 371 324 107 89 942 1163 1978 (dam completed) No reported reservoir induced seismicity.217 ICOLD-CIGB 2012 HUITES * Fuerte Mexico El Fuerte, Sinaloa Gravity in Masonry or Concrete/Arch 1302 430 460 152 122 3703 4568 1995 (dam completed) No reported reservoir induced seismicity.218 ICOLD-CIGB 2012 HUNANZHEN Lanjiang China Nearest town Qiuxian, ZhejiangProv. Buttress 1444 440 423 129 123 1670 2060 1979 (dam completed) Not Obtained 2.8 Reported Case219 ICOLD-CIGB 2012 HUNGRY HORSE SOUTH FORK FLATHEAD RIVE United States Montana XX/Arch 1953 645 521 172 142 3588 4426 1953 (dam completed) No reported reservoir induced seismicity.220 Gupta, 2002 Hungshi India 131 40 36 610 1970 Not Obtained Reported Case221 ICOLD-CIGB 2012 HWANGSUWON Hwangsuwon Korea N (RDK) Pungsan , Ryanggangdo Gravity in Masonry or Concrete 1787 590 306 101 83 470 580 1959 (dam completed) No reported reservoir induced seismicity.222 ICOLD-CIGB 2012 IDAMALAYAR * Idamalayar India K/Mangalam, Kerala Gravity in Masonry or Concrete 1136 375 303 100 90 935 1153 1985 (dam completed) No reported reservoir induced seismicity.223 Woodward-Clyde Con IDUKKI Not obtained Periyar India Concrete arch 551 168 158 1182 1460 1974 Not Obtained 3.5 Reported Case224 ICOLD-CIGB 2012 IKARI Sagae Japan Sagae, Yamagata Rock fill 1544 510 339 112 94 88 109 1990 (dam completed) No reported reservoir induced seismicity.225 ICOLD-CIGB 2012 IKAWA Oi Japan Shizuoka, Shizuoka Buttress 736 243 315 104 86 122 150 1957 (dam completed) No reported reservoir induced seismicity.226 ICOLD-CIGB 2012 IKEHARA Kitayama Japan Kumano, Nara Arch 1393 460 336 111 93 274 338 1964 (dam completed) No reported reservoir induced seismicity.227 ICOLD-CIGB 2012 INGURI Inguri Georgia Zugdidi, Georgia Arch 2059 680 824 272 242 892 1100 1980 (dam completed) No reported reservoir induced seismicity.228 ICOLD-CIGB 2012 Isacheon Isa Korea Sunchon, Chonnam Rock fill 1705 563 303 100 90 170 210 1992 (dam completed) No reported reservoir induced seismicity.229 ICOLD-CIGB 2012 ITA Uruguai Brazil Nova Ita / Arativa, Santa Catarina Rock fill 2665 880 379 125 107 4135 5100 2000 (dam completed) No reported reservoir induced seismicity.230 ICOLD-CIGB 2012 ITAIPU Itaipu Parana Paraguay Hermandarias, Parana Gravity in Masonry or Concrete/Rock fill /Earth/Buttress 24225 8000 594 196 186 23511 29000 1983 (dam completed) No reported reservoir induced seismicity.231 ICOLD-CIGB 2012 ITAPARICA Sao Francisco Brazil Petrolandia, Pernambuco Rock fill 14326 4731 318 105 87 8739 10780 1988 (dam completed) No reported reservoir induced seismicity.232 Packer et al. 1979 Itezhitezhi Itezhitezhi Kafue Zambia Rock fill 213 65 62 5000 1976 Igneous 4 Accepted case of reservoir induced macroearthquake activity.233 ICOLD-CIGB 2012 ITUMBIARA Paranaiba Brazil Itumbiara, Goias Earth/Gravity in Masonry or Concrete 20591 6800 333 110 105 13782 17000 1980 (dam completed) No reported reservoir induced seismicity.234 ICOLD-CIGB 2012 IWAYA Mase Japan Minokamo, Gifu Rock fill 1108 366 388 128 110 141 174 1976 (dam completed) No reported reservoir induced seismicity.235 ICOLD-CIGB 2012 IZNAJAR GENIL Spain RUTE, CUEVAS SAN MARCOS, CORDOBA Gravity in Masonry or Concrete 1232 407 369 122 104 865 1067 1969 (dam completed) No reported reservoir induced seismicity.236 ICOLD-CIGB 2012 IZVORUL MUNTELUI Bistrita Romania Piatra Neamt, Neamt Gravity in Masonry or Concrete 1317 435 385 127 109 997 1230 1961 (dam completed) No reported reservoir induced seismicity.237 ICOLD-CIGB 2012 JAMRANI Gola India Kathgodam, Uttaranchal Earth 2316 765 424 140 133 167 207 1990 (dam completed) No reported reservoir induced seismicity.238 ICOLD-CIGB 2012 JATILUHUR Citarum Indonesia Purwakarta, West Java Rock fill 3694 1220 318 105 87 2072 2556 1967 (dam completed) No reported reservoir induced seismicity.239 ICOLD-CIGB 2012 JIANGYA Luoshui China Cili, HunanProv. Gravity in Masonry or Concrete 1017 336 388 128 110 1419 1750 1999 (dam completed) No reported reservoir induced seismicity.240 ICOLD-CIGB 2012 JIGUEY Nizao Dominican R. Palo de Caja, Peravia Arch 951 314 333 110 92 136 168 1992 (dam completed) No reported reservoir induced seismicity.241 ICOLD-CIGB 2012 JILINTAI Keshihe China Nileke, XinjiangReg. Rock fill 1187 392 460 152 122 1978 2440 2001 (dam completed) No reported reservoir induced seismicity.242 ICOLD-CIGB 2012 JINSHUITAN Longqianxi China Yunhe, ZhejiangProv. Arch 1063 351 309 102 84 1129 1393 1986 (dam completed) No reported reservoir induced seismicity.243 ICOLD-CIGB 2012 JIROFT HALIL ROOD I. Rep. Iran JIROFT, KERMAN Arch 757 250 406 134 116 349 430 1991 (dam completed) No reported reservoir induced seismicity.244 Packer et al. 1979 & WJOCASSEE Lake Jocassee Keowee U.S.A. South Carolina Earth and rock fill 1948 594 436 133 111 1288 1588 1973 (dam completed) Metamorphic 3.2 Accepted case of reservoir induced macroearthquake activity.245 ICOLD-CIGB 2012 JOZANKEI Otarunai Japan Sapporo, Hokkaido Gravity in Masonry or Concrete 1242 410 357 118 100 67 82 1990 (dam completed) No reported reservoir induced seismicity.246 ICOLD-CIGB 2012 JUAMJOJOL Sangsaho Isa Korea Yochon, Jeonnam Rock fill 1705 563 303 100 90 203 250 1992 (dam completed) No reported reservoir induced seismicity.247 ICOLD-CIGB 2012 KAJIGAWA Kaji Japan Shibata, Nigata Gravity in Masonry or Concrete 866 286 324 107 89 18 23 1974 (dam completed) No reported reservoir induced seismicity.248 ICOLD-CIGB 2012 KAKKI * Kakki India Vandiperiyar, Kerala Rock fill 1017 336 345 114 96 369 455 1966 (dam completed) No reported reservoir induced seismicity.249 Packer et al. 1979 & WKAMAFUSA Not obtained Goishi Japan 20 km west of Sendai Concrete gravity 581 177 155 47 42 36 45 1970 (dam completed) Not Obtained 2.5 Accepted case of reservoir induced microearthquake activity.250 ICOLD-CIGB 2012 KAMISHIIBA Mimi Japan Hyuga, Miyazaki Arch 1033 341 333 110 92 74 92 1955 (dam completed) No reported reservoir induced seismicity.251 ICOLD-CIGB 2012 KAORE Itatori Japan Gifu, Gifu Arch 1033 341 327 108 90 14 17 1994 (dam completed) No reported reservoir induced seismicity.252 ICOLD-CIGB 2012 KARAKAYA Firat Turkey Cungus, Diyarbakir Arch 1399 462 524 173 143 7767 9580 1987 (dam completed) No reported reservoir induced seismicity.253 ICOLD-CIGB 2012 KARDGALI Arda Bulgaria Kardgali, Haskovo Arch/Gravity in Masonry or Concrete 1220 403 315 104 86 432 533 1976 (dam completed) No reported reservoir induced seismicity.254 Packer et al. 1979 & WKARIBA Lake Kariba Zambezi Zimbabwe Nearest town Harare, Mashonaland Double curvature concrete arch 1900 579 420 128 122 146415 180600 1959 Metamorphic 6.25 Accepted case of reservoir induced macroearthquake activity.255 ICOLD-CIGB 2012 KARKHEH KARKHEH I. Rep. Iran ANDIMESHK, KHUZESTAN Earth 9175 3030 385 127 121 4517 5572 2001 (dam completed) No reported reservoir induced seismicity.256 ICOLD-CIGB 2012 KAROUN - 4 (MONJ) KAROUN I. Rep. Iran IZEH, CHAHAR MAHAL & Gravity in Masonry or Concrete/Arch 1732 572 672 222 192 1775 2190 Not Obtained No reported reservoir induced seismicity.257 ICOLD-CIGB 2012 KATSE Malibamatso Lesotho Nearest town Katse, Lesotho Concrete Arch 2329 710 607 185 155 1581 1950 1998 (dam completed) Not Obtained 3.1 Reported Case258 ICOLD-CIGB 2012 KAWAJI Kinu Japan Imaichi, Tochigi Arch 1090 360 424 140 122 67 83 1981 (dam completed) No reported reservoir induced seismicity.259 ICOLD-CIGB 2012 KAWAMATA Kinu Japan Nikko, Tochigi Arch 415 137 354 117 99 71 88 1966 (dam completed) No reported reservoir induced seismicity.260 ICOLD-CIGB 2012 KAZAYA Totsu Japan Gojo, Nara Gravity in Masonry or Concrete 999 330 306 101 83 105 130 1960 (dam completed) No reported reservoir induced seismicity.261 Packer et al. 1979 & WKEBAN Not obtained Firat (Euphrates) Turkey Concrete gravity 3598 1097 535 163 153 25120 31000 1973 Igneous 3 Accepted case of reservoir induced microearthquake activity.262 ICOLD-CIGB 2012 KEDDARA Keddara Algeria Boudouaou, Boumerdes Rock fill 1696 560 327 108 90 118 146 1987 (dam completed) No reported reservoir induced seismicity.263 ICOLD-CIGB 2012 KEMER Akcay Turkey Bozdogan, Aydin Gravity in Masonry or Concrete 905 299 345 114 96 302 373 1958 (dam completed) No reported reservoir induced seismicity.264 ICOLD-CIGB 2012 KENNEY Nechako Canada Prince George, BC Rock fill 1384 457 315 104 86 19295 23800 1952 (dam completed) No reported reservoir induced seismicity.265 ICOLD-CIGB 2012 KENYIR Terengganu Malaysia Kuala Brang, Terrengganu Rock fill 2422 800 469 155 125 11026 13600 1985 (dam completed) No reported reservoir induced seismicity.266 Packer et al. 1979 & WKERR Flathead Lake Flathead U.S.A. Concrete Concrete Arch 676 206 194 59 51 1791 2209 1958 (dam completed) Igneous 4.9 Accepted case of reservoir induced macroearthquake activity.267 ICOLD-CIGB 2012 KIAMBERE Tana Kenya Embu, Eastern Rock fill 2544 840 339 112 94 474 585 1987 (dam completed) No reported reservoir induced seismicity.268 ICOLD-CIGB 2012 KILICKAYA Kelkit Turkey Susehri, Sivas Rock fill 1226 405 406 134 116 1135 1400 1989 (dam completed) No reported reservoir induced seismicity.269 Packer et al. 1979 & WKINARSANI Kinarsani Kinarsani India Not obtained Not obtained 0 0 Not Obtain Not obtained Not Obtained -- Questionable case of reservoir induced earthquake activity. Magnitude not obtained.270 ICOLD-CIGB 2012 KIRAZDERE Kirazdere Turkey Izmit, Izmit Earth/Rock fill 1208 399 330 109 104 49 60 1999 (dam completed) No reported reservoir induced seismicity.271 ICOLD-CIGB 2012 KOELNBREIN Malta Austria Gmuend, Carinthia Arch 1896 626 606 200 170 166 205 1977 (dam completed) No reported reservoir induced seismicity.272 ICOLD-CIGB 2012 KOLYMA Kolyma Russia Magadan, Magadan Rock fill 2298 759 394 130 112 1184 1460 1991 (dam completed) No reported reservoir induced seismicity.273 Gupta, 2002 Komani Albania 427 130 124 1600 1985 Not Obtained 4.2 Reported case.274 Woodward-Clyde Con KOPPERSTON NO. 3 Not obtained Jones Branch U.S.A. Earth fill 581 177 155 Not Obtained 1963 No reported reservoir induced seismicity.275 ICOLD-CIGB 2012 KOPS tr. Ill Austria Schruns, Vorarlberg Arch 1211 400 369 122 104 36 45 1965 (dam completed) No reported reservoir induced seismicity.276 ICOLD-CIGB 2012 KOSHIBU Koshibu Japan Iida, Nagano Arch 887 293 318 105 87 47 58 1969 (dam completed) No reported reservoir induced seismicity.277 Gupta, 2002 Kouris China 0 0 Not Obtained No reported reservoir induced seismicity.278 Packer et al. 1979 & WKOYNA Shivaji Sagar LaKoyna India Nearest town Patan, Maharashtra Concrete gravity 2641 805 338 103 100 2268 2797 1964 (dam completed) Igneous 6.5 Accepted case of reservoir induced macroearthquake activity.279 ICOLD-CIGB 2012 KRASNOYARSK Yenisei Russia Krasnoyarsk, Krasnoyarsk Gravity in Masonry or Concrete 3225 1065 375 124 106 59425 73300 1967 (dam completed) No reported reservoir induced seismicity.280 ICOLD-CIGB 2012 KRICHIM Vacha Bulgaria Krichim, Plovdiv Buttress/Gravity in Masonry or Concrete 815 269 318 105 87 15 18 1972 (dam completed) No reported reservoir induced seismicity.281 ICOLD-CIGB 2012 KULAMAVU * Tr.of M.puzha India Idukki, Kerala Earth 1166 385 303 100 90 0 0 1977 (dam completed) No reported reservoir induced seismicity.282 ICOLD-CIGB 2012 KULEKHANI Indra Sarowar Kulekhani Nepal Kathmandu, Makwanpur District Rock fill 1229 406 345 114 96 69 85 1982 (dam completed) No reported reservoir induced seismicity.283 Packer et al. 1979 & WKUROBE Lake Kurobe Kurobe Japan Concrete Arch 492 150 610 186 180 121 149 1960 Not Obtained 4.9 Not a case of reservoir induced macroearthquake activity.284 ICOLD-CIGB 2012 KURPSAY Naryn Kirghizstan Kara-Kul, Kirghizstan Gravity in Masonry or Concrete 1090 360 342 113 95 300 370 1983 (dam completed) No reported reservoir induced seismicity.285 Gupta, 2002 Kurupsai Cyprus 328 100 90 500 1981 Not Obtained Reported Case286 ICOLD-CIGB 2012 KUSAKI Watarase Japan Kiryu, Gunma Gravity in Masonry or Concrete 1226 405 424 140 122 49 61 1976 (dam completed) No reported reservoir induced seismicity.287 ICOLD-CIGB 2012 KUTTARI Tokachi Japan Obihiro, Hokkaido Rock fill 1030 340 309 102 84 15 19 1987 (dam completed) No reported reservoir induced seismicity.288 ICOLD-CIGB 2012 KUZGUN Serceme Turkey Erzurum, Erzurum Rock fill 848 280 363 120 102 253 312 1995 (dam completed) No reported reservoir induced seismicity.289 ICOLD-CIGB 2012 KUZURYU Kuzuryu Japan Ono, Fukui Rock fill 1075 355 388 128 110 259 320 1968 (dam completed) No reported reservoir induced seismicity.
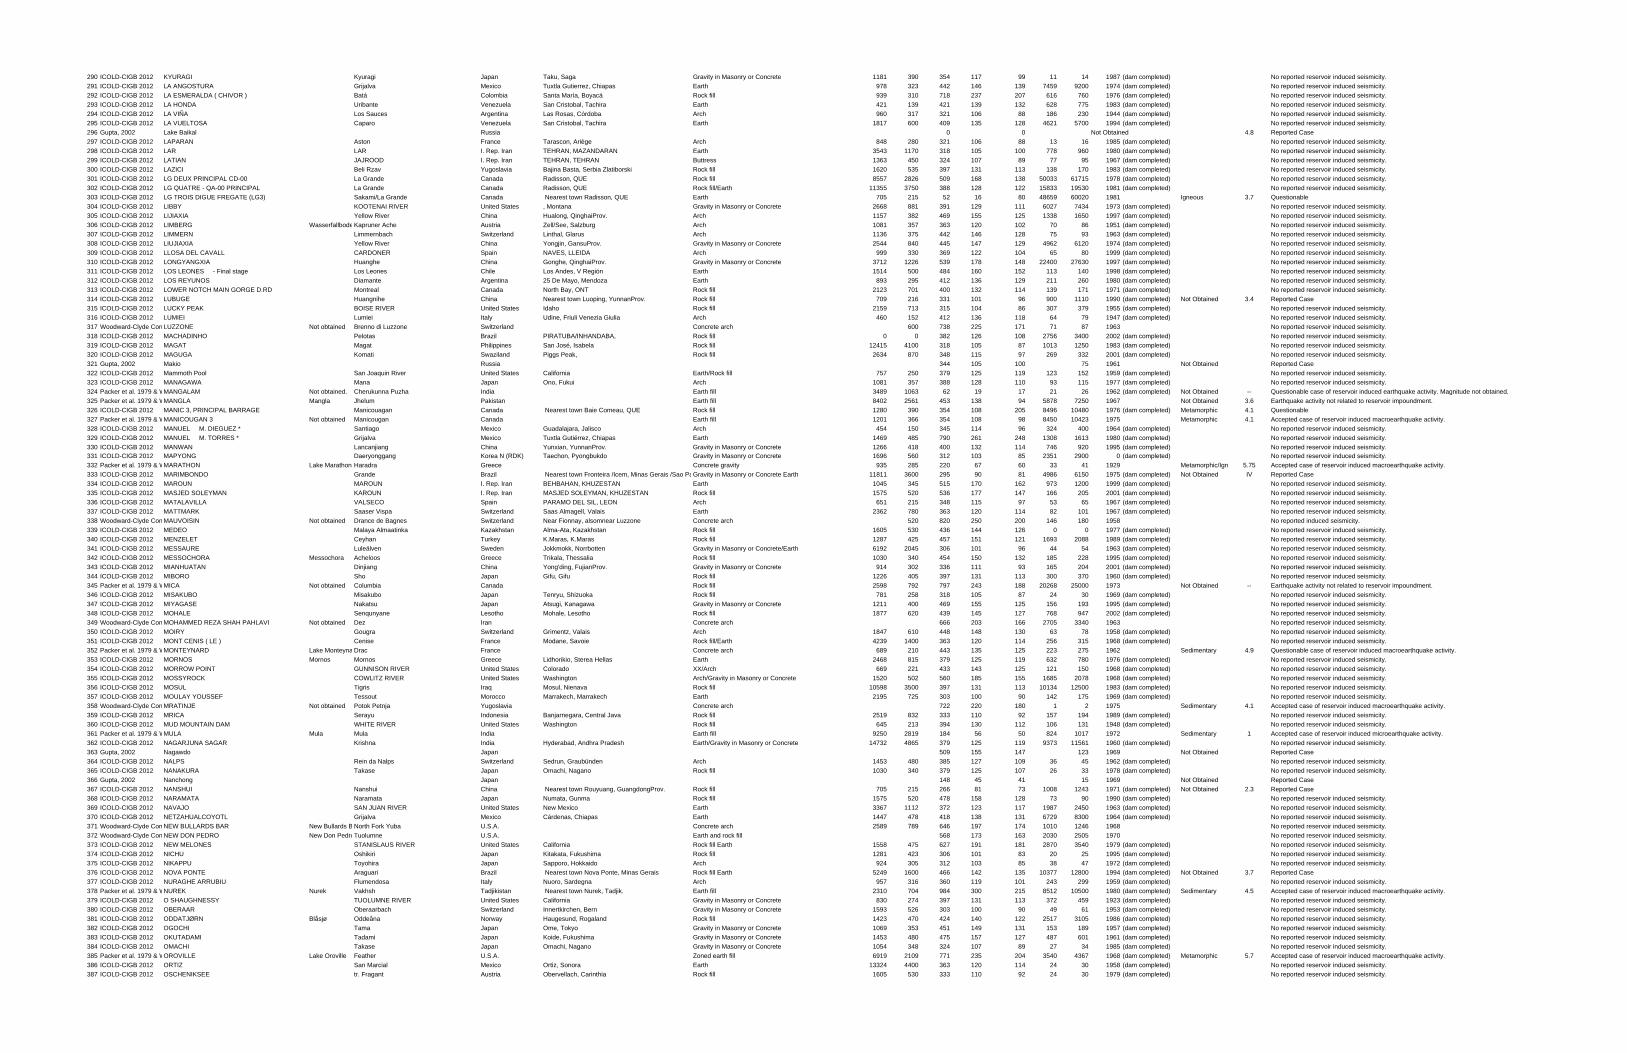
290 ICOLD-CIGB 2012 KYURAGI Kyuragi Japan Taku, Saga Gravity in Masonry or Concrete 1181 390 354 117 99 11 14 1987 (dam completed) No reported reservoir induced seismicity.291 ICOLD-CIGB 2012 LA ANGOSTURA Grijalva Mexico Tuxtla Gutierrez, Chiapas Earth 978 323 442 146 139 7459 9200 1974 (dam completed) No reported reservoir induced seismicity.292 ICOLD-CIGB 2012 LA ESMERALDA ( CHIVOR ) Batá Colombia Santa María, Boyacá Rock fill 939 310 718 237 207 616 760 1976 (dam completed) No reported reservoir induced seismicity.293 ICOLD-CIGB 2012 LA HONDA Uribante Venezuela San Cristobal, Tachira Earth 421 139 421 139 132 628 775 1983 (dam completed) No reported reservoir induced seismicity.294 ICOLD-CIGB 2012 LA VIÑA Los Sauces Argentina Las Rosas, Córdoba Arch 960 317 321 106 88 186 230 1944 (dam completed) No reported reservoir induced seismicity.295 ICOLD-CIGB 2012 LA VUELTOSA Caparo Venezuela San Cristobal, Tachira Earth 1817 600 409 135 128 4621 5700 1994 (dam completed) No reported reservoir induced seismicity.296 Gupta, 2002 Lake Baikal Russia 0 0 Not Obtained 4.8 Reported Case297 ICOLD-CIGB 2012 LAPARAN Aston France Tarascon, Ariège Arch 848 280 321 106 88 13 16 1985 (dam completed) No reported reservoir induced seismicity.298 ICOLD-CIGB 2012 LAR LAR I. Rep. Iran TEHRAN, MAZANDARAN Earth 3543 1170 318 105 100 778 960 1980 (dam completed) No reported reservoir induced seismicity.299 ICOLD-CIGB 2012 LATIAN JAJROOD I. Rep. Iran TEHRAN, TEHRAN Buttress 1363 450 324 107 89 77 95 1967 (dam completed) No reported reservoir induced seismicity.300 ICOLD-CIGB 2012 LAZICI Beli Rzav Yugoslavia Bajina Basta, Serbia Zlatiborski Rock fill 1620 535 397 131 113 138 170 1983 (dam completed) No reported reservoir induced seismicity.301 ICOLD-CIGB 2012 LG DEUX PRINCIPAL CD-00 La Grande Canada Radisson, QUE Rock fill 8557 2826 509 168 138 50033 61715 1978 (dam completed) No reported reservoir induced seismicity.302 ICOLD-CIGB 2012 LG QUATRE - QA-00 PRINCIPAL La Grande Canada Radisson, QUE Rock fill/Earth 11355 3750 388 128 122 15833 19530 1981 (dam completed) No reported reservoir induced seismicity.303 ICOLD-CIGB 2012 LG TROIS DIGUE FREGATE (LG3) Sakami/La Grande Canada Nearest town Radisson, QUE Earth 705 215 52 16 80 48659 60020 1981 Igneous 3.7 Questionable304 ICOLD-CIGB 2012 LIBBY KOOTENAI RIVER United States , Montana Gravity in Masonry or Concrete 2668 881 391 129 111 6027 7434 1973 (dam completed) No reported reservoir induced seismicity.305 ICOLD-CIGB 2012 LIJIAXIA Yellow River China Hualong, QinghaiProv. Arch 1157 382 469 155 125 1338 1650 1997 (dam completed) No reported reservoir induced seismicity.306 ICOLD-CIGB 2012 LIMBERG WasserfallbodeKapruner Ache Austria Zell/See, Salzburg Arch 1081 357 363 120 102 70 86 1951 (dam completed) No reported reservoir induced seismicity.307 ICOLD-CIGB 2012 LIMMERN Limmernbach Switzerland Linthal, Glarus Arch 1136 375 442 146 128 75 93 1963 (dam completed) No reported reservoir induced seismicity.308 ICOLD-CIGB 2012 LIUJIAXIA Yellow River China Yongjin, GansuProv. Gravity in Masonry or Concrete 2544 840 445 147 129 4962 6120 1974 (dam completed) No reported reservoir induced seismicity.309 ICOLD-CIGB 2012 LLOSA DEL CAVALL CARDONER Spain NAVES, LLEIDA Arch 999 330 369 122 104 65 80 1999 (dam completed) No reported reservoir induced seismicity.310 ICOLD-CIGB 2012 LONGYANGXIA Huanghe China Gonghe, QinghaiProv. Gravity in Masonry or Concrete 3712 1226 539 178 148 22400 27630 1997 (dam completed) No reported reservoir induced seismicity.311 ICOLD-CIGB 2012 LOS LEONES - Final stage Los Leones Chile Los Andes, V Región Earth 1514 500 484 160 152 113 140 1998 (dam completed) No reported reservoir induced seismicity.312 ICOLD-CIGB 2012 LOS REYUNOS Diamante Argentina 25 De Mayo, Mendoza Earth 893 295 412 136 129 211 260 1980 (dam completed) No reported reservoir induced seismicity.313 ICOLD-CIGB 2012 LOWER NOTCH MAIN GORGE D.RD Montreal Canada North Bay, ONT Rock fill 2123 701 400 132 114 139 171 1971 (dam completed) No reported reservoir induced seismicity.314 ICOLD-CIGB 2012 LUBUGE Huangnihe China Nearest town Luoping, YunnanProv. Rock fill 709 216 331 101 96 900 1110 1990 (dam completed) Not Obtained 3.4 Reported Case315 ICOLD-CIGB 2012 LUCKY PEAK BOISE RIVER United States Idaho Rock fill 2159 713 315 104 86 307 379 1955 (dam completed) No reported reservoir induced seismicity.316 ICOLD-CIGB 2012 LUMIEI Lumiei Italy Udine, Friuli Venezia Giulia Arch 460 152 412 136 118 64 79 1947 (dam completed) No reported reservoir induced seismicity.317 Woodward-Clyde Con LUZZONE Not obtained Brenno di Luzzone Switzerland Concrete arch 600 738 225 171 71 87 1963 No reported reservoir induced seismicity.318 ICOLD-CIGB 2012 MACHADINHO Pelotas Brazil PIRATUBA/INHANDABA, Rock fill 0 0 382 126 108 2756 3400 2002 (dam completed) No reported reservoir induced seismicity.319 ICOLD-CIGB 2012 MAGAT Magat Philippines San José, Isabela Rock fill 12415 4100 318 105 87 1013 1250 1983 (dam completed) No reported reservoir induced seismicity.320 ICOLD-CIGB 2012 MAGUGA Komati Swaziland Piggs Peak, Rock fill 2634 870 348 115 97 269 332 2001 (dam completed) No reported reservoir induced seismicity.321 Gupta, 2002 Makio Russia 344 105 100 75 1961 Not Obtained Reported Case322 ICOLD-CIGB 2012 Mammoth Pool San Joaquin River United States California Earth/Rock fill 757 250 379 125 119 123 152 1959 (dam completed) No reported reservoir induced seismicity.323 ICOLD-CIGB 2012 MANAGAWA Mana Japan Ono, Fukui Arch 1081 357 388 128 110 93 115 1977 (dam completed) No reported reservoir induced seismicity.324 Packer et al. 1979 & WMANGALAM Not obtained. Cherukunna Puzha India Earth fill 3489 1063 62 19 17 21 26 1962 (dam completed) Not Obtained -- Questionable case of reservoir induced earthquake activity. Magnitude not obtained.325 Packer et al. 1979 & WMANGLA Mangla Jhelum Pakistan Earth fill 8402 2561 453 138 94 5878 7250 1967 Not Obtained 3.6 Earthquake activity not related to reservoir impoundment.326 ICOLD-CIGB 2012 MANIC 3, PRINCIPAL BARRAGE Manicouagan Canada Nearest town Baie Comeau, QUE Rock fill 1280 390 354 108 205 8496 10480 1976 (dam completed) Metamorphic 4.1 Questionable327 Packer et al. 1979 & WMANICOUGAN 3 Not obtained Manicougan Canada Earth fill 1201 366 354 108 98 8450 10423 1975 Metamorphic 4.1 Accepted case of reservoir induced macroearthquake activity.328 ICOLD-CIGB 2012 MANUEL M. DIEGUEZ * Santiago Mexico Guadalajara, Jalisco Arch 454 150 345 114 96 324 400 1964 (dam completed) No reported reservoir induced seismicity.329 ICOLD-CIGB 2012 MANUEL M. TORRES * Grijalva Mexico Tuxtla Gutiérrez, Chiapas Earth 1469 485 790 261 248 1308 1613 1980 (dam completed) No reported reservoir induced seismicity.330 ICOLD-CIGB 2012 MANWAN Lancanjiang China Yunxian, YunnanProv. Gravity in Masonry or Concrete 1266 418 400 132 114 746 920 1995 (dam completed) No reported reservoir induced seismicity.331 ICOLD-CIGB 2012 MAPYONG Daeryonggang Korea N (RDK) Taechon, Pyongbukdo Gravity in Masonry or Concrete 1696 560 312 103 85 2351 2900 0 (dam completed) No reported reservoir induced seismicity.332 Packer et al. 1979 & WMARATHON Lake Marathon Haradra Greece Concrete gravity 935 285 220 67 60 33 41 1929 Metamorphic/Ign 5.75 Accepted case of reservoir induced macroearthquake activity.333 ICOLD-CIGB 2012 MARIMBONDO Grande Brazil Nearest town Fronteira /Icem, Minas Gerais /Sao PaGravity in Masonry or Concrete Earth 11811 3600 295 90 81 4986 6150 1975 (dam completed) Not Obtained IV Reported Case334 ICOLD-CIGB 2012 MAROUN MAROUN I. Rep. Iran BEHBAHAN, KHUZESTAN Earth 1045 345 515 170 162 973 1200 1999 (dam completed) No reported reservoir induced seismicity.335 ICOLD-CIGB 2012 MASJED SOLEYMAN KAROUN I. Rep. Iran MASJED SOLEYMAN, KHUZESTAN Rock fill 1575 520 536 177 147 166 205 2001 (dam completed) No reported reservoir induced seismicity.336 ICOLD-CIGB 2012 MATALAVILLA VALSECO Spain PARAMO DEL SIL, LEON Arch 651 215 348 115 97 53 65 1967 (dam completed) No reported reservoir induced seismicity.337 ICOLD-CIGB 2012 MATTMARK Saaser Vispa Switzerland Saas Almagell, Valais Earth 2362 780 363 120 114 82 101 1967 (dam completed) No reported reservoir induced seismicity.338 Woodward-Clyde Con MAUVOISIN Not obtained Drance de Bagnes Switzerland Near Fionnay, alsomnear Luzzone Concrete arch 520 820 250 200 146 180 1958 No reported induced seismicity.339 ICOLD-CIGB 2012 MEDEO Malaya Almaatinka Kazakhstan Alma-Ata, Kazakhstan Rock fill 1605 530 436 144 126 0 0 1977 (dam completed) No reported reservoir induced seismicity.340 ICOLD-CIGB 2012 MENZELET Ceyhan Turkey K.Maras, K.Maras Rock fill 1287 425 457 151 121 1693 2088 1989 (dam completed) No reported reservoir induced seismicity.341 ICOLD-CIGB 2012 MESSAURE Luleälven Sweden Jokkmokk, Norrbotten Gravity in Masonry or Concrete/Earth 6192 2045 306 101 96 44 54 1963 (dam completed) No reported reservoir induced seismicity.342 ICOLD-CIGB 2012 MESSOCHORA Messochora Acheloos Greece Trikala, Thessalia Rock fill 1030 340 454 150 132 185 228 1995 (dam completed) No reported reservoir induced seismicity.343 ICOLD-CIGB 2012 MIANHUATAN Dinjiang China Yong'ding, FujianProv. Gravity in Masonry or Concrete 914 302 336 111 93 165 204 2001 (dam completed) No reported reservoir induced seismicity.344 ICOLD-CIGB 2012 MIBORO Sho Japan Gifu, Gifu Rock fill 1226 405 397 131 113 300 370 1960 (dam completed) No reported reservoir induced seismicity.345 Packer et al. 1979 & WMICA Not obtained Columbia Canada Rock fill 2598 792 797 243 188 20268 25000 1973 Not Obtained -- Earthquake activity not related to reservoir impoundment.346 ICOLD-CIGB 2012 MISAKUBO Misakubo Japan Tenryu, Shizuoka Rock fill 781 258 318 105 87 24 30 1969 (dam completed) No reported reservoir induced seismicity.347 ICOLD-CIGB 2012 MIYAGASE Nakatsu Japan Atsugi, Kanagawa Gravity in Masonry or Concrete 1211 400 469 155 125 156 193 1995 (dam completed) No reported reservoir induced seismicity.348 ICOLD-CIGB 2012 MOHALE Senqunyane Lesotho Mohale, Lesotho Rock fill 1877 620 439 145 127 768 947 2002 (dam completed) No reported reservoir induced seismicity.349 Woodward-Clyde Con MOHAMMED REZA SHAH PAHLAVI Not obtained Dez Iran Concrete arch 666 203 166 2705 3340 1963 No reported reservoir induced seismicity.350 ICOLD-CIGB 2012 MOIRY Gougra Switzerland Grimentz, Valais Arch 1847 610 448 148 130 63 78 1958 (dam completed) No reported reservoir induced seismicity.351 ICOLD-CIGB 2012 MONT CENIS ( LE ) Cenise France Modane, Savoie Rock fill/Earth 4239 1400 363 120 114 256 315 1968 (dam completed) No reported reservoir induced seismicity.352 Packer et al. 1979 & WMONTEYNARD Lake Monteyna Drac France Concrete arch 689 210 443 135 125 223 275 1962 Sedimentary 4.9 Questionable case of reservoir induced macroearthquake activity.353 ICOLD-CIGB 2012 MORNOS Mornos Mornos Greece Lidhorikio, Sterea Hellas Earth 2468 815 379 125 119 632 780 1976 (dam completed) No reported reservoir induced seismicity.354 ICOLD-CIGB 2012 MORROW POINT GUNNISON RIVER United States Colorado XX/Arch 669 221 433 143 125 121 150 1968 (dam completed) No reported reservoir induced seismicity.355 ICOLD-CIGB 2012 MOSSYROCK COWLITZ RIVER United States Washington Arch/Gravity in Masonry or Concrete 1520 502 560 185 155 1685 2078 1968 (dam completed) No reported reservoir induced seismicity.356 ICOLD-CIGB 2012 MOSUL Tigris Iraq Mosul, Nienava Rock fill 10598 3500 397 131 113 10134 12500 1983 (dam completed) No reported reservoir induced seismicity.357 ICOLD-CIGB 2012 MOULAY YOUSSEF Tessout Morocco Marrakech, Marrakech Earth 2195 725 303 100 90 142 175 1969 (dam completed) No reported reservoir induced seismicity.358 Woodward-Clyde Con MRATINJE Not obtained Potok Petnja Yugoslavia Concrete arch 722 220 180 1 2 1975 Sedimentary 4.1 Accepted case of reservoir induced macroearthquake activity.359 ICOLD-CIGB 2012 MRICA Serayu Indonesia Banjarnegara, Central Java Rock fill 2519 832 333 110 92 157 194 1989 (dam completed) No reported reservoir induced seismicity.360 ICOLD-CIGB 2012 MUD MOUNTAIN DAM WHITE RIVER United States Washington Rock fill 645 213 394 130 112 106 131 1948 (dam completed) No reported reservoir induced seismicity.361 Packer et al. 1979 & WMULA Mula Mula India Earth fill 9250 2819 184 56 50 824 1017 1972 Sedimentary 1 Accepted case of reservoir induced microearthquake activity.362 ICOLD-CIGB 2012 NAGARJUNA SAGAR Krishna India Hyderabad, Andhra Pradesh Earth/Gravity in Masonry or Concrete 14732 4865 379 125 119 9373 11561 1960 (dam completed) No reported reservoir induced seismicity.363 Gupta, 2002 Nagawdo Japan 509 155 147 123 1969 Not Obtained Reported Case364 ICOLD-CIGB 2012 NALPS Rein da Nalps Switzerland Sedrun, Graubünden Arch 1453 480 385 127 109 36 45 1962 (dam completed) No reported reservoir induced seismicity.365 ICOLD-CIGB 2012 NANAKURA Takase Japan Omachi, Nagano Rock fill 1030 340 379 125 107 26 33 1978 (dam completed) No reported reservoir induced seismicity.366 Gupta, 2002 Nanchong Japan 148 45 41 15 1969 Not Obtained Reported Case367 ICOLD-CIGB 2012 NANSHUI Nanshui China Nearest town Rouyuang, GuangdongProv. Rock fill 705 215 266 81 73 1008 1243 1971 (dam completed) Not Obtained 2.3 Reported Case368 ICOLD-CIGB 2012 NARAMATA Naramata Japan Numata, Gunma Rock fill 1575 520 478 158 128 73 90 1990 (dam completed) No reported reservoir induced seismicity.369 ICOLD-CIGB 2012 NAVAJO SAN JUAN RIVER United States New Mexico Earth 3367 1112 372 123 117 1987 2450 1963 (dam completed) No reported reservoir induced seismicity.370 ICOLD-CIGB 2012 NETZAHUALCOYOTL Grijalva Mexico Cárdenas, Chiapas Earth 1447 478 418 138 131 6729 8300 1964 (dam completed) No reported reservoir induced seismicity.371 Woodward-Clyde Con NEW BULLARDS BAR New Bullards B North Fork Yuba U.S.A. Concrete arch 2589 789 646 197 174 1010 1246 1968 No reported reservoir induced seismicity.372 Woodward-Clyde Con NEW DON PEDRO New Don PedroTuolumne U.S.A. Earth and rock fill 568 173 163 2030 2505 1970 No reported reservoir induced seismicity.373 ICOLD-CIGB 2012 NEW MELONES STANISLAUS RIVER United States California Rock fill Earth 1558 475 627 191 181 2870 3540 1979 (dam completed) No reported reservoir induced seismicity.374 ICOLD-CIGB 2012 NICHU Oshikiri Japan Kitakata, Fukushima Rock fill 1281 423 306 101 83 20 25 1995 (dam completed) No reported reservoir induced seismicity.375 ICOLD-CIGB 2012 NIKAPPU Toyohira Japan Sapporo, Hokkaido Arch 924 305 312 103 85 38 47 1972 (dam completed) No reported reservoir induced seismicity.376 ICOLD-CIGB 2012 NOVA PONTE Araguari Brazil Nearest town Nova Ponte, Minas Gerais Rock fill Earth 5249 1600 466 142 135 10377 12800 1994 (dam completed) Not Obtained 3.7 Reported Case377 ICOLD-CIGB 2012 NURAGHE ARRUBIU Flumendosa Italy Nuoro, Sardegna Arch 957 316 360 119 101 243 299 1959 (dam completed) No reported reservoir induced seismicity.378 Packer et al. 1979 & WNUREK Nurek Vakhsh Tadjikistan Nearest town Nurek, Tadjik. Earth fill 2310 704 984 300 215 8512 10500 1980 (dam completed) Sedimentary 4.5 Accepted case of reservoir induced macroearthquake activity.379 ICOLD-CIGB 2012 O SHAUGHNESSY TUOLUMNE RIVER United States California Gravity in Masonry or Concrete 830 274 397 131 113 372 459 1923 (dam completed) No reported reservoir induced seismicity.380 ICOLD-CIGB 2012 OBERAAR Oberaarbach Switzerland Innertkirchen, Bern Gravity in Masonry or Concrete 1593 526 303 100 90 49 61 1953 (dam completed) No reported reservoir induced seismicity.381 ICOLD-CIGB 2012 ODDATJØRN Blåsjø Oddeåna Norway Haugesund, Rogaland Rock fill 1423 470 424 140 122 2517 3105 1986 (dam completed) No reported reservoir induced seismicity.382 ICOLD-CIGB 2012 OGOCHI Tama Japan Ome, Tokyo Gravity in Masonry or Concrete 1069 353 451 149 131 153 189 1957 (dam completed) No reported reservoir induced seismicity.383 ICOLD-CIGB 2012 OKUTADAMI Tadami Japan Koide, Fukushima Gravity in Masonry or Concrete 1453 480 475 157 127 487 601 1961 (dam completed) No reported reservoir induced seismicity.384 ICOLD-CIGB 2012 OMACHI Takase Japan Omachi, Nagano Gravity in Masonry or Concrete 1054 348 324 107 89 27 34 1985 (dam completed) No reported reservoir induced seismicity.385 Packer et al. 1979 & WOROVILLE Lake Oroville Feather U.S.A. Zoned earth fill 6919 2109 771 235 204 3540 4367 1968 (dam completed) Metamorphic 5.7 Accepted case of reservoir induced macroearthquake activity.386 ICOLD-CIGB 2012 ORTIZ San Marcial Mexico Ortiz, Sonora Earth 13324 4400 363 120 114 24 30 1958 (dam completed) No reported reservoir induced seismicity.387 ICOLD-CIGB 2012 OSCHENIKSEE tr. Fragant Austria Obervellach, Carinthia Rock fill 1605 530 333 110 92 24 30 1979 (dam completed) No reported reservoir induced seismicity.
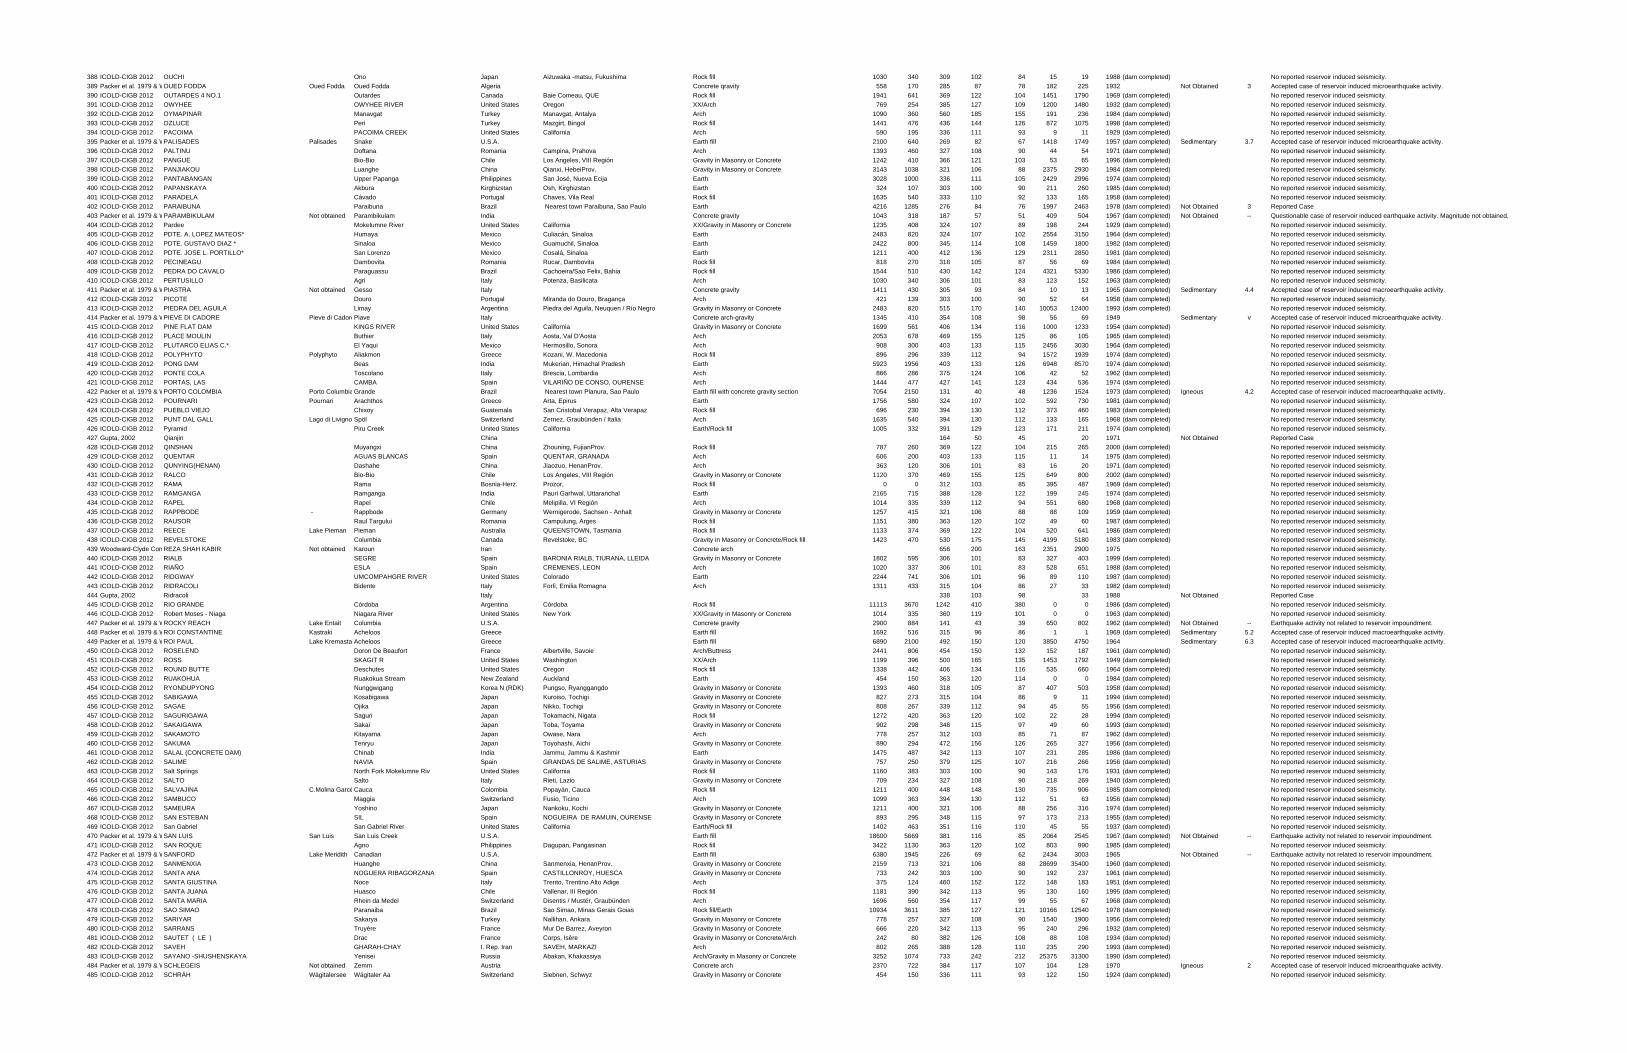
388 ICOLD-CIGB 2012 OUCHI Ono Japan Aizuwaka -matsu, Fukushima Rock fill 1030 340 309 102 84 15 19 1988 (dam completed) No reported reservoir induced seismicity.389 Packer et al. 1979 & WOUED FODDA Oued Fodda Oued Fodda Algeria Concrete qravity 558 170 285 87 78 182 225 1932 Not Obtained 3 Accepted case of reservoir induced microearthquake activity.390 ICOLD-CIGB 2012 OUTARDES 4 NO.1 Outardes Canada Baie Comeau, QUE Rock fill 1941 641 369 122 104 1451 1790 1969 (dam completed) No reported reservoir induced seismicity.391 ICOLD-CIGB 2012 OWYHEE OWYHEE RIVER United States Oregon XX/Arch 769 254 385 127 109 1200 1480 1932 (dam completed) No reported reservoir induced seismicity.392 ICOLD-CIGB 2012 OYMAPINAR Manavgat Turkey Manavgat, Antalya Arch 1090 360 560 185 155 191 236 1984 (dam completed) No reported reservoir induced seismicity.393 ICOLD-CIGB 2012 OZLUCE Peri Turkey Mazgirt, Bingol Rock fill 1441 476 436 144 126 872 1075 1998 (dam completed) No reported reservoir induced seismicity.394 ICOLD-CIGB 2012 PACOIMA PACOIMA CREEK United States California Arch 590 195 336 111 93 9 11 1929 (dam completed) No reported reservoir induced seismicity.395 Packer et al. 1979 & WPALISADES Palisades Snake U.S.A. Earth fill 2100 640 269 82 67 1418 1749 1957 (dam completed) Sedimentary 3.7 Accepted case of reservoir induced microearthquake activity.396 ICOLD-CIGB 2012 PALTINU Doftana Romania Campina, Prahova Arch 1393 460 327 108 90 44 54 1971 (dam completed) No reported reservoir induced seismicity.397 ICOLD-CIGB 2012 PANGUE Bio-Bio Chile Los Angeles, VIII Región Gravity in Masonry or Concrete 1242 410 366 121 103 53 65 1996 (dam completed) No reported reservoir induced seismicity.398 ICOLD-CIGB 2012 PANJIAKOU Luanghe China Qianxi, HebeiProv. Gravity in Masonry or Concrete 3143 1038 321 106 88 2375 2930 1984 (dam completed) No reported reservoir induced seismicity.399 ICOLD-CIGB 2012 PANTABANGAN Upper Papanga Philippines San José, Nueva Ecija Earth 3028 1000 336 111 105 2429 2996 1974 (dam completed) No reported reservoir induced seismicity.400 ICOLD-CIGB 2012 PAPANSKAYA Akbura Kirghizstan Osh, Kirghizstan Earth 324 107 303 100 90 211 260 1985 (dam completed) No reported reservoir induced seismicity.401 ICOLD-CIGB 2012 PARADELA Cávado Portugal Chaves, Vila Real Rock fill 1635 540 333 110 92 133 165 1958 (dam completed) No reported reservoir induced seismicity.402 ICOLD-CIGB 2012 PARAIBUNA Paraibuna Brazil Nearest town Paraibuna, Sao Paulo Earth 4216 1285 276 84 76 1997 2463 1978 (dam completed) Not Obtained 3 Reported Case403 Packer et al. 1979 & WPARAMBIKULAM Not obtained Parambikulam India Concrete gravity 1043 318 187 57 51 409 504 1967 (dam completed) Not Obtained -- Questionable case of reservoir induced earthquake activity. Magnitude not obtained.404 ICOLD-CIGB 2012 Pardee Mokelumne River United States California XX/Gravity in Masonry or Concrete 1235 408 324 107 89 198 244 1929 (dam completed) No reported reservoir induced seismicity.405 ICOLD-CIGB 2012 PDTE. A. LOPEZ MATEOS* Humaya Mexico Culiacán, Sinaloa Earth 2483 820 324 107 102 2554 3150 1964 (dam completed) No reported reservoir induced seismicity.406 ICOLD-CIGB 2012 PDTE. GUSTAVO DIAZ * Sinaloa Mexico Guamuchil, Sinaloa Earth 2422 800 345 114 108 1459 1800 1982 (dam completed) No reported reservoir induced seismicity.407 ICOLD-CIGB 2012 PDTE. JOSE L. PORTILLO* San Lorenzo Mexico Cosalá, Sinaloa Earth 1211 400 412 136 129 2311 2850 1981 (dam completed) No reported reservoir induced seismicity.408 ICOLD-CIGB 2012 PECINEAGU Dambovita Romania Rucar, Dambovita Rock fill 818 270 318 105 87 56 69 1984 (dam completed) No reported reservoir induced seismicity.409 ICOLD-CIGB 2012 PEDRA DO CAVALO Paraguassu Brazil Cachoeira/Sao Felix, Bahia Rock fill 1544 510 430 142 124 4321 5330 1986 (dam completed) No reported reservoir induced seismicity.410 ICOLD-CIGB 2012 PERTUSILLO Agri Italy Potenza, Basilicata Arch 1030 340 306 101 83 123 152 1963 (dam completed) No reported reservoir induced seismicity.411 Packer et al. 1979 & WPIASTRA Not obtained Gesso Italy Concrete gravity 1411 430 305 93 84 10 13 1965 (dam completed) Sedimentary 4.4 Accepted case of reservoir induced macroearthquake activity.412 ICOLD-CIGB 2012 PICOTE Douro Portugal Miranda do Douro, Bragança Arch 421 139 303 100 90 52 64 1958 (dam completed) No reported reservoir induced seismicity.413 ICOLD-CIGB 2012 PIEDRA DEL AGUILA Limay Argentina Piedra del Aguila, Neuquen / Río Negro Gravity in Masonry or Concrete 2483 820 515 170 140 10053 12400 1993 (dam completed) No reported reservoir induced seismicity.414 Packer et al. 1979 & WPIEVE DI CADORE Pieve di CadorePiave Italy Concrete arch-gravity 1345 410 354 108 98 56 69 1949 Sedimentary v Accepted case of reservoir induced microearthquake activity.415 ICOLD-CIGB 2012 PINE FLAT DAM KINGS RIVER United States California Gravity in Masonry or Concrete 1699 561 406 134 116 1000 1233 1954 (dam completed) No reported reservoir induced seismicity.416 ICOLD-CIGB 2012 PLACE MOULIN Buthier Italy Aosta, Val D'Aosta Arch 2053 678 469 155 125 86 105 1965 (dam completed) No reported reservoir induced seismicity.417 ICOLD-CIGB 2012 PLUTARCO ELIAS C.* El Yaqui Mexico Hermosillo, Sonora Arch 908 300 403 133 115 2456 3030 1964 (dam completed) No reported reservoir induced seismicity.418 ICOLD-CIGB 2012 POLYPHYTO Polyphyto Aliakmon Greece Kozani, W. Macedonia Rock fill 896 296 339 112 94 1572 1939 1974 (dam completed) No reported reservoir induced seismicity.419 ICOLD-CIGB 2012 PONG DAM Beas India Mukerian, Himachal Pradesh Earth 5923 1956 403 133 126 6948 8570 1974 (dam completed) No reported reservoir induced seismicity.420 ICOLD-CIGB 2012 PONTE COLA Toscolano Italy Brescia, Lombardia Arch 866 286 375 124 106 42 52 1962 (dam completed) No reported reservoir induced seismicity.421 ICOLD-CIGB 2012 PORTAS, LAS CAMBA Spain VILARIÑO DE CONSO, OURENSE Arch 1444 477 427 141 123 434 536 1974 (dam completed) No reported reservoir induced seismicity.422 Packer et al. 1979 & WPORTO COLOMBIA Porto ColumbiaGrande Brazil Nearest town Planura, Sao Paulo Earth fill with concrete gravity section 7054 2150 131 40 48 1236 1524 1973 (dam completed) Igneous 4.2 Accepted case of reservoir induced macroearthquake activity.423 ICOLD-CIGB 2012 POURNARI Pournari Arachthos Greece Arta, Epirus Earth 1756 580 324 107 102 592 730 1981 (dam completed) No reported reservoir induced seismicity.424 ICOLD-CIGB 2012 PUEBLO VIEJO Chixoy Guatemala San Cristobal Verapaz, Alta Verapaz Rock fill 696 230 394 130 112 373 460 1983 (dam completed) No reported reservoir induced seismicity.425 ICOLD-CIGB 2012 PUNT DAL GALL Lago di Livigno Spöl Switzerland Zernez, Graubünden / Italia Arch 1635 540 394 130 112 133 165 1968 (dam completed) No reported reservoir induced seismicity.426 ICOLD-CIGB 2012 Pyramid Piru Creek United States California Earth/Rock fill 1005 332 391 129 123 171 211 1974 (dam completed) No reported reservoir induced seismicity.427 Gupta, 2002 Qianjin China 164 50 45 20 1971 Not Obtained Reported Case428 ICOLD-CIGB 2012 QINSHAN Muyangxi China Zhouning, FujianProv. Rock fill 787 260 369 122 104 215 265 2000 (dam completed) No reported reservoir induced seismicity.429 ICOLD-CIGB 2012 QUENTAR AGUAS BLANCAS Spain QUENTAR, GRANADA Arch 606 200 403 133 115 11 14 1975 (dam completed) No reported reservoir induced seismicity.430 ICOLD-CIGB 2012 QUNYING(HENAN) Dashahe China Jiaozuo, HenanProv. Arch 363 120 306 101 83 16 20 1971 (dam completed) No reported reservoir induced seismicity.431 ICOLD-CIGB 2012 RALCO Bio-Bio Chile Los Angeles, VIII Región Gravity in Masonry or Concrete 1120 370 469 155 125 649 800 2002 (dam completed) No reported reservoir induced seismicity.432 ICOLD-CIGB 2012 RAMA Rama Bosnia-Herz. Prozor, Rock fill 0 0 312 103 85 395 487 1969 (dam completed) No reported reservoir induced seismicity.433 ICOLD-CIGB 2012 RAMGANGA Ramganga India Pauri Garhwal, Uttaranchal Earth 2165 715 388 128 122 199 245 1974 (dam completed) No reported reservoir induced seismicity.434 ICOLD-CIGB 2012 RAPEL Rapel Chile Melipilla, VI Región Arch 1014 335 339 112 94 551 680 1968 (dam completed) No reported reservoir induced seismicity.435 ICOLD-CIGB 2012 RAPPBODE - Rappbode Germany Wernigerode, Sachsen - Anhalt Gravity in Masonry or Concrete 1257 415 321 106 88 88 109 1959 (dam completed) No reported reservoir induced seismicity.436 ICOLD-CIGB 2012 RAUSOR Raul Targului Romania Campulung, Arges Rock fill 1151 380 363 120 102 49 60 1987 (dam completed) No reported reservoir induced seismicity.437 ICOLD-CIGB 2012 REECE Lake Pieman Pieman Australia QUEENSTOWN, Tasmania Rock fill 1133 374 369 122 104 520 641 1986 (dam completed) No reported reservoir induced seismicity.438 ICOLD-CIGB 2012 REVELSTOKE Columbia Canada Revelstoke, BC Gravity in Masonry or Concrete/Rock fill 1423 470 530 175 145 4199 5180 1983 (dam completed) No reported reservoir induced seismicity.439 Woodward-Clyde Con REZA SHAH KABIR Not obtained Karoun Iran Concrete arch 656 200 163 2351 2900 1975 No reported reservoir induced seismicity.440 ICOLD-CIGB 2012 RIALB SEGRE Spain BARONIA RIALB, TIURANA, LLEIDA Gravity in Masonry or Concrete 1802 595 306 101 83 327 403 1999 (dam completed) No reported reservoir induced seismicity.441 ICOLD-CIGB 2012 RIAÑO ESLA Spain CREMENES, LEON Arch 1020 337 306 101 83 528 651 1988 (dam completed) No reported reservoir induced seismicity.442 ICOLD-CIGB 2012 RIDGWAY UMCOMPAHGRE RIVER United States Colorado Earth 2244 741 306 101 96 89 110 1987 (dam completed) No reported reservoir induced seismicity.443 ICOLD-CIGB 2012 RIDRACOLI Bidente Italy Forlì, Emilia Romagna Arch 1311 433 315 104 86 27 33 1982 (dam completed) No reported reservoir induced seismicity.444 Gupta, 2002 Ridracoli Italy 338 103 98 33 1988 Not Obtained Reported Case445 ICOLD-CIGB 2012 RIO GRANDE Córdoba Argentina Córdoba Rock fill 11113 3670 1242 410 380 0 0 1986 (dam completed) No reported reservoir induced seismicity.446 ICOLD-CIGB 2012 Robert Moses - Niaga Niagara River United States New York XX/Gravity in Masonry or Concrete 1014 335 360 119 101 0 0 1963 (dam completed) No reported reservoir induced seismicity.447 Packer et al. 1979 & WROCKY REACH Lake Entait Columbia U.S.A. Concrete gravity 2900 884 141 43 39 650 802 1962 (dam completed) Not Obtained -- Earthquake activity not related to reservoir impoundment.448 Packer et al. 1979 & WROI CONSTANTINE Kastraki Acheloos Greece Earth fill 1692 516 315 96 86 1 1 1969 (dam completed) Sedimentary 5.2 Accepted case of reservoir induced macroearthquake activity.449 Packer et al. 1979 & WROI PAUL Lake Kremasta Acheloos Greece Earth fill 6890 2100 492 150 120 3850 4750 1964 Sedimentary 6.3 Accepted case of reservoir induced macroearthquake activity.450 ICOLD-CIGB 2012 ROSELEND Doron De Beaufort France Albertville, Savoie Arch/Buttress 2441 806 454 150 132 152 187 1961 (dam completed) No reported reservoir induced seismicity.451 ICOLD-CIGB 2012 ROSS SKAGIT R United States Washington XX/Arch 1199 396 500 165 135 1453 1792 1949 (dam completed) No reported reservoir induced seismicity.452 ICOLD-CIGB 2012 ROUND BUTTE Deschutes United States Oregon Rock fill 1338 442 406 134 116 535 660 1964 (dam completed) No reported reservoir induced seismicity.453 ICOLD-CIGB 2012 RUAKOHUA Ruakokua Stream New Zealand Auckland Earth 454 150 363 120 114 0 0 1984 (dam completed) No reported reservoir induced seismicity.454 ICOLD-CIGB 2012 RYONDUPYONG Nunggwigang Korea N (RDK) Pungso, Ryanggangdo Gravity in Masonry or Concrete 1393 460 318 105 87 407 503 1958 (dam completed) No reported reservoir induced seismicity.455 ICOLD-CIGB 2012 SABIGAWA Kosabigawa Japan Kuroiso, Tochigi Gravity in Masonry or Concrete 827 273 315 104 86 9 11 1994 (dam completed) No reported reservoir induced seismicity.456 ICOLD-CIGB 2012 SAGAE Ojika Japan Nikko, Tochigi Gravity in Masonry or Concrete 808 267 339 112 94 45 55 1956 (dam completed) No reported reservoir induced seismicity.457 ICOLD-CIGB 2012 SAGURIGAWA Saguri Japan Tokamachi, Nigata Rock fill 1272 420 363 120 102 22 28 1994 (dam completed) No reported reservoir induced seismicity.458 ICOLD-CIGB 2012 SAKAIGAWA Sakai Japan Toba, Toyama Gravity in Masonry or Concrete 902 298 348 115 97 49 60 1993 (dam completed) No reported reservoir induced seismicity.459 ICOLD-CIGB 2012 SAKAMOTO Kitayama Japan Owase, Nara Arch 778 257 312 103 85 71 87 1962 (dam completed) No reported reservoir induced seismicity.460 ICOLD-CIGB 2012 SAKUMA Tenryu Japan Toyohashi, Aichi Gravity in Masonry or Concrete 890 294 472 156 126 265 327 1956 (dam completed) No reported reservoir induced seismicity.461 ICOLD-CIGB 2012 SALAL (CONCRETE DAM) Chinab India Jammu, Jammu & Kashmir Earth 1475 487 342 113 107 231 285 1986 (dam completed) No reported reservoir induced seismicity.462 ICOLD-CIGB 2012 SALIME NAVIA Spain GRANDAS DE SALIME, ASTURIAS Gravity in Masonry or Concrete 757 250 379 125 107 216 266 1956 (dam completed) No reported reservoir induced seismicity.463 ICOLD-CIGB 2012 Salt Springs North Fork Mokelumne Riv United States California Rock fill 1160 383 303 100 90 143 176 1931 (dam completed) No reported reservoir induced seismicity.464 ICOLD-CIGB 2012 SALTO Salto Italy Rieti, Lazio Gravity in Masonry or Concrete 709 234 327 108 90 218 269 1940 (dam completed) No reported reservoir induced seismicity.465 ICOLD-CIGB 2012 SALVAJINA C.Molina GarcéCauca Colombia Popayán, Cauca Rock fill 1211 400 448 148 130 735 906 1985 (dam completed) No reported reservoir induced seismicity.466 ICOLD-CIGB 2012 SAMBUCO Maggia Switzerland Fusio, Ticino Arch 1099 363 394 130 112 51 63 1956 (dam completed) No reported reservoir induced seismicity.467 ICOLD-CIGB 2012 SAMEURA Yoshino Japan Nankoku, Kochi Gravity in Masonry or Concrete 1211 400 321 106 88 256 316 1974 (dam completed) No reported reservoir induced seismicity.468 ICOLD-CIGB 2012 SAN ESTEBAN SIL Spain NOGUEIRA DE RAMUIN, OURENSE Gravity in Masonry or Concrete 893 295 348 115 97 173 213 1955 (dam completed) No reported reservoir induced seismicity.469 ICOLD-CIGB 2012 San Gabriel San Gabriel River United States California Earth/Rock fill 1402 463 351 116 110 45 55 1937 (dam completed) No reported reservoir induced seismicity.470 Packer et al. 1979 & WSAN LUIS San Luis San Luis Creek U.S.A. Earth fill 18600 5669 381 116 85 2064 2545 1967 (dam completed) Not Obtained -- Earthquake activity not related to reservoir impoundment.471 ICOLD-CIGB 2012 SAN ROQUE Agno Philippines Dagupan, Pangasinan Rock fill 3422 1130 363 120 102 803 990 1985 (dam completed) No reported reservoir induced seismicity.472 Packer et al. 1979 & WSANFORD Lake Meridith Canadian U.S.A. Earth fill 6380 1945 226 69 62 2434 3003 1965 Not Obtained -- Earthquake activity not related to reservoir impoundment.473 ICOLD-CIGB 2012 SANMENXIA Huanghe China Sanmenxia, HenanProv. Gravity in Masonry or Concrete 2159 713 321 106 88 28699 35400 1960 (dam completed) No reported reservoir induced seismicity.474 ICOLD-CIGB 2012 SANTA ANA NOGUERA RIBAGORZANA Spain CASTILLONROY, HUESCA Gravity in Masonry or Concrete 733 242 303 100 90 192 237 1961 (dam completed) No reported reservoir induced seismicity.475 ICOLD-CIGB 2012 SANTA GIUSTINA Noce Italy Trento, Trentino Alto Adige Arch 375 124 460 152 122 148 183 1951 (dam completed) No reported reservoir induced seismicity.476 ICOLD-CIGB 2012 SANTA JUANA Huasco Chile Vallenar, III Región Rock fill 1181 390 342 113 95 130 160 1995 (dam completed) No reported reservoir induced seismicity.477 ICOLD-CIGB 2012 SANTA MARIA Rhein da Medel Switzerland Disentis / Mustér, Graubünden Arch 1696 560 354 117 99 55 67 1968 (dam completed) No reported reservoir induced seismicity.478 ICOLD-CIGB 2012 SAO SIMAO Paranaiba Brazil Sao Simao, Minas Gerais Goias Rock fill/Earth 10934 3611 385 127 121 10166 12540 1978 (dam completed) No reported reservoir induced seismicity.479 ICOLD-CIGB 2012 SARIYAR Sakarya Turkey Nallihan, Ankara Gravity in Masonry or Concrete 778 257 327 108 90 1540 1900 1956 (dam completed) No reported reservoir induced seismicity.480 ICOLD-CIGB 2012 SARRANS Truyère France Mur De Barrez, Aveyron Gravity in Masonry or Concrete 666 220 342 113 95 240 296 1932 (dam completed) No reported reservoir induced seismicity.481 ICOLD-CIGB 2012 SAUTET ( LE ) Drac France Corps, Isère Gravity in Masonry or Concrete/Arch 242 80 382 126 108 88 108 1934 (dam completed) No reported reservoir induced seismicity.482 ICOLD-CIGB 2012 SAVEH GHARAH-CHAY I. Rep. Iran SAVEH, MARKAZI Arch 802 265 388 128 110 235 290 1993 (dam completed) No reported reservoir induced seismicity.483 ICOLD-CIGB 2012 SAYANO -SHUSHENSKAYA Yenisei Russia Abakan, Khakassiya Arch/Gravity in Masonry or Concrete 3252 1074 733 242 212 25375 31300 1990 (dam completed) No reported reservoir induced seismicity.484 Packer et al. 1979 & WSCHLEGEIS Not obtained Zemm Austria Concrete arch 2370 722 384 117 107 104 128 1970 Igneous 2 Accepted case of reservoir induced microearthquake activity.485 ICOLD-CIGB 2012 SCHRÄH Wägitalersee Wägitaler Aa Switzerland Siebnen, Schwyz Gravity in Masonry or Concrete 454 150 336 111 93 122 150 1924 (dam completed) No reported reservoir induced seismicity.
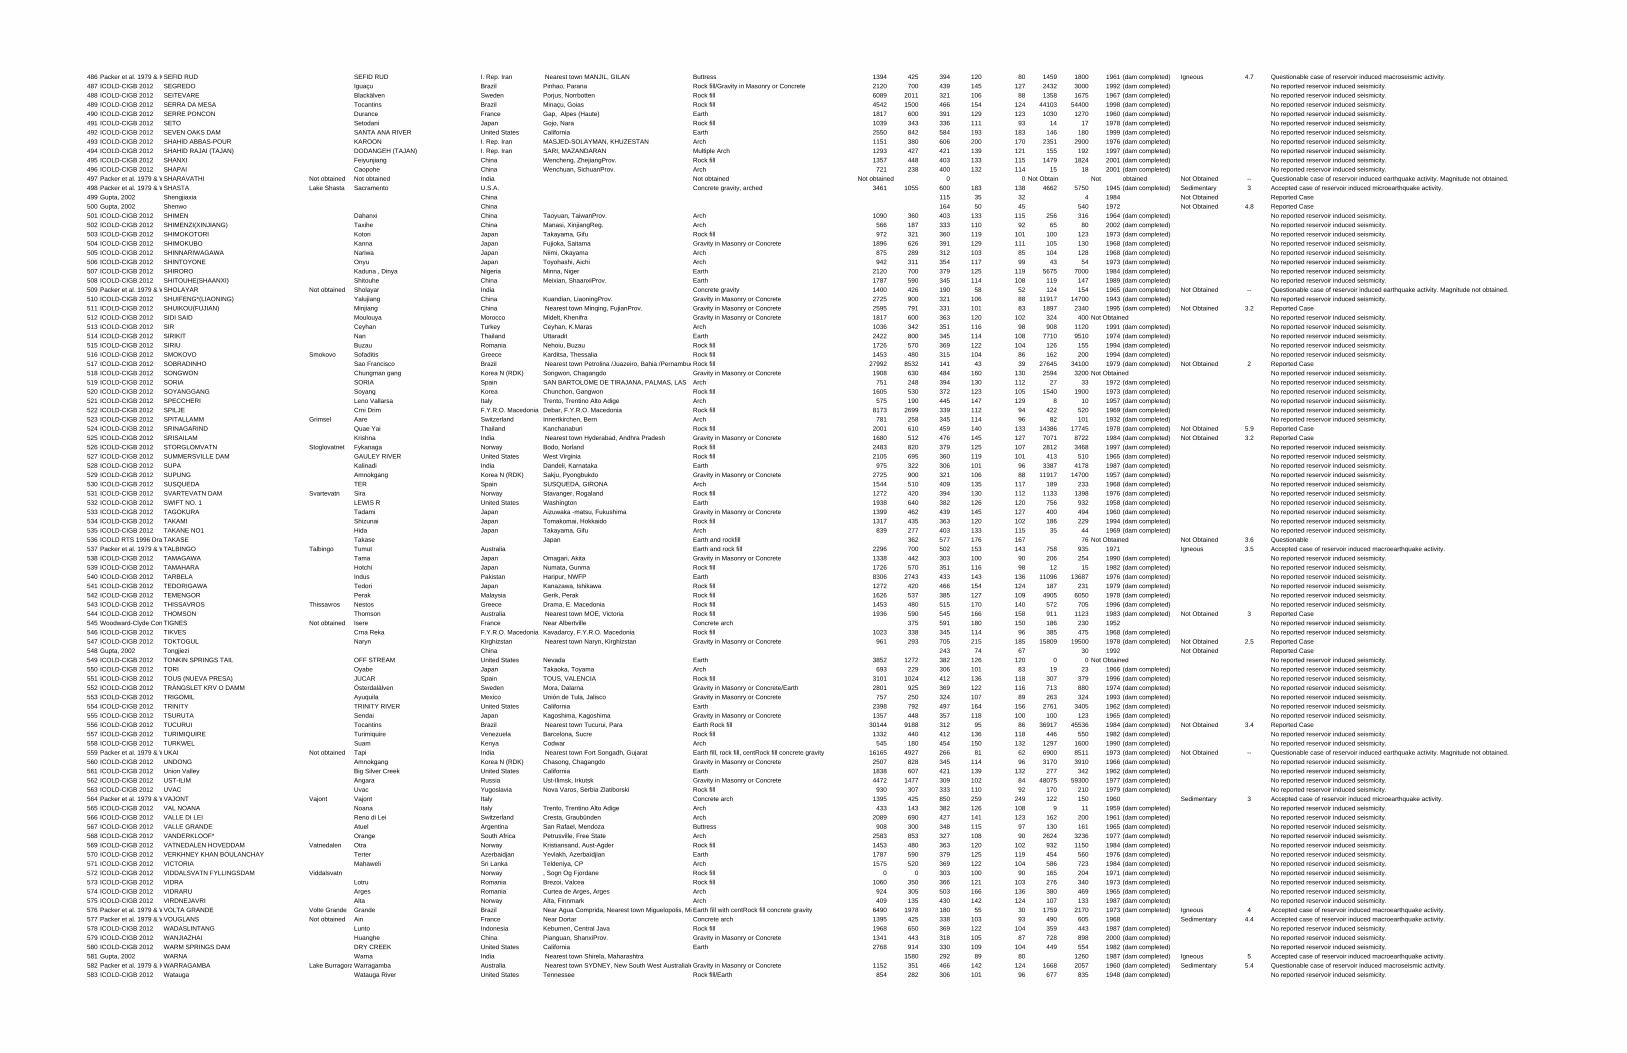
486 Packer et al. 1979 & ICSEFID RUD SEFID RUD I. Rep. Iran Nearest town MANJIL, GILAN Buttress 1394 425 394 120 80 1459 1800 1961 (dam completed) Igneous 4.7 Questionable case of reservoir induced macroseismic activity.487 ICOLD-CIGB 2012 SEGREDO Iguaçu Brazil Pinhao, Parana Rock fill/Gravity in Masonry or Concrete 2120 700 439 145 127 2432 3000 1992 (dam completed) No reported reservoir induced seismicity.488 ICOLD-CIGB 2012 SEITEVARE Blackälven Sweden Porjus, Norrbotten Rock fill 6089 2011 321 106 88 1358 1675 1967 (dam completed) No reported reservoir induced seismicity.489 ICOLD-CIGB 2012 SERRA DA MESA Tocantins Brazil Minaçu, Goias Rock fill 4542 1500 466 154 124 44103 54400 1998 (dam completed) No reported reservoir induced seismicity.490 ICOLD-CIGB 2012 SERRE PONCON Durance France Gap, Alpes (Haute) Earth 1817 600 391 129 123 1030 1270 1960 (dam completed) No reported reservoir induced seismicity.491 ICOLD-CIGB 2012 SETO Setodani Japan Gojo, Nara Rock fill 1039 343 336 111 93 14 17 1978 (dam completed) No reported reservoir induced seismicity.492 ICOLD-CIGB 2012 SEVEN OAKS DAM SANTA ANA RIVER United States California Earth 2550 842 584 193 183 146 180 1999 (dam completed) No reported reservoir induced seismicity.493 ICOLD-CIGB 2012 SHAHID ABBAS-POUR KAROON I. Rep. Iran MASJED-SOLAYMAN, KHUZESTAN Arch 1151 380 606 200 170 2351 2900 1976 (dam completed) No reported reservoir induced seismicity.494 ICOLD-CIGB 2012 SHAHID RAJAI (TAJAN) DODANGEH (TAJAN) I. Rep. Iran SARI, MAZANDARAN Multiple Arch 1293 427 421 139 121 155 192 1997 (dam completed) No reported reservoir induced seismicity.495 ICOLD-CIGB 2012 SHANXI Feiyunjiang China Wencheng, ZhejiangProv. Rock fill 1357 448 403 133 115 1479 1824 2001 (dam completed) No reported reservoir induced seismicity.496 ICOLD-CIGB 2012 SHAPAI Caopohe China Wenchuan, SichuanProv. Arch 721 238 400 132 114 15 18 2001 (dam completed) No reported reservoir induced seismicity.497 Packer et al. 1979 & WSHARAVATHI Not obtained Not obtained India Not obtained Not obtained 0 0 Not Obtain Not obtained Not Obtained -- Questionable case of reservoir induced earthquake activity. Magnitude not obtained.498 Packer et al. 1979 & WSHASTA Lake Shasta Sacramento U.S.A. Concrete gravity, arched 3461 1055 600 183 138 4662 5750 1945 (dam completed) Sedimentary 3 Accepted case of reservoir induced microearthquake activity.499 Gupta, 2002 Shengjiaxia China 115 35 32 4 1984 Not Obtained Reported Case500 Gupta, 2002 Shenwo China 164 50 45 540 1972 Not Obtained 4.8 Reported Case501 ICOLD-CIGB 2012 SHIMEN Dahanxi China Taoyuan, TaiwanProv. Arch 1090 360 403 133 115 256 316 1964 (dam completed) No reported reservoir induced seismicity.502 ICOLD-CIGB 2012 SHIMENZI(XINJIANG) Taxihe China Manasi, XinjiangReg. Arch 566 187 333 110 92 65 80 2002 (dam completed) No reported reservoir induced seismicity.503 ICOLD-CIGB 2012 SHIMOKOTORI Kotori Japan Takayama, Gifu Rock fill 972 321 360 119 101 100 123 1973 (dam completed) No reported reservoir induced seismicity.504 ICOLD-CIGB 2012 SHIMOKUBO Kanna Japan Fujioka, Saitama Gravity in Masonry or Concrete 1896 626 391 129 111 105 130 1968 (dam completed) No reported reservoir induced seismicity.505 ICOLD-CIGB 2012 SHINNARIWAGAWA Nariwa Japan Niimi, Okayama Arch 875 289 312 103 85 104 128 1968 (dam completed) No reported reservoir induced seismicity.506 ICOLD-CIGB 2012 SHINTOYONE Onyu Japan Toyohashi, Aichi Arch 942 311 354 117 99 43 54 1973 (dam completed) No reported reservoir induced seismicity.507 ICOLD-CIGB 2012 SHIRORO Kaduna , Dinya Nigeria Minna, Niger Earth 2120 700 379 125 119 5675 7000 1984 (dam completed) No reported reservoir induced seismicity.508 ICOLD-CIGB 2012 SHITOUHE(SHAANXI) Shitouhe China Meixian, ShaanxiProv. Earth 1787 590 345 114 108 119 147 1989 (dam completed) No reported reservoir induced seismicity.509 Packer et al. 1979 & WSHOLAYAR Not obtained Sholayar India Concrete gravity 1400 426 190 58 52 124 154 1965 (dam completed) Not Obtained -- Questionable case of reservoir induced earthquake activity. Magnitude not obtained.510 ICOLD-CIGB 2012 SHUIFENG*(LIAONING) Yalujiang China Kuandian, LiaoningProv. Gravity in Masonry or Concrete 2725 900 321 106 88 11917 14700 1943 (dam completed) No reported reservoir induced seismicity.511 ICOLD-CIGB 2012 SHUIKOU(FUJIAN) Minjiang China Nearest town Minqing, FujianProv. Gravity in Masonry or Concrete 2595 791 331 101 83 1897 2340 1995 (dam completed) Not Obtained 3.2 Reported Case512 ICOLD-CIGB 2012 SIDI SAID Moulouya Morocco Midelt, Khenifra Gravity in Masonry or Concrete 1817 600 363 120 102 324 400 Not Obtained No reported reservoir induced seismicity.513 ICOLD-CIGB 2012 SIR Ceyhan Turkey Ceyhan, K.Maras Arch 1036 342 351 116 98 908 1120 1991 (dam completed) No reported reservoir induced seismicity.514 ICOLD-CIGB 2012 SIRIKIT Nan Thailand Uttaradit Earth 2422 800 345 114 108 7710 9510 1974 (dam completed) No reported reservoir induced seismicity.515 ICOLD-CIGB 2012 SIRIU Buzau Romania Nehoiu, Buzau Rock fill 1726 570 369 122 104 126 155 1994 (dam completed) No reported reservoir induced seismicity.516 ICOLD-CIGB 2012 SMOKOVO Smokovo Sofaditis Greece Karditsa, Thessalia Rock fill 1453 480 315 104 86 162 200 1994 (dam completed) No reported reservoir induced seismicity.517 ICOLD-CIGB 2012 SOBRADINHO Sao Francisco Brazil Nearest town Petrolina /Juazeiro, Bahia /PernambucRock fill 27992 8532 141 43 39 27645 34100 1979 (dam completed) Not Obtained 2 Reported Case518 ICOLD-CIGB 2012 SONGWON Chungman gang Korea N (RDK) Songwon, Chagangdo Gravity in Masonry or Concrete 1908 630 484 160 130 2594 3200 Not Obtained No reported reservoir induced seismicity.519 ICOLD-CIGB 2012 SORIA SORIA Spain SAN BARTOLOME DE TIRAJANA, PALMAS, LAS Arch 751 248 394 130 112 27 33 1972 (dam completed) No reported reservoir induced seismicity.520 ICOLD-CIGB 2012 SOYANGGANG Soyang Korea Chunchon, Gangwon Rock fill 1605 530 372 123 105 1540 1900 1973 (dam completed) No reported reservoir induced seismicity.521 ICOLD-CIGB 2012 SPECCHERI Leno Vallarsa Italy Trento, Trentino Alto Adige Arch 575 190 445 147 129 8 10 1957 (dam completed) No reported reservoir induced seismicity.522 ICOLD-CIGB 2012 SPILJE Crni Drim F.Y.R.O. Macedonia Debar, F.Y.R.O. Macedonia Rock fill 8173 2699 339 112 94 422 520 1969 (dam completed) No reported reservoir induced seismicity.523 ICOLD-CIGB 2012 SPITALLAMM Grimsel Aare Switzerland Innertkirchen, Bern Arch 781 258 345 114 96 82 101 1932 (dam completed) No reported reservoir induced seismicity.524 ICOLD-CIGB 2012 SRINAGARIND Quae Yai Thailand Kanchanaburi Rock fill 2001 610 459 140 133 14386 17745 1978 (dam completed) Not Obtained 5.9 Reported Case525 ICOLD-CIGB 2012 SRISAILAM Krishna India Nearest town Hyderabad, Andhra Pradesh Gravity in Masonry or Concrete 1680 512 476 145 127 7071 8722 1984 (dam completed) Not Obtained 3.2 Reported Case526 ICOLD-CIGB 2012 STORGLOMVATN Stoglovatnet Fykanaga Norway Bodo, Norland Rock fill 2483 820 379 125 107 2812 3468 1997 (dam completed) No reported reservoir induced seismicity.527 ICOLD-CIGB 2012 SUMMERSVILLE DAM GAULEY RIVER United States West Virginia Rock fill 2105 695 360 119 101 413 510 1965 (dam completed) No reported reservoir induced seismicity.528 ICOLD-CIGB 2012 SUPA Kalinadi India Dandeli, Karnataka Earth 975 322 306 101 96 3387 4178 1987 (dam completed) No reported reservoir induced seismicity.529 ICOLD-CIGB 2012 SUPUNG Amnokgang Korea N (RDK) Sakju, Pyongbukdo Gravity in Masonry or Concrete 2725 900 321 106 88 11917 14700 1957 (dam completed) No reported reservoir induced seismicity.530 ICOLD-CIGB 2012 SUSQUEDA TER Spain SUSQUEDA, GIRONA Arch 1544 510 409 135 117 189 233 1968 (dam completed) No reported reservoir induced seismicity.531 ICOLD-CIGB 2012 SVARTEVATN DAM Svartevatn Sira Norway Stavanger, Rogaland Rock fill 1272 420 394 130 112 1133 1398 1976 (dam completed) No reported reservoir induced seismicity.532 ICOLD-CIGB 2012 SWIFT NO. 1 LEWIS R United States Washington Earth 1938 640 382 126 120 756 932 1958 (dam completed) No reported reservoir induced seismicity.533 ICOLD-CIGB 2012 TAGOKURA Tadami Japan Aizuwaka -matsu, Fukushima Gravity in Masonry or Concrete 1399 462 439 145 127 400 494 1960 (dam completed) No reported reservoir induced seismicity.534 ICOLD-CIGB 2012 TAKAMI Shizunai Japan Tomakomai, Hokkaido Rock fill 1317 435 363 120 102 186 229 1994 (dam completed) No reported reservoir induced seismicity.535 ICOLD-CIGB 2012 TAKANE NO1 Hida Japan Takayama, Gifu Arch 839 277 403 133 115 35 44 1969 (dam completed) No reported reservoir induced seismicity.536 ICOLD RTS 1996 Dra TAKASE Takase Japan Earth and rockfill 362 577 176 167 76 Not Obtained Not Obtained 3.6 Questionable537 Packer et al. 1979 & WTALBINGO Talbingo Tumut Australia Earth and rock fill 2296 700 502 153 143 758 935 1971 Igneous 3.5 Accepted case of reservoir induced macroearthquake activity.538 ICOLD-CIGB 2012 TAMAGAWA Tama Japan Omagari, Akita Gravity in Masonry or Concrete 1338 442 303 100 90 206 254 1990 (dam completed) No reported reservoir induced seismicity.539 ICOLD-CIGB 2012 TAMAHARA Hotchi Japan Numata, Gunma Rock fill 1726 570 351 116 98 12 15 1982 (dam completed) No reported reservoir induced seismicity.540 ICOLD-CIGB 2012 TARBELA Indus Pakistan Haripur, NWFP Earth 8306 2743 433 143 136 11096 13687 1976 (dam completed) No reported reservoir induced seismicity.541 ICOLD-CIGB 2012 TEDORIGAWA Tedori Japan Kanazawa, Ishikawa Rock fill 1272 420 466 154 124 187 231 1979 (dam completed) No reported reservoir induced seismicity.542 ICOLD-CIGB 2012 TEMENGOR Perak Malaysia Gerik, Perak Rock fill 1626 537 385 127 109 4905 6050 1978 (dam completed) No reported reservoir induced seismicity.543 ICOLD-CIGB 2012 THISSAVROS Thissavros Nestos Greece Drama, E. Macedonia Rock fill 1453 480 515 170 140 572 705 1996 (dam completed) No reported reservoir induced seismicity.544 ICOLD-CIGB 2012 THOMSON Thomson Australia Nearest town MOE, Victoria Rock fill 1936 590 545 166 158 911 1123 1983 (dam completed) Not Obtained 3 Reported Case545 Woodward-Clyde Con TIGNES Not obtained Isere France Near Albertville Concrete arch 375 591 180 150 186 230 1952 No reported reservoir induced seismicity.546 ICOLD-CIGB 2012 TIKVES Crna Reka F.Y.R.O. Macedonia Kavadarcy, F.Y.R.O. Macedonia Rock fill 1023 338 345 114 96 385 475 1968 (dam completed) No reported reservoir induced seismicity.547 ICOLD-CIGB 2012 TOKTOGUL Naryn Kirghizstan Nearest town Naryn, Kirghizstan Gravity in Masonry or Concrete 961 293 705 215 185 15809 19500 1978 (dam completed) Not Obtained 2.5 Reported Case548 Gupta, 2002 Tongjiezi China 243 74 67 30 1992 Not Obtained Reported Case549 ICOLD-CIGB 2012 TONKIN SPRINGS TAIL OFF STREAM United States Nevada Earth 3852 1272 382 126 120 0 0 Not Obtained No reported reservoir induced seismicity.550 ICOLD-CIGB 2012 TORI Oyabe Japan Takaoka, Toyama Arch 693 229 306 101 83 19 23 1966 (dam completed) No reported reservoir induced seismicity.551 ICOLD-CIGB 2012 TOUS (NUEVA PRESA) JUCAR Spain TOUS, VALENCIA Rock fill 3101 1024 412 136 118 307 379 1996 (dam completed) No reported reservoir induced seismicity.552 ICOLD-CIGB 2012 TRÄNGSLET KRV O DAMM Österdalälven Sweden Mora, Dalarna Gravity in Masonry or Concrete/Earth 2801 925 369 122 116 713 880 1974 (dam completed) No reported reservoir induced seismicity.553 ICOLD-CIGB 2012 TRIGOMIL Ayuquila Mexico Unión de Tula, Jalisco Gravity in Masonry or Concrete 757 250 324 107 89 263 324 1993 (dam completed) No reported reservoir induced seismicity.554 ICOLD-CIGB 2012 TRINITY TRINITY RIVER United States California Earth 2398 792 497 164 156 2761 3405 1962 (dam completed) No reported reservoir induced seismicity.555 ICOLD-CIGB 2012 TSURUTA Sendai Japan Kagoshima, Kagoshima Gravity in Masonry or Concrete 1357 448 357 118 100 100 123 1965 (dam completed) No reported reservoir induced seismicity.556 ICOLD-CIGB 2012 TUCURUI Tocantins Brazil Nearest town Tucurui, Para Earth Rock fill 30144 9188 312 95 86 36917 45536 1984 (dam completed) Not Obtained 3.4 Reported Case557 ICOLD-CIGB 2012 TURIMIQUIRE Turimiquire Venezuela Barcelona, Sucre Rock fill 1332 440 412 136 118 446 550 1982 (dam completed) No reported reservoir induced seismicity.558 ICOLD-CIGB 2012 TURKWEL Suam Kenya Codwar Arch 545 180 454 150 132 1297 1600 1990 (dam completed) No reported reservoir induced seismicity.559 Packer et al. 1979 & WUKAI Not obtained Tapi India Nearest town Fort Songadh, Gujarat Earth fill, rock fill, centRock fill concrete gravity 16165 4927 266 81 62 6900 8511 1973 (dam completed) Not Obtained -- Questionable case of reservoir induced earthquake activity. Magnitude not obtained.560 ICOLD-CIGB 2012 UNDONG Amnokgang Korea N (RDK) Chasong, Chagangdo Gravity in Masonry or Concrete 2507 828 345 114 96 3170 3910 1966 (dam completed) No reported reservoir induced seismicity.561 ICOLD-CIGB 2012 Union Valley Big Silver Creek United States California Earth 1838 607 421 139 132 277 342 1962 (dam completed) No reported reservoir induced seismicity.562 ICOLD-CIGB 2012 UST-ILIM Angara Russia Ust-Ilimsk, Irkutsk Gravity in Masonry or Concrete 4472 1477 309 102 84 48075 59300 1977 (dam completed) No reported reservoir induced seismicity.563 ICOLD-CIGB 2012 UVAC Uvac Yugoslavia Nova Varos, Serbia Zlatiborski Rock fill 930 307 333 110 92 170 210 1979 (dam completed) No reported reservoir induced seismicity.564 Packer et al. 1979 & WVAJONT Vajont Vajont Italy Concrete arch 1395 425 850 259 249 122 150 1960 Sedimentary 3 Accepted case of reservoir induced microearthquake activity.565 ICOLD-CIGB 2012 VAL NOANA Noana Italy Trento, Trentino Alto Adige Arch 433 143 382 126 108 9 11 1959 (dam completed) No reported reservoir induced seismicity.566 ICOLD-CIGB 2012 VALLE DI LEI Reno di Lei Switzerland Cresta, Graubünden Arch 2089 690 427 141 123 162 200 1961 (dam completed) No reported reservoir induced seismicity.567 ICOLD-CIGB 2012 VALLE GRANDE Atuel Argentina San Rafael, Mendoza Buttress 908 300 348 115 97 130 161 1965 (dam completed) No reported reservoir induced seismicity.568 ICOLD-CIGB 2012 VANDERKLOOF* Orange South Africa Petrusville, Free State Arch 2583 853 327 108 90 2624 3236 1977 (dam completed) No reported reservoir induced seismicity.569 ICOLD-CIGB 2012 VATNEDALEN HOVEDDAM Vatnedalen Otra Norway Kristiansand, Aust-Agder Rock fill 1453 480 363 120 102 932 1150 1984 (dam completed) No reported reservoir induced seismicity.570 ICOLD-CIGB 2012 VERKHNEY KHAN BOULANCHAY Terter Azerbaidjan Yevlakh, Azerbaïdjian Earth 1787 590 379 125 119 454 560 1976 (dam completed) No reported reservoir induced seismicity.571 ICOLD-CIGB 2012 VICTORIA Mahaweli Sri Lanka Teldeniya, CP Arch 1575 520 369 122 104 586 723 1984 (dam completed) No reported reservoir induced seismicity.572 ICOLD-CIGB 2012 VIDDALSVATN FYLLINGSDAM Viddalsvatn Norway , Sogn Og Fjordane Rock fill 0 0 303 100 90 165 204 1971 (dam completed) No reported reservoir induced seismicity.573 ICOLD-CIGB 2012 VIDRA Lotru Romania Brezoi, Valcea Rock fill 1060 350 366 121 103 276 340 1973 (dam completed) No reported reservoir induced seismicity.574 ICOLD-CIGB 2012 VIDRARU Arges Romania Curtea de Arges, Arges Arch 924 305 503 166 136 380 469 1965 (dam completed) No reported reservoir induced seismicity.575 ICOLD-CIGB 2012 VIRDNEJAVRI Alta Norway Alta, Finnmark Arch 409 135 430 142 124 107 133 1987 (dam completed) No reported reservoir induced seismicity.576 Packer et al. 1979 & WVOLTA GRANDE Volte Grande Grande Brazil Near Agua Comprida, Nearest town Miguelopolis, Mi Earth fill with centRock fill concrete gravity 6490 1978 180 55 30 1759 2170 1973 (dam completed) Igneous 4 Accepted case of reservoir induced macroearthquake activity.577 Packer et al. 1979 & WVOUGLANS Not obtained Ain France Near Dortar Concrete arch 1395 425 338 103 93 490 605 1968 Sedimentary 4.4 Accepted case of reservoir induced macroearthquake activity.578 ICOLD-CIGB 2012 WADASLINTANG Lunto Indonesia Kebumen, Central Java Rock fill 1968 650 369 122 104 359 443 1987 (dam completed) No reported reservoir induced seismicity.579 ICOLD-CIGB 2012 WANJIAZHAI Huanghe China Pianguan, ShanxiProv. Gravity in Masonry or Concrete 1341 443 318 105 87 728 898 2000 (dam completed) No reported reservoir induced seismicity.580 ICOLD-CIGB 2012 WARM SPRINGS DAM DRY CREEK United States California Earth 2768 914 330 109 104 449 554 1982 (dam completed) No reported reservoir induced seismicity.581 Gupta, 2002 WARNA Warna India Nearest town Shirela, Maharashtra 1580 292 89 80 1260 1987 (dam completed) Igneous 5 Accepted case of reservoir induced macroearthquake activity.582 Packer et al. 1979 & ICWARRAGAMBA Lake BurragoraWarragamba Australia Nearest town SYDNEY, New South West AustralialeGravity in Masonry or Concrete 1152 351 466 142 124 1668 2057 1960 (dam completed) Sedimentary 5.4 Questionable case of reservoir induced macroseismic activity.583 ICOLD-CIGB 2012 Watauga Watauga River United States Tennessee Rock fill/Earth 854 282 306 101 96 677 835 1948 (dam completed) No reported reservoir induced seismicity.

584 ICOLD-CIGB 2012 WILLIAM L. JESS ROGUE RIVER United States Oregon Rock fill 3322 1097 318 105 87 500 617 1976 (dam completed) No reported reservoir induced seismicity.585 ICOLD-CIGB 2012 WUJIANGDU Wujiang China Nearest town Zunyi, GuizhouProv. Gravity in Masonry or Concrete 1207 368 541 165 135 1865 2300 1985 (dam completed) Not Obtained 2.8 Reported Case586 ICOLD-CIGB 2012 WUSHE Zhuoshuixi China Nantou, TaiwanProv. Gravity in Masonry or Concrete 684 226 345 114 96 122 150 1959 (dam completed) No reported reservoir induced seismicity.587 ICOLD-CIGB 2012 XIAOLANGDI Huanghe China Mengjin, HenanProv. Rock fill 5048 1667 466 154 124 10256 12650 2001 (dam completed) No reported reservoir induced seismicity.588 ICOLD-CIGB 2012 XIN'ANJIANG Xin'anjiang China Jiande, ZhejiangProv. Gravity in Masonry or Concrete 1408 465 318 105 87 14479 17860 1965 (dam completed) No reported reservoir induced seismicity.589 Woodward-Clyde Con XINFENGJIANG (HSINFENGKIANG) Xinfengjiang Xinfeng jiang China Nearest town Heyuan, GuangdongProv. Buttress 1444 440 344 105 100 11266 13896 1960 (dam completed) Igneous 6 Accepted case of reservoir induced macroearthquake activity.590 ICOLD-CIGB 2012 XINGO Sao Francisco Brazil Caninde do Sao Francisco, Sergipe Rock fill 2422 800 454 150 132 3081 3800 1994 (dam completed) No reported reservoir induced seismicity.591 ICOLD-CIGB 2012 YAGISAWA Tone Japan Numata, Gunma Arch 1217 402 397 131 113 165 204 1967 (dam completed) No reported reservoir induced seismicity.592 ICOLD-CIGB 2012 YAHAGI Yahagi Japan Toyoda, Gifu Arch 978 323 303 100 90 65 80 1971 (dam completed) No reported reservoir induced seismicity.593 ICOLD-CIGB 2012 YANASE Nabari Japan Aki, Kochi Rock fill 612 202 348 115 97 85 105 1965 (dam completed) No reported reservoir induced seismicity.594 ICOLD-CIGB 2012 YANTAN Hongshuihe China Nearest town Dahua, GuangxiReg. Gravity in Masonry or Concrete 1722 525 361 110 92 1970 2430 1995 (dam completed) Not Obtained 3.5 Reported Case595 ICOLD-CIGB 2012 YASAKA Ose Japan Iwakuni, Yamaguchi Gravity in Masonry or Concrete 1635 540 363 120 102 91 112 1990 (dam completed) No reported reservoir induced seismicity.596 ICOLD-CIGB 2012 YELLOWTAIL BIGHORN RIVER United States Montana XX/Arch 1366 451 484 160 130 1427 1761 1966 (dam completed) No reported reservoir induced seismicity.597 ICOLD-CIGB 2012 YULONGYAN Gongxihe China Qianyang, HunanProv. Gravity in Masonry or Concrete 1211 400 303 100 90 42 52 1997 (dam completed) No reported reservoir induced seismicity.598 ICOLD-CIGB 2012 YUNFENG Yalujiang China Ji'an, JilinProv. Gravity in Masonry or Concrete 2507 828 345 114 96 3006 3708 1967 (dam completed) No reported reservoir induced seismicity.599 ICOLD-CIGB 2012 ZAYANDEH-ROOD ZAYANDEH-ROOD I. Rep. Iran SHAHR-KORD, ESFAHAN Arch 1363 450 303 100 90 1176 1450 1970 (dam completed) No reported reservoir induced seismicity.600 ICOLD-CIGB 2012 ZENGWEN Zengwenhe China Tainan, TaiwanProv. Earth 1423 470 415 137 130 8046 9924 1973 (dam completed) No reported reservoir induced seismicity.601 ICOLD-CIGB 2012 ZERVREILA Valserrhein Switzerland Vals, Graubünden Arch 1526 504 457 151 121 81 101 1957 (dam completed) No reported reservoir induced seismicity.602 ICOLD-CIGB 2012 ZEUZIER Lienne Switzerland Sion, Valais Arch 775 256 472 156 126 41 51 1957 (dam completed) No reported reservoir induced seismicity.603 ICOLD-CIGB 2012 ZEYA Zeya Russia Blagovesh - chensk, Amur Buttress 2295 758 348 115 97 55453 68400 1978 (dam completed) No reported reservoir induced seismicity.604 ICOLD-CIGB 2012 ZHELIN Xiuhe China Nearest town Yongxiu, JiangxiProv. Earth 1939 591 210 64 58 6421 7920 1972 (dam completed) Not Obtained 3.2 Reported Case605 ICOLD-CIGB 2012 ZHEXI Zishui China Anhua, HunanProv. Buttress 999 330 315 104 86 2894 3570 1975 (dam completed) No reported reservoir induced seismicity.606 ICOLD-CIGB 2012 ZILLERGRUENDL Ziller Austria Mayrhofen, Tyrol Arch 1532 506 563 186 156 73 90 1986 (dam completed) No reported reservoir induced seismicity.607 ICOLD-CIGB 2012 ZIMAPAN Moctezuma Mexico Tula, Hidalgo Arch 348 115 627 207 177 807 996 1994 (dam completed) No reported reservoir induced seismicity.608 ICOLD-CIGB 2012 ZIPINGPU Minjiang China Nearest town Dujiangyan, SichuanProv. Rock fill 2093 638 512 156 148 876 1080 2000 (dam completed) Not Obtained 7.9 Questionable


![Seismicity of the Sinai subplate region] kinematic implications](https://img.pdfslide.net/doc/110x75/635a9cb378abe3be930dbcca/seismicity-of-the-sinai-subplate-region-kinematic-implications.jpg)