Embed Size (px)
Citation preview

i'4r-,-. � - .. Ii*f4 he Ado \\4 .
GS .92. M. 000002
USGS-OFR-91-572 UJSGS-OFR-91-572
UNITED STATES DEPARTMENT OF THE INTERIOR
U.S. GEOLOGICAL SURVEY
SEISMICITY AND FOCAL MECHANISMS FOR THE SOUTHERN GREAT BASINOF NEVADA AND CALIFORNIA: 1987 THROUG 1989
*~ I . K . . t-
by
S. C. Harmsen and C. G. Bufe
Open-File Report 91-572
Prepared In cooperation with theNevada Operations Offite:
U.S. Department of Energy(Interagency Agreement DE-AI08-78ET44802)
. . 0
This report is preliminary and has not been reviewed for conformity with U.S. Geological Surveyeditorial standards (or with the North American Stratigraphic Code). Any use of trade, product,or firm names is for descriptive purposes only and does not constitute endorsement by the U.S.Government.
Denver, Colorado1992
Pi99 940411Or

GS.92.A.100239
INFORMATION ONLYOr
GS.92.M.000002GSP-92-0020
QRP: WBS 1.2.3.2.8.4.1QA: QAGP: OMP 3.04, R3
0CD
To
0-
1.OD
Page 1 of 1
YMP-USGS-GSPTABLE OF CONTENTS
PUBLICATIONS QA RECORD PACKAGE
Seismicity and focal mechanisms for the southern Great Basin ofNevada and California: 1987 through 1989. by S.C. Harmsen and C.G. Bufe
No.Published Open-File Report ................................
Published1.2.3.4.5.
V.. 6.7.8.9.
10.11.12.13.
Report Package:Table of Contents............................DOE Form 1332 ..............-----Letter to DOE for concurrence (02/27/92)......DOE concurrence letter (04/29/92).............USGS approval letter and MRS showing date ofUSGS approval of October 31. 1991 ll/8/91).Reconstructed Manuscript Routing Sheet......OA review (02/21/92) ..... ..........TPO review (02/25/92) .........................Reviewer selection form for Swolfs (06/06/91).Reviewer selection form for Perkins (06/06/91)Swolfs review (08/16/91) ......................Perkins review (04/05/91) ..... ............Author response to Perkins review (10/07/91)..
. of Pages c k
1
222
22211119
2*91~j 7
TOTAL PAGE COUNT ..................................
Raw Data Package:Southern Great Basin Local EarthquaKe Archive Tapes
L1009 through L1036
Tracking numbers for the data associated with thispublication are: GS910583117412.032, GC910583117412.0 3 3and GS9105831l74,2.0 s---._ A
AUTHENTICATED BY:
1
Additional tracking numbers for the data associatedwith this publication: GS910831174 1 2.0 1 9 (supercedesNNA.910517.0005), GS91083117412.020, GS910583117412.021and GS910583117412.022
'I

11-1'1. '. I F I v. 7-
USGS-OFR-91-572 USGS-OFR-91-572
UNITED STATESDEPARTMENT OF THE INTERIOR
GEOLOGICAL SURVEY
Denver, Colorado
SEISMICITY AND FOCAL MECHANISMS FOR THE SOUTHERN GREAT BASINOF NEVADA AND CALIFORNIA: 1987 THROUGH 1989
by
S. C. Harmsen' and C. G. Bufe'
1 U. S. Geological Survey, Denver, Colorado, 80225

Copies of this Open-File Reportmay be purchased from
Open-File Services SectionBranch of DistributionU.S. Geological Survey
Box 25425, Federal CenterDenver, Colorado 80225
PREPAYMENT IS REQUIRED
Price information will be publishedin the monthly listing
'New Publications of the Geological Survey"
FOR ADDITIONAL ORDERING INFORMATION
CALL: Commercial: (303) 236-5456FTS: 8-303-236-5456
* I
__
II
I -11.- or t414
CONTENTSPage
Ira>
Abstract.
Introduction .... . . . . . . . . . . . . . . . . . . . . . . . . .. 1
Acknowledgments .. 2
Calibration procedures and results ... . . . . . . .. . . . . . . . . . 2
Preliminary hypocenter determination for SGB earthquakes and explosions . 4
Can localized velocity anisotropy be inferred from NTS nuclear tests?. . 6
Earthquake magnitudes and detection threshold .. . 10
Overview of local SGB seisinicitY, 1987 through 1989 . .13
Seismicity at Yucca Mountain, 1987 through 1989. . . 21
1988 Boulder City, Nevada swarm .. 22
Earthquake focal mechanisms .. . . . 26
Effects of modeling on focal mechanisms .. 29
Representativeness of focal mechanisms in the SGB catalog . .30
Untypical focal mechanisms and source zones in the SGB . .30
Evidence of seismically active detachment faults? . . 31
Yucca Mountain earthquake focal mechanisms . .33
Reverse-slip focal mechanisms and compressional tectonism in the SGB 35
Focal mechanisms of other notable SGB earthquakes .36
Average directions of P and T and tectonic strain .38
Depth-of-focus distribution and deep-crust intraplate earthquakes .42
Conclusions . 47
References cited .48
Appendix A. SGB earthquake locations for the years 1987, 1988, and 1989, and
quadrangle names ... . . . . . . . . . . . . . . . . . . . . . . . . 51
Appendix B. Chemical explosion locations for the years 1987, 1988, and 1989 . . 135
Appendix C. NTS nuclear device test locations and low-frequency event listing for
the years 1987, 1988, and 1989 .152
Appendix D. Southern Great Basin earthquake focal mechanisms, 1987 through
1989 .162
Appendix E. Station codes, locations, and instrumentation 200
Appendix F. Input parameters to HYPO71 . ............. .. . 206
I
iu

ILLUSTRATIONS
Page
Figure 1.- SGBSN station locations and some physiographic features of the southernGreat Basin . . . . . . . . . . . . . . . . . . . . . . . . . . . . 3
Figure 2.- SGBSN travel-time delays from NTS nuclear device tests . . . . . 8Figure 3.- Comparison of ML determined from horizontal-component instruments
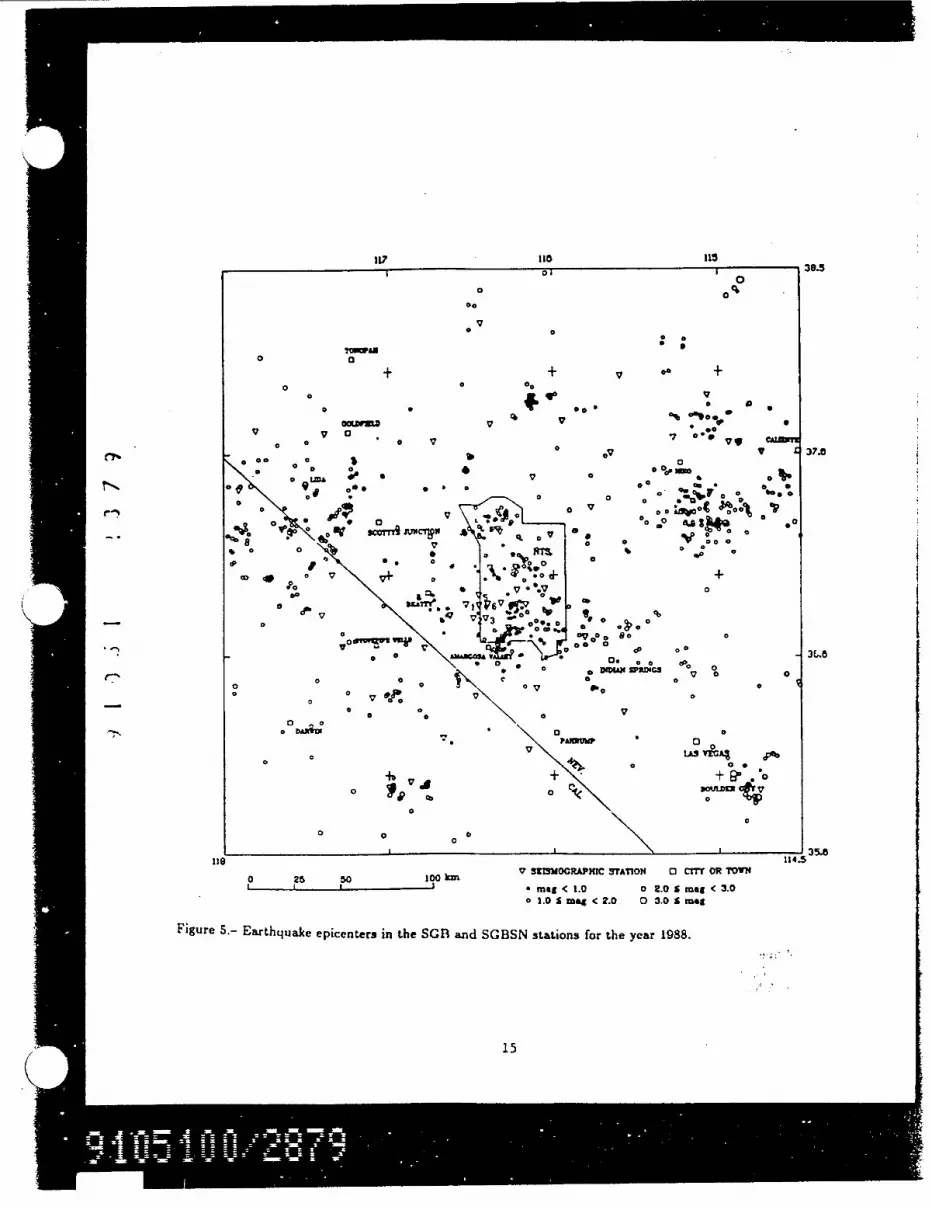
with ML determined from vertical-component instruments ...... . .. 11Figure 4.- Seismicity in the southern Great Basin, 1987 .... . . ... . . . 14Figure 5.- Seismicity in the southern Great Basin, 1988 ........... . 15Figure 6.- Seisrmicity in the southern Great Basin, 1989 ........... . 17Figure 7.- Seismicity in the vicinity of Oasis Valley, southern Nevada, 1979 through
1989 ............................... . 18Figure 8.- Epicenter counts in SGB quadrangles, 1987-1989 versus 1984-1986. . 19Figure 9.- Epicenter counts in SGB quadrangles, 1987-1989 versus 1978-1983. . 20
C wFigure 10.- Epicentral scatter and variation of RMS travel time residual with depthof focus for a small Yucca Mountain earthquake . . . . . . . . . . . . . 23
Figure 11.- Seismicity at Yucca Mountain, 1979 through 1989 .... . . . . 24Figure 12.- Preliminary epicenters for Boulder City vicinity swarm, 1988 . . . . 25Figure 13.- SGB earthquake focal mechanisms on regional map base, 1987 through
1989.. . ..................... 2Figure 14.- Epicentral scatter and RMS travel time residual as a function of depth
of focus for a shallow Yucca Flat earthquake . . . .. ....... . 37Figure 15.- Focal mechanism 1' and T axes on lower hemisphere, 1987 through 1989 40Figurc 16.- Focal mechanism P and T axes on lower hemisphere, 1979 through 1986 41
Figure 17. Depth-of-focus distribution for a subset of SGB earthquakes, 1987through 1989 ....... .......... ......... . . . 43
Figure 18. SGBSN seismograms for a deep-cruRtal earthquake of August 8, 1989 44
Figure 19.- Epiccntral scatter and RMS travel time residual as a function of depthof focus for a deep-crust Yucca Flat earthquake . . . . ..... . . . . 45
Figure 20.- Epicentral scatter and RMS travel time residual as a function of depthof focus for an earthquake north of Las Vegas, Nev. having depth near thebrittle-ductile transition zone .... . . . . . . . . . . . . . . . . 46
Figure Al.- Quadrangle names in the northeast quarter of the southern Great Basin. 52Figure A2.- Quadrangle names in the southeast quarter of the southern Great Basin. 53
Figure A3.- Quadrangle names in the northwest quarter of the southern GreatBasin . ... . ... . ............. . ........ . 54
Figure A4.- Quadrangle names in the southwest quarter of the southern GreatBasin . .................. 55
Figure A5.- Maximum earthquake magnitude per 7 l x 7 1' quadrangle in the SGB,1987 through 1989 and August 1978 through 1986 . ....... . . . . 56
Figure Bi.- Preliminary epicenter map of blasts and probable blasts in the SGB,1987 through 1989 . ........... ........... 136
iv

Figure Cl.- Map of announced NTS nuclear device test epicenters and selectedlow-frequency phenomena, 1987 through 1989 .... . . . . . . . . . 153
Figure C2.- Contour map of P-wave velocity variation from the standard model forthe NTS test 'ALAMO' ....................... . 154
Figure C3.- Contour map of P-wave velocity variation from the standard model forthe NTS test ODISKO ELM* .... . . . . . . . . . . . . . . . . . 155
Figure C4.- Contour map of P-wave velocity variation from the standard model forthe NTS test OKAWICH .. .................... . 156
Figure Dl.- Focal mechanism for Stovepipe Wells earthquake 1982-03-16 ... . 163Figure D2.- Focal mechanism for Alamo SE earthquake 1987-01-13 ... . . . 164Figure D3.- Focal mechanism for Yucca Mountain (Bare Mtn. quadrangle) earth-
quake 1987-03-10 ..... . . . . . . . . ........ . . . . . 165Figure D4.- Focal mechanism for Tin Mtn. earthquake 1987-04-08 ..... . 166Figure DS.- Focal mechanism for Specter Range SW earthquake 1987-04-20 . . 167Figure D6.- Alternate focal mechanism for Specter Range SW earthquake 1987-04-
20 ............ ........ .......... 168Figure D7.- Focal mechanism for Yucca Mtn. (Topopah Spring NW quadrangle)
earthquake 1987-06-01 ..... . . . . . . . . . . . . . . . . . . . 169Figure D8.- Focal mechanism for Desert Hills SE earthquake 1987-06-17 . . . . 170Figure D9.- Focal mechanism for Stonewall Pass earthquake 1987-07-13 . . . . 171Figure D10.- Focal mechanism for Timber Mtn. (Buckboard Mesa quadrangle)
earthquake 1987-08-13 ..... . . . . . . . . . . . . . . . . . . . 172Figure DlI.- Focal mechanism for Papoose Lake SE earthquake 1987-10-02 . . 173Figure 312.- Alternate focal mechanism for Papoose Lake SE earthquake 1987-10-
02 ................................ . 174Figure D13.- Focal mechanism for Reveille Peak earthquake 1987-10-28 . . . . 175Figure D14.- Alternate focal mechanism for Reveille Peak earthquake 1987-10-28 176Figure D15.- Focai mechanism for Specter Range NW earthquake 1987-12-10 . . 177Figure D16.- Focal mechanism for Striped Hills earthquake 1988-01-14 .. . . 178Figure D17.- Focal mechanism for Thirsty Canyon NW earthquake 1988-01-26 . 179Figure D18.- Focal mechanism for Yucca Flat earthquake 1988-02-07 ... . . 180Figure DI9.- Alternate focal mechanism for Yucca Flat earthquake 1988-02-07 . 181Figure D20.- Focal mechanism for Dry Mountain earthquake 1988-05-26 . . . . 182Figure D21.- Focal mechanism for Ammonia Tanks earthquake 1988-06-15 . . .I 83Figure D22.- Focal mechanism for Thirsty Canyon SW earthquake 1988-07-02 . 184Figure D23.- Focal mechanism for Owens Valley, California, earthquake 1988-07-05 185Figure D24.- Focal mechanism for Timber Mountain earthquakes 1988-07-03 and
1988-07-24 ..... . . . . . . . . . . . . . . . . . . . . . . . . 186Figure D25.- Focal mechanism for Reveille Peak earthquake 1988-08-30 . . . . 187Figure D26.- Focal mechanism for Gold Flat (Mellan quadrangle) earthquake 1988-
10-28 ............................... . 188
V

IFigure D27.- Focal mechanism for Cold Flat (Mellan quadrangle) earthquake 1988-
10-29 . . . 189
Figure D28.- Focal mechanism for Yucca Mtn. (Bare Mtn. quadrangle) earthquake1988-11-18 ............................ . 190
Figure D29.- Focal mechanism for Gass Peak, Nevada, earthquake 1989-01-09 . 191
Figure D30.- Alternate focal mechanism for Gass Peak, Nevada, earthquake 1989-01-09. . 192
Figure D31.- Focal mechanism for Dead Horse Flat earthquake 1989-01-31 . 193
Figure D32.- Focal mechanism for Timber Mountain earthquake 1989-03-05 194
Figure D33.- Focal mechanism for Ubehebe Crater earthquake 1989-04-12 195
Figure D34.- Focal mechanism for Alamo SE earthquake 1989-04-19 . .196
Figure D35.- Alternate focal mechanism for Alamo SE earthquake 1989-04-19 197
Figure D36.- Focal mechanism for Jacka Flats earthquake 1989-07-21 . . . . 198
Figure D37.- Focal mechanism for Scottys Junction SW earthquake 1989-08-28 .199
Figure El. Magnification curves for SGBSN seismographs at Yucca Mountain,Nevada with telemetry to and computer recording at Golden, Co .201
Figure Fl.- The two P and S velocity model- used for preliminary hypocenter
determination in the SGB .208
LIST OF TABLESTable 1.- Ilypocentral parameters for selected Rainier Mesa nuclear device tests
that display 1800 P-wave azimuthal delay periodicity at SGBSN stations 9
Table 2.- Preliminary hypocentral parameters for Yucca Mountain seismicity, 1987
through 1989 .22
Table 3.- Preliminary SGB focal mechanisms, 1982 and 1987 through 1989... 27
Table Cl.- Announced NTS nuclear device test locations for 1987, 1988, and 1989.
157
Table El.- Seismographic systems in use in SGBSN in 1989 .200

Seismicity and Focal Mechanlsms for the Southern Great Basinof Nevada and California: 1987 through 1989
Abstract
For the calendar year 1987, the southern Great Basin seismic network (SGBSN) recorded about
820 earthquakes in the southern Great Basin (SGB). Local magnitudes ranged from 0.2 to 4.2
(December 30, 1987, 22:50:42 UTC at Hot Creek Valley). Five earthquakes epicenters in 1987
within the detection threshhold of the seismic network are at Yucca Mountain, the site of a potential
national, high-level nuclear waste repository. The maximum magnitude of those five earthquakes
is 1.1, and their estimated depths of focus ranged from 3.1 to 7.6 km below sea level. For the
calendar year 1988, about 1280 SGB earthquakes were catalogued, with maximum magnitude 4.4 for
an Owens Valley, California, earthquake on July 5, 1988. Eight earthquake epicenters in 1988 are at
Yucca Mountain, with depths ranging from three to 12 km below sea level, and maximum magnitude
2.1. For the calendar year 1989, about 1190 SGB earthquakes were located and catalogued, with
maximum magnitude equal to 3.5 for an earthquake about ten miles north of Las Vegas, Nevada,
on January 9. No Yucca Mountain earthquakes were recorded in 1989. An earthquake having a
well-constrained depth of about 30 km below sea level was observed on August 21, 1989, in eastern
Nevada Test Site (NTS).The greatest concentration of SGB earthquakes in a small area during the three years 1987
through 1989 occurred at the Reveille Range (Reveille Peak quadrang'a), about 115 km north of
Yucca Mountain. Other concentrations of seismicity were observed at Rock Valley (southern Nevada
Test Site), Pahranagat Shear Zone, Sarcobatus Flat, Gold Flat, and in the Grapevine Mountains.
Seismicity near Boulder City, Nevada and Lake Mead produced very modest structural damage at
Boulder City. The magnitude 3.5 earthquake in January, 1989, near Las Vegas, Nevada, resulted in
a few cracked windows at Las Vegas, the only other case of damage being reported from earthquakesin the southern Great Basin for that three-year period.
Focal mechanisms from thiry-one SGB earthquakes are presented in this report. The solutions
range from normal slip or oblique slip to strike slip, with a few having sub-horizontal nodal planes.
Tension axes for most SGB earthquake focal mechanisms cluster in the northwest-southeast direc-
tion, and tend to display sub-horizontal angles of inclination. Alternate focal mechanism solutions
resulting from different assumed hypocenters demonstrate that, in some instances, the current seis-
mographic network cannot provide unambiguous focal mechanism solutions, even for some of the
magnitude > 3 earthquakes. This is because the focal mechanism is dependent on depth of focus,which is often a poorly resolved parameter.
Examination of travel-time delays for P waves from NTS nuclear tests indicates a strong 1800
azimuthal pattern, especially for data from Rainier Mesa and western Yucca Flat tests. This pattern
could be the signature of stress-induced and/or crack-induced azimuthal velocity anisotropy, or
alternatively, of a high-speed body having a longitudinal axis oriented approximately north 10°
east to south 100 west, possibly the lower carbonate aquifer. Whatever the source, delays have no
significant correlation with distance, probably indicating the presence of localized tectonic or geologicanomalies (radius < 50 km) rather than a regional feature.
Introduction
The SGBSN, one of several regional seismographic networks operating in the Great Basin, has
monitored local seismicity and has recorded arrivals from regional and teleseismic earthquakes con-
tinuously since August, 1978. 54 permanent stations were in place by rnid-1981, including a dense
sub-array at Yucca Mountain, Nevada. Preliminary hypocenter listings and seismicity data anal-
ysis from data collected by the SGBSN for the period August, 1978 through December, 1986, are
presented in Rogers and others (1987) and Harmnsen and Rogers (1987). This report is an adden-
dum/update to those reports. A broad-scope review of the seismotectonics of Nevada is available in
1

Rogers and others (1991), where contemporary SGB and other seismicity data are discussed in thecontext of the Cenozoic deformation of the Great Basin.The SGBSN was initially composed entirely of vertical-component seismographic stations. Eight
horizontal-componient seismographs were added in 1984, and a vertical-component seismograph southof Boulder City, Nevada, was added in August, 1988. Figure 1 shows the seismic station locations andmajor physiographic structures discussed below. Appendix E lists station parameters. References toindividual stations in the text below will be in bold font.The primary purpose of the network is to investigate the seismotectonic environment in theimmediate vicinity of Yucca Mountain, Nevada, the potential site of a high-level, national nuclearwaste repository. Also, the network provides information on seismicity at greater distances, out toabout 160 km radial distance of Yucca Mountain. Seismic signals from the network are continuouslytelemetered to the USGS data processing center in Golden, Colorado, where preliminary hypocenter
determination is performed, along with research on focal mechanisms and faulting, on fluid-inducedseismicity, on attenuation of seismic waves, on velocity structure, on crustal strain in the southernGreat Basin, and other topics having relevance to the Yucca Mountain Project.
Operation of the seismic network is funded under an interagency agreement with the Departmentof Energy, which provides Quality Assurance regulations for the collection, analysis, interpretation,reporting and archiving of data. Digital, event-oriented SGBSN data (seismograms, station data,and so on) are permanently archived on magnetic tapes, ard a nearly continuous record of analogSGBSN data is also maintained on 16 mm develocorder film. Because seism _ data in the SGB comefrom sources and crustal paths that exhibit large degrees of geologic variability, with many detailsthat are simply unknown, the hypocenters and analyses that are presented in open-file format mustbe considered prelimrinary. Uncertainty in many reported parameters, such as those associated withearthquake location and focal mechanism, is in most cases substantial and difficult to completelyquantify. In this report, consequences of uncertainty are explicitly addressed by offering alternatehypocenters and focal mechanisms that are of comparable "goodness-of-fit" within the context of thesimplified geologic models invoked to parametrize the earth. Since a possible consequence of this highlevel of ambiguity is that permissable licensing uncertainties about the seismotectonic component ofthe geologic system may be exceeded, as stipulated in 40 CFR Part 191, the U.S.G.S. response is toincrease the density of seismic station coverage of southwestern Nevada during the next few years,with the expectation of reducing parameter estimate uncertainties for much of the recorded localseismicity.
AcknowledgmentsMaintenance and periodic calibration of seismographs and related field equipment is performed
by D. E. Overturf of the U. S. Geological Survey, and by contract technicians. Arrival time andamplitude data from earthquakes and blasts were initially scaled by Pingsheng Chang, a contracttechnician, and by Miles Weida and Mark Meremonte, of the U.S. Geological Survey.
The seismological laboratories of the University of Utah at Salt Lake City (UUT), the Universityof Nevada at Reno (REN), the California Institute of Technology at Pasadena (PAS), the USGSat Menlo Park, California (MNLO), and the National Earthquake Information Center at Golden,Colorado (NEIC), provided useful seismograms, first motion data, and/or magnitude estimates forseveral of the earthquakes discussed in this report.
Helpful reviews of this report were provided by David M. Perkins and Henri S. Swolfs of the U.S.Geological Survey, Branch of Geologic Risk Assessment. The manuscript benefited from suggestionsand section reviews by R. E. Anderson, 1. Gomberg, and K. F. Fox.
Calibration procedures and resultsA complete discussion of the technical procedures used in field calibrations of SGBSN stations
is presented in the Quality Assurance document, YMP-USGS Seismic Procedure 11. Seismometers
2

II6 115 1 111i 117 .5
a5a.0
0
00
f0toFb oa
0C
U .
i CV.e
Vqh
*Z o,1 C,* C-1O cc
c0
-C
41"OTOM
'WS V.Z ° sez
00
Got dMtf. .
7,, \ PM M--- Jt
£a94y1. 01VcDV
2.R a 3 7 e
a'. I
i
v!,*
SF
Desert3rmea
_ ,3U- or U ; I Range
1 v - $, R'1tWF - 38. 6
* 4 aeu a~
a La V"SI
. . Sf 7aw * Gas.D
00
pMU-P sh ut* 14 9a
MR-Mont ezuma Range T U-TI mbvr Mtn. LVV-Las Vogcc Vol Icy
SF-Sar cabstus Ft at CF-Crcat or Fl at MV-Uercury Yoll y
OV-Coal SIColloy SR-Specter Rcngo LM-Laks Mend
LCA-Last Chance Range YM-Yucce Mtn. EM-Ei dordo Mtno.
GVM-Gra Svine Mtns. Bm-ar Mtn. FF-Fronchman Flat
Figure 1.- Miap of SGBSN: seisnmograph station locations, cities and towns, and some major phys-
iographic features of the southern Great Basin.
3
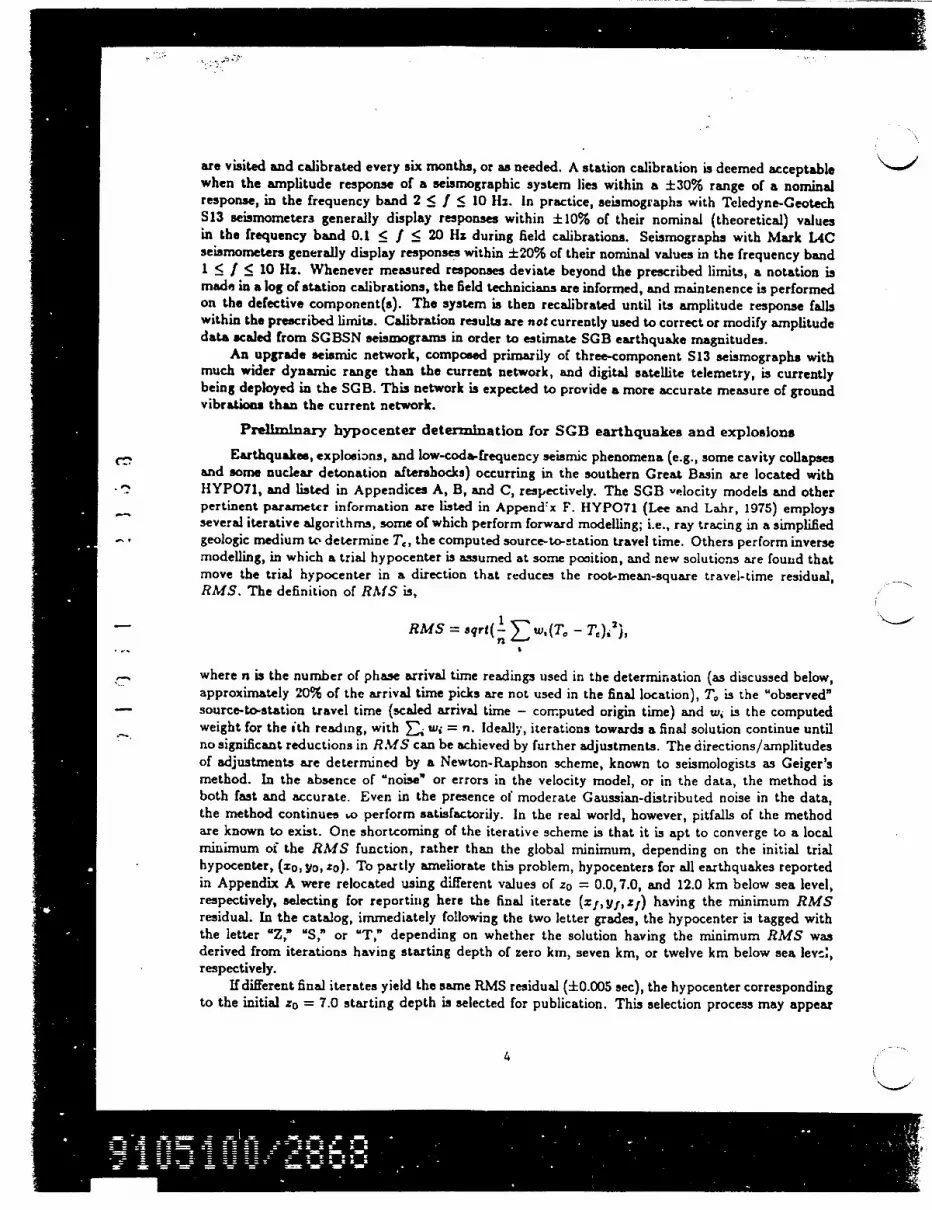
are visited and calibrated every six months, or as needed. A station calibration is deemed acceptablewhen the amplitude response of a seismographic system lies within a ±30% range of a nominalresponse, in the frequency band 2 < f < 10 Hz. In practice, seismographs with Teledyne-CeotechS13 seismometers generally display responses within ±10% of their nominal (theoretical) valuesin the frequency band 0.1 < f < 20 Hz during field calibrations. Seismographs with Mark L4Cseismometers generally display responses within ±20% of their nominal values in the frequency band1 < f < 10 Hz. Whenever measured responses deviate beyond the prescribed limits, a notation ismade in a log of station calibrations, the field technicians are informed, and maintenance is performedon the defective component(s). The system is then recalibrated until its amplitude response fallswithin the prescribed limits. Calibration results are not currently used to correct or modify amplitudedata scaled from SGBSN seismograms in order to estimate SGB earthquake magnitudes.
An upgrade seismic network, composed primarily of three-component S13 seismographs withmuch wider dynamic range than the current network, and digital satellite telemetry, is currentlybeing deployed in the SGB. This network is expected to provide a more accurate measure of groundvibrations than the current network.
Preliminary hypocenter determination for SGB earthquakes and explosions
Earthqualces, explosimns, and low-codafrequency seismic phenomena (e.g., some cavity collapsesand some nuclear detonation aftershocks) occurring in the southern Great Basin are located withHYPO71, and listed in Appendices A, B, and C, respectively. The SGB velocity models and otherpertinent parameter information are listed in Append'x F. HYPO71 (Lee and Lahr, 1975) employsseveral iterative algorithms, some of which perform forward modelling; i.e., ray tracing in a simplifiedgeologic medium to determine T,, the computed source-to-station travel time. Others perform inversemodelling, in which a trial hypocenter is assumed at some position, and new solutions are found thatmove the trial hypocenter in a direction that reduces the root-mean-square travel-time residual,RMS. The definition of RMS is,
RMS = aqrt(- W (T. - TC)i")
where n is the number of phase arrival time readings used in the determination (as discussed below,approximately 20% of the arrival time picks are not used in the final location), T. is the 'observed'source-to-station travel time (scaled arrival time - computed origin time) and w, is the computedweight for the ith reading, with at w; = n. Ideally, iterations towards a final solution continue untilno significant reductions in RM S can be achieved by further adjustments. The directions/amplitudesof adjustments are determined by a Newton-Raphson scheme, known to seismologists as Geiger'smethod. In the absence of 'noise' or errors in the velocity model, or in the data, the method isboth fast and accurate. Even in the presence of moderate Gaussian-distributed noise in the data,the method continues so perform satisfactorily. In the real world, however, pitfalls of the methodare known to exist. One shortcoming of the iterative scheme is that it is apt to converge to a localminimum oi the RMS function, rather than the global minimum, depending on the initial trialhypocenter, (xo, yo, zo). To partly ameliorate this problem, hypocenters for all earthquakes reportedin Appendix A were relocated using different values of zo = 0.0,7.0, and 12.0 km below sea level,respectively, selecting for reporting here the final iterate (zf,yf,zf) having the minimum RMSresidual. In the catalog, immediately following the two letter grades, the hypocenter is tagged withthe letter "Z,3 "S," or "T," depending on whether the solution having the minimum RMS wasderived from iterations having starting depth of zero km, seven km, or twelve km below sea levc:,respectively.
If different final iterates yield the same RMS residual (±0.005 sec), the hypocenter correspondingto the initial zo = 7.0 starting depth is selected for publication. This selection process may appear
4

arbitrary, but statistically, has little effect on the overall depth-of-focus distribution. We defineRMS(k) = RMSIzo = k km, and similarly, depth estimate, z(k), and standard error in depthestimate, stz(k). We investigated the percentage of hypocenters listed in Appendix A, below, thatwere derived from zo = 7 or 12 km iterations, but which also have competing solutions within X 10%of the sampled travel time residual minimum, RMS(O) - RMS(k) S max(O.01, 0.1 min(RMS(k)))sec, k = 7 or 12 km. For the hypocenters of 1987, 570 hypocenters met this criterion. However, allbut 92 of those 570 had the property that the depth estimate, z(0), was within one standard errorin depth of the reported depth estimate, tz(k) - z(O)j S atz(k). Of the remaining 92, 49 competingdepths were within two standard errors, Ir(k)-z(0)i < 2stz(k) (case A). The remaining 43 competingdepths were greater than two standard errors from the reported depth of focus, Iz(k)-z(0)j > 2stz(k)(Ps 5% of the catalog, case B). In Appendix A, hypocenters having misleadingly low at: estimatesare flagged by a + sign to the right of at: for case A, or by ++ for case B. This procedure conformsto the tradition of providing point estimates for hypocenters in preliminary seisrnicity catalogs,but explicitly acknowledges cases where depth-of-focus uncertainty is clearly underestimated byHYPO71's standard error statistics.
A more comprehensive solution than that outlined above would describe the volume where theRMS function (or a similar function) approximately attains its minimum' In general, it is emphat-ically not the case that the point estimate ± one standard deviation is a reliable estimate of that
_ volume, whether using HYPO71 or any similar leaa-ssquires software for hypocenter determination.One source of 'undeserved optimism" regarding error estimates is that their statistical determination
- is based on the local behavior of RMS, which in some instances may display a steep-flanked troughat a depth corresponding to a local minimum, but which may display a broad, featureless minimumat another competing depth. In other instances the standard error estimate for focal depth may beunrealistically large, as occurs when the hypoccnter locates in the immediate vicinity of the deepestsampled layer interface in the earth model.
The RMS travel time residual function is multivariate, and algorithmic attempts to minimizeRMS are necessarily performed in lower-dimensional subspaces than its true domain. As a practicalmatter, iypocenter determination is performed by fixing many of these variables at 'plausible'
* values, rather than routinely exploring all "equally likely" alternate values. In particular, RMS isobviously sensitive to weighting schemes, w,, as well as to velocity model, T,. Weighting of data hasfour components, (1) the analyst's subjective weight assignment at the time of phase data collection,
- which is based on the impulsiveness of the arrival, (2) the source-station distance, (3) the azimuthalquadrant which the source-station ray samples, and (4) the "feedback" residual weight. Weighsassigned by the analyst are discussed further in YMP-USGS Technical Procedure SP-01, 'Procedurefor the preliminary determination of the earthquake hypocenter." We note here that an S-arrivalweight at a given station is always downweighted relative to the corresponding P-arrival weight,since the S-wave slowness is greater and would increase its relative influence on the location processif such downweighting were not performed (see Gomberg and others, 1990, eq. 6). Distance weights,wd, depend on the model. For all earthquakes that are located using the Yucca Mountain velocitymodel, shown in Appendix F, wd = 1 for d < 5 km, and wj linearly decreases with d in the range5 < d < 90 km. Station arrival time data for stations greater than 90 km from Yucca Mountainepicenters are automatically zero-weighted. For all other earthquakes in the SGB, Wd = 1 for d < 10km, and wj decreases linearly with d in the range 10 < d < 220 km, and wj = 0 for d > 220 km.Azimuthal weights attempt to balance the sum of arrival time data weights in each 900 quadrant,or in each 1200 sector if station coverage is very poor. The azimuthal weight algorithm is discussedin greater detail in Lee and Lahr (1975).
The last weight factor is computed from each station's travel time residual, (T. - T,)j. Aftereach iteration after the second, the station residual is examined by the algorithm, and if its amplitudeis relatively large, the ith weight is reduced, sometimes to zero. The computed travel time to each
S

station, T., is the minimum travel time for the direct ray and each of the possible refracted rays, forthe given velocity model, plus any a priori delay that has been defined for the station.Therefore, for a given set of arrival time data, there are infinitely many computable RMSfunctions, and the determination of the 'quality' of a hypocenter is necessarily colored by theanalyst's choice of station delays, weighting functions, and velocity model (earth parametrization).
For the hypocenters of this report, HYPO71 assigns two grades to the hypocenter (A through D, neverF!), but neither grade fully accounts for uncertainties in the velocity model or in the station delays,or for the effects of information censoring performed by the weighting functions. The first gradefocuses on the quality of the hypocenter (low RMS residual, small standard errors of the epicenterand depth), and the second on the station distribution (number of phases, station azimuthal gap,distance from source to nearest station). Lee and Lahr (1975) discuss HYPO71's grading criteria indetail.Where crustal velocities are not well known (for example, where velocities differ from the model
velocities by more than 2 percent), primary and secondary wave arrival time data are usually insuf-ficient to constrain the depth of focus estimate for local earthquakes to lie within approximately onestandard-error-of-depth (as reported in Appendix A) of the true hypocenter (Gomberg and others,1990). To some extent, this uncertainty is reduced by insuring that accurate P and S arrivals froma station within one focal depth epicentral distance are available - a condition which is absent formost data of this report, but which is driving the site selection for the upgrade seismic network,N the deployment of which is presently under way. Although we routinely asr-gn HYP071's depth offocus estimate, z, to earthquake hypocenters discussed 'a this report, the true depth should not beconsidered known to within one standard error of z unless 'D%11.N," the source-to-nearest-stationdistance, is less thar about 1.4 x z.
Estimated hypocenters for chemical explosions are reported in Appendix B. Many known chern-ical explosions are located treating depth a free parameter, and the results of some of those experi-ments are listed in Appendix B. If a blast's depth is constrained during iteration for its epicenter, thedepth is generally fixed at -1.0 (one km above sea level). The fact that unconstrained depth estimates
- for known blasts can exceed ten km below sea level is an indication of poor station coverage andof problems with the velocity model, especially in the source zone (SGB mining detonations oftenoccur in low-velocity alluvium, with V, < 2 km/sec, while V, = 3.8 km/sec in the shallow layer of
-2 the standard SGB velocity model). The fact that earthquake data usuclly include several secondarywave arrivals that constrain the depth estimate whereas chemical explosion data usually lack sucharrivals, as well as the probability that the earthquake source zone is better modelled by the simplelayered velocity structure used in hypocenter determination than explosion source zones, imply thatearthquake location accuracy is better than would be indicated by blast location errors reported inthe chemical explosion catalog.
Alternatives to the forward-inverse approach to hypocenter determination have been suggestedin various seismological research articles. A maximum-likelihood approach yielding a more compre-hensive description of the hypocenter is explored by Gomberg and others (1990). In that approach,the inverse problem is avoided by computing RMS or an equivalent measure of goodness-of-fit atall points on a grid that surrounds the true source. The resulting hypocenter is then a 'probabilitycloud" whose dimensions are determined by requirements of Gaussian distribution of the stationtravel time errors. In the interests of conciseness, that approach has not been adopted for dataanalysis in this report, although the variation of RMS with constrained depth is examined for a fewhypocenters discussed below.
Can localized velocity anisctropy be Inferred from NTS nuclear tests?Whereas the comparison of true location with the estimated hypocenter of blasts (either chemical
or nuclear device) provides, at best, indirect information about earthquake mislocation in a highlyheterogeneous crust- unless they occur in the same place - the examination of station residuals
6
when using the true source location, and tracing rays using HYPO71 and the standard velocity
model, provides useful, direct information about crustal rock velocities at shallow depths. This topic
has been investigated for SGBSN P-wave arrival time data from several dozen nuclear device testsdetonated at Pahute Mesa, Rainier Mesa, and Yucca Flat (manuscript in preparation). Although
a complete description of the findings of this investigation is beyond the scope of this data report,
some observations and speculations about their significance both to earth structure and to earthquakehypocenter determination are discussed below.
Arrival times of compressional waves at southern Great Basin seismic stations from nuclear
device tests at NTS consistently display delay patterns with a strong directional signature or trend.
Here, delay is defined as the difference between the observed arrival time and the theoretical time,
when computed using the standard SGBSN velocity model, which is azimuthally isotropic. This
apparent azimuthal anisotropy is observed to varying degrees in data from all testing regions, Yucca
Flat, Rainier Mesa, and Pahute Mesa. Because seismic network station separation is on the order of
20-30 km, and the distribution of sources is limited, no detailed tomographic analysis' of the upper
crust is possible; however, the delay patterns are grossly related to known geology and to regional
structural grain (orientation of microfractures, cracks, joints and faults), and to tectonic stresses.
Perhaps the most striking feature of the P-arrival delays for Rainier Mesa (southern Belted
Range) nuclear device test data is their 180'-period azimuthal variation, which has peak-to-peak
amplitude of one second, and appears to be nearly distance-independent for SGBSN station distances,
ranging from 12 to 200 km. Figures 2a and 2b show the delays for Rainier Mesa tests Disko Elm and
Mission Cybar, respectively, plotted as a function of azimuth. Figure 2c shows the "reduced" delays
for the test detoisation Disko Elm, plotted against source-to-station distance, where the 180'-period
azimuthal effect, as defined in the next sentence, has beer. removed. Fitting thc Disko Elm delays,
T., with the function,T,(9) = acos(G, - OH) + b +
where Pi is the source-station azimuth for the ith datum, eH is the 'high-speed' azimuth, and c, is
the unmc-ieled component of the ith delay (1P norm), yields a = -0.741, b =-.133, and a correlation
coefficient, p, of 0.80 between the data and the function values. The angle 9 H s 100 maximixes p
for the P-arrival data of Disko Elm, and lies in the range 100 < OH < 150 for the other Rainier
Mesa tests of Table 1. Furthermore, because P-delays show very weak distance dependence, it is
reasonable to hypothesize that the azimuthal variations are generated in the inner 30 to 50 km of
the source hypocenters (working points), or in a combination of the initial down-going and the final
up-going portions of the raypaths.Possible physical explanations for these anomalous travel time delays include the presence in
the vicinity of Rainier Mesa of a high-speed body at shallow depth having longitudinal axis trend-
ing at s OH, or stress-induced velocity anisotropy in much of the rock surrounding Rainier Mesa.
The relevance of tb' stress-induced velocity anisotropy model (Nur, 1971) comes from the obser-
vation that EH is approximately perpendicular to the direction of average tension of SGBSN focal
mechanism solutions, presented in previous SGB seismicity reports, and below, and to the direc-
tion of least compressive principal stress in the earth's shallow crust, as determined from a series
of Yucca Mountain hydrofrac experiments (Stock and others, 1985 and 1988). It is possible that
P-wave velocities are being strongly influenced by aligned, propped open, cracks and microcracks in
rock at shallow depths, according to the "extensive dilatancy anisotropy (EDA)" model (see Leary
and others, 1990, for a review of recent seismological investigations on this topic). The possibility
that seismic anisotropy results in significant P-wave velocity variations in the shallow crust of the
southern Great Basin of Nevada is a current area of research.
If EDA is the primary source of the observed travel-time delay patterns from many NTS nuclear
detonations, an 1800 P-wave amplitude modulation effect (not necessarily sinusoidal) should also be
observable in local station seismograms. This potentially diagnostic effect cannot be verified by
7

) i I I.~ ) 7 2~
( a) D I s o L I riI, P 11tD) h l l ssorl Cyber, RM
0.1
0.3 _
O~s _'
Va0
V.
I%. ° oU
U o8 Jo,
O.)
0.2
00 '.
°o I1-
_
C,0..
0 D./
a, 0.9c 3
V)
)0 (I
I.1
0. 00.0
I..I
.4 *I,. 4 .-I .- *1.10 Jbt .0
0
0 0
0 000
0 0
0!: c~c 0°
0
U .0U 0
*'j1 *t~l' '-14 1.- 4-. I-s241~. M-.Xif *U-3.30-'4--l J~l~lx bOO ' U 100 1' IdjUtJ21 240.0 ;?'0.0 m. u 3;0.0 3bO0 OAvtrnuth Ideoi
C i) A j '2r), PH
,_,+-4.. .tc; 4 I 0- - -.- 4- 4 .1 -I - t .,4U1.0
Azimuth Ideqil
(c)UDsko EIm, t ;rn,)vlr,, z zrrZ-itt31 V i ie au. r
C-,
C
:0
10a,
0
0*I
11.4
0.2
0.0
0.2
0.4
000
-. O 0 r °
0 U O00 0
U I
0.
o.4 I C .!; y/'o s301)I, ls)t ,;. 4, ,^. ,t 2
V .
0
i : 0'0e,
UC
I
v
c# C.-co ,;
00V
IN
VC.'4
* * * --- .* . - 1 - .- ~ I~+ t - t t - ~-t . I2JI 1w, 4 -) 0. 0
A -- ,* I. --1nFigure 2.- Plot of P.wave travel tnie delays for HlTS nuclear device tests recorded at SGBSN stations. Delays Are relative to the predicted arrivaltimes from the standard (asimuthsally isotropic) velocity model shown in Figure Fl(a). (a) For data from the Rainier Mesa tug Disko Elm, opencircles are observed delays plotted against source to station azimuth, clwd triangles are values of aco'(l - 101) + 1, a sinusoid with 180 periodicitythat attempts to fit the observed data. (b) Obeerved P-wave delays for the Rainier Mesa test Mission Cyber. (c) Diso Elm delays after removingacoc2(I _ -I0) + b plotted against source-to-station distance. The lack of a linear trend in these residuals with distance suggests that the asimuthallyvarying component of the 'signal' occurs near the source. (d) Observed delays (open circls) and a 180' period functional ft (dark triangles) for theP-wave arrivals for the Pabute Mesa test Alamo (880707 15:05:30 UTC), ploted against source-to-station asimuth. Note phase shift evident in (d)relative to (a) and (b). The larger average delay for Alamo arrivals relative to those of Rainier Mesa tests is the result of lower average compressionalwave velocity in the shallow rock at Silent Canyon Calders compared to that of other NTS testing areas.
,(-)C C

the current SGBSN, since initial P-wave energy from most nuclear tests overdrives the telemetry
electronics. Teleseisrnic P-wave amplitude modulations with period 1800 have been observed from
NTS explosions (Lay and others, 1984), but they were interpreted as radiation from strike slip
tectonic release triggered by the tests. Although investigators are apt to model the propagation
medium as isotropic, "one of the most powerful factors modifying radiation patterns of body waves
in anisotropic media is focusing of energy near velocity maxima and defocusing near velocity minima.
These effects are pronounced even for small anisotropy' (Tsvankin and Chesnokov, 1990, p. 11,330).
Large-scale heterogeneities in rock properties at NTS may also be the primary source of the
strong variation in P-delay with azimuth. Measurements oi some dolomite rock velocities from core
samples taken from Rainier Mesa and northern Yucca Flat, NTS, indicate P-velocities approaching
seven km/sec (Carroll and Magner, 1988). Much of the lower carbonate aquifer that extends through
eastern and central NTS is comprised of dolomites and quartzites (Winograd and Thorardson, 1975).
A > 0.6 km thick dolomite section was encountered below a depth of 1.2 km at a borehole near Yucca
Mountain, Nevada (Carr and others, 1986). The geographic extent of the lower carbonate aquifer is
not precisely known. If it is terminated by the volcanic calderas of western NTS, and by an unknown
relatively slow structure east of NTS, the lower carbonate aquifer may act as a high-speed corridor
for seismic rays from Rainier Mesa and western Yucca Flat nuclear device source zones to many
SGBSN stations that lie in sectors at azimuths 15° ± 150 or 1950 L 150 from those sources. The fact
that the P-wave delays from sources at Pahute Mesa, fir example, Alamo delays, plotted in Figure2d, do not display the same high-speed phase angle, #H as those from Rainier Mesa tests, suggests
that (1), directions of horizontal principal stresses within Silent Canyon Caldera may be rotated
50° to 600 from those at Rainier Mesa, or (2), structural heterogeneity is the primary source of the
azimuthal variations in travel-time delays.
Table 1. Summary of PDE location parameters for selected nuclear device tests at Rainiar Mesa,
1985-1989, having strong azimuthal P-wave delay pattern. Dmnin is the approximate epicentra]
distance to the nearest reporting SGBSN station, ML is the Berkeley observatory magnitude.
DATE TL.E LATITUDE, l LONGITUDE, Depth Name ML I Dmin
I (UTC) N. W. (km) (km)
850406 23:15:0.09 37012.05' 116012.43 -1.85 Misty Rain 4.8 1 11
i 851009 23:20:0.09 37012.58' 116012.61' -1.85 Diamond Beech 4.0 10.1870318 18:28:0.09 37012.61 11612.52' -1.85 Middle Note 4.4 10.2
870620 16:00:0.10 37013.20' 116010.67' -1.74 Mission Ghost 3.5 12.9
871202 16:30 0.08 37014.08' 11609.80' -1.65 Mission Cybar 3.5 14
881210 20:30:0.06 37°11.94' I 116°12.57' -1.86 Misty Echo 5.0 17
890914 15:00:0.10 37014.15' l 11609.77' -1.60 DiskoElm 4.0 13.6
Contour maps of percent horizontal velocity variation from the underlying azimuthally isotropic
model of Figure Fl(a) are shown in Appendix C, figures C2, C3, and C4, for SGBSN station P-arrival
delays computed for the NTS tests Alamo (a Silent Canyon Caldera test), Disko Elm, and Kawich
(a Yucca Flat test), respectively. These contour maps show a similar high-speed corridor (the lower
carbonate aquifer?) east of the caldera region of the western NTS, extending north and south of
the NTS. The values of the velocity variation function, AV(x, y), are arrived at by the following
reasoning. Let ti be the ith source to station travel time (sec), Ai the source to station distance
(km), v, the ith apparent observed horizontal velocity, and us the ith apparent horizontal velocity
computed by HYPO71 (ui is a function of distance and station elevation). If we assume that the ith
station residual computed by HYPO71, Di, is the result of unmodeled horizontal velocity variations,
then t, = 4/v; = As/us + Di, whence ui = Aivi/(Ai - Div1). The percent velocity variation,
9
computed at the ith station's location, is then
AVi(%) = loo x i - = 100 DxD.
AV(x,y) is then computed by interpolation/extrapolation of AVi onto a (constant-elevation) gridover the SGB, and is plotted. Common features in the contour plots of data from different sourceregions (Figures C2, C3, and C4) suggest that crustal heterogeneity rather than azimuthal anisotropymay have a dominant role in the production of observed P-wave delays.
It is difficult to determine the extent of azimuthal velocity anisotropy at shallow to mid-crustalseismogenic depths because earthquake locations are uncertain, and typical hypocenter algorithmsadjust available free parameters to reduce data/model misfit, thereby obscuring unmodeled proper-ties of the earth. A theoretical study (Rothman and others, 1974) on the sensitivity of hypocentersto unmodeled transverse isotropy showed that epicenters will be consistently biased, regardless ofassumed isotropic velocity used, and that depth estimate error varies linearly with fractional errorin average velocity. Using actual SGBSN data, relocating Disko Elm as a hypothetical earthquake,allowing latitude, longitude, depth of focus, and origin time to readjust freely, HYPO71's final solu-tion using the standard SGBSN velocity model converges to a depth about three km below sea level,indicating a low model velocity. The station residuals for the free hypocenter continue to show afaint azimuthal periodicity, but the correlation of delays with 7'(8) drops to p = 0.51, from p = 0.80when fixing the hypocenter at the true working point. It is easy to imagine hat if the anisotropyimprint on arrival time data is not very clear to begin wita, what signal there is will be lost by thetypical hypocenter-determining algorithm which uses an azimuthally isotropic velocity model. How-ever, routinely invoking an azimuthally anisotropic velocity model when determining hypocenters isnot justified until alternate explanations (crustal heterogeneity) for the seismnic travel time delaysfrom NTS nuclear device tests have been fully discounted. One investigation having relevance tothe question of how seismic anisotropy varies with crustal depth concludes that there is no evidenceof shear-wave polarization at depths Veater than three to five km (Kaneshima, 1990). Althoughthat investigation analysed seismograms from events in the Japan volcanic arc, the underlying rockphysics is similar for the SGB, and may imply that EDA effects may be confined to the) final upgoingportions of most source-to-station raypaths for most SGB earthquakes.
Earthquake magnitudes and detection threshold
- The SGBSN routinely detects earthquakes having ML > 1.5 throughout the southern GreatBasin. This size threshold drops to ML ez 1.0 in the southern NTS and to ML ; 0.0 at Yucca Moun-tain. For the SGB earthquake data listed in Appendix 1, 90% of the hypocenters have MAL < 2.2, and95% have ML < 2.4. Size estimation is done using one or more of the following methods, discussedin greater detain in YMP-USGS SP-04, "Preliminary determination of earthquake magnitude," (1),ML from horizontal-component amplitude/period data, (2), MfL-equivalent from vertical-componentamplitude/period data (vertical component amplitudes are multiplied by 1.75 to convert them tohorizontal), (3), MCO from fitting an envelope over the decaying S-coda in series of 5-second 'win-dows" that do not contain overdriven amplitudes, (4), MD fromt total coda duration, and (5), a ML'lower bound" from clipped amplitude/period data. Measures (1) through (4) have been discussedin previous SOB data reports (Rogers and others, 1987). In previous reports, ML was reported asthe average of vertical-component and horizontal-component magnitude estimates; here, the two arereported separately. Figure 3 is a scattergram of the horizontal-component ML estimates (scaled tothe horizontal axis) versus the vertical-component estimates (scaled to the vertical axis) for about 800randomly selected SGB earthquakes that occurred in the period 1987 through 1989. Least-squaresregression of the y-values on the x-values for the data in Figure 3, constrained to pass through theorigin,
yj = axi + ci,
10

1987-19893.4
t_
9_00
4->
3.2
3.0 -
2.8
2.6
2.4
2.2
2.0
1.8
1.6
1.4
1.2
1.0
0.8
0.6
-O
0 0 80
0
0 00S~ &
0
00
0
0
So
0
0
0
. .
CP 00
I . I . I . I . 10* I I . I I . I0.4 . . I I . _lI I . . . . . . . . . . _
0.4 0.6 I _I I i I I I 3 .0.8 1.0 1,2 1.4 1.6 1.8 2.0 2.2 2.4 2.6 2.8 3.0 3.2 3.4
ML (horiz comp)
Figure 3.- Comparison of horizorital-component instrument-determined local magnitudes, ML, with
vertical-component instrument-determined local magnitudes, Mv, for a subset of the 1987 through
1989 SGBSN hypocenter data.
11

yields a slope a = 1.00, indicating that the 1.75 factor that is routinely used to convert verticalamplitudes to 'equivalent" horizontal amplitudes is reasonable for SGBSN data, in the sense that,on average, no bias is thereby introduced.
The fifth magnitude, ML from clipped or overdriven data, is theoretically a lower bound onmagnitude because the clipped amplitude is, by definition, less than the actual amplitude. However,in practice, this magnitude is not necessarily a lower bound when compared to other ML estimates,because the clipped ML is defined as the maximum of ML (J), where j is an index over all clipped,scaled, post-S wavelets, whereas the other ML estimates are averages of all unclipped scaled data.Because the earthquake radiation pattern, site conditions, and other geologic variability all contributeto a large range in reported station magnitudes, we frequently observe that the averages of on-scalestation magnitude estimates are lower than the maximum of the off-scale estimates. Magnitudesderived from clipped records are provided as a check on ML computed from on-scale records. Theseismic network upgrade will alleviate many of the problems associated with the current network'shigh-gain, limited dynamic range design, including that of most stations' amplifiers going off-scalefor input signals from SGB earthquakes having ML > 3.0.
We are often faced with the apparent paradox of reporting ML from 38-dB horizontal-componentstation data that is on the crder of one unit higher than ML from 84-dB, vertical-component stationdata, for a given earthquake. Examples of this discrepency are magnitudes for an earthquake on June17, 1987, 0:00:50 UTC having MM = 4.18 and MLv = k.8 and an earthquak- on October 28, 1988,20:02:50 in Cold Flat (Miellan quadrangle) having ML" = 3.40 and MLv = 2.78 (the superscripts referto horizontal-component and vertical-component, respectively). Tentatively, the primary reason forthese discrepancies is that the network provides a severely biased sample of on-scale station data fromearthquakes having ML > 3.0. In other words, for larger mnicrocarthquakes in the SGB, an unbiasedsample of the actual distribution of peak amplitudes of ground motion is not currently available;only those high-gain stations that sample the relatively low-amplitude tail of the distribution remainon-scale. Various calibration tests at the low-gain station at Little Skull Mountain and at high-gain stations run near the amplifier/VCO band edge have revealed no system non-linearity thatmight provide; an alternate explanation. For a few earthquakes having ML > 3.5, only low-gainhorizontal-component station magnitudes are reported, since virtually all of the verticai-componentstation amplifiers are overdriven. Examples of such earthquakes are Masy 26, 1988, 03:56 UTC , forwhich MLI = 4.2, MLRK = 3 .9, and MLPAS = 3.4, in the Dry Mountain, California, quadrangle, and
- January 9, 1989, 05:08 UTC, for which ML< = 3.5, MLN"C = 3.5, and MRENO = 3. 6, 10 miles northof Las Vegas, Nevada (Gass Peak SW quadrangle). The May 26, 1988 Dry Mountain magnitudediscrepency may be the result of only one SGBSN station, LSMN, providing an on-scale amplitudefor magnitude determination, which is too few for a robust estimate. Also, LSMN generally providesa magnitude estimate several tenths above that of any other SGBSN station for a given earthquake,suggesting a local site amplification effect. If so, it is peculiar that the high-gain vertical componentstation, LSM, does not display a systematic magnitude bias relative to other vertical-componentSGBSN stations.
The magnitude determination procedure for the SGBSN, in summary, is internally consistent forearthquakes having ML < 3.0. For larger earthquakes, we have to rely on meager on-scale amplitudedata from the SGBSN, which are difficult to calibrate due to the relative rarity of such events, oron estimates from adjoining seismic networks. For earthquakes having ML > 3.9±, the SGBSNhas < 1 on-scale station, and that station displays hints of overestimating magnitude by 0.3 - 0.5units. Furthermnore, the MC.. estimate has been calibrated against ML for smaller earthquakes,having ML < 3 (Rogers and others, 1987), but tends to underestimate larger earthquakes. Thus, theSGBSN magnitude estimates for earthquakes having ML > 3 are preliminary and subject to revisionas more data become available. For example, the upgrade seismic network, now being installed inthe SGB, will have sufficient dynamic range to allow us to calibrate the current network's horizontal-
12

component data against the upgrade network magnitudes.
Overview of local SGB selsmicity, 1987 through 1989
In order to distinguish 'local" seismicity from 'regional" seismicity in this report, the southern
Great Basin is defined as the interior of the region bounded by parallels 35.60 North and 38.5° North,
and meridians 114.50 West and 118.00 West, respectively (definition 1). A more tectonically inspired
definition would place the Sierra Nevada frontal fault as a western boundary, and the Garlock Fault
as a southern boundary of the province (definition 2; see Carr, 1984); a few SGB earthquakes that
are 'regional" by definition 1 and local by definition 2 are discussed in this report. The SGBSN
(Figure 1) does not extend to either the tectonic boundaries or to the above map boundaries, and
no claims are advanced as to the completeness of the catalog outside the convex polyhedron with
verteces at the outermost SGBSN stations. In particular, seismic activity in and southwest of the
Panamint Mountains, California, is not routinely located, because the southern California seismic
network covers that region. Also, north of 38.0° North, only one SGBSN station exists (HCR), and
south of 368 North, only two SGBSN stations exist (QSM and EMN), not enough to constrain
locations effectively in their vicinity. Station coverage east of the NTS, from Nellis Air Force Range
N to Alamo, Nevada, is also not sufficient to capture low-magnitude earthquakes in that area. With
these limitations, the 1987 through 1989 catalog should be complete to a lower ML bound of 1.5.
Data from "regional" earthquakes that are detected by the SGBSN's -omputer are permanently
- archived onto magnetic tapes, usually without anal) ys. These tapes include data from California
earthquakes, including the seismically active Long Valley Caldera and the less-active southern Death
Valley, from central Nevada earthquakes, and from earthquakes in eastern Nevada, western Utah,
and northwestern Arizona. Regional earthquake data are available to and are frequently provided
to seismologists investigating those regions.
SGB seismicity for 1987 is shown in Figure 4. Concentrations of southern Nevada earthquakes
occur at the southern end of the R.veille Range, in the Pahroc Range, in the Pahranagat Shear Zone,
in the Spetted Range (northwest of Indian Springs, Nevada), in the southern NTS (Rock Valley fault
zone, Mercury Valley, Mine Mountain) in the central NTS (Eleana Range), in the northern NTS
(Silent Canyon caldera), at Gold Flat, at Gold Mountain, Slate Ridge, and Mt. Dunfee, and in
the Sylvania Mountains. A concentration of earthquakes near MinA, Nevada, occurred during July
_ and August, 1987, with mainshock on July 28, at 1:55 UTC, having ML = 4.7 (BRK), coordinates
38.383° North, 118.117°0 West, 14 km depth (not shown). Concentrations of California earthquakes
-' oLcur in the Inyo Mountains, Eureka Valley, Last Chance Range, Grapevine Mountains, and in the
Panarnihit Range. More diffuse activity occurs in Death Valley. All of these areas were active or
moderately active in previous years (Rogers and others, 1987). Four earthquakes at Yucca Mountain,
Nevada, are discussed in the next section.
SGB seismicity "or 1988 is shown in Figure 5. The regions of concentrated seisrnicity for 1987
mentioned above continued to be active in 1988. Also, a second swarm area 10 km east of the first at
the southern Reveille Range, Nevada, began to show activity in 1988. At Gold Flat, the seismicity
level increased. A north-south trending concentration of microearthquakes in southwest Amargosa
Desert, California, occurred in 1988 and 1989. Strongly felt earthquakes at Boulder City, Nevada,
during the early part of 1988 (discussed below) prompted the installation of a permanent seismic
station, EMN, in the Eldorado Mountains, south of Lake Mead, in August of 1988. Seismicity in the
Eldorado Valley and in southern Lake Mead has been catalogued since that time by the SGBSN. The
largest SGB earthquake for 1988 was a ML = 4.4 earthquake in Owens Valley, California, on July 5,
at 18:18 UTC. Although west of the SGBSN, the earthquake is within the physiographic province,
and is of interest because a magnitude 7.5+, MMI=X, earthquake occurred in Owens Valley in 1872
(Beanland and Clark, 1987). A normal-slip focal mechanism for the 1988 Owens Valley earthquake is
shown in Appendix D, Figure D23. At Yucca Mountain, an isolated earthquake occurred on October
13
~._

117 li0 11538.5
S
7 0
0 0+
0 +0 + V +
o 0 O * o0
V
_ 0 D V V 0 .
° \0°l~ V ° e o 0X0 V 37.C0 0 0
10 0 - ° 0 406 *O... 0 0 .0 00
0 0 0 V n D*0 0 0ll -0 - -0 0 0 D 10 0
* 0w C 0. oIT D 00y a
o 0 S m C 2 0 +
FSv 7. 0
* 00
* 00 38.80*0 0
00RVA 0o:0 WVTAV
o 0 00
00
0 CrY ORIOWN 114.50 28 010k SKISMO0RAPMU STATION mOi Ok
mas< 1.0 0 2.Oina< 3.00 1.O Xmm < 2.0 0 ID S mag
Figure 4.- Earthquake epicenters in the SGB and SGBSN stations for the year 1987.
14
o1 It 11 O59
0 ~0 0
00
o 0
0 00a,
,0o o
+ + V °° +
0 z q 0,7
0 0 a
0 0 .7 di I w * 0
fl° 000 0 oV V V3O O
IV 9wmi e \ ° ° *o) \ o
o Oo 0
0 2
*0 *mg< . Z.O S co < 30
00
000.0 a * 0 0
o 0. 030S
0ca
0 0
.0A=g< .0 0 0. Sma
Fiur 5- athuae pietes n heSB ndSGSNsaton fr h yar1+8
15

5, 1988 and a small swarm of earthquakes occurred on November 18. Yucca Mountain seismicity isdiscussed in sections below.SCB seismicity for 1989 is shown in Figure 6. Areas of concentrated seismicity for 1987 and1988 continued to be active in 1989, although Yucca Mountain was seismically quiet. SarcobatusFlat, noted for several seismicity swarms in previous years (Rogers and others, 1987), showed renewedactivity in 1989, after being quiet in 1987 and 1988. Bare Mountain, Nevada, had several earthquakesin 1989. Yucca Flat, NTS, was seismically active, moreso than in the previous two years. Althoughthe Oasis Valley, the western boundary of volcanic calderas that comprise most of the western NTS,was not particularly active in any one calendar year, it does show a north-south trend of epicentersfor the 11-year monitoring period, 1979 through 1989. Figure 7 shows epicenters in the vicinityof the Oasis Valley for that period, along with the westermost boundaries of major local volcaniccaldera complexes (Christiansen and others, 1977; W. C. Carr, written communication, 1990). Anearthquake on January 9, 1989, 10 miles north of Las Vegas, Nevada, was energetic enough to cracka few windows in Las Vegas, the only cultural damage reported to the NEIC from SOB earthquakesduring the three-year period, 1987 to 1989. Its focal mechanism is discussed in a section below.
In an attempt to discern whether rates of seismicity are changing significantly with time indifferent parts of the SOB, we count the number of earthquakes recorded by the SCBSN in each ofthe 384 7 1 x 71 minute quadrangles contained in the region 114.875'W to 117.875 0 W, and 36.1250 Nto 38.125'N, (To increase legibility in the following figures, data for the outermost subregions ofFigures 8 and 9. for example, those having longitude 117.8750W to 118°\, are not included inthis compilation.) In each such quadrangle, two numbers are printed, the top being the numberof earthquakes recorded in that quadrangle during the period 1987 through 1989, and the bottombeing the number recorded during the previous three-year period, 1984 through 1986 (Harmsenand Rogers, 1987). A similar map shown in Figure 9 compares those same numbers of recordedearthquakes in 1987 through 1989 (top number) with those recorded in the period August. 1978through December, 1983 (bottom number, Rogers and others, 1987). The two periods of seismicmonitoring for which the data of Figure 8 are compared have the same station coverage, detectionthreshold, and instrumentation, whereas significant variations in station coverage, etc., occurredbetween the two periods compared in Figure 9. Therefore, caution needs to be exercised whencomparing rates of observed seismicity in a given subregion. Also, significant spatial variation indetection threshold exists over the SGB, as noted et.rlier, so that comparisons of seismicity rates indifferent parts of the SCO should be made with caution.Some of the most obvious temporal variations in seismicity rates for the data of Figure 8 occurat the Pahranagat Shear Zone, Nevada (roughly 37.25° North, 115.00 WVest), in the Reveille Range(roughly 37.8° North, 116.20 West), in the southern Montezuma Range (roughly 37.60 North, 117.40West), at Gold Mountain (roughly 37.25° North, 117.25° West), at various locales within SarcobatusFlat, in the Amargosa Desert south of NTS, and at Timber Mountain, which straddles the westernNTS boundary (see figure 1 for locations of physiographic features). In these and other subregions,clear increases or decreases in rates are evident, suggesting that stable patterns of seismicity oraseismicity cannot necessarily be determined from a few years of seismic monitoring. This conclusionis reinforced by comparing the temporal variations evident when comparing the period 1987 through1989 with 1978 through 1983. The Pahranagat Shear Zone was active during both of the periods,whereas the Reveille Range was seismically quiet during the earlier period. This quiescence isnot the result of insufficient station coverage, as the SGBSN had a station, RYE, in the ReveilleRange through July, 1981 (Rogers and others, 1987), which was then moved north to HCR, so thatdetection threshold in that subregion was comparable for all three periods.While several zones having largc temporal seismicity rate variations may be discerned, the ma-jority of 71 x 71' quadrangles show relative rate stability. For example, within a 50-km radius ofstation YMT4, on Yucca Mountain (that station's location is shown in Figures 8 and 9), temporal
16

115li0 38.
37.5
f -~
36.6
35.8
0 2 0V SEMWOCRAPH1C STAMQN OX 3 CmY OR TOWN
0 25 50 100 km o 20 3 a -
'* IMa < 1.0 D .OS <3
.0e 1.0 S mal < 2.0 0 3.0 S meg
Figure 6.- Earthquake epicenters in the SGB and SGBSN stations for the year 1989.
17

37.5
_ -
.
::5.925 116.5
o 2 6 10 gV SEISMOGRAPHIc STATION0 2 t 1 n km0 CITY OR TOWN
- cooK - 4 .u
0 1.0 5 meg < 2.0 (BMCVC-Blec Min. CaldermTMC-Timber Min Caldera
U0
2.0 S mag < 3.03.0 S mag
Figure 7.- Earthquake epicenters in thes Oasis Valley region west or the Black Mountain and TimberMountain calderas and east of Sarcobatus Flat, for the period 1979 through 1989. Caldera boundariesare shown as solid curves or dashed curves (written communication, Will Carr, 1990). An inner limitand an outer limit for the resurgent dome of Timber Mountain are partially shown as dashed rings.
18

84-88 compared to 87-89
117.75 117.5 117.25 117 115.75 115.5 315.25 310 115.75 315.5 135.25 315 114.75
I* *~'O S 3:'O 3 3 8 3 U0 a 3 0' 3 A I
o + 9 1 a 9 32 27+1 I 8 a 1 2 1 9+889 *gggg98999a 09 4 I1a 999 01 11
£I113123 13 I 1 S Lt52~321252'.103-1 33 1 ; 8 U1 a 9 a 79 )Z:3 i * 1 8 9 1 214-I9 28011i2801 11 9991 183I8999738 7313a 1 8 a U 8 I 2 9 9 9 98 3 1 9 8 9 1 2 4 84 11'
4 7.33 VA19 I D 8 324 5 I3 3 1-3 I S 8 2'.. 9 15 5:22 4 S 353 3 is I I 8 Z3 3 1 2 2 Sd 213 39
71229 52 52 3 4 51 9a5 22153 8 r. 17 6.9 2 9 3 1 3 3 4 3 3 6 0 3 1 9 9313 7 29 2 26 e91:5 7 35 33 190 2 2 42 7 2 .1 35 3334 37 95) 7
7'2. 5 81 131 1 2 5 Is I12 1 7 1 3::: 3 2 f 'I 5 25 112 3737 628 99J9313 03222256 7932i I41086 3416 5 43 7 49 9 76 14 3 41 I 36 7 9 0 9 I 8 L 3 96 5231 38913 to 2911 1136 21I 3$7 47 1 1I 55IS1 313 2 45. 9: 3 5 4 6 53 1 4 2 7? 17 25 23 2 5 1 2 9 6! 2 +S
le 30 14I 19 9 0+3 £6 1 1 7 p 1Is £9 5 1 9 1 3 2 3 1 3+95 I 6 5 I e 6 4 9 It 29 20 19 I 9 9 9 9 3 4 0
23 72 13 382 59 35 33 :25 9 73 2998Kt S I 9 a: s 26 48 47 8 7 17 2 3 9 9 8
091£2 4512 3 3 2 i I fee y51 19 71 1216 2 1 1
2 98 I 8 012 3 84 2211554 63.1 2 1 ki 0 2 4 149033 02 916 I1337 909316 7901£1 3226 9 3 9 3 2 98 390 7 '412 9 I I 0 3 9 4 2 2
8 aJ 87 23 I C 93 3 8 292 5 8 1 262 11 84 1 2.2iL3880 2 7 2 0 92
1 2 2 2 13993 90 O 9, £.~P3' 1 Il 1 0 3 5
38
37.75
37.5
37.25
31
30.75
30.5
36.25
118-I36
114.75V7 SEISM0GR.AP11C~ STATION
0 25 50 100 km
Figure 8.- Map of SGB region showing, on a 7W' quadrangle scale, Lhe number of earthquakces
recorded by the SGBSN in the three-year period, 1987 through 1989 (top number in each 71' quad-rangle) compared to number of earthquakces recorded by the SGBSN in the previous three-yearperiod, 1984 through 1986 (bottom number in each quadrangle). Alternate rows are shaded to aidin visual separation of information in adjacent quadrangles.
19

78-83 compared to 87-89
117.75 117.5 117.25 117 210.75 110.5 110.25 110 115.75 115.53 115.25 115 114
Iz-
I I1 v I I I I i I
i .g * * u 3 3 2 1 .
2 9 1 0 9 +' 0 0 1 0 0 32 27+ 1 9 0 I 2 I 0+ 2
'*"~Ii ~r' ~' ~5 2r"3" 3- 2 I"'2'52Z
*j17 2 U i 9 I 1 2 1 I2 0 0 SI B I 9 0 4 1 31:
2 2 989988990 0 1 '0190280489 02 61692V1773~.~j't 9 924 51.S.1IS-1:*- 5 *2', C I52,i
7 ,i II 1 411 L 9 ' 315II1712 952 5 3 5 I 91 522 15 3 G1 9 17 6
1' 2 1 S 12 19 2 2 2 1 9 . 4 9 'I 9 4.-.5 5 2 19 22 11S 15 '7 s 13S32 It ~ Ii.O 2 2 2 .'? 1 1 5 1 3 1 A 37 SS".a'
71 to 1 I 3129 S .,S.S#* S 5 91692837S2994 31383 2222566 78 31 14 199 63425 3 15 5 5 2 49 8 5 72 26 2 4 6 8 3 2 17 S 3 166,.$311' 3 813. 2s8911 11 9..*$2 L& # #71, .1 t 1 11 2 49 I 3 3v 8 9 i:3, i3 '5 2 2 1 2 54 313- : 6* -2 2 1 4 8 4 4
10 a30 14 1 9 9 8't3 16 11 7 I1 1 15i 8 1 1I I 3 I 3 +08 2' 401 2 4 3 11 612 71 06 01 02 3)
2 3 4 7 S:1S3 3I 2 5,335231. 25:S 7 3 2 B *83 9 3 7 3 3 1;: . 2 5 0 47 .I :'It 4 I 9 I a ~0 0 2 2 3 3 I.. 1 3 2 I 0 3 21 1 16 7 10 10 2 1 0 1
1 0 0 7 3 7 0 1 0 1 1 4 22 38 7 10 2 1 I I3 soegsa5 5 8 7 4 26 .I.)I 62 9 5 3.A68 2 09 8 25.* 1.3 4 13 33 642 212 9 1 1 61I
4 0 3 3 0 2 9 16 . 1 13 0 7 9 0 8 16 7 0 1 1 1 2 25 13 29 31314 1 III 3 33 198340 022 4
1713 56 44 2 32 10 0 2 91 0 l 1 3 510
.7538.25
38
37.75
37.5
37.25
37
36.75
-36.5
* 36.25
3675119 114.
7' SEISMOGRAPHIC STATIONo 25 50* I I
100 km
Figure 9.- Map of SGB region showing, on a 7, ' quadrangle scale, the numnber of earthquakes
recorded by the SGBSN in 1987 through 1989 (top number in each 7 1' quvdrangie) compared tonumber of earthquakes recorded by the SGB3SN' in the period, August, 1978 through December,1983 (bottom number in each quadrangle). Alternate rows are shaded to iaid in visual separation ofinformation in adjacent quadrangles.
20

fluctuations in seismicity rates detected by the SGBSN appear to be relatively modest when com-
paring time periods of at least three years. These observations are purely statistical in nature. If the
region surrounding Yucca Mountain, Nevada, indeed exhibits a more uniform rate of seismic energy
release than many other subregions of the southern Great Basin, a physical mechanism should be
found that explains this phenomenon. In particular, an improved understanding of zones where
distortional strain is accumulating without displaying concomitant rates of microseismicity is needed
to predict where future potentially hazardous earthquakes may occur.
Yucca Mountain selamlclty, 1987 through 1989
The SGBSN operates six vertical-component S13 seismorneters and two horizontal-component
L4C seismometers at Yucca Mountain, so that microearthquake detection capability is at its max-
imum sensitivity there. Four small earthquakes were detecied at Yucca Mountain in 1987, and of
these, two were further analysed to obtain focal mechanisms (data quality was inadequate in the
other cases). Eight earthquakes at Yucca Mountain were recorded in 1988, seven of which were
members of a swarm having total duration 10 minutes; of these, one was large enough to provide a
well-constrained focal mechanism. No Yucca Mountain earthquakes were recorded by the SGBSN in
1989. For the purpose of this categorization, Yucca Mountain is the interior of the region bounded
by parallels at 36.75° N and 36.93° N, and meridians 116.3750 W, and llb.560 W, respectively. This
definition is somewhat arbitrary; the northwest end of Yucca Mountain blends topographicaily into
the Timber Mountain Caldera, and the rest of Yucca Mountain rises from alluvial fiats and washes.
This region includes the Yucca Mountain area geologically mapped by Scott and Bonk (1984).
A Yucca Mountain velocity model, based on interpretations of Hoffmann and Mooney (1984),
and shown in Appendix F, Figure Fl(b), is input to HYPO71 for Yucca Mountain hypocenter de-
termination. The effect of inputting the Yucca Mountain velocity versus inputting the standard
SGB velocity model (shown in Figure Fl(a)) on Yucca Mountain hypocenters is small. Figure 10(a)
shows the effect that varying the assumed focal depth has on epicenter (left side) and on RMS (right
side) when HYPO71 invokes the standard SCB velocity model for the Yucca Mountain earthquake
of June 1, 1987 (ML = 0.1). Figure 10(b) shows the same effects when the Yucca Mountain velocity
model is invoked. For this arrival time data set, the minimum RMS occurs for hypocenters in
the 5-6 km below sea level range, with min(RMS) = 0.04 sec when using the standard model and
min(RMS) = 0.08 sec when using the Yucca Mountain model. The epicenters at a given depth
derived from the two velocity models differ by about 0.2-0.3 km, which is a reasonable epicentral un-
certainty estimate for Yucca Mountain earthquakes located using SGBSN station data, in agreement
with HYPO71's standard error estimates. The fact that, in some cases, the Yucca Mountain velocity
model fails to fit Yucca Mountain earthquake arrival time data better than the regional velocity model
suggests that Æfine-tuningn of the Yucca Mountain velocity model (for example, determining station
corrections appropriate for that model and for local earthquake sources) may improve hypocenter
estimates (or RMS). Table 2 summarizes Yucca Mountain earthquake location parameters for the
period 1987 through 1989.
Table 2. Summary of preliminary location parameters for earthquakes located at or near Yucca
Mountain, Nevada, for the years 1987 and 1988. 'Distance to site" represents the epicentral distance
to the point 36051'N., 116027.5'W., near the center of a potential national nuclear waste repository.
Depth is relative to sea-level (0.0 km). Sdx, sdy, and sdz are HYPO71 standard errors in estimates
of hypocentral longitude, latitude, and depth of focus, respectively.
2 1h

(a) D Who-l15 Gap-152 0 Dmin- 1.2 km.. T0P0PAH SPRING NW, 0 051 C
870601 11 3 35 clDC
3 2 W O
854CC63Z C
I 1 1 o 0.I - 1 3 5 I 9 13 15
b) ODelta XtkmI Fixed H (km)2.7 TOPOPAH SPRING NW WPho 15 Gap-1510 m-0.k.
870601 11 3 34 O
E CC
wd C C
O C C6r C
-13Fh E CB _ _ _ __ _ __ _ _ __ _ _
using the standard SGB velocity model tAppcndix F, Figure FIta)). The epicenter symbols are
M1 0, 1, 2.A, B, C, D E F, corresponding to depth-constrained hypocenters having z=-,.12,. ,10, 11,12,13 14 15 km respectively. The open square symbol at (0 0) is for a free-depth solution, with starting iterate depth 7 kin and the symbol Zf is for a free-depth solutionwith starting iterate depth 0 km (at sea level). Right side, the variation in RNIS travel time residualfor various fixed-depth and free-depth hypocenters for that earthquake and velocity model. (b) Thesame distribution of epicenters (lIet side) and variation in RMS travel time residual (right side) asin Figure 10(a), except that here, the Yucca Mountain velocity model (Appendix F, Figure Fl(b))is used in hypocenter determinations.
22

DATE TIME LAT., LONG., N-S udy | E-W sdx Depth±sdz - ML Dist. to
° N. ° W. (km) (km) (k. ) site (km)
870207 16:04:53 36.895 116.450 0.2 0.2 7.6±0.3 1.11 5.0
870310 12:51:02 36.840 116.511 0.1 0.3 3.3±0.4 0.52 4.8
870601 11:03:35 36.894 116.469 0.1 0.1 5.3±0.3 0.10 5.0
871031 23:06:59 36.755 116.532 0.3 0.4 3.6±1.2 1.14 12.4
881005 14:14:36 36.811 116.458 0.2 0.4 2.3±0.4 -0.16 4.3
881118 20:29:36 36.924 116.558 0.1 0.1 10.7±0.6 1.28 12.4
881118 20:29:48 36.930 116.555 0.1 0.1 11.0±0.4 1.87 12.4
881118 20:31:26 36.925 116.547 0.2 0.2 11.2±0.3 1.21 11.5
881118 20:32:24 36.926 116.550 0.1 0.1 12.2±0.5 2.08 11.7
881118 20:33:46 36.927 116.556 0.1 0.1 11.9±0.5 1.40 12.2
881118 20:35:53 36.931 116.558 0.1 0.1 10.5±0.5 1.85 12.6
881118 20:39:35 36.928 116.555 0.1 0.1 11.8±0.4 1.30 12.2
Earthquake data gathered by the SGBSN to the present time indicates that Yucca Mountain
is relatively inactive when compared to other nearby subregions, such as Rock Valley, southern
NTS, Sarcobatus Flat, Oasis Valley, Timber Mountain, and parts of the Amargosa Desert. Bare
Mountain is slightly more active, seismically, than Yucca Mountain. Crater Flat, separating those
two mountains, is seismically quiet. A seismicity map -r YuLca Mountain and the surrounding areas
showing all catalogued earthquakes for the period 1979 through 1989 is shown in Figure 11.
Sometimes seismic hazard is estimated by considering the largest magnitude earthquake recorded
in each subzone during a monitoring period. We present preliminary magnitude data to support this
kind of analysis in Appendix A, Figure A5. In that figure a regional map, with Yucca Mocuntain
at its center, shows the maximum earthquake magnitude (ML where available, otherwise MD or
Mc,) recorded by the SGBSN in each 7-1 quadrangle for two periods, (1) August, 1973 through
December, 1986, and (2) 1987 through 1989. (Appendix A, Figure A5). (The location of station
YMT4 near Yucca Crest is shown in Figure A5.) No earthquakes having magnitude > 1.0 have
been detected in the quadrangle containing Yucca Crest, although magnitude 3.0+ earthquakes have
been monitored within 50 km of Yucca Crest at Silent Canyon Caldera and at Yucca Flat, NTS,
in the Amargosa Desert, Nevada, and at Sarcobatus Flat, Nevada, during the monitoring period
August, 1978, through December, 1989 (Figure A5).
1988 Boulder City, Nevada swarm
An extended swarm of small earthquakes occurred near Boulder City, Nevada, in 1988. The
largest of the earthquakes felt in the Boulder City area were magnitude (ML, USGS NEIC) 3.7,
on February 23 00:48 UTC (February 22, George Washington's birthday, local time) and oa July 4
10:56 UTC (Independence Day). Minor damage to some roof structures at Boulder City was locally
reported following the February 23, 1988, earthquake, with epicenter in the Eldorado Valley (Boulder
City News, July 7, 1988).Historically, the Boulder City area has been seismically active since the construction of Hoover
Dam and impoundment of Lake Mead in 1935-36 (Carder, 1970). The largest earthquakes (ML 4.9
to 5.0) occurred between 1939 and 1963. Although there have been several temporary networks
operated at Lake Mead over the years, no permanent network exists.
In order to better evaluate the significance of the 1988 swarm and its relation, if any, to seismicity
induced by the impoundment of Lake Mead, a permanent station, EMN, was installed in the
Eldorado Mountains south of Lake Mead on August 11, 1988, and a temporary network of portable
seismographs was deployed around the Eldorado Valley and at southern Lake Mead during August
and September. Preliminary results from the analysis of data from this network (M. Meremonte
and C. Langer, written communication) show two areas of microearthquakes, one in the Eldorado
23
I

118.65 11 .350 37. 00
0
0_00
-7 Wi0-,
_. .
-' 0
0 CRATER 0PEIMETER DRIFT CF
F LA T SIGN REPOSITCRWV
I ~ ~3M0RAP STA0~3 6. 75
0' ' m c 1-0 0 2.0 t maa < 3.0
01.o 9 mng < 2.0
Figure II.-Epicenters in the vdcinity of Yucca MNlountain, Nevada, for earthquakes recorded by theSGBSN in the 11-year period, 1979 through 1989. The small concentration of earthquakes in thenorthwestern part 3f Yucca Mountain occurred in November, 1988, with maximum magnitude 2.1.The concentration of seismicity at about 37° North latitude is within the southeast part of theTimber Mountain Caldera.
24

Valley south of Boulder City and the other northeast of Boulder City in the vicinity of Hoover Dam
(see Figure 12). The earthquakes are relatively shallow (z < 10 km), and focal mechanisms are
consistent with minimum stress (T axis) oriented between east-west and northwest-southeast, with
maximum stress (P axis) ranging from north to northeast for the strike-slip mechanisms to vertical
for the normal faulting events. These mechanisms are similar to those observed elsewhere in the
SGB. Earthquake locations and focal mechanisms are also consistent with the observations of Rogers
and Lee (1976) for the seismic network operated around Lake Mead during 1972-73, who proposed
a physical model for impoundment-induced seismicity based on lower effective normal stresses on
faults resulting from higher fluid pressure. If such a mechanism is still operating more than 50
years since the impoundment of Lake Mead, the recent seismicity may be a response to diffusion of
water pressure into rock containing highly stressed faults. However, the pattern of occasional felt
earthquakes followed by years of relative aseismicity in a locale is commonly observed in much of
the Great Basin, and is not generally associated with reservoirs or with hydrologic cycles. In the
vicinity of Lake Mead, stick-slip behavior may be operating much as it does elsewhere, but at lower
stress levels. Expansion of the SGBSN into the Lake Mead region would provide an answer to the
question of whether the vicinity of Lake Mead continues to be a region of elevated microearthquake
activity.Earthquake focal mechanisms
For the three year period 1987 through 1989, aouble-couple focal mechanisms obtained from
thirty SGB earthquakes are discussed. Also, a previotily unpublished focal mechanism for a Furnace
Creek/north cicki Mtn. (Panamint Range, California) earthquake that occurred on March 16,
1982, is included here. Most of the earthquakes are considered because of their relatively large size
(maximum magnitude = 4.4); however, magnitude 0+ earthquakes at Yucca Mountain are analysed
for their possible relevance to site characterization. For most of the focal mechanisms presented,
the strike, dip, and rake of nodal planes are adequately constrained by P-wave polarities alone. For
eight of the mechanisms, including those for three earthquakes at Yucca Mountain, first motions
do not provide sufficient constraint, so vertical-component SV-to-P amplitude ratios, corrected for
path and free-surface effects, are also used to constrain the range of focal mechanism solutions
(Kisslinger and others, 1981 and 1982). The amplitude ratios and P-wave polarities are input into
the computer program focmec.for (Snoke and others, 1984), along with instructions on how densely
to sample the range of possible solutions, and how much data misfit to allow. The program outputs
the set of solutions that satisfy the input criteria and data, and, if the range is sufficiently limited
to be of practical use, the solutions are reported and plotted on an equal-area, lower hemisphere
projection. The plotted subset always includes a solid-line solution (which may be unique, or, if not,
has representative (average) strike and/or dip), and, optionally, one or two dashed-line solutions,
which are shown to indicate the range of strike, dip, and/or rake angles that are consistent with
the input data. The solid-line solution is designated as the primary solution, and the dashed-line
solutions are designated as alternate solutions. Focal mechanism parameters are listed in Table 3,
with indexes from 0 to 30, corresponding to the numbering in the epicenter/focal mechanism plot
of Figure 13. To avoid crowding, Timber Moulntain caldera focal mechanisms are plotted at the
bottom of Figure 13. Individual focal mechanisms, showing the primary solutions of Table 3, and
various alternates, are shown in Appendix D, Figures Dl through D37. The magnitude, ML, that
is reported for each earthquake is the average of the horizontal-component and vertical-component
magnitudes, where each of those is the average of all on-scale horizontal-component magnitudes
and vertical-component magnitudes, respectively, scaled at SGBSN stations, unless otherwise noted.
'DMIN" is the minimum source to station distance. (Hypocenter parameters reported in Appe'tzix
D may not correspond exactly to those reported in Appendix A. Appendix D hypocenters often are
the product of a more careful analysis of seismic wave arrival times, residuals, and polarities, than
the routine data analysis that results in Appendix A hypocenters. All reported hypocenters and
25

I36.25
C,
C-%
35.75 0115.00 0 114.50 °
Figure 12.- Preliminary sample of mticroearthquake epicenters located from temporary Boulder City,
Nevada, array during August and September, 1988, showing l-e epicentral error ellipses.
26

1 - -
) I * j I ! I 9 1
Table 3. Preliininaary Southern Creat Basin Focal Mechanisms 1982 and 1987-1989.
St, strike of nodal plane; Dp, dip of nodal plane; Rlk, rake of slip vector, Tr, trend of axis; 1P, plunge of axis. ML, local (SGB) magnitude, Tsn3,
type of source mechanism: 1, singlc event focal mechanism; 2, composite focal mechanism. Nodal planes: No inferred fault planes for these focal
mechanisms are presented here, although for many of the mechanisms, inferences about the preferred nodal plane based on lineations of epicenters
and/or on the state of tectonic crustal atress are possible. For example, if the maximnumi horizontal compressional stress is oriented at about North
20° to'30° East, then right-lateral strike slip may be expected on steeply dipping, north-trendiiig fault planes with greater likelihood than left-lateral
strike slip on east-trending fault planes, other mechanical conditions being equal. Rmik: Remarks, designated by , means that (SV/P), amplitude
ratios were used to constrain or help determine the focal mechanism. Alternate focal mechanisms: rather than trying to present uncertainty estimates
for strike, dip, and rake, we present alternate solutions as dashed-line great circles. Other alternate primary and secondary solutions for different
hypocenters are shown in Appendix D. Solutions based on fixed-depth hypocenters are indicated by a ' next to the focal depth.
. . . .
FocalFigure Origin time (UT) depth MknitudeIndex Date Time fkmlr (ML)
0123456
-S 789
10A10B1112131415161718192021222324252B27282930
1982 03161987 01131987 (03101987 04081987 04201987 06011987 06171987 07131987 08131987 10021987 10281987 10281987 12101988 01141988 01261988 02071988 05261988 06151988 07021988 07051988 07241988 08301988 10281988 10291988 11181989 01091989 01311989 03051989 04121989 04191989 07211989 0828
8:471:1512:5119:4011:2411:030:00
20:1011:4611:1117:2517:252:355:1618:1716:473:566:2310:4018:185:392:3020:026:3720:325:0816:0722:3 120:2422:3923:0115:47
5.218.393.137.84-1.195.947.41-0.078.9911.000.6510.924.5910.119.89
-0.217.00'0.121.72
6.00'8.395.00*10.8710.1511.864.00'0.008.297.917.00'2.755.74
3.43.20.42.61.90.13.52.51.43.02.82.82.42.42.32.04.21.62.34.41.12.73.12.32.03.52.21.23.23.62.61.6
GeologicQuadrangle orGeographic ID
Stovepipe WellsAlamo SE
Yucca MountainTin Mountain
Specter Range SWYucca MountainI)esert Hills SEStonewall Pass
Buckboard MesaPapoose Lake SE
Reveille PeakReveille Peak
Specter Range NWStriped llills
Thirsy Canyon NWYucca Flat
Dry MountainAmmonia Tanks
Thirsty Canyon SWOwens Valley
Buckboard MesaReveille Peak
MellanMellan
Bare Mtn.Valley
Dead Ilorse FlatTimber Mtn.
Ubehebe CraterLower Pahranagat Lake
Jackass Flatsqrnttys Junction SW
T Nodal planes Prmncipal axes. ln 2nd P T El m
m St DP Rk St Dp Rk Tr Pi Tr Pi Tr Pi k
1 255. 70. 52. 141. 42. 25. 149. 16. 122. 50. 270. 35.1 17. 51. -146. 264. 64. -44. 225. 49. 323. 8. 60. 40.1 349. 66. -141. 240. 55. -30. 209. 44. 112. 7. 15. 45. '2 210. 68. -46. 359. 11. -117. 167. 48. 270. 11. 10. 40.1 305. 85. *90. 125. 5. -90. 215. 50. 35. 40. 125. 0.1 75. 88. 20. 345. 70. 178. 208. 13. 302. 15. 80. 70.1 200. 60. -155. 90. 60. -35. 55. 45. 325. 0. 234. 45.1 101. 88. -28. 193. 62. -177. 53. 21. 150. 18. 277. 62.2 95. 90. -5. 185. 85. -180. 50. 4. 140. 3. 270. 85. '
1 247. 80. .80. 22. 14. -135. 167. 54. 328. 34. 65. 10.I 91. 79. 9.7 179. 80. 10. 45. 1.3 315. 15. 140. 75.1 343. 50. 123. 117. 50. 57. 50. 0. 320. 65. 140. 25.1 15. 90. -14l. 285. 50. 0. 248. 27. 142. 27. 15. 50.1 lal. 60. -125. 56. 45. -45. 39. 59. 295. 9. 200. 30. '
1 230. 65. -W0. 50. 25. -90. 140. 70. 320. 20. 50. 0.1 178. 80. -151. 80.7 52. -12. 47. 34. 303. 19. 190. 50.1 183. 70. -95. 18. 21. -76. 84. 65. 277. 25. 185. 5.1 130. 54. -121. 357. 46. -54. 342. 65. 242. 5. 150. 25.1 276. 85. 30. 183. 60. 174. 46. 17. 144. 25. 285. 60.1 331. 47. -111. 180. 47. -69. 165. 75. 75. 0. 345. 15.1 231. 76. -. 2. 330. 59. -164. 186. 33. 283. 11. 30. 55.1 64. 60. -55. 190. 45. -135. 26. 59. 130. 9. 225. 30.1 189. 52. -129. 62. 52. -51. 35. 60. 305. 0. 215. 30.1 183. 69. -139. 76. 52. -27. 46. 43. 306. 11. 205. 45.1 220. 74. -37. 322. 55. -160. 175. 37. 274. 13. 20. 50.1 0.0 90. 10. 270. 80. 0.0 225. 7. 135. 7. 0. 80.1 321. 45. -90. 141. 45. -90. 0. 90. 51. 0. 141. 0.2 236. 58. -48. 358. 51. -137. 201. 55. 297. 4. 30. 35.1 22. 65. -85. 189. 25. -102. 303. 69. 108. 20. 200. 5.1 115. 81. 60. 17. 30. 171. 229. 30. 354. 45. 120. 30.1 78. 86. -50. 173. 41. -174. 23. 36. 136. 29. 255. 40.1 50. 54. -59. 183. 46. -126. 18. 65. 118. 5. 210. 25. '
_ _ _ _ . . .

CNI 2.L, 22,v
30 7
79
v X
7 2s
8 2' 21
+ +7 + 4,
216 8
T be r Mt C Cal de0 PO too __ 7 M~ICPP 3TA1MDN
l ~(as 2.0 5 -. g < 3.0* I.t "'q L0 0 3.C S.4
Figure 13.- Regional map of SOB showing lower-hemisphere projections of earthquake focal mecha-nismrs indexed to Table 3. Event 0 occurred in 1982, all others (1-30) occurred in the period 1987through 198S. The focal mechanisms are plotted near the earthquake epicenters, for all events exceptthose at Timber Mountain (events 8, 19, and 26), which are plotted at the bottom of the map. Twomechanisms are included for event 10, to show how different interpretations are possible for the sameearthquake first motion data, resulting from different assumed depths of focus.
28

focal mechanism solutions are preliminary.)
Effects of modeling on focal mechanisms
The SGBSN has very sparse station coverage away from Yucca Mountain, with average stationspacing of 20 to 30 km. The main consequence of the limited station coverage is poor resolution ofmost earthquakes' depth-of-focus, when using the standard velocity model and first-arriving P andS waves to determine the hypocenter. For example, many earthquake arrival time data sets displaynearly equal local RMS travel time residual minima for z as 2 km below sea level and z X 7 kmbelow sea level. The effect of varying depth-of-focus on the earthquake focal mechanism is explicitlyexamined for many of the data presented here. When deriving focal mechanisms from varioushypocenter solutions, we invoke the same velocity model for ray tracing; therefore, the observed
variations in mechanism for a given earthquake are a consequence only of ray parameters varyingdue to different source depths and not to different velocity models. In some instances, the P-wavepolarity data help to prescribe which velocity model is used in hypocenter determination (a good
example is shown in Appendix D, Figure D20; also, see the following paragraph). It should be
noted that changing the velocity model may change the solution set of focal mechanisms, even ifthe hypocenter remains the satne. For example, ray tracing from a crustal model in which seismicvelocities increase linearly with depth may yield different focal mechanisms than those from dataderived from models in which seismic velocities are fixed within a series of layers with velocity
discontinuities at the interfaces, as we presently use in preliminary hyp. :enter determination forSGB earthquakes. This report does not systematica:y investigate the effect on focal mechanismparameters of changing the seismic velocity model.
Experience computing earthquake focal mechanisms from SGBSN data indicates that addingan interface (sometimes referred to as the Conrad discontinuity) somewhere between 12 and 15 kmbelow sea level, below which V. = 6.5 km/sec, often improves the fit of P-wave polarity data tofocal mechanism nodal plane solutions. This interface has been used for determining hypocentersand raypaths for many of the earthquakes for which focal mechanisms are presented in this report.Examples of focal mechanisms which require this interface a.e shown in Appendix D, Figures D4,D14, and ohes0.
In previous SGBSN data reports, the 15 km interface is absent, although another interface,located 24 km below sea level, below which V, = 6.9 km/sec, is present in all reports, and may alsobe identified as the Conrad discontinuity. RMS for the vast majority of SGB earthquake hypocenters
is not significantly affected by the presence/absence of the 15 km interface, and therefore cannot be
invoked to justify its inclusion/exclusion. For a very small subclass of hypocenters, namely, those
having depths near the 15 km interface, RMS is sensitive to its presence/absence; an example isdiscussed in the section entitled 'depth-of-focus distribution and deep-crust intraplate earthquakes."
Whereas the RMS travel time residual from local earthquake data is not a very sensitive toolfor ascertaining the presence of mid-crustal to deep-crustal layer interfaces, the earthquake focal
mechanism often is, as long as we consider only those mechanisms that arise from pure shear defor-
mation. Unless an active magmatic process or other high-fluid-pressure phenomenon is present, there
is probably no compelling reason to doubt that the microearthquake source can be represented by a
double-couple. Thus, this report takes the position that if quadrantal partitioning of unambiguousP-wave polarity data from SGB microearthquakes requires the modification of the velocity model,and if such modification does not degrade RMS, and does not contradict established models, then
it is more scientifically justifiable to modify the velocity model than to argue that the polarity dataimply other than pure shear source properties.
Independent confirmation of the presence of a strong P-wave velocity gradient or a velocitydiscontinuity at some depth between 12 and 15 km below sea level would be helpful. Seismic
refraction is the natural tool for searching for such a discontinuity. Pakiser's review (1985) ofpapers written in the previous three decades that deal with interpretations of seismic refraction
29

data in the Basin and Range province suggests that refraction seismologists have divided opinionson the visibility of Pa phase(s) that should arrive from such mid-crustal reflectors, both province-wide, and more specifically, at NTS. Hoffman and Mooney (1984) observe evidence for a 15 kminterface in an east-west profile across Yucca Mountain, but not in an unreversed proflie from anuclear device detonation at Pabute Mesa. Ismail and Priestley (1986) also argue that a mid-crustallayer boundary (12 to 18 km) is present in the vicinity of Yucca Mountain, Nevada, based on theirinterpretations of P-arrivals from east-west and north-south profiles. Serpa and others (1988) note 'aprominent zone of reflections at a traveltime of 5 ± 1.5 sec (15 km)' in the central Death Valley andsurrounding mountain ranges (p. 1446), which they interpret as either a deep detachment, a zone oftransition between the brittle upper crustal rocks and a ductile lower crust, or as an uplifted rockhorizon originally formed at the base of the crust. In a recent interpretation of combined refraction,reflection, and gravity data in northwest to central Nevada (about 4' north of the SCB), Catchingsand Mooney (1991) found mid-crustal reflectors at depths ranging from 12 to 18 km, below whichVP = 6.3 km/sec. These reflectors, which they interpreted as a possible brittle-ductile transition zoneboundary, extended over the length of their survey, 200 to 300 km. In summary, available evidenceappears to either support or not reject the existence of mid-crustal reflector(s) in the SGB.
Representativeness of focal mechanisms In the SOB catalog
Because the focal mechanism solutions presented in ApF-ndix D of this report include data fromonly about one percent of the local earthquakes located and catalogued in the period 1987 through1989, it is difficult to argue that they represent an unbiased and adequate sample of earthquakesources sufficient to characterize seismic deformation of shallow crust in the SCB. However, insofaras polarities can be determined for P-arrivals of smaller earthquakes for which focal mechanisms werenot computed, there is a remarkable conwistency of azimuthal partitioning of polarities for the vastmajority of SGB earthquakes. For most earthquake source regions in the SGB, first motions of Prays travelling from the source into the northwest and southeast quadrants are compressional. Firstmotions of P rays travelling in the interior of the northeast and southwest quadrants are usuallydilatational. Near the edges of these quadrants, the frst motions may be compressional or dilata-tional, depending on whether the seismic slip is predominantly normal or strike slip, respectively. Asignificant counterclockwise rotation of this first motion pattern is observed for many earthquakesin the westernmost part of the southern Great Basin, as is evident from several focal mechanismspresented in Appendix D, the most pronounced case being for the Owens Valley earthquake of July5, 1988 (Figure D23). The rotation of the average strain field from the center of the SGB to itswestern boundary is further discussed in Rogers and others (1989) and below, in the section 'averagedirections of fi and f and tectonic strain."
The bulk of SGB earthquake P-arrival data, whether from earthquakes having well-constrainedfocal mechanisms, or from smaller earthquakes, tend to support the model of earthquake gener-ation from uniform reg onal stresses and deformation processes more than it supports the modelof rnicroearthquakes being a nearly chaotic accomodation to local perturbations of the stress field.Conceptual models of the strain field in the shallow to mid-crustal rock of the SGB should accountfor the consistent patterns of P-wave first motions that are generally observed by the SGBSN formost SGB earthquakes.
Untypical focal mechanisms and source zones In the SGB
While the azimuthal distribution of P-wave first motions discussed above is likely to be observedfor most SGB shallow-crustal to mid-crustal earthquakes, a few earthquake data sets do not conformto that pattern. An example of a data set having first motions that are 180° out of phase from thenorm is that of an earthquake on May 30, 1985, at northern NTS (Tippipah Spring quadrangle),shown in Figure 13 of Harsen and Rogers (1987). Two focal mechanisms from earthquakes in the
30

epicentral vicinity of that May, 1985, earthquake, which occurred in July, 1984, also reported inHarmsen and Rogers (1987), display typical P-wave azimuthal distributions.
For sources within the Silent Canyon Caldera, in the vicinity of Pahute Mesa undergroundnuclear explosions (UNEs), earthquake seismograms from SGBSN stations often exhibit either di-
latational or indeterminate first motions, even in the northwest and southeast quadrants of the focalhemisphere, indicating the possibility that these initiate predominantly as isotropic, volume-reducingevents rather than as double-couple events. Because of the sparsity of U.S.G.S. seismic station cov-erage in the vicinity of the Silent Canyon Caldera, the proportion, r: 0 < r 5 1, of deformationat the seismic source that is deviatoric (double-couple) rather than isotropic (spherical) cannot be
determined using P-wave polarity information only; if we assume r = 1, the mechanisms exhibitapproximate 90° rotation of pressure and tension axes from the regional averages. Two examplesof double-couple interpretations for these peculiar Silent Canyon Caldera events are included inAppendix D, Figures D21 and D31. Another good example of a SCC earthquake having almostexclusively dilatational first motions is that of September 26, 1987, 22:52:31, listed in Appendix A,
which occurred about 56 hours after the relatively large UNE, Lockney (M& = 5.7). A possibleexplanation of such events at SCC is that they are seismic release from the closing of tension cracks
formed during nuclear device tests, or from partial implosion of the cavity. If this is the case, it is
probably true that r < < 1 for these SCC events, in which case the double-couple interpretations are
invalid.Yet another class of events following UNEs (which probably overlaps the class of 'dilatational
sources" discussed above) is that of the low-frequency events." Seismogram dominant frequencies
for both P-coda and S-coda are significantly lower for these events than those observed in 'natu-
ral' earthquake seismograms at comparable source-to-station distances. The remarks about typical
distributions of P-wave first motions and focal mechanism properties therefore do Dot apply to the
events that are most closely associated, both temporally and spatially, with UNEs. Such post-test
phenomena are probably induced by the tests, and need to be separated both from the earthquakehypocenter catalog when we estimate rates of regional natural seismic strain, and from the focal
mechanism catalog, when we compute the average direction of extension or other strain parameters.
Most hypocenters of events during the period 1987 through 1989 having coda with lower-than-averagefrequency content, whether in the Silent Canyon caldera or elsewhere in the SGB, have been sepa-rately tagged and listed in Appendix C of this report. In general, becuuse of the large number of such
phenomena, and the noisy, emergent nature of first motions at many stations, no attempt is made
to routinely determine, hypocenters for the vast majority of these low-frequency events. However,their seismograms are all archived onto magnetic tapes to provide a permanent data base for future
research. Of the three NTS nuclear device testing regions, Pahute Mesa, Rainier Mesa, and YuccaFlat, the most active region with respect to quantity of potentially induced seismicity per test of agiven reported magnitude is Pahute Mesa, and the least-active region is Rainier Mesa.
Inasmuch as low-eoda-frequency events have been occasionally recorded in the SGB away fromthe NTS, we cannot rule out the possibility that some are not induced by nuclear device tests.
One class of low-coda-frequency seismicity that is definitely natural is that of relatively deep-focus
earthquakes, at the crust-mantle interface, examples of which are discussed in the section, 'depth-of-focus distribution and deep-crust intraplate earthquakes.' If the event's hypocenter and origin time
3trongly suggest that it is not induced by cultural activity, it is included in the earthquake catalog
and listed in Appendix A, regardless of the frequency content of SGBSN seismograms.
Evidence of seismically active detachment faults?
The possibility that detachment faults are seismically active in parts of the SGB has not bcenpreviously documented to the authors' knowledge. Much of the large-scale extensional tectonics of
the southern Great Basin during the Neogene period is now understood to require a major componentof block movement along gently dipping faults (Wernicke and others, 1988). Therefore, it should
31

not be surprising if some of that movement is sufficiently 'catastrophic" to result in earthquakesdetectable by the SGBSN. However, under Hamilton's (1988) model for detachment faulting in theDeath Valley region, detachment faults would originate as moderately-dipping or steeply-dippingnormal fault segments. Fault dips become more gentle through unloading and ductile deformationof the lower plate, and fault segments may be inactivated as their dip becomes too gentle to permitfurther slip. Such fault segments would not be expected to be seismogenic.
All double-couple focal mechanisms have two orthogonal nodal planes. If the inclination or dipof one of those planes is X 20° or less, that focal mechanism solution provides evidence of a possibleseismically active detachment fault. Without further geological or geophysical information aboutdeformation in the vicinity of that hypocenter, detachment is one of two possible interpretations,and not the most likely unless movement on the near-vertical auxiliary plane can be discounted.No instances are given in this report where we wish to imply that the probability of slip on thenear-vertical auxiliary plane is significantly iess than 0.5. However, in addition to the major, if notdominant, role that shallow-dipping faults must play in the large-scale Neogene extension of thesouthern Great Basin, shallow-dipping nodal planes of focal mechanisms are sometimes unavoidablypresent in SGBSN data sets. If these shallow dipping nodal planes are not the fault planes, we areleft with vertical slip on very steeply-dipping faults, implied by the auxiliary nodal plane of suchfocal mechanisms. Such deformation yields almost no net crustal extension, and provides as manyobstacles to plausibility from a rock-mechanics perspective as does seismic slip on gently dippingfaults.
The first example of a shallow-dipping nodal plane foi the focal mechanismi solutions computedfor this report is for an earthquake of April 20, 1987, in the Specter Range SW quadrangle (AppendixD, Figures D5 and D6> This shallow-dipping nodal plane is somewhat 'robust," in the sense that,for two very different assumed hypocenters. the dip of the plane remains sub-horizontal, althoughthe angle of slip changes from -90° (normal slip) for the surface focus hypocenter, to O' (strikeslip) for the six km below sea level hypocenter. Several focal mechanisms presented in this reporthave primary or alternate solutions with a nodal plane whose dip is less than 20° (Appendix D,Figures D7, Dl, D17, D19, D20, D33, and D34). For some station geometries relative to SGBsources, the shallow dipping nodal plane 'goes away' by changing the assumed hypocentral depth(compare Figures D18 and D19, for example). Other cases in which the focal mechanism primarysolution contains a nodal plane whose dip is strongly dependent on the assumed hypocenter depthare discussed below. These observations are intended to emphasize that for the current SGBS.N' andprobably for many regional seismographic networks, uncertainties in source properties inferred fromtheir focal mechanism solutions are frequently substantial.
One possibly important example of a focal mechanism having a shallow-dipping nodal planethat does not 'ago away" by depth-of-focus manipulation is that for an earthquake in the GrapevineMountains, California (Dry Mountain quadrangle), on May 26, 1988, 03:56:49 UTC. This earthquakeis among the largest of SGB earthquakes recorded by the SGBSN in 1988. Because of its magnitude,this earthquake's P-wave polarities are exceptionally clear. The quadrantal distribution of first-motion P-polarities for SGBSN data does not occur for assumed hypocenters less than about 6-7km below sea level, i.e., for shallower focus hypocenters, dilatations are hopelessly intermixed withcompressions when plotted on the lower (equivalently, upper) hemisphere around the assumed source.The distribution of first motions does partition into quadrants of like polarity without significantinconsistencies for a source with assumed 7 km depth (Appendix D, figure D20), when source-to-station rays are computed using the velocity model of Appendix F, containing a velocity discontinuityat 15 km. Supplementary data from the southern California and central California seismic networks(PAS and MNLO, respectively) werr included to help constrain the focal mechanism, which hasa nodal plane dipping 21. Slip is normal. This example may be among the strongest evidenceyet collected by the SGBSN for possible seismic slip on a shallow-dipping surface. However, this
32

plane, if the fault plane, is perhaps too steeply dipping to imply seismic activity on a detachmentsurface. Other examples presented in this report have more shallow-dipping nodal planes, but theseare generally less well-constrained than the May 26, 1988 earthquake's focal mechanism.
Yucca Mountain earthquake focal mechanisms
Three earthquakes at Yucca Mountain are examined to see if it is possible to derive focalmechanisms; a magnitude 0.4 on March 10, 1987, a magnitude 0.1 on June 1, 1987, and a magnitude2.1 on November 18, 1988. For each of these, hypocenters were relocated using a flat layer velocitymodel having P-wave velocities and layer interfaces that approximately correspond to those foundby Hoffman and Mooney (1984) in a refraction survey of Yucca Mountain. These velocities arelower near-surface than those of the standard SGB model, with the consequence that seismic raystraveling to Yucca Mountain stations suffer more refraction towards the vertical than in standardmodel paths. The two models' P and S velocities are plotted as a function of crustal depth inAppendix F, Figure Fl. Because none of the Yucca Mountain earthquakes was large enough to beadequately constrained by P-wave first motions, SV and P vertical ground vibration amplitude datawere gathered, and had to be corrected for propagation effects to provide SV-to-P amplitude ratiosrepresentative of the source only. These path corrections are dependent on the earthquake's depth-of-focus, with greater amplitude corrections necessary for deeper focus hypocenters. The YuccaMountain velocity model differs from the "standard' SC-B velocity model in the important detailthat all source-to-station rays from SGB crustal earthquakes arriving a, Yucca Mountain stationsare incoming at C < ti where C is the free-surface angle of incidence, and do is the critical angle.When ray tracing is performed using the standard SGB velocity model the opposite case is true,v > 0,. Although, this modeling consideration may appear to be of only academic interest, the useof slow surface-layer velocities results in different focal mechanism interpretations for the extremelysmall Yucca Mountain earthquakes than would result when using the standard SGB crustal modelfor ray tracing and propagation effect corrections.
The largest recorded Yucca Mountain earthquake (ML = 2.1) from the inception of the SCBSN
-. in 1978-1979 through 1989 occurred on November 18, 1988, 20:32:24 UTC, at 36.925° North latitude.116.5530 West longitude, and 11 km below sea level depth. The epicenter is about 12 km northwestof the site of a potential national high-level nuclear waste repository (shown in Figure 11). Focalmechanism solutions for this earthquake are not sufficiently well constrained from SGBSN P'-wavefirst motion polarities; thus, (SV/P). amplitude ratios are used to limit the range of solutions.Seismic energy of the S-coda of the mainshock overdrove the telemetry electronics of all YuccaMountain stations. Yucca Mountain station seismograms from a small foreshock, which preceededthe mainshock by a minute, were scaled to provide amplitude and period data for (SV/P). ratios (thisprocedure assumes that the hypocenters and elastic energy radiation patterns of the two earthquakesare nearly identical). Path corrections having amplitudes several times those of the (SV/P), ratioswere added to remove propagation and free-surface effects (these corrections are sensitive to assumedincident angle of P and S waves at the free surface, thus to velocity model). If we accept the validityof these modelling assumptions, the resulting focal mechanism solutions are well-constrained. Theazimuth of T is 276± 30, its plunge is 18 ± 50; the azimuth of P is 178± 30, its plunge is 28 ± 90. Allsolutions are predominantly strike slip, with some alternate solutions having a component of reverseslip. Two representative solutions are shown in Appendix D, Figure D28, with the "observed" andtheoretical (SV/P). ratio data for each solution. The tension axes for these solutions trend west,and are therefore rotated counterclockwise from the average direction of T for SGB focal mechanisms(see the section, 'average directions of P and T and tectonic strain" below). The southwest-trendingnodal plane of the primary solution, if imagined to project to the earth's surface as a planar fruilt,would crop out 32 km southeast of the hypocenter, or 8 km northwest of the potential repository'slocation on the crest of Yucca Mountain. Slip on that plane is oblique left-lateral strike slip witha substantial normal component. No Quaternary faults or lineaments have been mapped in the
33

vicinity of that plane's surface projection (Reheis and Noller, 1990). The northwest-trending nodalplane has predominantly right-lateral strike-slip motion. If projected to the surface, it would cropout at Bare Mountain, cutting the trace of the Bare Mountain fault.
Selection of the fault plane for this Yucca Mountain earthquake from the two (solid-line) nodalplanes of Figure D28 is possible based on plausibility arguments taken from rock physics. If thedirection of minimum horizontal compressive stress in the vicinity of the hypocenter of November18, 1988, is approximately the same as that inferred by Stock and others (1985 and 1986) fromhydraulic fracturing measurements at various Yucca Mountain drillholes, azi(O's) = N60' - 651W,then application of the Coulomb-Mohr failure criterion to the two nodal planes of the primarysolution of Figure D28 selects the northeast- southwest trending plane as the fault plane. In otherwords, when considering the ratio of applied shear stress, r,,, to effective normal stress, a,,, on eachnodal plane, the condition
bran I > 0.7a,,
occurs when the fault normal direction, 6 = g, where f is the normal to the northeast-southwesttrending nodal plane, but not when K = 9, where .? is the normal to the other nodal plane(see Figure D28). Here, in order to satisfy the Coulomb-Mohr criterion using a plausible frictioncoefficient, p = 0.7, it is .ssumed that the ratio of effective maximum principal compressive stress,to effective minimum principal compressive stress, "PIE, is approximately four in the vicinity ofthe hypocenter. P, is the local fluid pore pressure. ro satisfy another plausibility criterion, thatthe direction of slip on the fault plane equals the direction of maximum shear stress on that plane,the amplitude of the intermediate principal compressive stress, a2, is considered a free parameter(in the range ae < a, < a,). This Coulomb-Mohr analysis also suggests that a, is oriented sub-horizontally at the hypocenter, a conclusion that would alsc be valid if the alternate (dashed-line)nodal planes of Figure D28 had been considered. 'Harmsen and Rogers (1986) discuss this process offault plane selection from rock physics considerations in greater detail.) The dip of the inferred faultplane of the primary solution, 740, is probably too great for that plane to correspond to Quavernaryfaults on Yucca Mountain having similar trend, mapped by Scott and Bonk (1984), who state thatfaults at Yucca Mountain that dip approximately 700 at the surface and display a 'major dip slipdisplacement" tend to flatten somewhat with depth, with 600 dip at depth > one krr.
The other two focal mechanisms for Yucca Mountain earthquakes occurring in 1987 were forearthquakes that, anywhere else in the SGB, would have been considered far too small to investigate(ML = 0.4 on March 10, 1987, and ML = 0.1 on June 1, 1987). The March 10 earthquake, with afocal depth of 3.1 km below sea level, has a well-constrained focal mechanism from six polarities andfour ratios, if we require a very close fit between all theoretical and 'observed" ratios (maximumdifference between logrithms = 0.15). The resulting mechanism is predominantly strike slip, withsubstantial normal component, on either a north-northwest trending nodal plane or on a west-southwest trending nodal plane. The north-northwest striking nodal plane dips east at about 66°,and the west-southwest. striking nodal plane dips northwest at about 55°. Mapped Quaternary faultsin the vicinity of the epicenter, such as the Solitario Canyon fault and the Windy Wash fault, trendnorth, with gentle undulations. Most of the mapped faults on the west side of Yucca Mountain dipto the west, perhaps forming a headwall complex for the Bare Mountain detachment fault, mostactive 12.5 million years BP (Scott and Whitney, 1987). Because of its dip, the focal mechanism'snorth-south nodal plane does not appear to be related to remanent activity of that system. Theauxiliary nodal plane's strike does not correspond to any mapped fault orientations in the vicinityof the epicenter. The orientation of the tension axis, with azimuth N680 W, approximately coincideswith tho direction of inferred minimum horizontal compressive stress at Yucca Mountain (Stock andothers, 1985 and 1986). Because constraint on the range of focal mechanism solutions is achievedby closely fitting four (SV/P)E amplitude ratios (implying that many assumptions about the earthmodel are valid for this data set), our confidence in these focal mechanism parameters is relatively
34

low.'The set of plausible focal mechanisms for the ML = 0.1 earthquake of June 1, 1987, with depth
of 5.9 km below sea level, is not well constrained even when four amplitude ratio data supplement thefive unambiguous P-wave polarities. A strike-slip focal mechanism solution, shown in Appendix D,Figure D7, has only marginally better amplitude ratio fit than an alternate normal-slip mechanism(RMS ratio error = 0.180 versus 0.197) when all 'observed' ratios are required to have amplitudeswithin a factor of two of theoretical values. One of the nodal planes of the normal-slip mechanism dipsabout 10 degrees to the east, which, if the fault plane, is an example of a possible active detachmentfault at Yucca Mountain. If the strike-slip solution is correct, the north-northwest trending nodalplane agrees in strike and dip with the Solitario Canyon fault, but not with mapped sense of slip.The T-axis for the strike slip solution also trends parallel to the direction of minimum horizontalcompressive stress as determined from hydrofrac measurements at Yucca Mountain drillholes (Stockand others, 1985 and 1986).
In summary, focal mechanism solutions for Yucca Mountain, Nevada, earthquakes detectedthrough 1989 are poorly to, at best, moderately well constrained when only P-wave polarities areused in their determination. This lack of constraint is the direct result of the inability of most SGBSNsensors to detect first motions, due to the very small size of Yucca Mountain earthquakes recordedthrough 1989. While supplementing polarity data with (SVIP), amplitude ratios is sometimes, butnot always, able to constrain the solution set to a narr-w, geologically plausible, range, the ratiomethod borrows heavily on hard-to-validate assumptions. A better understanding of seismic slip atYucca Mountain and vicinity requires that we imprmve seismographic coverage there, a project thatis currently underway by YMP-USGS.
While we hrve attempted to relate the microseismicity at Yucca Mountain to relatively majormapped Quaternary faults there, it is probable that much of the SGBSN's monitoring is recordingactivity on secondary structures, such as Riedel shears; thus, correlation of focal mechanism pararm-eters with major faults may be expected to be low. A second caveat may be in order. The shallow(< 1.5 km below surface) hydrofrac determinations of minimum compressive stress that were invokedto determine the fault plane for the Yucca Mountain earthquake of November 18, 1988 (AppendixD, figure D28) may not be appropriate for seismogenic depths. Such factors ha topographic influ-ence on the crustal stress field (Swolfs and others, 1988) or a detachment surface may not justifyextrapolation of those bydrofrac measurements to depths corresponding to earthquake hypocentersconsidered in this section.
Reverse-sllp focal mechanisms and compressional tectonism In the SGB
Tucki Mountain and the Panamint Range, California, may have moved s 125 ± 7 km in thedirection N65 ± 7W from the Nopah block during the Neogene period (Wernicke and others, 1988),and may therefore be expected to display significant seismicity if this extensional process is stillactive. Prominent reverse-slip faults have been observed at Tuclci Mountain (Wernicke and others,1988). The mainshock of a short-lived Tucki Mountain series of earthquakes in March, 1982, reportedin Rogers and others (1987), provides sufficient P-wave polarity data from the SGBSN and from thesouthern California seismic network (PAS) to yield a well-constrained focal mechanism (AppendixD, Figure D1). The focal mechanism of the earthquake (MPAS = 3.4) has east-west trending andnorthwest-southeast trending nodal planes, each with oblique reverse slip. The mainshock's epicenteris at the northernmost end of Tucki Mountain (Panamint Range), about 25 km northwest of thenorthern end of the north-trending, right-lateral strike-slip Death Valley fault, and about 12 kmsouthwest of the northwest-trending right-lateral Furnace Creek fault zone.
Although well-constrained oblique-revere-slip focal mechanisms are extremely uncommon inthe southern Great Basin, "most 'strike-skip' faults ... are associated with an assemblage of relatedstructures including both normal and reverse faults" (Christie-Blick and Biddle, 1985, p. 1). The
35

deformation implied by the March, 1982, Tucki Mountain mainshock may be the result of compres-
sional strain west of the junction of the Death Valley and Furnace Creek fault zones in the manner
predicted by laboratory-scale photoelastic models of segmented faults (see Freund, 1974, his figure
27).Compressional tectonism is of some interest to site characterization, because of its potential to
interact with the hydrologic subsystem. No unequivocal, predominantly reverse-slip focal mechanism
solutions have been determined from SGBSN data for earthquakes within 70 km of Yucca Mountain
to the present date. One oblique revere-slip mechanism for a small earthquake (ML = 1.7) in
the Tippipah Spring quadrangle, also mentioned above in the section 'unusual mechanisms," has
epicenter 35 km northeast of a central point (coordinates 360 51'N, -116027.5'W) on Yucca Mountain
(Harmsen and Rogers, 1987). That solution has one glaring polarity inconsistency, so our confidence
in the solution is low.
Focal mechanisms of other notable SGB earthquakes, 1987 to 1989
The October 2, 1987, 11:11 UTC, magnitude 3.4 earthquake in the Papoose Lake SE quadrangle
(Table 3, Index 9) yields focal mechanisms that vary significantly as a function of assumed depth-of-
focus. The nearest station is over 27 km frorr. the epicenter, so depth resolution is necessarily poor.
In Appendix D, two mechanisms are presented, one for an assumed five km below sea level focus
shown in Figure D11, and the other for an assumed 11 km below sea level focus shown in Figure
D12. RIMS travel time residuals are of little help in narro-ing -town the hypocenter, being 0.19 sec
for the shallower-focus solution and 0.20 sec for the deeper-focus solution whet using the standard
SGB crustal model. Both hypocenters' focal mechanisms possess a northwest-dipping and southeast-
dipping nodal plane. The southeast-dipping rodal plane for the shallower-focus hypocenter dips at
about 14 degrees, providing another example of a possible seismically active detachment fault. The
northwest-dipping nodal planes for both solutions dip steeply, and are oriented favorably for normal
slip if the extensional direction is north-northwest in the vicinity of the hypocenter. The earthquake
was somewhat unusual in that only two other hypocenters were observed in its vicinity over the next
month, an unusually low level of concomitant seismicity for an earthquake of its magnitude.
Focal mecL-nisms for a ML = 2.0 Yucca Flat earthquake on February 7, 1988, (Table 3, Index
14) show strong dependence of strike, dip, and rake on assumed depth of focus. When treated as
a surface-focus event, the focal mechanism indicates oblique slip on a steeply-dipping north-south
fault (Yucca Fault?), or strike slip on an east-west oriented fault (Figure D18). When treated as
a deeper-focus event, five km below sea level. the focal mechanism includes a 50 northwest dipping
nodal plane, with strike-slip motion, and a northwest-oriented vertical nodal plane with vertical
motion (Figure D19). The possibility of a seismic detachment fault thus reappears, although this
example suffers from a poorer data fit to the velocity model, with RMS travel time residual = 0.20
seconds for the deeper hypocenter, versus 0.14 seconds for the surface-focus hypocenter. A graph
of how the RMS travel time residual varies as a function of depth-of-focus when using HYPO71 to
determine the hypocenter of this Yucca Flat earthquake is shown in Figure 14. The surface-focus
solution is not particularly satisfying to many seismologists, who believe that ultra-shallow rock is
generally not strong enough to store sufficient distortional strain energy for magnitude 2 earthquake
generation. Thus, the relatively large travel time residual for the deeper focus solution may be more
the result of an inadequate velocity model for this earthquake's arrival time data set than of an
intrinsically poorer depth-of-focus estimate.The Reveille Peak quadrangle earthquake of October 28, 1987, 17:25 UTC (Table 3, Index 10),
is one of the larger (ML = 2.8) of a few hundred earthquakes observed in a few km zone at the
southern end of the Reveille Range from 1986 through 1989. The nearest seismic station to this
series, QCS, is about 21 km east, so depth of focus is poorly resolved for these earthquakes. A
rangefront fault on the west side of the Reveille Range may be active in the Quaternary, and may be
associated with this long-running series. Focal mechanisms were computed for a near sea level focus,
36

YUCCA FLAT uPho- 28 Gap- 65 0min- 13.3 km.Sz 880207 16 47 42
2 }
O-C i i,U,
-0.4 0 0.S -1 1 3 7 9 1! 13 15
Cel-. XMkrm) Fixed H (k-n)
Figure 14.- Left side: epicentral scatter for various fixed depth and free depth HYPO71 hypocenters
for a Yucca Flat earthquake of February 7. 1988, 16:47 UTC. The symbols correspond to the fixed
depth hypo,.:nters: NI,0,1,2,..., A,BC,D,E, and F for depths = -1,0,1,2,.,10,11,12,13,14, and 15
km below sea level. The open square is for the free depth solution, with starting iterate depth 7
km, and the Z is for the free depth solution with starting iterate depth 0 km (at sea level). Right
side: The RNIS travel time residual for the various fixed depth and free dept'x solutions for the same
event. The letters above the fixed depth solutions, and below the free depth solutions, are HYPO71
"grades' assigned durinr the process of hypocenter deterrmination. This plot shows a small variation
in RMS for many shallow depth estimates, a pattern that is often present for SGB data sets wherethe nearest station is relatively distant from the epicenter.
37

and for a 5.7 km below sea level focus. The shallower-focus focal mechanism solutions, shown inFigure D13, indicate right-lateral strike slip on a steeply dipping north-trending fault, or left-lateralstrike slip on a steeply dipping west-trending fault. The deeper-focus focal mechanisms shown inFigure D14, are less well constrained, but all solutions have a significant component of reverse slipon northwest-trending nodal planes, and a steeply plunging tension axis. Another earthquake in thesouthern Reveille Range series, occurring on August 30, 1988, at 2:30 UTC, has an oblique normal-slip strike-slip solution for a fixed-depth hypocenter at five km below sea-level, shown in Figure D36(Table 3, Index 20). The near-surface layer velocities used for hypocenter determination were twoto 25% faster than those of the standard model, based on observed negative travel-time residuals forstations north of Yucca Flat and Rainier Mesa nuclear device tests, relative to the standard velocitymodel.
A strike-slip earthquake occurred on January 9, 1989, 05:08 UTC, with epicenter about 10+miles (17 km) north of Las Vegas, Nevada (Valley quadrangle), where it was strongly felt (ML' =3.5; MLjEIC = 3.5; MMI= V to VI, Carl Stover, written communication). This is the only SOBearthquake during the 1987-1989 period for which property damage was reported to the NationalEarthquake Information Center (NEIC), although damage was slight (cracked windows). The focalmechanism solutions shown in Appendix D, Figure D29 and D30, indicate right-lateral strike slipon a steeply dipping north-trending fault, or left-lateral strike slip on a west-trending fault. Theepicenter is in an alluvial valley at the base of the south flank of Gass Peak, with no immediatelyobvious fault to identify as the source. The inferred Las Vegas Valley fault strikes west-northwestin the vicinity of the epicenter, but SGBSN first-mot on data do not fit the local trend of thatfault. Variations in assumed focal depth for this earthquake have little effect on the focal mechanismsolutions. For example, the angle of slip on the east-west nodal plane is 0:1 150 for a seven km belowsea level hypocenter; it is 7° ± 80 for the four km below sea level hypocenter shown in Figure D29; itis -5° ± 30 for solutions derived from a hypocenter at sea level, shown in Figure D30 (00 representshorizontal block movement). This earthquake is one of the few observed for the 1987 through 1989period for which the regional SGBSN network P-wave polarities provide a fairly well-constrained setof focal mechanisms, relatively independent of assumed hypocentral depth.
In this Aection, focal mechanism solutions for four SGB earthquakes that occurred between1987 and 1989, all having magnitude > 2.0, have been discussed, with emphasis on the variety ofsolutions that result by changing the assumed hypocentral depth. In only one case, that of theJanuary, 1989, earthquake north of Las Vegas, Nevada, was the focal mechanism solution set notstrongly affected by changing the assumed earthquake depth of focus by a few km. In some cases,depth uncertainty translates primarily to nodal plane dip-angle uncertainty, and seismically activedetachment faults become possible source interpretations. In some cases, predominantly strike slipsolutions change to predominantly reverse slip solutions by increasing the assumed depth of focus.Although the earthquakes for which these ambiguous source interpretation: are > 50 km distantfrom Yucca Mountain, they are often the mainshocks of relatively important earthquake clusters.These observations poinc to the need to put temporary portable networks over seismically activespots in the SGB if we wish to better understand seismotectonic processes in the region surroundinga potential national nuclear waste repository at the Yucca Mountain site.
Average directions of P and T and tectonic strain
When considered collectively, the focal mechanisms for SGB earthquakes provide a fairly consis-tent descriptor of certain components of the regional tectonic strain tensor at shallow to mid-crustaldepths. Figure 15 is a plot of the thirty pressure axes (P or P) and tension axes (T or f) for the1987-1989 mechanism primary solutions listed in Table 3. The pressure axes form a girdle or beltthrough the hemisphere, and the tension axes cluster in the northwest and southeast quadrants, withrelatively small plunge angles. When using Watson's eigenvalue/eigenvector analysis of directional
38

data on the sphere (Schuenemeyer and others, 1972), we obtain an average tension direction, azi(Tf),
of N59°W, with plunge 2.80, for the data of Table 2. (Each datum was weighed equally, regardless
of earthquake magnitude or degree of constraint on mechanism parameters.) When excluding the
Silent Canyon caldera focal mechanisms, whose sources may be induced by nuclear device tests, the
azimuth of avg(T)= N550W, with plunge 2.8°. Figure 16 is a plot of the pressure and tension axes
for previously published SCB earthquake focal mechanism data for the period 1979-1986 (Rogers and
others, 1987, and Harmsen and Rogers, 1987). For these earlier data, azi(f) =N570 W, with plunge
= 2.0°. The distributions are very comparable. The average T-axis is the seismically determined
direction of average minimum principal compressional strain within the seismuogenic crust, and is
sometimes taken an an approximation to the direction of minimum principal compressional tectonic
stress. Furthermore, the avg(!F) azimuth corresponds remarkably well with the direction of net Great
Basin extension as determined from space geodesy and neotectonic constraints, N56+ 10°W (Minster
and Jordan, 1987).The focal mechanism avg(T) is rotated about 150 clockwise from the direction of net Neogene
extension from the Las Vegas fault system to the Death Valley fault system, as geologically deter-
mined, N73 ± 12'W (Wernicke and others, 1988), although the significance of this observation is not
known.Focal mechanisms provide relatively cheap indicators of tectonic stress parameters, but because
of the multiple uncertainties in depth of focus, focal tnecl&nism strike, dip, and slip, the particular
mechanics of each fault (strength, friction, fluid pore pressures in fault zone, fault interactions), and
the variability of the stress tensor with position due to crustal heterogeneity, there is no mathe-
matically well-defined mapping between focal mechanism data and the crustal stress tensor. The
majority of SGB focal mechanism solutions computed to the presen, date certainly conform to the
model of a highly stressed shallow crust (earthquakes are triggered by many NTS nuclear device
tests) in which the horizontal stress in the northwest to west-northwest direction is substantially
reduced, releasing gravitational energy through normal faulting events on northeast trending faults
and releasing horizontal strain energy through strike slip motion on steeply dipping, generally north-
trending, 'aults. The mechanics permitting seismic slip on sub-horizontal (detachment) faults does
not fit this conventional model.Some of the earthquake focal mechanisms whose T azes differs markedly from the average
T may be called 'outliers." Outliers include (1), events with oblique to near-vertical T plunge
angle, and (2), events with f's azimuth rotated significantly from the northwest-southeast direction.
An example of an event having a 50'-plunging tension axis is the Furnace Creek eathquake of
March 16, 1982, discussed briefly in an earlier section. Examples of events with obliquely inclined
T (i.e., plunge(T) ; 450) are discussed in the section on possible active detachment faults, above.
Examples of events having rotated azi(T) include the Yucca Mountain mechanism for eazthquakes
on October 18, 1988, two Silent Canyon Caldera earthquakes discussed above, and the composite
Timber Mountain methanism for earthquakes on July 3, 1988 and July 24, 1988 shown in Appendix
D, Figure D24. The focal mechanism for the Owens Valley earthquake of July 5, 1988, shown in
Figure D23, has azi(T)= N105'W (longitude 118.05° W), and that of the Dry Mountain quadrangle
earthquake of May 26, 1988, shown in Figure D20, has azi(T)= N830 W (longitude !17.71° W),
providing evidence for the possible counterclockwise rotation of the direction of minimum crustal
compression at the western edge of the SGB, in the vicinity of the Sierra Nevada block boundary,
relative to the central SGB. Another southwest SGB hypocenter with a focal mechanism having
azi(T) X east-west is that for the Stovepipe Wells quadrangle earthquake of July 8, 1986, 03:02
UTC (Harmsen and Rogers, 1987). The northwest-southeast orientation of the Furnace Creek fault,
northern Death Valley, California, may be favorable for right-lateral strike slip if the extensional
direction is more east-west than would be suggested by the average strain tensor for SGB earthquakes,
and if north-south crustal compression is sufficiently great in its vicinity. Very extensive sets of focal
39
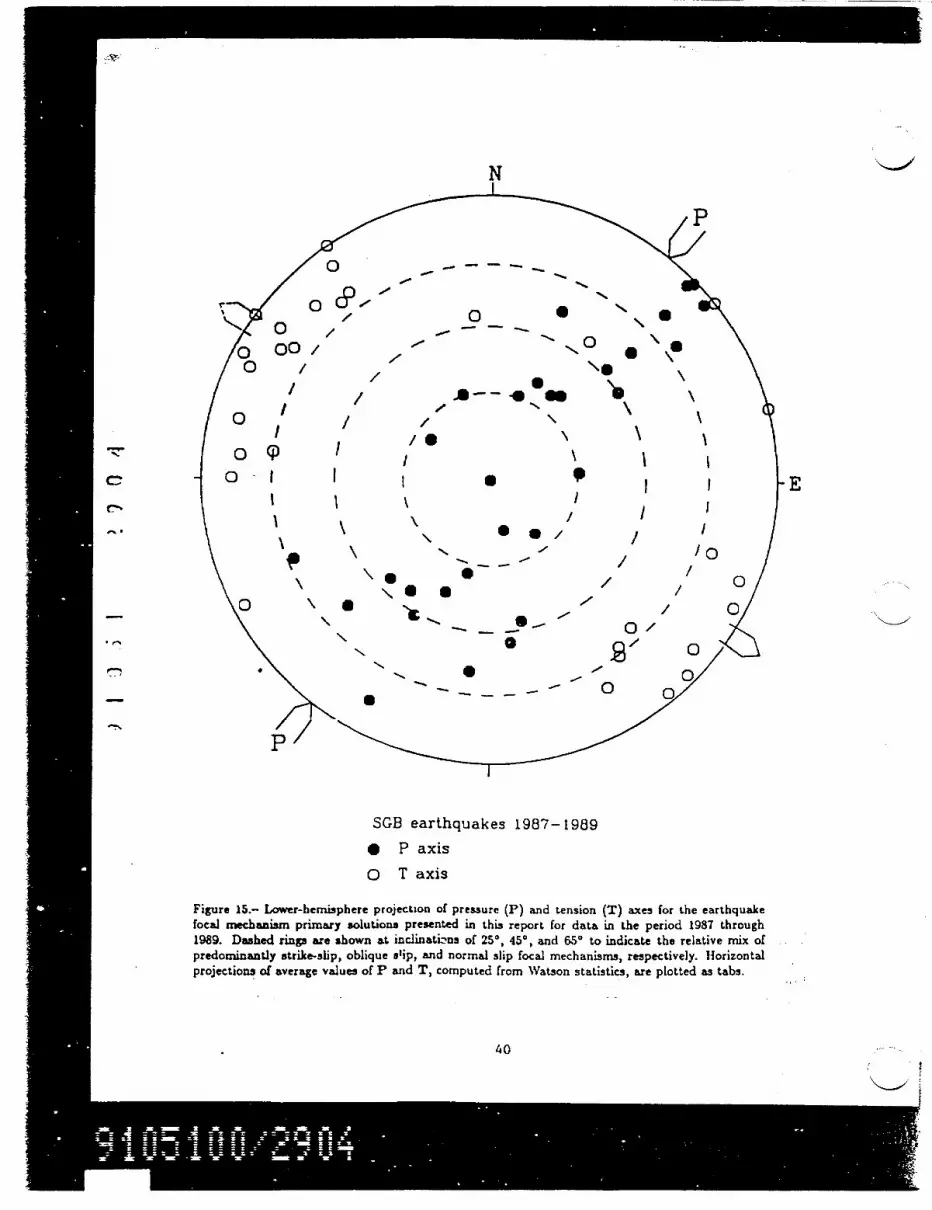
/\-.-
* * axi
0 N 1
00 0
S /O
*NI
SGB earthquakes 1987-1989
*1 P axis
o T axis
Figure 15.- Lower-hemisphere projection of pressure (P) and tension (T) axes for the earthquakefocal mechanism primary solutions presented in this report for data in the period 1987 through1989. Dashed rings are shown at inclinations of 25°, 450, and 65° to indicate the relative mix ofpredominantly strike-slip, oblique slip, and normal slip focal mechanisms, respectively. Horizontalprojections of average values of P and T, computed from Watson statistics, are plotted as tabs.
40

C/ *N
B 0 \ E
4 1 a ) I
0% 0-
SGB earthquakes 1979-1986
P Paxis
o T axis
Figure 16.- Lower-hemisphere projection of P and T axes, and their averages, for SGB earthquakedata of the period 1979 through 1986. Dashed rings are as in Figure 15.
41

mechanism solutions (hundreds) have been determined for the seismically active Mammoth Lakes,
Round Valley, Chalfant Valley, and Mono-Walker Lake regions, as well as for central Nevada, and
are used to infer crustal stress tensor rotation from central Nevada (Ps 39.5° N, 1180 W) to the Sierra
Nevada rangefront (na 37.5° N, 118.8° W) (Vetter, 1990). A clear counterclockwise rotation of es,
the minimum principal compressive stress, is evident from the Central Nevada Seismic Zone, where
the inferred O3 azimuth is approximately N50"W (plunge negligible), to Mammoth Lakes, where the
inferred es azimuth is approximately N100'W (plunge negligible) (Vetter, 1990).
Depth-of-focus distribution and deep-crust Intraplate earthquakes
A widely-held view on the depth distribution of earthquakes in the Great Basin is that depths
should be confined to the upper 15 km or so of crustal rock, with local variations based on higher-
than-average or lower-than-average heat flow, different lithologies, and strain rates (Smith and
Bruhn, 1984). The vicinity of 15 km depth i3 frequently termed the brittle-ductile transition zone.
The SGBSN hypocenter catalog generally conforms to this model, in that less than two percent of the
reported earthquake hypocenters for the 1987-1989 period have estimated depths, z, greater than 15
km below sea level. This property generally holds for depth distributions in other parts of the Great
Basin where hypocenter data are available, with the exception of the Truckee, California, region,
where depths of focus often lie between 15 and 20 km (Rogers and others, 1989). Figure 17 shows the
frequency distribution of depth-of-focus of a subset of earthquake hypocenters from Appendix A of
this report having the properties that the minimum source .o stktion distance < 10 km, the standard
error in depth, err. < 5 km, and the HYPO71 average grade (Avg(Q1,Q2) in Appendix A listing) is
C or better. Although these restrictions are not enough to insure well-constrained hypocenters, they
reduce the population from N rz 3300 to N = 851. and therefore result in a sample of what may
be the best-constrained quartile of the population of 1987 through 1989 SGB hypocenters. Figure
17(a) shows a bargraph of the counts of such events in each l-km interval, from one km above sea
level to 20 km below sea level. Figure 17(b) shows the probability distribution of depth of focus for
that sample, where cumulative probability within each interval is assigned by assuming that 'depth"
for the ith hypocenter is a normally and independently distributed random varible, with mean zi
and standard deviation err-,, respectively. The values z, and err,, are the depth and standard error
in depth, as reported in Appendix A. Also, the tails of the normal distributions are truncated at
one km above sea level and 20 km below sea level, and any remaining area under the probability
curves beyond those limits is accumulated into those extreme intervals. (A more realistic probability
density function would, of course, have finite tails, with limits corresponding to the bounds of the
seismogenic crust.) The distributions of Figure 17 are comparable to those reported in previous
SGBSN data reports (Rogers and others, 1987, and Harmsen and Rogers, 1987). Although the 'fine
structure" of the distributions may be more a function of the location algorithm and velocity model
than of any fundamental property of the earth's seismogenic crust, the main feature, a rapid tapering
off of seismic activity at depth > 12 km, is probably real.
Of the relatively deep-'ocus hypocenter solutions for earthquakes in the SGB, very few depths are
in the relatively well-constrained upper quartile as defined in the preceeding paragraph, the typical
deep hypocenter being from a data set having a source-station gap > 1800 and the nearest station
> 25 km from the source. A very small subset of the deep-crust hypocenters is well-located, having
both primary and secondary arrivals available at a station within 15 km of the epicenter, relatively
low RMS residual, reasonable Vp/Vs ratio, and < 180° gap in station azimuthal coverage. The
Vp/Vs ratio is the ratio of primary to secondary wave velocity, as inferred from P-wave and S-wave
arrival times at recording stations. For the period 1987 to 1989, the deepest hypocenter meeting
all of these criteria is that of a magnitude one earthquake on August 21, 1989, 16:17:45 UTC, in
the Halfpint Range, eastern NTS (Faiute Ridge quadrangle). The hypocenter is about 30 km below
sea level, at a depth corresponding to the crust-mantle interface. Seismograms from the 12 nearest
SGBSN stations that recorded this earthquake are displayed in Figure 18, with their corresponding P
42

'3 r,.
(A) 120
110-
100-
90-
80-
70-CD.0nE 60-
Z 50-
40
30-
20-
- 10
0.17-
0 2 4 12 14 16 18 20b 8 IU
(B) 1 8
14
.12~
=~ .1 0-0_ .0
2 .080..
.06
.04
.02
14 16 18 20
Depth (km)
Figure 17.- Depth of focus distribution of the best-constrained upper quartile of SGBSN hypocenters
for the period 1987 through 1989 (see text for definition of 'best-constrained"). (a) Graph of counts
of events versus focal depth, in one km intervals. (b) Graph of probability that an event occurs
within a given one-km interval in the depth range -1 < z < 20 km, where negative depths are
understood to be above sea level (see text for discussion of how probabilities are determined).
43.

) I t S )I 7 ' 3
GLR 5GLR: S-P 4.30 sec
i 32F 5
CPX _ _ v -_' , HA 3 ~ v
61 P 5
G4R
242 SSP: S-P 5.08 sec
176 ps
LOP 4 ---- " -
TMBRJ#&~r
$4 P 5SPRG _ <¢w n+
422 P s
YHT5 [ -- k '4
34& P , YM`16: S-P 6.86 sec
392 P
220 P 5
YIIT4
61 P S
SDHS0T-_s_ ,
Figure 18.- Seismograms from a deep-crustal earthquake on August 21, 1989, 16:17:45 UTC, in the eastern NTS (Paiute Ridge quadrangle) aredisplayed for 12 SGBSN stations nearest to the espicenier. The total time between the left and right brackets is 56 seconds. Scaled arrivals forprimary (I') and secondary (S) waves are also displayed. The S - P time for the nearest station, GLR, is 4.30 seconds.
( (

PA IUT -'_:8;O821 117/ 44 a
1.3 L [ ;-O.D <.. 15 ! . :~ S~ 23< 25 27 2C
De:wa Xsk I.. xed H (k..Figure 19.- Left side, cpicentral scatte. and right side, behavior of rM'\S funculon, as a function
-of assumed depth of focus for HYP071 hypocenters for an eastern NTS deep-crilstal earthquake* . of August 2'1, i989, 16:17 UTC. The symbols in thc epicenter plot. NI 0.1",2.\,1,C,D,E,F now.
represent fixed-depth epicenters for solutions having depth 15, 16, !,, 18.. 2!. 27 28, 29, 30~ and31 km below sea level, respectively. The open squar., arbitrarily plotted ;t (i),0), is the epicenterfor a free-depth solution, with initial iterate depth 7 kin, snd the "Z" symbol is the epicenter for a
-free-depth solution with initial iterate depth O km. All epicenters are plotted relative to the positionof the square
45

(a)
m GASS PEAK NE871231 8 12 57
V
0)O
5
4 a7
V)
LJi
znvZ
18 Gap-2420 0min- 4.4 km.
C i
NC /
c -,0
co
89A
B (a
0
C -. 5 I ' 1 J 15 17 :,
r ixec H kkm)Dei,. Xtkm)
(b)
s
7'V
00
CD
M GASS PEAK NE871231 8 12 57
3 A5
, : MPh- 18 Ce-24;° Drnir- !.- km.
-. C_ In I
; x ,V' -~' ~- ' C ,
.I
a:
L~
r I0
.' r , \ C'n7 KI/IC C
8 7
a gA D
E
i.5 7 9 Ul 13 15 17 . 2.
Flxed H (kim)-2.5 0
Delta X(km)
Figure 20.- Left side, epicentral scatter and right side, behavior of RM S as a function of fixed-depth
and free-depth HYPO71 solutions, with symbols having same meanings as in Figures 10 and 14. for
an earthquake north of Las Vegas, Nevada, on December 31, 1987 8:12 UTC having probable depth
of focus near the brittle-ductile transition. (a) Hypocenters derived using a model with no interface
at 15 km below sea level, V4 = 6.15 km/sec between 3 and 24 km below sea level, (b) Hypocenters
derived using a model with an interface at 15 km below sea level, V, = 6.5 km/sec below that
interface (see Figure Fl(a) for the velocity model). This figure shows that in some instances, the
15 km interface, or the relatively high velocity below that interface, is not well supported by arrival
time data.
46
In summary, deep crustal earthquakes in the SGB are both rare and small (maximum magni-
tude = 1). Data quality of those earthquakes' seismograms is poor, probably due in part to peculiar
source properties and to relatively high P-wave and S-wave attenuation (low Q) of rock at mid-
crustal to deep-crustal depths. To depths of about 15 km below sea level, SGB microearthquakes
yield seismograms that contain relatively high energy content in the 5-10 Hz range, whereas seis-
mograrns of microearthquakes originating at greater depths are depleted in those frequencies. Focal
mechanism solutions have not been attempted for the data of deep-crustal SGB earthquakes, due to
the ambiguity of P-wave onsets at SGBSN stations.
Conclusions
Although epicentral constraint on most SGB earthquake locations is fairly good (probable epi-
central error < 1 km), hypocenter (depth-of-focus) constraint is often poor (uncertainty in depth
frequently on the order of 5 km). A more accurate velocity model could reduce depth uncertainty, but
in its absence, and given the high degree of structural variability of SGB rock, a denser seismographic
network is necessary.
* An important consequence of depth-of-focus uncertainty is that focal mechanism solutions, even
if well-constrained for a given assumed depth, sometimes vary significantly with changes in depth.
However, some SGB focal mechanism parameters, e-pecitlly the azimuth of the tension axis, are
relatively stable or 'robust" for those different solutions.
* Deep-crustal earthquakes in the SGB are rare (less than 2% of the total hypocenters) but not non-
existent. Their presence at the crust-mantle interface (=s 32 km) provides an intriguing geophysical
problem in a high heat-flow region.
* SGB earthquake focal mechanism solutions are generally strike-slip, oblique slip, or normal-slip,
in roughly equal proportions, with tension axes clustering in the northwest-southeast quadrants,
with relatively small plunge angles, and pressure axes forming a girdle or belt through the focal
hemisphere. These solutions suggest a uniform crustal stress pattern in which compressional stress
in the northwest-southeast direction is substantially lower than in other directions. Gravitational
energy is released through normal faulting events on north-uortheast to northeast trending faults
and horizontal strain energy is released through dextral motion on steeply dipping, north trending
faults and through sinistral motion on east-northeast trending faults. The mechanics permitting
seismic slip on sub-horizontal (detachment) faults does not fit this conventional model.
* Exceptional focal mechanism solutions, including solutions having a nod-l plane with dip< 200,
strongly rotated tension axis direction, or reverse slip are encountered in the 1987-1989 SGB data.
They do not conform to the regional pattern, and some may indicate 'ocal anomalous tectonic
features. No unequivocal, predominantly compressional focal mechanism solutions have been deter-
mined from SGBSN data for earthquakes within 70 km of Yucca Mountain through 1989.
* SGB focal mechanism data are consistent with crustal stress models which display regional counter-
clockwise rotation of principal horizontal stress directions from the California-Nevada otateline at
36°N to 370 N, and : 1160W to 1170W to the eastern Sierra Nevada block boundary at about
118.10 W.
* Yucca Mountain, Nevada, is a seismically quiet site relative to surrounding areas. Focal mechanisms
for Yucca Mountain earthquakes are difficult to constrain, because no Yucca Mountain earthquakes
yet recorded have size greater than ML = 2.1, and most have ML < 1.0.
* Rock at shallow depths in the vicinity of Rainier Mesa displays a strong directional anisotropy for
P-wave velocities; whether this apparent anisotropy is the result of aligned cracks and stresses or of
the presence of crustal heterogeneity, i.e., a high-speed ridge under Rainier Mesa, is not determinable
47

from P-wave arrival data alone. The ability to distinguish among competing explanations could beachieved by an analysis of shear wave splitting from on-scale, three-component recordings of nucleardevice detonations which release tectonic strain over a range of azimuths; such data are not availablefrom the current SGBSN.
References CitedBeanland, S., and Clark, M. M., 1987, The Owens Valley fault zone, eastern California, and surface
rupture associated with the 1872 earthquake: Seismological Research Letters, v. 58, p. 32.(NNA.920407.0002)
Brocher, T. M., Hart, P. E., and Carle, S. F., 1990, Feasibility study of the seismic reflectionmethod in Amargosa Desert, Nye County, Nevada: U.S.G.S. Open File Report 89-133, 150 p.(NNA.901022.001 1)
Carder, D. S., 1970, Reservoir loading and local earthquakes : in Engineering Seismology - TheWorks of Man, Geol. Soc. Am. Eng. Geol. Case Histories, v. 8, p. 51-61. (NNA.920407.0003)
Carr, M. D., Waddell, S. J., Vick, C. S., Stock, J. M., Monsen, S. A., Harris, A. C., Cork, B. W.,and Byers, F. M., 1986, Geology of dril hole UE25p#1: A test hole into pre-Tertiary rocks nearYucca Mountain, southern Nevada: U.S.G.S. Open-File Report 86-175, 87 p. (HQS.880517.2633)
Carr, W. J., 1984, Regional structural setting of Yucca Mountain, southwestern Nevada, and lateCenozoic rates of tectonic activity in part of the southwestern Great B-sin, Nevada and Cali-fornia: U.S. Geo!ogical Survey Open-File Report 846-f54, 109 p. (NNA.870325.0475)
Carroll, R. D. and Magner, J. E.. 1988, Velocity logging and seismic velocity of rocks in the Rainier_. Mesa area, Nevada Test Site, Nevada: U.S.G.S. Opcn-Filc Report 88-380, 85 p. + Appendices.
(NNA.920407.0004)Catchings, R. D., and Mooney, W. D., 1991. Basin and Range crustal and upper mantle structure,
northwest to central Nevada: J. Geophysical Research, v. 96, p. 6247-6267. (NNA.920407.0005)Christiansen, R. L., Lipman, P. W., Carr, W. J., Byers, F. M., Orkild, P. P., and Sargent, K. A.,
1977, Timber Mountain-Oasis Valley caldera complex of southern Nevada: Geological Societyof Ameri.'.a Bulletin, v. 88, p. 943-959. (NNA.900329.0044)
- Christie-Blick, N., and Biddle, K. T., 1985, Deformation and basin formation along strike-slip faults:in Biddle, K. T., and Christie-Blick, N., eds., Strike-slip deformation, basin formation, andsedimentation: Society of Economic Paleontologist, and Mineralogists Special Publication No.
- 37, p. 1-34. (NNA.920407.0006)Freund, R., 1974, Kinematics of transform and transcurrent faults: Tcctonophyuics, v. 21, p. 93-134.
(NNA.920211.0031)Gomberg, J., Shedlock, K. M., and Roecker, S., 1990, The effect of S-wave arrival times on the
accuracy of hypocenter estimation: Seismological Society of America Bulletin, v. 80, p. 1605.1628. (NNA.920211.0033)
Hamilton, Warren B., 1983, Detachment faulting in the Death Valley region, California and Nevada,in Geologic and Hydrologic Investigations of a Potential Nuclear Waste Disposal Site at YuccaMountain, Southern Nevada: U.S. Geological Survey Bulletin 1790, Michael D. Carr and JamesC. Yount, eds., p. 51-86. (NNA.920211.0034)
Harmsen, S. C., and Rogers, A. M., 1986, Inferences about the local stress field from focal mecha-nisms: applications to earthquakes in the southern Great Basin of Nevada: Seismological Societyof America Bulletin, v. 76, p. 1560-1572. (NNA.920211.0035)
Harmsen, S. C., and Rogers, A. M., 1987, Earthquake location data for the southern Great Basinof NevAda and California: 1984 through 1986: U.S. Geological Survey Open-File Report 87-596,92 p. (NNA.920211.0046)
Hoffman, L. R., and Mooney, W. D., 1984, A seismic study of Yucca Mountain and Vicinity, southernNevada; Data report and preliminary results : U.S. Geological Survey Open-File Report 83-588,50 p. (HQS.880517.1267)
48

Ismail, A., and Priestley, K. F., 1986, Crustal structure in the vicinity of Yucca Mountain, Nevada:Earthquake Notes, v. 57, p. 10. (NNA.920407.0007)
Kaneshima, S., 1990, Origin of crustal anisotropy: shear wave splitting studies in Japan: Journal ofGeophysical Research, v. 95, p. 11,121-11,134. (NNA.920407.0008)
Kisslinger, C., Bowman, J. R., and Koch, Karl, 1981, Procedures for computing focal mechanismsfrom local (SV/P.) data: Seismological Society of America Bulletin, v. 71, p. 1719-1729.(NNA.920211.0036)
Kisalinger, C., Bowman, J. R., and Koch, Karl, 1982, Errata to procedures for computing focalmechanisms from local (SV/P). data: Seismological Society of America Bulletin, v. 72., p.344. (NNA.920211.0037)
Lay, T., Wallace, T., and Helxnberger, D. V., 1984, The effects of tectonic release on short-periodP waves from NTS explosions: Seismological Society of America Bulletin, v. 74, p. 819-842.(NNA.920407.0009)
Leary, P. C., Crampin, S., and McEvilly, T. V., 1990, Seismic fracture anisotropy in the earth's crust:an overview: Journal of Geophysical Research, v. 95, p. 11,105-11,114. (NNA.920407.0010)
Lee, W. H. K., and Lahr, J. C., 1975, HYPO71 (revised): A computer program for determininghypocenter, magnitude, and first-motion pattern of local earthquakes: U.S. Geological SurveyOpen-File Report 75-311, 116 p. (NNA.920211.C038)
Lee, W. H. K., and Stewart, S. W., 1979, Principles and applications of microcarthquake nrtworks:_~ New York City, N. Y., Academic Press, 293 p. (NNA.920211.0039)
Minster, J. B., and Jordan, T. H., 1987, Vector constraints on western U.S. deformation from spacegeodesy, neotectonics, and plate motions: Journal of Geophysical Research, v. 92, p. 4798-4804.(NNA.920407.001 1)
Minster, J. B., Savino, J. M., Rodi, W. L., Jordan, T. H., and Masso, J. F., 1981, Three-dimensionalvelocity structure of the crust and upper mantle beneath the Nevada Test Site: Systems Scienceand Software Report SSS-R-81-5138, 218 n. (NNA.920407.0012)
Nicholson, C., and Simpson, D., 1985, Changes in VY,'V, with depth: implications for appropriatevelocity models, improved earthquake locations, and material properties of the upper crust:Seismological Society of America Bulletin, v. 75, p. 1105-1123. (NNA.920407.0013)
Nur, A., 1971, Effects of stress on velocity anisotropy in rocks with cracks: Journal of GeophysicalResearch, v. 76, p. 2022-2034. (NNA.920407.0014)
Pakiser, L. C., 1985, Seismic exploration of the crust and upper mantle of the Basin andRange province: Geological Society of America Centennial Special Volume 1, p 453-469.(NNA.920407.0015)
Reheis, M. C., and Noller, J. S., 1990, Aerial photographic interpretation of lineaments an'd faultsin late Cenozoic deposits in the eastern part of the Benton Range 1:100000 quadrangle andthe Goldfield, Last Chance Range, Beatty, and Death Valley Junction 1:100000 quadrangles,Nevada and California: U.S. Geological Survey Open-File Report 90-41, 9 p. - 4 plates.(NNA.901031 .0001)
Rogers, A. M., and Lee, W. H. K., 1976, Seismic study of earthquakes in the Lake Mead,Nevada-Arizona region: Seismological Society of America Bulletin, v. 66, p. 1657-1681.(NNA.920407.0016)
Rogers, A. M., Harmsen, S. C., and Meremonte, M. E., 1987, Evaluation of the seismicity of thesouthern Great Basin and its relationship to the tectonic framework of the region: U. S. Geo-logical Survey Open-File Report 87-408, 196 p. (HQS.880519.1409)
Rogers, A. M., Harmsen, S. C., Corbett, E. J., Priestley, K., and DePolo, D., 1991, The seismicityof Nevada and some adjacent parts of the Great Basin, in Neotectonics of North America,Slemmons, D. B., Engdahl, E. R., Blackwall, D., and Schwartz, D., eds., Geological Society ofAmerica, vol. DMV, p. 153-184. (NNA.920211.0043)
49

Rothman, R. L., Greenfield, R. J., and Hardy, H. R., 1974, Errors in hypocenter location due to velocityanisotropy: Seismological Society of America Bulletin, v. 64, p. 1993-1996. (NNA.920407.0017)
Schuenemeyer, J. H., Koch, G. S., and Link, R. F., 1972, A computer program to analyse directionaldata, based on the methods of Fisher and Watson: Journal of Mathcematical Geology, v. 4, p.177-202. (NNA.920211.oo45)
Scott, R. B. and Bonk, J., 1984, Preliminary geologic map of Yucca Mountain with geologic sections,Nye County, Nevada: U. S. Geological Survey Open-File Report 84-494. (HQS.880517.1443)
Scott, R. B. and Whitney, J.W., 1987, The upper-crustal detachment system at Yucca Mountain,SW Nevada [abs.]: Geological Society of America Abstracts uith programs, v. 19, p. 332-333.(HQS.880517.2863)
Serpa, L., deVoogd, B., Wright, L., Willemin, J., Oliver, J., Hauser, E., and iroxel, B., 1988, Structureof the central Death Valley pull-apart basin and vicinity from COCORP profiles in the southernGreat Basin: Geological Society of America Bulletin, v. 100, p. 1437-1450. (NNA.901206.0011)
Smith, R. B., and Bruhn, R. L., 1984, Intraplate extensional tectonics of the eastern Basin-Range:Inferences on structural style from seismic reflection data, regional tectonics and thermal-mechanical models of brittle/ductile deformation: J. Geophysical Research, v. 89, p. 5733-5762.(NNA.920407.0018)
Snoke, J. A., Munsey, J. W., Teague, A. G., and Bollinger, G. A., 1984, A program for focal mechanismdetermination by combined use of polarity and SV-P arnpitude ratio data: Earthquake Notes, v.55, p. 15. (NNA.920211.0046)
Stock, J. i., Healy, J. H., Hickman, S. H., and Zoback, M. D., 1985, Hydraulic fracturing stressmeasurements at Yucca Mountain, Nevada, and relationship to the regional stress field: Journalof Geophysical Research, v. 90, p. 8691-8708. (HQS.880517.1509)
Stock, J. M., Healy, J. H., Svitek, J., and Mastin, L., 1986, Report on televiewer log and stressmeasurements in holes USW G-3 and UE-25pl, Yucca Mountain, Nye County, Nevada : U.S.Geological Survey Open-File Report 86-369, 91 p. (HQS.900326.0253)
Swolfs, H., Savage, W., and Ellis, W., :988, An evaluation of the topographic modification of stressesat Yucca Mountain, Nevada, in Geologic and Hydrologic Investigations of a Potential NuclearWaste Disposal Site at Yucca Mountain, Southern Nevada: U.S. Geological Survey Bulletin 1790,Michael D. Carr and James C. Yount, eds., p. 95-101. (NNA.920407.0019)
Tsvankin, I. D., and Chesnokov, E. M., 1990, Synthesis of body wave seismograms from point sources inanisotropic media: Journal of Geophysical Research, v. 95, p. 11317-11331. (NNA.920407.0020)
Vetter, Ute R., 1990, Varintion of the regional stress tensor at the western Great Basin boundary regionfrom the inversion of earthquake focal mechanisms: Tectonics, v. 9, p. 63-80. (NNA.910123.0032)
Wernicke, B, Axen, G. J., and Snow, J. K., 1988, Basin and Range extensional tectonics at thelatitude of Las Vegas, Nevada : Geological Society of America Bulletin, v. 100, p. 1738-1757.(NNA.920407.0021)
Winograd, I. J., and Thordarson, W., 1975, Hydrogeologic and hydrochemical framework, south-central Great Basin, Nevada-California, with special reference to the Nevada Test Site: U. S.Geological Survey Professional Paper 712-C, 126 p. + 3 Plates. (NNA.870406.0201)
Wong, Ivan G., and Chapman, D. S., 1990, Deep intraplate earthquakes in the western United Statesand their relationship to lithospheric temperatures: Seismological Society of America Bulletin, v.80, p. 589-599. (NNA.920407.0022)
NOTE: Parenthesized numbers following each cited reference are for U.S. Department of EnergyOCRWM Records Management purposes only and should not be used when ordering the publi-cation.
so

Appendix A
Earthquake locations for the years 1987, 1988 and 1989and quadrangle map names to which locations are keyed
AU earthquake hypocenters reported in Appendix A are preliminary. The local hypocenter sum-mary column headings are for the moet part self-explanatory. UTC is Universal Coordinated Time.Horizontal error equals %/-dz2 + d3dyi, where adz and edy refer to the HYPO71 standard errors inlongitude and latitude, respectively. Vertical error is the HYPO71 standard error in depth (adz). 'AZIGAP' is the azimuthal gap, that is, the largest angle subtended by the epicenter and any two circu-larly adjacent stations with positive phase weight. "Q19 and 'Q2 represent two HYPO71 hypocenterquality estimates as defined by Lee and Lahr (1975). 'DS' is a code for data source: A for analogseismograms, (data scaled from develocorder films, starting depth, zo, at 7 km for iterations), all otherletters are for data scaled from digital seismograns. Five digital data letters are defined: Z, S, andT are for minimum RMS travel time residual solution having z0 = 0, 7, or 12 km below sea level,respectively, using the standard SGB crustal velocity model, modified to include a layer interface at15 km, below which Vp = 6.5 km/sec; I is a solution using the standard SGB model without the15 km interface, and Y is a solution using the Yucca Mountain velocity model. In each of the lattercases, zo = 7 km. for the initial hypocenter guess. zo aind ya are always taken to be near the earliest-reporting station. When equal final RMS values occur for solutions havinb different zo, the priorityfor reporting is I, S, Z, and T. A and Y solutions were not extensively redetermined using differentvalues of zo.
Mca is the coda-average magnitude, Md is the duration magnitude estimate, MLh is local mag-nitude from horizontal-component instruments, MLv is local magnitude from vertical-component in-struments, MLc is the maximum of station magnitudes from overdriven (clipped) records. Amplitudesrecovered from vertical-component data are multiplied by 1.75 to provide an approximate horizontal-equivalent amplitude. Mca is computed from the post-S coda by fitting the envelope function,
A(t) = Ao(t - t,) -l
to a sequence of 5.12-second windows of peak amplitude data in the unclipped portion of the seis-
mogram. In this formula, AO is statistically determined, and is transformed into NIca. The modeledtime rate of decay is governed by the exponent 1.8, which lumps geometric spreading, scattering, andanelastic attenuation. Mca appears to underestimate the true event magnitude when M > 2.7.
Depth estimates may be followed by one or two stars. One star means that the depth-of-focusstandard error estimate was very large (> half crustal thickness). Two stars imply that the depth wasfixed by HYPO71 during the last several iterations for hypocenter, because the data lacked resolvingpower for that parameter. In some instances, the standard depth error estimate, adz is followed by oneor two +s. These cases, discussed in greater detail in the section, Preliminary hypocenter determinationfor SGB earthquakes and explosions, are for hypocenters whose depth-of-focus uncertainty is greaterthan would be suggested by sdz.
DELMIN is the minimum source to station distance in km, and RMS RES. is the root-mean-square travel time residual, defined in the text of this report. #N PH. is the number of (P+S) phaseshaving positive weight in the solution. Finally, U.S.G.S. quadrangle is the name of 71 or 15 minutetopographic quadrangle in which the epicenter lies. Regional events are not assigned quadrangle names.
51

115.2130
_ _ we~t_ -- 3&500
t t~~~~~~~~Ctl~~ s9,t*,t *wo
:,>R.^fxtN$ f 4'*eAS 4
Utv t ] § ,Jso .~t* 4'* >*.Ks$
Nd 9 %stRw;Ntu et f Ss4Xp ef5
t o~to~e2 4t°, k rS g/.J
48<+&* t~v~ V t 2 4 > e * w w9+ ,9 t
V1 000t14. 500-
V SESSMOCRAPH STMnON
Figure Al.- Quadrangle nam.-s in the northeast quarter of the southern Great Basin.
52

V985 /.*% / i " e 4R4 t~S|F|<F4, 4* /_% % Q .e v
- -~ - --- -
\.4 \ -<
r
bss+s eswLS ' X t t&f 0
I' \ t .q jo.C
-4 -
1115.250OV7 SE ISHOC RAPH ST AT ION
F igurc A2. Quadrang&le names in t he sou th east quarter of the sou the rn G rea t B asin.
5 3

4X A , , t * 4
II? 000
.e hsswh+ VtCFa r
- - _ . - -TS . 0
II 7- 0
V SEISMOCRAPH STATION
Figure A3,- Quadrangle names in the northwest quarter of the southern GrcatBsin.
54

doe eNs+swV Rsa+.
i
v
N-1
Figure M4.- Quadrangle names in the southwest quarter of the southern GreatBasin.
55

Max. eq maa. Top:1087-1989. Bottom: 5/1978-198M
117.75 117.5 117.25 117 116.75 116.5 116.25 116 115.75 115.5 115.25 115 114.75- - - . , ... . . A3B.25
I I I IY I IV I I I I
2.L140 0 00 0 2.60 a0 0 0S a 0 0to O a 1.71i.91.l.4.;' '0i0 1.60 1.60.930 0 0 1.7 D 0g.51'.1.f0 1.50 1.7 L.S80
' O 2.01.20 0 1.8 0 0 1.70 0 2.52.91.8I.40 0 2.51.71.60 O02.01.81.70 0 0 l.61.q 0 0 1.4 0 O 1.92.01.40 0 0 0 1.21.71.11.2IA1.94.31-';.31.91.3 2.3 0 1.2'0 1.80 23.32." 0 2A 1.6C1.38.91.31.22.32.5
'I- 01.;.0 4 2. 1 .1.. 0:.. 0 1.82.A2.52.32.'6.q 0 1.5 0 2.6 1.51.91.1O 1.50 1.71.51.5 0 1.11.51.60 0 0 1.5 0 1.4 0 0 0 0 0 1.91.81.82.51.21.61.60 0O0 0 1.7-.1 00 0.91.51.71.80 1.4 0 1.41.51.63.1 1->qt ''hI*:, .. ':.$2s3.2.3..20 a: .8 0 1.2.1 0 :.1.42.1.1.8I.1.5:.S'
:1 .S2.32.8 1.4 1.6 SJ .31. 1.62. 1.61.31.3 0 i252.11.32.41.51.32.81.S290.81.92.a1.62.51.91.71.31.31.91.6 0 2.21.61.81.52.42.02.02.02.42.12.0
2. .72.31.11.62.72.4 1.2.42.4 1.3 1.8 1.9 0 1.91.9 0 2.42.2 1.72.4 2.92.3 1.5L2.} 2t7.7 I-02A 2.'A;W 0:o 1.'3t.3 29 i8.72'.3Z.'6 1.32.:1 2.2 [email protected] 3A12.0239 1.72.53.22' 7S0 1 5?:1 1 72.47 ki L32 1 2.52.Z2.53.32. 12.41.82. .93.01.51.11.5 0 2.32.4 . 22. 2.41.71. 2.0 0 1.62.01.92.22.32.82.71.82.52 2.4 1.7 2.23.02.1 1.92.2 21.92.02.71. 2.11.21.42.52.52.42.82.2'2~..1'.72.I 2 S afi2.s2.r:L1AS ';2.q1.8j1 4.81.72.43 1-3.q LI. .71.93.S 2.61.62.11:.42.22.2'1. .3 1. 1.41.S1.52 2.92.23 -1. } .e. 1.4 1.1 2.2 2.32.57 .82.4 4.2 1.7 260 0 1.6 2.3 1.42.11 I l.b 2.33.21. 0 1.61.6 2.32.22.12.5702.21.81.91.40.71.1 6 1.91.41.10.81 91. 1.73.01. 1.42.5 0 1.60 1.62.01.0122.32.31.71.4 0 1'. P.82.9.3 2.52.61.32 2.31.82.1 2.81.7.0 0 01..72a,4-.t2.I2.,0,1.30 0:7-F. 130 61.82.1.72. L.41.42.22.S2.1 0 000 1.51.41.62.11.21. 990.90.1 3Z. 2.41.61. 1.52. 2.12.61.61.8 0 1.91.30 O .I.92.52.61.71.81. .13. 1 7. S U.5 l .91.91.92.D1.q 1.21.401.3 0 0 -12 2. . 0.S 12.G1. 2, I1.9 0712.09 1.91..6:0 2.4 2.2.341.A Y1.32.60 2.71'.5G.21.I863.1.52.22.71.I2.31.22. .0 .1.32.12.490
2.10 1.920O 1.7 1.82.21.51.71. 0 1 -' 2.80 0 1.91.4 1.21.8 1.2.0 .82.10.92.31.51.51.42.01.81.70.B2.00 1. 2.72.11.71.61.81.71.70 1.90 1.3.Gis~,,".,, 0 ,2.00O 2.1-'^ 1lS.20..1.60.9 60 1 .20 Q1.50Q' 0 0' 3.51.71.7
_ 2.! 0.I.32.X1 1. .6lt.917.,2.1'2.D2.70. Q .b21.21.S'2.5.0.4:1.31.31.5 0 2.12.52.5 2.02.01.50 1.31.00.91 ,.2.4 1.330 2.20 0..0. 1.92.12.00 2.43.52.52 53.32.11.72.5 1.12.61.6 1.'8 1.8 1.2 C 1 .61.60.91.61.92.00.C2.02.62.7
I I ! I I I I I ! I
I @w.sW
38
37.75
37.5
37.25
37
35.75t
1-��
36.5
36.25
118 114._ 36.75
0 25 501
100 km V SEISMOGRAPHIC STATIONCompare periods AB
Figure A5.- Map tabulating maximum earthquake magnitude (AIL where available, otherwise MID or
MC.) in each 71' quadrangle within the ranges 114.875°W to 117.875°W and 36.125°N to 38.125°Nrecorded by the SGBSN. The top number is the maximum magnitude in the period 1987 through 1989,and the bottom number is the maximum magnitude in the period August, 1978 through December1986. The letter "Q" (quiet) within a quadrangle means no earthquakes were monitored during thatperiod by the SGBSN. The NTS boundary and part of the California-Nevada state border are shown.Alternate rows are shaded to aid in visual separation of information in adjacent quadrangles.
56
I
i
I
. -1 iI
", I

I I . ) 2) I
1987 LOCAL HYPOCENTER SU MMARY - SGO EARTHQUAKES
DATE - TIUE LATITUDE(UTC) (DEG. N)
JAN 1 1:27:48 37.2891 4: 6: 5 36.8061 13:26:38 37.5401 14:58:10 37.8562 13: 7:56 36.9e62 14:13:29 36.9e8
3 5: 7:29 37.8543 7:48: 2 36.4624 2:38: 5 36.4645 19:48:18 35.6716 2:18:23 37.1166 3:49:32 36.651
6 12:20: B 36.8627 0:21: 8 37.6517 2:59:16 36.6138 7:24:37 37.3468 11:48: 3 37.1408 17:24: 8 36.624
9 7:39:17 37.857Ln 9 11:51:33 37.447
9 22:47:36 37.83310 6:18:17 37.874e l11:40:14 36.808
10 23:35:49 37.173
11 7:18:40 36.65611 7:31:17 37.40612 3: 0: 2 36.70512 5:34:15 37.15412 20: 3:21 36.87113 0:42:57 37.157
13 1:15: 9 37.32913 17:26:12 37.32316 e:53:22 37.37616 18: 8:27 37.21518 0: 6:49 37.85918 15:12:35 37.855
19 8:17:30 37.24920 19:22:35 37.85521 6:30:34 37.42321 9:32:50 36.46422 1:32: 2 36.97522 8:13:26 37.378
22 10:39:13 37.18822 13:48: 2 37.376
LONGITUDE(DEG. W)
114.837115.987115.760116.137115.976115.971
116.140116.16.116.159116.478117.354116.345
115.965114.878115. 896117.234116.289116.345
116.143117.887114.737116.130¶15.826116. 327
116.345114.682115.771117.354116.229117.401
115.032115. 034115.084117.316116.137115.113
115.010116.133117.015116.163116.124114.994
117.390114.991
STANDERRORH(KM)
1.70.30.20.20.4e.3
0.20.20.40.90.20.5
0.20.20.20.30.21.4
0.30.81 .20.40.3e.3
0.56.70.30.20.3e. 1
8.20.50.80.30.20.2
0.30.40.20.20.30.2
0.1e.5
DEPTH(KU)
11.910.324.320.23
-0.65-0. 16
3.9210.6410.6411.69e.282.43
6.455.229.570.176.880.90
8.254.483.e77. 492 .3.3.67
2.765.111.718.102.330.00
8.486.335.877.69
-0.47e.e7
0.659.480.55
10.052.14
-e.0e
-0.40-0.47
STAND AZIERROR GAPZ((KU) (DEG)
3.9 2330.4 1761.1+ 870.2 1060.4 1560.4 128
8.8 1050.2 640.5+ 1373.0++ 2830.4 1200.4 178
0.7 800.4 1460.5 1000.2 710.5 e51.0 293
2.6++ 1063.2 1062.6 2505,5++ 1101.0 104e.4 90
0.7 2681.4 2160.6 159e.6 III0.9 1020.2 111
0.344 1771.0 1798.5 1600.8 870.3 ; 060.4 107
0.4 1582.8 1060.3 760.3 620.7 1820.2 174
8.2 1130.4 176
qoD12S
801ACSACSACZAC IABI
CCIAAIACI8DIACZACI
ABIACIABIABSABIBDI
BCIBB8
* BDSCCIAC IABI
ADIADSACIACIAB5AC:
AC!ACACIABACiAC:
AC;BCACAAADAC
ACAC
MAGN I TUDE
1.80 1.810.721.2e1.570.94
1.60 1.30
1.681.72 1.16
0.832.07 1.74
0.970.40
1.72 1.281.59 1.201.56 1.092.18 1.65
e.951.27 0.76
1.641.27
1.64 1.631.82 1.39
0.98
0.45S 2.57 2.40I1.68 1.36
1.118.28
1.09 1.25
1 2.85 2.93I 1.07I 1.151 1.54 1.46z1.98 1.83z 1.37
Z 2.04 1.891.52
S 1.80 1.79I1 1.131 6.5f
1.74 1.54
z 0.911 1.90 1.8e
ESTIMATESULh ULv U
1.790.94
1.09 1.441.09 1.55
1.1e1 .25
1.531.35
1.1e 0.801.83 2.140.85 1.04
0.5e
1.47 1.361.431.061 .720.670.51
1.591.34 1.46
1.832.09 1.730.89 0.76
6.482.86
1.22 1.351.53 1.22
0.21i .16 1.49
'.77 2.791.451.111.60
1.96 1.831.28 1.52
3 2.321.611.78
1 1.78 1.066.411.67
1.06 0.961 1.91 2.10
DEL- RUS INMIN RES. PH. U.S.G.S.
Lc (KU) (SEC) QUADRANGLE
23.0 0.12 9 GREGERSON BASIN15.3 6.16 23 FRENC*HAN FLAT12.6 6.68 22 WHITE BLOTCH SPRINGS20.4 6.06 15 REVEILLE PEAK7.5 0.11 13 PLUTONIUM VALLEY8.2 6.11 20 PLUTONIUIM VALLEY
20.5 0.04 9 REVEILLE PEAK5.8 6.07 32 MARGOSA FLAT5.5 6.09 17 AMARGOSA FLAT
47.9 6.10 14 AVAWATZ PASS13.6 6.1l 20 UBEHEBE CRATER6.8 6.e9 16 STRIPED HILLS
11.1 6.10 4 FRENCHMAN FLAT1.7 5.2 6.05 12 PAHROC SPRING
7.9 O.16 36 MERCURY SW5.4 0.00 20 SCOTTYS JUNCTION SW8.7 0.09 26 AMMONIA TANKS
14.6 6.06 16 LATHROP WELLS SE
20.8 0.e7 le REVEILLE PEAK9.1 6.14 24 SOLDIER PASS
25.2 e.08 12 THE BLUFFS48.1 6.10 17 REVEILLE PEAK11.9 6.13 33 FRENCH'AAN LAKE SE4.5 6.1e 25 AMMONIA TANKS
1.2 11.6 0.65 13 STRIPED HILLS22.7 6.06 12 SLIDY MTN3.7 0.09 32 MERCURY NE
17.2 6.09 24 USEHEBE CRATER5.7 6.68 12 SKULL UTN
18.2 6.e6 21 UBEHEDE CRATER
3.0 8.8 6.10 40 ALAMO SE9.4 6.07 13 ALAMO SE4.5 0.06 9 AL.AN NE
le.8 6.18 21 UBEHEtE CRATER20.6 6.08 18 REVEILLE PEAK18.5 0.69 1S REVEILLE PEAK
17.9 6.o0 22 LOWER PAHRANACAT LAKE20.0 0.06 8 REVEILLE PEAK25.3 6.67 28 SCOTTYS JUNCTION NE5.9 6.69 4e AARGOSA FLAT7.8 6.06 20 YUCCA LAKE5.9 0.07 17 DELAMAR MN
17.2 6.06 21 UBEHEBE CRATER6.3 8.13 16 DELAMAR NW
-- - - - - - - - - - - -- T- - - - - ' - - 7 ".,-7-,-r , -;w ~, - T .-

.) I ", j I ) ') 2 ,i
1987 LOCAL HYPOCENTER S*)A4ARY - SGB EARTHQUAKES
J}
tn
co,
I,
STAND
DATE - TIME LATITUDE LONGITUDE ERROR
(UTC) (DEG. N) (DEG. W) H(Ku)
AN 22 23:19:14 37.110 117,914 0.6
23 13:.M8:11 37.192 117.621 6.3
23 18:24:17 36.459 116.162 6.2
23 21: 6:38 36.460 116.159 6.2
24 14:59:17 37.379 114.997 6.3
25 4:23:43 37.699 115.060 e.3
25 16:28: 3 37.696 115.060 e.3
25 21:19: 2 37.501 116.363 0,2
26 11:48:51 36.699 116.226 0.2
26 12:37:11 37.855 116.138 0.2
26 18: 3: 4 37.225 115.116 6.5
26 19:11: 7 36.648 116.267 6.2
27 A:19: 2 37.143 116.289 0.2
27 8:49:26 36,649 116.267 6.2
28 17:11:16 37.739 114.858 0.3
28 20:39:19 37.350 117.880 0.5
29 9:42:13 37.419 117.764 -
29 15:59:49 36.605 116.388 0.9
29 16:48: 5 36.587 116.245 0.2
29 16:49:14 36.589 116.251 0.5
30 1:14:36 37.319 117.535 6.3
50 3:23:23 36.583 116.258 0.3
3e 9:34:47 37.762 114.155 7.6
36 26: 3:35 36.650 116.288 0.2
31 9:15:46 37.888 116.118 0.7
FEB 1 6: 3:43 36.790 116.256 0.3
1 18:54:22 37.510 116.541 6.2
3 21:57:37 36.436 117.5e8 e.7
4 13:24:52 37.144 118.293 0.2
5 0:25:56 36.556 116.255 0.2
5 7:58:43 37.147 116,273 0.6
6 6:17:24 37.275 116.418 0.7
6 16: 6:23 37.215 117.603 6.56 16:15:32 37.218 114.879 0.9
6 20: 5:11 37.346 117.241 0.3
6 20:46:30 37.347 117.240 0.4
7 8:12:24 37.517 116.541 6.2
7 11:48:38 37.872 116.126 6.7
7 16: 4:53 36.893 116.449 0.3
8 1: 9:25 36.716 116.060 e.4
8 5:36:48 36.409 116.998 e.4
8 6:5e:16 37.345 117.239 e.4
8 10:44:22 36.806 115.860 e.5
a 5:17:48 37.338 117.244 0.4
DEPT H(KM)
5.4010.5511 . I11.12-0.156.95
5.890.846.390.565.995.51
7.685.545.877.00
29.922.78
-0.99-1.864.11
-1.040.83.5.17
-1 .50-6.4611.472.108.630.51
8.8715.055.4516.98-0.35-0.39
1e.360.607.63-0.78
1.93-e.20
4.746.59
STAND AZIERROR GAPZ(KM) (DEG)
6.0 2236.6 1600.4 77e.3+ 770.2 1731.5 112
1.3 1120.3 1360.4 860.4 1061.4 1890.6 66
6.3 63e.7 661.1 1941.1+ 199- 1200.7 228
0.3 82e.3 1672.1 84e.3 174- 324
6.3 66
1.3 113e.4 700.9++ 742.3 2400.4 8e0.3 95
0.4 1930.8 2130.7 1661.9 2430.3 710.3 134
6.7 531.1 1160.4 1180.5 1281.0 946.3 134
2.5 1530.2 161
(
1 2125 U,
CDI 2ACIAAI IAAI IACIABI 1
ACI IACZ IA81ACZADI
Asl 1
ADI IADI lCOAADI
ACZ 1ACZoclAC1DOAAAI
ACZAB!ACI
AAIACZ
ADIAD!ACIADIA81AB!
ACIoC!ABZACTABIASI
BCIABI
k.GNITUDEco Md
.04 1 .811.23
.93 1 .40
.66 1.261.55
.64 1.42
.34 1.19
.55 1.316.551.661.57
.75 1.28
.62 1.23.56 1.171.92 1.671.45 1.41
1.64
1.39 1.24
1.6e1.40 1.07
1 .861.59 I.16
1.711.57 0.91
1.111 .47
1.58 1 I71.69 1.14
O.ss1.35 1.4:
e.81.57 1.1,1.73 1.611.11
1.67 1.31.28 1.71
2.04 1.4¶.3
0.91.21 1.2
ESTIUATESULh ULv MLc
1.47 2.21 2.11.13 1.48
I.861.22
1.54 1.691.85
1.66 1.32 1.71.21
0.98 0.401.79 1.861.81 1.65
1.54 1.5
1.26 1.361.13
2.43 2.261.43 1.51
0.65
1.46 1.161.07
0.78 0.656.93
1.14 I.1
1.660.991.401.461.3e1.10
0.711.171.09
1.80 1.819 1.79
1.26
3 1.531.621.16e.61
2 1.571.39
5s 1.16
9 1.32
DEL- RiS JNUIN RES. PH. U.S.G.S.(KM) (SEC) QUADRANGLE
27.4 0.12 20 WAUCOBA SPRING5.00 .10 22 LAST CHANCE RANG E5.6 0.08 30 AMARGOSA FLAT5.3 6.11 38 AMARGOSA FLAT5.7 6.09 13 DELAMAR NW12.0 0.09 14 HIKO NE
11.9 0.08 14 HIKO NE21.2 0.07 29 CUARTZITE UTN6.7 0.06 27 SPECTER RANGE NW20.4 0.07 14 REVEILLE PEAK9.3 0.09 18 LOWER PAHRANAGAT6.5 0.16 33 STRIPED HILLS
8.5 0.09 47 AMMNIA TANWS6.5 0.09 26 STRIPED HILLS11.9 0.67 15 PAHROC SPRING NE8.6 0.16 17 SOLDIER PASS12.7 6.48 4 SOLDIER PASS6.3 0.66 7 LATHROP WELLS SW
10.6 0.09 34 SPECTER RANGE SW10.1 0.08 16 LATHROP WELLS SE13.8 0.10 14 MAGRUDER MTN10.1 0.08 22 LATHROP WELLS SE52.5 0.09 6 -QUAD. NOT LISI4.7 0.08 33 STRIPED HILLS
LAKE
rED-0
21.3 0.11 9 REVEILLE PEAK9.8 0.12 23 JACKASS FLATS
23.1 0.08 21 MELLAN31.1 0.10 19 DARWIN8.3 0.09 29 AMMONIA TANKS12.5 0.09 27 LATHROP WELLS SE
8.7 0.07 18 AMMONIA TANKS10.7 6.11 17 SILENT OUTTE4.3 6.09 11 LAST CHANCE RANGE26.e 6.08 8 DELAMAR 3 NW5.2 6.11 22 SCOTTYS JUNCTION SW5.3 0.10 13 SCOTTYS JUNCTION SW
22.6 6.08 26 MELLAN20.5 0.17 12 REVEILLE PEAK0.8 0.04 10 TOPOPAH SPRING NW10.7 0.11 14 CAMP DESERT ROCK9.0 0.11 22 FURNACE CREEK5.1 0.11 17 SCOTTYS JUNCTION SW
13.2 6.11 19 FRENCH-AN LAKE SE4.3 60.9 16 SCOTTYS JLPCTION SW
( (
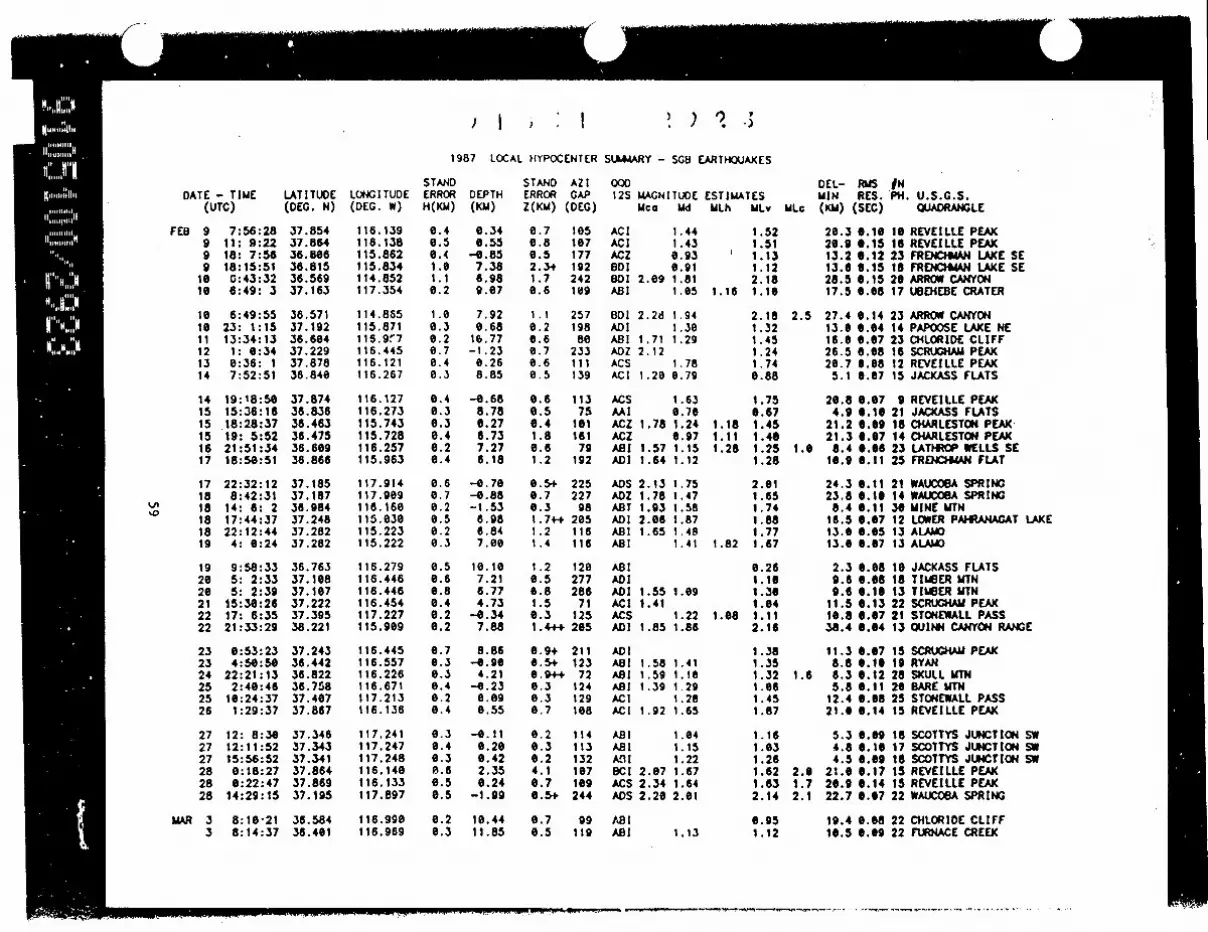
J I ) I ) 7 .)
1987 LOCAL HYPOCENTER SLUAAARY - SC8 EARTHQUAKES
DATE - TIME LATITUDE(UTC) (DEG. N)
FEB 9 7:56:28 37.8549 11: 9:22 37.8649 18: 7:56 36.8869 18:15:51 36.81510 0:43:32 36.56916 6:49: 3 37.163
16 6:49:55 36.57110 23: 1:15 37.19211 13:34:13 36.68412 1: 0:34 37.22913 0:36: 1 37.87814 7:52:51 36.840
14 19:18:58 37.87415 15:36:16 36.83615 18:28:37 36.46315 19: 5:52 36.47516 21:51:34 36.60917 18:50:51 38.866
17 22:32:12 37.18518 8:42:31 37,18718 14: 6: 2 36.98418 17:44:37 37.24818 22:12:44 37.28219 4: 0:24 37.282
19 9:58:33 36.76320 5: 2:33 37.10820 5: 2:39 37.18721 15:30:26 37.22222 17: 6:35 37.39522 21:33:29 38.221
23 0:53:23 37.24323 4:50:56 36.44224 22:21:13 36.82225 2:40:46 36.75825 10:24:37 37.40726 1:29:37 37.867
27 12: 8:30 37.34627 12:11:52 37.34327 15:56:52 37.34128 0:18:27 37.86428 6:22:47 37.86928 14:29:15 37.195
MAR 3 8:18-21 36.5843 8:14:37 36.401
LONGITUDE(DEG. W)
116.139116.138115.862115.834114.852117.354
114.885115.8711 16.9r7116.445116.121116. 267
116.127116.273115.743115.728116.257115.963
117.914117.909116.160115.030115.223115.222
116.279116.446116.446116.454117.227115.909
116.445116.557116.226116.671117.213116.136
117.241117.247117.248116.140116.133117.897
116.990116.969
STANDERRORH(K2)
0.40.50.41.01.10.2
1.00.30.20.70.40.3
0.40.30.36.40.20.4
0.60.70.20.50.2e.3
0.50.60.80.40.26.2
0.76.30.30.40.20.4
6.36.40.30.66.50.5
0.20.3
DEPTH(KU)
0.340.55
-6.857.386.989.07
7.920.68
16.77-1.238.268.85
-0.688.780.276.737.276.18
-e.70-0.88-1.536.986.847.06
10.107.216.774.73
-0.347.88
8.56-6.9e4.21
-8.230.090.55
-0.11e.2e0.422.350.24
-1.99
10.4411.85
STAND AZ2ERROR GAPZ(Ku) (DEG)
0.7 1050.6 1070.5 1772.34 1921.7 2420.6 109
1.! 2570.2 1980.6 se0.7 2330.6 111e.5 139
0.6 1130.5 756.4 1611.8 1610.6 791.2 192
0.5+ 2250.7 2276.3 981.7++ 2051.2 1161.4 116
1.2 1260.5 2776.8 2861.5 710.3 1251.4++- 265
6.9+ 2110.5+ 1230.944 720.3 1240.3 1298.7 108
0.2 1140.3 1130.2 1324.1 1070.7 1096.5+ 244
e.7 990.5 119
OQO12S MAANI!TUDE
Uca Ud
AC! 1.44ACI 1.43ACZ 0.93BDI 6.91001 2.09 1.81ABI 1.05
BDI 2.2d 1.94AD| 1.30ABl 1.71 1.29AOZ 2.12ACS 1.78ACI 1.20 0.79
ACS 1.63MAI 0.70ACZ 1.78 1.24ACZ 6.97ABI 1.57 1.15ADI 1.64 1.12
ADS 2.13 1.75ADZ 1.78 1.47AsT 1.93 1.58ADI 2.06 1.87ABI 1.65 1.48ABI 1.41
ABIADIADI 1.55 1.09AC! 1.41ACS 1.22ADI 1.85 1.86
ADIABI 1.58 1.41ABI 1.59 1.18ABI 1.39 1.29ACI 1.28ACI 1.92 1.65
ABI 1.64ABI 1.15A91 1.22BCl 2.07 1.67ACS 2.34 1.64ADS 2.20 2.01
As IABI 1.13
DEL- RMS INESTIMATES MIN RES. PH. U.S.G.S.ULh ULv MLc (Km) (SEC) QUADRANGLE
1.52 20.3 0.10 10 REVEILLE PEAK1.51 20.9 0.15 16 REVEILLE PEAK1.13 13.2 6.12 23 FRENCHMAN LAKE SE1.12 13.6 3.15 18 FRENCHMAN LAKE SE2.18 28.5 6.15 20 ARROW CANYON
1.16 1.16 17.5 6.68 17 UBEHEBE CRATER
2.18 2.5 27.4 6.14 23 ARROW CANYON1.32 13.6 0.04 14 PAPOOSE LAKE NE1.45 16.6 0.67 23 CHLORIDE CLIFF1.24 26.5 6.68 16 SCRUGHAM PEAK1.74 26.7 6.08 12 REVEILLE PEAK6.88 5.1 0.67 15 JACKASS FLATS
1.75 20.8 0607 9 REVEILLE PEAK6.67 4.9 0.10 21 JACKASS FLATS
1.18 1.45 21.2 0.e9 18 CHARLESTON PEAK1.11 1.40 21.3 6.67 14 CHARLESTON PEAK1.28 1.25 1.0 8.4 0.06 23 LATHROP WELLS SE
1.28 16.9 0.11 25 FRENCH!AN FLAT
2.01 24.3 6.11 21 WAUCOBA SPRING1.65 23.8 6.16 14 WAUCOSA SPRING1.74 8.4 6.11 36 MINE NTN1.88 16.5 6.67 12 LOWER PAHRANAGAT LAKE1.77 13.0 6.65 13 ALAMO
1.82 1.67 13.6 6.07 13 ALAMO
0.26 2.3 6.68 10 JACKASS FLATS1.16 9.6 6.08 18 TISBER MTN1.36 9.6 6.16 13 TIMBER MTN1.64 11.5 0.13 22 SCRUGHAM PEAK
1.68 1.11 10.8 6.67 21 STONEWALL PASS2.16 38.4 6.64 13 QUINN CANYON RANCE
1.38 11.3 6.67 15 SCRUGHAM PEAK1.35 8.8 6.16 19 RYAN1.32 1.6 6.3 6.12 28 SKULL MITN1.06 5.8 6.11 26 BARE MTN1.45 12.4 6.68 25 STONEWALL PASS1.87 21.0 0.14 15 REVEILLE PEAK
1.16 5.3 6.60 18 SCOTTYS JUNCTION SW1.03 4.8 6.10 17 SCOTTYS JUNCTION SW1.26 4.5 0."9 18 SCOTTYS JUNCTION SW1.62 2.0 21.0 0.17 15 REVEILLE PEAK1.63 1.7 20.9 0.14 15 REVEILLE PEAK2.14 2.1 22.7 6.67 22 WAUCOSA SPRING
6.95 19.4 0.68 22 CHLORIDE CLIFF1.12 16.5 0.69 22 FURNACE CREEK
.. . . ; P - , . ,,, , <

) I iD ) I 1 2 .11987 LOCAL HYPOCENTER SUMARY - SC8 EARTHOUAKES
DATE - TIME LATITUDE LONGITUDE(UTC) (DEG. N) (DEG. W)
MAR 344455
566777
a899
1 01 1
1 11 1
O' 1314
1416
16I818181919
212122222223
242425252526
2628
16:10:5118:19:2019:51:2223:26:550:34:300:41:17
2e:23:531:38:132:26:422:38: 2
17:59:5918: 0:59
2:27:5313: 9:1414:58:4921:36:5212:51: 20:23:56
6:25: 10:57: 0
17:34:4522:45:4623:24: 115:23:37
18:33:170:33:261:19:575:45:606:19:48
16:56:34
12:12:3219: 5:3116:49:2017: 7: 917:17:544:20: 8
4: 7:1712:41:121:38:41
11:43:1220:12:4216:57:56
18:36:3821: 4:51
37.86036.73636. 7e236. 60437.16836.604
37. 19437.84036.69437.86636. 48736.471
36.46136.46237. 34636.73636.84137.203
37.19937.15837.86137.e7436.73337.841
37.39736.64537.86737.00737.85736.016
37.87337.27137.15e36.80937.15637.866
37.86936. 79837.20036. 80337.28036.812
37.56037.007
116. 137116.256116.110116.957116.413116. 956
117.897116.502116.293lIA. 130116.304116.328
116.195116.190117.235117.413116.509116. 438
116.438116.272116.132117. 220115. 857116.139
117.630116.383116.135117.156116.135116.084
116.139114.828117.718116.000117.718116.133
116.133117.519116.437115. 995114.818115.981
115. 321116. 210
STANDERRORH(KM)
0.30.30.30.20.20.2
1.11.90.20.40.20.4
0.70.80.4e.7e.30.2
0.20.30.40.30.30.3
0.70.30.40.30.60.6
0.61.08.40.3C.50.5
0.40.60.20.21.20.3
0.30.6
DEPTH(KM)
6. 156.74
10.40
-0 409.35
-1.681e.658.34
-0.766.966.34
4.395.34
-0.161.973.320.50
-e.s 42.610.365.9X2.e7p.35
-1.560.29
-0.547.000.737.47
0 . I e
3.21.-0.04-0.21-e. 4 10.00
0.146.621.590.644.27*6.01
2.382.99
STAND AZIERROR GAPZ(KU) (DEG)
3.6+ 107e.3 1240.7 1090.9 800.1 920.z 81
1.2 2232.4 1730.3 830.7 108e.8 762.24+ 194
3.1 1842.5 1820.3 780.9 1860.5 830.7 66
1.0 760.7+ 1150.5 1071.5 1280.6 1303.6 103
0.5 2140.2 1ll0.6 1081.7+4 880.9 1060.8 237
1.1 109- 2630.4 1860.5 1470.5 186e.8 108
0.7 1e91.1 2060.8+ 450.24+ 189- 2931.C+ 178
1.1 1120.6 129
00012S 1AAGN I TUOE
McC Md
DCI 1.26ABl 1.38 6.78AB1 1.38 6.99ABl 1.94 1.26ABI 2.35ABI 1.80 1.60
BDoS 1.25BCIMAI 0.92ACS 1.91 1.76ACI 1.82 1.39BDI
801601ABI 1.23 1.35ADZ 1.34MI 0.64ACI 2.12 1.78
ACZ 2.02 1.78ABS 1.39 1.15ACI 1.73 1.56ACS 1.15ABI 1.00ECI 1.57 1.43
ADZ 1.16ABI 1.52 1.19ACI 1.66 1.59ACI 1.12ACZ 1.86 1.42ADI 2.08
BCS 1.40CDzADI 1.62ACSADSACI 1.58
ACS 1.75 1.60ADI 1.12ACSADICDI 1.22ACI 0.46
ACI 1.23ABZ
ESTIMATESMLh MLv b
1 .450.516.99
.115 1.392.111.28
1.541.770.67
1.80 2.e01.27 1.47
1.351.390.40
2.29 1.72
1.72 1.451.011.83
1.03 1.150.961.66
0.846.861.791.321.582.15
1.472.501.811.431.511 .73
1.691.351.890.79
2.01 1.441.06
1.300.38
DEL- RUS INMIN RES. PH. U.S.G.S.
JLc (KM) (SEC) QUADRANGLE
20.6 6.64 8 REVEILLE PEAK1.6 0.1 21 STRIPED HILLS
14.0 6."9 23 CAW DESERT ROCK1.9 16.0 0.11 28 CHLORIDE CLIFF
9.4 6.o6 21 SCRUGIHA PEAK15.9 6.09 19 CHLORIDE CLIFF
22.6 0.09 9 WAUCOBA SPRING15.2 6.21 8 STINKING SPRING5.7 6.e6 21 STRIPED HILLS
20.5 6.14 18 REVEILLE PEAK1.5 17.8 6.67 28 ASH MEADOWS
19.3 0.06 13 ASH UEADO S
8.4 0.05 12 AMARGOSA FLAT8.0 6.68 14 AMARGOSA FLAT5.4 6.11 17 SCOTTYS JUNCTION SW7.7 6.13 21 MARBLE CANYON2.4 6.07 15 BARE UTN
10.3 0.07 23 SCRUGHAM PEAK
1.6 10.2 0.05 17 SCRUGHAb PEAK1.1 7.8 0.69 20 AMMONIA TANKS
20.3 0.12 13 REVEILLE PEAK14.0 e6.8 13 BONNIE CLAIRE SW6.0 0.08 26 MERCURY NE
19.7 0.07 9 REVEILLE PEAK
18.3 0.65 7 MAGRDER UTN3.9 0.11 27 LATHROP WELLS NW
20.9 6.12 16 REVEILLE PEAK17.6 6.69 19 BONNIE CLAIRE SW20.3 e.15 10 REVEILLE PEAK13.9 6.09 16 STEWART VALLEY
21.6 0.18 14 REVEILLE PEAK2.6 24.9 e.08 10 GREGERSON BASIN
11.2 6.06 15 LAST CHANCE RANGE14.5 6.69 1e CANE SPRING10.6 e.e8 11 LAST CHANCE RANGE20.7 0.14 12 REVEILLE PEAK
20.9 6.14 17 REVEILLE PEAK1e.2 6.12 16 DRY MTN16.2 0.08 23 SCRUGHAM PEAK15.3 6.05 13 FRENCHAAN FLAT24.9 6.08 8 GREGERSON BASIN14.9 6.16 16 FRENCHMAN FLAT
1.6 13.6 0.06 10 UT IRISH3.8 0.13 14 TIPPIPAH SPRING
( ( (_ ,,, _ .,, _, _ _. .

19 I H C)E, I S A -s E UE
1987 LOCAL HYPOCENTER SUMMARY - SGB EARTHQUAKES
DATE - TIME(UTC)
MAR 30 3:22:1436 19:53:5331 19:57:24
APR 1 1: 1: 71 9:38:151 13:42:38
1 15:46:221 17:42:231 18:29:461 21:43:252 4: 7:332 10: 5: 7
2 12: : 192 14:17:382 23:17:142 23:27:254 7:44:144 20:22:33
5 18: 2:276 4: 1:367 6: 1:257 8:56:547 20:30:138 6:36:49
8 15:12:418 18:22:358 18:23:228 19:48:128 19:40:198 20: 2:38
8 28:12:598 2: 13:558 20:19:468 20:20:128 28:36: 29 8: 2:14
9 2:45:159 14:33:129 18:19:5316 8:49:3316 12:35:2410 22:52:12
11 3: 7: 1
LATITUDE(DEG. N)
36.69337.21437.85837.87536.27837.872
37.16436.57236.86037.89137.15537.433
36.77837.46436. 57637.63436.77836.436
37.43637.e4636.81336.75437.88237.871
37.31436.90836.90836. 90936.91836.909
36.90736.90836.90636 .91036.91036.909
35.95836.95037.86837.1 3937.87036.857
36.623
LSTAND STAND
LONGITUDE ERROR DEPTH ERRORDEG. W) H(KU) (KM) Z(KM) (
116.291 0.2 7.64 e.3117.912 8.6 -1.15 e.6116.124 .6. 2.37 2.2116.126 6.7 -0.42 1.1116.312 6.2 -0.12 0.4116.132 8.6 0.52 1.0
117.353 6.2 7.65 8.74-4116.189 0.3 11.12 0.7116.kgs 6.4 -0.31 8.4116.310 6.2 9.15 0.4117.477 8.9 3.180 -118.123 5.7 -1.82 10.6
116.279 0.8 6.81 1.3118.105 8.6 7.60 3.1116.189 6.2 11.09 0.6116.219 6.3 5.46 6.5116.279 6.2 -4.32 0.2117.005 0.4 10.08 0.8
115.579 6.3 6.12 1. 6*-4115.154 8.6 6.15 0.9115.952 6.4 6.67 0.8115.539 0.3 2.95 1.4116.138 1.7 2.22. -116.134 0.7 5.60. -
117.546 6.4 8.24 8.8117.461 0.3 8.75 6.6117.455 0.3 8.97 0.7117.460 8.4 7.62 0.7+117.467 0.3 7.84 0.4117.462 0.3 8.96 0.6
117.461 e.3 9.75 0.6117.465 6.3 7.93 0.8117.464 0.3 9.19 0.6117.449 6.3 7.90 0.8117.461 0.4 8.91 0.8117.456 0.3 8.70 0.6
117.643 6.4 0.63 8.34-117.462 0.5 6.34 6.7116.132 6.6 -0.49 1.0117.824 6.7 9.23 1.6+116.131 0.5 -0.17 6.8116.730 0.2 0.48 0.3
116.092 0.2 -1.59 0.4
AZIGAPDEC)
70219185110
96l09
1081487862306294
2232f214611072104
102252218151IIl109
85169167168171169
169171171172168166
260161log212109120
111
00012S
AAIADS4DIECSACZBCCI
ACIACIAAIADIDOADDA
ADADDAACIABIAAIAB I
ACIADIADIACZCCACCA
AE4ACIACIACSACSACI
ACIAC IACIACSACIACI
ADIACZ3CIADIACSACZ
ACS
UAGNITUDE ESTIUAAUco Md MLh
1.62 0.931.79 1.84 l¶69
1.701.49
1.52 1.281.38
1.54 1.440.806.61
1.92 1.541.e71.57
0.901.640.80
1.36 1.101.21 0.73
1.311.250.791 .27l .'41.33
1 .16 1.231.99 1.64
1.33
2.25 1.991.72 1.63
2.05 1.641.37
1 .65
1.281.28 1.31
1.471.15
1.48 1.551.40
1.89 1.581.22 0.88
1.42 1.21
1 .70
DEL- RUS *NrES MIN RES. PH. U.S.C.S.ULv ULc (KM) (SEC) QUADRANGLE
1.23 5.7 06.9 32 STRIPED HILLS23.5 6.09 17 WAUCOGA SPRING
2.13 41.6 6.11 17 REVEILLE PEAK1.46 28.8 0.15 11 REVEILLE PEAK1.63 19.8 0.08 17 ASH MEADOWS1.38 21.6 0.15 16 REVEILLE PEAK
1.59 17.4 6.68 23 UBEHEBE CRATER6.76 15.7 6.07 13 SPECTER RANGE SW6.54 1.9 0.08 13 JACKASS FLATS1.77 2.1 9.2 .1 43 BUCKBOARD UESA
20.8 0.e9 6 U8EHEBE CRATER71.6 0.17 16 o.Q UAO. NOT LISTED...
16.1 6.66 7 JACKASS FLATS68.8 6.17 10 .*.QUAD. NOT LISTED...
0.80 15.5 0.67 16 SPECTER RANGE SW1.19 1.6 6.08 20 TIPPIPAH SPRING6.47 4.0 6.os 26 JACKASS FLATS1.17 11.1 6.10 15 EMIGRANT CANYON
1.65 19.8 6.09 l CROON RANGE NE1.36 14.6 6.04 11 LOWER PAHRANACAT LAKE SW0.85 16.6 0.05 14 FRENCUWA FLAT1.63 25.2 6.07 14 TIM SPRING
47.6 0.28 9 REVEILLE PEAK48.2 6.24 16 REVEILLE PEAK
1.16 12.7 6.08 11 MAGRUDER MTN1.90 12.5 6.08 26 TIN MTN1.73 12.3 0.08 17 TIN MTN1.37 12.6 0.08 1S TIN MTN2.59 12.9 0.68 28 TIN MTN1.82 12.6 0.08 24 TIN MTN
1.85 12.4 0.08 21 TIN MTN1.69 12.7 6.07 18 TIN MTN1.78 12.4 0.68 24 TIN MTN1.82 12.3 0.04 9 TIN MTN1.60 12.6 6.09 14 TIN MTN1.63 12.5 0.08 19 TIN ITN
1.75 15.9 6.62 10 MANLY PEAK1.41 11.6 6.10 12 TIN UTN1.72 1.7 20.7 6.18 11 REVEILLE PEAK1.59 18.8 6.11 14 WAUCOBA SPRING1.81 20.7 6.13 12 REVEILLE PEAK6.47 11.4 6.67 16 BARE MTN
1.26 12.4 0.08 19 SPECTER RANGE SE0.96 12.7 8.o9 17 SPECTER RANGE SE
1.88
1.861 .66
1.0211 3:12:58 36.621 116.095 0.3 -e.77 8.5 110 ACl 0.88
I

DATE - TIME(UTC)
APR 11 19:30:5913 12: 0:5914 15:20:1715 18:33:2215 19:56:1216 2: 5:45
16 5:50:4218 1:48:4718 4: 1:4318 23:25:1819 0:13:5519 5:55:54
20 11:24:3420 12:47:2220 18: 7:2220 18:21:2121 5:21: 521 12:23:41
21 13:18:4023 0: 6:1823 4:44:48
~ 23 4:46: 723 9: 4:1223 10:15:22
23 18:50:5624 1:33:4324 2:37:2324 10: 5:5926 7:29:5826 15:29:31
26 16:45:4527 5:20:4227 6:37:3127 7:34:2129 11:54:1829 12:49:42
29 14:39: 030 13:49:38
MAY 1 2: 6:311 13:14: 92 6:54:472 9:32: 2
3 3:12: 13 3:16: 4
LATITUDE LONGITUDE(DEC. N) (DEG. W)
36.95336.56136.28937.46637.46337.861
37.38537.86937.87037.24937.51937.121
36.58937.25637.43237.43236.58637.686
37.00437.86937.86337.00937.00737.870
37.86337.86137.29036.72237.86136.645
37.29637.55137.87337.20436.82336.751
36.69936.75737.25937.31437.41237.379
37.85837.863
117. 454116.252116.986117.255117.260116.134
114.967116.130116.131116.511115.631117.871
116.243116.516115.239115. 237116.251115.157
117.577116.133116.138117.564117.576116.131
116.138116.136117.297116.139116.134116.323
115. 432117.463116.129117.919116.302115.537
116.215117.284116.388114.858115.670115.329
116.137116.136
1987
STANDERROR DiH(KM) (
0.5 10.3 -e
0.30.50.4 -e0.6 e
0.4 ee.4 e0.2 e0.4 -4- I5.5 I
e.2 -40.2 -.0.50.4 I0.2 20.3
0. 68.2 I0.6 f0.40.58.2
0.2 40.4 I0.5 -40.3 -40.30.6
0.4 10.30.5 -0.6 -0.30.2
0.67.3 30.60.60.50.2
0.60.4
I '); ILOCAL HYPOCENTER
lPTH(U)
.541.05
1.171 .39-. 331.70
1.621.47e.20*.55.1.225.71
1.901.987.98B.42D.671.94
2.701.210.712.994.441.23
D.97D. 3.-. 283.07D.072.94
D.79D.91D.121.484.332.65
7.601.909.902.53e.956.58
5.290.78
STAND AZIERROR GAPZ(KU) (DEG)
2.91 1580.3 1850.5 1s51.9 1460.6 1320.6 188
0.5 1790.7 1090.4 109- 63- 253
2.9 260
0.4 810.3 472.8+ 862.0 1100.5 1690.5 102
2.8 1820.3 1091.0 1072.8 1786.5 1810.9 109
0.3 1070.6 1070.4 81e.5 1230.5 1070.3 131
0.5 910.5 1240.9 110e.6 2250.7 902.1 95
0.5 2282.4 2398.6 2122.0 2230.8 1072.6 100
6.8 1060.7 + 167
SIU6MARY - Scs EARTHOUAKES
12S MAGNITUDE ESTIMATESUco Md ULh ULv
8CI 1.51 1.44 1.66 1.74ADZ 0.7.ACI 1.73 1.58 1.54ACI 1.25 1.00 1.04ACZ 1.04 1.1ADI 1.89 1.53 1.6~
ACT 1.09 1.11ACI 1.88 1.55 1.61ACI 1.77 1.75 I.8CCA 2.21ADA 2.13DDA 1.84
5
ACd 1.91ACZ 2.27D3CI 2.37BIB I
ACIACI 1.34
DO IACI 2.12ACI 1.53oCI 1.99CDIACS 1.91
AClACI 2.eeMIACIACI 1.84ADBI
ACIACIECI 1.56ADS 1.87MIBDCI 1.86
ADIODAADSADS 1.76ACZ 1.22DCI 1.73
CCIACI 1.88
! ) . ) '
2.23
1.500.961.21
: .392.181.341.801.311.69
1.821.25
1 .630.72
1.902.262.40
1.62 1.431 .08
1.71 1.38
1.52 1.482.22 2.88
1.632.101.381.84
1.442.031.110.561.940.66
1.291.32 1.05
1.632.030.571.74
1.14
1.68 0.831.93 2.01
1.661.87 1.74
1.781.71
DEL- RMS INMIN RES. PH. U.S.G.S.
ILc (KU) (SEC) OUADRANGLE
1e.9 0.14 17 TIN MTN12.2 0.06 16 LATHROP WELLS SE9.8 0.10 20 FURNACE CREEK18.3 0.13 14 MOUNT JACKSON18.0 0.10 12 MOUNT JACKSON28.5 0.13 15 REVEILLE PEAK
7.8 0.07 9 DELAJAR NW1.8 20.7 0.11 13 REVEILLE PEAK
2e.8 0.09 26 REVEILLE PEAK12.3 0.17 24 THIRSTY CANYON NE97.9 0.01 4 TEVPIUTE UTN77.4 0.17 7 WAUCOBA SPRING
10.7 8.89 28 SPECTER RANGE SW11.7 0.08 30 TRAIL RIDGE16.9 R.18 13 ASH SPRINGS16.7 0.11 11 ASH SPRINGS18.3 0.07 20 LATHROP WELLS SE10.8 0.08 12 FOSSIL PEAK
20.6 0.12 14 LAST CHANCE RANGE2.5 20.9 0.08 29 REVEILLE PEAK
20.9 0.14 11 REVEILLE PEAK19.4 0.11 21 LAST CHANCE RA1WE
1.5 20.4 0.11 13 LAST CHANCE RANGE20.8 0.67 18 REVEILLE PEAK
28.9 0.02 7 REVEILLE PEAK28.6 8.13 20 REVEILLE PEAK3.7 0.10 It GOLD POINT
12.2 0.09 15 SPECTER RANGE NW20.4 0.11 20 REVEILLE PEAK1.5 0.07 14 STRIPED HILLS
1.7 25.9 0.08 12 CUTLER RESERVOIR12.7 0.07 11 UONTEZtJUA PEAK SW20.9 0.15 15 REVEILLE PEAK24.4 0.08 17 WAUCOBA SPRING4.7 8.89 16 JACKASS FLATS
25.3 0.08 19 TIU SPRING
7.0 8.03 6 SPECTER RANGE NW33.4 0.22 6 TIN MTN7.6 0.07 13 SILENT BUTTE19.9 0.06 10 GREGERSON BASIN12.6 0.11 14 BALD MTN
2.5 24.8 0.07 16 HANCOCK SUMMIT
20.5 0.12 8 REVEILLE PEAK20.7 0.12 14 REVEILLE PEAK
1.371.850.521.28
1.411.211.671.361.58
1.601.74
( I. _ (

1 I I A I ) '> 7
1987 LOCAL HYPOCENTER SULSAARY - SG8 EARTHQUAKES
DATE - TIME LATITUDE LONGITUDE(UTC) (DEG. N) (DEG. W)
MAYr 3445S7
78a8a8
999
leI111 1
1 11 2
h 1 4w 15
151 6
17171 8181920
202121212223
242526262626
2727
3:16:3421:43: 922:39: 3210:36:1221:16:305: 8:29
20:31:4011: 0:3211:19: 213:11: 015:36:4518: 5:54
10:58: 31I: 4:2722:18:547:17:27
13: 1:1913:56:37
19:18: 328:28: 52:39: 77:53: 1
18:16:1912: 3:44
7:37: 013:16:177:57:397:57:39
19:41:595:33:45
15:53:2312:40:2112:40:4423:15:532e: 2:555:14:15
19:52:5922: 8:51
7: 2:307:14:567:39:438:30:14
0:55:1323: 2:16
37.85337.85337. 86536.70036.54037. 002
37. 35837.04236.70636.62437.10237.455
37.25337.23936.98037.38437.86337.001
37.85636.37337.27037.24337.31737.133
37.22637.27737.11137.11536. 78137.111
37.24537.39735.98037.68637. 33737.517
36.77437.37736.95536.95636. 95736.956
37.85537.398
116.137116.146116.133116.274117.057116.201
117.283116.139116.564116.268116.269115 425
115.011115.003116.159117.132116.131116.197
116.129117.488117.865114.972116.290116.261
116.949116.113117.238117.24315.0e93117.231
117.492117.299117.286116.662115.174114.583
116.166117.140117.522117.521117.519117.518
116.136115.061
STANDERRORH(KU)
0.21.00.40.20.30.7
8.40.20.2e.20.20.2
0.61.70.20.20.40.2
0.50.80.60.70.90.4
0.20.4e.30.71.20.2
0.20.l1.70.20.10.9
0.28.50.30.40.§0.4
0.50.5
DEPTH(Ku)
1.907.e90.660.96
11.135.06
2.380.017.545.073.586.e0
4.733.16.
-1.200.431.342.99
0.561.627.038.942.67.7.39
11.76-1.398.11
10.785.767.40
-0.06-0.07
2.709.427.774.55
5.524.685.566.284.455.12
0.432.48
STAND AZI ODERROR CAPZ(Ku) (DEG)
0.7 1054,5+ff1180.5 1080.4 650.6++ 1190.8 203
0.8 1620.3 1160.6 1400.5 1461.1 1041.7+ 100
3.1 197- 2370.2 92e.3 821.6 1080.4+ 85
0.8 1063.1 2401.8 2061.8 164- 2041.0 253
0.7itj 1390.7 1081.5 1241.2 1461.6 2950.9 75
0.4 1100.2 1144.9 2612.4t+1 1280.5 1293.6+1-281
0.4 1442.3 1331.8 1922.0 1783.2 1772.3 177
0.8 1066.4 153
12S
ACI8CIACIAAIA8SADS
ACIAIZACIACIA81ACI
801CDIA81ACZACSAAI
ACI8DIADIACACDSADS
ACIACSACIACAEDzACT
ACZACI80S8CIABI80I
ACI8CIADIACIarI8CI
ACSACI
MAGNITUDEUco Md
1.28
1.381.63 1.16
.051.23
1.14 0.761.11
1.35 1.191.03 0.96
1.68 1.771.60
1.43 1.001.28
1.80 1.581.12
1.78 1.58
1.52 1.341.68
1.71 1.341.17 1.31
2.56
0.97
1.180.92
1.60 1.351.291.16
2.34 2.00
1.141.121.131.171.161.11
1.411.69 1.80
DEL- RUSESTIMATES MIN RES.ILh MLv MLc (KU) (SEC)
1.41 20.2 0.041.49 20.8 0.061.43 20.6 0.09
2.42 1.29 4.7 0.0921.2 0.05
0.55 4.6 0.09
0.90 1.16 1.2 6.8 0.070.63 8.1 0.060.75 11.2 0.070.76 6.9 0.06e.82 8.0 0.051.32 26.0 0.05
1.64 2.10 17.4 0.131.59 46.3 0.190.73 8.2 0.07
1.03 1.30 14.4 0.091.74 20.4 0.120.51 5.0 0.06
1.74 19.8 0.141.20 35.7 0.081.48 17.6 0.10
19.5 0.121.62 32.4 0.07
11.0 0.93
1.47 1.8 21.7 0.090.93 12.1 0.10
21.2 0.0620.7 0.11
0.84 10.6 0.040.71 0.83 16.1 0.07
1.12 0.93 13.8 0.091.11 0.96 11.3 0.05
1.49. 37.8 0.111.58 43.8 0.061.42 13.4 0.022.63 2.3 16.9 0.08
0.53 8.9 0.050.93 1.19 13.4 0.13
1.55 16.4 0.051.29 16.3 0.091.39 16.0 0.091.29 16.0 e.08
1.6C 20.2 0.141.81 1.84 1.3 0.10
JNPH. U.S.G.S.
QUADRANGLE
6 REVEILLE PEAK6 REVEILLE PEAK
11 REVEILLE PEAK27 STRIPED HILLS11 STOVEPIPE WELLS11 TIPPIPAH SPRING
15 GOLD POINT22 TIPPIPAH SPRING21 BIC DUNE18 LATHROP WELLS SE16 BUCKBOARD MESA12 CRESCENT RESERVOIR
15 ALAMO SE10 LOWER PAHRANAGAT LAKe17 MINE MTN23 STONEWALL PASS14 REVEILLE PEAK1S TIPPIPAH SPRING
14 REVEILLE PEAK14 PANAMINT BUTTE14 SOLDIER PASS13 DELAUAR 3 NW13 DEAD HORSE FLAT8 AIMONIA TANKS
29 SPRINGDALE11 OAK SPRING BUTTE12 BONNIE CLAIRE SW10 BONNIE CLAIRE SW6 CANE SPRING
19 BONNIE CLAIRE SW
16 UBEHEBE CRATER20 UXNT JACKSON11 TRONA18 MELLAN9 ALAMO
11 CALIENTE
14 SKULL MTN21 STONEWALL PASS
9 DRY MTN11 DRY MTN14 DRY UTN14 DRY UTN
13 REVEILLE PEAK12 ALAMO NE
--- I- T"Imm-1w---

ml(
i 1 , ; I . ) ') 1.1987 LOCAL HYPOCENTER SUL&ARY - SG8 EARTHOUAKES
DATE - TIME(UTC)
uAY 27 23:58:3628 7:50:2328 8:29:3729 4: 9:1529 9:34:1429 10: 3:34
30 6:15:4130 22:32:20
JUN I 11: 3:351 13:11:423 4: 4:584 17: 7:16
5 13:45:186 20:50:227 5: 1:527 15:52:247 18:25: 47 22:13:55
8 11:18:589 4:17:31
1 e 7:27: 110 23: 5:5211 2:53: 911 5:41:59
11 5:58: 011 5:50:1511 7:10:3311 7:37:1211 7:45:4111 10:55:17
11 11:42:2811 14:24:3511 23:12:4611 23:58:3111 23:58:3412 0: 1: 2
12 0:35:3212 7:27:5712 7:28:4412 8: 4: 412 8:20:2012 12:56:58
13 5:12:1614 8:15:52
LATITUDE(DEG. N)
36.60736.78136.78537.85636.63436.634
36.43637.22736.89437.32837.33637.380
37.38337.23837.26437.37737.87337.582
37.38937.37237.37837.26537.26936.828
37.38037.37237.38537.38937.38637. 282
37.03036.85937.39237.38937.38537.380
37.39037.38037.37937.11737.86437.370
37.10336.136
LSTAND STAND AZI
.ONGITUDE ERROR DEPTH ERROR GAPDEG. W) H(KU) (Ku) Z(KU) (DEC)
116.269 0.4 7.56 0.7 163116.129 0.3 9.62 0.7 87116.124 0.2 8.62 0.9 89116.138 0.5 0.52 0.9 106116.320 0.4 2.34 0.3 167116.321 0.2 1.90 0.4 63
117.075 0.6 13.42 0.9 147116.620 0.1 9.76 0.3 68116.466 0.2 4.94 0.3 151114.874 0.8 9.23 0.9 216115.16 0.2 6.e5 1.6 128117.139 0.2 -0.10 0.3 134
117.142 o.l 0.25 0.2 134114.914 0.5 7.20 2.24* 174115.137 0.4 0.03 0.6t 160117.140 8.4 -0.51 0.4 197116.126 0.5 0.00 0.9 110116.377 0,2 1.73 0.9t 89
117.134 0.2 0.28 0.3 131117.146 0.3 -1.17 0.4 178117.141 0.2 -0.47 0.4 133118.387 1.2 8.42 1.7 217116.387 0.7 8.36 1.0 221117.461 0.6 9.04 0.5 188
117.141 0.4 -0.65 0.5 1s8117.142 0.5 -0.84 0.5 201117.136 0.1 0.65 0.2 82117.141 0.2 0.63 0.2 131117.136 0.1 0.58 0.2 83117.535 0.4 7.61 0.7 82
116.731 0.2 0.42 0.4 73116.739 0.3 3.93 4.3 108115.01e 0.2 0.45 0.1 219117.138 0.2 0.9e 0.4 131117.135 0.2 0.24 0.3 83117.143 0.3 -1.21 0.5 133
117.141 0.3 2.08 0.6++ 206117.143 0.2 -0.69 0.3 133117.143 0.2 -0.65 0.3 133116.587 0.2 11.16 0.6t0 79116.134 0.7 -e.39 1.2 108114.997 Q.3 -0.66 e.2 176
116.245 0.1 7.15 0.3 104116.608 2.0 7.00. - 246
OOD12S UAGNI
mca
ACI 0.98AA[ABI 1.31ACE 1.68ACIAAl 1.50
BCE 11.46AAI 1.60ACZ 0.74ADS 1.63ACIACZ
ACIBC1 2.41ACE 1.76ADIBCS 1.80AC! 1.91
ACE 1.28ACIACIBDI 1.79ADI 1.41AD!
ADIADSACIACZACI 1.51ABI
ACIBC!ADI 1.40ACEACZ 1.88ACZ
ADIACZACZAB! 1.54ALEACE 1.47
ABIDOA
ITUDE ESTIMATESUd ULh MLv ULc
0.45 0.85 0.781.08 1.051.06 1.07 1.31.53 1.630.68 0.52 1.31.17 1.14 1.15
1.15 1.521.26 1.340.70 0.071.58 1.511.33 1.251.17 0.83 U.94
1.18 1.12 1.102.30 2.141.81 2.12 1.831.07 0.90 1.001.83 1.961.80 1.52 1.95 1.7
1.21 1.24 1.071.01 0.86
1.16 0.97 0.792.19 1.36
1.22 1.21 0.950.97 1.29
1.04 0.98 0.940.97 0.71 0.861.32 1.Z9 1.160.89 1.01 0.951.35 1.341.06 1.04 1.4
1.36 0.851.02 0.67
1.21
1.96 1.861.13 1 .08
1.01 0.881.00 1.07
1.12 1.02 1.051.12 1.101.38 1.42
1.31
1.22 0I. 932.38
DEL- RUS INMIN RES. PH. U.S.G.S.(KU) (SEC) OUADRANGLE
7.7 0.06 14 LATHROP WELLS SE8.9 0.09 25 SKULL UTN8.7 0.09 25 CANE SPRING20.4 0.11 12 REVEILLE PEAK2.1 0.68 20 STRIPED HILLS2.1 e.09 31 STRIPED HILLS
9.7 0.15 23 EMIGRANT CANYON7.4 0.06 29 THIRSTY CANYON NE1.2 0.04 14 TOPOPAH SPRING NW
17.9 0.07 8 GREGERSON BASIN13.6 0.05 10 ALAUO13.8 0.05 14 STONEWALL PASS
13.7 0.06 20 STONEWALL PASS22.3 0.04 It DELAUAR .3 NW11.5 0.06 11 ALAMO13.5 0.07 I5 STONEWALL PASS20.7 0.19 18 REVEILLE PEAK17.7 0.08 25 OUARTZITE MTN
14.7 0.07 16 STONEWALL PASS12.7 0.06 13 SCOTTYS JUNCTION SW13.4 0.06 16 STONEWALL PASS7.9 0.05 10 SILENT BUTTE8.3 0.07 15 SILENT BUTTE5.6 0.10 18 TIN MTN
13.5 0.07 12 STONEWALL PASS12.9 0.07 9 SCOTTYS JUNCTION SW14.2 0.06 24 STONEWALL PASS14.2 0.04 13 STONEWALL PASS14.4 0.06 26 STONEWALL PASS7.8 0.10 16 MAGRUDER MTN
13.0 0.09 24 THIRSTY CANYON SW12.2 0.10 18 BARE MTN4.0 0.01 7 ALAMO NE14.5 0.05 16 STONEWALL PASS14.3 0.08 23 STONEWALL PASS13.4 0.07 14 STONEWALL PASS
14.3 0.05 13 STONEWALL PASS13.5 0.06 16 STONEWALL PASS13.3 0.07 21 STONEWALL PASS12.7 0.08 26 THIRSTY CANYOS SE20.6 0.12 10 REVEILLE PEAK6.2 0.07 11 DELAMAR LAKE
7.4 0.04 22 TIPPIPAH SPRING47.4 0.08 5 FUNERAL PEAK
/

) I !~ ; I *. ) I .)
1987 LOCAL HYPOCENTER SULAARY - SGO EARTHQUAKES
DATE - TIME LATITUDE(UTC) (DEG. N)
JUN 15 13: 6: 4 36.28315 13:21: 8 37.86816 7:26:40 35.86516 13:16:26 37.86516 15:40:11 37.32216 22:47:57 37.235
16 22:55:34 37.23416 23: 1:46 37.23417 8: 0:51 37.e9717 1:45:38 37.86119 17:38: 4 37.20421 17:1a:16 37.263
21 17:14:37 37.26e22 22:10:75 37.86223 6:l1:49 36.58623 22:22:45 35.67524 4:25:13 36.57924 7:55:54 36.648
24 14:27:59 36.82524 16:40:42 36.57825 6: 1:59 36.795
V 25 13:58:16 37.68825 16:43:32 37.15526 15:37:56 36.778
26 23:57: 2 37.26227 1:41:52 37.37928 0:58: 2 37.71328 4:47:18 37.35229 14:38:53 37.26830 16: 5: 0 36.995
JUL 1 19:23:20 37.4352 0:32:47 37.8483 7:18:14 38.3693 14:48:38 37.6863 14:48:59 36.9074 4:35:51 36.815
5 11:24:47 37.3705 16:43:40 37.1935 16:58: 0 37.5185 23: 3:12 37.1966 17:23i35 36.8126 22:42:51 37.173
3 23:17:52 37.3866 23:31:38 36.824
LCNGI TUOE(DEG. W)
116.761116.141116.728116.134114.863114.912
114.9ed114.913115.274116.136117.610115.513
115.506116.135116.235116.564116.251116.289
117. 595116.256115.954115.089115.533117.715
115.513117.140115.853116.356117.592116. 054
115.233115.759115.775115.094117.478115.986
117.224114.826115.737117. 415115.828116.448
117. 130115. 757
STANDERRORH(KU)
0.70.90.31.10.3
e.30.70.3e.45.4I.e
0.68.40.21.50.20.3
0.40.30.30 .18.20.9
0.20.30.30.28.48.5
e.2e .11.28.40.30.5
0.2e. 80.60.20.30.5
0.20.5
DEPTH(KU)
7.80.e3.13.4.631.345.55
10.40
4.956.127.93e.862.46-
16.24
14.84-0.49-2.8312.02-1.82
2.34
-1.32-1.61-0.230.9s
-0.225.69
0.73-80.14
6.348.422.69
-8. 34
5.718.48
-8.451.46
11.118.51
-e0.64-0.415.756.24
-1.257.53
0.578.44
STAND AZI 000ERROR CAP 125Z(KM) (DEG)
UAGNITUDE ESTIMATESuca Md MLh MLv
- 142 BOA 2.18- 108 CCA 1.443.3 249 BDI 1.331.3t 108 ACS 1.98 1.96 1.926.4 223 CDI 1.721.2 175 AC! 2.61
2.4 213 80! 2.43 1.973.2+ 213 8DI 2.07 2.161.8 127 ABI 2.56 2.32 4.188.6 1e7 ACS 1.8e 1.64-- 302 DOI 1.503.2 152 BCI 1.63
2.8 62 BCI 2.138.7 187 ACS 1.91 1.710.3 133 ACZ 1.39 1.09e.5 269 0DI 2.69 2.98e.5 173 ACZ 1.29 1.280.81j-122 AB[ 1.32
1.0 192 ADS 2.27 2.23 2.128.5 176 ACZ 1.37 1.848.4 162 ACI 1.39 1.190.2 182 ACI 1.62 1.51 1.870.3 119 ACZ 1.55 1.38 1.583.8 236 801
0.3 93 ACS 1.86 1.53 1.980.3 180 ADI 1.19 1.051.1 118 ABI 1.10e.3 1e7 ACZ 8.98e.8+ 79 ABl0.8 123 ABA 3.16
1.1 156 ACI 8.93 1.478.3 99 ACS 2.12 1.911.1 236 8DI 2.691.2 18e ACS 1.35 1.178.5 176 AC! 1.86 1.77 2.050.9 197 ADI 0.67
0.2 138 AC[ 1.380.8 228 ADS2.0 146 ACS 2.00 1.761.0 136 ACS 1.08 0.980.9 127 ACS 2.16 2.04 2.151.6 128 ADI 1.38
8.3t 83 ACS 0.95 0.99 8.94e.81+ 264 ADI( , \
1.352.261.582.80
2.601.952.791.721.e7
1.851.22
1.04
2.541.131.421.441.301.17
1.631.061.12I.030.97
DEL- RuS INMIN RES. PH. U.S.C.S.
ULc (KM) (SEC) OUADRANGLE
15.6 0.24 4 FURNACE CREEK48.1 0.18 14 REVEILLE PEAK17.2 0.09 11 CONFIDENCE HILLS
2.3 20.7 0.13 24 REVEILLE PEAK19.1 8.06 7 CRECERSON BASIN22.7 0.05 13 DELAWAR 3 NW
23.0 0.04 11 DELAUAR 3 NW22.8 0.06 10 DELAUAR 3 NW11.1 0.11 24 DESERT HILLS SE20.6 0.11 12 REVEILLE PEAK32.6 0.12 11 LAST CHANCE RANCE3a.8 0.10 8 CROOM RANCE SE
30.1 0.09 It GROOM RANCE SE20.6 0.13 14 REVEILLE PEAK11.4 0.06 19 SPECTER RANGE SW42.3 8.13 30 LEACH LAKE10.8 0.07 17 LATHROP WELLS SE4.5 0.08 18 STRIPED HILLS
17.1 8.e9 32 DRY MTN16.6 0.86 12 LATHROP WELLS SE14.9 0.08 22 FRENCHUAN FLAT14.0 8.83 12 HIKO NE
1.9 29.1 0.08 17 FALLOUT HILLS NE27.8 0.07 11 DRY UTN
24.3 0.09 22 GROON RANCE SE13.5 0.84 12 STONEWALL PASS
1.7 12.3 0.07 12 HIKO NE25.2 a.07 16 DEAD NORSE FLAT
1.2 6.2 0.18 15 MAGRUDER LTN6.9 0.09 15 YUCCA LAKE
16.4 0.04 9 ASH SPRINGS19.1 8.05 17
2.7 45.9 8.11 12 THE WALL SE14.3 0.05 9 HIKO NE
1.8 13.0 0.09 28 TIN LTN14.4 0.09 15 FRENCHUAN FLAT
8.2 0.07 20 SCOTTYS JUNCTION SW31.0 0.07 10 DELAMAR 3 NE
2.3 12.3 0.07 11 TEMPIUTE UTN18.2 0.04 11 ULIEMEBE CRATER13.1 0.10 24 FRENCHMAN LAKE SE12.0 0.09 15 SCRUGHAM PEAK
14.7 0.08 16 STONEWALL PASS15.2 6.05 13 FRENCHfAN LAKE SE
1 .232.282.501.332.091.06
1.361.381.81I.8l2.030.83
1.060.93
( (

) I j I1987 LOCAL HYPOCENTER
' ) ;3 )SLU&ARY - SOB CARTHQUAKES
DATE - TIME(UTC)
JUL 7 6: 0:467 19:24: 37 19:53:377 21:2q: 98 3:28:598 3:51:41
8 11:50:558 18:41:508 18:42:228 20:57:468 28:58:268 21:43:55
9 20: 10: 399 21:31:48
11 2- 2: 111 14: 9:3312 10:14:2212 15:53:12
12 16:26:3813 8:52:5913 9:39:48
0' 13 14:13:54~' 13 28:10:15
13 2e:18:15
13 21:22:2e14 18:56:1714 13:13: 1 114 19:21:3214 20:31:2715 1 :5s:4e
16 13:59:2118 7: 4:5s18 12:31: e18 17:20:5(19 18:51:3128 8: 3:11
28 19:48:521 7: 8:5421 7: 9:4421 17:27:22 12:18:3.23 1:38:3.
23 1:32:423 6:27:2
LATITUDE LONGITUDE(DEG. N) (DEG. W)
36.73336.8 1136.80537.99136.81238.253
37.23937.86637.06437.07837.06437.236
38.37636.91337.39136.92237.18836.971
36.99137.38537.38737.12237.38737.382
37.38537.16637.38337.08037.06937.867
36.40637.38637.61537.38636.60637.863
37.23837.38437.21537.22136.95836.971
36.98437.262
116.043115.816115.795116.955115.787116.702
114.916116.152116.152116.167116.158114.908
115.777117.453117.156117.798117. 400117.981
117.959117.129117.132117.424117.133117.135
117.132116.453117.136115.748115,743116.135
I 7.806117.132117.663
17.1730116.355116.129
114.813117.133117.600117.878117.553117.908
117.877117.688
STANDERRORH(KU)
8.10.51.30.30.72.2
8.60.28.30.48.28.3
0.90.30.41.10.11.2
1.40.20.30.48.28.2
e.3e.18.18.38.28.6
0.50.2e.30.28.28.4
e.68.28.40.70.68.5
8.68.2
DEPTH(KU)
4.744.458.595.958.025.87
8.517.717.108.358.62e.64
STANDERRORZ(KM)
0.72.81.94.6i-2.05.0
0.60.70.8e.78.68.4
Ac(I
I 8.18 0.51.27 1.72.45 4.8-0.03 8.22.74 4.1
-1.44 1.48.68 8.38.41 8.46.38 1.7e.36 8.4-0.07 0.2
0.07 8.5-0.76 8.20.13 8.1
10.39 I.211.7e 1.4
-8.45 1.8
9.38 0.60.29 8.4
-e.82 8.50.20 8.37.22 1.5
-0.18 0.7
e. 13 0.5-0.36 0.3
4.66 0.74.40 4.448.54 1.95.57 5.1
6.84 4. 4-1.14 e.2
AZIGAPDEG)
139105257172188229
231119I11149111175
237164134240
248
2438383
14983
158
8361158123III108
17783
1178399
188
248136178244182258
257179
ACI 1.37 1.28BCI 1.57 1.29BDS 1.18BCI 1.70 1.718DI 2.07 1.958DS
ADS 1.35ABIABI 1.20 1.30ACIAS!ACI 1.74
CDI 2.06 2.12AC!
ACS8DS 1.14ACS 1.16 1.288D1 2.24 2.14
BDS 1.29ACI 1.29 1.38ACS 1.24ACT 1.16 1.23AC! 2.25 2.14ACS 1.36
ACI 1.1IACS 1.85 2.00ACSACI 1.66 1.39ACT 1.69 1.37ACS 1.52
AC IACI 1.57 1.53ACS 1.43ACS 1.84 1.67ACT 1.39 1.36ACI 1.92 1.74
ADS 1.97 1.78ACS 1.69 1.67ACS8D1 1.41ADI 1.26CDI 2.08 1.86
8D1 1.80 1.C7ACS 1.32
0.981.521.001.83
1.83 2.001.68
1.65 1.201.011.140.761.021.71
2.220.97
0.83 1.171.26 1.310.70 1.002.41 2.39
1.571.32 1.411.07 1.121.05 0.89
2.461.00 1.10
.11 1.031.88
0.93 8.881.48 1.381.53 1.68
1.37
8.931 .541.531.890.841.78
1.98 1.961.790.881.311.422.38
1.98 1.751.26 1.19
OOD12S MAGNITUDE ESTIMATES
uco Ud ULh ULv ULc
DU- RUS INUIN RES. PH. U.S.G.S.(KM) (SEC) OUADRANGLE
10.9 0.05 22 CAMP DESERT ROCK13.8 0.15 25 FRENCHMAN LAKE SE12.4 0.14 16 FRDECUMAN LAKE SE42.2 0.09 20 CACTUS PEAK13.2 0.13 24 FRENCHUAN LAKE SE63.3 0.18 6 GEORGES CANYON RIU
22.1 0.07 1l DELAMAR 3 NW7.6 0.06 13 TIPPIPAH SPRING7.5 0.09 19 TIPPIPAH SPRING7.2 0.06 12 TIPPIPAt SPRING7.6 0.06 18 TIPPIPAH SPRING
22.8 0.05 11 DELAMAR 3 NW
7 46.7 0.11 11 **.OUAD. NOT LISTED912.7 0.06 12 TIN MTN13.5 0.88 12 STONEWALL PASS37.0 0.13 12 WAUICOBA WASH17.8 8.04 19 L8EHEBE CRATER41.6 0.14 28 WAUCOBA WASHI
38.6 8.89 18 WAUUC08A WASH14.7 e.06 21 STONEWALL PASS14.7 0.88 14 STONEWALL PASS15.3 0.10 13 LtEHEBE CRATER14.7 6.08 27 STONEWALL PASS14.1 0.05 15 STONEWALL PASS
14.6 0.09 15 STONEWALL PASS12.6 0.e8 38 SCRUGHAM PEAK14.1 0.63 14 STONEWALL PASS27.3 0.08 21 FALLOUT HILLS SW28.3 6.08 22 FALLOUT HILLS SW20.9 6.13 11 REVEILLE PEAK
8.2 0.05 14 EMIGRANT CANYON14.6 0.08 19 STONEWALL PASS16.7 6.89 11 LIDA WASH
.9 14.7 8.08 22 STONEWALL PASS
.4 16.9 8.07 18 LATHROP WELLS SE20.2 0.13 15 REVEILLE PEAK
28.2 0.06 9 DELAMAR 3 NE14.4 6.06 19 STONEWALL PASS4.5 0.05 8 LAST CHANCE RANGE
.7 20.6 0.09 11 WAUCOBA SPRING19.2 0.12 14 DRY MTN37.2 0.07 22 WAUCOBA WASH
34.4 0.12 22 WAUCO8A WASH4.9 0.05 16 MAGRUDER UTN

, I ; ) ! I ) :. I
1987 LOCAL HYPOCENTER SULUARY - 58 EARTHQUAKES
DATE - TIUE LATITUDE(U1^) (DEG. N)
JUL 24 3:38:15 37.09624 10:21:20 37.09925 1:25:27 37.16925 1:37:16 37.16825 2:41:48 37.26925 2:57: 6 37.320
25 7:58: 6 37.62e26 6:47:45 37.24727 10: 3:29 37.41827 17: 0: 7 38.73628 16:44:55 36.49729 5:22:30 38.131
29 6:25:15 37.40529 21::9:5e 37.4e230 4:27:27 37.5083e 5:39:37 37.40531 0:54:35 37.21131 3:45:30 37.216
31 4: 6:19 37.28131 4:29: 0 36.65731 4:57: 2 36.670
o 31 11:20:33 37.39331 11:24:45 37.40031 16: 8:23 37.205
AUG 1 4:25:28 37.3851 7:36:37 37.4031 8:58: 0 37.1891 19:34: 8 36.6681 21:28:17 37.6102 5:41:57 37.403
2 6:56:22 37.3852 20:11:41 37.4e63 4: 1:18 37.4063 le:27:59 37.4044 4:21:53 37.3914 11:50: 1 37.198
4 13:16:53 37.3985 14:33:15 36.6375 20:14:59 37.8626 7:37:52 38.4326 8:57:43 37.3966 13:15:35 36.951
6 13:16- 3 36.9566 13:17:14 36.949
LONG I TUDE(DEG. W)
117. 353117.349117. 387117.395116.364114.819
117.5e9114.995115.515116. 1l1115.384116.407
116.2e3116.2ee117.555116.202116.448116.326
116.372116.385116.361116.2e2116.199114.722
117.139116.202115.180116.359115.077116.203
117.136116. 202116.203116.201116.197117. 638
11G.201116.274116.131117.034116.197116.136
116.148116.138
STANDERROR DEPTHH(KU) (Ku)
0. 2 -0.230.2 -0.940.6 -1.45e.2 7.240.5 9.670.7 9.91
0.1 0.731.3 0.660.5 3.11.0.2 4.710.6 16.300.4 0.00
0.2 8.170.2 s.000.3 2.920.2 8.25- 2.91- 4.77
5.6 4.27.1.3 1.66
10.1 0.730.3 -0.71e.4 8.111.7 9.75
0.1 0.260.2 8.260.6 6.930.2 2.270.2 2.100.2 8.50
0.1 0.450.2 8.710.1 9.44e.3 8.60e.3 0.120.4 11.71
0.3 0.00o.8.4 6.62e.3 -e.360.3 11.530.3 12.120.3 7.54
0.2 7.410.2 7.58
STAND AZIERROR GAPZ(KU) (DEG)
0.3 1240.3 1101.0 1180.8 1210.5 2341.7 230
0.2 1190.8 237- 791.1 691.1 1360.5 139
0.5 850.5 641.0 790.6 85- 241- 303
- 2663.0 2199.4 193
10.1 1550.8 1437.0 266
0.2 1350.5 630 7 1560.3 101e.6 1190.6 85
e.1 1520.6 850.8 1250.6 850.4 1590.7 186
0.2 1860.5 1340.5 1870.4 1241.e 980.5 89
0.4 t680.5 91
00012S MAGN I TUDE
Uca Md
ACSACI 1,72ACSACIADI 1.55ADI 1.60
ACSEDSCCAABI 1.72ACIACS 2.e4
ABS 1.34ABS 1.57ABSASS 1.37ODAADA
DOABOADDACCAACSCoS
ACZASI 1.60 1ACT 1.60 1ABS 1.29 eACI 1.16 1AS! I
ACI IABl 1.52 1AC!AS! 1.63 1ACS 1.70 1ADI 1.22 Q
AD! 2.11 1ABZ 1.18 1ACS 1.83 1ASf 1.87 iABIABI e
ACIA8 1
I .231.56
1.43
1.21
1 .971.621.401.66
1.271.461.091.301.291.14
1.078.79D.151.921.401.30
1.35.25.24
e.94.12.43
.36
.35
.45
.se
.99
.72
.15
.61.38
.95
.18
ESTIMATES&dLh MLv
0.991.650.890.86
2.04 1.361.51 1.60
1.181.29 0.77
1.34 1.821.441.77
1.20 1.191.73 1.621.05 1.0!1.18 1.22
1.51
1.451.31
1.87 1.700.811.09
1.31 1.18
0.94 1.191 34 1.371.21 1.211.70 1.621.63 1.57
1.22
2.181.14 0.95
1.781.430.836.84
0.246.62
DEL- RUS INMIN RES. PH. U.S.G.S.ULc (KU) (SEC) QUADRANGLE
10.8 0.06 14 USEHEBE CRATER11.1 0.e9 24 USEHEBE CRATER18.6 e.14 11 USEHEBE CRATER19.2 0.06 13 USEHEBE CRATER7.1 0.07 16 DEAD HORSE FLAT
22.6 0.08 12 GREGERSON BASIN
14.1 0.04 15 LIDA WASH18.4 0.e4 7 DELAMAR 3 NW23.9 0.14 15 GROOM RANGE NE7.3 e.e8 29 SPECTER RANGE NW
28.1 e.e9 12 CORN CREEK SPRINGS N11.7 0.64 9 WARM SPRINGS NW
11.2 0.06 20 WHEELBARROW PEAK W1.9 11.2 0.07 22 WHEELBARROW PEAK NW
9.0 0.12 15 LIDA WASH11.1 0.08 29 WHEELBARROW PEAK NW20.3 e.19 4 SCRuGHuA PEAK0.2 0.09 4 AdONIA TANKS
8.6 0.08 6 DEAD HORSE FLAT4.2 0.16 9 LATHROP WELLS NW3.4 0.06 7 STRIPED HILLS
12.1 0.04 8 WHEELBARROW PEAK NW11.3 0.06 14 WHEELBARROw PEAK Nw
1.7 36.7 6.10 8 VIGO NW
14.1 e.04 18 STONEWALL PASS11.3 0.08 21 WHEELBARROW PEAK NW2.4 0.09 16 LOwER PAHRANAGAT LAKE1.2 3.1 0.e6 17 STRIPED HILLS13.3 0.06 12 HIKO SE11.3 0.07 18 WHEELBARROW PEAK NW
14.2 0.03 16 STONEWALL PASS11.6 0.07 15 WHEELBARROW PEAK NW23.8 0.04 12 WHEELBARROW PEAK NW11.2 0.16 21 WHEELBARROw PEAK NW26.7 0.06 18 WHEELBARROW PEAK NW3.9 0.10 14 LAST CHANCE RANGE
2.2 27.5 0.06 24 WHEELBARROW PEAK NW1.4 6.0 0.07 21 STRIPED HILLS20.3 8.10 13 REVEILLE PEAK9.7 0.09 27 EMIGRANT CANYON
23.1 0.09 14 WHEELBARROw PEAK NW7.6 0.67 22 MINE MTN
7.4 0.06 14 MINE UTH7.6 0.06 20 MINE MTN
i( (

V-- -1 U1 _
? I 0 s I1987 LOCAL HYPOCENTER
) 9 ? : ')SUJMARY - SG$ EARTHQUAKES
DATE - TIUE(LUTC)
AUG 6 13:25:346 13:59:376 14:33:346 18:58:517 0:53:257 1:13:34
8 2: 8:358 15:13:208 15:13:209 13:34:259 16: 5: 110 2:58: 4
11 7: 9:4211 9: 6:1412 1:12:2012 7:56:3512 21:39:1613 11:18:55
13 11:46; 914 4:11:5914 11:16:14
a' 15 11:43:40c 15 12:17:50
16 0:34:52
16 0:35:3116 22:16:4916 23:13:4917 13:56: 620 le: 3:2520 10:16:34
20 10:32:5323 23:18:5824 12:11:3325 1:35:1925 11:30:2325 11:43:54
26 0:53: 626 11:19:5226 15: 3:2526 16:23:5927 3:40:5727 5:27: 7
27 10:45:1528 1: 6: 6
LATITUDE(DEG. N)
36.95137.38737.40637.75837.24237.938
37.37936.71236.71336.48437.41937.402
37.37137.34037.73337.22237. 61537.862
37. 01137.01237.56436.98837.56137.030
37.02937.37737. 24937. 67337.22337.109
36. 45635.90237.20135.93136.78236.671
37.80537.13337.33137.28137.30237.188
37.41137.764
LSTAND STAND AZI OOD
LONGITUDE ERROR DEPTH ERROR GAP 12SDEC. W) H(KM) (Ku) Z(KM) (DEG)
116.137 0.3 7.26 0.5 147 ACI117.130 e.1 0.88 0.2 83 ACI116.200 0.3 8.78 0.6 85 ABZ117e066 0.9 3.28. - 208 CDI116.414 0.2 -0.18 0.2 172 ACZ115.492 0.3 5.42 1.e 161 ACI
117.143 0.4 2.94. - 133 CCA116.170 e.6 14.11 1.0 161 ACS116.168 0.4 15.48 0.7 159 ACI116.311 0.2 6.87 0.8 132 ACS117.bl8 0.2 0.86 0.2 90 ACZ116.205 0.2 6.30 0.8 51 ABI
115.113 1.1 8.96 1.3 142 BCI117.473 0.2 0.67 0.3 114 ACT117.240 1.8 1.23 2.8 181 BDZ116.886 0.3 9.42 0.8 1 2 ADI117.672 0.8 6.30 4.5 116 BCI116.126 0.5 -0.47 0.7 11 ACS
116.360 0.2 8.67 0.3 47 MAI116.361 0.2 9.07 e.4 70 AAI115.008 0.2 2.43 e.4 113 ACT116,733 0.3 5.96 2.0 115 BCI118.457 7.7 2.235 - 311 DDI117.527 e.5 4.44 6.0 166 CCI
117.535 0.6 5.23 4.3 181 SDI117.144 0.2 -0.11 0.2 133 ACZ116.728 0.3 4.53 0.7 196 ADI115.055 0.4 1.54 1.4 1e6 ACI114.960 0.6 18.59 0.6 229 ADS117.32e 0.2 9.36 0.3 1e4 AB1
116.175 e.3 1.68 e.7 146 ACI117.034 1.3 7.53 1.01 263 BDI117.365 0.2 -0.54 0.3 102 ACZ117.009 0.1 7.13 0.2 280 ADI116.251 0.2 5.61 0.3 86 MI116.390 0.2 8.08 0.5 70 MAI
117.255 1.1 1e.93 1.1 245 D01117.940 0.7 8.54 2.7 238 BDI117.208 0.5 6.48 0.5 160 ACI117.600 0.3 8.00 0.5 83 AAI114.813 1.5 4.65. - 235 CDZ117.465 0.2 8.09 e.8 134 ACI
116.841 e.2 6.54 1.5+i107 ACI117.239 1.0 7.26 2.1 188 BDI
MACNITUDEUco ud
1.38 1.081.50 1.65
1.36
1.852.17 2.08
0.781.241.21
1.48 1.151.38 1.352.11 1.94
0.64
1.961.21
1.55
1.85 1.291.73 1.40
1.100.76
2.17 2.111.23
1.401.30 1.15
1.16
1.17
1.13
1.250.93
1.59 1.34
1.931.83 1.61
1.21 1.311 .000.91
1.86
ESTIMATESULh ULv
1.071.75
1.20 1.371.461.352.52
1.061.252.30
0.81
1.211.542.19
0.72 1.101.30
1.161.59
1.361.330.960.632.26
1.30 1.21
1.241 20 1.37
0.941.00
1.59 1.261.07 1.18
1.323.07
1.131.250.631.19
1.5611.82
0.36 0.491.09 1.25
1.180.90
1.261.33
DEL- RUS #NMIN RES. PH. U.S.G.S.
ULc (KU) (SEC) QUADRANGLE
1.2 7.7 0.09 26 MINE UTN1.3 14.8 0.06 27 STONEWALL PASS
10.9 0.07 15 WSHEELBARROW PEAK NW53.5 e.e0 13 MUD LAKE8.6 0.63 IS SCRUGHAU PEAK
2.5 10.1 0.08 20
13.4 6.06 10 STONEWALL PASS9.7 0.07 9 SPECTER RANGE NW9.8 6.05 9 SPECTER RANGE NW
17.7 0.05 21 ASH MEADOWS24.9 0.05 20 SCOTTYS JUNCTION NE11.5 0.08 39 WHEELBARROW PEAK NW
1.1 6.8 0.07 7 ALAMO SE11.4 0.05 12 GOLD POINT SW13.3 6.16 13 GOLDFIELD16.5 0.06 16 SPRINGDALE16.0 0.10 9 LIDA WASH19.9 0.09 9 REVEILLE PEAK
3.5 0.07 36 BUCKBOARD MESA3.5 0.08 32 BUCKBOARD MESA
11.8 0.04 16 HIKO SE17.7 0.07 16 BARE MTNS0.9 0.08 9 .*.OUAD. NOT LISTED.16.4 0.11 12 LAST CHANCE RANGE
17.2 0.09 9 LAST CHANCE RANGE13.1 0.04 11 STONEWALL PASS9.1 0.06 22 THIRSTY CANYON NW
1.2 10.7 0.10 11 HIKO NE21.1 0.07 10 DELAMAR 3 NW12.4 0.05 21 UBEHEBE CRATER
6.6 0.07 18 AMARGOSA FLAT4.0 16.5 0.12 27 MANLY PEAK
14.6 0.05 17 UBEHE8E CRATER13.3 0.01 7 MANLY PEAK4.8 0.05 17 JACKASS FLATS5.3 6.09 29 LATHROP WELLS NW
16.3 0.08 11 ALKALI2.0 28.3 0.11 15 WAUCOGA SPRING
5.5 0.03 8 SCOTTYS JUNCTION SW1.7 6.8 0.67 17 MAGRUDER MTN
24.0 0.08 8 GREGERSON BASIN16.9 0.05 14 UBEHEBE CRATER
22.2 0.09 20 TOLICHA PEAK14.6 0.18 17 UUD LAKE

* I ,; ; I ' ) I; :.
1987 LOCAL HYPOCENTER
AL
Si
a,%O
STAND
DATE - TIME LATITUDE LONGITUDE ERROR
(UTC) (DEG. N) (DEG. W) H(KU)
UG 29 18:34:35 37.861 116.131 0.3
29 19:37: 3 36.659 115.779 -30 0:54:17 37.356 115.164 1.7
30 7:56: 9 37.322 114.862 0.830 11:19:15 37.237 116.512 0.3
30 12:46: 8 37.176 117.215 0.3
30 17:59:17 37.272 116.327 0.4
31 10:34:59 37.060 116.022 0.1
31 19:12:38 36.625 116.778 1.2
,EP 1 4:10:40 37.227 117.581 0.4
1 15:31:18 37.501 117.228 0.2
2 16: 4:55 37.561 114.960 9.9
3 2:46:28 36.467 117.969 0.9
3 3:54:35 36.471 118.000 0.9
3 23:35:39 37.185 116.279 0.44 1:35:31 37.108 116.036 0.4
4 3:44:39 36.907 117.816 0.6
4 18:30: 6 37.393 116.520 0.5
5 4:23:24 38.142 115.091 2.45 4:39:44 37.741 114.858 0.3
5 17:30:35 36.734 116.191 0.4
5 21: 8:32 37.466 117.879 0.3
6 5:52:35 37.453 117.885 6.5
6 8: 3: 0 36.703 116.311 0.2
6 23:20:55 37.394 116.074 0.5
7 0:47:19 37.366 116.050 0.5
7 1:36:12 37.372 116.047 0.5
7 11:34:44 37.366 116.e46 e.6
7 11:46:30 37.295 114.911 0.67 13:25:46 36.930 115.061 0.7
8 5:48: 6 36.927 115.052 0.5
8 14:39: 4 37.161 117.371 0.2
8 20:50:46 37.181 117.263 0.3
9 11:10:14 37.113 114.906 1.8
le 5:55:58 38.111 115.103 2.110 5:56: e 37.935 115.220 3.2
I1 3:10:11 37.329 116.351 1.0
11 5:18:15 36.702 116.306 0.212 11:43:32 36.711 116.277 0.3
12 12:52:33 37.090 115.271 8.3
12 15: 8:58 37.315 116.315 0.2
13 2:3z:36 36.185 117.636 0.7
13 7:25: 8 36.581 115.562 0.31O It .' .10 36.R67 115.979 1.0
DEPTH(KU)
-0.16-1.17-1.14
1.916.230.09
-0.35-02 b1
8.291.130.200.91
10.078.961.112.712.947.24
2.466.224.267.5810.504.80
1.120.09
-9.66-0.8411.01-0.58
-e. 1910.600.66
18.172.ea
- 1.54
6.235.146.837.340.195.49
-0.711.48
STANDERRORZ(KM)
0.5
1.11.01.20.5
0.20.21.6
0.90 .35.5
0.9
0.81.20.62,42.41*
8.20.70.50.4+0.60.3
. .'
0.50.5e.60.60.7
0.60.50.43. 3N
6.11.2
1.60.20.30.7e.46.7
0.62.0
AZIGAPDEG)
1073062)622016190
218119197136157231
259246182114244262
264194225165161163
249210212219216190
171115
92183259195
26911218615888266
81185
ACIADSBDZADIACIACZ
ADIACIBDAAC IACZDDZ
ADIADIAD!ACIODS80D
CDSADIADIACIAC IACI
ADIADIADIADIADZADZ
AC2ABl
ACIBDICDICDZ
BD]ARAUiACIACICD
AC:BDi
1.77 1.75
1.16 1.521.53 1.651.45 1.32 1.701.34 1.36
2.011.23 1.27 1.67
0.881.14 1.111.29 1.14
0.92
1.841.77
1.571.59 1.351.40 1.39
1.15
1.85 2.361.99 1.85 2.e2
1.222.06 2.07
1.38
1.73 1.55 1.271.78 1.56
1.36 1.311.90 1.53 1.37
z 1.35Z 1.47 1.97
1.930.92
1.221 1.72 1.78
1.65 1.72z1.65 1.68
SLL4ARY - 5Gf EARTHQUAKES
000
12S MAGNITUDE ESTIMATESUco Md MLh MLv MLc
1.850.600.98
1.511.161.52
1.980.88
1.141.361.06
2.002.031.291.211 .591.10
2.42
0.642.231.370.59
1.211.741.201.341.331 .85
1.831.121.351.931.781.58
1.301.e80.681.62
, 1.172.46
1.490.60
DEL- RUS . NMIN RES. PH. U.S.G.S.(Ku) (SEC) OUADRANGLE
20.3 0.12 17 REVEILLE PEAK4.8 0.01 4 MERCURY NE
11.5 0.05 7 ALAMO19.1 0.e6 8 GREGERSON BASIN
12.9 0.07 21 THIRSTY CANYON NE14.3 8.10 23 BONNIE CLAIRE NW
6.4 e.e4 13 DEA HORSE FLAT15.4 0.05 18 YUCCA FLAT1.5 e.09 8 CHLORIDE CLIFF5.8 0.07 17 LAST CHANCE RANGE
22.4 0.05 15 GOLDFIELD18.9 0.03 6 PAHROC SUIMIIT PASS
62.8 0.11 17 KEELER64.9 0.11 19 *.OLUAD. NOT LISTED*19.1 0.08 15 AM4MINIA TANKS
1.9 16.3 0.09 22 YUCCA FLAT38.3 0.08 17 WAUCOBA WASH32.9 0.05 13 BLACK UTN NE
28.9 0.08 7 TIMBER MTN PASS NE12.0 0.04 1( PAHROC SPRING NE7.3 0.07 19 SPECTER RANGE NW
2.2 5.1 0.07 2e SOLDIER PASS3.7 0.06 9 SOLDIER PASS5.6 0.03 14 STRIPED HILLS
22.2 0.06 12 WHEELBARROM PEAK NE
2.0 18.8 0.09 17 OAK SPRING BUTTE19.4 0.08 14 OAK SPRING BUTTE18.7 0.09 it OAK SPRING BUTTE
17.6 0.06 8 DELAMAR LAKE28.8 0.11 9 MULE DEER RIDGE NE
29.4 0.10 It MuLE DEER RIDGE NE18.1 0.07 14 UBEHEBE CRATER13.2 0.08 14 U8EHEBE CRATER25.8 0.15 10 DELAMAR 3 SW25.5 0.06 6 TIMBER uTN PASS EAST14.5 0.45 6 OREANA SPRING
13.0 0.05 10 DEAD HORSE FLAT5.4 0.05 18 STRIPED HILLS3.5 0.06 19 STRIPED HILLS
2.2 11.5 0.06 14 DESERT HILLS SE
1.1 11.3 e.05 22 DEAD HORSE FLAT2.4 54.4 0.11 20 COSO PEAK
25.6 0.11 20 INDIAN SPRINGS SE9.9 0.19 16 FRENCtuAN FLAT
iIIIII
zZ
1.281.251.751.622.24
2.84
1.040.871.661.471.98
1.38
I .821 .39
. l.s.....
( (

DATE - TIME LATITUDE(U-C) (DEG. N)
SEP 14 9:11: 4 37.21214 19:34:32 36.63115 6:42:16 37.15515 15:17:12 37.19615 19: 7: 6 36.41416 19:37:44 37.865
16 23:17:22 36.88317 12:29:30 36.99817 13: 8:42 36.97517 23:21:35 36.72518 16:55:17 36.18119 14:14: 0 37.270
19 23:26:48 36.63520 22:38:51 37.32822 16: 3:58 37.07322 18:21:28 36.58922 19:26:13 36.67223 4:08.34 37.276
23 6:31:59 36.66623 7:20: 5 37.28823 23:15:47 37.31223 23:59:26 37.744
o 24 0:54:38 36.78825 20: 8:46 37.211
25 20:49:21 37.21126 1:56:22 37.08526 19:17:54 37.21326 22:52:31 37.22827 7:48:18 35.84927 9:50:38 37.647
27 9:52:48 36.63427 15:29:30 36.61828 3:24: 9 37.49428 8:43:42 37.01528 1S: 9:11 37.22328 21:49:39 37.865
29 1:16:29 37.14829 11:48:39 37.890
OCT 1 16: 0:17 36.9571 20:20:15 36.7392 11:11:55 37.0723 5:14:25 36.887
3 7:4e:45 36.0953 7:4':21 36.e97
STAL(NGITUDE ERR((DEG. W) H(KI
117.337 0.;116.343 0.2116.286 0.;117.385 e.1117.473 0.1116.136 0.
116.749 0.116.231 2.'117.140 1.1116.718 e.:117.619 0.!116.654 0.
116.336 e.117.684 0..115.763 0.117.642 1.116.333 0.114.586 1.
116.384 0.114.620 1.116.315 0.117.242 1.115.970 0.117.455 0.
117.456 8.114.923 0.117.457 0.116.370 0.116.748 1.116.792 0.
116.330 0.117.124 0.117.583 0.116.223 0.117.458 0.116.131 0.
115.326 0.117.616 0.116.156 -115.482 0.115.753 0.117.725 0.
116.639 e.116.636 0.
) I O j3I1987 LOCAL HYPOCENTER
40 STAND AZIOR DEPTH ERROR GAPA) (KU) Z(KM) (DEG)
2 7.13 0.6 932 2.79 0.4 1012 7.22 0.3 81
-0.36 0.2 1896 2.94 2.1 2365 4.84 7.3 157
3 0.54 0.6 1785 7.00* - 1721 1.47 3.7 1652 1.52 0.7 110
1.03 2.7 2653 -0.13 0.3 188
7 12.46 0.7 2963 6.89 0.8 1362 10.13 1.2t+ 1071 -1.02 0.8 27.9 4.46 1.4 1561 2.44 3.7 278
4 6.97 e.6 2063 -1.02 1.0 2722 -1.00 0.2 74a 5.67 2.8 1463 8.65 0e.9+ 1323 8.3: 0.9 104
2 7.97 0.8 1t26 15.79 1.3i- 1822 7.66 6.8 1033 -0.35 0.3 402 1.69 1.6 2602 0.21 0.3 lII
6 4.11 0.34 2971 0.43 0.2 1123 -0.06 0.6 80a 3.64 0.4 1332 8.81 0.7 1153 0.70 0.5 108
4 0.86 0.5 1637 5.11 4.5 238- 7.00.. - 2462 7.88 2.0 1035 5.18 8.5 627 2.86 2.8 209
3 6.27 1.4 1503 6.12 0.9 149
S00OSOD12S I
ABIABSABSACZEDICCI
ACIDODABCAAC IBOSADZ
ADIACIACIBDZACIBDI
ADIBDZACSECSABtACI
ACIADIACIAAMBoDSACZ
ADIACZABIABIASSACI
ACIBDIDDAACIt'CIBDS
AC IACI
2 9RY - SGB EA
AAGNITUOE cUco Ud
1.23 1.311.40 1.23
1 .29
1.85 1.841.57 1.54
0.281.00
1.33 1.051 .80
1.43 1.40
1.60 1.621.78 1.65
1.25
1.38 1.81
0.851.12
1.69 1.44
1.55 1.171.66 1.74
1.58 1.331.99 2.201 .62 1.691.942.25
1.56
e.991.42
1.26
1.33
1.76 1.441.53 1.71
2.352.59
1.31 1.30
7 4RTHOUAKES
DEL- RUS ON'STIMATES IN RES. PH. U.S.G.S.ULh ULv MLc (KU) (SEC) QUADRANGLE
1.43 12.1 0.07 24 UBEHEBE CRATER1.16 1.6 0.os 21 STRIPED HILLS0.84 7.4 0.06 23 AMMNIA TANKS
8.96 0.90 16.3 0.04 14 UOEHEBE CRATER2.04 31.1 0.07 16 PANAIINT BUTTE1.69 20.8 *.1s 10 REVEILLE PEAK
0.61 14.5 0.05 11 BARE MTN4.4 0.20 5 MINE MTN
18.6 0.es 10 CRAPEVINE PEAK0.90 10.8 0.06 20 DIG DUNE
1.79 2.16 2.0 53.0 6.10 1s COSO PEAK0.64 30.0 0.07 15 BLACK MTN SW
0.71 1.2 0.10 16 STRIPED HILLS1.37 1.74 11.1 0.09 25 MAGRUDER MTN
1.97 26.5 0.09 30 PAPOOSE LAKE SE1.62 32.0 0.06 11 USHEBE PEAK0.28 3.0 0.11 10 STRIPED HILLS1.35 38.9 0.05 10 ELGIN
0.57 4.6 0.06 12 LATHROP WELLS NW1.18 1.37 36.8 0.06 9 ELGIN1.51 1.34 1.3 10.9 0.08 34 DEAD HORSE FLAT
1.49 13.5 0.14 10 GOLDFIELD1.31 14.2 0.08 15 FRENCHUAN FLAT1.73 17.1 0.09 26 UBEHEDE CRATER
1.46 17.1 0.07 22 USEHE8E CRATER2.08 2.06 25.3 0.08 13 DELAMAR 3 SW
1.69 1.8 16.9 0.08 24 UBEHEBE CRATER1.55 4.3 6.09 22 AMMONIA TANKS2.36 2.4 16.7 0.09 18 CONFIDENCE HILLS1.52 37.7 0.06 19 CACTUS SPRING
0.96 1.5 0.07 15 STRIPED HILLS1.39 1.58 14.2 0.05 23 STOVEPIPE WELLS
1.17 9.5 0.09 14 MAGRUDER MTN0.75 2.6 0.09 20 TIPPIPAH SPRING
1.20 0.97 16.8 6.07 14 UBEHEBE CRATER1.52 20.5 0.09 13 REVEILLE PEAK
1.79 1.46 12.5 0.00 14 DESERT HILLS NE1.74 25.5 0.09 14 SILVER PEAK
92.1 1.56 3MINE UTN29.8 0.07 27 BLACK HILLS NW
3.43 29.1 0.19 35 PAPOOSE LAKE SE1.35 1.53 29.9 0.12 18 DRY MTN
1.79 1.36 10.4 0.11 16 FUNERAL PEAK1.63 1.27 10.3 0.07 13 FUNERAL PEAK

' I ); I * ) 3 j
1987 LOCAL HYPOCENTER SUUUARY - SGs EARTHQUAKES
0x
STANDDATE - TIME LATITUDE LONGITUDE ERROR
(UTC) (DEG. N) (DEG. W) H(KU)
-T 4 11:56:15 37.327 116.413 0.7
4 13:30:11 36.802 116.105 0.25 e:26:42 36.637 116.249 0.25 20:26:41 36.975 116.084 0.35 21:10:42 37.318 115.078 0.26 9:45:44 37.e70 115.762 0.2
6 17:29:28 37.717 117.634 8.5
8 20:36:49 37.231 116.374 0.3
9 4:53:10 37.e77 115.7A2 083
18 1e:12:42 37.868 116.138 0.511 8:37: 7 37.743 114.514 1.5
e1 8:43:24 37.784 114.530 3.2
11 1:27:50 37.197 116.306 8.3
11 2:43:31 36.634 117.057 0.'
11 3:16:16 37.177 117.428 0.4
11 5:24:30 36.741 116.220 0.211 8:42: 9 37.274 115.845 8.3
12 0:10:20 35.937 117.022 0.8
12 0:19: 5 35.935 117.824 0.7
12 5:22:40 37.496 117.961 8.4
12 5:23:32 37.264 116.484 085
12 5:36: 4 37.194 116.304 0.3
12 14:53:45 37.214 116.381 0.212 19:29: 6 37.864 116.131 0.3
13 7:34:44 37.116 117.329 0.413 18:42: 8 36.583 115.597 0.3
14 23:56:43 37.308 115.341 0.21S 1:56:51 37.231 116.334 0.8
15 13: 8:29 36.323 117.478 0.615 13:39:39 36.313 117.495 0.7
15 21:40:45 36.209 116.857 0.216 2: 7:32 37.871 115.699 0.216 20: 5: 3 37.865 116.130 8.2
16 20:36:22 37.020 117.541 0.5
17 8:53: 8 37.871 116.119 0.5
17 21:57:29 36.773 116.048 0.4
17 22:27:55 37.465 117.259 0.3
18 20:51:37 36.831 116.253 0.419 21:15:24 37.791 117.805 -26 16:16:40 37.049 116.98t 1.1
26 20:22:27 37.047 116.974 1.721 0:26: 5 37.274 116.335 1.1
21 23:t9:17 36.462 116.949 8.2
22 5:32:39 37.586 117.675 0.2
DEPTH I(KU)
4. 79.845.44
l1.40-0.112.59
6.770.317.29
-0.441.454.28.
0.299.789.435.37
-0.771.63
1 743.54-0.90
0.2q-0.04
7.3111.8110.886.17
-0.725.69
9.240.968.585.811 .600.71
4.99-0.167.00..2.234.001.32
6.831.49
STANDERRORZ(KM) (
1 .90.68.78.68.3
1.9
1.48.2
2. 3 t0.83.4
8.10.51.28.60.71.5
1.30.70.40.2t0. 18.4
0.71.11 .7FF0.70.55.2
i .e8.38.42.12.18.5
2.00.2+
2.14.31.1
1.00.54
Az IoAPDEG)
249123127196167108
18681
152108304327
6992
1209152
277
27824118410969
18
190149136231741244
128176188237164145
89195306164163272
132102
OOD125 UAGNITUDE ESTIMATES
Uco Md ULh ULv
AD!ADI 1.42ABI 1. 10ADI 1.25ACSACI 2.16 1.98
ADIAAI 1.48BCI 1.73 1.46ACS 1.68DOSCDI
AAI 1.37 1.38ACI 1.09 1.11ActABI 1.19 1.28AD! 2.64ADZ 1.28
ADSADZADIABI 1.40 1.29ADI 1.39 1.39ACI 2.05 1.94
ADIACIACI 1.30ADI 1.55ADZ 1.84 1.61CDI 1.74 1.68
ABSACS 1.18 1.17ACI 2.04 1.6680!
SCA I . 13AC! 1.22 1.37
DCI 1.12 1.31ADI 1.32 0.87CDA 1.43UCA 0.56BOA 8.50ODS
ACIACI 1.21
8.720.878.680.63I .40
2.17 2.21
1.461.61 8.751.75 1.82
1 .551 .591.69
1.011.37 0.98
0.810.78
2.57 2.681.43
1.11
1.401.67
1.39 0.951.432.22
0.86 0.761.45
1.84 1.28I.ie
1.69 2.021.68 1.94
0.97 0.831.3u
2.10 2.1E1.42
1.12
1.340.6!
1.79 1.31
0.88 a 1.11.2;
DEL- RMS INMIN RES. PH. U.S.G.S.
ULC (KU) (SEC) QUADRANGLE
14.9 0.87 9 SILENT BUTTE1.0 8.2 20.8 25 CANE SPRING
8.1 0.87 23 SPECTER RANGE NW14.7 8.06 14 YUCCA LAKE
1.7 10.1 0.02 8 ALAM SE26.8 0.18 31 PAPOOSE LAKE SE
14.9 8.07 10 LIDA WASH4.9 e.89 22 AMNIA TANKS
26.4 e.88 22 PAPOOSE LAKE SE21.1 0.14 13 REVEILLE PEAK25.0 e.09 6 CHIEF MTN21.3 0.87 5 CHIEF UTN
1.6 2.4 8.10 25 AMEONIA TANKS19.8 8e.4 19 STOVEPIPE WELLS20.4 e8.1 15 UEEHEEE CRATER4.6 0.89 21 SPECTER RANGE NM
2.8 9.2 6.13 30 GROOU MINE SE14.2 6.87 13 MANLY PEAK
14.5 6.06 10 MANLY PEAK9.2 0.85 13 SOLDIER PASS9.8e 0.6 10 SILENT BUTTE2.9 8.09 20 AMMONIA TANKS
s 5.1 8.e7 23 SCUM)M PEAK20.4 0.10 21 REVEILLE PEAK
3 13.1 0.02 6 LBEHEBE CRATER22.7 0.08 12 INDIAN SPRINGS SE2e.6 0.04 7BADGER SPRING2.1 0.07 9 A 4NIA TANKS
1.8 37.1 0.88 17 PANAMINT BUTTE38.7 e.10 20 PANAMINT BUTTE
17.0 6.85 10 BENNETTS WELL15.4 8.03 8 WRTHINGTON MTNS20.4 0.09 21 REVEILLE PEAK17.5 e.e8 16 LAST CHANCE RANGE20.0 8.83 7 REVEILLE PEAK14.6 0.16 15 CANE SPRING
18.2 0.07 17 hOUNT JACKSON6.7 8.07 11 JACKASS FLATS8.5 .3 7 3 RHYOLITE RIDGE8.9 .6e9 6 SPRINGDALE9.6 6.65 5 SPRINGDALE6.7 6.e6 12 DEAD HORSE FLAT
2 16.4 6.05 19 FURNACE CREEK18.2 8.09 12 LIDA WASH-
- - - - -- -
( .�.... I -

1967 *~ SJ.GARY SOBEAR ES' I *) IEN;
1987 LOCAL HYPOCENTER SLMAARY - SG8 EARTH "ES
DATE - TIME LATITUDE(UTC) (DEG. N)
OCT 22 1'1:42:13 37.86222 14:45:33 37.18323 3:57:12 37.15423 10:40:12 37.62423 17:12:12 36.73124 6:33:37 36.672
25 1:53:3e 37.56325 2:52: 5 37.74925 4: 3:28 38.49725 4: 4: 1 38.48425 8:10:49 38.47625 16:30: 1 37.198
26 3: 2: 5 37.13326 13:48: 3 37.86927 3:28:52 37.e6927 7:!2:20 37.86827 8:37:23 37.17627 10:42:16 37.871
27 12:39:52 37.86928 6: 0: 3 37.86428 17:25: 9 37.86928 17:41: 6 37.86129 1:37:51 36.86029 2:47:21 36.861
29 6:10:13 36.44229 6:19:30 37.86530 0:39:17 37.87730 19:17:48 36.95330 22:23:46 37.27031 12:46:23 37.308
31 13:26:21 37.37431 17:20:27 36.57431 23: 6:59 36.751
NOV 1 5:38:32 36.7131 5:48:22 36.6341 12:48: 4 36.785
1 13:59:32 36.4201 18:47:46 37.420I 19:33:10 37.2712 22: 8:33 37.8652 23:38:14 37.1783 3:18:52 37.877
3 8:59:18 37.8833 9: 2:48 37.878
LONGITUDE(DEG. W)
116.129114.819117.356114.995116.096115.564
118.005117.341116.036116.050116.842117.371
115.119116.133115.754116.134117.392116.127
116.137116.131116.132116.136116.170116.170
117.501116.128116.128115.271118.199117.718
117.887116.052116.533116.399116.332116.259
116.651115.638114.545116.135115.498116.128
116.127116.132
STANDERRORH(KU)
e.20.70.20.30.30.8
0.40.30.82.21.20.2
1.40.50.50.40.10.2
0.40.30.20.38.6e.7
0.90.60.30.52.00.4
0.30.3e.60.90.2
5.00.30.80.40.40.7
0.50.6
STAND AZIDEPTH ERROR GAP(KU) Z(KU) (DEG)
-0.23 0.4 1088.47 2.2+4 1938.05 0.7 1113.56 0.9 978.92 0.5 149
12.00o - 244
4.69 1.6 2568.94 0.7 1513.63 1.5 2597.61 I .D4, 2697.95 0.64+ 2548.66 0.6 107
9.92 3.8*4 2227.00 8.3 1094.55 9.4 1257.00 7.2 1080.12 0.3 1170.16 0.3 109
7.08 7.8 1080.42 0.4 1085.87 2.6 1098.60 0.6 1076.22 0.5 2126.57 0.5 213
0.54 0.8 239-0.61 1.0 108-0.44 0.6 Il112.64 2.3 1470.43 1.5 305
-0.52 0.8 165
2.72 - 21712.75 0.5 1571.52 1.2 1774.75 2.1 1503.97 0.7 280
-1.40 0.2 148
25.84 2.7 3150.97 0.5 74
13.86 1.0*+ 2380.81 0.7 1083.21. - 1240.00 1.2 110
-0.71 0.9 1120.77 1.0 109
OOD12S UAGNITUDE ESTIMATES
Uco Ud uth ULv U
AC! 1.96 1.760DI 1.91 2.07
ACI 1.47A81 1.49 1.48ACSCOT
ADIACI 2.42 1.72ADS 2.298D1 2.748D1 2.64ABl 1.40
8DICCI 1.43CCS 1.51 1.26CCI 1.44ACZ 1.32 1.28ACS 2.03 1.75
CCI 1.47ACI 1.79 1.82CDCI 2.39
ACS 1.47ADI 1.17 0.79ADI 1.22 0.87
ADI 1.88 1.74DCI 1.2CACS 1.91 1.758CS801ADA 0.72
ADA 0.75ACIACZ 1.42 0.91sCS 1.05 0.93ADZ 0.61ACZ 1.15 0.87
0DIACI 2.06 1.77ADI 1.60 1.70ACZ 1.78 1.72CCI 1.96 1.73EDCI 1.70
BCZACS 1.55
2.062.18 2.07
1.561.47 1.45
0.891.22
1.521.39 1.61
2.41
1.56
1.96 1.541.52
1.46 1.461.45
1.41 1.301.97 2.13
1.602.21 1.832.85
1.700.540.63
1.941.53
2.03 1.921.451.19
1.090.850.360.770.46
1.722.131.731.911.971.37
1.581.41
DEL- RuS INWIN RES. PH. U.S.G.S.
iLc (KM) (SEC) QUADRANGLE
20.2 0.09 19 REVEILLE PEAK32.2 0.12 15 DELAMAR 3 NE17.2 6.87 20 UBEHEBE CRATER6.0 e.06 11 PAHROC SUWIT PASS
14.3 6.05 14 CAMP DESERT ROCK22.1 6.67 12 HEAVENS WELL
17.5 0.08 17 *..QUAD. NOT LISTED.6.6 0.10 22 MONTEZULA PEAK
45.6 6.06 9 *oQUAD. NOT LISTED.43.7 0.65 7 **QUAD. NOT LISTED*
4.2 43.7 0.09 15 **. UAD. NOT LISTED&
1.9 15.7 0.08 23 UeEHEBE CRATER
31.0 0.12 9 LOWER PAHRANAGAT LAKE48.4 0.10 13 REVEILLE PEAK27.5 0.12 21 PAPOOSE LAKE SE48.5 0.16 15 REVEILLE PEAK18.3 0.05 21 U6EEHEBE CRATER20.6 6.07 22 REVEILLE PEAK
48.3 0.10 14 REVEILLE PEAK2.0 20.4 0.11 26 REVEILLE PEAK2.7 20.8 0.08 27 REVEILLE PEAK
20.6 0.07 10 REVEILLE PEAK0.7 0.06 10 SKULL UTN0.7 0.08 11 SKULL UTN
30.2 0.09 19 DARWIN26.3 0.15 14 REVEILLE PEAK21.1 0.13 20 REVEILLE PEAK25.1 0.11 II BURRO BASIN31.1 0.07 11 -**QUAD. NOT LISTED.
16.5 0.02 5 MAGRUDER MTN
6.0 0.05 4 SOLDIER PASS12.6 0.04 12 SPECTER RANGE SE5.6 0.07 14 BARE UTN9.2 0.68 11 LATHROP WELLS IW1.4 0.11 13 STRIPED HILLS4.9 0.06 15 JACKASS FLATS
37.4 0.04 10 RYAN2.1 15.3 0.13 30 BALD MTN
40.9 0.07 11 ELGIN20.8 0.13 18 REVEILLE PEAK27.7 0.13 22 DESERT HILLS W21.0 0.15 13 REVEILLE PEAK
21.4 0.17 16 REVEILLE PEAK20.9 0.15 12 REVEILLE PEAK

) I ',; I ' -) :3 7
1987 LOCAL HYPOCENTER SUMMARY - SCs EARTHQUAKES
DATE T TIME LATITUDE LONGITUDE(UTC) (DEG. N) (DEC. W)
NOV 334566
666677
7899
1011
I I1111
.1 12W 13
14
141415151515
151515151515
16.1616,1616is
17: 3:1720:ZS:5018:41: 90:34:464:45:42
12:31:32
14:20: 215:52:3515:57:5322:49:533:41:386: 0:34
C: 15:5714:27:5710: 14:4923:32:5811:49:284:41:35
8: 3: 111:56:4312:32: 422:10:204:15:467:56:45
15:27:2122:49 :583:37:484:17: 25:53:229:25:51
14: 7:5014: 8:3715:14:2816:26:1118:43:6020:56:19
0:5e: 1617:58: 317:58:5221: 3: 423:29:472:31:50
36.65136.86237.37637.85536.42137.878
37.s9437. 29237.29737.67737.86836.758
37. 66937.48436.81337.69635.93437.051
37. 13937.69437.69436.77137.86635.897
37.86737.85537.86837.87037.85337.875
37.85037.91637.86637.85337.84837.381
37.86337 .85837.85137.85637.86035.924
116.546116.157117.287116.132116.311116.138
15. 772116.028I 16.J29115.92116.131115.791
116.132114.446117.474114.963117.014116.31 7
114.815114,964114.963116.265116.135117.237
116.132116.133116.127116.126116.137116.115
116.118116.111116.136116.105116.124115.492
116.139116.134116.140116.135116.102117.215
STANDERRORH (KM)
0.20.20.10.68.2e.8
0.68.48.28.48.50.3
8.22.2e.7e.28.5e.2
8.68.50.30.20.51.8
0.20.40.48.38.53.1
2.23.51.51.53.68.6
0.60.58.50.60.61.9
DEPTH(Ku)
4.181.77
-0.10
4.82-8.32
16.864.360.461.017.088.01
1.16-1.54
1.931.934.842.65
5.330.631.91
-1.787.00e3.11.
5.764.518.e97.047.432.32.
2.58.2.86.2.13.8.962.47.2.77.
1.71-0.18
2.462.80
-0.782.62
2.2 1748.4 * 928.2 1448.9 1062.5 1031.0 199
1.4 1801.7 lee8.4 1021.7 977.8 1138.5 139
8.8 1091 .6 2931.4 lb6e.s 1411.5 2788.2 182
4.9+ 2108.8 1408.6 1418.3 1498.7 188- 280
3.1+ 1885.4 1338.6+ 1893.7 1892.0 285- 244
- 258- 208- 1991.9 281- 248- 94
STAND AZI OO0ERROR GAP 12S uAGNITUDE ESTIMATESZ(Ku) (DEG) uca Wd MLh MLv MLc
DEL- RUS ONMIN RES. PH. U.S.G.S.(KU) (SEC) QUADRANGLE
DCIASTACSBC IDCCIAOI
1.16 1.811 .34
1 .161.59
1.64 1.881.97 1.71
ADA
ACI 1.13ACIACZCCIACZ
I.18
1.47
ACSBDZBDIACIADSABI
1.611.551.24
1.58 1.492.01 1.38
e.88
0.711.871.231.690.961.73
1.05 1.041.14 1.09
1.211.510.78
1.871.661.44
1.68 1.601.588.65
2.01 1.811.071.es
1.81 0.611.741.61
7.78 2.771.941.68
2.61 2.711.59
15.8 0.061.4 8.089.5 0.03
19.9 0.1615.1 0.05
1.7 21.9 0.12
24.7 0.0310.3 0.0918.9 0.0e
1.6 14.0 0.051.7 48.6 0.09
7.3 0.07
1.7 28.8 0.8929.2 0.04
1.5 6.3 0.155.4 8.83
13.7 8.846.4 8.e5
18 BIG DUNE20 SKULL MTN15 STONEWALL PASS14 REVEILLE PEAK15 ASH MEADOWS
9 REVEILLE PEAK
8 PAPOOSE LAKE SE16 OAK SPRING BUTTE18 OAK SPRING BUTTE8 HIKO NE
15 REVEILLE PEAK17 FRENCHIAN LAKE SE
19 REVEILLE PEAK8 *-*QUAD. NOT LISTED.
22 TIN MTN8 PAHROC SPRING
10 MANLY PEAK17 8UCKB0ARD MESA
D0 I .8jACI 1.34AC:ACZ 1.12CCI 1.77CDI 1.71
BCI 2.58CCIACIBCI 2.258DICDA
CDACDACDABOACDACCA
BCAACIBCSACIADICDI 2.03
1.860.880.931.891.611. _5
1.441.49
1.381.63
1.241.98I.641.541.8s1.96
1.881.61
1.36
33.2 0.06 11 DELAMAR 3 NE5.2 0.10 9 PA10C SPRING5.2 0.05 10 PAROC SPRING3.2 0.07 21 JACKASS FLATS
1.7 48.7 8.12 15 REVEILLE PEAK34.2 0.10 9 MANLY PEAK
20.7 0.11 30 REVEILLE20.0 0.0s 11 REVEILLE20.3 0.09 12 REVEILLE28.5 e.10 20 REVEILLE20.2 0.e4 7 REVEILLE50.7 0.16 11 REVEILLE
PEAKPEAKPEAKPEAKPEAKPEAK
PEAKPEAKPEAKPEAKPEAKRESERVOIR
49.4 0.10s3.3 0.2351.7 8. 1848.6 0.1049.7 0.2125.4 0.14
8 REVEILLE7 REVEILLE
14 REVEILLE14 REVEILLE14 REVEILLE15 CRESCENT
5.88.93.31.8+0.75.7
1071071es186213268
1.981.711.551.432.12
20.9 0.141.8 220.93 0.1420.3 6.0720.2 0.1118.1 0.0831.7 0.09
16 REVEILLE PEAK12 REVEILLE PEAK8 REVEILLE PEAK9 REVEILLE PEAK
11 REVEILLE PEAK16 MANLY PEAK
18 9: 6:34 37.74118 21:14:32 37.693
115.014 e.4 e.68 0.5 139 ACI114.964 0.6 1.77 1.5 1i.0 ACI
0.89 1.16 12.0 0.06 9 HIKO NE5.1 0.09 11 PAFROC SPRING
( (
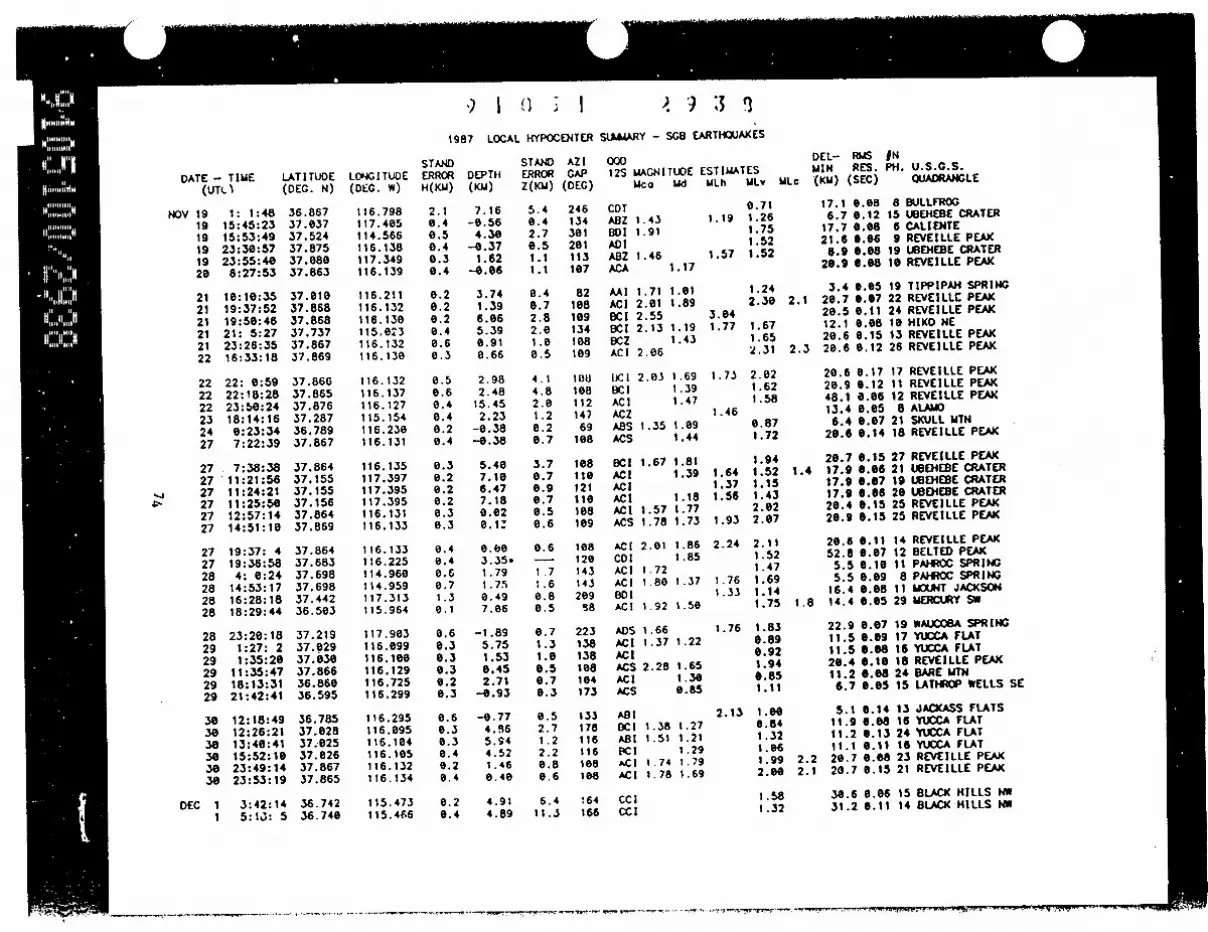
9) I () ; I J) 9 3 I1987 LOCAL HYPOCENTER S(.iARY - SG8 EARTHKES
DATE - TIUE LATITUDE(UTL)I (DEC. N)
NOV 19 1: 1:48 36.86719 15:45:23 37.03719 15:53:49 37.52419 23:30:57 37.87519 23:55:40 37.08020 8:27:53 37.863
21 10:10:35 37.01021 19:37:52 37.86821 19:50:45 37.86821 21: 5:27 37.73721 23:26:35 37.86722 16:33:18 37.869
22 22: 0:59 37.86622 22:18:28 37.86522 23:50:24 37.87623 18:14:16 37.28724 0:23:34 36.78927 7:22:39 37.867
27 7:38:38 37.86427 11:21:58 37.155
-. 27 11:24:21 37.155> 27 11:25:50 37.156
27 12:57:14 37.86427 14:51:10 37.869
27 19:37: 4 37.86427 19:36:58 37.68328 4: 0:24 37.69828 14:53:17 37.69828 16:28:18 37.44228 18:29:44 36.503
28 23:20:18 37.21929 1:27: 2 37.02929 1:35:20 37.03829 11:35:47 37.86629 18:13:31 36.86029 21:42:41 36.595
30 12:18:49 36.78530 12:26:21 37.02830 13:40:41 37;02530 15:52:10 37.02630 23:49:14 37.86730 23:53:19 37.865
DEC 1 3:42:14 36.7421 5:13: 5 36.740
LONG I TUDE(DEG. W)
116.798117.405114.566116.138117.349116.139
116.211116.132116.130115.073116.132116.130
116.132116.137116.127115.154116.230116.131
116.135117.397117.395117.395116.131116.133
116.133116.225114.960114.959117.313115.964
117.903116.099116,100116.129116,725116.299
116.295I16.095116.104116.105116.132116.134
115.473115.466
STANDERRORH(KM)
2.10.40.50.40.30.4
0.20.20.20.40.60.3
0.50.60.40.40.20.4
0.3e.20.20.20.30.3
0.40.40.60.71.30.1
0.60.30.30.30.20.3
0.60.30.30.40.20.4
e.20.4
DEPTH(KM)
7.16-e .56
4.30-0.37
1.62- 0.06
3.741.396.065.390.910.66
2.982.48
15.452.23
-0.38-0.38
5.407.106.477.180.020.1'1
0.003.35.1 .79I .750.497.06
-1.895.751.530.452.71
-0.93
- 0.774.565.944.521.460.40
4.914.89
STAND AZIERROR GAPZ(KU) (DEG)
5.4 2460.4 1342.7 301e.5 2011.1 1131.1 107
0.4 820.7 1e82.8 1092.0 1341.0 1080.5 109
4.1 10o4.8 1082.0 1121.2 1470.2 690.7 108
3.7 1080.7 1100.9 1210.7 110e.s 1es0.6 1e0
0.6 108- 120
1.7 1431.6 1430.8 2090.5 58
0.7 2231.3 1381.0 1380.5 1050.7 1040.3 173
0.5 1332.7 1781.2 1162.2 1160.8 08a0.6 108
6.4 16411.3 166
000 DEL- RMS12S MAGNITUDE ESTIMATES MIN RES.
Uca Md ULh ULv ULc (KU) (SEC)
CDTABZ 1.43BDI 1.91ADIABZ 1.46ACA
AAI 1.71ACI 2.01BCI 2.55BCI 2.13BCZAC! 2.06
WCI 2.03BCIACIACZABS 1.35ACS
BCI 1.67ACIACIAC[ACI 1.57ACS 1.78
ACI 2.01CDIAC 1. 72AC! 1.80DOIACI 1.92
ADS 1.66ACI 1.37AC!ACS 2.28ACIACS
ABIDCI 1.3fAB! 1.51PCIAC! 1.74AC! 1.71
CCIGCc
1.17
1.011.89
1.191.43
1 691.391 .47
1 .09
1 .44
1 .811.39
1.181.771.73
1.861.85
1.37
2 .5e
1 .22
;1.651.300.85
1 1.27l1.21
1.29i .7951.69
0.711.19 1.26
1.751.52
1.57 1.52
1.242.303.04
1.77 1.671.652.31
1.73 2.021.621.58
1.460.871.72
1.941.64 1.521.37 1.151.56 1.43
2.e21.93 2.07
2.24 2.111.521.47
1.76 1.691.33 1.14
1.75
1.76 1.830.890.921.940.851.11
2.13 1.000.841.321.061.992.00
1.581.32
17.1 o.es6.7 0.12
17.7 0.0821.6 0.068.9 6.08
20.9 6.e8
3.4 0.052.1 20.7 6.07
20.5 0.1112.1 0.0820.6 0.15
2.3 20.6 0.12
20.6 0.1720.9 0.1248.1 0.813.4 0.016.4 0.0o
20.6 O.14
20.7 0.1!1.4 17.9 0.O8
17.9 0.0e17.9 o.0l20.4 0.1!20.9 0.1I
20.6 0.1152.8 0.o5.5 0.15.5 0.0
16.4 0.01.8 14.4 o.0o
22.9 0.011.5 0.0W11.5 6.e20.4 0.111.2 0.6.7 0.0
jNPH. U.S.C.S.
QUADRANGLE
8 BULLFROG15 UOEHEBE CRATER
6 CALIENTE9 REVEILLE PEAK
19 U.8EHEBE CRATER10 REVEILLE PEAK
19 TIPPIPAH SPRING22 REVEILLC PEAK24 REVEILLE PEAK10 HIKO NEi13 REVEILLE PEAK26 REVEILLE PEAK
17 REVEILLE PEAK11 REVEILLE PEAK12 REVEILLE PEAK
S 8ALAMO21 SKULL MTN18 REVEILLE PEAK
527 REVEILLE PEAK1 21 UBEHEBE CRATER719 UBEHEBE CRATER1 20 UBEHE8E CRATERS25 REVEILLE PEAKS25 REVEILLE PEAK
1 14 REVEILLE PEAK7 12 BELTED PEAK0 11 PAHROC SPRING
8 PAHROC SPRING811 MOUT JACKSON5 29 UERCURY SW
7 19 WAUCOBA SPRING9 17 YUCCA FLATi 16 YUCCA FLATO 18 REVEILLE PEAK8 24 EARE MTN5 15 LATHROP WELLS SE
5.1 0.14 13 JACKASS FLATS11.9 0.8 16 YUOCA FLAT11.2 0.13 24 YUCCA FLAT11.1 0.11 16 YUCCA FLAT
2.2 20.7 0.08 23 REVEILLE PEAK2.1 20.7 0.15 21 REVEILLE PEAK
30.6 0.06 1S BLACK HILLS NW31.2 0.11 14 BLACK HILLS NW
~. . - _ r ~t~w .~-Ss I VIM _~ I "

) I ') . I 11 ) . )
1987 LOCAL HYPOCENTER
DATE - TIME(UTC)
DEC 1 8:42:161 15:49:331 22:28:182 1e:23:112 21:12:523 18:30:17
3 19:36:313 22: 8: 64 6:59:354 7: 6:424 7:59: 34 9:43:48
5 7:1A: 45 8: 9:575 10:15:145 13:15:246 14:11:606 14:12: e
7 11:17:137 11:27:357 21:47:108 1:27: 08 6:24:358 23:38:12
9 15:49:109 17:16:22
10 2:35:171e 2:37:2310 18: 8:5611 13:31:59
11 19:38:4512 1:29:2612 1:32:3412 1:32:3512 1:33:2912 1:54:39
12 3:53:1012 4: 8: 913 8: 6:1113 5:45:4913 10: 4:2114 6:42: 8
14 19:57:,715 13:33:19
LATITUDE(DEG. N)
36. 73035.82635.81737. e5837. 86837.866
37.86937. 85e36.72536. 71237. e9337.547
36.81637.6 e36.81336.81237.3823 7.388
36. 67436. 67137. 46237.31937.87437.836
36.84237.86636.73736.74136.34436.748
36.58637.85737.85437.85137.85437.860
36.73536.73536.71637.e5636.67637.868
37.86535.825
LONGLITUE(DEG. W)
115.451116.915116.885116.124116. 138116.129
116. 127116.143115.474115.713116.984115.380
115.806115.075115.791115.796117.136117. 1 35
116.184116.187115.514115.182116.125116.143
116.268116.128116.189116,194116.808116.260
117.083116.141116.139116.134116.145116.136
116.192116.193116.274116.121116.309116.135
116.129116.910
STANDERRORH(KU)
0.51.20.60.20.2e.6
8.20.2e.40.58.3e.4
8.60.40.80.50.30.5
8.28.28.30.50.3
e.38.20.28.6e.28.3
e.98.38.3e. 3
8.4e.2
0.30.20.50.20.21.3
0.21.9
DEPTH(KU)
4.80-1.181.150.261.480.88
3.636.07
-1 .dl-1.14-8.41-1.06
2.746.639.417.538.214.66
6.015.78
15. 366.22
-0.5115.89
1e.290.294.824.538.150.96
6.034.789.4810.5612.490.33
4.954.455.120.886.663.05.
-8.13-8. 16
STANDERRORZ(Ku)
2.10. 70.30.71.0
5.91 .90.6e.40.40.5
1.71.31.91.00.31.8
0.80.61.01.98.5
0.50.38.80.80.3(I. 1
5.94.11.51.61.70.3
e.s0.90.40.40.2
0.41e.s
AZIGAP(DEG)
169274319'88
109188
109104165186122167
17995
21321e199198
7094
100131110213
1071es69
22115775
1591061051051s5107
15768214126113176
108276
SL#AAARY - SGD EARTHOUJ
OO012S MAGNITUDE ESTIUAI
Ucc Ud ULh
CCIBDZ 2.26 2.02ADTABZ 1.71 1.44ACS 1.81 1.75BCI 1.51
CCI 2.47AC!ACZ 1.17ADI 1.99 1.35ACI 1.68 1.46ACI 1.11
ACZ 1.85 1.42ABI 1.48 1.42BDS 2.10 1.83ADI 1.35AD[ 1.26ADT 1.26
ABI 1.89 1.74ABI 1.71 1.37ABI 1.50 1.28AC! 1.61 1.27ACZ 1.55AD!
ABIACI 1.83 1.72AS! 2.12 1.45ADIAC!AAI 1.58
CCIBCI 1.50AC!A81ASSACZ
ACI 1.54ABI 1.68 1.34ADIA8Z 1.09AS! 1.56CCA 1.34
ACS 1.88 1.69CDI
2.18
3.04
1 .40
1.47
2.36
kKES
DEL- RUS INrES MIN RES. PH. U.S.G.S.ULv ULc (KU) (SEC) QUADRANGLE
1.54 32.4 0.09 13 BLACK HILLS NW2.23 2.8 15.9 0.12 14 WINGATE WASH1.14 16.4 0.04 7 WINMATE WASH1.54 9.6 0.07 27 YUCCA FLAT2.00 2.3 26.6 0.07 21 REVEILLE PEAK1.63 20.4 0.15 13 REVEILLE PEAK
20.4 0.11 35 REVEILLE PEAK1.82 20.4 0.02 6 REVEILLE PEAK1.59 30.2 0.09 14 BLACK HILLS NW1.47 8.9 0.12 15 INDIAN SPRINGS NW1.41 13.1 0.09 18 SPRINGDALE1.38 17.0 .10 12 UT IRISH
1.85 13.6 0.09 27 FRENCHUAN LAKE SE1.53 13.1 0.09 13 HIKO SE2.17 2.2 13.3 0.15 19 FRENCH*AN LAKE SE1.62 13.2 0.09 21 FRENCHUAN LAKE SE1.27 14.6 0.06 16 STONEWALL PASS1.27 14.0 0.10 16 STONEWALL PASS
2.82 1.882.38 1.711.16 1.50
1.411.421.24
8.561.97
2.31 2.428.531.19
2.47 1.11
1.041.591.881.761.581.50
0.732.22 1.42
0.631.050.96
2.22.31.2
1.3
11.0 0.0811.6 6.0520.0 o.0815.1 0.0720.7 6.0819.7 0.00
5.0 0.0620.3 0.077.4 0.187.0 0.09
21.5 0.061.2 0.09
18.6 0.0720.7 0.0620.3 .0es19.8 0.0624.3 0.0520.5 0.03
7.2 0.097.1 0.093.0 0.059.9 0.044.4 0.0s
20.4 6.13
20.4 0.0715.9 0.0s
39 SPECTER RANGE NW21 SPECTER RANGE NW13 GROOu RANGE NE12 ALAMO13 REVEILLE PEAK
4 REVEILLE PEAK
13 JACKASS FLATS20 REVEILLE PEAK38 SPECTER RANGE NW14 SPECTER RANGE NW17 FURNACE CREEK22 STRIPED HILLS
6 STOVEPIPE WELLS11 REVEILLE PEAK9 REVEILLE PEAK10 REVEILLE PEAK7 REVEILLE PEAK8 REVEILLE PEAK
19 SPECTER RANGE NW34 SPECTER RANGE HW13 STRIPED HILLS9 YUCCA FLAT
19 STRIPED HILLS6 REVEILLE PEAK
14 REVEILLE PEAK7 WINGATE WASH
2.102.28
( C-

J I j j I .*) 1 I I1987 LOCAL HYPOCENTER StUAARY - SG8 EARTHOUAXES
DATE - TIME LATITUDE LONGITUDE(UTC) (DEG. N) (DEC. W)
DEC 151616171717
181819202020
212121212222
2223
li 230% 24
2425
262727282829
3030313131
14: 4:268:50:218:50:36
16:27: 721: 6:5823:33:29
0:19:161:12:227:10: 54:50: 2
11:19:2522:45:57
3: 5:3310:57:3711:11: 415:33:221:28:441:38:47
14:54:489:36:20
14: 7:3216:12:2119:31: 91:33:27
22:28:3212: 1:5218:40:255:29:406:42:261:49:12
19:31:4622:50:423:27:188:12:57
13:37:51
35.83737. 07437.07736. 45236.44536. 449
36. 63536.44637.86836.44637.69636.742
37.85037.01137.23137.01637.01337.014
37.01637. 02037.01036.25237.31237.106
37.57637.01337.88836.41437.86736.499
36.11138.45037.84336.49436. 500
116.908115. 752115. 755115. 738115.768115.759
116.334115. 758116.130115.760115. 0.9116.008
116. 143116.187116.373116.191116. 186116.173
116.173116.212117.961117. 212115.894116.868
117.782116. 188116. 123117.534116. 129115. 125
115.364116.056116.142115.114115.127
STANDERRORH(KU)
1.70.20.4e.60.30.3
0.6e.3e.40.20.20.2
0.80.20.20.20.20.6
e.40.81.3
e.60.2
0.50.20.70.40.91.4
1.11.60.90.70.8
DEPTH(Ku)
-0.432.01
11.3611.23-e.es
0.26
3.76-0.38-e.030.121.43
-1.00
9.391.83
-0.821.882.593.58
3.742.5611 .935.445.97
-0.38
0.591.750.224.923.96.
14.46
2.1611.282.53
16.4315.47
STAND AZIERROR GAPZ(KM) (DEG)
1.4 2751.6 1091. 1901.2 1510.4 930.4 93
0.5 2730.4 930.6 1090.3 930.7 1150.4 108
2.8 1040.4 910.2 730.5 920.4t 821.e 210
0.8 2100.7 2614.24+ 242- 2541.0 1840.3 150
0.9 1390.5 1380 .6+t 2510.84+ 224- 2741.2 249
3.1 2950.7 2613.7 2380.5 2420.6 240
OOD12S MAGNITUDE
UcO Md
BDZ 1.52ACI 1.70ADIACI 1.46 1.12ACI 1.15ACI 1.76
ADZ 0.59ACZ 1.34ACI 1.65ACI 1.68 1.44ACS 1,11A8 1.83 1.17
8CIABI 1.36 0.87AAS 2.20ABI 1.29 1.26MI 1.64 1.23ADI 1.20 0.88
ADI 1.41ADIBDI 2.26ADA 2.12ADS 2.04ACS 1.88
ACI 1.42ACI 1.36 1.24ADI 2.08ADS 1.21CDI 1.51BDI 1.47
BDSBDI 2.87
ADI 2.12ADI
ESTIMATESULh ULv ULc
1.911.43 1.601.17 1.20
1.381.37 1.51.74 1.5
8.841.351.74 1.7
1.61 1.461.141.24
1.250.921.758.90 0.91.198.82
0.980.252.66 2.3
2.31 2.71.93
1.72 1.590.85
2.'v9 2.601.44I.801.81 2.0
1.834.35
1.642.031.58
DEL-UIN(KU)
14.527.326.919.920.821.1
1.220.720.620.911.010.0
20.44.84.84.24.75.6
5.62.4
37.344.111.013.4
15.64.5
59.044.867.03.2
30.683.665.24.43.0
RU.S fNRES. PH. U.S.G.S.
(SEC) OUADRANGLE
0.06 9 WINGATE WASH0.07 22 PAPOOSE LAKE SE0.04 9 PAPOOSE LAKE SE0.08 15 CHARLESTON PEAK0.11 23 UT STIRLING4.12 24 UT STIRLING
0.08 16 STRIPED HILLS0.12 23 UT STIRLING0.13 16 REVEILLE PEAK0.09 24 UT STIRLING0.03 9 HIKO NE0.09 24 CAMP DESERT ROCK
0.07 7 REVEILLE PEAK0.07 20 TIPPIPAH SPRINC0.07 23 AM"NIA TANKS0.08 16 TIPPIPAH SPRING0.09 24 TIPPIPAH SPRING0.08 15 TIPPIPAH SPRING
i0.8 19 TIPPIPAH SPRING0.02 5 TIPPIPAH SPRING0.12 12 WAUCOBA SPRING0.10 4 EUICRANT CANYON0.09 19 GROOM MINE SW0.06 22 SPRINCDALE
0.08 10 PIPER PEAK0.07 16 TIPPIPAH SPRING0.10 17 REVEILLE PEAK0.06 16 DARWIN0.06 14 REVEILLE PEAK0.14 14 CASS PEAK NW
0.09 12 BLUE DIAMOND SE0.11 32 SCaoeln0.07 12 REVEILLE PEAK0.09 18 GASS PEAK NE
0.08 13 HAYFORD PEAK
.~ ~ ~~~~~ ~ ~ ~ ~ ~ I I R 11 wi" o - I- -i - - -

I ! I
198B LOCAL HYPOCENTER Slk4ARY - 5Gt EARTHQUAKES
DATE - TIlME(UTC)
JAN 1 15:38;881 22:51:392 8:19:412 11;15:602 13: 9:532 15:48:38
2 19:38:452 23: 7: 13 8:36:303 9: 5:443 10:12:213 22: 8:56
4 11:14:494 15: 5:394 15:49:564 20:58: 16 2:41:466 5:19: 4
6 8:21:557 10: 6: 87 13:57:278 16:33: 88 20: 1: 88 20:27:58
8 23:16:539 3:44:169 11:31:539 18:40:589 16:54:51
10 18:51:33
11 2:13:5312 13:46:2812 14:53:2013 9:35:2813 20:29:4314 2:23:55
14 2:54: 614 5:16:3314 5:29:5614 5:46: 814 5:49:1614 7:35:11
14 7:35:5514 9:27:18
LATITUDE(DEC. N)
37.85337.85537.85337. 45637.12738.480
37.85437.31736.67736.67636. 73636.435
37.85137.01837.92837.84837.85237.937
36.57337.12937.86037.07637.85237.49e
37.33237.29337.58937.85736.19237.313
37.03236.26837.18536. 59136.42636.765
36.67736.68136.68036.68136.76436.679
36.68136.683
LONGI TUDE(DEG. W)
116.128116.129118.132115.42411.8le1116.040
116.132115.066116.339116. 339116.188115.767
116.132116.460117.620116.137116.136116.152
115.613115.224116.138115.762116.131115.770
116.469114.814115.680116.148115.498114.657
116.248117.408115.793117.097115.703116 .66
116.339116.328116.329116.328116.8"6116.323
116.328116.329
STANDERRORH(KM)
0.48.50.3e.3o.31.e
e.48.80.30.30.28.4
8.40.20.70.58.6
8.51.8e.38.48.5
8.21.42.8
0.7
0.30.68.38.38.3e.4
8.30.20.40.20.48.4
8. 1e.3
DEPTH(KM)
-0.250.80*.8.72..
11 .576.863.18.
0.62-0.7918.7210.403.73
-8.94
1.4510.481.958.803.15.3.16
3.148.89
-0.250.538.280.74
0.8810.761.290.3714.15-0.23
5.781.188.03
7.108.97
10.499.98
10.1010.069.3210.56
18.e810.22
STAND AZIERROR GAPZ(Kw) (DEG)
8.7 1060.9 1068.5 ie6I.94 lee1.8 189- 256
0.7 106- 1718.2 1328.3 1321.0 1850.4 173
1.3 1850.5 1323.4 21a0.9 104- 241- 274
- 2470.8 1881.8 1678.5 1286.7 1866.7 58
8.3 613.4 2223.9 121- 244- - 3260.8 229
8.7 652.0 2360.9 1021.14- 1171.84+ 086.6 135
e.3 1316.3 470.4 1570.3 540.7 1460.5 169
8.2 548.4 155
0DO12S MAGNITUDE ESTIMATES
Uca Md MLh MLv I
ACIACZ 1.43ACZ 1.82 1.77ACIABI 1.35CDI 1.91 1.83
ACZ 2.09ADZ 1.34ABI 1.18 0.95AS! 0.83 8.52ASI 1.30 8.96ACZ 1.81
BCZ 1.56 1.45AS! 1.16 0.88801 1.87BCZ 1.58 1.78CDA 0.96CDA 1.80
ADA 0.57ADI 1.31AC1 1.28ACZ 2.23 1.84ACI 1.60 1.74ACZ 1.52
ACZ 1.58BOA 2.26CEA 1.23ADA 0.92ADA 0.92ADZ 1.77 1.45
MI 2.67 1.61130! 1.52 1.38ACI 1.74 1.50ACI 1.85 1.62ACI 1.51 1.14ASI Ill
A8! 0.86MU 1.95 1.68ACI 0.75MI 1.78 1.66AC!ACI
^Al 1.81 1.75ACI
1.491.70
1.96 2.161.10 1.12
1.352.11
8.d70.630.82
1.55 1.810.792.84
1.67 1.93
1.72
1.43
1.521.382.211.861.64
1.11
DEL- RYS INMIN RES. PH. U.S.G.S.
ULc (KU) (SEC) QUADRANGLE
19.5 0.12 13 REVEILLE PEAK19.7 0.11 13 REVEILLE PEAK19.8 0.13 25 REVEILLE PEAK26.0 8.08 16 CRESCENT RESERVOIR
1.2 10.9 0.08 20 OAK SPRING44.1 0.18 9 *.*QUAD. NOT LISTED.
19.9 0.12 19 REVEILLE PEAK16.0 0.80 5 ALAMO SE3.5 8.05 21 STRIPED HILLS3.4 0.05 17 STRIPED HILLS7.6 0.08 24 SPECTER RANGE NW20.5 0.05 10 MT STIRLING
19.7 0.17 17 REVEILLE PEAK1.6 6.8 0." 19 TIMBER UTN2.3 28.7 0.07 11 SILVER PEAK2.2 19.9 0.15 17 REVEILLE PEAK
20.0 0.03 5 REVEILLE PEAK27.2 0.48 4 REVEILLE PEAK
28.1 0.09 4 INDIAN SPRINGS SE5.5 0.06 11 LOWER PAHRANAGAT LAKE20.7 0.14 8 REVEILLE PEAK26.5 0.10 28 PAPOOSE LAKE SE19.6 0.13 1 REVEILLE PEAK16.5 0.12 11 GROOM MINE NE
15.8 0.06 24 SILENT BUTTE24.5 0.10 8 CREGERSON BASIN3.0 0.27 6 TEVPIUTE MTN21.2 0.13 4 REVEILLE PEAK16.3 0.0 4 LA MADRE MTN33.3 G."4 8 ELCIN SW
2.0 1.8 0.12 31 TIPPIPAH SPRING32.0 0.06 17 PANAMINT BUTTE16.5 .n" 30 PAPOOSE LAKE NE17.3 0."9 28 STOVEPIPE WELLS15.7 0.07 26 CHARLESTON PEAK13.5 0."9 22 CANE SPRING
3.5 0.07 19 STRIPED HILLS4.1 0.0a 44 STRIPED HILLS4.0 0." 15 STRIPED HILLS4.1 0.07 34 STRIPED HILLS13.6 .068 17 CANE SPRING4.0 0.07 13 STRIPED HILLS
4.0 0.06 42 STRIPED HILLS4.3 0.04 9 STRIPED HILLS
1.75 1.82
1.631.36 1.60
1.661.99
1.36 1.451.10
0.862.59 2.09
0.921.96 1.30
0.800.70
2.36 2.010.40
9� i(

) I ) ; I .. ) I 2)
1988 LOCAL HYPOCENTER SUL44ARY - SG8 EARTHFUAXES
DATE - TIME(UTC)
JAN 14 9:27:2714 14:59: 314 19: 8:5214 21:38:5914 22:17:3915 11:22:33
I5 11:30: 115 11:47:3815 18:56:4315 19;46:5615 21:42:3016 4:29:20
16 5:53:2616 14: 6:4017 3: 5:3817 9: 7:3218 3:30:1118 4:12:60
18 6: 6:5216 6: 12:5218 6:23:2018 6:24: 518 6:47:3118 23:52:38
19 8:32: 819 15: 1:2420 7:55:1220 18:50:2620 21:22:3122 10:50: 9
23 5:57:3423 11:40:2123 17:52:1724 5;16:4824 12:48:4426 11:50:35
26 11:57:3326 12:18:1626 12:18:1526 18:17:2226 19: 7: 626 23:54:10
27 5:59:5427 12:23:23
LATI TUDE(DEG. N)
36.67837.85438.67736.68236.68138.682
36.68638.68838.68237.33436.67538.679
38.68036.51737.85537.19137.85137.225
37.23937.23837.23237.23937.23636.307
36.87337.22637.e9636.67436.74336.814
37.81537.85237.39237.84936.81938.442
36.44536.99437.23437.19036.42237.852
37.27136.443
LONG ITUDE(DEG. W)
116.335118.129116.331116.33110.331116.334
118.340118.337116.332117. 768116.341116.328
116.329115.782116.129117.398116.135114.997
117.305117.313117.319117.328117.314117.119
115.973117.322116.411116.337115.822115.386
115.s53116.131117.231116.133115.799114.861
115,759117.884117.648116.746116.936116.131
116.305115.758
STANDERRORH(KY)
0.36.60.36.46.36.3
0.36.36.36.46.36.3
8.20.56.36.20.51.3
0.36.56.40.40.41.6
0.26.46.20.51.16.6
0.36.40.60.6e.54.3
0.20.96.20.26.38.3
1.10.2
STANDDEPTH ERROR(KW) Z ()4
16.34 0.30.66.. 1.o
10.23 6.310.02 6.49.94 6.3
16.04 6.3
9.16 6.39.38 6.4
10.01 6.4-0.84 6.616.49 8.316.13 6.3
16.10 6.26.68 6.66.66.. 6.6
- 1.18 6.36.27 6.88.32 2.3
a.37 6.56.97 1.64.43 1.35.86 6.96.92 e.8++7.93 0.8
1.96 6.74.20 1.86.17 6.38.73 0.54.65 1.8
-4.72 1.0
2.36 1.26.53 6.72.66 1.96.26 1.14.59 2.67.e6 1.6
0.23 0.36.21 6.86.00.. 2.56.68 6.5
12.20 1.10.74 6.6
2.95 0.6-e.64 6.3
AZ]GAP
'DEG)
144106156155l5S4147
141151158136114
116164166114165243
65838584
183
196
1258781
27622817
99165124195182273
93241157
69117166
26794
Om12S
AC]ACIACIACIACI
ACIAC!ACI
ACI
AC2ACI
ADIAC2ACZACIBD!
MIA81ABZABIAB!801
ACIACIA8ZADIBDZACT
ACZACZACAACIBDICDI
AC2AD!DC2MAIAB!ACZ
BOI
MAGNITUDE ESr MATESmco Md UdLh MLv
e.68 6.771.34 1.641.28 6.71
6.781.31 6.68 6.77
1.17 0.72
6.686.94 0.89
6.731.31
6.9s e.990.79
1.57 1.08 1.110.61 1.15 1.11
1.86 1.79 2.61 2.191.62 1.16 1.071.50 1.67
1 .33
1.370.97 1.451.67 1.27
1.42 1.121.47 1.17 1.59
1.09
1.65 1.69 1.341.07 1.51
1.48 1.13 1.231."1.06
1.36 1.62
2.66 1.80 1.82 2.151.76 1.836.99
1.55 1.68 1.831.90 1.78 1.99
3.17 2.96
1.17 1.13 1.371.35 1.411.27 0.90
2.08 2.41 2.141.29 1.32 1.26
1.95 2.05 2.22 2.12
1.43 1.691.03 1.23 1.11
DEL- RMIS INUIN RES. PH. U.S.G.S.
MLc (KM) (SEC) QUADRANGLE
1.2 3.7 8.06 16 STRIPED HILLS19.6 6.14 14 REVEILLE PEAK3.6 0.64 13 STRIPED HILLS4.1 0.06 12 STRIPED HILLS4.0 0.04 11 STRIPED HILLS4.0 0.04 13 STRIPED HILLS
4.6 0.05 14 STRIPED HILLS4.5 6.65 14 STRIPED HILLS4.1 0.04 9 STRIPED HILLS
15.5 0.09 11 SOLDIER PASS3.3 6.ts 17 STRIPED HILLS3.9 0.05 13 STRIPED HILLS
1.5 3.9 0.06 20 STRIPED HILLS22.6 0.07 11 MERCuRY SE19.7 0.13 23 REVEILLE PEAK17.4 0.04 13 U8EHEBE CRATER19.0 0.15 17 REVEILLE PEAK18.6 6.6 6 DELAMAR 3 MA
8.0 .f5 11 UDEHEBE CRATER8.7 0.11 15 USEIEBE CRATER9.4 0.11 19 U8EHEDE CRATER8.9 0.09 16 U8EHE8E CRATER8.8 6.16 17 UBEHE8E CRATER6.7 6.07 7 EMIGRANT CANYON
1.5 17.5 6.68 21 FRENCHAAN FLAT10.1 0.60 11 UBEHEEE CRATER
1.1 7.1 0.66 19 TIMBER MTN9.5 0.04 9 STRIPED HILLS5.5 6.06 10 MERCURY NE
30.5 0.12 8 DOG BONE LAKE SOUTH
2.1 16.3 6.11 2019.6 6.14 18 REVEILLE PEAK16.3 0.10 9 STONEWALL PASS19.7 0.15 14 REVEILLE PEAK
2.1 13.9 0.16 22 FRDECHMAN LAKE SE3.1 64.8 0.19 14 oooQUAD. NOT LISTED.
20.8 6.09 22 UT STIRLING33.9 0.68 11 WAUCOBA WASH0.2 2.16 11 LAST CHANCE RANGE
2.1 5.2 0.09 38 THIRSTY CANYON NW14.3 .10 17 FUlNACE CREEX
2.6 19.7 6.13 24 REVEILLE PEAK
6.5 6.68 12 DEAD HORSE FLAT20.6 0.08 21 MT STIRLING
FM -9

) I *i; I ') 1 ;3
1988 LOCAL HYPOCENTER
DATE - TIME(UTC)
JAN 27 17:37:4627 22: 5:4728 14:58:5328 16:47:1230 1:38:1130 6:57: 6
30 16: 4:1430 18:38: 6
FEB 1 15:50:511 18:37:463 15:47:223 21:13:22
4 4:56:254 4:50:324 23: 6: 25 0:36:295 II: 6:555 11:18:46
5 5 11:50:555 11:53: 15 12:20: 65 13:43: 55 22:43:386 2:58:36
6 8:12:486 12:58: 36 18:46:337 6:23:427 13:47:187 16:47:42
7 17:16:328 4:30:338 7:52:479 10:32:339 11:28: 59 11:29:22
9 11:52:4816 6:21:1816 15: 1:3916 17:22:5516 17:24:53le 17:26:11
16 20:43:5816 20:44: 2
LATITIW E(DEC. N)
37.86537.54938 .40236.77038.38737.853
37.51636.44736.99638.73836.76336.800
38.36837.99535.96835. 94737.79235.940
37. 78237 .80437.79935.94835.93937.214
35.95436.37635.95035.94235.93637.654
37.36437.86537. 16137.22636.68138.679
36.68135.68736.82835.94635.95435.942
35 .95536.1863
LONGITUDE(DEG. W)
116.134117. 562114.895115.558114.878118.12J
118.02511S.7571186.87116.429115.844115.803
114.946115.326116.763116.776118.152116.774
118.135118.192118.150116.768116.804116.487
118.778117.476116.774116.782116. 793116.056
115.445116.131116.615117.566116.324116.329
116.339116.768116.749116.768116.779116.765
116.76B116.621
STANDERRORH(KMs
0.48.43.46.74.20.4
1.8
0.20.21.56.46.8
2.44.73.51.85.21.1
5.21.25.26.96.50.2
1.40.81.11.61 .0.4
0.26.46.36.46.26.3
6.48.76.51.61.53.2
2.22.6
DEPTH(KM)
-0.29-0.51
8.0e..3.27.6.96
-0.0e
5.298.256.847.78
-1.53-1.02
-1.547.68.4.942.992.58sO.67
-0.183.0-1.50s3.21.2.69.
-0.23
4.975.955.573.225.394.51
e.58-0.344.959.549.409.85
9.377.602.605.415.765.00.
9.527.60
STANDERRORZ(KM)
e.78.53.5
3.46.8
2.26.36.40.86.81.0
1.6
11.84.0
2.8
4.0
0.3
3.36.62.51.86.43.8
6.26.71.6+6.76.46.5
8.57.26.92.12.99.5
2.81.5
AZIGAP
(OEG)
168185269
97269186
25693
133302146211
264194197212307218
303316300306313165
207238210218291112
130le11911335676
148288307213267215
288 -28t
SLU&ARY - SG8 EARTHQUAKES
000125 MAGNITUDE ESTIMATES
Mca Md MLh MLv I
ACI 1.60 1.73ADZCOZ 2.48GCA 1.36CDZACI 2.23
801 1.78ACI 1.87ACI 1.45 1.83BOIACI 1.73 1.42ADZ 1.76
BOZ 2.05 1.51DOI 2.85 1.44CDA 1.588DI 2.18DD1 1.52801 2.89
DDI 1.70COI 1.46DDICWI 1.37DDI 1.44ACZ 1.67 1.61
801 2.04COI 1.39E8OZ 1 .89 1.60ADZ 2.16CDI 1.51BCI 2.11
ACZ 1.86 1.32ACI 1.50ADIABI 1.53MI 1.62AA) 1.49
ACI 6.65DDA 1."eADI801 2.14E01 2.43CWA 1.69
1.55 1.881.32 1.222.69 2.65
2.55
1.881.811.193.621 .3a1.32
2.12 2.631.88 1.62
2.131.782.13
1.941.591.441.441.431.10
1.95 2.101.621.87
2.39 2.211.43
2.16 1.98
1.17 1.291.6.6.95
6.842.14 2.04
2.89
1.186.84
DEL- RYS fNMIN RES. PH. U.S.G.S.
MLc (KM) (SEC) QUADRANGLE
26.7 6.13 17 REVEILLE PEAK13.3 0.09 12 LIDA WASH
2.4 59.7 0.16 11 sooQUAD. NOT LISTED.24.1 0.16 11 TIM SPRING58.5 8.15 1O -**QUAD. NOT LISTED.19.6 8.11 15 REVEILLE PEAK
1.9 14.5 e.68 16 .oo0UAD. NOT LISTED.26.7 e.68 16 MT STIRLING15.5 0.06 12 YUCCA LAKE
116.6 0.68 14 --*QUAD. NOT LISTED.11.5 6.69 16 MERCURY NE21.0 6.69 12 FRENCHUAN LAKE SE
55.0 6.16 7 SILVER KING WELL23.5 1.53 79.4 6.19 7 WINCATE WASH9.6 6.11 12 WINGATE WASH
2.6 31.9 6.11 12 ...OUAD. NOT LISTED.2.3 8.9 0.11 12 WINGATE WASH
30.2 6.16 16 *--OUAD. NOT LISTED.35.6 6.67 7 **QOUAD. NOT LISTED.31.9 6.67 sooQUAD. NOT LISTED.27.8 6.67 6 WINGATE WASH29.8 6.69 6 WINGATE WASH14.5 6.69 26 SCRUGHAM PEAK
8.2 6.11 13 WINGATE WASH48.0 6.11 17 PANAMINT BUTTE8.6 6.10 1 WINGATE WASH8.1 6.14 22 WINGATE WASH
29.8 6.11 9 WINGATE WASH13.5 6.22 36 YUCCA FLAT
29.3 6.64 11 CUTLER RESERVOIR20.5 6.13 15 REVEILLE PEAK16.8 6.67 13 YUCCA FLAT7.2 6.69 19 LAST CHANCE RANGE4.2 6.68 27 STRIPED HILLS3.9 6.67 18 STRIPED HILLS
3.9 6.65 16 STRIPED HILLS12.4 0.52 5 WINGATE WASH11.4 6.e5 14 BARE HTN
2.3 9.2 6.6 18 WINGATE WASH8.1 0.12 15 WINGATE WASH9.5 6.26 7 WINGATE WASH
27.6 6.16 7 WINGATE WASH5.6 1.26 7 FUNERAL PEAK (( Ik

-
) I I') , I .) 4 .1
1988 LOCAL HYPOCENTER
DATE - TIME LATITUDE(UTC) (DEG. N)
FEB 11 5: 8:36 35.94911 18:42:51 38.00211 22:32:15 36.29812 6:54:53 37.33612 19:25:47 36.65113 14:12:25 37.576
13 17: 6:11 36.44713 17:17:45 36.71013 18:48: 6 37.2e713 19:52:39 36.-7214 0:52:15 37.29114 3:23:54 35.668
14 tl: 5:42 37.48215 6:31:48 37.33815 6:55:56 36.80215 13:Z4:52 36.63115 20:51:46 36.67915 21:28: 9 36.680
co 28 4:29: 2 38.6770 28 5:12:47 36.726
20 12:33:31 37.11728 22: 3:54 36.83021 0:33:37 36.65922 7:33:15 37.808
22 11:32: 6 37.71022 20:43:39 37.07822 23:32:48 37.24323 7:33:33 36.61024 20:11:59 36.71725 3:41:51 36.993
25 23: 0:28 37.30726 13:34:12 36.73326 15:33: 9 36.86226 16: 1:16 56.86026 16:18:23 36.85126 18:38: 2 37.242
27 2: 8:16 36.99428 20: 0:38 36.79329 0:46:36 37.24429 12:30:27 37.43329 13:23:40 37.871
MAR 1 8:26:46 37.281
1 17:34:47 36.5061 17:34:52 36.698
STANDLONGITUDE ERRDO(DEG. W) H(KM)
116.767 5.6115.295 3.1116.066 9.3114.930 6.5115.859 1.2117.740 6.5
115.764 9.2116.292 0.5117.587 0.7116.297 0.3117.625 0.3116.608 1.6
117.579 8.4114.966 6.9116.195 0.4116.320 6.2116.330 0.2116.326 0.2
116.331 2.5116.357 1.5117.330 6.6116.218 0.4115.688 0.4115.808 0.3
115.063 0.3116.163 0.2117.913 1.0118.fg1 5.8116.205 0.2116.111 6.4
114.939 6.3116.102 6.2116.244 0.4116.245 0.2116.240 0.4117.922 0.5
117.867 1.2116.233 6.5115.104 4.4114.577 6.4116.127 8.8114.733 e.8
114.589 3.8114.957 5.0
DEPTH(KU)
2.18.1.76
-1 .02.1.46
-1.217.42
13.37-4.224.727.67
-1.3714.65
-4.217.06
-0.318.77
10.2010.30
1.23.-1.675.678.53
-1.28*e.28
8.061.731.175.09.832.64
0.59-0.631.79
-0.322.9016.81
2.22e.898.956.500.80.6.12
-1.54*2.21.
STAND AZIERROR GAPZ(KU) (DEG)
- 216
7.5 199- 2150.9 2618.7 2522.6+ 119
0.6 1680.3 1851.3 1610.4 1780.3 1470.5 273
0.3 733.4 19I6.4 1056.4 710.2 1170.2 III
- 3071.7 2503.7 1080.4 129- 1360.4 143
1.2 113e.8 1651.7 225- 303
0.3 1300.7 123
0.3 2070.4 1121.3 810.2 950.6 1070.4 225
3.7 2290.7 1712.9 1831.9 2781.4 1091.5 * 254
- 279- 227
SLL#AARY - SCB EARTHQUAKES
00012S MAGNITUDE ESTIMATES
Uca Md MLh MLv
WDACOADOZADIBDZ8CI
ACTADIACIACIACI
CDIAB!
SDIABIMIA31A81
CDIDDZ
8CAABICCAACZ
ABIACZADAWOAABIAS!
ADZACZe8!ABZABIADI
BOZACIcoDADIACZADI
CDZcot
1.66
1.161.e8 1.31 1.16
1.311.26
6.68 0.97
0.58 1.66 6.476.870.74
0.88 6.882.41
1.411.41 1.511.63 1.14
1.34!.92 1.1t1.67 1.64
1.691.571.611.421 .44
6.761.521.656.96
2. I1.44
1.42 1.291.58
1.841.40
DEL- RIS INMIN RES PH. U.S.G.S.
MLc (KA) (SEC) QUADRANGLE
9.2 6.21 8 WINGATE WASH23.9 6.25 916.2 1.36 6 MT SCHZDER SE13.3 P.06 16 DELAMAR LAKE9.2 0.67 8 MRCURY NE
16.4 6.S8 9 LIDA WASH
21. 5O 04 12 UT STIRLING4. 86.64 11 STRIPED HILLS
1.3 6.6 0.12 13 LAST CHANCE RANGE5.6 6.e5 16 STRIPED HILLS6.8 6.62 8 MAGRUDER MTN
4I.4 6.16 15 LEACH LAKE
8.5 6.16 12 MAGRUDER MTNa 27.1 0.9 9 DELAWAR LAKE
2.6 6.2 6.11 20 SKULL MTN2 2.3 0.07 21 STRIPED HILLS1 :3.8 6.05 19 STRIPED HILLS8 4.0 6.e6 26 STRIPED HILLS
16.5 0.65 5 STRIPED HILLS15.4 6.06 6 STRIPED HILLS13.2 667 7 UBEHE8E CRATER5.2 6.04 16 SKULL MYN
11.8 0.10 17 INDIAN SPRINGS NI5 1.7 13.2 0 5 16
5 1.7 12.9 6.67 19 HIKO NE8 17.7 0.08 17 TIPPIPAH SPRING
20.3 6.69 12 WAUCOBA SPRING65.6 6.26 5 *..QUAD. NOT LISTED.
7 6.7 6.es 15 SPECTER RANGE W2 8.4 6.11 17 YUCCA LAKE
1 14.8 0.05 1e DELAMAR LAKE3 14.8 6.07 21 CAMP DESERT ROCK8 1.3 6.4 0.17 22 SKULL MTNa 6.4 6.09 16 SKULL WTN6 6.4 6.16 14 SKULL MTN1 2.4 26.4 6.68 17 WAUCO8A SPRING
9 46.3 0.14 14 WAUC08A WASH52 6.6 0.08 8 SKULL ITN3 11.2 6.O8 7 LOER PAHRANAGAT LAKE4 23.9 0.04 9 ELICN NESB 26.6 0.14 8 REVEILLE PEAKa8 31.5 6.67 11 ELGIN SW
14 51.2 0.04 6 UBAPA12 28.6 0.46 6 ARO CANYON
1 .391.52 6.941.64 1.241.29 1.18
1.112.27 1.85
1.82 1.796.781.061.241.48
1.4
1.53 1. 11.01
6.7
6.9
1.47 1.21.10.90.90.62.6
2.06.6
1.42 1.11.31.3
1.11 1.3
2.41 .e
2.242.19
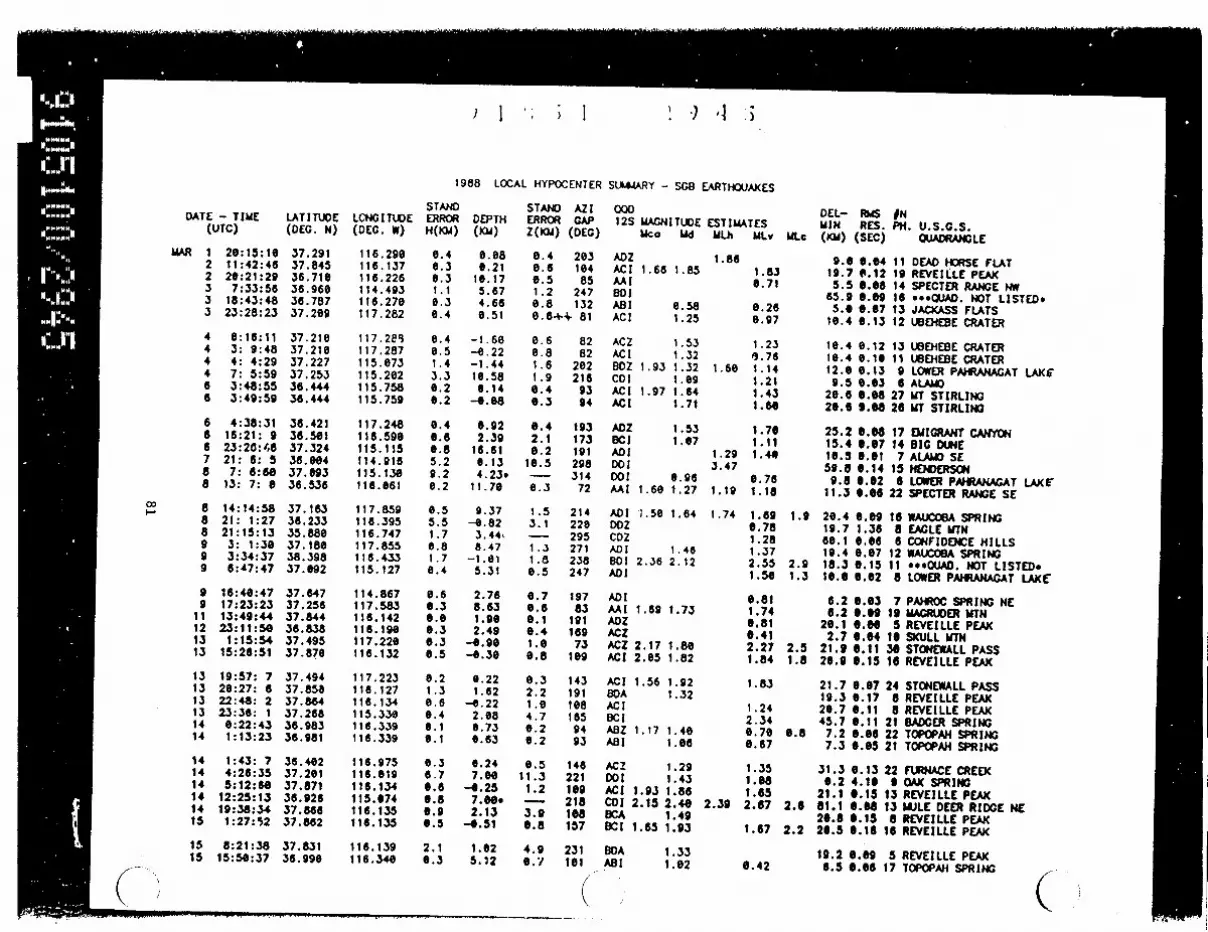
) I ; I ' 1 I :;
1988 LOCAL HYPOCENTER SUUUARY - SG8 EARTHOUAKES
DATE - TIME LATITUDE(UTC) (DEC. N)
MAR 1 20:15:10 37.2912 11:42:46 37.8452 20:21:29 36.7103 7:33:56 36.9603 18:43:48 36.7873 23:28:23 37.209
4 6:16:11 37.21e4 3: 9:48 37.2184 4: 4:29 37.2274 7: 5:59 37.2536 3:48:55 36.4446 3:49:59 36.444
6 4:38:31 36.4216 16:21: 9 36.5816 23:20:48 37.3247 21: 6: 5 38.0048 7: 6:68 37.e938 13: 7: 0 36.536
0 8 14:14:58 37.1638 21: 1:27 36.2338 21:15:13 35.6809 3: 1:38 37.1889 3:34:37 38.3989 6:47:47 37.092
9 16:40:47 37.6479 17:23:23 37.256
11 13:49:44 37.84412 23:11:50 368.&3813 1:15:54 37.49513 15:26:51 37.676
13 19:57: 7 37.49413 26:27: 6 37.85813 22:46: 2 37.86413 23:36: 1 37.26814 6:22:43 36.98314 1:13:23 36.981
14 1:43: 7 36.44214 4:26:35 37.20114 5:12:60 37.87114 12:25:13 36.92614 19:38:54 37.86615 1:27:52 37.8J2
1s 8:21:38 37.83115 15:50:37 36.990
LONCGITUOE(DEC. W)
116.290116.137116.226114.493116.270117.282
117.2EI117.287115.673115.202115.758115.759
117.248116.590115.115114.916115.130116.061
11 7.59116.395116.747117.855116.433115.127
114.867117.583116.142116.190117.220116.132
117.223115.127116.134115.330116.339116.339
116.975116.019116.134115.074116.135116.135
116.139116.340
STANDERROR DEPTHH(Kd) (KM)
6.4 6.086.3 6.210.3 16.171.1 5.676.3 4.666.4 0.51
e.4 -1.608.5 -e.221.4 -1.443.3 16.580.2 6.140.2 -4.08
0.4 0.926.6 2.396.8 16.615.2 0.139.2 4.23.0.2 11.70
6.5 9.375.5 -0.821.7 3.44t6.8 8.471.7 -1.610.4 5.31
0.6 2.766.3 8.630.0 1.906.3 2.490.3 -0.906.5 -4.36
0.2 6.221.3 1.626.6 -4.220.4 2.080.1 6.730.1 6.63
0.3 6.246.7 7.800.6 -4.250.8 7.60.0.9 2.130.5 -4.51
2.1 1.026.3 5.12
STAND AZ! OQOERROR GAP 12S MAGNITUDEZ(KU) (DEC) MCa Md
0.4 203 ADZ0.6 104 ACI 1.66 1.850.5 85 AMA1.2 247 BDI0.8 132 ABI 6.580.644 81 AC! 1.25
0.6 82 ACZ 1.53e.8 82 ACI 1.321.6 202 BDZ 1.93 1.321.9 216 CDI 1.096.4 93 AC! 1.97 1.640.3 94 ACI 1.71
0.4 193 ADZ 1.532.1 173 BCI 1.676.2 191 AD!
16.5 298 DOI- 314 DDI 0.960.3 72 MI 1.60 1.27
1.5 214 ADI L.50 1.643.1 220 DDZ- 295 CDZ1.3 271 AD! 1.461.8 238 90! 2.36 2.120.5 247 AD!
0.7 197 ADI0.6 63 MI 1.69 1.736.1 191 ADZ0.4 169 ACZ1.0 73 ACZ 2.17 1.800.8 169 ACI 2.65 1.82
0.3 143 ACI 1.56 1.922.2 191 BOA 1.321.0 168 AC!4.7 165 8CI0.2 94 A8Z 1.17 1.440.2 93 AB! 1.06
e.5 146 ACZ 1.2911.3 221 DOI 1.43
1.2 109 AC! 1.93 1.86- 218 CDI 2.15 2.403.9 104 SCA 1.490.8 157 BCI 1.65 1.93
4.9 231 BDA 1.330.7 161 AD! 1.02
ESTIMATESMLh ULv
1.861.830.71
0.266.97
1.236.76
1.60 1.141.211.431.64
1 .701.11
1.29 1.403.47
6.761.19 1.18
1.74 1.690.781.281.372.551.50
0.811.746.810.412.271.84
1.83
1.242.346.706.67
1.351.081.65
2.39 2.67
1.67
0.42
DEL- RuS INMIN RES. PH. U.S.G.S.MLc (KM) (SEC) QUADRANGLE
9.0 0.04 11 DEAD HORSE FLAT19.7 0.12 19 REVEILLE PEAK5.5 0.08 14 SPECTER RANGE R#
65.9 0.09 16 *s*.CJAD. NOT LISTED.5.0 0.07 13 JACKASS FLATS
10.4 0.13 12 UBIEHEBE CRATER
1e.4 0.12 13 UBEHEtE CRATER16.4 0.10 11 UBEHEBE CRATER12.6 6.13 9 LOWER PAHRANAGAT LAKf9.5 0.03 6 ALMO
20.6 0.8s 27 MYT STIRLING20.6 s.08 26 MT STIRLING
25.2 0.08 17 EMIGRANT CANYON15.4 0.07 14 B10 DUNE16.3 6.01 7 ALA&. SE59.8 0.14 15 HENDERSON9.8 0.02 6 LOWER PMUAHAGAT LAKE
11.3 0.086 22 SPECTER RANGE SE
1.9 20.4 0.09 16 WAUCOBA SPRING19.7 1.36 8 EAGLE MTN60.1 0.06 6 CONFIDENCE HILLS19.4 6.07 12 WAUCOOA SPRING
2.9 18.3 0.15 11 *.OUAIo. NOT LISTED.1.3 16.0 0.62 8 LOWER PAHRANAGAT LAK'
6.2 0.03 7 PAHROC SPRING NE6.2 0.os 19 MAGRUDER MTN
20.1 0.ee 5 REVEILLE PEAK2.7 0.04 10 SKULL MTN
2.5 21.9 0.11 30 STONEWALL PASS1.8 20.9 0.15 16 REVEILLE PEAK
21.7 0.07 24 STONEWALL PASS19.3 0.17 8 REVEILLE PEAK20.7 0.11 8 REVEILLE PEAK45.7 0.11 21 BADGER SPRING
0.8 7.2 0.06 22 TOPOPAH SPRING7.3 0.65 21 TOPOPAH SPRING
31.3 0.13 22 FURNACE CREEK0.2 4.10 9 OAK SPRING
21.1 0.15 13 REVEILLE PEAK2.0 81.1 0.08 13 MULE DEER RIDGE NE
20.8 0.15 8 REVEILLE PEAK2.2 20.5 0.16 16 REVEILLE PEAK
19.2 0.09 5 REVEILLE PEAK6.5 0.06 17 TOPOPAH SPRINGC (

d,1
) I ) i I ' ) I ',
1988 LOCAL HYPOCENTER SULUARY - SOB EARTHQUAKES
DATL - TIME LATITUDE LGITUDE(UTC) (DEG. N) (DEG. W)
MAR 272727272828
28292929363.
APR I
2222
244445
556777
788aa
aa9999
1610
8:50: 118: 5:3.19:15: 819:35:594:19:539:59: e
13:19:323;28: 75:49:28
13:52:267:49:587:58: 1
5:56:5517:16:48
6:55:543:52:215: 7:345:26:17
23:31:282:33:462:39:412:41:38
10:30:3118:52:60
20:37:2923: 4:34
6:45:541:25:13
17: 10: 1718: 1:21
20:22:116: 3:162:58:404:16:295:47:236:58:49
22:32:3722:33:422:31:267:50:53
13: 2:5021:15:43
3:54:145:23:37
37.42637.23937. 32037.33237.30236.781
37.31836.38237.84837.85137.93537.867
35.69737.5136.41736.e8837.22837.861
37.31037.28637.65836.84937.86237.627
37.03137.83537.86337.92337.86136.425
37.62937. e2937.87637.02837.33637.851
38.32538.32037.27936.85337.02637.416
37.70937.076
117.241116.450116.337116.311116.292116.294
116.2891l .994116.149116.138116. 548116.138
1 17.036116. 138117.937114.950115.649116. 133
116.280114.832114.881116.260116.133116.106
116.168116.112116.1351 16.123116.131116.966
116.1e8116.106116. 132116.1051l5.259116.166
116.503116. 468117.588116.244116.106117.443
115.e54115.761
STANDERRORH(MA
6.6A-3
11.16.36.4
0.20.71 .6
1.46.6
1.66.58.62.4
6.4
6.36.96.3
0.26.50.4
6.51.46.18.41.26.5
8.26.2C.66.21.12.7
2.63.8
.36.36.36.3
6.36.3
STAND AZ2DEPTH ERROR GAP(KS) Z(KU) (DEG)
11.84 1.1 1477.16 1.3 1677.6.o. - 3e15.6o.. 7.3 2954.12 2.3 781.47 1.1 191
6.77 6.6 1276.69 6.7 2081.50 2.1 1932.73 - 241
-1.62 1.9 155-4.45 1.5 158
14.25 6.4 2896.36 6.9 165
-1.92 6.1 2977.66 2.2 2667.60e. - 2126.66.. 2.0 107
2.52 1.1 1287.60 6.8 2525.97 6.4 14811. 6o .3 466.60.. 6.8 1076.75 0.8 134
0.60 0.8 1724.67 3.7 1991.68 6.2 1573.63. - 264
-4.61 1.9 15714.52 1.6 82
6.18 0.4 1156.30 6.3 1176.22 1.6 161
-6.14 6.2 1164.08. - 1504.39* - 205
2.49 8.7 232-4.42 2.6 284
8.19 0.6 866.13 0.3 163
-1.20 6.6 1345.84 0.8 58
5.54 1.5 1169.43 1.84 123
000125 MAGNITUDE ES
Uco Md I
ACI 1.39ACI 1.88ADA 1.11DOA 1.53BCI 1.61ADI 1.21
ACI 1.10ADI 1.54BOA 6.93ADA 1.218CZ8CI 1.58
BDI 2.30 2.16ACIDQA 1.71BODA 1.86ADA 1.44BCZ 2.28
ACI 1.89 1.81CosACIAAI 1.71 1.30BCI 1.67 1.82ACZ 1.66 1.27
AC? 1.49BDZ 1.41ADIDOA 1.33BCIAAI 1.79 1.8e
ACZ 2.38ACI 1.33 1.3.ecI 1.47ACZ 1.46 -CCI 0.96CDI
CDICDZAA 1.37ABI 0.49 9.80Acz 1.34ABl 1.72 1.91
ACZ 6.99ACI 1.89 1.61
T IMAiLh
1.76
2.31
1.71
DEL- RUS INES UIN RES. PH. U.S.G.S.ULv ULc (KW) (SEC) QUADRANGLE
14.0 6.13 13 STONEWALL PASS11.5 0.65 13 SCRUGHAM PEAK11.8 6.68 3 DEAD HORSE FLAT13.2 6.68 5 DEAD HORSE FLAT16.2 6.67 12 DEAD HORSE FLAT14.2 6.68 14 STRIPED HILLS
11.1 6.63 8 DEAD HORSE FLAT34.1 6.68 14 FURNACE CREEK26.7 0.86 5 REVEILLE PEAK26.2 0.63 4 REVEILLE PEAK
1.74 2.6 34.5 6.26 6 STIUKING SPRING21.1 0.16 12 REVEILLE PEAK
2.63 33.3 6.67 16 WIGATE PASS1.21 20.1 0.16 8 REVEILLE PEAK
64.2 6.19 8 KEELER50.0 6.e8 10 HNDERSON13.5 0.02 4 LOWER PNAHWWAGAT LAKE26.4 0.11 15 REVEILLE PEAK
1.35 11.3 6.11 23 DEAD HORSE FLAT1.38 29.5 0604 6DELAMR 3 NE6.75 5. 6.65 8 PAHROC SPRINO1.57 5.3 0.0" 29 JAOCASS FLATS1.64 20.5 0.16 17 REVEILLE PEAK1.25 11. .16 13 YUCCA FLAT
6.76 16.8 6.67 12 YUCCA FLAT6.59 16.5 0.69 16 YUCCA FLAT0.92 26.6 6.64 5 REVEILLE PEAK
24.3 6.22 5 REVEILLE PEAK1.31 20.2 6.12 6 REVEILLE PEAK2.02 12.7 0.14 22 FURNACE CREEK
16.9 6.67 24 YUCCA FLAT0.96 11.3 O.06 17 YUCCA FLAT1.71 26.8 6.16 14 REVEILLE PEAK6.94 11.1 6.66 18 YUCCA FLAT0.75 19.6 6.68 7 BADGER SPRING0.98 23.6 0.05 5 REVEILLE PEAK
1.96 65.6 6.12 10 GEORGES CANYON RIM S1.98 16.e 6 .68 9 TYBO1.30 7.3 6.68 16 MAGRUDER MTN0.42 6.5 6.05 15 SKULL MTN0.88 11.6 0.66 13 YUCCA FLAT2.02 6.0 6.13 22 LIDA
6.94 12.1 6.o5 8 HIKO NE1.76 26.5 06.9 23 PAPOOSE LAKE SE

) I * ; I '? 9 I1 7
1988 LOCAL HYPOCENTER SU6.ARY - SCO EARTHQUAKES
000
DATE - TIUE LATITUDE(UTC) (DECG. N)
MAR 15 16:26: 5 37.86915 20:59:21 37.86415 21:36:57 37.30316 19:11: 2 36.69117 4:12:13 36.73517 II: 1: 5 36.14
17 19:28:31 36.44716 0:21:26 37.35118 2:49:30 38.67518 9:21: 0 36.81718 12:53:13 37.88119 8:56:30 36.836
20 16:25:18 36.98620 16:49:58 34.98021 12:54:36 37.a7922 1:52: 8 37.87322 4: 9:20 37.31322 4:46:12 37.252
22 5:12:35 36.22322 5:12:45 36.64822 6:13:24 37.30622 17: 1:39 37.84922 20:48:46 37.28523 3:35:60 37.059
23 3:36:32 37.05923 8: 4:5 3S.44023 8:20:42 36.44823 14: 2: 1 37.31024 9:59: 0 37.86624 II: 2:25 37.307
24 12:10:49 35.M24 16:12: 2 35.98825 20:49:38 5.71525 23:48:17 37.42326 0:56:49 36 .85026 6:34:38 57. 85s
26 12:29: 0 37.33226 13: 8:20 37.86526 13:45: 5 36.78826 14:22:34 37.32726 18:17:19 37.85627 5: 8:42 37.319
27 5:37:53 36.99527 5:56:57 37.039
LONGITUDE(DEG. W)
116.128116.139116.282116.302116.225115.042
114.761115.069116.446115.813118.139117.477
116.329116.350116.138118. 131116.285115.258
117.646117.2Se116.292116.136115.279116.949
116.951115.738115.783116.288116.136116.282
115.783116.976116.280116.771117.031116.138
115.079116.136115.776115.082116.150115.901
116.232116.216
STANDERROR DEPTHH(KY) (KM)
0.4 -0.566.0 -0.826.4 -0.400.5 7.260.4 4.565.7 5.00.
3.3 -1.546.3 6.007.4 9.10.0.5 6.961.3 -1.821.7 5.36
0.4 4.316.4 6.65- -4.960.2 1.226.4 0.244.5 5.006.
2.6 5.28.7.7 0.0ae.6.4 -4.180.7 -4.71.2.8 0.536.4 6.20..
0.2 0.20..1.8 3.21.1.8 9.026.2 2.456.6 0.e00.6.3 6.e4
4.4 11.474.4 2.16*6.4 5.540.6 5.eo001.6 26.140.8 -1.19
2.3 4.151.6 3.10.2.2 13.191.2 -4.221.3 0.910.4 7.80
- G.06
4.7 6.23
STAND AZIERROR GAPZ(KY) (DEC)
0.8 159- 1570.4 2306.5 1691.0 141
- 269
2.6 2806.6 162- III0.5 2022.5 1II2.3 261
2.2 961.5. 93- 2021.2 1100.8 128
11.5 231
- 2803.4 1921.0 84- 1652.4 324C.4 164
6.2 165- 3093.6 3050.9 801.2 1062.6 61
6.4 271- 2598. 71 895.6 1332.4 2596.9 195
3.9 163- 1972.4 2536.9 1631.6 1941.1 80
- 1584.4 276
12S
ACIAOZADZADIACIDOA
COZACIDCIADZOOABOA
EBC!A81ADAACIACIODA
CDIDDZACZOCACDIACA
ACACDABOAACIACZA81
CDACDAAAIBCAODI
ADI
BCICDAODAEDCIBOAA81
ADA- COA
L4NI TUDEMCC Md
2.11 2.14
1.60
2.43
1.91 2. e1.721 .481.210.50
0.971.191.042.441.421.10
1.721.88I .3v2.091.226.82
6.826.986.8u1 .622.122.05
0.931.501.501.091 .731 .37
0.991.260.971.121.622.60
* 0.36* 0.47
ESTIMATESULh MLv MLc
2.18 2.41.911.35 2.60.330.63
1.681.71 1.67
1.661.03
DEL- RYS ONMIN RES. PH. U.S.G.S.(KU) (SEC) QUADRANGLE
20.5 6.14 20 REVEILLE PEAK21. I.0 S REVEILLE PEAK10.6 1 6.4 10 DEAD HORSE FLAT6.1 6.65 10 STRIPED HILLS4.3 *.091 2 SPECTER RANGE NW
41.5 0.50 14 LAS VEGAS NE
36.3 6.16 10 DRY LAKE6.4 *.07 13 ALAMO SE
49.4 6.12 16 QUAD NOT LISTED13.6 6.09 17 FRENCHUAN LAKE SE22.1 0.09 5 REVEILLE PEAK7.3 0.12 6 TIN MTN
10.6 0.e6 11 TOPOPAH SPRING11.0 S.0 13 TCOPPAH SPRING21.9 0.10 4 REVEILLE PEAK21.0 ."9 25 REVEILLE PEAK11.4 0.1 15 DEAD HOSE FLAT7.2 ." 6 DEAD HORSE FLAT
57.4 0.23 11 CO0D PEAK0.2 1.56 11 ALE CANYON
16.6 0.12 16 DEAD HORSE FLAT19.8 0.15 11 REVEILLE PEAK8.9 O.6 8 DEAD HORSE FlAT
11.5 6.07 13 SPRINGDALE
11,4 6.02 8 SPRINGDALE31.6 0.12 9 CHARLESTON PEAK29.5 0."e 9 MT STIRLING11.1 90.7 22 DOAD HORSE FLAT20.9 6.14 12 REVEILLE PEAK11.0 0.11 25 DEAD HORSE FLAT
9.5 0.16 6 FREOHMAN LAKE SE64.0 0.22 10 WINGATE WASH5.1 0.1 18 STRIPED HILLS
18.7 0.11 7 TOLICHA PEAK14.6 0.11 11 GRAPEVINE PEAK26.5 0.12 10 REVEILLE PEAK
8.7 0.15 8 ALA&U SE20.8 0.14 6 REVEILLE PEAK10.9 0.17 11 FRENCHAN LAKE SE9.3 0.06 7 ALAO SE
20.4 0.06 6 REVEILLE PEAK11.5 0.11 19 CROON MINE SW
4.7 S." 4 MINE MTN1.7 0.10 S TIPPIPAH SPRING
( (
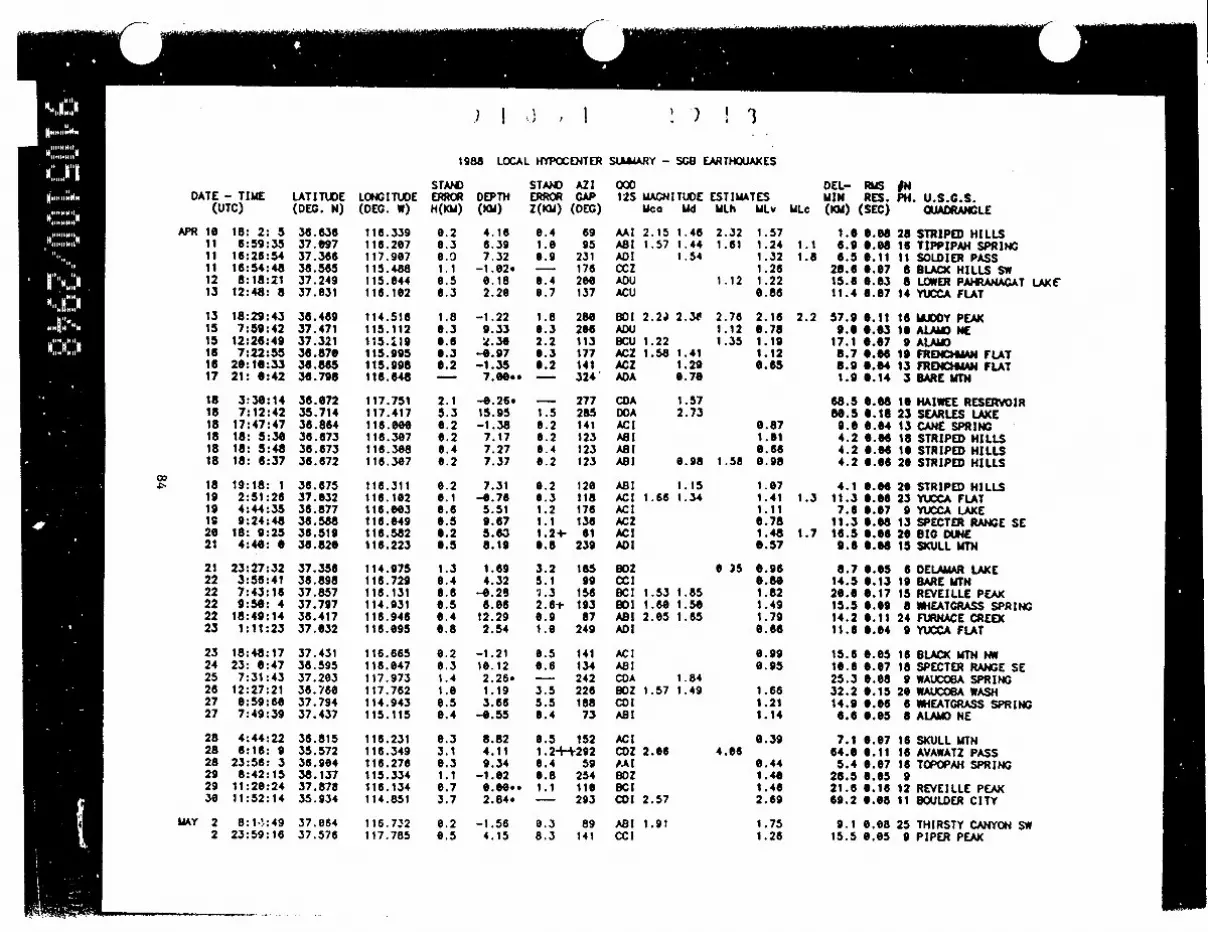
.) I J) I
1988 LOCAL HYPOCENTER SLJIARY - SOB EARTHQUAKES
DATE - TIME(UTC)
APR 16 18: 2: 511 s:59:3511 16:26:5411 16:54:4812 8:18:2113 12:48: 8
13 18:29:4315 7:59:4215 12:26:4916 7:22:5516 20: 6:3.317 21: 6:42
18 3:30:1416 7:12:4218 17:47:4718 18: 5:3018 18: 5:481a 18: 6:37
18 19:18: 119 2:51:2619 4:44:351s 9:24:4826 18: 9:2521 4:40: 6
21 23:27:3222 3:56:4122 7:43:1622 9:50: 422 18:49:1423 1:11:23
23 18:48:1724 23: 6:4725 7:31:4326 12:27:2127 0:59:6027 7:49:39
28 4:44:2228 6:16: 928 23:56: 329 8:42:1529 11:26:2430 11:52:14
MAY 2 8:1.A:492 23:59:16
LATITUDE(DEG. N)
36.63637.69737.36638.56537.24937.031
36.46937.47137.32136.87636.86536.798
36.67235.71436.86436.67336.67336. 672
36.67537.03236.87736.58836.51936.626
37.35636.89a37.85737. 79736.41737.632
37.43136.59537.20336.76037.79437.437
36.81535.57236.96438. 13737.87835.934
37.06437.576
LONGITUDE(DEG. W)
116.339116.267117.907115.488115.644116.162
114.516115.112115..19115.995115.998116.648
117.751117.417116.000116.307116.3e81 6.347
116.311116.102116.603116.049116.5s2116.223
114.975116.729116.131114.931116. 946116.695
116.665116.04711i7.973117.762114.943115.115
116.231116.349116.276115.334116.134114.851
116.7'2117.785
STANDERRORH(m)
0.20.36.01.16.56.3
1.86.30.66.36.2
2.15.30.20.26.46.2
6.26.16.66.56.26.5
1.30.46.66.50.46.s
6.26.31.41.66.56.4
e.33.10.31.16.73.7
6.26.5
DEPTH(KM)
4.166.397.32
-1.82.0.182.26
-1.229.33d.30
-0.97-1.357.0o..
-0.26.15.95-1.38
7.177.277.37
7.31-0.76
5.519.675.Go6.19
1.694.32
-0.296.66
12.292.54
-1.2116. 122.26*1.193.66
-0.55
8.824.119.34
-1.026.60..2.84*
-1.564.15
STAND AZIERROR GAPZ(KY) (DEG)
6.4 691.6 958.9 231- 1766.4 2006.7 137
1.8 2800.3 2062.2 1130.3 1776.2 141- 324
- 2771.5 2856.2 1416.2 1236.4 1230.2 123
0.2 1206.3 l111.2 1761.1 1361.2- 616.6 239
3.2 1655.1 99;.3 1562.6+ 1930.9 871.o 249
6.5 1410.6 134- 2423.5 2265.5 1886.4 73
6.5 1521.2+42926.4 596.8 2541.1 116- 293
8.3 898.3 141
00012S MAGNITUDE
uca Wd
AAI 2.15 1.46ABI 1.57 1.44ADI 1.54CczADUACU
BI 2.2) 2.3eADUECU 1.22ACZ 1.58 1.41ACZ 1.29ADA 6.76
CDA 1.57DDA 2.73ACIA81A81
A81 1. 15ACI 1.66 1.34ACIACZACIADI
ODZCCIBCI 1.53 1.85BDI 1.80 1.50A81 2.05 1.65ADI
ACIA81CDA 1.84BOZ 1.57 1.49CDIABI
ACICDZ 2.66PAIBozEc'CDI 2.57
ABI 1.91Cci
ESTIMATESMLh iLv
2.32 1.571.61 1.24
1.321.26
1.12 1.220.86
2.76 2.161.12 0.761.35 1.19
1.126.05
0.871.016.66
1.58 6.98
1.071.411.116.781.486.57
6 35 6.966.801.821.491.790.66
0.990.95
1.661.211.14
6.394.06
0.441.401.462.69
1 .751.26
DEL- RMS INMIN RES. PH. U.S.G.S.
MLc (KM) (SEC) QUADRANGLE
1.6 6.68 28 STRIPED HILLS1.1 6.9 6.08 16 TIPPIPAH SPRING1.8 6.5 6.11 11 SOLDIER PASS
26.6 6.07 8 BLACK HILLS SW15.6 0.63 8 LOWER PAHRANAGAT LAKE11.4 6.67 14 YUCCA FLAT
2.2 57.9 0.11 16 MUDDY PEAK9.0 6.63 16 ALAMO NE
17.1 0.67 9 ALAMO8.7 0.06 19 FRENCHMAN FLAT8.9 6.04 13 FRENCHMAN FLAT1.9 6.14 3 BARE MTN
68.5 6.08 16 HAIWEE RESERVOIR80.5 6.11 23 SEARLES LAKE
9.6 8.04 13 CANE SPRING4.2 6.e6 18 STRIPED HILLS4.2 G." 10 STRIPED HILLS4.2 6.66 20 STRIPED HILLS
4.1 6.66 20 STRIPED HILLS1.3 11.3 0.08 23 YUCCA FLAT
7.6 0.07 9 YUCCA LAKE11.3 6.08 13 SPECTER RANGE SE
1.7 16.5 6.06 20 B10 DUNE9.6 6.68 15 SKULL MTN
8.7 6.e5 6 DELAMAR LAKE14.5 6.13 19 BARE MTN20.0 0.17 15 REVEILLE PEAK15.5 6.09 8 WHEATGRASS SPRING14.2 6.11 24 FURNACE CREEK11.6 6.64 9 YUCCA FLAT
15.6 6.05 16 BLACK UTN Ng10.6 0.07 18 SPECTER RANGE SE25.3 6.68 9 WAUCOBA SPRING32.2 0.15 20 WAUCOBA WASH14.9 6.06 6 NWEATGRASS SPRING6.6 0.65 8 ALAMO NE
7.1 0.67 16 SKULL UTN64.6 0.11 16 AVAWATZ PASS5.4 6.07 16 TOPOPAH SPRING
28.5 6.65 921.6 0.16 12 REVEILLE PEAK69.2 6.OJ 11 BOULDER CITY
9.1 0.08 25 THIRSTY CANYON SW15.5 0.65 9 PIPER PEAK

.) I 0 3. I 9 el 9
1988 LOCAL HYPOCENTER SUW4ARY - SG8 EARTHQUAKES
DATE - TIME LATITUDE LONGITUDE(UTC) (DEG, N) (DEG. W)
MAY 333444
445566
79999
10
10l2121313
141414141616
171717171717
17l819192020
2121
0:53:143: 9:467:50:256:15: 56:53:287:32:53
11:57: 121:11:5410:41:317:10:548:34:2916: 6:58
17:35:382:54:597:34;49
14:29: 1921:53:524:23:49
4:33:2314:22:180:42:60
23:59:5412:23:2215:15:21
3:54:3111:39:2020:25:4723:21: 1519:22:4519:33:51
0:37:513:54: 1
15: 5:4818: 2:3619:36:3320:26:58
28:40:4319:59:210:12:36
19:38:5821:23:1221 :21:46
5:32:268: 0:58
37.86436.56337.76536.56436.85037. 859
37.40536.64537.67835.42336.45637.851
37.86737.41937.47837.29037.86436. 873
38 .07437.05737.40837.12036.40437.e31
37.22437.s6e37.77338.12437.20137.194
38.11637.38737.86437.20137.84737.566
37.84936.u3337.63437.86237.34837.345
37.13036.998
118.132116.468115.103116. 466116.264116.141
1 15. t 44116.333118.267116.954116.803116.144
116.141115.226115.120116.397116.132115.989
117.772116.144117.440117.946117.018116. 103
117.314116.140116.224115.209117.978114.503
115.211115.103116.133117.404116.097117.876
116.111115.481116.109116.13e117.231117.230
117.327116.362
STANDERRORH(KW)
0.40.21.00.20.4
8.38.69.90.40.26.4
0.36.70.30.20.36.6
2.40.20.81.00.50.2
0.31.41.01.62.81.2
1.40.68.58.5
0.80.60.26.76.30.5
0.50.3
DEPTH(KM)
7.744.117.383.910.s8
2.683.467.82
13.685.023.56.
6.707.218.306.450.372.43
2.115.175.13
-1.02b. la8.28
8.340.0*0.5.647.00
-1.543.70.
9.736.82
-e. ss6.317.00..0.00.
1.96-1.75.4.29
-4.52-0.21-4.18
6.641e.96
STAND AZIERROR GAPZ(KM) (DEC)
0.6 1080.8 1048.2 1351 .0441311.4 115- 196
0.4 2850.4* 246
11.5 3530.9 842.3 97- 269
0.5 1 8 52.7+ 1260.9 750.5 580.5 1081.1 145
8.2 2831.0 1151.1 1761.1 2622.54+ 1940.4 117
0.5+ 852.7 1006.1 1148.1 2712.7 262- 242
4.0 2580.7 1338.8 1883.3 112- 304
- 192
2.1 189-1 1331.0 1321.1 lee0.3 720.4 71
1.2 1916.4+ 105
000I12SAONI TUDE
Mca MdESTIWtMLh
ACI 1.97ADI 1.20CCIABI 1.02ABIADZ
ADI 1.06ADIDDA 1.34EtAI 2.22 2.05BCI 1.89 1.71 1.58CDI 1.58
ACI 1.8l 2.el 2.14ECI 1.28 1.23ABI 1.61 1.68ABI 1.73 1.50 1.39AC! 2.88OCZ 1.51 l.38
CDI 1.98AS1 1.47 1.35ACIBDZ 1.5.
'DI 1.25ACZ 1.59 1.39
ABZ 6.769CI 1.45CCA 1.04COICSU 1.55CDI 1.72 1.60 1.72
E0s 1.66 1.37ABIACI 1.75DICA 0.9sADA 1.34ADI
DOA 1.18CXA 1.65ACZ 1.51 1.38ACt 1.75A81 2.83 2.11AD! 1.74 2.04
ADI 0.68ABI
kTESMLv
1.950.78
e.8u1 .e50.621.06
0.67
2.191.391.86
2.681.111.591.122.071.12
2.091.336.791.481.161.38
0.931.44
1.641.591.77
1.84
1.61
1.48
0.831.672.111.78
6.690.92
DEL- ISS JNMIN RES. PH. U.S.G.S.
ML; (K) (SC) QLADRANGLE
20.5 0.13 18 REVEILLE PEAK14.7 0.04 16 LATHROP WELLS SW13.3 0.15 9 WHITE RIVER NARROWS14.5 6.65 16 LATHROP WELLS SW4.8 0.12 12 JACKASS FLATS
20.9 8.08 4 REVEILLE PEAK
8.2 0.02 7 ASH SPRINGS0.6 6.04 7 STRIPED HILLS
42.4 6.05 5 *.ooUAD. NOT LISTED.13.6 0.15 34 FURNACE CREEK20.2 6.07 26 FURNACE CREEK
1.7 51.4 .65 9 REVEILLE PEAK
21.3 0.12 24 REVEILLE PEAK15.6 0.16 8 ASH SPRINGS10.6 0.67 13 ALA&O NE10.7 0.es 22 SILENT BUTTE20.5 0.12 19 REVEILLE PEAK8.8 0.17 15 FRENCHIAN FLAT
39.9 6.16 10 BLAIR JUNCTION1.5 7.9 6.e8 21 TIPPIPAH SPRING
6.4 6.69 16 LIDA29.4 6.66 9 WAUCOBA SPRING33.4 0.67 14 EMIGRANT CANYON11.2 6.es 21 YUCCA FLAT
9.9 6.68 16 UBEHEBE CRATER28.8 6.18 0 REVEILLE PEAK14.3 6.16 7 REVEILLE PEAK29.6 6.14 7 T1WER UTN PASS WEST25.7 6.07 6 WAUCOBA SPRING50.3 .67 7 VICO NE
28.8 6.15 9 TIMBER WTN PASS WEST5.1 6.09 11 ALAMO NE
2.4 26.5 6.14 13 REVEILLE PEAK17.1 0.0 8 UBE4EBE CRATER40.4 6.62 4 REVEILLE PEAK15.9 0.13 3 PIPER PEAK
18.1 6.e9 6 REVEILLE PEAK38.2 0.13 15 BLACK HILLS W10.8 0.64 11 YUCCA FLAT
1.7 20.3 6.15 10 REVEILLE PEAK5.8 0.12 28 ScOTTYS JUNCTION SW5.5 6.15 15 SCOTTYS JUNCTION SO
14.6 6.05 11 LIBEHEBE CRATER4.7 0.05 17 TOPOPAH SPRING
(

L U
.) I Oi I *, -) 5 1
1988 LOCAL HYPOCENTER SUWARY - SGO EARTIOUAKES
DATE - TIME(UTC)
MAY 22 1:26:3322 1:44:2622 16: 9:2622 18:35:2322 16:45:1422 21:42:21
23 6:39: 723 7:53:3823 8:19:1423 9:32: 123 9:38:4723 9:58:28
23 11:31:2623 11:36:1723 11:57:5723 12.- : 523 16:13: 223 17:41:49
° 23 19:57:5324 16:49:2224 20:42: 424 21:53:1525 4:57:5625 8:49: 8
25 23:52:5826 1:48: 726 2:21: 426 3:56:4926 4: 6:5s26 4: 9:60
26 4:20: 1526 4:43:3126 4:49: 726 4:50:4126 6:38:4326 6:40:18
26 6:52: 326 7: 2:1926 7:29:5726 9:47:4126 15: 7:2626 15:49:38
26 19:52:5526 21: 1:40
LATITUDE(DEG. N)
36.99237.28835.88435.90435.88837.519
37. 02336.98638.98336.99236.98936.984
36.98736.92136.99936.991.37.6.2537.857
36.99436.98836.71236.64338.99437.408
37.4e036.74036.74136.98836.9 836.992
35. 91136.98235.99336.99s38.99336.993
37.44130. 98636.99336.99137.23936.981
37.66e36.992
LONGI TUDE(DEC. W)
117.722116.389116.937116.922116.928117.792
116.139117.729117.731117.723117.726117.725
117.726116.087117.711117.728116.139116.142
117.717117.731116.668116.250117.712115.852
114.671116.236116.233117.722117.718117.714
116.623117.729117.711117.725117.719117.733
115.138117.736117.723117. 723115.364117.720
117.492117.716
STAND
H(*A)
0.71 51.32.66.56.9
0.30.66.96.80.76.7
6.76.26.86.76.16.2
1.22.16.76.36.7
0.66.36.36.61.06.9
1.8.8I .e0.76.76.8
6.46.81.66.ae.41.0
6.26.7
DEPTH(KM)
0.250.84.5.44
-4.542.459. 8s
2.481.277.,4.s05.170.94
0.I67.e09.12
-0.052.040.91
0.00.2.427.894. P52.99
1 .20
16.303.633.762.220.921 .73
-e.733.04.0.0o..6.559.546.85
-1 .732.110.310.07
-1 .197.06
e.9o7.60
STAN) AZI QQDERROR GAP 125 MAGN I TUDEZ(KM) (DEC) Ico Md
0.7 215 ADI 1.32- 234 CDI2.l1>, 269 8DD 2.372.2 266 CDI 1.761.9 276 ADZ3.9 133 69!
6.5 114 AB! 1.32 1.413.3 263 801 2.26 2.074.2*tt23 901 1.688.7 201 CDI 1.666.8 202 CDI 1.96 1.810.8 202 ADI 1.80 1.83
0.9 262 ADI0.3 1.6 ABI2.06* l99 ADI 1.480.8 201 ADZ 1.64 1.806.5 105 ACIe.3 106 ACZ
1.6 200 SDI8.3 251 C0D0.9 162 AC!1.0 110 ABI3.3 199 0DI- 177 BDI
1.3 286 ADI0.6 155 ACZ0.4t 86 AAI 1.4e2.9+ 195 601 2.931.2 201 ADI 2.11 2.284.7 20a SDI
1.0 234 E60I 1.64- 203 CDI 2.22 2.161.2 285 SDI 2.032.8t+216 6013.1 201 9DI 1.556.7 236 ADZ 1.71
0.4 209 ADZ 1.533.6 204 RDI 2.0o1.4 252 8jDZ1.6 201 90I 2.03 1.910.9 97 ACI 1.685.6 202 CDI
6.3 142 ACI 1.84
ESTIMATESMLh MLv I
1.521.312.45
2.09 1.941.92 1.57
1.24
e.792.541.83I.691.941.99
1.490.621 .621.601.331 .55
1.441.650.770.441.48
1.61
1.170.530.37
4.212.471.66
2.122.362.361.s81.861.77
1.042.02 1.97
1.612.25
1.911.90
1.72 1.761.81
DEL- RUS fNMIN RES. PH. U.S.G.S.
ULc (13t) (SEC) QUADRANGLE
27.5 0.16 13 DRY MTN10.0 0.05 9 SILENT BUTTE10.9 0.13 16 WINGATE WAMSH38.6 0.11 11 WINGATE WASH58.2 0.02 8 WINGATE WASH14.6 0.11 8 PIPER PEAK
8.2 6.08 18 TIPPIPAH SPRING28.4 0.12 25 DRY MTN28.7 0.12 13 DRY MTN27.8 6.11 11 DRY 4TN
2.0 27.9 0.13 17 DRY WTN28.5 0.12 16 DRY MTN
28.1 0.08 16 DRY MTN5.2 0.65 IS YUCCA LAKE
26.6 0.08 9 DRY I4TN27.6 6.11 15 DRY 14TH26.2 0.83 7 REVEILLE PEAK20.8 0.02 7 REVEILLE PEAK
27.2 0.12 9 DRY 1TN28.2 0.12 7 DRY MTN16.6 0.67 13 DIG DUNE6.3 6.06 10 JACKASS FLATS
27.1 0.68 10 DRY MTN0.2 0.29 5 ALMO NE
23.6 0.03 6 SLIDY YTN3.2 6.08 18 SPECTER RANGE NW3.5 6.68 19 SPECTER RANGE NW
28.6 6.15 38 DRY 4TN2.2 27.9 0.14 18 DRY MTN
27.3 0.13 13 DRY MTN
26.8 0.11 14 TECOPA28.8 0.12 15 DRY MTN
2.2 27.2 0.15 14 DRY MTN27.8 .16 11 DRY 4TN27.4 0.68 8 DRY 4TN27.7 6.06 1o DRY 4TN
8.6 0.04 7 ASH SPRINGS2.0 29.2 0.12 16 DRY UTN
27.4 6.68 8 DRY MTN2.3 27.7 0.15 22 DRY 4TN
17.6 0.68 10 DESERT HILLS NE25.7 6.11 12 DRY 4TN
10.5 0.05 14 SPLIT 4TH27.4 0.12 12 DRY UTN3.9t 206 SDI 1.79

; I ; I *> ) '. I
1988 LOCAL HYPOCENTER
DATE - TIME(UTC)
MAY 27 8:16:3827 13:37:3427 22:58: 628 1:26:2728 6:29:2828 16:51:14
28 16:39:3129 18:20;2931 0:31:3431 9:34:5331 13: 6: 3
JUN 1 5: 8:26
2 5:40:252 5:25:582 12:38:143 15:59: 'I3 16:57:273 18:55:22
4 1:24: 14 16:42:594 18:11:414 22:44:124 23:15: 05 0: 5:45
5 0:25:575 16:40:495 13:17:216 18:37:357 7:47:388 18:39:18
8 21:24:196 22: 9:539 16:59:1016 3:11:2110 3:18:3416 3:19: 4
16 15: 1:5416 22:32:3511 1:48:4412 0:43:2812 6:45: 512 7: 1:i2
12 8:13:3412 8:46:52
(
LAT I TUDE(DEC. N)
37.26137.19537.27336.77137.86435.873
37.22736.98637.23936.71637.86637.346
37.87836.73136.76736. a6137.18637.123
38.93435.6 a37.26536.68437.18436.663
38. 80237.19138.26237.12935.04936.448
57.11536.54535.98737.24637.24437.252
37.48837.58337.25937.00236.91I37.246
38.16437.489
LOGI TUDE(DEC. W)
115.008115.787I 17.233115.429116.130114.785
117.281117.734117. 271116.453116.131114.943
116.125116.215116.265115. 362116. 731115.555
116.156116.191116.397116.200116.421116.202
116.264117.947116.500117.831115.525114.409
115.54815.185117.750114.943114.959114.956
117.227117.211114.988117.495117.552114.963
115.328114.595
STANDERRORH(KY)
0.46.60.36.70.63.8
0.41.90.40.26.70.5
0.80.20.20.56.26.5
0.30.21.00.10.70.5
0.82.69.11.32.15.e
0.52.11.36.80.30.5
6.46.40.9
0.3
1.62.9
DEPTH(KM)
-0.5348.295.91
-1.96-0.17
3.02
-0. 03.38.7.056.736.59
-1.0
6.00..5.294.633.49.0.056.67
1 .49-0.49
1.590.771.596.13
-1.64-1.30.
1.61.10.961.993.37.
0.00..15.487.00
-1.676.886.01
-0.737.5416.271.922.650.40
6.00..0.67
STAND AZIERROR GAPZ(KQ) (DEC)
0.5 1973.0 510.4 650.6 1881.1 lea1.6 282
6.4 78- 2370.5 920.7 1211.2 1080.6 195
1.4 1110.5 920.3 73- 1786.4 550.6 124
.9 1530.5 842.2 2466.2 1531.6 2681.9+ 137
l.5 164- 256- 2534.6 2156.7 289- 276
6.7 1371.7 1455.9+ 2551.4 2076.3 2222.8t 166
e.7 1431.51+ 1671.3 2111.1 1627.8 1860.4 220
1.4 2252.3 280
SUuMuARY - SG8 EARTHOuaxES
C0O12S MUCNITUDE ESTIMATES
McU Md MLh MLv I
ADZ 2.09BOA 1.90MI 1.84 1.56ADZ 1.11DCI 1.77CDA 2.62
AB 2.16CDA 1.41ABIABI 1.54 1.28ACl 1.79AD! 1.34
BC1 1.54 1.87AD1 1.40 1.27MI 1.49 1.35cc'ABA 2.40ACZ
8CIACZ901ACIADIACI
ACIWA 1.39DOA 1.29EOICOUCOI
ACI8CI 1.16ColADIADIBC1 2.S5
ACIAC! 1.80 1.82ADI 1.79ACI 1.74CDIADI
BD! 1.79 1.85CDI 1.67
2.16
1.651.641.80
1 .96
.s920.29 1.07
1.731.14
2.011.14
1.94 1.121.52
1.37
0.650.966.986.930.630.93
0.72
1.661.932.35
1.331.471.64
2.00 1.513.06
1.041.601.491.711.540.78
1.941.58
DEL- RAS fNUIN RES. PH. U.S.G.S.
ILc (MA) (SEC) QUADRANGLE
16.7 0.05 13 ALAMO SE15.5 0.16 19 PAPOOSE LAKE NE3.7 0.09 18 SCOTTYS JUNCTION SW
35.1 0.11 16 DOG DONE LAKE SOUTH20.4 0.15 14 REVEILLE PEAK77.9 0.12 17 BOULDER CITY SE
2.2 8.4 0."9 17 LBEHEBE CRATER28.5 0.14 9 DRY MTN6.9 0.08 13 LJ8MEHE CRATER8.9 0.06 20 LATHROP WELLS 3W
20.6 0.14 11 REVEILLE PEAK1.5 11.6 0.04 6 DELAMAR LAKE
2.1 26.9 0.17 12 REVEILLE PEAK5.3 0.07 22 SPECTER RANGE NW4.0 0."0 22 STRIPED HILLS
41.9 0.09 12 DEAD HORSE RIDGE5.2 0.09 54 THIRSTY CANYON SW
30.5 0.08 9 SOUTHEASTERN MINE
5.9 0.05 8 MINE UTN14.0 0.07 15 SPECTER RANGE SW
8.6 0.02 5 SILENT UTTE16.7 0.02 10 SPECTER RANGE SW16.8 0.04 7 SCRUGHAU PEAK13.2 6." 10 SPECTER RANGE SW
16.7 0.08 7 SPECTER RANGE SW26.5 0.13 5 WAUCOBA SPRING7.0 0.19 6 STONE CABIN VALLEY20.1 0.11 8 WAUCOIA SPRING30.6 0.11 11 WOUNTAIN SPRINGS67.6 6.14 9 *.O.UAD. NOT LISTED.
2.0 51.4 0.07 6 SOUTHEASTERN MINE -4.9 0." 7 HAYFORD PEAK28.7 0.03 5 WAUCOBA WASH
2.6 20.2 0.10 14 DELAMAR 3 NW19.6 0.*3 8 DELAMAR 3 NW19.1 0.10 18 DELAMAR LAKE
20.9 0. 0 9 STONEWALL PASS26.2 9.97 14 GOLDFIELD17.3 0.97 7 DELAMAR LAKE13.3 0.10 21 U8EHEBE CRATER17.5 0.14 11 DRY THN
1.4 19.4 6.02 7 DELAWAR 3 NO
2.3 30.8 6.10 9 COAL VALLEY16.1 0 .4 B ELIGN NE
(

or
.) I U :j I 2) ' 2
1988 LOCAL HYPOCENTER SUMMARY - SGE EARTHQUAKES
DATE - TIME(UTC)
JUN 12 9: 6:1713 4: 2:2914 10:44:4515 4:12:5515 4:32:5115 6:23:40
15 8: 4:5015 12:15:1515 18:54:5215 19: 9:4915 22:40:5516 9:50:34
17 0:43:2317 11:33:5117 12:50:4318 2:28: 918 16:29:2219 1:26:32
19 4:22:4419 16:45:3320 5:49:202e 23: 2:1421 7:11:4221 11: 8:19
21 20:46.2922 0:24:3522 1: 3:5623 0:46:4623 3:27:3923 10: 8:42
23 12:32:1524 3: 8:2e24 16:12:2725 3: 9: 325 10:28:2725 13:45:18
26 1:19: 926 13:56:2826 14: 2:4726 16:27:3e26 17:53:2726 20:29:17
27 7: .:s50
LATITUDE(DEG. N)
37.49236.87736.82136.68837.11337.233
37.87037.86237.38737.39236.68137.745
37.24536.87537.53235.90337.35837.251
36.88437.53037.44137. e9737.06336.949
37.31737.10837.11136.77436.97437.692
37.84837.07537.65837.38637.85138.701
37.78137.88137.87937.88435.92336.874
36.411
LONGI TUDE(DEG. W)
114.619115.994116.020115.684115.542116.364
116.128116.132115. 19115.124116.421114.998
117.62415.997
117.457116.354115.724114.957
116.187117.226117.198116.243116.177116.108
116.282116.733116.734116.105116.729115.094
116.134117.023116. 929115.087116.130116.538
116.238116.134116.128116. 139117.218116.723
117.006116.002
STANDERRORH (Ku)
3.80.5e.30.80.40.4
0.30.50,60.3e.20.6
e.60.40.50.70.31.4
0,61.21.10.20.30.3
0.40.30.5e.4e.20.4
0.40.3e.40.70.5
12.3
1.4
0.62.11.10.2
0.30.3
DEPTH(KM)
-1 .027.350.57
-0.72I .080.13
-8.67-0.32
3.125.319.071.18
7.00-0.11
1.46-0.635.795.72
6.382.144.556.924.e72.85
11.470.360.555.079.345.86
0.600.39
-1.234.760.071.06.
2.98.2.352.51 .3.22.2.92
-0.e0
5.28-1.28
STANDERRORZ(KU)
2.92.70.40.92.40.3
0.60.81 .0e0.60.52.8
e.9e.61.40.61.23.7+
0.69.09.40.5*.9440.5
2.e0.2a.41.71.01.9
0.7e.51.10.5
AZICAP(DEG)
296144127196128
74
10910712411673
147
791431T,2222139272
18715413810510095
194III114167173le
114113119278
OOD;i2S MACN
MCa
CDZ8CIACIADIBCZ 1.87AAI 1.94
ACI 1.798CIA81A8!AAI 1.968CI 1.49
AAI 1.32ACZ 1.54ACIADZACI 1.93SD1 1.67
ADICCACC .AS! 1.58A81ABI
ADIABZ 1.64A8! 1.60ACI 1.45ACI 1.31AC! 1.40
ACZACI 2.08ACZADIACIDDA
CDAADACCACDABDIACZ
ASlACI 1.54
IlUDE ESTIMATESUd MLh ILv ULc
1.35 1.071.22 1.201.01 1.031.38 1.33
1.431.57 1.8
1.83 1.901.80 1.97
1.021.43
1.54 1.321.16
1.36 1.631.51 1.06
1.261.42 1.681.94 1.93 1.8
1.78 1.32
0.68 0.701.441.56 1.221.41 1.281.53 0.93112a 1.16
1.211.55 1.25 1.21.66 0.830.96 1.060.91 1.001.01 0.95
1.49 1.481.53 1.841.05 1.10
0.971.61 1.46
DEL- RUSUIN RES.(KU) (SEC)
16.4 0.0426.9 6.1118.6 6.0711.3 0.1331.9 6.094.2 0 09
20.6 0.1220.3 6.166.4 0.106.7 0.048.3 0.0711.7 0.11
2.4 0.138.2 .0910.8 0.0730.8 0.095.1 0.1119.2 6.08
3.7 0.0923.6 0.2016.5 0.176.7 6.095.4 6.075.1 0. 09
31.9 0.064.3 0.084.1 0. 0810.6 0.0719.1 0.0614.5 0. 08
19.7 0.0427.6 0.1049.2 0.123.9 6.0519.5 0.1452.7 0.13
13.3 0.1621.8 0.0.321.2 .1522.3 0.1132.0 0.1012.2 0.06
8.8 0. 099.6 0. 06
jNPH. U.S.G.S.
OUADRANGLE
7 ELICN NE13 PLUTONIUM VALLEY15 CANE SPRING18 INDIAN SPRINGS NW13 SOUTHEASTERN MINE19 JMhONIA TANKS
21 REVEILLE PEAK15 REVEILLE PEAK11 ALAMO NE9 ALAMO NE27 LATHROP WELLS UW8 PAHROC SPRING
14 LAST CHANCE RANGE1S PLUTONIUM VALLEY12 UONTEZUMA PEAK SW12 SHOSHONE22 GROOM LAKE7 DELAUAR LAKE
16 MINE MTN9 GOLDFIELD9 STONEWALL PASS
21 TIPPIPAH SPRING16 TIPPIPAH SPRING16 YUCCA LAKE
11 DEAD HORSE FLAT20 THIRSTY CANYON SW15 THIRSTY CANYON SW12 CANE SPRING18 BARE MTN9 HIKO NE
7 REVEILLE PEAK24 8DNNIE CLAIRE SE11 CACTUS SPRING7 ALAMO NE15 REVEILLE PEAK6 ... QUAD. NOT LISTED**.
10 REVEILLE PEAK4 REVEILLE PEAK
15 REVEILLE PEAKS REEILLE PEAK
21 MANLY PEAK14 BARE UTN
24 EMIGRANT CANYON18 CANE SPRING
0.8 105- 321
-- 206- 255- 111- 2564.1 2680. 4 168
0.9 910.3 168
1.39
2.301.022.491.03
0.49
1.661 .47
2.360.57
1 .361.1327 14:30:39 36.862

) I . I -) 1; 'I I11988 LOCAL HYPOCENTER SUMUARY - SCB EARTHQUAKES
DATE - TIME(UTC)
JUN 28 5:39:4328 15:46:2528 20:47:4629 0: 4: 629 2:34:1e29 3:19:28
29 4:14:4529 5:40: 329 5:51:1629 9:34:2129 12: 8:2829 18: 9:14
29 22:54:2736 0:14:1436 3: 3: 636 11:13: 9
JUL 1 2:43:151 3:45:44
1 23:30:572 2:31:532 16:40:142 26:51:223 2:55:583 3:29:57
3 18: 9:103 18:13:344 4:27:464 4:29:324 10:56:534 12:28:51
4 12:40:314 16:40:384 26:41:325 9:14:255 15:44:205 18:18:48
6 0:28:416 3:24:136 3:50:226 7:26:486 7:56:386 7:56:48
6 8:26:266 9:40:57
LATITUDE(DEC. N)
37.88037.75236.e5237.88737.25137.244
37.23737. 19137.87337.87537.66137.875
37.29737.65737.85636.69837.26837.283
37.76837.58037 .10437. 16436.97837.852
37.02837.62937.84137.84535.88436.481
36.55837.85137.64937.29637.85936.417
37.33436.62936.83435.88937.49237.496
37.6e737.844
LONGITUDEXDEG. W)
116.134114.980114.932117.471115.663115.637
117.3131 17.K82116.134116.135114.870116.137
115.189114.891116.133116.138115.165117.557
115.616116.137116.732116.732116.414116.132
116.375116.377116.140116.141114.769117.432
115.229116.136116.146115.183116.132118.049
114.649115.924116.260114.789117.227117.233
117.936116.137
STANDERRORH(KM)
0.46.32.56.46.66.5
0.20.16.86.80.56.5
2.86.56.46.3
0.4
1.66,30.20.26.52.3
e.20.40.40.53.62.8
1.31.e0.28.46.30.7
6.98.38.31.86.26.3
0.96.5
DEPTH(KM)
-4.862.645.996.065.63
-0.52
6.976.76-1.266.315.39
-0.42
4.266.45
1.4712.298.26
-6.94-4.6
-0.216.61o .86..
7.377.282.661 .68
-1 .243.24
-e.46.6e.86.
7.18-e.266.66
1.261 .613.454.16
-e. 40
6.16
-0.31
o . 13e.93
STANDERRORZ(KY)
6.66.61.21.7+41.86.3
6.46.21.31.40.80.9
8.31.20.76.9+
6.8
e 36.66.26.20.84.1
0.3e.s1.21.26.4
1.61.61.0I.e6.61.1
6.60.86.91.06.36.4
6.56.8
AZ!GAP(DEG)
111156278235194227
82115
llegII:154116
216145e16
113172169
156111
42117125165
73124163164281248
142t15
15116716773
250146112286142141
265164
OOD12S MAGNITUDE
Uck MdESTIM,MLh
ACI 2.64 2.15ACZ 6.93CDIADIADI 2.24ADZ
ABI 1.41ACI 0.97BCZDCI 1.75ACIBCI 1.99 2.65
CDI 0.78ACI 1.81 1.68 1.95ACI 1.99 1.94ACI 1.81ADI 1.22ABI 1.17
ACZ 1.43 1.05ACI 2.64AAI 2.16 2.68ABIA81 1.e6BCI
AAZ I.36 1.32ADIACA 1.19ACA 6.98CDA 3.14CDA 1.22
CDA 1.98ACI 1.59ADIACI 1.20ACZ 2.46BCS 4.44
ADI 2.74ActABU0DI 2.49 2..3ACI 1.27ACI 1.26
ADZ' 1.47ACI 1.42
ATESMLv
2.180.962.121.281.730.98
1.391.621.521.571.562.15
1.121.712.17e.821.280.88
1.112.162.341.6e6.641.25
1.45e.45
DEL- RMS INMIN RES. PH. U.S.G.S.
MLc (KM) (SEC) QUADRANGLE
2.3 21.7 0.14 24 REVEILLE PEAK11.8 0.03 6 WHEATGRASS SPRING54.4 0.11 13 HENDERSON22.1 0.05 9 PAYMASTER CANYON14.3 6.e0 13 ALAMO SE15.7 0.82 6 LOWER PAHRANAGAT LAKE
8.6 6.07 21 U8EHEBE CRATER17.7 0.02 16 UBEHEBE CRATER21.2 0.16 11 REVEILLE PEAK21.4 0.20 14 REVEILLE PEAK6.6 6.07 7 PAHROC SPRING NE
21.6 6.18 18 REVEILLE PEAK
14.3 6.68 6 ALASO4.1 0.11 11 PAHROC SPRING
26.1 0.13 18 REVEILLE PEAK1S.0 6.67 16 SPECTER RANGE NW13.2 6.66 5 ALAMO SE9.7 6.07 10 UAGCRUER MTN
13.5 6.1 7 WHITE RIVER NARROWS21.9 0.14 26 REVEILLE PEAK4.8 6.16 45 THIRSTY CANYON SW4.8 6.66 19 THIRSTY CANYON SW6.8 6.11 15 TOPOPAH SPRING UN
19.8 0.15 7 REVEILLE PEAK
6.8 1.3 6.67 21 TIMBER MTN1.1 0.e9 14 TIMBER MTN
19.7 0.65 6 REVEILLE PEAK20.6 6.66 6 REVEILLE PEAK77.4 0.12 15 BOULDER CITY23.0 6.33 12 PANAMINT BUTTE
8.5 6.69 5 HAYFORD PEAK20.6 6.69 7 REVEILLE PEAK26.2 6.61 5 REVEILLE PEAK14.1 0.64 9 ALAMO2e.1 6.12 28 REVEILLE PEAK37.3 6.19 44 OWENS VALLEY
31.2 0.68 19 ELGIN SW4.8 6.6a 1a UERCURY6.6 6.67 12 JACKASS FLATS
76.1 6.1a 23 BOULDER CITY21.4 6.67 24 STONEWALL PASS21.1 6.04 9 STONEWALL PASS
1.9 31.4 0.06 10 WAUCOBA SPRING19.6 6.68 7 REVEILLE PEAK
1.681 .23
2.80
1.630.282.561.391.45
1.411.48
( ,I

J I ; ' I . ) .; I
1988 LOCAL HYPOCENTER
DATE - TIME(UTC)
JUL 6 13:40:196 14:43: 56 19:21: 37 7:17:287 11: 0:157 20:18:57
8 5:17:158 7:29:378 7:29:468 21: 0:408 23:51:428 23:52:12
9 0: 8:519 e: 18:569 0:53:3716 4: 3:5818 8:48:2610 11:37: 0
10 11:59:3110 12:14:12
o 10 17:17:52le 17:41:2810 19:47:2011 3:59:14
11 6:33:2911 11: 5:5111 15: 8:1412 7:42:3112 14: 4:5912 19:57:27
12 19:57:3012 23:20:5113 2:14:1113 2:14:1613 2:35:5113 3: 0: 2
13 7:33t3114 1:27:1714 4: 8:2414 9: 0:3214 15: 9:5015 11:14:15
15 11:24:2815 23:44:32
LATITUDE(DEG. N)
37.85537.02537.83837.85436.75537.846
36.68837.84737.84437.84437.87937.585
37.57937.59337.58 137.85337.13637.251
37.24737.24337.58437.39736.65537.062
37.87937.85236.74137.47e37.36837.320
37.33037.85837.76037.60837.85337.848
37.23837.85837.20637. 47237.86337.856
37.85637.849
LONGITUDE(DEC. W)
116.131116.373114.813116.133116.032116. 139
116.35l116.136116.132116.140116.128116.493
116.588116.511116.490116.156115. 097115 .006
115.024114.997116.497114.563116.894117.951
116.127116.132115.487114.601115.155114.828
114.825116.133114.435114.740116.134116.136
115.011116.132116.536114.690116.136116.134
116.152116.134
STANDERRORH(Q)
8.5e.30.80.71.20.3
0.20.50.90.4e.40.9
0.20.4e.40.56.80.3
1.4e.70.40.40.21.1
6.40.61.18.82.8
8.20.38.5
7.71.1e.8
1.40.36.18.56.50.5
6.51.7
DEPTH(KM)
-0.127.263.65.0.60*.4.527.00
2.410.84e.o60.4.94
-0.28-0.99
-1.0612.2517.488.10
-1.93-0.50
8.79-1.0117.4410.398.41
-1.02
-4.390.00..
16.277.719.6610.e8
4.34-0.45
3.28*0.ee0.0.06..6.74
4.71-4.56-0.13
9.39-6.26-0.22
-0.340.20
STAND AZIERROR GAPZ(KM) (DEG)
0.8 1866.5 123- 2421.3 1065.7 1943.0 1604
0.3 1156.8 1041.5 1646.6 le30.7 1111.7 99
6.5 981.6 1040.8 2120.8 10e0.9 1740.5 158
1.9 2070.7 2141.444 1841.1 2698.5 1281.1 231
6.7 1110.9 las2.5 2321.5 2991.7 236- 282
2.0+ 2790.6 le6
- 3112.5 1851.9 le61.3 104
7.7 2130.6 1870.5 570.9 2736.9 1676.9 106
0.9 1062.3 105
SU4UARY - SG8 EARTHQUAKES
OOD12S UAGNITUDE ESTIMATES
Uco Wd MLh ULV I
ACI 1.74ABZ 1.24CDI 2.67 2.80BCI 1.56CDI e.898CI
ABI 1.08ACZACI 1.62ACI 1.36BCI 2.03BCZ 2.05
ACZ 1.77 1.61ABI 1.54 1.42ADI 1.98 1.54ACI 1.88ACZ 2.55ACI 2.57
8DC 1.96ADZ 1.89 1.85ADIADI 1.78 1.84ABI 1.068D2
8CI 1.78 1.80ACI 1.688DI 1.46ADI 1.86 1.67BDzADI
8DI 1.56ACI 2.37CDI 1.92 1.51DOI 1.92 1.45cEI 1.20
ACI 1.69 1.60
CDI 1.8s 1.69ACI 2.26 2.13ACZ 2.08ADI 1.24 1.01LCI 1.77ACI 1.98 1.95
8CI 1.81 1.83ocI
1.750.752.101.660.741.47
0.351.541.761.432.412.31
1.511.411.311.741.962.70
1.611.681.301 .se1.031.36
1.831.691.60
1.39 1.591.77 1.311.61
1.56 1.622.361.581.021.401.62
1.412.38 2.281.69 1.72
I .42.61 2.67
1.97
1.861.62
DEL- RU INUIN RES. PH. U.S.G.S.
JLC (KM) (SEC) QUADRANGLE
19.9 0.13 16 REVEILLE PEAK1.7 0.07 16 BUCKBOARD MESA
23.8 0.10 1e DEADMAN SPRING SE19.9 0.15 12 REVEILLE PEAK12.3 0.12 10 CANE SPRING2t.0 0.84 7 REVEILLE PEAK
5.9 0.04 13 STRIPED HILLS19.8 0.08 8 REVEILLE PEAK24.8 0.14 7 REVEILLE PEAK19.9 0.08 8 REVEILLE PEAK21.2 0.16 26 REVEILLE PEAK20.0 9.18 9 QUARTZITE WTN
21.1 0.07 19 MELLAN20.1 0.09 16 MELLAN43.4 0.05 13 QUARTZITE U[N20.1 0.13 12 REVEILLE PEAK8.8 0.09 9 LOWER PAHRANAGAT LAKE
2.6 17.7 0.10 27 ALAMO SE
16.8 0.06 9 LOWER PA4RANAGAT LAKE18.8 0.07 11 DELAMAR 3 NW52.5 0.05 10 QUARTZITE MTN27.8 6.03 9 ELIGN NE10.1 0.07 14 CHLORIDE CLIFF33.1 6.11 11 WAUCOSA SPRING
2.2 21.2 0.16 19 REVEILLE PEAK19.7 0.13 11 REVEILLE PEAK29.4 0.08 6 BLACK HILLS W19.4 0.05 6 ELIGN NE10.2 0.18 9 ALAMO21.9 0.00 4 GREGERSON BASIN
21.7 6.02 7 CREGERSON BASIN20.2 6.12 23 REVEILLE PEAK31.7 0.02 6 ***OUAD. NOT LISTED*..0.2 1.84 6 CHCKECHERRY UTN
19.9 0.12 8 REVEILLE PEAK1.6 19.8 6.14 16 REVEILLE PEAK
17.4 0.12 9 LOWER PAHRANAGAT LAKE20.1 0.13 25 REVEILLE PEAK
2.0 13.3 0.06 30 THIRSTY CANYON NE15.4 6.03 7 SLIDY UTN20.7 0.16 18 REVEILLE PEAK
2.8 20.1 0.15 18 REVEILLE PEAK
20.0 0.16 16 REVEILLE PEAK19.7 0.13 6 REVEILLE PEAK

) I ) S I . 9 S .i
1988 LOCAL HYPOCENTER SLUAARY - SG8 EARTHQUAKES
DATE - TIME(UTC)
JUL 16 1:18:4816 4: 9:1516 4: 9:5816 4:14:5216 15:28: 716 15:38:45
16 15:39:2716 19:59: 416 22:38:1317 6:16:2617 7:28:2117 15: 7: 6
17 15:56:5918 4:41:3918 22:22:4019 2:58:5019 6:50:1519 6:52:41
19 9: 8:2719 12: 0:23
I 19 12: 7:5819 13:47:3320 15:14:4526 19:33:12
21 1:49: e21 11: 3:4621 17:59:1121 18:32:1822 11:22:5822 19:24: 7
23 2:18: 623 2:56: 723 10:59:4123 13: 7:3923 16:18:1823 18:35:27
23 20: 2:3723 20:20:4723 21:15:5624 1:24:5524 4:46:5724 4:55:16
24 5:39: 824 5:40:10
LAT I TUDE(DEG. N)
37.85137.29437.57937.57836.47836.450
36.46937.83737.84636.46336.47837.854
37.85637.10537.40937.16536.86337.857
37.88337.85636.45437.81637.42837.844
37.85837.84837.78637.76937.29437.857
37.84536.73237.ee237.84337.33137.846
37.50937.29437.30037.29437.29737.3ee
37.01937.620
LONGI TUE(DEG. W)
116.136116.21611i.S08116.504116.577116.579
116.578115. S.9116.137116.578116.573116.136
116.131116.241114.763116.247116.222116.136
116.134116.133117.932116.862114.724116.136
116.130116.137115.255115.242117.343116.132
116.136116.276116.357116.138117.295116.134
114.611117.347117.344117.343117.338117.342
116.376116.376
STANDFRRORH(KU)
1.50. .,6.46.20.31.0
4.10.90.56.96.46.7
0830.20.4e.36.70.3
e.90.33.52.7e.s0.6
e.s6.80.50.70.30.3
6.50.20.26.30.26.6
6.66.3
6.30.46.4
6.20.3
DEPTH(KM)
-0.328.510.8s
-1.532.2512.26
1.32...360.897.52
-0.830.36
-e.6e6.589.635.911.51
-8.12
6.e66.-0.262.45.5.0c..8.082.98
-0.836.300.14
-0.656.48
-0.31
2.764.23
1e.881.749.72e.84
10.37.6ee
4.944.845.845.48
16.3710.30
STAND AZIERROR GAPZ(Ku) (DEG)
2.3 1051.1 1121.7 980.5 771.1 1191.8 197
- 1851.9 1436.8 1643.9+ 1321.6 1231.2 105
e.5 1m66.5 164e.9++ 2770.7 1034.4 1656.5 106
1.6 11I6.6 16- 2727.9 2371.3++ 2694.e 184
6.9 107S.5 1040.6 1741.2 1890.4 750.6 186
3.2 1046.3 1220.3 1076.7 1036.1 1986.9 164
1.1 29e6.3 761.6++ 951.0++ 750.9 1136.8 96
0.3 510.3 124
O0D12S UAGNITUDE
Uco Ud
9CI 1.72ABI 1.32ACZ 1.39ACZ 1.88 1.99ACZ 1.52 1.2390! 1.56 1.17
CDI 1.30 1.07ADZACZ 1.36B81ACZ 1.20ACI 1.61
ACI 1.72 1.87As!ADI 1.31ABI 1.27BI! 1.39ACI 2.25 1.97
oclAC! 2.34 2.14CDA 2.16CDA 1.18ADI 1.51 1.51BCI 1.48 1.52
ACZ 1.73ACI 1.32 1.63ACI 2.11 1.18ACI 1.69ABZ 1.50ACI 2.45
BCI 1.40ABZ 1.27 6.92ABI 1.23 6.94AC!ADIACI 2.16 1.72
ADIK9ZAB! 1.15ABI 1.29AB! 0.94 1.31AS!
AAI 1.43 1.13As! 1.10 1.17
DEL- RYS INESTIMATES MIN RES. PH. U.S.G.S.
ULh ULv ULc (KU) (SEC) OUADRANGLE
1.76 20.0 0.14 6 REVEILLE PEAK1.08 13.1 0.09 16 OUARTET DOME1.20 21.1 S.09 11 MELLAN
1.52 1.65 21.2 0.09 25 UELLAN1.37 12.7 6.09 17 RYAN1.08 0.9 0.18 16 RYAN
6.87 2.4 12.1 0.12 10 RYAN1.08 5.1 0.03 5 WHITE RIVER NARROWS1.46 19.7 0.09 6 REVEILLE PEAK0.75 11.7 0.16 14 RYAN1.17 12.5 0.13 18 RYAN1.71 20.1 0.13 11 REVEILLE PEAK
2.04 19.9 0.12 20 REVEILLE PEAKe.96 7.6 0.07 17 TIPPIPAH SPRING0.77 22.1 6.02 6 SLIDY UTN0.86 7.6 0.OJ 15 TIPPIPAH SPRING0.77 4.9 0.05 6 SKULL MTN
2.31 2.22 19.9 0.11 26 REVEILLE PEAK
1.39 47.1 0.17 10 REVEILLE PEAK2.38 2.29 20.1 0.12 23 REVEILLE PEAK
61.2 0.12 9 KEELER21.3 0.14 8 CACTUS PEAK
1.76 1.72 19.7 0.03 7 SLIDY UTN1.46 19.6 0.10 7 REVEILLE PEAK
1.60 19.9 0.13 lt REVEILLE PEAK1.72 19.9 0.10 8 REVEILLE PEAK1.26 11.5 0.03 6 COAL VALLEY1.14 10.6 o.11 7SEAMAN WASH1.53 7.6 0.09 19 OOLD POINT
2.57 20.0 0.13 28 REVEILLE PEAK
1.56 19.7 0.10 8 REVEILLE PEAK0.64 1.2 6.05 18 STRIPED HILLS0.98 0.8 4.5 0.04 15 BUCKBCARD MESA1.22 19.6 0.04 6 REVEILLE PEAK
1.20 1.09 4.7 0.01 6 COLD POINT1.94 1.7 19.5 0.15 12 REVEILLE PEAK
1.19 15.5 6.83 6 CALIENTE1.12 8.0 6.12 15 COLD POINT0.95 7.7 0.07 11 GOLD POINT1.32 7.7 0.10 17 OOLD POINT1.17 7.2 0.07 10 COLD POINT
1.24 0.96 7.5 0.07 10 GOLD POINT
1.09 2.3 0.07 27 BUCKBOARD MESA0.57 2.2 0.05 13 BUCKBOARD MESA
( i(

..j I , i I1988 LOCAL HYPOCENTER
U -S ; R OSUM4ARY - SG8 EARTHQUAKES
DATE - TIME LATITUDE(UTC) (DEG. N)
JUL 24 6:12:27 37.e2024 6:56: 3 37.28324 14:17: 8 37.30124 14:37:54 37.3e224 17:42:55 37.85724 22: 3:33 36.732
24 23: 1:34 36.73725 1:36:48 36.73425 7:22:36 37.48425 23:31:27 37.40426 4:55: 4 37.85626 6: 4:39 37.195
26 6: 5:32 37.86126 7:22: 4 37.22926 15:29:41 38.15626 18:56:31 37.84426 22:47:17 36.47827 4: 7:51 37.839
27 4:19: 2 37.84027 9:36:59 37.84727 9:59:48 37.878
@ 27 15:52:19 37.3e327 16:16:57 37.29727 17:39:48 36.485
27 18: 4:51 37.85828 e:39: 9 37.29928 0:39:44 37.31528 0:47:44 37.29426 2:13:15 37.85828 3:20:10 37.302
28 9:40:14 37.e4128 9:48: 7 37.68028 17:59:39 37.26828 18:21:26 37.5e629 12:53:36 37.85929 20:43:16 36.397
29 20e55:50 36.88329 23:51: 1 37.19030 1:35:46 37.85630 1:46:14 37.84330 10:32:38 37.13830 1e:35:18 37.512
30 14:52:39 36.6893e 15:55:43 36.449
LONGITUDE(DEG. W)
116.371117.356117.345117.341116.130116.259
116.256116.271114.568117.441116.129115.212
116.134117.894115.205116.132116.523116.142
116.135116.144116.132117.342117.343115.796
116.129117.320117.31217.348116.130117.340
116.133115.047117.238114.612116.128115.162
116.016117.417116.129116.137118.019115.289
116.3e7116.174
STANDERRORH(KU)
8.30.78.48.40.48.5
8.90.60.00.70.50.8
0.80.61.78.88.20.6
1.3e.51.08.50.20.2
0.50.20.38.28.38.3
1.50.40.4
e.s12.2
1.2
e.3e.10.38.70.8
8.28.3
DEPTH(KM)
10.360.254.555.31
-0.141.53
1.650.839.734.22
-0.248.08
-0.372.995.32.2.258.166.10
2.184.780.300.172.879.03
-1 .es8.729.690.650.0e0.4.55
e.e88.1.401.139.68-0.7810.82
2.857.25
-0.741.63e.0e.
11 .53
2.207.56
STANDERRORZ(KM)
0.40.5s1.20.90.60.4
0.58.2
1.70.81.1
1.22.7
2.40.59.9
2.56.43.09.40.41.144
8.90.30.40.30.40.9+F
2.61.10.91.41 .53.2
1.71.2e.20.88.52.9
0.3e.7
AZIGAP(DEG)
7621696
133'86x86
17817730799
106127
107220266104152102
188192III1339591
18713415912410797
103197112278107236
171119148103242121
1781e6
OOD12S
AAIAD[ABIAB!ACIAD!
ACZACZADIBolACIA81
DC'BDICDl
ACICDA
BOACDABCAABZAS!AC!
ACZABSAC!As!ACIABS
BCIADZAS!ADIBCIDDZ
sct
AC!ADZ
AC]ADiB81
ACIADI
F ~DEL- RUSMAGNITUDE ESTIMATES MIN RES. IUco Ud ULh ULv ULc (KU) (SEC)
1.28 1.03 0.95 e.8 2.2 0.691.01 1.31 1.15 9.0 6.03
1.19 1.12 7.8 ."60.96 1.23 0.73 7.4 6.052.e0 1.92 2.11 2.4 19.9 0.130.91 1.e6 1.07 1.7 6.08
8.82 1.08 8.76 1.5 6.100.54 I.6 0.08
1.26 1.49 20.2 6.661.17 1.44 1.20 1.44 6.6 6.161.95 1.58 1.88 1.7 19.8 0.14
1.31 1.32 1.36 3.6 0.65
1.66 20.4 0.162.43 2.20 2.42 2.4 21.8 6.161.88 1.65 1.90 32.6 0.16
1.33 19.2 6.131.02 0.97 9.8 0.041.03 19.8 0.05
1.52 19.3 0.131.02 20.4 6.o61.73 21.5 0.21
1.25 1.49 1.36 7.5 6.111.34 1.66 1.58 1.8 7.6 0.081.97 1.81 1.5 23.3 0.10
1.79 1.72 1.79 19.9 0.121.05 1.27 1.06 5.6 0.62
1.24 1.bd 1.e9 5.1 6.631.24 1.28 8.0 6.64
2.87 2.22 2.32 2.33 20.0 6.131.34 1.30 7.4 0.09
1,70 2.2 19.2 0.250.79 10.2 6.03
1.59 1.43 1.25 4.6 6.111.79 1.71 1.64 1.76 15.7 6.651.31 1.79 1.56 19.9 6.152.26 1.82 2.0 12.1 0.78
0.72 6.4 6.120.72 6.85 18.7 6.68
1.25 41.4 0.011.52 1.32 19.6 0.07
1.73 1.63 1.67 33.4 6.690.95 18.5 0.12
1.37 1.8e 1.03 5.7 e.041.51 1.14 1.15 6.3 6.07
INPH. U.S.G.S.
QUADRANGLE
24 BUCK90ARD MESAJ OOLD POINT9 COLD POINT9 GOLD POINT19 REVEILLE PEAK1S STRIPED HILLS
14 STRIPED HILLS9 STRIPED HILLSS ELICN NE
13 LIDA16 REVEILLE PEAK10 LOWER PAHRANAGAT LAKE NW
10 REVEILLE PEAK39 WAUCOBA SPRING9 TIlMER MTN PASS NW7 REVEILLE PEAK
15 RYANS REVEILLE PEAK
6 REVEILLE PEAK6 REVEILLE PEAK
12 REVEILLE PEAK16 COLD POINT25 GOLD POINT28 UT STIRLING
16 REVEILLE PEAK9 GOLD POINT9 GOLD POINT
10 COLD POINT29 REVEILLE PEAK14 GOLD POINT
8 REVEILLE PEAK6 HIKO NE
20 SCOTTYS JUNCTION SW6 CALIENTE
16 REVEILLE PEAK13 CASS PEAK NW
11 YUCCA LAKE13 UBEHEBE CRATER5 REVEILLE PEAK8 REVEILLE PEAK
16 ***QUAD NOT LISTED...7 UT IRISH
17 STRIPED HILLS19 AMARGOSA FLAT

) I 3 ; I ' ) ") 7
1988 LOCAL HYPOCENTER SULMARY - SG8 EARTHOUAKES
DATE - TIME LATITUDE LONGITUDE(UTC) (DEG. N) (DEG. W)
JUL 303131313131
313131
AUG I
2I1
2
222
0 222
2
3
333
44444
5
SS5
66
666
19:51:392:38: 64:24:254:45:286: 13:487: 1:47
7:31:3218:47:1821:56:25
1:45:341:46:262:39:58
9:59: 215:42:580: 4:29e:25 160:38:141:3e: 15
4:21:4811:25:2812:39:1113:31:2414:58:461:38:34
2:45:316:33:59
10:41: 113:24: 814: 0:4422:22:31
14:34:2915:33:2221:21:5722:32:3622:45:262: 9:38
3:43: 36: 3:456:27:394:12:154:47:596:33:13
15:58:2116: 9:48
37.39936.71437.50737. 5e736.76837. 505
37.85837.84337.19337.04537.e3937.171
36.48137.23937.21937.85737. 86637.256
37.85937. 85437.50337.85736.73337.848
37.86336.67237.82837.43237.83637.277
37.84137.85737.84337.84036.83237.412
37.85337.84336.48437.84e37.84137.863
37.84037.851
114.884116.275114.615114.616116.265114.611
116.126116.133117.610116.611116.618I 18.065
116.928115.350117.886116.131116. 129115.009
116.129116.118114. 614116. 119116.274116.141
116.131117. 246116.132117.148116.151116.346
116.139116.120116.138116.142116.644117.438
116.134116.140116.307116.138116.134116.132
116.138116.132
STANDERRORH(KM)
12.2e.10.31.26.50.9
6.5e.66.66.4e.32.6
6.86.82.6e.40.26.7
0.20.41.00.56.26.3
e.30.94.30.31.91.5
0.30.90.5
11.90.50.4
6.96.3e.20.36.30.4
0.36.5
DEPTH(KM)
2.5396.828.569.998.468.51
-e.48
9.4911.2511.422.60
14.916.164.44.0.78
-0.14-0.31
6.17-0.7211.20-0.32
6.227.94
-6.2714.6e2.78.5.06.4.32.0.90
5.17-0.520.781 .88.
-6.815.74
-6.321.607.997.066.34
-0.41
8.650.85
STANDERRORZ(KU)
0.30.82.40.82.2
6.83.8+6.86.86.79.5
3.64.8
0.70.80.6
6.40.41.46.46.31 8
0.62.5
2.8
1.4
3.5+1.40.7
0.50.7
1.50.90.72.02.40.6
1.30.9
AZIGAP(DEG)
31354
299300233299
113134162135136256
165I02218114107209
107194278195176164
108178226111294277
163112103235l1e67
106103
64103103188
163105
C4D12S UAGNITUDE ESTIUAl
Uco Ud ULh
DDI 1.5e 6.87AAI 2.66 1.49ADI0DI 1.64ADI0DI 1.61
ACIBCIACIACIABICDA 1.71
BCA 1.26BC!CDI 1.39 1.45ACI 1.91ACI 2.72ADZ 1.76
AC! 2.66ADI 1.90 1.84ADI 1.42 1.31ADZ 1.93 2.05ACZ 1.13 e.9sAC! 1.78
ACI 1.64 1.91BCA 2.12CDA 1.88BCA 1.68COA 1.30SDZ 1.84
BCI 1.52 1.97ACZACIDDI 1.31ABI 1.44 1.36ABI 1.08 1.37
ACI 1.76 1.56AC! 1.46 1.86AC! 1.54 1.57ACU 1.28 1.54BCI 1.87 1.81AC! 1.69
ACI 1.62BCZ 1.97 1.94
3.291.61
2.18
DEL- RS IN[ES MIN RES. PH. U.S.G.S.ULY 4Lc (KU) (SEC) QUADRANGLE
1.4 14.8 0.02 6 DELAMAR NW2.2 3.1 0.67 40 STRIPED HILLS
0.98 15.4 0.01 S CALIENTE1.20 15.7 0.64 5 CALIENTE0.66 3.8 6.06 13 STRIPED HILLS1.03 15.6 0.05 6 CALIENTE
1.74 19.7 0.08 9 REVEILLE PEAK1.66 19.3 0.09 7 REVEILLE PEAK0.88 5.5 0.13 14 LAST CHANCE RANGE1.81 15.2 0.06 16 THIRSTY CANYON SE1.05 15.3 e.e5 15 THIRSTY CANYON SE
29.5 0.15 8 *..QUAD. NOT LISTED...
4e.1 0.13 10 FURNACE CREEK1.36 16.4 6.11 13 DESERT HILLS NE1.33 21.4 0.22 8 WAUCOBA SPRING1.6e 20.6 0.09 13 REVEILLE PEAK
20.0 0.08 30 REVEILLE PEAK1.34 17.8 6.65 8 ALAMO SE
1.99 20.0 6.67 20 REVEILLE PEAK1.81 2.2 18.9 6.65 13 REVEILLE PEAK1.55 15.8 0.08 9 CALIENTE1.69 19.1 0.04 9 REVEILLE PEAK
1.0 1.0 6.04 16 STRIPED HILLS1.65 26.2 0.06 1I REVEILLE PEAK
1.96 20.3 0.13 19 REVEILLE PEAK20.9 0.67 9 STOVEPIPE WELLS23.9 0.26 7 REVEILLE PEAK17.5 0.13 9 STONEWALL PASS22.8 0.l8 5 REVEILLE PEAK
1.25 7.2 0.04 12 DEAD HORSE FLAT
1.83 1.7 19.7 0.10 16 REVEILLE PEAK1.19 19.2 0.09 7 REVEILLE PEAK1.45 19.7 6.09 8 REVEILLE PEAK1.6e 19.8 6.09 5 REVEILLE PEAK0.74 4.3 6.08 9 BARE MTN1.37 1.3 6.2 0.11 16 LIDA
1.55 19.9 0.12 8 REVEILLE PEAK1.84 1.8 19.8 0.08 17 REVEILLE PEAK1.48 1.8 18.6 6.07 25 ASH MEADOS1.62 19.5 0.09 12 REVEILLE PEAK1.69 19.2 6.o8 14 REVEILLE PEAK1.83 2.1 20.4 0.13 19 REVEILLE PEAK
1.59 19.5 0.06 9 REVEILLE PEAK1.78 19.7 0.16 15 REVEILLE PEAK
1.29
1.94
) (
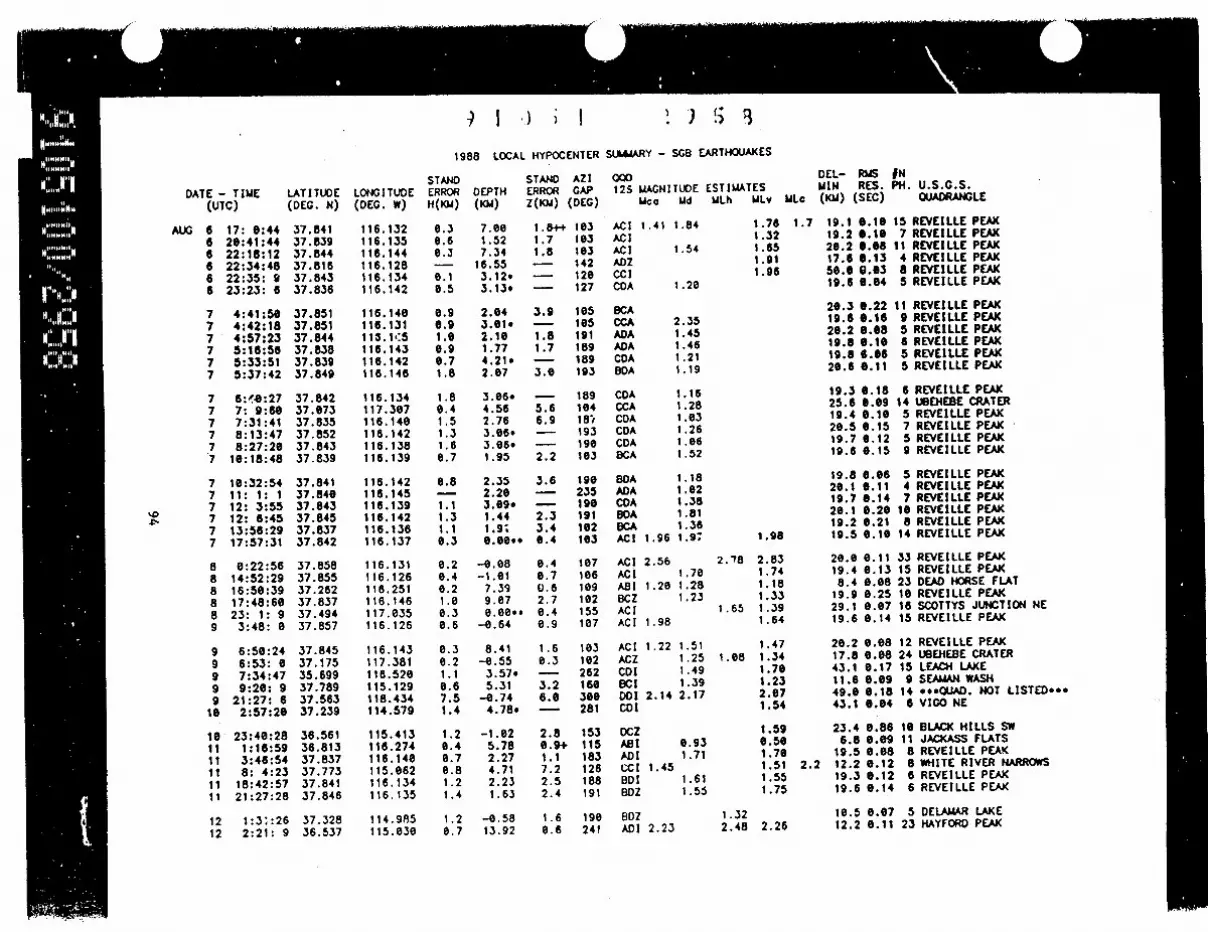
dw
) I 1) i I ' ) !i 3
1988 LOCAL HYPOCENTER SUU4ARY - SGB EARTHQUAKES
DATE - TIME LATITUDE(UTC) (DEG. N)
AUG 6 17: 0:44 37.8416 20:41:44 37.5396 22:16:12 37.8446 22:34:48 37.8166 22:35: 9 37.8436 23:23: 6 37.836
7 4:41:50 37.8517 4:42:18 37.8517 4:57:23 37.8447 5:16:56 37.8387 5:33:51 37.8397 5:37:42 37.849
7 6:'4:27 37.8427 7: 9:68 37.0737 7:31:41 37.8357 8:13:47 37.8527 8:27:20 37.8437 10:18:48 37.839
7 10:32:54 37.8417 II: 1: 1 37.8407 12: 3:55 37.8437 12: 6:45 37.8457 13:56:29 37.8377 17:57:31 37.842
8 0:22:56 37.8588 14:52:29 37.8558 16:50:39 37.2628 17:48:60 37.8378 23: 1: 9 37.4949 3:48: e 37.857
9 6:50:24 37.8459 6:53: 0 37.1759 7:34:47 35.6999 9:20; 9 37.7899 21:27: 6 37.56310 2:57:20 37.239
10 23:40:28 36.56111 1:16:59 36.81311 3.46:54 37.83711 8: 4:23 37.77311 18:42:57 37.84111 21:27:28 37.846
12 1:3:26 37.32812 2:21: 9 36.537
LONGITUDE(DEG. W)
116.132116.135116.144t16.128116.134116.142
116.140116.131115.1}5S116.143116.142116.146
116.134117.307116.140116.142116.138118.139
116.142116.145116.139116.142116.136116.137
116.131116.126116.251116.1461 17.e35116.126
116.143117.381116.520115.129118.434114.579
115.413116.274116.140115.e62
116.134116.135
114.985115. e3e
STANDERRORH(KW)
0.50.6e0,
0.1e.5
e.90.91.00.90.71.8
1.80.41.51.31.60.7
0.8
1.11.31.10.3
0.20.40.21 .0e.30.6
0.3e.21.10.67.51.4
1.20.40.70.81.21.4
1.20.7
STAND AZIDEPTH ERROR CAP(KM) Z(KU) (DEG)
7.00 1.8++ 1031.52 1.7 1037.34 1.8 103
16.55 - 1423.12. - 1203.135 - 127
2.04 3.9 1055.01. - 1052.10 1.8 1911.77 1.7 1894.21. - 1892.07 3.0 193
3.06. - 1894.56 5.6 1042.76 6.9 18)3.06. - 1933.06. - 1901.95 2.2 103
2.35 3.6 1902.20 - 2353.09. - 1901.44 2.3 1911.9. 3.4 1020.00.o 0.4 103
--0.08 0.4 107-1.01 0.7 106
7.39 0.6 1099.07 2.7 1020.00.* 0.4 155
-0.64 0.9 107
8.41 1.6 103-0.55 0.3 1023.57. - 2625.31 3.2 160-0.74 6.0 300
4.78. - 281
-1.02 2.8 1535.78 0.9+ 1152.27 1.1 1834.71 7.2 1262.23 2.5 1881.63 2.4 191
-0.58 1.6 19013.92 0.6 240
000125 MAGNITUDE ESTIUATES
Uca Ud MLh MLv MLc
DEL- RUS INMIN RES. PH. U.S.G.S.(KM) (SEC) QUADRANGLE
ACI 1.41 1.84ACIACI 1.54ADZCclCDA 1.20
BCACCA 2.35ADA 1.45ADA 1.46CDA 1.21BDA 1.19
CDA 1.16CCA 1.28CDA 1.03CDA 1.26CDA 1.06DCA 1.52
BDA 1.18ADA 1.02CDA 1.38BOA 1.81BCA 1.36ACI 1.96 1.9.
AC! 2.56ACI 1.70ABI 1.20 1.28BCZ 1.23AC!ACI 1.98
ACI 1.22 1.51ACZ 1.25CDI 1.49BCI 1.39DDI 2.14 2.17CDI
DCZABI 0.93ADI 1.71CCI 1.45BDI 1.61BoZ 1.55
BDZADI 2.23
1.761.321 .651.911.96
1.98
2.78 2.831.741.181.33
1.65 1.391.64
1.471.08 1.34
1.701.232.071.54
1.590.501.701.511.551.75
1.7 19.1 6.1019.2 0.1020.2 6.0817.6 e.135.0. 9.0319.6 0.04
20.3 6.2219.6 0.1620.2 0.0819.8 0.1019.8 6.0620.6 0.11
19.3 0.1825.6 6.0919.4 0.1020.5 0.1519.7 6.1219.6 0.15
19.8 0.0620.1 0.1119.7 6.1420.1 0.2019.2 0.2119.5 0.10
20.0 0.1119.4 0.138.4 0.08
19.9 0.2529.1 0.e719.6 0.14
20.2 0.0817.8 e.e843.1 0.1711.6 0.0949.0 0.1843.1 6.04
23.4 0.886.8 O.0s
19.5 0.082.2 12.2 0.12
19.3 0.1219.6 0.14
10.5 0.0212.2 0.11
15 REVEILLE PEAK7 REVEILLE PEAK
11 REVEILLE PEAK4 REVEILLE PEAK8 REVEILLE PEAK5 REVEILLE PEAK
11 REVEILLE PEAK9 REVEILLE PEAK5 REVEILLE PEAK6 REVEILLE PEAK5 REVEILLE PEAK5 REVEILLE PEAK
6 REVEILLE PEAK14 UBEHEBE CRATER
5 REVEILLE PEAK7 REVEILLE PEAKS REVEILLE PEAK9 REVEILLE PEAK
5 REVEILLE PEAK4 REVEILLE PEAK7 REVEILLE PEAK
10 REVEILLE PEAK8 REVEILLE PEAK
14 REVEILLE PEAK
33 REVEILLE PEAKi15 REVEILLE PEAK23 DEAD HORSE FLAT10 REVEILLE PEAK15 SCOTTYS JUNCTION NE15 REVEILLE PEAK
12 REVEILLE PEAK24 UBEHEBE CRATER15 LEACH LAKE9 SEAMAN WASH
14 ***OUAD. NOT LISTED...6VIGO NE
5 10 BLACK HILLS SWI 11 JACKASS FLATS3 8 REVEILLE PEAK
8 WHITE RIVER NARRCWS6 REVEILLE PEAK6 REVEILLE PEAK
S DELAUAR LAKE1 23 HAYFORD PEAK
1.322.48 2.26

) I 1 ; I i ) 9)
1988 LOCAL HYPOCENTER SLAARY - SG8 EARTHQUAKES
DATE - TIME LATITUDE(UTC) (DEC. N)
AUG 12 3:18:11 38.56812 6:34:34 37.82212 13:47:22 35.94612 13:47:23 36.66312 21:42:39 56.81312 22:44:22 37.229
13 6:25:29 36.8ie13 5:39:29 36.63413 6:28:14 36.84513 7:55:11 36.02013 9: 9:18 36.61713 12:14:45 36.619
13 13:48:25 36.81113 26:22:19 37.86413 20:51: 7 37.86114 8:12: 7 35.97114 13:45:54 37.81514 18:22:39 37.231
15 5:53:60 37.41115 10:34:49 37.86115 11:30: 8 37.2e515 17:16: 2 37.868
u S 15 18:44:49 36.63715 18:49: 6 37.385
15 18:59:36 37.38415 19:36:31 37.38416 2:13:59 37.27216 5:45: 6 37.56616 6:46:45 36.80916 7:52:26 36.818
16 7:54:48 36.81318 9:15:48 37.25816 16:35:33 37.20616 11: 3:39 37.20417 7:28:13 37.82917 6:10:38 37.218
17 11:14:35 37.84317 11:26:16 37.84817 12:10:58 36.62617 16: 9:30 36.49318 3:12: 2 36.37818 21:30:27 36.618
18 22: 4:12 37.86418 22:22:46 37.301
LOiG ITUDE(DEG. W)
115.018117.384114.821114.884116.033116.511
116.026116.36k116.266114.757116.347116.353
116.628116.132116.134114.8s4114.687117.593
117.439116.135116.534116.135115.1 99115.201
115.183115.193116.353117.267116.635116.638
116.036117.869116.533116.558116.145116.540
116.139116.141115.252116.577116.930115.963
116.127116.286
STANDERRORH(KM)
0.91.21.52.10.56.3
0.20.60.2
1.01.6
e.7e.66.84.71.36.4
6.4e.86.21.5e.50.3
0.66.40.96.36.20.4
1.01.70.216.81.10.5
0.91.33.76.30.40.3
0.86.3
STAND AZI OODDEPTH(KM)
15.36n72
-e.93-0.90.6.081.81
-6.968.458.427.00..8.589.20
6.20-1.00-0.4816.403.139.29
5.046.126.22
-1.2615.34-0.22
7.8e4.656.65
-0.33-0.862.94.
1.989.434.876.38*0.878.13
2.273.8637.00.0.l816.561e.45
2.20-0.17
ERRORZ(KU)
0.71.42.8
2.36.8
6.36.56.4
0.66.6
2.10.50.86.03.36.5
0. 8+41.00.31.30.86,4
1.52.50.40.60.4
GAP(DEG)
244nPe4163282132169
16613846
245380313
176189188203269112
5818842
189145125
165le1243121136195
24320941
197186139
10319224963163155
1088e
12S MAGNITUDEUcC Md
SDI 2.34SDIBC!CDISCI 1.86 1.53ACI 1.47 1.48
ACZAct 0.84MI 1.58 1.22ADIADZ801
BCtADI 1.71AD!DOIBDZ 1.80 1.12ABI 1.11 1.33
A81 1.36ADI 2.54ACZ 1.84BOZ 1.38ACI 2.63 1.70ACZ 1.57
ACI 1.44DC! 1.62ADI 1.68 1.73DC! 2.63ACZ 1.45 1.33CDA 1.86
ADA 1.24BOA 1.38ACA 2.42W A 6.83BOA 1.25ACA 1.18
BCA 1.34CCA 1.16CDA 1.37ACI 1.69AS!ACI
BCIACI 2.21
DEL- RUS INESTIMATES MIN RES. PH. U.S.G.S.ULh ULv MLc (Ku) (SEC) QUADRANGLE
2.48 2.32 12.7 0.15 21 HAYFORD PEAK1.32 58.9 0.12 11 PAYMASTER RIDGE1.95 6.6 0.10 9 BOULDER CITY1.91 113.2 6.05 8 HENDERSON1.46 13.6 6.15 21 CANE SPRING1.11 13.4 0.68 18 THIRSTY CANYON NE
0.99 13.7 0.04 9 CANE SPRING1.62 2.4 0.16 15 STRIPED HILLS
1.23 1.69 5.4 6.09 30 JACKASS FLATS0.54 10.9 6.13 3 BOULDER BEACH6.80 3.2 6.06 7 LATHROP WELLS SE6.73 3.1 6.07 8 LATHROP WELLS SE
6.85 13.4 6.69 9 CANE SPRING1.65 20.5 6.0 11 REVEILLE PEAK1.58 20.5 6.09 8 REVEILLE PEAK
2.0 32.4 0.16 7 ELDORADO VALLEY1.97 1.98 23.6 6 .J 8 THE BLUFFS
1.15 4.8 6.16 15 LAST CHANCE RANGE
1.21 6.2 0.12 20 LIDA2.36 2.46 26.5 6.14 14 REVEILLE PEAK1.98 2.65 13.5 6.68 33 THIRSTY CANYON NE
1.58 21.6 6.68 7 REVEILLE PEAK1.85 15.6 6.69 12 HAYFORD PEAK1.4e 13.6 0.65 7 ASH SPRINGS
1.57 1.25 12.0 0.68 7 ASH SPRINGS1.54 12.9 6.e6 10 ASH SPRINGS
1.67 1.12 7.6 0.11 15 DEAD HORSE FLAT2.33 2.32 21.7 6.17 33 COLDFIELD
1.24 1.5 12.9 6.08 18 CANE SPRING12.3 0.66 12 CANE SPRING
12.7 6.11 8 CANE SPRING18.8 0.12 8 SOLDIER PASS13.5 0.68 26 THIRSTY CANYON NE12.1 6.12 5 THIRSTY CANYON NE19.5 6.13 6 REVEILLE PEAK12.1 6.69 16 THIRSTY CANYON NE
19.7 0.17 8 REVEILLE PEAK26.2 0.34 6 REVEILLE PEAK50.5 0.14 16 WHITE SAGE FLAT
1.45 13.9 6.12 19 RYAN1.45 1.33 15.5 6.13 23 FURNACE CREEK
1.11 4.8 6.05 15 MERCURY SW
1.57 20.1 6.14 7 REVEILLE PEAK2.67 16.3 6.11 27 DEAD HORSE FLAT
1.53.31.4
1.21.4
2.7
0.60.90.6
2.70.8
6
( )(
/ (

MW/
) I . .; I ' 9 31988 LOCAL HYPOCEJTER SLUAARY - SGB EARTHQUAKES
STAND STAND AZI 000
AL
~o'.0
DATE - TIME LATITUDE I(UTC) (DEG. N)
UG 18 22:25:59 37.30119 0:26:34 37.25119 2:57:43 37.85619 3:56:45 37.57019 14:27:14 37.56719 15: 1:58 37.567
20 1:14: 0 37.56620 7:57:39 37.56820 10:58:37 37.65420 11:26:29 37.44720 14:18:55 36.62920 14:31:15 36.636
28 15: 2:29 36.84520 18:13:58 37.56620 18: 4:23 37.57420 23:48:24 37.57121 7:58:21 37.85121 9:46:48 37.714
21 13: 8: 1 37.16121 13:22:40 37.67122 4:32:40 37.85722 5:25:50 37.85322 8:13: 5 36.71322 11:35: 1 37.858
22 22;44:31 37.85522 22:53:16 37.84123 14:23:38 36.10823 14:46:12 37.20923 19: 5:15 37.29523 28:37:38 35.9se
24 5: 3:33 36.66224 7:35:26 35.93124 7:59:48 35.94224 9: 4:11 35.92924 10:20:18 35.93124 11:57:24 35.934
24 12: 8:13 36.29324 14:13:24 37.85824 14:27:38 37.85824 14:38:23 35.92224 14:39:35 35.92724 14:56:24 35.952
24 15:36:37 35.946
.ONGITUDE ERROR DEPTH ERROR GAP 12S UACNI:DEG. W) H(KU) (KU) Z(KM) (DEG) uca
116.289 9.3 6.44 0.8 79 ACI 2.65115.031 0.4 5.56 1.6+ 195 ADI 2.17116.130 0.4 -0.13 0.7 106 ACI 1.79117.208 0.4 8.94 1.6 125 ACI117.200 6.6 e.22 0.9 125 BCI117.202 8.5 0.15 0.9 124 ACZ
117.205 e.7 0.68 1.1 124 ACI117.297 e.5 7.e 2.9+ 124 WCI116.131 8.5 6.37 0.8 106 BCI 1.44117.898 e.7 9.69 0.9 177 ACZ116.38a 0.2 2.52 6.5 132 ABZ 1.53116.295 6.3 0.99 8.3++ 142 ACI
116.258 0.3 8.61 0.6 103 ABI117.203 e.5 6.68 e.7 124 BCI117.268 6.4 10.72 1.7 126 ABI117.208 e.4 7.09 2.2++ 123 BCI116.129 e.7 0.00o. 1.1 1e5 ACI115.024 1.0 8.73 3.1 127 681 1.39
115.017 5.1 19.92 10.2 247 DODI115.044 0.7 -1.84 0.9 108 ADZ116.133 0.4 2.85. - 106 CCA116.138 6.3 -0.88* - 185 CCA117.280 8.3 11.e65 - 133 DBA116.131 0.7 3.51. - 107 CCA
116.127 6.8 0.00.e 1.3 106 ACI116.128 6.6 0.73 0.9 164 ACZ114.676 2.3 1.16 7.8 220 CDI 2.58116.543 0.3 5.66 1.0 70 ACI 1.45116.318 1.4 2.86 1.0 274 BDZ 1.55114.847 5.3 2.67. - 208 DDI
116.06e 0.4 6.85 1.1 144 ACI116.976 1.5 5.17 2.7 267 SDI116.972 3.0 e.54 2.5 266 CD!116.972 2.8 2.42 9.0 274 CDI116.978 1.1 5.95 1.4 268 SDI116.972 1.0 5.30 1.8 264 SDI 2.11
116.776 4.1 7.60 10.9 149 DCI116.130 6.4 -0.39 6.7 167 ACI116.127 6.4 -0.60 0.8 107 ACI 1.72116.981 0.7 6.15 1.4 266 ADI 2.17116.993 3.6 -0.e1 3.0 269 CDI116.981 1.0 6.21 0.9 265 BDI
117.003 1.8 2.94. - 328 DDI116.978 0.8 6.59 1.0+4+ 275 ADI
TUDE ESTIMATESUd ULh MLv 1
2.25 1.852.09 1.931.89 1.96 2.611.31 0.77 1.091.60 0.92 1.32
0.99
1.371.12
1.75 1.851.58
1.14 0.981.37 6.86
6.511.301.24
1.78 1.631.76 1.821.47 1.26 1.32
1.21 1.376.85
2.512.271.611.97
1.631.58
1.84
DEL- R4S INUIN RES. PH. U.S.G.S.
JLc (KM) (SEC) QUADRANGLE
16.1 0.11 23 DEAD HORSE FLAT16.6 0.07 10 ALAMO SE
2.2 19.9 6.13 26 REVEILLE PEAK21.3 0.08 14 GOLDFIELD22.1 6.15 14 GOLDFIELD21.9 9.11 11 GOLDFIELD
21.8 6.13 16 GOLDFIELD21.5 0.10 12 GOLDFIELD19.8 0.16 17 REVEILLE PEAK2.5 6.67 10 SOLDIER PASS3.4 0.07 25 STRIPED HILLS4.1 0.05 13 STRIPED HILLS
5.5 0.08 16 JACKASS FLATS21.9 0.16 15 GOLDFIELD26.9 0.08 13 GOLDFIELD21.3 0.09 16 GOLDFIELD19.5 0.12 9 REVEILLE PEAK10.3 0.14 6 HIKO NE
15.1 0.13 5 LO*ER PAHRANAGAT LAKE9.7 6.05 5 HIKO NE
26.1 6.12 13 REVEILLE PEAK20.2 6.11 12 REVEILLE PEAK7.5 2.51 9 MARBLE CANYON
26.0 0.34 12 REVEILLE PEAK
19.5 0.10 8 REVEILLE PEAK18.8 0.16 7 REVEILLE PEAK21.8 0.06 10 HOOVER DAM12.6 0.09 25 THIRSTY CANYON NE
9.0 0.86 9 DEAD HORSE FLAT8.6 0.16016 BOULDER CITY
8.9 0.08 12 CAMP DESERT ROCK10.4 6.67 8 WINGATE WASH38.3 e.09 9 WINGATE WASH39.4 6.67 9 WINGATE WASH10.6 0.10 14 WINGATE WASH10.0 6.11 16 WINGATE WASH
15.3 1.63 16 FURNACE CREEK19.9 0.13 17 REVEILLE PEAK
2.2 19.8 6.13 15 REVEILLE PEAK11.3 6.68 14 WINGATE WASH12.1 0.68 7 WINGATE WASH10.3 0.64 6 WINGATE WASH
12.4 0.05 5 MANLY PEAK1e.8 0.07 9 WINGATE WASH
1.521.342.651.216.832.22
0.751.96
1.65 1.841.752.062.37
1.322.861.922.381.351.19
1.221.1624 17:45:44 35.926
- -- IR m I 14 R,-- 1 � I. lp I rm lw�p. .. . L' ... --

,. I ; I ) ', I
1988 LOCAL HYPOCENTER
DATE - TIUE(UTC)
AUG 25 2: 6:3125 3:30:5325 6:33:3425 16:50:4625 12:26:4725 13:11:14
25 14:14:5025 16:59:5825 17:29:5225 17:45:5725 18:10:4025 26:57:15
26 2: 7:2528 2:32:2628 3:59:2828 5:56:5828 10:48:4928 16: 8:39
29 2:27:2729 2:51:3529 4: 1:2829 4:25:1029 10:13:4129 12:51:10
29 13:46:5930 2:36:3236 2:46:4330 3:33: 430 I1: 4:1030 13:53: 8
30 15:28:1931 2:49:5131 2:59:2931 3:19:2531 9:22:5631 12:45:39
31 14:55:3931 18:20:1531 19:27:5231 19:27:5831 23:45:19
SEP 1 3:10.' 8
1 9:24:161 9:24:35
LATITUDE(DEG. N)
36.32737.62637.85237.85335.95435.902
35.92537.33735.93036.7el37.32037.339
35.98937.28037.86335.87936.72137.858
37.88436.69537.26336.67837.78637.154
36.70837.85737.85937.85037.83437.840
37.20737.84337.85036.81237.85436.728
37.24336.72656.69936.66237.25837.512
37.36637.292
LONG I TUDE(DEG. W)
116.812115.972116.146116.140116.973116.996
116.976117.631116.982115.736115.208117.626
114.728115.462116.123115.074115.969116.126
116.116115.s58115.198116.078115.164117.540
115.583116.135116.1J6116.132116.142116.145
116.539116.137116.134116.262116.130115.941
115.021115.938115.542115.963115.434114.623
117.339117.346
STANDERROR DEPTHH(KU) (KM)
8.1 5.41.2.3 2.352.6 5.41.1.9 7.15.- 5.902.9 -0.14.
1.0 (.270.2 0.511.3 5.18e.2 11.693.2 7.65.6.2 6.01
1.7 4.116.7 -1.620.2 -1.290.8 3.26.0.2 -4.510.2 -0.94
0.2 -1.111.2 9.782.4 -1.626.3 6.361.7 4.58e.3 9.18
0.6 -1.500.2 0.420.4 -0.950.8 0.06..0.7 4.321.1 3.18.
0.2 -0.ele.7 2.290.4 -0.e60.6 6.28e.4 -1.060.1 4.36
2.1 4.960.2 4.10t.6 1.404.8 7.000.4 6.741.5 13.27
6.4 5.180.3 0.41
STANDERRORZ(KU)
7.4
1.4++
0.42.30.5
0.4
1.60.90.4
0.30.4
0.34.22.76.6
11.50.9
0.96.S0.71.3
1 1. 1
0.32.00.71.20.70.7
7.90.8-a,
10.43.10.81.9
0.9 16.5
AZIGAP(DEG)
145175193194271268
275105275176220102
255126108223120107
113153166108178153
86106107105187190
132163165126106132
209132k78146101297
112Is
86
SL*AAARY - SGB
OOD12S MAGNITUDE
Uco a d
DCA 1.69CCA 1.41CDA 1.14CDA 1.23BDA 1.37CDA 2.34
ADI 1.21ACZ 1.69BDI 1.11ACI 1.97 1.31DDIACI
8DZ 2.01ACZ 1.43ACICDIABZACI
ACIBCIDCZACZ 1.2eCCI 1.45ACI 1.85 2.18
ECzACI 2.42ACZACICDA 1.34CDA 1.61
ACZACIACI 1.89ABIACI 1.75ASI 1.85 1.55
CDIAb! 1.82 0.96CDZ 1.01DCI 0.93ACZ 1.61BDI 1.22
ABIABZ 1.22
.,
FARTHOUAKES
ESTIMATESMLh MLv MLc
1.151.741.28
1.58 1.661.691.12 1.00
2.251.19 1.49
1.701.320.751.72
1.651.41
0.84 0.730.771.14
2.-5 2.10
1.492.65 2.72
1.771.43
6.821.49
2.23 2.166.47
1.68 1.911.48
1.87 1.041.341.196.86
1.46 1.540.93
1.101.52
DEL-. RUS tNDIN RES. PH. U.S.G.S.(KM) (SEC) QUADRANGLE
20.2 0.99 7 FURNACE CREEK14.7 0.12 1O WHITE BLOTCH SPRINGS26.3 6.15 5 REVEILLE PEAK20.4 0.14 5 REVEILLE PEAK37.5 6.27 4 WINGATE WASH43.0 0.14 12 WINGATE WASH
16.7 6.07 8 WINGATE WASH11.7 6.07 23 MAGRUDER MTN11.6 6.67 7 WINGATE WASH6.7 0.06 22 INDIAN SPRINGS Nt
16.9 1.09 6 ALAMO11.9 0.06 14 MAGRUDER MTN
7.8 6.05 6 RING8OLT RAPIDS27.4 0.12 9 CUTLER RESERVOIR19.8 .O4 1 REVEILLE PEAK29.1 6.67 8 SLOAN6.8 0.08 17 MERCURY
19.7 6.04 10 REVEILLE PEAK
20.8 0.04 11 REVEILLE PEAK19.9 0.28 14 HEAVENS WELL10.5 0.64 7 ALAMO10.6 0.16 18 CAUP DESERT ROCK13.5 0.16 7 SEAMAN WASH14.4 6.16 26 LAST CHANCE RANGE
2e.4 0.17 16 HEAVENS WELL20.3 6.11 33 REVEILLE PEAK20.6 0.12 12 REVEILLE PEAK19.6 0.13 9 REVEILLE PEAK19.5 0.08 6 REVEILLE PEAK20.1 6.15 8 REVEILLE PEAK
12.9 0.06 16 THIRSTY CANYON NE19.7 0.13 8 REVEILLE PEAK19.8 6.15 21 REVEILLE PEAK7.5 0.12 11 JACKASS FLATS
19.7 0.13 15 REVEILLE PEAK7.7 6.65 23 MERCURY
16.9 6.e7 8 LOWER PAHRANAGAT LAKE7.5 0.05 15 MERCURY
37.7 0.12 9 HEAVENS WELL6.2 1.96 9 MERCURY24.0 0.08 13 CUTLER RESERVOIR14.5 0.08 6 CALIENTE
7.2 0.16 13 GOLD POINT7.9 6.11 17 GOLD POINT

j,,_
988 LOCAL YCNT ' I E
1988 LOCAL HYPOCENTER SUMMARY - SG8 EARTHOUAXES
DATE - TIME LATITUDE(UTC) (DEG. N)
SEP 1 9:26:29 37.2961 9:38:38 37.2951 21:55:21 37.4922 6:59:19 37.8782 14:12:56 36.9882 21:14:24 37.843
2 21:46: 6 36.5623 11:53:19 37.1473 17:47:50 37.8614 13:20: 2 37.4284 22:13:29 37.8525 3: 5:54 37.862
5 11: i:25 37.6616 18:42:54 36.7297 6:51:45 37.2387 7:36:11 35.8597 18:14:31 36.e967 18:58:20 36.108
8 8:59:51 36.8108 19:28:10 37.8508 28: 7: 3 37.216
co 9 12:49:58 36.8999 18:29:50 36.946
11 7:24: 2 37.856
11 15:18: 2 37.50312 1:43:49 37.84812 7: 7:55 37.86112 17:47:39 37.72914 7:58: 1 37.84514 11: 1:44 37.218
14 16:34:32 37.04314 20:53: 4 37.60715 1:48:36 37.51915 2:32: 4 37.19615 6:14:34 37.18015 11: 4:44 36.846
15 11:41:33 37.84815 11:41:35 37.85615 15:53:58 37.31916 5:31:56 36.59716 14:32:21 37.28116 18:25:45 37.844
16 18:35:11 36.88516 18:36:2 36.882
LONGITUDE(DEG. W)
117.339117.346117.632116.128116.013116.138
116.341116.384116.130116.524116.133116.131
114.875115.931116.945114. 784114.652114.7e6
116.027116.133116.544116.817117.607116.129
114.609116.135116.138115.158116.136116.539
116.474114.465115.384115 .268116. 087114.850
116. 128116.127114.865116.363115.664116.133
116.817116.813
STANDERRORH(KY)
e.30.4e.3e.50.20.7
0.26.36.56.21.90.5
0.50.50.30.61.26.2
0.30.68.26.41.30.4
0.60.61.10.32.86.9
0.14.26.10.50.85.6
6.80.41.40.50.6t.4
8.68.6
DEPTH(KU)
4.768.128.81.8e2
-0.200.74
7.99-6.08-0.21
8.49-1.02
0.04
6.244.91
13.163.06
-1.571.27*
-1.166.688.486.00*.0.706.66..
8.870.74
-0.566.803.03.7.32
-8.7415.778.878.57
-0.484.59
0.17-0.11-0.32
9.185.468.s6
0.36-1.21
STANDERRORZ(KU)
0.9e.50.6
.8+0.21.0
1.06.30.81.64.7e.9
1.10.61.28.61.6
8.40.96.51.01.70.7
1.21.62.01.4
2.8
0.11.3e.26.61.0
12.0
1.90.81.70.56 .9448.7
2.01.9
AZIGAPDEG)
911141091II152103
10074
107102154107
152223149312228205
171105136121262106
300184107132190139
12535315318699
155
105119220194182104
128127
oao12S
ABIABZACISCIACZACZ
ABIAB8ACIACIBCZACI
ACIADIACIADI80IDOI
ACZACIACIACIBDIACI
ADIACIoC!ACICDAECA
ABICDIACZABI88lDCZ
ACIACI8OIAD!AhIACI
ACIACI
MACNITUDE ESTIMATESWco ad MLh ULv MLc
1.37l.08
1.84 1.96 1.931.73 1.861.54 1.26 1.7
1.34
1.99 2.27 1.94 2.20.8
1.51 1.96 1.842.08 1.73 1.64
I.61.91 1.94 1..91 2.1
1.28 1.75 1.55 1.63 1.71.311.20
2.59 2.152.65 1.992.74 2.19
e.89 6.931.271.046.936.90
1.66 1.80
1.441.461.320.89
DEL- RYS tNMIN RES. PH. U.S.G.S.(KM) (SEC) OUADRANGLE
7.2 6.16 18 GOLD POINT7.9 6.11 13 GOLD POINT
29.1 6.11 27 SCOTTYS JUNCTION NE21.1 6.16 18 REVEILLE PEAK7.2 0."8 18 YUCCA LAKE
19.7 6.16 6 REVEILLE PEAK
9.3 0.09 28 LATHROP WELLS SE7.7 O."8 18 AM&NIOA TANKS
26.2 6.14 15 REVEILLE PEAK18.3 0.67 27 BLACK UTN NE20.6 6.14 6 REVEILLE PEAK26.3 6.14 15 REVEILLE PEAK
5.6 6.09 16 PAHROC SPRING8.1 6.67 26 NERCUIRY
27.7 0.08 17 SPRINGOALE79.3 0.03 9 BOULDER CITY SE21.4 0.09 12 HOOVER DAM20.3 0.07 8 HOOVER DAM
13.6 6.67 14 CANE SPRING19.7 0.06 7 REVEILLE PEAK12.0 6.64 15 THIRSTY CANYON NE26.4 6.09 15 BULLFROG23.9 6.67 6 DRY UTN19.8 0.13 15 REVEILLE PEAK
16.1 6.64 7 CALIENTE19.7 6.12 9 REVEILLE PEAK20.2 0.15 8 REVEILLE PEAK12.0 6.06 9 FOSSIL PEAK19.6 6.12 5 REVEILLE PEAK12.1 6.16 9 THIRSTY CANYON NE
7.8 0.02 11 TILBER UTN24.1 6.04 6 .. *OUAD. NOT LISTED.*.19.9 6.02 I MY IRISH3.6 6.11 17 LOWER PAHRANAGAT LAKE NW6.6 6.15 14 OAK SPRING
16.2 6.17 6 BOULDER BEACH
19.2 .09 6 REVEILLE PEAK19.3 6.66 7 REVEILLE PEAK19.1 6.12 7 GREGERSON BASIN6.3 6.66 13 LATHROP WELLS SE
14.0 6.64 9 ALAMO SE19.3 6.07 7 REVEILLE PEAK
19.6 6.69 14 BULLFROG19.1 t.16 11 BULLFROG
1.13
1.86
e. 998.85
0.381.011.111.961.661.83
1.201.601.660.70
1.16 1.201.13
1.080.86
-_I - -7-M.1 ,-~-~" O ,F r-- -r

, I i, 1 'I .
1988 LOCAL HYPOCENTER SUMIAARY - SGO EARTHOUAKES
DATE - TIME LATITUDE(UTC) (DEG. N)
SEP 18 20:56:60 37.84616 23:24:43 57.30717 6:41:11 36.83717 6:42:11 36.83917 6:44:15 36.84017 7:27:31 36.841
17 23:42:23 37.85718 0:51:51 37.86018 2:11:57 37.86118 8:29: 7 37.85918 8:49:26 37.19218 18: 4:43 37.857
18 18: 7:10 57.84918 18: 9:24 37.8418 18:10: 8 37.83718 18:55: 6 37.85719 4: 6:10 37.36119 4:22:46 37.410
19 7:17: 3 36.90019 11:13:56 37.85419 12:23:16 37.42119 16:49:23 37.84819 2e: 6:27 37.67919 22:56:50 37.079
2e 1: 0:30 37.35320 2:31:15 37.41120 5:54:14 37.41226 8:20:44 37.85226 15: 1: 8 37.84421 1:58:50 37.352
21 15:45: 5 37.35522 1: 7;21 36.71622 2:57:58 37.52722 53:43:25 37.0622 4:51:50 37.85722 7:17:25 35.938
22 14:58:34 37.85622 22: 8:52 37.67923 0:20:24 37.67223 12: 6:36 37.67923 17:36:13 37.84724 21: 6:32 37.548
25 0: 9.23 36.33725 4: 1: 2 36.524
LONG ITUDE(DEC. W)
116.138115.363117.501117.492117.498117.493
116.130116.135116.133116.138115..2e2116.132
116.137116.141116.142116.131116.13e115.212
116.667116.131115. 313116.133115.035116.183
117.244115.197115.193116. 152116.133117.246
117.243116.228115.329114.824116.127114.837
116.135115.041115.052115 .63116.136117.272
117.243116.506
STANDERRORH(KU)
6.30.10.60.76.5e.8
e.40.60.60.61.3e.4
6.96.20.56.50.56.3
0.21.00.46.36.61.3
0.40.71.36.90.28.3
6.36.26.46.5e.32.5
1.46.46.5r.46.56.6
6.50.2
DEPTH(KU)
1.723.22.1.781.561.962.35
-0.38
-e.39-0.76-0.36
2.596.635.136.536.445.30
-0.957.3210.450.551.88
-1.066
-1.247.436.245.82-e.25-0.53
0.760.54
-1.89
7.10
15.16
5.266.96
STANO AZ!ERROR GAPZ(KU) (DEG)
1. 16e4- 2561.1+ 1871.6+ 1861.3 1861.3 186
0.7 1671.5 1071.0 1071.3 1061.3 1236.6 1e6
1.6 l150.3 1033.5 1276.9 1066.9 1670.4 124
6.3 1181.7 1066.0 970.5 1211.1 1151.4 282
6.4 1682.3+ 1203.1 1191.4 10S6.7 1140.4 71
6.3 720.4 s86.8 864.2 2326.5 1070.7 192
2.3 1066.6 1138.4 1066.7 1152.7 1041.544 225
1.2 2141.1 11l
00012S MAGN I TUDE
Mce Ud
ACA 1.45CDIADIADIADI 1.5JADI
ACI 1.51ACI 1.46BCI 1.53BCIB81ACI 2.46
ACIACIBDIBCI 2.19 1.83ACZ 1.45ACZ 1.37
A81 1.33ACICcIACZ 1.54ABZ 1.66BDI
ACI891BElACI 1.61ACZ 1.45ABI 1.59
ABIAAI 1.43ACZ 2.21B01 1.62 1.21ACI 2.00801 2.17 1.51
BCIABI 1.57ACIABI 1.718CA 1.49ADI 1.30
ADIABI 1.57
DEL- RYS INESTIMATES MIN RES. PH. U.S.G.S.ULh ULv MLc (KM) (SEC) CUADRANGLE
19.9 0.66 8 REVEILLE PEAK1.11 21.8 0.61 6 BADGER SPRING
1.70 1.69 9.2 0.13 19 DRY UTN1.30 8.7 0.10 12 TIN MTN1.70 9.2 0.12 19 TIN MTN1.28 8.8 0.12 13 TIN UTN
1.65 19.9 0.14 16 REVEILLE PEAK1.63 20.4 0.14 12 REVEILLE PEAK1.66 20.7 0.15 13 REVEILLE PEAK1.77 1.7 20.6 6.16 14 REVEILLE PEAK1.35 2.9 0.12 8 LONER PAkRANAGAT LAKE NW
2.62 2.30 2.8 26.6 0.14 24 REVEILLE PEAK
1.48 19.9 0.12 7 REVEILLE PEAK1.88 19.9 0.05 10 REVEILLE PEAK1.59 19.7 6.63 5 REVEILLE PEAK2.96 20.e 6.16 15 REVEILLE PEAK1.51 26.1 6.13 IJ REVEILLE PEAK
1.34 1.47 14.3 0.04 16 ASH SPRINGS
1.01 1.3 3.6 0."6 14 YUCCA LAKE1.44 19.8 6.11 8 REVEILLE PEAK1.54 23.3 0.69 13 HANCOCK SUIWIT1.58 19.5 6.64 7 REVEILLE PEAK
1. 0 1.39 9.2 0.09 8 HIKO NE6.84 6.2 6.10 9 TIPPIPAH SPRING
1.44 6.0 0.06 16 SCOTTYS JUNCTION SW1.41 1.28 12.9 0.16 11 ASH SPRINGS1.41 1.45 12.6 0.17 9 ASH SPRINGS
1.77 19.7 0.12 9 REVEILLE PEAK1.18 19.3 0.03 6 REVEILLE PEAK1.44 5.6 6.16 16 SCOTTYS JUNCTION SW
1.29 6.2 6.67 11 SCOTTYS JUNCTION SW.93 1.22 5.5 0.07 20 SPECTER RANGE NW
2.13 17.3 0.69 11 WT IRISH1.55 1.42 1.9 23.0 0.04 9 GRECERSON BASIN2.23 2.36 19.7 0.12 22 REVEILLE PEAK
7.6 0.11 1I BOULDER CITY
1."6 20.2 0.12 6 REVEILLE PEAK1.23 1.23 9.7 6.06 8 HIKO NE
6.95 10.4 6.03 0 HIKO NE1.85 9.2 6.67 16 HIKO NE
19.7 0.83 6 REVEILLE PEAK1.56 59.3 0.06 13 GOLD POINT
1.43 14.2 0."9 19 EMIGRANT CANYON1.20 13.7 O."6 21 LATHROP WELLS SE
V
( C<N (^..

Cm
9 I ~ ) II i 9 t1 ) L 1A ) T A G JA T1988 LOCAL HYPOCENTER SUL&AY - SGB EARTHQUAKES
DATE - TIME(UTC)
SEP 25 4:32: 225 5:20:5725 6: 5:2825 14: 2:2025 16:12:5325 19:37:43
26 4:52:3426 19:25: 326 20:37:1726 23:46:3826 23:52:2126 23:52:50
27 2:23:5427 3: 7:4127 3:57:3127 4:55: 127 5: 3: 627 7:37:49
27 8:56; 728 2:42: 528 5:13:1428 6: 8:29
o 28 10:54:4528 11:29:15
28 22:58:1229 5:56:4329 9:43:3129 13: 5:5729 14: 7: 229 14:59:42
29 15: 1:2929 19:53:5129 21:36:3630 1:11: 430 7:15: 430 1e:51:14
30 22:34:56OCT 1 9:54: 8
2 4:37: 42 6:24:172 17:25:292 19: 6:34
2 19:16:242 19:19: 5
LATITUOE(DEG. N)
37.34637.21936.52637.35137.19037.676
37.64137.25836.86037.35037.34937.349
36.62637.34237.34636.99536.56737.343
37.35537.85237.35437.29637.29137.342
36.90337.84437.82536.67937.257J37.856
37.85837.11237.85737.67936.86836.965
37.84437.39836.73037.85237.34636.853
36.85136.849
LONGI TUDE(DEG. W)
117.250117.599116.303117.240116.447115.044
114.880117.618116.260117.25e117.247117.243
116. 377117.254117.249117.731115.208117.257
117.238116.137117.255117.335116.415114.676
117.582116.133115.748115.760115.061116.134
116.129114.911116.126115.035116.197117.592
116.138115.356116.048116.137117.248116.222
116.227116.221
STANDERRORH(KM)
6.36.2
0.20.60.20.2
0.60.20.20.4e.10.2
e.s6.60.40.70.96.2
e.s6.80.60.36.71.2
0.71.11.10.82.16.7
0.42.60.60.40.66.5
0.20.26.36.56.40.3
6.36.3
DEPTH(KU)
-0.2810.125.72
-0.485.15
-0.96
5.466.639.30
-0.71-0.11
o.ee
6.e7e.15
-e.025.3913.41
0.18a
-0.841.86
-1.556.287.947.66
2.80£ .36
-0.1511 .62-0.13
-0.323.63.-0.53-0.084.645.38
2.979.57
-1.39-0.20-0.2710.35
9.4811 .98
STAND AZI 000ERRORZ(KU)
6.46.31.40.40.70.2
0.9
0.46.40.30.1
0.4e.36.35.11.10.2
0.3+2.40.6e.30.85.8
6.08.36.1
0672.41.3
0.7
1.00.81.03.6
1.61.30.50.90 .30.5
0.60.4
GAP(DEG)
76130169
183102112
183999071
181259
274178118236140153
184105163128226258
19110414928219216
167269167116139186
11316213910510245
41119
12S MAGNITUDE ESTIMAtESUcc Md MLh ULv MLc
AD! 1.84 1.99Asl 1.86 1.96 2.20 2.21ACI 1.11ADI 1.22AC! 1.86 1.76 1.33 1.9ADI 1.16 1.15
ADI 0.76AS! 1.10 1.18As! 0.46AI! 1.21 1.50ADI 1.06ADI 0.82
ADI 6.82ACI 1.11As! 1.23CDI 1.41Bc! 1.56 2.3ACI 1.07
ADI 1.08oCz 1.18ACt 1.22 1.10ABZ 0.91ADI 0.84CD! 1.67 1.58
CDI 1.48CCI 1.e6CCZ 0.82ADI 1.37sD! 1.53 e.71ACI 1.56
Ac! 1.79 1.94CDI 1.28 1.14Ac! 1.40 1.69As! 0.71ACI 0.52SDI 1.64
ACI 1.44ACI 1.31ACI 6.89 1.05AC! 1.44 1.53ABI 1.31AAI 1.31 1.22 0.99
AAI 1.72 1.24 1.83As! 0.78 0.67
DEL- FMS tNWIN RES. PH. U.S.G.S.(KU) (SEC) CUADRANGLE
5.1 0.11 25 GOLD POINT4.4 0.07 28 LAST CHANCE RANGE
13.6 0.06 16 LATHROP WELLS SE5.8 0.16 9 SCOTTYS JUNCTION SW11.2 6.05 20 SCRUGHAM PEAK9.8 o0.1 5 HIKO NE
5.2 6.64 6 PAHROC SPRING6.6 6.03 9 MAGRUDER MITN5.0 0.03 11 JACKASS FLATS5.5 0.10 13 GOLD POINT5.5 0.01 8 SCOTTYS JUNCTION SW5.5 0.01 7 SCOTTYS JUNCTION SW
4.e 0.05 12 LATHROP WELLS NV4.6 6.07 9 GOLD POINT5.1 6.09 12 SCOTTYS JUNCTION SW
27.4 6.06 9 DRY MTN8.1 0.18 14 HAYFORD PEAK4.7 0.04 10 GOLD POINT
6.2 0.08 9 SCOTTYS JUNCTION SW20.1 6.14 8 REVEILLE PEAK5.9 0.11 10 GOLD POINT6.9 0.05 10 GOLD POINT11.7 6.09 14 SILENT DUTTE29.8 0.68 8 ELGIN SW
19.2 0.13 12 DRY MTN19.4 6.11 7 REVEILLE PEAK19.4 0.13 6 WORTHINGTON MTNS4.8 0.14 12 MERCURY NE14.9 0.06 7 ALAMO SE26.2 0.12 9 REVEILLE PEAK
19.9 0.12 15 REVEILLE PEAK25.3 6.15 6 DELAMAR 3 SW19.6 6.14 12 REVEILLE PEAK9.2 6.06 7 HIKO NE2.9 0.10 11 SKULL MTN22.2 6.13 16 DRY MTN
40.1 0.04 6 REVEILLE PEAK27.0 0.04 8 HANCOCK SUIUUIT10.9 0.09 16 CAMP DESERT ROCK20.2 0.13 13 REVEILLE PEAK5.1 0.09 12 SCOTTYS JUNCTION SW4.8 O.10 25 SKULL MTN
5.3 0.12 32 SKULL MTN4.7 0.05 16 SKULL MtN

) I '3 .j I
1988 LOCAL HYPOCENTER SULAARY - SGC EARTHOUAKES
DATE - TIUE(UTC)
OCT 3 4:55:463 9:45:593 21: 9:113 21:54:133 22:10: 84 17:17:38
4 19:37:184 19:46:144 20:16:355 0:19:575 1:16:295 9:34:33
5 14:14:365 17:29:125 17:31:546 13:18:357 14:21;408 2:58:24
8 5:36: 98 7:35:318 9:26:128 20:41:36
o 9 14: 5:189 14:35:28
9 14:37:1110 20:58:3216 22:19:5011 11: 4:5712 22:3e:2912 23:33:14
12 23:36: 113 0:17:3314 1: 7:1914 1:18:4015 11:46:1016 4: 3:46
16 16:35:3516 19:57:5617 6:53: 117 14:38:5117 18:27:3817 19:20:17
17 22:14:2818 4:14:10
LATITUDE(DEG. N)
37.24436.73537.85537.87937.87737.884
37.86836.87137.87637.64737.38437.228
36.81137.67437.87537.84837.20236.872
37.85637. 14137.31736.85437.84936.252
36.84936.59436.73237.5e737.87536.657
36.65937.87237.63537.44137.31137.251
37.44037.57737.34137.21437. 15437. 205
37.31237.258
LONGITUDE(DEG. W)
115.180115. 555116.128116.018116.617116.e12
116.011115.7971186.618117.670114.973117.301
116.458115.041116.018116.139116.449116.2e5
116.128117.336114.902117.662116.131117.470
117.663115.956116.033117.191116.026116.272
116.268116.018116.147115.817115.312117.554
117.268117.488115.081114.939115.793116.542
117.267115.156
STANDERRORH(KU)
0.10.40.0e.66.1e.3
6.30.76.30.80.10.5
0.46.40.20.96.41.1
1.60.20.60.86.74.6
1.36.20.46.46.2e.4
0.46.26.21.06.90.3
6.30.30.91.86.40.3
0.31.3
STAND AZIERRO.ARsDEPTH(KU)
5.663.6e5e.615.176.195.97
7.8612.61d.528.873.728.79
2.31-1.656.266.997.92e.82
6.66e.e.235.966.ee..2.6.J4.77.
0.65.13.468.734.837.16
-0.e8
-0.158.272.807.409.859.84
-0.910.624.49
19.7916.63-e.36
6.428.51
ERRORZ(KM) (
6.3
6.94.20.82.1+
0.80.92.33.10.30.8
0.40.41.31.30.81.1
1.86.32.0++1.53.6
0.30.77.91.30.4
0.51.3e.5+1.53.50.6
0.46.51.12.92.06.4
0.12.5
GAP:DEG)
16692
106116116118
163257115134178103
981I1115104143144
106107205206105270
206168144126115110
127114112164114136
13699
160172
93129
65152
0OD12S MAGNITUDE
Uco Lid
AC!CCI 2.11AC!DCI 1.35ACI 1.698C1 2.26
ACIADIECI 1.55 1.758alAC!AB!
ABUAB!ACIACZACI 1.338CI
aCt 1.48ACZ 1.44ADI 1.86ADI 2.33BCA 1.81CDA 1.61
CDA 1.54ACIACI 1.16CCA 1.60ACI 1.54 1.70ABI
ABIABIABI 1.48
8BIACI
ACZACIAC!E'C!SalACZ
AAZ 2.288C1 1.81
DEL- RMSESTIMATES MIN RES.MLh ULv MLc (KM) (SEC)
0.97 1.00 8.4 6.002.08 2.5 23.3 0.151.68 19.6 6.121.60 15.1 6.131.82 14.9 6.622.62 15.4 6.18
1.26 13.7 6.631.36 19.7 0.661.61 14.8 0.e81.17 14.6 0.12
1.52 0.83 7.3 0.811.16 1.28 8.9 6.16
-0.16 3.9 6.681.19 1.19 9.5 6.65
1.59 14.7 e.651.44 26.6 6.150.90 11.2 0.666.57 3.8 6.05
1.53 19.7 6.151.35 1.47 15.7 6.o6
1.73 16.5 6.682.28 2.6 23.6 0.12
19.5 0.1736.6 0.23
23.6 6.116.68 1.2 7.4 6.631.13 10.2 6.07
23.6 0.681.81 1.9 14.8 s.e06.78 6.2 6.69
0.72 6.6 6.e61.45 14.4 6.640.92 1.2 7.3 6.67
0.92 0.83 4.9 0.061.31 1.06 19.3 0.151.01 1.03 8.4 0.06
1.44 16.6 6.671.18 15.1 0.67
1.16 7.7 0.641.38 22.6 6.091.81 26.5 6.121.18 13.0 0.69
2.07 2.3 1.5 0.091.89 1.20 16.3 6.11
JNPH. U.S.G.S.
OUADRANGLE
5 LOWER PAHRANAGAT LAKE NW26 HEAVENS WELL12 REVEILLE PEAK10 REVEILLE PEAK16 REVEILLE PEAK20 REVEILLE PEAK
7 REVEILLE PEAK14 FRENCHMAN LAKE SE13 REVEILLE PEAK
9 LIDA WASH8 DELAMAR NW
13 UBEHEBE CRATER
9 TOPOPAH SPRING SW6 HIKO NE
12 REVEILLE PEAK8 REVEILLE PEAK
13 SCRUCHAU PEAK8 SKULL MTN
9 REVEILLE PEAK17 UBEHE8E CRATER12 DELAUAR LAKE21 DRY UTH12 REVEILLE PEAK
6 PANAMINT BUTTE
9 DRY fTN9 LERCuRY SW
13 CAMP DESERT ROCK8 GOLDFIELD
12 REVEILLE PEAK16 STRIPED HILLS
14 STRIPED HILLS8 REVEILLE PEAK
17 TIPPIPAH SPRING7 ALAMO NE9 BADGER SPRING
10 MAGRUDER MTN
12 STONEWALL PASS16 MONTEZUMA PEAK SW7 ALAMO SE8 DELAMAR 3 NW
19 PAPOOSE LAKE NE14 THIRSTY CANYON NE
24 COLD POINT8 ALAMO
PI - -
( /

) I ,) ) I1988 LOCAL HYPOCENTER
) '') ') I
SUiMAR'f - SCO EARTHQUAKES
DATE - TIME(UTC)
OCT 18 16:19:1918 19:28:1718 21:19:2619 0:29:2820 1:27:3220 19:14:34
21 3:19:3021 5:32:3221 11:41: 421 12:19: 522 3: 5:2822 19:39:15
23 20:57:5823 23: 1:5923 23:27:5124 6:48:1324 14:30:4924 21:41:25
25 6:23: 325 15:35:5225 16:27:2725 20:41: 426 3:22:2526 7:16:14
26 12: 2:1626 26:21:1526 21:20:4927 12:46:3227 21:13:5228 26: 2:56
28 20: 4:3528 20:17:4428 26:19: 228 26:19:5828 21:29:2328 21:36:58
28 21:53:1729 6:37:130 1: 7:5630 16:31:1730 16:58:1630 22:44:31
NOV 1 2:16:581 5:29:46
LATITUDE(DEG. N)
37.44537.17637.17736.56136.74337.513
37.33737.33835.76836.62436.77737.164
36.8343:6.69935.95137.69537.39536. e82
37.77936.95337.56237. 64337.15436.816
37.17937.51336.67937.56137.85837.515
37.84237.52837.51637.51337.51637.517
37.51437.51637.85836.81837.2ee37.563
36. 62237.745
LONGITUDE(DEC. W)
117.969117.404117.403116.463115.600116.536
117.256117.259114.838115.502115.698115.665
116.059116.460114.827115.137115.058114.725
115.6le116.112117.210116.177117.356116.159
115. 176116.529116.683117.267116.127116.527
116.134116.528116.531116.536116.529116.538
116.535116.536116.128116.281115.159117.206
116.251114.584
STANDERROR DEPTHH(KM) (KU)
6.7 6.566.1 -0.066.3 -O.110.3 9.711.0 5.376.3 7.80
0.4 6.466.6 0.249.8 11.876.5 -1.54- 2.476.4 1.86
1.0 13.676.4 8.656.8 6.366.7 1.336.5 6.426.9 -0.96
0.4 3.971.4 0.316.5 7.ee0.2 5.606.3 -0.666.4 6.64
6.5 7.316.2 7.06e.3 9.926.5 -0.436.3 6.00e.3 1e.86
0.4 1.456.3 13.31e.2 1e.50e.2 -0.236.2 16.656.2 16.94
6.2 -0.696.2 8.366.5 -0.770.6 3.642.5 5.476.7 8.06..
6.3 6.e90.8 8.67
STANDERRORZ(KU)
1.66.30.41.12.52.0
0.28.49.66.5
1.3
0e90.91.41.20.20.6
3.31.72.70.40.46.3
0.61 6-#
P.60.8
1.11.00.9H6.36.9+40.6
6.41.4++6.82.14.5+1.4
1.41.4
AZICAP
(DEC)
241106117134316
75
176176280187289270
232138163246154208
10716212013216178
14068
16812016754
1638068
12255
122
6754
107196194121
125290
000125 MAGNITUDE
Mco Md
A01 1.93ACZACIABI601DCA
ACIACIDWZADZADZADI 1.85
SDIACIACI 2.42ADIACI 1.36ADZ
BCE 2.19OcEECI 1.37ABIACZME1 1.45
ACZ 2.34ACIABI 1.71CEC 1.89ACZ 2.18ACI 2.49
ACEABE 1.76ACIACZ 1.85ACI 2.12ACE 1.69
ACZACE 2.26BCIBseCDIBcE 1.53
ACZ 1.62ADI
1.61
EST IMATESMLh MLv
1.791.46
1.25 1.141.621.35
1.58
1 .96
1.331.44
6.596.622.861.361.341.66
2.640.771.491.021.151.33
2.191.551.641.882.55
3.40 2.78
1.981.37
1.93 1.74?.66 1.582.48 2.271.69 1.47
1.562.27 2.26
1.970.661.121.52
1.131.16
DEL- 56.1 9NMIN RES. PH4. U.S.G.S.
MLc (KM) (SEC) QUADRANGLE
5.9 6.12 16 SOLDIER PASS19.0 6.05 19 UBEXESE CRATER18.9 6.06 11 U6EHEBE CRATER14.5 0.05 14 LATHWOP WELLS SW19.6 6.07 14 HEAVENS WELL23.5 0.04 8 MELLAN
4.6 6.64 9 COLD POINT4.1 0.65 8 GOLD POINT
18.7 6.26 7 BOULDER CITY SE28.6 6.16 8 INDIAN SPRINGS SE13.6 6.60 4 QUARTZ PEAK SW10.8 6.61 7 LOWER PAHRANAGAT LAKE
10.0 0.69 11 CANE SPRINC9.9 6.69 17 LATHOP WELLS NW7.2 0.68 11 BOULDER CITY9.3 6.07 16 LOWER PAHRANAGAT LAKE SW1.5 6.68 16 ALAMO NE
18.6 6.65 8 HOOVER DAM
1.5 11.7 6.67 16 WHITE RIVER NARROWS5.6 0.06 8 YUCCA LAKE
1.9 21.8 0.16 12 GOLDFIELD4.7 6.65 13 TIPPIPAH SPRING
17.3 0.67 11 UBEH£BE CRATER4.3 0.12 19 SKULL MTN
1.5 6.12 19 LOWER PAHRANAGAT LAKE NW23.6 0.09 26 MELLAN11.0 0.09 26 CAMP DESERT ROCK22.0 0.17 19 GOLDFIELD
2.5 19.7 0.14 26 REVEILLE PEAK23.6 6.13 48 MELLAN
1.6 19.4 6.05 6 REVEILLE PEAK22.6 6.08 16 VELLAN23.2 0.69 21 MELLAN
2.1 23.2 0.67 14 MELLAN2.2 23.4 0.09 30 MELLAN
22.7 0.e6 15 MELLAN
23.1 0.09 20 MELLAN2.3 23.3 0.08 28 MELLAN2.2 19.8 0.15 19 REVEILLE PEAK
5.9 0.17 14 JACKASS FLATS4.3 6.16 6 LOWER PAHRANAGAT LAKE NW
21.9 0.18 15 GOLDFIELD - poss. expI.
13.5 6.67 17 LATHROP WELLS SE26.5 6.03 6 CHIEF MTN
1.92
I - - , - , ,

.) I 1 -i I .) 9 o 7
1988 LOCAL HYPOCENTER SU 4AARY - SGB EARTHQUAKES
DATE - TIME(UTC)
NOV 1 7:44:571 II: 6:382 6:31:172 7:15:312 18:56:252 17:19:56
2 18:46:362 19:11:553 8:28:324 5:28:584 5:56: 44 21:59:11
5 5:17:565 26:29:226 15:18:287 16:5e:188 2:26M359 1:21:59
9 8:10:549 14:11:169 15: 8:359 21:21:57
16 7: 2:3910 16: 5:32
11 1;19:5611 6: 7:4214 15: 1:2915 16:20:4715 23:47:3916 0:47:19
16 4:27: 516 11:26:1416 16:22:1116 21:47:5117 5: 7: 517 16:13:13
17 18:29: 217 19:43:3117 20: 3:1918 6:55: 518 20:29:3618 20:29:48
18 26:31:2618 26:32:24
LAT I TUD E(DEG. N)
37.51537.24537.41637.41337.34437.515
37.68437.42637.63037.27136.90637.501
37.51436. 10335.92437.13137.51937.864
37.85437.77637.78537.85437.26737. 856
37.86036.76637. 17837 .0e336.54936.545
37.51637.87737.87537.88137.84037.e50
37.87838.21537.30437.85536.92836.936
36.92536.926
LONGITUDE(DEG. W)
116.529115.157117.438117.433117.249116.527
115.137117.430116.215115.048117. 582115.310
116.531114.673114.833117.375118.533116.132
116.137115.e69115.106116.129116.539116.131
116.134115.975117.381117. 451116.211116.217
116.528116.129116.127116.022116.136117.464
116.126114.975116.330116.130116.558116.555
116.547116.55s
STANDERRORH(KY)
0.21.8'.56.66.36.2
6.70.56.23.56.76.5
6.32.61.90.4'.36.3
6.50.40.26.86.16.4
6.41.76.26.50.50.1
6.26.86.96.80.10.7
1.12.26.71.40.26.2
6.3e.2
DEPTH(KM)
-0.844.385.484.866.685.66
0.94a.476.69
11 .534.850.52
9.67-1.024.447.94
11.09-4.18
-0.190.216.370.60..
-4.1 I-4 .t5
-e.379.128.501.756.386.72
6.790.00..
-0.545.455.250.05
-1.42-1.54
1.66-0.6910.7411.e0
11.1912.23
STANDERRORZ(KU)
0.48.30.81.30.21.2
1.30.66.43.77.2e.7
1.5++1.42.71.61 .1++0.6
6.80.9.s9+
1 .66.26.6
e.72.8b.61.31.48.7
1 .1++1 .5I .a3.3 +1.81.e
1.92.46.70.70.60.4
6.30.5
AZIGAP
(DEG)
681551671077069
86178Go
191190127
75222189171
e6
16108145106131106
107224113153
93176
69111110190103157
II117629310612644
20349
OOD12S MAGNITUDE ESTIMATES
Mca Md MLh ULv ULc
ACZ 1.65CCI 1.62 1.18ABI 1.65 1.238e1 6.86 1.06
M I 1.52ACI 1.82 1.68
oCz 1.58ACZ 1.02AAI 6.93CDZ 1.20 1.11CoI 1.48 1.47ACZ 1.22
ACI 1.23 1.20BwZ 1.64801 2.37 1.96 2.38 2.29AC! 1.16ACI 1.55 1.5AC! 1.84 2.21 2.12 2.0
ACI 1.68 2.1ACZ 1.86 1.66 1.49 1.7ACI 1.33 1.21BCI 1.67ACZ 1.34 1.69ACI 1.86 1.a2
ACI 1.83 2.61 2.20 2.18 2.3EoZ 1.15 1.2AC! 1.50 1.46 1.66ACA 1.29ACI 1.56 1.32 1.1ACI 1.31 1.0e 1.4
AC! 2.61 1.86 2.13 2.4DCI 1.54ACZ 1.5180! 1.87 2.04AC! 1.51ACZ 1.56
BCZ 1.41BCZ 1.50A.! 1.66 1.65 1.20AC! 2.14 2.34 2.19ABI 1.56 6.98AAI 2.25 1.81 1.91
ADI 1.56 0.82AAI 2.12 2.86 2.03 2.12
DEL- RUS JNUIN RES. PH. U.S.G.S.(KU) (SEC) QUADRANGLE
23.4 6.67 18 MELLAN8.9 6.14 a LOWER PA)RAJAGAT LAKE NW6.4 6.11 13 LIDA6.6 6.15 14 LIDA4.6 S.0a 18 SCOTTYS JUNCTION SW
23.6 6.0 26 MELLAN
12.5 0.16 12 FOSSIL PEAK6.3 6.08 16 LIDA6.6 6.67 24 LEKXBOARD MESA15.1 0.67 5 ALAMO SE19.3 0.15 16 DRY WTN19.9 0.09 9 MT IRISH
23.4 0.07 11 MELLAN21.4 0.14 7 HOOVER DAM
7.0 0.14 15 BOULDER CITY14.8 6.16 15 UIENEBE CRATER22.9 6.09 20 MELLAN20.5 0.14 23 REVEILLE PEAK
20.3 0.14 14 REVEILLE PEAK12.1 0.09 10 WMITE RIVER NARROWS11.3 0.04 9 WMITE RIVER NARROWS19.7 0.15 12 REVEILLE PEAK13.0 0.05 19 THIRSTY CANYON NE19.9 0.14 16 REVEILLE PEAK
20.4 0.14 19 REVEILLE PEAK11.0 0.19 12 FRENCHIMAN FLAT17.5 0.06 22 UBEHE8E CRATER11.7 6.05 7 U8EHEBE CRATER15.4 0.68 22 SPECTER RANGE SW15.5 0.04 21 SPECTER RANGE SW
23.4 6.67 27 MELLAN21.2 0.17 13 REVEILLE PEAK20.9 0.12 9 REVEILLE PEAK15.5 0.10 9 REVEILLE PEAK19.4 6.61 6 REVEILLE PEAK11.9 0.15 13 WBEHEBE CRATER
21.0 6.12 7 REVEILLE PEAK36.3 6.21 7 FRENCHMAN MTN16.0 6.64 11 DEAD HORSE FLAT19.8 0.13 16 REVEILLE PEAK8.6 6.04 12 BARE MTN8.7 6.06 27 BARE MTN
8.6 0.0s 18 BARE MTN8.2 O.06 36 BARE MTW
16
I(
__

I I .' i I ! '. ., 11988 LOCAL HYPOCENTER SUAARY - SOO EARTHOUAKES
DATE - TIME LA(UTC) (D
NOV 18 20:33:46 3I8 20:35:53 318 28:39:35 318 23:23:42 319 28:26:13 320 8:59:57 3
20 9: 2: 7 228 10:43:55:28 19:30:18Z21 7:53:12Z21 8: 7: 622 7:31:13
25 8: 3:4925 17: 3:1225 19:44: 1226 4: 4:6027 2:35: 827 8:25:58
27 15: 3:4727 19:35:3927 22:36:5328 3:59:4428 9:43:5128 20:47:31
29 10:28:1929 15:34:2629 19: 6: 238 4:44:4330 8: 3:1930 19: 4:10
DEC 1 18:12:102 9:50:283 6:21:173 23: 9:304 4:17:544 4:39:46
4 9: 8: 15 1:54:205 8:31:335 14:44: 35 20:44:175 20:50:27
8 16:17:148 16:33:35
TI TUDEEG. N)
,6.9276.931.6.92515.94616.88417.411
17.41717.84717.79216.624$7.27837.049
36.83037.41037.19936.82537.10437.403
37.85437.26537.26437.39136. 75337.832
37.86137.06837.84036.77936.77237.234
37.76837.06436.65537.ee537.08837.128
38.19836.94537.36636.60537.34137.328
36.75537.129
LONG I TUDE(DEG. W)
116.556116.558116.555114.833115. 966117.444
117.437117.467115.136116.338117.567117.463
116.697117.430115.069116.054115.185114.698
116.142117.696117.694114.629115.541114.825
116.134117.464117.473116.680116.675117.864
115 .819117.455115.808116.245116.192117.956
115.994117.5651:4.868116.958114.841117.228
116.019117.318
STANDERRORH(KU)
0.20.28.20.83.5e.5
e.s0.51.20.30.70.4
0.20.48.9e.31.21.1
8.08.48.35.88.30.8
0,48.58.5e.58.31.6
1.38.50.78.3l.11.2
2.28.61.4e.2e.38.4
8.38.3
SDEPTH E(KU)
11.9310.4511.770.260 495.44
6.l65.485.384.965.965.36
8.008.568.019.14
-0.475.16
0.82-4.89-4.11-1.82
8.8s2.98
-6.2.0.71
-1.081.491.776.60
1.280.18
18.745.364.817.08
0.88..7.88
-8.889.435.79
-0.56
7.546.68
STAND ARROR C(KU) (0
0.58.50.4-41.1 12.6 21. 14-
8.9 1
2.8 1
5.8 1
8.4 11.5 12.3 1
8.4
8.61.58.91.37.6
0.68.4++5.10.63.5
8.68.7
2.11.20.84.9
2.68.76.5e.51.8
4.2
1.7
2.8$1.98.7
0 .3
TzIAPEG)
838SU3699691
8e5865
i04146147
9968
239124284248
194160160265
95238
187156160
9598
230
157154231
93215241
258188289
90221133
00012S MAGNITUDE E'
Uca c d U
MIMI 1.68Ml 1.60AC!CDZABI 1.78
ADISC! 1.89BCI
AS!ACIsCI 1.97
AS1ASZADIAB1 1.328D1 1.51CDI
ADZAC! 2.52ACI 2.44DDZAC] 2.21BDI
ACIACIECZ 2.36ASZ 1.71AB! l.76CDA 1.46
BCZ 1.61ACZADIABI 1.6980! 1.36BOI 1.75
SD!SolBOZAS!ADI 1.43A81 1.68 1.34
T I UAT ESULh ULv Ul
1.401.651.302.110.851.76
0.942.671.01
1.08 1.088.94 0.732.48 2.85
0.640.83 1.131.84
1.011.73 1.661.88 1.40
1.062.872.65 2.85
1.172.87 2.18
8.79
1.881.312.571.581.22
1.40 1.251.151.171.38e.94
1.55 1.80
1.480.79 1.46
1.311.81
1.69 1.611.57
1.111.29 1.25
DEL- RUS iNUIN RES. PH. U.S.G.S.
Lc (KU) (SEC) QUADRANGLE
9.6 0.04 18 BARE MTN8.9 0.06 23 BARE MTN8.5 0.65 22 BARE UTN
2.4 7.5 0.06 13 BOULDER CITY9.5 0.12 8 PLUTONIUM VALLEY*5.9 0.13 20 LIDA
6.1 0.69 9 LIDA1.7 12.0 0.12 14 UBEHE8E CRATER
11.6 0.12 8 SEAMAN WASH2.4 6.09 20 LATHROP WELLS SE
1.4 8.7 0.11 10 MAGRUDER MTN11.7 0.11 19 UBEHEBE CRATER
7.3 6.07 17 BARE MTN7.0 6.13 14 LIDA
11.1 0.08 9 LO!ER PAHRANACAT LAKE10.7 0.08 1 CANE SPRING10.2 0.14 11 LOWER PAHRANAGAT LAKE SE22.8 0.01 5 SLIDY MTN
20.6 0.00 5 REVEILLE PEAK5.7 0.15 30 UAGRUDER MTN5.5 0.13 34 UAGRLDER UTN
25.7 0.11 6 SLIDY MTN2.1 24.9 0.14 26 TIM SPRING
22.1 O.07 6 DEAOUAN SPRING SE
28.4 0.1212.5 0.1112.2 0.14
1.6 5.2 0.131.2 5.1 0.86
19.3 0.34
13.4 0.0912.0 0.114.3 0.06
1.7 3.9 0.076.5 0.18
1.9 29.8 0.15
42.1 8.1828.3 0.1216.8 .. 0716.1 .es20.0 0.84
1.8 4.0 0.11
16 REVEILLE PEAK11 UBEHEBE CRATER20 ULEHE8E CRATER17 BARE MTN15 BARE WTN5 WAUCOSA SPRING
8 WHITE RIVER NARROWS11 U8EHEBE CRATER11 MERCURY NE19 TIPPIPAH SPRING12 TIPPIPAH SPRING17 WAUCOSA SPRING
7 OUINN CANYON RANGE15 DRY UTN6 CREGERSON BASIN
15 CHLORIDE CLIFf10 CREGERSON BASIN18 SCOTTYS JUNCTION SW
0.7 117 ABS 1.580.9 102 ACI
1.3 11.8 0.06 14 SKULL UTN14.6 0.06 11 UBEHESE CRATER
M. 1-l"I'Mms I �p I v

) I , I1
1988 LOCAL HYPOCENTER
'. - , 7
SLUUARY - SGB EARTHWUAKES
DATE - TIME(UTC)
DEC 8 23:57: 89 15:23:31
16 9: 0:1216 12:47:4710 13:13:4011 21: 3:44
12 4:13:2912 2e: 6:2413 16: 9:1913 12:13:2613 12:25:5215 8:24:23
15 10:39:3315 II: 8: 515 16:52:2916 4:20:3616 10:59:4616 16:58:48
17 8:15:3317 13: 7: 717 20:12:42
O 18 2:11:15S 18 5:20:23
18 9:39:54
18 20:26:4818 20:26:5919 5:50:1619 9:13:4219 21:13:5820 8:18:40
20 17:22:3820 20:58:3321 19:38:4722 15:53: 222 19:51:1623 l1:7: 9
23 .21i27:3124 23:38:3925 1: 9:2025 4:11:3226 21: 0:4326 22:29:38
27 4: 9:4527 7: 0:33
LATITUDE(DEG. N)
37.86637.86836.09737.38037.21937.164
37.05835.82037.24937.27137.27437.236
36.87336.87037.42336.81937.44837.393
37.88236.88336.70237.38437.78836.843
35.88436.47637.84937.16437.21037.248
36.67537.31137 .19137.18937.88937.014
37.20837.28137.21536.90037.36137.364
37.27836.972
LONG I TUDE(DEG. W)
116.126116.123117.468115.664115.864114.944
117.458116.866114.9J611s.008115.e03117.486
115.814115.789116.776117.519117.832117.486
116.015114.464116.315116.e86115.283115.909
114.824115.263116.139115.569117.845114.951
117.207114.828116.206116.210115.985116.222
117.368117.498115.871116.736115.236115.240
117.499116.178
STANDERRORH(KM)
0.30.5
1.31.20.5
e.52.24.90.51.80.3
0.42.31.40.50.70.6
0.34.80.20.30.70.4
8.63.90.5e.40.80.8
0.40.20.70.40.60.3
0.30.30.48.40.40.3
0.40.2
DEPTH(KU)
-0.77-0.712.108.329.21
12.49
0.287.0011.477.978.37-0.47
0.9810.34-0.971.799.445.05
8.994.02.8.347.4q1.760.10
-0.69-0.20-1.264.890.1710.23
8.863.26.
-1.19-0.25-0.641.72
7.21-0.725.701.945.110.0I
-1.252.28
STANDERROR2(KM)
0.50.9
1.72.60.8
0.71.86.51.23.30.4
0.8442.31.70.81.111.7
0.5
0.30.82.00.7
10.85.40.86.90.81.3
0.7
0.81.5+1.00.5
1.1e.52.2*s0.64.20.6
0.70.4
AZ IGAP
(DEG)
113le9278161143251
155276213202202104
121273248204116102
11725310769
11391
311169105113208222
80230878711973
101911132369698
92144
I .
OQD12S
ACIACIADABCAOCAADI
ACIEDICDIADI80BACZ
ACIBDIBDIADlABIaA
ACZCDAABIABIBCIACI
DDIDCZACICCIADZADI
MAICDZBCIACIACZMAZ
ABlACIsciADZBCIACZ
ACIACI
DEL- RUS INMAGNITUDE ESTIMATES MIN RES. PH. U.S.G.S.Mca Md ULh ULv ULc (KM) (SEC) QUADRANGLE
1.73 1.76 20.2 0.06 10 REVEILLE PEAK1.87 20.1 6.08 9 REVEILLE PEAK
1.97 72.5 0.08 4 MATURANGO2.44 16.9 0.16 12 BALD MTN2.e3 13.8 0.15 10 PAPOOSE LAKE NE
2.13 1.56 21.6 0.06 9 DELAYAR 3 NW
1.48 11.9 0.10 10 UBEHEBE CRATER1.93 16.0 0.26 10 WINGATE WASH
1.26 1.02 18.2 0.13 7 DELAMAR 3 NW1.00 1.27 15.5 .05 7ALAMO SE
1.06 15.3 0.03 5 ALAMO SE1.32 1.6 14.2 0.08 10 USEHE6E CRATER
1.73 1.75 19.9 0.13 24 FRENCHMAN LAKE SE0.98 19.6 0.04 7 FRENCHMAN LAKE SE1.04 18.9 0.05 7 TOLICHA PEAK1.05 10.3 0.07 14 DRY MTN
1.98 2.15 7.1 0.13 20 SOLDIER PASS1.82 5.4 0.12 9 LIDA
2.08 2.10 2.2 15.3 0.11 18 REVEILLE PEAK1.79 75.0 0.32 10 .**OUAD. NOT LISTED.-*
0.93 0.9 5.9 0.07 26 STRIPED HILLS1.25 1.62 11.4 0.11 19 WHEELBARROW PEAK NE
1.06 12.2 O.11 81.74 1.28 1.27 16.3 6.13 23 FRENCHIAN FLAT
2.23 75.3 0.17 12 BOULDER CITY1.80 9.8 1.80 12 CORN CREEK SPRINGS
1.48 1.77 1.91 20.1 6.12 12 REVEILLE PEAK1.80 1.48 26.1 0.10 14 FALLOUT HILLS NE1.28 1.36 17.8 0.10 12 WAUCOGA SPRING
2.00 1.71 19.7 0.12 11 DELAMAR 3 NW
1.41 7.1 0.09 15 STOVEPIPE WELLS1.37 1.61 1.44 22.4 0.01 6 GREGERSON BASIN1.92 1;40 1.2 10.8 0.18 15 RAINIER MESA1.98 2.42 2.0 10.5 0.14 26 RAINIER MESA1.88 1.92 1.79 1.89 1.9 15.2 0.14 142.18 1.63 1.67 2.6 6.10 31 TIPPIPAH SPRING
1.43 1.39 1.50 1.06 14.3 0.12 19 U8EHE8E CRATER1.73 1.60 1.5 14.2 0.9 16 GOLD POINT SW
1.42 15.8 0.10 14 PAPOOSE LAKE NE0.81 15.1 0.05 8 BARE MTN
2.37 1.89 1.63 17.1 0.11 12 ALAMO2.06 2.e3 1.84 17.4 0.09 13 ALAMO
1.60 1.78 14.0 0.12 17 GOLD POINT SW1.56 1.02 6.4 0.05 15 MINE MTN
_( ( *1I .__ ....-

1988 LOCAt IIYPOCENT[R SIAAAARY - SOGl CjRTIK AXS
DATE - TIUE LATITUDE(UTC) (DEG. N)
DEC 27 14:36:30 37.38827 17:25:45 36.72827 19:50:53 36.45427 23:35: 3 37.88227 23:54:40 37.88428 e:19;25 37.442
28 12:56:17 37.26029 3:38:45 37.37929 8:20:54 37.12829 22:13:59 37.18230 1:40: 2 36.78930 1:59:54 36.711
30 11:50:13 36.78530 16:38:53 37.39930 19:55:55 35.92131 12:16:46 37.85631 21:40: 4 37.086
LONGITUDE(DEG. W)
115,114115.992114.506116.12516.121115.473
114.538115.111117.341117.923116.2b5116.452
116.256115.119114.842116.130117.380
STANDERRORH(KM)
0.61.00.70.40.41.3
1.00.20.80.80.30.3
0.40.40.70.40.9
DEPTH(KM)
1 .6411.25-0.37-1 .36
-0.4113.31
5.102.239.49-0.895.017.40
5.900.79
-0.710 46
-O.54
STANO AZIERROR GAPZ(KI) (DEG)
1.5 125t.1 1520.9 2250.6 1120.6 1125.2 106
2.6+ 2380.4 1361.2 1990.9 2230.8 72e.7 174
0.8 115e.54+ 1530.8 1910.6 1140.9 194
OOD125 UAGNITUDE
A8Z 1.68ACIADI 2.11ACZ 1.46ACIC81
802 2.40ACI 1.99ADIADI 2.07ABI 1.17ACI 1.27
A8! 1.28ACIADI 2.42AC!ADI
EST IMAI ESULh ULv Y
1.68 1.580.892.131.651.47
1.19 1.51
2.602.20 2.ee1.21 1.191.76 2.12
0.846.74
0.83
2.581.691.36
DEL- RMSYIN RES.
LC (Ku) (SEC)
6.0 0.e18.0 *.0"
58.7 0.0,21.3 6.1:21.1 0.623.9 0.1:
42.3 0.12.0 6.1 0.0
14.3 0.025.2 0.05.3 0.08.9 0.0
4.9 0.11.4 6.1 0.12.6 7.8 0.1
19.8 0.126.2 6.1
INPH. U.S.C.S.
)QUADRANGLE
7 7ALAUO NEF 8MERCURY7 11 YUDOY PEAK2 13 REVEILLE PEAK710 REVEILLE PEAK2 7 CRESCENT RESERVOIR
2 13 ELGIN31 I ALAMO NE9 13 LUEHE8E CRATER8 12 WAUCOBA SPRING0 16 JACKASS FLATSi7 19 LATHROP WELLS NW
015 JACKASS FLATS6 7ALAw NE
19 18 BWOUDER CITY11 13 REVEILLE PEAK12 15 UBEHE8E CRATER
I-.0

I ), I ' ) 7 1
1989 LOCAL HYPOCENTER SUAARY - SG8 EARTHQUAKES
DATE - TIME LATITUDE(UTC) (DEG. N)
JAN 1 0: 4:39 37.1611 0:12:36 37.1531 9:27:28 37.4841 17:42:43 37.2802 7:12:58 35.9242 9:28:59 37.884
3 7:33:15 37.8723 21:39:12 37.2734 16:22:46 37.6914 11:50:23 37.7994 16: 0:20 37.8645 2:53:19 35.897
5 5: 3:52 37.1135 6:34: 9 37.8575 17: 9:42 37.2676 14:40:69 37.856
6 15: 8:14 37.7e46 15: 1: 6 37.855
6 18:26:39 37.8497 11: 8:18 37.4557 17:38: 5 37.3647 19: 1:40 37.3657 21:27:49 37.8647 21:31:45 37.862
7 21:32:13 37.8608 7:37:22 37.415a 23:33: 3 37.8209 5: 8:22 36.3299 10:29:41 37.2959 10:57:25 37.864
9 14:13:45 37.8649 14:34:39 37.8649 19: 4:57 37.8469 21:11:55 37.8599 21:15:24 37.8639 23: 7:50 37.858
9 23:13:10 37.85810 2:39:25 37.0391e 5:15:39 37.8b31o 12:28:53 37.864
1o 12:50:22 37.86310 17:50:15 37.863
1l 19:10:42 37.849
10 23:20:13 37.856
LONGITUDE(DEG. W)
117.559117.559117,618117.495114.843116.025
115.758114.574115.197115.124116.159116.942
115.161116.128115.429116.133115.203116.136
116.142116.959117.198117.197116.136115.126
116.132114.717115.816115.124117.409116.126
116.129116. 12f115.132116.152116.138115. 128
116.134116.608116.128115.126115.124116.130
116.142116.133
STANDERRORH(KM)
6.56.50.70.4
0.8
0.31.80.61.80.51.9
6.50.66.71.26.61.0
0.20.30.20.30.20.3
e.71.41l.0.50.40.4
0.20.20.40.6e.50.7
0.50.20.80.20.60.5
0.10.6
DEPTH El(A) Z
11.4611.656.49
-1.510.00..1.71
2.86-1.623.763.20.0.00..
7.800
2.94-e.750.00eo3.22.5.880.00..
4.42-..66-4.51-O.59-e.29-1.85
-0.135.590.227.22
-1.35-4.82
0.50-1.e50.98
-.. 21-0.870.0e0*
0.00..10.89-1.51-4.53-4.56-4.93
0.84e.00.e
rAND AZIRROR GAP((KM) (DEG)
125 MAGNITUDE ESTIMATESUco Wd MLh NLv U
0.688.96.86.?
1.7
2.31.42.2
0.8
1.06.90.9
1.01 .8
5.90.68.20.30.30.5
1.05.21.60.90.90.8
0.40.30.51.ee.51.1
0.80.81.30.31.00.6
0.20.8
1982621501921219l
108
279130143
107267
146107142106193106
1048284123108111
11224217014185
108
108111
112112I1107
11261
111108108175
15110e
ADI 1.6eADI 1.36 1.58ACZ 1.43ACZ 1.39ADZADZ
BCZ 2.27BDZE01
CczACZCDI
ACZ 1.89E'CACZ 1.35CCA 2.14ACI 1.54ACZ
EcZACZA3ZABZACI 2.05ACZ
ACICDZoczBCIACZACZ 1.65
ACZ 2.51ACZACZACZACZACZ
ACZABI 1.79AC2ACZ 1.76ACZACZ
ACZACZ
1.711.58 1.611.24 1.611.24 1.49
1.591.64 1.84
1.99 2.221.37 1.381.11 0.98
1.171.82
1.83 1.91
2.16 1.971.56
1.50 1.47
1.49 1.321.60
1.371.74 1.75
1.371.e81.0e1.67
1.441.391.31
3.451.331.94
2.72
DEL- RMS INMIN RES. PH. U.S.G.S.
JLt (KM) (SEC) QUADRANGLE
11.1 0.o8 17 LAST CHANCE RANGE11.7 0.09 14 LAST CHANCE RANGE29.4 0.14 14 SCOTTYS JUNCTION NE14.4 0.10 11 COLD POINT SW7.9 0.03 3 BOULDER CITY15.9 0.12 le REVEILLE PEAK
2.6 27.0 9.13 31 PAPOOSE LAKE SE39.7 0.07 9 ELGIN7.4 0.08 9 FOSSIL PEAK10.4 0.15 9 WHITE RIVER NARROWS21.0 6.14 14 REVEILLE PEAK56.9 0.14 10 WINGATE WASH
6.6 0.12 17 LONER PAIANAGAT LAKE19.7 0.16 14 REVEILLE PEAK24.1 0.09 8 CUTLER RESERVOIR20.0 0.19 8 REVEILLE PEAK7.2 0.09 11 FOSSIL PEAK26.2 0.13 8 REVEILLE PEAK
20.4 0.62 7 REVEILLE PEAK1.9 30.4 0.13 22 TOLICHA PEAK
8.8 0.086 20 SCOTTYS JUNCTION SW8.9 0.06 12 SCOTTYS JUNCTION SW20.3 0.06 15 REVEILLE PEAK19.9 0.07 9 REVEILLE PEAK
20.2 0.12 7 REVEILLE PEAK21.3 0.06 7 SLIDY lIN13.2 6.18 1019.9 0.17 32 VALLEY13.4 0.07 8 GOLD POINT SW20.0 0.12 15 REVEILLE PEAK
20.3 0.08 23 REVEILLE PEAK20.2 0.07 14 REVEILLE PEAK19.4 0.06 7 REVEILLE PEAK20.2 0.10 9 REVEILLE PEAK
2.1 20.2 0.08 12 REVEILLE PEAK19.8 0.13 1s REVEILLE PEAK
20.3 0.09 10 REVEILLE PEAK1.6 15.9 0.07 26 THIRSTY CANYON SE
20.1 0.06 6 REVEILLE PEAK20.0 O.0" 14 REVEILLE PEAK19.9 0.07 7 REVEILLE PEAK20.3 0.03 6 REVEILLE PEAK
20.3 0.02 7 REVEILLE PEAK20.0 0.11 8 REVEILLE PEAK
1.671 .571.821.791.63
1.831.841.621.951.541.58
1.711.34
f . . . . .- .)
(.

) I ,; I ) ) 7 2.1989 LOCAL HYPOCENTER SLI44ARY - SCO EARTHQUAKES
DATE - TIME(UTC)
JAN 11 4:48:5411 15:25: 612 3:48:1112 12:38:4212 16:24:2012 22: 3:33
13 7:28:2613 9:16:1713 9:16:2113 17: 7:1013 21:35:5314 15:27: 5
14 18:48: S14 19::S:1514 22:52:4314 23: 6:4614 23: 8:. 814 23:12: 9
15 3:41: 615 4:37: 8
D 15 5: 1: 715 6: 5:3515 7:19: 215 7:27:47
15 19:38:2116 8:52:1917 16:34:2817 12:10:1517 14:28:1017 16:41:37
17 16:47:3717 21:22:1818 8:29:5118 3:14:4318 14:29:3919 8: 7:31
19 7:42:5519 7:43:2719 23:37:3620 3:15:5820 5:2e: 726 18: 1: 1
20 13:18e4726 21:15:35
LATITUDE(DEG. N)
36.67037.36537.86237.47636.65435.722
37.21837.24337.40837.32237.86537.114
37.11037.25837.27537.28a37.28337.288
37.25237.29536.71437.25636.41337.285
36.75437.65737.86537.86237.86337.163
37.16237.33637.89737.24936.95136.324
37.28537.26837.39537.11435.91437.115
36.99837.116
LCNGITUDE(DEG. W)
116.679115.213116.138115.420116.237115.554
115.683114.831115.052114.aia116.128117.155
117.159115.042114.995115.616115.017115.625
115.639115.303116.215115.637114.833115.615
115.920116.130116.129116.132116.128117.385
117.388114.666116.124115.042116.728115.113
114.846116.397117.228117.166114.839117.155
117.550117.155
STANDERRORH(KU)
2.36.76.76.46.55.6
1.40.79.66.86.56.2
6.40.40.56.3
6.50.5
6.50.30.3
6.56.6
0.38.20.30.40.30.2
0.22.06.76 .66.26.4
1.26.96.30.4
.:2,
6.3
6.60.4
DEPTH(KM)
12.064.75
-4994.212.13.
13.2210.846.e0o.5.106.oe086.85
4.572.836.046.168.728.So
7.3110.891.645.4U
-1.969.67
6.846.u
-4.67-8.23-4.587.75
8.21-1.62-1.3910.976.51
-0.91
4.825.886.426.841.e61 .69
2.96-4.68
STAND AZIERROR GAPZ(KY) (DEC)
1.5 1997.0 1621.1 1070.7 960.5 248- 224
6.9 2641.4 2442.6 964.8 2281.6 1130.4 103
5.6 1642.5 1520.6 264S.9it' 1540.8 1950.9 152
1.4 2660.3* 1881.2 902.2 1710.6 1836.8 195
6.5 1550.4 1670.5 16e0.7 1676.5 11I6.7 118
e.8 1191.7 2601.6 1151.4 2010.2 1256.8 142
9.1 2321.8 1516.5 792.4 1653.5 1981.0 163
2.4 1936.5 91
DODIZS UAGN
MCo
SOZCCZACZACZADZDDI
0DIADIDOZEDZACZACZ 1.89
9CZBCZ 2.35ADZACZ 2.23ADI 1. 58ACI 1.97
ADI 2.04ADZ 1.34ABZBCI 2.44ADZADI 1.77
ACZACZACZ 2.46ACI 1.97ACZ 1.66ACu 1.75
ACI 1.78BOZ 2.03ACZADIACZACZ 1.79
CDZACAACZOCI 1.86BDZ 2.26ACZ 1.87
BDZ 1.51ACZ
ITUDE ESTIMATESMd hLh ULv
0.941.33 1.15
I.821.59 1.611.81 0.91
2.12
1.27 1.241.496.851.321.65
1.53 1.65
1.67 1.13S 2.51
1.37 1.162.50
* 1.471.74
1.76 1.771.371 .022.211.851.25
1.031.74
2.42 2.742.161.781.58
1.931.80 1.81
1.73 1.561.44
6.871.70
1 .276.98
1.21 1.271.28 1.582.15 2.25
1.40
1.746.47 0.62
DEL- RMS JNMIN RES. PH. U.S.G.S.
MLc (KW) (SEC) QUADRANGLE
10.6 6.20 10 CAMP DESERT ROCK15.0 6.12 8 ALAMO20.2 6.14 9 REVEILLE PEAK25.3 0.10 1I CRESCDWT RESERYOIR9.2 e.04 15 SPECTER RANGE NW
66.4 .20 5 CLARK MTN
16.8 6.62 6 LOWER PAURANAGAT LAKE26.7 0.04 6 DELAMAR 3 NE6.2 2.27 6 ALAMO NE
1.4 21.9 6.05 7 GRECERSON CASIN48.8 0.08 7 REVEILLE PEAK
1.6 18.1 6.11 26 BSNCIE CLAIRE SW
18.0 o.09 12 BONNIE CLAIRE SW16.3 6.11 19 ALAMO SE15.8 0.04 7 DELAMAR LAKE
2.7 13.6 0.07 17 ALAM0 SE14.1 0.0 9ALAMO SE13.4 6.07 13 ALAMO SE
16.1 6.08 11 ALAMO SE1.6 12.5 6.2 S ALAMO SE
6.0 6.12 19 SPECTER RANGE NW2.3 16.5 6.11 16 ALAMO SE
31.0 0.12 13 DRY LAKE13.9 0.65 8 ALAMO SE
11.6 0.0 19 FRENCHIAN FLAT19.9 0.0 17 REVEILLE PEAK
2.4 20.4 0.11 26 REVEILLE PEAK20.3 0.12 15 REVEILLE PEAK26.2 6.es 12 REVEILLE PEAK
1.8 18.5 0.67 19 U8EHE8E CRATER
2.0 18.4 0.08 21 UBEHEBE CRATER1.9 30.6 6.16 8 ELGIN SW
22.3 0.13 9 REVEILLE PEAK15.7 0.08 6 LOWER PAHRANAGAT LAKE19.4 0.05 18 BARE ITN20.6 6.09 14 VALLEY
22.6 0.65 7 GREGERSCON BASIN6.6 0.08 8 SCRUG4AM PEAK
1e.8 6.09 20 STONEWALL PASS18.4 8.16 19 BONNIE CLAIRE SW7.6 0.15 12 BOULDER CITY
2.6 18.2 0.09 22 BONNIE CLAIRE SW
18.1 6.12 22 DRY WTN18.3 0.10 12 BONNIE CLAIRE SW
_.

.) I -I j I)
1989 LOCAL HYPOCLNILR
.! .) I/ 'i
SUMMARY - SG8 EAR THQUAKES
DATE - TIME(UTC)
JAN 26 22:26:2321 4: 5:2421 23:55:3822 11:39:5622 12:52:1423 17:52:17
24 9:31:3425 17:36:3426 6: 1:2826 3:42:4126 14:19: 126 17:47:52
26 17:62:3326 17:53:1527 22:12:1028 1: 2:4628 16:47:1129 5:16:38
29 15:21:3529 18:55:3630 9:30:2331 16: 7:1731 18:22:5631 22: 9:16
FEB 1 3:27:341 3:28:251 15:33:161 15:37: 91 18:44: 83 17:25:30
5 8: 9:175 16: 8:235 15: 1:225 19:57:465 21: 7:285 22:21:28
6 0:42:186 9:16:576 15:23:586 19:28:527 11:29:167 22:18: 6
7 22:51:288 6:44:49
LATITUDE(DEG. N)
37.74837.74637.39637.88337.68537.396
37.63336.75937.42436.74536.09837.114
37.11437.11137.43836.88736.76637.111
37.04836.56237.39637.25336.76136.964
36.71536.73337.53037.45736.45636.726
37.13136.91836.61436.91537.25037.863
37.26737.15936.86936 .36637.50436.369
37. 62437.529
LONGITUDE(DEG. W)
115.041115.645117.773116.129115.523117.229
115.671116.537114.313116.198114.639117.155
117.154117.159114.095116 .814115.554117.911
1 16.636116.619117.230116. 364116.115115.606
115.519115.545114.638115.482114.486116.137
115.752116.770115.831116 .767118.343116.132
115.094117.637116.126114.938114.237115.817
114.316118.466
STANDERRORH(KU)
0.70.20.90.76.30.2
8.44.41 .0.21.56.3
0.20.42.10.50.61.1
6.41.20.20.20.20.4
0.96.71.30.61.00.3
1.51.36.30.11.50.4
0.40.43.36.61.40.4
6.82.3
DEPTH(KM)
4.21-0.466.55
-e.891.27
-0.56
2.1422.478.809.253.11.4.38
0.654.409.730.26.5.85
-0.06
6.897.80
-1.e0-e0.146.536.o..
12.856.60..6.246.06.e
-1.331.42
4.70e0.990.360.691.54
-0.92
9.589.671.942.814.99
-4.24
19.172.84.
STAND AZIERROR GAPZ(KU) (DEG)
5.7 1300.3 1273.6 1351.1 1122.0 1479.3 125
1.1 1098.7 1411.1 2460.4 115- 2313.9 96
6.3 915.6 1042.5 294- 865.0 1461.1 257
0.4 1864.5 2306.2 1256.3 456.3 1376.7 126
3.2 2961.1 1541.4 2961.1 a81.6 2281.0 16
- 1631.1 2931.2 1678.2 1513.5 2786.7 108
6.8 1776.7 1760.8 1095.6 1761.6 2836.7 124
0.7 311- 312
000125
cCZACZ
eCZBCz
ACZ
ACZDCIBOIABZCOIBCZ
ACZE5CZBDI801CCAOCABOI
ADZwZACZABZACZACZ
0DIACZBDZBczEOZAC2
CCZBDZACZACZEOIACZ
ACI
ABZEID0DZACZ
ADI001
I DEL- RAS fNMAGNITUDE ESTIMATES MIN RES. P1H-. U.S.G.S.Uca Md ULh MLv MLc (KM4) (SEC) OLLACRANGLE
0.91 14.0 0.12 8 HIKO NE1.12 0.89 13.7 0.63 o HIKO NE
1.78 1.74 12.5 0.19 14 SOLDIER PASS1.61 21.5 0.17 13 REVEILLE PEAK
1.65 1.75 1.66 31.3 0.67 17 SOUTHEASTERN MINE1.24 16.9 0.06 26 STONEWALL PASS
0.74 12.6 0.67 8 HIKO NE1.01 6.8 1.72 9 BARE TN
2.77 2.69 2.8 42.6 9.12 17 *&*QUAD. NOT LISTED.1.11 0.75 6.7 6.e6 17 SPECTER RANGE NW2.62 2.11 22.2 6.67 6 HOOVER DAM
1.11 1.24 18.2 0.08 15 BOWIE CLAIRE SW
1.61 1.21 1.35 18.1 0.08 18 DONNIE CLAIRE SW0.49 6.8l 10.1 0.06 6 9DONNIE CLAIRE SW
2.37 1.74 1.65 59.8 0.67 7 .o-QUAD. NOT LISTED.2.18 19.4 6.16 11 BULLFROG1.82 24.2 0.1 11 TIM SPRING
1.45 27.1 0.10 16 WAUCOBA SPRING
1.65 13. 07 12 YUCCA FLAT0.77 16.9 0.11 12 E10 DUNE
0.93 1.10 10.9 0.08 21 STONEWALL PASS2.35 2 11 2.35 2.8 5.6 0.09 37 DEAD HORSE FLAT
0.67 14.5 6.66 12 CALF DESERT ROCK1.71 1.83 35.1 0.13 25 QUARTZ PEAK
1.34 1.53 44.3 0.15 13 HEAVENS WELL1.12 24.1 0.12 8 HEAVENS WELL6.77 12.2 6.06 6 CHOKECHERRY WTN
1.59 1.34 1.50 22.2 6.16 12 CRESCENT RESERVOIR1.87 1.99 60.7 0.14 11 ***QUAD. NOT LISTED.1.48 1.26 1.5 12.3 0.10 16 SPECTER RANGE NW
1.44 22.6 0.12 l PAPOOSE LAKE NE1.24 18.5 0.06 13 BULLFROG1.54 13.5 6.07 14 FRENCHMAN LAKE SE
1.35 0.89 18.1 6.04 19 BULLFROG1.80 2.15 43.2 6.13 13 -.. OW.D. NOT LISTED.
1.83 26.5 0.12 13 REVEILLE PEAK
2.12 1.56 13.7 0.06 11 ALAMO SE1.38 8.2 .18 15 LAST CHANCE RANGE
1.29 6.79 4.6 0.11 18 CANE SPRING1.63 25.2 6.03 5 DRY LAKE
2.37 2.42 2.39 45.7 6.101 -eeQUAD. NOT LISTED.1.72 1.39 1.52 21.3 0.10 19 MT STIRLING
2.10 1.79 37.8 0.03 6 ...OUAD. NOT LISTED.1.83 45.6 0.15 9 *-QUAD. NOT LISTED.
()j ) i
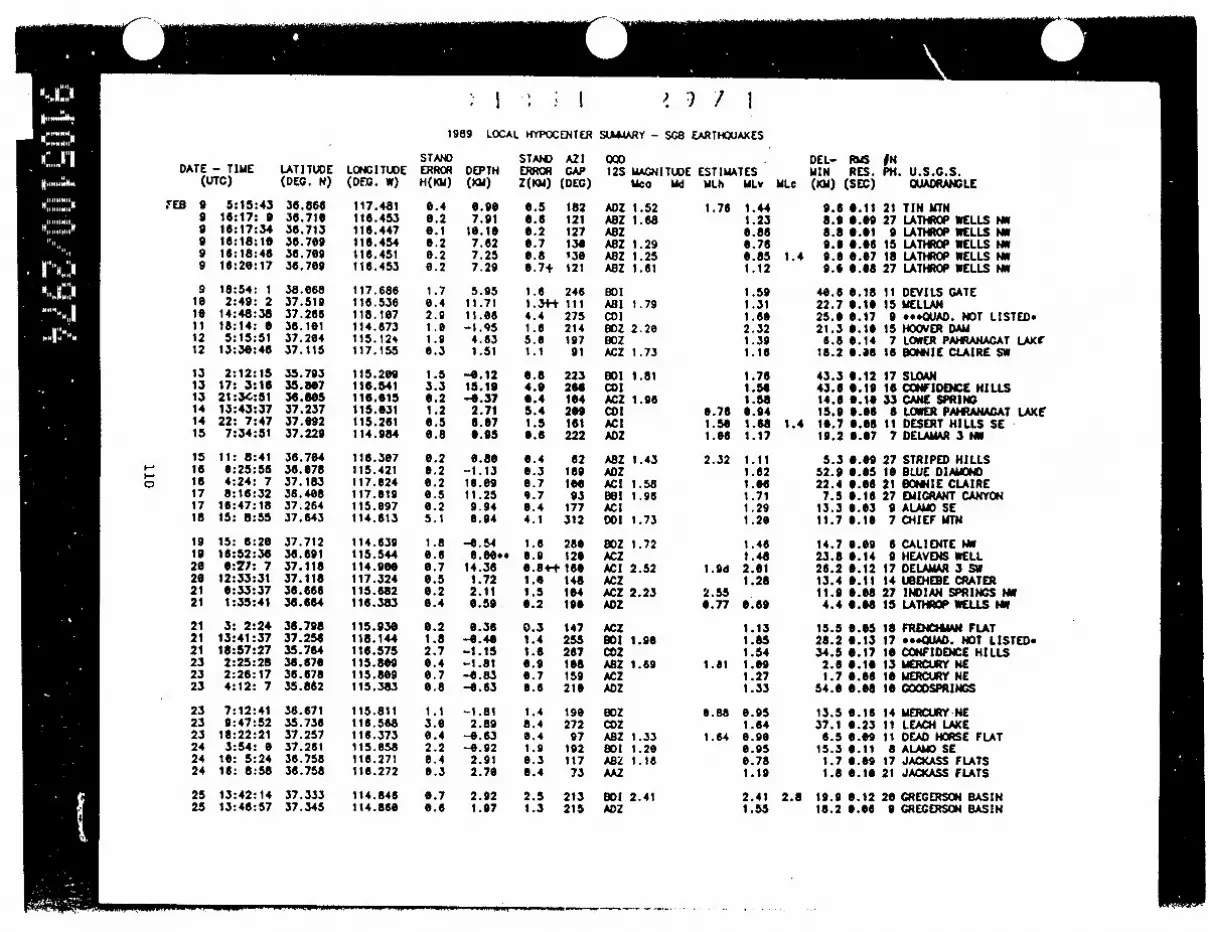
I. I .A , I ' ) I 11989 LOCAL HYPOCENTER StUAARY - SG8 EARTHOUAKES
DATE - TIME LATITUDE LONGITUDE(UTC) (DEC. N) (D8C. W)
FEB 9 5:15:43 35.866 117.4819 16:17: 9 36.716 116.4539 16:17:34 36.713 116.4479 16:18:10 36.709 116.4549 16:18:46 36.709 116.4519 16:20:17 36.709 116.453
9 18:54: 1 38.068 117.68616 2:49: 2 37.519 116.53616 14:48:38 37.266 118.10711 18:14: e 38.101 114.67312 5:15:51 37.284 115.12#12 13:30:46 37.115 117.155
13 2:12:15 35.793 115.20913 17: 3:16 35.807 116.54113 21:34:51 36.865 116.01514 13:43:37 37.237 115.63114 22: 7:47 37.092 115.26115 7:34:51 37.229 114.984
15 11: 8:41 36.704 116.3e7' 16 0:25:56 36.078 115.421
16 4:24: 7 37.183 117.02417 8:16:32 36.408 117.01917 16:47:18 37.264 115.09718 15: 8:55 37.843 114.613
19 15: 6:20 37.712 114.63919 16:52:36 36.691 115.54426 0:77: 7 37.118 114.90020 12:33:31 37.118 117.32421 0:33:37 38.666 115.68221 1:35:41 36.664 116.3a83
21 3: 2:24 36.798 115.93021 13:41:37 37.254 118.14421 18:57:27 35.764 116.57523 2:25:28 36.670 115.80923 2:26:17 36.678 115.80923 4:12: 7 35.862 115.383
23 7:12:41 36.671 115.81123 9:47:52 35.736 116.56823 18:22:21 37.257 116.37324 3:54: 6 37.261 115.e5824 16: 5:24 36.758 116.27124 1s: 8:58 36.758 116.272
25 13:42:14 37.333 114.84625 13:46:57 37.345 114.868
STANDERORH(KI)
0.40.20.10.20.26.2
1.76.42.91.e1 .96.3
1.53.36.21.20.50.8
6.20.20.26.56.25.1
1.8O.60.70.50.20.4
6.21.82.76.46.76.8
1.13.66.42.20.46.3
0.70.6
DEPTH(a)
6.907.9116.167.627.257.29
5.9511.7111 .e6-1 .954.631.51
- 0.1215.19-4.372.716.67.95
0.8s-1.1316.6911.259.948.94
-e.54
14.361.722.110.59
6.36-0.40-1.15-1.81-4.83-e.63
-1.812.89
-O.63-4.92
2.912.70
2.921.97
STAND AZIERROR GAPZ(KM) (DEG)
0.5 1826.6 1216.2 1276.7 1386.6 1306.7+ 121
1.6 2461.34* 1114.4 2751.6 2145.0 1971.1 91
6.6 2234.9 2660.4 1045.4 2691.5 1616.6 222
6.4 620.3 1696.7 1609.7 936.4 1774.1 312
1.6 2866.9 1266.8"t 1661.e 1481.5 1040.2 190
0.3 1471.4 2551.6 2676.9 l66.7 1590.6 216
1.4 1968.4 2720.4 971.9 1926.3 1176.4 73
2.5 2131.3 215
TOO12S MAGNITUDE
Uca Md
ADZ 1.52A8Z 1. 68ABZABZ 1.29ADZ 1.25ABZ 1.61
BDIABI 1.79CDIBOZ 2.20BDZACZ 1.73
BDo 1.81volACZ 1.96cDIACIADZ
A8Z 1.43ADZACI 1.58Bel 1.96ACI001 1.73
EOZ 1.72ACZACI 2.52ACZACZ 2.23ADZ
ACZDo1 1.96cozA8Z 1.69ACZADZ
EOZCDZA8Z 1.3380I 1.20A8Z 1.16AAZ
WI 2.41ADZ
ESTIMATESWLh MLv MLc
1.76 1.441.236.866.766.85 1.41.12
1.591.311.662.321.391.16
1.761.501.58
6.76 0.941.50 1.68 1.41.66 1.17
2.32 1.111.62I.ee1.711.291.20
1.461.48
1.9d 2.011.28
2.556.77 6.69
1.131.851.54
1.81 1.691.271.33
6.88 0.951.64
1.64 8.900.950.781.19
2.41 2.81.55
DEL- RUS JNMIN RES. PH. U.S.G.S.(KM) (SEC) QUADRANCLE
9.6 6.11 21 TIN MTN6.9 0.69 27 LATHROP WELLS UN8.8 6.61 9 LATHROP WELLS MW9.6 6.66 15 LATHROP WELLS UN9.0 6.07 18 LAUTHROP WELLS NW9.6 6.08 27 LATHROP WELLS NW
4e.5 0.18 11 DEVILS GATE22.7 6.16 15 MELLAN25.0 6.17 9 *.*.UAD. NOT LISTED.21.3 6.1 1 S HOOVER DAM6.8 6.14 7 LOWER PAHRANAGAT LAKr
18.2 6.08 16 DONNIE CLAIRE SW
43.3 6.12 17 SLOAN43.6 6.19 16 CONFIDENCE HILLS14.6 0.10 33 CANE SPRINO15.9 6.66 6 LOWER PAHRANAGAT LAKE16.7 6.68 11 DESERT HILLS SE19.2 6.67 7 DELAMAR 3 NW
5.3 6.09 27 STRIPED HILLS52.9 6.05 16 BLUE DIAMOND22.4 0.e6 21 BONNIE CLAIRE
7.5 0.16 27 EMIGRANT CANYON13.3 6.63 9 ALAM SE11.7 6.16 7 CHIEF ITN
14.7 6.09 6 CALIENTE NW23.8 0.14 9 HEAVENS WELL26.2 6.12 17 DELAMAR 3 SW13.4 6.11 14 U8EHEBE CRATER11.9 6.68 27 INDIAN SPRINGS 1W4.4 6.08 15 LATHROP WELLS NW
15.5 0.o5 18 FRENCHUAN FLAT28.2 6.13 17 **.'UAD. NOT LISTED&34.5 6.17 16 CONFIDENCE HILLS
2.6 0.16 13 MERCURY NE1.7 6.66 16 MERCURY NE
54.6 6.08 16 OGODSPRINGS
13.5 6.16 14 UERCURY NE37.1 6.23 11 LEACH LAKE
6.5 0.09 11 DEAD HORSE FLAT15.3 6.11 8 ALAMO SE1.7 6.09 17 JACKASS FLATS1.8 6.10 21 JACKASS FLATS
19.9 6.12 20 GREGERSCN BASIN18.2 6.06 9 GREGERSON BASIN

) i J I ' ) 7 i
1989 LOCAL HYPOCENTER
DATE - TIME(UTC)
FEB 25 15: 4: 025 15:16:5525 15:34:3425 15:35:1325 15:35:4425 16:39: 1
25 17:18:5525 17:31:5725 19:42: 825 19:59:4425 20:44:4325 21: 1: 0
26 0:15:3026 7:59:4226 13:57:4226 14: d:1926 19:11:4427 3:47:28
27 16: 5: 727 16:34:4828 6:26:5428 7:24:3428 7:50:2728 16: 7:38
MAR 1 9:34:171 13:18:422 1:58: 82 10:17: 12 14:49:482 14:;5:14
2 14:56:172 14:54:422 14:54:422 23:31:374 14:53:174 23:16:59
5 22:31:135 22:58: 35 23: 1: 36 2:4e:586 2:47:496 3:11:25
6 3:27:596 3:39:19
LATITUDE(DEG. N)
37.354537. 34637.33637.34537.34137.339
37.33637.34437.34237.34037.34637.344
37.34335.89835.92635.91238.77836.970
37.24537.23637.23337.34237.17637.001
37.33937.25936.89435.90735.90935.911
35.91335.88335.91537.11537.02837.156
37.01437.01236. 6W37.61937.01437.612
37. 61537.614
LONGITUDE(DEG. W)
114.859114.868114.857114.855114.8581 14.858
114.852114. 8of8114.856114.857114.860114.858
114.855115.388116.953116.951116.270116.139
115.e21115.009115.057114.857117 4621 17.600
114.867117.694
116.9531186.949116.953
116.947116.959116.945117.157116 .916116.215
116.380116.385114.822116.387116.384116.381
116.380116.381
STANDERRORH(KM)
0.5i.e
1.0
1.60.60.4
0.50.50.5
0.50.50.5
0.53.81.91.10.20.2
0.40.41.10.40.40.8
1.00.20.46.96.61.1
1.61.42.40.20.3
0.3
0.20.20.80.30.20.2
0.20.1
DEPTH(KM)
1.991.773.911.494.092.30
1.881.841.702.041.841.96
1.850.027.207.40
-e . e96.32
0.160.986.581.655.840.68
6.31-e.09-1.287.598.628. 08
7.559.639.276.50
-0.113.83
8.307.27
-1.958.787.728.52
8.008.61
STANDERRORZ(KM)
1.1I1.29.64.45.50.9
1.11.01.01.21.0
i.e3.12.31.16.20.7
0.40.43.51.02.41.0
1.00.11.71.10.70.8
2.91.21.36.40.42.1
0.30.41.70.30.30.4
0.30.2
AZIGAP
(DEG)
216215218272217217
219216217217215216
217285267274
9196
208214225217139183
302181
69207269269
268268268
87109127
7383
1531478673
7373
SU&A.RY - SG8 EARTHOU,
Otl12S MAGNITUDE ESTIUA1
Uco Ud ULh
ADZADZCDI 1.64BDZCDI 1.81AD2 1.74
ADK 2.13ADZADIADZADZADZ
ADI 1.58CDA 2.11BOA 1.81BOA 1.58A8Z 1.e5 1.11ABZ
ADZ 2.10ADZB01ADZ
ADZ
DDIADZ
BCZ 2.19ADI 2.28ADAE1Z 1.94
90Z 1.83B9I 2.40EOA 2.47ACZ 2.41ACZ 2.40DCZ
AAI 1.56AAZACZ 2.13ACZAAZ 1.44AAZ 1.62
AAZ 1.47AAZ 1.30 1.39
1.45
1.401.20
0.691 .65
1.252.17
AXES
DEL- RYS JN,TES IN RES. PH. U.S.G.S.ULv MLc (KM) (SEC) CUADRANGLE
0.96 18.3 0.06 9 CREGERSON BASIN1.11 18.2 6.06 9 GREGERSON BASIN1.69 18.8 4.15 16 CREGERSON BASIN1.18 18.7 0.05 7 GREGERSON BASIN1.73 18.5 0.06 8 GREGERSON BASIN1.73 10.6 6.05 9 CREGERSON BASIN
2.48 2.7 19.3 0.67 13 GREGERSON BASIN0.88 18.5 6.05 8 GREGERSON BASIN1.35 18.7 0.05 9 GREGERSON BASIN1.03 1.5 18.7 6.05 9 GREGERSON BASIN0.93 18.2 0.05 8 GREGERSON BASIN1.18 18.4 0.05 9 CREGERSON BASIN
1.38 1.7 18.7 0.05 9 GREGERSON BASIN73.6 0.14 14 OOODSPRINGS8.8 0.12 8 WINGATE WASH9.5 0.05 6 WINGATE WASH
0.61 3.9 0.06 15 JACKASS FLATS0.61 8.6 0.05 1l MINE UTH
1.39 17.0 6.65 13 LOWER PAHRANAGAT LAKf6.78 1.5 17.5 0.03 7 LOWER PAHRANAGAT LAKE1.47 13.6 0.07 6 LOWER PAHRANAGAT LAKC1.23 18.6 0.03 7 GREGERSON BASIN0.86 17.5 0.10 12 UBEHEBE CRATER1.19 22.6 0.12 12 LAST CHANCE RANGE
1.34 17.9 6.67 9 GREGERSON BASIN1.28 5.2 6.05 21 UUCRUDER MTN
2.7 19.6 0.16 26 BULLFROG2.31 10.0 6.11 20 WINGATE WASH
9.5 0.04 7 WINGATE WASH9.8 6.07 9 WINGATE WASH
1.92 39.3 6.67 6 WINGATE WASH2.64 2.6 12.2 0.16 22 WINGATE WASH
8.9 0.05 6 WINGATE WASH2.15 2.2 18.3 0.10 32 BONNIE CLAIRE SW1.16 11.8 0.06 12 SPRINGOALE0.95 12.6 6.09 13 RAINIER MESA
1.21 2.5 0.06 27 TIMBER MTN6.66 2.6 6.05 18 TIMBER MTN2.03 16.66 .1 14 BOULDER BEACH6.74 1.8 0.05 16 TISBER MTN6.84 2.3 6.05 18 TIMBER MTN1.44 2.7 0.e8 33 TIUBER MTN
1.06 2.3 0.05 22 TIMBER MTN6.99 2.4 0.84 23 TIMBER NTN
2.17
2.02
I ,.) (It o W I!I l w'"M I A . .-

:) I () 3 I .' 9 7 61989 LOCAL HYPOCENTER SUAARY - SG8 EARTHQUAKES
DATE - TIME LATITUDE(UTC) (DEG. N)
MAR 6 7:25: 4 37.0136 18:58:3e 37.9086 20: 6:25 37.3397 4:28:34 37.8587 11: 4:27 37.7067 18: 6: 6 37.906
a 6:32:24 37.0138 lo: 5:36 37.9059 11:17:52 37.86816 4:35:44 36.80716 14:30:41 36.82211 1: 4:45 37.148
11 12:21:46 37.87912 8:53:44 38.39413 4:33: 2 37.11213 18:50:47 37.92614 1:53: 8 36.49414 6:34:32 37.260
14 18:51:56 36.46514 23:17:46 37.24114 23:18:48 37.25414 23:23:18 37.33515 2:34:42 36.68915 3:44:28 37.250
15 5: 6:39 37.24415 5:16: 6 37.24615 5:16:39 37.25415 5:14:39 37.25115 5:15:47 37.23815 5:23: 4 37.253
15 6:13:22 37.24915 7:58: 3 37.33315 8:34:39 37.24915 9:59:21 37.24215 12:58:23 37.24915 16:37:11 36.914
15 18:26:14 37.24415 19: 9:55 37.25115 19:11:24 37.24115 19:44:11 37.26615 21:44: 0 37.24515 22:22:22 37.250
16 0:35: 7 37.24716 2: 6i18 37.248
LONGITUDE(DEG. W)
116.384116.137114.846114.990115.0111:6.136
116.380116.141116.138116.068116.24i116.864
116.069116.462117.156116.161115.573115.067
114.493115.0e3115. 036115. 166116.170115.037
115.018115.626115.644115.024115.0e3115.023
115.032115.259115.629115.02111 5.027117.654
115.006115.621115.O05115.094115.029115.633
115.025115.017
STANDERRORH(KO)
e.26.50.60.80.46.4
0.26.56.50.26.76.8
0.71.96.21.48.21.8
1.46.40.4
14.10.20.8
6.20.60.46.53.40.4
0.61.16.61.71.60.8
6.36.46.14.31.36.6
2.50.4
DEPTH(KM)
8.13-0.670.327.216.680.35
8.49-1.032.710.455.42
-1.85
7.14-0.85
6.67-0 .21-0.946.58
-1.130.204.9324.96*4.924.51
3. 87.0.796.88
-0.834.87o6.55
4.500.614.627.892.905.94
6.42-0.89
6.768.629.574.33
7.20-0.52
STANDERRORZ(A)
0.36.90.71.26.96.7
6.31.07.60.41.60.7
4.31. 7t0.31.36.42.8
1.26.32.0
1.43.1
6.86.50.4
0.5
2.36.71.93.04.26.3
6.40.46.14.01.82.2
2.60.2
AZIGAP
(DEG)
107116220237129116
73115
126135146
1162859018454
189
24023620619199
202
209206198205215196
204238265209205199
212266213178206203
229231
QODi2S MAGNITUDE
Wco Md
ABZ 1.22BczADZ 1.47ADZABIDCI 1.65
AAZACZCCA 2.32ACZ 1.69 1.14ABZ 1.26ACZ 1.57
ECA 2.88BDZACZ 1.76 1.4880ZACZ 1.69BOZ
E2DZADIBDZ 2.51DOI 1.52 1.67ACZBDZ 1.81
wzADZADZ 2.14ADZCOZADZ 2.16
8DZ 1.75BDZADZ 2.02BDZ0DZ 1.90
COI
ADIADZ 1.49ADZ 1.24CCUB01BDZ 1.92 e.77
EDZADI
ESTIMATESYdLh MLv 6
0.831.601.446.971.131.96
1.001.8N
1.470.861 .65
2.151.521 .401 .23
1.12 6.96
2.081.67 6.89
2.22
6.731.89
1.67 1.061.48 6.64
1.481.541.21 1.17
1.92
1.401 .61.44
1.581.41
1.62 1.73
1.511.851.59 0.95
1.151.67
1.34
1.41 0.781.32 1.34
DEL- RMiS INMIN RES. PH. U.S.G.S.
ILe (KM) (SEC) QUADRANGLE
2.5 6.67 21 TIlMER MTN24.6 6.15 14 REVEILLE PEAK19.6 6.08 1f GRECERSON BASIN7.5 0.67 7 WHEATGRASS SPRING8.9 6.08 9 HIKO NE
2.2 23.7 6.15 18 REVEILLE PEAK
2.6 0.67 21 TIBER MTN23.9 6.13 11 REVEILLE PEAK21.2 6.11 9 REVEILLE PEAK14.6 6.67 21 CANE SPRING7.6 0.13 14 SKULL WTN7.8 6.14 12 OAK SPRING
14.8 0.16 13 REVEILLE PEAK16.9 6.66 10 **QUJAD. NOT LISTED.18.6 0.67 24 BONNIE CLAIRE SW23.4 6.11 7 REVEILLE PEAK13.8 6.08 23 RYAN14.7 6.67 7 ALAMO SE
60.6 6.17 10 .*.QUAD. NOT LISTEDe18.2 6.61 6 LtWER PAHRANAGAT LAKE16.4 6.67 12 ALAMO SE9.4 6.17 5 ALAW SE16.9 6.98 18 SPECTER RANGE HI16.1 6.64 8 ALAMO SE
17.2 6.08 5 LOWER PHRAHNAGAT LAKV17.1 6.67 8 LOWER PAHRANAGAT LAKI15.9 0.05 16 ALAMO SE
1.3 17.1 6.64 8 ALAMO SE18.0 6.16 6 LOWER PAHRANAGAT LAKE17.3 0.65 12 ALAMO SE
16.4 6.67 11 LCOER PAHRANAGAT LAKC19.3 6.16 7 BADGER SPRING16.7 6.67 11 LOWER PARHANAGAT LAKC16.8 6.08 7 LOWER PAHRANAGAT LAKE16.8 0608 9 LOWER PAHRANAGAT LAKC25.2 6.15 14 DRY MTN
18.1 6.62 7 LOWER PAIHUAAGAT LAKE17.3 6.63 9 ALAMO SE18.1 6.61 7 LOER PAHRANAGAT LAKC13.6 6.16 6 ALAMO SE16.4 6.08 9 LOWER PAHRANAGAT LAKE16.4 6.65 9 ALAUM SE
16.8 6.06 7 LCWER PAHANAGAT LAKC17.5 6.61 6 LOWER PAHANAGAT LAKE
NLVMF_.

) I ., j I .) *1 7
1989 LOCAL HYPOCENTER SUMAARY - SG8 EARTHCUAKES
DATE - TIME(UTC)
MAR 16 4:17:2716 4:28:2916 5:13:5816 7:56:52le 8:13:5816 8:14:46
16 11:36:5916 12: 0: 616 14:34:6016 14:48:2416 16: 9:5516 21: 4:33
17 1:36:2817 4: 2:2717 6: 3:4717 16: 7:3317 17:46:4817 17:54:10
17 18:43:55t 17 22:25:25w 18 2: 4:35
18 3:54:1518 5:50:3518 22:25:56
19 6: 1:1919 20:28:2121 12:38:4021 23: 7:3922 12:26:2122 17:40: 7
22 18:29:6023 6:31:3423 21:39:5924 1:12:1424 6:54: 724 6:57:52
24 6:57:5224 16: 5:1624 16:12:1524 23:44:1525 4: 8:5525 6:14t27
25 8:36:2525 10:49: 3
LATITUDE(DEG. N)
37.30037.24737.25537.29937.25237.260
37.24137.25437.25437.24837.24237.248
37.23837.00037.25037.02237.25337.249
37.11537.24237.24137.24637.15037.248
36.98337.34137.07437.11537.10638.497
35.95237.44837.34336.48637.16237.162
37.05637.16337.16237.5037.26037.243
37.24537.070
STANDLCtNGITUDE ERROR(DEC. W) H(UW)
115.178 1.4115.026 1.2115.661 2.4115.178 11.3115.834 1.4115.062 4.2
115.011 1.1115.029 0.5115.046 2.7115.034 6.8115.603 3.0115.028 6.5
115.008 0.9115.978 0.9115.031 3.6116.525 6.2115.032 2.2115.024 1.4
117.367 0.3115.608 6.3115.009 6.9115.023 1.1116.067 6.5115.617 1.2
116.714 6.2116.793 0.2116.228 0.3117.362 0.3115.193 0.7114.400 2.5
115.221 1.5114.508 2.8116.795 0.2116.932 6.3117.386 6.2117.382 6.3
117.475 4.0117.384 0.2117.383 0.2114.632 1.2115.048 0.6115.006 1.3
115.004 0.5116.219 6.3
DEPTH(KM)
8.564.959.477.06e6.16
11.24
6 42-0.89
8.705.724.34
-4.06
1.772.404.81.9.20
-4.778.44
6.170.146.870.47
-1.124.03
0.606.337.760.132.16
-1.02
6.60..- 1.546.566.638.167.23
19.717.246.91
-1.022.290.73
.4.646.68
STANDERRORZ(oJ)
1.e2.63.5
I.04.6
0.90.44.21.9
11.70.5
1.71.4
6.71.32.0
1.10.31.56.90.57.2
O.31.10.66.46.81.7
1.62.26.31.60.71.0
3.10.96. 60.61.00.9
0.56.a
AZ2cAP(DEG)
206229193265262191
212263198204236205
214228204102225206
112212213207125211
87105114111194283
1872911664
118118
198119131293195214
212(5
OO012S MAGNITUDE ESTIUA1
Mca Md MLh
BDZ 1.67601 1.78BDuDOIBOICDU
BOZ 1.35ADZ 1.83CDZ 1.91ADZ 1.85CDIADZ
ADZADZ 1.44COUABZ 1.32BOZ
ACI 1.51ADZADZ 1.79801 1.53A8ZCDZ
ACZ 1.52ACZ 1.84ABZACZ 1.78ADZCoZ
BOZCDZ 1.71ACZ 1.53ACI 1.61ACI 1.77ACZ 0.73
CDZ 0.71ACIACIDOZ 1.73ADU 1.68mU 1.19
ADU 1.39AMU 1.40
1.37
1.421.38I.581.41
1.741.871.91
1.68
1.65
1.32
1.53
1.541 .38
1.S6
1.i0
DEL- RUSrES MIN RES.ULv ULc (KU) (SEC)
1.35 14.6 6.111.34 16.7 0.001.42 14.7 0.001.33 14.5 0.12
16.4 0.0715.1 6.12
6.95 17.6 6.061.21 16.9 0.03
15.7 o.091.45 16.1 D.091.26 18.3 0.101.13 16.7 0.03
1.04 17.7 0.951.19 10.9 0.08
16.6 0.071.O1 12.4 0.65
16.7 0.0717.6 0.68
1.58 13.0 0.0817.9 0.02
1.34 17.8 6.1016.9 0.08
1.55 7.0 0.01.4 17.0 0.05
INPH. U.S.C.S.
QUADRANGLE
0 ALAMO9 LOWER PAHRANAGAT LAKE5 ALAMO SE6 ALAW7 ALAMO SE6 ALAMO SE
7 LOWER PAHRANAGAT LAKG8 ALAMO SE7 ALAMO SE
12 LONER PAHRANACAT LAKE7 LOWER PAHRANAGAT WEJf6 LONER PAHRANAGAT LAKE
7 LOWER PAHRANAGAT LAKe17 PAIUTE RIDGES ALAMO SE
20 THIRSTY CANYON SE6 ALAMO SE8 LOWER PAHRANAGAT LAKC
20 UBDEEBE CRATER7 LOER PAHRANAAT LAKE
11 LOWER PAHRANACAT LAKI9 LOWER PAHRANACAT LAKt
13 OAK SPRING7 LOWER PAHRANAAT LAKE
1.411.76 1.60
6.991.78
1.48 1.412.06
2.031.71 1.741.46 1.42
1.701 .80
6.86 0.96
1.600.89 0.901.00 1.011.61 1.47
1.631.0 1.17
1.74 1.210.87
18.2 C.0 23 BARE UTN14.6 0.05 24 TOLICHA PEAK4.1 0 .8 16 TIPPIPAN SPRING
13.0 .09 23 UBEHEBE CRATER7.0 0.07 9 LOWER PAHRANACAT LAKE
68.1 6.10 8 .9..UAD. NOT LISTED.
42.2 6.13 11 SLOAN27.5 0.06 9 ELIGN NE14.8 0.07 22 TOLICHA PEAK18.3 0.08 25 FURNACE CREEK
2.2 18.4 0.08 27 UBEHEBE CRATER18.4 6.07 12 UBEHEBE CRATER
13.1 0.27 0 UBUiEBE CRATER18.5 0.07 14 USEHEBE CRATER18.4 0.64 14 USEHESE CRATER14.5 8.03 8 CH)KECHERRY MTN10. 0.08 11 ALAMO SE18.5 0.17 8 LOWER PAHRANAGAT LAKF
18.3 0.08 10 LOWER PAHRANAGAT LAKE3.8 80.0 15 TIPPIPAN SPRING
)X i

' I . ) / '
1989 LOCAL HYPOCENTER SULLARY - S08 EARTHQUAKES
DATE - TIUE LATITUDE(UTC) (DEG. N)
MAR 26 2:59:56 37.11626 5: 5:18 37.1"26 17:43:21 37.28028 22: 2:18 37.07526 23: 3:22 37.24128 2: 6:58 37.653
28 5:16:31 37.12928 12: 5:19 36.85028 12:12:41 37.16228 12:18:12 37.16328 12:41:19 37.16128 12:41:32 37.163
28 I6: 7:18 37.16328 17:59:56 35.92329 5:33:22 37.69229 5:55:16 37.69029 18:18:26 37.11629 23:16:46 37.162
29 23:19:59 37.16530 19: 2:22 37.41951 2:29:25 37.64331 22:42:36 37.876
APR 1 17:21:10 37.0641 25:34:31 37.689
2 2: 1:43 37.6983 0:58:17 37.2793 8:59:59 37.0683 19:48: 6 37.1054 13:26: 6 37.6574 13:20:10 37.645
4 18:55:39 38.1s65 11:12:40 36.7136 1:27:49 38.5766 9:45:44 37.8696 16:10: 5 36.0616 22:30:45 37.83
7 0: 3: 6 36.6967 9:54:25 37.1617 16:42:18 37.4487 21:38:35 36.a077 23:55: 2 54.8968 7: 1:56 37.268
9 11:45:20 37.2619 11:52-33 37.327
LONGITUDE(DEG. W)
117.159117.384117.699116.227115. 616116.050
117.154116.453117.384117.334117.387117.382
117.384114.829115.051115.052117.849117.564
117.562115.637115.049116.622115.745115.053
115.051115.117116.034115.737114.492114.740
116.073116.046115.906115.715114.742116.131
116.813117.386117.895116.08O116.811116.375
116.510115.446
STANDERROR DEPTHH(KW) (KU)
6.3 5.986.2 6.476.8 -1.276. 6.212.3 0.556.3 11.67
0.4 6.200.3 13.676.3 7.966.2 8.356.4 8.5s6.3 7.86
0.2 7.465.6 4.23.6.3 6.176.2 6.566.5 7.386.2 7.27
6.3 7.016.6 9.106.7 7.726.8 6.206.3 -0.826.2 6.6"
0.3 0.936.6 13.146.5 -0.31.5 -0.55
4.4 2.12.3.2 0.00..
0.5 2.759.3 2.740.2 12.846.4 -0.170.6 1.566.6 0.6..
0.4 0.870.2 6.486.6 9.700.3 6.960.3 -1.420.4 -9.84
0.9 7.230.2 1.22
STANDERROR2 (KM)
2.41I1
o0.86.66.00.9
2.60.81.1
0.90.9
6.7
e.50.41.60.5
0.72.21.30.1
6.s6.4
0.41.30.80.4
5.5
2.40.60.50.61.61.0
10.50.96.61.18.26.4
3.11.5
AZICAP
(DEC)
90120158114211141
94175119118167117
118199114
24518
176
I"
273115
112
26e
146
152504228
199131102
247
198
55
116
172384
96
128144
1S;12S WAGNI
BCUACUACAABUcouACU
BCIACU 1.06ACUACUAcuACU
CDI 2.05
ACUACUADIACU
ACUscuADUADUACZACZ 1.37
ADIADIACZACZ 1.81COI 1.83DDZ 1.83
BOZ 1.89 1ABZABI 1.63 1ACZADI 2.39ACZ
ccz 1.99ACIACZAC! 1.54 1CCZ 2.02ABZ
B0zACZ 1.74
ITUDE ESTIMATESMd MU, MLv. MLc
1.08 1.490.88
1.970.80
1.36 0.996.84
1.34 1.306.826.71
0.94 6.776.69
6.06
1.35 1.161.970.956.68
1.54 1.691.37 1.52
1.53 1.521.57
1.771.261.231.28
1.026.a5 1.11
0.6s1.51 1.46
1.410.s8
1.92 2.026.85
.38 .36 1.481.65
1.85
1.950.84 0.97
1.12.38 1.08
1.811.72 1.63
1.581.54 1.46
DEL- RUS JNUIN RES. PH. U.S.G.S.(Kt) (SEc) QUADRANGLE
18.5 6.16 17 BOhNIE CLAIRE SW18.1 0.65 16 UBEHEBE CRATER7.0 .1 8 MAGRUDER 1TN4.2 0.0 11 TIPPIPAH SPRING
17.2 0.06 6 LOWER PAHAANAGAT LAKE16.6 6.06 14 YUCCA FLAT
19.4 0.14 20 BOWIE CLAIRE NW16.1 0.05 11 LATHROP WELLS NW18.4 6.67 10 U8DEHEE CRATER18.5 0.06 12 LBEHEBE CRATER19.3 0.06 9 UBEHEBE CRATER18.5 .67 13 UBEHEBE CRATER
18.6 O."6 15 UBEHEBE CRATER6.6 6.64 8 BOULDER CITY
11.0 6.07 10 HIKO NE11.0 ."6 10f HIKO NE22.2 0.0 9 WAUCOBA SPRING18.4 6." 15 L4EHEBE CRATER
18.7 0.4 16 UBEHEE CRATER20.7 6.14 12 8ALD INT18.6 6.06 9 LOOER PAHRANAGAT LAKE SE14.9 0.06 5 REVEILLE PEAK28.5 0.0610 FALLOUT HILLS SW11.0 6.05 9 HIKO NE
11.3 6.05 91HK0 NE13.8 6.08 7 ALAO SE8.6 6.09 12 YUCCA FLAT25.8 0.08 15 FALLOUT HILLS SW22.4 6.16 8 *e.OUAD. NOT LISTED.
4.4 1.01 8 CALIENTE NW
32.3 6.8o 10 ECHO CANYON9.6 6.08 17 CAMP DESERT ROCK
18.6 6.08 20 MERCURY SW16.5 6.08 1 ORTHINGTON UTNS8.9 0.07 14 HOOVER DAM26.3 6.14 14 REVEILLE PEAK
19.6 0.13 25 BULLFROG18.3 6.06 18 UBEHE8E CRATER2.7 0.63 6 SOLDIER PASS9.3 0.08 17 CANE SPRING
19.8 0.13 25 BULLFROG6.8 0.09 13 SILENT BUTTE
12.0 0.12 11 TRAIL RIDGE28.9 0.03 10 CUTLER RESERVOIR

') I 0) 3 I ~ )7 9
1989 LOCAL HYPOCENTER SULA4ARY - SG8 EARTHQUAKES
DATE - TIUE LATITUDE(UTC) (DEG. N)
APR 9 16:29:45 36.9959 16:31:15 36.9989 16:57:35 37.329
10 3:28: 4 37.18110 9: 5:57 37.73616 9:30:60 36.725
16 13:11:30 37.16210 13:12:11 37.16310 13:21:44 37.16310 13:28: 0 37.16211 3: 5: 5 37.71511 21:57:53 36.805
12 1:32:25 36.99812 4:11:48 36.81212 17:49:40 36.71312 20:24:55 37.21512 20:37:26 37.21712 20:56:33 37.214
12 20:59:59 37.22013 3:21:29 37.434
F 13 14: 8:58 36.84113 18:12:56 36.05613 19:31:58 37.24214 20:49: 6 36.913
15 2:44:15 37.33915 21:17: 5 36.80216 5:45:52 37.11617 13:32:39 37.51917 19:39:20 37.3e718 11: 4:34 37.193
18 19:48:52 37.06219 9: 1:20 37.06219 9:26: 1 37.16319 11: 0: 6 37.62919 13:21:58 37.57619 22:39:29 37.257
19 22:47:39 37.25019 23: 6:29 37.24719 23:15: 7 37.24819 23:37:26 37.25619 23:48:36 37.24219 2 :55:26 37.256
20 0:33:45 37.29920 4:23:49 37.236
)
LONGITUDE(DEG. W)
116.293116.295115.444115. 10114.530115.976
117 383117.383117.383117.383115.267115.967
116.2981 15.830115.639117.294117. 293117. 296
117.296116.664116.265115.405117.603116.190
115.008116.090117.159115.296117.751117.419
116.951116.951117.384115.077117.746115.012
1s.045115.023115.616115.036115.002115.632
115.174114.992
STANDERRORH(KM)
6.30.20.2e.97.20.4
8.20.20.10.20.46.3
'.30.86.66.26.26.2
6.30.26.30.50.50.2
6.36.36.41.60.80.1
8.20.20.26.46.26.5
1.36.32.61.95.20.8
12.76.7
STAND AZIDEPTH ERROR GAP(Km) Z(KW) (DEG)
4.58 8.9t 584.61 6.7 1172.70 2.4 1439.11 1.2 2064.06. - 296
-0.92 e.4 120
7.23 9.9st 1197.26 0.94+ 1187.14 0.6 1167.12 e.9 1183.79 1.2 141
-1.18 6.6 134
3.60 1.5 1162.74 2.2 1681.58 0.4 3368.32 6.4+ 818.66 6.5 818.65 0.4 a2
9.05 6.4 81-0.87. - 14210.16 0.4 10?3.36. - 1725.89 0.6 1346.28 e.5 94
6.76 6.7 1650.35 6.5 906.52 2.2 1044.41 11.9 121
-1.34 1.1 18s-4.13 6.3 119
6.82 6.4 450.43 6.3 937.08 6.4 1194.60 3.6 1136.28 6.4 1213.95 2.4 139
2.78 3.5 2007.17 6.5 2e7
-0.8s 1.3 200-0.33 0.8 2235.62. - 214
-0.92 6.6 224
7.00 - 2630.67 6.7 202
(
000 DEL- RUS tN12S UAGNITWVE ESTIUATES WIN RES. PH. U.S.G.S.
Ucc Ud ULh MLv ULc (KM) (SEC) CUADRANGLE
ABI 1.93ABI
UCZ 1.88ADI 1.72DDIABZ
ACIACIACIACIACZACI 1.92
ABZUCZADIAB! 2.55ABIABZ 1.95
APZ 1.65cczAEZ 1.69CcI 2.e8
ABZABZ
AC! 1.84 1.51ABI 1.69BCIOct
9DZ 1.53ACZ
ACZ 1.83ACIACZBCZ 1.76ACZ 1.22BCt
BDZADZ 1.58EOZBDzDDI 1.28ADZ
DOI 1.26ADZ 2.03
1.810.92
2.97 1.921.751.320.79
0.740.95 0.811.96 0.78i.a e.6.95
0.951.34
6.761.261.44
2.991.75 2.661.88
2.0 7.3 o.0" 15 TOPOPAN SPRING
29.0 0.65 11 CUTLER RESERVOIR15.8 0.66 11 LOWER PAHRANAGAT LAKE23.3 6.29 6 CHIEF UTN7.3 0S. 12 MERCURY
18.4 0.07 14 UEBEHEBE CRATER18.5 6.05 11 UDtEHEBE CRATER18.5 0.05 17 UBEHEBE CRATER18.4 0.67 18 UBEIHEBE CRATER7.5 6."e 9 FOSSIL PEAK
15.1 6.11 23 FRENCHMAN FLAT
1.281.296.90
2.06 2.106.68 6.86
6.821.57
1.09 1.496.77 1.661.29 1.211.43 1.80
6.99
1.76 1.83
1.381.09 6.931.49 1.23
1.59
7.6 6.65 13 TOPOPAH SPRING13.2 6.13 15 FRENCHOAAN LAKE SE15.5 6.61 5 INDIAN SPRINGS NW10.1 0.16 48 UBEHESE CRATER9.8 O." 30 LUEHEE CRATER
16.2 6.67 21 UBEHEBE CRATER
9.6 6.10 25 UBEHEBE CRATER16.0 0.07 15 BLACK WTN NW5.2 6.67 16 JACKASS FLATS
33.6 0.11 14 BLUE DIAl ND4.6 0.08 9 LAST CWNCE RANGE6.8 6.65 16 MINE MTN
7.7 S."6 13 ALAMO SE9.1 0.12 27 CANE SPRING
16. 66.0 9 BOaWIE CLAIRE SW17.8 0.19 10 UT IRISH12.5 0.19 16 SOLDIER PASS18.7 6.05 16 IBEHEBE CRATER
11.6 6.0" 31 SPRINGDALE11.7 0.08 23 SPRINGDALE18.5 O."0 17 UBEHEBE CRATER12.7 0.10 9 HIKO NE16.2 6.69 17 LIDA WASH17.6 6.22 43 ALAMO SE
15.5 0.09 7 ALAMO SE17.6 6.04 16 LOWER PAHRANACAT LAKt
1.5 17.6 6.11 7 LoER PA iAWGAT LAKS16.5 6.65 6 ALAMO SE16.3 6.11 7 LOWER PAHRANAGAT LAKF16.8 6.65 7 ALAMO SE
14.5 6.13 6 ALDUO18.9 0.1 9 DELAMAR 3 M
3.59
1.04
1.57
1.651.63
1.68
6.90
1.62
1.046.99
1.051.69
CU )

7, 1 3 1 I ~). v 3 ')1989 LOCAL HYPOCENTER SIJaAY - SG8 EARTHOUAXES
DATE - TIME LATITUE LGGITUDE(UTC) (DEG. N) (DEC. W)
APR 20 4:25:39 37.240 11505420 4:30:10 37.047 117.32720 5:19:28 37.250 115.01920 5:22:53 37.257 115.05920 5:38:57 37.240 114.99820 5:39:58 37.243 115.0tt
20 5:58:29 37.275 115.14420 6: 3: 9 37.254 115.os420 6:53:4a 37.290 115.18920 6:55:31 37.244 115.32920 7:19:30 37.243 115.02020 8:16:46 36.876 116.720
20 10:12: 1 36.735 116.29220 18: 3:57 37.263 115.11020 19:25: 0 37.244 115.00620 19:28:11 37.283 115.13120 19:32:38 37.288 115.14320 21:44: 1 37.23a 115.015
20 23:21:52 38.321 116.50121 17:11:42 37.301 115.18921 17:16:27 37.24a 115.01321 18:42:45 37.260 115.06221 20:17: 1 36.93e 117.56221 22:26:35 37.242 114.999
22 8:57:56 37.268 115.06523 4:41:33 36.773 115.35123 5:21:38 36.746 115.27223 5:31:13 37.341 118.15523 5:32: 6 37.752 117.11623 11: 3:28 37.249 115.017
23 12:55:44 37.255 115.0es24 3:49:52 37.094 115.15124 6:38:13 37.285 115.33824 15:14:55 36.845 115.92424 21:55:45 37.13a 117.33525 21:43:23 36.819 116.052
25 22:23:30 36.752 115.54025 23:27:14 36.823 116.24326 3: 8:58 37.244 115.03026 7:39:17 37.093 115.15726 12: 1:59 37.244 115.02226 13:14:29 37.246 115.019
26 15:53:35 36.840 116.17926 21: 6.21 37.251 115.025
STANERROH(KY
1.70.30.89.51.11.0
4.54.22.64.01.26.2
0.33.02.14.84.52.6
0.63.56.52.50.50.7
4.21.01.80.70.71.6
4.10.s2.50.90.20.4
0.50.42.30.3re.60.6
3.23.7
0R DEPTHS)(KM)
6.829.86
0.1511.600.070.06
6.4611.472.034.04.7.603.83
0.9010.717.008.2410.734.45.
6.807.600.029.27S.11
-0.27
9.431.213.16.8.13
13.55-e.83
5.66-e.893.94.9.220.07
-0.11
11.573.965.18
-0.854.290.56
7.66e.se
STAND AZERROR CGAZ(KM) (DEC
3.8 20Z0.4 10t0.4 2075.3 1930.7 2150.9 211
2.6 1854.6 1992.1 210- 2292.4 2094.3 101
6.2 952.3 1724.5 2125.7 1811.4 188- 212
1.4 953.8 2100.3 2093.3 1913.1 1860.9 214
4.5 1684.e 184- 2961.1 2791.2 1851.1 231
7.0 1940.5 172- 1442.2 2390.3 l1e0.5 174
2.4 1471.3 1348.5 2060.2 2004.1 2080.4 208
0.3 690.7 205
I) 000 MACNITUOE ESTI14co Ud 4Lh
SABIADZ 1.80DOZ 1. 7!
SoZ 0.94
CDZ 1.34
GolICDZ 1.10COZ 1.93 0.6480Z 1.82ECI 1.55
ABICcz 1.51JDI 1.37 1.95DDZ 1.58CDI 1.59CoZ 1.23
ABA 1.59CDI 1.46ADZ 1.4180Z 1.519DIADI 1.46
CDZ I oBDZCozADI 1.74ADI8DZ 1.46
CDI 1.51ACZ I.96CDIBDZACZ 1.51ACZ
ECIABZCDI 1.36
ACZ 1.55AZZ 1.90ADZ 1.68
AAZ 1.53 1.58ADZ 1.85
MATES
IdLv
1.2
1. e;
I 0.
I 1.0.
1.111.41
0.6$
I . 11.241. 141.201.32
0.741.34
1.70
1.011 .72.65
'.972.656.71
1.691 .081.121.766.87
1 .706.780.951 .02
1.01
1.071.30
DEL- RuS INMIN RES. PH. U.S.G.S.
liLc (KW) (SEC) QUADRANGLE
t4 14.13 0. e5 7 LO1NER PSRA)AAT LAKi;!9 5.5 0.07 16 UBEHEEE CRATER*e 17.5 0.04 9 ALAIo SE15.C 0.09 8 ALAMO SE5 18.6 6.09 8DELAMAR 3 NW3 17.7 0.04 5 LOWER PAHLVNAGAT LAKE
12.4 0.09 8 ALAMO5 15.8 0.13 6 ALAMO SE8 13.5 0.09 6 ALAMO7 16.4 0.07 7 LOWER PAHRANAGAT LAKE9 17.0 0.07 9 LOER PAHRANAGAT LAKE1 12.1 0.08 22 BARE IUN
7 2.4 0.10 19 STRIPED HILLS12.5 0.07 6 ALAMO SE18.1 0 .07 8 LOWER PAIRANACAT LAKE13.6 6.11 6 ALAMO13.8 0.09 7 ALAM17.1 0.05 6 LOWER PACRANAGAT LAKe8.8 6.14 11 RYAN
14.6 0.12 6 ALAMO17.8 6.04 8 LOWER PAWRANAGAT LAKE15.0 ."8 8 ALAMO SE19.7 0.12 18 DRY MTN18.5 I." 7 DELAMAR 3 NW
15.3 0.16 8 ALAMO SE46.2 6.17 16 DEAD HORSE RIDGE48.5 0.13 15 WI"TE SAGE FLAT23.9 0.0a 14 *.CwU0. NOT LISTED24.4 6.05 7 UV ELAK17.5 0.06 7 LOWER PAHAANAGAT LAKE15.0 6.08 7 ALAM SE8.9 6.08 12 LOWER PAHRANAT LAKJe8.6 0.09 S BADGER SPRING
15.1 0.09 7 FRENCHMAN FLAT1.5 15.4 6.09 24 U0EHEBE RATER11.1 6.05 13 CANE SPRING
25.1 0.09 10 TIM SPRING7.5 0.19 16 SKULL WtN
16.3 6.05 6 LOWER PNIRANAGAT LAKE8.8 0.05 11 LOWER PAfGANAGAT LAKE16.9 0.09 10 LOWER PAhRANArAT LAKE17.3 6.05 9 LOWER PkRANAGAT LAKE1.3 1.8 0.07 26 SKULL 4TN
17.0 0.07 16 ALAMO SE

) I ' j~ I , ) "3 I
1989 LOCAL HYPOCENTER SUMARY - SO8 EARTHOUAKES
DATE - TIME(UTC)
APR 26 21: 8:1526 21:22:5526 22: 6:1526 22: 1:4227 2:22:2427 6:35:18
27 11:10:3427 16:28:1927 20:33:4127 20:54:1927 21:58: 328 7:38:18
28 12:18:3628 13:31:1928 18: 0:1328 21:50:3429 6:20: 429 12:16: 7
29 13:36:5229 15:33:4529 22:47:4730 8:29:323e 8:54:43
IAY 1 1:33:23
1 5: 6:491 11:36:472 0:45:492 9:59:312 14:49: 33 0:30: 9
3 2:50:173 5:49: 04 4: 13:374 12:57:545 7:46:186 4:31:52
6 4:49:496 6:16:609 12:24:579 20:43:439 23:30:299 23:35: 2
16 14:12:3911 2:39:48
LATU TILDE(DEC. N)
37. 24437. 25437.24437.25537.24437.253
37.26037.14936.52736.34436.75835.768
37.43637.87237.25836.38236.77836.636
37.84836.63736,72937.36536.84937.35s
37.16036.57038.29237.27535.99837. 255
37.62337.51337.25235.89835.63737.330
36.83e37.e9935.92137.07336.63636.635
37.28937.883
LONGITUDE(DEG. W)
115.6e5115.02711i5.26115.639115.014115.646
115.051115.266114.913114.964116.251116.574
118.2e2116.621115.663114.901115.995116.254
115.482116.257115.9ee114.914115.969115.566
116.328115.975116.515116.139114.733115.639
115.677115.292115.624114.824115.892117.687
116.304116.645114,841116.526116.255116.248
115.147116.617
STANDERROR DEPTHH(KU) (KU)
1.9 4.170.7 -0.521.8 6.910.9 -1.020.9 6.218.1 8.72
3.2 11.472.4 -1.620.4 9.650.8 1.390.4 2.861.5 -1.02
2.1 2.850.2 6.072.4 6.911.3 -1.656.7 1.126.2 4.41
6.6 11.756.3 4.750.4 -0.401.0 6.890.2 c.980.2 15.44
6.3 5.686.3 3.962.5 0.370.5 -0.912.0 -0.554.8 9.47
6.4 6.696.3 -6.845.6 10.654.6 11.495.1 2.51.0.4 0.91
6.4 -0.230.5 -1.701.0 -e.716.2 5.526.3 2.696.2 2.17
16.8 6.016.3 1.61
STAND AZIERROR CAPZ(KU) (DEG)
11.2 212O-e 2031.0 2071.1 2006.8 216
10.1 198
2.8 1941.4 1642.3 1752.0 1626.4 1781.2 266
6.9 .861.1 1143.8 1921.5 1822.5 1370.9 64
1.6 l10.7 1221.3 1472.2 1980.3 ISO1.8 165
0.5 662.e 1512.3 2621.0 752.3 2643.9 222
0.8 1140.6 1226.5 2041.4 215- 2940.6 137
6.3 931.4 1120.8' 1910.7 1640.5 1936.3 288
2.6 1961.6 117
( ,
OOD12S MAGNITUDE
mca Md
COZAOZBDZ 1.71ADZ 1.49ADZ 1.27DOZ
Col
BCI 2.02ACZACZBDZ 2.24
CDI 1.60 1.78ACZsDISolE01C
ABI 1.88
APIADZ 1.44 1.27ACZ
DE1ACIACI
ABI 1.51 1.13ACZ 1.88CDZ 2.42BCz 1.68BDZ 2.26CDI
ACZ 1.09ACZ 1.64CDEC00DODACZ
ABUACZ01I 2.19
ACZADZ 1.21ADZ
DDZACZ 1.95
DEL- RUS INESTIMATES MIN RES. PH. U.S.G.S.MLh ULv MLc (KM) (SEC) QUADRANLE
1.44 1.43 18.2 0.68 8 LOER PAHRANACAT LAKC1.55 0.94 17.1 0.68 9 ALAMO SE
1.28 16.6 0.16 9 LOWER PAHWANAGAT LAKE1.36 16.3 6.65 7 ALAMO SE
1.36 1.29 17.5 0.67 9 LOWER PAHhANAGAT LAKE1.27 1.24 15.7 0.69 5 ALAMO SE
1.26 1.26 15.7 0.11 8 ALAMO SE1.58 7.3 0.66 5 DESERT HILLS NE2.33 22.3 6.09 14 ARROW CANYON1.72 25.1 0.06 7 DRY LAKE0.44 2.5 6.08 16 JACKASS FLATS1.74 34.3 0.12 13 CONFIDENCE HILLS
2.61 26.1 6.69 13 *.oQUAD. NOT LISTED.1.43 14.5 0.04 12 REVEILLE PEAK
1.31 1.06 14.8 0.06 6 ALAMO SE1.85 27.0 6.09 16 DRY LAKE1.28 13.4 6.17 17 FRENCHMN FLAT
2.18 2.16 7.7 6.88 27 STRIPED HILLS
6.87 17.7 0.68 80.94 7.4 6.08 24 STRIPED HILLS1.25 8.9 6.69 12 MERCURY
1.3 13.0 e.05 7 DELAMAR LAKE0.69 12.0 6.64 14 FRENCHUAN FLAT1.56 43.3 0.03 7GROON RANCE SE
1.66 6.0 0.16 24 AMMONIA TANKS0.72 1.10 16.1 6.e6 13 MERCURY SW
2.62 9.5 6.14 13 GEORGES CANYON RIM S1.85 1.83 2.6 13.7 0.20 26 OUARTET DOME
2.e6 2.3 8.7 0.11 12 RINCOLT RAPIDS1.47 0.77 16.2 0.6 6 ALAMO SE
0.91 12.8 0.07 7 HIKO SE1.65 1.45 18.4 0.08 12 MT IRISH
0.94 17.2 0.16 6 ALAMO SE1.82 6.7 0.13 7 BOULDER CITY1.95 2.0 39.9 0.15 11 HORSE THIEF SPRINGS
1.15 1.28 11.4 6.11 15 MRWUDER UTN
1.05 3.9 0.06 9 JACKASS FLATS1.29 11.4 0.12 18 YUCCA FLAT2.23 7.7 6.05 10 BOULDER CITY1.15 13.1 6.04 17 THIRSTY CANYON SE0.69 7.6 0.06 11 STRIPED HILLS0.45 8.3 0.62 8 SPECTER RANCE IW
0.79 0.58 13.8 0.17 6 ALAMO2.4 15.4 0.11 17 REVEILLE PEAK
C ) .'

) I . j, I 2* 9 3 2
1989 LOCAL HYPOCENTER SUMMARY - SOB EARTHMAES
DATE - TIME LATITUDE(UTC) (DEG. N)
bMY 12 17:43:49 37.82813 2:20:59 37.38614 14:39:28 36.55915 4:39:30 37.61S15 19:14:47 36.02416 18: 7: 7 37.108
18 2: 1:19 35.93918 4:29:29 38.73218 22:26:30 37.40619 6:24:15 36.89619 3:25:22 36.68319 6:48:3e 36.427
19 7:15:23 37.28619 II: 3: 3 37.21519 14:37:4 37.25426 11:19:30 37.12726 21:36:36 37.25521 19:28: 1 37.813
21 26: 6:35 36.854. 21 23:53:53 36.853
0 22 0:22:55 36.84322 15:54:46 36.85323 1:11:38 37.03623 4: 6:33 36.859
23 17: 7:21 36.34124 21:21:36 37.5e724 22:49: 5 36.66125 14:46:23 37.29325 16:28:13 37.39426 3:35:57 37.243
26 3:41:21 37.24826 3:48:15 37.32226 6:28:55 37.34126 6:43:39 37.26e26 16:13:38 37.30526 13:37:51 37.422
26 14:37:35 37.42026 14:38:24 37.42126 16:48:14 37.30726 19:57:41 37.42226 26: 3:23 37.42126 21: 8:33 37.255
27 6:2t:35 36.57227 4:21:58 37.228
LONGITUDE(OEG. W)
117.551114.533116.262116.166115.351115.684
114.823115.9001 1 4. %4116. 813116.245116.558
116.343117.293115.850116.393115.673117.711
115.947115.947115.961115. 947116.735115.938
114.848116.532115.764
16.430117.909115.008
115.013115.219117.003115.044115.189115.209
115.220115.209117.761115.209115.214118.191
115.219117.603
STANDERRORH(KI)
6.71.96.30.90.50.4
3.10.36.76.36.20.4
0.20.21.66.51.51.9
e.30.4e.56.30.36.1
7.36.61 .40.16.82.7
1.51.70.36.4
11.76.4
0.30.30.40.20.42.3
0.40.6
STANDDEPTH ERROR(Ka) Z(Ka)
0.52 0.80.45 1.54.04 3.80.93 6.71.63 4,30.0.oe 0.7
2.91 6.6-0.13 0.5-9.11 6.6-1.13 9.2
6.49 0.5-0.16 0.7
-1.39 6.48.39 6.42.97 4.89.17 1.63.00. -
-0.22 1.8
6.92 1.59.92 1.45.63 2.50.71 0.5
-0.88 0.58.-7 6.5
7.00. -10.51 2.8-1.32 e.5
1.4e 0.47.0e 5.00.00.. 1.6
-0.46 1.6-1.46 1.4-4.96 6.6-1.23 6.27.00. -6.88 1.7
0.81 6.47.19 1.7
-1.50 0.53.93 2.63.93 5.40.09 1.8
12.58 0.66.45 0.8
AZIGAP
(DEG)
18528494238177125
172129232858968
678?
1971es189237
12910089
12998159
227l16318142231235
22122411121921183
1068916512184
268
144140
CQO12S MAGNITUDE ESTIMAT
Mcc Md MLh 1
ADZ 1.70BDZ 1.91ICAADZBWUACZ
CCIABZADZ 1.85cCZ 2.02ABZ8BZ
ABZ 2.42ABZ 1.36BozABZCDIBDZ
ABI 1.85ABA8CAACZACIACI 1.74
DDI 1.85OCNBDzACI0DD 1.86CDZ 2.22
BDI 1.96IDZACZADZDOIACZ 1.62
ACZABZAczBCZ 1.80CczIDI
ACl 2.07ACI
1.912.28
1.78
1.831.85
2.11
1.66
2.581.73
DEL- RMS fNES MIN RES. PH. U.S.G.S.MLv MLc (Ka) (SEC) QWARANGLE
1.90 20.4 6.12 19 SILVER PEAK2.31 30.4 0.66 11 ELIGN NE
11.8 6.07 13 LATHOP WELLS SE6.67 6.0 o.e9 14 TIPPIPAH SPRING2.01 54.9 6.09 12 BLUE DIAMOND SE1.59 26.2 6.65 11 FALLOUT HILLS SW
2.06 6.4 0.64 8 BOULDER CITY1.02 9.6 0.07 13 MERCURY1.77 22.3 6.07 12 DELAMAR2.00 19.6 6.12 20 BULLFROG0.81 7.1 0."6 18 SPECTER RANGE MW1.37 8.6 0.16 18 RYAN
2.30 2.6 8.1 8.07 21 DEAD HORSE FLAT1.53 16.6 6.67 22 LBdEHEBE CRATER1.22 15.4 .0" 7 ALA SE6.54 10.2 6.67 14 SCRUGHAM PEAK1.83 14.6 S." 5 ALAMD SE
13.6 6.13 16 SILVER PEAK
1.71 1.8 13.6 6.16 27 FRW-CHJAN FLAT13.6 6.11 21 FRDENHAN FLAT13.6 0.12 16 FRW HMANFFLAT
1.68 1.4 13.0 6.69 26 FRlCMAN FLAT6.85 12.3 0.11 14 THIRSTY CANYON SW1.53 13.2 0.03 18 FRl4CHAAN FLAT
1.87 33.4 1.07 7 DRY LAKE1.37 29.2 0.13 13 MELLAN6.94 5.5 6.65 5 MERCURY NE6.92 12.8 6.63 16 SILENT BUTTE1.79 3.5 1.00 9 SOLDIER PASS1.22 18.0 6.10 8 LOWER PAHUANAGAT LAKE
1.58 17.8 6.08 10 LOWER PAHRANAGAT LAKE0.96 17.3 6.11 6 ALAMD1.13 23.6 6.07 13 SCOTTYS JUNCTION6.96 16.2 6.61 5 ALAMO SE1.32 15.1 6.10 5 ALAMO1.84 14.1 6.67 9 ASH SPRINGS
15.o 0.06 9 ASH SPRINGS14.1 6.65 8 ASH SPRINGS
1.66 13.2 6.11 14 SOLDIER PASS1.71 14.1 6.64 9 ASH SPRINGS1.41 1.8 14.5 0.08 8 ASH SPRINGS1.90 31.5 6.13 16 *..WAD. NOT LISTED.
2.08 8.6 0.1617 HAYFORD PEAK1.14 3.9 6.08 11 LAST CHANCE RANGE
.301.516.68
1.421 .36
1.79
1 .GO

') I i) 3 I ;' ! '3 3
1989 LOCALL HYPOCENTER SLUMARY - SG8 EARTHQUAKES
STANO AZI 000
DATE - TIME LATITUDE(LITC) (DEG. h)
MAY 27 6:34:44 37.27327 9:50:54 36.71828 0:10:51 37.87328 13:18:34 36.99428 20:15:17 37.23929 8:59:18 36.784
29 22:17:10 37.85531 2:52:21 35.90931 7: 3:18 35.926
JUN 1 7:45:42 37.2041 11:25:33 36.7851 17:22:47 37.233
2 4:45:41 36.7472 6:45:58 36.9e74 18:46:15 36.4465 28: 2: 7 36.4455 22:33: 3 35.9196 10:53:12 37.115
6 17:53:36 36.2186 22:52:37 36.7867 7:33:48 36.7067 10:11: 4 36.9357 14: 3:24 37.1518 12: 6:44 37.232
8 12: 6:42 38.0638 15:36: 7 37.1679 16:47:15 36.37910 10:27: 7 36.69412 1: 6:54 37.86612 1:59:17 36.451
12 20:23: 1 37.86514 15: 9:17 37.25114 18:56:28 35.96414 19:52: 8 36.91215 3:14:15 35.78815 16: 5:47 36.172
15 16:22:31 36.79815 18:47:22 36.76516 4:29:36 36.80816 11:23:29 36.97916 12:30:56 36.84416 14:33:22 37.611
17 7.28:26 3a.07817 23:45:47 37.267
LONGITUDE(DEC. w)
115.081
116.222116.018116.298117.602115.633
115.236116.743116.750117.573115.650114.792
117.420117.460115.758115.757115.990115.195
115.490116.085116.276116.760117.848114.969
116.885116.5871 17.046115.745116.134115.745
116.138115.226115.212115.986116.653115.558
116.080116.164115.730115.127118.269117.920
116.906116.165
SiEFHi
IIfiI4I
Ii1
4
II
I
III
'ANDtROR DEPTH:KM) (KM)
S.6 -1.251.3 0.67).3 5.59).2 2.66).3 10.861.0 6.55
1.4 5.111.7 3.26.1.e 0.12e.5 4.81e.3 0.241.5 13.52
1.1 7.148.3 7.358.2 0.188.3 0.978.8 4.451.8 2.21.
5.6 8.218.4 2.250.3 0.208.2 0.00..0.5 7.331.2 7.25
e.7 5.650.4 7.050.5 12.176.9 -e.29l.8 2.570.4 6.46
0.3 1.500.4 7.691.5 -1.54.0.4 -0.651.6 9.262.2 0.00.
8.4 0.120.2 8.072.e 1.800.7 13.078.3 10.571.7 0.00..
1.o 3.44.- 1.32
ERROR GAPZ(KM) (DEG)
1.2 2028.4 951.7 1150.4 1128.3 1782.4 264
2.0t 13a- 264
0.9 2251.6 1570.6 1833.8 252
0.6 2280.6+ 1690.4 931.2 936.2 234- 208
2.4 2890.6 1570.2 1220.3 140I .6*-$236I .8ai 228
8.6 1920.7 1780.6 1260.4 2127.6 1591.5 148
0.7 1071.0 121- 184
0.5 1258.5 265-- 221
0.4 1970.5 1252.0 2641.8 1388.4 621.6 245
- 184- 191
12S MhCNITUDE ESTIUATESUco Ud ULh ULv v
DDZABZ 1.45ACZ 1.50ABZACZCDA 1.42
DCI 2.43CDIAOZ 1.52ACI 1.82 1.84ADZBOI
8DZACZACZ 1.68 1.91ACZ 1.81CDI 1.64CDA 2.32
DDIACZA8ZACZADI8D1 2.56
CDI 2.47AC!A8!ADZ 1.66
CCIACZ
ACZ 1.47ABZCDZ 2.11ABZCDtCDZ
ADZABZBDUECI 2.27AAZ 0.92BDZ 1.46
CDA 1.84ADA 1.21
1.54 0.951.86 1.17
1.750.871.20
2.31 2.801.481.811.801.38
1.51 1.62
1.51 1.201.541.961.42? .71
1.010.96
1.99 0.530.23
1.14 1.52
2.621.03I.42
1.84 1.641.49
1.0s 1.31
1.551.34 1.47
2.031.151.161.31
0.660.621.392.100.711.51
DEL- RMS INMIN RES. PH. U.S.G.S.
iLc (KM) (SEC) QUADRANGLE
15.0 0.06 6 ALAMO SE0.8 5.2 0.07 20 SPECTER RANGE NW
14.5 0.00 11 REVEILLE PEAK7.3 0.0 18 TOPOPAN SPRING4.0 0.01 6 LAST CHANCE RANGE
18.8 0.15 11 QUARTZ PEAK SW
13.3 6.12 25 LOWER PAHRANAGAT LAKE31.4 0.16 8 CONFIDENCE HILLS
1.8 11.4 0.13 15 WINGATE WASH7.2 0.11 15 LAST CHANCE RANGE
17.5 0.07 15 QUARTZ PEAK SW29.9 0.0" 7 DELAMAR 3 NE
1.4 6.5 0.00 11 MARBLE CANYON12.4 0.00 21 TIN WTN20.7 0.o8 24 MT STIRLING20.0 #.1 21 NT STIRLING27.4 0.27 11 HORSE THIEF SPRINGS34.9 0.18 12 LOWER PAHRANACAT LAKE
14.3 0.21 7 LA MADRE YTN10.6 0.07 15 CANE SPRING4.1 0.08 17 STRIPED HILLS
19.4 0.05 13 BULLFROG19.4 0.08 12 WAUCOBA SPRING20.6 D.0" 10 DELAMAR 3 1W
43.7 0.13 19 BLACK BUTTE12.5 0.09 14 THIRSTY CANYON NE
1.3 5.2 0.10 15 EMICRANT CANYON5.8 0.12 20 INDIAN SPRINGS VA20.8 0.15 7 REVEILLE PEAK20.3 0.0 13 CHARLESTON PEAK
20.0 0.05 8 REVEILLE PEAK9.8 6.e2 7 ALAMO
41.5 0.14 10 SLOAN6.5 0.07 1i PLUTONIUL VALLEY
27.5 0.05 5 CONFIDENCE HILLS51.4 0.14 6 NMDTAIN SPRINGS
10.1 0.07 13 CANE SPRING10.0 0.05 18 SKULL MTN14.0 0.12 7 QUARTZ PEAK SW
2.3 21.7 0.17 21 MULE DEER RIDGE NO4.8 6.08 20 JACKASS FLATS
34.6 0.14 10 WAUCOBA SPRING
44.6 0.16 12 BLACK BUTTE15.3 0.06 4 OUARTET DOME
) II - - - -,_m m-l

tK-o- >
J) I 0 ! -! ) 3 4
1989 LOCAL HYPOCINTER 5
DATE - TIME LATITUDE(UTC) (DEG. N)
JUN 18 5:16: 4 35.74119 4:36:45 37.05719 13:40:38 36.54329 5:58:54 37.39320 ie: 1:13 37.21120 14:42: 1 36.201
20 20: 2: 7 37.32226 20: 3:35 37.28321 1:18:46 37.26021 1:31:30 37.26721 2:18:37 37.72821 5:39:20 37.385
22 (: 7:46 37.17422 19:36:47 37.01823 4:47:33 35.89323 14:50:29 37.38223 17:46:26 37.33323 20: 9:17 35.911
24 5:47:58 37.75925 1:57:26 38.024
9 25 3:26:10 37.19525 5:45:34 37.13525 23:23:59 36.72727 17: 4:58 36.519
27 19:25:46 37.71728 0: 3:41 37.14628 14:40:55 37.22728 23:15: 9 38.06329 1:35:57 36.70829 7:12: 1 37.245
29 7:22:22 37.24529 7:40:30 36.78829 22:37:44 36.703
JUL 1 18:49:12 37.1971 19:22:39 36.7521 19:53:38 36.748
2 5:42:31 37.2152 19: 2:50 36.5e42 22:44:58 37.0343 3:40:49 37.2463 10:40:48 37.2944 4:58:33 38.216
4 8. 7: 5 37.0094 8:24:12 37.613
LONGITUDE(DEG. W)
116.653116.025116.269115.354114.839115.397
116.354115.361115.374115.0941 15.051114.367
114.894116.372114.788115.184114.599114.805
115.254114.985117.346117.831117.264114.378
115.500117.826117.396116.892116.252115.610
115.009115.478116.290117.371116.2s5116.262
115.881116.311116.998115.027115.262116.234
115.959115.937
STANDERRORH(Km)
1.36.36.24.9e.g6.2
6.86.52.89.36.41.7
3.10.22.46.00.21.8
2.42.96.36.5e.33.3
e.21.16.70.56.32.3
1.60.56.36.26.36.5
6.56.26.21.14.50.5
0.30.8
DEPTH i(KW)
-0.241.810.46
-1.621.74
16.51
7.684.2e8.6111.638.74
15.82
14.1811.083.74.
13.60-1.251e.19
3.54.0.261.787.288.72
-1.22
7.362.62
10.090.971.580.00
6.583.56.7.61
-0.158.051.33
6.835.792.744.50
11.112.76
5.613.56.
I0.G.
5,36
34
3
5a
4
I
2t
ND AZIROR GAPOA) (DEG)
2 2399 110.3 le1.6 263.7 225.6 145
.1 281
.8 149.7 187.0 177.3 121.8 321
.7+.t 253
.4 77- 311..0 215.2 273.6 221
- 314
2.7 235D.8 99!. 9+ 2399.6 116[.2 284
1.e 1195.3 2121.9 1691.5 1971.9 771.9 211
1.6 211- 159
S.4 1950.4 1656.5 1270.5 101
0.9 1511.2 1260.6 863.6 2065. et 2413.1 194
1.3 173- 240
5aaY - SU) EARTHoUAAKES
QOm12S MAGNITUDE ESTIMATES
Uco md VLh MLvI
E'I 2.32ACZACZCDzEDI 2.14ACI 1.80
ADIcczCDZDCZABZSlDI
CDIMZ 1.88CDIDDIADZE'I 2.08
CoZ 1.95CDZACT801 1.69ABZCDI
ABZCDZACZADZ 1.96M0Z
901EDDI
CCZADZACZA8ZABZ 1.44
ACZACZ 1.61ABZ .59
'DI 1.66CDIEDZ 1.88
ACICOZ 2.03
2.35 2.301.041.02
1.44 6.91.991.95
1.061.12
1.63 6.971.61 6.92
1.611.61 1.73
1.191.801.."
1.47 1.051.552.04
2.36.44
1.351.86 1.91
6.672.21
0.761.16
1.01 1.002.21
2.31 0. 860."8
1.21 0.781.306. 681.010.691.05
1.341.281.541.36
1.38 1.111.e7
3.123 0.9!
DEL- RMS JNMIN RES. PH. U.S.G.S.
ALc (IW) (SEC) Q LUADRANLE
31.4 0.11 15 LEACH LAKE14.1 0.05 9 YUCCA FLAT13.0 0.05 20 LATHROP WELLS SE
1.5 26.9 0.14 5RSANOCK SUMMIT2.6 28.7 0.12 15 DELAmAR 3 NE
21.6 0.08 25 LA MADRE UTN
12.2 0.11 12 DEAD hORSE FLAT20.0 0.04 6 BADGER SPRING14.3 0.10 7 ALAMD SE13.7 0.13 7 ALAO SE13.2 0.07 7 HIKO NE41.0 0.05 6 -G.OUAD. NOT LISTED.
26.1 0.09 7 DELAMAR 3 1W2.3 0.07 26 BUCKOARD MESA
66.2 6.10 J BOULDER CITY12.1 0.11 e ASH SPRINGS32.6 0.01 5 ELGIN
4.7 0.05 7 BOULDER CITY
40.0 0.06 5 *.QUAD. NOT LISTED.17.4 0.15 7 SILVER KING VTN SW
1.5 14.1 0.08 13 U8D4EBE CRATER19.7 0.10 12 wAUCOSA SPRING
1.4 9.1 8.04 12 MARBLE CANYON70.1 0.12 a ...QUAD. NOT LISTED.
12.3 0.05 8 HIKO NE18.6 0.12 11 wAUCOBA SPRING14.8 0.10 a UBEHEBE CRATER
2.2 44.2 S.0" 12 BLACK BUTTE4.2 0.09 18 STRIPED HILLS
17.6 0.11 6 LOWER PANHCAT LAKX
18.0 0.05 6 LOWER PAHRANAGAT LAKE31.5 0.15 7 DOG BONE LAKE SOUTH4.6 0.02 11 STRIPED HILLS15.3 0.07 13 UBEHEBE CRATER1.6 0.08 14 JACKASS FLATS1.1 0.12 17 STRIPED HILLS
12.2 0.11 12 JANGLE RIDGE15.9 0.06 20 LATHROP WELLS SE6.7 0.08 22 SPRINGDALE
16.6 6.08 9 LONER PAHRANAGAT LAKE
15.4 0.11 6 BADGER SPRING717.6 0." 10 TWIN SPRINGS SLOUGH
z 12.0 0. 22 PAIUTE RIDGE39.2 6.06 6 PAIUTE RIDGE
1.29
1.61
1.171.346.951 .69
1.241 .20

) I J i I ; 9 '3 *a
1989 LOCAL HYPOCENTER SUILARY - SGB EARTHQUAKES
DATE - TIME LATITUDE(UTC) (DEG. N)
JUL 4 8:28:13 37.0e55 13:50:22 37.1216 0: 5: 3 37.3078 3:19:48 37.2448 8:34:18 37.2718 8:39:40 37.249
9 3:42:24 37.33711 3:54:29 37.29011 15:41:35 38.1531 18:46:10 36.70512 6:30:31 35.93412 1:45:34 37.288
12 10:38: 6 37.55912 22:18:49 38.34913 0:25:58 38.94314 0:40:15 38.86314 3:37:44 37.04814 8:35: 6 37.427
15 0:13:49 37.442~ 15 9:51:50 37.595~ 16 5:19:53 37.466
17 0: 9:45 37.51217 1: 3:29 37.20017 15:56:19 37.252
18 22:56:26 38.76219 9:21:11 36.97019 18:24:16 37.17819 20:28:24 37.29020 4: 9:19 36.77120 l0: 2: 6 36.717
20 23:39:11 31.85220 23:51:55 37.15321 0:55: 5 36.44221 12:54:30 38.77821 13:34:30 36.77221 13:35:11 38.772
21 22:24:41 37.14921 23: 1:40 36.77322 11:10:38 37.25522 13: 4:48 37.47222 13:27: 3 37.47322 13t27:40 37.473
22 14:47:22 37.47322 20:47:41 37.269
LONG I TUDE(DEG. w)
115.968116.354116.365114.997115.083115.009
116.363¶ 16.#13117.904116.196118.918116.483
115.743117.325116.846117.776116.466116.419
115.312114.740117.574115.108117.399115.041
117.108117.517117.242116.406115.816115.931
115.940117.395116.996116.254116.257116.262
117.821116.248114.991117.260117.253117.254
117.253116.374
STANDERRORH(KM)
0.310.25.30.71.90.5
2.10.53.40.60.80.3
0.72.66.5S.60.26.2
0.52.06.4e.30.2e.6
2.20.50.21.20.50.9
6.3e.30.40.30.60.7
0.50.32.76.30.20.2
0.20.5
STAND AZIDEPTH ERROR GAP
(K") Z(KU) (DEG)
4.29 1.9 132-e.47* - 3306.13 6.1 255
-1.40 0.6 2140.45 1.3 1S8
-e.31 0.4 209
9.01 1.4 267-0.21 0.6 2263.31. - 3186.36 1.8 1406.95 6.7 2885.65 1.0 90
e.55 1.5 972.12 3.4 2495.96 3,.3 2837.ee 4.2 2459.27 0.7 Ise0.96 0.3 57
0.00* 1.0 944.31 2.0 2261.49 1.8 804.38 2.7 133
-4.18 6.3 I1I0.39 6.4 20e
3.66 1.3 2761.45 1.3 1749.74 0.4 1264.58 3.6 1746.24 0.9 1736.84 1.4 228
9.74 6.6 1952.91 2.2 110
12.16 e.7 1174.62 1.9 890.60 0.8 742.80 1.4 72
5.46 2.0 2341.32 0.9 5s16.36 4.5 2116.86 6.4 1330.55 0.3 910.56 0.4 91
6.72 6.4 315.76 0.7 188
COO12S MAGNITUDE
Uco Md
ACZ 1.18DDA 6.89DDUADZ
ECI 1.16ADI 1.36 6.89
S0I 1.46 1.26ADZ 1.35CDA 1.91ACI 0.99 1.05ADI 1.28 1.38ABZ 1.64 1.53
BBZ 1.17 1.29CDI 2.07 2.03DOI 1.75E0I 1.28 1.34ABl 1.08ACZ 1.86 1.64
ACZ 1.83 2.64DOA 1.68ABI 1.61ECZ 1.62 1.64ACZ 1.41ADZ 1.75 1.62
801 2.21ACZ 1.50 1.42A81 1.11BCZ l.3sACA 1.6aADA ,Z
ADZ 1.44OCZ 1.52 1.44ABI 1.79 1.5'ACA 2.2.BAA 1.21MA 1.2;
0DI 1.59 1.31AAZ 2.16 2.1:CDI 1.2:ACZ 1.12 1.41ACZ 1.16 1.3.ACZ 1.6
ACZ 1.22 1.6ADZ 1.06 1.3
I
I
II
I
I
ESTIMATESULh ULv 1w
1.12
1.276.90 1.081.30 1.26
0.89
1.52 1.181.16
0.721.101.29
1.242.35
1.720.801.65
2.03
1.25 1.871.49
1.21 1.171.77 1.26
2.306.92 1.251.24 1.16
DEL- R8S INMIN RES. PH. U.S.G.S.
iLc (KU) (SEC) QUADRANGLE
11.2 0.10 21 PAIUTE RIDGE10.0 0.21 7 BUCKBOARD MESA10.9 0.11 9 DEAD HORSE FLAT18.7 0.09 6 DELAMAR 3 NO14.6 0.11 7 ALAMO SE17.8 0.0 5 LOWER PARANAGAT LAKf
14.1 0.08 8 DEAD HORSE FLAT1.3 11.6 0.60 16 SILENT BUTTE
49.4 0.20 0 ROCK HILL8.0 0.11 9 SPECTER RANGE NW
1.2 5.6 0.05 7 WINGATE WASH10.8 6.09 25 SILENT BUTTE
9.6 0.17 11 TEUPIUTE ITN72.2 0.19 13 SAN ANTONIA RANCH
139.2 0.16 9 ... OUAD. NOT LISTED.33.8 0.08 13 WAUCOBA WASH
0.9 7.2 0.05 14 TIMBER UTN24.6 0.08 28 SILENT CANYON NW
1.9 23.5 0.09 12 HANCOCK SUUMIT1.2 0.51 5 CHOKECHERRY UTN7.2 0.13 16 MAGRUDER HTN
12.8 0.05 9 HIKO SE16.8 0.03 10 UBEHE8E CRATER15.9 0.06 10 ALAMO SE
120.3 0.07 8 .*.OUAD. NOT LISTED.15.5 0.10 11 DRY MTN13.7 0.63 7 BONNIE CLAIRE NW11.2 0.15 16 SILENT BUTTE8.6 0.e8 15 FRENc4CHAN LAKE SE6.8 0.16 11 MERCURY
13.5 e.05 14 FRENCHUAN FLAT17.6 0.08 16 UBEHEBE CRATER10.8 0.10 23 FURNACE CREEK11.1 0.06 15 JACKASSFFLATS3.5 0.18 19 JACKASSFFLATS3.4 0.12 9 JACKASSFFLATS
18.1 0.08 13 WA5UCOBA SPRING4.6 0.11 30 SKULL UTN
17.7 0.11 6 DELAMAR LAKE9.0 0.6 1 WUNT JACKSON
19.1 6.05 15 MOUNT JACKSON19.2 0.05 12 WOUNT JACKSON
19.1 0.05 12 WMT JACKSON7.6 0.08 16 DEAD HORSE FLAT
I
5
I
2
636
22
1.43
0.871.191.65
2.631.481.531 .551.60
1.27
0.971.391.591.48
1.241.05
( ) *Ix

&W1
-
9) I 0 3 I1989 LOCAL HYPOCENTER
2 9 '3 6SUMA.RY - S0S EARTHQUAKES
12S MAGNITUDE ESTIMATESUc5 Wd MLh MLvDATE - TIUE LATITUDE
(UTC) (DEG. N)
JUL 23 2:30:38 37.55223 21:50:60 36.54624 1S: 2:37 37.29424 16: 6:57 37.25324 26: 4:55 37.01825 12:32:39 37.231
26 0:52:31 37.25827 3:23:15 36.70027 4:16:39 37.02527 4:16:40 37.01727 11:46:53 36.65627 13:56:50 37.233
29 3:32:55 36.69529 1I: 1:29 37.28829 20:38:39 37.20629 23:36:31 36.66830 8:10:26 37.191
AUG 1 9:15:52 37.828
3 16:45:24 37.4213 18:44:44 37.2623 18:45:17 37.2843 19:11:47 37.0063 21: 8: 2 36.7734 2:12:50 36.772
4 4: 5:21 36.7774 5:50: 5 36.7714 9:26: 3 36.7764 19: 5: 6 37.2024 23:16:22 37.0054 23:51:43 36.776
5 2:39:16 37.2436 16:16:33 36.7696 22:26:38 36.7757 3:17: 6 37.2757 7:39:51 37.2977 7:43:16 37.037
7 8:48:15 37.1657 15:22:19 37.3118 15:53: 8 37.2629 6:14:14 37.45716 13:21:49 37.25910 14: 6:33 35.721
11 4:32:46 37.15011 517: 9 37.303
LONG I TUDE(DEG. W)
116.071116.357115.487116.649117.539117.683
115.632116 .30616.379
116.575
116.655
116.296115.307117.33116.40611 7.795115.156
116.580117.585117.568115.968116.261116.261
115.644116.264116.258116.724115.958116.266
115.025115.262116.252116.462116.510116.589
116.394116.494115.671114.586115. 047117.648
117.828116.448
STANDERRORH(KW)
e.80.22.5'.3e.b0.4
0.90.60.80.2e.50.5
6.2
0.30.40.61.2
0.40.7e.36.30.46.4
6.39.48.44.80.56.5
5.20.46.52.61.91 .'I
2.16.82.50.84.62.1
6.60.2
DEPTH(m)
1.809.79-1.30
6.268.817.54
-0.566.82
16.8416.627.327.67
6.13
6.336.650.684.15
-0.3510.42-1.416.141.823.74
-1 233.842.317.60.e.s06.24
4.84.3.691.488.293.16e2.42
2.674.959.029.686.332.06
5.87I.33
STANDERRORZ (KW) (
6.60.91.26.22.60.5
1.66.71.40.31.46.9
0.2
6.90.86.75.2
12.61.20.30.90.90.81
e.s0.8e.7
e.71.2
1.71.62.8
0.5
6.62.52.41.78.54.8
1.76.7
AZIGAPDEG)
10596
231112172134
203151116
729877
154279
8813119dt199
13215783
1327369
131728e
127156116
2081l176
30e346360
143225187301196309
210139
MLc
CCZ 1ABt 1.37 1CDUABZ 1.36 1BCIABZ 1,16 1
ADZ 1.72 1ACZ 1.17 1A8ZMI 1.78 1AtZ 1.13 1AAII
ACZ 1ADZ 1AS! 2.12 1AS! 1.35 1ADI 1.36 1COz
CCAAC!ASZ 1.24ABZ 1.61MZ 1.33MI 0.87
ACZ 1.54AAI 1.22MZ 1.04D6OACZA81
DDZ 1.56ABZAZBOACDAWDA
CCA
BDZ
ADICDZBDI
ADIACZ 1.82
.56 1.85
.36 6.971.16
.54 0.87
.33 0.96 1.34
.32 1.11 1.34
.51 1.39
.11 6.590.91
.18 1.26
.36 1.05.41 1.23
.16 6.54
.14 1.26
.88 2.32 2.351.06 1.051.56 1.52
1.03
1.891.27 1.111.53 1.631.66 1.561.23 1.331.e0 6.71 0.96
1,4J ).20 1.381.12 0.421.04 0.82
0.766.636.60
1.48 1.181.10 0.26
6.631.431.391.40
1.686.56
1.44 6.601.38 1.46
1.08 1.05 6.961.82
1.74 1.57 1.341.32 1.17
DEL- R NMIN RES. PH. U.S.G.S.(K3) (SEC) LUADRANGLE
25.4 0.17 I1 BELTED PEAK11.2 0.06 17 LATHROP WELLS SE11.5 0.65 5 SILEWT BUTTE4.4 0.o5 11 BLACK 11N SW
17.2 0.66 6 LAST CHANCE RANGE3.8 0.07 13 LAST CHANCE RANGE
16.5 0.07 8 ALAMO SE6 .8 0.8 14 STRIPED HILLS1.5 0.03 6 TIMBER 11TN
5 2.2 0.06 25 TIWBER WM10.8 0.e8 13 STOVEPIPE WELLS5.7 0.12 11 OAK SPRING
6.8 0.04 11 STRIPED HILLS16.3 0.01 3 BADGER SPRING12.5 0.07 19 USEhEB CRATER6.6 0.07 13 LATI~O WELLS NW
13.9 0.00 13 WAUCOBA SPRING9.7 6.08 7 SEAMAN WASH
15.4 0.09 6 BLACK ITN NE6.4 0.68 8 MACRUDER MTN9.0 0.04 10 MAGRUDER MTN
.7 11.2 0.10 21 PAIUTE RIDGE
.2 3.5 0.11 17 JACKASS FLATS3.5 0.12 19 JACKASS FLATS
17.5 0.06 18 GtUARTZ PEAK SW3.2 0.12 15 JACKASS FLATS3.3 0.11 13 JACKASS FLATS
12.4 0.76 9 THIRSTY CANYON NW22.2 6.12 12 PAIUTE RIDGE3.9 0.10 12 JACKASS FLATS
16.6 0.14 6 LOER PAHRANAGAT LAKE3.0 .608 10 JACKASS FLATS4.6 09.6 13 JACKASS FLATS
14.0 .06 8 SILENT BUTTE31.1 0.67 7 TRAIL RIDGE
6.2 1.31 7 TIMSER 1TN
8.3 0.19 8 SCRUGHAM PEAK13.2 0.10 11 SILENT BUTTE14.6 0.04 6 ALAMO SE21.3 6.03 6 ELIGN NE15.9 0.09 5 ALAM SE75.5 0.19 11 RIDGECREST
17.9 6.09 14 WAUCOBA SPRING.3 14.8 0.07 21 SILENT BUTTE
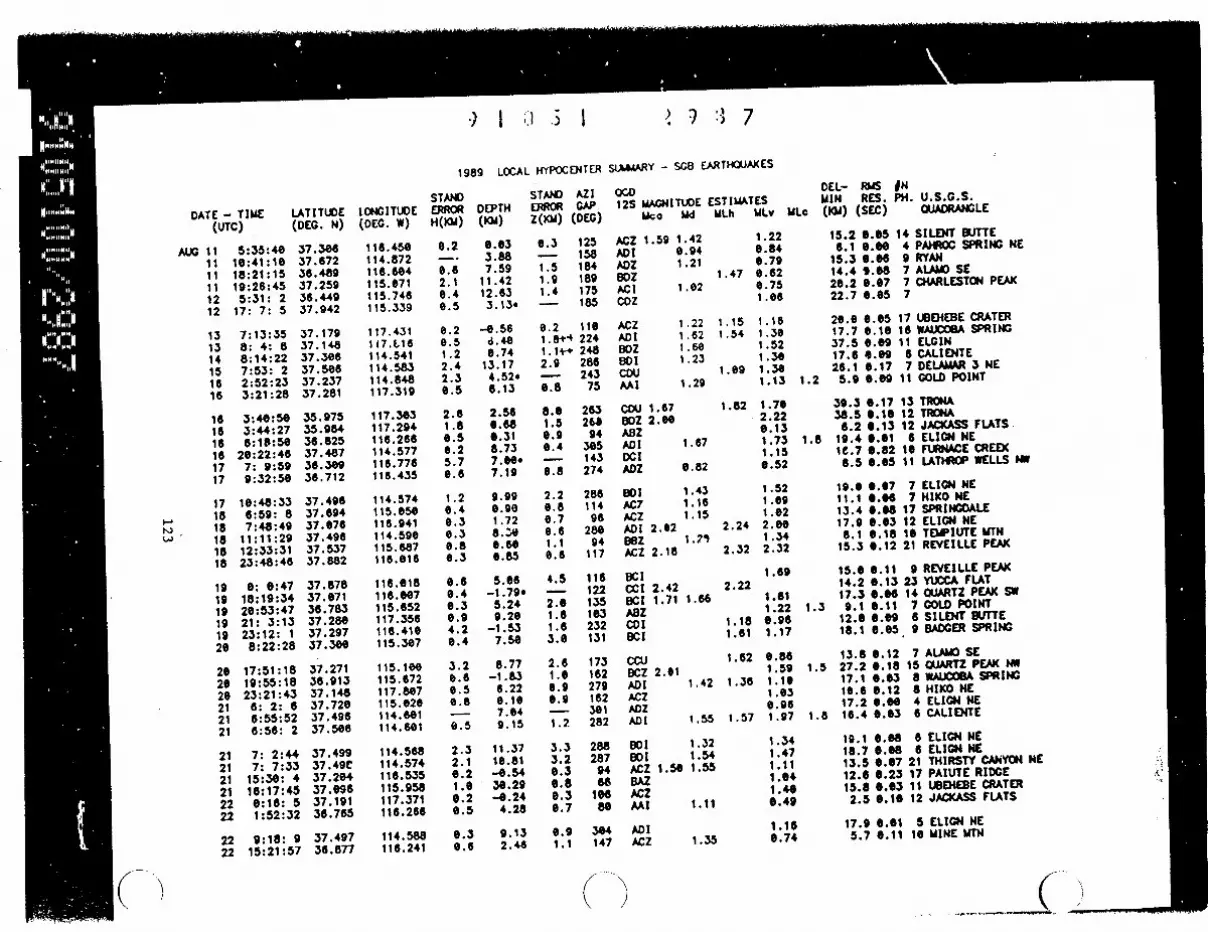
) I J1 .3 I , ) :I 7
1989 LOCAL HYPOCENTER SLARY - SCO EARTHOUAKES
DATE - TIME LA(UTC) (D
AUG 11 5:35:40 311 10:41:10 311 18:21:15 311 19:26:45 J12 5:31: 2 312 17: 7: 5 Z
13 7:13:35 J13 8: 4: 814 8:14:2215 7:53: 216 2:52:2316 3:21:28
1e 3:40:5016 3:44:271e 6:18:501e 20:22:4617 7: 9:5917 9:32:50
17 10:48:3316 6:59: 818 7:48:49
i 18 11:11:2918 12:33:3118 23:48:46
19 0: 0:4719 18:19:3419 20:53:4719 21: 3:1319 23:12: 120 8:22:28
20 17:51:1820 19:55:1820 23:21:4321 6: 2: 621 6:55:5221 6:56: 2
21 7: 2:4421 7: 7:3321 15:30: 421 16:17:4522 0:16: 522 1;52:32
22 9:18: 922 15:21:57
TITUDEEG. N)
7.3087.672.6.489.7.25946.4497.942
17.17917.14837.30637.50s57.23737.281
35.975"5.95436.82537.48736.30936.712
37.49637.69437.07637.49637.53737.882
37.67837.07136.78337.28037.29737.300
37.27136.91337.14837.72037.49637.506
37.49937.49C37.20437.09637.19136.765
37.49736.877
LONGITUDE(DEG. W)
116.450114.872116.604115.071115.746115.339
117.431117.616114.541114.583114.848117.319
117.303117.294116,266114.577116.776116.435
114.574115.050116.941114.590115.6871 le.016
116.61811 O. 07115.652117.356116.410115.307
115.100115.672117.807115.020114.601114.601
114.568114.574116.535115.958117.371116.266
114.588116.241
STAND
H(KM)
0.2
0.62.10.40.5
0.20.51.22.42.30.5
2.61.80.5e.25.70.6
1.20.40.30.30.80.3
0.60.40.30.94.20.4
3.20.60.50.8
9.5
2.32.10.21.00.20.5
O.ao.e
DEPTH(KM)
3.887.5911.4212.633.13*
-0.56Ji. 40
0.7413.174.52.6.13
2.560.600.318.737.0e.7.19
9.99o.se1.728.0.600.8s
5.06-1.79*
5.249.20
-1.537.50
8.77-1.83
6.220.107.049.15
11.3710.81-0.5430.29-0.24
4.28
9.131 2.46
STAND AZIERROR GAPZ(KM) (DEG)
0.3 125- 1581.5 1841.9 1891.4 175- 185
0.2 110.¶s+4 224
1.1-i 2482.9 286- 243
0.8 75
8.o 2631.5 2610.9 940.4 385- 143
0.8 274
2.2 2860.8 1140.7 960.6 2801.1 940.6 117
4.5 11e- 122
2.0 1351.6 1031.6 2323.0 131
2.6 1731.0 1628.9 2790.9 162- 3011.2 282
3.3 2883.2 2870,3 940.8 68e.3 1080.7 80
0.9 3041.1 147
12S MAGNITUDE ESTIMATESMca Md MLh MLv MLc
ACZ 1.59 1.42ADI 0.94ADZ 1.21EtDZ 1.47ACI 1.02
Coz
ACZ 1.22 1.15AOI 1.62 1.54EOZ 1.60
tDI 1.23COU 1.09AAI 1.29
COU 1.67 1.82EDZ 2.00A8ZAol 1.67DCIADZ 0.82
001 1.43AC7 1.16ACZ 1.15ADI 2.02 2.24
ACZ 2.18 2.32
OCICCI 2.42 2.22DCI 1.71 1.66A8ZCDI 1.18aCI 1.61
cCU 1.52BCZ 2.01ADI 1.42 1.36ACZADZ
AOI 1.55 1.57
E01 1.32tDI 1.54
ACZ 1.50 1.55BAZ
iAC2AAI 1.11
ADIACZ 1.35
1.220.84
0.790.620.751.06
1.161.301 .521.301.301.13
1.702.220.131.731.150.52
1.52I .091.022.0e1.342.32
1 .69
1.611.220.961.17
0.e861.591.101.030.961.97
1.341.471.111.041.400.49
1.160.74
DEL- RMS fNMIN RES. PH. U.S.G.S.(KU) (SEC) QUADRANGLE
15.2 0.05 14 SILEIT BUTTE6.1 0.00 4 PAROc SPRING NE
15.3 0.0e 9 RYAN14.4 p.88 7 ALMO SC20.2 0.07 7 CHARLESTON PEAK22.7 0.05 7
20.0 0.05 17 UBeEHEE CRATER17.7 0.10 16 We COBA SPRING37.5 0.09 11 ELGIN17.6 9.09 6 CALIENTE26.1 0.17 7 DELAMAR 3 NE
2 5.9 0.es 11 GOLD POINT
39.3 0.17 13 TRONA38.5 0.10 12 TROkA6.2 6.13 12 JACKASS FLATS
8 19.4 6.01 6 ELIGN NE16.7 0.82 10 FURNACE CREEK6.5 6.05 11 LATW40P WELLS NW
19.0 0.07 7 ELIGN NE11.1 0.06 7 HIKO NE13.4 0.08 17 SPRINGDALE17.9 0.93 12 ELIGN NE8.1 0.18 10 TEUPIUTE MTN
15.3 0.12 21 REVEILLE PEAK
15.0 0.11 9 REVEILLE PEAK14.2 0.13 23 YUCCA FLAT17.3 0.00 14 QUARTZ PEAK SW
.3 9.1 0.11 7 GOLD POINT12.0 0.09 6 SILENT BUTTE18.1 0.es 9 BADGER SPRING
13.8 0.12 7 ALAMO SE.5 27.2 0.18 15 QLUARTZ PEAK 3M
17.1 0.03 8 wAUCOBA SPRING10.6 0.12 8 HIKO NE17.2 o6.0 4 ELIGN NE
1.8 16.4 0.03 6 CALIENTE
19.1 0.08 6 ELIGN NE18.7 0.08 6 ELIGN NE13.5 0.07 21 THIRSTY CANYON NE12.6 0.23 17 PAIUTE RIDGE15.8 0.03 I1 UBEHEBE CRATER2.5 0.10 12 JACKASS FLATS
17.9 0.01 5 ELIGN NE5.7 0.11 10 MINE MTN
It,
I) ( ~~~1I

U
) I :j ;) I ' ) '3 31989 LOCAL HYPOCENTER SAARY - SG8 EARTHQUAKES
DATE - TIME L(UTC) (c
AUG 22 15:54:33Z22 15:54:44Z23 3:40:5823 4: 6:3123 4: 6:3623 11:58:23
23 14:51: 523 17:15:3924 7:55:5424 20: 3:4525 21:13: 626 21: 7:47
27 6: 4: 127 17:22: 127 18:47:4628 6:12:5928 13:14:3428 15:47:59
29 0:24:5729 8: 6:5729 16:29:5629 17:30:1230 7:41:5130 16:37: 9
30 17:17:1130 18:21:2430 20:40:4931 12:43:6031 17:30:55
SEP 1 2: 4:14
13: 0:342 4:11: 12 4:13:412 4:57:342 4:58: 32 5:10:44
2 5:16:382 8:27:263 0:36: 83 9:10: 23 10: 4:283 14:57:28
4 21:20:465 p0:12:27
6TITUDEDEG. N)
18.36217.74417.00715.80016.11327.142
37.81436.45037.34630.71837.52537.892
37.22837.02236.87336.57335.75537 .328
36.75836.61737.28836.93636.99136.451
36.18837.10237.14438.56435.70636.208
37.24637.24837.24737.25436.70137.245
37.25437.22035.45238.40137. 6 338.665
36.03237.235
LONGI TUDE(DEC. W)
116.497116.383117.662116.567116.482117.821
115.525117.044115.6803116.124117.223118.011
116.517116.429117.320115.631115.951117.238
115.952117.898114.801116.ss5115.273114.509
116.536116.162116.180115.597118.024115.403
115. 023115. 025115.018115.052115.576115.029
115.040114.985115.846116.329115.139116.461
115.008114.908
STANDERRORH(KI)
4.34.20.61.74.30.6
6.10.60.90.46.7
1e.5
6.30.26.40.40.36.3
0.32.70.96.51.60.9
5.20.30.91.82.40.4
1.51.11.01.72.73 .4
3.41.50.40.30.62.8
9.20.3
DEPTH EJ(KM) Zl
6.17.6.00..5.033.939.765.65
2.8917.630.21
-1.160.26
-1.02
2.406.90
16.806.986.905.00
0.3011.608.96
-1.812.82.7.00
11.93.5.582.54
-1.025.04
-1.79
1 .Se6.374.44
10.15-0.15
5.61.
6.1212.330.00..7.361.09
-1.02
11.95.-0.64
S,;TARM(O
3'-6 I
2'.5,1S
20
9
aa
II
2I
AND AZIROR CAP3K) (DEG)
- 284. 177.1 196.3 267AF 209
.' 211
.7 143
.1 97
.5 164.8 128.2 108.8 301
.7 108.4 10
1.7 95i.6 123i.9 1251.3 69
1.7 125- 2921.1 2401.7 115- 1961.6 225
- 1681.3t 1461.7 1501.6 2312.5 297O.5 144
2.6 2072.4 2063.8 2081.9 1962.5 240- 206
b.9 2802.3 2250.7 950.9 902.4 1142.5 268
- 3201.2 175
I ND ESTIMATES12S MAGNITUDE SITE
Uco Md MLh MLv ILc
CDI 1.99DCZ 1.86CDI 1.47801DOIADI 1.35 1.65
ADZ 1.39ABI 1.85 1.76EBCZ
ACZ
D0Z 1.66
ACZ 1.72 1.54ABz 1.37ABI 1.24ACZ 2.00ACZ 1.14AAI 1.44
ACZ 2.03CDI3DU 1.83ACU 1.12CDA 2.15ADI 2.16
DCIACI 1.53ACZODZ
ACZ 1.97 1.84
EOZB0Z 1.718D2 1.878DZ 1.74CDICDU
CDUOD[ACZ 1.36ABt 1-418CZ 1.70CDZ
ACI 2.75
2.261.42
1.74 1.571.481.22
1.61 1.53
1.321.63
1.490.930.981.55
1.530.651.242.021.651,551 .261.48
2.02 1.941. 19
2.78 2.10
o .gg
1.21
0.981.442.771.79
1 .661.421.541.611.44
1 .83 0.29
1.4-4 1. .27
DEL- MS #NMIN RES. PH. U.S.O.S.(Kki) (SEC) QUADRANGLE
69.5 0.15 8 TYBO0.2 4.50 8 QUARTZITE MTN
25.1 0.11 14 LAST CHANCE RANGE43.8 0.17 12 CONFIDENCE HILLS16a .99 12 EAGLE MTN18.5 0.09 17 WAUCOBA SPRING
19.5 0.61 5 WORTHINGTON MTNS8.1 0.13 21 EMIGRANT CANYON
15.1 0.12 7 GROOM RANGE SE13.5 0.08 11 CMP DESERT ROCK24.2 0.13 8 GOLDFIELD26.9 0.11 5 *..QUAD. NOT LISTED*
5 13.0 0.07 22 THIRSTY CANYON NE4.0 0.04 17 TIMBER UTN
10.7 0.11 19 TIN UTN21.6 0.10 16 INDIAN SPRINGS10.5 0.07 13 FRENCHAN FLAT3.5 0.08 21 SCOTTYS JUNCTION SW
10.6 e8.87 16 FRENCHMAN FLAT46.8 0.08 5 NEW YORK BUTTE25.8 0.88 10 GREGERSON BASIN14.3 0.12 13 BULLFROG50.2 6.22 17 BURRO BASIN58.6 0.07 10 MUDDY PEAK
12.1 1.38 6 FUNERAL PEAK9.3 0.07 11 TIPPIPAH SPRING
12.6 0.10 9 RAINIER MESA23.9 0.13 11 INOIAN SPRINGS SE
108.4 0.20 19 ***OUAD. NOT LISTED.20.8 6.12 19 LA MADRE MTN
17.0 0.67 7 LONER PAHIANAGAT LAKE16.8 0.65 8 LOWER PAHRANAGAT LAKE17.4 0.04 9 LONER PAHRANAGAT LAKE15.3 0.65 6 ALAM SE21.0 0,13 8 HEAVENS WELL16.4 0.e7 5 LOWER PAHRANAGAT LAK
16.2 0.08 5 ALAMO SE18.9 0.0 6DELAMAR 3 NW
23.2 0.09 15 MT STIRLING13.2 0.05 11 ASH MEADOWS12.4 0.09 9 FOSSIL PEAK48.00 10 8 -..QUAD. NOT LISTED.
61.2 0.22 5 LAS VEGAS SE22.9 0.e7 16 DELAMAIR 3 NW
1.271.381.50
1.892.29
1.652.39
L �1-

) I ) 3 I
1989 LOCAL HYPOCENTER
DATE - TIME(UTC)
SEP 5 22:5s:218 7:30:256 18:13:216 18:19:476 18:54: 97 5:22:26
7 11: 6:408 3:29:188 15:48:398 21: 7: 59 e: 1: 99 8:34:43
9 13: 5:179 18: 3:199 26:55:529 23:53:43
10 5:58:1112 3:17:28
12 12:24:5512 22:30:4213 3: 5:28
L- 13 11:53:4614 16: 7: 815 9:44: 5
16 11: 5:3216 17:12:3816 18:51:4317 1:26:5417 21:35:2718 1:37: 7
18 9:17:6618 9:28:1418 19:43: 418 22:16:5319 12:28:1026 6:42:52
21 6:59:5821 11:36:4421 12:15:2021 15:11: 621 21:17: 821 23:30:13
22 5:29:4822 7:12: 4
LATITUDE(DEC. N)
37.26137.02437.20637.19037.20337.233
37.67137.22736.74537.51138.17836.747
37.27136.93837.12637.26436.02337.333
37.35936.74337.24638.44636.64836.454
37.24137.19136.59036.42438. 39938.379
37.17635.78737.61035.59137.25037.285
37.31537.41938.62137.32436.99637.149
36.48337.665
LONGITUDE(OEG. W)
114.973115.571116.447116.455116.442114.928
116.261114.937116.047116.530116.689116.040
114.571116.757117. 529114.539114.772118.263
114.867117.586116.360115.388116.340116.988
115.621118.258117.094117.217116.198116.203
117.377117. 130115.129117. 606117.634117.572
115.634114.320116.250115.201117.863117.396
116.307116.950
STANDERROR DEPTHH(KU) (KM)
- 8.34e.G 1.780.3 8.440.2 0.320.7 10.021.0 -e.68
0.3 9.010.5 -0.48e.6 0.610.2 -e.420.4 2.670.5 0.96
1.1 14.450.3 0.21e.5 9.520.9 9.676.8 0.22.6.0 2.21.
0.3 5.861.5 5.320.6 6.151.3 -0.770.4 4.386.6 12.69
0.4 -1.882.9 2.976.3 1.6es0.4 6.362.2 -1.23.0.9 3.24.
0.4 7.563.5 -1.024.2 4.0.6.5 5.910.5 1.440.3 -1.26
2.6 11.616.5 3.22.e.3 4.536.4 6.671.5 1.e28.6 1.68
6.1 8.95e.1 --0.14
STANDERRORZ(KM)
4.78.60.41.31.0
6.66.56.66.62.30.7
3.16.41.42.84-j
1.38.46.47.46.41.1
6.610.11.3t46.4
1.42.8
2.36.80.3
2.9
1.36.65.11.9
0.7 10.2
AZIGAP(DEC)
213145146102145230
9123614774
195188
28e162187284224294
211223178296164
73
145265109
09
258244
113312161302
9981
18133015s120229127
133112
SULIMARY - SG8 EARTHQUAKES
000125 MAGNITUDE ESTIMATES
Mco Md ULh MLv
ADIECZACZACZACIADZ 1.71
ABZADI 1.61ACZACZ 2.23BozADZ
D0IACZADID0I 1.84
DOI 1.84DOI
ADICDIACI 1.16DU 1.91ADZGAI 1.88
ACZ 1.64GDIABI 1.74ADZCDZ 2.49CDI 2.34
ACICDZ 1.73CDUDDIABZ 1.99ABZ
COI 1.94ColACZACZ 1.75CDZBCI
ABIACZ
0.951.61 1.661.32 1.14
1.921.33 1.30 0.99
1.46
1.62 0.621.72 1.29
0.99 *.862.28 2.19 1.961.73 1.58
6.52
1.45 1.400.56
1.04 1.16 1.151.82 2.04
1.791.91 1.96
0.91 1.e01.27 1.36
1.001.806.89
1.44 1.32
1.76 1.622.04 2.061.72 1.83
1.40
2.61
1.21 0.961.77 1.91
1.142.64
2.261.32
1.561 .290.71
1.82 1.341.35
1.33 0.63 1.14
0.411.60 1.21 1.23
DEL- RMS fNMIN RES. PH. U.S.G.S.
MLc (KM) (SEC) QUADRANGLE
1.4 17.6 0.02 4 DELAMAR LAKE37.7 0.15 13 SOUTHEASTERN MINE10.9 0.05 13 SCRUCHAM PEAK11.9 0.07 15 SCRUGHAM PEAK10.5 0.16 11 SCRUGHAM PEAK
1.8 22.1 0.65 7 DELAI 3 MN
4.4 0.07 14 TIPPIPAH SPRING23.8 6.62 5 DELAMAR 3 MN12.1 6.66 9 CAMP DESERT ROCK23.7 6.68 26 MELLAN31.1 6.66 9 ECH0 CANYON11.9 0.06 16 CAW DESERT ROCK
4e.6 0.63 6 ELGIN22.3 6.65 16 BULLFROG15.7 6.68 9 LAST CHANCE RANGE41.9 6.65 12 ELGIN11.3 6.6" 8 BOULDER BEACH33.2 6.16 9 .. OUAD. NOT LISTED.
17.1 0.62 7 GREGERSON BASIN17.5 6.18 16 ULHEBE PEAK4.8 0.08 1e AMMONIA TAWCS
53.9 6.13 7 FOREST HOME6.3 S.0 16 STRIPED HILLS
12.2 6.16 19 FURNACE CREEK
16.9 6.68 10 FALLOUT HILLS NE40.5 6.12 11 *e.OUAD. NOT LISTED.
1.8 17.6 6.11 21 STOEPIPE WELLS16.9 0.06 15 EMIGRANT CANYON27.8 0.13 7 -.. UAD. NOT LISTED*26.1 0.11 15 *.*QUAD. NOT LISTED.
17.5 6.08 1 UBIEHEBE CRATER30.8 6.04 16 MANLY PEAK18.3 0.11 5 LOWER PAHRACAOAT LAKE78.6 0.15 15 RIDGECREST
2.2 2.2 0.12 15 MAGRUDER WTN6.8 0.67 14 MAGRUDER UTN
16.2 6.08 5 ALAMO SE42.4 0.02 5 *.VUAD. NOT LISTED.8.5 6.08 14 LATHE0P WELLS SE
16.1 6.66 8 ALAMO32.6 0.12 9 WAUCBA WASH17.3 0.17 10 UE.HEBE CRATER
17.8 0.61 6 ASH MEADOWS11.9 0.63 16 SPRINGDALE
)

r--U- .
LOA I T1989 LOCAL HYPOCENTER
). )
SLAAAARY - SGB D)
000125 MAGNITUDE I
Uco Wd
_ _, 1. 5 9
9 0kRTHOUAKES
DATE - TIME(UTC)
SEP 22 14:45:1822 17:43:5023 4: 6:5823 16:40:4923 26:41:2523 20:43:11
24 4:46:4424 6:34:3124 16:41:2724 12:34:1725 4:27: 325 16: 0:39
26 16:26:1927 1:1:a3427 7:15:2127 7:15:2327 7:1: 827 7:16:48
27 7:17:5527 7:18:23
~ 27 7:21: 30 27 7:23: 8
27 7:23:5227 7:34:11
27 7:34:1327 7:38:3427 7:38:3927 7:57:1227 7:57:2027 16:38:43
28 16:39:5429 6: 0:1429 8:16:3536 2:37:5530 14:44:53
OCT 1 19:40:45
1 26:43:241 21:59:261 21:59:422 2:59: 52 21:15:593 2:31:5s
3 6:23:213 9:31:46
LATITUOE LNG ITUDE(DEC. N) (DEG. W)
37.15036.47837.24237.38636.62136.621
37.22537.43437.22137.26736.85937.224
37.22837.50137.61937.61737.01637.017
37.01837.02637.01637.01737.61837.022
37.01937.02137.61537.61637.01936.897
37.17838.89137.57437.73937.14835.927
37.00437.00537.00737.00637.00537.876
37. 14837.141
117.821116.582115.614115.378116.222116.220
117.546115.322117.548115.189118. '31117.544
117.545115.852116.8011 16.608
Ie .o8e711 6. 007116.007
1 16.002
1600311 6. 002
11 6. 002115.99611I6.6011I6.05116.004117. 479
115.204117.438115.849114.967117.396116.639
115. 972115.97315. 971
115. 967115.976116. 128
118.246116.289
STANDERRORH(KM)
6.76.46.46.8
0.20.5
6.36.86.50.8e.36.3
0.30.46.26.36.26.3
e.36.26.3e.36.36.2
6.26.26.2
0.36.3
2.7
0.76.26.46.31.7
6.30.3e.50.40.3
0.9
2.50.3
STANDDEPTH ERROR(KW) Z(lM)
6.06 2.1-0.71 1.0
6.96 0.4-e.56 1.6-0.61 6.4-0.85 6.8
11.37 6.41.20 2.9
11.63 0.711.12 1.41.8e 1.1
1l.30 6.5
11.63 6.32.15 1.84.16 1.76.68 6.44.55 1.55.84 6.8
5.3 1.26.63 6.65.72 0.95.96 6.94.62 1.25.93 6.7
6.22 6.55.51 6.64.96 1.65.64 1.16.11 6.8
-1.42 -
-ese e.6-0.80 6.64.33 3.11.89 6.6
-1.e2 6.51.26 4.3
5.89 1.26.18 1.66.01 1.56.18 1.46.46 1.16.00ee 1.7
2.63 8.82.31 0.7
AZIGA.P
(DEC)
21064
2117773
131
130145135133106131
12895
159144123123
159159124125124S59
179161124124158189
148166
99230126218
132131153133132l1e
26963
BDI 1.59ACZADZ 1.46OCZ 1.79ACZ 1.39ACZ 1.14
AB1 1.20ilCZASl 1.34AS!ACZ 1.49 1.43AB! 1.52
ASZACIACZACZ 1.75ACZ 1.97AiZ
ACZACZABZABZAC2ACI
ACZACZACZ 1.75ABZACt 1.20COA 1.85
ADZACIBCI 1.48
ADZACZ 1.74 1.928OZ
ABZ 1.91 1.67A8ZACZABZ 6.99A8Z 1.60oCZ
CDI 2.46ABZ 1.85
1.66
1.54 1 0. 6 D. 9 I I I WPAAAMA arm I lP
ES6
I
IIf1
1
1
DEL- RMS tNTIMATES MIN RES. PH. U.S.¢.S.ILh MLv VLe (KM) (SEC) QUADRANGLE
.7 1.50 18.6 6.67 11 WAUCOBA SPRING1.29 13.1 6.1 13 RYAN1.26 1.8 17.5 6.63 6 LOWER PAJANAGAT LAKC1.67 2.6 22.8 6.26 12 CUTLER RESERVOIR1.11 16.9 6.67 1s SPECTER RANGE SW6.65 11.6 6.69 9 SPECTER RANGE SW
1.30 1.30 1.5 8.9 .06 15 LAST CHANCE RANGEt.41 1.16 24.2 6.09 86 HCOCX SUMMIT1.84 1.0e 8.8 e.6e II LAST CHANCE RANGE1.44 1.85 16.9 6.10 6 ALAMO
6.85 11.6 e.8e 17 BARE MTN1.66 1.50 1.6 9.2 6.67 16 LAST CHANCE RANGE
1.81 1.64 9.6 6.63 7 LAST CHANCE RANGE1.32 18.4 6.05 7 UHITE BLOTCH SPRINGS0.85 16.7 6.64 II YUCCA FLAT1.27 16.3 6.67 16 YUCCA FLAT1.73 16.2 6.6 22 YUCCA FLAT1.46 16.3 6.67 15 YUCCA FLAT
6.81 1I.6 6.67 14 YUCCA FLAT6.91 16.8 6.64 12 YUCCA FLAT1.16 16.3 6.68 16 YUCCA FLAT6.92 16.s 6.es 16 YUCCA FLAT6.91 16.6 6.67 16 YUCCA FLAT6.53 11.6 6.64 16 YUCCA FLAT
6.68 16.7 6.63 9 YUCCA FLAT6.68 11.1 6.64 12 PAIUTE RIDGE1.69 16.2 6.68 26 YUCCA FLAT6.88 16.2 6.08 17 YUCCA FLAT1.29 16. 66.ee 11 YUCCA FLAT
12.2 0.13 5 TIN MTH
1.26 1.13 1.8 .00 3 LOWER PAHNAGAT LAKE1.45 9.9 6.16 16 TIN UTN1.53 17.8 6.68 11 WHITE BLOTCH SPRINGS1.64 16.1 6.64 7 PAiROC SPRING1.81 17.6 6.68 19 U3EHEUE CRATER1.19 21.1 6.15 12 CONFIDENCE HILLS
1.64 16.6 6.1 27 PAIUTE RIDGE1.13 16.9 6.e6 18 PAIUTE RIDGE1.38 11.1 6.68 16 PAIUTE RIDGE6.81 11.2 6.69 15 PAIUTE RIDGE1.69 11.6 6.68 16 PAIUTE RIDGC1.97 21.6 6.17 9 REVEILLE PEAK
2.8 43.6 6.13 12 ***OUAD. NOT LISTEDo1.62 2.00 2.2 8.7 6.11 26 Ak#NIA TANKS
.1.. 1
- WIq X, r�, , - "Twu11---,;-,--- ----. ,.. - - - . - - w " ITIX �-
- --

) I a3 I ' 9 9 1
1989 LOCAL HYPOCENTER SUA.RY - SC8 EARTHQUAKES
DATE - TIME LATITUDE LONGITUDE(UTC) (DEG. N) (DEG. W)
OCT 333444
555667
a999
1e16
161ele
1o
1011
1111le1212
12
1212121212
12
131313141415
1616
15:56:5216:19:1522:49:338:47:439:37:58
16:54:46
11:31:2214: 2:2420:46:4711:11: 711:16:5916:28:29
12:44:4515:1:1719:5e:4719:50:4815:2.5:3815:29:22
16:25:1119:30:4119:36:3419:39:5220: 6: 90:49:38
14:25:5315:31:2817:15:266:42:295:59: 76:11:55
7:14:477:15:587:18:307:29: 2
16: 6:5518:25:33
6:16:391:31: 1011:59:1616:39:4621:37:1721:37:26
0:26 378:35:52
37.29537 .1 3838.18837.57438.26138.176
37. 57636.85438. 5s537.87737.86737.268
37.66836 .76636.82836.82637.16037.154
37. 16236.75436.82836.82736.82836.348
36.82936.77937.16835.78836.70e37. 1e2
36.68936.69636. S8836.68437.50336.414
38.77736.68836.54337.25535.93236, 373
37.60535.876
115.052117.840116.626117.686116.031116.631
117.686115.9391 16,351116.626116.623116.306
115.212116.118116.262116 5266116.603116.609
116.612116.262116.267116.262116.262117.436
116.269116.199116.513116.548116.289117.089
115.831115.812115.827115.825118.049116.980
1 13.540116.728118.644115. 171116.795117.496
116.621114.827
STANDERROR DEPTHH(KM) (KWJ)
0.6 -0.736.9 2.44Os 3.500.3 6.990.3 3.630.4 2.70
6.3 1.006.2 8.4-42.6 4.18.1.6 8.446.7 9.226.3 2.62
6.5 5.666.4 6.710.3 3.590.3 3.760.2 2.090.4 -0.46
0.3 6.316.4 4.896.3 4.266.3 6.140.3 4.8e0.6 1.86
6.6 3.471.6 7.866.5 6.967.9 6.e0.6.3 4.966.5 11.41
2.8 6.655.3 -1.084.6 -0.652.2 -1.766.7 9.520.7 14.36
6.7 7.580.2 4.S61.7 10.102.5 -1.430.6 6.430.9 6.69
6.3 6.82- 2.93
STAND AZIERRORZ(KM)
6.44.02.2
6.51. 11.9
6.56.5
4.82.66.3
0.80.91.31.2S+6.50.4
6.90.40.80.31.62.1
1.61.11.3
6.94.7
2.44.6
5.16.11.31.1
6.42.60.81.8 11.4
6.6
0.6- 2
GAP(DEG)
182216263
97267199
97197256189185
99
84131llb5362
192
90133
966363
233
169221175292
73114
14919515717427196
1491042461s6e29141
151!54
OOD12S MAGNII bo
TUDEMd
ADZBDI 1.61BDZ 2.65ACZADZ 1.76ADZ
ACA 1 . 5'ADZ
cotBDA 1.72BOA 1.59AB1 1.62
AAI 1.32ABZA8ZABI 1.59ACZ 1.98ADZ
ABZ 1.48 1.61ABZABZ 1.33ABZ 2.36ABI 1.65DZ 1.69
ABZADZACIDWZAAA 1.74ECA 1.59
CCA 1.50WOA 1.40OCA 1.34CCA 1.55ADIBAI 2.14 1.82
Ccz
8CI91BczADZADZ
ACZADI
ESTIMATESMLh liLv
1.53 0.951.43 1.51
2.211.382.191.59
1.162.87
1.30 1.63
1.251.140.261.17
1.79 2.486.68
1.136.131.22
2.76 2.252 14 1.39
1.45
6.630.396.691 .47
1.501.65
1.636.59
2.47 2.731.63 6.82
1.171.95
6.911.04
DEL- RMS INIhN RES. PH. U.S.G.S.
WLc (Ka) (SEC) GUADRANGLE
12.4 6.03 6 ALAW SE26.1 6.12 11 WALUIOBA SPRING38.3 O." 10 ECHO CANYON18.7 8.67 9 LIDA WASH
2.1 35.7 6.65 12 ECHO CANYON36.1 6.65 9 E[HO CANYON
18.5 6.11 13 LIDA WASH13.5 6.63 13 FRECIMANd FLAT
2.9 84.7 0.16 13 *..OJAD. NOT LISTED.15.3 e.22 8 REVEILLE PEAK14.1 6.14 8 REVEILLE PEAK
1.2 2.2 0.08 17 Ahk"IA TANS
1.6 3.5 6.11 14 TIPPIPAH SPRING10.8 6.68 13 CANE SPRING6.3 6.05 8 JACKASS FLATS6.1 0.09 19 JACKASS FLATS
11.6 6.06 26 THIRSTY CANYON NE26.2 0.67 12 THIRSTY CANYON NE
16.2 6.06 19 THIRSTY CANYON NE1.6 6.67 12 JACKASS FLATS6.0 6.10 17 JACKASS FLATS
2.4 6.3 0.12 30 JACKASS FLATS6.3 6.16 16 JACKASS FLATS
30.5 0.06 13 PANAMINT BUTTE
5.7 0.11 9 JACKASS FLATS7.7 6.69 7 SKULL UTN
16.1 0.64 7 THIRSTY CANYON NE82.6 6.16 8 COFIDENCE HILLS4.9 6.09 19 STRIPED HILLS
31.2 0.67 9 DONNIE CLAIRE SE
2.0 0.41 8 MERCURY NE6.2 6.24 8 MERCURY NE1.7 6.31 7MERCURY NE1.7 6.12 6 RCUY NE
15.3 0.67 86 sQIUD. NOT LISTED.2.6 11.1 0.15 21 FURNACE CREEK
25.8 6.17 13 TIM SPRING12.0 6." 15 BARE STN64.6 6.17 26 *..OJAD. NOT LISTED.9.76.19 7ALAMO7.5 6.61 5 WINGATE WASH35.5 6.11 18 PAINAINT BUTTE
8.6 6.16 12 YUCCA FLAT8.3 6.63 4 BOULDER CITY
r \� rI IS

9) I ) .i, I *! -) 9 2
1989 LOCAL HYPOCENTER Su&MARY - SG8 EARTHOUAKES
DATE - TIUE LA(UTC) (D
OCT 16 10: 6:18 317 4: 6:14 317 11:28:18 317 15:59:29 318 1:55:13 J18 6:14:18 3
19 9:48:53 Z20 1:53:16220 6:32: 3226 16:26:5820 20:15:3826 20:49:58
20 22: 7:1520 22:57:1421 3:10:4121 4:18: 121 5:12:2221 22:54:19
21 23:20:4022 1: 2:1322 9:36:22
rQ 23 0: 9:5800 23 1:42:36
23 7:55:59
23 11:13:2424 8:23: 424 14:39:4024 16:35:5824 17:48:5125 5:52:59
25 7: 4:4625 14:10:1926 8:23:3926 10:39:5326 15:37:4427 0:24:40
27 1:13:3127 1:27:1127 2:51:1627 12:36:3127 13:16: 227 15:48:22
27 16: 4:1827 %9:46:53
TITUDEEC. N)
7.1467.052.6.707.6.8777.22165.996
17.20117.2877.089
17.46517.46137.463
37.45337.46136.68037.43236. 86136.828
37.28136.76536.76237.35337.14636.877
36.86036.86136.63735.99936.78436.909
36.47737.34737.48237.21037.86436.519
36.51736.36636.97936.51736.51637.128
37.51637.127
LONGITUDE(DEG. W)
117.365116.123116.041116.249116.451116.080
116.279117.375116.467117,571117.563117.565
115.654117.561116.249114.649115.997116.264
117.700116.024116.024116.113117.810115.989
116.005116.008115.962117.327115.650116.184
116.570116.370114.632114.983116.137116,582
116.584115.828116.106116.586116.589117.251
117.205117.251
STANDERRORH(KW)
0.30.41.66.26.20.7
0.79.36.30.46.30.4
0.30.59.1S . I1.0
0.3
0.50.5
0.60.61.2
0.30.60.42.36.70.2
0.52.21.21.29.3.6.2
0.26.20.30.46.46.3
0.50.5
DEPTH(10A)
6.86-0.72
2.780.45-1.011.92
9.96-1.67
0.962.632.922.60
5.494.55
-4.33-1.02
0.793.87
-4.8110.1610.700.241.57o.06
-0.72-0.4410.931.550.728.6s
2.2-.6.96
13.698.626.740.29
6.079.581.657.755.9410.00
-1.297.30
STAND AZIERROR GAPZ(KY) (DEG)
0.8 11910.9 1le3.5 1600.5 1040.7 491.2 241
2.9t- 2910.5 1150.5 1390.9 810.6 820.9 82
1.74* 911.34 820.1 1050.8 2610.9 1751.2* 52
0.3 1571.e 1600.8 1581.6 161I.3t 2332.1 217
0.5 1720.9 1646.5 716.7 2681.3 1836.4 48
1.9 941.9 2691.6 2692.9 2306.4 1070.8 51
1.3 511.1 1250.9 1212.0 1052.7 1061.3 147
0.7 1541.9 138
OOD12S MAGNITUDE E
ACIC8A 2.06BCA 1.54ASZ 2.e9AC2 2.29ADZ
BIACZACzABZ 1.56 2.08ABZA8Z 1.91
ACI 1.40AS1 1.35ABZADZACZASI 1.71
ACZACZACZACz 1.79ADIBDZ
ACZACZ 1.46AAZCDZ 1.67ADZ 1.82AAZ 1.C6
ACZBDIB01001 2.51ACz 1.03ACz 2.46
ACI 2.00ACIABZ 1.68ECA 1.51BCA 1.49ACI
ACZACI
DEL- RMS INSTIMATES MIN RES. PH. U.S.G.S.MLh MLv MLc (KU) (SEC) OUADRANGLE
1.35 1.26 15.7 6.07 16 UBEHE8E CRATER9.6 0.11 14 YUCCAFFLAT8.7 0.13 11 CAMP DESERT ROCK
1.56 6.2 008 22 MINE W2.11 11.3 0.07 26 SCRUGHAM PEAK
1.51 1.80 16.1 0.11 13 TECOWA
1.81 41.4 0.05 10 *..QUAD. NOT LISTED.0.94 10.5 8.07 II GOLD POINW SW0.3t 9.3 0.03 9 TIMBER UTN1.94 2.6 6.9 0.12 17 MAGRUDER WTN
1.05 1.23 6.1 0.07 9 AGRUDER ITN1.61 1.76 6.3 6.12 13 MAGRUDER UTN
1.51 16.8 0.09 13 BALD WTN1.14 5.9 0.11 1s MAGRUDER UTN0.59 6.2 0.64 13 MINE MTN
1.23 1.23 20.8 0.04 7 SLIDY W1N0.63 9.4 0.08 l FRENCHMAN FLAT
2.02 1.39 6.1 0.12 23 JACKASS FLATS
1.37 7.2 0.05 1t MAGRUDER WTN
0.82 12.9 0.08 13 CANE SPRING0.67 12.6 0.06 13 CANE SPRING1.37 14.4 0.11 8 OAK SPRING BUTTE1.19 17.5 0.09 11 WAUCOBA SPRING0.72 8.5 0.14 8 PLUTONIUI VALLEY
0.81 0.1 o0.0 le CANE SPRING1.07 8.9 0.09 12 CANE SPRING1.05 2.6 0.67 15 MERCURY
1.86 1.87 41.6 0.10 11 TRONA1.45 1.o 17.5 0.08 10 QUARTZ PEAK SW1.35 6.2 0.061 9 MINE ITN
1.12 12.2 0.08 10 RYAN1.46 0.86 15.4 6.09 8 DEAD HORSE FLAT
1.24 1.32 16.6 0.01 5 SLIDY MTN1.97 18.7 0.12 10 DELAMAR 3 NE1.21 20.8 6.03 6 REVEILLE PEAK
2.57 16.5 6.09 33 BIG DUNE
2.41 1.98 16.4 0.06 25 BIG DUNE1.32 22.2 0.65 13 MT STIRLING1.23 6.9 0.08 16 YUCCA LAKE
16.5 0.12 14 BIG DUNE16.6 0.08 11 BIG DUNE
0.88 16.7 0.06 8 UBEHEBE CRATER
0.81 1.12 24.3 0.16 0 GOLOFIELD1.04 1.13 1.4 16.5 0.10 14 UBEHEBE CRATER

2 9 9 3
1989 LOCAIL HYPOCENTER SLAUARY - SG0 EARTHQUAKES
STAND AZI 000DATE - TIME LATITUDE LONGITUDE
(UTC) (DEG. N) (DEG. W)
OCT 2828282829
,29
293650303031
313131
NO I22
23
%O 3
34
444444
445556
686
66
67
11:50:3312:25:4114:38:3916:50:429: 8:30
18:10:20
21:40: 96: 19: 1s4:35:29
17:21:5918: 9:495:18:10
5:358:116:33:6018:56:402: If: 362:40: 54:44:16
5: 2:153:43:58
10:11:4011:47:1220:52:376:13:59
6:42:3110:47:3713: C: 913:13:4713:27:4713:51: 17
17:26: 418:54:217: 7:487:38:567:39:2516:25:12
3:24:448:34:23
11:57:3915:21:46I5: 2:4722: 1:14
22:16:563:28: 6
36. 72937.03156.87336.86935.92437.126
37.e8537.12436.77037. 12536.86456.867
37.61136.87436.94037.14937.09836.s68
37.22337.21336.87536.69536.87437.680
36.86637.24837.28837.82537.29137.247
37;30e36.87438.17936.87636.35737.251
37.24738.17736.77637.22136.97437.809
37.80636.770
115.479116.023116.736116.741114.849117.254
115.388117.159116.222117.255116.743118.740
116.296116.736117.774117.811116.246116.744
117.546116.748118. 737116.268116.740115.005
116.742115.028117.381115.006117.382115.029
117.367115.992116.030116.751116.476115.052
115.022116.631115.918117.545116.112115.078
115.084116.226
STANDERROR DEPTHH(KU) (KM)
6.5 -1.641.1 6.710.2 5.630.3 4.831.4 -0.430.2 8.17
6.5 6.120.4 8.460.4 -e.110.4 9.470.5 3.870.3 4.87
6.2 6.440.2 4.471.7 2.531.1 5.936.3 6.950.2 6.35
0.3 11.370.1 -4.506.5 6.626.5 O.C5e . 0.580.3 8.16
06. 5.540.8 6.480.4 -6.540.7 1.450.0 -1.271.1 2.88
0.6 7.430.7 5.146.2 2.960.2 4.030.5 -6.969.8 6.67
0.7 6.780.5 1.116.7 -4.136.5 11.590.2 0.670.9 5.68
1.3 4.330.5 -0.09
ERRORZ(KM)
0.81.31.3i V5.12.6
6.6
0.91.30.41.26.92.9
0.51.7e4.52.20.61.4
6.56.2
1.66.30.50.8
.67
1.6
2.6
1.61.91.52.91
0.7
6.422.91.66.60.52.91
5.716.5
GAP(DEG)
164180
86167190118
160151137149lees107
136158
244280104
108
133125162203106123
108205166177165205
126214200le96
243
20720e202534
35
12S UAGNITUDE) ka Wd
ESTI&ULh
ACZBCZACI 1.88 1.9eoCzB3DZ 2.60ACZ 1.70
ACZ 2.03 2.01ACZACIACI 0.77CCzoCZ
ACZACI 1.96 1.75BDZ 1.23B01 1.33ABUACZ
A81 1.13ABZ 1.86 1.84ACZADUACZ 1.78ABZ
BCZ 1.59ADI 2.04ACIACZ 1.62ACZBDZ 1.30
A8Z 8.82ADIADZ 2.0BCZABZDOA 1.72
ADZ 1.52 1.74PDZADZABIADI 1.64BBZ
dATESIULv
1.70.s96
) 1.871.392.772.61
1.756.830.521.150.886.64
1.032.05
I 1.56* 1.40
1.01
1.151.310.7e0.421.241.19
6.961 .776.951.446.86
6.636.682.316.760.8e
1.25.60
1.211.751.616.83
1.360.47
DEL- RYS NUIN RES. PH. U.S.G.S.MLc (KM) (SEC) QUADRANGLE
29.9 0.11 11 BLACK HILLS NW18.4 6.08 9 YUCCA FLAT13.6 0.67 26 BARE UTN13.0 6.09 18 BARE UTN8.5 6.14 15 BOULDER CITY
16.4 0.06 14 UBEHE6E CRATER
26.1 0.09 10 DESERT HILLS SW15.9 0.09 11 UBEHEBE CRATER5.4 e.oa 11 SKULL MTN
16.3 0.07 11 UBEHEBE CRATER12.8 0.09 13 BARE UTN12.8 6."9 17 BARE MTN
6.6 6.64 15 BUCKBOARD MESA13.0 6.67 27 BARE UTN34.3 56.1 7 WAUCOBA WASH17.3 .. CS 16 WAUCOBA SPRING6.9 6.09 18 TIPPIPAH SPRING
13.1 6."6 18 BARE UTN
8.9 6.Oa 11 LAST CHANCE RANGE7.6 6.04 17 THIRSTY CANYON NW
15.2 6.16 13 BARE MTN5.3 6.06 12 STRIPED HILLS
13.3 0.08 16 BARE MTN6.8 6.65 8 HIKO NE
12.9 6.es 16 BARE UTN16.6 6.ea 13 LOWER PAHRANAGAT LAKE11.e 6.05 7 COLD POINT SW6.4 6.08 9 WHITE RIVER NARROWS
11.2 0.60 8 COLD POINT SW1.4 16.5 0.67 8 LONER PAHRANAGAT LAKe
9.7 S."6 6 GOLD POINT8.5 6.10 16 FRENCHUAN FLAT
2.3 36.2 6.65 16 ECHO CANYON13.7 6.05 14 BULLFROG
1.1 4.5 0.16 9ASH MEADOWS17.3 0.25 5 ALAMO SE
17.6 6.05 9 LONER PAHRANAGAT LAKIC36.1 0.05 8 ECHO CANYON13.2 6.16 11 FRENCHUAN FLAT9.1 0.06 12 LAST CHANCE RANGE
1.3 6.9 0.03 14 YUCCA LAKE8.1 0.12 8 WHITE RIVER NARROWS
8.6 6.12 8 WHITE RIVER NARROWS5.1 6.05 16 SKULL WTN
59 CCI 1.5099 AS]
(_ .
( J(

I I '3; 1 .) 9 fl
1989 LOCAL HYPOCENTER StUARY - SC8 EARTHOUAKES
DATE - TIUE LATITUDE(UTC) (DEG. N)
NOV 7 6: 5:41 36.8677 14:b1:47 36.6787 26:49:33 36.3928 14:47:55 37.2498 14:55:28 37.2738 16:22:12 36.625
8 18:46:51 37.2448 20:38:46 37.4838 21:16:45 36.7288 21:17: 1 36.7218 21:20:19 36.7248 21:21: 7 36.730
8 2V;21:49 38.6649 2:43:13 36.6299 5: 6: 7 36.8299 5:26:51 36.5259 21: 2:35 35.77216 4:55:18 37.484
10 11: 6:47 36.77316 13:58:18 37.627
W 11 12: 3: 6 37.30911 14:14:18 36.74811 17:12:42 37.30411 17:22:57 36.865
11 28:36:11 37.25211 22:16:55 36.73112 6:31:49 37.88912 8:50: 4 36.98712 13:19:59 36.73513 19:16:17 36.78e
13 19:37: 2 37.32814 6:12:18 37.01414 4:44:46 37.31814 6: 0:45 37.31214 19:33:32 36.78814 19:35: 6 37.463
15 7:56:13 36.87816 2:38:44 36.8016 12:47: 8 36.26116 21:43: 6 37.30617 1: 7:43 37.22817 1:57:13 37.113
17 14: 6:53 37.85117 19: 2:21 36.944
LONCGITUDE(DEG. W)
116.742116.670114.896115.628115.096116.250
115.016116.000
115. J36115.923115.928115.932
115.236116.245116.262116.261117.9471 16.6I
116. 262117.645114.913116.042115.424116.742
115.047115.495115.751116.180115.453115.968
114.865117.984115.420115.428115.638115.417
115.427115.791116.806115.249117.724117.036
116.142116.883
STANDERRORH(KYi)
6.26.21.36.71.56.8
1.16.66.26.66.46.3
6.76.36.26.4
7.96.6
0.36.56.5e.50.46.3
6.51.61.60.31.60.2
1.31.9I.e1 .70.56.4
6.81.26.3
1.16.46.3
0.50.6
DEPTH E(KM) Z
4.666.97
-1.136.95
10.444,46
-8.641.2512.1411.6216.27
5.234.233.792.87
11.08-0.33
2.376.916.72
7.73
7.1814.451.465.476.428.77
17.994.94.7.006.00..2.10
10.67
2.74.7.426.82
10.84-0.34
6.23
1.65-1.82
STANDERROZ(KY)
2.50.41.36.4.2t
2.2
AZIGAP
(DEG)
108125228205174156
0.721.16.3t16.90.40.8
5.71.96.6+0.43.41.6
6.50.56.61.61.61.8*
1.3"5.94.36.5
10.36.9
1.9
11.92.41.61.6
2.91.23.66.30.4
1.47.9
!1083
166163163167
250134
212305
63
72187212150
81106
193I15185215218129
218246142158186
97
12621310e114196164
105153
COD12S MAGNITUDE
Uca Md
BCZABZBDZ 1.62ADZ 1.43ocIBCZ
90Z 1.:3DCZ 2.03ACZACI
ACZAZ
CC) 1.70ABZABI 1.30 1.19ADIODA 2.5sACZ 1.70
AAZ 1.15ADZADIACZ 1.11ACZ 2.34ABI
ADI 2.30CCI
1DIADZCOZABZ 1.63
B02 1.52CDA 1.8CCA 1.9BCZADZ 1.94 1.7ACZ 1.66
ESTIMATESULh MY MU
1.661.41
1.55 1.266.826.67
1.42 1.351.761.e71.020.821.21
1.896.74 1.66
6 .87
0.68
1.69
6.776.931.04 6.89
1 0.96
0.78
17.4 6.1610.9 6.178.0 6.057.5 6.047.6 0.658.2 6.ee
2.1 24.9 .048.7 S.066.2 6.676.6 6.64
99.8 6.1510.9 6.15
3.5 6.6922.8 6.0616.3 0.02
1.1 12.0 6.112.1 25.8 0.11
12.8 6.09
15.5 0.6739.1 6.2617.3 0.107.1 6.63
48.1 6.161.6 13.2 6.67
18.6 0.1438.6 6.2631.3 6.2626.7 6.1I18.5 0.0126.6 6.01
39.8 6.1111.9 0.1715.3 6.6716.3 6.2:6.9 6.6'
14.5 6.6U
20.5 0. &14.2 0.el
Le
DEL- RUS ONMIN RES. PH. U.S.G.S.(XI) (SEC) QUADRANGLE
13.0 6.67 18 BARE 1TH9.9 0.64 11 CAMP DESERT ROCK
26.8 6.19 7 DRY LAKE16.7 0.06 9 LOWER PANRAHAGAT LAKt14.2 6.65 6 ALAMO SE8.4 0.11 11 STRIPED HILLS
9 LOWER PAHRANAGAT LAKE14 WHEELBARROW PEAK NE14 MERCURY7 MERCURY
11 MERCURY13 MERCURY
6 TINDER UTN PASS WEST13 SPECTER RANGE NM21 JACKASS FLATS
9 JACKASS FLATS7 LITTLE LAKE
13 WHEELBARROW PEAK NE
15 JACKASS FLATS13 LAST CHANCE RANGE5 DELAWAR LAKE
12 CAMP DESERT ROCK13 CUTLER RESERVOIR15 BARE WTN
12 ALAuO SE9 BLACK HILLS IW6
16 MINE MTN8 BLACK HILLS NW
18 FRENCHAN FLAT
6 GREGERSON BASIN6 12 WAUCOBA SPRINGI 12 CUTLER RESERVOIRI6 CUTLER RESERVOIR915 QUARTZ PEAK SWI 16 CRESCENT RESERVOIR
114 DOG BONE LAKE NORTH7 14 FRENCH"AN LAKE SE7 12 FURNACE CREEK2 16 ALAMOt 9 LAST CHANCE RANGE8 19 BONNIE CLAIRE SE
5 6 REVEILLE PEAK9 13 BULLFROG
4
2
1.421.380.761.361.24
1.55 1.50
1.74 1.311.83
1.69 1.55
1.451.43 1.521.eo 1.18
1.511.19 1.32
1.561.41 1.70
CCA 2.32501 1.61ACZ89Z
ADZ 1.54 1.59ACZ 1.83 1.20
ACZCCU

) I 0 S I :2 9 9 3
1989 LOCAL HYPOCENTER SLIASARY - SGS EARTHQUAKES
DATE - TIME LATITUDE(UTC) (DEG. N)
NOV 18 6:26:15 37.30418 10:31:26 36.82818 23:38:38 37.11116 23:41:35 37.23518 23:41:58 37.19819 6: 2: 2 37.114
19 1:48:37 37.11319 2:33: 3 37.11319 7:34:44 37.39419 16:58:44 36.52819 17: 9:17 37.11319 it:11:26 35.968
19 19:37: 7 37.11326 3:33:15 37.11420 5:22:23 37.12026 6:17:35 36.7W20 18:36:38 37.15120 20:22:48 36.121
21 6:35: 9 36.86121 18:18:15 38.682
L 22 0:33:54 36.89222 7:39: 9 37.17422 21: 9:48 37.11023 3:57:41 37.115
23 6:36:32 36.68723 12:26:51 37.16923 22:48:59 36.63624 12:29:10 37.02324 21:49: 3 37.18325 2:16:55 36.752
25 2:29: 7 36.65725 26:22:56 37.11225 20:25:45 37.11225 26:45:52 37.11127 5:59:40 37.69627 14:40:39 37.111
27 17:15:36 37.17628 5:23:37 37.11428 6:37: 7 37.24028 13: 6:44 36.33728 20:41:51 35.95028 21: 7:31 36.895
29 1:55: 3 38.60529 8:10:18 36.869
LONG ITUDE(DEG. W)
115.251116.266117.038114.987117.63117.636
117.036117.036115.213117.879117.036114.839
117.636117.637116.438116,259117.357117.640
116.619116.634116.811115.63117.633117.036
115.596117. 637117.268116.194117.425115.973
116.681117.036117.0S4117.632115.046117.W4
117.5s4117.633117.323116.864115.204115.35
115.364116.744
STAND STAND AZIERR0R DEPTH ERROR GAPH(KI) (KM) Z(KM) (DEG)
1.6 3.09. - 217e.3 6.54 6.6 966.3 7.84 1.5 1631.5 1.65 2.9 2190.3 7.11 6.8 1736.3 7.36 1.7 164
6.3 6.39 6.4 1646.3 7.41 1.8 1046.1 5.76 6.3 1752.7 2.79* - 2666.3 8.06 1.6 1642.3 -4.19. - 171
6.3 7.91 1.7 1646.3 8.21 1.5 1646.4 -4.38 6.7 1336.4 3.71 6.5 976.4 4.43 2.5 1256.5 6.49 6.6 262
1.5 3.56 8.6 156- 7.06. - 2696.5 -0.92. - 791.5 7.59 2.6 2346.5 11.71 1.514 136.3 6.18 6.4t se
2.0 -1.62 2.1 2106.5 8.50 2.1 1633.8 6.84 2.2 2506.6 6.15 1.3+t 826.2 -e.94 6.5 1246.4 8.68 6.8 163
6.6 7.59 1.5 1676.3 -4.38 0.6 1646.3 6.66.. 6.4 1146.3 6.68 1.0 1252.6 1.72 11.2 1186.3 7.51 1.3 163
6.2 6.56 6.4 1516.4 6.68 6.6 866.3 6.45 6.7 846.7 7.81 3.5 6e62.6 -1.62 2.9 189
14.1 2.18. - 351
1.8 7.60. -- 2996.3 2.69 1.2 108
ooo12S
COIABZABZ801ACZABZ
ACZABIACIcDIABZOCt
ABIABZACZABZoCzADZ
CCZADUCCABOUGB!8Cz
sozBDZ
CDIcAI
ACZACZ
ACZACUACZACZcczABZ
ACZACZADZBCABDZD0I
COIACZ
MAGNITUtE ESTIMATESMcC Md ULh SLv
1.330.73
6.97 1.191.051.626.95
1.85 1.09 1.151.21 1.29 1.22 1.11
0.99 1.45 0.772.65 2.49
1.44 1.241.99
1.47 1.251.81 1.61
1.33 0.950.48
1.38 1.141 .32
1.60 6.74 6.601.17 6.34 6.86
2.261.56 1.52
2.69 1.81
1.76 1.541.47 6.761.34 1.171.54 1.131.23 1.091.37 1.17
1.16 1.631.37 1.33
1.26 1.141.59 1.191.62 1.25
1.171.79 1.321.37 1.26
1.6"2.381.68 6."0
2.22 1.441.30
DEL- R5S tNWIN RES. PH. U.S.G.S.
MLc (KM) (SEC) QUADRANGLE
21.1 ."6 5 BADGER SPRING6.6 6.66 12 JACKASS FLATS
14.3 6.16 26 BONNIE CLAIRE SE19.2 6.14 5 DELAMAR 3 ?M14. 0.66 15 BONNIE CLAiRE SE14.6 6.16 16 BONNIE CLAIRE SE
14.6 6.69 21 BONNIE CLAIRE SE14.6 6.16 18 BONNIE CLAIRE SE14.4 6.01 6 ASH SPRINGS52.3 0.14 13 NEW YORK BUTTE14.5 6.11 20 BONNIE CLAIRE SE9.1 6.es 11 BOULDER CITY
14.6 6.11 21 BONNIE CLAIRE SE14.6 6.11 24 BONNIE CLAIRE SE10.5 0.eo 10 TIMER MTN2.2 6.66 12 JACKASS FLATS
16.8 6.08 12 UWEHESE CRATER23.4 6.e6 16 TELESCOPE PEAK
8.5 6.16 7 CANE SPRING6.9 6.63 3 CAW DESERT ROCK
19.5 6.12 12 BULLFROG9.3 O.9 7 LOER PARANAGAT LAK
14.2 0.16 18 8ONNIE CLAIRE SE14.7 6.19 59 BONNIE CLAIRE SE
21.9 6.27 15 INDIAN SPRINGS SE14.6 0.17 26 BONNIE CLAIRE SE3S6.8 .31 17 MTURANGO3.5 6.22 28 TIPPIPAH SPRING
19.8 6.66 19 UEIEHEBE CRATER16.1 6.16 22 FRDCHMAN FLAT
11.2 6.16 19 BIG DUNE14.4 6.67 15 BONNIE CLAIRE SE14.4 O."9 14 BONNIE CLAIRE SE14.3 6." 11 BONNIE CLAIRE SE20.6 0.17 7 HIKO NE14.3 6.06 15 BOWIE CLAIRE SE
14.1 O.6 16 LAST CHANCE RANGE1.6 14.6 6.15 28 BONNIE CLAIRE SE
8.9 .66 15 UtEHEBE CRATER22.1 0.18 14 FURNACE CREEK48.6 6.26 11 SLOAN
2.6 33.8 6.94 5 BURRO BASIN
72.1 0.17 10 *..QUAD. NOT LISTED.13.2 6.11 14 BARE MTN
2.611.212.14
1.431.59 1.141.52 1.39
1.661.28 0.90
1 .62
6.720.98
1.18 1.161.34 6.89
1.401.24 1.30
1.45 1.461.6 1.39
1.39
2.45 2.140.37

) I 0 j I *). 9 61989 LOCAL HYPOCENTER SUUMARY - SG8 EARTHOUAXES
DI
w-
STANDDATE - TIME LATITUDE LONGITUDE ERROR
(UTC) (DEG. N) (DEG. W) H(KU)
oV 29 14:12:22 36.859 116.737 0.629 16:14:27 37.408 115.052 -30 1:47: 9 37.511 118.077 1.930 2:13:40 37.115 117.634 0.230 19:43:27 36.978 116.109 0.4
EC 1 8:23:22 36.909 117.427 1.3
1 14:46:58 37.347 118.243 1.11 20:49:28 36.019 116.451 6.31 22:35: 0 37.187 117.037 0.42 1:12:60 36.052 117.767 3.42 7:58:45 37.306 115.192 3.42 18:18:35 37.116 117.637 8.3
2 19:15:11 35.550 117.345 1.12 21:48: 6 37.112 117.637 0.23 0: 5:59 37.256 115.102 0.93 7:10:34 37.115 117.034 0.33 13:16:54 37.009 116.199 0.23 15:22:11 37.645 117.682 0.2
3 18: 6:43 36.452 116.956 1.23 23:22: 3 36.862 116.734 6.53 23:23:21 36.859 116.722 0.64 3:49: 3 37.167 117.,39 1.e4 10:27:45 37.111 117.033 0.34 12: 1:58 36.884 115.996 0.8
DEPTH(KM)
11.047.00..6.725.886.391.15
6.028.77
-0.442.69.7.00*
-0. 10
12.636.311.757.847.23
10.27
5.00..5.508.367.616.85
12.85
9.325.693.91.6.600.232.38
-1.67-0.61.
0.749.927.305.24
1.29-0.08-0.9911.96-0.31-0.47
7.227.05
STAND AZIERROR GAPZ(KU) (DEG)
1.7 168- 2971.5 2621.9 1656.7 1940.9 224
5.1 2881.4 1946.7 90- 263- 2120.4 165
6.6 3041.2 1631.6 1781.3 1656.4 l60.5 235
8.6 813.2 1220.9 3162.6 2111.7 1641.2 192
- 2692.5 168- 197J.6 1486.4 881.2 259
6.4 275- 1940.4 1961.2 1446.9 2321.9 210
1.2 2818.3 2126.6 1841.6 1510.8 1070.4 40
3.8 1342.5 108
cOD12S
Mc a
8B1 1.03DOI 1.08901 1.99ACZ 1.71ADZ 1.72BOz
COIADIACACOI 2.29DOIACZ
BDI 2.53ACZACZABZ 1.82AAZADI
CCAOCAADABOAACZADI
ADZ 1.139CZCOZ 1.26ACZABZB0Z
ADICDIADZACZADIADZ
ADZADZ 1.59ABAACI 1.469CZ8BZ 2.22
BCI 1.40BBZ 1.19
ITUDE ESTIMATESMd MLh MLv 1
0.456.81 1.381.92 1.94 2.221.50 1.83 1.55
1.241.45 1.26
2.161.38 1.271.52
2.380.99 1.16
1.34 6.95
1.47 1.276.79 6.681.13 1.08
1.26 1.161.28 1.72
455666
a77777
88a910le
1016
15:43: 412:30:2212:40:346: 18: 15
15: 6:4115: 9:12
23:46:571:15:501:36:203:37:213:56:536:51:16
2:18:3217:42:3923: 5: 716:10:216:32:52
10:11:39
19:17:4321:15: 1
37.22936.86637.25036.20937.25536.873
37.27438.17238.14337.10836.87536.870
37.24537. 25537.22836.68536.53037.233
36.78236.866
117.552116. 744115.650115.452116.364116.758
116.383115.947115.958117.048116.746115.996
114.577116.365116.415115.977116. 388116.461
115.656116.741
e.33.36.50.41.0
0.60.80.40.5e.46..
6.30.70.60.40.50.4
1.20.4
1.501.981.e61.57
1.34
1 .69
1.23
1.05 6.990.73
1.06 1.166.54
'.25 1.681.231.120.55
1.382.88
1 .691.260.571.12
1.221.47 1.08
1.181.212.12
1.410.80
DEL- RMS NMIN RES. PH. U.S.G.S.
.ILc (KU) (SEC) QUADRANGLE
12.0 0.19 19 BARE MTN0.2 1.26 3 ALAMO NE-no convergen"
2.0 17.8 0.26 37 *. OUAD. NOT LISTED.14.7 6.09 21 BONNIE CLAIRE SE7.1 6.06 13 YUCCA LAKE
12.3 .U4 6 TIN MTN
31.0 0.20 9 *..CUAD. NOT LISTED.27.0 0.64 9 EAGLE MTN29.1 6.16 16 BONNIE CLAIRE SE70.9 0.13 11 HAIWEE RESERVOIR15.3 0.09 7 ALAMO14.8 0."8 15 BONNIE CLAIRE SE
63.1 0.67 14 SEARLES LAKE14.4 6.07 18 DONNIE CLAIRE SE12.3 6.65 7 ALAMO SE14.7 6. 9 18 80NNIE CLAIRE SE
1.3 4.2 6.87 18 TIPPIPAH SPRING21.6 0.62 8 LAST CHANCE RANGE
14.6 0.27 9 FURNACE CREEX12.1 6.11 15 BARE WTN10.9 6.64 8 BARE ITN13.9 6.09 16 BONNIE CLAIRE SE14.3 6.16 17 DONNIE CLAIRE SE15.7 6.06 11 PLUTONIUM VALLEY
27.3 6.00 4 LAST CHANCE RANGE13.6 S.68 13 BARE MTN14.7 .16 7 ALAMO SE17.3 0.67 13 LA MADRE MTN5.8 0.11 15 DEAD HORSE FLAT
14.4 0.68 9 BULLFROG
8.5 S."8 12 SILENT BUTTE37.6 0.14 15 OUINN CANYON rIANGE36.7 O.06 16 QUINN CANYON RANGE14.0 0.08 16 BONNIE CLAIRE SE13.3 0.64 16 BARE MTN8.6 O.68 9 FRENCH4AN FLAT
42.5 6.01 5 VIGO NE5.8 6.09 14 DEAD HORSE FLAT8.2 6.09 16 SCRUGHAM PEAK8.7 0.15 28 PLUTONIWU VALLEY
13.1 0.18 17 LATHROP WELLS SE7.2 6.17 37 SCRUGHAM PEAK
16.9 0.22 13 QUARTZ PEAK SW12.8 6.14 17 BARE MTN
1.82
8.86
1.330.65
( ( (
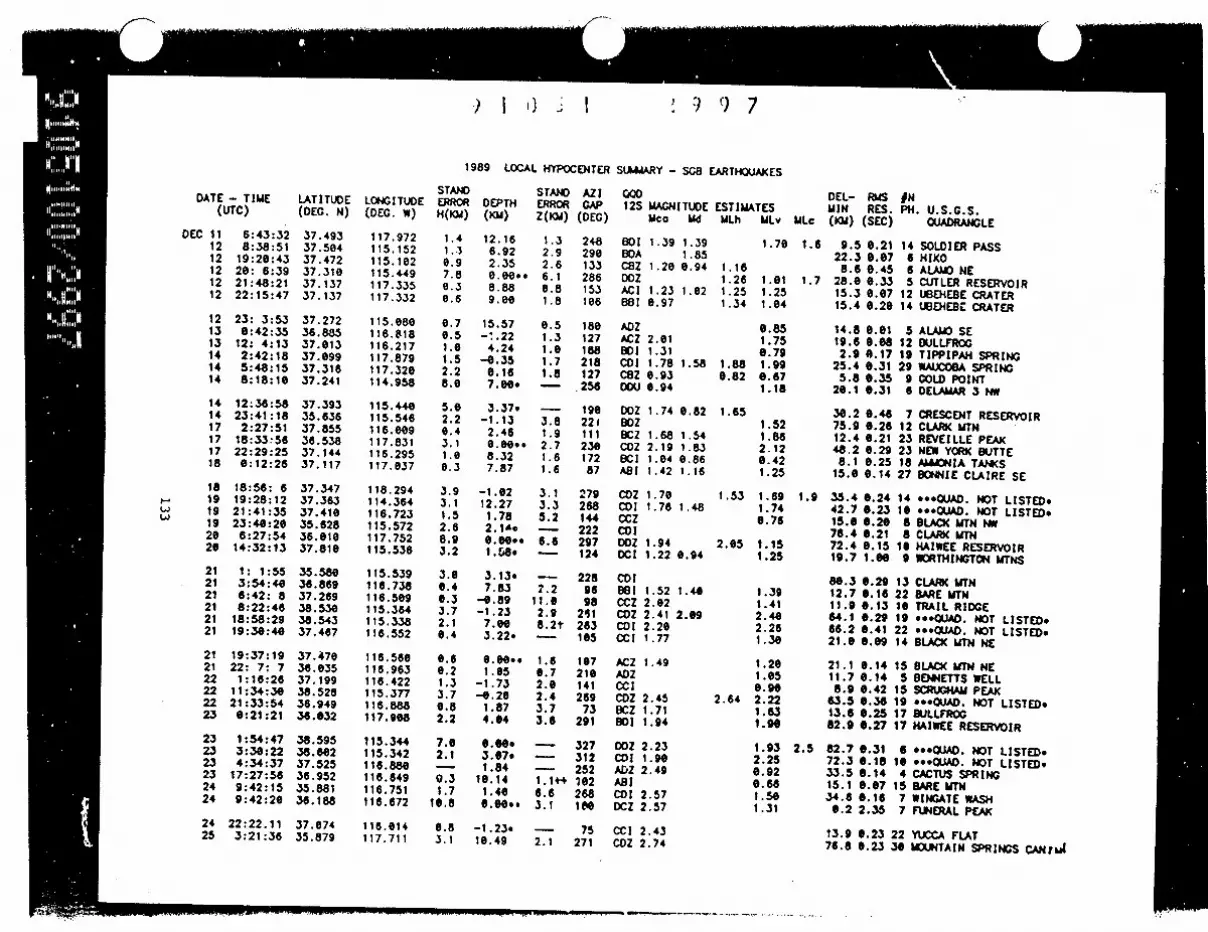
I
') I ) , I 9 9) 7
1989 LOCAL HYPOCENTER SUMUARY - SC8 EARTHOUAKES
DATE - TIME LATITUDE(UTC) (DEC. N)
DEC 11 6:43:32 37.49312 8:38:51 37.50412 19:28:43 37.47212 20: 6:39 37.31812 21:48:21 37.13712 22:15:47 37.137
12 23: 3:53 37.27213 6:42:35 36.88513 12: 4:13 37.01314 2:42:18 37.09914 5:48:15 37.31614 8:18:16 37.241
14 12:36:58 37.39314 23:41:18 35.63617 2:27:51 37.85517 18:33:56 36.53817 22:29:25 37.14418 0:12:26 37.117
18 18:56: 6 37.34719 19:28:12 37.36319 21:41:35 37.41619 23:40:26 35.62820 6:27:54 36.61620 14:32:13 37.810
21 1: 1:55 35.58021 3:54:40 36.86921 6:42: 8 37.26921 8:22:46 38.53021 18:58:29 38.54321 19:38:40 37.467
21 19:37:19 37.47021 22: 7: 7 36.e3522 1:16:26 37.19922 11:34:30 38.52822 21:33:54 36.94923 6:21:21 30.032
23 1:54:47 38.59523 3:30:22 3a.6e223 4:34:37 37.52523 17:27:56 36.95224 9:42:15 35.88124 9:42:20 30.188
24 22:22.11 37.67425 3:21:36 35.879
LONGITUDE(DEG. W)
117.972115.152115.102115.449117.335117.332
115.680116.818116.217117.879117.320114.958
115.440115.546116.009117.831116.295117.037
118. 294114.364116.723115.572117.752115. 536
115.539116.73a1 16.509115.364115.338116.552
116s560116.963116.422115.377116.888117.908
115.344115.342116.880116.649116.751l11.672
116.614117.711
STANDERRORH(KM)
1.41.30.9
7.86.30.6
0.70.51.0
1.52.28.0
5.02.20.43.11.00.3
3.93.1
1 .52.6
8.93.2
3.00.40.33.72.16.4
6.66.21.33.70.82.2
7.02.1
0.31.7
10.6
6.83.1
STAND AZIDEPTH ERROR GAP(KY) Z(KUA) (DEG)
12.16 1.3 2486.92 2.9 2902.35 2.6 1330.00.. 6.1 2868.88 0.8 1539.00 1.8 106
15.57 0.5 180_ 22 1.3 127
4.24 1.0 l8-0.35 1.7 2180.16 1.8 1277.0e. - 256
3.37s - 196-1.13 3.8 221
2.46 1.9 III0.e0.. 2.7 2308.32 1.6 1727.87 1.6 87
-1.02 3.1 27912.27 3.3 2681.78 5.2 1442.1'e - 2226.800. 6.6 2971.58. - 124
3.13. -- 2287.83 7.2 96
-0.89 11.6 98-1.23 2.9 2il7.00 a.2t 2633.22. - 105
0.00.. 1.6 1071.05 6.7 210
-1.73 2.0 14l-e.26 2.4 2691.87 3.7 734.04 3.6 291
0.00. - 3273.07. - 3121.84 - 252
16.14 1.1+4 1021.40 6.6 2686.00.. 3.1 le0
-1.23. - 7510.49 2.1 271
GOD12S MAGNITUDE
McC Md
BOI 1.39 1.39BOA 1.85CBZ 1.20 0.94wDzACI 1.23 1.02681 0.97
ADZACZ 2.01BDI 1.31COI 1.78 1.58Cez 0.93DDU 0.94
DOZ 1.74 0.82BDZ8CZ 1.68 1.54COZ 2.19 1.83BCI 1.04 0.86ABl 1.42 1.16
CDZ 1.70CDI 1.76 1.48CCzCDIDDZ 1.94DCI 1.22 0.94
CDI8BI 1.52 1.40CCZ 2.02CDZ 2.41 2.09CDI 2.20CCI 1.77
ACZ 1.49ADZCCICDZ 2.45BCZ 1.71SDI 1.94
DDZ 2.23CDI 1.90AbZ 2.49ABICDI 2.57DCZ 2.57
CCI 2.43CDZ 2.74
ESTIMATESMLh MLv
1 .70
1.161.26 1.011.25 1.251.34 1.04
0.851.750.79
1.88 1.990.82 0.67
1.18
1.651.52I.862.120.421.25
1.53 1.691.740.76
2.05 1.151.25
1.391.412.402.261.30
1.201.050.90
2.64 2.221.631.90
1.932.250.920.661.501.31
DEL- RmS INMIN RES. PH. U.S.G.S.MLc (Ku) (SEC) QUADRANGLE
1.6 9.5 0.21 14 SOLDIER PASS22.3 0.07 6 HIKO8.6 0.45 6 ALAMO NE
1.7 28.0 0.33 5 CUTLER RESERVOIR15.3 0.07 12 UBEHEsE CRATER15.4 0.20 14 UBEHEDE CRATER
14.8 6.01 5 ALAMO SE19.6 0.68 12 BULLFROG2.9 f.17 19 TIPPIPAH SPRING
25.4 0.31 29 WAUCO6A SPRING5.8 0.35 9 GOLD POINT
2e.1 0.31 6 DELAMAR 3 tM
30.2 0.46 7 CRESCENT RESERVOIR75.9 0.26 12 CLARK MTN12.4 0.21 23 REVEILLE PEAK48.2 0.29 23 NEW YORK BUTTE8.1 0.25 18 ANMONIA TANKS
15.0 0.14 27 BENNIE CLAIRE SE
1.9 35.4 e.24 14 ee.QUAD. NOT LISTED42.7 0.23 10 -.. QUAD. NOT LISTED15.0 0.20 a BLACK MTN W76.4 0.21 8 CLARK WTN72.4 6.15 l6 HAIWEE RESERVOIR19.7 1.00 9 WORTHINGTON MTNS
80.3 0.29 13 CLARK 4TN12.7 0.16 22 BARE MTN11.9 0.13 10 TRAIL RIDGE64.1 0.29 19 *..QUAD. NOT LISTED66.2 0.41 22 es.QUAD. NOT LISTED21.0 e.09 14 BLACK YTN NE
21.1 0.14 15 BLACK 4TN NE11.7 0.14 5 BENNETTS WELL8.9 0.42 15 SCRUGHAM PEAK
63.5 0.3 19 **-QUAD. NOT LISTED13.6 0.25 17 BULLFROG82.9 0.27 17 HAIWEE RESERVOIR
2.5 82.7 0.31 6 *..QUAD. NOT LISTED472.3 0.18 10 .- QOUAD. NOT LISTED433.5 0.14 4 CACTUS SPRING15.1 0.07 15 BARE MTN34.6 0.16 7 WINCATE WASH0.2 2.35 7 FUNERAL PEAK
Is
S
D
13.9 0.23 22 YUCCA FLAT76.8 0.23 3J 4OUNTAIN SPRINGS CANrL1
--------

DATE - TIME LATITUDE(UTC) (DEG. N)
DEC 25 7:25: 6 37.23625 11:44:29 30.41825 17:22:53 36.64725 17:45:44 34.91126 1:49: 5 37.11626 2:21:13 36.643
26 8:47:32 38.90526 15:11: 6 38.43127 22: 2:25 38.50728 0:31:34 37.64728 0:32:16 37.36528 5:28:29 37.283
28 8:24:4e 37.5se28 8:24:54 37.53926 22.22:44 37.42028 22:23:17 37.41728 23:31:45 37.33229 1:22:53 37.333
29 1:50s:26 3.05029 6:48:18 3e.06936 22:57:15 38.967
41 31 10:48:57 38.481
LONGITU)E(DEG. W)
116.4e6118.032116.344116.758117.632116.351
116.759117. 98115.077114.745115.446115.171
118.482117.909116. 7291 16.898115.353115.35
117.896117.875115.995115. 372
*) I 0 . I1989 LOCAL HYPOCENTER
STAND STAND AZICRRUM DEPTH ERROR GAPH(KY) (KM) Z(KY) (DEC)
6.4 -4.52 0.4 481.1 8.89 6.6 2500.3 4.40 0.6 6604 11.01 1.1 1500.3 4.47 3.9 1056.6 4.65 0.4 169
6.3 8.48 1.6 1052.9 -1.02 2.0 2622.0 3.39 1.9 2336.6 2.23. - 288- 6.80. - 3095.5 -0.26 2.3 349
9.0 6.74 6.7 3185.9 7.90 9.9 2064.6 6.67 1.7 241- 7.0e0. - 2660.8 2.97. - 1436.6 11.65 3.6 143
2.2 7.0 4.9 2745.6 8.02 3.7 2720.3 8.61 e.5 1263.7 -1.23 2.5 265
I) i ) 9 13SLUAURY - SGB EARTHOUAKES
12S MAGNITUDE ESTIMATESYco Md MLh MLv
ABz 1.99 1.86 1.44E01 2.55AAI 1.80 1.09 1.14ACI 6.586CZ 0.91 0.74ACU 1.19 e.-3 0.96
ABZ 0.43 0.86COZ 1.83 2.16 1.79DOA 2.03DOI 1.43 1.38DDZX0Z 2.01
DDU 1.82DOU 1.82COA 1.20ADA 1.07OCA 2.05BCA 1.95
BOA 2.27CDA 2.54A8Z 1.24 1.05CDI 2.17 2.47 2.19
ULc
2.9
1.9
DEL- RYS tNIN RES. PH. U.S.G.S.(Kw) (SEC) QUADRANGLE
7.7 6.13 28 SCRLG PEAK76.7 6.21 38 *.*QwO. NOT LISTED.0. 6.1 26 STRIPED HILLS
17.3 6.08 17 BULLFROG14.9 6.13 21 BONNIE CLAIRE SE1.1 0.12 17 STRIPED HILLS
16.8 .16 17 BULLFROG68.7 0.20 12 KEELER
7.5 6.52 IS HAYFORD PEAK41.5 0.28 8 SUmFLOaER wTN31.6 6.16 5 CUTLER RESERVOIR17.4 6.16 5 ALAW
53.6 6.26 16 *;*OOUD. NOT LISTED.12.6 1.82 1 PIPER PEAK16.2 6.63 5 BLACK WTN W26.7 6.61 3 TOLICHA PEAK28.6 0.16 12 BADGER SPRING27.7 0.1 12 BADGER SPRING
01.6 *.21 11 HAIWEE RESERVOIR76.4 0.15 6 HAIWEE RESERVOIR6.6.e08 15 PLUTONIWU VALLEY58.7 6.30 14 FOREST HOME
Nt
( C

Appendix B
Chemical explosion location data for the years 1987, 1988, and 1989
The southern Great Basin of Nevada is seismically active from both natural and man-madesources. Chemical explosion seismic data acquired by the SGBSN have been scaled to provideinformation on the accuracy of the crustal models and the validity of the location algorithm used bythe SGBSN. These data should also be helpful in future research such as tomographic inversion ofP-arrivals to determine crustal structure.
Employees from the follow'ng organizations have been contacted and have provided helpfulinformation on source locations, times, and in some cases, TNT-equivalent source size:
(1) Bond International Gold, Denver, Colorado. Blasting at Ladd Mountain, Nev. (Bullfrog Hillsquadrangle), approximately daily (weekdays, 4 PM to 5 PM).
(2) Chemstar, Inc., Las Vegas, Nevada. Blasting at two limestone quarries, one in the Dry Lake,Nevada, quadrangle, and one in the Sloan, Nevada, quadrangle.
(3) Cyprus Tonopah Mining, Tonopah, Nevada. Blasting ir the San Antonia Mountains (San AntoniaRanch quadrangle), usually in the AM.
(4) Frehner Construction, North Las Vegas, Nevada. Blasting at limestone quarry in Sloan, Nevada,quadrangle.
(5) Saga Exploration Co., Beatty, Nevada. Blasting at Bare Mountain, Nevada usually early to lateafternoon.
(6) U. S. Geological Survey, Menlo Park, California. Chemical explosions during January, 1988, inrAmargosa Desert, Nevada, for seismic reflection feasibility survey See Brocher and others, Table 3
(1990), for shot information.
A number of other organizations are also known to be engaged in blasting in the southern GreatBasin of Nevada, but have not been contacted.
Column headings for this Appendix are identical to those for Appendix A. The depth of all blasts isat the surface (plus < 100 feet, usually), but in many instances, hypocenters have been located withdepth as a free parameter, to examine the location algorithm and velocity model. If the hypocenterdepth is reported as -1.00, it was fixed at that value during hypocenter determination. All otherdepths are freely determined. If the letters 'PB' follow the depth estimate, the event is a probableblast, but just enough ambiguity was present in the seismograms to prevent a certain judgment.Far more hypocentral data from chemical explosions than are presented in this Appendix have beendetected and archived by the SGBSN, especially for years preceeding 1989. The decision was madein late 1988 to scale arrival time and amplitude data and to include all resulting hypocenters forknown and probable blasts into the catalog, but to flag them as blasts (or probable blasts).
135

11 Ito 1 3a
0
v
0 + v+
OD V
v v c 3 7 . -0
7 7 ALAM
9COTMI AWCTZ"
0
v v \ +
, e - \t1l.; 5
V 7E5 OCII 3flN lr R ~t
00
DANWUE PANN
V lLAS V0mAS
+7+ -+ g
0
11435(
Ila SEISMOGRAPIUC STATION 0 CITY OR TOWN0 25 50 too0km
.m.g< l.O 0 2.0SMag< 3.0
01.O f.Mae <2.0 0 3.0 9mag
Figure B1. Preliminary epicenter map of blasts and probable blasts in the SGB, 1987 through 1989.
136

.)) I r' ; I .p , n
DATE - TIUE LATITUDE(UTC) (DEG. N)
JAN 16 23:35:19 36.806
OCT 20 0:35:38 36.935
NOV 8 18:13:57 386.94416 20:46:35 36.89118 0: 3:31 38.93919 1: 1:47 38.88223 6:49:29 36.889
DEC 19 0:28:46 36.94921 22:45:20 36.947
LONGITUDE(DEG. W)
116.909
1i6.890
116.883116.824116.894116.814116.812
116.882116.885
STAMERR(H(Kk
e.s
0.4
2.:
0.;1
el'0.'
1987 LOCAL HYPOCENTER SLU.ARY - SGB CHEUICAL EXPLOSIONS
ND STAND AZI 009 DEOR DEPTH ERROR GAP 12S MAGNITUDE ESTIMATES UlU) (KM) Z(KU) (DEG) Uco Md YLh MLw ULc (K
9 1.16P8 1.4 324 ADI 1.33 0.92
S -8.288L 9.7 116 CCA 6.97
.1U8PB 0.8 113 AC! 1.91 1.48 1.46 1.29 14 8.44PB 2.4 156 BC! 0.383 -6.9IBL 0.4 116 ACI 1.74 1.41 1.37 1) -1.23BL 18.3 252 CDI 0.712 0.21BL 0.6 126 ACI 1.52 1.22 1.06
5 -1.13BL 0.7 85 BCI 1.48 1.61 1.625 -1.101 9.7 125 CCI 6.93
,EL- RUS fNIN RES. PH. U.S.G.S.KU) (SEC) CUADRANGLE
25.2 0.66 13 BULLFROG 20-12.
13.9 0.09 12 BULLFROG
14.2 0.10 14 BULLFROG20.5 0.64 11 BULLFROG :0-713.4 6.10 19 BULLFROG 20-719.2 6.06 8 BULLFROG 20-720.2 0.65 17 BULLFROG
14.1 8.16 19 BULLFROG z:-613.9 0.08 11 BULLFROG
I-.
S.
-'-- -1-7

DATE - TIME(UTC)
JAN 10 23:15:1912 22: 8:3814 19:17: 4iS 18:58:1a15 19:18:4715 19:28:15
15 19:57:1215 26:21:4926 18: 7:36
FEB 7 19:24:517 19:27:26
11 2:05:1112 22:20: 5
15 21:57:1916 21.33:4916 21:33:5017 0:45:1817 0:45:1719 21:55:53
21 1: 2:39co 24 20:40:23
28 21:16:36MAR 1 6:34: 9
2 19:33:322 22:41:46
4 23:38: 76 6:58: 37 21:33: 3
10 20:14:5814 16: 3:3615 1:38:2317 20:32:31
21 1:50:1621 22:51:4125 1:53:15
APR 1 26:15:312 2:19:163 0:44:46
3 21:12: 23 23:11:445 1:47:235 20:33:556 20:21:168 0:26:25
8 21:21:44
LATITUDE(DEC. N)
36.88836.94536.93936.54436.57136.572
38.57336.89336.94436.89436.89836.95836.897
36.94436.88238.87836.90558.91036.920
36.88736.94436.93236.88036.90256.896
36.95436.89236.91236.96936.89136.89036.941
38.88838.89036.89936.92536.88536.897
36.89236.89036.88936.88638.89936.891
36.938
LONGITUDE(DEC. W)
116.816116.886116.888116.338116.374116.372
116.342116.814116.882116.815118.J14116.898116.813
116.886116.815116.804116.812116.811118.806
I16.812116.887118.890116.817116.809116.813
116.888116.814116.809116.815116.823116.814116.894
116.819116.814116.81411s.895116.1824116.815
116.817116.812116.814116.820116.815116.813
116.888116.814
) I .); I1988 LOCAL HYPOCENTER
STAND STAND AZIERROR DEPTH ERROR GAPH(KY) (KiW) Z(KO) (DEC)
6.4 -1.o06L 0.6 III0.4 -1.e0eL 6.7 866.3 -1.e6eL 6.9 1266.9 -1.0e0L 7.4 2700.4 -1.900L 15.5 956.5 -1.0eeL 0.9 91
0.3 -1.608L 6.5 870.4 -0.919L 6.9 1090.4 -1.006L 6.9 1136.4 -1.e001 0.9 1096.4 -1.606L 13.3 1090.4 -1.268L 0.9 1170.4 -0.501. 0.9 109
0.2 -1.e00L 8.7 1140.3 -1.6061 2.9 I1I1.7 20.106L 2.0 1761.2 -1.588L 13.6 15s0.5 -1.00L 2.5 1540.3 -4.258L 1.1 163
0.4 5.006L 5.4 810.2 -1.0061 7.0 1140.4 -1.0061 1.3 966.7 -1.0061 24.7 1120.6 -1.006L 8.1 1576.6 -1.0e6L 1.5 132
0.4 -1.06L 1.0 1l66.4 -1.006L 11.8 1100.4 -1.006L 18.2 1530.2 -1.006L 1.1 1186.5 16.868L 1.9 1250.3 -0.958L 6.7 1160.9 -1.16PB 16.9 225
0.4 6.4881 4.2 1116.4 -4.858L 6.8 1166.5 -1.306L 13.6 846.8 3.68. - 670.2 0.13P9 6.5 1270.4 -1.606L 1.6 121
0.2 -1.00BL 0.3 1230.4 -1.606L 0.8 1690.4 0.56PO 0.9 1100.5 -1.608L 1.1 1280.3 -1.001. 16.2 1210.3 -1.006L 9.9 110
6.3 -1.00BL 12.3 1260.4 -1.0ML 1.1 126b
; ) (0 2SUMMARY - SCB CHENICAL EXPLOSIONS
Om125 MAGN!TUDE
c a Md
ACIACI 2.26 1.68ACICDIcal
ABIACI 1.50 1.31ACIACI 2.16cc! 1.65ACI 1.48ACI 1.68
cclACI 1.73BC! 1.78Oct 1.43DCI 1.95ACI 1.24
cc! 2.05cclCCIAC! 1.54
CCICcOACI 1.72 1.0
AC! 1.22 1.78CcO 1.65ccACIABI 1.52 1.43AC!CDI
BC! 1.60 1.65ACI 1.51 1.55cc[ 1.54CCI 1.45ACI 1.35ACI 1.72
ACI 1.67 1.55ACI 1.85 1.59ACt 1.51ACI 1.55 1.30CCI 1.49 1.57ccl
CCI 1.40ACI
ESTIMATESULh ULv I
6.871.98 1.86
6.980.741.151.13
1.38I."00.961.476.94
1.44
1.251.43
2.67
1.391.746.976.951.68
1.531.411.261.250.846.82.50
1.286.63
1.50
1.221.39
1.061.676.74
1.550.85
DEL- R--MIN RES. P1H. U.S.G.S.
ULc (KM) (SEC) OUUDRAhGLE
22.1 6.12 17 BULLFROG14.6 6.11 23 BULLFROG14.0 6.6 11 BULLFROG11.2 6.63 8 LAThROP WELLS SE8.8 6.091 6 LAThROP WELLS SE0.6 6.12 15 LATHROP WELLS SE
8.6 .68 15 LATHROP WELLS SE22.6 6.12 15 BULLFROG
1.4 14.2 6.11 13 BULLFROG26.6 6.13 16 BULLFROG26.6 6.12 12 BULLFROG13.1 6.11 15 BULLFROG26.6 *.15 19 BULLFROG
13.9 .09 13 BULLFROG19.3 6.09 15 BULLFROG23.6 e.69 16 BULLFROG26.5 6.69 11 BULLFROG26.7 6.11 15 BULLFROG25.6 6.64 8 BULLFROG
22.5 6.11 5 BULLFROG13.9 6.11 12 BULLFROG14. 6.10 15 BULLFROG22.5 .11 8 BULLFROG26.1 6.16 11 BULLFROG19.9 6.11 15 BULLFROG
14.1 0.12 15 BULLFROG19.8 6.13 IS BULLFROG26.7 6.09 9 BULLFROG
1.3 26.6 6.65 13 BULLFROG26.5 6.09 18 BULLFROG19.6 6.11 16 BULLFROG27.4 6.09 12 BULLFROG
20.6 6.13 17 BULLFROG19.7 6.12 15 BULLFROG20.2 6.15 14 BULLFROG14.6 6.17 14 BULLFROG26.1 6.64 13 BULLFROG20.2 0.13 16 BULLFROG
20.6 6.08 14 BULLFROG19.5 6.13 l8 BULLFROG19.6 6.11 19 BULLFROG19.9 6.05 13 BULLFROG26.2 6.11 13 BULLFROG19.6 6.11 15 BULLFROG
13.9 0.04 10 BULLFROG20.3 6.1J 14 BULLFROG9 18:25:43 36.9ee
() C

I
) I l , 3 I ) ) 3) :3
1988 LOCAL HYPOCENTER SNLAARY - SGB CHEWICAL EXPLOSIONS
DATE - TIME LATITUDE(UTC) (DEG. N)
APR 10 15:51: 8 36.90716 23:40:18 36.89311 23:22:45 36.88813 0:18:45 36.89513 16:37:55 36.89216 19:39:46 36.899
17 18:36:41 36.88917 21: 3:20 36.88217 23:38:11 36.87818 16:34:10 36.94126 21:52:52 36.88226 22:49:22 36.935
22 15:26:46 36.89122 20:32:37 WO.88823 17:34:23 37.02825 18:51: 5 36.84525 20:51: 6 36.85126 0: 1:24 36.852
26 15: 5:36 38.88626 21:47:19 36.94327 1:49:55 36.89e
W 27 15: 8:49 36.891q. 27 22:24:31 36.85
28 21:28:38 36.935
28 22:24: 6 36.90436 1:36: 0 36.37736 19:49:49 36.888
MAY 2 23:17:33 36.8894 18:53:35 36.6384 18:57:32 36.036
4 22:51:26 36.9516 17:38: 5 3M9357 6:19:58 36.8867 17:19:58 36.8848 15:37:22 36.9018 19: 9:28 36.902
9 20: 1:18 36.93710 17:57: 0 36.93911 17:52:10 36.8311 19: 4:50 36.88611 22:54:18 36.89812 14:38:41 36.509
12 16:11:12 36.93916 15:58:33 34.939
LONGITUDE(DEG. W)
118.812116.619116.822116.815116.8181i6.814
116.818116.832116.821116.885116.slu116.880
116.815116.816116.11e116.304116.366118.299
116.816116.883116.814116.813116.817116W893
116.819116.371116.816116.813115.043115.033
116.883116.889116.815116.816116.813116.811
116 .ss611 C.884116 .811116.818116.817116.590
116.886116.882
STANDERRORH (KM)
0.20.40.30.30.40.4
0.54.20.90.40.40.4
0.40.40.46.50.38.4
6.40.40.30.40.40.3
8.46.60.50.53.31.6
0.50.56.46.96.46.3
0.40.46.50.66.51.0
6.40.4
STANDDEPTH ERROR(KM) Z(KM)
-1.0eBL 6.8-1.MOBL 1.2-1.606t 0.8-1.000L 0.9-1.0OWL 1.2-1.60BL 1.1
-I.OOBL 0.910.6P8 9.75.e0P8 4.7
-0.828L 1.1
-1.00BL. 0.8
-1.690L 1.4-1.e08L 18.66.4WP8 6.4
-1.648L 0.6-. 9301L 0.4-0.37BL 0.3
-1.8061 1.3-1.861. 1.3-1.000L 9.5-1.e00L 1.4-1.600L 1.4-1.00BL 12.7
-0.ssBL 12.6-1.6esL 16.8-1.60L 1.2-1.69sL 0.9-1.0HL 11.5-1.09ML 1.5
3.89sL 8.5-1.73P9 1.6-0.77P8 0.8a.91P8 3.7
-4.59P8 1.4-1.54PO 9.8
-1.s9PB 0.9-0.43Ps 1.2-I.56P8 1.4-e.19PB 1.8-1.82PB 1.31.87PB 2.6
-1.05Pe 1.3-1.20PB 1.1
AZIGAP(DEC)
118136126122I10120
129184168114126116
7912419104
788B
11187
11611e128
97
120198IIIlie279277
106611612811161
107
8887
109128124169
8787
000 DEL- RYS JN12S MAGNITUDE ESTIMATES MIw RES. PH. U.S.G.S.
Uco Md MLh MLv WLc (KM) (SEC) CUADRANGLE
ACI 6.77 26.6 0.07 12 BULLFROGACI 1.56 1.20 6.91 20.2 0.65 9 BULLFROGACI 0.66 20.2 0.08 10 BULLFROGACI 6.72 26.1 0.12 13 BULLFROGACI 0.63 20.1 0.08 13 BULLFROGACI 1.42 1.60 26.3 0.69 14 BULLFROG
ACI 1.51 1.29 0.97 19.9 0.16 15 BULLFROGCCI 6.37 20.0 0.0" 6 BULLFROCSC! 0.98 19.5 0.14 8 BULLFROGAC! 1.68 1.47 14.1 0.10 5 BULLFROGACI 1.42 1.41 0.79 19.5 0.08 14 BULLFROGACI 1.47 1.84 1.55 14.1 6.11 18 BULLFROG
8C! 1.85 1.64 1.66 1.1 19.8 0.15 21 BULLFROGCCI 1.60 19.7 0.10 10 BULLFROGADI 1.53 6.85 10.6 *.16 19 YUCCA FLATABI 0.24 2.4 0.10 10 JACKASS FLATSMI 1.38 0.74 1.7 0.07 12 JACKASS FLATSMI 0.28 2.0 0.09 11 JACKASS FLATS
AC! 1.66 1.44 1.05 19.6 0.12 16 BULLFROGACI 1.81 1.57 14.2 0.11 17 BULLFROGCCI 1.53 1.07 19.7 0.11 15 BULLFROGACI 1.61 1.07 19.6 0.13 16 BULLFROGACI 0.98 19.6 0.07 10 BULLFROGCCI 1.56 1.36 13.7 0.13 12 BULLFROG
CCI 1.24 20.8 0.19 14 BULLFROGC0I 0.99 1.45 0.74 0.98 9.6 0.11 12 ASH MEADOWSACI 1.56 1.10 19.7 0.14 15 BULLFROGACI 0.87 19.5 0.13 15 BULLFROGCD! 2.29 2.46 52.9 0.22 18 LAS VEGAS SECDI 2.75 2.49 3.21 2.83 2.9 72.0 0.49 20 LAS VEGAS SE
CCI 2.26 1.79 14.6 6.13 12 BULLFROGACI 1.42 1.05 14.6 0.10 13 BULLFROGACI 1.47 0.83 19.5 0.09 16 BULLFROGaCt 0.65 19.5 0.26 14 BULLFROGACI 1.53 1.80 1.. 20.3 0.13 24 BULLFROGCCI 1.17 20.2 6.13 14 BULLFROG
ACI 1.54 1.58 14.2 0.16 18 BULLFROGACI 1.65 1.59 14.3 0.10 17 BULLFROGACI 1.54 0.98 19.6 6.12 14 BULLFROGACI 0.96 19.7 0.08 12 BULLFROGACI 1.66 1.19 19.9 0.12 15 BULLFROGBCI 1.21 0.93 16.0 0.10 12 BIG DUNE
AC! 1.36 14.1 6.16 17 BULLFROGACI 1.65 14.4 0.11 16 BULLFROG

I I J .. J 11988 LOCAL tlYPOCENTER
I ) 0 1
SUUAARY - SCO CHEMICAL EXPLOSIONS
DATE - TIME LAT I TUDE(UTC) (DEG. N)
MAY 20 17:58:54 37.43320 21:28:36 36.92720 21:31:15 38.93221 0:20:35 36.88724 20: 6:40 36.94331 15:34:26 36.932
AUG 9 18:24:57 36.93627 23:23:36 35.923
SEP 1 22:41:34 36.8222 23:46:57 36.8956 23:37:54 36.9357 6: 8:49 36.8927 23:52:47 36.898
7 23:5S¶:55 38.8998 20:17:25 36.8538 23:59:31 36.89616 18:49:36 38.88512 17:43:29 38.94212 23:35:31 38.892
13 23:41:42 36.89014 6: 4:49 36.699
' 15 6: 7:31 38.89415 22:19: 2 36.94217 23:40:37 38.90319 23:26:27 36.943
20 0:24:12 36.90121 0:40:42 38.79421 1: 9: 0 36.89123 0: 9: 3 36.90324 0: 3:14 38.89824 0:50: 9 36.693
27 23:48:17 38.89728 6: 1:32 Wa.89028 23:47:19 56.89229 18:52:31 348.9030 6: 2: 7 36.90130 23:54:46 36.890
OCT 1 0:24:59 36s.903 16:25:39 36.8974 6:34:56 36.8905 1:16:31 36.8925 23:51:19 36.8966 6:21: 2 36.929
6 23: 6:58 36.8876 23: 7:30 36-.88
LONGITUDE(DEC. W)
116.860116.891116.893116.810116.882116.895
116.886115.124116.88311S.8i116.892118.824118.825
116.822116.620116.817116.818118.894116.829
116.614116.618116.815116.883116.812116.896
116.810116.206116.822116. 813116.819116.814
116.815116.822116.824116.685116.807116.815
116.815116.824116.824116.626116.812116.887
116.B1B116.819
STANDERRORH(KU)
6.26.56.50.40.56.3
6.52.2
0.46.56.70.3
6.41.06.40.30.90.6
0.40.56.56.36.32.4
6.46.56.56.30.56.5
6.56.56.36.50.40.5
0.40.46.56.36.50.6
6.86.3
S
DEPTH E(KM) Z
-1. 73P !-1.47P0-1.52PO-1.720LI .66We
-1.74PB
-1. 10BL6.9013L 26. SspE
-.0. 39P0
6.51 PB-1.538BL
7.72PB
11.74PS
-1.81ps-1.e3Ps1. 67P9
13.24PB
S. 83P86. 5861.
-1.488L
-1. 130t4,74s
-0. 828L
-1 .26PS6.961L
-1.1881.
2.918L3.1661
-0. 548L
8.448L-2.6061-4.91 BL-1.948L-0.5881
-0.808L7. SOPS
16. 42Ps-1 .601.
-1.76PS-0. 98P
-1. 63P9-1 .87PO
SAND AZI O0RROR GAP 12S(KU) (DEG)
MAGNITUDE ESTIMATESUco 4d ULh ULv MLc
9.11.60.73.01.26.7
1.e29.1
1.31.42.23.6
2.82.61.11.83.13.4
1.75.41.30.49.9
9.96.31.28.7
306.30.0
1.35.46.71.31.51.5
1.43.73.1
11.92.71.5
11.11.5
76118
117116117131
8819228817497130125
12315S116125115127
79122Ile87
168164
169146177169122116
1691261258783
110
58124126124leg95
149125
CCI 1.53ACI 'ACI 2.68 1.24sC! 1.58ACI
ACI
ACI 1.34ColADIACIACI 2.12BCI 1.63BCI 1.85
BIC!
PCI 1.42 1.64ACI 1.45BCI 2.22B81
ACI 2.29CCI 1.73ACIACICCI 1.89 1.33CCI
CCI 1.58ACI 1.62ACI 1.22CCI 2.01CCI 1.66CcI
ACI 1.30CciACIACI 1.48ECI
ACI
ACI 1.94BC!
CCIBCI 1.65ACI
CcIACI
1 .S1.191.50
1.381.271.01
1.86 2.1e.881.17 1.6
1.82 1.901 .57*.9g
0.8s0.886.840.561.86 2.06.92
1.841.321.45 2.61.541.511.60
1.90 1.,*.81 1.11.441.42 121.576.90
1.48 1.11.171.031.42
1.80 2.11.01
1.886.630.831.781.181.42
0.741.28
DEL- RMS ONMIN RES. PH. U.S.G.S.(KM) (SEC) aUADRANGLE
15.7 0.08 26 BLACK MTN NW14.2 6."9 12 BULLFROG13.8 6.12 16 BULLFROG19.2 6.13 18 BULLFROG14.3 0.10 13 BULLFROG13.6 *.U4 10 BULLFROG
14.2 0.12 18 BULLFROG33.3 6.12 9 SLOAN5.8 6.01 3 BARE MTN
26.4 0.09 14 BULLFROG13.8 6.14 21 BULLFROG26.5 6.11 14 BULLFROG26.9 6.65 13 BULLFROG
26.8 6.66 14 BULLFROG19.7 6.11 1f BULLFROG19.9 6.00 13 BULLFROG19.7 0.00 15 BULLFROG13.4 0.29 17 BULLFROG26.9 6.12 13 BULLFROG
19.7 0.13 21 BULLFROG20.5 0.16 16 BULLFROG26.6 0.11 15 BULLFROG14.2 0.09 16 BULLFROG20.3 6.66 11 BULLFROG13.6 0.05 16 BULLFROG
1 20.1 0.08 14 BULLFROG7.5 6.10 12 SKULL MTN20.3 6.08 13 BULLFROG
1 20.4 0.06 14 BULLFROG26.5 0.12 14 BULLFROG19.8 0.11 12 BULLFROG
8 20.2 0.13 16 BULLFROG26.3 S.8 13 BULLFROG20.5 0.06 12 BULLFROG14.2 0.11 13 BULLFROG
I 19.6 0.16 26 BULLFROG19.7 0,12 13 BULLFROG
26.3 0.15 25 BULLFROG26.8 6.08 10 BULLFROG20.4 0.67 11 BULLFROG26.2 6.69 15 BULLFROG19.9 6.13 14 BULLFROG14.4 6.15 15 BULLFROG
19.7 6.11 12 BULLFROG19.9 0.12 16 BULLFROG
C I ( (

J I o) I I ) ( i
1988 LOCAL HYPOCENTER SU4MARY - SG8 CHOJICAL EXPLOSIONS
DATE - TIME(UTC)
OCT 7 0: 8:458 23:49:609 20:2e:40
16 23:45:17It 17:24: 212 1:55:50
12 23:52:6012 23:58:3914 1: 8:4814 23:58: 815 6:24:5916 6:47:41
17 17:35:2918 23:42:2021 6:45:3921 22:58:4822 0:28:4222 0:58:16
22 0:58:1322 23:49:4923 16:45: 925 22:29: 226 20:27:5426 23:58:33
27 23:40:3627 23:53:1028 17: 5:5629 6:40: 729 0:53:3229 23:44:19
NOV 1 0:48:591 23:50:572 16:33: 83 0:42:183 22:38:233 22:39:16
4 0:42:485 0:45:225' 19:27:498 18:37:188 19:17:169 1: 1:52
11 0:48:5911 0:4J:60
LATITUDE(DEC. N)
36.89836.89336.88536.90s36.94636.892
36.89536.9"138.89136.90030.89130.893
38.94036.89836.89536.93936.87738.896
38.89736.88236.88536.94035.93536.899
36.88936.94336.88836.89336.96636.889
36.89136.93736.89636.89936.93935.942
36.89536.89936.88836.93936.88936.884
36.89736.896
LONCITUDE(DEC. W)
116.813116.819116.821116.818116.883116.825
116.81S116.816116.8241 16.836116.815116.817
116.884t16.813116.813116.8WM116.821116.817
11s. 818116.815116.616116.883115.234116.812
16 .817116.903116.835116.830116.815116.819
116.816116. 886116.814116.817116.890116.881
116.819116.812116.8256.884
116.819116.827
116.821116.813
STANDERRORH(KW)
0.46.40.56.46.46.7
6.56.30.36.76.40.3
6.56.26.36.46.56.3
0.36.36.4e,52.26.3
6.30.86.46.56.36.3
0.36.40.40.46.40.7
6.46.46.6e.56.31.0
0.80.3
DEPTH(KM)
-1. 11P8-1.94181.-0. 59Pe-1.06618-0 .35ps
6. 65P9
3.23.-1.23PS-0.62.15. 36P9
-1 .0661
-1.87PS
-1.61Pe-1.77PS-1 .93P-1.38.
6. 67P8
-1.43PO-1 . 8ape-4.77(-1.008L
-1 .60sL10. 92PS12 *1I9P9
9.86We-1. 13.
-1 .24PS3.66.
-1.606L-1 .5"P-1 .48PB
-1.0091-1.161.S. 87P9
-0. 27Ps-1.606L0.660
6. 68Ps-1.23Pe
STAND AZIERROR GAPZ(KU) (DEC)
1.4 1081.1 1231.5 127
15.1 12112.0 1005.1 139
- 11e11.6 16S- 1254.2 1251.1 1231.1 123
1.0 677.6 16"9.3 1691.0 871.4 113
- 122
11.1 1220.8 1111.8 1116.9 87- 2147.2 78
9.6 1243.1 1282.4 1363.6 127- 1261.1 78
11.6 1236.6 88- Ie"14.9 1211.1 1261.9 113
1.2 1231.4 184.9 1271.4 87
13.6 125- 128
9.6 1237.8 1I"
OOD12S MACNITUDE
Uco Md
ACI 1.65ACI 1.80ACICcICCI 2.67 2.16cC! 1.66 1.65
CCICciAcl
Ac!ACI 1.99
ACIcciCCI 2.67AC!ACIOcc
CCIACIAc!AC[CDI 2.57CCI 1.92
cCt 1.80Bet881 1.66Bc! 1.60OccACI
CCI 1.40ACIctiCCI
ACIACI
ACIACI
sctAcl
CCl
CC!CSI
DEL- miS fNESTI4ATES lIH RES. PON. U.S.G.S.
ULh MSLv Uc (KM) (SEC) QUAORANGLE
1.89 28.6 6.13 19 BULLFROG1.80 20.2 6.12 20 BULLFROG0.71 19.9 6.07 10 BULLFROG1.20 20.5 6.69 12 BULLFROG1.69 1.5 14.1 0.11 16 BULLFROG1.89 20.6 0.69 15 BULLFROG
1.46 26.3 6.14 17 BULLFROG0." 26.5 6.08 10 BULLFROG1.89 20.2 0.05 17 BULLFROG1.03 20.5 0.12 14 BULLFROG1.31 19.8 6.16 1S BULLFROG1.90 2.0 20.0 0.11 21 BULLFROG
1.65 14.3 0.10 18 BULLFROG1.15 20.1 0.13 16 BULLFROG1.99 19.8 6.13 22 BULLFROG
1.43 1.42 14.2 0.11 22 BULLFROG0.65 19.5 0.11 14 BULLFROG
26.2 0.89 14 BULLFROG
1.65 26.4 0.68 13 BULLFROG2.02 1.9 19.3 0.14 26 BULLFROG6.96 19.5 6.10 14 BULLFROG
1.56 1.91 14.3 6.11 15 BULLFROG2.34 43.2 0.13 8 SLOAN1.87 20.1 6.15 29 BULLFROG
2.15 19.8 6.11 19 BULLFROG12.5 0.e4 7 BULLFROG
1.55 20.6 6.08 14 BULLFROG1.41 26.8 6.10 15 BULLFROG
1.5 29.4 6.16 12 BULLFROG2.63 26.6 0.16 19 BULLFROG
1.45 19.9 0.16 17 BULLFROG2:11 14.2 .10 20 BULLFROG0.99 26.0 0.68 13 BULLFROG1.87 2.0 26.5 6.14 16 BULLFROG1.64 13.8 6.11 15 BULLFROG1.55 14.4 0.68 6 BULLFROG
1.80 20.4 0.13 18 BULLFROG1.60 29.1 6.14 16 BULLFROG0.93 20.4 0.e 12 BULLFROG1.59 2.0 14.3 0.11 16 BULLFROG1.02 29.0.0 14 BULLFROG1.77 1.7 29.4 .13 14 BULLFROG
1.63 20.6 6.11 12 BULLFROG1.67 19.9 6.13 16 BULLFROG
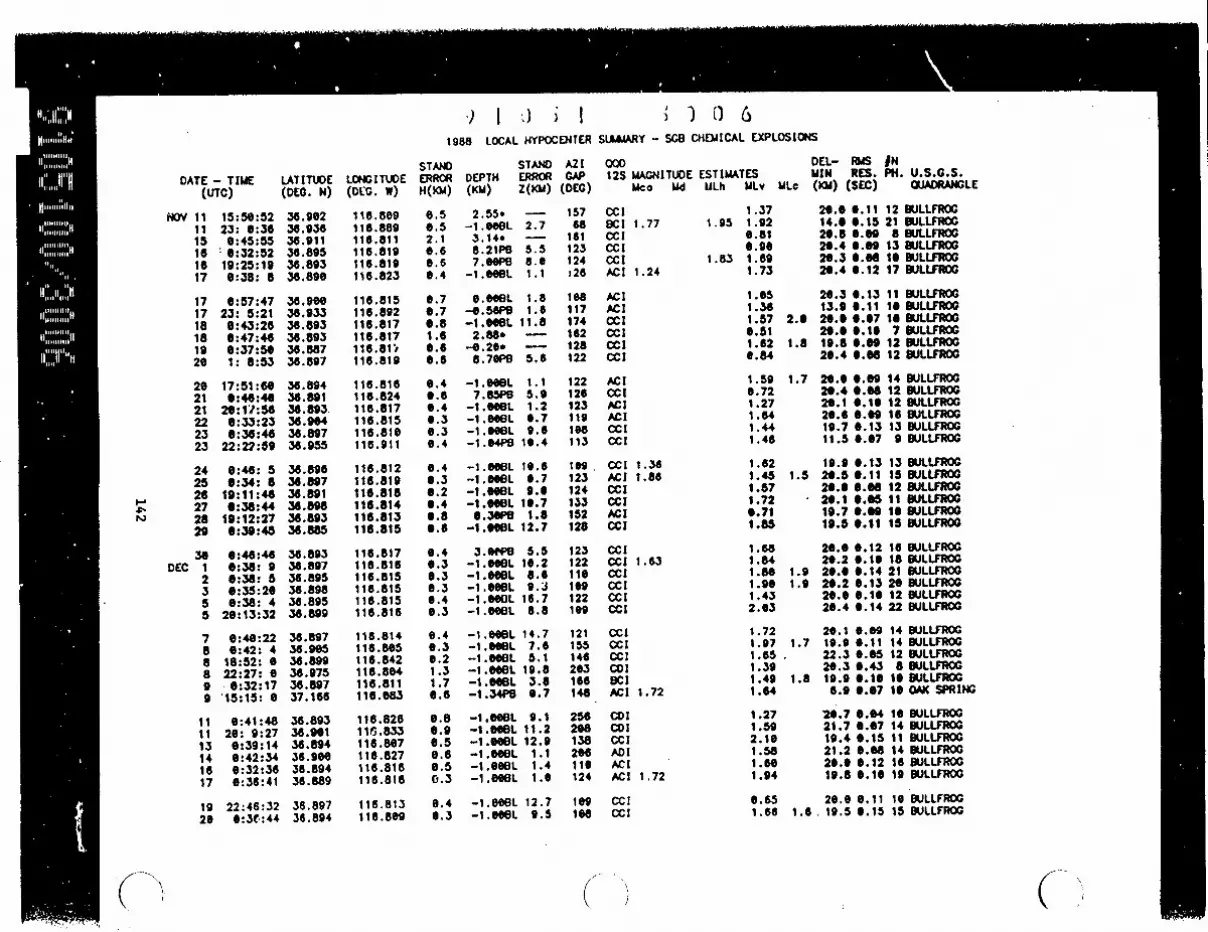
) I ;) j I1988 LOCAL HYPOCENTER
; ) ( 6SLuMARY - SG8 CHOEICAL EXPLOSIONS
DATE - TIME LATITUDE LONGITUDE(UTC) (DEG. N) (DEG. W)
NOV 11
Is1516
17
1717l8i81926
262121222323
2425
Ha 264 27
2829
30DEC 1
2355
788899
111113141617
1926
15:50:5223: 0:366:45:556:32:52
19:25:196:38: 8
0:57:4723: 5:210:43:266:47:446:37:501: 8:53
17:51:50*:44:40
26:1V:500:33:230:36:46
22:22:59
0:46: 50:34: 8l
19:11:466:38:44
19:12:276:39:45
0:44:440:36: 90:36: 50:35:200:38: 4
20:13:32
0:40:220:42: 4
18:52: 022:27: 66:32:17
'15:15: 0
6:41:4826: 9:27
6:39:146:42:340:32:360:36:41
22:46:32e:uW:44
36.90238.93836.91136 .89536 .89336.8se
36.96636.93336.89336.a9336.66736.897
36.89430.89136.893.36.90438.89736.955
36.89636 .89736.89136.89836.89336.85
36.89336.89736.89536. 89838.89536.899
3z.s9736.90536.89936.97536.89737.166
36.89336.96136.89436.90036 .89436.889
36.89736.894
116.8091 16.889116.811116.819116.819116.823
116.815116.892116.817116.8171 16 .8 1.116.619
116.816116.824116.817116.815116.810116 .911
116 .812116.819116 .818116.814116.813116 .815
116 .817116.816116.815116.815116 .815116.816
116.814116.8.5116.842116.804116 .811116.083
116.8261 16i.833116.807116 .827116 .816116 .816
116.813116.809
STANDERRORH(K10)
6.56.52.10.66.60.4
6.70.76.81.60.60.6
6.40.60.40.36.30.4
0.46.30.20.46.80.6
0.46.30.36.36.46.3
0.46.30.21.31.70.6
0.86.96.50.66.5E.3
0.46.3
STANDDEPTH ERROR(KM) Z(KM)
2.55. --1.900L 2.73.14. -8.21PB 5.57. 0P9 6.0
-1 . e61 1,.1-I.eBL 1.10. OWL 1.8
.4.5"P 1.6-1.eeeL 11.82.88 -
-0.26 -
6.76P9 5.6
-1.668L 1.17.85PS 5.9
-1.6901 1.2-1.6001 6.7-1.00L s9.6-1.e4PB 16.4
-1.669L 10.6-1.0661 0.7
-.esL 9.0-1.0061 16.76.3W6 1.8-1.001. 12.7
3.oP9 5.5-1.60OL 10.2-1.801 8.6-1.606L 9.3-1.60OL 16.7-1.eeBL 8.8
-1.0eBL 14.7-1.6091 7.6-1.6691. 5.1-1.00L 19.8-1.061e 3.8-1.34P8 0.7
-1.6981 9.1-1.066L 11.2-1.666L 12.9-1.069L 1.1-1.606L 1.4-1.6981 1.6
-1.009L 12.7-1.86eL 9.5
AZIGAP
(DEG)
157
161123124j26
168117174162128122
1221261231191e6113169
109 .123124153152128
123122116les
122169
121155146203166148
25U206138260le
124
169168
00012S MAGNITUDE ESTIMATES
Uca Md ULh MLv I
ccI 1.37BC! 1.77 1.95 1.92Cci 6.81ccI 6.90CCI 1.83 1.69ACI 1.24 1.73
ACI 1.65AC! 1.36cCI 1.57cCI 0.51cCI 1.62
Occ 6.8.4
ACI 1.59cci 6.72Ac! 1.27AGC 1.64ccl 1.44CCI 1.46
cci 1.36 1.62ACI 1.86 1.45CCI 1.57CCI 1.72ACI 0.71CCI 1.85
Occ 1.68CCI 1.63 1.84OCCI 1.secci l.a.Occ 1.96cCC 1.43CCI 2.03
ccI 1.72Cci 1.97cc] 1.65CDI 1.39BCI 1.49ACI 1.72 1.64
CDI 1.27CDI 1.59cci 2.10ADI 1.58ACI 1.60ACG 1.72 1.94
CCI 0.65OCt 1.66
DEL- RMIS INMIN RES. PH. U.S.G.S.
1Lc (KM) (SEC) QUADRANGLE
20.0 0.11 12 BULLFROG14.0 0.15 21 BULLFROG20.8 6.0e 8 BULLFROG20.4 0.69 13 BULLFROG20.3 0.68 10 BULLFROG20.4 0.12 17 BULLFROG
20.3 0.13 11 BULLFROG13.9 9.11 10 BULLFROG
2.0 20.0 6.07 10 BULLFROG29.00.10 7 BULLFROG
1.8 19.8 0.09 12 BULLFROG26.4 0.68 12 BULLFROG
1.7 20.0 0.e 9 14 BULLFROG20.4 O .0 12 BULLFROG26.1 0.10 12 BULLFROG20.e 0.69 16 BULLFROG19.7 0.13 13 BULLFROG11.5 0.07 9 BULLFROG
19.9 0.13 13 BULLFROG1.5 29.5 0.11 15 BULLFROG
20.0 0.68 12 BULLFROG20.1 0.65 11 BULLFROG19.7 6.09 10 BULLFROG19.5 0.11 15 BULLFROG
26.0 0.12 16 BULLFROG20.2 0.10 18 BULLFROG
1.9 20.0 0.14 21 BULLFROG1.9 20.2 0.13 20 BULLFROG
20. 0.10 12 BULLFROG26.4 0.14 22 BULLFROG
20.1 0.69 14 BULLFROG1.7 19.9 0.11 14 BULLFROG
22.3 6.05 12 BULLFROG20.3 0.43 8 BULLFROG
1.8 19.9 0.10 10 BULLFROG6.9 0.07 10 OAK SPRING
20.7 0.64 10 BULLFROG21.7 0.67 14 BULLFROG19.4 0.15 11 BULLFROG21.2 0.08 14 BULLFROG26.0 6.12 16 BULLFROG19.8 0.10 19 BULLFROG
20.0 6.11 16 BULLFROG1.6 19.5 6.15 15 BULLFROG
C ) (

9 I I j I ', ) I ) 7
1988 LOCAL HYPOCENTER SUUUARY - SG8 CHEUICAL EXPLOSIONS
STANDDATE - TIME LATITUDE LONGITUDE ERROR DEPTH
(UTC) (DEG. N) (DEG. w) H(KW) (KM)
STAND AZIERROR GAPZ(KU) (DEG)
000 DEL- RMS fN12S MAGNITUDE ESTIMATES MIN RES. PH. U.S.G.S.
Mca Md MLh ULv MLc (KU) (SEC) QUADRANGLE
DEC 202021212323
242729293031
17:34:1521:38:440:38:49
18:40:390:30:21
22:28:52
0:35:540:47:110:36:43
23:19:530:31 :570:42: 1
36.94135.92336.89136.89836.89336.940
36.90336.89336 .89836.94536.90136.902
116.885115.220116.815116.813116.6121160.88
116.815116.815116. b1411 6.8861 16.816116.811
0.61.66.36.3e.30.4
9.30.40.3e.58.40.4
-1.72. -17.20PB 2.3-1.0061 11.0
-1.eoBL 8.5-1.006L 9.6-1.96PB 9.4
-l.0BL 19.4-l.06L 13.7-1.0061 7.4-1.OOBL 1.2-1.000L 10.6-I.609L 17.1
11419513e1lU10987
16912279
113170142
cCI901 1.72CCI 1.51cciccicci
1.281.44
*.59
2.011.951.34
1.411.701.90
1.66 1.761.991.95
14.1 0.10 8 BULLFROG41.9 0.18 16 SLOAN
1.3 19.8 0.11 14 BULLFROG20.1 0.14 16 BULLFROG19.7 0.13 15 BULLFROG14.1 0.09 1s BULLFROG
20.6 0.10 15 BULLFROG19.9 0.09 14 BULLFROG26.1 0.14 29 BULLFROG13.9 9.11 14 BULLFROG
1.7 20.5 0.15 15 BULLFROG20.2 6.07 14 BULLFROG
cCIOccOccACIcCIcCI

) I ) j 1
1989 LOCAL HYPOCENTER
; ) t) 3SLAUARY - SG8 CHEiICAL EXPLOSIONS
OO DEL- RMS fN
12S MAGNITUDE ESTIMATES MIN RES. PH. U.S.G.S.
Uca Md MLh ULv ULc (KI) (SEC) QUAORANGLEDATE - TIME LATITUDE(UTC) (DEG. N)
JAN 1 0:46:43 36.8942 0:33:25 36.9014 6:46: 2 36.8956 0:31:53 36.8947 3:43: 2 36.8928 0:35:10 36.893
l 17:15:10 36.93811 e:48;58 36.89713 18:54: 7 36.94014 1:14:27 36.89115 0:39:42 36.90017 6:41:48 36.892
18 0:14: 3 36.93819 0:45:45 35.89719 22:39:54 36.94121 0:47:41 36.89823 22:23:30 36.94125 0:41:52 36.894
26 0:43:45 36.89026 18: 6:41 36.82728 1: 2:38 36.8912; 1: 9:53 36.89328 1: 0:40 36.89230 0:47:49 36.894
FEB 2 e:49:49 36.8893 0:35:51 35.5833 0:42:40 36.8984 6:59:39 36.8996 0:52:40 36.8989 0:43:48 36.893
9 22:47:23 36.94311 1: 4:53 36.89712 0:56:43 36.89614 1:25: 6 36.89714 22:26:18 36.93515 0:37:46 35.584
16 0:58:11 36.89316 18:13:23 36.93818 1: 1:39 36.89719 0:57:37 36.89521 1: 2:38 36.89323 1: 6: 7 36.894
23 22:26: 3 36.93524 0:57: 4 36.894
LONGITUDE(DEG. w)
116.814116.816116.814116.816116.820116.812
116.888116.815116. 86116.815116.816116.816
116.884116.815116.882116.815116.887116.817
116.812116.791116.813116.816116.812116.814
116.815115.569116.816116.s80116.814116.816
116.887116.814l16.816116.817116.886115.576
116.813116.891116.812116.812116.813116.816
116.886116.812
STANDERRORH(KW)
0.46.36.30.2e.30.2
1.20.20.46.46.36.4
6.46.30.46.40.46.3
6.4
e.36.3e.30.3
6.61e.96.46.36.36.3
6.56.30.46.,,6.30.9
0.46.70.36.36.3e.2
6.60.4
STANDDEPTH ERROR(KU) Z(KO)
-1.0061 16.3-1.606L 11.5-1.e0eL 9.1-1.008L 6.7-1.08BL 9.8-1.608L 7.3
-1.69. --1.6eBL 6.6-1.oeBL 16.2-1.e00L 16.8-1.081L 11.3-1.600L 11.2
-1.60BL 12.4-1.001. 11.3-1.808L 9.8-1.O0OL 2.6-1.606L 13.6-1.eoBL 9.2
-1.60BL 16.5-1.56ps --1.0eBL 16e.-1.06eL 9.5-106eBL 11.8-1.606L 16.5
-1.00BL 3.7-1.6001. 30.6-1.091L 10.3-1.00BL 9.1-1.008. 10.0-1.68BL 9.9
-1.00BL 1.3-1.6061. 9.5-1.06BL 1.2-1.061L 10.1-1.60BL 9.7-1.00BL 30.6
-1.00BL 10.9-1.6061. 21.9-1.860L 8.6-1.609L 9.7-1.60BL 11.2-1.e0BL 6.6
-1.78PB 12.0-1.006L 1.5
AZIGAP
(DEG)
1741438e
10879
109
166109114
57143175
114121
8747
11479
78332
781106062
116266
79168
144116
114169
58115241
6211679
57122lie
144109
CCICCI 1.91CCICCI 1.85cciccI
cclCCICCICCI 2.64cclccl
OccCCICCI 1.75
cct 1.65cCl 1.99
CCIADICcICcicCI 2.35
CCI
ctCIDCICCICCI 1.82accCCI 1.92
ACICCIACI 1.77OcctCCI 2.41CDI
CCICCI 1.79ccI 1.96ccI 2.03cCI 1.94cci
CDIACI 1.59
1.622.162.131.842.021.95
1.332.171.721.912.021.79
1.411 .651.642.01.54
2.05 2.27
1.76 2.261.22
1.59
2.08
2.011.151.98
1.631.58 1.64
2.14
1.282.691i.77
2.07 2.271.51 1.72
1.76
1.61 2.011.40
1.68 2.171.95 1.961.872.10
1.461.48 1.96
19.9 o.1e 16 EXLLFROG2.2 26.4 0.16 16 BULLFROG
19.9 6.14 21 EULLFROG19.6 0.13 12 BULLFROG
2.6 20.2 6.12 19 BULLFROG19.6 0.15 26 BULLFROG
14.6 6.16 7 BULLFROG21.7 0.14 16 BULLFROG14.1 6.16 13 BULLFROG19.6 0.13 20 BULLFROG26.4 0.09 18 BULLFROG19.9 0.10 15 BULLFROG
14.3 0.12 13 BULLFROG20.1 0.e9 15 BULLFROG14.4 6.69 16 BULLFROG26.2 6.14 26 BULLFROG14.6 6.15 11 BULLFROG
2.1 20.1 0.13 28 BULLFROG
1.7 19.5 0.17 17 BULLFROG15.6 0.04 4 BULLFROG19.7 0.12 17 BULLFROG26.0 6.17 16 BULLFROG19.6 6.14 30 BULLFROG19.9 0.14 27 BULLFROG
1.7 19.7 0.16 14 BULLFROG0.3 6.65 6 MESQUITE VALLEY20.3 0.15 19 BULLFROG
2.5 19.9 0.13 16 BULLFROG20.2 6.09 19 BULLFROG26.6 6.12 18 BULLFROG
13.9 0.16 11 BULLFROG20.1 0.13 20 BULLFROG20.2 0.13 25 BULLFROG20.3 0.15 28 BULLFROG14.2 0.12 17 BULLFROG79.7 0.64 7 CLARK MTN
19.7 6.13 22 BULLFROG13.7 6.14 13 BULLFROG
2.4 19.9 0.13 23 BULLFROG19.8 6.13 24 BULLFROG19.8 6.68 16 BULLFROG20.0 6.13 21 BULLFROG
14.2 0.69 5 BULLFROG19.7 6.14 22 BULLFROG
C" ( ci-.-

-K
) I ') ) I ; ) 0 9
1989 LOCAL HYPOCENTER SUMMARY - SC8 CHEUICAL EXPLOSIONS
DATE - TIME(UTC)
FEM 26 1: 2:3227 1: 7:5227 18: 7:35
LAR 1 18:16:283 1:28:424 0:57:36
5 1:56:377 1: 8:118 0:57:369 1: 5: 69 18:32:2216 1:15:42
10 21: 9:4314 1:38:3615 0:58:3215 22:20:4216 0:57: 317 0;58:57
18 22:22:5119 0:57:2020 22:37:13
t 21 1:37: 421 18:31:3822 1:13:36
23 1: 4:4123 18:39: 924 0:58:3924 22:24:3525 1:11:5626 0:47:57
29 0:58:1430 1: 3:3731 0:59:35
APR 1 0:58: 23 24: 0: 34 20:51:40
4 21:44:156 O: 1: 28 21: 1: 0
11 0: 3:1212 17: 6: 913 0: 4: 5
14 0: 4: 415 0:31: 2
LATITUDE(DEG. N)
36.89436.89536.93938.94238.89136.891
38.89336.89936.89436.89238.94636 .892
36.83836 .89338.89336.94236.89436.889
38.94036.89436.94036.89136.94438.894
36.89136.94036.89336.94438.89636 893
36.89536.89336.89538.89236.89537.274
36.94236.89436.93938.89336.94536.895
36.89536.895
LONGI TUtDE(DEG. W)
1 16.B8151I6 8 ~13116.881116.884116.814116.814
116. 815116.8 u116.812118.815116.885116.803
116.646116.813116.817116.887116.8 1311 6.810
116.887116.813116.891116.8131 16.885116.812
116.813118.882116.815116.885116.812116.815
118.819118.811118.813i18. 85i116.8121 e.416
116.885116.812116.885116.811118.882116.814
116.813116.814
STANDERRORH(KM)
0.70.40.30.40.4
0.4
0.40.40.40.45.20.3
0.80.30.40.50.30.4
0.40.50.70.30.40.4
0.40.40.40.40.50.4
6.30.30.30.30.32.1
0.40.30.38.36.60.4
0.30.3
STAND AZI CODDEPTH(KU)
-I .OeBL-1.0808-l .OOOL-1.86PS-1.0061.-1.008L-1.0061.
-1.0681.-1 .e006-1.0081-1 .00EL
-1 .76P0
-1 .91Ps-1.008L
-1.9061.-1 .8se8-1.088L
-1.0001.-I .000L-1.6098-.0081.
-1 .eoee-1.0061
-1.008L-1.060L-1 .066L-1.00BL-1.006L-1 .00e6L
-1.000L
-1.0061
8 .37P0
-1.0061.-1.0061-1.8001-1.0081
-1.0061L
-1.008L-Ie.08
ERRORZ(KM)
2.81.3
11.50.91.21.7
1.51.31.51.68.48.4
6.61.6
11.28.6
13.61.3
8.91.7
14.37.910.1
1.3
1.514.1
1.68.63.312.2
10.98.79.36.38.83.9
11.18.19.79.8
12.410.7
9.4Ie.z
GAP(DEG)
7410910e114
le78
571e87979
1791e9
22057
12314812278
8879
16611616219s
628757878e57
12379575757
214
11479
11416915257
7957
12S MAGNITUDE ESTIUATESUcc Md ULh ULv
DCA 2.27ACI 1.73CC!ACIACI 2.05ACI 1.85
ACIACI 1.69ACI 2.06ACI 1.83DCICCI 2.16
ADIACI 2. 12cci 1.85CCI
AC!
CCMBc! 2.39CCI 1.40 1.23CCI 2.46CCIAC! 1.92
ACI 1.88CCI 1.60ACI 1.84CMECU 1.64CCU 1.83
CCU 1.77CCU 2.00cCU 2.02
CCI 2.19CCI 2.6580D
CCI 1.61CCICCICCI 1.95CCICCI
CCI 1.97cci 1.90
2.011.451.362.081.82
2.07
1.79 1.971.94
1.99 2.111.56 1.91
1.181.74 2.12
0.632.04
2.611 .64
1.58 1.95s.93
1.89
2. 4
1 .75
1.39
1 .042.291.32
DEL- RUAS fNUIN RES. PHN. U.S.G.S.MLc (KU) (SEC) t EADRANGLE
21.9 6.15 10 BULLFROG19.9 0.13 24 BULLFROG14.6 6.1 13 BULLFROG14.1 6.12 17 BULLFROG19.8 0.13 20 BULLFROG
2.0 19.7 0.13 20 BULLFROG
20.0 0.14 28 BULLFROG19.9 0.13 20 BULLFROG19.8 0.14 24 BULLFROG19.9 0.14 20 BULLFROG13.9 6.14 6 BULLFROG19.6 6.14 21 BULLFROG
4.9 0.08 7 BARE MM19.8 6.14 32 BULLFROG20. 6 .12 17 BULLFROG13.9 6.11 12 BULLFROG19.9 6.11 17 BULLFROG19.3 6.13 22 BULLFROG
1.6 14.6 6.16 19 BULLFROG19.9 6.16 23 BULLFROG
1.4 13.7 6.e6 7 BULLFROG19.6 6.13 27 BULLFROG14.0 0.11 11 BULLFROG19.7 0.14 21 BULLFROG
19.6 0.12 26 BULLFROG26.9 6.09 14 BULLFROG
2.1 19.9 0.14 25 BULLFROG14.6 0.08 13 BULLFROG19.6 6.16 19 BULLFROG19.9 6.13 20 BULLFROG
1.9 20.3 J.10 17 BULLFROG19.6 0.15 24 BULLFROG19.9 0.14 24 BULLFROG19.8 6.12 32 BULLFROG19.8 6.14 23 BULLFROG16.5 .65 7 SILENT BUTTE
14.1 0.10 11 BULLFROG19.7 6.14 23 BULLFROG14.2 0.13 12 BULLFROG19.6 0.15 20 BULLFROG
1.5 14.2 0.10 8 BULLFROG20.0 6.14 23 BULLFROG
19.9 6.15 23 BULLFROG20.0 0.15 23 BULLFROG
1.78 1.901.44
1. 88 1.801.44
1.58 1.871.76 1.92
1.541.881.88 2.082.061.51 1.86
1.36
1.311.99
1.561.82
1.181.88
1.771.85
1.87

.) I i1 . I ; 3 I 0
1989 LOCAL HYPOCENTER S^.RY - SCB CHEMICAL EXPLOSIONS
DATE - TIME LA(UTC) (D
APR 15 17:44: 4 318 6: 9:19 318 21:27:25 318 23:59:18 320 0:48:41 Z21 17:39:10 3
22 6:31:20Z24 22:45:37Z25 6:18: 826 6: 1:4927 0:51:3328 17:27: 2
29 6: 1:28MAY 2 1: 8: 8
3 : 4:64 1: 4;3e4 22:48:475 23:44:29
8 23:58:3510 6:29:431o 17:17: 6
* ~11 0:39:1612 6: 9:2112 23:50:28
13 1: 9:3816 8: 0:2416 17: 5:2117 6:14:1417 23:54:13is 0:15:23
20 0: 8:4823 0: 3:2623 17:46:2523 21:30:1824 0:42:2425 0:18:33
25 6: e:2526 e: 3: 527 6: 3:3327 22:46:1128 1:10:1330 21:22:33
31 0:39:2331 21:26:42
TITUDEEC. N)
6.945'6.8928,93736.889
*.890!6.941
56.89216.93756.89236.89536.89236.938
38.89436.89136.89136.88936.93836.893
38.89136.89536.93936.89536 .89436.892
36.94236.89636.94136.89236.93836.892
36.89136.89336.94636.94736 .89436.892
36.89436.93938.89536.94e36.89236.946
36.89236.947
LONGITUDE(DEG. W)
116.883116 .815116.884116.813116.813116.669
116 .815116.8801 16.8171 16.81611S.815116.888
116.810116.813116.813116. 882116.888116.812
116.813116.811116.892116.815116 .813
116.882116.814116.881116.814116.884116.813
116.815116.889116.881116.882116.615116.814
116.813116.887
116. 813
116.883116 .811116.882
116.811116.883
STANDERRORH (KW)
0.40.40.40.40.30.5
0.36.50.50.40.30.5
0.20.30.30.30.50.3
0.40.30.60.30.30.3
0.50.40.50.40.40.4
0.40.30.76.70.30.3
0.30.40.30.60.20.5
0.20.5
DEPTH ERq(KM) Z(
-1.0061 It-1.0061
-1.006L V-1.00L1S
-1 .OeL I
-1.608L 1-1 .60L 1I-1.008L:
_1.008L 14
-1. OfL
_1i. tBL
-1.008L
-I.OOBL1
-1.008L1-1 .0061
-1.0081
-1.008L_1.00BL1-1.600BL1
-1 .00sL-1.0001-1.008L
-1.0081
_1 .0061t
-1 .0061-1 .006f8
-1 .0061
-1.8061
i-1.00BL
!-1. 0081i-1 .0081
!-1 .0061i-I1.0081
STTANDRRORKM)
0.25.71.8
1.2
9.95.31.32.80.22.1
7.09.80.20.12.29.4
1.77.71.59.48.26.5
13.110.711.91.6
15.31.3
1.610.016.714.216.29.9
9.911 .9.1I .27.t
14.72
I.:1
GAP(DEG)
8662886256
164
7999
123625788
109505
Ile116
ee79
798088
10979
109
113578779
101109
79108125152lie
1 79
1 7986
a 109r 103
2 1092 112
IGAP12S UcGNITDE ESTIMATES~
mco M M~h ~v.2 L
DEL- RM0MIN RES.(Ks) (SEC)
INPH. U.S.G.S.
QUADRANGLE
CCICCIACI 1.68CCI 1.99CCI 2.23ACI
ccICCIAC I1.80BC'CCIBCI 1.41
CCI 1.90CCIccICCI 1.87CciCCI
ACI 1.70CCI 2.06BC!CCICCICCI
CCICCIccIACI 1.78CCIACI 1.88
eC! 1.78ccICCICCIccIcci
CcicclCCI i.79ACICCI 1.60CCI
CCIACI
2.051.591 .83
2.64
2.08
1.742.41
1.762.611.671.90
2.66
1.621.95
'.791.61
1.54
1.83
1.59
1.85
1.761.70
1.70
1.681.391.52
1.45
1.28
1.51
*.89
1.361.56
1 .44
2.521 .2g0.87
2.39
1.461.54
1.241.671.33
1.052.16
2.501.831.231.61
1.83
1.112.131.161.720.80
1 .39
14.1 0.11 15 BlULLFROG19.8 0.14 25 BULLFROG14.4 0.16 18 BULLFROG19.5 6.12 20 BULLFROG19.6 0.13 26 BULLFROG13.7 0.11 12 BULLFROG
19.8 0.14 19 BULLFRiG14.7 0.09 8 BULLFROG
1.6 20.6 6.12 14 BULLFROG20.1 6.14 24 BULLFROG19.8 0.13 29 BULLFROG14.6 0.12 15 BULLFROG
2.5 19.5 6.13 20 BULLFROG19.7 0.12 24 BULLFROG19.6 0.13 18 BULLFROG19.4 0.13 18 BULLFROG14.6 6.14 15 BULLFROG19.7 6.14 22 BULLFROG
19.7 0.15 22 BULLFROG19.7 0.14 18 BULLFROG
1.7 13.6 0.15 14 BULLFROG26.0 0.12 13 BULLFROG19.8 6.13 27 BULLFROG19.7 0.12 20 BULLFROG
14.3 0.11 11 BULLFROG20.6 6.14 21 BULLFROG14.5 .16 13 BULLFROG19.7 .14 20 BULLFROG14.3 0.12 12 BULLFROG19.7 0.13 19 BULLFROG
19.7 0.15 24 BULLFROG19.5 0.14 14 BULLFROG14.2 6.19 12 BULLFROG14.2 0.09 7 BULLFROG19.9 0.13 18 BULLFROG19.8 6.13 21 BULLFROG
19.8 0.15 21 BULLFROG14.1 6.11 16 BULLFROG19.9 6.14 21 BULLFROG14.1 0.11 12 BULLFROG19.5 6.13 18 BULLFROG14.2 6.12 14 BULLFROG
19.5 0.13 19 BULLFROG14.4 6.68 9 BULLFROG
C, ) ) C

') I o i, I I :) I I
1989 LOCAL HYPOCENTER SLWARY - SGO CHEMICAL EXPLOSIONS
DATE - TIME LATITUDE(UTC) (DEG. N)
JUN 1 0:36:27 3:.8951 23:54:26 36.8933 8:28:30 36.8944 17:22: 0 36.9456 0: 6:22 36.8957 6: 4:19 36.891
7 17: 1:43 36.9447 21:45: 1 37.1738 6: 1:34 36.8888 17: 5:54 36.94216 6: 2:28 36.89512 22: 7:38 36.936
13 6: 6:27 36.89314 0:47:18 38.89514 17:28:46 36.94314 21: 2.:18 37.61514 21:24: 3 36.94916 6: 3:21 38.896
20 17: 7:29 36.94326 23:58:26 36.89322 6: 6: 1 36.90222 17: 7:57 36.93223 0:10:21 36.89123 20: 7:66 37.811
24 6:13:56 38.89627 21:35:37 38.94728 0: 1:17 56.89529 6: 6:17 36.89229 23:59:59 35.89338 17: 9:51 36.935
JUL 7 23:43:21 36.8948 22:54:52 35.589
16 22:24:25 38.33416 22:47: 4 35.52911 25: 1:42 35.64212 12:35:32 56.896
12 22:37:31 35.64312 23:51:47 36.89517 23:58:14 36.88918 17:57:38 36.93618 25:48: 8 36.88626 0:48: 3 38.894
22 6:19:53 36.89222 12:43:24 38.891
LONGITUDE(DEG. W)
116.8511116.a12116.8141 16.888116.ae81e.817
116.8861 16.i69116.815116.886
a16.813116.885
116.813116.815116.891116.177116.882116 .815
116.8841 i a.82116.8a1111.e892116.812116.581
116.811116.884116.816116.813116.813116.888
116.813115.572117.307115.804115.573118.811
.115.543116.816116.813116.890116.814116 .816
116.816116.817
STANDERRORH(KM)
0.3.3
0.30.66.406.3
e.41.96.46.50.21.6
6.38.36.66.26.46.4
6.76.26.46.56.38.5
6.36.66.36.36.26.8
6.32.20.29.11.76.5
6.96.48.5e.86.56.3
6.36.3
STAND AZIDEPTH ERROR GAP(KM) Z(Ki) (DEG)
- e.s08L 9.4 57-1.606L 8.5 169-1.669L 16.1 79-1.08.L 1.5 114-1.668L 1.7 79-1.6681 8.8 l11
-1.6eBL 6.5 153-1.IIPB 2.7 131-1.608L 1.3 11e-1.680L 15.3 114-1.668L 6.8 169-1.68L 1.4 1s6
-1.008L 9.4 169-1.66L 8.7 79-1.o68L 16.2 128-. 97P9 6.5 105-1.668L 8.4 151-1.0001 1.5 79
-1.008L 12.9 153-1.668L 7.7 1n9-1.688L 17.1 142-1.0081 16.1 158-1.600L 7.7 79
2.92. - 122
-1.608L 1.6 79-1.960 1.7 152-1.0s6L 9.7 168-1.6o6L 8.8 169-1.66L 7.4 le1-1.9661. 11.7 184
-1.661s 8.6 573.50. - 226
-1.02PS 1.6 2465.07. - 2636.e601 36.6 226
-1.e6oL 3.6 108
6.6061 36.6 226-1.0L 16.7 le-1.468L 13.8 85-1.609L 15.3 156-1.6681 1.5 116-1.6SL 9.1 65
-1.o60L 9.2 110-1.668L 9.7 124
uOO12S MAGNI
McC
CCI 1.78CCI 1.65CCI 1.88BCI 1.38ACICCI 2.62
CCIECIACICCI
cci
CCI 1.44CCI 2.68DOCIOccOciOct
ccicciECI
CcIcCI 1.77cCI 1.55
CCI
CCI
CCI 1.80CcI 1.96cci .eCCI
cc]CCIDcc 2.32
DOIcoi
OCI 2.12001C0I
CCI 1.97ACI 1.98CCI 2.14
CCI 1.87CCI 2.32
TUDEUd
ESTIMAIMLh
1.931.561.77
1.511.86
1.29
1.921.66
1.81
1.61
1.92
DEL- RMS tNES MIN RES. PH. U.S.G.S.MLv MLc (KM) (SEC) QUADRANGLE
19.7 6.14 24 BULLFROG2.12 19.7 0.12 18 BULLFROG2.68 2.6 19.9 0.17 22 BULLFROG1.14 13.7 0.19 11 BULLFROG
19.5 0.12 19 BULLFROG19.9 0.14 22 BULLFPOG
6.82 13.9 6.16 12 BULLFROG1.13 11.2 6.12 8 RAINIER MESA1.88 19.6 6.13 19 BULLFROG6.92 14.6 6.11 11 BULLFROG
19.9 6.14 21 BULLFROG1.02 14.3 6.17 9 BULLFROG
1.62 19.7 6.13 17 BULLFROG2.29 26.1 6.16 25 BULLFROG1.15 26.1 6.6 9 BULLFROG1.84 15.3 0.17 8 BELTED PEAK6.96 14.1 S.00 11 BULLFROG2.01 26.1 6.15 23 BULLFROG
1.29 14.1 6.16 16 BULLFROG19.7 0.13 20 BULLFROG26.2 0.67 14 BULLFROG
1.26 13.9 6.15 7 BULLFROG1.96 19.5 0.16 21 BULLFROG6.82 16.9 6.16 11 THIRSTY CANYON SE
2.41 19.4 6.14 21 BULLFROG1.13 14.0 6.69 8 BULLFROG2.41 19.7 0.12 15 BULLFROG2.17 19.7 6.13 18 BULLFROG2.56 19.8 .16 13 BULLFROG1.16 14.1 O."9 7 BULLFROG
19.8 6.13 25 BULLFROG1.98 79.6 0.13 9 CLARK MTN1.67 76.7 6.62 6 SAN ANTONIA RANCH1.68 82.9 6.12 6 CLARK 1TN1.43 75.2 6.67 6 CLARK M1TN
19.8 6.15 14 BULLFROG
1.81 75.2 6.33 6 CLARK MTN1.88 1.7 26.1 6.14 17 BULLFROG
19.5 6.16 11 BULLFROG1.41 13.9 6.16 8 BULLFROG2.66 19.5 0.15 19 BULLFROG2.69 26.0 0.12 20 BULLFROG
1.65 19.9 0.13 16 BULLFROG2.e5 26.6 6.11 19 BULLFROG
1.65
1.89
1.651.741.77
2.181.561.771.371.392.16
1.642.692.131.392.9e2.33
2.062.16
1 .96
-7,-. -,� pi 101,11!1.,17 ,. , , I 1--- I-- - - , 9 f;Tw-m-�77.7 -Ta"W7 ITpoppp".

) I *J I i :I 1 2
1989 LOCAL HYPOCENTER SUMMARY - SC8 CHEMICAL EXPLOSIONS
DATE - TIME(UTC)
JUL 25 12:47: 426 23:46: 626 0:13: 827 22:39:1027 23:56: 829 0: 2:24
AUG 1 12:47: 82 0: 8:343 0: 6:133 23:46:254 17: 6:565 0:36: 3
8 0: 3:139 6: 7:129 23:55: 1
11 20:18:3211 23:44:1712 17: 2:49
12 23:50:2114 23:52: 615 19:14:5815 25:56:3017 0: 1:5917 21: 9:15
17 23:59:1318 23: 3: 518 23:56:2119 19:18:1021 23:52:1522 23:59: 4
24 0: 4: 624 19: 1:1025 23:44:1527 0:22:1928 23:50:1929 21:59:14
30 6: 8:1930 23:58:1931 17:16: 231 21:15:53
SEP 1 0:22:591 22:34:23
1 23:49:132 23:52:15
LATITUDE(DEG. N)
36.89136.88936.90435.59336.89636.894
36.89436.89236.89636.89536.95136.893
36.89436.89636.89236.90836.90136.939
36.89536.90136.91836.88936.89236.939
36.69436.90636. 89336.90936.69a36 .895
36.89636.90536.89536.94336.89436.913
36.89636.89336.93736.90736.89736.908
36.89836.895
LONGITUDE(DEC. W)
116.812116.8161 6.8l11115 .568116.823116.811
16 .a86e16 .81a16.809116.82:116.a9116.812
116.8081 16.81e16.813116.838116.8141 16.888
116.815116.813116.832116.813116.81516.s81
116.816118.660116.812116.836116.81511.816
16.816116.648116.817116.88s116.813116.835
116.815116.811116.889116.839116.815116.649
116.809116.812
STANDERRORH(KY)
e.40.36.52.90.36.3
0.46.40.30.40,46.3
6.46.30.4e.56.46.4
6.30.41.40.46.41.e
0.40.50.30.30.46.3
0.36.36.30.3e.40.4
6.36.30.40.30.31.3
6.36.3
STAND AZI 000DEPTH(KU)
-1.0681L
-1 .OOBL
-1 .oe8L-1 .OOBL
1.0061.
-1 .0081L
-1 .OOBL
-1.60813
-1.60831.
-1.6081
-1.006L
-1.6081L
-l .80o6L-1 .800eL-1.00831.-1.608L
-1 .60813-1 .006BL-1.00L1
-1.e01es
-1.008L-1 .60L-1.001L-1 .01BL-1 .69081
-1 .60919
-1 .00BL-1.600DL
-1 00DL
-1 .008L
-1 .60OBL-1 .6081
-1 .6691
-1.06BL-1 . 0081L
-1.0081L
-1 .0061
ERRORZ(KU)
1 .41.11.8
30.08.99.0
1.61.47.6
13.313.71.4
1.67.41.58.41.5
14.3
8.112.211.22.51.5
27.3
1.730.6
8.47.61.68.9
9.86.616.210.616.5
9.3
8.48.42.69.89.61.2
8.98.7
GAP(DEC)
10993
107240III79
109Ie
168124
01957
1081es
7915978
115
10978
1628585
102
57181
79159797a
109159796957157
858588
11210e252
105169
12S UACNUca
ACI 1.66ACI 2.45OCNCDICC! 1.89CCI 1.94
ACI 1.85ACN 1.90CCl 1.66CCI 1.94CCIACI
ACICCI 1.94ACI 1.70CCIACICCI 1.61
CCICcI 1.81CcleCIACI 1.91CCI
ACI 2.08CD!CCI 1.h5CCIACI 1.77CCI 1.71
CclACICCl 1.83CCICCI 2.61CCI
CCICCI 1.82BCICCICCI 1.9760!
CCIccl 1.56
ITUDE ESTIMATESMd ULh ULv MLc
2.13 1.59 1.772.24 1.752.23 1.991.43 1.802.12 1.712.01 1.75
2.08 1.952.33 2.84 1.91 2.5
2.e81.95 1.77
1.061.81 1.88
1.76 1.s0I .931.52 2.03
1.39 6.691.86 1.58
1.12
1.55 1.61.44 1.98 2.5
1.04 1."01.81 1.381.80 2.24 1.9
1.37
1.98 2.6091.54 1.52
1.80 1.981.36
1.54 1.861.60 2.25 1.8
1.80 2.071.67
I 76 1.871.44 1.8
1.76 2.181.03
1.99 1.801.66 1.991.63 1.45 1.5
1 .201.64 1.97 2.0
1.42 0.95
1.82 2.61.90 1.9
DEL- RUS INMIN RES. PH. U.S.G.S.(KU) (SEC) QUADRANGLE
19.6 6.14 19 BULLFROG19.8 6.11 19 BULLFROG20.3 0.16 18 BULLFROG79.5 6.16 6 CLARK MTN26.7 0.13 15 BULLFROG19.7 0.13 16 BULLFROG
19.6 0.12 19 BULLFROG19.8 0.13 18 BULLFROG19.6 0.13 16 BULLFROG26.5 0.11 15 BULLFROG13.3 0.10 11 BULLFROG19.7 0.13 25 BULLFROG
19.5 0.14 26 BULLFROG19.7 0.13 18 BULLFROG19.6 0.14 21 BULLFROG19.4 6.11 11 BULLFROG26.3 0.14 19 BULLFROG13.9 0.12 13 BULLFROG
26.1 6.12 16 BULLFROG20.2 0.17 18 BULLFROG19.4 0.16 7 BULLFROG19.5 0.13 17 BULLFROG19.8 0.13 22 BULLFROG14.6 6.12 7 BULLFROG
20.1 0.14 24 BULLFROG12.5 6.05 9 BARE MTN19.6 0.13 19 BULLFROG19.5 6.10 11 BULLFROG20.1 6.14 21 BULLFROG19.6 0.13 18 BULLFROG
20.1 0.14 18 BULLFROG11.9 0.07 14 BARE UTN20.2 6.13 20 BULLFROG14.1 0.10 17 BULLFROG19.9 6.13 22 BULLFROG19.4 0.69 9 BULLFROG
20.1 6.12 21 BULLFROG19.6 0.14 22 BULLFROG13.9 6.11 18 BULLFROG19.4 6.16 12 BULLFROG20.1 0.14 22 BULLFROG12.1 0.66 7 BARE WTN
19.8 0.14 17 BULLFROG19.8 6.14 15 BULLFROG
) k
C

1 ' 1 3
1989 LOCAL HYPOCENTER SLMAARY - SG8 CHEMICAL EXPLOSIONS
DATE - TIME(UTC)
SEP 3 6:38:523 16:57:115 2!:14:186 6:25:226 21:16:548 6: 5:19
8 16:15:248 21: 8:399 6: 7:5216 6:53:1816 23:53:1812 6: 7:57
13 0:12:5813 23:53:5715 0:12:3715 15:34:5515 19:10:2115 19:17:59
15 21:3e: 416 0:26:33
vD 18 17:24:2219 6: 9:2820 6: 3:5620 17:17:25
21 e: 4:221 23:52:3223 0:44:5623 18:40:1726 6:24:5627 6: 4: 4
27 23:57:2628 21:20:5229 6:14: 529 21:26:1336 6:14:15
OCT 3 0:47: 1
3 23:57:585 0: 9: 35 21:53:386 6: 9:167 0: 2: 57 23:37.36
7 23:52: 412 1: 3:52
LATITUDE(DEG. N)
36.89236.93836.90536.90236.94636.898
36.9s636.96836.9so36.90636.89s36.897
36 .89636.89536.89236.57235.92835.956
36.94636.89336.94236.89236.89636.368
36.89336 .89336 .89436.91736.89536.896
36.89936.87536.89236.94836.89436.893
36.89436.89157.15536.89336.89636.891
36.94236.892
LCLM I TUDE(DEG. W)
116.845116.888116.837116. 612116.884116.813
116. V7116.832116.812116.837116.812116.813
116.814116.816116.811115.515115.227115.225
116.885116.8l I116.885116.816116. 817114.918
116.814116.818116.814116.829116.8141 16.889
I16.809116.913116.s16118.882116.816116.811
116.815116.813116.193116.810116.86116.822
1 16.886116.815
STANDERRORH(KU)
6.46.46.70.30.46.3
6.56.76.36.56.36.2
6.40.30.31.30.91.3
6.50.30.40.36.31.3
6.3O.30.30.60.40.3
6.33.40.36.36.46.2
8.4e.40.50.30.50.4
0.40.4
STANDDEPTH ERROR(KM) Z(KM)
-1 .6091B 9.9-8.8686 8.0-1.008L 1.8-1.00BL 8.6-1.0661L 9.9-1.6661 9.0
-1.0OBL 1.5-1.6eBL 14.2-1.00BL 9.2-1.006L 9.5-1.eoL 8.5-1.0661 7.6
-1.068L 1.5-1.008L 10.1-1.008L 8.4-1.13. --I.56P8 1.2-1.02PB 1.8
-1.6BL Y4.7-1.608L 8.2-1.0O0L 9.8-1.68eL 9.6-1.606L 7.72.52. -
-1.608L 6.3-1.066L 9.8-1.e08L 9.04.235 -
-1.068L 10.6-1.608L 8.9
-1.0081 8.817.88pB 6.5-1.666L 8.4-1.6061 6.6-1.6eBL 1.5-1.006L 6.6
-1.66BL 1.6-l.e6BL 1.50.47P6 1.4-1.006L 8.8-1.068L 10.5-1.00BL 12.7
-1.006L 9.1-1.80BL 1.4
AZ IGAP(DEG)
1161671661088779
166158les16079
109
79577990
194189
87858779
lie
179
les116leg19857
10
81181
791515679
79798156as
125
8657
00012S MAGNITUDE ESTIMATES
Mco Md ULh MLv I
CCIccl
ACI 1.56CCICCICCI
AC ICCICCICCICCI 1.97CCI 1.94
ACI 1.94CCI 2.72CCIcciAD! 1.98
601BDi
CCI ..94 1.52CCICCICCICCICCI 1.69
CCI 2.16CCICCI 1.71CDI 1. 5CCI 1.82CCI 1.82
ccICDI 1.46CCI 1.71CCIAC!CCI 1.88
Ac! 2.16ACIACI 1.91CCI 1.59CCA 2.35
ccrl
CCI
CC! 1.80
AC! 2.11
1.386.821.19
1.71 2.251.43
1.56 2.11
1.21A.961.851.111.76
2.06 1.89
1.77 2.002.241.70 1.73
1.241.961.90
1.411.76 1.97
1.561.60 2.121.17 1.65
1.84
1.50 1.961.06
1.47 1.94
1.72 1.77
DEL- RS ONMIN RES. PH. U.S.G.S.
ILc (KM) (SEC) OUADRANGLE
19.6 0.6s 12 BULLFROG14.0 0.06 11 BULLFROG19.6 0.09 10 BULLFROG20.2 0.13 21 BULLFROG14.3 o.09 13 BULLFROG20.1 0.14 23 BULLFROG
19.6 O.10 12 BULLFROG19.9 0.11 6 BULLFROG21.8 0.13 16 BULLFROG19.6 0.16 14 BULLFROG19.5 0.13 23 BULLFROG
2.6 26.0 6.13 21 BULLFROG
19.7 0.15 24 BULLFROG20.1 6.13 23 BULLFROG
2.1 19.5 0.13 22 BULLFROG28.0 0.21 o INDIAN SPRINGS SC42.6 6.16 7 SLOAN42.5 6.16 8 SLOAN
14.2 6.16 15 BULLFROG19.6 0.12 22 BULLFROG14.1 e.09 13 BULLFROG19.5 0.14 19 BULLFROG
1.6 20.2 0.12 18 BULLFROG26.5 0.11 7 DRY LAKE
19.8 0.13 22 BULLFROG20.1 6.15 17 BULLFROG19.9 6.15 21 BULLFROG31.3 6.04 6 BULLFROG20.0 0.14 24 BULLFROG19.6 6.12 15 BULLFROG
19.9 0.13 15 BULLFROG27.0 6.18 9 BULLFROG19.5 6.14 20 BULLFROG14.2 6.10 8 BULLFROG19.6 6.14 22 BULLFROG19.6 0.14 18 BULLFROG
19.9 0.15 27 BULLFROG19.7 0.14 23 BULLFROG13.4 0.12 16 RAINIER MESA19.6 0.13 24 BULLFROG19.5 0.12 14 BULLFROG20.3 0.16 18 BULLFROG
14.5 0.18 13 BULLFROG19.9 0.13 26 BULLFROG
1.58
1.19
1.47
1.601.71
1.971.76
1.58
1.55
2.281.062.0e1.111.661.94
2.111.111.63
1.99
1.132.032.11
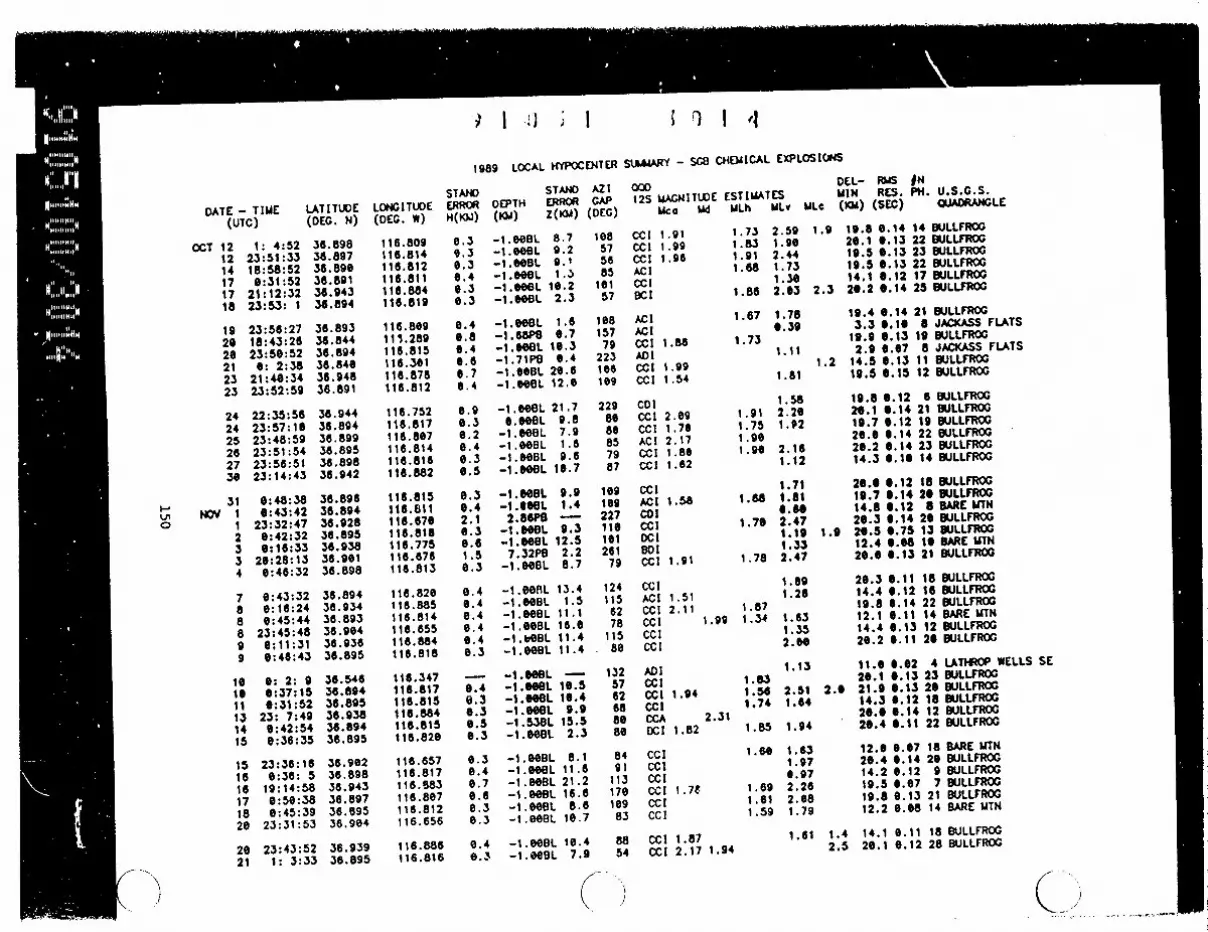
) I I) ) I ; ' I 1
1989 LOCAL 11YPOCENTER SUIMARY - SGO CHDEICAL EXPLOSIONS
DATE - TIME LATITUDE I(UTC) (DEG. N)
OCT 12 1: 4:52 36.89812 23:51:33 36.89714 15:58:52 36.89017 0:31:52 36.89117 21:12:32 36.94318 23:53: 1 30.894
19 23:56:27 36.89320 18:43:26 36.84420 23:50:52 36.89421 6: 2:38 36.84023 21:48:34 36.94823 23:52:59 36.891
24 22:35:56 36.94424 23:57:10 36.89425 23:48:59 36.89926 23:51:54 36.89527 23:56:51 36,89830 23:14:43 36.942
31 0:48:38 36.8961NOV 0:43:42 36.894
0 1 23:32:47 36.9282 6:42:32 36.8953 8:16:33 36.9383 26:28:13 36.9014 0:46:32 36.898
7 0:43:32 36.8948 0:16:24 36.9348 6:45:44 36.8938 23:45:48 36.9049 0:11:31 36.9369 0:46:43 36.895
1e 0: 2: 9 36.54616 0:37:15 36.894l1 0:31:52 36.89513 23: 7:49 36.93814 8:42:54 36.89415 8:36:35 36.895
15 23:36:16 36.9216 0:36: 5 36.89816 19:14:58 36.94317 0:50:38 36.89718 0:45:39 36.59520 23:31:53 36.9e4
20 23:43:52 36.93921 1: 3:33 36.895
LONGITUDE(DEG. W)
186.809116 .814116.812116.811116.84116.819
116.80911.289
1 6.815116.361116.87116.812
116.752116.817116.8071 1i6.814116.816116. 82
116.815116i.811116.676116.818116.7751 16. 676116.813
116.820116.885116 . 814116.655116.884116.818
11 6.347116.8171 16. 1s116.e84116.815115.820
116. 657116 .817116.883116.807116.812116.656
116.886116.816
STANDERRORA(K1J)
6.30.3
8.40.30.3
6.40.86.4
6.4
0.40.30.5
6.30.42.10.36.61 .50.3
0.40. 46.40.40.40.3
0.40.30.36.50.3
0.30.40.78.60.36.3
0.40.3
STAND,DEPTH ERROR(W) z(iO)(
-1.60B6 8.7-1.O8BL 9.2-1.60L 9-
-1.SOOL 10.2-l.et2.3
-1.600L 2.5-i.eaPS 0.7-1.9601. 16.3
-1.71PC 6.4-1.608L 26.6-1.000L 12.6
-1.008L 21.76.601. 9.8-1.680L 7.9-1.00BL 1.6-1.6001. 9.6
-1.600L 18.7
-1.609e 9.9-1.106L 1.42.86PO --1.606L 9.3-1.0691 12.5
7.32PB 2.2-1.006L 8.7
-1.8fitL 13.4-1.606L 1.5-1.806L 11.1-1.080L 16.6-1.bOBL 11.4-1.0B1. 11.4
-1.8001. 1.4-
-1.606. 10.5-1i. tL 16.4-1.6001. 9.9-1.538L 15.5-1.600BL 2.3
-1.06BL 8.1-1.6081. 11.6-1.608 21.2I-1.001. 16.6
-106.8.6
-1.06B1 16.7
-1 .006.L 16.4
-1.0e6 7.9
A21GAP(DEG)
108575685
16157
108157
79223106109
2298686
857987
109
227116161261
79
1241156278
11586
132576268Beo86
849!
113170
r8388
54
0DO12S WAGNITUOE ESTIMATES
Uca Wd ULh ULv MLC
CCI 1.91 1.73 2.59 1.l
CCI 1.99 1.83 1.96
CC! 1,96 1.91 2.44
ACI 1.68 1.73CCI 1.30DCI 1.86 2.63 2.
ACI 1.67 1.78AC! 0.39
CCI 1.U8 1.73
ADt 1.11CCI 1.99 1.
CCI 1.54 1.61
CDI 1.58CCI 2.09 1.91 2.26
CCI 1.76 1.75 1.92
ACI 2.17 1.96CCI 1.86 1.90 2.16
CCI 1.62 1.12
CCI 1.71ACI 1.58 1.88 1.81
Col I."
CCI 1.70 2.47
DCI 1.19Dot 1.33
CCt 1.91 1.78 2.47
CC! 1.89
AC! 1.51 1.26CCI 2.11 1.87CCI 1.99 1.34 1.63
CCI 1.35
CCI 2.60
ADI 1.13CCI 1.83
CCI 1.94 1.56 2.51
CCI 1.74 1.64CCA 2.31DCI 1.82 1.85 1.94
CCI 1.60 1.63
CCI 1.97CCI 6.97
CCI 1.7t 1.69 2.26
CCI 1.61 2.68CCI 1.59 1.79
CCI 1.87 1.61
CCI 2.17 1.94
DEL- RUS ONUWN RES. PH. U.S.G.S.(KM) (SEC) QUADRANGLE
. 19.8 0.14 14 BULLFROG26.1 0.13 22 BULLFROG19.5 6.13 23 BULLFROG19.5 6.13 22 BULLFROG14.1 6.12 17 BULLFROG
3 20.2 0.14 25 BULLFROG
19.4 0.14 21 BULLFROG3.3 0.16 8 JACKASS FLATS
19.9 0.13 19 BULLFROG2.9 6.67 8 JACKASS FLATS
2 14.5 6.13 11 BULLFROG19.5 6.15 12 BULLFROG
19.8 0.12 6 BULLFROG20.1 0.14 21 BULLFROG19.7 0.12 19 BULLFROG26.6 0.14 22 BULLFROG26.2 6.14 23 BULLFROG14.3 0.16 14 BULLFROG
20.0 0.12 18 BULLFROG19.7 0.14 20 BULLFROG14.8 0.12 S BARE MTN20.3 0.14 20 BULLFROG
.9 20.5 0.75 13 BULLFROG12.4 0.68 10 BARE UTN20.0 0.13 21 BULLFROG
20.3 0.11 18 BULLFROG14.4 0.12 16 BULLFROG19.8 6.14 22 BULLFROG12.1 6.11 14 BARE UTN14.4 0.13 12 BULLFROG26.2 0.11 20 BULLFROG
11.0 0.62 4 LATHROP WELLS SE20.1 0.13 23 BULLFROG
2.0 21.9 0.13 20 BULLFROG14.3 0.12 18 BULLFROG20.0 0.14 12 BULLFROG20.4 0.11 22 BULLFROG
12.6 6.67 18 BARE UTN26.4 0.14 26 BULLFROG14.2 0.12 9 BULLFROG19.5 0.07 7 BULLFROG19.8 6.13 21 BULLFROG12.2 0.08 14 BARE UTN
1.4 14.1 6.11 18 BULLFROG2.5 20.1 0.12 28 BULLFROG
) .... . .- . , ,; . -

1f
I, I I I ) I I;
1989 LOCAL HYPOCENTER SULMARY - SC8 CHEMICAL EXPLOSIONS
DATE - TIME LATITUDE(UTC) (DEG. N)
NOV 27 20:18:32 36.94628 6:28:31 36.98628 0:43:21 36.89928 23:36:18 36.71229 8:57:39 38.89929 15:14:49 37.11330 0:22:52 36.944
30 0:45: 5 38.89850 19:17:37 36.89030 23:14:56 36.31130 23:34:53 36.965
DEC 2 0:31:34 36.8984 6:ZS:36 35.8984 21:15:48 36.939
5 0:37:34 36.8966 0:16:47 36.9396 0:40:34 36.8957 0:42:34 36.8949 0:48:37 36.891
11 23:20:23 36.938
11 23:29:29 36.90811 23:36:59 36.93712 0:33:36 36.89713 23:51:25 35.67414 22:11: 3 36.89615 0:40: 3 36.893
16 0:44:34 36,89616 23:27:35 36.94517 23:45: 8 36.90219 6:50:26 36.89419 21:13:36 36.89420 22:44:42 36.899
21 0:40:55 36.89221 23:36:26 36.90921 23:36:50 36.89222 23: 5:43 36.91323 0:32:51 35.89423 21:38:26 36.903
26 20:22:52 36.8M 628 6:54: 3 36.89428 1:58:59 36.94329 0:3.i:35 36.89230 0:35:36 36.887
LONGITUDE(DEC. W)
116.885116.653118.816115.731116.815117.635116.88a
11 d.81118.814115.728116.655116.812118.811116.883
118.811116.885118.820116.807116.821116.889
116.653116.891118.819115.555116.841116.837
118.865116.885116.827116.817118.803116.829
1 16. 8121 6.653
116.81116t.686116.811116.828
116.819116.814116. 887
116.814
STANDERRORH(KU)
0.50.40.41.06.46.46.3
0.66.31.76.56.40.90.4
6.30.56.36.30.30.3
0.40.36.33.96.66.9
0.70.50.60.30.66.6
0.36.e6.52.66.50.3
8.40.40.40.60.6
STAND AZIDEPTH ERROR GAP(KM) Z(KU) (DEG)
-1.0e06 9.4 171-1.8081 13.5 83-1.009L 12.3 108-I.ISPe 0.5 246-1.0091 1.5 1217.96PB 1.6 104-1.6061 11.5 69
-1.6068 19.1 18-1.0091 1.1 123-0.98PB - 157-1.0O01 15.7 79-1.000 1.6 108
-166 19.6 155-1.608L 16.8 87
-1.609L 8.9 168-1.006L 11.5 87-1.0061 11.3 123-1.606L 8.5 168-1.00B1. 12.7 125-1.606L 1.5 126
-1.6061 1.6 78-1.606L 1.6 127-1.tOBL 2.2 006.0061 38.6 2U4
-1.0061 1.3 115-1.6061 1.4 144
-1.6061 1.3 79-1.6061 1.1 105-1.6eBL 6.9 111-1.6091 1.8 57-1.606L 1.4 83-1.54PB 2.6 b0
-1.009L 1.7 77-1.606L 1.2 78-1.6061 1.2 78-1.O061 38.6 226-1.8061 14.1 81-1.69PB 0.8 111
-1.0061 0.7 112-1.606L 1.3 47-1.606B 1.6 89-1.628L 17.2 79-1.030L 18.8 81
OaD12S
DEL- RMS ONMAGNITUDE ESTIMATES MIN RES. PH. U.S.G.S.Uca Ud MLh MLv ULc (KU) (SEC) QUADRANGLE
CCICCICCI 1.75SolACIABI 1.20 1.29CCI 2.66
CCI 1.89ACI 1.71CDIOccACI 2.63CCA 2.26CCI
CCI 1.70CCICCICCICCI 1.62ACI 2.11
BCIACI 2.11BCI 2.64DoU 1.17BCU 1.63 1.15BCI 1.83
BCI 2.09 1.71BCI 1.66 1.37BCt 1.38 1.06Ac! 1.96ECI 1.55BCI 1.52
ACI 2.03 1.89BCI 1.30ACI 1.54 1.76CDI 2.61CCIAC! 1.14
Act I.64BCI 2.29ACICCA 2.29CCA 2.19
1.63.36
1.766.961.841.29
1.27 2.381.40
1.81 1.89
1.54
1.4A1. 68 2.131.641.48 1.74
1.34
1.606.0
1.801.551.68
1.681.13
2.6o1.441.63
1.841."0
1.352.221.52 1.57
13.9 6.08 7 BULLFROG12.3 0.08 13 BARE UTN
1.8 19.9 6.13 14 BULLFROG7.4 6.e6 6 INDIAN SPRINGS W20.3 6.11 14 BULLFROG14.5 0.12 22 BONNIE CLAIRE SE13.9 0.13 23 BULLFROG
19.9 0.12 6 BULLFROG19.7 6.11 19 BULLFROG12.7 0.19 5 CHARLESTON PEAK12.3 0.12 15 BARE MTN20.0 0.14 23 BULLFROG19.9 6.15 1l BULLFROG14.3 6.16 18 BULLFROG
19.8 6.12 15 BULLFROG14.2 6.161 5 BULLFROG26.4 6.11 18 BULLFROG
1.9 19.4 0.13 16 BULLFROG20.2 6.11 19 BULLFROG13.9 6.13 13 BULLFROG
12.4 0.23 16 BARE MTN1.4 13.7 6.161 6 BULLFROG
26.5 .16 23 BULLFROG71.8 0.26 5 CLARK MTN19.8 6.17 17 BULLFROG21.5 6.21 17 BULLFROG
19.3 0.28 15 BULLFROG14.6 0.18 18 BULLFROG26.6 0.19 18 BULLFROG26.1 0.12 22 BULLFROG19.6 6.21 19 BULLFROG20.6 6.17 17 BULLFROG
19.7 0.13 28 BULLFROG12.5 6.15 16 BARE MTN19.5 6.15 18 BULLFROG13.7 6.12 7 BARE WTH19.7 6.13 11 BULLFROG20.4 6.11 10 BULLFROG
1.1 19.8 0.15 21 BULLFROG19.9 0.15 29 BULLFROG13.8 6.14 25 BULLFROG20.1 6.14 11 BULLFROG19.4 .09 8 BULLFROG

Appendix C
Nuclear device tests and low-frequency shallow seisricity in the SGB, 1987 through 1989
Hypocenter data for announced Nevada Test Site nuclear device tests occurring in 1987, 1988,
and 1989 are listed in Table C1 and corresponding epicenters are shown in map view in Figure Cl.
Hlypocenter parameters are listed as they are reported to the National Earthquake Information Center
(NEIC) by the Department of Energy. Magnitude estimates are provided by Berkeley Seismographic
Laboratory or by the NEIC. SGBSN stations generally record nuclear detonation ground motions
well beyond their dynamic range; thus, only initial P-wave arrival times can be reliably scaled from
SGBSN seismograms of nuclear tests.
When observed travel times (OT,) are compared with theoretical values (TTi, corresponding to
source to station rays computed from the standard velocity model used to locate SGB earthquakes,
shown in Appendix E), the resulting residuals or 'delays' (D, = OT, - TTI) provide insight into
the P-wave velocity structure of shallow crust. Figures C2, C3, and C4 are contour maps of percent
velocity variation from the standard model, as implied by th- delays observed for tests 'Alamo,"
'Disko Elm," and "Kawich," respectively. The contour levels are interpolatior.:/extrapolations onto
the entire SGB of AV(%6) = -- 100D, OT., i = 1,55, wl ere D, is the ith delay (sec). for SGBSN
station recordings of primary waves from a given nuclear device test. The reader is cautioned that the
mapped patterns of velocity variation result from 'heavy-handed" interpolation and extrapolation
from a very limited station data base. Station coverage within the Nevada Test Site and at Yucca
Mountain is many times better than elsewhere in the southern Great Basin with the consequence
that patterns in the variation of shallow crustal velocity in the immediate vicinity of NTS are more
reliable than those away from NTS.
Relatively high levels of ultra-shallow seismicity are regularly recorded by SGBSN stations for
periods ranging from hours to days following NTS nuclear device tests. The seismicity listed in
Appendix C consists of such events, which have characteristicaIly lower-frequency seismic P coda
and S coda than the vast majority of earthquakes in the SGB. and are designated 'LFEs." Most of
the LFEs can be associated with nuclear device testing at Pahute Mesa, Yucca Flat, and in a few
instances, at Rainier Mess. Some of these events may be identified as the collapse of a given test.
The heightened level of post-test LFE seismicity often continues for days, with no single event having
clearly greater magnitude, as determined from SGBSN seismograms, than many ethers in its vicinity.
Data from the majority of these LFEs are archived onto magnetic tapes without being analysed by
SGBSN staff. An unexamined assumption about the nature of these low-frequency northern NTS
events is that all of them are ultra-shallow aftershocks resulting from anomalous local conditions
generated during nuclear device tests.
Apart from the LFE seismicity, it is possibly true that the natural seismicity rate in the SGB
also increases for several days following some NTS tests, especially if the time interval between NTS
tests is several months. That NTS tests might trigger earthquakes for several days at distances on
the order of 50 to 100 km is a hypothesis that the current catalog should be able to address. This
topic is an area of current research.
A few low-frequency events that do not locate at NTS are included in Appendix C, because
their seismic coda appears more similar to post-test, collapse-like seismicity than to earthquake
coda. Many of these are undoubted1y blants in unconsolidated alluvium or intensely fractured tuff.
The verification that other explanations of these phenomena are invalid is left to future investigation.
152

37.B
N~
116.9 3E.5115.75V SEISMOGRAPHIC STATION 0 CITY OR TOWN
o mag < 3.0o 3.0 :c mag < 4.0
o .4.0 5 mag < 5.0o 5.0 5r mag
Figure C1. Map of announced NTS nuclear device detonation epicenters for the period 1987 through1989 (test epicenters are octogons), and of epicenters of a small subset of the low-coda frequencyactivity (aftershocks?, collapses?) that followed those UNEs (designated by 'L" symbols).
153

Alamo veloc. var. (7I117W 1 16X 115W
.5-.
I (/N
-- 7
x, / \E/'' n ~\'\K''
ZONTOUR FROM -10 TO B BY I
Figure C2. Contour map of percent P-wave horizontal velocity variation, AV, from velocities obtAined
from the standard model shown in Figure Fl(a) for arrival time delays from the test "Alamo,"
detonated on July 7, 1988, 15:05:30.07 UTC, in the Silent Canyon Caldera. AVs from stations
nearest the four corners of the map have been inserted at the map corners to suppress the formation of
spurious contours near the edges of the map. (Interpolation of the AVs computed at SGBSN station
locations to a 42 x 42 grid over the entire SGB is performed using the International Mathematical
and Statistical Library routine 'IQHSCV.")
154

-D;SKO Eim dv !%)117WJ -16W
---- ---- --- ---- ---
I
IIIII
../
J
N..,>
N
/
N
N/
-.. . - "- -- C.4 B
Figure C3. Contour map of percent P-wave velocity variation from the standard model shown inFigure Fl(a) for SGBSN station data from the tunnel test 'Disko Elm," detonated on September14, 1989, 15:00:00.10 UTC, at Rainier Mesa. The same data reduction was performed as in FigureC2.
155

Kawich vr loc var (%1117W 116W I1. l W
CCNICu: * -R3 -3 13 15 -b ,
Figure C4. Contour map of percent P-wave velocity variation from the standard model shown inFigure Fl(a) for SGBSN station data from the test 'Kawich,' detonated on February 24, 1989,16:15:00.08 UTC, at western Yucca Flat. The same data reduction was performed as in Figure C2.
156

Table Cl. Announced NTS Nuclear Device Teet Information for 1967. 1988. and 1989
YEARMODA HR MN SECND(UTC)
19870203 15 20 e0.0819870211 16 45 00.0719870318 18 28 00.0919870418 13 40 00.6019870422 22 00 00.0919870430 13 30 00.0919870618 15 20 0.8819870620 16 00 00.0919870638 16 05 00.1019870716 19 00 00.0819870813 14 00 00.0919870924 15 00 00.0519871023 16 00 00.0919871201 16 30 00.0919871202 18 30 e0.084
ML SRC LATITUDE LONGITUDE DEPTH DOE TEST NAMEDEC. N. DEC. W. (KU)
2.2NEIC 37.18114.2BRK 37.01074.48RK 37.21025.38RK 37.24793.9BRK 36.98315.3BRK 37.23304.IBRK 37.19363.5NEIC 37.22004.OBRK 36.99864.78RK 37.10385.58RK 37.06105.48RK 37.22805.08RK 37.14194.09RK 36.99643.5NEIC 37.2347
-116.0484-116.0447-116.2086-1 16.5I91-11 6.0046-116.4231-116.0350-116.1778-116.0431-116.0234-116.0453-1i 6.3747-116.0787-1 16.645-116.1634
-1.02 HAZEBROOK-4.91 TORNERO-1..85 MIDDLE NOTE-1.40 DELAMAR-0.90 PRESIDIO-1.37 HARDIN-1.14 BRIE-1.74 MISSION GHOST-0.90 PANCHUELA-0.81 MIDLAND-0.64 TAHOKA-1.47 LOCKNEY-0.82 BORATE-0.90 WACO-1.45 MISSION CYBAR
19880215 18 10 ee.0919880407 17 15 00.0819880513 15 35 0.1019880521 22 30 0.14
- 19880602 13 0 0.0919880622 14 0 0.0819880707 15 5 30.0719880817 17 00 0.09519880830 1800 0.0919881013 14 00 0.eg19881210 20 30 0.86
5. 38RKC4.ONEIC4.9BRX4.29RX5. 3BRK3. INEIC5. 48RK5. 48R4. 8RK5.6BRS5.OBRK
37.314437.613237.124437.032537.260137.166237.252437.297237.085937.089037.199e
-116.4715-116.0443-116.0721-115.9873-116.4411-116.0722-118.3767-116.3865-116.0685-116.0493-116.2094
-1.43 KERNVILLE-1.02 ABILENE-4.80 SCHELL9OURNE-0.85 LAREDO-1.39 COMSTOCK-1.14 qHYOLITE-NIGHTENGALE-.. 39 ALAMO-1.53 KEARSARGE-6.76 BULLFROG-0.66 DALHART-1.86 MISTY ECHO
19890210 20 0619890224 16 1519890309 14 0519890515 13 1019890526 18 0719890622 21 1519890627 15 Z-19890914 15 0019891031 15 3019891115 20 2019891208 15 0e
0.060.080.100.090.020.090.020.100.090.110 .09
5.28RK 37.07684.S8RK 37.12854.88RK 37.14284.48RK 37.01763.7NEIC 37.63595.2BRK 37.28294.8BRK 37.27544.0BRK 37.23595.3BRK 37.26313.4NEIC 37.10655.29RK 37.2311
-116.00e5-116.1220-116.0669-116.1209-116.0551-116.4123-116.3536-116.1629-116.4907-1165.0134-116.4094
-0.79 TEXARKANA-0.97 KAWICH-0.8 INGOT-0.96 PALISADE-0.86 TULIA-1.50 CONTACT-1.4 AMARILLO-1.6 DISKO ELM-1.27 HCRNITOS-1.13 W LESHOE-1.40 BARNWIELL
- NOTES: Coordinates of announced toote ore supplied to ihe National EarthquakeInformation Center. Golden. Colorado (NEIC). by the Deportment of Energy.These coordinates hove been rounded to the nearest 0.0001 degree in Table C1.The ML estimates (local magnitude) ar* provided by the Berkeley SeiamographicLaboratory (aRK) or by the NEIC. Depth is the reported working point depth.relative to sea level (negative z above sea level).
157

') I ) 1 2 {) 2
DATE - TIME LATITUDE(UTC) (DEC. N)
APR 30 13:39:36 37.22530 13:40:52 37.24530 13:57: 9 37.23736 14: 5:47 37.e2930 14:11:24 37.20430 17:39:52 37.257
56 18:32:56 37.263
30 21:33:47 37.221
LONGITUDE(DEG. W)
116.442116.474116.390116.177116.358116.399
116.399116.242
1987 LOCAL HYPOCENTER SUUMARY - SC8 LOW-FREOUENCY PHENOMENA
STAND STAND AZI Oca DEL- RUS IN
ERROR DEPTH ERROR GAP 12S UAGNITUDE ESTIMATES UIN RES. PH. U.S.G.S.
H(KU) (KU) Z(KU) (DEG) Uco Ud MLh MLv MLc (KM) (SEC) QUADRANGLE
0.7 2.66 - 133 CCI 2.08 47.3 0.09 7 SCRUGHAU PEAK
3.9 7.00 - 123 CDI 1.67 50.8 8.50 5 SCRUCH.W PEAK
1.O 2.46. - 13e CCI 2.26 23.0 6.19 11 SCRUCHAM PEAK
- 29.02 - 200 ADI 1.53 4.7 6.00 4 TIPPIPAH SPRING
1.5 24.61 3.8 125 B81 2.08 28.5 0.17 7 AMOCNIA TANKS
0.4 8.58 6.6 206 ADI 1.71 1.06 2.10 1.22 8.2 0.o6 15 SILENT BUTTE
6.5 9.57 6.6 243 ADl 1.21 1.82 1.06 8.6 0.07 13 SILENT BUTTE
0.6 9.75 0.4 273 ADI 1.52 1.87 1.35 7.3 0.85 11 RAINIER MESA
%...0'
(I I )
wwwomm

1987 SCB LOW-FREOUENCY EVENTS WITHMWT HYPOCENTER DETERMINATIONS
MONTH DA HR:WN
JANUARY 28 21:34
FEBRUARY 04 23:58
MARCH 03 19:5523 19:36
APRIL 06 18:3917 12:0124 14:43
MAY 09 67:36
JUNE 08 12:2623 64:12
JULY 16 17:2930 17:02
AUGUST 22 20:31
SEPTEMBER 01 09:5813 20:3724 18:38
OCTOBER 01 00:3323 16:53
DA HR:UN DA HR:IM DA HR:1N DA HR:UN DA HR:4N DA HR:MN (UTC)
06 00:27 12 23:08 17 20:26 23 23:13
09 06:18 11 22:46 14 02:33 14 88:46 17 23:33 18 18:53
09 17:08 16 64:43 10 10:47 14 01:34 14 18:67 15 20:4118 14:03 la 14:05 18 14:30 18 17:04 21 08:27 22 23:43
15 18:16 30 66:29
10 16:43 11 12:31 12 U6:18 22 18:13 22 22:13 23 00:18
6s 19:0530 22:27
24 17: 13
09 90:4a16 63:4624 16:46
05 15:5323 16:58
18 19:09 16 19:18 16 19:22 28 05:37 28 06:09
30 17:59
09 18:3024 15:6927 61:15
09 12:53
10 04:4424 15:1627 62:48
12 61:19
11 63:1024 15:4627 13:04
Is 20:03
12 16:53 12 11:4324 15:54 24 16:2828 00:44
15 23:56 16 08:29
NOVEMBER 19 16:21 29 61:35
DECEMBER 11 1:29 15 2e:39 21 22:45
159

1988 SG8 LO*-FREQUENCY EVENTS WITHOUT HYPOCENTER DETERMINATIONS
JANUARY 14 21:43 16 21:48
FEBRUARY 15 21:44 18 00:1226 15:42
MARCH 4 21:88 a 22:4729 23:22 38 16:35
APRIL 1 10:29 7 17:19
MAY 21 22:35 21 22:55
JUNE 2 10:31 2 15:05
JULY 6 2J:18 7 15:11717:37 7 17:447 20:10 7 20:147 20:55 7 21:017 21:25 7 21:277 21:57 7 21:587 22:17 7 22:197 22:47 7 22:49
11 7:20 1I 8:471a 18:44 19 21:e9
AUGUST 1 18:52 3 2':1717 15:47 17 19:0817 21:06 17 21:1823 18:08 23 21:0258 18:25 30 18:3830 19:03 31 23:16
SEPTEueER 10 23:43 1o 23:45
OCTOBER 15 14:42 15 15: a13 15:58
NOVEMBER 9 25:05
16 01:90 16 01:53 16 03:09 16 04:35 16 05:58
9 00:4030 20:48
7 17:27
3 23:23
7 15:207 17:527 20:217 21:067 21:357 22:077 22:237 22:51
1 1 2:5622 0:47
15 22:2317 19:4617 21:1923 22:5130 18:44
9 22:48 1i 19:59 12 00:10 13 22:18
7 17:29
13 11:22
7 16:027 18:05, 20:297 21:107 21:417 22: 17 22:277 23:H413 18:0025 20:53
15 23:0817 19:4817 21:4824 9:2030 18:46
15 19:40
7 16:107 1: 157 20:357 21:187 21:457 22:127 22:ae8 1:07
14 14:4329 15: 15
16 25:2817 20:1917 21?5327 23:3830 18:48
7 17:017 19:087 26:407 21:177 21:497 22:137 22:358 9:37
18 1:1029 21:26
17 18:1417 20:3217 22:0029 25:4130 18:50
77777779
la
17:3219:11
20:4221:2021:5222:1522:442:186:39
17 18:2017 20:4917 22:2130 18:180 15:57
13 15:52
C~11 00:40 1l 0:55 28 20:43 28 18:34
13 15:15 13 15:19 13 15:28 13 15:50
DECEMBER 10 21:11 18 18:40 26 8:56
160
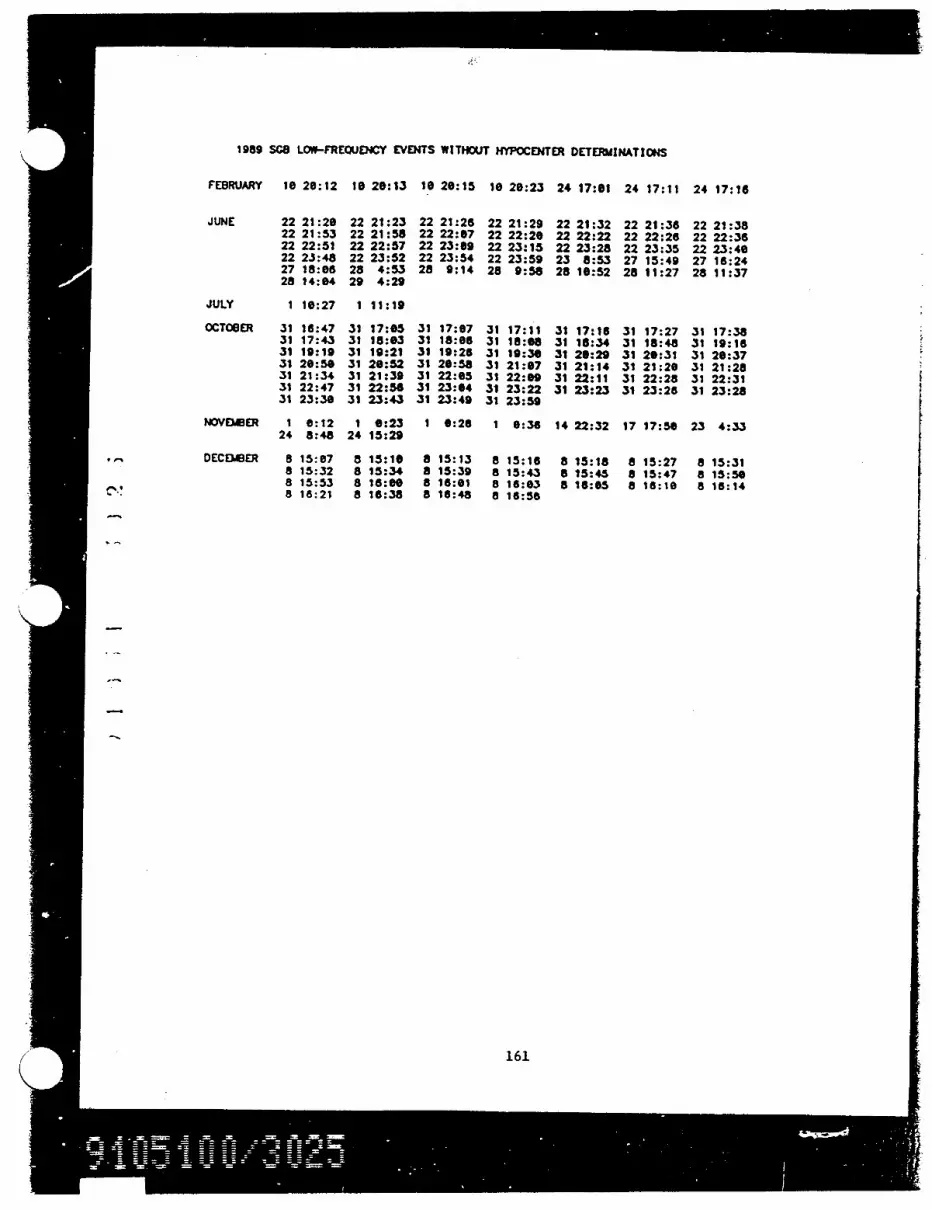
1989 S08 LOW-FREQUENCY EVENTS WITHOUT HYPOCENTER DETERMINATIONS
FEBRUARY 10 20:12 10 20:13 10 20:15 10 20:23 24 17:01 24 17:11 24 17:16
JUNE 22 21:20 22 21:23 22 21:26 22 21:29 22 21:32 22 21:36 22 21:3822 21:53 22 21:58 22 22:07 22 22:20 22 22:22 22 22:26 22 22:3622 22:51 22 22:57 22 23:09 22 23:15 22 23:28 22 23:35 22 23:4022 23:48 22 23:52 22 23:54 22 23:59 23 8:53 27 15:49 27 16:2427 18:06 28 4:53 28 9:14 28 9:58 28 10:52 28 11:27 28 11:3728 14:04 29 4:29
JULY 1 10:27 1 11:19
OCTOBER 31 16:47 31 17:05 31 17:07 31 17:11 31 17:16 31 17:27 31 17:3831 17:43 31 18:03 31 18:06 31 18:68 31 18:34 31 18:48 31 19:1631 19:19 31 19:21 31 19:26 31 19:30 31 20:29 31 20:31 31 20:3731 20:50 31 20:52 31 20:58 31 21:07 31 21:14 31 21:20 31 21:2831 21:34 31 21:39 31 22:05 31 22:09 31 22:11 31 22:28 31 22:3131 22:47 31 22:56 31 23:04 31 23:22 31 23:23 31 23:26 31 23:2831 23:38 31 23:43 31 23:49 31 23:59
NOVEMBER 1 0:12 1 0:23 1 6:26 1 0:36 14 22:32 17 17:58 23 4:3324 8:48 24 15:29
DECEDBER 8 15:07 8 15:10 8 15:13 8 15:16 8 15:18 8 15:27 8 15:318 15:32 8 15:34 8 15:39 8 15:43 8 15:45 8 15:47 a 15:588 15:53 8 16:00 8 16:01 8 16:03 8 16:05 8 16:10 8 16:148 18:21 8 16:38 8 16:48 a 16:56
161

Appendix D
Earthquake focal mechanisms 1982 and 1987 through 1989
The focal mechanisms of Appendix D were obtained by selecting the best-fitting solution(s)
from the application of the computer program 'FOCMEC" (Snoke and others, 1984) to the ray
data generated by HYPO71, and in some instances, to amplitude data. We plot data on the lower
focal hemisphere using the equal-area projection (Lee and Stewart, 1979). The symbols represent
first-motion P-polarities, and their positions represent the points where the HYPO71-determnined
raypaths intersect the focal hemisphere. The darkened circles represent impulsive compressional
arrivals, the + symbols represent emergent compressionals, the open circles represent impulsive dili-
tationals, the - symbols represent emergent dilitationals, and the x symbols represent indeterminate
or nodal readings. The + symbol at the center of each mechanism is not a compression; it is a point
of reference for readers who may wish to search for alternative solutions using a Schmidt net. SGBSN
station names are printed adjacent to the first-motion symbol for many of the solutions presented in
Appendix D. In the following figures the P and T symbols represent the pressure and tension axes,
respectively. The X and Y symbols represent slip vectors for each nodal plane, and B is the null
axis. Primed P and T symbols are the respective vectors for alternate (dashed) solutions when they
are presented. Some mechanisms are composited using data from several events that are clustered in
time and space. Composite solutions are noted in each Egure. Several examples of focal mechanism
solutions for relocated hypocenters at substantially different depthb-of-focus are presented to indicate
the effect these changes have on strike, dip, and rake.For several mechanisms, the information contained in P-wave polarities was not adequate to
effectively constrain the nodal planes. In these instances, first motion P- and SV- amplitude data
were gathered at selected stations, indicated by a large square around the polarity symbol. The
observed and theoretical loglo(SV/P). ratios and the difference between the logarithms of observed
and theoretical ratios are computed for hundreds of potential solutions whose nodal planes conform
to P-wave first-motion polarities. The theoretical values shown in each figure are for the 'optimum"
solution show.., having the lowest rms error and fewest polarity inconsistencies. If the difference
between observed and theoretical values is greater than a specified limit, erro,.., that station's
amplitude data are not used in the solution and an asterisk is placed by its name in the solution
table. We always set errm,. < 0.3, corresponding to a maximum factor between theoretical and
observed amplitude ratios of 2.0.Kisslinger and others (1981 and 1982) and Rogers and others (1987) discuss several assumptions
that must be satisfied for the (SV/P). amplitude ratio method to be valid. Their comments and
observations are included herein by reference.
162

+ EI.
,
xT
0S
0-. ~00
azi plungeP axiS 11.78 16.31T axis 122.41 50.28
STOVEPIPE WELLS B axis 289.94 35.02DATE&TIME: 820318 8 47 0.90 X axis 50.93 47.95LAT: 38.583 LONG: 117.075 Y axis 165.00 20-20
DEPTH. k 5-21 /-07 1 394 strike dip rakeDi" (1kD). 19.5 Soln 1 255.00 89.80 52.30
This earthquake's foool _-ohonlenav constrained bS eelPuv"I caarindb several Puwave
arrivals From a ttions in theeouthern Colifornla selsla network.orchived in their CUSP steA. event 7461.1. la taken Fron Posadend. also reportedby Berkeley as L-3.7.
Figure D1. Oblique reverse-sl:p focal mechanism solution for an earthquake of March 16, 1982, withepicenter west of the northern end of the Death Valley fault.
163

_ \E P G I BLT
JON IPRN/
- \ D~LM °
\ O / / /
/ /
_ g- 5azi plungeP ais 224.66 48.99
-ALAMO SE T axis 323.50 7.81DATE&TRLE: 870113 1 15 9.05 B aois 59.93 39.99LAT: 37.327 LONG: 115.028 X axis 287.43 38.84DEPTHL k= 7.48 +/- 0.4 ML- 3.2 Y axis 174.23 28.10DION (3cm)- 9.1 strike dip rake
Soal 1 264.20 83.90 -44.30Var 2' 263.70 77.80 -54.10
This eoart hae -o FIt at Rloto. Nevada. Var 2" 262.70 65.60 -32.70Its Focal A:hnl~ w ll-oonstrainedb P-wo first aotlons. includingpolarit4 data From station DU. operated
the Siop Stations of theIlvm'it o Utah. Salt Lak City. Utah.
Station COI has the cmi loritFer the rvnge of focal eho.
Figure D2. Oblique norrnal-slip focal mechanism solutions for an earthquake of January 13, 1987,in the Pahranagat Shear Zone, that was felt at Alamo, Nevada.
164

I aziP ais 209.00
BARE YTN T axis 112.11DATE&TIME: 870310 12 51 2.11 B axis 15.00LAT: 3e.844 LONG: 116.505 X axis 258.dBDEPTH. knL 3.13 +/- 0.4 ILL 0.4 Y ax 150.28DION (krn)-2.5 strike
Soln 1 240.28Var L 242.57
This Yucooa ountaln hypooenter wos detoeiined froma Yucca Monx1aln *aI-nlo veloolt pmdel. The SV-to-Pground .- pI I tud raotio hove been orroected for pathcnd m arace effects ooolated with that nodel. to
41d 'oouro &zone ' *pIItude rotlo . These ore hownol for th olid-line nodal plane eolution. alonc
ulth the theoretical rotio. froh that solution'srodiation pattern (t ampiltude wror -O.1 1.
WTh orPtzal Difference Station1.3283 1.2798 U.P495 YHTq9.9178 0.6S9S O3.1193 YlT29.6M28 O -.SIS .mis YTSs9.6758 0.8296 -0 1539 YMT -
plunge44.147.05
45.0023.9335.40
dip54.6058.23
rake-29.84-25.70
-------Figure D3. Predominantly strike-slip focal mechanism for a very small earthquake of March 10,1987, at Yucca Mountain, Nevada, constrained by several SV/P, amplitude ratios.
165

T/
*SGV
\TCN I"\P' AM I
I JI
P gN MGM0 azi plunge
P axis 187.39 47.71TIN VW T axis 270.28 11.45DATE&TULE: 870408 19 40 19.25 B axis 10.05 40.01
LAT: 38.910 LONG: 117.467 Y axis 120.40 22.50DEPTH. kn- 7.84 +/- 0.4 Yl; 2.Bst12 e c2p rkDMIN (1m)- 12.9 strike dip rakeCOUPOSUE WITH 870408 20 19 48.43 Soln 1 210.40 67.50 -45.90870408 20 2 38.13 Ver 2' 203.30 65.80 -51.00
Var 2"213.20 74.80 -48.20The rf-fl of foult-planisolutlo-. For this coapoelto oftFre. eorthquos rra a shcrt-lIfvedSwam in the Grapevine tlcuntaolna narlw when det lif I opths using
a SG8 veloolt Z ZIl IWe~raossat 1. 3. and YI belo level.The oounterolockuise rotation of thetenalon CMl axis fra Its 4verdirection for SG8 alroeartFooal nochonisom ghmould be noted.
Figure D4. A composite, oblique, normal-daip set of focal mechanism solutions for earthquakes ofApril 8, 1987, in the Grapevine Mountains, California.
166

+E
\\7 \ APKW
\\ A+ @ JON
NOP
azi plungeP ais 215.00 50.00
SPECTER RANGE SW T axis 35.00 40.00DATE&TIME: 870420 11 24 33.47 B axis 125.00 0.00LAT: 38.588 LONG: 118.242 X 215.00 5.00DEPTH. 1 +/ - 0.5 Y as 35.00 85.00DION (kcm)- 10.7 strike dip rake
Soln 1 125.00 5.00 -90.00
Thl fooni fechohanlm indioate that theSG8SN h1s r0oorded AiorveathquakP-wav. first botlons thatar best fit bL nodol plree owe of iwhlhin w-bho zonlal. If 'the hpooentsr i c orreot.thie orthquko ay be SeIdn Far a
isaicoully ootiw sj new-urfaae datochwentfault.
Figure D5. A normal-slip focal mechanism solution having one sub-horizontal nodal plane for anearthquake of April 20, 1987, in the northern Amargosa Valley, Nevada (Specter Range SW quad-rangle). The RMS-nminimizing depth of focus is at the earth's surface.
167

E
\LSM y
nzl plunlge
P axis 224.98 44.78
SPECTER RANGE SW B axis 130.00 5.00
DATE&IMLE: 870420 11 24 33.97 X axis 310.00 85.00
LAT: 38.588 LONG: 116.239 Y axs 40.00 0 00
DEPTH. km 6.65 +/- 1.8 MLL 1.8 str4ke d0p raL0e
DS1 (kh:)-11.1 Sola 1 130.00 90.00 85.00
Var 2 128.50 90.00 89.00fLTERdATE HYPOCENTER -> RLTERHATE MECHM151The Spooter Ron. hupooenter of- April 20. 1987.11:24 UTC hod a minir RM1S trvel tire residualof 0.10 seonrds for the sur.oos-fo'oms solutionPrei" otiuly shwn veiWafl a RM travel tis. remidualof 0.14 .eoondu oRrS this 6.65 kA below son levelsolution. Even for a rodIoall difFerent d itr Ibut Ionof' P-rog take-off ongle for Tah deep.r foou solution.the poO ibilltu of on aotive detaohnint fault recalin.albeit uith IJizontal ml lp here. vorMuM nornol *lIpin the previouM eolutlon.
Figure D6. A strike-slip focal mechanism solution on a sub-horizontal nodal plane for the same
earthquake as in Figure D5, in which the focal depth is changed from surface to 6.65 km below sea
level.
168

PI-. \ I /Y
_^\ PI /
_ aozi plungeP axs 208.28 12.89
TOPOPAH SPRING NW T axis 301.77 15.1DATE&TE: 870801 11 3 34.76 X s 79.99 70.03LAT: 38.898 LONG: 118.482 254.68 1 .DEPTHI kx. 5.94 +/- 0.5 ML- 0.1 45.30DMIN (lan)- 0.8 strike dip rake
Soln 1 75.30 88.30 19.90Var 2' 185.40 85.00 -85.00
npl Stu" Ratio DataLooI(SV/P)z fO-Norol Slip Solution (dosed)
Ob o Thoretioal Olfrrenoe Station1.7394 1.7863 -0.0915 YltTS9.4341 0.37G6 0.1635 Y"T4O.qgg1 0.2130 0.2675 YWITS0.7285 0.9980 -0.2695 YT3
RHS Ratio ri-ror for above date to 0.197.
LlIU(SV/P)z For Strike Slip Solution (solid)lh o OtloeleOlf StationOb, Theoretical DE-n tto1.7648 1.5349 S.1699 YM0.4341 8.3667 0.9674 'mTqO.696S 9.1890 0.2915 YTS0.7Q (.106 0.1060 YMT
Avg MO r 80 Qt80 -.
Figure D7. A very different pair of focal mechanism solutions for a very small earthquake of June1, 1987, at Yucca Mountin, Nevada, both of which are constrained by several SV/P5 amplituderatioe.
169

/ ~r mi// ~ xS 349300
/ ~~+HCR //
B +Bi 2. 45
.L 37.097 LOG 1TPU1
X oziplunge_- I P axis 54.94 45.00
DESER HEL SE T ais 324.93 0.00DAT2EllDE: 870817 0 0 50.39 B wris 234.9k3 45.00LAlT: 37.097 LONG: 115.273 X axs 109.ff7 30.00_DEPTH, kln 7.41 +/- 1.3 IL- 3.5 Y axi 0.20 30.00DMIN (km)- 11.0 strike dip rake
Soln 1 90.20 60.00 -35.26Var 2' 95.28 54.60 -29.84
Th _9 ntsP is the malnshook of Var 2" 84.32 47.85 -39.32o diffume series of earthquakes in thePahronoq~at Shear Zone. ooourrina atthe souThwest terminus of the 2ne.at the mouthern *nd or the PohrwmoqatRano. Conetraint Is provi dedbutSV/P ampiItude ratIo at *tatIonOther nearbu otatlon all have olipped(over&' IvenJ ool-rograco for this earthquake.The plonter fall nt the mst end of a moppedncrtheast-trendint laft-loteral strike-sl ip oult.
Figure D8. An oblique strike-slip focal mechanism solution for an earthquake of June 17, 1987,0:00:51, in the Pahranagat Shear Zone.
170 7

azi plungePaxis 53.45 21.08
STONEWALL PASS T axis 150.45 17.55DATE&-TlE: 870713 20 10 15.14 B axis 278.97 82.01LQT_ 37.386 LONG: 117.133 X axis 102.84 27.87LAX: 7.38 LONG 1-1.133V` ."- 414 Arnl3r
DEPTH. k: -0.07 +/- 0.3 M: 2.5 I ^ X ""'
DMIN (Icm- 14.5 strike dip rakeSoln 1 101.40 87.65 -27.90
The earthquake is the oalnmhook of a _1 iesof ebout °1recorded eathquok fromFebeur-o 1987 through AuMt 1987 about15 km north-northweit OF Soottr Jot Ion. Nev.This htpooenter. whioh hos min ,mRlS travel time residual at se levelor ehallo er. was detei-ilnod usnINO aodified velooltq model In u~hl oVp/V-1.6S. froce *-Vedatl ilagean. Also.O Pg interfooe at 15 km below am level1- Pbet. below which Vp - 6.5 ki./eeo.
Figure D9. A predominantly strike-slip focal mechanism solution for an earthquake of July 13, 1987,20:10:15, northwest of Scottys Junction, Nevada.
171

E
IIIII
azi plungea 49.89 3.83
3UCKBOARD E T axis 140.11 3.21
D&TE&TDIE: 870813 11 4U 9.37 B ails 289.94 85.00
L&T: 37.012 LONG: 118.359 X axis 95.02 4.98
DEPT km 8.99 +/- 0.4 YLI 1.5 Y axis 4.98 0.44
COMPOSTE WiMT 870814 4 11 59.10 strike dip
Po(PI ituds ratio data for the Ferst foowl ah. Soln 1 94.98 89.66!Owrthga ok AlR t 14. 1987. sq:11:5S UTC3I Var Z 79.95 88.71
-..... ito Ver Z'271.51 80.15
rake-4.90-4.8317.50
Qx-OTheorettlool*.q90q 3.23 1.2074 LOP1.2114 3.2094 0.9225 aSZI
-6.3159 -6~3~96 SAM8 VCT-571M -6.63S -C 3233 r - T049.8m2 4.1664 3.1732 - - am
The RS ratio wrum for aocoptobI4'oCmpIItUdmis 11 .1142
Figure DI1. A strike-slip set of focal mechanism solutions for an earthquake of August 13, 1987,
11:46:09 UTC at the southeast edge of the Timber Mountain Caldera, Nevada.
172

EPR
P
NPN//
t,! \H~TI-
TPU5 plunge
pP axis 168.92 53.78T axis 328.06 34.39
PAPOOSE LAKE SE B axi 65.00 10.00DATE&TRDE: 871002 11 11 55.21 X B 290.45 75.89
LAT: 37.072 LONG: 115.753 Y axis 158.75 9.85
DEPTH. krn 5.18 +/- 8.5 L; 3.4 strike dp rake
DMIN (km) 29.1 Soln 1 246.75 80.15 -79.85
Beouse the distonoe between thenearest statlon (GtR) ond the eploente_is 23 kl. the depth of Foous for thisearthquok 1veu uncrtalf*. Theum-hcriZontal dip OF the Southeastdippin onniq nodalI plaI sdependent an theoarreo'IneUU OF the depth st loate. and.
Acr 9eera By onthe odequac4 oF the veloolt9acdel. V the ~ocent Be rreot. the fooal
eohanawi le i-constrained. havIng essentiallyno alternate nodbl plon sotton.
Figure Dll. A peculiar normal-slip focal mechanism solution for an earthquake of October 2, 1987,
11:11:55 UTC, at Yucca Flat, Nevada Test Site, in which one nodal plane is sub-horizontal when the
depth of focus is assumed to be about 5 km below sea level.
173

azi plungeP axs 193.28 62.01
axi _ z~ *_1iiabj -.PAPOOSE LA1E SE r IS ;30.04 10.70DTE&TIE: 871002 11 11 55.10 1 axis 20.04 20.00LAT: 37.074 LONG: 115.752 X is 293.78 58.39DEPTH. kn 11.00 +/- 2.7 L. 3.4 Y axis 159.10 23.40DYIN (krn)-27.1 strike dip rakeSoln 1 249.10 66.80 -68.12
Var 2 251.15 67.50 -62.77RLTERH4RTE HYOC -> fLTERNRTE ~E~ftSIFor this rixod-2 solution, tho distator betweenthe nearest station (GMI and the eploenterin 27 km. PRu5Air,en 11 k* below sea level depth. soreaonventlonal nodal plne so utOnare foud. The atS Travel tle rul&wslFor this 1I kb hepooenter is 1-.2 se0.vs 3.19 weo For The 5.18 k1 shown prelaously.
Figure D12. An alternate predominantly normal-slip focal mechanism solution for the same earth-quake as in Figure D1I, in which tie previously shallow-dipping nodal plane now dips at about 30degrees, when the depth of focus is assumed to be 11 km below sea level.
174

U.-'-
* -. , I /
azi plunge-_ P axis 45.20 1.32
REVE PEAK T axis 314.85 14.87DATE&TIME: 871028 17 25 8.57 B axi 140.15 75.07IAT: 37.870 LONG: 111.132 259.06 .51DEPTH., lcn: 0.85 +/- 0.5 lL 2.5 Y axis 1.00 11.40DYIN (Ian):- 20.9 strike dip rake
Soln 1 91.00 78.80 9.70Var 2' 86.70 77.30 15.60
Ih. voloolty Rodel used to obtain thisdata set has a r frootor Interface at 12 k^below sea level. vp/va-1.71 (standardvalue for- prelllinarN det-erination ofhypooent-e for SG8 earthquokeW . The
rt I no depth for- Iterotione ucs setto z&B-.0 " (atsoea *olaY). Th. RMs trovaltire residual for- this solution is 8.11 *eo.not the global m Inium.
Figure D13. A strike-slip focal mechanism for an earthquake of October 28, 1987, in the southwestReveille Range, Nevada, in which the depth of focus is assumed to be 0.65 km below sea level.A velocity discontinuity at 12 km below sea level was used for ray tracing when computing thispreliminary hypocenter.
175
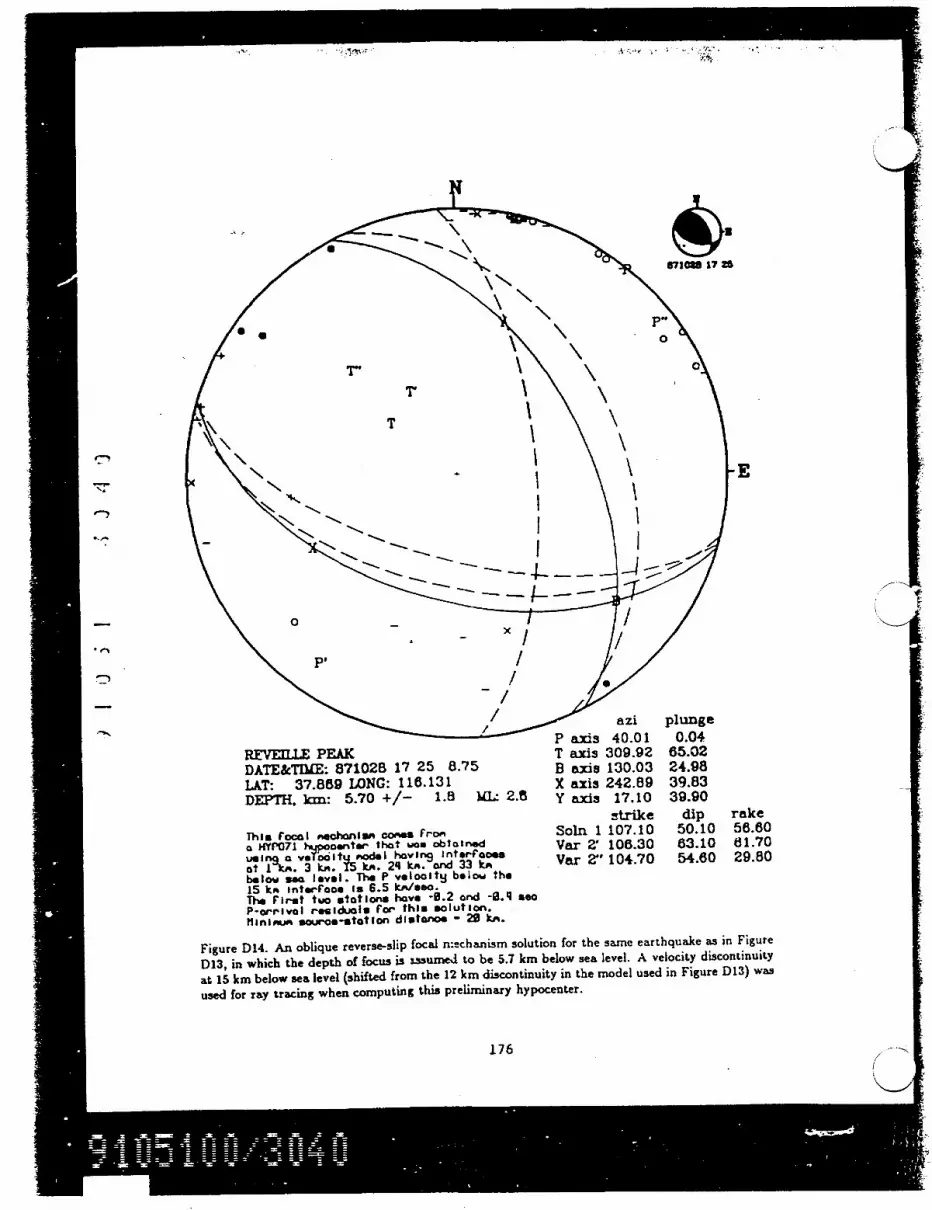
IN
PI
/ azi plunge
P axis 40.01 0.04REVE3lLE PEAK T axis 309.92 65.02DATE&TDLE: 871028 17 25 8.75 B a-is 130.03 24.98
LAT: 37.869 LONG: 116.131 X axis 242.89 39.83DEPTH. kra: 5.70 +1- 1.8 1la 2.8 Y axis 17.10 39.90
strike dip rake
This foaal ecohanisA comes from Soln 1 107.10 50.10 56.60a HYPO71 hI4 ooofnter that was obtained Var 2' 10.30 83.10 81.70
ve a oltu ,.odel havirng Inter~foo"eu IngkA.3 km. VS kR. 24b k. arnd 33 kA Var 2" 104.70 54.80 29.80below sea level. The P voloolty below the15 km Int rfoao in 6.5 kreeo.The First tuo stations have -0.2 and -0.q se4P-Orrivol residuals for this solution.
linimum souroe-stotion ditonos - 20 kb.
Figure D14. An oblique reverse-slip focal mechanism solution for the same earthquake as in Figure
D13, in which the depth of focus is aSSumed to be 5.7 km below sea level. A velocity discontinuity
at 15 km below sea level (shifted from the 12 km discontinuity in the model used in Figure D13) was
used for ray tracing when computing this preliminary hypocenter.
176
'

P..
P/
/ T..
0S
%~ % L\a4azi plungeP axis 240.90 23.70SPECTER RANGE NW T axis 148.15 6.02
DATE&TIME: 871210 2 35 17.19 B axis 44.79 85.48LAT: 38.737 LDNG: 118.189 X axis 288.73 12.12DEPTH. kn 4.82 +/- 0.8 ILL, 2.2 Y axis 192.00 21.00DILIN %'kz)- 7.4 st~rike dip rake
SolIn 1 282.00 69.00 -13.00Var 2' 288.00 88.00 34.00Var 2" 283.00 45.00 0.00
Figure DIS. A set of predominantly strike-slip focal mechanism solutions for an earthquake ofDecember 10, 1987, 2:35:17 UTC, in the Specter Range, southern Nevada Test Site.
177

*N 0MCY I / 'wA_SPRG E / /
c II ///\ \ l/ / //
\ / T26 SGV-/
;_-PP Y!MT4 *0
\ X Bl TPNMDR B3T\.+azi plunge
P axis 39.41 58.52T axis 295.00 8.67
STRIPED H B axis 199.95 30.00DATE&TIE: 880114 5 18 33.45 X 90.67 29.77UT: 36.680 LONG: 116.327 Y axis 32.50 29.77DEPTH, k 10.11 +/- 0.3 ML 2.3 Y axis 325.50 45.20DMIN (kcm)-4.1 Sm 1strike dip rake
Composit w3 Soln 1 55.50 44.80 -44.50Composite with 880114 07:35 Var 2' 60.90 41.40 -AO.90
Thlo obliqe noro-l Ip *teltre-eII Var 2" 51.60 52.50 -50.80ooNpoeIto ,ie.ohnimR ie oon atrifnedthe Aaln -DOke fipst rotione. oth..-earthquae. dota have bn InWluded beocusea4 thir ooneimtonoy. roather than Ineolty to odd th 5or contrainT
Figure D16. A composite oblique normal-slip set of focal mechanism solutions for a pair of earth-
quakes on January 14, 1988, in the Striped Hills, about 20 km south of Yucca Mountain, Nevada.
178

azi plungeP axis 140.00 70.00T axis 320.00 20.00
THURSTY CANYON NW 8 axs 50.00 0.00DATE&TM: 880128 18 17 21.68 axis 320.00 65.00LAT: 37.191 LONG: 116.743 Y xiB 32000 2500DEPTH. km 9.89 +J- 0.5 IL 2.3 Y axis 140.00 25.00DION (km)-5.2 strike dip ra~ke
Soln 1 230.00 85.00 -90.00Var 2' 38.02 15.80 -71.30
Focal meohofiUs solutiona For thishe1`oontsr owe foir l Ie11 oonstraoinedusing P-ove poloriti o laone. Note. thedashd-line solution Nor 2') has a shllowdippinq nodal plans (dip - 16 d-or.s).providTnQ on exoople oF the possbilItyof .isATo slip on o detOahment fault.
Figure D17. Predominantly normalslip focal mechanism solutions for an earthquake of January 26,
1988, 18:17:22 UTC, in the Oasis Valley, Nevada (Thirsty Canyon NW quadrangle), one of which
has a bha&Uow-dipping nodal plane.
179

IN.'
\ \ a~i plungePaii 47.01 33.87T x-is 303.85 18.73YUCCA FLAT B _ii 19.0 49.97
DITE&MILE: 880207 16 47 41.87 X aim 88.4. 49.91LiT. 37.058 ILNG: 116.080 8.41 9.81DEP~TL kzn -0.21 +/- 0.8 ILY 2.0 Y Sall 350.70 38.40D)IN (km)- 13.7 strike dip rake
Soln 1 80.70 51.60 -12.30Var 2 75.70 51.60 -12.30
T ultra-sallo uhontr. with Var Z' 85.70 51.80 -12.30ter-abot oe rAWes ofthe
=o- traoe of Yuooe Fault. heoull-conetroanod nodol plae.rFrom P- polarItl.The RltS trvelI tIme rs IduIalfor this hLpooeter in 0.14 aecands.
the Vtahartd SGBSN velcoiturd. The nroeret-ln-tli nuoleardevioe tost ot Yuooe Flat In MWo.Oeoaimber 1. 1987. 16:30 UTC.
Figure D18. Set of strike-slip focal mechanism solutions for an earthquake on February 7, 198816:47:42 UTC at Yucca Flat, Nevada Test Site, in which the depth of focus is assumed to be 0.21km above sa level.
180
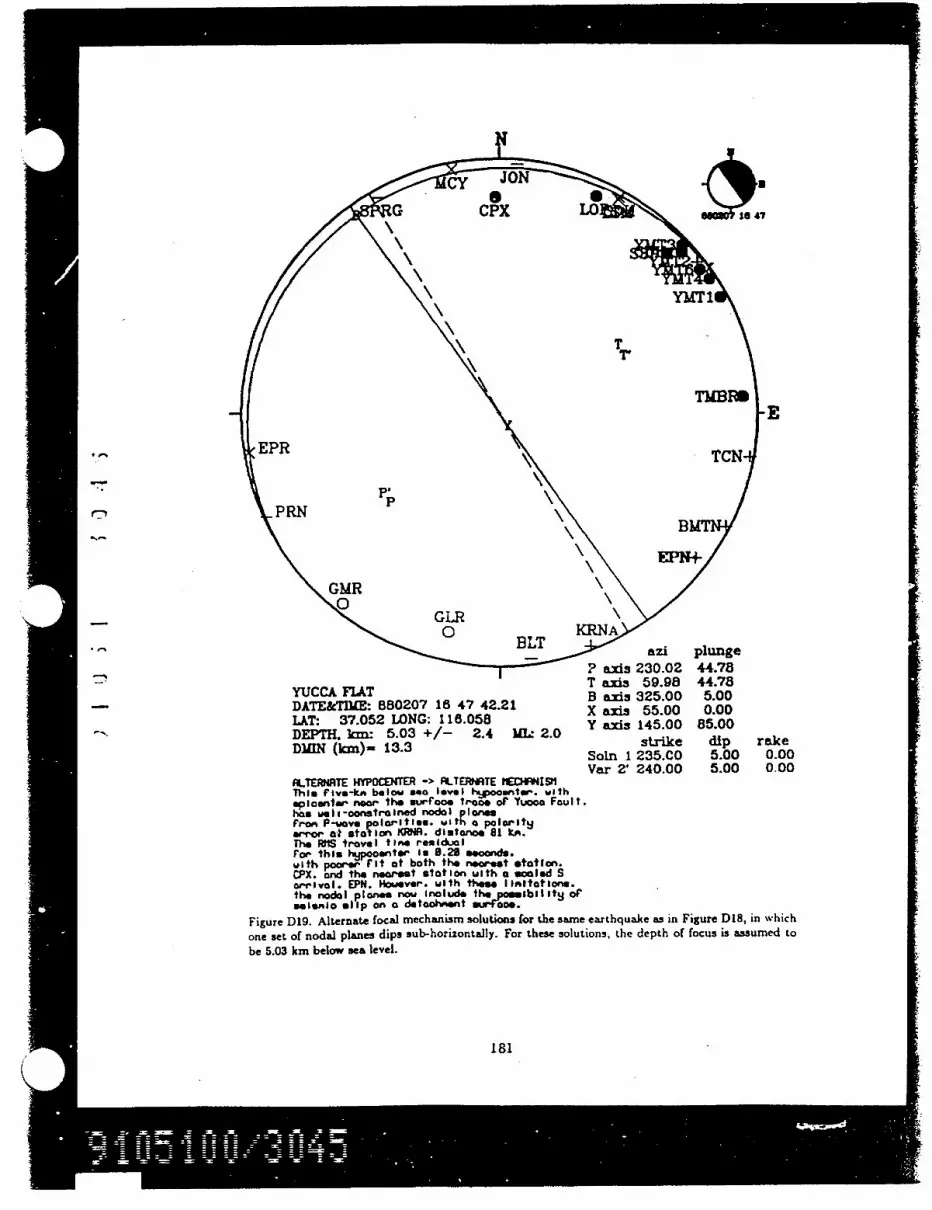
, EPR TCN
P.r. PRN
B
GMR
GLR
11=ET z plungeP aids 230.02 44.78
Taxis 59.98 44.78YUCCA FLAT B axis 325.00 5.00DATE&TMUE: 880207 18 47 42.21 X axis 55.00 0.00LAT: 37.052 LONG: 118.058 Y axis 145.00 85.00DEPTH. kcm: 5.03 +/- 2.4 ML 2.0 s~ie dp rk
DI (1m- Solm I 235.CO 5.00 0.00Var 2' 240.00 5.00 0.00
ALTERNRTE HYPOCENTER -> ALTERI*TE IlECIORMISiThis Five-Ito below son lvlNost. itheploentee- near the sur-Face =ro tYcaFou?has weli'.oonstroined nodal plane.From P'.wav. polarities. with a poloritgjwvvroe at ttiont K4RNA distanos, SI ki.The RMlS travel tinhe residualFor- this hijpooentser Is 0.29 seconds.with poorer Fit at both the nearest station.CPX. and the nearest station with a scoilsd Sca-rival. EPN. However, with the"e llimitations.the nodal planes now Inoludste ~ponslbilit~g otPmic slip on a detoo/ment
Figure D19. Alternate focal mechanism solutions for the samne earthquake as in Figure D18, in which
one set of nodal planes dips sub-horizontally. For these solutions, the depth of focus is assumed to
be 5.03 km below sea level.
181

DRY MTNDATE&TIME: 880520 3 58 49.82LAT: 38.997 LONG: 117.709DEPTH, kn: 7.00 +/- 1.7 IMLU 4.2
aziP axis 84.47T ais 277.33B axis 185.01X axis 288.45Y axis 93.20
strikeSoln 1 183.20
plunge64.5224.924.98
69.4319.90
dip rake70.10 -95.30
This solution asounme a rorrlootor at15 kL below *ao-lovel. with _loo ofoof, ainnol wo vcs - B.4 k, /o beneaththe ouw bodori. Also. a rofroaotor.ot 24 VA bolou hiToh olpha - 7.3 km/moo.The 15 kR r rrootorv wa needed to separatethe dilatations frta the oOpressioe.
Figure D20. Nornial-slip focal r.echanism solutions for an earthquake of May 26, 1988, 3:56:50 UTC,in the Fish Lake Valley, California (Dry Mountain quadrangle).
182
I

T~
\r<
ZI plungeP ais 341.68 64.54
AMMONIA TANKS T axis 242.08 4.53DATE&TIME: 880615 C 23 40.25 B axds 149.97 25.00LAT: 37.232 LONG: 116.384 X axis 40.44 35.63DEPTH, kmn: 0.12 +/- 0.3 MLL 1.B Y aids 268.70 43.97S1 lont Cc olds.-. SvOnt having strike dip rake.ctly diltional r"I t fotilons. Soln 1 356.70 40.03 -54.04*q-ourtre on uoMf2 at e. e2this Soln 2310.00 35.00 -90.00
The sha low-foous phmonenon repa ins whenoll stotions having sploontrol distonocge ater than S8 k^ ars not usJd.
Figure D21. Oblique normal-slip and predominantly normal-slip focal mechanism Solutions for anearthquake of June 15, 1988, 6:23:40 UTC, at Silent Canyon Caldera, Nevada Test Site. For thisearthquake, all SGBSN stations recorded dilatational P-wave first motions, as if the source were animplosion, a possibility which cannot be ruled out by seismic network data. A Pahute Mesa nucleardevice test was detonated on June 2, 19B8, about 10 km from the epicenter.
183

0- x
I' r
&xi plungeP axis 45.79 18.89
THMSMY CANYON SW T ai 143.73 24.45DATE&TDLX: 880702 10 40 13.88 B axis 284.68 59.62UT: 37.105 L0NG: 116.733 X axis 93.12 29.87DEPT.I kmn: 1.72 +/- 0.2 LL 2.2 y axis 188.00 5.30
strike dip rakeUsing HoVFonn-fo Yucco Mountoin Soln 1 278.00 55.00 30.00veoolty II p - Provo the RM Var 2' 272.50 80.20 28.50trow-I 1n error for thlawhen ooAreO to stnd. SG8 Rbl Var 2" 281.00 88.00 25.00
Figure D22. Strike-slip focal mechanism solutions for an Oasis Valley earthquake on July 2, 1988,10:40:1-t UTC, located using the velocity model shown in Figure Fl(b). The source-to-station raysshown in this figure come from that hypocenter.
184

+ * E
PI P.
azI plunge~ ~~J&=~~~~ Paids 165.08 75.04
DATE&TIME: 880705 18 18 47.53 T arxi 75.03 0.01LAT: 38.417 LONC: 118.049 B axis 345.02 14.98DEPTH. knn: 6.00 +/- 1.1 ML: 4.4 X axis 240.58 43.080._ns Volley oarthquoke "Is s iory Y axis 89.50 43.10ohonotu erk using southern Cal ifornio strike dip rake
d Soln 1 179.50 46.90 -89.30This solution Plneo depth or rocuo Soln 2 175.40 26.80 -67.40at 6 k beiow sea sval also, arofrootor at IS k^ below seo-lev-lnot usuolly present in our SG8 ^od-l1- naw be in g used. rg ofarrivols at obout 70 deress.
Figure D23. Predominantly normal-slip focal mechanism solutions for a magnitude 1.4 carthquakein the Owens Valley, California, possibly on the Independence Fault, on July 5, 1988, 18:18:48UTC (fixed-depth hypocenter 6 km below sea level). Additional first motions and arrival timeswere provided by the Southern California Seismic Network (Pasadena) and by the seismographiclaboratory of the University or Ncvada (Reno).
185

+ /
* \ /
azi plunge. P aids 186.02 32.59
TDJBER MLTN T axis 283.39 11.34DATE&-TDwE: 880703 18 13 33.59 B axis 30.03 55.011AT 37.038 LONG: 118.379 X axis 239.63 31.33DEPTH. nm: 8.39 +/- 0.7 ILL 0.5 Y axis 140.90 14.00COMPOSME WTrH 880724 5 39 7.57 strike dip rake880724 8 12 28.71 AAC -4 Soln 1 230.90 78.00 -32.40The". thre e*vuts o" wiuthin I k^ Soln 2 229.50 68.40 -28.20o stotaion TtH8R: for the oorpon Its_o K Ion. an I rour Iv" *^ I IIor)solutlons fro. FOCMEC tOt s degi..Inoroen1ts wuev obtained.
Figure D24. Oblique strike-slip focal mechanism solutions for a composite Timber Mountain Calderaearthquake series on July 3 and July 24, 1988.
186

* n / //D
.. s~MGg k
T
f \t \ HCR/
tls plungeP axis 25.49 58.78
REVE PET axis 129.79 8.52DATE&TIME: 880830 2 30 32.92 B axis 224.70 20.78LAT 37.855 LONG: 118.132 y ai 93 45.19DEPTH. kmn 5.00 +/- 3.8 MLL 2.8 Y axis 334.00 30.00DMIN (kin)- 19.5 strike dip rake
Soln 1 84.00 80.00 -55.00Var 2' 59.00 76.00 -74.00
p hgxoontwr in derived FroA 0 velooltt Var 2" 82.00 35.00 -42.00mode In whloh the P-wave voloolt i.In shllow rook are 4.8 kW0e freonthe earthv surfoov to I k* below "a level.6.3 WRo to 3 kR below sea level. and6.15 kW/owo belou the 3 kR Intmrfooa. Thehigher v0loolty for ultro-shollow rock. uhen
-o-ed to thi staendard odel. It supportedbu XTS nuelort devloe P-artival reeI&;ols at
the rS58SN utatlona. The depth or focuFor this solution was f Ixed at 5 km below woo level.
Figure D25. Oblique normal-slip focal :mechanism solutions for a southwest Reveille Range, Nevada,eanrhquake of August 30, 1988, 2:30:33 UTC, in which the hypocenter was derived using a velocitymodel having higher-than-usual velocities for rock at shallow depths.
187

NS-
/S Ay BMTN*GL
1/ ~SRG- /_ PBLTIP
lSVP-
x
HCR* -' azi plunge
P axis 35.10 60.04T axis 305.05 0.02
DATE&TDE: 881028 20 2 49.58 X axis 98252 . 37072LAT: 37.515 LONG: 116.527 Y axis 331.60 37.80DEPTH, km- 10.86 +/- 0.8 ILU 3.1 st331ke S7 reDMN (lcm)- 23.8 strike dip raike
Soln 1 81.80 52.20 -50.80Var 2' 52.90 50.10 -56.80
This hpooantsr in the mo Ilbl~o of asol l Wleo or orthtes in Cootus Flat.north oi Pahui Mle". tht Woe accede
th SG8SN rroeOct 20. 1SM to Nov IS. 188.iquerol *lnm l sp to tr slip in Indicated
on eoch nodal plone of the Fool meohWlnsm.
Figure D26. Oblique ncrmal-slip focal rnechanism solutions for a ML = 3.1 earthquake at Cactus
Flat, Nevada (Mellan quadrangle) on October 28, 1988, 20:02:50 UTC. That earthquake was themamnshock of a series that lasted nearly one month.
188

9 *n
MELLNDATE&TULE: 881029 6 37 17.64IAT: 37.518 LONG: 116.527DEPTH, kn: 10.15 +/- 1.0 IL 2.3
aziP adas 45.78T axis 305.73B axis 205.01X axia 92.86Y axis 345.77
strikeSoln 1 75.77
plunge43.0810.5445.0020.7137.76
dip rake52.24 -28.57Suwora rao In Gold FIat north
of S lI nt Canyon ooI dw-o.
Figure D27. Oblique strike-slip & normal-slip focal mechanism solutions for one of the largestaftershocks in the Cactus Flat, Nevada series on October 29, 1988, 6:37:18 UTC.
189

BARE MTNDATE&TulE: 881118 20 32 24.74LAT: 38.925 LONG: 118.553DEPTH. k 11.25 +/- 0.4 MLU 2.1DION (kam)-8.2
aziP Sim 174.f4T axus 274.49B axis 20.03X axis 231.42Y axims 129.70
strikc
Soln 1 219.70Var 2 50.70
plunge37.2212.7049.9435.8715.80
dip rake74.20 -37.3087.50 29.90
S_.
Log1OCSV/Plz SolId-IInn uolutIonObe TheoiatIool Olrrwr-no Station
d.6354 0.4469 0.1885 YMITI
0.3407 0.7596 -0. 4189 OYTS3.3779 0.2966 0.0813 YHTS0.3788 0.222q 0.1556 SPRG
Lo l DSV/P) z Dlahd- Ilno-*o lut IonObrv Tetl IIDirr-eno Station,.6354q 0.7095 -0.0741 YHlTI0 3407 0.4432 -8.125 yITS0 3779 -0.2333 0.6112 mXYTG0.3780 0.3413 9.3S67 SPRG
Figure D28. Predominantly strike-slip focal mechanism solutions for the tfL = 2.1 mainshock of a
short-lived series of microearthquakes at a northwest boundary of Yucca Mountain, Nevada (Bare
Mountain quadrangle) on November 18, 1988, 20:32:25 UTC. To provide additional constraint on the
focal mechanisms, SV/P. amplitude ratios were included from a foreshock (the mainshock clipped
nearby station seismograms).
190
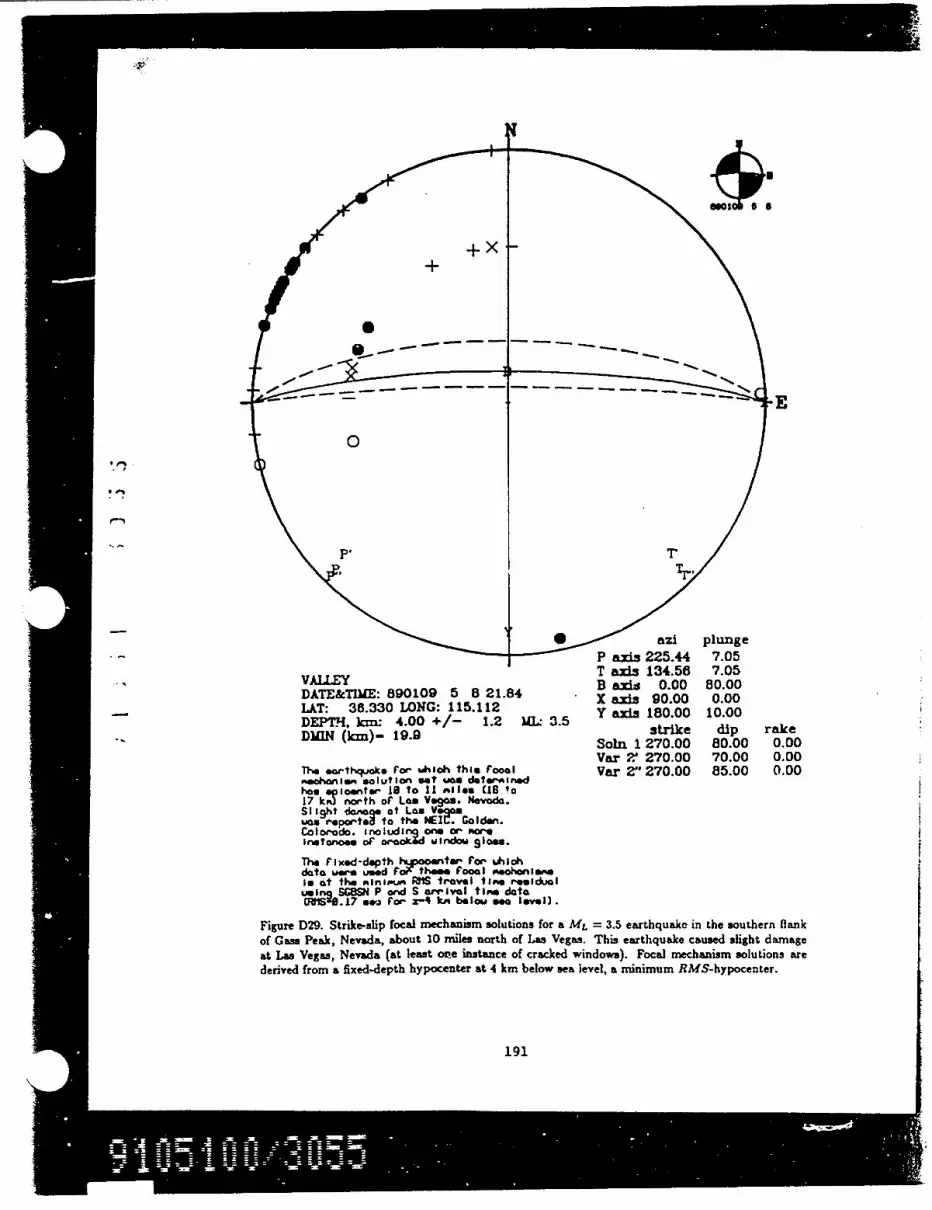
t nziplungeP axis 225.44 7.05
T axis 134.58 7.05*VALLEY B axis 0.00 80.00
DATE&TIME: 890109 5 8 21.84 X axis 90.00 0.00LAT: 38.330 LONG: 115.112 Y is 18000 1000DEPT.H. km. 4.00 +1- 1.2 IfLL- 35 Y xst180.0 10.00 ak
*DYIN (1Cm)- 19.9 strike dip raSkeN * Soan 1 270.00 80.00 0.00
Var PI 270.00 70.00 0.00The eothquoke for whIoh this focal Var 2" 270.00 85.00 0.00tOohonlim solution *et eas determinedhoe *oonter IB to 11 miles (16 to17 km north or Los V.gas. Nevodo.Slight dWoq ot Los VY- oaUCs raportd to the NE1C GoldnColoaodo. inludinq cm or nor'sInstonc-~ or orookid window Sloss.
The Fixed-depth hspacenter for uhiohdato w e used FoF theme Fol maohanim-I* at the otInlpu R1S trovel tilm rviedueluIqSG8SN P and S arrival tim dota
.e17 *tV for z-4 kg be low ao lava]
Figure D29. Strike-Slip focal mechanism solutions for a ML = 3.5 earthquake in the southern flankof Gasn Peak, Nevada, about 10 miles north of Las Vegas. This earthquake caused slight damageat Las Vegas, Nevada (at least or~e instance of cracked windows). Focal mechanism solutions arederived from a fixed-depth hypocenter at 4 km below sea level, a minimum RMS-hypocenter.
191

P P j
azi plunge
P axis 2Z0.05 4.68T axis 129.91 1.70
GASS PEAK SW B aids 19.95 85.04DATE&TlIL: 890109 5 8 21.40 X axis 265.08 2.09
LAY: 3B.330 LONG: 115.125 Y axis 174.90 4.50DEPTH kxn: 0.00 +1- 4.0 ML 35 strike14.9 4.50 ak
DMIN (km)- 19.8 strike dip rakeSoln 1 284.90 85.50 -2.10Var 2' 95.00 89.10 -4.90
The rttqEO for, which this foool Var 2" 254.10 77.80 -8.70neohi'onw ,olutlol set wOS detwr-ninedheg kiOWnt_ II to 11 aia- (18 to17 X- ~nortthrof1 Loto YVtl. AI I*1.tiL . goa.. Nevada.SilIgt ao.oetot Las Vuca rtport a the WE1 _G -,id.C~o lor io . I noIud Inqe on ovr ontIr&taneie of orodii wIndOw 9lalt.
The Fixed-depth spooent for wohidata wer uued feI thee. 'oeoal ,,ohonlwi1 not at the ^In1F4^ t1S tr*vel tia. roes1duus In SGBSN P arid S or I va I t I s dataOlti. 23 eea Fo' z at *ie oval) .
Figure D30. Alternate, ttrike-stip focal mechanism solutions for the saene earthquake as in Fig-
ure D29. Focal mechanism solutions are derived from a fixed-depth hypocenter at sea level, not a
minimum RMS-hypocenter. The uncertainty or range in plausible strike of the nodal planes at-
tains its maximum when computing focal mechanisim from this shallow-focus hypocenter. Initial P
waves from this earthquake at all SCBSN stations except SHRG, the nearest station to the epi-
center, display parabolic starts, characteristic of retracted arrivals, suggesting a very shallow source,
notwithstanding RMS.
192

-
-x
p x
Lt)
azi plungeP axis 0.00 89.98
DEAD HORSE FLAT T axis 51.00 0.00DATE&TUML: 890131 16 7 17.43 X adir 541.00 45.00LAT. 37.253 LONG: 116.364 X a-n- 51,00 45.00DEPTH. km- 0.00 +1- 0.3 ULL 2.3 Y axis 231.00 45.00
strike dip rakeSoln 1 321.00 45.00 -90.00
This Silent Conyon oaldero orthquokei another exsonple of on olnoet *eoluelvelidllotatlonal phmno#enon. vrg s*lalor to th*erthquke or June LS. 188. Z6:15 UTC. hosefoool r eohanie is also shoun In this report.
lhe nornt.l o the earthqaes of the
have aIP I Ior woverore. ThI I oawearthquake. probablyj Inluo d b4 nuoleor devicetesta ot Pohute 11aa. Thoe norT rn SCC eventashould not be oconldered when ulIfoool r echcn,.1^4e to infer propertl'e ofthe natural reglonol teotonlo streas FleldIn shallow SGS orustal rook.
Figure D31. Normalslip focal mechanism solution for a Silent Canyon Caldera, Nevada Test Site,
earthquake on January 31. 1989, 16:07:17 UTC. The consistently dilatational first motions fromSGBSN stations for this earthquake suggest that it may be an implosion rather than the double-
couple event shown in this figure. ITe nearest-in-time nuclear device test in the vicinity was theDecember 10, 1988, detonation of 'Misty Echo' at Rainier Mesa.
193
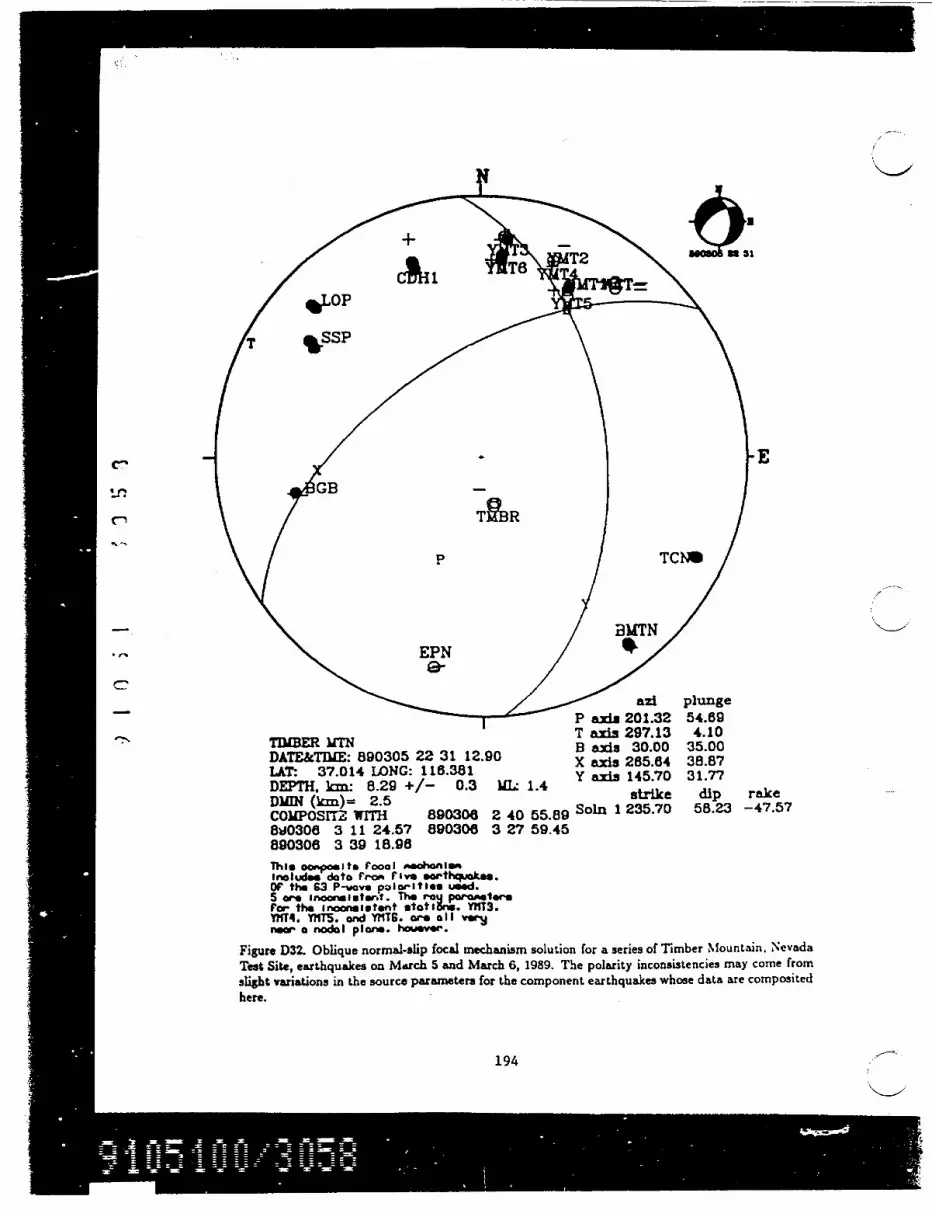
C-,
TDLBER MTNDATE&TIlE: 890305 22 31 12.90LAT- 37.014 LONG: 116.381DEPTH. km 8.29 +/- 0.3 YL: 1.4DUN (lnm)= 2.5COMPOSUT24 WITH 890306 2 40 55.89850308 3 11 24.57 890308 3 27 59.45890308 3 39 18.98
I aziP axis 201.32T axis 297.13B axis 30.00X axis 285.64Y axis 145.70
strikeSoln 1 235.70
plunge54.694.10
35.0038.8731.77
dip rake58.23 -47.57
This ocposlte Foool seohanlafinclude, data rro rive, *eet .OF the 63 P-ways polaritles used.5 ere Inoon-lstwnt. The ro p otor. the inoonsistent statibr. YKT3.mIlT4. YT. an YMTG. we ll v"
rar a nodal plone. however.
Figure D32. Oblique normal-slip focal mechanism solution for a series of Timber Mountain. 'NevadaTest Site, earthquakes on March 5 and March 6,1989. The polarity inconsistencies may come fromslight variations in the source parameters for the component earthquakes whose data are compositedhere.
194

1-1�
UBEHEBE CRATERDATE&TULE: 890412 20 24 55.05LAT: 37.214 LONG: 117.295DEPTH. km: 7.91 +/- 0.4 YL- 3.0DMN (lcm)- 10.2
aziP axis 303.41T axis 108.17B axis 199.98X axis 99.42Y axis 292.30
strikeSoln 1 22.30Var 2' 26.30Var 2" 190.00
plunge69.4119.924.99
64.5424.90
dip rake65.10 -84.5075.10 -84.8020.00 -90.00Thml h~ooenter Is derived Fre o
SS8 varoolIt4 Ioo having Intorraoooat one and kA below *sa level.an usual. and on interfooe at 15 kmbelow sen level. below hloh vp-6.5 kW/eo.For, this hupooonter. the ronge orfocal riohinl3R_ oonslstent with ollP-wve polorit lee io norrou and Inoludeso 2P t e or et -d lDP lnq nodo l Dlan, on uhiohnorniol i lip oooure PvA. thlo hypooenterp-ovldee anothei eopla oV the pos bIl~tatof ue*eRloily deteotoba -*lIp on a dMtoohtnt
ur-fooe thio one In thwe Gnopevine tnountaIne.
Figure D33. Normra-slip focal mechanism solutions for a Gold Mountain, Nevada (Ubehebe Craterquadrangle) earthquake of April 12, 1989, 20:24:55 UTC. Some of the west-dipping nodal planes have20± degree dip, but the depth of focus is probably too great to allow the selection of the west-dippingnodal plane as the fault plane due to high confining stress.
195

I axi 133 89
DATETJM: 8041922 9 2.95 axs 28. 4 78.87
ZKNA HCR \
BLT \ ~ARUT+ \\
SHRG ai plng
LAT: 37.251 LONG: 115.025DEPTH. km. 3.22 I .0 ML:- 3.8 Y axis 24.10 4.90
strike dip rake°Son 1114.10 85.10 80.00
VaTr 2' 113.70 85.20 74.95This earthquake il the rainshook
ofa I n-rum in series of earthqaesouthesT or Ttown or r Rl~o. Nivda.Thi focal moahanimA solution independent on depth of focus. In porticular.the southeast-dippinec nodal pl lne has
ti-atr dip for. a daiper NhpPooenter Stationpo~ritj nd rrvat iAe dtata uu'o, suppli ed bpo I a Utah. -SIe1°-ophla Laborwtor.'
Figure D34. Peculiar reverse-slip or strike-slip focal mechanism solutions for a ML, 3.6 earthquakein the Pahranagat Shear Zone, Nevada (Alamo SE quadrangle), having one sub-horizontal nodalplane. Constraint on the set of focal mechanisms consistent with first-motion data is increased bythe inclusion of the data from ARUT, a station operated by the University of Utah SeismographicLaboratory. These solutions assumes a hypocenter depth 3.2 km below sea level. If the modelingassumptions are correct, this is another candidate for seismically active detachment faulting.
196
,.

LOWER PAHRANAGAT LAKEDATE&TIME: 890419 22 39 28.5LAT: 37.246 LONG: 115.013DEPTH, kln: 7.00 +/- 0.7DlIN (kn)- 17.7
P axis 229.29T axis 354.47
8 B awis 120.00X axis 280.57
M- 3.6 Y axis 24.96MLL 3.6strikeSoln 1 114.96Var 2' 11250
plunge29.7845.1930.0058.538.65dip rake
81.35 59.6285.67 59.9077.10 59.10ALTERNATE HYPOCENTER -> fLTERNATE MEDtWSlS Var 2'
Using a fixed-depth hypooenter. wIth depth atseven kr beI ou sea l-vel. r-oulto tn theth foutheoat-dipping nodal plane hovinggreater dip than the oori-esponding nodaT planeihoun In th prenious figure For a *halloue. Free-depthh~pe nte. The ootuol depth to unorrtain. StationARUT poritu and oarrival tle dota umar- supplied byjUniverwit) oF Utah's Selanoqrophla Laborotoru.
117.40
Figure D35. Oblique reverse-r!ip focal mechanism solutions for the same Pahranagat Shear Zoneearthquake as discussed in Figure D33, where the hypocenter is now fixed at a depth of seven kmbelow sea level. The arrival time data do not provide an well-constrained estimate of the hypocentraldepth for this earthquake.
197

-"' a2i plungeP axds 22.58 35.74
JACKASS FLATS T axis 136.47 29.37DATE&TIME: 890721 23 1 39.93 B ads 254.97 40.29LAT: 38.776 LONG: 118.252 X axds 82.85 49.45DEPTH. kia: 2.75 +/- 0.4 IM 2.4 Y axis 348.20 3.80
strike dip rakeSoln 1 78.20 86.20 -40.60
This .crthquxke la th most Var 2' 77.50 85.70 -59.90orthr ciF a NE-trtndn, Var 2" 73.50 86.80 -39.90
In Jl 1e tred we rightLed_& tol LStl (Littig Skull Mttn).
Figure D36. Oblique normal-slip or strike-skip focal mechanism solutions for an earthquake at Little
Skull Mountain, Nevada Test Site, on July 21, 1989, 23:01:40 UTC.
198

azi plungeP axds 18.31 64.54T __4_ 1 s " nf A CO
SCOTTYS JUNCTION SW B axis 210.00 25.00DATE&n.ME: 890828 15 47 58.58 X axis 93.27 43.97LAT: 37.328 LONG: 117.238DEPTH, kin: 5.74 +/- 0.4 MLU 1.5 naxis 319.53 35.63MELN (lczn)-3.5 Son~ strike dip ra~ke
Soln 1 49.53 54.37 -58.87Var 2' 48.00 52.84 -64.59
This Gold Mountain earthquake Var 2" 52.75 58.17 -53.00was too -^oll to have sunFioi-ntpolorlt9 dota to constrain the ocaln ohinisn. SV/P onplitude ratio datauer* 9gther-d to provide additionaloonetraint From direot P L SV UOveO at fiveSG8SN *totIon,. The logI0CSV/P)z ratiou are
Station OdS. THEO. OIFF.LD4 O.3646 8.586s -0.1419GVN 8.8107 1.036S -8.2258SGV .416613 9.6922 -0.2256MzP 8.45qss BASH -0.8336TCN 0.1227 0.0976 0.8251
Figure D37. Predominantly normal-s'ip focal mechanism solutions for a Mt. Dunfee, Nevada (ScottysJunction SW quadrangle) e.rthquake on August 28, 1989, constrained by SV/P, amplitude ratiosas well as P-wave first motions.
199

Appendix E
Station codes, locations, and instrumentation
Appendix E contains a list of SGBSN station names, coordinates, and other descriptive infor-mation. Instrument codes refer to the seismometer, amplifier/VCO, and discriminator packagesfor each station. For the current network, codes 1 through 7 are valid. Any other codes are forsystems having unknown frequency response, which are no longer operating in the SGBSN. Thefollowing table shows the major components comprising the seven current seismographic systems.
Table El. Major components in seismographic systems comprising the SGBSN in the period 1987through 1989. All seismometers have natural frequency, J., = 1.0 Hz. The (analog) output of thediscriminators is digitized on a PDP 11/34 computer, with sampling rate = 104.167 sps/channel.
| KIND SEISMOMETER Motion Amplifier/VCO Discriminator1 Mark L4C vertical Tricom 649 Tricom 6422 Teledyne S13 vertical Tricom 649 Tricom 6423 Teledyne S13 vert., horiz. Teledyne Geotech 42.50 Teledyne 46124 Mark L4C vertical Teledy ne Geotech 42.50 Tricom 6425 Mark L4C horizontal Teledyne Geotech 42.50 Teledyne 46126 Teledyne! S13 vertical Teledyne Geotech 42.50 Tricom 6427 Ranger RR-I vertical Teledyne Geotech 42.50 Teledyne 4612
Figure El shows the amplification curves (theoretical frequency response) for typical vertical-component (KIND=3) and horizontal-component (KIND=-5) stations on Yucca Mountain, Nevada,with data telemetered to a PDP 11/34 computer in Golden, Colorado, that has 12-bit A-to-Dconverters with digital gain, 2048 counts per 5 volts input. A
200

e0
Yucca [Mountain Seismoqraphs
O 0-
"Z0-
C -
o 0-L0
(0 -
CY,
-c--
Vertical
- N
/
/
/1
!I Horizontal/
I
i O 2' '.. .1.~0 10Fr~equency (Hz)
A 2
Figure El. Upper curve, magnification (displacement response) for a typical seismographic systemon Yucca Mountain, Nevada, with a vertical-component Teledyne-Geotech S13 seismometer and as-sociated electronics (type = 3, amplifier gain = 84 dB), and digital-computer recording. Lower curve(dashed), magnification for north-south and east-west component seismographic systems on YuccaMountain, Nevada, witta horizontal-component Mark L4C seismometers and associated electronics(type = 5, amplifier gain = 60 dB), and digital-computer recording.
201
F
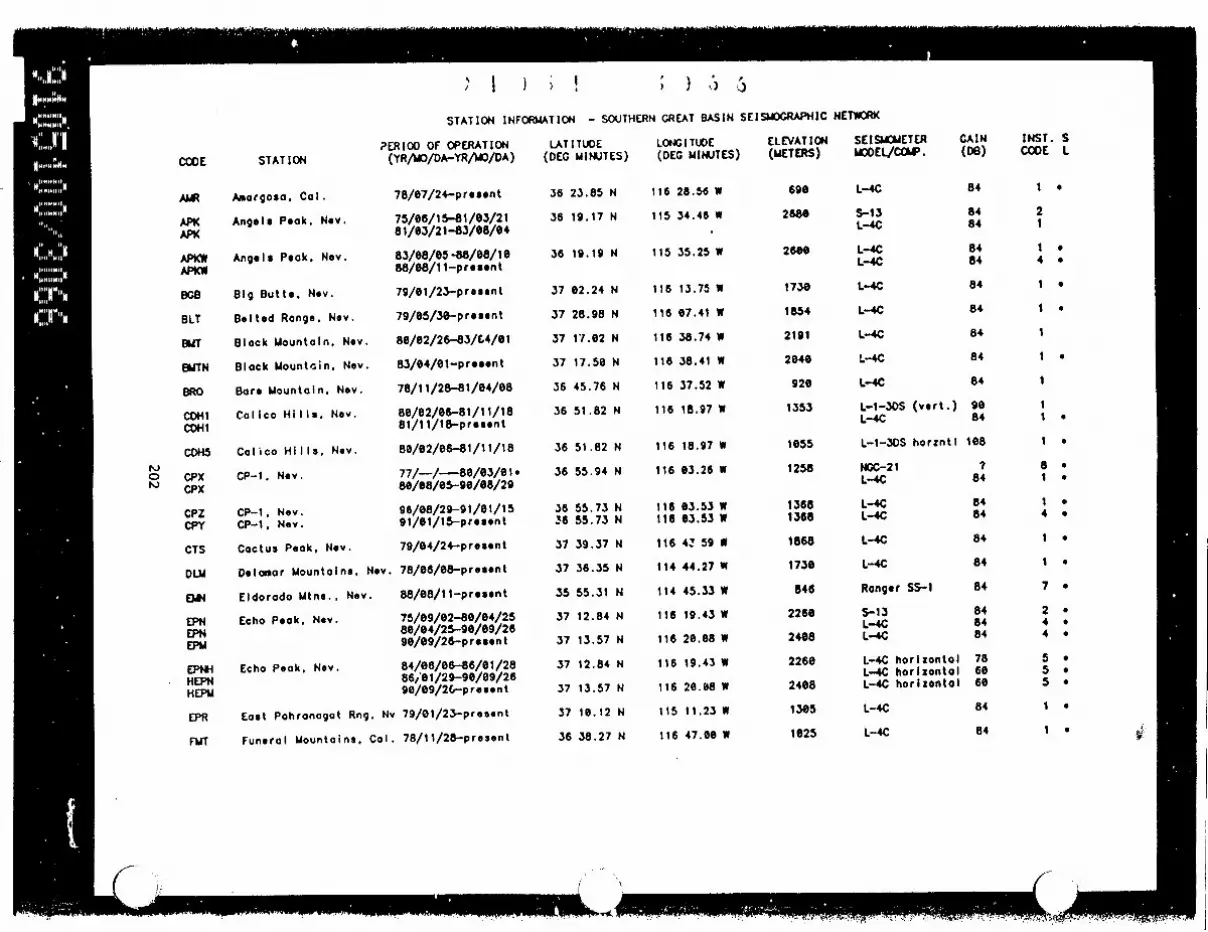
,- I I :, .s') -
STATION INFORUATION - SOUTHERN GREAT BASIN SEISMOGRAPHIC NETVCRK
PERIOO OF OPERATION(YR/MO/DA-YR/MO/DA)
LATITUDE(DEC UINUTES)
LONGITUDE(DEG MINUTES)
ELEVATION SEISMOUETER(VETERS) VCOEL/CO4P.
CAIN INST. S(DB) CODE L
CODE STATION
AUR
APKAPK
APKW
BLT
BUT
BMTN
BRO
CDH1
CDHS
rD CPX
CPZCPY
CTS
DLU
ELN
EPNEPNEPU
EPNHHEPNHEPU
EPR
Amorgosa. Col.
Angels Peak, Nov.
Angels Peak. Nev.
Big Butte. Nov.
Belted Range. Nov.
Block MountaIn, Nov.
Black Uountoin. Nov.
Bare Mountain. Nov.
Calico Hills. Nov.
Calico Hills, Nov.
CP-1. Nov.
CP-1. Nov.CP-1, Nov.
Cactus Peak. Nov.
Dolmaor Uountains, Nov.
Eldorado Utns., Nov.
Echo Peak. Nov.
Echo Peak, Nov.
East Pahronagat Rng. N
78/07/24-present
75/06/15-81/03/2181/03/21-83/68/04
83/08/05-88/68/1688/08/11-present
79/01/23-present
79/05/30-prseont
80/62/26-3/C4/6 1
85/04/01-pres-nt
78/11/28-81/04/08
86/62/06-81/11/1881/11/18-present
80/02/06-81/11/18
77/-/-80/03/01.80/08/O5-90/08/29
06/08/29-91/01/1591/01/15-procent
79/04/24-present
78/06/08-present
88/68/11-prosent
75/09/02-80/04/25se/04/25-90/69/2690/09/26-present
84/06/06-86/81/28868S 1/29-90/09/2690/09/2C.-prosont
v 79/01/23-present
36 23.85 N 116 28.56 W
36 19.17 N 115 34.46 W
36 19.19 N 115 35.25 W
37
37
37
37
36
36
02.24 N
28.98 N
17.02 N
17.50 N
45.76 N
51.82 N
36 51.82 N
36 55.94 N
116 13.75 W
116 07.41 W
116 38.74 W
116 38.41 W
116 37.52 W
116 18.97 W
116 18.97 W
116 U3.26 W
116 03.53 t116 03.53 W
116 4' 59 U
114 44.27 W
114 45.33 W
116 19.43 W
116 2e.e8 w
116 19.43 W
116 20.08 W
115 11.23 W
690
2680
2600
1730
1854
2191
2040
920
1353
10S5
1258
13681368
1868
1 738
846
2260
2468
2260
2408
1305
1625
L-4C
S-1IL-4C
L-4CL-4C
L-4C
L-4C
L-4C
L-4C
L-4C
L-1-3DS (vert.)L-4C
L-1-3OS horzntl
NGC-21L-4C
L-4CL-4C
L-4C
L-4C
Rangcr SS-1
S-13L-4CL-4C
L-4C horizontalL-4C horizontalL-4C horizontal
L-44C
L-4C
84
8484
8484
84
84
84
84
84
2
4
0
3656
37
37
37
37
37
37
37
55.773 N5S5.73 N
39.37 N
36.35 N
55.51 N
12.84 N
13.57 N
12.84 N
13.57 N
10.12 N
i
.
De I84 1
08 1
'1 884 1
84 184 4
84 1
84 1
84 7
84 284 484 4
78 560 560 5
84 1
84 1
0
0
0
0
S
S
0
0
0
0
0
0
0
S
FVT Funeral Mountains, Cal. 78/11/28-present 36 38.27 N 116 47.00 W
K
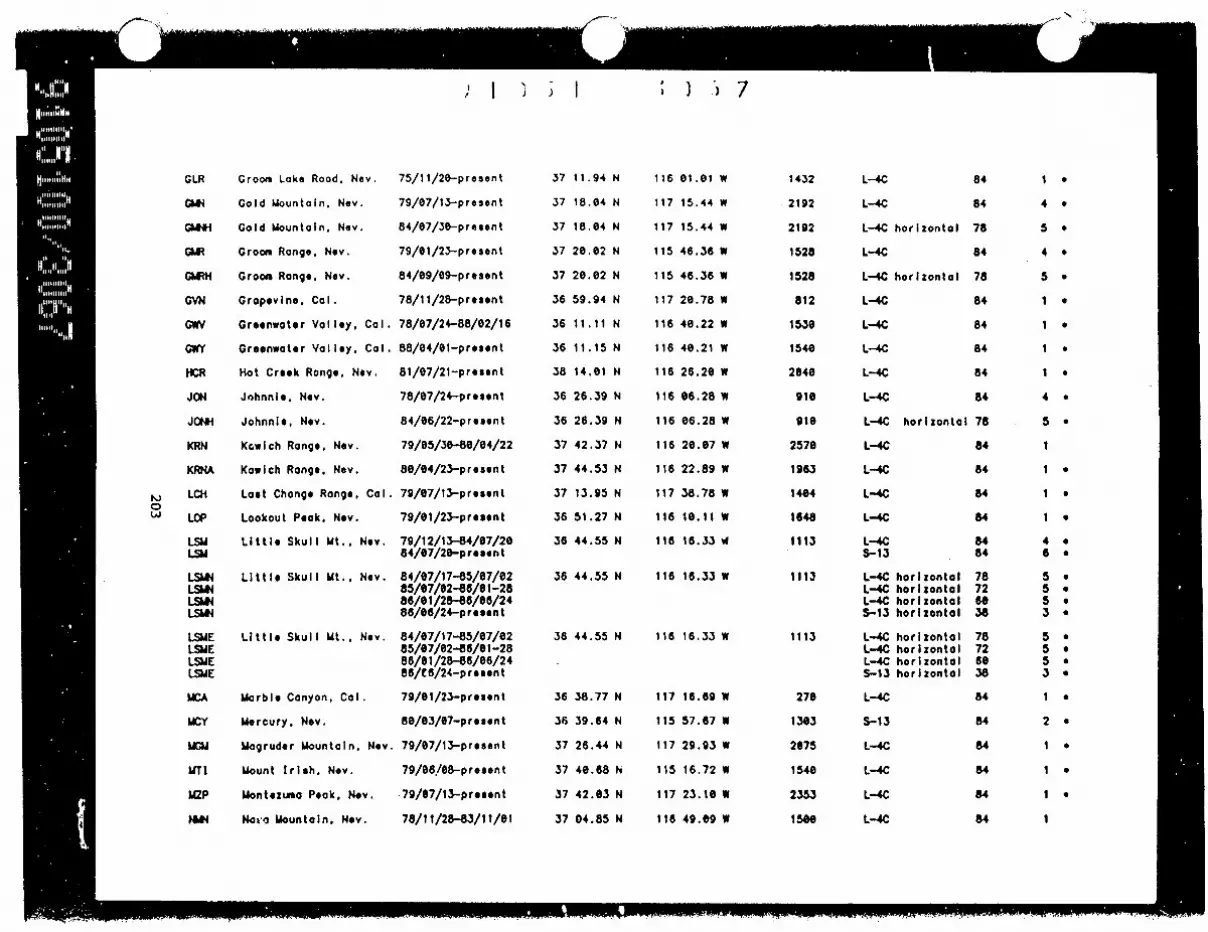
11K
id' I ) ) I ; ) ., 7
GLR
GVNH
NCR
JGNH
GRN
HCRN
JON
0w LOP
LSM4LSMA
LSMNELSJNLSMNLSJN
LSEA
LSEY
SMEP
Groom Lake Rood, No
Gold Mountain, Nov.
Gold Mountain, Nov.
Groom Range. Nov.
Groom Range, Nov.
Grapevine, Col.
Greenwater Volley,
Greenwater Volley.
Hot Croek Range, No
Johnnie, Nov.
Johnnie, Nov.
Kcwlch Range. Nov.
Kawich Range, Nov.
Lost Change Range.
Lookout Peak. Nov.
Little Skull Mt., N
Little Skull Mt., N
Little Skull Mt.. N
Marble Canyon. Col.
Mercury, Nov.
Magruder Mountain.
Mount Irish. Nov.
Montezuma Peak. Nsv
Nava Mountain. Nov.
v. 75/11/20-present
79/e7/13.-present
84/07/38-present
79/01/23-prssont
84/09/09-present
78/11/28-present
cal. 78/07/24-88/82/16
Col. 88/04/01-present
v. 81/07/21-present
78/07/24-present
84/06/22-present
79/05/30-88/e4/22
80/04/23-present
Col. 79/87/13-present
79/01/23-ppr eent
sv. 79/12/13-84/07/2084/07/20-present
ev 84/07/17-85/07/0285/67/02-86/01-2886/01/2"-86/06/2486/06/24-present
8v. 84/07/17-85/07/8285/07/02-86/01-2886/e1/28-86/86/2466/C6/24-present
79/01/23-present
80/03/07-prosent
Nev. 79/07/13-present
79/06/08-prosent
.79/07/13-present
78/11/28-83/11/01
37 11.94 N
37 18.04 N
37 18.04 N
37 2e0e2 N
37 20.02 N
36 59.94 N
36 11.11 N
36 11 .15 N
38 14.01 N
36 26.39 N
36 26.39 N
37 42.37 N
37 44.53 N
37 13.95 N
36 51.27 N
36 44.55 N
116
117
117
115
115
117
116
116
116
116
116
116
116
117
116
116
01.01 w
15.44 W
15.44 W
46.36 W
46.36 W
20.78 W
40.22 W
40.21 W
26.20 w
06.28 W
06.28 W
20.07 W
22.89 W
38.78 w
10.11 w
16.33 w
1432
2192
2192
1528
1528
812
1530
1540
2040
910
91e
2570
1963
1464
1648
1113
1113
1113
270
1303
2675
1544
2353
1500
L-4C
L-4C
L-4C horizontal
L-4C
L-4C horizontal
L-4C
L-4C
L-4C
L-4C
L-4C
L-4C horizontal
L-4C
L-4C
L-4C
L-4C
L-4CS-13
L-4C horizontalL-4C horizontalL-4C horizontal5-13 horizontal
L-4C horizontalL-4C horizontalL-4C horizontalS-13 horizontal
L-4C
S-13
L-4C
L-4C
L-4C
L-4C
84
84
78
84
78
84
84
84
84
84
78
84
84
84
84
8484
78726038
78726038
84
84
84
84
84
84
.
0
0
36 44.55 N 116 16.33 w
36 44.55 N 116 16.33 w
0
0
C
0
S
0
C
C
C
C
0
C
S
C
36
36
37
37
37
37
38.77 N
39.64 N
26.44 N
40.68 h
42.03 N
04.85 N
117 16.69 W
115 57.67 W
117 29.93 W
115 16.72 W
117 23.10 W
116 49.09 W
- I -1 --- � -"rMrMw--. . - 11, - - . --- .. 1. �. U'

.) I oI ) ; I I : $
NOPHOP
NPN
PAN
PANH
PCE
PGEH
PPK
PRN
OSM
SOH
Soy
P.a~SHRG
SPRO
SRG
SSPSP
SWP
TCN
ThSR
TPU
WCTWCT
Nopoh Range. Cal. 78/07/2+-u/04/2580/04/25-present
North Pohroc Rg. Ney. 79/e6/08-present
Panamint Range. Cal. 88/04/01-present
Panamint Range. Cal. 88/04/01-present
Panamint Range. Cal. 78/11/28-.8/02/13
Panamint Range. Cal. 84/16/11-88/02/13
Piper Mountain, Cal. 79/07/13-present
Pahroc Range. Nev. 72/01/21-80/6i/1980/06/19-present
Pahroc Range. Nov. 84/08/28-present
Queen City Susnit. Nev. 79/06/08-present
Oueen of Sheba Mine, Co 78/11/28-present
Striped Hills, Nov. 78/07/24-present
South Grapevine Uts, Ca 78/11/28-81/06/1581/06/15-82/06/1682/06/15-proeent
Sheep Range. Nev. 79/e5/22-present
Spotted Range. Nov. 79/05/28-presnt
Seaman Range. Nov. 79/e6/08-present
Shoshone Peak. Nov. 73/t0/13-80/05/2580/05/27-present
Silver Peak Range. Nov. 79/07/13-present
Thirsty Canyon. Nev. 84/11/02-present
Timber Mt.. Nov. 82/02/19-87/05/0587/05/05-nresent
Tin Mountain, Cal. 78/11/28-present
Tempiute Mountain. Nov. 79/e6/e8-present
Wildcat Mountain. Nov. 81/04/08-88/01/0588/01/05-88/03/1188/03/11-present
Worthington Uts.. Nov. 79/06/08-presept
36 07.63 N 116 09.26 w
37 39.12 N
36 23.59 N
36 23.59 N
36 20.93 N
36 20.93 N
37 25.51 N
37 24.40 N
114 56.21 W
117 6e.05 W
117 06.05 W
117 03.95 W
117 03.95 W
1!7 54.42 W
115 03.05 W
37
37
35
36
36
24.40
45.39
57.35
38.72
M8.92
N
N
N
N
N
115
115
116
116
117
03.05
56.58
52.05
20.38
02.11
W
W
W
W
W
911 L-4CS-13
1684 L-4C
1696 L-4C
1690 L-4-C horizontal
IB5M L-4C
1850 L-4C horizontal
1851 L-4C
1402 NCC-21S-13
1402 L-4C horizontal
1914 L-4C
450 L-4C
1050 L-4C
1550 L-4CS-13L-4C
15I9 L-41C
1191 L-4C
164e L-4C
2021 NGC-21L-4C
2595 L-4C
1469 L-4C
1754 L-4CS-13
2113 L-4C
1910 L-4C
930 L-4CL-4CL-4C
1725 L-4C
84
64
.84
84
76
84
78
84
84
78
84
84
84
848484
84
84
84
84
84
84
8484
64
84
846684
84
.
0
S
S
S
S
S
S
S
S
e
S
S
e
36 30.33 N
36 41.64 N
37 52.93 N
36 55.53 N
115 09.61 W
I 1 48.t W3I
113 04.15 W
116 13.26 W
37 42.89
37 e8.80
37 02.11
N
N
N
117
116
116
48.20
43.52
23.21
24.30
39.06
37.62
W
W
w
36
37
36
48.29
36127
47.79
N
N
N
117
115
116
W
W
W
S
S
S
C
0
e
S
C
e
C37 58.89 N 115 35.58 W
( - (,ii1111 I x -I-

.) I I ; ) :, 9
YUT I
YMT2
YUT3
Y1JT4YUAT4
Y)J4NYU4SNYM4
YU4EYM4W
YMT5
YMT5
YUT6
YUT6
Yucca Mountain.
Yucca Mountain,
Yucca Mountain.
Yucca Mountain.
Nev.
Nov.
Nov.
Nov.
Yucca Mountain, Nov.
Yucca Mountain, Nev.
Yucca Mountain, Nov.
Yucca Mountain, Nov.
81/03/05-present
81/03/05-pr6sent
81/03/05-prosent
81/04/el-81/10/1381/10/13-83/07/0183/07/02-present
84/06/29-85/e5/2385/85/24-86/0l/2886/01/28-pronent
84/06/29-85/eS/2385/05/24-86/01/2886/01/28-present
81/e4/01-81/10/1381/10/13-83/07/02(?)83/07/02-present
81/04/01-81/10/13e/10e/13-83/e7/02(?)83/07/02-prosent
36 51.22
36 47. 14
36 47.21
3f 50.99
N
N
N
N
116
116
116
116
36 50.99 N 116 27.18 W
36 50.99 N 116 27.18 W
36 53.91 N 116 27.25 W
31.86 W
29.22 W
24.75 W
27.18 W
1006
1248
1248
1248
1555
se90
5-13
S-13
S-13
3-153-133-13
L-4CL-4CL--4CI
L-4CL-4CL-4C
S-13
S-13
S-13S-135-133-13
horizontalhorizontalhorizontal
horizontalhorizontalhorizontal
84
84
54
847284
787260
787260
847284
786684
3
3
3
333
55S
5S5
333
333
00
C
0
C
C
36 51.36 N 116 24.02 W
0Ln
NOTES: All Instruments are vertical-component unless otherwise noted. If onehorizontol-component Instrument exists at a site. it has north-southpolarity; if two horizontals exist at a site, they hove north-south anaeast-West polarities, resp. The polarity Is suggested by the station name.A * in the final column Indicates soteilite-dotermined station coordinates.Elevations of stations with s in the final column were obtained usingaltimeters calibrated against nearest USGS benchmark. Locations arepreliminary.

Appendix F
Input parameters to HYPO71
HYPO71.FOR, version 1.001, was baselined for use by the Yucca Mountain Project, with CIDYMP-USGS/GDDO001.02, on October 22, 1990. This version of HYPO71 requires a minimumof three input files, (1), a header file, containing crustal velocity information, weighting schemeinformation, iteration-controlling parameters, and 1/0-controlling parameters, (2), a station file,containing most of the information shown in Appendix E, above, and (3), a phase file, containingP and S phase arrival times and information for determining earthquake magnitude. The data ofitem (1) are presented in Appendix E, and will not be repeated here. The data of item (3) are toobulky for inclusion in this report, but are available on request.
One of two header files is used, depending on the source zone. For most earthquakes occurringin the SGB, the file nvhead.dat, having the velocity model shown in Figure F1 (a) is input. Forearthquakes occurring in the immediate vicinity of Yucca Mountain, the file nvhead.ymt, havingthe velocity model shown in Figure F1 (b), is input. Copies of these two files are shown on thenext page. For meanings of the 'Control Card' parameters, Mhe reader should consult Lee and
N. Lahr (1975).
206

The below lines ore a listing of nvhsad.dat. used as on input file to HYPO71.
HEADRESET TEST 1 - 2.s550RESET TEST 2 - 2e.OeooRESET TEST 3 - 0.5800RESET TEST 4 _ 0.05o0RESET TEST 5 - 5.0000RESET TEST 6 _ t.OOOORESET TEST 7 - -1.27600RESET TEST 8 - 1 6660eRESET TEST 9 - 0.00227RESET TEST 10 - 1oo.ooo0RESET TEST 11 - 12.000RESET TEST 12 - 0.soeoRESET TEST 13 - 1.80o0RESET TEST 14 - -2.050eRESET TEST 15 - e.oeooRESET EST S5 - e.s52RESET TEST ;75- -1.768
.38800088E+01 .ee8009eeE+0G
.598080:s E+61 . 1000009E+0e
. 61588088E+01 .38000980E+01
. 65eeee0eE+01 . 15880000E+02
. 6980 888E+01 . 24e00000E+02
.78000000E+01 .3200880WE+02
.800000E+0O .0e0eee00E+0e7. 10. 228. 1.71 3 8
Imox f of iterotions/solutlon
0 a 7 0 1 1111 0 0.88 e e.0e
The below lInes ore a listing of nvhead.ymt. used as on input file to HYP071.
HEADRESET TEST 1)- 8.1000RESET TEST( 2)- 38.08e8RESET TEST 3)- 0.50s0RESET TEST( 4)- 0.0500RESET TEST S }- S.OOOORESET TEST( C)- 1e0008RESET TEST 7 - -1.27600RESET TEST, 8 - 1.86680RESET TEST' 9- 0.00227RESET TEST 18 e180.000RESET TEST 11 - s.o8ooRESET TEST 12 - 8.5090RESET TEST 13 - 1.8006RESET TEST 14- -1.2080RESET TEST 15)- 0.O0oORESET TEST 16 - a.'52RESET TEST 17 - -1.766
.3280080E+81 .eee0000eE+0046eee0e0E+01 .05000000E+01
.57000000E+81 .250,A80oE+0
.620.0008E+C1 .4e0000E+01
.650088e E4e1 .15800080E+02
.7s800ee8E+0l . 320ee0eE+02
.000oee00E+e0 .8eee00008E+007. 5. 90. 1.71 3 8 a a 7 a 1 1l1l 0 8.80 e 8.8e
In this filee a slightly different weighting scheme with respect todistance is invoked than In nvheod.dat. above. In the former file, weightstoper from 1. to 0. in a linear manner for *picentrol distonces between10 and 220 km. In the latter file. weigits toper from 1. to 0. for distancesbetween 5 and 90 km.
207
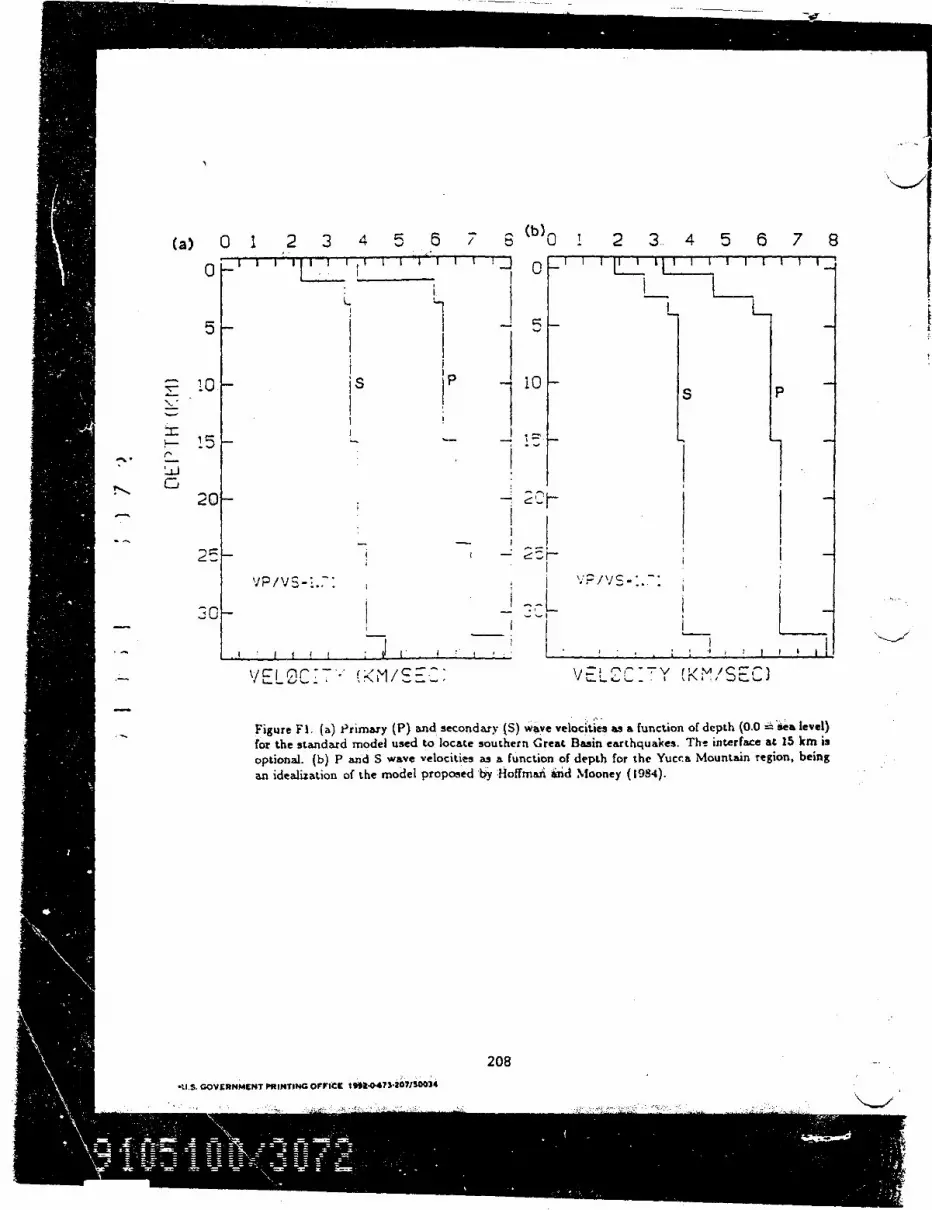
II..
i
I-
N,.
(a) 0 1 2 3 4 5 6 7 6 "UO
55
10 - iS P 10-
-I 5
20 -
25 -
C__I__
II I I
VElCCI (K--sM/Sc--
. _0 .
! 2 3 4 5 6 7I . .. . . . . . . . .
I I lL LI I I I I I s
L L
L L
I I I
8
P
II � -
ii
L--i ; I I I I IiI -
I . , II
\/ ! - 7 VY rK-V /SzC)
Figure Fl. (a) Primary (P) and secondary (5) wave velocities as a function of depth (0.0 =6 sea level)for the standard model used to locate southern Great Basin earthquakes. Th- interface at 15 km is
optional. (b) P and S wave velocities as a function of depth for the Yucra Mountain region, being
an idealization of the model proposed by Hoffmari &nd Mooney (1984).
208
*U.S. GOVERNMENT PRINTING OVrICE 1014473-.27JISO)4


