Embed Size (px)
Citation preview

Preliminary Seismic Assessment Method for
Identifying R.C. Structural Failures
Stylianos J. Pardalopoulos1, Georgia E. Thermou
2,
Stavroula J. Pantazopoulou1,3
1 Demokritus University of Thrace, Dept. of Civil Engineering 67100, Xanthi, Greece
2 Aristotle University of Thessaloniki, Dept. of Civil Engineering, 54124, Thessaloniki,
Greece
3 University of Cyprus, Dept. of Civil & Envtl. Engineering, Nicosia, Cyprus
Abstract In this chapter, an efficient method for rapid preliminary assessment of
the seismic vulnerability of reinforced concrete buildings is presented. The
method determines the columns’ limiting shear resistance at the critical storey of
the structure, by applying a strength assessment procedure associated with typical
column details representative of the state of practice from the era of the building’s
period of construction and evaluates the severity of seismic displacement demand
and the maximum seismic acceleration that the building can sustain by applying a
stiffness index assessment. For application of the method, only knowledge of the
basic geometric and material properties of the building is required. The proposed
method is applied for verification reasons to two reinforced concrete buildings that
failed during the 1999 Athens earthquake. It is shown that the proposed method
can be used as a diagnostic tool for identification of both the building’s fragility
and the prevailing failure mechanism, allowing the engineers to immediately iden-
tify the most vulnerable buildings that are likely to collapse in a potentially strong
earthquake, as well as to set objectives for their rehabilitation.

2
Introduction
Recent earthquakes have repeatedly illustrated the deficiencies of brittle rein-
forced concrete buildings built according to earlier design codes. This class of
buildings, which today represents the majority of the built environment in the
greatest part of the world, is typified by a number of features such as small section
columns, relatively stiff beams, inadequately confined joints and insufficient an-
chorage of longitudinal and transverse reinforcement. Although the application of
detailed assessment procedures for seismic evaluation of every single existing
structure is of vital importance, the immense volume of required work makes it
seem an unrealistic scenario. This difficulty could be removed by applying a rapid
evaluation procedure, where information readily available for most buildings will
be used; in such a rapid assessment, critical features of the structure that render it
more vulnerable could be immediately identified, thereby simplifying the process
of singling out those structures that represent a major threat to human life in the
event of a strong earthquake.
The objective of this study is to present a methodology where the building’s
geometrical characteristics, material properties and reinforcement detailing of the
structural elements are considered sufficient information so as to single out the
most vulnerable buildings that are likely to collapse in a potential strong earth-
quake, but can also be used to determine the objectives for their rehabilitation. Ex-
isting reinforced concrete buildings, “non-conforming” according to modern stan-
dards, are assessed based on prioritizing of the various alternative modes of
failure. Mechanisms considered refer to column flexure, degraded shear, anchor-
age and lap-splice development, exceedence of joint shear capacity, connection
punching and reinforcement yield at the adjacent to columns beams; the rate of
degradation of these mechanisms with increasing displacement amplitude and
number of cycles is idealised through simplified mechanistic constructs which al-
lows the prioritizing of failure modes as degradation proceeds. Furthermore, the
seismic vulnerability of this category of buildings is assessed as a function of in-
terstorey drift demand imposed by the design earthquake [1]. For confirmation,
the methodology is applied in two reinforced concrete buildings that collapsed
during the 1999 Athens earthquake. Results indicated that in all cases buildings
failed in a brittle manner practically prior to development of any displacement
ductility (i.e. elastic – brittle damage), a conclusion compatible with the recon-
naissance reports.

3
Construction Practice of Reinforced Concrete Buildings in the
1960’s and 1970’s
The rapid population growth and the shift from the agricultural to the industrial
economy model throughout Southern Europe in the first 2/3rds of the 20th
century
led to massive urbanization of cities. Multistorey reinforced concrete constructions
were established as the basic building unit, as they provided capability of arrang-
ing the structural elements according to the architectural designs, short construc-
tion time, low construction cost and endurance in earthquake excitations.
In this period, construction details were not strictly addressed by the design
codes, since their role in seismic response was yet to be fully understood and as
such they were seldom specified in design drawings of that era. Implementation in
practice was, to a large extent, determined by the experience of the labourers and
the foreman responsible for the site. Credentials were never questioned and super-
vision was relatively lenient. Reconnaissance studies from collapsed buildings in
major earthquake events over the past 30 years suggest that specific trade practices
were used throughout Southern Europe (tie patterns and spacing, layout of rein-
forcement), regardless of details – if any – that may have been specified in official
drawings. Typical details based on the standards of the period (summarised in fib
Bulletin 24 [2]) comprised smooth rectangular stirrups anchored with 90° hooks in
the ends, made of StI (fyk = 220 MPa) 6 mm - 8 mm diameter bars spaced at 250
mm - 300 mm o.c. (on centers) along the member lengths. Longitudinal rein-
forcement of StIII (fyk = 420 MPa) at relatively low area ratios and concrete qual-
ity of Bn150 to Bn200 (defined as per DIN 1045, [3]) corresponding to modern
concrete characteristic strengths of 12 to 16 MPa were utilised. Lap splices were
unconfined whereas starter bars had arbitrary lengths. Regarding typical column
section sizes those ranged between 250 and 500 mm. Beam sizes were 250 mm by
600 to 700 mm, common slab thicknesses ranged from 120 to 160 mm, reinforced
with 10 mm diameter bars usually spaced at 200 mm o.c. Other features com-
monly reported refer to short or captive columns owing to the mixed use of the
first floor of the buildings and unconfined beam-column joints particularly in con-
nections over the perimeter of an R.C. frame building. Single column footings
were mostly used and, in well-attended structures, they were joined at the column
base with lightly reinforced, small section connecting beams.
Despite these systematic inadequacies, the percentage of buildings that have
collapsed in major earthquakes in the Mediterranean basin is relatively low when
compared to the total number of available buildings that belong to this substandard
construction category; this is not the case in other parts of the world such as in
Haiti [4]. One issue that can be concluded, however, from post-earthquake recon-
naissance evidence and forensic evaluations of collapsed buildings which led to
loss of human life, is that collapse usually occurs due to premature failure if the
gravity load bearing elements of the structures, prior to attainment of the nominal
yielding displacement. This is contrary to the focus of most modern assessment

4
methodologies that are based on comparisons between ductility demand and sup-
ply. Note that the usual point of reference in these procedures is columns where
transverse reinforcement is not adequate to support shear strength under displace-
ment reversals beyond flexural yielding of the individual members of a structure.
For this reason, values of rotation capacity in what is termed “non-conforming”
members are usually deemed in the range of 1% to 1.5%. This focus could be jus-
tifiable for structures with columns where the member size (in the range of 500
mm or higher) is twice that of typical stirrup spacing used in the 1960’s, so that a
nominal 45° shear plane in a column would intersect at least two stirrups. But in
case of structures with smaller column sizes, in the range of 350 mm, as is often
encountered in older residential buildings, the practical spacing of stirrups from
the1960’s (250 mm) could mean that a nominal potential sliding plane could be
formed, intersecting no stirrup at all and therefore being unable to mobilise any
form of shear resistance.
Method for Rapid Seismic Assessment of Reinforced Concrete
Buildings
In light of the limited knowledge of actual construction details in older structures,
preliminary assessment targeted toward identification of the most vulnerable
buildings must necessarily rely on a marginal collection of data that is readily
available, such as the overall geometric details of the structure (number of floors,
floor height, floor area, location and gross geometry of load carrying members in
plan), on the implicit assumption that all reinforcing details are represented by the
historical construction information for the period and region of construction of the
building studied. With these data, building seismic vulnerability is based on the
following two criteria:
(a) A strength assessment criterion, which is used to determine the weakest
mechanism of resistance, likely to control the sequence of failure of the vertical
elements of the structure, as well as their limiting resistance.
(b) A stiffness index assessment criterion, which is used to quantify the intersto-
rey drift demand of the critical storey of the building and the maximum ground
acceleration that the building can sustain.
Strength Assessment: Collapse occurs when the vertical elements of the criti-
cal floor lose their load carrying capacity. This process may be initiated either by
loss of lateral load resistance of the columns, or by punching and loss of support
of the floor diaphragms. Assuming the point of inflection (zero moment) at
midspan of the column length, enables the establishment of a static relationship
between the critical strengths of various mechanisms that could be responsible for
column failure along the line of a single column and the column shear sustained
when any of these phenomena is occurring: Vcol=(Mtop+Mbottom)/hcol where hcol is
the deformable length of the column (i.e. the clear storey height, or free column

5
length in captive columns, Fig. 1(a)). This enables using column shear as a com-
mon basis for comparison of strengths in order to establish a hierarchy of possible
events that threaten the integrity of a structure under lateral sway.
Fig. 1. Moment distribution and (b) – (f) possible failure modes of a reinforced concrete col-
umns: (b) Flexural yielding, (c) Shear failure, (d) Bar anchorage/lap-splice failure, (e) Joint shear
failure, (f) Connection punching failure, (g) Column shear limited by plastic hinging in the
beams ⇒ ductile frame behaviour.
The flexural shear demand associated with flexural yielding in the column ends
under lateral sway, is a point of reference in the hierarchy of failure (Fig. 1(b)), as
flexural yielding is the only failure mode associated with ductile member behav-
iour. Assuming the maximum developed stress of the column longitudinal rein-
forcement equals to the steel yielding stress, fy, the flexural shear demand can be
calculated according to Eq. 1, taking into consideration the column’s internal force
equilibrium.
( )col
c
c
ytotcolyflex
h
fdb
d
hv
f
fhMV
⋅⋅⋅
⋅−⋅+⋅−⋅⋅=⋅=
2
, 8.04.012 ξξρl (1)
where, My is the flexural moment at yielding; ρℓ,tot is the total longitudinal rein-
forcement ratio of the column; fy is the longitudinal reinforcement yield stress; fc is
the concrete compressive strength; ξ is the normalised depth of compression zone
given in Fig. 2(b) as a function of ρℓ,tot and the (service) axial load ratio, ν, acting
on the cross section (Ng+0.3q/(b⋅d⋅fc)); h is the column height; d is the column effec-
tive depth; b is the column width and hcol is the deformable length of column
(equal to free storey height or to the column length in the case of captive col-
umns).
Lightly reinforced columns, where transverse reinforcement is not adequate to
support shear strength under displacement reversals beyond flexural yielding, is a
common occurrence in older structures. A first estimate of the shear strength can
be obtained from the typical reinforcing details used in construction in the 1960-
70’s, by considering the simple statics of a column with symmetric end conditions
(a)
hcol
dbeam
(g) (e) (c) (f) (b) (d)

6
under lateral sway. Shear strength is supported by the stirrups that are intersected
by the critical plane of diagonal tension failure. To this end, it is assumed that
shear failure occurs by formation of a sliding plane inclined at an angle θv with re-
spect to the longitudinal axis of the typical column (Fig. 1(c)). θv determines the
number of stirrup legs actively participating to shear strength; based on calibration
with test and analytical results it is taken equal to 30°. The concrete contribution
to shear strength is accounted for by the horizontal component of a diagonal strut
that carries the column axial load through the web to the support. The angle of in-
clination of the diagonal strut, α, is determined from the line connecting the cen-
ters of the compression zones in the opposite ends of the column (over its height),
i.e. tanα = (h-0.8⋅ξ⋅d)/hcol = (h/d-0.8⋅ξ)⋅d/hcol (Fig. 2(a)), where ξ is the normalised
depth of compression zone at the onset of yielding (Fig. 2(b)) and h and d are the
height and the effective depth of the column’s cross section. Generally, it is re-
quired that α ≤ θv.
Fig. 2. (a) Lightly reinforced column model used for the methodology; (b) Relationship between
ξ, ρℓ,tot and normalised axial load, v, for columns at the onset of yielding.
The shear force that can develop to a column at the exhaustion of its shear strength
is:
vsttrcvs
ddfAfdbvV θ
ξα cottan ⋅
⋅−⋅⋅+⋅⋅⋅⋅= (2)
where, Atr is the area of stirrup legs in a single stirrup pattern in direction normal
to the splitting plane; s is the stirrup spacing and fst is the stirrup yield stress.
(b)
ρℓ,tot
1.0%
1.5%
2.0%
2.5%
3.0%
3.5%
4.0%
0.20 0.25 0.30 0.35 0.40
ν=0.4 ν=0.3
ν=0.2 ν=0.1
ν=0
Normalised compression zone depth, ξ
(a)
Shear Tension
Shear
tana hst
ξ⋅d
d
Compression Tension
Compression

7
Another possible mechanism of failure that can develop in reinforced concrete
columns is anchorage failure of longitudinal reinforcement (Fig. 1(d)). Anchorage
of a reinforcement bar in tension is achieved through friction, developed between
the surface of the bar and the surrounding concrete. In cases of bars with ends
formed as hooks, an additional constant force is added to the total anchorage ca-
pacity of the bar [5]. When the maximum anchorage force that can be developed
by the bar is lower than the tension force corresponding to the bar yield, fy⋅Ab
(where Ab is the cross section area of the bar), anchorage failure is anticipated and
the maximum tension force developed by the bar is limited to its maximum an-
chorage capacity. In this state, the column’s anchorage shear demand can be cal-
culated according to:
( )col
cc
ybhook
b
ba
tot,a
h
fdb
ξ.d
hvξ.
f
f;fαD
fLmin
ρV
⋅⋅⋅
⋅−⋅+⋅−⋅
⋅
⋅⋅+⋅⋅
⋅=
2
80401
504
l (3)
where, ρℓ,tot is the total longitudinal reinforcement ratio of the column; Lα is the
anchorage length; fb is the concrete bond stress, calculated according to Model
Code 2010 [5] (fb = 2⋅fb,o, where fb,o = n1 ⋅ n4 ⋅ (fc / 20)0.5
, n1 = {1.80 for ribbed
bars; 0.90 for smooth bars}, n4 = {1.2 for fy = 400 MPa; 1.0 for fy = 500 MPa}.
Note that the anchorage capacity of a smooth bar hook is considered equal to with
that of a ribbed bar, = 50 ⋅ fb ⋅ Ab); Db is the diameter of longitudinal reinforcing
bars; αhook is a binary index (1 or 0) to account for hooked anchorages (αhook = 0 ⇒
no hooks); fy is the longitudinal reinforcement yield stress; fc is the concrete com-
pressive strength; ξ is the normalised depth of compression zone (Fig. 2(b)); v is
the (service) axial load acting on the cross section; h is the column height; d is the
column effective depth; b is the column width; hcol is the column’s deformable
length.
Lap failure of longitudinal reinforcement bars (Fig. 1(d)) occurs when the ten-
sion force developed to the one of the two paired bars cannot be fully transferred
to the other one, due to insufficient concrete bond stress. Note that laps usually
occur at the lower end of the column, where starter bars from the floor below are
paired with their extensions. Concrete bond stress is increased by the transversal
pressure provided by the column stirrups along the lap length, whereas hook de-
velopment at the ends of the lapped bars also increase the tension force that can be
transferred from one bar to another. The column’s shear demand at the onset of its
longitudinal reinforcement bars lap capacity can be calculated as:
8
( )
( ) ( )2
4050401
50
2
/h
ξ.dh.fdbvξ.d
fAN;
fANα
fDNbαfs
ALµ
min
Vcol
c
ybb
bbbhook
tbbbsttr
lapfr
lap
⋅−⋅⋅⋅⋅⋅+⋅−⋅⋅
⋅
⋅⋅
⋅⋅⋅⋅+
+
⋅⋅−⋅+⋅⋅⋅
= (4)
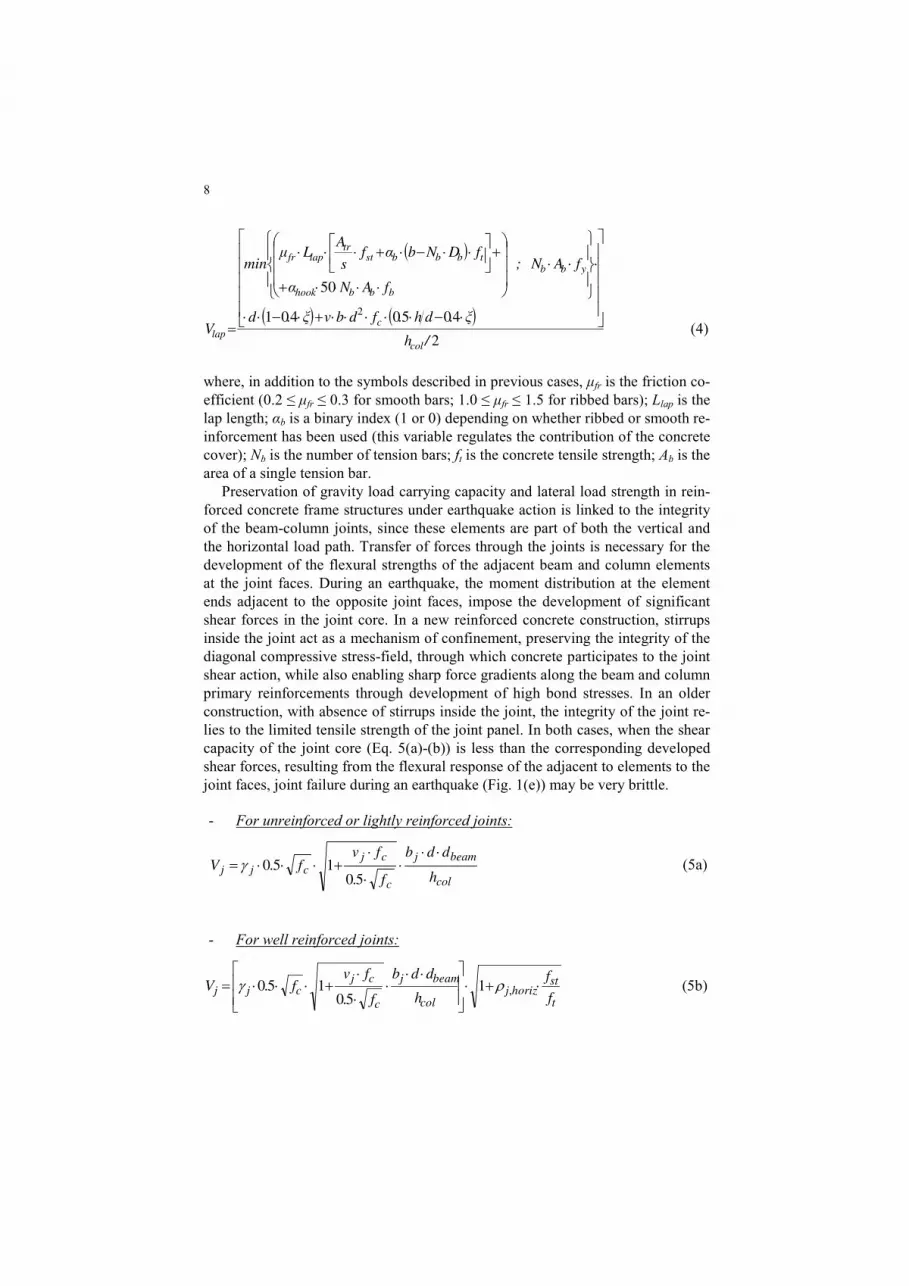
where, in addition to the symbols described in previous cases, µfr is the friction co-
efficient (0.2 ≤ µfr ≤ 0.3 for smooth bars; 1.0 ≤ µfr ≤ 1.5 for ribbed bars); Llap is the
lap length; αb is a binary index (1 or 0) depending on whether ribbed or smooth re-
inforcement has been used (this variable regulates the contribution of the concrete
cover); Nb is the number of tension bars; ft is the concrete tensile strength; Ab is the
area of a single tension bar.
Preservation of gravity load carrying capacity and lateral load strength in rein-
forced concrete frame structures under earthquake action is linked to the integrity
of the beam-column joints, since these elements are part of both the vertical and
the horizontal load path. Transfer of forces through the joints is necessary for the
development of the flexural strengths of the adjacent beam and column elements
at the joint faces. During an earthquake, the moment distribution at the element
ends adjacent to the opposite joint faces, impose the development of significant
shear forces in the joint core. In a new reinforced concrete construction, stirrups
inside the joint act as a mechanism of confinement, preserving the integrity of the
diagonal compressive stress-field, through which concrete participates to the joint
shear action, while also enabling sharp force gradients along the beam and column
primary reinforcements through development of high bond stresses. In an older
construction, with absence of stirrups inside the joint, the integrity of the joint re-
lies to the limited tensile strength of the joint panel. In both cases, when the shear
capacity of the joint core (Eq. 5(a)-(b)) is less than the corresponding developed
shear forces, resulting from the flexural response of the adjacent to elements to the
joint faces, joint failure during an earthquake (Fig. 1(e)) may be very brittle.
- For unreinforced or lightly reinforced joints:
col
beamj
c
cjcjj
h
ddb
f
fvfV
⋅⋅⋅
⋅
⋅+⋅⋅⋅=
5.015.0γ (5a)
- For well reinforced joints:
t
sthorizj
col
beamj
c
cjcjj
f
f
h
ddb
f
fvfV ⋅+⋅
⋅⋅⋅
⋅
⋅+⋅⋅⋅= ,1
5.015.0 ργ (5b)

9
In Eqs. 5, γj equals to 1.40 for interior joints and 1.00 for all other cases; vj is the
(service) axial load acting on the bottom of the column adjusted at the top of the
joint; bj is the joint width; dbeam is the beam depth; ρj,horiz is the area ratio of joint
horizontal reinforcement (i.e. total area of stirrup legs in the joint parallel to the
plane of action, divided by bj ⋅ dbeam).
Punching shear of flat slabs in slab – column connections (Fig. 1(f)) is a failure
mode associated to the concentration of shear stresses over a relatively small area,
around the column. The associated column shear is estimated from equilibrium of
moment transfer, Vpn = Mpn / hcol, where Mpn is the strength for moment transfer of
the critical punching perimeter at the slab – column connection, as:
( ) ( )
col
slcritsl/
csl,
sl
pnh
dhu.dfρ;d
min.
V
⋅+⋅⋅⋅⋅⋅⋅⋅
+⋅
=
42501002200
112031
l
(6)
where, dsl is the slab depth, ρℓ,sl is the total slab reinforcement ratio at the critical
punching perimeter around the column, ucrit.
The limiting shear strength that controls the behaviour of the column, Vu,lim, is
the least value obtained from Eq. 1 – 6, also identifying the mode of column fail-
ure, thus,
Vu,lim = min{Vflex, Vv, Vα, Vlap, Vj, Vpn} (7)
The above scenarios, which correspond to brittle failure modes except for the
column flexural yield, may be suppressed if the shear force input to the column is
limited by yield of the longitudinal reinforcement if the adjacent beams (Fig.
1(g)). In this case, the limiting shear strength of the column is:
( )col
beamybeambeambeam
st
beambeamby
h
fdb
h
MMV
⋅⋅⋅⋅=
+=
−+ 285.0 ρ
(8)
where, ρbeam is the tension longitudinal reinforcement ratio of the beam (i.e. the to-
tal longitudinal reinforcement ratio of the beam section adjacent to the column if
an interior connection is considered, or in the case of exterior connections the
value of the top or bottom beam reinforcement ratio (whichever is largest, since
the numerator in original form of Eq. 8 is simplified to absolute maximum of
M+beam or M-
beam)); bbeam is the beam width; dbeam is the beam effective depth and
fybeam
is the yield stress of the beam longitudinal reinforcement.
Stiffness Index Assessment: From the earliest earthquake studies the area ratio
of the vertical load-bearing elements in a structure was used to characterise the
magnitude of lateral stiffness. The first generation of Seismic Codes (up to
1950’s) required that the floor area ratio of walls should be 2‰ times the number
10
of floors in the structure. The relationship between generalised stiffness, K* and
the floor area ratios of columns, ρc, walls, ρwc, and infill walls, ρwm, in a multisto-
rey structure was explored recently [1]. Next, the fundamental period of the struc-
ture, T (T≈2⋅π⋅√[0.8⋅W/(g⋅K*)]), was used, in order to derive expressions for the
displacement demand under the design earthquake, Sd, in terms of ρc, ρwc, and ρwm
(where the seismic hazard is given in relative displacement vs. period spectrum
coordinates). Here the Design Earthquake Spectrum of Type I, as prescribed by
EC8-I [6] has been used.
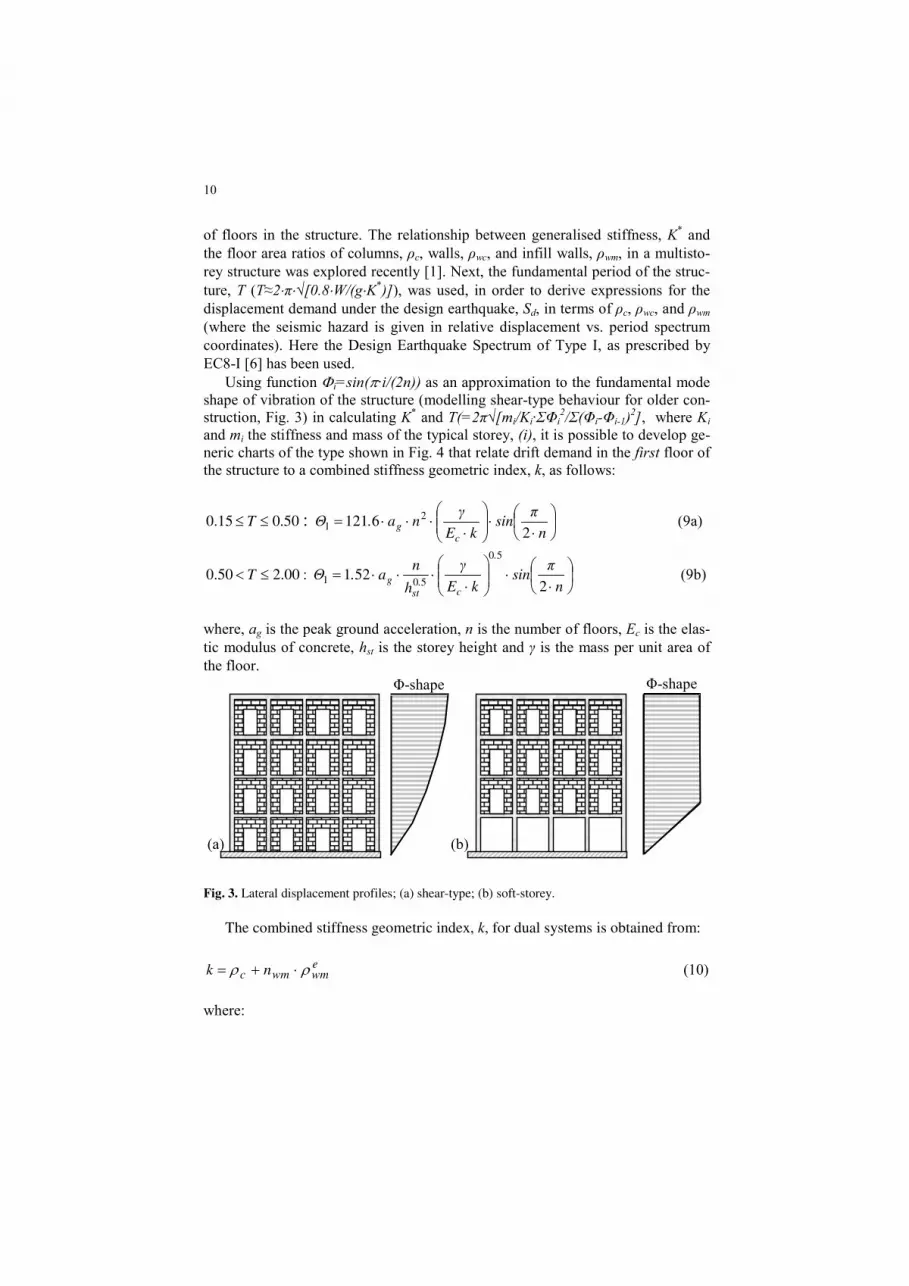
Using function Φi=sin(π·i/(2n)) as an approximation to the fundamental mode
shape of vibration of the structure (modelling shear-type behaviour for older con-
struction, Fig. 3) in calculating K* and T(=2π√[mi/Ki∙ΣΦi
2/Σ(Φi-Φi-1)2], where Ki
and mi the stiffness and mass of the typical storey, (i), it is possible to develop ge-
neric charts of the type shown in Fig. 4 that relate drift demand in the first floor of
the structure to a combined stiffness geometric index, k, as follows:
50.015.0 ≤≤ T :
⋅
⋅
⋅⋅⋅⋅=
n
πsin
kE
γna.Θ
c
g2
6121 21 (9a)
00.250.0 ≤< T :
⋅
⋅
⋅⋅⋅⋅=
n
πsin
kE
γ
h
na.Θ
.
c.
st
g2
521
50
501 (9b)
where, ag is the peak ground acceleration, n is the number of floors, Ec is the elas-
tic modulus of concrete, hst is the storey height and γ is the mass per unit area of
the floor.
Fig. 3. Lateral displacement profiles; (a) shear-type; (b) soft-storey.
The combined stiffness geometric index, k, for dual systems is obtained from:
ewmwmc nk ρρ ⋅+= (10)
where:
(a)
Φ-shape
(b)
Φ-shape

11
+⋅
⋅=
5.2
25
2,
2
avem
stc
wmwm
l
hE
En , iwc
wm
c
avew
st
avem
st
iwme
iwmE
E
l
h
l
h
,
2,
2
2,
2
,,
5,24
5.24
ρρρ ⋅⋅
+⋅
+⋅
+=
For frame-structures index k is substituted by k/, defined as:
wmwmck ρηρ // +=,
where
1
2,
2
'
110
Θ
+⋅
=c
avew
stwk
wmE
l
hf
η (11)
where Ec, Ewm are the elastic moduli of concrete and masonry, respectively, ρc is
the columns’ area ratio in the floor plan, ρewm, is an equivalent compound dimen-
sionless area index that represents both masonry walls and R.C. walls expressed in
terms of masonry wall properties, hst is the storey height, lm,ave, lw,ave are the aver-
age lengths of masonry and R.C. walls in the plane of seismic action, respectively,
fwk is the compressive strength of masonry and Θ1 is the estimated chord rotation
demand of the first storey.
In cases of inadequate shear resistance collapse of substandard buildings in a
critical earthquake could be prevented only if the interstorey drift demand, Θu, in
the critical floor (if the critical floor is the first floor, Θu=Θu,1), is less than the es-
timated drift at failure, Θfail. The fraction of the interstorey drift demand developed
through deformation in the columns, is: Θuc=λc⋅Θu, where λc is the relative column
stiffness ratio in the frame connections of the building [1]: λc=λ/(1+λ),
λ=ΣEIbhst/ΣEIcLb, where summation refers to the number of beams (1 or 2) and
columns (1 or 2) converging to the connection.
If failure occurs prior to flexural yielding of the columns, i.e., when the esti-
mated base shear force at the occurrence of the controlling mode of failure of the
column, Vu,lim is less than the base shear corresponding to the onset of yielding of
column reinforcement, Vy,flex, then the drift at failure is obtained from:
critycc
crityc
nomyuc
nomyflexy
ucfail
rV
V,,,lim,,
,
lim, Θ⋅≤Θ=Θ⋅=Θ⋅=Θ λ
ccrity
c
cfail
cfail ,
11Θ⋅=Θ⋅=Θ⇒
λλ (12)
In the above, Θy,crit is the estimated interstorey drift at longitudinal reinforce-
ment yielding of the critical floor – for typical frame structures (with floor heights
around 3 m) this is usually in the range of 0.5%. Θy,critc is the average interstorey

12
drift at longitudinal reinforcement yielding of the vertical members of the critical
storey. For typical older construction (stirrups spaced at distances over 200 mm),
it is shown through detailed calculation in the next section that the ratio ru,lim may
be as low as 0.3 ÷ 0.6, depending on the size of the columns for the typical details
used in the period of reference (due to the widespread practice of using uniformly
large stirrup spacing around 250 mm, values for the ratio are lower in the case of
smaller column section sizes owing to the lower number of stirrup layers engaged
by the sliding plane).
Fig. 4. Seismic vulnerability of old construction curves: relate the required composite floor area
ratio of vertical members to interstorey drift demand ratio for a unit value of peak ground accel-
eration, ag=1 m/s2 and a mass per unit area of the floor, γ=1 t/m
2 (For any other PGA or γ value
given in m/s2 and in t/m
2, the vertical axis should be multiplied by the product of these values
(without the units); e.g. if ag=0.36g=3.53 and γ=0.5, then the vertical axis value should be multi-
plied by the product 3.53·0.5=1.765).
The plot in Fig. 4 has been drawn for the EC8 [6] design spectrum (Type I) us-
ing a unit value of peak ground acceleration for a period range 0.15 ≤ T < 0.5 sec
(Eq. 9(a)); thus, demand (ordinate in the graph) should be multiplied by the speci-
fied peak ground acceleration of the site in consideration, ag. The plot has been de-
rived for concrete quality C20/25 (fc’=20 MPa) and mass per unit area of the floor,
γ=1.0 t/m2. (For a different mass value (e.g. 0.5 t/m
2), the ordinate values in the
graph should be multiplied by this value. A detailed example is provided in the
legend of Fig. 4). The range of the y-axis in the plot (i.e. 1st-floor drift demand)
0.1% ≤ Θ1 ≤0.5%, is defined for buildings susceptible to brittle failures: the upper
limit corresponds to nominal interstorey drift at yielding for frames, whereas the
baseline value of 0.1% is the estimated drift limit associated with inclined web
cracking (owing to diagonal tension failure) of concrete members; it is also in the
range of shear angle associated with masonry infill cracking). The chart may be
used to determine the level of peak ground acceleration that may be sustained
0.1%
0.2%
0.3%
0.4%
0.5%
0.0% 1.0% 2.0% 3.0% 4.0%
1
Number of storeys
Composite area ratio of the vertical floor members (k or k/)
ΘΘ ΘΘ1 (
%)
C20/25, γ=1 t/m2
2
3 4
5 6

13
without failure, given the area ratios of the vertical, load-bearing elements in an
existing structure; alternatively, it may be used to determine the required floor in-
dex so as to guide the retrofit strategy for upgrading the structure to a specified
level of regional seismic demand.
Application of the Seismic Assessment Procedure
The proposed methodology for rapid evaluation of the limiting resistance of “non-
conforming” reinforced concrete buildings through prioritizing of the individual
column shear strengths is tested through application to two building examples.
Those buildings are field examples of structures that collapsed during the 1999
strong ground motion of Athens. Both buildings were located in the northern re-
gion of Athens, were the ground motion possessed “near-field” characteristics.
The essential attributes of each building and the estimated strengths and modes of
failure are studied using the expressions for strength ratios and drift demands de-
tailed in the preceding section; the characteristics of the performance point are es-
timated with reference to the EC8 [6] spectrum adjusted to the level of peak
ground acceleration reported for the site in consideration. The estimated perform-
ance limit state is compared with the observed behaviour based on post-
earthquake reconnaissance reports.
Building A was a two-storey fully symmetric in plan, industrial building, with
external plan dimensions of 38.00 m by 26.00 m (Fig 5(a)). The first and the sec-
ond storey heights were 5.40 m and 5.30 m, respectively. Building A was sepa-
rated by seismic gaps from two adjacent wing buildings along the two smaller
sides. The structural system was formed as an orthogonal grid of columns, beams
and slabs, according to typical construction practice of reinforced concrete frame
structures in Southern Europe. Details of the column geometry and longitudinal
reinforcement are presented in Figure 5(b). Column longitudinal bars were smooth
∅20 mm in all cases, whereas stirrups were smooth, rectangular ties, approxi-
mately categorised based on site reconnaissance as ∅8/300 mm. Slab thickness
was 0.15 m. All perimeter beam cross sections were 0.70 m (height) by 0.30 m
(width), 0.70×0.45 m for beams spanning between columns and 0.70×0.25 m for
the secondary beams. During the earthquake the building collapsed without any
horizontal dislocations of its structural elements, whereas the two adjacent build-
ings were intact. From tests of core samples, the mean value of concrete compres-
sive strength was determined as 24.8 MPa, whereas steel yielding and ultimate
stresses were found to be for the longitudinal reinforcement 431.5 MPa and 512.0
MPa respectively and for the stirrups 402.0 and 553.0 MPa, respectively.
The results of the strength assessment of the first storey columns in x and y di-
rections for Building A are presented in Fig. 6. The building’s columns were di-
vided in four groups, according to their geometric properties (Fig. 5) and service
loads, calculated according to the g+0.3⋅q earthquake combination. Note that
shear strength at lap-splice and at anchorage of column primary reinforcement are

14
calculated considering Llap = 20 ⋅ Db and La = Llap + hsl, respectively. Also consid-
ered was the existence of hooks in both ends of each longitudinal reinforcement
bar. The prevailing failure mechanisms for all the orthogonal section columns (i.e.
column groups 1, 2 and 3) was failure due to exhaustion of the lap-length devel-
opment capacity of tension reinforcement when seismic action is considered in a
direction parallel to the columns’ smaller side and joint shear failure when the di-
rection parallel to the columns’ bigger side is considered. Rectangular section col-
umns (i.e. columns C7 – C9 and C12 – C14) were found vulnerable to shear fail-
ure. Shear strength at beam yielding, Vby, was not calculated due to insufficient
information concerning the beam reinforcement. The total shear force that the first
storey columns of Building A could sustain was 1386 kN and 1301 kN in x and y
directions, respectively, whereas the corresponding flexural strength was esti-
mated equal to 2346 kN and 2138 kN, respectively.
Fig. 5. (a) Plan configuration of Building A; (b) External dimensions and reinforcement details of
the building’s columns.
(a)
x – axis
y –
ax
is
9.00 10.00 10.00 9.00
8.4
5
8.4
5
9.1
0
C1 C2 C3 C4 C5
C6 C7 C8 C9 C10
C11 C12 C13 C14 C15
C16 C17 C18 C19 C20
(b) 0.45
0.4
5
Group 4:
C7-C9, C12-C14
12∅∅∅∅20
0.45
0.3
0
Group 1:
C1, C5, C16, C20
4∅∅∅∅20
Group 3:
C6, C10, C11, C15
8∅∅∅∅20
0.30
0.4
5
0.45
0.3
0
Group 2:
C2-C4, C17-C19
8∅∅∅∅20

15
Fig. 6. Shear strength of Building A columns in (a) x and (b) y plan directions.
Results of the stiffness index assessment of the first storey columns are shown
in Fig. 7. Considering mass per unit area, γ = 0.66 t/m2 (derived from the g+0.3⋅q
seismic combination), total storey mass, m = 651.1 t and storey stiffness, Kx =
53161.1 kN/m and Ky = 52498.9 kN/m, the estimated building period was Tx = Ty
= 1.12 sec ( T = 2 ⋅ π ⋅ √[mi / Ki ⋅ ΣΦi2 / Σ(Φi – Φi-1)
2] ). The vulnerability curve de-
rived for Building A (Eq. 9(b)) for a pga value of 0.38g which is the reported site
acceleration for the critical earthquake. From the floor plan of Fig. 5(a) the area
ratio of vertical elements and corresponding k parameters (Eq. 10) where esti-
mated equal to k = ρc = 0.31% in both x and y directions, indicated that for the es-
timated area ratio of the vertical members in both directions, the first storey drift
demand would be Θ1,x = Θ1,y = 1.00% (Fig. 7). The average nominal drift at yield,
Θy,nomc, was estimated equal to 1.00% and 0.88% in x and y directions, respec-
tively. Note that interstorey drift at column yielding was estimated using a “stick
model” cantilever extending from the support to the point of inflection around the
midheight of the column [7, 8]: Θy,nomc = 1/3 ⋅ φy ⋅ Ls, where φy = 2.14 ⋅ εsy / h (εsy is
the nominal yield strain of longitudinal reinforcement). Premature failure was es-
0
20
40
60
80
100
120
140
160
180
200
Group 1 Group 2 Group 3 Group 4
Column Group I.D.
y - axis
Sh
ear
Str
eng
th (
kN
)
Vflex Vv Va Vlap Vj
0
20
40
60
80
100
120
140
160
180
200
Group 1 Group 2 Group 3 Group 4
Column Group I.D.
x - axis
Sh
ear
Str
eng
th (
kN
)

16
timated for the columns by applying the strength criteria (Eq. 7) in the x and y di-
rections, respectively (Fig. 6(a), (b)). In all column group cases the controlling
limiting shear strength was smaller than the corresponding flexural shear demand
(note that Vby was not estimated due to insufficient information), indicating brittle
failure with no ductility. The average values of the first storey columns were
Vu,lim,x / Vflex,x = 0.61 and Vu,lim,y/ Vflex,y = 0.65 and the corresponding drifts at failure
(Θy,critc = ru,lim ⋅ Θy,nom
c, Eq. 12) were 0.61% and 0.56% in x and y directions, re-
spectively. The estimated first storey drift at failure in each direction for an aver-
age value of λc = 0.70 is Θfail,x = 1 / λc ⋅ 0.61% = 0.86% and Θfail,y = 1 / λc ⋅ 0.56% =
0.80% (horizontal dashed lines). The outcome of the stiffness index assessment procedure (Θ1,x > Θfail,x and Θ1,y > Θfail,y) renders Building A susceptible to collapse
in the 1999 Athens earthquake, a finding compatible with the reconnaissance re-
port.
Fig. 7. Vulnerability curve of Building A.
Building B was also an industrial building, having a 37.60 m by 22.80 m orthogo-
nal plan (Fig. 8(a)). The building had two basements and four storeys, each 2.85 m
high. The structural system comprised a grid of columns which were connected
with beams only along the buildings’ perimeter, the beams having a section height
of 0.60 m and 0.20 m web width. In the center of typical floor plan, columns sup-
ported a flat-plane Zoellner system, having a thickness of 0.22 m. During the
earthquake the building collapsed, except for the stairwell in the corner of the plan
(Fig 8(a)). The stairwell was connected to the building through the floor slabs
which were lightly reinforced (ρℓ,sl around 1.0%). Thus the connection was defi-
cient in its capacity to transfer the inertia forces of the diaphragm to the perimeter
walls of the stairwell over the 5 m long unilateral contact provided at each floor
level; in light of this poor connection, mobilization of walls in providing lateral
load resistance to the building was marginal, as evidenced by the building wreck-
age. After tests conducted on material samples, the concrete was found to have a
0.0%
0.2%
0.4%
0.6%
0.8%
1.0%
1.2%
0.0% 0.5% 1.0% 1.5% 2.0% 2.5% 3.0%
Θ1
k 0.31%
0.80% (y-y)
0.86% (x-x)
1.00%
1st storey drifts at
failure
1st storey drift demand

17
mean compressive strength of 20 MPa, while longitudinal reinforcement and stir-
rups were found to have smooth surface and were classified as S400 (fy = 400
MPa) and S220 (fy = 220 MPa) respectively. Column dimensions and longitudinal
reinforcement details (bar diameter equal to 16 mm in all cases, except for the rec-
tangular columns where ∅20 mm bars were utilised) are presented in Fig. 8(b),
whereas transverse reinforcement comprised ∅6/300 mm rectangular, smooth stir-
rups.
Fig. 8. (a) Plan configuration of Building B; (b) External dimensions and reinforcement details of
the building’s columns.
(b)
Group 3:
C8-C11, C14-C17
8 ∅∅∅∅20
0.65
0.6
5
Group 1:
C7, C12, C13, C18
8 ∅∅∅∅16
0.40
0.7
5
0.4
0
0.75
Group 2:
C1-C6, C19-C22
8 ∅∅∅∅16
(a)
x – axis
y –
ax
is
C1 C2 C3 C4 C5 C6
C7 C8 C9 C10 C11 C12
C13 C14 C15 C16 C17 C18
C19 C20 C21 C22 C23 C24
7.00 7.00 7.00 7.00 7.15 7
.00
7
.00
7
.40

18
Fig. 9. Shear strength of Building B columns in (a) x and (b) y plan directions.
To perform strength assessment, the building’s columns were divided in three
column groups, as presented in Fig. 8, according to their geometrical properties
and their service load (calculated according to the seismic combination g+0.3⋅q).
Longitudinal reinforcement bars were considered to have a lap length, Llap, equal
to 25⋅Db, and an anchor length, La = Llap + dsl, whereas hooks were considered in
both ends of each bar. Strength assessment (Fig. 9(a)-(b)) has revealed that the
prevailing failure mechanism of the first storey columns was failure due to ex-
haustion of slab punching strength. The total shear force that the first storey col-
umns of Building B could sustain at the onset of slab punching was 3602 kN and
3422 kN in x and y directions, respectively, whereas the corresponding flexural
strength was estimated equal to 9650 kN and 8345 kN, respectively. Considering
first storey total weight, Wg+0.3q = 31836 kN (total mass, m = 811.3 t and mass per
unit area, γ = 1.08 t/m2) and storey stiffness, Kx = 1059906 kN/m and Ky =
1051293 kN/m, the estimated building period was Tx = Ty = 0.50 sec. The vulner-
ability curve of Building B (Fig. 10) derived from Eq. 9(a), considering ag = 0.38
0
100
200
300
400
500
600
Group 1 Group 2 Group 3 Column Group I.D.
x - axis S
hea
r S
tren
gth
(k
N)
0
100
200
300
400
500
600
Group 1 Group 2 Group 3 Column Group I.D.
y - axis
Sh
ear
Str
eng
th (
kN
)
Vflex Vv Va Vlap Vpn

19
g, which was the peak ground acceleration in the Sepolia region where the build-
ing was located. The area ratios of the first storey columns was estimated equal to
k = ρc = 1.00% in both x and y directions, thus the first storey drift demand for
Building B would be Θ1,x = Θ1,y = 1.35%. The average nominal drift at yielding of
the vertical elements, Θy,nomc (Θy,nom
c = 1/3 ⋅ φy ⋅ Ls, φy = 2.14 ⋅ εsy / h [7, 8]), was
estimated equal to 0.35% and 0.29% in x and y directions, respectively, whereas
the failure drift of columns, Θy,critc, was equal to less than 50% of the average
nominal drift at yield (Θy,crit,xc = 0.37⋅ Θy,nom,x
c, Θy,crit,y
c = 0.41⋅ Θy,nom,y
c). The first
storey drift at failure, Θfail, (λc = 1.00) (Eq. 10) was found equal to 0.14% and
0.13% in x and y directions, respectively. Since Θfail < Θ1, stiffness index assess-ment indicates that Building B is susceptible to collapse in the 1999 Athens earth-
quake, a finding compatible with the reconnaissance report.
Fig. 10. Vulnerability curve of Building B.
Conclusions
A method for rapid seismic assessment of reinforced concrete buildings, based on
basic data easily available for all buildings such as the building’s general geome-
try in plan and elevation, material properties and reinforcement detailing rules rep-
resentative of the period of the building’s construction, was presented in this chap-
ter. Motivation for the introduction of this method was the emerging need for a
dependable tool for rapid identification of the most vulnerable buildings that are
likely to collapse in the in the event of a strong earthquake, without the need of
conducting time and effort consuming detailed assessment procedures, which can
be applied in a second face to the selected buildings.
Prioritization of the potential failure mechanisms in the load carrying system
of concrete buildings in order to calculate its limiting resistance and determination
0.0%
0.2%
0.4%
0.6%
0.8%
1.0%
1.2%
1.4%
1.6%
1.8%
2.0%
0.0% 2.0% 4.0% 6.0% 8.0% 10.0% 12.0%
1st storey drift demand
0.13% (y-y)
0.14% (x-x)
1.35%
1st storey drifts at failure
1.00% k
Θ1
20
of the building’s ultimate storey drift are the two main concepts of the assessment
method. Mechanisms considered refer to column flexure, shear, anchorage lap and
splice development capacity, beam-column joint shear and slab punching strength
in the slab-column area, as failure of vertical structural elements is directly related
to building severe damage or collapse. Based on the determination of the struc-
tural system limiting strength, strength ratios are calculated for each of the princi-
pal directions of the plan, that allow to obtain the drift capacity of the building in
the respective direction. Drift capacity is compared with the corresponding drift
demand. When the demand exceeds the capacity prior to attainment of flexural
yielding, brittle failure and collapse is anticipated. Note that through the rapid as-
sessment method it is also possible to obtain the magnitude of displacement duc-
tility that would be required through column retrofit, in order to eliminate the risk
of collapse due to excessive displacement demand.
For verification the method is tested in two actual building examples that col-
lapsed during the 1999 Athens earthquake. The proposed seismic assessment ap-
proach was successful in all the cases considered, in properly identifying collapse
and the mode of prevailing failure. In both building cases, brittle failure modes
were prioritised to occur prior to flexural yielding with premature collapse without
ductility. The base shear at the onset of failure was in both cases in the range of
0.10 to 0.12 to the structural weight, underscoring the older practices where the
so-called seismic coefficient used was in this range of values.
References
1. Thermou G. E. and Pantazopoulou S. J. (2011) Assessment indices for the seismic vulnerabil-
ity of existing RC buildings. Journal of Earthquake Engineering and Structural Dynamics, 40
(3), p. 293-313.
2. Federation of Structural Concrete (fib) (2003) Seismic assessment and retrofit of reinforced
concrete buildings. fib Bulletin 42 State-of-art report prepared by Task Group 7.1.
3. Deutsches Institut fur Normung (DIN) (1972) Beton un Stahlbetonbau: Bemessung und
Ausfuhrung – DIN 1045, Berlin.
4. Eberhard M. O., Baldridge S, Marshall J., Mooney W., Rix G. J. (2010) The Mw7.0 Haiti
Earthquake of January 12, 2010. USGS/EERI Advance Reconnaissance Team: Team Report
V1-1.
5. Federation of Structural Concrete (fib) (2010) Model Code 2010. First Complete Draft.
6. Eurocode 8 (2004) Design of structures for earthquake resistance – Part 1: general rules,
seismic actions and rules for buildings. EN1998-1-2004, European Committee for Standardi-
zation (CEN), Brussels.
7. Priestley M. J. N. (1998) Brief comments on elastic flexibility of reinforced concrete frames
and significance to seismic design. Bulletin, New Zealand National Society for Earthquake
Engineering, 31 (4): p. 246-259.
8. Priestley M. J. N., Kowalsky M. J. (1998) Aspects of drift and ductility capacity of cantilever
structural walls. Bulletin, New Zealand National Society for Earthquake Engineering, 31 (2):
p. 73-85.


