Embed Size (px)
Citation preview
The Journal of Neuroscience, January 1993. 13(l): 313323
Prenatal Development of Excitability in Cat Retinal Ganglion Cells: Action Potentials and Sodium Currents
I. Skaliora,’ R. P. Scobey,2 and L. M. Chalupa’
Departments of ‘Psychology and 2Neurology and the Neurobiology Graduate Group, University of California, Davis, California 95616
The development of precise retinofugal projections is de- pendent on activity-mediated events, but as yet nothing is known about the ontogeny of excitable membrane properties in retinal ganglion cells (RGCs). In order to begin to under- stand how functional maturity is attained in these neurons, whole-cell patch-clamp recordings were obtained from acutely dissociated RGCs of fetal and postnatal timed-preg- nant cats. Current-clamp recordings revealed a pronounced developmental increase in the proportion of RGCs capable of generating action potentials. At embryonic day 30 (E30), 5 weeks before birth and during a time when RGCs are still being generated, electrical stimulation elicited spikes in only a third of the cells. None of these neurons were capable of multiple discharges in response to maintained depolarira- tion. The proportion of spiking neurons increased during ontogeny, such that by E55 all RGCs could be induced to generate action potentials, with the majority manifesting repetitive spiking patterns. Application of tetrodotoxin abol- ished spike activity of all fetal RGCs, indicating that sodium- mediated action potentials are present very early in devel- opment.
At the same time, voltage-clamp recordings revealed sig- nificant ontogenetic modifications in several key properties of the sodium currents (I,.,,). These were (1) a twofold in- crease in Na current densities; (2) a shift in the voltage de- pendence of both activation and steady state inactivation: with maturity, sodium currents activate at more negative po- tentials, while steady state inactivation of /,.,, occurs at less negative potentials; and (3) a decrease in decay time con- stants of the Na current, at membrane potentials negative to - 15 mV. These developmental changes were largely re- stricted to the period of axon ingrowth (E30-E38), suggesting that maturation of I,,. is not the limiting factor for the onset of activity-dependent restructuring of retinofugal projec- tions.
[Key words: retinal ganglion cells, whole-cell patch clamp, development, sodium conductance, action potentials, TTX]
There is good reason to believe that neuronal activity plays a key role in the establishment of specific connections in the de- veloping visual system (for recent reviews, see Constantine-
Received June 16, 1992; accepted July 2 I, 1992. We thank C. J. Snider for excellent technical assistance and L. C. Liets for
participating in some of the experiments. We also thank Drs. Martin C. L. Wilson and David W. Robinson for comments on the manuscript. This work was sup- ported by NIH Grant EY-0399 I. IS. was supported by a Regents fellowship from the University of California.
Correspondence should be addressed to Irini Skaliora, Psychology Department, University of California at Davis, Davis, CA 95616.
Copyright 0 1993 Society for Neuroscience 0270-647419311303 13- 1 1$05.00/O
Paton et al., 1990; Kalil, 1990; Shatz, 1990). In particular, sodium-mediated action potentials are thought to underlie cor- related activity patterns that stabilize certain synapses according to the Hebbian postulate. Support for this idea is provided by studies showing that application oftetrodotoxin (TTX), the volt- age-gated sodium channel blocker, disrupts the normal refine- ments of early patterns of projections (Meyer, 1983; Dubin et al., 1986; Stryker and Harris, 1986). In the cat visual system, for instance, it has been demonstrated that infusion of TTX into the fetal brain prevents the formation of eye-specific do- mains in the dorsal LGN (Shatz and Stryker, 1988) and results in larger than normal retinogeniculate axon terminals (Sretavan et al., 1988).
The results of such studies imply that retinal ganglion cells can generate spikes early in ontogeny. Indeed, extracellular re- cordings from the intact embryonic retina have demonstrated that developing ganglion cells are capable of generating action potentials (Galli and Maffei, 1988; Meister et al., 199 I). Dis- charges of neighboring cells in the embryonic rat retina have been shown to be positively correlated (Maffei and Galli-Resta, 1990), and periodic bursts of synchronous activity have been demonstrated in fetal cats and postnatal ferrets (Meister et al., 199 1). Furthermore, electrical stimulation of the optic nerve can induce postsynaptic activity in some dorsal lateral geniculate neurons as early as embryonic day 39 (E39; Shatz and Kirkwood, 1984). As yet, however, nothing is known about the ontogeny of functional properties and the mechanisms underlying spike generation in developing retinal ganglion cells (RGCs).
Conventional electrophysiological experiments on very young mammalian neurons are difficult for a number of technical rea- sons, not the least of which is their small size. The use of dis- sociated cells, in conjunction with the whole-cell patch-clamp recording technique (Hamill et al., 1981; Lipton and Tauck, 1987) offers a powerful tool for assessing the electrophysiolog- ical properties of individual neurons. We have employed these techniques to study the development of excitability in ganglion cells of the fetal and postnatal cat retina. In this system, it is possible to relate functional development to structural refine- ments that occur during ontogeny since a great deal is already known about the anatomical and morphological maturation of these neurons and their projection patterns (for reviews, see Shatz and Sretavan, 1986; Chalupa and White, 1990).
In the present study, we addressed the following questions. When are fetal RGCs first capable of generating action poten- tials, and how does the excitability of these neurons change during development? Are the action potentials of fetal cells me- diated by sodium? If so, what are the properties of sodium currents in developing RGCs? The findings are related to the pattern of ganglion cell ingrowth and the refinements that are
314 Skaliora et al. - Development of Excitability in Cat Retinal Ganglion Cells
known to occur during the establishment of mature retinal pro- jection patterns.
Some of these findings have been published in abstract form (Skaliora et al., 1990, 199 1).
Materials and Methods Retrograde labeling of retinalganglion cells. Dissociated retinal ganglion cells (RGCs) cannot be unequivocally identified based on morphological features. For this reason, RGCs were retrogradely labeled in vivo with rhodamine latex beads (RBs). All surgeries were carried out under sterile conditions in strict compliance with NIH guidelines. To backfill gan- glion cells in prenatal animals, the fetal head was exposed through a small incision over the nonplacental portion of the uterus of a timed- pregnant cat anesthetized with 2% halothane. RBs were injected bilat- erally into the optic tract, dorsal lateral geniculate nucleus, and superior colliculus with a Hamilton syringe. Cranial landmarks were used to orient the placement of such injections. Postnatal animals were anes- thetized with Telazol (I 5.4 mg/kg), and injections of RBs were made into the same brain regions using stereotaxic coordinates. After a 2 d survival period, the animals were deeply anesthetized with barbiturate and the eyes were removed and kept in a cold, oxvaenated, buffered solution (solution A: Hanks’ balanced salt solution, buffered with 15 mM HEPES, pH 7.3) until readv for dissection.
Retinal disiociatidn. Retinas were dissected from the sclera and pig- ment epithelium and enzymatically treated in a Ca* + /Mg*+ -free Hanks’ balanced salt solution containing cysteine (1 mM, Sigma) and papain (25 U/ml, Worthington), at 30°C for 45-60 min depending on the age of the animal. The retinal fragments were subsequently rinsed three or four times in solution A, with DNase and antibiotics (gentamycin, 50 pg/ml) added to the final rinse and kept in rotating tubes at 5°C until aliquots were removed. Following brief trituration through a fire-pol- ished Pasteur pipette, the cells were transferred to a recording chamber. Neurons from which recordings were obtained had translucent cell bod- ies with nongranular appearance and clear surfaces that often retained stumps of broken processes (Fig. 1). Such cells remained viable for 20- 50 hr after dissociation. There was a developmental change in the total membrane area as assessed from the cell capacitance measurements (mean * SD), from 4. I f I.5 pF (n = 14) at E30 to 10.2 f 4 pF (n = 23) at postnatal stages. Since the extent of processes on the dissociated cells did not vary appreciably with maturation (see Fig. I), this change largely reflects an increase in somal size. Assuming a value of 1 pF/cm2 and a spherical shape, these values correspond to average cell body diameters of approximately 1 1.5 bum at E30 and 18 pm at postnatal ages.
Electrophysiological recordings. Isolated RGCs backfilled with RB were located in the recording chamber using an IM35 Zeiss epifluores- cence microscope (400 x ; filters: BP 5 1 O-560, FI 580, LP 590) equipped with a mercury vapor lamp. Differential interference contrast optics were used to visualize the cell during the recording period. A Sutter Instruments P-87 puller was used to make patch pipettes from thick- walled 1.5-mm-o.d. capillary tubing. Patch electrodes had resistances of 5-8 MQ when filled with electrode solution (see below). Recordings were made with a patch-clamp amplifier (Axopatch 1-C; bandpass: 5 kHz). Current-clamp and voltage-clamp data were digitized (I 0,000 or 1000 samples per trace respectively), displayed and-stored for subse- quent off-line analysis on an IBM AT computer. Software developed in our laboratory was used for data acquisition and analysis and the com- mercially available program SIGMA-PLOT was used for curve fitting and plotting.
Current-clump recordings. To monitor the spike generation capability and firing patterns ofdeveloping RGCs, we used theperforated variation of the patch-clamp techniaue (Horn and Martv. 1988). With this meth- od, electrical access to the’cytbplasm is obtained as nystatin molecules are inserted into the patch membrane. This recording mode was pre- ferred for current-clamp experiments because it minimizes dialysis of the cytoplasm. [It was not used for voltage-clamp recordings due to the much higher series resistance (R,) values, ranging from 20 to 50 MR.] Recordings were typically obtained in a bath solution containing (in mM) NaCl, 140; CaCl, 3; KCI, 5; MgCl,, I; HEPES-NaOH, 10; and D-glucose, 5 (pH 7.3; osmolarity, 290-300 mOsm). The electrode so- lution contained (in mM) KCI, 140; EGTA, 0.5; HEPES, IO; nystatin, 250 &ml; and pluronic, 250 &ml to aid nystatin suspension. The osmolarity was adjusted to 280-290 mOsm and the pH to 7.3. To assess the cells’ spike generation ability, steps ofdepolarizing current (typically varying from I to 60 pA with a duration of 2-3 set) were injected. For
some cells, the effect of the membrane potential on spiking was ex- amined by altering membrane voltage with injections ofsmall, constant currents, before the stimulating currents were applied. For selected neu- rons, recordings were obtained in the presence of TTX (300 nM), pre- ceded and followed by recordings in control solutions.
Voltage-clamp recordings. After formation of a high-resistance seal (gigaseal) between the recording electrode and the cell membrane, tran- sient currents caused by pipette capacitance were compensated elec- tronically before establishing the whole-cell configuration (Hamill et al., 198 1). Recordings where the seal resistance was less than I GQ were discarded. The cell capacitance was obtained from the calibrated ad- justment of the amplifier and was used to calculate current densities. For isolation of the sodium currents (I,,), the extracellular solution contained (in mM) NaCI, 120; CsCI, 5; CaC&, 0.5; CoCI,, 2.5; tetraethyl- ammonium (TEA)-Cl, IO; 4-aminopyridine, IO; HEPES-NaOH, IO; and D-glucose 10 (pH 7.3, osmolarity adjusted to 290-300 mOsm). The electrode solution contained (in mM) CsCI, 120; NaCl, 15; MgCI,, 1; CaCI>, 0. I ; TEA-acetate, 5; HEPES, IO; EGTA, I. I ; and ATP, I (pH 7.3; osmolarity, 280-290 mOsm). Typically, recordings were made at room temperature, around 24°C.
Control of membrane potential and a small voltage drop across the electrode were essential for the analysis of Na currents. After electronic compensation (usually 75-80%) R, values ranged between 3 and 9 Ma. In large cells, as the membrane area and peak Na current increased, there was loss of voltage control, as indicated by a lack ofgraded inward current responses to voltage steps in the threshold range (-50 to -30 mV), a delayed onset of the currents, and steep activation curves (k < 3 mV per e-fold change in activation). In order to obtain adequate voltage control during I,, activation in these RGCs, the current am- plitude was reduced, either by decreasing the extracellular Na concen- tration to 2540 mM (substituted by tetramethylammonium or sucrose to maintain constant osmolarity), or by adding TTX (30-75 nM) to the bath solution. These modifications permitted an analysis of the Na currents throughout the developmental period studied. Such records, however, were not used for peak current amplitude or density mea- surements. In order to be included in the present study, the recordings had to fullli1l two criteria: (1) an electrode voltage drop of less than 5 mV and (2) smoothly rising current-voltage (I-v) relationships, giving rise to activation curves (fitted by Boltzmann equations) with a steepness factor k > 4. In selected cells the adequacy of space clamp was assessed more directly, either by fitting the capacitance charging curves obtained in whole-cell recordings or by scaling currents reduced by different con- ditioning prepulses. In all cases that fullfilled the above two criteria, a single exponential provided an adequate fit and the scaled current traces overplotted, implying electrical homogeneity of the cell membrane. Overall, 73% (44 out of 60) of the RGCs obtained from fetal animals and 45% (23 out of 51) of the postnatal cells fulltilled the above re- quirements.
Analysis. Capacitative transients and leak currents were subtracted from the records by the use of scaled currents, obtained by averaging 10 hyperpolarizing pulses in which the potential was stepped from - 75 to -95 mV. The data were used to plot current-voltage (1-l’) relation- ships. To determine the voltage sensitivity of the Na conductance, ac- tivation curves were constructed by converting current values to con- ductances, using the equation
where I is the measured peak current generated at each command po- tential, corrected for the leak current; V,,, is the membrane voltage ob- tained from the command potential after corrections for the tip potential and the voltage drop across the electrode due to the series resistance; and E,, is the sodium reversal potential, measured from the I-Vcurve. Activation and steady-state inactivation curves were fitted by mini- mizing the sum of squares, using Boltzmann equations. Decay time constants (r,,) were calculated by linear regression as the inverses of the current slopes plotted on a semilogarithmic scale. Original current traces were fitted according to the formulas given in the Results (SIGMA-PLOT).
Since there was no evidence of multiple distributions for any of the parameters examined, the data are reported as means -+ SD throughout the article.
Results Current-clamp recordings All postnatal RGCs manifested spike activity in response to electrical stimulation. Small depolarizing currents (2-10 PA)
The Journal of Neuroscience, January 1993, 13(l) 315
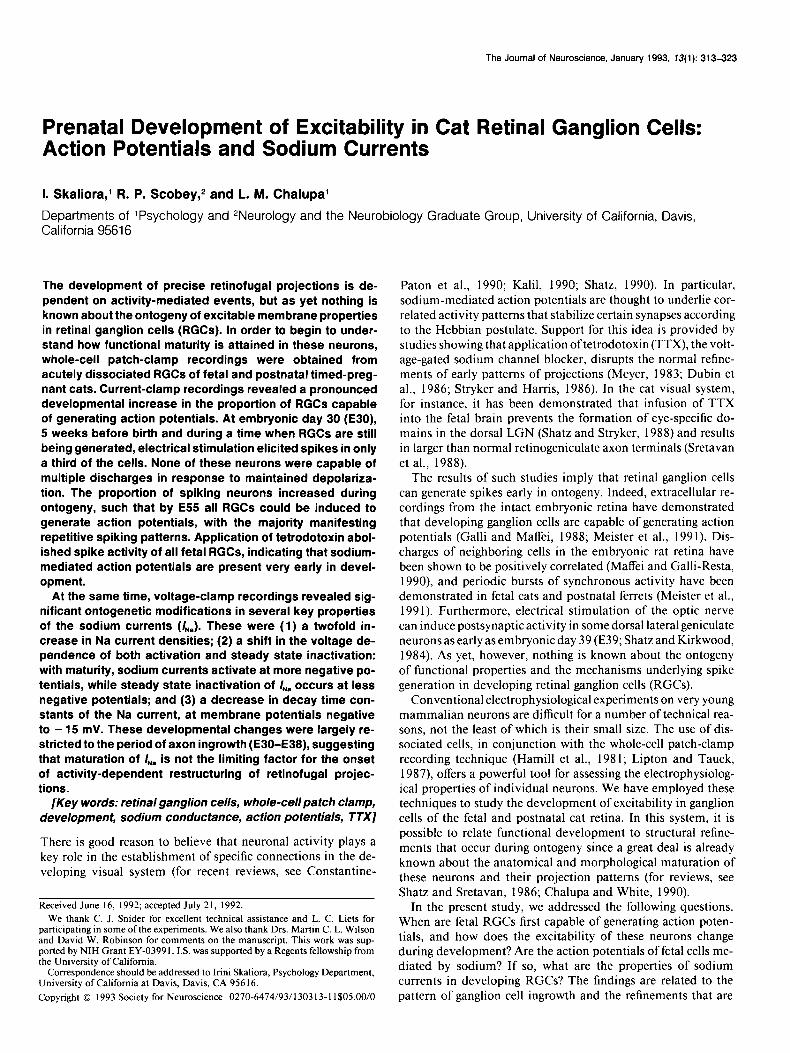
Ftgure 1. Photomicrographs of isolated RGCs. A and B, Retinal cells dissociated from a retina of an E30 and an E35 animal, respectively. Arrows indicate RGCs (labeling not shown). Healthy neurons from which recordings were obtained had smooth surfaces, a three-dimensional appearance under Nomarski optics, and visible nuclei when focused accordingly. Typically, dissociated cells retained short processes on their somata (A). In rare cases, however, as in the neuron in B, extensive processes were preserved. Recordings from such cells were usually not considered for kinetic analysis due to space-clamp problems. C, Three RGCs from an E35 retina. The cells were labeled by injections of RBs as shown in the fluorescent picture (left). Processes in these neurons are out of the plane of focus. D, Labeled neuron from an E38 retina. Often, the fluorescent tracer (top) was apparent in the processes of the cell.
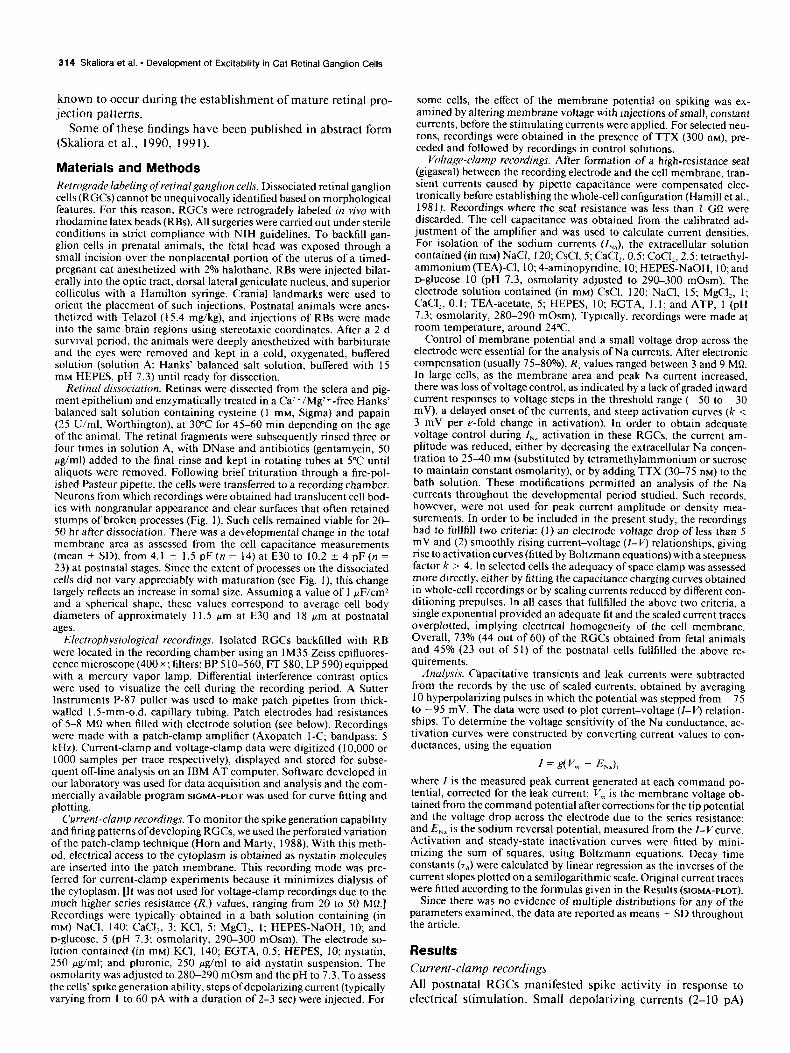
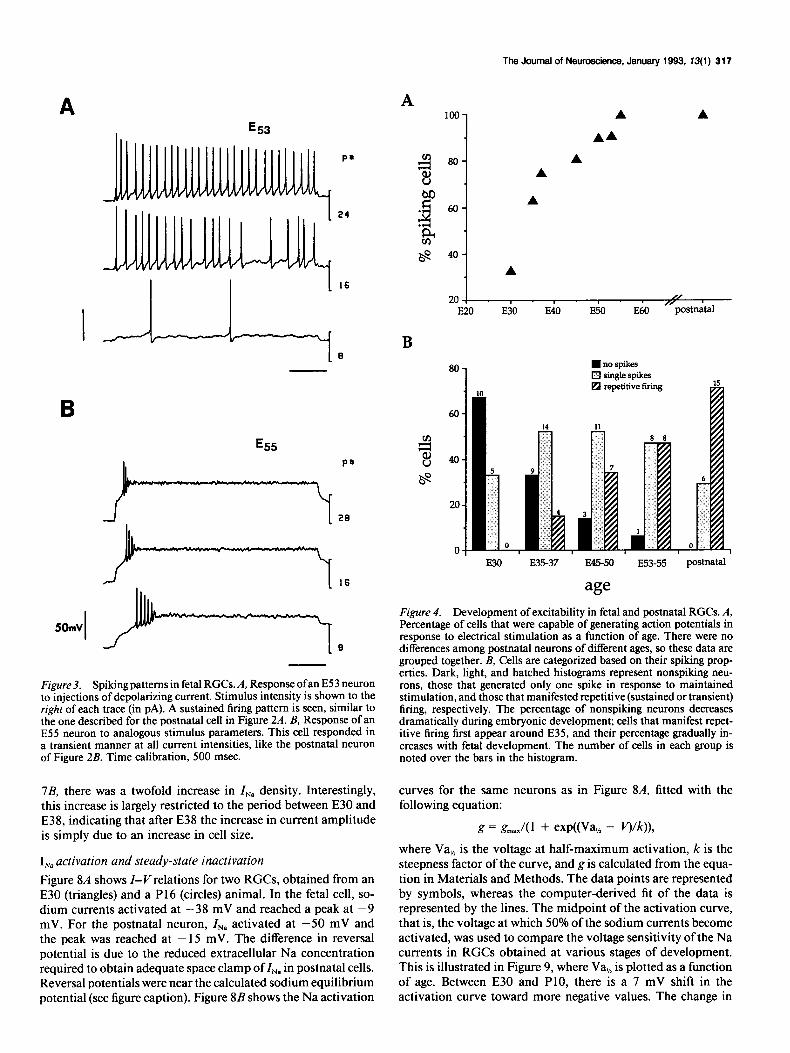
were sufficient to evoke action potentials. Some cells fired in a sustained manner over a wide range of current intensities (2- 45 PA). In these cases, spike activity lasted for the duration of the stimulus and the amplitude of action potentials remained fairly constant (Fig. 2A). With increasing stimulus intensities there was an increase in response frequency. Other cells re- sponded in a transient manner at all stimulus intensities. Such cells generated a limited number of spikes of decreasing am-
plitudes, followed by a stabilization of the membrane potential at a fairly depolarized level that was maintained until the stim- ulus was terminated (Fig. 2B). In some cases, only a single spike was generated. For any given cell, the response pattern was invariant as demonstrated by repeated recordings. There was no correlation between spiking properties and soma size, extent of processes present, or the resting membrane potential. RGCs manifesting sustained firing patterns had an average resting po-
316 Skaliora et al. l Development of Excitability in Cat Retinal Ganglion Cells
24
Figure 2. Responses to current injections in postnatal cells: sustained (A) and transient (B) spiking patterns. Each trace illustrates the cell’s response to a current pulse injected through the patch electrode. The numbers on the right of each trace represent the current intensity in pA, the negative sign defining a hyperpolarizing current. Note that for the sustained pattern the frequency of the response increases with increasing stimulus intensities. As in most cells that showed this response, action potentials were of nearly constant amplitude and duration for the length of the current injection. In contrast, for the cells manifesting transient firing patterns, action potentials tend to become longer and smaller during the response. In some cases, only a single action potential was elicited. Time calibration, 500 msec.
tential of -59 + 14 mV and an average cell capacitance of 17 -t 2 pF (n = 13), while for RGCs that fired transiently these values were -65 f 11 and 17 f 3 pF (n = 1 l), respectively (mean f SD). Sustained and transient firing patterns in response to electrical stimulation have also been observed in recordings from acutely dissociated rat (Barres et al., 1988) and tiger sal- amander RGCs, as well as in salamander retinal whole-mounts (Mobbs et al., 1992).
Both response patterns were also evident in recordings of RGCs obtained from fetal animals as illustrated for the two neurons shown in Figure 3. In embryonic cells, the average resting potential was -50 f 13 mV (n = 47). In any given neuron, the same response pattern was obtained over a wide range of stimulus intensities and repeated recordings.
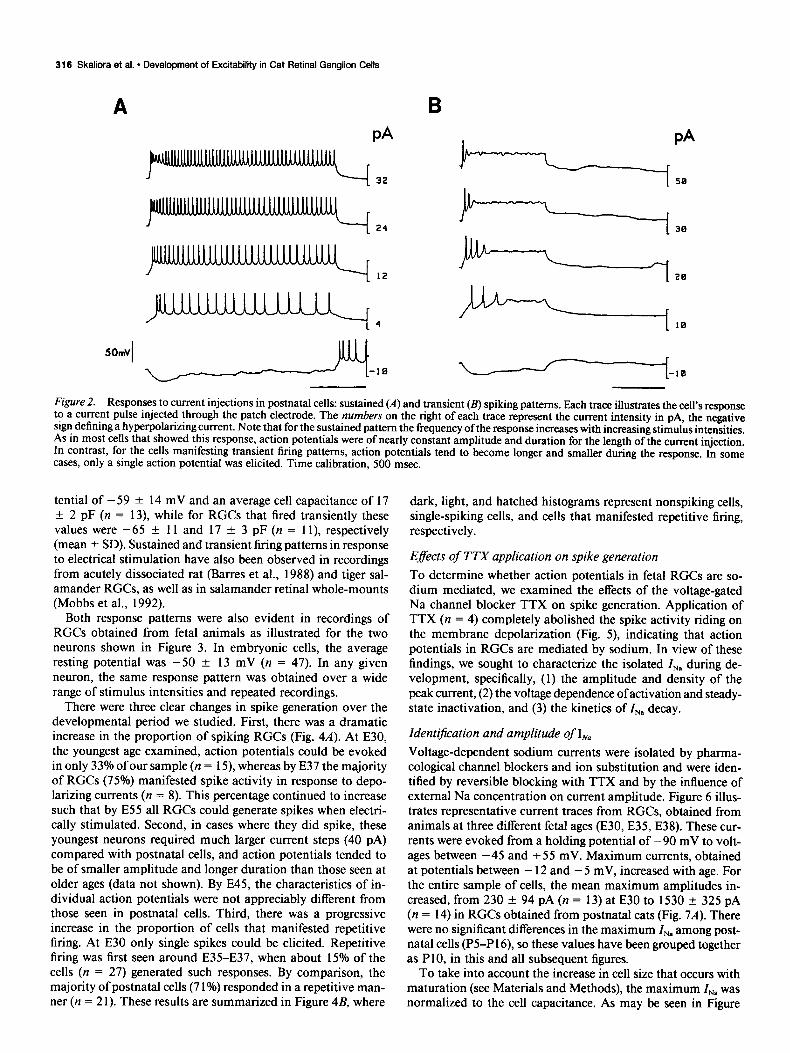
There were three clear changes in spike generation over the developmental period we studied. First, there was a dramatic increase in the proportion of spiking RGCs (Fig. 4A). At E30, the youngest age examined, action potentials could be evoked in only 33% of our sample (n = 15), whereas by E37 the majority of RGCs (75%) manifested spike activity in response to depo- larizing currents (n = 8). This percentage continued to increase such that by E55 all RGCs could generate spikes when electri- cally stimulated. Second, in cases where they did spike, these youngest neurons required much larger current steps (40 PA) compared with postnatal cells, and action potentials tended to be of smaller amplitude and longer duration than those seen at older ages (data not shown). By E45, the characteristics of in- dividual action potentials were not appreciably different from those seen in postnatal cells. Third, there was a progressive increase in the proportion of cells that manifested repetitive firing. At E30 only single spikes could be elicited. Repetitive firing was first seen around E35-E37, when about 15% of the cells (n = 27) generated such responses. By comparison, the majority of postnatal cells (7 1%) responded in a repetitive man- ner (n = 2 1). These results are summarized in Figure 4B, where
dark, light, and hatched histograms represent nonspiking cells, single-spiking cells, and cells that manifested repetitive firing, respectively.
Efects of TTX application on spike generation
To determine whether action potentials in fetal RGCs are so- dium mediated, we examined the effects of the voltage-gated Na channel blocker TTX on spike generation. Application of TTX (n = 4) completely abolished the spike activity riding on the membrane depolarization (Fig. 5), indicating that action potentials in RGCs are mediated by sodium. In view of these findings, we sought to characterize the isolated INn during de- velopment, specifically, (1) the amplitude and density of the peak current, (2) the voltage dependence of activation and steady- state inactivation, and (3) the kinetics of I,, decay.
IdentiJication and amplitude of I,
Voltage-dependent sodium currents were isolated by pharma- cological channel blockers and ion substitution and were iden- tified by reversible blocking with TTX and by the influence of external Na concentration on current amplitude. Figure 6 illus- trates representative current traces from RGCs, obtained from animals at three different fetal ages (E30, E35, E38). These cur- rents were evoked from a holding potential of -90 mV to volt- ages between -45 and +55 mV. Maximum currents, obtained at potentials between - 12 and - 5 mV, increased with age. For the entire sample of cells, the mean maximum amplitudes in- creased, from 230 f 94 pA (n = 13) at E30 to 1530 f 325 pA (n = 14) in RGCs obtained from postnatal cats (Fig. 7A). There were no significant differences in the maximum INn among post- natal cells (P5-P16), so these values have been grouped together as PlO, in this and all subsequent figures.
To take into account the increase in cell size that occurs with maturation (see Materials and Methods), the maximum I,, was normalized to the cell capacitance. As may be seen in Figure
The Journal of Neuroscience, January 1993. 13(l) 317
A
1 16
B
1 16
5OmV I
Figure 3. Spiking patterns in fetal RGCs. A, Response ofan E53 neuron to injections of depolarizing current. Stimulus intensity is shown to the right of each trace (in PA). A sustained firing pattern is seen, similar to the one described for the postnatal cell in Figure 2A. B, Response of an ES5 neuron to analogous stimulus parameters. This cell responded in a transient manner at all current intensities, like the postnatal neuron of Figure 2B. Time calibration, 500 msec.
7B, there was a twofold increase in I,, density. Interestingly, this increase is largely restricted to the period between E30 and E38, indicating that after E38 the increase in current amplitude is simply due to an increase in cell size.
I, activation and steady-state inactivation Figure 8A shows Z-V relations for two RGCs, obtained from an E30 (triangles) and a P16 (circles) animal. In the fetal cell, so- dium currents activated at -38 mV and reached a peak at -9 mV. For the postnatal neuron, INa activated at -50 mV and the peak was reached at - 15 mV. The difference in reversal potential is due to the reduced extracellular Na concentration required to obtain adequate space clamp of I,, in postnatal cells. Reversal potentials were near the calculated sodium equilibrium potential (see figure caption). Figure 8B shows the Na activation
loo
1
A
A A
AA
A
20 -I , . , , I ,/” I E20 E30 E40 E-50 E60 postnatal
I no spikes El single spikes Pa repetitive firing 15
60
2 pj 40
s\”
20
0 E30 F.35-37 lwm E53-55 posmatal
age
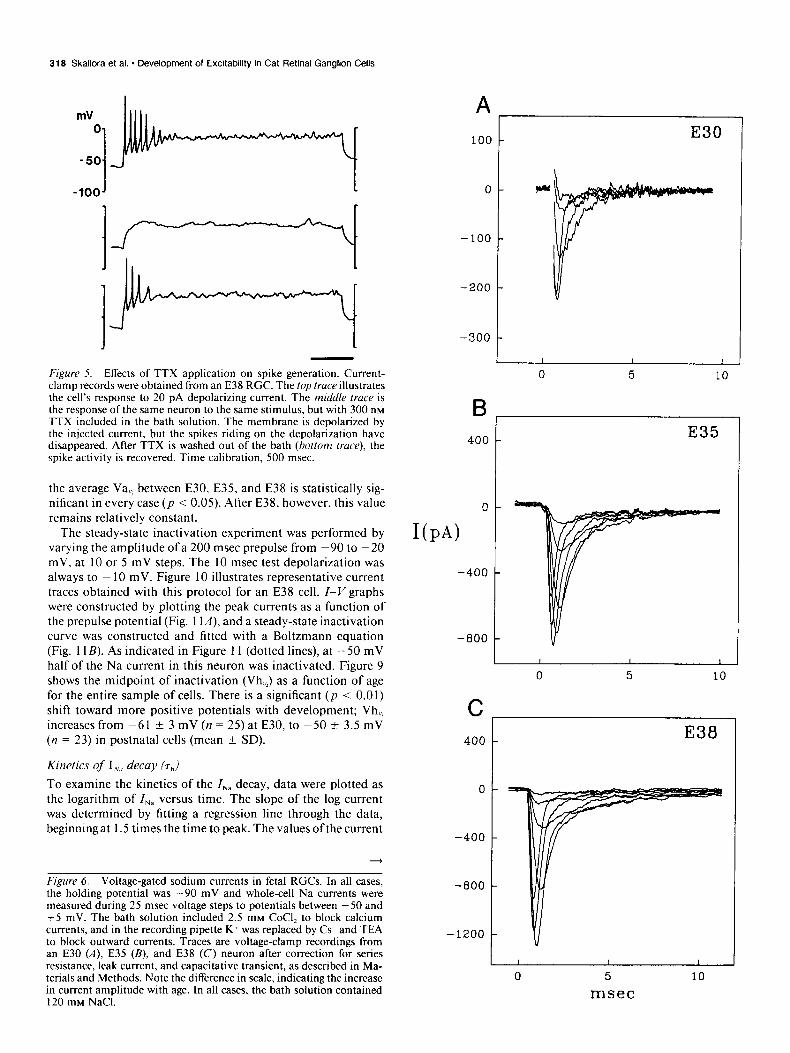
Figure 4. Development of excitability in fetal and postnatal RGCs. A, Percentage of cells that were capable of generating action potentials in response to electrical stimulation as a function of age. There were no differences among postnatal neurons of different ages, so these data are grouped together. B, Cells are categorized based on their spiking prop- erties. Dark, light, and hatched histograms represent nonspiking neu- rons, those that generated only one spike in response to maintained stimulation, and those that manifested repetitive (sustained or transient) firing, respectively. The percentage of nonspiking neurons decreases dramatically during embryonic development; cells that manifest repet- itive firing first appear around E35, and their percentage gradually in- creases with fetal development. The number of cells in each group is noted over the bars in the histogram.
curves for the same neurons as in Figure 84 fitted with the following equation:
g = g,.A + exr-Walh - WW, where Vach is the voltage at half-maximum activation, k is the steepness factor of the curve, and g is calculated from the equa- tion in Materials and Methods. The data points are represented by symbols, whereas the computer-derived fit of the data is represented by the lines. The midpoint of the activation curve, that is, the voltage at which 50% of the sodium currents become activated, was used to compare the voltage sensitivity of the Na currents in RGCs obtained at various stages of development. This is illustrated in Figure 9, where Va,,* is plotted as a function of age. Between E30 and PlO, there is a 7 mV shift in the activation curve toward more negative values. The change in
318 Skaliora et al. * Development of Excitability in Cat Retinal Ganglion Cells
1 1
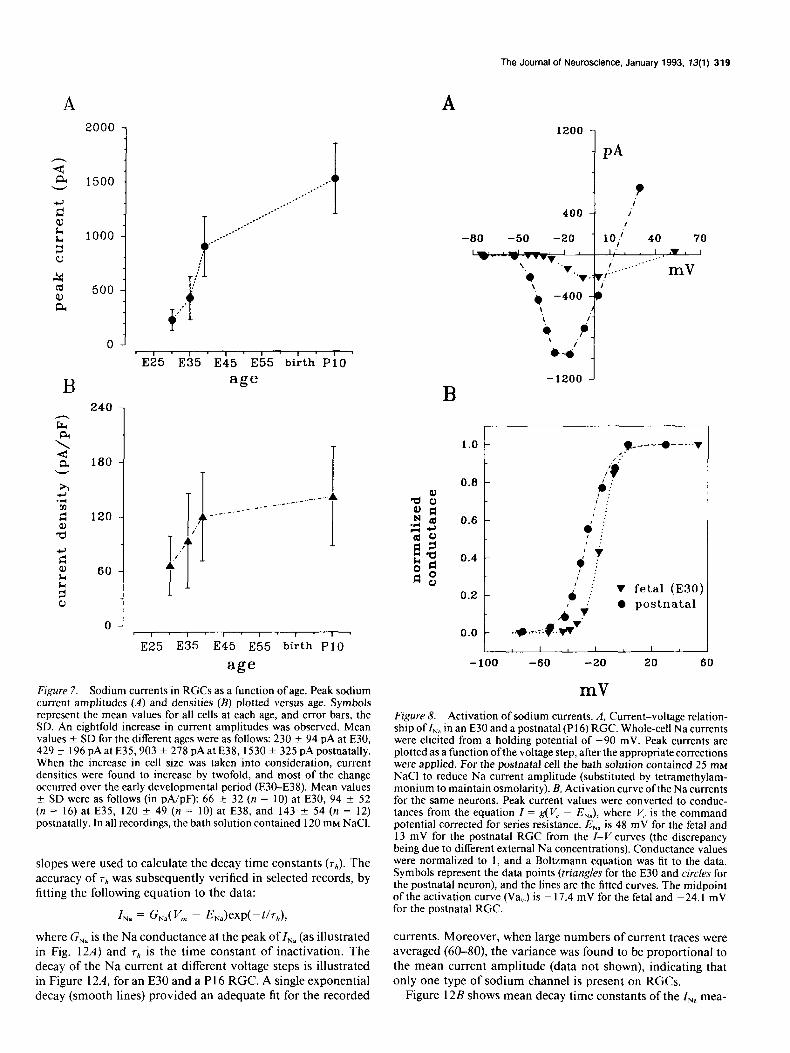
Figure 5. Effects of TTX application on spike generation. Current- clamp records were obtained from an E38 RGC. The top truceillustrates the cell’s response to 20 pA depolarizing current. The middle trace is the response of the same neuron to the same stimulus, but with 300 nM TTX included in the bath solution. The membrane is depolarized by the in.jected current, but the spikes riding on the depolarization have disappeared. After TTX is washed out of the bath (bottom truce), the spike activity is recovered. Time calibration, 500 msec.
the average Va,,? between E30, E35, and E38 is statistically sig- nificant in every case (p < 0.05). After E38, however, this value remains relatively constant.
The steady-state inactivation experiment was performed by varying the amplitude of a 200 msec prepulse from -90 to -20 mV, at 10 or 5 mV steps. The 10 msec test depolarization was always to - 10 mV. Figure 10 illustrates representative current traces obtained with this protocol for an E38 cell. I-Vgraphs were constructed by plotting the peak currents as a function of the prepulse potential (Fig. 1 lA), and a steady-state inactivation curve was constructed and fitted with a Boltzmann equation (Fig. 11B). As indicated in Figure 11 (dotted lines), at -50 mV half of the Na current in this neuron was inactivated. Figure 9 shows the midpoint of inactivation (Vh,) as a function of age for the entire sample of cells. There is a significant (p < 0.01) shift toward more positive potentials with development; Vh,,Z increases from -61 + 3 mV (n = 25) at E30, to -50 f 3.5 mV (n = 23) in postnatal cells (mean + SD).
Kinetics of I,, decay (T,,)
To examine the kinetics of the I,, decay, data were plotted as the logarithm of I,, versus time. The slope of the log current was determined by fitting a regression line through the data, beginning at 1.5 times the time to peak. The values of the current
Fimre 6. Voltage-gated sodium currents in fetal RGCs. In all cases, - - the holding potential was -90 mV and whole-cell Na currents were measured during 25 msec voltage steps to potentials between -50 and +5 mV. The bath solution included 2.5 mM CoCl, to block calcium currents, and in the recording pipette K+ was replaced by Cs+ and TEA to block outward currents. Traces are voltage-clamp recordings from an E30 (A), E35 (B), and E38 (C) neuron after correction for series resistance, leak current, and capacitative transient, as described in Ma- terials and Methods. Note the difference in scale, indicating the increase in current amplitude with age. In all cases, the bath solution contained 120 mM NaCl.
100 - E30
o-
-100 -
-200 -
-300 d 0 5 10
B 400 - E35
o-
UPA)
-400 -
-800 - I I I 1 J
0 5 10
o-
-400 -
-800 -
-1200 -
0 5
msec
The Journal of Neuroscience, January 1993, 73(l) 319
A 1200
PA
t
I
_,.* . ..-
._.’ _..’ ._.*
*:
i
,.: ;
.’ _,’
+
1 ’ 1 ’ I ’ I ’ I ’ 1 ’ E25 E35 E45 E55 birth PlO
B age B
240
2
% ch 180
r
I I ,_,_ - ---.. _ _.- .-. ,_.,-. -‘.- I I( I
1 1
1 1.’
, ; V fetal (E30)
0 postnatal L
t I I I
-100 -60 -20 20 60
I ’ I ’ I ’ 1 ’ IQ 11
E25 E35 E45 E55 birth PlO
age
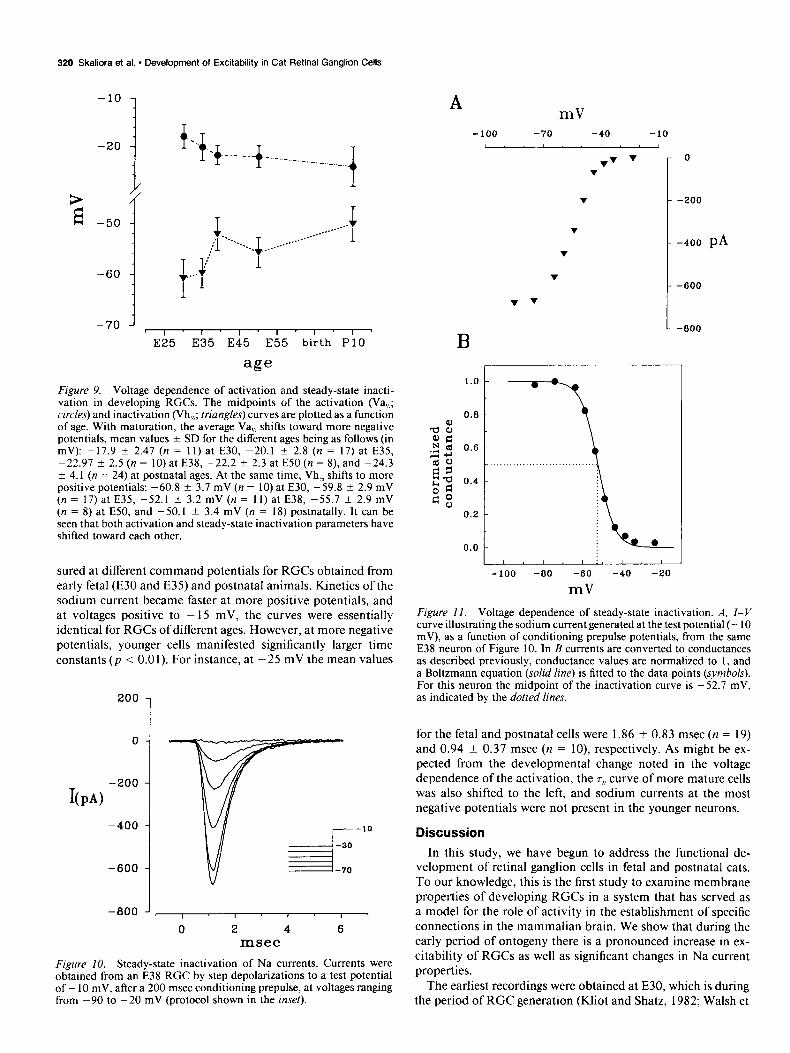
mV Figure 7. Sodium currents in RGCs as a function of age. Peak sodium current amplitudes (A) and densities (B) plotted versus age. Symbols represent the mean values for all cells at each age, and error bars, the SD. An eightfold increase in current amplitudes was observed. Mean values f SD for the different ages were as follows: 230 + 94 pA at E30, 429 + 196 pA at E35,903 + 278 pA at E38, 1530 + 325 pA postnatally. When the increase in cell size was taken into consideration, current densities were found to increase by twofold, and most of the change occurred over the early developmental period (E30-E38). Mean values + SD were as follows (in pA/pF): 66 + 32 (n = 10) at E30, 94 ? 52 (n = 16) at E35, 120 + 49 (n = IO) at E38, and 143 + 54 (n = 12) postnatally. In all recordings, the bath solution contained 120 mM NaCl.
Figure 8. Activation of sodium currents. A, Current-voltage relation- ship of Z,, in an E30 and a postnatal (PI 6) RGC. Whole-cell Na currents were elicited from a holding potential of -90 mV. Peak currents are plotted as a function ofthe voltage step, after the appropriate corrections were applied. For the postnatal cell the bath solution contained 25 rnM NaCl to reduce Na current amplitude (substituted by tetramethylam- monium to maintain osmolarity). B, Activation curve ofthe Na currents for the same neurons. Peak current values were converted to conduc- tances from the equation I = g(V, - I?,,), where V, is the command potential corrected for series resistance. E,, is 48 mV for the fetal and 13 mV for the postnatal RGC from the Z-V curves (the discrepancy being due to different external Na concentrations). Conductance values were normalized to 1, and a Boltzmann equation was fit to the data. Symbols represent the data points (triangles for the E30 and circles for the postnatal neuron), and the lines are the fitted curves. The midpoint of the activation curve (Va,,J is - 17.4 mV for the fetal and -24.1 mV for the postnatal RGC.
slopes were used to calculate the decay time constants (T,J. The accuracy of 7h was subsequently verified in selected records, by fitting the following equation to the data:
where GNa is the Na conductance at the peak of I,, (as illustrated in Fig. 12A) and T,, is the time constant of inactivation. The decay of the Na current at different voltage steps is illustrated in Figure 12A, for an E30 and a P 16 RGC. A single exponential decay (smooth lines) provided an adequate fit for the recorded
currents. Moreover, when large numbers of current traces were averaged (60-80), the variance was found to be proportional to the mean current amplitude (data not shown), indicating that only one type of sodium channel is present on RGCs.
Figure 12B shows mean decay time constants of the I,, mea-
320 Skaliora et al. - Development of Excitability in Cat Retinal Ganglion Cells
-60
-70
‘. ‘.ir -+ . . _ - - -..-..-..-. -.._. _ ._,,_,, f
A mV
-100 -70 -40 -10
T
I ’ I * I ’ I ‘I’ 1 I
E25 E35 E45 E55 birth PlO
age
Figure 9. Voltage dependence of activation and steady-state inacti- vation in developing RGCs. The midpoints of the activation (Va,,>; circles) and inactivation (Vh,,Z; triangles) curves are plotted as a function of age. With maturation, the average Va,,> shifts toward more negative potentials, mean values k SD for the different ages being as follows (in mV): -17.9 k 2.47 (n = 11) at E30, -20.1 k 2.8 (n = 17) at E35, -22.97 + 2.5 (n = 10) at E38, -22.2 f 2.3 at E50 (n = 8) and -24.3 f 4.1 (n = 24) at postnatal ages. At the same time, Vh,,I shifts to more positive potentials: -60.8 k 3.7 mV (n = 10) at E30, -59.8 f 2.9 mV (n = 17) at E35, -52.1 k 3.2 mV (n = 11) at E38, -55.7 -C 2.9 mV (n = 8) at E50, and -50.1 k 3.4 mV (n = 18) postnatally. It can be seen that both activation and steady-state inactivation parameters have shifted toward each other.
0
-200
I(PA)
-400
-600
-10
-800 J, , I ! ,
0 2 4 6
msec
Figure 10. Steady-state inactivation of Na currents. Currents were obtained from an E38 RGC by step depolarizations to a test potential of - 10 mV, after a 200 msec conditioning prepulse, at voltages ranging from -90 to -20 mV (protocol shown in the inset).
B
1.0
0.0
sured at different command potentials for RGCs obtained from early fetal (E30 and E35) and postnatal animals. Kinetics of the sodium current became faster at more positive potentials, and at voltages positive to - 15 mV, the curves were essentially identical for RGCs of different ages. However, at more negative potentials, younger cells manifested significantly larger time constants (p < 0.01). For instance, at -25 mV the mean values
200
1
T
T
T
T .
-200
-400 pA
-600
-800
-100 -00 -60 -40 -20
mV
Figure II. Voltage dependence of steady-state inactivation. A, I-V curve illustrating the sodium current generated at the test potential (- 10 mV), as a function of conditioning prepulse potentials, from the same E38 neuron of Figure 10. In B currents are converted to conductances as described previously, conductance values are normalized to 1, and a Boltzmann equation (solid line) is fitted to the data points (symbols). For this neuron the midpoint of the inactivation curve is -52.7 mV, as indicated by the dotted lines.
for the fetal and postnatal cells were 1.86 & 0.83 msec (n = 19) and 0.94 f 0.37 msec (n = lo), respectively. As might be ex- pected from the developmental change noted in the voltage dependence of the activation, the TV curve of more mature cells was also shifted to the left, and sodium currents at the most negative potentials were not present in the younger neurons.
Discussion
In this study, we have begun to address the functional de- velopment of retinal ganglion cells in fetal and postnatal cats. To our knowledge, this is the first study to examine membrane properties of developing RGCs in a system that has served as a model for the role of activity in the establishment of specific connections in the mammalian brain. We show that during the early period of ontogeny there is a pronounced increase in ex- citability of RGCs as well as significant changes in Na current properties.
The earliest recordings were obtained at E30, which is during the period of RGC generation (Kliot and Shatz, 1982; Walsh et
The Journal of Neuroscience, January 1993, 13(l) 321
A
50 -
o-
-50 -
-100 -
-150 - E30
&PA) -200 -
-600
-600 P16 -1000 J
t I I I I I I I 1
-2 0 2 4 6 6 10 12 14 msec
B
4
1
0
d 0 postnatal (10)
V fetal (19)
T
-40 0 40 80
test potential (mV)
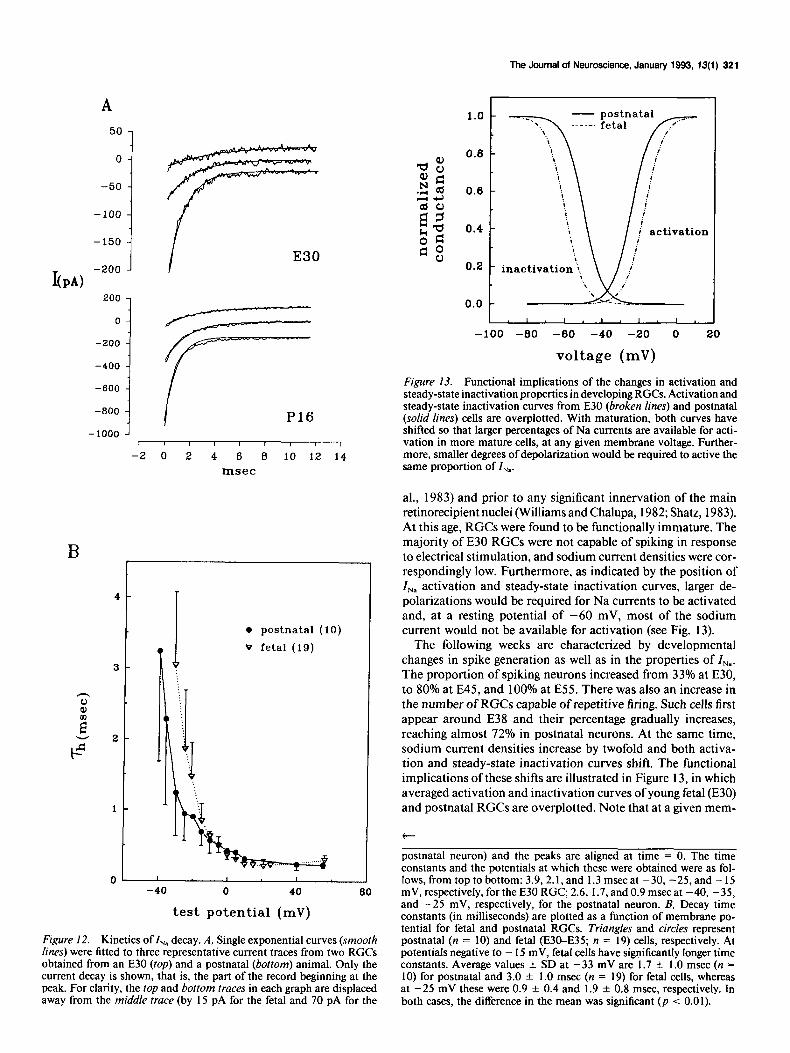
Figure 12. Kinetics of I,, decay. A, Single exponential curves (smooth lines) were fitted to three representative current traces from two RGCs obtained from an E30 (top) and a postnatal (bottom) animal. Only the current decay is shown, that is, the part of the record beginning at the peak. For clarity, the top and bottom traces in each graph are displaced away from the middle trace (by 15 pA for the fetal and IO pA for the
-100 -80 -60 -40 -20 0 20
voltage (mV)
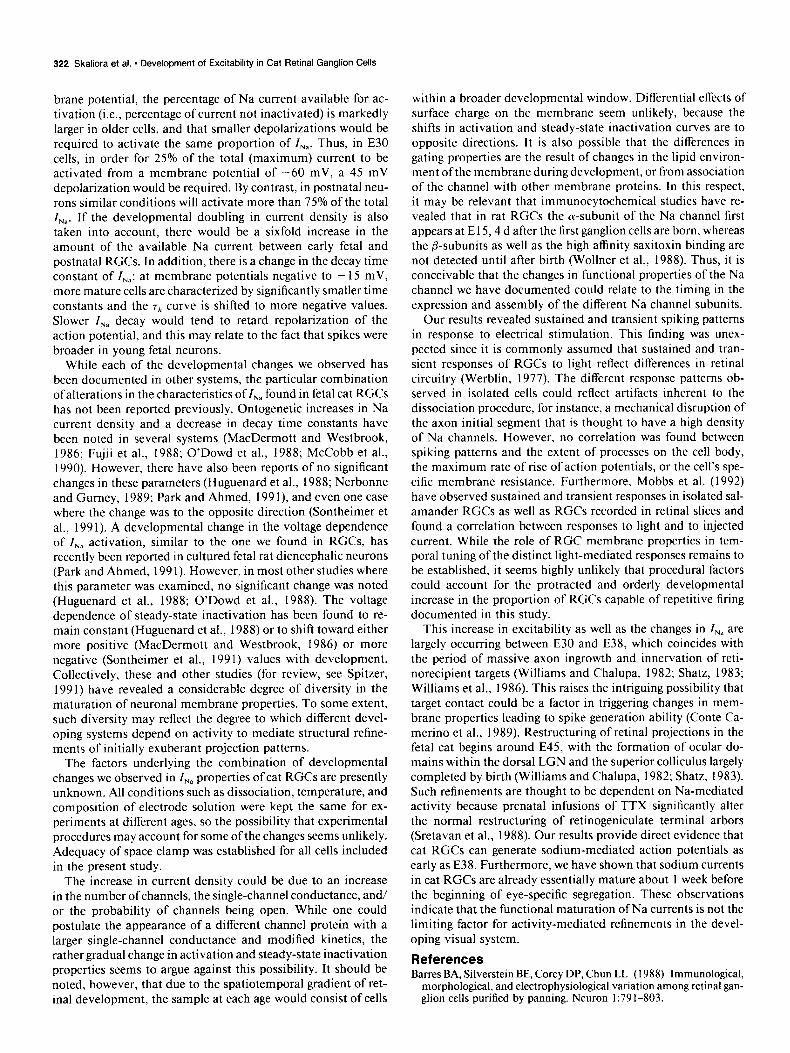
Figure 13. Functional implications of the changes in activation and steady-state inactivation properties in developing RGCs. Activation and steady-state inactivation curves from E30 (broken lines) and postnatal (solid lines) cells are overplotted. With maturation, both curves have shifted so that larger percentages of Na currents are available for acti- vation in more mature cells, at any given membrane voltage. Further- more, smaller degrees of depolarization would be required to active the same proportion of I,,.
al., 1983) and prior to any significant innervation of the main retinorecipient nuclei (Williams and Chalupa, 1982; Shatz, 1983). At this age, RGCs were found to be functionally immature. The majority of E30 RGCs were not capable of spiking in response to electrical stimulation, and sodium current densities were cor- respondingly low. Furthermore, as indicated by the position of I,, activation and steady-state inactivation curves, larger de- polarizations would be required for Na currents to be activated and, at a resting potential of -60 mV, most of the sodium current would not be available for activation (see Fig. 13).
The following weeks are characterized by developmental changes in spike generation as well as in the properties of INa. The proportion of spiking neurons increased from 33% at E30, to 80% at E45, and 100% at E55. There was also an increase in the number of RGCs capable of repetitive firing. Such cells first appear around E38 and their percentage gradually increases, reaching almost 72% in postnatal neurons. At the same time, sodium current densities increase by twofold and both activa- tion and steady-state inactivation curves shift. The functional implications of these shifts are illustrated in Figure 13, in which averaged activation and inactivation curves ofyoung fetal (E30) and postnatal RGCs are overplotted. Note that at a given mem-
t
postnatal neuron) and the peaks are aligned at time = 0. The time constants and the potentials at which these were obtained were as fol- lows, from top to bottom: 3.9,2.1, and I .3 msec at -30, -25, and - 15 mV, respectively, for the E30 RGC, 2.6, 1.7, and 0.9 msec at -40, -35, and -25 mV, respectively, for the postnatal neuron. B, Decay time constants (in milliseconds) are plotted as a function of membrane po- tential for fetal and postnatal RGCs. Triangles and circles represent postnatal (n = 10) and fetal (E30-E35; n = 19) cells, respectively. At potentials negative to - 15 mV, fetal cells have significantly longer time constants. Average values & SD at -33 mV are 1.7 f 1.0 msec (n = 10) for postnatal and 3.0 + 1.0 msec (n = 19) for fetal cells, whereas at -25 mV these were 0.9 + 0.4 and 1.9 ? 0.8 msec, respectively. In both cases, the difference in the mean was significant (p < 0.01).
322 Skaliora et al. - Development of Excitability in Cat Retinal Ganglion Cells
brane potential, the percentage of Na current available for ac- tivation (i.e., percentage of current not inactivated) is markedly larger in older cells, and that smaller depolarizations would be required to activate the same proportion of Z,,. Thus, in E30 cells, in order for 25% of the total (maximum) current to be activated from a membrane potential of -60 mV, a 45 mV depolarization would be required. By contrast, in postnatal neu- rons similar conditions will activate more than 75% of the total I,.,,. If the developmental doubling in current density is also taken into account, there would be a sixfold increase in the amount of the available Na current between early fetal and postnatal RGCs. In addition, there is a change in the decay time constant of I,,: at membrane potentials negative to - 15 mV, more mature cells are characterized by significantly smaller time constants and the 7h curve is shifted to more negative values. Slower I,, decay would tend to retard repolarization of the action potential, and this may relate to the fact that spikes were broader in young fetal neurons.
While each of the developmental changes we observed has been documented in other systems, the particular combination ofalterations in the characteristics of INa found in fetal cat RGCs has not been reported previously. Ontogenetic increases in Na current density and a decrease in decay time constants have been noted in several systems (MacDermott and Westbrook, 1986; Fujii et al., 1988; O’Dowd et al., 1988; McCobb et al., 1990). However, there have also been reports of no significant changes in these parameters (Huguenard et al., 1988; Nerbonne and Gurney, 1989; Park and Ahmed, 199 l), and even one case where the change was to the opposite direction (Sontheimer et al., 199 1). A developmental change in the voltage dependence of I,, activation, similar to the one we found in RGCs, has recently been reported in cultured fetal rat diencephalic neurons (Park and Ahmed, 199 1). However, in most other studies where this parameter was examined, no significant change was noted (Huguenard et al., 1988; O’Dowd et al., 1988). The voltage dependence of steady-state inactivation has been found to re- main constant (Huguenard et al., 1988) or to shift toward either more positive (MacDermott and Westbrook, 1986) or more negative (Sontheimer et al., 1991) values with development. Collectively, these and other studies (for review, see Spitzer, 1991) have revealed a considerable degree of diversity in the maturation of neuronal membrane properties. To some extent, such diversity may reflect the degree to which different devel- oping systems depend on activity to mediate structural refine- ments of initially exuberant projection patterns.
The factors underlying the combination of developmental changes we observed in I,, properties of cat RGCs are presently unknown. All conditions such as dissociation, temperature, and composition of electrode solution were kept the same for ex- periments at different ages, so the possibility that experimental procedures may account for some ofthe changes seems unlikely. Adequacy of space clamp was established for all cells included in the present study.
The increase in current density could be due to an increase in the number ofchannels, the single-channel conductance, and/ or the probability of channels being open. While one could postulate the appearance of a different channel protein with a larger single-channel conductance and modified kinetics, the rather gradual change in activation and steady-state inactivation properties seems to argue against this possibility. It should be noted, however, that due to the spatiotemporal gradient of ret- inal development, the sample at each age would consist of cells
within a broader developmental window. Differential effects of surface charge on the membrane seem unlikely, because the shifts in activation and steady-state inactivation curves are to opposite directions. It is also possible that the differences in gating properties are the result of changes in the lipid environ- ment of the membrane during development, or from association of the channel with other membrane proteins. In this respect, it may be relevant that immunocytochemical studies have re- vealed that in rat RGCs the a-subunit of the Na channel first appears at E 15,4 d after the first ganglion cells are born, whereas the P-subunits as well as the high affinity saxitoxin binding are not detected until after birth (Wollner et al., 1988). Thus, it is conceivable that the changes in functional properties of the Na channel we have documented could relate to the timing in the expression and assembly of the different Na channel subunits.
Our results revealed sustained and transient spiking patterns in response to electrical stimulation. This finding was unex- pected since it is commonly assumed that sustained and tran- sient responses of RGCs to light reflect differences in retinal circuitry (Werblin, 1977). The different response patterns ob- served in isolated cells could reflect artifacts inherent to the dissociation procedure, for instance, a mechanical disruption of the axon initial segment that is thought to have a high density of Na channels. However, no correlation was found between spiking patterns and the extent of processes on the cell body, the maximum rate of rise of action potentials, or the cell’s spe- cific membrane resistance. Furthermore, Mobbs et al. (1992) have observed sustained and transient responses in isolated sal- amander RGCs as well as RGCs recorded in retinal slices and found a correlation between responses to light and to injected current. While the role of RGC membrane properties in tem- poral tuning of the distinct light-mediated responses remains to be established, it seems highly unlikely that procedural factors could account for the protracted and orderly developmental increase in the proportion of RGCs capable of repetitive firing documented in this study.
This increase in excitability as well as the changes in I,, are largely occurring between E30 and E38, which coincides with the period of massive axon ingrowth and innervation of reti- norecipient targets (Williams and Chalupa, 1982; Shatz, 1983; Williams et al., 1986). This raises the intriguing possibility that target contact could be a factor in triggering changes in mem- brane properties leading to spike generation ability (Conte Ca- merino et al., 1989). Restructuring of retinal projections in the fetal cat begins around E45, with the formation of ocular do- mains within the dorsal LGN and the superior colliculus largely completed by birth (Williams and Chalupa, 1982; Shatz, 1983). Such refinements are thought to be dependent on Na-mediated activity because prenatal infusions of TTX significantly alter the normal restructuring of retinogeniculate terminal arbors (Sretavan et al., 1988). Our results provide direct evidence that cat RGCs can generate sodium-mediated action potentials as early as E38. Furthermore, we have shown that sodium currents in cat RGCs are already essentially mature about 1 week before the beginning of eye-specific segregation. These observations indicate that the functional maturation of Na currents is not the limiting factor for activity-mediated refinements in the devel- oping visual system.
References Barres BA, Silverstein BE, Corey DP, Chun LL (1988) Immunological,
morphological, and electrophysiological variation among retinal gan- glion cells purified by panning. Neuron 1:791-803.
The Journal of Neuroscience, January 1993, 13(l) 323
Chalupa LM, White CA (1990) Prenatal development of visual system structures. In: Development of sensory systems in mammals (Cole- man JR, ed), pp 3-60. New York: Wiley.
Constantine-Paton M, Cline HT, Debski E (1990) Patterned activity, synaptic convergence, and the NMDA receptor in developing visual pathways. Annu Rev Neurosci 13: 129-I 54.
Conte Camerino D, De Luca A, Mambrini M, Vrbova G (1989) Mem- brane ionic conductances in normal and denervated skeletal muscle of the rat during development. Pfluegers Arch 413:568-570.
Dubin MW, Stark LA, Archer SM (1986) A role for action-potential activity in the development of neuronal connections in the kitten retinogeniculate pathway. J Neurosci 6: 102 l-l 036.
G’Dowd DK, Ribera AB, Spitzer NC (1988) Development of voltage- dependent calcium, sodium, and potassium currents in Xenopus spi- nai neurons. J Neurosci 8:792-805.
Park CC. Ahmed Z (199 1) Characterization of sodium current in developing rat dienckphalic neurons in serum-free culture. J Neuro- physiol 65:1011-1021.
Shatz CJ (1983) The prenatal development ofthe cat’s retinogeniculate pathway. J Neurosci 3:482499.
Shatz CJ (1990) Competitive interactions between retinal ganglion cells during prenatal development. J Neurobiol 2 1: 197-2 I 1.
Shatz CJ, Kirkwood PA (1984) Prenatal development of functional connections in the cat’s retinogeniculate pathway. J Neurosci 4: 1378- 1397.
Shatz CJ, Sretavan DW (1986) Interactions between retinal ganglion cells during the development of the mammalian visual system. Annu
Fujii S, Ayer RJ, DeHaan RL (1988) Development of the fast sodium current in early embryonic chick heart cells. J Membr Biol 101:209- 223.
Galli L, Maffei L (1988) Spontaneous impulse activity of rat retinal
Horn R, Marty A (1988) Muscarinic activation of ionic currents mea-
ganglion cells in prenatal life. Science 242:90-91. Hamill OP, Marty A, Neher E, Sakmann B, Sigworth FJ (1981) Im-
sured by a new whole-cell recording method. J Gen Physiol 92: 145-
proved patch-clamp techniques for high resolution current recording from cells and cell-free membrane patches. Pfluegers Arch 39 1:85-
159.
100.
Huguenard JR, Hamill OP, Prince DA (1988) Developmental changes in Na+ conductances in rat neocortical neurons: appearance ofa slowly inactivating component. J Neurophysiol 59:778-795.
Kalil RE (1990) The influence of action potentials on the development of the central visual pathway in mammals. J Exp Biol 153:26 l-276.
Kliot M, Shatz CJ (1982) Genesis of different retinal ganglion cell types in the cat. Sot Neurosci Abstr 8:8 15.
Lipton SA, Tauck DL (1987) Voltage-dependent conductances of sol- itary ganglion cells dissociated from the rat retina. J Physiol (Lond) 385:361-391.
MacDermott AB, Westbrook GL (1986) Early development of volt- age-dependent sodium currents in cultured mouse spinal cord neu- rons. Dev Biol I 13:3 17-326.
Maffei L, Galli-Resta L (1990) Correlation in the discharges of neigh- boring rat retinal ganglion cells during prenatal life. Proc Nat1 Acad Sci USA 87:286 1-2864.
McCobb DP, Best PM, Beam KG (1990) The differentiation of ex- citability in embryonic chick limb motoneurons. J Neurosci 10:2974- 2984.
Meister M, Wong ROL, Baylor DA, Shatz CJ (1991) Synchronous bursts of action potentials in ganglion cells of the developing mam- malian retina. Science 252:939-943.
Meyer RL (1983) Tetrodotoxin inhibits the formation of refined ret- inotopography in goldfish. Devel Brain Res 6:293-298.
Mobbs P, Everett K, Cook A (1992) Signal shaping by voltage-gated currents in retinal ganglion cells. Brain Res 574:217-223.
Nerbonne JM, Gurney AM (1989) Development of excitable mem- brane properties in mammalian sympathetic neurons. J Neurosci 9: 3272-3286.
Rev Neurosci 9: 17 l-207. Shatz CJ, Stryker MP (1988) Prenatal tetrodotoxin infusion blocks
segregation of retinogeniculate afferents. Science 242:87-89. Skaliora I, Scobey RP, Chalupa LM (1990) Development of excit-
ability in dissociated cat retinal ganglion cells. Sot Neurosci Abstr 16:464.
Skaliora I, Liets LC, Scobey RP, Chalupa LM (1991) Development of membrane currents in dissociated retinal ganglion cells of the cat. Sot Neurosci Abstr 17: 186.
Sontheimer H, Ransom BR, Cornell BA, Black JA, Waxman SG (I 99 1) Na(+)-current expression in rat hippocampal astrocytes in vitro: al- terations during development. J Neurophysiol 65:3-19.
Spitzer NC (1991) A developmental handshake: neuronal control of ionic currents and their control of neuronal differentiation. J Neu- robiol 22:659-673.
Sretavan DW. Shatz CJ. Strvker MP (1988) Modification of retinal ganglion ceil axon morphology by prenatal infusion of tetrodotoxin. Nature 336:46847 1.
Stryker MP, Harris WA (1986) Binocular impulse blockade prevents the formation of ocular dominance columns in cat visual cortex. J Neurosci 6:22 17-2 133.
Walsh C, Polley EH, Hickey TL, Guillery RW (1983) Generation of cat retinal ganglion cells in relation to central pathways. Nature 302: 611-614.
Werblin FS (1977) Regenerative amacrine cell depolarization and for- mation of on-off ganglion cell response. J Physiol (Lond) 264:767- 785.
Williams RW, Chalupa LM (1982) Prenatal development of retino- collicular projections in the cat: an anterograde tracer transport study. J Neurosci 2:604-622.
Williams RW, Bastiani MJ, Lia B, Chalupa LM (1986) Growth cones, dying axons, and developmental fluctuations in the fiber population of the cat’s optic nerve. J Comp Neurol 246:32-69.
Wollner DA, Scheinman R, Catterall WA (1988) Sodium channel expression and assembly during development of retinal ganglion cells. Neuron 11727-737.


