Embed Size (px)
Citation preview

Preserving Neural Function under Extreme ScalingHermann Cuntz1,2,3*, Friedrich Forstner1, Bettina Schnell1,4, Georg Ammer1, Shamprasad Varija Raghu1,5,
Alexander Borst1
1 Department of Systems and Computational Neurobiology, Max Planck Institute of Neurobiology, Martinsried, Germany, 2 Institute of Clinical Neuroanatomy, Goethe
University, Frankfurt/Main, Germany, 3 Ernst Strungmann Institute for Neuroscience in Cooperation with Max Planck Society, Frankfurt/Main, Germany, 4 Department of
Biology, University of Washington, Seattle, Washington, United States of America, 5 Neuroscience Research Partnership, Biopolis, Singapore
Abstract
Important brain functions need to be conserved throughout organisms of extremely varying sizes. Here we study thescaling properties of an essential component of computation in the brain: the single neuron. We compare morphology andsignal propagation of a uniquely identifiable interneuron, the HS cell, in the blowfly (Calliphora) with its exact counterpart inthe fruit fly (Drosophila) which is about four times smaller in each dimension. Anatomical features of the HS cell scaleisometrically and minimise wiring costs but, by themselves, do not scale to preserve the electrotonic behaviour. However,the membrane properties are set to conserve dendritic as well as axonal delays and attenuation as well as dendriticintegration of visual information. In conclusion, the electrotonic structure of a neuron, the HS cell in this case, is surprisinglystable over a wide range of morphological scales.
Citation: Cuntz H, Forstner F, Schnell B, Ammer G, Raghu SV, et al. (2013) Preserving Neural Function under Extreme Scaling. PLoS ONE 8(8): e71540. doi:10.1371/journal.pone.0071540
Editor: Maurice J. Chacron, McGill University, Canada
Received April 26, 2013; Accepted June 28, 2013; Published August 19, 2013
Copyright: � 2013 Cuntz et al. This is an open-access article distributed under the terms of the Creative Commons Attribution License, which permitsunrestricted use, distribution, and reproduction in any medium, provided the original author and source are credited.
Funding: The authors have no funding or support to report.
Competing Interests: The authors have declared that no competing interests exist.
* E-mail: [email protected]
Introduction
Intuition from simple cable theory tells us that smaller neurons
should have larger input resistances, faster integration times and
be altogether electrically more compact (e.g. [1]). However, the
brains of smaller organisms which consist of correspondingly
smaller cells (e.g. [2–6]) often implement very much the same
computations and functions as their larger counterparts. Since
brain tissue is energetically expensive to maintain [7–9] the
question arises why brain evolution did not lead to more compact
brains even in larger organisms? How does the single neuron cope
with the electrotonic changes due to differences in size? Would a
neuron compromise material costs that are known to be otherwise
instrumental in determining dendrite structure [10–12] to adjust
its shape to preserve a particular computation? To address these
questions the concept of conservative scaling may be useful (e.g.
[3,13]). In such a setting an invariance preserving important
electrotonic properties rather than anatomical proportions could
result in a conservation of dendritic integration features such as
relative conduction delays and non-linear interactions of synaptic
currents in the dendrite.
Here, we address these questions in a circuit of the fly visual
system for which both the function and the underlying biophysical
mechanisms are well understood at the cellular and the network
level: Tangential Cells (LPTCs) of the third visual neuropil, the
Lobula Plate, form a circuitry involved in optic flow calculations.
By pooling of inputs from presynaptic elementary motion detectors
and cross-talk between LPTCs they compute large field visual
motion features required for the fly’s course control [14]. In a
number of electrophysiology and modelling studies on Calliphora
LPTCs, their predominantly passive electrotonic features [15–17]
were characterised and linked to their function as large-field signal
integrators: They were shown to average out spatial structure in
the motion image [18], to communicate signal features selectively
to other LPTCs (e.g. [19,20]) and to compartmentalise the signals
between their dendrites and axons [21–23]. More recently, LPTCs
have also become amenable to intracellular electrophysiological
analysis in Drosophila [24,25] revealing surprisingly conserved
functionality and visual responses. This opens up the opportunity
to compare both electrophysiology and shape of an identified
neuron with its exact homolog in two flies of fundamentally
different sizes (Figure 1A), with a scaling factor of about four in
each dimension. LPTCs are the ideal subject to study the scaling
property of one particular neuron since each LPTC is individually
identifiable due to the high degree of constancy in receptive field,
morphology, location within the Lobula Plate and visual response
properties [26,27].
In this study we focus particularly on a subset of LPTCs, the
Horizontal System (HS) cells, which respond selectively to
horizontal large-field motion. Their membrane potential responds
in a graded direction-selective manner, i.e. it depolarises during
front-to-back visual motion stimulation and hyperpolarises when
stimulated in the opposite direction. Three individual HS cells
exist in each of the two optic lobes of the fly brain. They are
named according to their position within the Lobula Plate, with
HSN (Northern) covering the dorsal, HSE (Equatorial) the
intermediate and HSS (Southern) the ventral parts, respectively
[26] (Figures 1B and C show the HSN and HSE in Calliphora and
Drosophila, respectively). In the following, we use electrophysiolog-
ical and morphological data in combination with computational
models to quantitatively assess the scaling principles of HS cells in
both species.
PLOS ONE | www.plosone.org 1 August 2013 | Volume 8 | Issue 8 | e71540

Materials and Methods
Reconstructions and anatomyCalliphora cells were filled intracellularly using sharp electrodes
with Alexa 488 [28] for the three dimensional reconstructions. In
Drosophila, a Gal4 driver (NP0282) driving expression specifically in
HSN and HSE in both lobes was used (Figure 1C) [25,29].
Reconstructions of HS dendrites (see overview in Figure S1) were
done using custom-made software in Matlab (The Mathworks,
Inc.) and exported to our software package that is freely available
for download (the TREES toolbox, www.treestoolbox.org)
[10,30]. Reconstructions are available on the TREES toolbox
website and at www.neuro.mpg.de/30330/
borst_modelfly_downloads. All further analyses and models were
performed using these tools. Reconstruction of the axons was not
possible in Drosophila HS cells due to co-localisation of other
labelled cells in the NP0282 driver line. One axonal reconstruction
was obtained using intracellular injection of a fluorescent dye (see
below) and was appended to all Drosophila dendrites for
electrotonic analysis. Combined spanning fields of HSE and
HSN cells provided good context clues for the Lobula Plate
contours (confirmed with background stains).
Drosophila electrotonic analysisWhole cell patch-clamp recordings were performed as described
previously [24,25]. Briefly, flies were anaesthetized on ice and
waxed on a Plexiglas holder. A small window was cut into the
cuticle on the backside of the head and a glass electrode filled with
collagenase (Collagenase IV, Gibco, 0.5 mg/ml in extracellular
saline) was used to weaken the perineural sheath and expose the
somata of LPTCs. Somata were approached with a patch
electrode (7–10 MV resistance, thin wall) filled with intracellular
solution (as in [31] containing an additional 30 mM Alexa Fluor
568 hydrazide-Na (A-10441, Molecular Probes) adjusted to pH
7.3). Signals were recorded on a BA-1S Bridge Amplifier (npi
electronics, Tamm, Germany), low-pass filtered at 3 kHz, and
Figure 1. Morphological analysis of Drosophila vs. Calliphora HS cell dendrites. (A) Comparison of size between the blowfly (Calliphora) andthe fruit fly (Drosophila); ruler has mm markings. (B) Superposition of the HSN (green) and the HSE (red) in a Lobula Plate of Calliphora. On the rightside, a rendering of the full reconstructions of both cells (HSN – green and HSE – blue) within the marked boundaries of the reconstructed LobulaPlate is depicted. (C) Similar setting for the HSN and HSE cells (both are green since they both express GFP) in a brain of Drosophila withcorresponding reconstructions (HSN – red and HSE – black) to the right. (D) Power law between branch point and total length densities, a power of 1/2 being indicative of optimal wiring for planar dendrites [33]. (E) Absolute scaling between total surface and total length. Crosses indicate populationmean and standard deviation.doi:10.1371/journal.pone.0071540.g001
Table 1. Scaling of global anatomical features.
Size parameters Calliphora Drosophila scalelinearscale
body length (mm) 11 2.6 4.2 4.2
brain volume (mm3) 1.22 0.015 81.3 4.3
Lobula Plate area (mm2) 0.18 0.009 20.0 4.5
(personal communication, Christoph Kapfer).doi:10.1371/journal.pone.0071540.t001
Preserving Neural Function under Extreme Scaling
PLOS ONE | www.plosone.org 2 August 2013 | Volume 8 | Issue 8 | e71540

digitised at 10 kHz via a D/A converter (PCI-DAS6025,
Measurement Computing, Norton, MA) with Matlab. Note that
electrophysiological and morphological data were not obtained
from the same individuals. Input resistance and membrane time
constant were measured in responses to 36 step currents of
hyperpolarizing 50 pA each, 30 seconds and 10 minutes after
break-in. Membrane time constants were obtained by linear
regression on a semi-logarithmic plot corresponding to a single
exponential fit to the voltage response, which yielded good results.
Both input resistance and membrane time constant increased
during the recording period from 176646 to 205645 MV and
from 4.3 6 1.4 to 4.961.3 ms respectively within 10 minutes
(numbers are mean and standard deviation). While the quality of
the seal increases with time, the quality of the recording decreases
because of clogging of the electrode. It was therefore not clear
which values to use but the differences were small in comparison to
the overall variance in experimental values. The later measure-
ments were used for averaged values. Since recordings were
obtained in current clamp and the membrane potential measure-
ments were relatively noisy even without any stimulation, we were
unable to accurately estimate and compensate for the series
resistance. However, our values for the input resistance are in good
agreement with data for VS cells in Drosophila obtained in voltage
clamp [32], suggesting that errors in measurement are minor.
Morphological modelTo check that Drosophila HS cells obeyed optimal wiring
constraints we first verified the scaling properties predicted by
these constraints (Figure 1D) [33]. Further we performed the
complete analysis as previously for Calliphora HS cells [28]
Figure 2. Morphological model to study the scaling properties of HS cells. (A) Model error compared to standard deviation of experimentalmeasures as a function of the balancing factor bf, the one parameter in the morphological model. To the right, sample model dendrites (lightercolours) with their respective real counterparts for Drosophila HSE (black) and HSN (red) and Calliphora HSE (blue) and HSN (green). (B) Diameterhistograms for all cell types (same colours as in A) and best fits (grey lines) using the quadratic taper fit from our model [12]. Lower panel showsscaled diameters of Drosophila cells in comparison to Calliphora cells. To the right, sample Calliphora and Drosophila HSE dendrites comparing realand modelled diameters (in lighter colours).doi:10.1371/journal.pone.0071540.g002
Preserving Neural Function under Extreme Scaling
PLOS ONE | www.plosone.org 3 August 2013 | Volume 8 | Issue 8 | e71540
involving the generation of a morphological model based on
optimal wiring principles (see Results). Briefly, dendrite spanning
fields were obtained for each reconstructed HS dendrite delimiting
the area covered by the dendrite such that each point in the
dendrite spanning field is within a threshold distance away from
the dendritic tree. Target points were then distributed randomly
within the spanning fields and connected to dendritic structures
satisfying two wiring costs: (1) the total dendrite length should be
short and (2) the length of all paths along the dendrite from any
point to the root should be short. The second cost was weighted
with a balancing factor bf against the first cost. We verified that our
morphological model was useful also for Drosophila dendrites using
a similar model parameter value bf as for Calliphora HS dendrites.
Only few minor adjustments were required in the modelling
procedure accounting for the differences in scale: e.g. a finer
resolution was used to estimate the dendrite spanning fields.
Morphological model databaseThe corresponding database of synthetic dendrites used to
studying the electrotonic scaling properties of HS cells were
obtained using target point numbers ranging from 625 to 2,300
and scaling down the surface area of a Calliphora HS dendrite
between 16 and 4.56. A model for diameter tapering was
obtained as discussed previously [12] based on requirements for
synaptic democracy. Two sets of parameters (consisting of a
terminal branch diameter value and a scaling factor) were
obtained by fitting the data from real reconstructions for Drosophila
and Calliphora HS cell dendrites, respectively. All algorithms are
available in the Matlab software package (the TREES toolbox,
www.treestoolbox.org) [10,30].
Results
Morphological analysisFirst, we studied the global scaling properties between the two
species of flies. Selected size parameters (Table 1) scaled linearly
with a factor of about 4 indicating that isometric rather than
allometric scaling takes place regarding the body shape thereby
conserving the general anatomical proportions [34,35]. In
particular, the area of the Lobula Plate (see outlines in
Figure 1BC) that is spanned by the HS cells seemed to be scaled
linearly with the body length and its shape was well preserved. It is
worth noting that HSN dendritic fields cover a similar percentage
of the Lobula Plate in Calliphora and Drosophila, whereas the HSE
dendritic field covers a larger percentage in Drosophila than in
Calliphora. We have previously shown that dendrite morphology of
LPTCs in fact depends most strongly on the area they span [28].
This indicates that some aspects of LPTC morphology should be
conserved and should scale linearly with the Lobula Plate size. To
make quantitative assertions, however, full morphological LPTC
reconstructions were required consisting of connected cylinders
representing the tree structure. Such reconstructions were
obtained and discussed previously for the Calliphora HS cells [28]
(Figure 1B). To quantitatively assess differences in morphology
and signal propagation between HS cells of Calliphora with those of
Drosophila, we acquired the corresponding data from fruit flies.
Studying Drosophila allows the usage of genetic techniques. We
therefore obtained image stacks from flies using the Gal4 driver
line NP0282 to express GFP bilaterally in HSN and HSE cells
[25,29] (Figure 1C). The dendrite reconstructions were obtained
from these image stacks using custom-made Matlab code as done
previously for the Calliphora HS cells (see Methods and Figure S1).
A major determinant of dendritic shape is a strive for
minimising wiring costs and conduction times [10–12,36–38]. It
was previously shown that optimal wiring constraints account for
inner branching features in the case of Calliphora LPTCs [12,28].
Assuming optimal wiring principles, the scaling behaviour of
dendrites can be predicted in terms of dendrite length, number of
synapses, number of branch points and the surface or volume that
a dendrite spans [33]. A 1/2 power between branch point density
and dendrite cable density is expected for planar dendrites with a
precise calculation of a tight lower bound for the optimal dendritic
length (Figure 1D, straight line). Both Drosophila and Calliphora HS
cell dendrites were strictly constrained by this equation with the
best fit of 0.49 for the power relation between cable density and
branch point density (Figure 1D). As expected, the overall density
of dendrites was much larger in the smaller Drosophila dendrites.
Beyond this relation describing the scaling behaviour in terms of
optimal wiring it is useful to compare the absolute dendritic length
with the surface covered by the dendrite (Figure 1E). For this
relation no prediction in terms of optimal wiring is known. A linear
relation (power of 1) would indicate that the cable density is similar
in both species, while a power of 1/2 would correspond to a simple
isometric scaling without a change in dendrite complexity.
Interestingly, the fitted power was 0.33 indicating that the larger
dendrites of Calliphora HS cells were consistently less complex than
their smaller counterparts. This result is particularly counterintu-
itive since Drosophila has a much smaller number of facets in the
eye with 700 in Drosophila [39] vs. 4,500 in Calliphora [40]. Since
the underlying neural circuitry is subdivided and organised into
retinotopic cartridges corresponding to the ommatidial layout
[41], Drosophila HS cells should in fact receive fewer inputs to be
integrated within their receptive field.
A morphological model for scalingIn order to understand the change of morphological and
electrotonic properties due to scaling we first developed a model
that describes the morphology with a few parameters. With the
possibility to scale continuously between Drosophila and Calliphora
dendrites the consequences of morphological scaling can then be
studied independently from each other while keeping the other
features constant. We have recently proposed a morphological
model capable of generating synthetic dendrites that match well
those of Calliphora LPTCs and many other neurons [10,12,28].
The model is based on the assumption that a dendrite strives to
connect optimally to its inputs that are distributed in space. In the
case of LPTCs, inputs are retinotopically organised elementary
motion detectors covering the area of the Lobula Plate. Target
points that are distributed within the contours of a real LPTC are
connected while minimising cable length and path lengths along
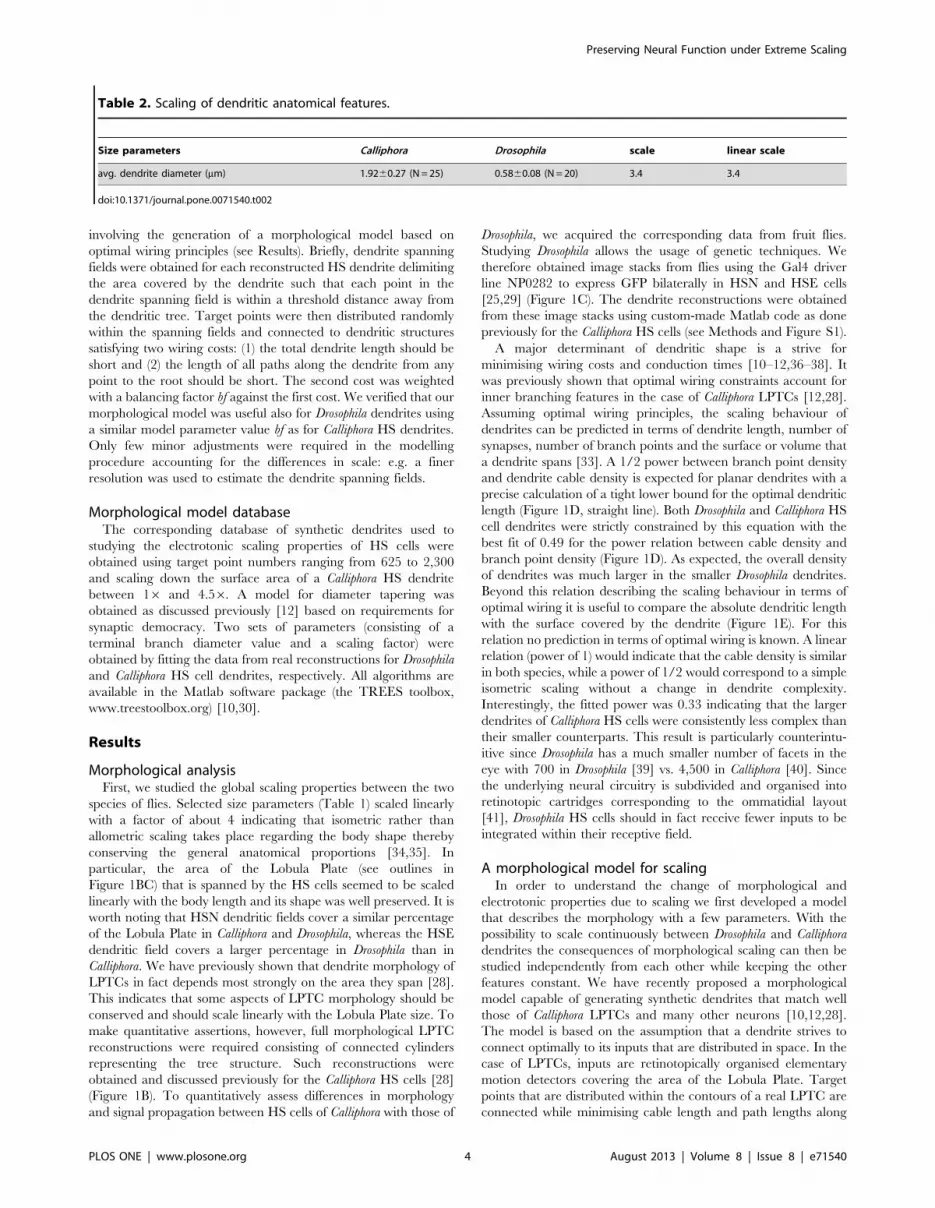
Table 2. Scaling of dendritic anatomical features.
Size parameters Calliphora Drosophila scale linear scale
avg. dendrite diameter (mm) 1.9260.27 (N = 25) 0.5860.08 (N = 20) 3.4 3.4
doi:10.1371/journal.pone.0071540.t002
Preserving Neural Function under Extreme Scaling
PLOS ONE | www.plosone.org 4 August 2013 | Volume 8 | Issue 8 | e71540

the tree toward the root [28]. A cost for long path lengths is
weighted in comparison to the cost of cable length by one
parameter of the model, the balancing factor bf. The same
procedure was previously performed on Calliphora dendrites [28]
(see Methods). When branching features (total length, branch
order and path length distributions) of the resulting model
Figure 3. Signal conduction and dendritic integration in Drosophila and Calliphora HS cells. (A) Experimental input resistance andmembrane time constant measurements in Drosophila HS cells (dark grey 210 min.; light grey 230 sec. after breaking into the cell). The latermeasurements were used for estimating average values since the patch is more stable then. Two model parameter sets (black and orange) were usedin the further study. (B) Morphoelectrotonic transforms of four sample cells where electrotonic lengths are mapped onto the segments of thebranched structures [42] (orange box: second parameter set for Drosophila). (C) Same four cells as in B but with the amplitude decay from thedendrite root mapped onto the y-axis of the cells (top panels) and delays from the dendrite root (middle panels) and from selected dendrite tips(bottom panels). The Drosophila HSN cell results are shown for the second parameter set in orange.doi:10.1371/journal.pone.0071540.g003
Preserving Neural Function under Extreme Scaling
PLOS ONE | www.plosone.org 5 August 2013 | Volume 8 | Issue 8 | e71540

dendrites were linearly combined and compared to the standard
deviation in the experimental measures, a small parameter value
bf = 0.1 represented a good fit in Drosophila as well as in Calliphora
(Figure 2A, see also sample dendrites and their corresponding
model counterparts). The comparably low value for bf (the typical
range is between 0.1 in LPTCs and 0.85 in dentate gyrus granule
cells for example) seems to discard fast conduction times in favour
of short cable length and reduces the effective electrotonic
compartmentalisation in favour of more even integration of
signals throughout the dendrite [10].
Next, we studied the scaling property of diameters while further
confining our model. Beyond the cable length and dendrite
complexity, cable diameters play an important role for conveying
electrical signals. While average dendrite diameter values (see
Table 2) scaled isometrically with the rest of the global fly
measures, diameter distributions were slightly different (Figure 2B,
top and bottom panel). When dendrite diameters were scaled to
have the overall same average diameter, a higher proportion of
thin Drosophila dendrites was revealed compared to a higher
proportion of medium size diameters for Calliphora counterparts. A
quadratic diameter taper was previously shown to optimise
synaptic current transfer democracy in LPTCs [12] and a method
exists for mapping diameters onto a tree structure following the
corresponding rules of diameter tapering. Beyond reproducing the
diameter taper observed in Calliphora LPTCs the method generates
good diameter mappings for a number of other dendrites [10,30].
The quadratic diameter taper is parameterised with a parameter
for the smallest dendrite tip diameter and a scaling factor
determining a neuron’s overall leak [12]. To compare diameter
values between Calliphora and Drosophila dendrites we obtained the
best fits for these two parameters in the two populations of
dendrites. Parameter sets reproducing the diameter distributions
were obtained and validated (Figure 2B). This procedure allows us
to manipulate diameter values of the morphology using the two
different diameter mapping methods as well as a smooth transition
between the two. In summary, the morphology of both types of
HS cells are essentially scaled versions of each other following
similar branching principles but Drosophila HS cells are surprisingly
more complex than Calliphora HS cells.
Designing the passive electrotonic modelNext we studied the electrotonic properties of HS cells to
determine the following parameters for the corresponding
compartmental models: the specific membrane resistance Rm, the
specific axial resistance Ra, and the specific membrane capacitance
Cm. We determined input resistance and membrane time constant
in electrophysiological intracellular recordings (Table 3; see
Methods). The measured membrane time constants were short
in both species, but about 2.36 longer in Drosophila (4.9 ms) than
in Calliphora (2.1 ms). The measured input resistances were much
higher (,506) in Drosophila HS cells (205645 MV instead of 4–
5 MV in Calliphora). A common assumption is that the specific
membrane capacitance is close to Cm = 1mF/cm2. The specific
membrane resistance Rm is then fully determined when the
measured membrane time constant is known. This is the case since
t = Rm ? Cm corresponding to the membrane time constant for a
current injection in an infinite cable is valid for current injections
in complex electrotonic models of neurons including the ones
tested here. For Calliphora HS cells, a model was selected that
corresponding to the measured membrane time constant of 2.1 ms
had Rm = 2,100 Vcm2 and to fit the input resistance Rin required
Ra = 100 Vcm. This is in agreement with previously measured
parameters [17]. The Drosophila HS cell electrotonic model has not
yet been studied and we performed meticulous intracellular
recordings for which experimental Rin and t are plotted in
Figure 3A. With Calliphora HS cell membrane parameters,
Drosophila HS cells exhibit an input resistance of about 40 MV.
To obtain realistic input resistance values in the model, Cm was
required to be very small and Ra very large even considering that
recordings in Drosophila were performed in the soma whereas
Calliphora input resistances measures were performed in the axon.
We considered two model parameter sets both with
Rm = 8,166 Vcm2 and Cm = 0.6 mF/cm2 but with different axial
resistances of Ra = 400 Vcm in a model with realistic axial
resistance but with low input resistance and with Ra = 900 Vcm
in a model with very high axial resistance but corresponding to the
average experimental input resistance (Figure 3A black and orange
dots). Cm = 0.6 mF/cm2 and Ra = 400 Vcm are at the boundaries of
typically observed values in invertebrates and therefore within the
realistic range (see summarising table 4 in [17].
Dendritic integration in the electrotonic modelsSince the primary computation in LPTC dendrites is the
integration of local motion information, dendritic integration
properties of Calliphora and Drosophila electrotonic HS cell models
might reflect the similarity in function. Figure 3B shows
morphoelectrotonic transforms [42] of four representative mor-
phologies, one for each HS cell type. Instead of showing metric
length relations for the individual segments of the branched
structures, this representation maps electrotonic length onto the
respective segments. Strikingly, in this representation, HS cells of
Drosophila exhibit very similar proportions and overall size as HS
cells of Calliphora. The summed electrotonic lengths were
remarkably similar (Calliphora: 23.663.8 L; Drosophila: 2163.8 L).
If anything, this similarity was increased when considering the
more unrealistic parameter set 2 that described the experimental
data better. Consequently dendritic integration properties affect-
ing synaptic democracy were well conserved. Synaptic democracy
in amplitude as expressed in the current transfer between the
dendrite root and the rest of the neuron was qualitatively identical
between Calliphora and Drosophila (Figure 3C). Also, temporal
synaptic democracy as expressed by the temporal delays between
dendrite root or dendrite tip and the rest of the neuron (Figure 3C)
was similar but slightly scaled in Drosophila because of the
difference in the membrane time constant. Again, these similarities
were only affected slightly when the alternative set of passive
membrane properties was used for the Drosophila electrotonic
model (Figure 3C, orange).
To test how robust these properties were with morphological
changes we designed a morphological model with variable branch
point numbers and dendrite surface areas. To do this we selected
one sample dendrite contour from a Calliphora HSE and
generated synthetic morphologies using the method described
above but varying both the number of target points and the scaling
factor for the surface area. These synthetic dendrites were
appended to either a Calliphora or a Drosophila axon (Figure 4A).
Note that the only differences between a Calliphora neuron and a
Table 3. Electrophysiological measures.
Calliphora Drosophila
Input resistance, Rin (MV) 4.9562.25 (N = 5) 205645 (N = 14)
Membrane time constant, T(ms)
2.1 (N = 5) 4.961.3 (N = 14)
Data for Calliphora are from [17].doi:10.1371/journal.pone.0071540.t003
Preserving Neural Function under Extreme Scaling
PLOS ONE | www.plosone.org 6 August 2013 | Volume 8 | Issue 8 | e71540

Drosophila neuron were therefore given by (1) the appended axons,
(2) the diameters mapped onto the dendrites and (3) the passive
membrane properties. Summed electrotonic length measures for
this database of morphological models (Figure 4B) showed that the
passive membrane properties are indeed selective for the particular
overall morphology. In conclusion however, dendritic integration
properties are largely unaffected by the scaling procedure and
changes in passive membrane properties are helpful to further
stabilise the electrotonic skeleton.
Integration of visual responses in HS cellsThe model can then be used to study the responses to visual
stimulation of HS cells in a comparative way between Calliphora
and Drosophila. We focused here on the integration of large-field
visual inputs that have been extensively studied in Calliphora HS
cells [16]. As mentioned above, the dendritic arrangement of HS
cells is retinotopic and the Ca2+ distribution within the dendrites
reproduces the motion image in the visual field [43]. One function
of the HS cell dendrite is to integrate democratically the motion
Figure 4. Electrotonic analysis of a morphological model for scaling HS cells. (A) Database of models generated by pairing either a sampleCalliphora (blue box) or a sample Drosophila HSE axon (black box) to a synthetic dendrite obtained from a sample Calliphora HSE dendrite contourbut scaled in overall size (surface) and in complexity (number of branch points). Upper left (blue box) and lower right (black box) model dendritescorrespond to Calliphora and Drosophila dendrite measures respectively. (B) Corresponding to the morphological model databases in A, totalelectrotonic length is shown for Calliphora (left) and Drosophila (right) morphological models. Models with realistic morphologies for Calliphora (bluebox) and Drosophila (black box) are in the same range but scaling surface area or number of branch points changes these measures.doi:10.1371/journal.pone.0071540.g004
Preserving Neural Function under Extreme Scaling
PLOS ONE | www.plosone.org 7 August 2013 | Volume 8 | Issue 8 | e71540

vectors present in the individual parts of the visual field and to
smooth out irregularities due to textures in the moving
background in both space and time [18].
In order to simulate visual responses we distributed a total
synaptic conductance in the terminal branches of the dendrites
that corresponds to the total input conductance of the cell as
derived from visual stimulation recordings in Calliphora HS cells
[15]. Since the HS cell membrane potential responds to visual
stimulation in a graded manner, simulations using passive
electrotonic models produced good results. Synaptic conductances
of about 9 pS6577 = 5.2 nS were required in the Drosophila HS
cell model compared to about 900 pS6278 = 250 nS in the
Calliphora HS cell model (Figure 5, top panels) and achieved
voltage responses to large-field visual stimulation of about 5 mV at
the electrode location (in the axon or the soma) for both cells. This
indicates that the amplitudes of synaptic conductance indeed
match the input resistance and therefore that the passive
membrane properties of the cell match the synaptic conductance.
The voltage distributions throughout the cells were similar;
compare in particular the dendritic tip where the synapses were
located (Figure 5, cyan dots), the dendrite root where the signals
are integrated (Figure 5, orange dots) and the axon tip where
signals are conveyed to neurons that descend to the thoracic
ganglia involved in flight muscle control (Figure 5, pink dots).
Finally, we studied how dendritic integration averages out
modulations in the visual input due to textures in the visual
background. We inserted sinusoidally modulated synaptic con-
ductances along the dendrites of the model HS cells reflecting
visual inputs due to a moving spatial grating. The phase was
proportional to the x-coordinate for each synaptic input and the
sinusoidal input covered the dendritic span with exactly one
period. In both Calliphora and Drosophila model cells, the
modulations vanished at the level of the dendrite root and the
axon tip (Figure 5, bottom panels; see also movie S1). In
conclusion, also the visual response properties between Calliphora
and Drosophila HS cells were qualitatively similar throughout the
neuron in the electrotonic compartmental models.
Discussion
In recent years comparison of Drosophila and Calliphora Lobula
Plate circuits have revealed close similarities in anatomical and
computational features [24,25,44,45]. We focused on one type of
neuron, the HS cell, to study specifically to which extent it is
modified to compensate for the extreme differences in size
between both species. We showed that Drosophila HS cells follow
the same branching principles as Calliphora HS cells and that the
underlying electrotonic architecture is well conserved. We find also
that the morphology obeys essentially isometric scaling and that
even drastic scaling alterations do not per se challenge dendritic
integration features such as synaptic democracy and responses to
visual motion. Furthermore, total length and number of branch
points, i.e. dendrite complexity, are strongly linked to each other
by optimal wiring constraints (Figure 1D) [33].
Even though the general anatomical features were roughly
scaled isometrically, two notable features departed from this rule.
Firstly, while the average diameter values were scaled isometri-
cally, the distribution of the branching diameters was altered
Figure 5. Visual responses in Drosophila and Calliphora HS cells. Calliphora (left) vs. Drosophila (right) HSE cell model responses to full fieldvisual stimulation (top) and full field sinusoidal conductance injections in the dendrite with the phase corresponding to the x-axis location of theconduction injection site (bottom). Cyan, orange and pink dots in top panels indicate dendrite tip, dendrite root and axon terminal locationsrespectively for which voltage time traces are plotted in bottom panels. Grey bars indicate stimulation region (top panels) and time onset ofstimulation (bottom panels).doi:10.1371/journal.pone.0071540.g005
Preserving Neural Function under Extreme Scaling
PLOS ONE | www.plosone.org 8 August 2013 | Volume 8 | Issue 8 | e71540

possibly to conserve dendritic synaptic democracy. Secondly, and
more surprising, the complexity of Drosophila’s HS cells was
increased compared to Calliphora. The lower spatial resolution of
the Drosophila visual system with roughly 700 ommatidia per eye
[39] vs. 4,500 in Calliphora [40] would suggest a lower complexity
in the retinotopically organised branching structures of LPTCs
since their function is to integrate signals from individual columnar
elements over large parts of the visual field.
The morphological model of Drosophila cells indicated that the
trade-off between cable cost and short conduction delays is in
favour of short cables in a similar way as had been the case for
Calliphora cells [12,28]. Together with the planar organisation of
LPTCs within the Lobula Plate, this finding sets them functionally
in one common group with cerebellar Purkinje cells that were
suggested to also maximise their connectivity repertoire
[11,46,47]. The low importance of conduction delays in the
morphological model for both types of HS cells, thereby indicating
less electrotonic compartmentalisation [10] is highly suggestive of a
similar functional role. This function does not seem to be affected
by general scale.
The electrotonic properties of the cells indicate that the specific
membrane properties did not change very much. Changes in
membrane resistivity in the scaling process led to higher input
resistances without compromising dendritic integration. As a result
however, predicted synaptic currents are much smaller in
Drosophila than in Calliphora HS cells. This could in turn result in
smaller metabolic costs generally associated with higher input
resistances [48]. The differences in electrotonic properties that
were seen are hard to resolve since experimental measurements
were performed using sharp electrodes in axons of Calliphora HS
cells but with patch electrodes in somata of Drosophila HS cells.
While the former have been shown to introduce higher leak
conductances, the latter have unknown influences on ion
concentrations [49]. Studies performed in maturing invertebrates
also describe the conservation of electrophysiological features in
the nervous system even with large differences in size [50,51].
Interestingly, the functional syntax (e.g. spike timing), but not the
absolute response intensity were conserved within growing cricket
neurons, supporting the idea that functional concepts rather than
the detailed physical sizes of features are encoded genetically
[52,53]. In general the number of detailed electrotonic studies in
Drosophila is still limited. Antennal lobe projection neurons exhibit
different function, morphology and electrotonic properties com-
pared to the HS cells described here [54]. However, input
resistance measurements of around 220 MV in Drosophila VS cells,
another class of LPTCs, matches our measurements in HS cells
[32].
Most strikingly and in accordance with previous electrophysi-
ological recordings [24,25], the dendritic integration properties
and the simulated responses to visual stimulation were extremely
similar in the Calliphora and Drosophila HS cell models. Despite the
anatomical scaling of 606 between the two fly species, the
similarity in the electrotonic structure seems to be rather robust.
While this requires some adjustments in the set of membrane
properties, the range of adequate parameters is rather large. The
overall importance of morphology for neural computation has
been emphasised in many studies [55–57]. Dendrite structure
plays a large role for spiking responses [56] and theoretical
discussions on preserving synaptic integration through adjustments
of morphological and electrotonic scaling properties of neurons
have been held [3,58]. We show here in a combined electrophys-
iology, morphology and modelling study that iso-electrotonic
scaling is feasible with minor adjustments in passive membrane
properties and anatomy in the fly HS cell. We have provided
evidence that the morphological backbone is important but robust
over a wide range of scaling alterations in terms of the
implementation of dendritic computations. By dissecting morpho-
logical and electrotonic scaling features, we show that neural
function and many electrotonic properties are not compromised
by scaling. We therefore conclude that a conservative scaling as
proposed previously is comparably simple to achieve.
Supporting Information
Figure S1 Drosophila HS morphology database. HSN
and HSE cells were genetically tagged with GFP and all HSN and
HSE cells from five flies were imaged with confocal microscopy
(left two columns) and reconstructed (right two columns; HSN –
red, HSE – black). The two columns each represent the left and
right lobula plate of the same animal so that each row corresponds
to the data obtained from one animal.
(TIF)
Movie S1 Responses of Drosophila and Calliphora HSmodel cells to a moving sinusoidal grating. The dendrite
receives sinusoidally modulated inputs where the phase depends
on the x-coordinate and the pattern covers the dendrite with
exactly one period of the sinusoidal input. The y-axis shows the
local membrane potential instead of the correct HS cell y-
coordinate (see Figure 5 for more details).
(AVI)
Acknowledgments
We would like to thank P. Jedlicka and C. Kapfer for helpful discussions.
Author Contributions
Conceived and designed the experiments: HC FF AB. Performed the
experiments: FF BS GA SVR. Analyzed the data: HC FF. Wrote the
paper: HC FF BS GA SVR AB.
References
1. Niven JE, Farris SM (2012) Miniaturization of nervous systems and neurons.
Curr. Biol. 22: R323–R329.
2. Tower DB (1954) Structural and functional organization of mammalian cerebral
cortex: the correlation of neurone density with brain size. J. Comp. Neurol. 101:
19–51.
3. Bekkers JM, Stevens CF (1990) Two different ways evolution makes neurons
larger. Prog. Brain Res. 83: 37–45.
4. Herculano-Houzel S, Mota B, Lent R (2006) Cellular scaling rules for rodent
brains. Proc. Natl. Acad. Sci. U.S.A. 103: 12138–12143.
5. Herculano-Houzel S, Collins CE, Wong P, Kaas JH (2007) Cellular scaling rules
for primate brains. Proc. Natl. Acad. Sci. U.S.A. 104: 3562–3567.
6. Purves D, Lichtman JW (1985) Geometrical differences among homologous
neurons in mammals. Science 228: 298–302.
7. Howarth C, Gleeson P, Attwell D (2012) Updated energy budgets for neural
computation in the neocortex and cerebellum. J. Cereb. Blood Flow Metab. 32:
1222–1232.
8. Scholvinck ML, Howarth C, Attwell D (2008) The cortical energy needed for
conscious perception. NeuroImage 40: 1460–1468.
9. Laughlin SB, De Ruyter van Steveninck RR, Anderson JC (1998) The metabolic
cost of neural information. Nat. Neurosci. 1: 36–41.
10. Cuntz H, Forstner F, Borst A, Hausser M (2010) One rule to grow them all: a
general theory of neuronal branching and its practical application. PLoS
Comput. Biol. 6: e1000877.
11. Wen Q, Chklovskii DB (2008) A cost-benefit analysis of neuronal morphology. J.
Neurophys. 99: 2320–2328.
12. Cuntz H, Borst A, Segev I (2007) Optimization principles of dendritic structure.
Theor. Biol. Med. Model. 4: 21.
Preserving Neural Function under Extreme Scaling
PLOS ONE | www.plosone.org 9 August 2013 | Volume 8 | Issue 8 | e71540

13. Bakken TE, Stevens CF (2011) Visual system scaling in teleost fish. J. Comp.
Neurol. 153: 142–153.14. Borst A, Haag J, Reiff DF (2010) Fly motion vision. Annu. Rev. Neurosci. 33:
49–70.
15. Haag J, Theunissen F, Borst A (1997) The intrinsic electrophysiologicalcharacteristics of fly lobula plate tangential cells: II. Active membrane properties.
J. Comput. Neurosci. 4: 349–369.16. Haag J, Vermeulen A, Borst A (1999) The intrinsic electrophysiological
characteristics of fly lobula plate tangential cells: III. Visual response properties.
J. Comput. Neurosci. 7: 213–234.17. Borst A, Haag J (1996) The intrinsic electrophysiological characteristics of fly
lobula plate tangential cells: I. Passive membrane properties. J. Comput.Neurosci. 3: 313–336.
18. Single S, Borst A (1998) Dendritic integration and its role in computing imagevelocity. Science 281: 1848–1850.
19. Haag J, Borst A (2002) Dendro-dendritic interactions between motion-sensitive
large-field neurons in the fly. J. Neurosci. 22: 3227–3233.20. Cuntz H, Haag J, Borst A (2003) Neural image processing by dendritic networks.
Proc. Natl. Acad. Sci. U.S.A. 100: 11082–11085.21. Haag J, Borst A (2004) Neural mechanism underlying complex receptive field
properties of motion-sensitive interneurons. Nat. Neurosci. 7: 628–634.
22. Cuntz H, Haag J, Forstner F, Segev I, Borst A (2007) Robust coding of flow-fieldparameters by axo-axonal gap junctions between fly visual interneurons. Proc.
Natl. Acad. Sci. U.S.A. 104: 10229–10233.23. Elyada YM, Haag J, Borst A (2009) Different receptive fields in axons and
dendrites underlie robust coding in motion-sensitive neurons. Nat. Neurosci. 12:327–332.
24. Joesch M, Plett J, Borst A, Reiff DF (2008) Response properties of motion-
sensitive visual interneurons in the lobula plate of Drosophila melanogaster.Curr. Biol. 18: 368–374.
25. Schnell B, Joesch M, Forstner F, Raghu SV, Otsuna H, et al. (2010) Processingof horizontal optic flow in three visual interneurons of the Drosophila brain. J.
Neurophys. 103: 1646–1657.
26. Hausen K (1982) Motion sensitive interneurons in the optomotor system of thefly - I. The horizontal cells: structure and signals. Biol. Cybern. 45: 143–156.
27. Hengstenberg R, Hausen K, Hengstenberg B (1982) The number and structureof giant vertical cells (VS) in the lobula plate of the blowfly Calliphora
erythrocephala. J. Comp. Physiol. A 149: 163–177.28. Cuntz H, Forstner F, Haag J, Borst A (2008) The morphological identity of
insect dendrites. PLoS Comput. Biol. 4: e1000251.
29. Otsuna H, Ito K (2006) Systematic Analysis of the Visual Projection Neurons ofDrosophila melanogaster. I. Lobula-Specific Pathways. J. Comp. Neurol. 497:
928–958.30. Cuntz H, Forstner F, Borst A, Hausser M (2011) The TREES toolbox–probing
the basis of axonal and dendritic branching. Neuroinformatics 9: 91–96.
31. Wilson RI, Laurent G (2005) Role of GABAergic inhibition in shaping odor-evoked spatiotemporal patterns in the Drosophila antennal lobe. J. Neurosci. 25:
9069–9079.32. Maimon G, Straw AD, Dickinson MH (2010) Active flight increases the gain of
visual motion processing in Drosophila. Nat. Neurosci. 13: 393–399.33. Cuntz H, Mathy A, Hausser M (2012) A scaling law derived from optimal
dendritic wiring. Proc. Natl. Acad. Sci. U.S.A. 109: 11014–11018.
34. Thompson DW (1917) On growth and form. Cambridge University Press. 1116p.
35. Huxley JS (1932) Problems of relative growth. Methuen, Co. LTD, London. 276
p.
36. Ramon y Cajal S (1911) Histologie du systeme nerveux de l’homme et des
vertebres. Paris, A. Maloine, translated by Larry W Swanson 1995, Oxford
University Press. 986 p.
37. Cherniak C (1992) Local optimization of neuron arbors. Biol. Cybern. 66: 503–
510.
38. Cherniak C, Changizi MA, Kang DW (1999) Large-scale optimization of
neuron arbors. Phys. Rev. E 59: 6001–6009.
39. Gotz KG (1968) Flight control in Drosophila by visual perception of motion.
Kybernetik 4: 199–208.
40. Sukontason KL, Chaiwong T, Piangjai S, Upakut S, Moophayak K, et al. (2008)
Ommatidia of blow fly, house fly, and flesh fly: implication of their vision
efficiency. Parasitol. Res. 103: 123–131.
41. Braitenberg V (1970) Ordnung und Orientierung der Elemente im Sehsystem
der Fliege. Biol. Cybern. 7: 235–242.
42. Zador AM, Agmon-Snir H, Segev I (1995) The morphoelectrotonic transform: a
graphical approach to dendritic function. J. Neurosci. 15: 1669–1682.
43. Borst A, Egelhaaf M (1992) In vivo imaging of calcium accumulation in fly
interneurons as elicited by visual motion stimulation. Proc. Natl. Acad. Sci.
U.S.A. 89: 4139–4143.
44. Fischbach K-F, Heisenberg M (1984) Neurogenetics and behaviour in insects. J.
Exp. Biol. 93: 65–93.
45. Scott EK, Raabe T, Luo L (2002) Structure of the vertical and horizontal system
neurons of the lobula plate in Drosophila. J. Comp. Neurol. 454: 470–481.
46. Wen Q, Stepanyants A, Elston GN, Grosberg AY, Chklovskii DB (2009)
Maximization of the connectivity repertoire as a statistical principle governing
the shapes of dendritic arbors. Proc. Natl. Acad. Sci. U.S.A. 106: 12536–12541.
47. Cuntz H (2012) The dendritic density field of a cortical pyramidal cell. Front.
Neuroanat. 6: 2.
48. Niven JE, Anderson JC, Laughlin SB (2007) Fly photoreceptors demonstrate
energy-information trade-offs in neural coding. PLoS biology 5: e116.
49. Staley KJ, Otis TS, Mody I (1992) Membrane properties of dentate gyrus
granule cells: comparison of sharp microelectrode and whole-cell recordings. J.
Neurophys. 67: 1346–1358.
50. Kamper G, Murphey RK (1994) Maturation of an insect nervous system:
constancy in the face of change. Comp. Biochem. Phys. A 109: 23–32.
51. Bucher D, Prinz AA, Marder E (2005) Animal-to-animal variability in motor
pattern production in adults and during growth. J. Neurosci. 25: 1611–1619.
52. Marder E, Goaillard J-M (2006) Variability, compensation and homeostasis in
neuron and network function. Nat. Rev. Neurosci. 7: 563–574.
53. Borst A (2008) How does nature program neuron types? Front. Neurosci. 2: 4–5.
54. Gouwens NW, Wilson RI (2009) Signal propagation in Drosophila central
neurons. J. Neurosci. 29: 6239–6249.
55. Egelhaaf M, Haag J, Borst A (1994) Processing of synaptic information depends
on the structure of the dendritic tree. NeuroReport 6: 205–208.
56. Mainen ZF, Sejnowski TJ (1996) Influence of dendritic structure on firing
pattern in model neocortical neurons. Nature 382: 363–366.
57. London M, Hausser M (2005) Dendritic computation. Annu. Rev. Neurosci. 28:
503–532.
58. Hill AA V, Edwards DH, Murphey RK (1994) The effect of neuronal growth on
synaptic integration. J. Comput. Neurosci. 1: 239–254.
Preserving Neural Function under Extreme Scaling
PLOS ONE | www.plosone.org 10 August 2013 | Volume 8 | Issue 8 | e71540