Embed Size (px)
Citation preview
For enquiries, contact:Water and Sanitation Program–Africa RegionThe World Bank, Upper Hill RoadP.O. Box 30577, 00100, Nairobi, KenyaTel: +(254) 20 322 6300 E-mail: [email protected] site: www.wsp.org
An AMCOW Country Status Overview
Water Supply and Sanitation in The GambiaTurning Finance into Services for 2015 and Beyond
The first round of Country Status Overviews (CSO1) published in 2006 benchmarked the preparedness of sectors of 16 countries in Africa to meet the WSS MDGs based on their medium-term spending plans and a set of ‘success factors’ selected from regional experience. Combined with a process of national stakeholder consultation, this prompted countries to ask whether they had those ‘success factors’ in place and, if not, whether they should put them in place.
The second round of Country Status Overviews (CSO2) has built on both the method and the process developed in CSO1. The ‘success factors’ have been supplemented with additional factors drawn from country and regional analysis to develop the CSO2 scorecard. Together these reflect the essential steps, functions and results in translating finance into services through government systems—in line with Paris Principles for aid effectiveness. The data and summary assessments have been drawn from local data sources and compared with internationally reported data, and, wherever possible, the assessments have been subject to broad-based consultations with lead government agencies and country sector stakeholders, including donor institutions.
This second set of 32 Country Status Overviews (CSO2) on water supply and sanitation was commissioned by the African Ministers’ Council on Water (AMCOW). Development of the CSO2 was led by the World Bank administered Water and Sanitation Program (WSP) in collaboration with the African Development Bank (AfDB), the United Nations Children’s Fund (UNICEF), the World Bank, and the World Health Organization (WHO).
This report was produced in collaboration with the Government of The Gambia and other stakeholders during 2009/10. Some sources cited may be informal documents that are not readily available.
The findings, interpretations, and conclusions expressed in this volume do not necessarily reflect the views of the collaborating institutions, their Executive Directors, or the governments they represent. The collaborating institutions do not guarantee the accuracy of the data included in this work. The boundaries, colors, denominations, and other information shown on any map in this work do not imply any judgment on the part of the collaborating institutions concerning the legal status of any territory or the endorsement or acceptance of such boundaries.
The material in this publication is copyrighted. Requests for permission to reproduce portions of it should be sent to [email protected]. The collaborating institutions encourage the dissemination of this work and will normally grant permission promptly. For more information, please visit www.amcow.net or www.wsp.org.
Photograph credits: Getty Images
© 2011 Water and Sanitation Program
1
Water Supply and Sanitation in The GambiaTurning Finance into Services for 2015 and Beyond
An AMCOW Country Status Overview
2
Strategic Overview
The water supply and sanitation sector in The Gambia has been evolving gradually in the last two decades, in response to rising demand and the challenges of maintaining sector related infrastructure constructed as a response to Sahelian drought in the 1970s and 1980s. An important achievement has been the formulation and adoption of the National Water Resources Policy in 2006 based on an integrated approach to water resources management. The Policy calls for institutional restructuring and the development of an implementation strategy and regulatory framework. The delay in implementing these and other reforms continues to hamper the sector’s development. Reforms in sanitation have been slow, with the first draft policy document formulated in 2010. As a result, sanitation continues to be fragmented among different agencies, with little coordination.
It is expected that the reforms will create the needed enabling environment for improved service delivery both in terms of quantity and quality. The Gambia’s challenge is to implement the reforms by developing strategies and investment plans, and undertaking the necessary institutional restructuring to further clarify roles and responsibilities, whilst at the same time significantly scaling up resources and systems for better delivery of services.
The rate of progress on sanitation coverage is slow and at current rates of progress only half of the population will have access to safe sanitation by 2015. For the water supply subsector, significant progress has been made but this needs to be sustained to ensure sector targets are met.
Government financial allocation to water supply is still low with the bulk of investment funds coming from donors. Estimates of investment requirements suggest that additional funding will be required for capital investment, particularly rehabilitation of existing facilities. For sanitation,
there is no official policy on cost sharing, though there is an implicit assumption that households will meet hardware costs for on-site sanitation but not for sewerage. This underscores the need for an improved promotion and marketing program to encourage households to invest in sanitation as well as a reassessment of the equity of publicly funded sewerage.
Significant improvements can still be made throughout the service delivery pathway through which finance is turned into services. Upstream, the formulation of a national policy for sanitation, and completion of the separation and clarification of subsector institutional roles are vital.
The country lacks a comprehensive overall water supply and sanitation sector development program—this makes it difficult to establish sector investment priorities and ensure better coordination with donors. There is also no structured mechanism for sector monitoring and performance evaluation. It is expected that the introduction of Sector-Wide Approach (SWAp) as already proposed by the government will help address some of these constraints.
In addition, coordination, disbursement, and expenditure of finance can still be improved to make the most of government and donor allocations to the sector.
Moving downstream, aspects for developing and sustaining services are relatively stronger, although issues such as equity of resource allocation—at local level in rural areas, and in the absence of a clear strategy for pro-poor urban water supply—can be significantly improved.
The second AMCOW Country Status Overview (CSO2) has been produced in collaboration with the Government of The Gambia and other stakeholders.
An AMCOW Country Status Overview
2
3
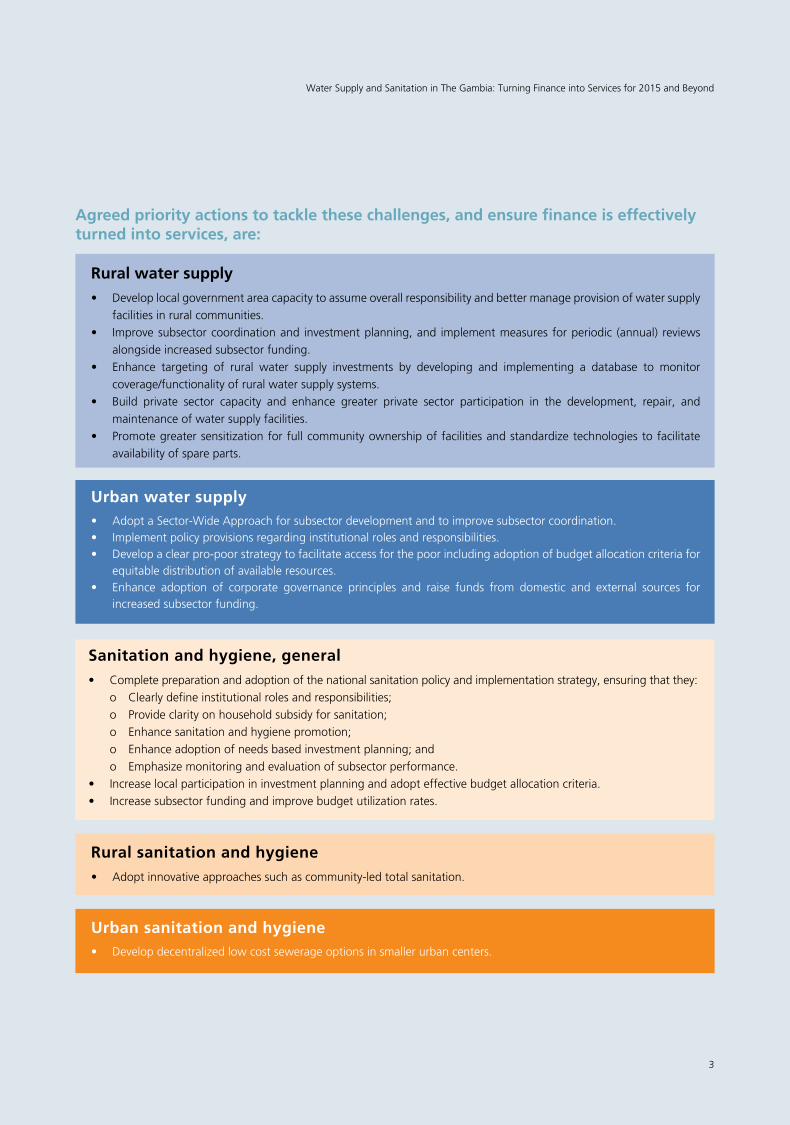
Rural water supply• Developlocalgovernmentareacapacitytoassumeoverallresponsibilityandbettermanageprovisionofwatersupply
facilities in rural communities.• Improvesubsectorcoordinationand investmentplanning,and implementmeasuresforperiodic (annual) reviews
alongside increased subsector funding.• Enhance targeting of rural water supply investments by developing and implementing a database to monitor
coverage/functionality of rural water supply systems.• Build private sector capacity and enhance greater private sector participation in the development, repair, and
maintenance of water supply facilities.• Promotegreatersensitizationforfullcommunityownershipoffacilitiesandstandardizetechnologiestofacilitate
availability of spare parts.
Urban water supply• AdoptaSector-WideApproachforsubsectordevelopmentandtoimprovesubsectorcoordination.• Implementpolicyprovisionsregardinginstitutionalrolesandresponsibilities.• Developaclearpro-poorstrategytofacilitateaccessforthepoorincludingadoptionofbudgetallocationcriteriafor
equitable distribution of available resources.• Enhance adoption of corporate governance principles and raise funds from domestic and external sources for
increased subsector funding.
Rural sanitation and hygiene• Adoptinnovativeapproachessuchascommunity-ledtotalsanitation.
WaterSupplyandSanitationinTheGambia:TurningFinanceintoServicesfor2015andBeyond
3
Agreed priority actions to tackle these challenges, and ensure finance is effectively turned into services, are:
Urban sanitation and hygiene• Developdecentralizedlowcostsewerageoptionsinsmallerurbancenters.
Sanitation and hygiene, general• Completepreparationandadoptionofthenationalsanitationpolicyandimplementationstrategy,ensuringthatthey: o Clearly define institutional roles and responsibilities; o Provide clarity on household subsidy for sanitation; o Enhance sanitation and hygiene promotion; o Enhance adoption of needs based investment planning; and o Emphasizemonitoringandevaluationofsubsectorperformance.• Increaselocalparticipationininvestmentplanningandadopteffectivebudgetallocationcriteria.• Increasesubsectorfundingandimprovebudgetutilizationrates.
4
5
Acronyms and Abbreviations ........................................................................................................................... 6
1. Introduction .................................................................................................................................................... 7
2. Sector Overview: Coverage and Finance Trends ............................................................................................... 8
3. Reform Context: Introducing the CSO2 Scorecard ......................................................................................... 11
4. Institutional Framework ................................................................................................................................ 13
5. Financing and its Implementation .................................................................................................................. 16
6. Sector Monitoring and Evaluation ................................................................................................................. 18
7. Subsector: Rural Water Supply ...................................................................................................................... 20
8. Subsector: Urban Water Supply ..................................................................................................................... 22
9. Subsector: Rural Sanitation and Hygiene ....................................................................................................... 24
10. Subsector: Urban Sanitation and Hygiene ...................................................................................................... 26
Notes and References ................................................................................................................................... 28
Contents
6
Acronyms and Abbreviations
AfDB AfricanDevelopmentBankAMCOW African Ministers’ Council on WaterCAPEX Capital expenditureCLTS Community-Led Total SanitationCSO2 Country Status Overviews (second round)DCD DepartmentforCommunityDevelopmentDWO DistrictWaterOfficersDWR DepartmentofWaterResourcesGDP GrossdomesticproductGNI Gross national incomeGUC The Gambia Utilities CorporationHH HouseholdJMP Joint Monitoring Programme (UNICEF/WHO)LGA Local Government AreaLIC Low-income countryM&E Monitoring and evaluationMDG MillenniumDevelopmentGoalMICS Multiple Indicator Cluster SurveyMoE Ministry of EducationMoEN Ministry of EnergyMoF&En Ministry of Forestry and EnvironmentMoFWR Ministry of Fisheries and Water ResourcesMoH Ministry of HealthMoLG Ministry of Local Government
NAWEC National Water and Electricity CompanyNEA National Environment AgencyNGO NongovernmentalorganizationO&M Operations and maintenanceOPEX Operations expenditurePRSP Poverty Reduction Strategy PaperPURA Public Utilities Regulatory AuthorityRSH Rural sanitation and hygieneRWS Rural water supplyRWSSI Rural Water Supply and Sanitation InitiativeSSA Sub-Saharan AfricaSWAp Sector-Wide ApproachUNICEF United Nations Children’s FundUSH Urban sanitation and hygieneUWS Urban water supplyVDC VillageDevelopmentCommitteeVWC Village Water CommitteeWASH Water, sanitation and hygieneWDC WardDevelopmentCommitteeWHO WorldHealthOrganizationWSP Water and Sanitation ProgramWSS Water supply and sanitationWSWG Water Sector Working Group
Exchange rate:US$1=GMB28.1
An AMCOW Country Status Overview
7
1. Introduction
The African Ministers’ Council on Water (AMCOW) commissioned the production of a second round of Country Status Overviews (CSOs) to better understand what underpins progress in water supply and sanitation and what its member governments can do to accelerate that progress across countries in Sub-Saharan Africa (SSA).2 AMCOW delegated this tasktotheWorldBank’sWaterandSanitationProgramandtheAfricanDevelopmentBankwhoareimplementingitin close partnership with UNICEF and WHO in over 30 countries across SSA. This CSO2 report has been produced in collaboration with the Government of The Gambia and other stakeholders during 2009/10.
The analysis aims to help countries assess their own service delivery pathways for turning finance into water supply and sanitation services in each of four subsectors: rural and urban water supply, and rural and urban sanitation and hygiene. The CSO2 analysis has three main components: a review of past coverage; a costing model to assess the adequacy of future investments; and a scorecard which allows diagnosis of particular bottlenecks along the service delivery pathway. The CSO2’s contribution is to answer not only whether past trends and future finance are sufficient to meet sector targets, but what specific issues need to be addressed to ensure finance is effectively turned into accelerated coverage in water supply and sanitation. In this spirit, specific priority actions have been identified through consultation. A synthesis report,availableseparately,presentsbestpracticeandsharedlearningtohelprealizethesepriorityactions.
WaterSupplyandSanitationinTheGambia:TurningFinanceintoServicesfor2015andBeyond
8
2. Sector Overview: Coverage and Finance Trends
Coverage: Assessing Past Progress
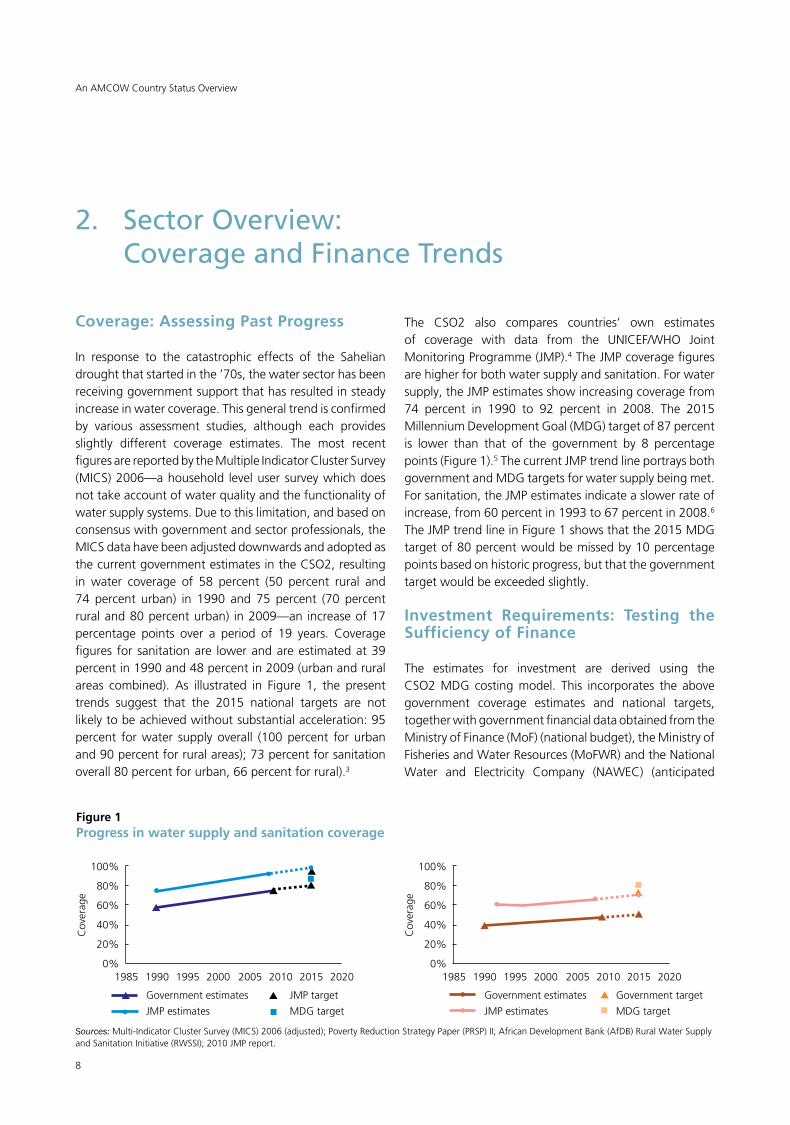
In response to the catastrophic effects of the Sahelian drought that started in the ’70s, the water sector has been receiving government support that has resulted in steady increase in water coverage. This general trend is confirmed by various assessment studies, although each provides slightly different coverage estimates. The most recent figures are reported by the Multiple Indicator Cluster Survey (MICS) 2006—a household level user survey which does not take account of water quality and the functionality of watersupplysystems.Duetothislimitation,andbasedonconsensus with government and sector professionals, the MICS data have been adjusted downwards and adopted as the current government estimates in the CSO2, resulting in water coverage of 58 percent (50 percent rural and 74 percent urban) in 1990 and 75 percent (70 percent rural and 80 percent urban) in 2009—an increase of 17 percentage points over a period of 19 years. Coverage figures for sanitation are lower and are estimated at 39 percent in 1990 and 48 percent in 2009 (urban and rural areas combined). As illustrated in Figure 1, the present trends suggest that the 2015 national targets are not likely to be achieved without substantial acceleration: 95 percent for water supply overall (100 percent for urban and 90 percent for rural areas); 73 percent for sanitation overall 80 percent for urban, 66 percent for rural).3
The CSO2 also compares countries’ own estimates of coverage with data from the UNICEF/WHO Joint Monitoring Programme (JMP).4 The JMP coverage figures are higher for both water supply and sanitation. For water supply, the JMP estimates show increasing coverage from 74 percent in 1990 to 92 percent in 2008. The 2015 MillenniumDevelopmentGoal(MDG)targetof87percentis lower than that of the government by 8 percentage points (Figure 1).5 The current JMP trend line portrays both governmentandMDGtargetsforwatersupplybeingmet.For sanitation, the JMP estimates indicate a slower rate of increase, from 60 percent in 1993 to 67 percent in 2008.6 TheJMPtrendlineinFigure1showsthatthe2015MDGtarget of 80 percent would be missed by 10 percentage points based on historic progress, but that the government target would be exceeded slightly.
Investment Requirements: Testing the Sufficiency of Finance
The estimates for investment are derived using the CSO2MDG costingmodel. This incorporates the abovegovernment coverage estimates and national targets, together with government financial data obtained from the Ministry of Finance (MoF) (national budget), the Ministry of Fisheries and Water Resources (MoFWR) and the National Water and Electricity Company (NAWEC) (anticipated
An AMCOW Country Status Overview
100%
80%
60%
40%
20%
0%1985 1990 1995 2000 2005 2010 2015 2020
Government estimates Government target
Cov
erag
e
Figure 1Progress in water supply and sanitation coverage
100%
80%
60%
40%
20%
0%1985 1990 1995 2000 2005 2010 2015 2020
JMP targetGovernment estimates
Cov
erag
e
Sources:Multi-IndicatorClusterSurvey(MICS)2006(adjusted);PovertyReductionStrategyPaper(PRSP)II;AfricanDevelopmentBank(AfDB)RuralWaterSupplyand Sanitation Initiative (RWSSI); 2010 JMP report.
JMP estimates MDGtarget JMP estimates MDGtarget
9
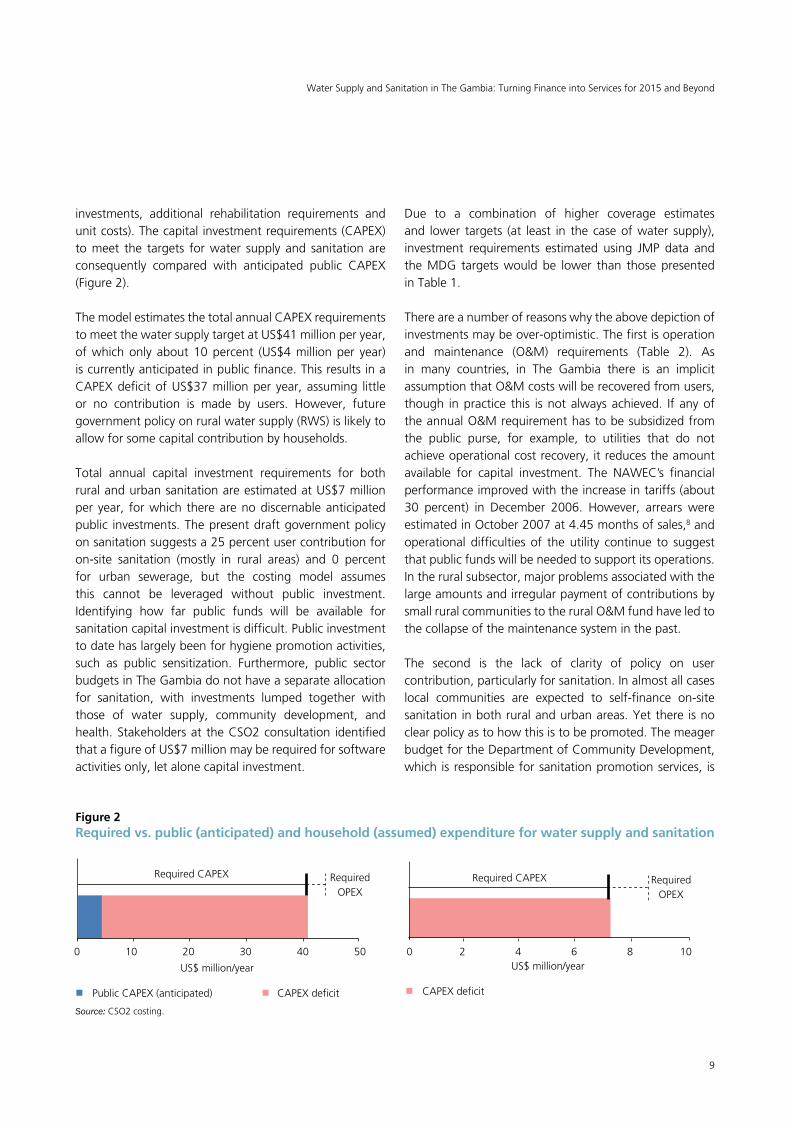
investments, additional rehabilitation requirements and unit costs). The capital investment requirements (CAPEX) to meet the targets for water supply and sanitation are consequently compared with anticipated public CAPEX (Figure 2).
The model estimates the total annual CAPEX requirements to meet the water supply target at US$41 million per year, of which only about 10 percent (US$4 million per year) is currently anticipated in public finance. This results in a CAPEX deficit of US$37 million per year, assuming little or no contribution is made by users. However, future government policy on rural water supply (RWS) is likely to allow for some capital contribution by households.
Total annual capital investment requirements for both rural and urban sanitation are estimated at US$7 million per year, for which there are no discernable anticipated public investments. The present draft government policy on sanitation suggests a 25 percent user contribution for on-site sanitation (mostly in rural areas) and 0 percent for urban sewerage, but the costing model assumes this cannot be leveraged without public investment. Identifying how far public funds will be available for sanitation capital investment is difficult. Public investment to date has largely been for hygiene promotion activities, such as public sensitization. Furthermore, public sectorbudgets in The Gambia do not have a separate allocation for sanitation, with investments lumped together with those of water supply, community development, and health. Stakeholders at the CSO2 consultation identified that a figure of US$7 million may be required for software activities only, let alone capital investment.
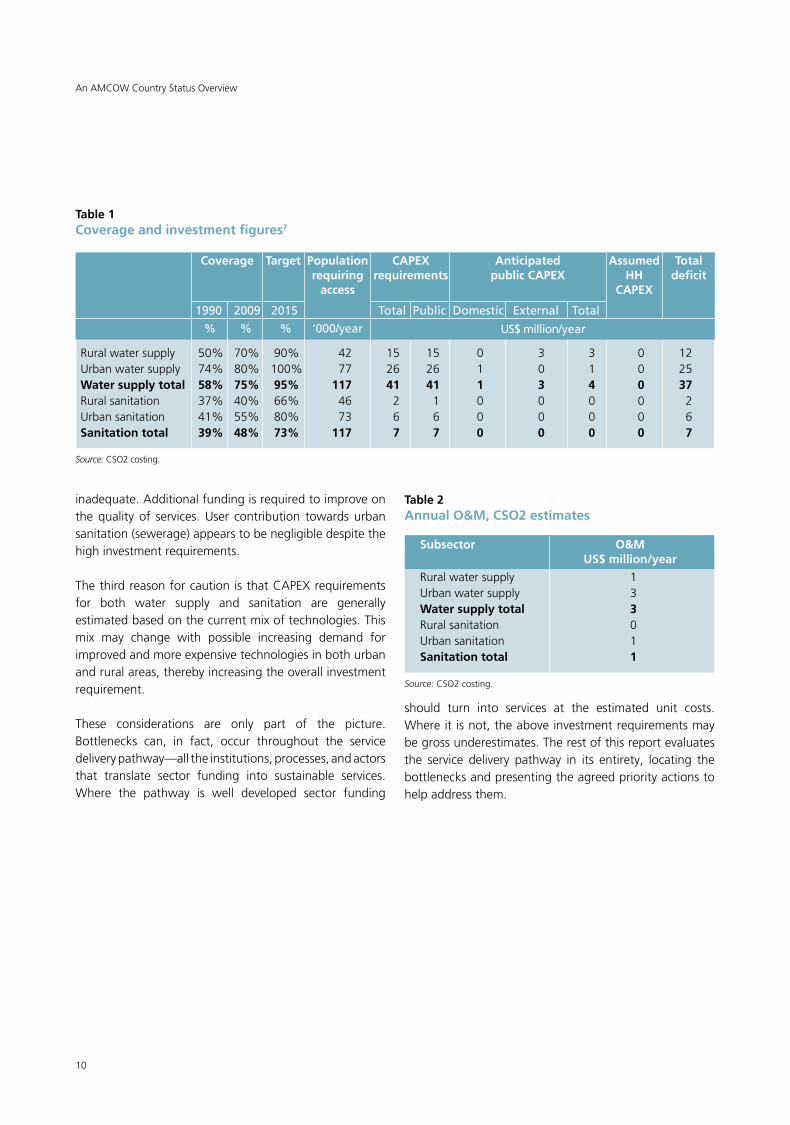
Due to a combination of higher coverage estimatesand lower targets (at least in the case of water supply), investment requirements estimated using JMP data and theMDG targetswouldbe lower than thosepresentedin Table 1.
There are a number of reasons why the above depiction of investments may be over-optimistic. The first is operation and maintenance (O&M) requirements (Table 2). As in many countries, in The Gambia there is an implicit assumption that O&M costs will be recovered from users, though in practice this is not always achieved. If any of theannualO&Mrequirementhastobesubsidizedfromthe public purse, for example, to utilities that do not achieve operational cost recovery, it reduces the amount available for capital investment. The NAWEC’s financial performance improved with the increase in tariffs (about 30 percent) in December 2006. However, arrears wereestimated in October 2007 at 4.45 months of sales,8 and operational difficulties of the utility continue to suggest that public funds will be needed to support its operations. In the rural subsector, major problems associated with the large amounts and irregular payment of contributions by small rural communities to the rural O&M fund have led to the collapse of the maintenance system in the past.
The second is the lack of clarity of policy on user contribution, particularly for sanitation. In almost all cases local communities are expected to self-finance on-site sanitation in both rural and urban areas. Yet there is no clear policy as to how this is to be promoted. The meager budgetfortheDepartmentofCommunityDevelopment,which is responsible for sanitation promotion services, is
WaterSupplyandSanitationinTheGambia:TurningFinanceintoServicesfor2015andBeyond
Required CAPEX Required OPEX
US$ million/year
CAPEX deficit
Figure 2Required vs. public (anticipated) and household (assumed) expenditure for water supply and sanitation
0 10 20 30 40 50
Required CAPEX Required OPEX
US$ million/year
Public CAPEX (anticipated) CAPEX deficit
Source: CSO2 costing.
0 2 4 6 8 10
10
Table 2Annual O&M, CSO2 estimates
Subsector O&M US$ million/year
Rural water supply 1Urban water supply 3Water supply total 3Rural sanitation 0Urban sanitation 1Sanitation total 1
Source: CSO2 costing.
inadequate. Additional funding is required to improve on the quality of services. User contribution towards urban sanitation (sewerage) appears to be negligible despite the high investment requirements.
The third reason for caution is that CAPEX requirements for both water supply and sanitation are generally estimated based on the current mix of technologies. This mix may change with possible increasing demand for improved and more expensive technologies in both urban and rural areas, thereby increasing the overall investment requirement.
These considerations are only part of the picture. Bottlenecks can, in fact, occur throughout the servicedelivery pathway—all the institutions, processes, and actors that translate sector funding into sustainable services. Where the pathway is well developed sector funding
should turn into services at the estimated unit costs. Where it is not, the above investment requirements may be gross underestimates. The rest of this report evaluates the service delivery pathway in its entirety, locating the bottlenecks and presenting the agreed priority actions to help address them.
An AMCOW Country Status Overview
Source: CSO2 costing.
Table 1Coverage and investment figures7
Coverage Target Population CAPEX Anticipated Assumed Total requiring requirements public CAPEX HH deficit access CAPEX
1990 2009 2015 Total Public Domestic External Total
% % % ‘000/year Rural water supply 50% 70% 90% 42 15 15 0 3 3 0 12Urban water supply 74% 80% 100% 77 26 26 1 0 1 0 25Water supply total 58% 75% 95% 117 41 41 1 3 4 0 37Rural sanitation 37% 40% 66% 46 2 1 0 0 0 0 2Urban sanitation 41% 55% 80% 73 6 6 0 0 0 0 6Sanitation total 39% 48% 73% 117 7 7 0 0 0 0 7
US$ million/year
11
3. Reform Context: Introducing the CSO2 Scorecard
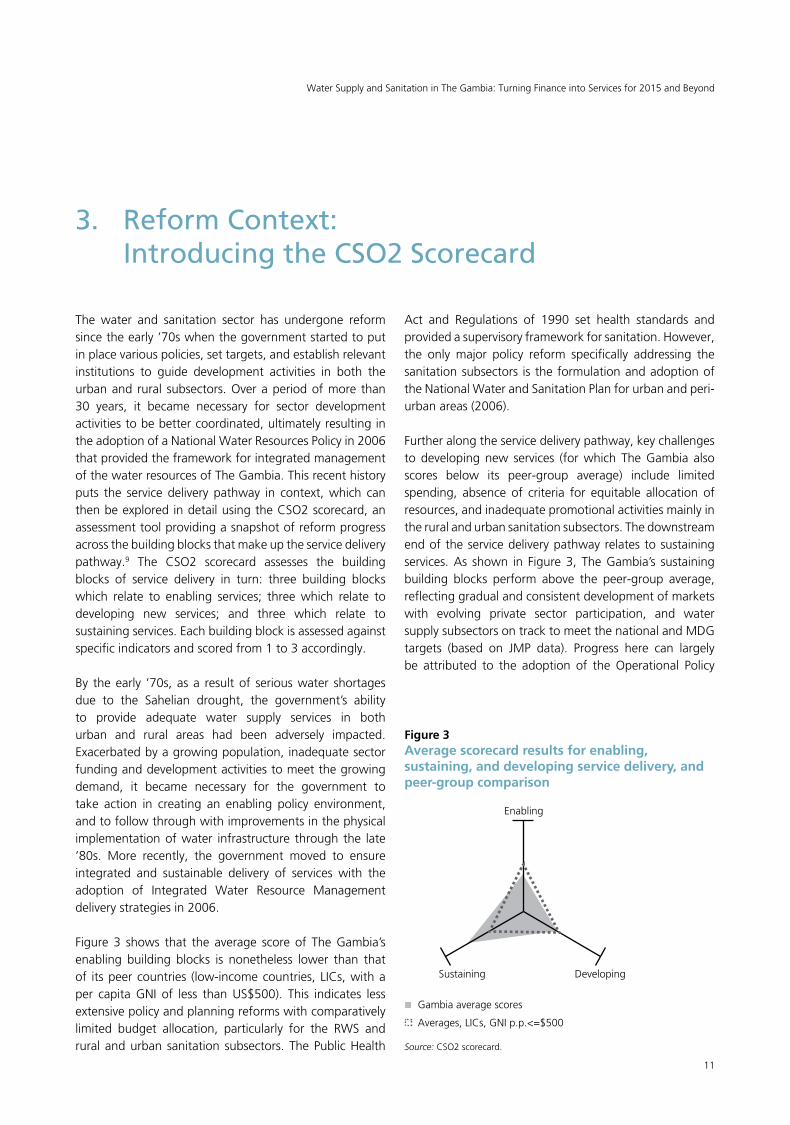
The water and sanitation sector has undergone reform since the early ’70s when the government started to put in place various policies, set targets, and establish relevant institutions to guide development activities in both the urban and rural subsectors. Over a period of more than 30 years, it became necessary for sector development activities to be better coordinated, ultimately resulting in the adoption of a National Water Resources Policy in 2006 that provided the framework for integrated management of the water resources of The Gambia. This recent history puts the service delivery pathway in context, which can then be explored in detail using the CSO2 scorecard, an assessment tool providing a snapshot of reform progress across the building blocks that make up the service delivery pathway.9 The CSO2 scorecard assesses the building blocks of service delivery in turn: three building blocks which relate to enabling services; three which relate to developing new services; and three which relate to sustaining services. Each building block is assessed against specific indicators and scored from 1 to 3 accordingly.
By theearly ’70s,asa resultof seriouswater shortagesdue to the Sahelian drought, the government’s ability to provide adequate water supply services in both urban and rural areas had been adversely impacted. Exacerbated by a growing population, inadequate sector funding and development activities to meet the growing demand, it became necessary for the government to take action in creating an enabling policy environment, and to follow through with improvements in the physical implementation of water infrastructure through the late ’80s. More recently, the government moved to ensure integrated and sustainable delivery of services with the adoption of Integrated Water Resource Management delivery strategies in 2006.
Figure 3 shows that the average score of The Gambia’s enabling building blocks is nonetheless lower than that of its peer countries (low-income countries, LICs, with a per capita GNI of less than US$500). This indicates less extensive policy and planning reforms with comparatively limited budget allocation, particularly for the RWS and rural and urban sanitation subsectors. The Public Health
Act and Regulations of 1990 set health standards and provided a supervisory framework for sanitation. However, the only major policy reform specifically addressing the sanitation subsectors is the formulation and adoption of the National Water and Sanitation Plan for urban and peri-urban areas (2006).
Further along the service delivery pathway, key challenges to developing new services (for which The Gambia also scores below its peer-group average) include limited spending, absence of criteria for equitable allocation of resources, and inadequate promotional activities mainly in the rural and urban sanitation subsectors. The downstream end of the service delivery pathway relates to sustaining services. As shown in Figure 3, The Gambia’s sustaining building blocks perform above the peer-group average, reflecting gradual and consistent development of markets with evolving private sector participation, and water supplysubsectorsontracktomeetthenationalandMDGtargets (based on JMP data). Progress here can largely be attributed to the adoption of the Operational Policy
Figure 3Average scorecard results for enabling, sustaining, and developing service delivery, and peer-group comparison
Gambia average scores
Averages, LICs, GNI p.p.<=$500
Source: CSO2 scorecard.
Enabling
Sustaining Developing
WaterSupplyandSanitationinTheGambia:TurningFinanceintoServicesfor2015andBeyond
12
GuidelinesfortheNationalWaterResourcesDevelopmentand Exploitation 1989, that paved the way for private sector participation in the RWS sector; transferred responsibility foroperationandmaintenancetousers;andstandardizedwell design, construction techniques, and handpumps to facilitate training and repairs.
Sections 4 to 6 highlight challenges across three thematic areas—the institutional framework, finance, and monitoring and evaluation (M&E). The related scorecard indicators which give an empirical basis for evaluation are highlighted at the beginning of each section. The scorecards for each subsector are presented in their entirety in sections 7 to 10.
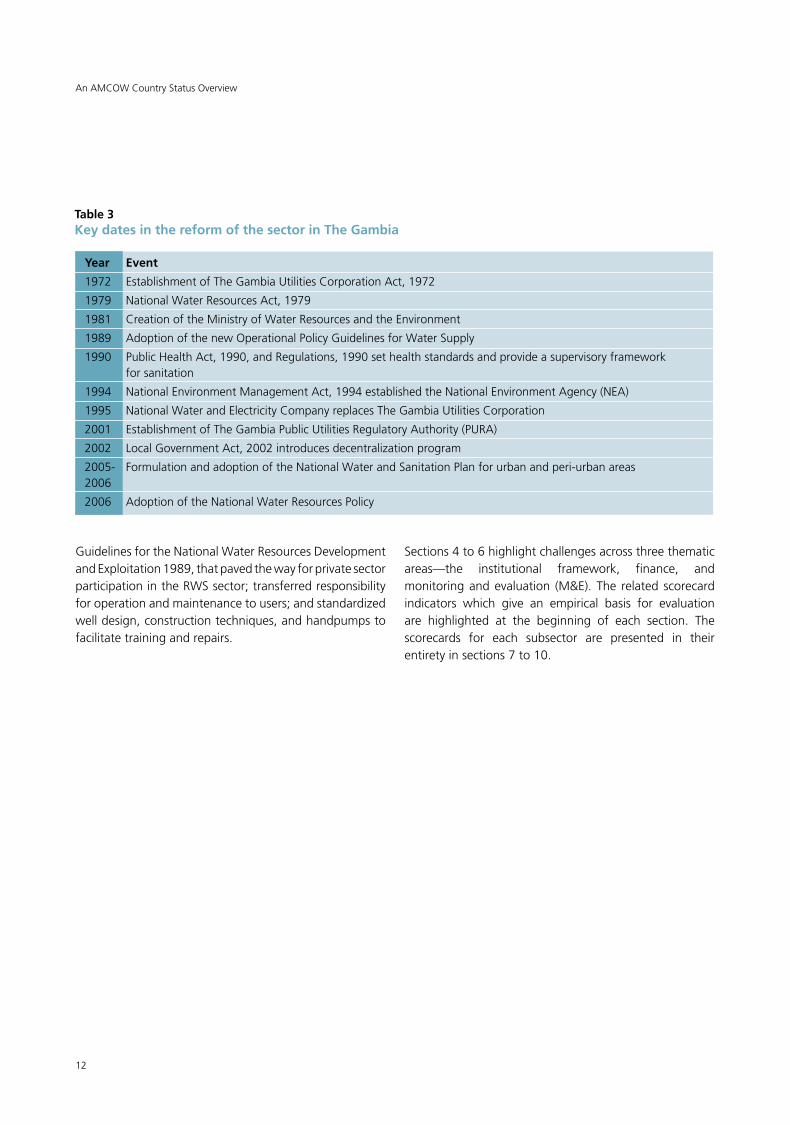
Table 3Key dates in the reform of the sector in The Gambia
Year Event
1972 Establishment of The Gambia Utilities Corporation Act, 1972
1979 National Water Resources Act, 1979
1981 Creation of the Ministry of Water Resources and the Environment
1989 Adoption of the new Operational Policy Guidelines for Water Supply
1990 Public Health Act, 1990, and Regulations, 1990 set health standards and provide a supervisory framework for sanitation
1994 National Environment Management Act, 1994 established the National Environment Agency (NEA)
1995 National Water and Electricity Company replaces The Gambia Utilities Corporation
2001 Establishment of The Gambia Public Utilities Regulatory Authority (PURA)
2002 LocalGovernmentAct,2002introducesdecentralizationprogram
2005- Formulation and adoption of the National Water and Sanitation Plan for urban and peri-urban areas 2006
2006 Adoption of the National Water Resources Policy
An AMCOW Country Status Overview
13
WaterSupplyandSanitationinTheGambia:TurningFinanceintoServicesfor2015andBeyond
4. Institutional Framework
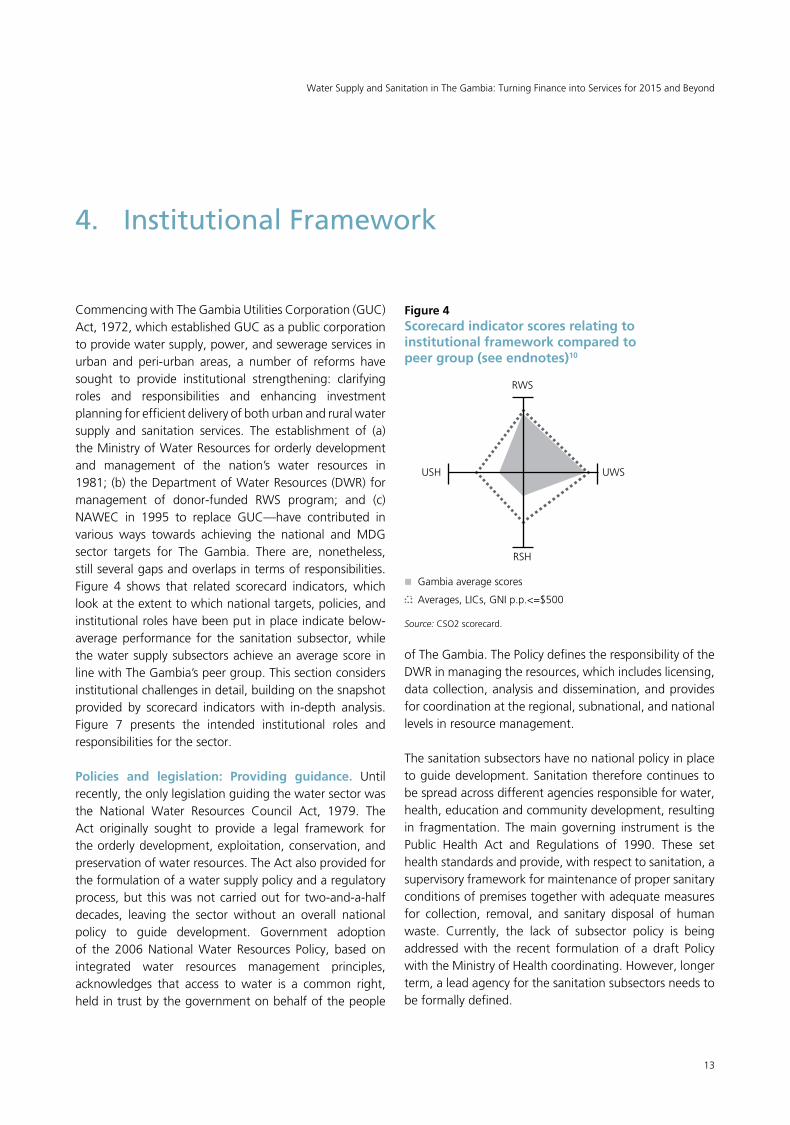
Commencing with The Gambia Utilities Corporation (GUC) Act, 1972, which established GUC as a public corporation to provide water supply, power, and sewerage services in urban and peri-urban areas, a number of reforms have sought to provide institutional strengthening: clarifying roles and responsibilities and enhancing investment planning for efficient delivery of both urban and rural water supply and sanitation services. The establishment of (a) the Ministry of Water Resources for orderly development and management of the nation’s water resources in 1981;(b)theDepartmentofWaterResources(DWR)formanagement of donor-funded RWS program; and (c) NAWEC in 1995 to replace GUC—have contributed in various ways towards achieving the national and MDGsector targets for The Gambia. There are, nonetheless, still several gaps and overlaps in terms of responsibilities. Figure 4 shows that related scorecard indicators, which look at the extent to which national targets, policies, and institutional roles have been put in place indicate below-average performance for the sanitation subsector, while the water supply subsectors achieve an average score in line with The Gambia’s peer group. This section considers institutional challenges in detail, building on the snapshot provided by scorecard indicators with in-depth analysis. Figure 7 presents the intended institutional roles and responsibilities for the sector.
Policies and legislation: Providing guidance. Until recently, the only legislation guiding the water sector was the National Water Resources Council Act, 1979. The Act originally sought to provide a legal framework for the orderly development, exploitation, conservation, and preservation of water resources. The Act also provided for the formulation of a water supply policy and a regulatory process, but this was not carried out for two-and-a-half decades, leaving the sector without an overall national policy to guide development. Government adoption of the 2006 National Water Resources Policy, based on integrated water resources management principles, acknowledges that access to water is a common right, held in trust by the government on behalf of the people
of The Gambia. The Policy defines the responsibility of the DWRinmanagingtheresources,whichincludeslicensing,data collection, analysis and dissemination, and provides for coordination at the regional, subnational, and national levels in resource management.
The sanitation subsectors have no national policy in place to guide development. Sanitation therefore continues to be spread across different agencies responsible for water, health, education and community development, resulting in fragmentation. The main governing instrument is the Public Health Act and Regulations of 1990. These set health standards and provide, with respect to sanitation, a supervisory framework for maintenance of proper sanitary conditions of premises together with adequate measures for collection, removal, and sanitary disposal of human waste. Currently, the lack of subsector policy is being addressed with the recent formulation of a draft Policy with the Ministry of Health coordinating. However, longer term, a lead agency for the sanitation subsectors needs to be formally defined.
Figure 4Scorecard indicator scores relating to institutional framework compared to peer group (see endnotes)10
Gambia average scores
Averages, LICs, GNI p.p.<=$500
Source: CSO2 scorecard.
RWS
RSH
USH UWS
14
An AMCOW Country Status Overview
Strategic Investment Planning: Improving capacity. The sector lacks a comprehensive development plan for strategic investments. It is, therefore, difficult to establish priority areas for investment and ensure better coordination with all sector development partners. The situation may ultimately be attributed to the absence of adequate, validated, and up-to-date data on coverage. At present, there are multiple coverage data sources—MICS3 (2006); the Water Supply and Sanitation (WSS) Study (2005); The Gambia RWSSI Country Sector Situation Assessment Report (2004)—which provide different coverage figures based on varying basic definitions. Some donors have used these figures to make investment decisions in the sector. The current investment plan for urban water supply (UWS) is based on the lower access
figures provided by the 2005 WSS Study. The need for improving capacity for periodic inventories and functionality studies to update baseline data cannot be overemphasized. Such an inventory is currently underway for the rural subsector to provide adequate data for investment planning.
Overall coordination: Defining leadership. Previously, the only body that existed for sector coordination was the Water and Sanitation Working Group (WSWG). The WSWG established three subcommittees (Water Supply Provision, Hygiene Education, and Environmental Sanitation) to develop subsector strategies. The Group collaborated with decentralized structures such as the VillageWaterCommittees (VWCs) at the community level to coordinate
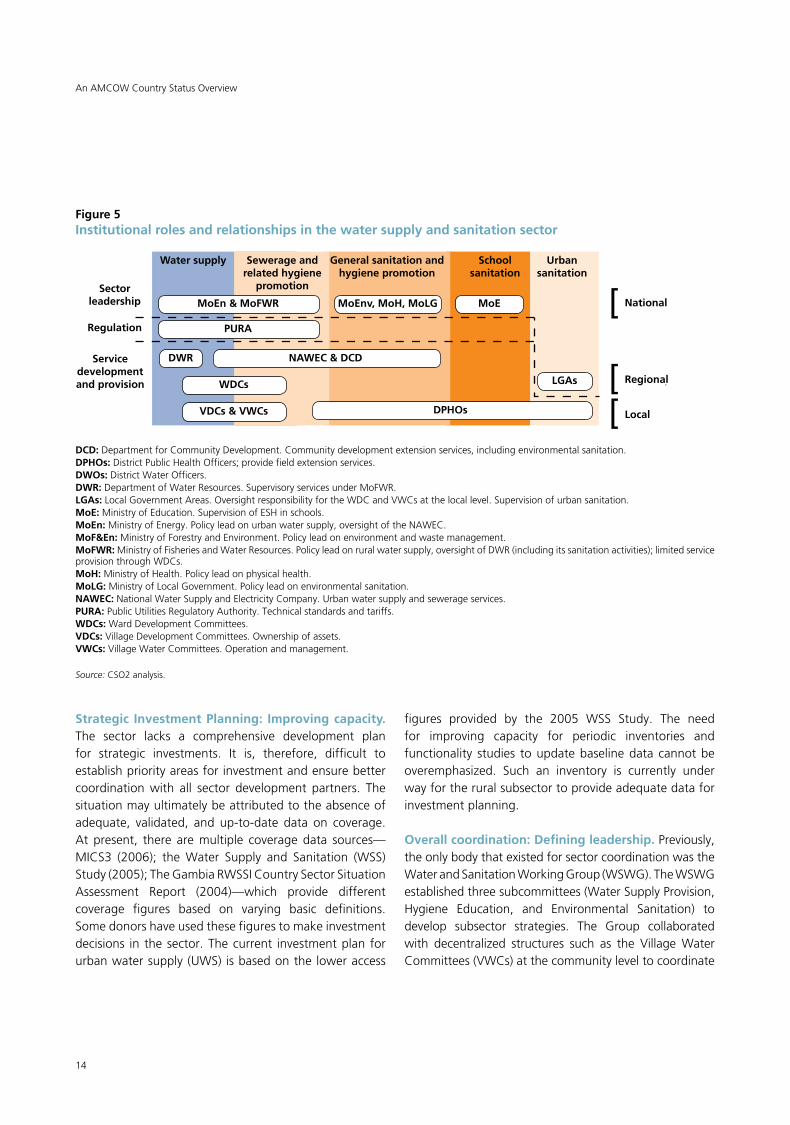
DCD: DepartmentforCommunityDevelopment.Communitydevelopmentextensionservices,includingenvironmentalsanitation.DPHOs:DistrictPublicHealthOfficers;providefieldextensionservices.DWOs:DistrictWaterOfficers.DWR:DepartmentofWaterResources.SupervisoryservicesunderMoFWR.LGAs: LocalGovernmentAreas.OversightresponsibilityfortheWDCandVWCsatthelocallevel.Supervisionofurbansanitation.MoE: Ministry of Education. Supervision of ESH in schools.MoEn: Ministry of Energy. Policy lead on urban water supply, oversight of the NAWEC.MoF&En: Ministry of Forestry and Environment. Policy lead on environment and waste management. MoFWR:MinistryofFisheriesandWaterResources.Policyleadonruralwatersupply,oversightofDWR(includingitssanitationactivities);limitedserviceprovisionthroughWDCs.MoH: Ministry of Health. Policy lead on physical health.MoLG: Ministry of Local Government. Policy lead on environmental sanitation.NAWEC: National Water Supply and Electricity Company. Urban water supply and sewerage services.PURA: Public Utilities Regulatory Authority. Technical standards and tariffs.WDCs:WardDevelopmentCommittees.VDCs: VillageDevelopmentCommittees.Ownershipofassets.VWCs: Village Water Committees. Operation and management.
Figure 5Institutional roles and relationships in the water supply and sanitation sector
Sector leadership
Water supply General sanitation andhygiene promotion
School sanitation
Urbansanitation
Servicedevelopment and provision
Regulation
MoEn & MoFWR
Sewerage andrelated hygiene
promotion
MoEnv, MoH, MoLG MoE
PURA
DWR NAWEC & DCD
WDCs
VDCs & VWCs DPHOs
LGAs
National
Regional
Local
[
[[
Source: CSO2 analysis.
15
interventions in water supply, sanitation, and hygiene education. The WSWG no longer functions but remains an example of workable arrangements in government to ensureadequatesectorcoordination,harmonization,andalignment of overseas development assistance within a commonframework.Atpresent,theDWRappearstoplaya leadership role and interacts individually with donors at different times in an unstructured manner that does not encourage setting of sector priorities, assessment of progress in relation to agreed targets or mapping out of future actions. In the present circumstances, donor interventions have been project based. The role of the MoFWR in providing leadership for water supply needs to be clearly articulated. Also, the sanitation subsector needs a leader assigned among the three ministries that currently carry out subsector functions: Environment, Health, and Local Government.
Private sector participation: Increasing the space for local entrepreneurs. The role of local entrepreneurs is gradually increasing. In the water supply subsector, they are contracted to construct urban and rural facilities and also supply spare parts for maintenance of rural facilities including solar powered reticulation systems (distribution systems for small towns and rural communities). The market for borehole drilling continues to be dominated by a few foreign firms. For sanitation, they provide construction of on-site sanitation facilities (in both rural and urban areas) and septic tank emptying services (in urban areas). Large-scale private investment is unlikely duetothestill-evolvingtariff regulationregime.Despitea relatively competitive domestic market in technology and related services, there is limited contracting of private enterprises toprovidespecializedsector relatedservices,particularly management and operation of RWS.
WaterSupplyandSanitationinTheGambia:TurningFinanceintoServicesfor2015andBeyond
16
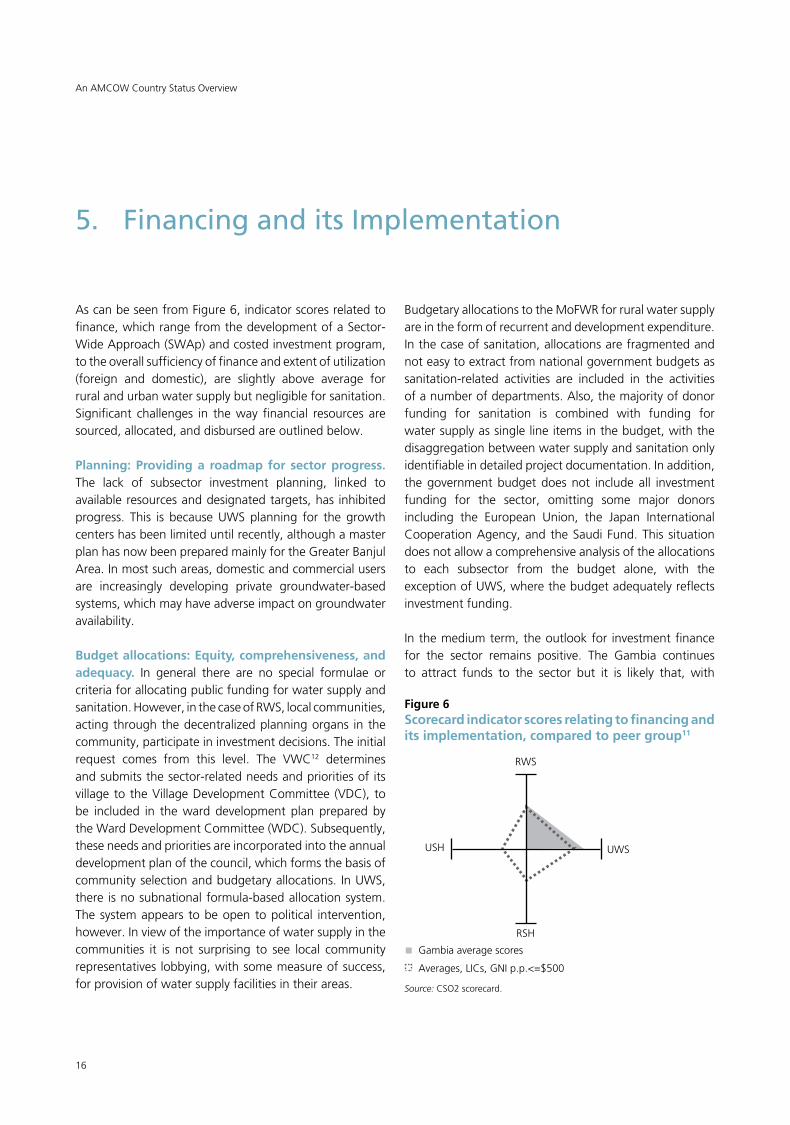
Figure 6Scorecard indicator scores relating to financing and its implementation, compared to peer group11
Gambia average scores
Averages, LICs, GNI p.p.<=$500
RWS
RSH
USH UWS
Source: CSO2 scorecard.
As can be seen from Figure 6, indicator scores related to finance, which range from the development of a Sector-Wide Approach (SWAp) and costed investment program, totheoverallsufficiencyoffinanceandextentofutilization(foreign and domestic), are slightly above average for rural and urban water supply but negligible for sanitation. Significant challenges in the way financial resources are sourced, allocated, and disbursed are outlined below. Planning: Providing a roadmap for sector progress. The lack of subsector investment planning, linked to available resources and designated targets, has inhibited progress. This is because UWS planning for the growth centers has been limited until recently, although a master planhasnowbeenpreparedmainlyfortheGreaterBanjulArea. In most such areas, domestic and commercial users are increasingly developing private groundwater-based systems, which may have adverse impact on groundwater availability.
Budget allocations: Equity, comprehensiveness, and adequacy. In general there are no special formulae or criteria for allocating public funding for water supply and sanitation. However, in the case of RWS, local communities, actingthroughthedecentralizedplanningorgans inthecommunity, participate in investment decisions. The initial request comes from this level. The VWC12 determines and submits the sector-related needs and priorities of its villagetotheVillageDevelopmentCommittee (VDC), tobe included in the ward development plan prepared by theWardDevelopmentCommittee(WDC).Subsequently,these needs and priorities are incorporated into the annual development plan of the council, which forms the basis of community selection and budgetary allocations. In UWS, there is no subnational formula-based allocation system. The system appears to be open to political intervention, however. In view of the importance of water supply in the communities it is not surprising to see local community representatives lobbying, with some measure of success, for provision of water supply facilities in their areas.
5. Financing and its Implementation
BudgetaryallocationstotheMoFWRforruralwatersupplyare in the form of recurrent and development expenditure. In the case of sanitation, allocations are fragmented and not easy to extract from national government budgets as sanitation-related activities are included in the activities of a number of departments. Also, the majority of donor funding for sanitation is combined with funding for water supply as single line items in the budget, with the disaggregation between water supply and sanitation only identifiable in detailed project documentation. In addition, the government budget does not include all investment funding for the sector, omitting some major donors including the European Union, the Japan International Cooperation Agency, and the Saudi Fund. This situation does not allow a comprehensive analysis of the allocations to each subsector from the budget alone, with the exception of UWS, where the budget adequately reflects investment funding.
In the medium term, the outlook for investment finance for the sector remains positive. The Gambia continues to attract funds to the sector but it is likely that, with
An AMCOW Country Status Overview
17
WaterSupplyandSanitationinTheGambia:TurningFinanceintoServicesfor2015andBeyond
the significant progress made in recent years, previous funding levels may not be sustained in the coming years. The government’s allocations are not likely to increase significantly in future because of the current economic climate, but in any case the contributions are very low in comparison to the level of investment required in the sector. A comprehensive review of the sector financing is necessary to map out future challenges and develop strategies to address them.
Expenditure: Improving utilization rate. Generally, projectsareobservedtoexperiencelowbudgetutilizationrates at project start up, largely due to strict donor disbursement and procurement procedures which result in disbursement rates of 10 percent to 30 percent. These initial delays often lead to project extensions. However, once these preliminary problems with donor procedures have been resolved disbursements can rise to over 70 percent within a short period. That notwithstanding, while governmentallocationsappeartobefullyutilized,donorallocationsoftenhavelessthan50percentutilizationrateoverall,andoptimizinguseofavailable resourceswithinplanned implementation periods of projects, particularly from donors, remains desirable.
Donor finance: Aligning and harmonizing. Donorassistance to WSS has been characterized by project
rather than programmatic approaches, often using parallel project implementation structures. This is partly attributed to the existing institutional weaknesses. Since 2006, the number of donors active in the sector has pointed to the need for overall sector coordination; according to the Second Poverty Reduction Strategy, the government is gradually adopting a SWAp in relation to development assistance. SWAps are considered to be an integral part of Government’s Aid Coordination Policy to ensure harmonized and aligned procurement anddisbursement procedures for donor funding. However, while the approach has been introduced in the health and education sectors, it has yet to be extended to the WSS sector. In the absence of adequate capacity for planning and management in WSS it will be difficult to successfully implement a SWAp, and this limitation may explain the gradual extension of SWAps to the other sectors.
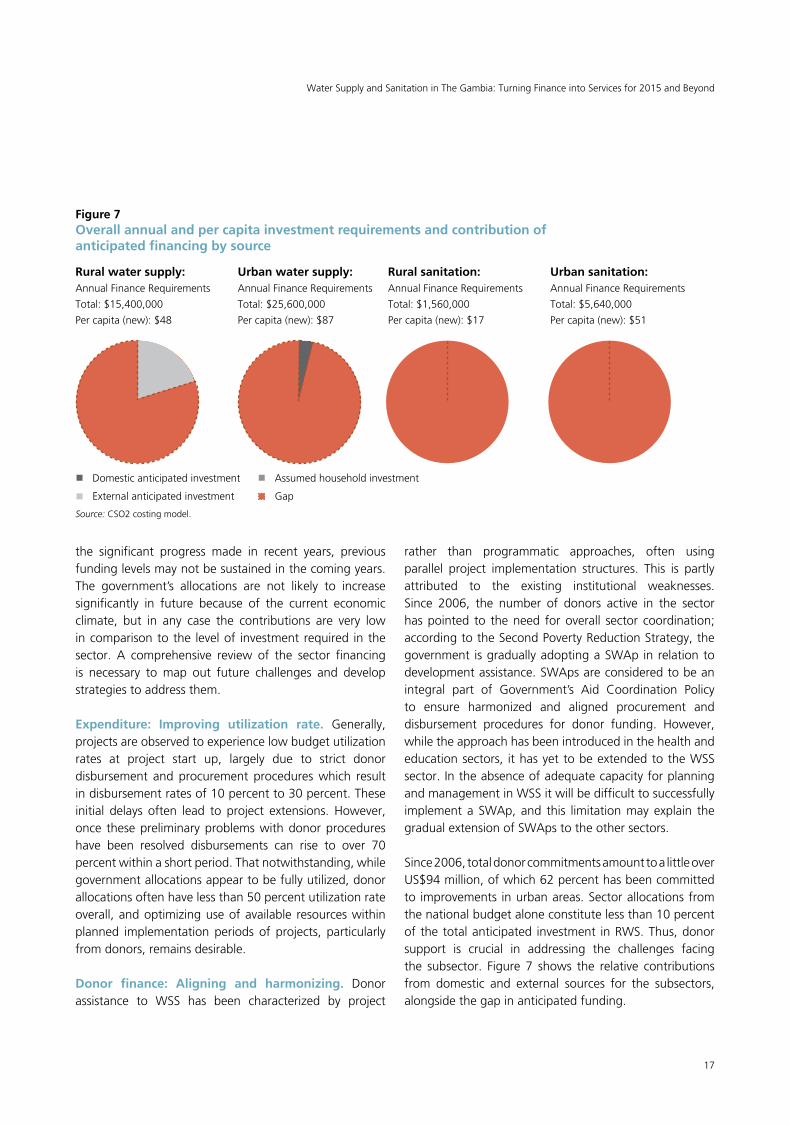
Since 2006, total donor commitments amount to a little over US$94 million, of which 62 percent has been committed to improvements in urban areas. Sector allocations from the national budget alone constitute less than 10 percent of the total anticipated investment in RWS. Thus, donor support is crucial in addressing the challenges facing the subsector. Figure 7 shows the relative contributions from domestic and external sources for the subsectors, alongside the gap in anticipated funding.
Rural water supply:Annual Finance Requirements
Total: $15,400,000
Per capita (new): $48
Urban water supply:Annual Finance Requirements
Total: $25,600,000
Per capita (new): $87
Rural sanitation:Annual Finance Requirements
Total: $1,560,000
Per capita (new): $17
Urban sanitation:Annual Finance Requirements
Total: $5,640,000
Per capita (new): $51
Domesticanticipatedinvestment
External anticipated investment
Assumed household investment
Gap
Source: CSO2 costing model.
Figure 7Overall annual and per capita investment requirements and contribution of anticipated financing by source
18
An AMCOW Country Status Overview
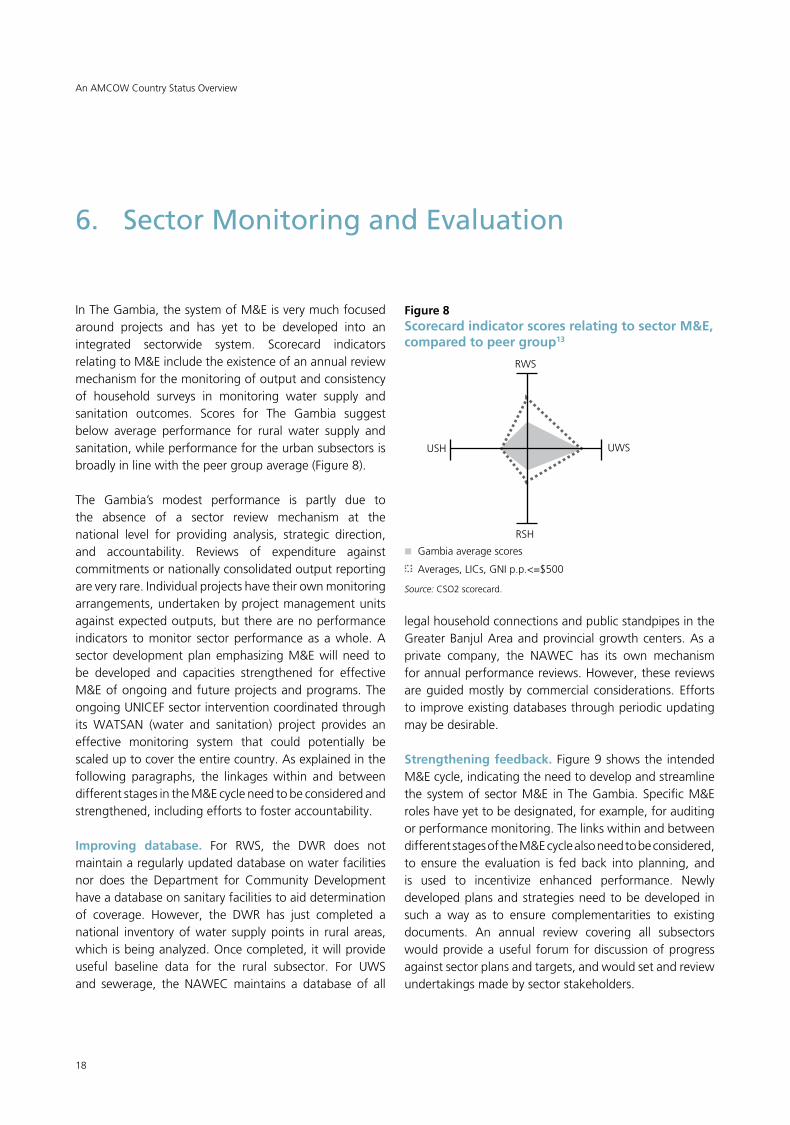
In The Gambia, the system of M&E is very much focused around projects and has yet to be developed into an integrated sectorwide system. Scorecard indicators relating to M&E include the existence of an annual review mechanism for the monitoring of output and consistency of household surveys in monitoring water supply and sanitation outcomes. Scores for The Gambia suggest below average performance for rural water supply and sanitation, while performance for the urban subsectors is broadly in line with the peer group average (Figure 8).
The Gambia’s modest performance is partly due to the absence of a sector review mechanism at the national level for providing analysis, strategic direction, and accountability. Reviews of expenditure against commitments or nationally consolidated output reporting are very rare. Individual projects have their own monitoring arrangements, undertaken by project management units against expected outputs, but there are no performance indicators to monitor sector performance as a whole. A sectordevelopmentplanemphasizingM&Ewillneed tobe developed and capacities strengthened for effective M&E of ongoing and future projects and programs. The ongoing UNICEF sector intervention coordinated through its WATSAN (water and sanitation) project provides an effective monitoring system that could potentially be scaled up to cover the entire country. As explained in the following paragraphs, the linkages within and between different stages in the M&E cycle need to be considered and strengthened, including efforts to foster accountability.
Improving database. For RWS, the DWR does notmaintain a regularly updated database on water facilities nor does the Department for Community Developmenthave a database on sanitary facilities to aid determination of coverage. However, the DWR has just completed anational inventory of water supply points in rural areas, whichisbeinganalyzed.Oncecompleted,itwillprovideuseful baseline data for the rural subsector. For UWS and sewerage, the NAWEC maintains a database of all
6. Sector Monitoring and Evaluation
legal household connections and public standpipes in the GreaterBanjulAreaandprovincialgrowthcenters.Asaprivate company, the NAWEC has its own mechanism for annual performance reviews. However, these reviews are guided mostly by commercial considerations. Efforts to improve existing databases through periodic updating may be desirable.
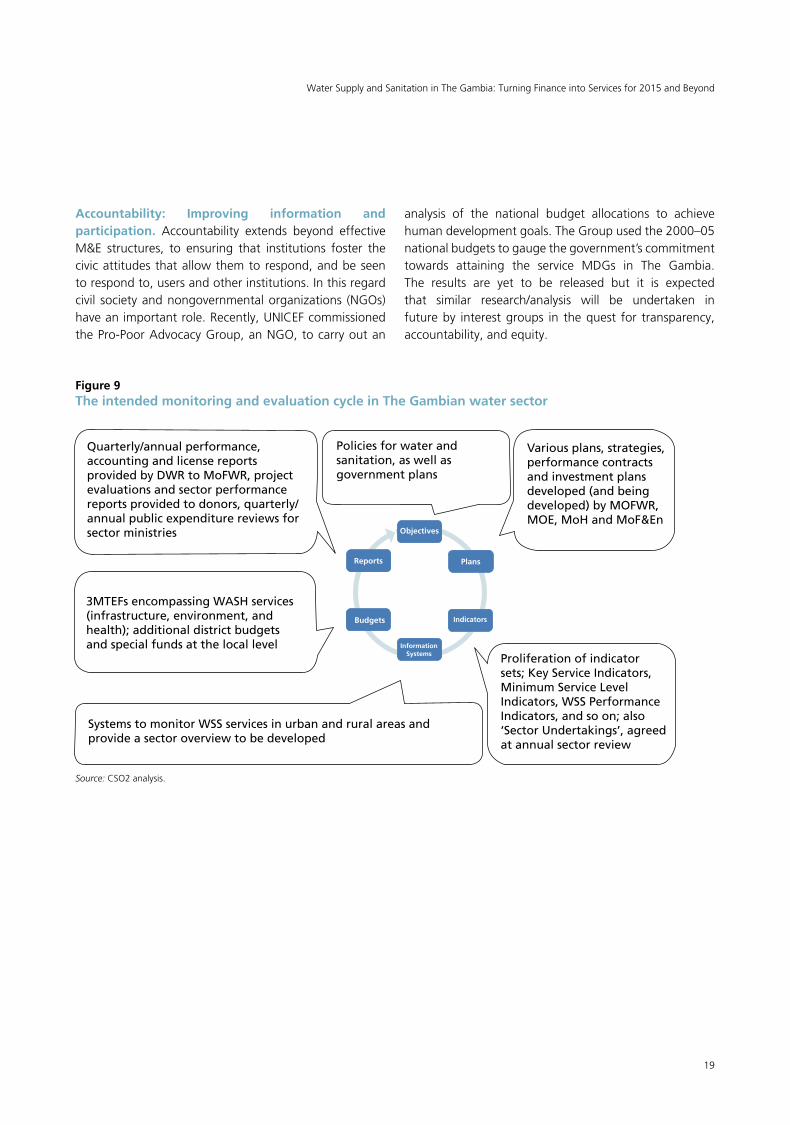
Strengthening feedback. Figure 9 shows the intended M&E cycle, indicating the need to develop and streamline the system of sector M&E in The Gambia. Specific M&E roles have yet to be designated, for example, for auditing or performance monitoring. The links within and between different stages of the M&E cycle also need to be considered, to ensure the evaluation is fed back into planning, and is used to incentivize enhanced performance. Newlydeveloped plans and strategies need to be developed in such a way as to ensure complementarities to existing documents. An annual review covering all subsectors would provide a useful forum for discussion of progress against sector plans and targets, and would set and review undertakings made by sector stakeholders.
Figure 8Scorecard indicator scores relating to sector M&E, compared to peer group13
RWS
RSH
Gambia average scores
Averages, LICs, GNI p.p.<=$500
USH UWS
Source: CSO2 scorecard.
19
WaterSupplyandSanitationinTheGambia:TurningFinanceintoServicesfor2015andBeyond
Accountability: Improving information and participation. Accountability extends beyond effective M&E structures, to ensuring that institutions foster the civic attitudes that allow them to respond, and be seen to respond to, users and other institutions. In this regard civil societyandnongovernmentalorganizations (NGOs)have an important role. Recently, UNICEF commissioned the Pro-Poor Advocacy Group, an NGO, to carry out an
Figure 9The intended monitoring and evaluation cycle in The Gambian water sector
Quarterly/annual performance, accounting and license reports provided by DWR to MoFWR, project evaluations and sector performance reports provided to donors, quarterly/annual public expenditure reviews for sector ministries
Policies for water and sanitation, as well as government plans
Various plans, strategies, performance contracts and investment plans developed (and being developed) by MOFWR, MOE, MoH and MoF&En
Proliferation of indicator sets; Key Service Indicators, Minimum Service Level Indicators, WSS Performance Indicators, and so on; also ‘Sector Undertakings’, agreed at annual sector review
3MTEFs encompassing WASH services (infrastructure, environment, and health); additional district budgets and special funds at the local level
Systems to monitor WSS services in urban and rural areas and provide a sector overview to be developed
Objectives
Plans
Budgets Indicators
Information Systems
Reports
analysis of the national budget allocations to achieve human development goals. The Group used the 2000–05 national budgets to gauge the government’s commitment towards attaining the service MDGs in The Gambia. The results are yet to be released but it is expected that similar research/analysis will be undertaken in future by interest groups in the quest for transparency, accountability, and equity.
Source: CSO2 analysis.
20
An AMCOW Country Status Overview
7. Subsector: Rural Water Supply
Priority actions for rural water supply
• DevelopLocalGovernmentAreacapacitytoassumeoverallresponsibilityandbettermanageprovisionofwater supply facilities in rural communities.
• Improvesubsectorcoordinationandinvestmentplanning,andimplementmeasuresforperiodic(annual)reviews alongside increased subsector funding.
• Enhance targeting of ruralwater supply investments by developing and implementing a database tomonitor coverage/functionality of rural water supply systems.
• Buildprivatesectorcapacityandenhancegreaterprivatesectorparticipationinthedevelopment,repair,and maintenance of water supply facilities.
• Promotegreatersensitizationforfullcommunityownershipoffacilitiesandstandardizetechnologiestofacilitate availability of spare parts.
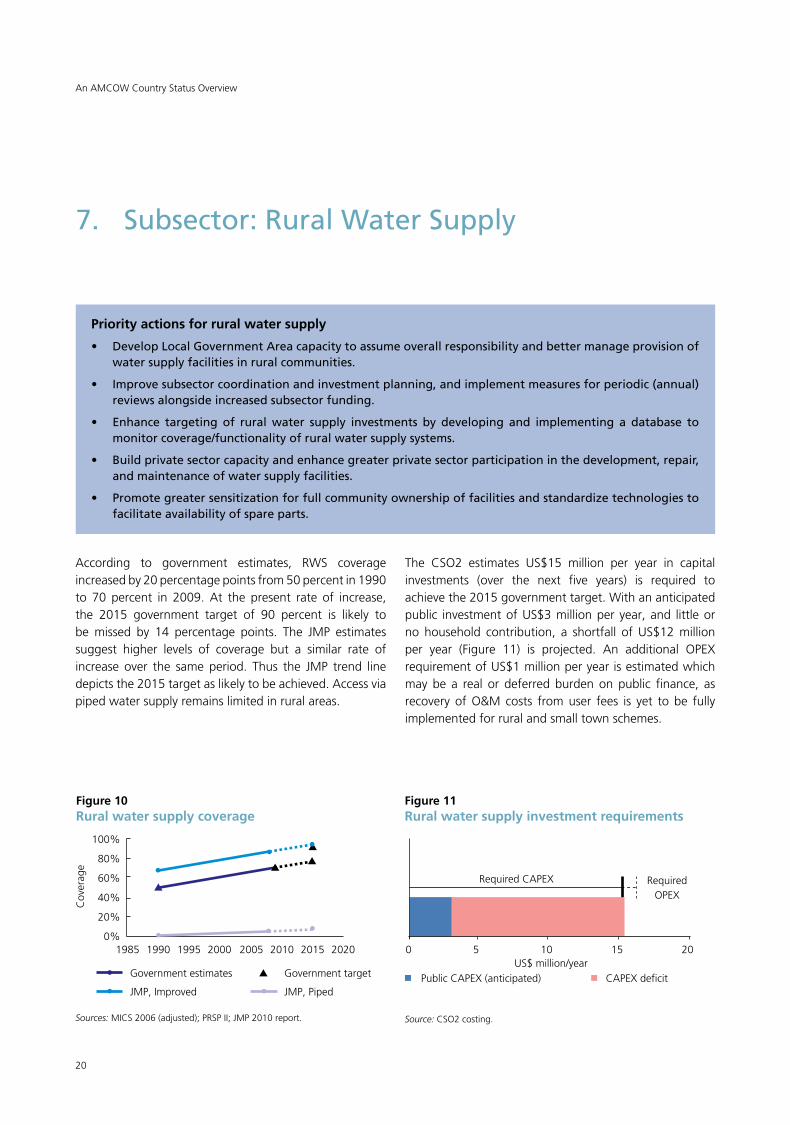
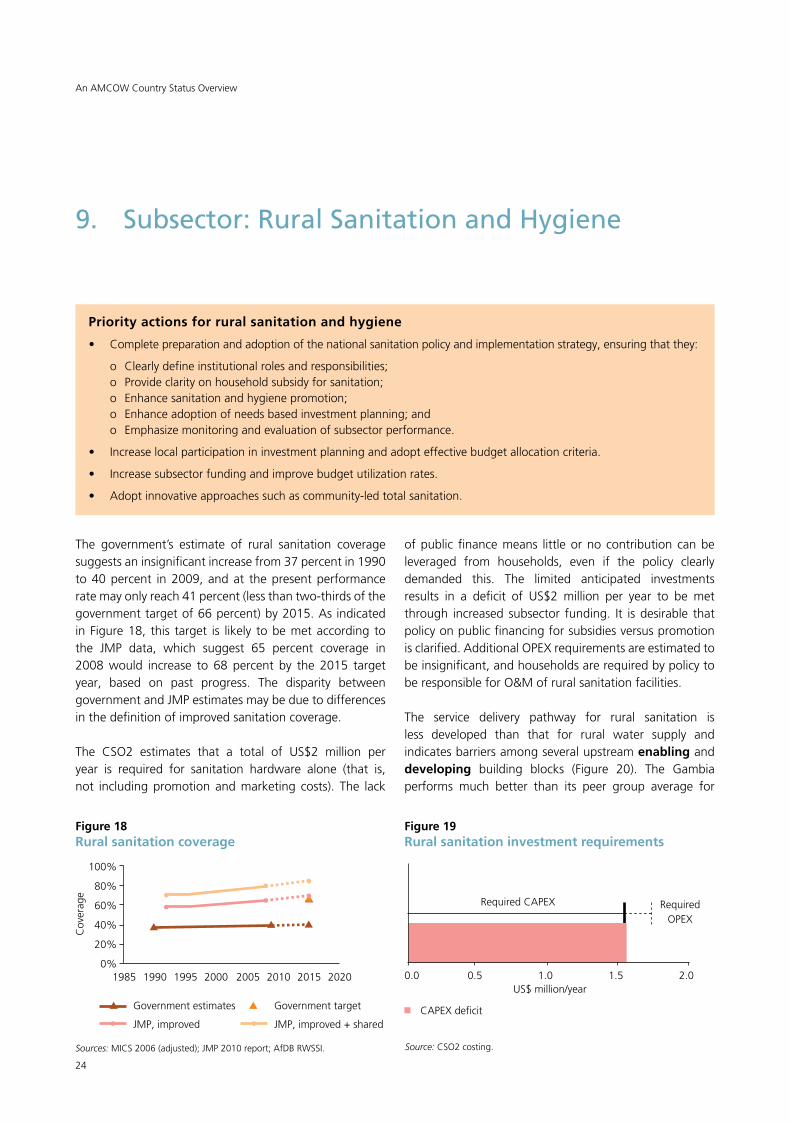
The CSO2 estimates US$15 million per year in capital investments (over the next five years) is required to achieve the 2015 government target. With an anticipated public investment of US$3 million per year, and little or no household contribution, a shortfall of US$12 million per year (Figure 11) is projected. An additional OPEX requirement of US$1 million per year is estimated which may be a real or deferred burden on public finance, as recovery of O&M costs from user fees is yet to be fully implemented for rural and small town schemes.
According to government estimates, RWS coverage increased by 20 percentage points from 50 percent in 1990 to 70 percent in 2009. At the present rate of increase, the 2015 government target of 90 percent is likely to be missed by 14 percentage points. The JMP estimates suggest higher levels of coverage but a similar rate of increase over the same period. Thus the JMP trend line depicts the 2015 target as likely to be achieved. Access via piped water supply remains limited in rural areas.
Figure 10Rural water supply coverage
100%
80%
60%
40%
20%
0%1985 1990 1995 2000 2005 2010 2015 2020
Government estimates Government target
Sources: MICS 2006 (adjusted); PRSP II; JMP 2010 report.
Figure 11Rural water supply investment requirements
0 5 10 15 20
Required CAPEX Required OPEX
US$ million/year
Source: CSO2 costing.
Cov
erag
e
JMP, Improved JMP, PipedPublic CAPEX (anticipated) CAPEX deficit
21
WaterSupplyandSanitationinTheGambia:TurningFinanceintoServicesfor2015andBeyond
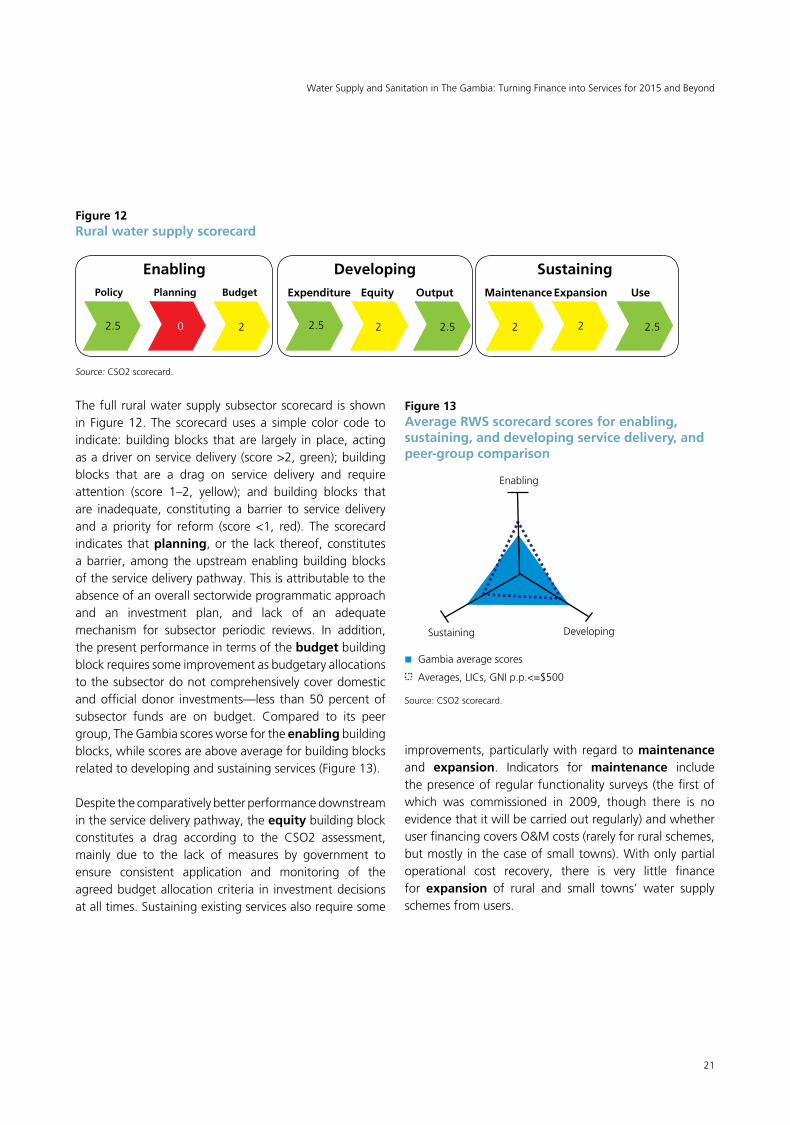
Figure 12Rural water supply scorecard
The full rural water supply subsector scorecard is shown in Figure 12. The scorecard uses a simple color code to indicate: building blocks that are largely in place, acting as a driver on service delivery (score >2, green); building blocks that are a drag on service delivery and require attention (score 1–2, yellow); and building blocks that are inadequate, constituting a barrier to service delivery and a priority for reform (score <1, red). The scorecard indicates that planning, or the lack thereof, constitutes a barrier, among the upstream enabling building blocks of the service delivery pathway. This is attributable to the absence of an overall sectorwide programmatic approach and an investment plan, and lack of an adequate mechanism for subsector periodic reviews. In addition, the present performance in terms of the budget building block requires some improvement as budgetary allocations to the subsector do not comprehensively cover domestic and official donor investments—less than 50 percent of subsector funds are on budget. Compared to its peer group, The Gambia scores worse for the enabling building blocks, while scores are above average for building blocks related to developing and sustaining services (Figure 13).
Despitethecomparativelybetterperformancedownstreamin the service delivery pathway, the equity building block constitutes a drag according to the CSO2 assessment, mainly due to the lack of measures by government to ensure consistent application and monitoring of the agreed budget allocation criteria in investment decisions at all times. Sustaining existing services also require some
improvements, particularly with regard to maintenance and expansion. Indicators for maintenance include the presence of regular functionality surveys (the first of which was commissioned in 2009, though there is no evidence that it will be carried out regularly) and whether user financing covers O&M costs (rarely for rural schemes, but mostly in the case of small towns). With only partial operational cost recovery, there is very little finance for expansion of rural and small towns’ water supply schemes from users.
EnablingPolicy
2.5 0 2 2.5 2 2.5 2 2.5
Planning Budget Expenditure Equity Output Maintenance Expansion Use
Developing Sustaining
Source: CSO2 scorecard.
Figure 13Average RWS scorecard scores for enabling, sustaining, and developing service delivery, and peer-group comparison
Enabling
Gambia average scores
Averages, LICs, GNI p.p.<=$500
Sustaining Developing
Source: CSO2 scorecard.
2
22
An AMCOW Country Status Overview
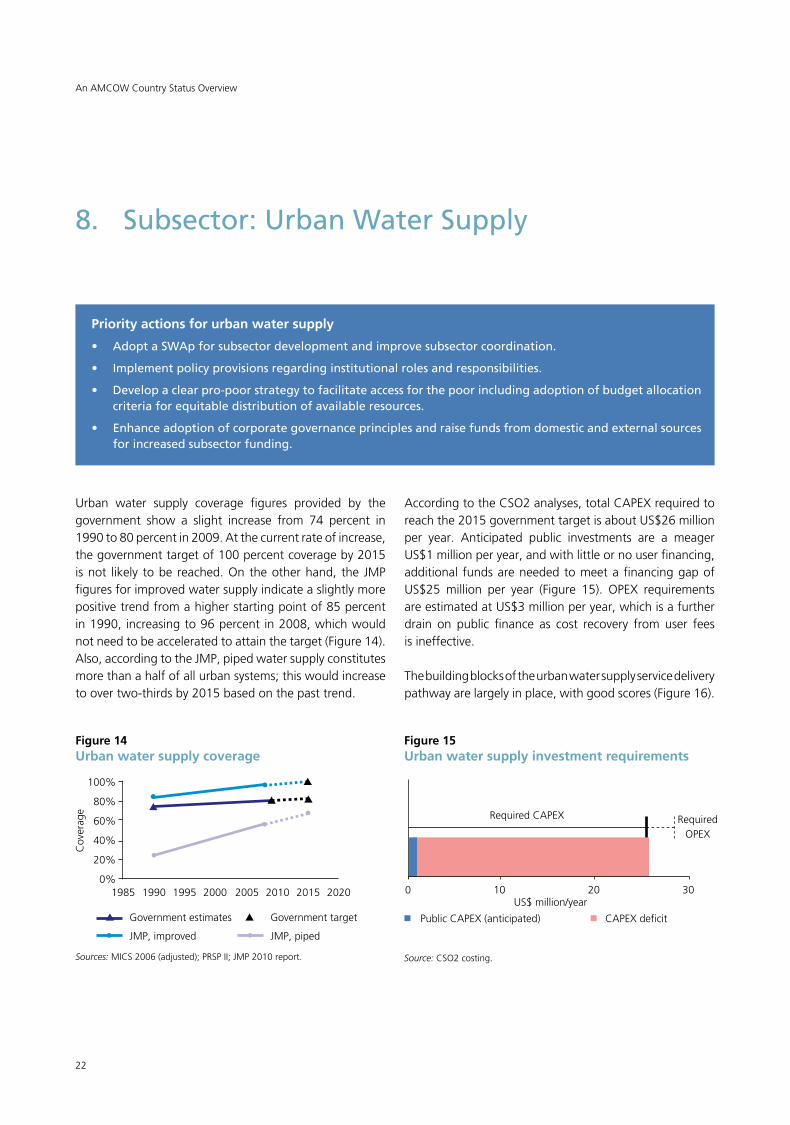
Urban water supply coverage figures provided by the government show a slight increase from 74 percent in 1990 to 80 percent in 2009. At the current rate of increase, the government target of 100 percent coverage by 2015 is not likely to be reached. On the other hand, the JMP figures for improved water supply indicate a slightly more positive trend from a higher starting point of 85 percent in 1990, increasing to 96 percent in 2008, which would not need to be accelerated to attain the target (Figure 14). Also, according to the JMP, piped water supply constitutes more than a half of all urban systems; this would increase to over two-thirds by 2015 based on the past trend.
8. Subsector: Urban Water Supply
Priority actions for urban water supply
• AdoptaSWApforsubsectordevelopmentandimprovesubsectorcoordination.
• Implementpolicyprovisionsregardinginstitutionalrolesandresponsibilities.
• Developaclearpro-poorstrategytofacilitateaccessforthepoorincludingadoptionofbudgetallocationcriteria for equitable distribution of available resources.
• Enhanceadoptionofcorporategovernanceprinciplesandraisefundsfromdomesticandexternalsourcesfor increased subsector funding.
According to the CSO2 analyses, total CAPEX required to reach the 2015 government target is about US$26 million per year. Anticipated public investments are a meager US$1 million per year, and with little or no user financing, additional funds are needed to meet a financing gap of US$25 million per year (Figure 15). OPEX requirements are estimated at US$3 million per year, which is a further drain on public finance as cost recovery from user fees is ineffective.
The building blocks of the urban water supply service delivery pathway are largely in place, with good scores (Figure 16).
Figure 14Urban water supply coverage
100%
80%
60%
40%
20%
0%1985 1990 1995 2000 2005 2010 2015 2020
Sources: MICS 2006 (adjusted); PRSP II; JMP 2010 report.
Figure 15Urban water supply investment requirements
Cov
erag
e
Government estimates Government target
JMP, improved JMP, piped
0 10 20 30
Required CAPEX Required OPEX
US$ million/year
Source: CSO2 costing.
Public CAPEX (anticipated) CAPEX deficit
23
WaterSupplyandSanitationinTheGambia:TurningFinanceintoServicesfor2015andBeyond
Figure 17Average UWS scorecard scores for enabling, sustaining, and developing service delivery, and peer-group comparison
Gambia average scores
Averages, LICs, GNI p.p.<=$500
Enabling
Sustaining Developing
Source: CSO2 scorecard.
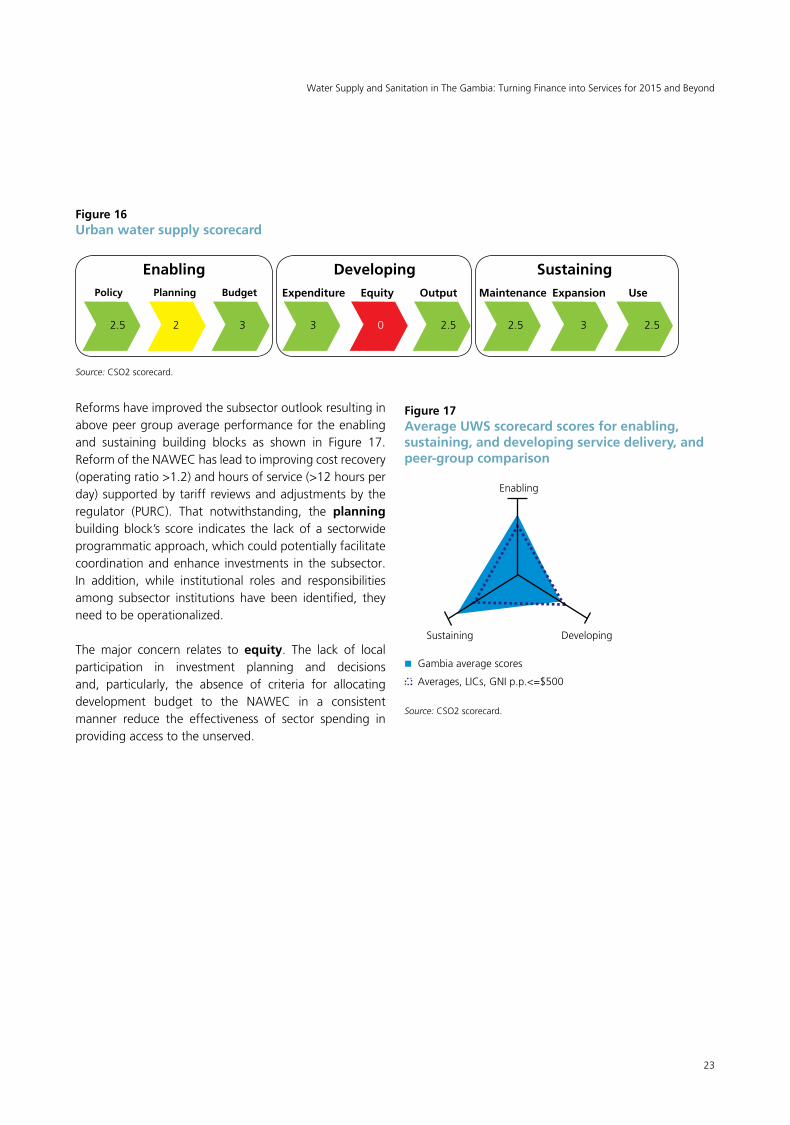
Reforms have improved the subsector outlook resulting in above peer group average performance for the enabling and sustaining building blocks as shown in Figure 17. Reform of the NAWEC has lead to improving cost recovery (operating ratio >1.2) and hours of service (>12 hours per day) supported by tariff reviews and adjustments by the regulator (PURC). That notwithstanding, the planning building block’s score indicates the lack of a sectorwide programmatic approach, which could potentially facilitate coordination and enhance investments in the subsector. In addition, while institutional roles and responsibilities among subsector institutions have been identified, they needtobeoperationalized.
The major concern relates to equity. The lack of local participation in investment planning and decisions and, particularly, the absence of criteria for allocating development budget to the NAWEC in a consistent manner reduce the effectiveness of sector spending in providing access to the unserved.
Figure 16Urban water supply scorecard
EnablingPolicy
2.5 2 3 3 0 2.5 2.5 3 2.5
Planning Budget Expenditure Equity Output Maintenance Expansion Use
Developing Sustaining
Source: CSO2 scorecard.
24
Priority actions for rural sanitation and hygiene
• Completepreparationandadoptionofthenationalsanitationpolicyandimplementationstrategy,ensuringthatthey:
o Clearly define institutional roles and responsibilities; o Provide clarity on household subsidy for sanitation; o Enhance sanitation and hygiene promotion; o Enhance adoption of needs based investment planning; and o Emphasizemonitoringandevaluationofsubsectorperformance.
• Increaselocalparticipationininvestmentplanningandadopteffectivebudgetallocationcriteria.
• Increasesubsectorfundingandimprovebudgetutilizationrates.
• Adoptinnovativeapproachessuchascommunity-ledtotalsanitation.
The government’s estimate of rural sanitation coverage suggests an insignificant increase from 37 percent in 1990 to 40 percent in 2009, and at the present performance rate may only reach 41 percent (less than two-thirds of the government target of 66 percent) by 2015. As indicated in Figure 18, this target is likely to be met according to the JMP data, which suggest 65 percent coverage in 2008 would increase to 68 percent by the 2015 target year, based on past progress. The disparity between government and JMP estimates may be due to differences in the definition of improved sanitation coverage.
The CSO2 estimates that a total of US$2 million per year is required for sanitation hardware alone (that is, not including promotion and marketing costs). The lack
9. Subsector: Rural Sanitation and Hygiene
of public finance means little or no contribution can be leveraged from households, even if the policy clearly demanded this. The limited anticipated investments results in a deficit of US$2 million per year to be met through increased subsector funding. It is desirable that policy on public financing for subsidies versus promotion is clarified. Additional OPEX requirements are estimated to be insignificant, and households are required by policy to be responsible for O&M of rural sanitation facilities.
The service delivery pathway for rural sanitation is less developed than that for rural water supply and indicates barriers among several upstream enabling and developing building blocks (Figure 20). The Gambia performs much better than its peer group average for
Figure 19Rural sanitation investment requirements
Source: CSO2 costing.
Figure 18Rural sanitation coverage
100%
80%
60%
40%
20%
0%1985 1990 1995 2000 2005 2010 2015 2020
Sources:MICS2006(adjusted);JMP2010report;AfDBRWSSI.
Cov
erag
e
0.0 0.5 1.0 1.5 2.0
Required CAPEX Required OPEX
US$ million/year
An AMCOW Country Status Overview
CAPEX deficitGovernment estimates Government target
JMP, improved JMP, improved + shared
25
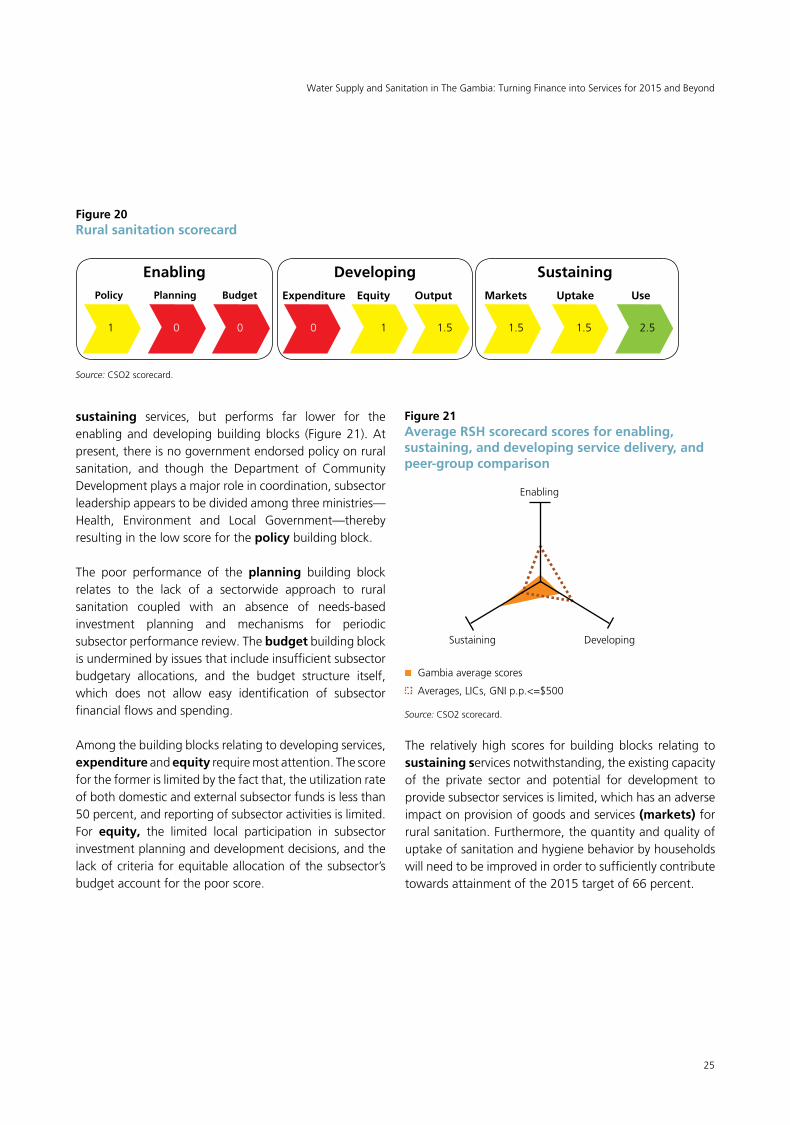
sustaining services, but performs far lower for the enabling and developing building blocks (Figure 21). At present, there is no government endorsed policy on rural sanitation, and though the Department of CommunityDevelopmentplaysamajorroleincoordination,subsectorleadership appears to be divided among three ministries—Health, Environment and Local Government—thereby resulting in the low score for the policy building block.
The poor performance of the planning building block relates to the lack of a sectorwide approach to rural sanitation coupled with an absence of needs-based investment planning and mechanisms for periodic subsector performance review. The budget building block is undermined by issues that include insufficient subsector budgetary allocations, and the budget structure itself, which does not allow easy identification of subsector financial flows and spending.
Among the building blocks relating to developing services, expenditure and equity require most attention. The score fortheformerislimitedbythefactthat,theutilizationrateof both domestic and external subsector funds is less than 50 percent, and reporting of subsector activities is limited. For equity, the limited local participation in subsector investment planning and development decisions, and the lack of criteria for equitable allocation of the subsector’s budget account for the poor score.
The relatively high scores for building blocks relating to sustaining services notwithstanding, the existing capacity of the private sector and potential for development to provide subsector services is limited, which has an adverse impact on provision of goods and services (markets) for rural sanitation. Furthermore, the quantity and quality of uptake of sanitation and hygiene behavior by households will need to be improved in order to sufficiently contribute towards attainment of the 2015 target of 66 percent.
Figure 20Rural sanitation scorecard
EnablingPolicy
1 0 0 0 1 1.5 1.5 1.5 2.5
Planning Budget Expenditure Equity Output Markets Uptake Use
Developing Sustaining
Source: CSO2 scorecard.
Figure 21Average RSH scorecard scores for enabling, sustaining, and developing service delivery, and peer-group comparison
Enabling
Gambia average scores
Averages, LICs, GNI p.p.<=$500
Sustaining Developing
Source: CSO2 scorecard.
WaterSupplyandSanitationinTheGambia:TurningFinanceintoServicesfor2015andBeyond
26
An AMCOW Country Status Overview
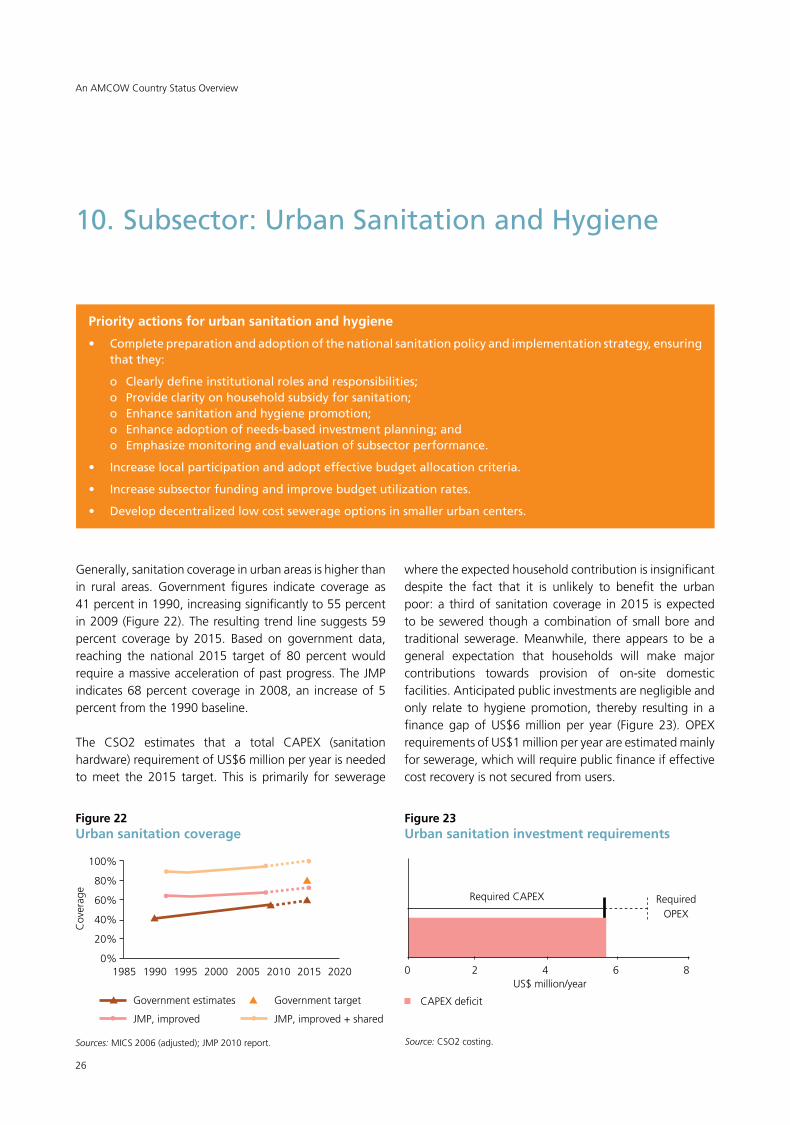
Generally, sanitation coverage in urban areas is higher than in rural areas. Government figures indicate coverage as 41 percent in 1990, increasing significantly to 55 percent in 2009 (Figure 22). The resulting trend line suggests 59 percent coverage by 2015. Based on government data,reaching the national 2015 target of 80 percent would require a massive acceleration of past progress. The JMP indicates 68 percent coverage in 2008, an increase of 5 percent from the 1990 baseline.
The CSO2 estimates that a total CAPEX (sanitation hardware) requirement of US$6 million per year is needed to meet the 2015 target. This is primarily for sewerage
10. Subsector: Urban Sanitation and Hygiene
Priority actions for urban sanitation and hygiene
• Completepreparationandadoptionofthenationalsanitationpolicyandimplementationstrategy,ensuringthat they:
o Clearly define institutional roles and responsibilities; o Provide clarity on household subsidy for sanitation; o Enhance sanitation and hygiene promotion; o Enhanceadoptionofneeds-basedinvestmentplanning;and o Emphasizemonitoringandevaluationofsubsectorperformance.
• Increaselocalparticipationandadopteffectivebudgetallocationcriteria.
• Increasesubsectorfundingandimprovebudgetutilizationrates.
• Developdecentralizedlowcostsewerageoptionsinsmallerurbancenters.
where the expected household contribution is insignificant despite the fact that it is unlikely to benefit the urban poor: a third of sanitation coverage in 2015 is expected to be sewered though a combination of small bore and traditional sewerage. Meanwhile, there appears to be a general expectation that households will make major contributions towards provision of on-site domestic facilities. Anticipated public investments are negligible and only relate to hygiene promotion, thereby resulting in a finance gap of US$6 million per year (Figure 23). OPEX requirements of US$1 million per year are estimated mainly for sewerage, which will require public finance if effective cost recovery is not secured from users.
Figure 23Urban sanitation investment requirements
Source: CSO2 costing.
Figure 22Urban sanitation coverage
100%
80%
60%
40%
20%
0%1985 1990 1995 2000 2005 2010 2015 2020
Sources: MICS 2006 (adjusted); JMP 2010 report.
Cov
erag
e
Government estimates Government target
JMP, improved JMP, improved + shared
0 2 4 6 8
Required CAPEX Required OPEX
US$ million/year
CAPEX deficit
27
WaterSupplyandSanitationinTheGambia:TurningFinanceintoServicesfor2015andBeyond
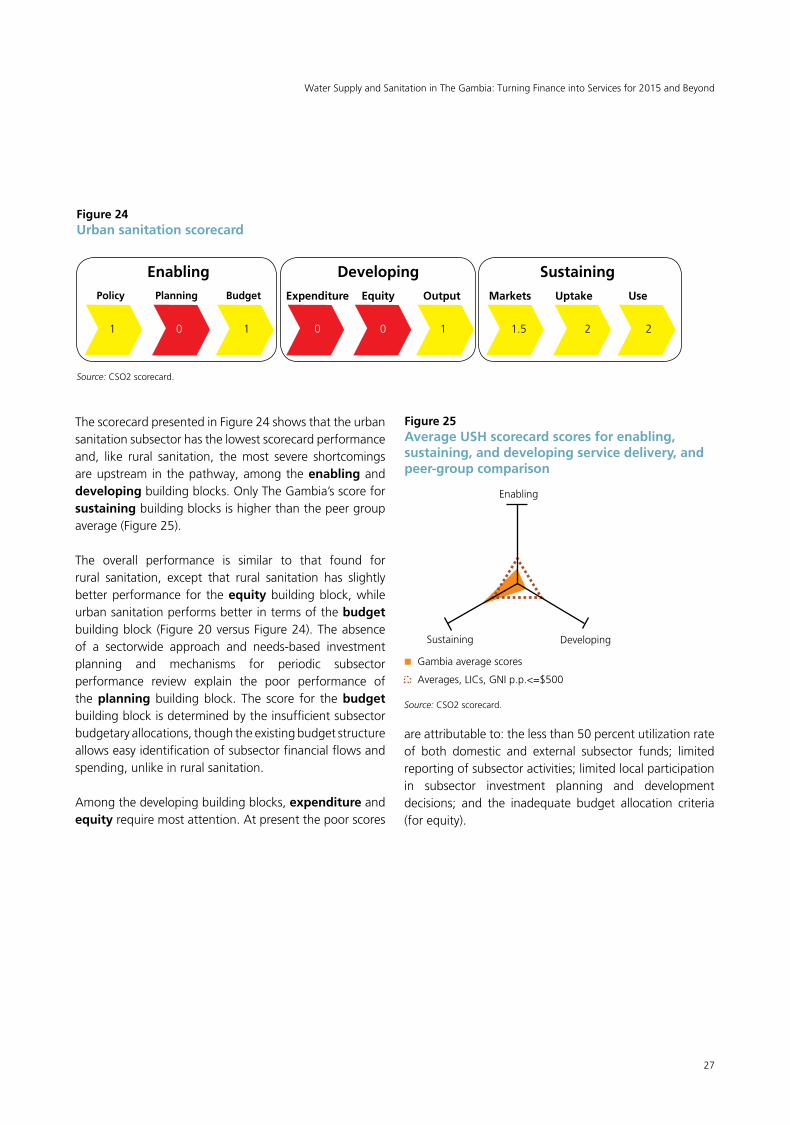
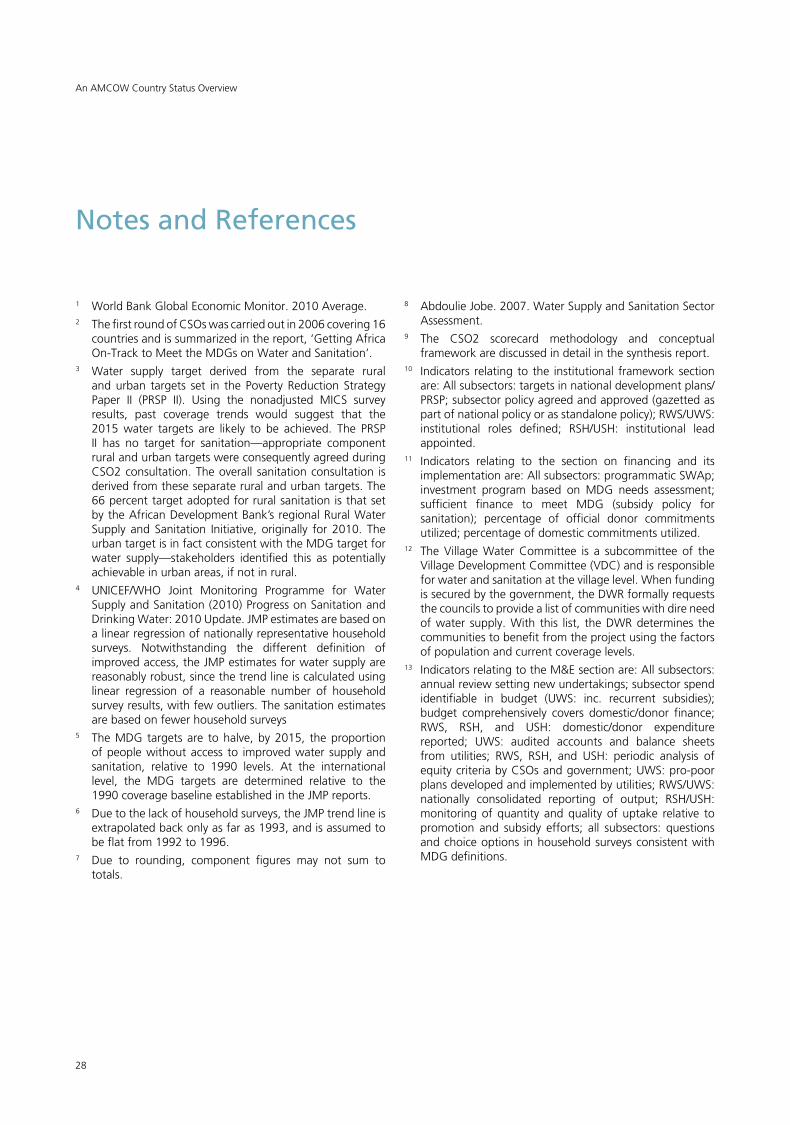
The scorecard presented in Figure 24 shows that the urban sanitation subsector has the lowest scorecard performance and, like rural sanitation, the most severe shortcomings are upstream in the pathway, among the enabling and developing building blocks. Only The Gambia’s score for sustaining building blocks is higher than the peer group average (Figure 25).
The overall performance is similar to that found for rural sanitation, except that rural sanitation has slightly better performance for the equity building block, while urban sanitation performs better in terms of the budget building block (Figure 20 versus Figure 24). The absence of a sectorwide approach and needs-based investment planning and mechanisms for periodic subsector performance review explain the poor performance of the planning building block. The score for the budget building block is determined by the insufficient subsector budgetary allocations, though the existing budget structure allows easy identification of subsector financial flows and spending, unlike in rural sanitation.
Among the developing building blocks, expenditure and equity require most attention. At present the poor scores
areattributableto:thelessthan50percentutilizationrateof both domestic and external subsector funds; limited reporting of subsector activities; limited local participation in subsector investment planning and development decisions; and the inadequate budget allocation criteria (for equity).
Figure 24Urban sanitation scorecard
EnablingPolicy
1 0 1 0 0 1 1.5 2 2
Planning Budget Expenditure Equity Output Markets Uptake Use
Developing Sustaining
Figure 25Average USH scorecard scores for enabling, sustaining, and developing service delivery, and peer-group comparison
Enabling
Gambia average scores
Averages, LICs, GNI p.p.<=$500
Source: CSO2 scorecard.
Source: CSO2 scorecard.
Sustaining Developing
28
An AMCOW Country Status Overview
1 WorldBankGlobalEconomicMonitor.2010Average.2 The first round of CSOs was carried out in 2006 covering 16
countriesandissummarizedinthereport,‘GettingAfricaOn-TracktoMeettheMDGsonWaterandSanitation’.
3 Water supply target derived from the separate rural and urban targets set in the Poverty Reduction Strategy Paper II (PRSP II). Using the nonadjusted MICS survey results, past coverage trends would suggest that the 2015 water targets are likely to be achieved. The PRSP II has no target for sanitation—appropriate component rural and urban targets were consequently agreed during CSO2 consultation. The overall sanitation consultation is derived from these separate rural and urban targets. The 66 percent target adopted for rural sanitation is that set bytheAfricanDevelopmentBank’sregionalRuralWaterSupply and Sanitation Initiative, originally for 2010. The urbantargetisinfactconsistentwiththeMDGtargetforwater supply—stakeholders identified this as potentially achievable in urban areas, if not in rural.
4 UNICEF/WHO Joint Monitoring Programme for Water Supply and Sanitation (2010) Progress on Sanitation and DrinkingWater:2010Update.JMPestimatesarebasedona linear regression of nationally representative household surveys. Notwithstanding the different definition of improved access, the JMP estimates for water supply are reasonably robust, since the trend line is calculated using linear regression of a reasonable number of household survey results, with few outliers. The sanitation estimates are based on fewer household surveys
5 TheMDG targetsare tohalve,by2015, theproportionof people without access to improved water supply and sanitation, relative to 1990 levels. At the international level, the MDG targets are determined relative to the1990 coverage baseline established in the JMP reports.
6 Duetothelackofhouseholdsurveys,theJMPtrendlineisextrapolated back only as far as 1993, and is assumed to be flat from 1992 to 1996.
7 Due to rounding, component figures may not sum tototals.
Notes and References
8 Abdoulie Jobe. 2007. Water Supply and Sanitation Sector Assessment.
9 The CSO2 scorecard methodology and conceptual framework are discussed in detail in the synthesis report.
10 Indicators relating to the institutional framework section are: All subsectors: targets in national development plans/PRSP;subsectorpolicyagreedandapproved(gazettedaspart of national policy or as standalone policy); RWS/UWS: institutional roles defined; RSH/USH: institutional lead appointed.
11 Indicators relating to the section on financing and its implementation are: All subsectors: programmatic SWAp; investment program based onMDG needs assessment;sufficient finance to meet MDG (subsidy policy forsanitation); percentage of official donor commitments utilized;percentageofdomesticcommitmentsutilized.
12 The Village Water Committee is a subcommittee of the VillageDevelopmentCommittee(VDC)andisresponsiblefor water and sanitation at the village level. When funding issecuredbythegovernment,theDWRformallyrequeststhe councils to provide a list of communities with dire need ofwater supply.With this list, theDWRdetermines thecommunities to benefit from the project using the factors of population and current coverage levels.
13 Indicators relating to the M&E section are: All subsectors: annual review setting new undertakings; subsector spend identifiable in budget (UWS: inc. recurrent subsidies); budget comprehensively covers domestic/donor finance; RWS, RSH, and USH: domestic/donor expenditure reported; UWS: audited accounts and balance sheets from utilities; RWS, RSH, and USH: periodic analysis of equity criteria by CSOs and government; UWS: pro-poor plans developed and implemented by utilities; RWS/UWS: nationally consolidated reporting of output; RSH/USH: monitoring of quantity and quality of uptake relative to promotion and subsidy efforts; all subsectors: questions and choice options in household surveys consistent with MDGdefinitions.
The first round of Country Status Overviews (CSO1) published in 2006 benchmarked the preparedness of sectors of 16 countries in Africa to meet the WSS MDGs based on their medium-term spending plans and a set of ‘success factors’ selected from regional experience. Combined with a process of national stakeholder consultation, this prompted countries to ask whether they had those ‘success factors’ in place and, if not, whether they should put them in place.
The second round of Country Status Overviews (CSO2) has built on both the method and the process developed in CSO1. The ‘success factors’ have been supplemented with additional factors drawn from country and regional analysis to develop the CSO2 scorecard. Together these reflect the essential steps, functions and results in translating finance into services through government systems—in line with Paris Principles for aid effectiveness. The data and summary assessments have been drawn from local data sources and compared with internationally reported data, and, wherever possible, the assessments have been subject to broad-based consultations with lead government agencies and country sector stakeholders, including donor institutions.
This second set of 32 Country Status Overviews (CSO2) on water supply and sanitation was commissioned by the African Ministers’ Council on Water (AMCOW). Development of the CSO2 was led by the World Bank administered Water and Sanitation Program (WSP) in collaboration with the African Development Bank (AfDB), the United Nations Children’s Fund (UNICEF), the World Bank, and the World Health Organization (WHO).
This report was produced in collaboration with the Government of The Gambia and other stakeholders during 2009/10. Some sources cited may be informal documents that are not readily available.
The findings, interpretations, and conclusions expressed in this volume do not necessarily reflect the views of the collaborating institutions, their Executive Directors, or the governments they represent. The collaborating institutions do not guarantee the accuracy of the data included in this work. The boundaries, colors, denominations, and other information shown on any map in this work do not imply any judgment on the part of the collaborating institutions concerning the legal status of any territory or the endorsement or acceptance of such boundaries.
The material in this publication is copyrighted. Requests for permission to reproduce portions of it should be sent to [email protected]. The collaborating institutions encourage the dissemination of this work and will normally grant permission promptly. For more information, please visit www.amcow.net or www.wsp.org.
Photograph credits: Getty Images
© 2011 Water and Sanitation Program

For enquiries, contact:Water and Sanitation Program–Africa RegionThe World Bank, Upper Hill RoadP.O. Box 30577, 00100, Nairobi, KenyaTel: +(254) 20 322 6300 E-mail: [email protected] site: www.wsp.org
An AMCOW Country Status Overview
Water Supply and Sanitation in The GambiaTurning Finance into Services for 2015 and Beyond


