Embed Size (px)
Citation preview
Principled and constructive approaches and h-type indices
Gangan Prathap
CSIR National Institute for Interdisciplinary Science and Technology,
Thiruvananthapuram 695019, India; [email protected]
Abstract
We examine two classes of h-type indices; those that emerge
from a heuristic algorithm or construction and those that are
deduced from the citation sequence by ordered mathematical
operations using first principles. We shall call these
constructive approaches and principled approaches. These
indices are then compared using some real life examples. One
relates to papers on the topic of h-index itself; the other is
a bibliometric analyses of studies on the monsoon cycle over
South Asia and the forces that drive this annual cycle and its
variability from year to year and within the season. The
bibliometric analyses breaks down scholarly performance into
three primary components - quantity, quality and consistency
using citation data is retrieved from the Web of Science and
two h-type indices are derived from these primary components.
Keywords Bibliometrics ∙ Indicators ∙ Quality ∙ Quantity ∙
Consistency ∙ Constructed indices ∙ Principled indices
1
Introduction
Einstein (1954) had an interesting view on the nature of
scientific theory. Most scientific theories model phenomena
based on facts; these belong to a class he called the
constructive type originating from empirically observed
principles ordered into meaningful patterns using imaginary
or speculative conjectures and hypotheses (Chatterjee 2012).
These are accepted as accurate representations of the world of
experience, until falsified. However, constructive theories
lack unifying principles to explain why the world is what it
is (Gefter 2005). On the other hand, principled theories start
with first principles that underlie the theory and then work
down to deduce the facts; they are deductive (Gefter 2013).
"The supreme task of the physicist is to arrive at those
universal elementary laws from which the cosmos can be built
up by pure deduction," Einstein said (Gefter 2013). This
classification is very useful in building up a framework for
understanding the major problems in physics. In extending this
logic to rationalize how approaches to derive h-type indices
are founded, we must use this classification in a slightly
different way from what Einstein had intended. That is the
purpose of the present paper.
2
Informetric indicators and indices start with a basic sequence
called the citation sequence or distribution. If an actor
(author, group, institution or country, etc.) has P
publications and the k-th publication in this set has ck
citations, then ck, k = 1 to P is the citation
sequence. The earliest bibliometric indicators used for
research evaluation where naturally:
P, the number of papers in the publication set, which is a
proxy for quantity or size,
C = Σck, k = 1 to P, the total number of citations
and
i = C/P, the impact, which is taken as a proxy for the quality
of the publication set.
We can think of P and i as primary bibliometric indicators
of the parameter space and consider the information production
process as being two-dimensional in nature. Note that in this
conceptual scheme, C is derived as a product of a quantity
term and a quality term. While both P and i have the
dimensions of P (indicated as order of P, or O(P)), we see
that C has the dimensions of O(P2). One can think of P
as being generated from the operation P = Σ(ck)0, k = 1
to P while C is generated from the operation C = Σ(ck)1,
k = 1 to P. In this sense, P is a zeroth-order
indicator and C is a first-order indicator. To
simplify, if P is thought of as a zeroth-order measure of
scholarly performance, being a proxy for the quantity of
3
scholarly output, C = iP is the first-order measure of
scholarly performance. Thus impact i emerges at the
first-order level. Table 1 summarizes this. So far, all
these indicators are derived by basic mathematical operations
in a deductive way and can be called a "principled" approach.
The Hirsch index (or h-index) was introduced as a single
number informetric measure by using a heuristic construction
or algorithm on the citation sequence (Hirsch 2005). It was
intended to combine the quantity and quality dimensions into
a single number measure of performance. It is in this sense,
that it is a constructive approach as it does not start from
basic principles. Since then, more than a thousand articles
have used this metric in bibliometric, scientometric and
informetric research and also routine research assessment
exercises and several dozen copy-cat h-type constructions
have followed (Bornmann et al. 2011). However, only two indices
have been generated by purely deductive procedures, namely the
p- and z-indices. In the next section, we shall review these
three indices before we use them in a real life example.
The h-index and other h-type indices as constructed indices.
Nature's editorial on the h-index (Ball, 2005) very quickly
brought international attention to Hirsch's (2005) proposal
that a single number could serve as an index for measuring
research achievement. Just as the h-index sums up the life-
4
time publication achievement or performance of an individual
scientist, nearly half-a-century earlier, the great
astrophysicist Sir Arthur Stanley Eddington had introduced a
single number entity called the cycling number n. Eddington
was an avid cycling enthusiast and he devised this criterion
for assessing lifetime cycling progress: the largest number n
such that one had cycled n or more miles on n different
days (Chandrasekhar, 1991). Edwards (2005) records that some
35 years before Hirsch's landmark paper, the geophysicist
Harold Jeffrey's was already recording his cycling prowess in
terms of the number n, having learned this idea from his
fellow cyclist Eddington. Note here the emphasis on words like
"prowess", "achievement" and "performance". Also on the use of
the qualifier "largest". This will be of significance later in
this discussion. Another aspect that is easy to ignore is the
key role the elementary units of measurement play in
determining the value of n. Eddington's algorithm is
effective because cycling distance is measured in miles and
the time windows are taken as days. Thus, Harold Jeffrey's n
which was 70 when he communicated this value to Edwards (2005)
made sense only in such units. If distances were measure in
centimetres or inches and time windows were taken in minutes,
or weeks, it may not have led to any meaningful number.
Hirsch’s (2005) definition relies on using papers and
citations as the units of measurement and life-time or
particularly chosen publication and citation windows as the
unit of time:
5
"I propose the index h, defined as the number of papers with
citation number ≥h, as a useful index to characterize the
scientific output of a researcher."
The calculation of the h-index proceeds thus: A scientist has
index h if h of her P papers during the chosen
publication window (say a life-time) have at least h
citations each during the chosen citations window, and the
other (P - h) papers have no more than h citations each. That
this value is the "largest" meeting this criterion is
implied. The h-index cannot be computed in a trivial manner if
the citation sequence is chronological or arranged in any
other fashion (e.g. in ascending order) and would need a
special algorithmic procedure. The simplest procedure to
compute h requires citations to be rearranged in descending
order according to rank. This need arises from the definition
of the h-index, as the highest number h of papers of a
scientist that have been cited h or more times. The
construction for h is facilitated by arranging citations in
descending order according to rank and displayed graphically
with citations on the y-axis and rank of papers on the x-axis.
That is, a paper at rank k that has ck citations is
displayed by a bar of unit width, and a height ck Schreiber
(2008, 2009). The h-index is then read off this sequence as
ck h c≥ ≥ k+1.
6
The h-index is a single, simple measure that combines papers,
a proxy of quantity and citations, actually a proxy of the
product of impact and quantity (Egghe, 2010). The advantages
and disadvantages have been neatly summarized by Egghe (2010).
Various generalizations and variants of the h-index, mostly
based on constructions, have emerged (Egghe, 2010). The h-
index is insensitive to the citations received in the h-core.
The most successful of these is perhaps the g-index which was
introduced by Egghe (2006a, 2006b, 2006c) to correct for this.
Most of these indices are highly correlated with each other
and in that sense, redundant.
The p- and z-indices as emerging from principled
approaches.
The p-index was originally introduced as a mock h-index
(Prathap 2010). The p-index was inspired by, and can be
thought of as a proxy of the h-index based entirely on
theoretical foundations which first appeared in Glanzel (2006)
and was empirically tested first in Schubert and Glanzel
(2007). This was a natural result of the attempts to relate h
to conventional scientometric measures like productivity
(total number of papers P), citation impact (total citations
C) and quality expressed as an impact (i = C/P). A composite
indicator appeared from this exercises, which was (C2/P)1/3. To
the physicist or engineer, this has the dimensions of h or P.
7
Interestingly, Glanzel had warned that ‘‘it is not intended
to substitute the h-index.’’ Prathap (2010) suggested that it
is profitable to disregard Glanzel’s well meaning caveat and
instead proposed that there may well be merit in treating this
as a substitute or mock h, say hm = (C2/P)1/3. Further studies
have indicated that the C2/P term is an second-order term which
is arguably the best measure of scholarly performance if only
two bibliometric dimensions are considered, namely quality and
quantity.
We have seen above that when we start with the citation
sequence ck, k = 1 to P, the impact i = C/P, appears
as an average or arithmetic mean. Since C is determined from
what we call a first-order process, i.e. C = Σ(ck)1, k =
1 to P, at first sight impact i is seen to emerge at
the first-order level through basic mathematical operations in
a deductive way in our "principled" approach. But why is this
the best measure for an average? For this to become obvious,
we have to take this up as a second-order process.
Given the citation sequence ck, k = 1 to P, let i be
that value that minimizes the error in the least-squares error
sense. Let S be the sum of the squares of the error as
S = Σ(ck - i)2
(1)
8
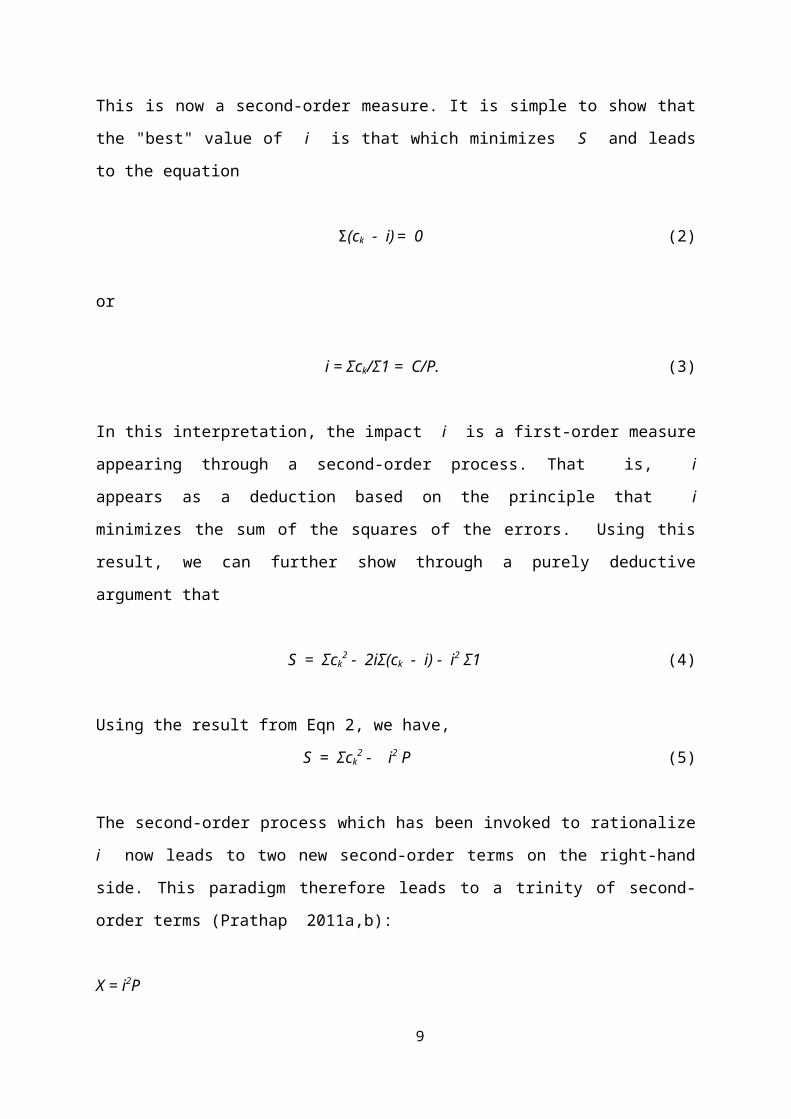
This is now a second-order measure. It is simple to show that
the "best" value of i is that which minimizes S and leads
to the equation
Σ(ck - i) = 0 (2)
or
i = Σck/Σ1 = C/P. (3)
In this interpretation, the impact i is a first-order measure
appearing through a second-order process. That is, i
appears as a deduction based on the principle that i
minimizes the sum of the squares of the errors. Using this
result, we can further show through a purely deductive
argument that
S = Σck2 - 2iΣ(ck - i) - i2 Σ1 (4)
Using the result from Eqn 2, we have,
S = Σck2 - i2 P (5)
The second-order process which has been invoked to rationalize
i now leads to two new second-order terms on the right-hand
side. This paradigm therefore leads to a trinity of second-
order terms (Prathap 2011a,b):
X = i2P
9
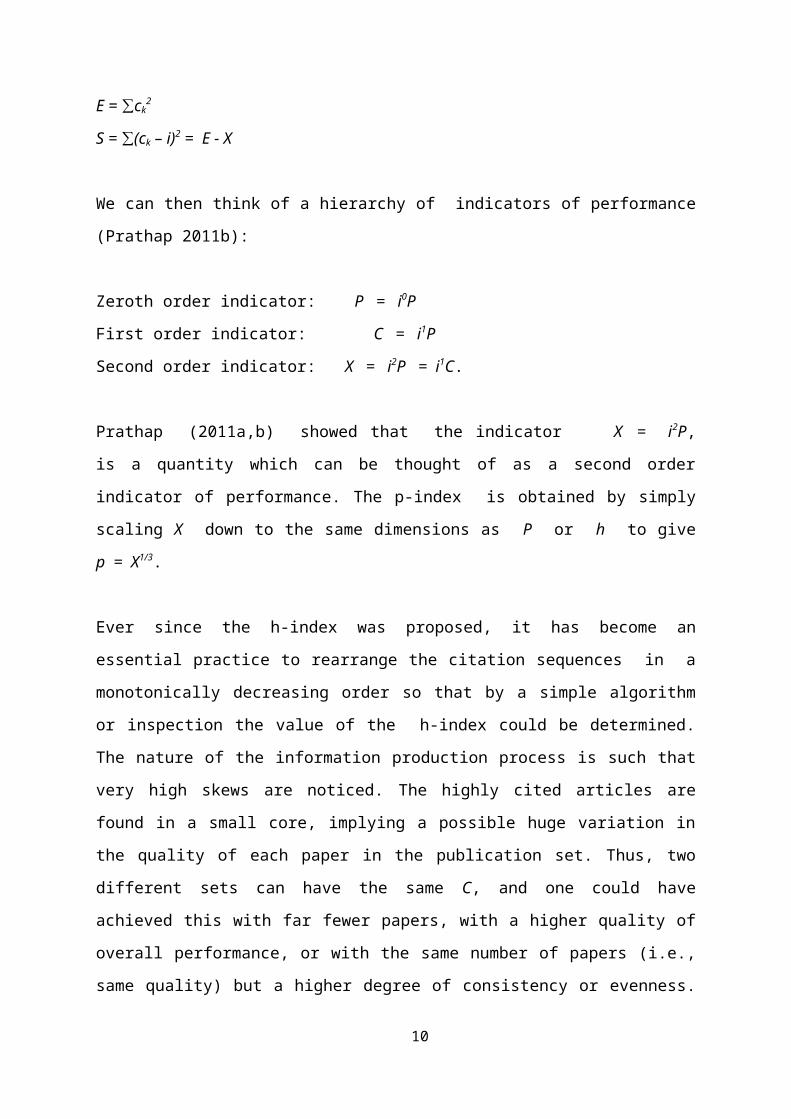
E = c∑ k2
S = (c∑ k – i)2 = E - X
We can then think of a hierarchy of indicators of performance
(Prathap 2011b):
Zeroth order indicator: P = i0P
First order indicator: C = i1P
Second order indicator: X = i2P = i1C.
Prathap (2011a,b) showed that the indicator X = i2P,
is a quantity which can be thought of as a second order
indicator of performance. The p-index is obtained by simply
scaling X down to the same dimensions as P or h to give
p = X1/3.
Ever since the h-index was proposed, it has become an
essential practice to rearrange the citation sequences in a
monotonically decreasing order so that by a simple algorithm
or inspection the value of the h-index could be determined.
The nature of the information production process is such that
very high skews are noticed. The highly cited articles are
found in a small core, implying a possible huge variation in
the quality of each paper in the publication set. Thus, two
different sets can have the same C, and one could have
achieved this with far fewer papers, with a higher quality of
overall performance, or with the same number of papers (i.e.,
same quality) but a higher degree of consistency or evenness.
10
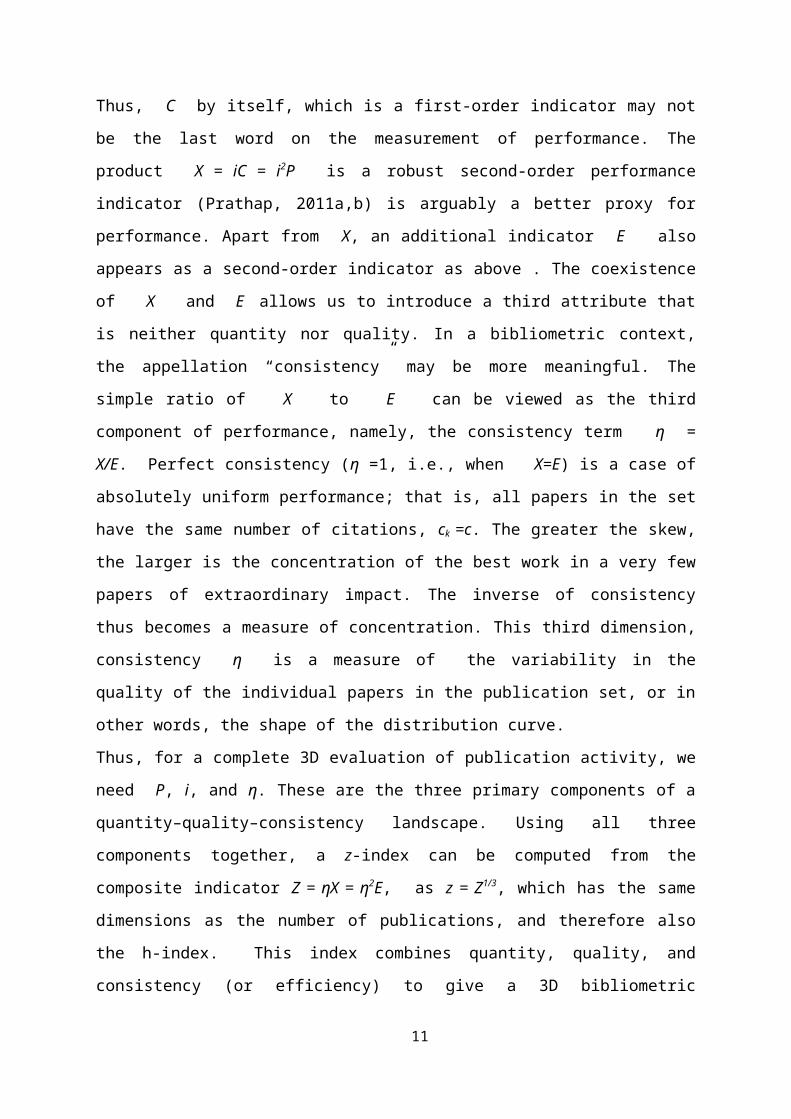
Thus, C by itself, which is a first-order indicator may not
be the last word on the measurement of performance. The
product X = iC = i2P is a robust second-order performance
indicator (Prathap, 2011a,b) is arguably a better proxy for
performance. Apart from X, an additional indicator E also
appears as a second-order indicator as above . The coexistence
of X and E allows us to introduce a third attribute that
is neither quantity nor quality. In a bibliometric context,
the appellation “consistency” may be more meaningful. The
simple ratio of X to E can be viewed as the third
component of performance, namely, the consistency term η =
X/E. Perfect consistency (η =1, i.e., when X=E) is a case of
absolutely uniform performance; that is, all papers in the set
have the same number of citations, ck =c. The greater the skew,
the larger is the concentration of the best work in a very few
papers of extraordinary impact. The inverse of consistency
thus becomes a measure of concentration. This third dimension,
consistency η is a measure of the variability in the
quality of the individual papers in the publication set, or in
other words, the shape of the distribution curve.
Thus, for a complete 3D evaluation of publication activity, we
need P, i, and η. These are the three primary components of a
quantity–quality–consistency landscape. Using all three
components together, a z-index can be computed from the
composite indicator Z = ηX = η2E, as z = Z1/3, which has the same
dimensions as the number of publications, and therefore also
the h-index. This index combines quantity, quality, and
consistency (or efficiency) to give a 3D bibliometric
11
evaluation (Prathap 2013a,b,c). Thus, the h-, p- and z-
are secondary single number bibliometric indicators of
performance. This is summarized in Table 1. We can extend
Einstein's metaphor to imagine that the h-index is a
"constructed" index while the p- and z-indices are
"principled" indices.
The h-, p- and z-indices as defined in amplitude or
frequency spaces.
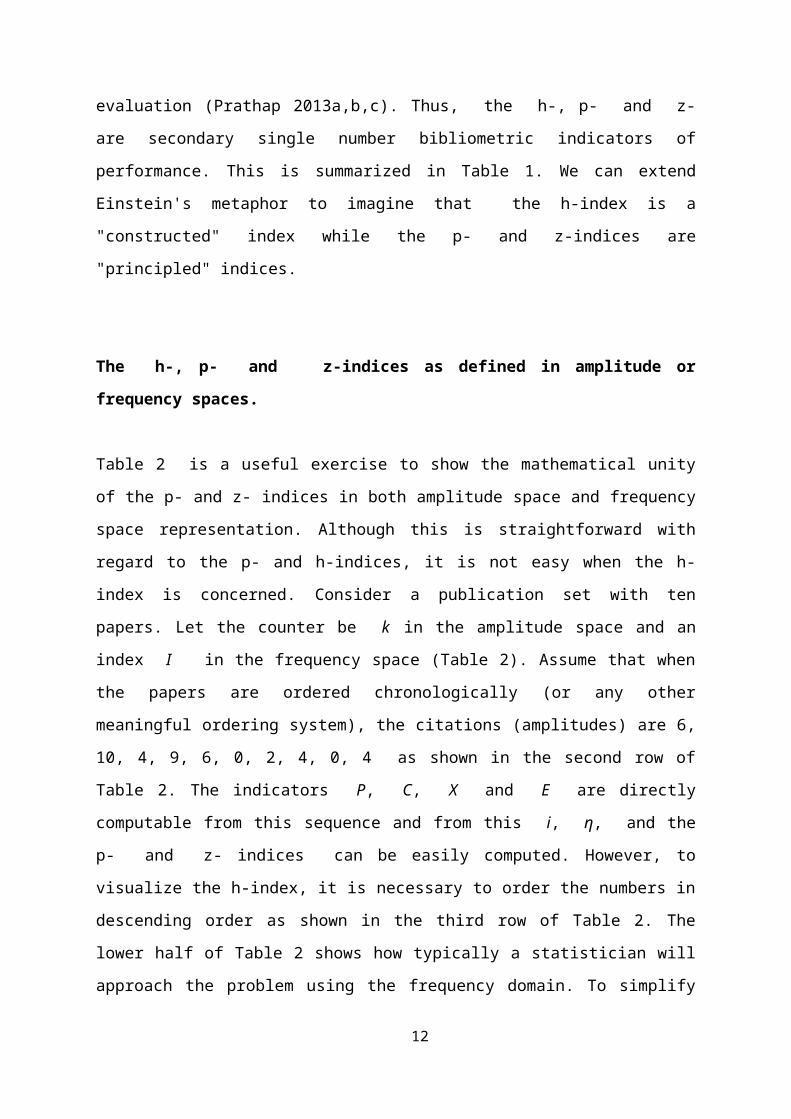
Table 2 is a useful exercise to show the mathematical unity
of the p- and z- indices in both amplitude space and frequency
space representation. Although this is straightforward with
regard to the p- and h-indices, it is not easy when the h-
index is concerned. Consider a publication set with ten
papers. Let the counter be k in the amplitude space and an
index I in the frequency space (Table 2). Assume that when
the papers are ordered chronologically (or any other
meaningful ordering system), the citations (amplitudes) are 6,
10, 4, 9, 6, 0, 2, 4, 0, 4 as shown in the second row of
Table 2. The indicators P, C, X and E are directly
computable from this sequence and from this i, η, and the
p- and z- indices can be easily computed. However, to
visualize the h-index, it is necessary to order the numbers in
descending order as shown in the third row of Table 2. The
lower half of Table 2 shows how typically a statistician will
approach the problem using the frequency domain. To simplify
12
the discussion, an index I is used for citations
(amplitudes) increasing from a value of zero. For each
citation value x, there are f(x) instances where such
citations are realized. There is no difficulty here to
determine the same indicators P, C, X and E from this
representation and from this to compute i, η, and the p-
and z- indices (Table 2 shows how an excel sheet calculation
is performed.) It seems almost impossible to obtain the h-
index from such an approach. The indices obtained from a
"principled" approach have a mathematical unity that is not
found for the h-index.
Real life exercises
Case 1 - Research on the topic, h-index.
The precise computation of η requires the knowledge of the
complete citation sequence (i.e. the distribution curve) for
each individual scientist (or aggregation like institute,
journal or country). This is obtained directly from the Web of
Science for each country, Web of Science category and journal
taken up in the present analysis and the methodology to obtain
this is discussed below.
Consider the scientific output in the area described by
Topic=(h-index) as indexed in the Web of Science (a Thomson-
Reuters product). We choose the period 1986-All Years
(updated 2014-01-08 ) for which subscription was available.
13
All articles P, and citations C gathered by these P
articles, are counted. Then the impact i is computed for this
period. From the citation sequence for each entity (author,
country, organization or journal), consistency η can be
computed using simple Excel spread sheet functions.
The search strategy
Topic=(h-index)Timespan=All years. Databases=SCI-EXPANDED, CPCI-S, CPCI-SSH, CCR-EXPANDED, IC.
using the Web of Science database (accessed on 10 January
2014) picked up 1012 records matching the query of the
32,942,465 in the data limits selected for the period 1987-
till date. The citation sequence is downloaded as an Excel
file and can be easily processed to extract the impact, and
the h-, p- and z-index. Table 3 displays the primary and
secondary bibliometric indicators and indices. We notice the
curious fact that the h- and p-indices are very close to each
other. We shall find that this is largely true where i < h
and i << P, leading one to conclude that in such instances,
the h-index is a mock of the p-index, or vice versa. However,
where there is extraordinary scholarly performance and i > h,
both p- and z-indices can be larger than the h-index.
The Web of Science database allows us to refine the results in
terms of countries, Web of Science categories, and journals
(source titles), etc. Our focus in this paper will be to see
14
how the constructed and principled indices perform relative to
each other for these three aspects.
We follow up with the address option to identify the share of
various countries in this area. A typical search is of the
type:
Topic=(h-index)Refined by: Countries/Territories=( USA )Timespan=All years. Databases=SCI-EXPANDED, CPCI-S, CPCI-SSH,CCR-EXPANDED, IC
Table 4 shows the primary and secondary bibliometric
indicators and indices for country-wise performance in the
area of h-index research. Also shown are the correlation
coefficients between the various indicators and indices.
Case 2 - Research in the area of monsoon studies
The monsoon system is a unique geophysical phenomenon that
determines the weather and climate over most parts of Asia,
mainly the Indian sub-continent, and over South-east Asia and
large parts of China. It influences the lives of nearly one-
third of the world population sirectly, and indirectly the
lives of nearly three-quarters of the world population.
The emergence of global satellite data and images and
computational models that integrate the global earth and
15
atmospheric systems has permitted the monsoon to be studied as
a very complex global phenomenon and research work is
performed in many countries outside South Asia and China
(Turner & Annamalai, 2012). The bibliometric evidence from the
Web of Science (accessed on 30 December 2013) shows that from
1987 to 2012 the number of records in database has increased
from 48 to 1833 when the search was restricted to
Topic=(monsoon). In all, there were 19603 results for the
period 1987-till date.
We will like to studied critically the relationship of the h-
index with the derived indices like the p-index and the z-
index. For this, we need to investigate large-scale systems
where there are a large number of papers and the impact is
considerably lower than these indices. For this, we shall
restrict attention to publications refined according to the
Web of Science categories. For example, there are 7700 papers
in the category "METEOROLOGY ATMOSPHERIC SCIENCES" and the impact is
a modest 18.05 and the h-, p- and z-indices are 135.88,
132 and 75.66 respectively (Table 5). Table 5 and Figure 1
shows the primary and secondary bibliometric indicators and
indices for twelve web of science categories. We find from the
correlation coefficients between the various indicators and
indices, and visually from the figure that the h- and p-
indices are very close to each other. In all the twelve
categories listed here, i < h and i << P. In such
instances, the h-index is a mock of the p-index, or vice versa.
16
Concluding remarks
We compare the h-index, which belongs to a class of
heuristically or algorithmically constructed indices with the
p- and z-indices which are systematically deduced from the
citation sequence by ordered mathematical operations using
first principles. Loosely following a terminology introduced
by Einstein, we shall call these "constructive" approaches and
"principled" approaches. For the "principled" approach, the
bibliometric analyses breaks down scholarly performance into
three primary components - quantity, quality and consistency.
The citation data is retrieved from the Web of Science and the
p- and z-indices are derived from these primary components.
Two real life examples are used to see the relationship
between these indices. One relates to papers on the topic of
h-index itself; the other is a bibliometric analyses of
studies on the monsoon cycle over South Asia and the forces
that drive this annual cycle and its variability from year to
year and within the season. In many instances, the h- and p-
indices are close to each other. This is largely true for
large datasets where i < h and i << P, leading one to
conclude that in such instances, the h-index is a mock of the
p-index, or vice versa. However, where there is extraordinary
scholarly performance and i > h, both p- and z-indices can be
larger than the h-index. The h-index therefore considerably
understates performance of high achievers.
17
References
Ball, P. (2005). Index aims for fair ranking of scientists.
Nature, 436, 900.
Bornmann, L., Mutz, R., Hug, S. E., & Daniel, H. D. (2011). A
meta-analysis of studies reporting correlations between the h
index and 37 different h index variants. Journal of Informetrics,
5(3), 346–359.
Chandrasekhar, S. (1991). Truth and Beauty, Penguin India, p.97.
Chatterjee, S. G. (2012). The nature of scientific theory.
Current Science 102 (3), 386-388.
Edwards, A. W. F. (2005). System to rank scientists was
pedalled by Jeffreys. Nature, 437,
951.
Egghe, L. (2006a). How to improve the h-index. The Scientist,
20(3), 14.
Egghe, L. (2006b). An improvement of the h-index: The g-index.
ISSI Newsletter, 2(1), 8–9.
Egghe, L. (2006c). Theory and practice of the g-index.
Scientometrics, 69(1), 131–152.
18
Egghe, L. (2010). The Hirsch Index and Related Impact
Measures. Annual Review of Information Science and Technology, 44(1), 65-
114.
Einstein, A. (1954). in Ideas and Opinions, Crown Publishers, New
York, pp. 227–232.
Gefter, A. (2013). http://www.edge.org/response-detail/23766
accessed on 8 January 2014.
Glanzel, W. (2006). On the h-index – A mathematical approach
to a new measure of publication activity and citation impact.
Scientometrics, 67, 315–321.
Hirsch, J. E. (2005). An index to quantify an individual’sscientific research output. Proceedings of the National Academy ofSciences of the United States of America, 102(46), 16569–16572.
Prathap, G. (2010). Is there a place for a mock h-index?.
Scientometrics, 84, 153–165.
Prathap, G. (2011a). The Energy–Exergy–Entropy (or EEE)sequences in bibliometric assessment. Scientometrics, 87, 515–524.
Prathap, G. (2011b). Quasity, when quantity has a quality allof its own—toward a theory of performance. Scientometrics, 88,555–562.
19
Prathap, G. (2013a). Quantity, Quality, and Consistency asBibliometric Indicators. Journal of the American Society for InformationScience and Technology, DOI: 10.1002/asi.23008.
Prathap, G. (2013b). Measures for Impact, Consistency, and theh- and g-Indices. Journal of the American Society for Information Scienceand Technology, DOI: 10.1002/asi.23028.
Prathap, G. (2013c). The Zynergy-Index and the Formula for theh-Index. Journal of the American Society for Information Science andTechnology, DOI: 10.1002/asi.23046.
Schubert, A., & Glanzel, W. (2007). A systematic analysis of
Hirsch-type indices for journals. Journal of Informetrics, 1, 179-
184.
Schreiber, M. (2008). A modification of the h‐index:The hm‐index accounts for multi‐authored manuscripts.Journal of Informetrics, 2(3), 211–216.
Schreiber, M. (2009). A case study of the modified Hirschindex hm accounting for multiple coauthors. Journal of the AmericanSociety for Information Science and Technology, 60, 1274–1282.
Turner, A. G., & Annamalai, H. (2012) Climate Change and the
South Asian Monsoon. Nature Climate Change, 2: 587-595.
20
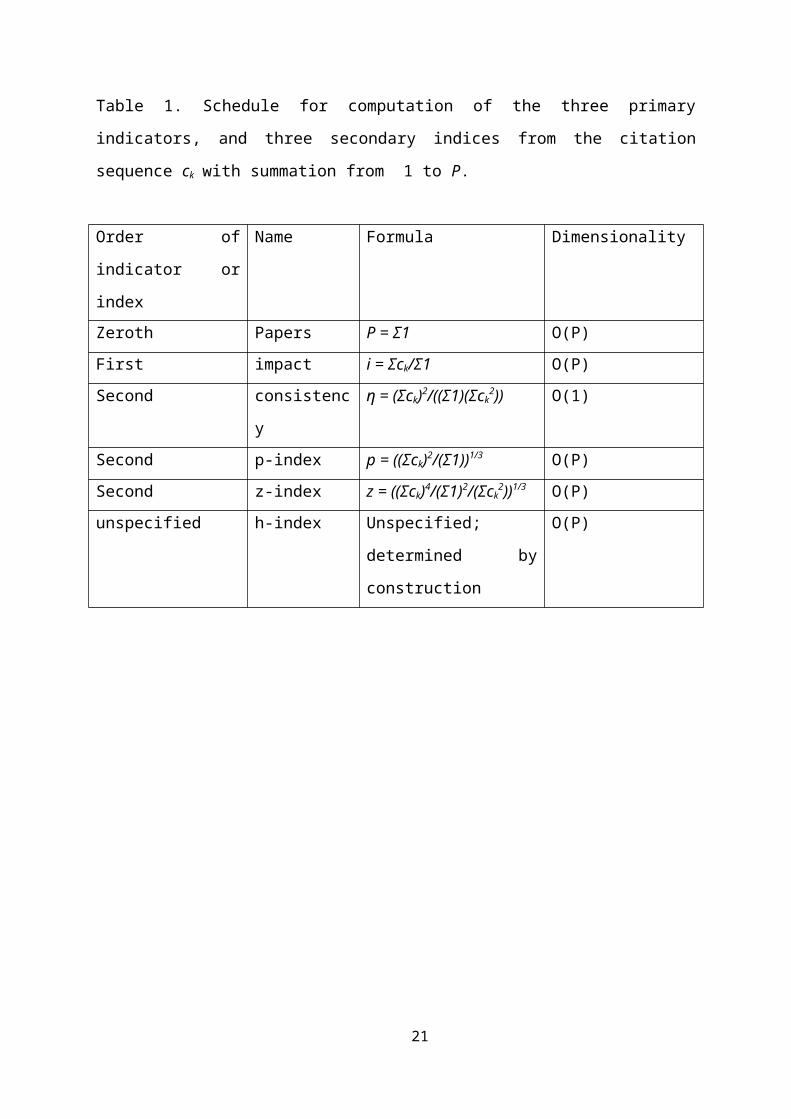
Table 1. Schedule for computation of the three primary
indicators, and three secondary indices from the citation
sequence ck with summation from 1 to P.
Order of
indicator or
index
Name Formula Dimensionality
Zeroth Papers P = Σ1 O(P)First impact i = Σck/Σ1 O(P)Second consistenc
y
η = (Σck)2/((Σ1)(Σck2)) O(1)
Second p-index p = ((Σck)2/(Σ1))1/3 O(P)Second z-index z = ((Σck)4/(Σ1)2/(Σck
2))1/3 O(P)unspecified h-index Unspecified;
determined by
construction
O(P)
21
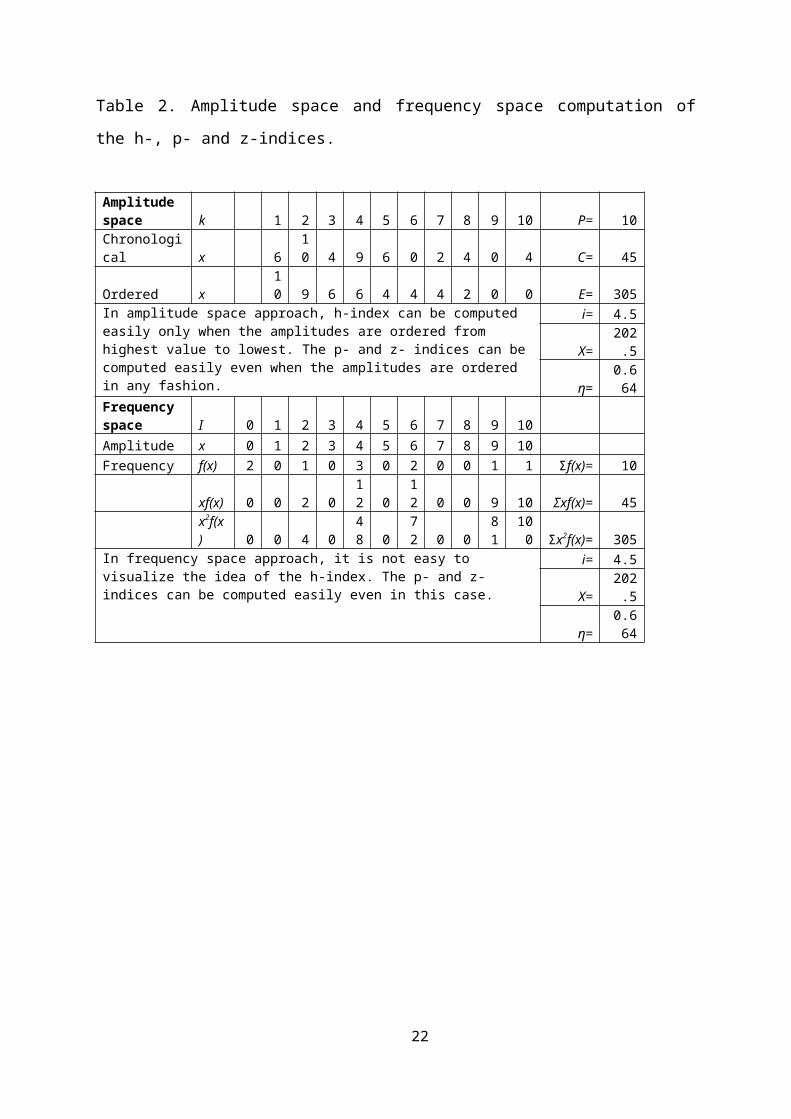
Table 2. Amplitude space and frequency space computation of
the h-, p- and z-indices.
Amplitude space k 1 2 3 4 5 6 7 8 9 10 P= 10Chronological x 6
10 4 9 6 0 2 4 0 4 C= 45
Ordered x 10 9 6 6 4 4 4 2 0 0 E= 305
In amplitude space approach, h-index can be computed easily only when the amplitudes are ordered from highest value to lowest. The p- and z- indices can becomputed easily even when the amplitudes are ordered in any fashion.
i= 4.5
X=202.5
η=0.664
Frequency space I 0 1 2 3 4 5 6 7 8 9 10 Amplitude x 0 1 2 3 4 5 6 7 8 9 10 Frequency f(x) 2 0 1 0 3 0 2 0 0 1 1 Σf(x)= 10
xf(x) 0 0 2 012 0
12 0 0 9 10 Σxf(x)= 45
x2f(x) 0 0 4 0
48 0
72 0 0
81
100 Σx2f(x)= 305
In frequency space approach, it is not easy to visualize the idea of the h-index. The p- and z- indices can be computed easily even in this case.
i= 4.5
X=202.5
η=0.664
22
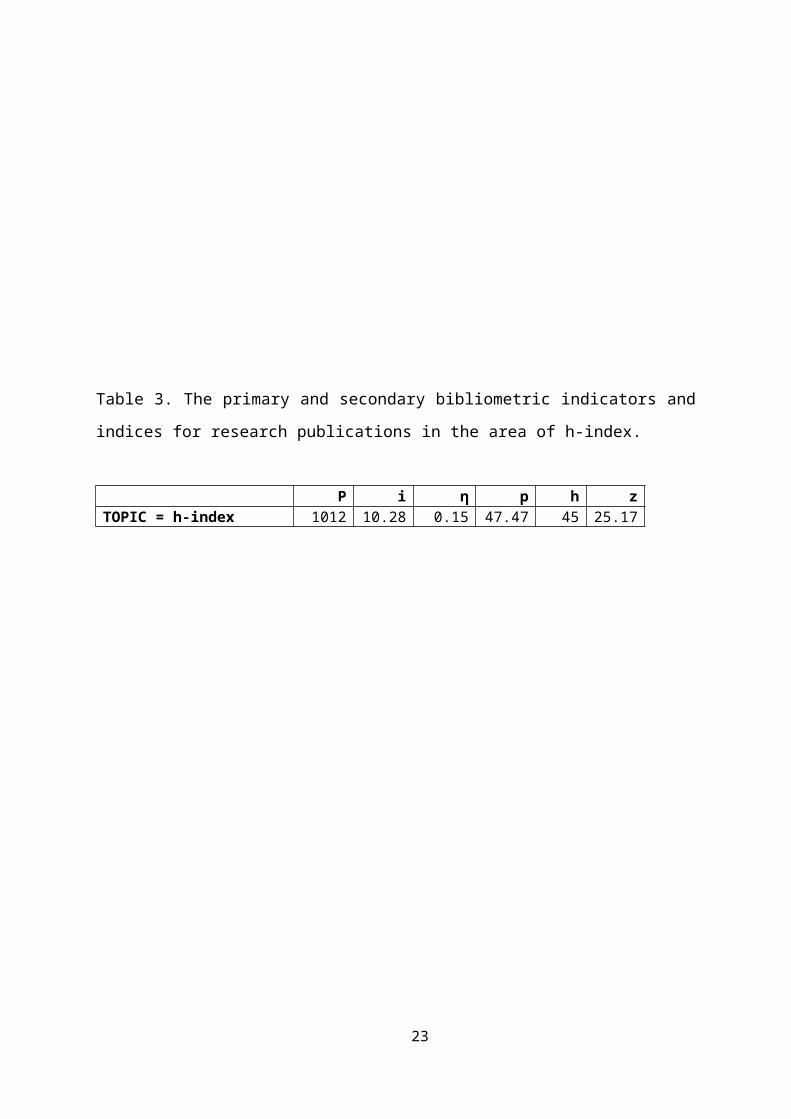
Table 3. The primary and secondary bibliometric indicators and
indices for research publications in the area of h-index.
P i η p h zTOPIC = h-index 1012 10.28 0.15 47.47 45 25.17
23
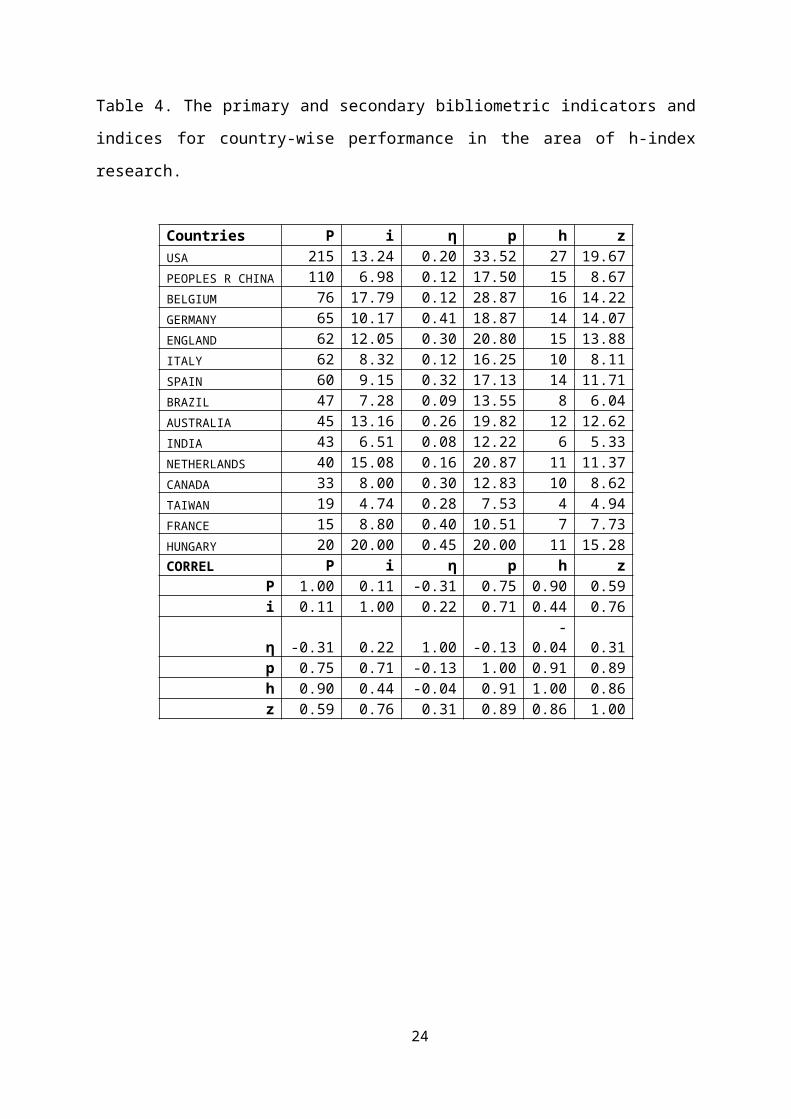
Table 4. The primary and secondary bibliometric indicators and
indices for country-wise performance in the area of h-index
research.
Countries P i η p h zUSA 215 13.24 0.20 33.52 27 19.67PEOPLES R CHINA 110 6.98 0.12 17.50 15 8.67BELGIUM 76 17.79 0.12 28.87 16 14.22GERMANY 65 10.17 0.41 18.87 14 14.07ENGLAND 62 12.05 0.30 20.80 15 13.88ITALY 62 8.32 0.12 16.25 10 8.11SPAIN 60 9.15 0.32 17.13 14 11.71BRAZIL 47 7.28 0.09 13.55 8 6.04AUSTRALIA 45 13.16 0.26 19.82 12 12.62INDIA 43 6.51 0.08 12.22 6 5.33NETHERLANDS 40 15.08 0.16 20.87 11 11.37CANADA 33 8.00 0.30 12.83 10 8.62TAIWAN 19 4.74 0.28 7.53 4 4.94FRANCE 15 8.80 0.40 10.51 7 7.73HUNGARY 20 20.00 0.45 20.00 11 15.28CORREL P i η p h z
P 1.00 0.11 -0.31 0.75 0.90 0.59i 0.11 1.00 0.22 0.71 0.44 0.76
η -0.31 0.22 1.00 -0.13-
0.04 0.31p 0.75 0.71 -0.13 1.00 0.91 0.89h 0.90 0.44 -0.04 0.91 1.00 0.86z 0.59 0.76 0.31 0.89 0.86 1.00
24
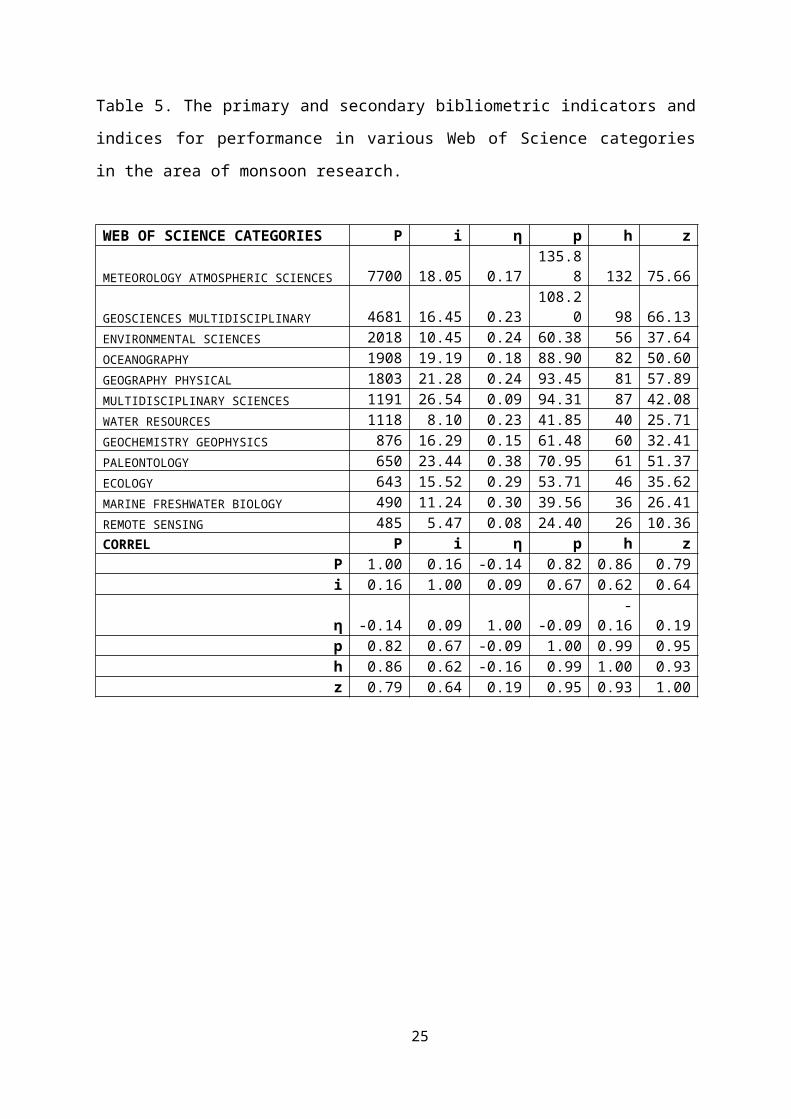
Table 5. The primary and secondary bibliometric indicators and
indices for performance in various Web of Science categories
in the area of monsoon research.
WEB OF SCIENCE CATEGORIES P i η p h z
METEOROLOGY ATMOSPHERIC SCIENCES 7700 18.05 0.17135.8
8 132 75.66
GEOSCIENCES MULTIDISCIPLINARY 4681 16.45 0.23108.2
0 98 66.13ENVIRONMENTAL SCIENCES 2018 10.45 0.24 60.38 56 37.64OCEANOGRAPHY 1908 19.19 0.18 88.90 82 50.60GEOGRAPHY PHYSICAL 1803 21.28 0.24 93.45 81 57.89MULTIDISCIPLINARY SCIENCES 1191 26.54 0.09 94.31 87 42.08WATER RESOURCES 1118 8.10 0.23 41.85 40 25.71GEOCHEMISTRY GEOPHYSICS 876 16.29 0.15 61.48 60 32.41PALEONTOLOGY 650 23.44 0.38 70.95 61 51.37ECOLOGY 643 15.52 0.29 53.71 46 35.62MARINE FRESHWATER BIOLOGY 490 11.24 0.30 39.56 36 26.41REMOTE SENSING 485 5.47 0.08 24.40 26 10.36CORREL P i η p h z
P 1.00 0.16 -0.14 0.82 0.86 0.79i 0.16 1.00 0.09 0.67 0.62 0.64
η -0.14 0.09 1.00 -0.09-
0.16 0.19p 0.82 0.67 -0.09 1.00 0.99 0.95h 0.86 0.62 -0.16 0.99 1.00 0.93z 0.79 0.64 0.19 0.95 0.93 1.00
25
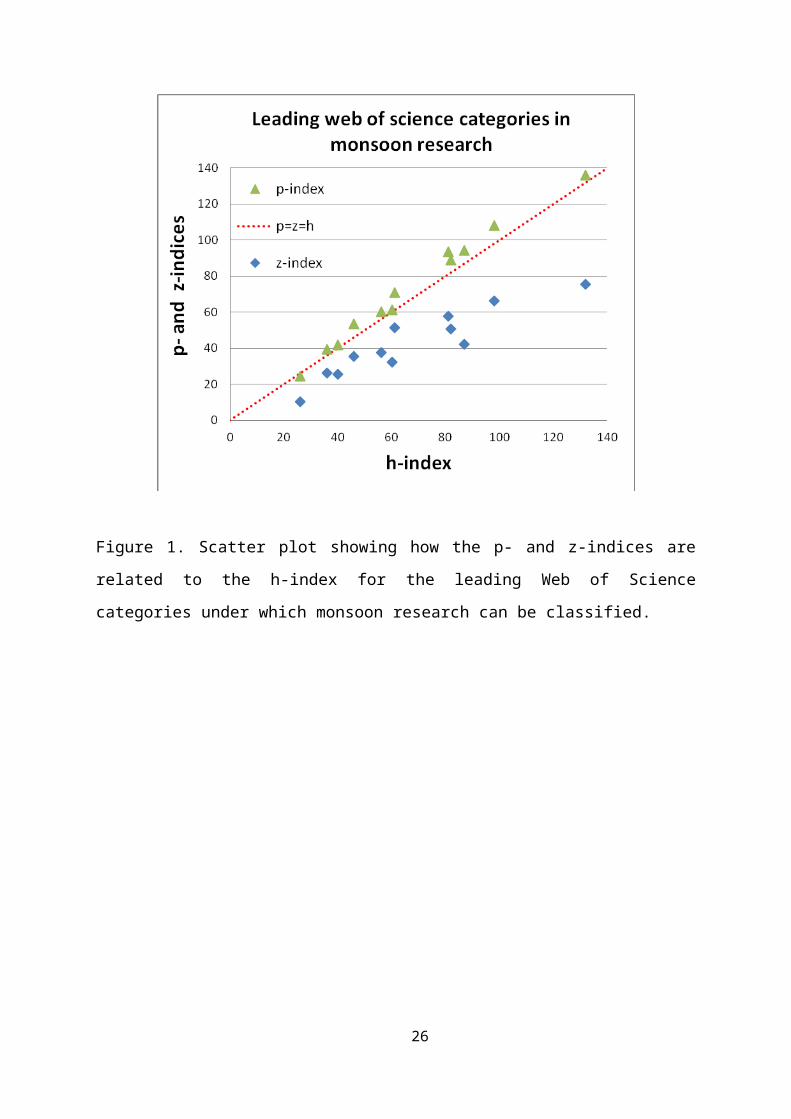
Figure 1. Scatter plot showing how the p- and z-indices are
related to the h-index for the leading Web of Science
categories under which monsoon research can be classified.
26


