Embed Size (px)
Citation preview
Pro-poor tourism policy in Thailand
Somparat Srisantisuk
Department of Social Policy
London School of Economics
A thesis submitted for the degree of
Doctor of Philosophy
2015
2
Declaration
I certify that the thesis I have presented for examination for the PhD degree of the London
School of Economics and Political Science is solely my own work other than where I have
clearly indicated that it is the work of others (in which case the extent of any work carried
out jointly by me and any other person is clearly identified in it).
The copyright of this thesis rests with the author. Quotation from it is permitted, provided
that full acknowledgement is made. This thesis may not be reproduced without my prior
written consent.
I warrant that this authorisation does not, to the best of my belief, infringe the rights of any
third party.
I declare that my thesis consists of 90,890 words.
3
Abstract
This study is an attempt to determine how tourism and tourism development policies,
strategies and initiatives impact income generation and employment opportunities in a
rural ethnic community.
The research consisted of both qualitative and quantitative methods. In-depth
interviews, focus group discussions and participatory observations from various
stakeholders were used to obtain qualitative data. The quantitative data were gathered
using a researcher-developed questionnaire to obtain data from 330 households in Had Bai
Village, Chiang Rai Province, northern Thailand. The research findings demonstrate that
the well-being of the poor and the impact of the Thai government‘s One Tambon One
Product (OTOP) project in terms of livelihood improvement were distributed unequally
across the village.
The information from the qualitative and quantitative data revealed that the OTOP
project improved slightly the livelihood outcomes of villagers in the group which fully
participated in the scheme. By contrast, the villagers who were aware of OTOP but did not
participate used their right to borrow funds to make independent investments and buy
consumer goods. Members of this group were thus unable to repay their loans on time, had
no return on their investment and had the highest amount of debt. Those villagers who
were unaware of the OTOP scheme and did not participate were the poorest in the village.
An analysis of this third group revealed that non-participation was largely due to a lack of
access to information. Moreover, these families did not regard themselves as poor. They
were happy with their simple life and did not perceive any benefit in participating in the
pro-poor tourism project introduced by the Thai government.
Pro-poor tourism may benefit the poor in many parts of the world; however, in the
case of Thailand it works mainly as a catalyst to improve the overall livelihood outcome of
the poor and cannot be expected to enhance the individual livelihoods of the poorest. This
study contributes to the literature in various ways. First, it is the first of its kind to
investigate thoroughly Thailand‘s pro-poor tourism development policy. Second, it has
attempted to assess pro-poor tourism from many vantage points: international standards,
4
livelihood impacts, and the assets and vulnerability of the poor. Third, the key success
model developed from the outcome of the thesis can be used by Thailand and other
developing countries in their efforts to develop more effective pro-poor tourism policies in
the future.
5
Table of Contents
LIST OF TABLES ......................................................................................................................... 10
LIST OF PICTURES ..................................................................................................................... 12
LIST OF BOXES ............................................................................................................................ 13
LIST OF MAPS .............................................................................................................................. 13
ACKNOWLEDGEMENTS ........................................................................................................... 14
CHAPTER 1 INTRODUCTION TO PRO-POOR TOURISM ................................................. 16
1.1 Research questions ............................................................................................................................ 17
1.2 The expected outcomes from this study ............................................................................................ 18
1.3 Scope of the study ............................................................................................................................. 18
1.4 Why study Pro-poor Tourism? .......................................................................................................... 18
1.5 How Pro-Poor Tourism development began in Thailand .................................................................. 20
1.6 Poverty situation in Thailand ............................................................................................................ 21
1.7 Categorising the poor in Thailand ..................................................................................................... 23
1.8 Motivations for a study of the impact of Pro-poor Tourism development on the livelihoods of the
poor in Thailand .......................................................................................................................................... 27
1.9 Thesis Structure ................................................................................................................................. 30
CHAPTER 2 PRO-POOR TOURISM AND REVIEW OF LITERATURE ............................ 32
2.1 Defining Pro-Poor Tourism Concepts ............................................................................................... 32
2.2 Pro-Poor Tourism and Alternative Conceptualizations of Tourism .................................................. 33
2.3 Sustainable Tourism: Definition and Concepts of Sustainable Tourism ........................................... 34
2.4 Pro-poor Tourism and Sustainable Tourism ..................................................................................... 38
2.5 Pro-poor Tourism Strategies ............................................................................................................. 42
2.6 Literature review on Pro-Poor Tourism: International Case study .................................................... 45
2.7 Pro-poor Tourism in the Greater Mekong Sub-region (GMS) .......................................................... 51
2.8 Pro-poor Tourism case studies in the Greater Mekong Sub-region(GMS) ....................................... 53
2.9 Issues arising from PPT case studies in GMS countries ................................................................... 57
2.9.1 Unequal benefits from PPT ..................................................................................................... 57
2.9.2 Constraints and Barriersto Participation .................................................................................. 59
2.9.3 Infrastructure ........................................................................................................................... 61
2.9.4 Local Governance .................................................................................................................... 61
2.9.5 Regulatory and Land Use Concerns ........................................................................................ 62
2.9.6 Human Resource and Business Development ......................................................................... 62
2.9.7 Government support in Marketing ........................................................................................... 63
2.9.8 In conclusion ........................................................................................................................... 63
6
CHAPTER 3 SUSTAINABLE LIVELIHOOD AND ANALYTICAL FRAMEWORK ......... 65
3.1 The Sustainable Livelihood Framework ........................................................................................... 65
3.2 Sustainable Livelihoods and Pro-Poor Tourism ................................................................................ 71
3.3 Sustainable Livelihoods (SLA) Approach as an Analytical Framework ........................................... 74
3.4 Sustainable Livelihoods and Adaptive Strategies ............................................................................. 79
3.5 The Impact of Pro-Poor Tourism on Livelihoods ............................................................................. 81
3.5.1 Impact on Financial Capital ..................................................................................................... 81
3.5.2 Impact on Human Capital, Education, Skills and Health ........................................................ 82
3.5.3 Impact on the Physical Environment and Infrastructure .......................................................... 82
3.5.4 Impact on social capital and community organizations ........................................................... 83
3.5.5 Impact on natural capital ......................................................................................................... 84
3.6 Tourism, Vulnerability and Livelihood Diversification .................................................................... 85
3.6.1 The Linkage between Tourism and Vulnerability ................................................................... 85
3.6.2 Pro-Poor Tourism, Poverty and Vulnerability ......................................................................... 86
3.6.3 Tourism and Livelihood Diversification .................................................................................. 87
3.7 Objectives of the Research under the SL Framework ....................................................................... 89
3.7.1 Expected Outcomes ................................................................................................................. 89
3.8 Scope of the Study ............................................................................................................................ 90
CHAPTER 4 PRO-POOR TOURISM IN THAILAND AND PROJECT SELECTION........ 91
4.1 Tourism Policy in Thailand ............................................................................................................... 91
4.2 Pro-poor Tourism in the Greater Mekong Sub-Region ..................................................................... 92
4.3 PPT in Northern Thailand ................................................................................................................. 97
4.4 PPT Development and Strategies in Thailand ................................................................................. 100
4.4.1 The Village-based Tourism Programme ................................................................................ 100
4.4.2 Village Funds ......................................................................................................................... 102
4.4.3 ―One Tambon One Product‖ Programme .............................................................................. 102
4.4.4 OTOP as a PPT Project ......................................................................................................... 106
4.5 Pro Poor Tourism Interventions in HadBai Village ........................................................................ 107
4.6 Underlying reasons for selecting Had Bai as a case study .............................................................. 110
CHAPTER 5 DETAILED METHODOLOGY ......................................................................... 115
5.1 Analysis of Datausing the Sustainability Framework in this Study ................................................ 115
5.2 Sampling ......................................................................................................................................... 117
5.3 Data Collection Methods ................................................................................................................. 119
5.4 Data Analysis .................................................................................................................................. 124
5.5 Main Research Question: ................................................................................................................ 125
5.6 Expected Outcomes ......................................................................................................................... 126
5.7 Scope of the study ........................................................................................................................... 126
5.8 Limitations ...................................................................................................................................... 134
7
CHAPTER 6 GENERAL PRO-POOR ACTIVITIES IN THE PILOT PROJECT .............. 138
6.1 General Background of the Northern Region .................................................................................. 138
6.2 Economic Structure of the Northern Region ................................................................................... 138
6.2.1 Characteristics of the Northern Economy .............................................................................. 139
6.2.2 Structure of the Northern Economy ....................................................................................... 139
6.3 Demographic Data of Had Bai Village 1999 – 2011 ...................................................................... 141
6.4 Distribution of Stakeholders in the PPT programme ...................................................................... 147
6.5 Livelihood Structures and Strategies in Had Bai Village ................................................................ 150
6.5.1 Agriculture ............................................................................................................................. 150
6.5.2 Employment .......................................................................................................................... 151
6.5.3 Weaving ................................................................................................................................. 152
6.5.4 Local Resources of Had Bai ................................................................................................. 158
6.5.5 Land Holding pattern in Had Bai ........................................................................................... 160
6.5.6 Infrastructure support ............................................................................................................ 165
6.6 Participation in PPT programmes ................................................................................................... 165
6.6.1 Group 1:Those who did not know about the OTOP programme and hence did not participate.
167
6.6.2 Group 2: Villagerswith knowledge of OTOP, who chose to not participate. ....................... 169
6.6.3 Group 3:These villagers actively participated in the OTOP programme. ............................ 171
CHAPTER 7 PPT IMPACT ON THE SUSTAINABILITY AND DIVERSIFICATION OF
LIVELIHOODS IN HAD BAI VILLAGE ................................................................................. 176
7.1 Assessment of PPT Impact on Livelihood diversification .............................................................. 177
7.1.1 Livelihood Diversification ..................................................................................................... 177
7.1.2 PPT initiatives match to the livelihood diversification strategies people use ........................ 179
7.1.3 Tourism‘s impact on villagers‘ way of life ............................................................................ 180
7.2 PPT‘s Impact on Assets .................................................................................................................. 182
7.2.1 Impact on Financial Assets .................................................................................................... 189
7.2.2 PPT Impact on Social Assets ................................................................................................. 196
7.2.3 PPT Impact on Personal Assets ............................................................................................. 201
7.2.4 PPT Impact on Physical Assets ............................................................................................. 203
7.2.5 PPT Impact on Human Assets ............................................................................................... 209
7.2.6 PPT Impact on Natural Capital .............................................................................................. 215
CHAPTER 8 PPT IMPACT ON THE VULNERABILITY OF THE POOR ........................ 220
8.1 Levels of Vulnerability in Had Bai after PPT programmes ............................................................ 221
8.1.1 Vulnerability in Group 1 ........................................................................................................ 221
8.1.2 Vulnerability in Group 2 ........................................................................................................ 223
8.1.3 Vulnerability in Group 3 ........................................................................................................ 225
8.2 Drivers of vulnerability and its impact in Had Bai Village ............................................................. 226
8
8.3 How villagers in Had Bai interpret vulnerability ............................................................................ 227
8.3.1 Coping with Change .............................................................................................................. 236
8.3.2 Enhancement of the Sense of Security in Life ....................................................................... 237
8.4 The Sense of Self Worth and Personal Development ..................................................................... 239
8.5 Conclusion ...................................................................................................................................... 240
CHAPTER 9 CONCLUSIONS AND RECOMMENDATIONS .............................................. 243
9.1 Key Findings ................................................................................................................................... 243
9.2 Livelihood Outcomes and Vulnerability ......................................................................................... 248
9.3 Financial outcomes.......................................................................................................................... 251
9.3.1 The Financial Sustainability of PPT initiatives in Had Bai Village ....................................... 252
9.4 Social outcomes .............................................................................................................................. 253
9.5 Personal outcomes ........................................................................................................................... 254
9.6 Physical outcomes ........................................................................................................................... 255
9.7 Human Outcomes ............................................................................................................................ 256
9.8 Natural Outcomes ........................................................................................................................... 257
9.9 Analytical and Methodological Lessons ......................................................................................... 258
9.10 Challenges and Implications....................................................................................................... 261
9.10.1 Challenges in financial outcomes ..................................................................................... 261
9.10.2 Challenges in social outcomes .......................................................................................... 262
9.10.3 Challenges in personal outcomes ...................................................................................... 262
9.10.4 Challenges in physical outcomes ...................................................................................... 262
9.10.5 Challenges in Human Outcomes ....................................................................................... 263
9.10.6 Challenges in natural outcomes ........................................................................................ 263
9.10.7 Challenges in how to sustain the livelihood benefit .......................................................... 263
9.11 Recommendation for Future Research ....................................................................................... 270
9.12 Summary of PPT key success factors ......................................................................................... 272
9.13 Summary of Livelihood Tourism (LT) ....................................................................................... 273
9.14 Process of Making Livelihood Tourism (PPT) ........................................................................... 276
9.14.1 Preparation of community readiness for LT ..................................................................... 276
9.14.2 Key factors for the success of LT ..................................................................................... 278
9.14.3 Marketing for LT .............................................................................................................. 279
9.14.4 The four ‗Ps‘ of LT marketing .......................................................................................... 279
9.15 Theoretical Reflection ................................................................................................................ 281
APPENDIX A ............................................................................................................................... 286
APPENDIX B ............................................................................................................................... 310
REFERENCES ............................................................................................................................. 314
9
List of Figures
Figure 1-1 Real GDP and Real GDP per capita in Thailand ............................................... 21
Figure 1-2 Income share held by each income group .......................................................... 22
Figure 1-3The Map of Poverty Categorisation .................................................................... 24
Figure 1-4 Poverty Headcount Ratio and Distribution by Province .................................... 26
Figure 1-5 Income from Tourism in Thailand ..................................................................... 29
Figure 2-1 Pro-Poor Tourism Concept among Others ........................................................ 33
Figure 2-2 Sub-regional GMS Mekong Map ...................................................................... 51
Figure 3-1 Dimensions of Sustainable Livelihoods Framework ......................................... 66
Figure 3-2 Five Asset Building Blocks ............................................................................... 66
Figure 4-1 Chart of Fundamental ―One Tambon One Product‖ Concept ......................... 105
Figure 4-2 Organization Responsible for OTOP ............................................................... 106
Figure 4-3 Average Monthly Income of Selected Areas in 2011 ...................................... 110
Figure 4-4 Value of household debt in selected areas from 2002-2011 ............................ 111
Figure 6-1 Gender Distribution ......................................................................................... 142
Figure 6-2 Where Had Bai children have gone to live ...................................................... 143
Figure 6-3 Number of children living outside village per family...................................... 144
Figure 6-4 Age Distribution .............................................................................................. 145
Figure 6-5 Education ......................................................................................................... 146
Figure 6-6 Annual schedule for Had Bai villagers ............................................................ 150
Figure 6-7 Number of Rai in Had Bai during 3 periods .................................................... 161
Figure 6-8 Allocation of households in the sample among threegroups ........................... 167
Figure 6-9 Average Number of children per household in Group 1 ................................. 168
Figure 6-10 Average Annual Income and Debt of the Three Groups ............................... 172
Figure 8-1 Group 1 Livelihood Outcomes ........................................................................ 221
Figure 8-2 Group 2 Livelihood Outcomes ........................................................................ 223
Figure 8-3 Livelihood outcomes in Group 3 ..................................................................... 225
Figure 8-4 What villagers chose to do when facing livelihood constraint and vulnerability
problem ........................................................................................................... 233
Figure 8-5 If you become poor or are already poor, what do you think the reason would be?233
Figure 8-6 If you had money, do you think about changing your agricultural occupation to
something else? ............................................................................................... 234
Figure 9-1 Six Assets Building Blocks ............................................................................. 259
10
Figure 9-2 Sustainable Livelihoods framework and impact of Pro-Poor Tourism policy in
Thailand .......................................................................................................... 260
Figure 9-3 Relationship of the Government Policy and The National Tourism Development
Plan ................................................................................................................. 266
Figure 9-4 shows ideal cooperation among tourism partnerships ..................................... 267
Figure 9-5 Development Process of Pro-poor Tourism Policy in Thailand ...................... 268
Figure 9-6 How do we measure success of PPT ............................................................... 271
Figure 9-7 Simplified Idea of Livelihood Tourism ........................................................... 274
List of Tables
Table 1-1 Development of Household Debt in Thailand .................................................. 23
Table 1-2 Measurement of Poverty in Thailand, 1988 - 2007 .......................................... 25
Table 1-3 Total expenditure of international tourists ........................................................ 28
Table 2-1 Pro-poor Tourism compared with Sustainable Tourism ................................... 38
Table 2-2 Pro-Poor Tourism compared with Eco-Tourism .............................................. 41
Table 3-1 Sustainable Livelihoods Frameworks—Strengths and Weaknesses ................ 79
Table 4-1 Tourism‘s Share of National GDP (%) ............................................................. 93
Table 4-2 International Tourist Arrivals in GMS Countries, 1995-2007.......................... 93
Table 4-3 Population in the GMS Countries (Millions) ................................................... 94
Table 4-4 Poverty Indicators in the GMS ......................................................................... 94
Table 4-5 Annual income by source (THB) ...................................................................... 99
Table 4-6 Countries and villages participatingin Village Based Tourism ...................... 100
Table 4-7 Poverty conditions in the pilot area related to other parts of Thailand ........... 112
Table 5-1 Fundamental questions for overall review ...................................................... 126
Table 5-2 Integrated sustainable livelihood components with sub-question #1 ............. 127
Table 5-3 Integrated sustainable livelihood components with sub-question #2 ............. 128
Table 5-4 Integrated sustainable livelihood components with sub-question 3# ............. 131
Table 5-5 Questions that lead to the answers from the main research question ............. 131
Table 6-1 Number of Households and Total Population ................................................ 142
Table 6-2 Average number of persons per household seeking jobs outside the village . 144
Table 6-3 Average daily wage comparison from outside employment 1998-2011 ........ 151
Table 6-4 Wages for weaving and tailoring .................................................................... 155
Table 6-5 Land Holding pattern in Had Bai.................................................................... 160
11
Table 6-6 Livelihood Activities (estimated) in Had Bai ................................................. 162
Table 6-7 Measuring factors of a good quality of life .................................................... 162
Table 6-8 Working Schedule of Men and Women in Had Bai Village .......................... 164
Table 6-9 How PPT affects livelihood activities ............................................................ 165
Table 7.1 Do you agree with the following statements?................................................. 183
Table 7.2 Questions concerning financial assets ............................................................ 184
Table 7.3 Questions concerning human assets ............................................................... 184
Table 7.4 Questions concerning natural assets ............................................................... 185
Table 7.5 Questions concerning physical assets / infrastructure .................................... 185
Table 7.6 Questions concerning social assets ................................................................. 186
Table 7.7 PPT Impact on Financial Assets of Group 1 .................................................. 192
Table 7.8 PPT Impact on Financial Assets of Group 2 .................................................. 193
Table 7.9 PPT Impact on Financial Assets of Group 3 .................................................. 194
Table 7.10 PPT Impact on Social Assets in Group 1........................................................ 198
Table 7.11 PPT Impact on Social Assets in Group 2........................................................ 199
Table 7.12 PPT Impact on Social Assets in Group 3........................................................ 200
Table 7.13 PPT Impact on Personal Assets in Group 1 .................................................... 201
Table 7.14 PPT Impact on Personal Assets in Group 2 .................................................... 202
Table 7.15 PPT Impact on Personal Assets in Group 3 .................................................... 203
Table 7.16 PPT Impact on Physical Assets in Group 1 .................................................... 206
Table 7.17 PPT Impact on Physical Assets in Group 2 .................................................... 207
Table 7.18 PPT Impact on Physical Assets in Group 3 .................................................... 208
Table 7.19 PPT Impact on Human Assets in Group 1 ...................................................... 212
Table 7.20 PPT Impact on Human Assets in Group 2 ...................................................... 212
Table 7.21 PPT Impact on Human Assets in Group 3 ...................................................... 213
Table 8.1 PPT impact on the Vulnerability of Group 1 .................................................. 222
Table 8.2 PPT impact on the Vulnerability of Group 2 .................................................. 224
Table 8.3 PPT impact on the Vulnerability of Group 3 .................................................. 226
Table 8.4 How villagers think that PPT can reduce their vulnerability .......................... 229
Table 8.5 Time Line of Events of Disaster in Had Bai Village ...................................... 230
Table 8.6 Time Line of Major Change Events in Had Bai Village ................................ 230
Table 8.7 Scoring of Livelihood constraint & Vulnerability problem ........................... 231
Table 9.9-1 Villagers‘ opinions of a better livelihood ....................................................... 244
12
Table 9.9-2 Improvements and benefits from PPT on the livelihoods of Had Bai Villagers246
Table 9.9-3 To what extent has PPT improved livelihood outcomes ................................ 251
Table 9-4 Japan OVOP and Thailand OTOP Principle ..................................................... 264
List of Pictures
Picture 4.1 Examples of the special weaving styles of the village ................................... 108
Picture 5.1 The Author and Mrs. Duangporn who provided food and accommodation
during fieldwork. ............................................................................................ 136
Picture 5.2 The author during small group discussion ...................................................... 137
Picture 5.3 Focus Group Discussion ................................................................................. 137
Picture 6.1 Elderly Woman and Weaving ......................................................................... 147
Picture 6.2 The author learned how to make cotton yarn .................................................. 173
Picture 6.3 Dance to celebrate Loy Krathong full moon night festival ............................ 174
Picture 6.4 Elder women gather at the temple to make monk‘s robe during full moon
festival............................................................................................................. 174
Picture 6.5 Hua Kuan Temple near Had Bai Village. ....................................................... 175
Picture 6.6 Buddha at Hua Kuan temple ........................................................................... 175
Picture 7.1 Local shop in Had BaiPicture 7.2 The village‘s only water pum ................... 219
13
List of Boxes
Box 2.1 Sapa, Vietnam ........................................................................................................ 53
Box 2.2 Siem Reap, Cambodia ............................................................................................ 54
Box 2.3 Mae Kompong and Plai Phong Phang, Thailand ................................................... 55
Box 2.4 Xishuangbanna, Yunnan ........................................................................................ 56
Box 2.5 Luang Prabang, Lao PDR ...................................................................................... 57
List of Maps
Map 6.1 Map of Chiang Rai .............................................................................................. 140
Map 6.2 Map of the location of participating groups in Had Bai Village ......................... 166
14
ACKNOWLEDGEMENTS
I am grateful to many people in Thailand and the UK who have directly and indirectly
contributed to the success of this study. The following persons require special thanks.
First of all, my supervisor, Dr.Sunil Kumar, who devoted his valuable time and offered me
guidance and support throughout my study.
I am grateful to Dr. Gail Wilson for her support during the major review in 2002.
For her provision of important materials and guidance in Thailand, I would like to thank
Ms. Patcharee Wattanatham.
I would like to thank Dr. Somsak Srisontisuk, Dr. Ivan Stanley Reyes Sagun and Dr.
Chayawadee Chaianan for many valuable comments on the thesis.
Special thanks go also to Mrs. Carol Woollard, Mrs. Sitapa Na Talang, and Dr. Pataporn
Sukontamarn for their help and encouragement at various stages of my research.
Last but not least, my husband Warit Decharin, who shouldered all family responsibilities,
my daughter Warichaya Decharin and my son Supatach Decharin who gave me love and
inspiration.
Finally, I would like to thank my parents for the inspiration to pursue my studies, their
constant support and encouragement for my study in Britain.
This thesis is dedicated to my family.
15
ABBREVIATIONS
ADB Asian Development Bank
ASEAN Association of Southeast Asian Nations
Bt, THB Thai Baht(Thailand‘s currency)
CARE Cooperative for Assistance and Relief Everywhere, Incorporated
CBOs Community-based Organisations
CBT Community-Based Tourism
DFID Department for International Development
DOT Department of Tourism
FRDF Farmers Restoration and Development Fund
GDP Gross Domestic Product
GMS Greater Mekong Sub-region
Lao PDR Lao People‘s Democratic Republic
LED Local Economic Development
MOTS Ministry of Tourism and Sports
NGO Non-Governmental Organisation
NOAC National OTOP Administrative Committee
ODI Overseas Development Institute
OTOP One Tambon One Product
OVOP One Village One Product
PA Participatory Assessment
PALI Participatory Analysis of Livelihood Impacts & Issues
PRA Participatory Rural Appraisal
PPT Pro-poor Tourism
RRA Rapid Rural Appraisal
SL Sustainable Livelihoods
SMEs Small and Medium Enterprises
TAT Tourism Authority of Thailand
UNDP United Nations Development Programme
USD United States Dollars
VBT Village-Based Tourism
WTO World Tourism Organization
16
CHAPTER 1
Introduction to Pro-Poor Tourism
Tourism is one of the world‘s largest industries, with over 10 per cent of global GDP
directly related to tourism activities (Goodwin, 2000). Tourism also in Thailand directly
contributed 2.56 million jobs or 6.6 percent of the total employment in 2013 (World Travel
and Tourism Council 2014). With both backward and forward links to production and
employment, the industry can have both a positive and a negative effect on the livelihood
of the poor (Deloitte and Touche, 1999). Nevertheless, policy regarding tourism
development in most countries continues driven by economic, environmental and cultural
perspectives at national and international levels, with the impact on the poor at best a
secondary consideration.
Since the mid-1980s there has been rapid growth in interest among decision makers
and practitioners in sustainable tourism, eco-tourism and community tourism, focusing on
the need to ensure that tourism does not prove ruinous to the environment and local
cultures (Ashley, Boyd and Goodwin, 2000). However, there has been little consideration
of the full range of impacts on rural livelihoods, and most countries have failed to
incorporate the objectives of poverty elimination or mitigation into policies regarding
tourism development. To this extent, the current policy agenda has missed the potential to
enhance opportunities for the poor and hence the overall well-being of the economy
(Ashley, 2000).
Governments and investors in tourism development thus face the challenge of
responding to changes in broader thinking on strategies to ensure and enhance the positive
impact of tourism on the livelihood of the poor.While poverty reduction may not be at the
heart of the international tourism agenda, tourism itself affects significantly the livelihoods
of millions of poor people. As a result, authorities in many countries, especially emerging
markets, have promoted a strategy known as Pro-poor Tourism (PPT), defined as tourism
that generates net benefits for the poor. This does not refer only to economic benefits, but
also encompasses social, environmental and cultural benefits, at the same time as aiming to
unlock opportunities for the poor rather than merely expanding the overall size of the
sector.
17
The aim of this thesis is to explore PPT policy and its impact on projects in
Thailand.In particular, it examines whether PPT interventions have enhanced the
livelihoods of the poor. In addition it seeks to examine question whether PPT contributes
to a diversification of livelihood options, and to what extent this diversification reduces
vulnerability and thus has an impact on poverty reduction. One PPT strategy this thesis
will focus on is the One Tambon One Product (OTOP) scheme.
Launched in 2001 as a countrywide community entrepreneurship stimulus
programme designed by then Prime Minister ThaksinShinawatra during his 2001-
2006 Thai Rak Thai (Thai Loves Thai) government, OTOP was inspired by an earlier
Japanese One Village One Product (OVOP) scheme, and Taiwan‘s One Town One Product
(OTOP) project, itself modelled on the Japanese innovation. The programme is intended to
support locally made products from each sub-district (tambon)through the improved
quality and marketing of local products. A selected product from each sub-district is
formally branded as a starred OTOP product, with a platform for local promotion and
marketing, but also for the national market and possible export. Locallyproduced OTOP
products include handicrafts, cotton and silk clothing and accessories, ceramics, kitchen
and household items, and processed food products. In September 2006 a military junta
carried out a coup against the elected government and cancelled the OTOPprogramme, but
it was later revived and renamed, although retaining OTOP branding. Aimed at improving
income in village communities to help alleviate rural poverty, the scheme provides an
avenue through which the poor can access the higher benefits of tourism.
1.1 Research questions
The purpose of the research is to investigate the effect of the OTOP project as a proxy for
Thailand‘s PPT policy on the livelihood of the rural poor, and to this end focuseson the
extent to which Thailand‘s PPT policy has improved the livelihoodof the rural poor, the
degree of participation, how PPT has contributed to livelihood diversification and whether
it has reduced or increased the vulnerability of the poor.
The research question of this project is―To what extent has Pro-poor Tourism
improved the livelihood of the rural poor in Thailand‖. This question will be answered
through the following three sub questions:
18
1. What are the livelihood structures and strategies of the rural poor in Thailand?
2. How has Pro-poor Tourism contributed to livelihood diversification and an
increasing in the assets of the poor?
3. To what extent has pro-poor tourism reduced the vulnerability of the rural poor?
1.2 The expected outcomes from this study
The expected results of this studyare:
1. An understanding of how tourism interventions have improved the livelihood
outcomes of the poor in Thailand.
2. An improved understanding of residents‘ perceptions, values and priorities relating
to Pro-poor Tourism projects in their community.
3. Help identifying strategies to enhance the livelihood impacts of tourism on the
poor.
This will produce guidelines for the future development of Pro-poor Tourism in Thailand.
1.3 Scope of the study
This study will focus on Pro-poor Tourism Projectslaunched by the Thai Government
from 1998-2011. The methodology employed to answer this is based on a sustainable
livelihoods (SL) framework using secondary data together with information fromprimary
data obtained from a survey on OTOP.
1.4 Why study Pro-poor Tourism?
Essentially, pro-poor tourism is defined as tourism that generates net benefits for the poor.
Benefits may be economic but they may also be social, environmental or cultural. Many
developing countries believe that tourism is an effective means of expanding national
economic growth as the development of the industry helps create job opportunities and
increase local income. The industry is considered labourintensive and has a catalytic effect
on the rest of the economy as it has lower barriers to entry and creates better and more
gender-concerned jobs than most other economic sectors (Gerosa, 2003). Tourism can be
seen to not only generate growth within its own industry, but also to spread this growth to
other related businesses, including the hotel, restaurant, transport and communications
sectors.
19
Moreover, it is also involved with almost all production sectors at all levels,
whether local, provincial or national. However, tourism policy in most countries has not
incorporated sufficiently the objective of poverty reduction. Tourism has been
predominantly driven by economic, environmental and cultural perspectives at both
national and international levels, and its potential to enhance opportunities for the poor has
been somewhat overlooked. While the economic aspects of tourism in terms of wage and
income has a direct benefit to the poor, the indirect impact on the livelihood of the poor
can also be significant (Dorosh and Klytchnikova, 2009). Firstly, it can change poor
people‘s access to assets and related livelihood options such as natural resources, physical
infrastructure and funds for investment in health, education and other assets. Secondly,
tourism can have a social impact, affecting other livelihood goals such as cultural pride, a
sense of control and security, as well as good health. The range of impacts may be
distributed unevenly among different sectors of the poor, depending upon the structural
characteristics of the society in question.
In Thailand, tourism has been part of the nation‘s broad development strategy for
decades, and is used as a major source of generating foreign exchange revenue for the
economy, thus contributing to overall economic growth. Furthermore, as tourism is a
labour-intensive activity, it is expected to create a broader distribution of economic benefit,
both direct and indirect, within the economy. Although the number of foreign tourists
visiting Thailand has grown in recent years, the majority remain concentrated in major
cities with well-developed infrastructure and shopping areas. Mass tourism of this kind is
unlikely to ensure the favourable distribution of impacts to low-income groups living away
from popular locations. More recently however the Thai government has started to
promote tourism development, better income distribution and cooperation among the
people in local communities to foster sustainable development. (MOTS Tourism
Strategies, 2012)
The government and community leaders have developed several alternative forms of
tourism for the benefit of local communities, where people can use their natural and
cultural endowments to create economic value. However, there has been no explicit pro-
poor strategy that uses tourism as a tool to reduce poverty.
20
Although alternative tourism activities help to create income and employment, they
do not create net positive benefits to the poor (Pupphavesa, Panpeimras and
Anutchiworawong, 2005).
1.5 How Pro-Poor Tourism development began in Thailand
Recognizing the importance of tourism, the Thai government formulated several strategies
specific to tourism development under the Ninth National and Social Development Plan
(2002-2006). In addition to this national plan, which provides policy direction for the
entire economy, government agencies have formulated a number of sub-plans, including
Thailand Tourism Strategies (2004-2008), Thailand Tourism Development Strategies
(2004-2006), and the Ministry of Tourism and Sports‘ Action Plan (2005-2008). These
plans contain implicit pro-poor aspects in terms of improved income distribution, and the
strategies have the economic objective of driving tourism activities to generate substantial
earnings for the economy. Some strategies are concerned with the development of
communities, and focus on how to establish linkages between tourism and local
communities and to improve income distribution.
Historically, tourism in Thailand has been widely criticisedas a major cause of
social problems. In particular tourism achieved notoriety as a result of a sex industry
catering to locals and international tourists. During the1970s and 1980s sex tourism in
Thailand was advertised by both Thai and international travel companies as one of
thecountry‘s key attractions (Truong, 1990).The World Health Organization (WHO)
estimated that 3.5 million people in Asia are infected with HIV and probably as many as
750,000 from Thailand (Fairclough, 1995) Social problems such as the exploitation and
trafficking of women and children for sex and/or cheap labour, the spread of HIV/AIDS,
and the sale and use of illegal drugs all affects vulnerable populations. The struggle against
the social problems attributed to tourism has been exacerbated by the failure of
government authorities to curb corruption instigated by well-connected criminal
organizations. This has hindered the Thai government from a close examination of the root
causes of these problems, an examination that is vital if vulnerable populations are to be
rescued from entrenched poverty.
21
International and Thai tourists
To address this, a Pro-poor National Tourism Policy was formulated at a National Tourism
Workshop held in the northern city of Chiang Mai on 20-21 April 2001, attended by the
prime minister and representatives of the Tourism Authority of Thailand (TAT), the
governments of each of the nation‘s provinces, NGOs and private businesse. In the hope
that tourism will become a tool to reduce the poverty behind wider social problems, new
policies have been launched together with the new National Agenda. These policies match
the concept of PPT in that they aim to generate direct benefits for impoverished groups
nationwide.
1.6 Poverty situation in Thailand
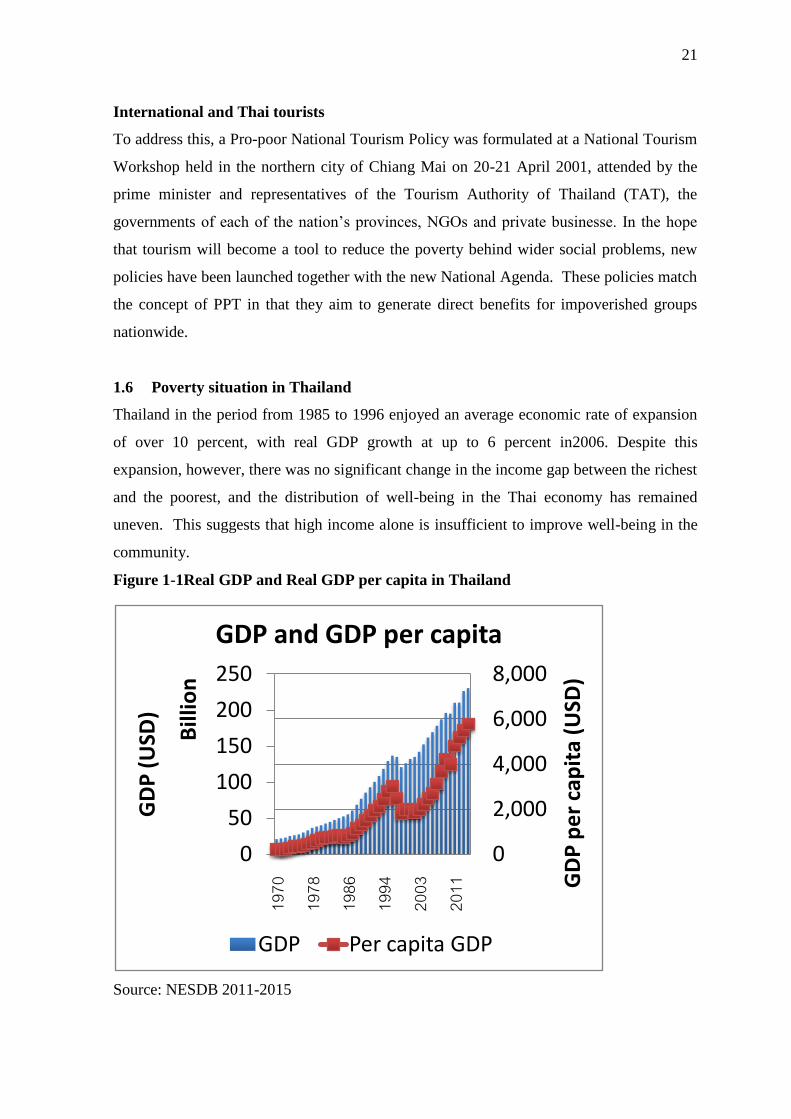
Thailand in the period from 1985 to 1996 enjoyed an average economic rate of expansion
of over 10 percent, with real GDP growth at up to 6 percent in2006. Despite this
expansion, however, there was no significant change in the income gap between the richest
and the poorest, and the distribution of well-being in the Thai economy has remained
uneven. This suggests that high income alone is insufficient to improve well-being in the
community.
Figure 1-1Real GDP and Real GDP per capita in Thailand
Source: NESDB 2011-2015
0
50
100
150
200
250
0
2,000
4,000
6,000
8,000
1970
1978
1986
1994
2003
2011
GD
P (
USD
)
Bill
ion
GD
P p
er
cap
ita
(USD
)
GDP and GDP per capita
GDP Per capita GDP
22
Theory also suggests that an inadequate income is only a partial indication of
poverty, as it is also possible to escape the condition of poverty through better education,
consumption and healthcare. Moreover, poverty does not merely have an economic
impact, but also, due to questions of social status, a psychological one, and leads to issues
such as general insecurity and unstable homes (Johnson, B., 1967). Regardless, a
considerable amount of research has used income as an indicator of poverty. Traditional
approaches to poverty define the minimum subsistence needs of people to achieve an
adequate standard of living in a given country. The most common measure of poverty used
in international studies has been approximately USD1 per day. However, the World Bank
has revised the threshold to USD1.25 at 2005 PPP (Purchasing Power Parity) standards
(Worldbank, 2008).
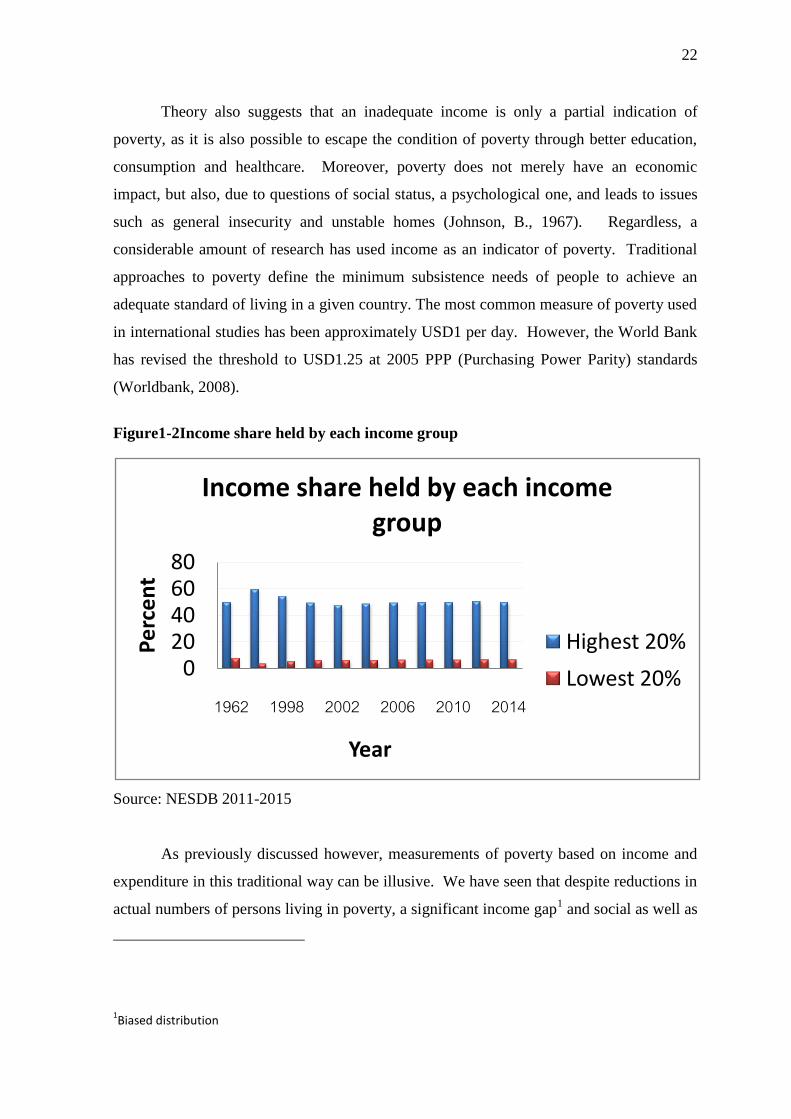
Figure1-2Income share held by each income group
Source: NESDB 2011-2015
As previously discussed however, measurements of poverty based on income and
expenditure in this traditional way can be illusive. We have seen that despite reductions in
actual numbers of persons living in poverty, a significant income gap1 and social as well as
1Biased distribution
020406080
1962 1998 2002 2006 2010 2014
Pe
rce
nt
Year
Income share held by each income group
Highest 20%
Lowest 20%
23
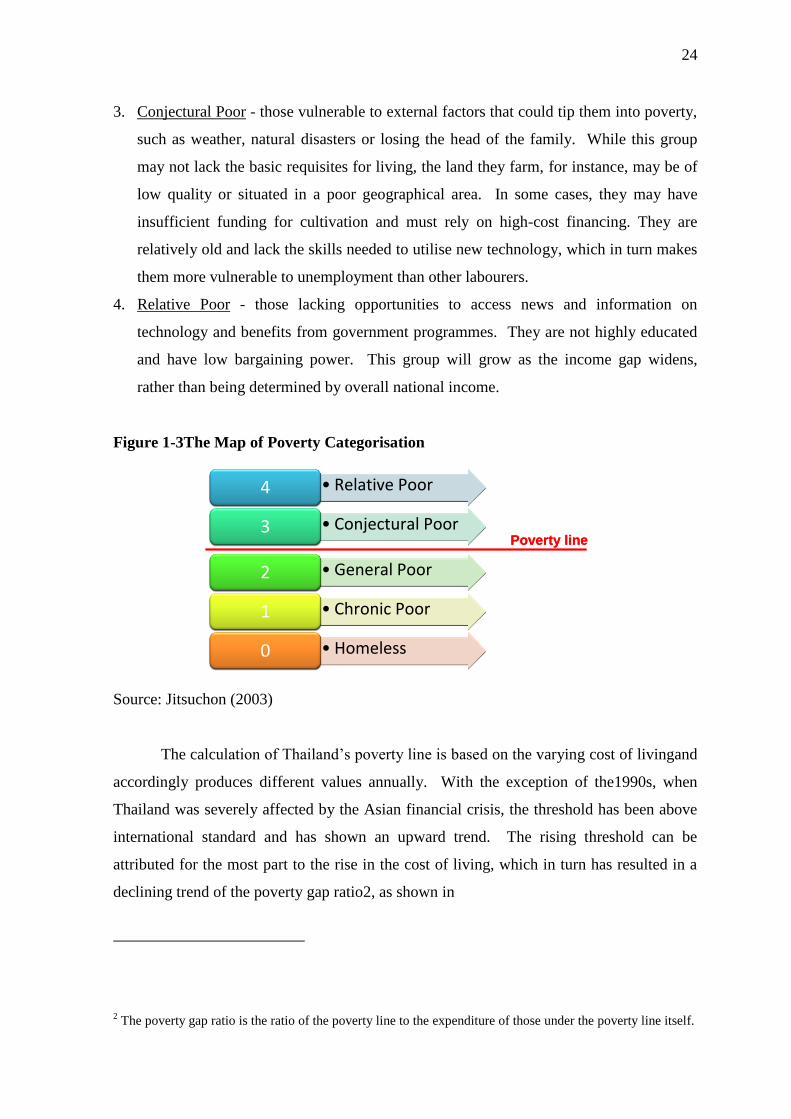
environmental problems remain. The simple statistics from previous studies on Thailand
can be taken as a good example of outstanding problems. Researchers discovered that the
rate of income increase over previous years led by a rise in household assets has been
relatively lower than the increase in household‘s liabilities (BOT symposium, 2004). This
finding is confirmed by the data from the National Statistical Office on household debt and
monthly income, shown in Table 1-1.
Table 1-1 Development of Household Debt in Thailand
1994 1996 1998 2000 2002 2004 2006 2007
Average Household Debt
(Baht/household)
31,019 55,300 72,345 70,586 84,603 104,571 116,585 116,681
Ratio of Household Debt to
Monthly Income
3.7 5.0 5.7 5.7 6.1 7.0 6.6 6.3
Source: National Statistical Office 2008
These increasing liabilities may create further difficulties for the poor in their
management of their way of living, and it is thus possible to argue that these people remain
stuck in poverty. Although there has been no breakthrough in terms of the invention of an
approach to poverty measurement that would accommodate these factors, the facts indicate
that the growth development strategies targeting the grass-roots economy are essential for
the overall improvement of the country‘s well-being.
1.7 Categorising the poor in Thailand
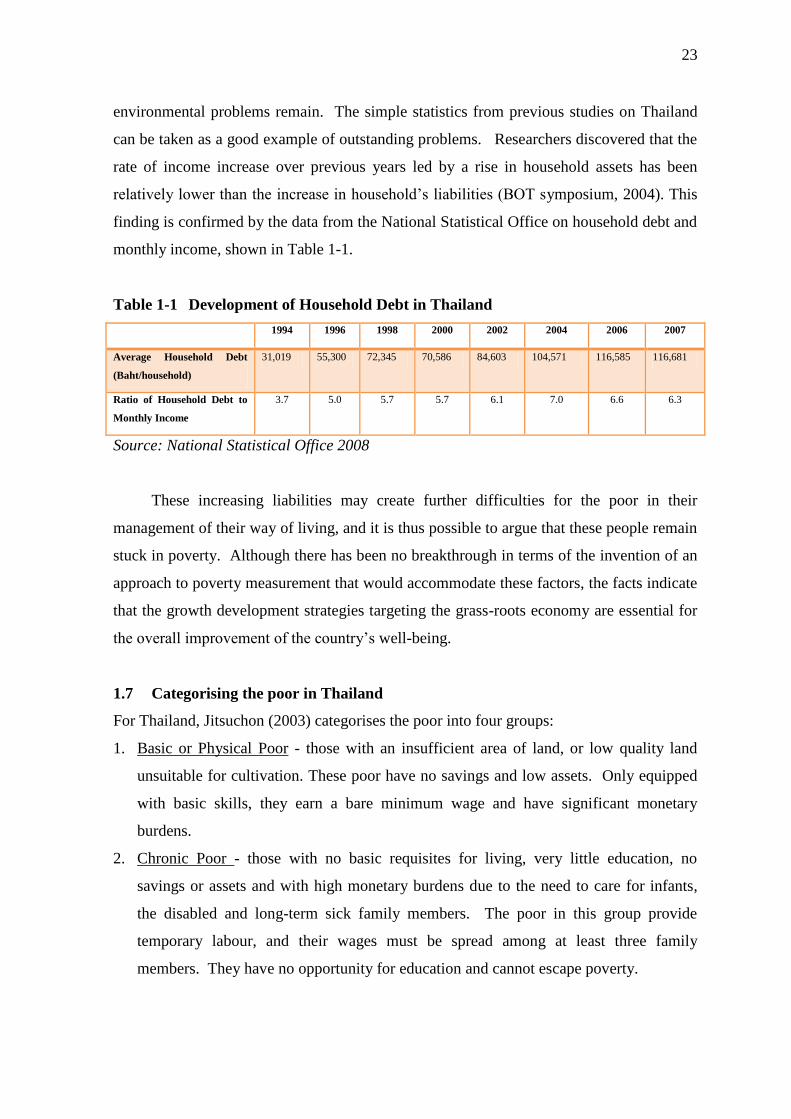
For Thailand, Jitsuchon (2003) categorises the poor into four groups:
1. Basic or Physical Poor - those with an insufficient area of land, or low quality land
unsuitable for cultivation. These poor have no savings and low assets. Only equipped
with basic skills, they earn a bare minimum wage and have significant monetary
burdens.
2. Chronic Poor - those with no basic requisites for living, very little education, no
savings or assets and with high monetary burdens due to the need to care for infants,
the disabled and long-term sick family members. The poor in this group provide
temporary labour, and their wages must be spread among at least three family
members. They have no opportunity for education and cannot escape poverty.
24
3. Conjectural Poor - those vulnerable to external factors that could tip them into poverty,
such as weather, natural disasters or losing the head of the family. While this group
may not lack the basic requisites for living, the land they farm, for instance, may be of
low quality or situated in a poor geographical area. In some cases, they may have
insufficient funding for cultivation and must rely on high-cost financing. They are
relatively old and lack the skills needed to utilise new technology, which in turn makes
them more vulnerable to unemployment than other labourers.
4. Relative Poor - those lacking opportunities to access news and information on
technology and benefits from government programmes. They are not highly educated
and have low bargaining power. This group will grow as the income gap widens,
rather than being determined by overall national income.
Figure 1-3The Map of Poverty Categorisation
Source: Jitsuchon (2003)
The calculation of Thailand‘s poverty line is based on the varying cost of livingand
accordingly produces different values annually. With the exception of the1990s, when
Thailand was severely affected by the Asian financial crisis, the threshold has been above
international standard and has shown an upward trend. The rising threshold can be
attributed for the most part to the rise in the cost of living, which in turn has resulted in a
declining trend of the poverty gap ratio2, as shown in
2 The poverty gap ratio is the ratio of the poverty line to the expenditure of those under the poverty line itself.
• Relative Poor4
• Conjectural Poor3
• General Poor2
• Chronic Poor1
• Homeless0
Poverty line
• Relative Poor• Relative Poor44
• Conjectural Poor• Conjectural Poor33
• General Poor• General Poor22
• Chronic Poor• Chronic Poor11
• Homeless• Homeless00
Poverty line
25
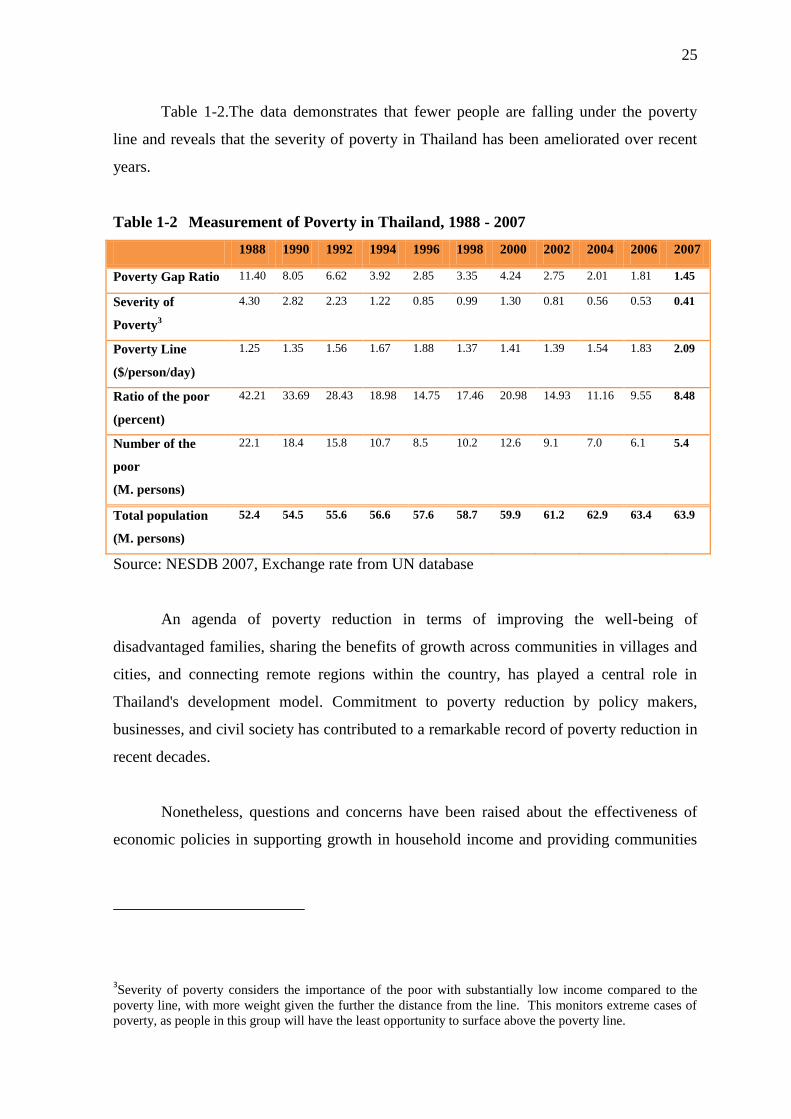
Table 1-2.The data demonstrates that fewer people are falling under the poverty
line and reveals that the severity of poverty in Thailand has been ameliorated over recent
years.
Table 1-2 Measurement of Poverty in Thailand, 1988 - 2007
1988 1990 1992 1994 1996 1998 2000 2002 2004 2006 2007
Poverty Gap Ratio 11.40 8.05 6.62 3.92 2.85 3.35 4.24 2.75 2.01 1.81 1.45
Severity of
Poverty3
4.30 2.82 2.23 1.22 0.85 0.99 1.30 0.81 0.56 0.53 0.41
Poverty Line
($/person/day)
1.25 1.35 1.56 1.67 1.88 1.37 1.41 1.39 1.54 1.83 2.09
Ratio of the poor
(percent)
42.21 33.69 28.43 18.98 14.75 17.46 20.98 14.93 11.16 9.55 8.48
Number of the
poor
(M. persons)
22.1 18.4 15.8 10.7 8.5 10.2 12.6 9.1 7.0 6.1 5.4
Total population
(M. persons)
52.4 54.5 55.6 56.6 57.6 58.7 59.9 61.2 62.9 63.4 63.9
Source: NESDB 2007, Exchange rate from UN database
An agenda of poverty reduction in terms of improving the well-being of
disadvantaged families, sharing the benefits of growth across communities in villages and
cities, and connecting remote regions within the country, has played a central role in
Thailand's development model. Commitment to poverty reduction by policy makers,
businesses, and civil society has contributed to a remarkable record of poverty reduction in
recent decades.
Nonetheless, questions and concerns have been raised about the effectiveness of
economic policies in supporting growth in household income and providing communities
3Severity of poverty considers the importance of the poor with substantially low income compared to the
poverty line, with more weight given the further the distance from the line. This monitors extreme cases of
poverty, as people in this group will have the least opportunity to surface above the poverty line.
26
with access to basic services. The overlap between poor areas and areas with low
population densities is a special form of poverty in Thailand.
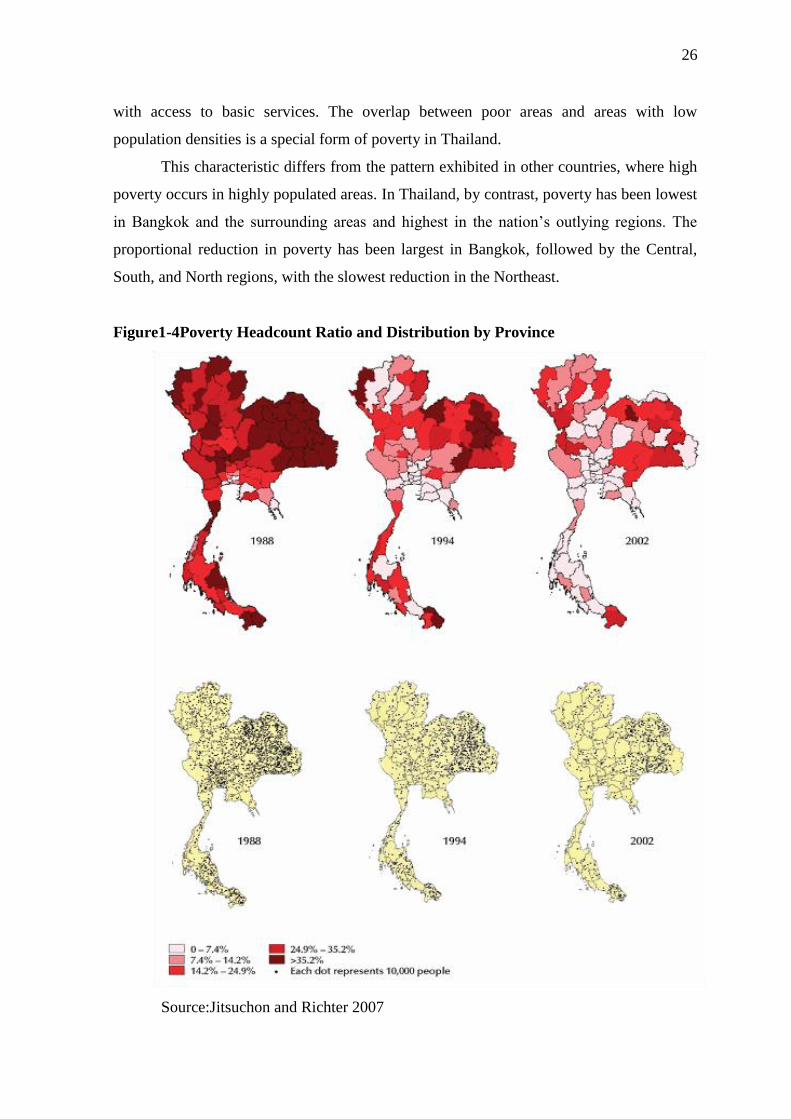
This characteristic differs from the pattern exhibited in other countries, where high
poverty occurs in highly populated areas. In Thailand, by contrast, poverty has been lowest
in Bangkok and the surrounding areas and highest in the nation‘s outlying regions. The
proportional reduction in poverty has been largest in Bangkok, followed by the Central,
South, and North regions, with the slowest reduction in the Northeast.
Figure1-4Poverty Headcount Ratio and Distribution by Province
Source:Jitsuchon and Richter 2007
27
The Thai poverty map shows that while the Northeast and the South include the
very poorest provinces, these regions also contain wealthy provinces where poverty
incidence is less than 7.5 percent. Provinces in Thailand having high poverty headcounts
tend to have large populations and, as a result, a large number of poor people. However,
this general pattern does not apply to the North, the second poorest region in Thailand. The
Northern provinces with the highest poverty incidence tend to be remote and with small
populations, the low population density meaning that they contribute only moderately to
the national poverty rate. In order to touch the root cause of poverty in Thailand one must
look beyond the income rate and the conventional national poverty rate. Thus, in
Thailand‘s case, the targeting of public resources on a small number of provinces, sub-
districts, and villages has allowed the country to achieve significant progress in meeting
the goal of eradicating poverty (Jitsuchon and Richter, 2007)
1.8 Motivations for a study of the impact of Pro-poor Tourism development on the
livelihoods of the poor in Thailand
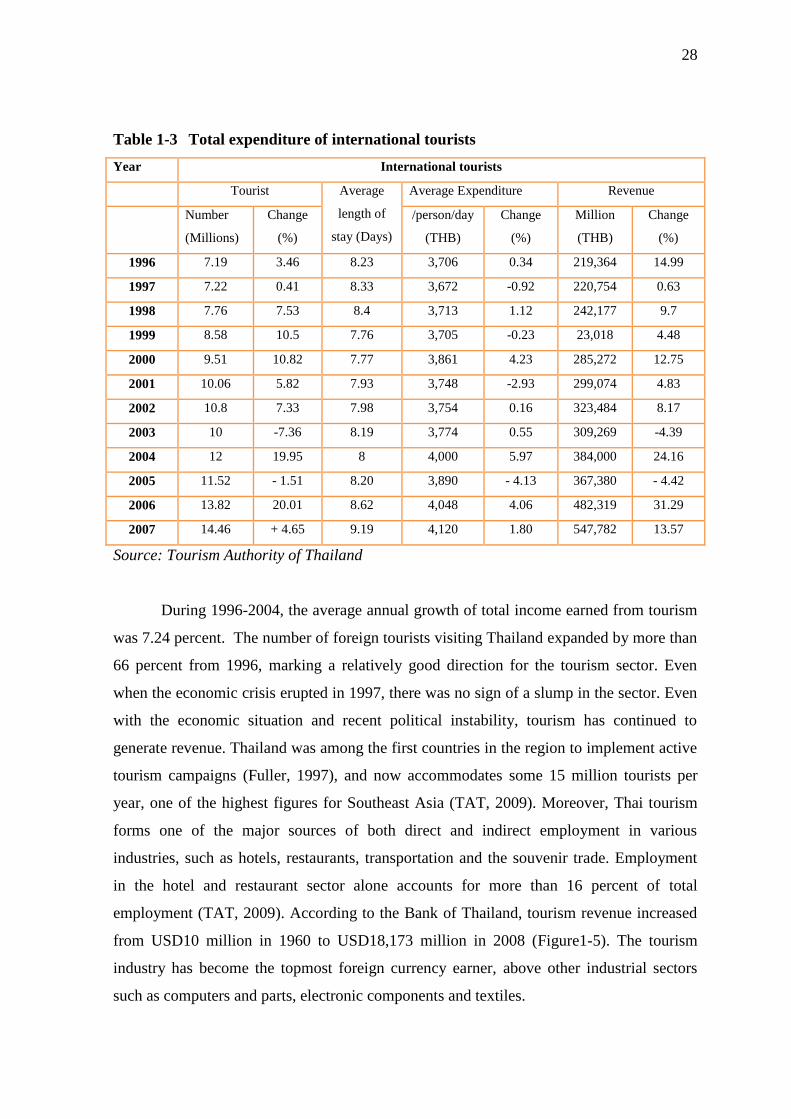
Tourism has played a vital role in the Thai economy, with an estimated THB 348 billion in
total receipts from foreign tourist expenditure in 2004, representing a 24.16 percent
increase from 2003 levels (Table 1-3).
Even with an economic downturn and ten years of political instability, tourism
continues to generate revenue. (Fuller, 1997), and now accommodates approximately 24.7
million tourists per year, one of the highest figures for Southeast Asia (Ministry of
Tourism and Sports, 2015). Thai tourism forms a major source of both direct and indirect
employment in industries such as hotels, restaurants, transportation and the souvenir trade.
Employment in the hotel and restaurant sector alone accounts for more than 16 per cent of
total employment (TAT. 2009). Tourism revenue has increased from USD 10 million in
1960 to USD 46 billion in 2013 according to the World Tourism Organization.
28
Table 1-3 Total expenditure of international tourists
Year International tourists
Tourist Average
length of
stay (Days)
Average Expenditure Revenue
Number
(Millions)
Change
(%)
/person/day
(THB)
Change
(%)
Million
(THB)
Change
(%)
1996 7.19 3.46 8.23 3,706 0.34 219,364 14.99
1997 7.22 0.41 8.33 3,672 -0.92 220,754 0.63
1998 7.76 7.53 8.4 3,713 1.12 242,177 9.7
1999 8.58 10.5 7.76 3,705 -0.23 23,018 4.48
2000 9.51 10.82 7.77 3,861 4.23 285,272 12.75
2001 10.06 5.82 7.93 3,748 -2.93 299,074 4.83
2002 10.8 7.33 7.98 3,754 0.16 323,484 8.17
2003 10 -7.36 8.19 3,774 0.55 309,269 -4.39
2004 12 19.95 8 4,000 5.97 384,000 24.16
2005 11.52 - 1.51 8.20 3,890 - 4.13 367,380 - 4.42
2006 13.82 20.01 8.62 4,048 4.06 482,319 31.29
2007 14.46 + 4.65 9.19 4,120 1.80 547,782 13.57
Source: Tourism Authority of Thailand
During 1996-2004, the average annual growth of total income earned from tourism
was 7.24 percent. The number of foreign tourists visiting Thailand expanded by more than
66 percent from 1996, marking a relatively good direction for the tourism sector. Even
when the economic crisis erupted in 1997, there was no sign of a slump in the sector. Even
with the economic situation and recent political instability, tourism has continued to
generate revenue. Thailand was among the first countries in the region to implement active
tourism campaigns (Fuller, 1997), and now accommodates some 15 million tourists per
year, one of the highest figures for Southeast Asia (TAT, 2009). Moreover, Thai tourism
forms one of the major sources of both direct and indirect employment in various
industries, such as hotels, restaurants, transportation and the souvenir trade. Employment
in the hotel and restaurant sector alone accounts for more than 16 percent of total
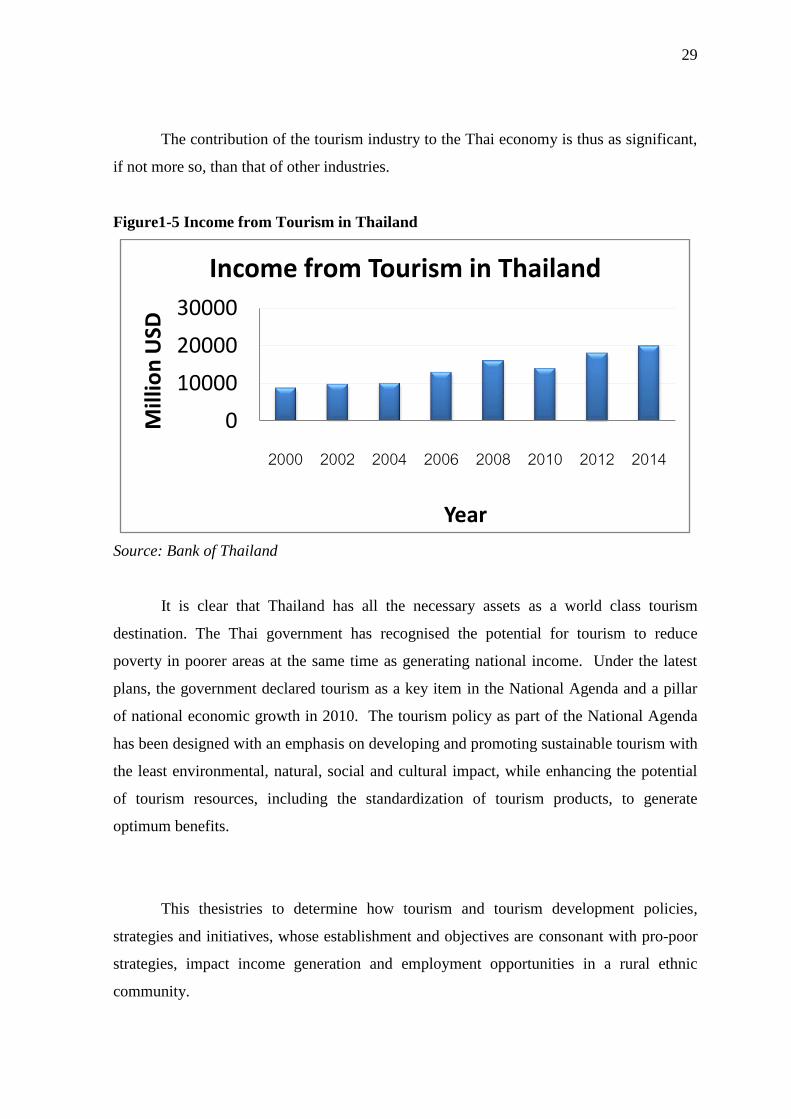
employment (TAT, 2009). According to the Bank of Thailand, tourism revenue increased
from USD10 million in 1960 to USD18,173 million in 2008 (Figure1-5). The tourism
industry has become the topmost foreign currency earner, above other industrial sectors
such as computers and parts, electronic components and textiles.
29
The contribution of the tourism industry to the Thai economy is thus as significant,
if not more so, than that of other industries.
Figure1-5 Income from Tourism in Thailand
Source: Bank of Thailand
It is clear that Thailand has all the necessary assets as a world class tourism
destination. The Thai government has recognised the potential for tourism to reduce
poverty in poorer areas at the same time as generating national income. Under the latest
plans, the government declared tourism as a key item in the National Agenda and a pillar
of national economic growth in 2010. The tourism policy as part of the National Agenda
has been designed with an emphasis on developing and promoting sustainable tourism with
the least environmental, natural, social and cultural impact, while enhancing the potential
of tourism resources, including the standardization of tourism products, to generate
optimum benefits.
This thesistries to determine how tourism and tourism development policies,
strategies and initiatives, whose establishment and objectives are consonant with pro-poor
strategies, impact income generation and employment opportunities in a rural ethnic
community.
0
10000
20000
30000
2000 2002 2004 2006 2008 2010 2012 2014
Mill
ion
USD
Year
Income from Tourism in Thailand
30
This issue is the main motivation of this research, as tourism is one of many
revenues streams that can increase opportunities forthe poor and gradually close the
income gap in the long run. This research focuses on PPT development in Thailand, where
existing natural resources and legendary hospitality have combined to help generate
tourism income. However, most benefits from the sector have hitherto appeared to
concentrate in middle-to high-income groups, such as business owners and workers
earning at very least a basic living wage. This, in turn, leads to questions of how policy
makers can expand tourism activities in Thailand that they may fulfill their potential to
enhance the well-being of poor communities. To fully access the potential of tourism for
pro-poor growth, Gerosa (2003) has suggested that one must go beyond the economic
benefits and socio-cultural impact and focus on livelihood and distribution.
1.9 Thesis Structure
This paper is divided into nine chapters. Chapter 1 introduces the purpose and aim of this
research, looking at the background and motivations for a study of PPT and how it began
in Thailand, and providing an overview to poverty hereand the categorisation ofits poor.
Following the general introduction, Chapter 2 focuses on PPT as a concept and
gives an overview of related literature, including issues and debates. This chapter defines
differences between PPT and alternative conceptualisations of tourism and PPT strategies.
Chapter 3 links the PPT concept to an analysis of its impact on livelihood,
providing a framework for methodology and analysis.The Sustainable Livelihoods
framework was adapted and reviewed to provide a more holistic approach to examine the
livelihood impact of Thailand‘s PPT. The framework also helps explain the livelihood
strategies of the rural poor in the research village.
Chapter 4 discusses PPT policy in Thailand and gives an overview of the
authorities‘ policy towards PPT. This chapter provides information on PPT intervention in
Thailand and the background of the OTOP project. Related literature on OTOP and
tourism in Northern Thailandare described here.
31
Chapter 5 explains the methodology employed and experiences
of the author while undertaking field research during various stages of study. Fundamental
questions for overall review are provided along with the reasons for project selection.
Chapter 6 begins the analysis, and answers the first sub-question of the research:
What are the livelihood structures and strategies of the rural poor in Thailand? This will
provide information on the livelihood patterns, the general background of Thailand‘s rural
poor, and the characteristics of the economic structure, all of which are necessary for an
understanding of the livelihood structures and strategies of the poor in the pilot project.
It also provides the general background of the research village as well as the demographic
data. The chapter divides the villagers into the three groups based on their level of
participation in the OTOP project: those who were unaware of theprogramme and thus did
not participate, those who knew of the programme but chose not to participate, and those
who actively participated. The average annual income versus debt analysis of the three
groups is presented to illuminate the financial capital of the poor. In-depth analysis of the
overall livelihood and assets of the three groups will be analysed systematically. Chapter 6
also explains the relevance of participation and the livelihood impact.
Chapter 7 attempts to answer the second sub-research question: How has pro-poor
tourism contributed to livelihood diversification and an increase in the assets of the poor?
The chapter will explain how villagers understand livelihood diversification and whether
their assets, as defined by the Sustainable Livelihood approach, have changed
followingimplementation of the PPT project.
Chapter 8 answers the third sub-research question: To what extent has pro-poor
tourism reduced the vulnerability of the rural poor?
Finally, Chapter 9 pulls together answers to the three sub-questions in order to
answer the main research question: To what extent has Pro-poor Tourism improved the
livelihood of the rural poor in Thailand? This chapter summarises the effectiveness of PPT
projects in terms of improving the livelihoods of the poor. Overall results are looked at in
the light of the existing literature, and an explanation of the discrepancies is discussed.
Suggestions are given for policy implication and ways of making PPT work effectively.
32
CHAPTER 2
Pro-poor Tourism and Review of Literature
2.1 Defining Pro-Poor Tourism Concepts
The concept of Pro-Poor Tourism falls under the broader umbrella of sustainable
development. Sustainable tourism focuses on issues such how tourism damages nature,
culture and the environment, the response of the local community and investment in
tourism. While PPT is broadly congruent with such ideas, it places greater emphasis on
how tourism can benefit the poor (Ashley, 2000). It is not a specific tourism product or
sector, but rather an overall approach involving a range of stakeholders operating at
different levels. Rather than aiming to expand the size of the tourism-related sector, PPT
strategies aim to unlock opportunities for the poor (Ashley, Roe, Goodwin, 2001). One
distinctive feature of PPT is that the poor can use ancestral skills such as cooking, farming,
fishing, and craft production that they typically possess, to create profitable opportunities
(Renard, 2001). PPT comprises tourism-related activities to bring about net benefits for
the poor, increasing their overall quality of life and sense of well-being in diverse ways,
including economic, social, environmental and cultural benefits.
Pro-poor tourism is set-up in developing countries as a means to improve the local
economy for local people. It generally enhances linkages between tourism businesses and
the poor, reducing poverty so poor people can participate more effectively in tourism
development. There are a host of possible aims of pro-poor tourism, such as increasing
local employment to involving local people in the decision-making process.
Prior to the emergence of PPT as a distinct concept, there was already an emphasis
on sustainable tourism, eco-tourism and community tourism, all of which have grown
rapidly since the mid-1980s. All of these seek to ensure that tourism does not have a
detrimental environmental or cultural impact on the societies in question, but do not
consider specifically the full extent of the impact on the livelihoods of the poor (Ashley,
Roe and Goodwin 2001). An awareness that such issues needed addressing led
governments in the late 1990s to develop PPT strategies.
33
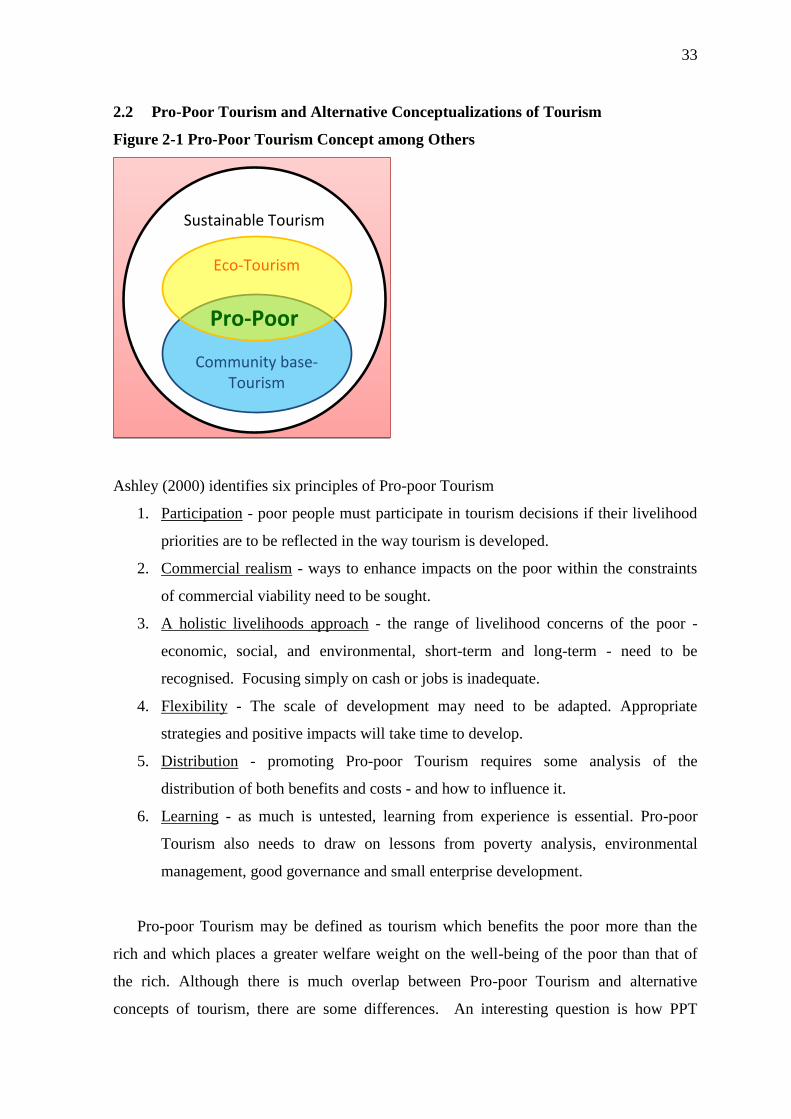
2.2 Pro-Poor Tourism and Alternative Conceptualizations of Tourism
Figure 2-1 Pro-Poor Tourism Concept among Others
Ashley (2000) identifies six principles of Pro-poor Tourism
1. Participation - poor people must participate in tourism decisions if their livelihood
priorities are to be reflected in the way tourism is developed.
2. Commercial realism - ways to enhance impacts on the poor within the constraints
of commercial viability need to be sought.
3. A holistic livelihoods approach - the range of livelihood concerns of the poor -
economic, social, and environmental, short-term and long-term - need to be
recognised. Focusing simply on cash or jobs is inadequate.
4. Flexibility - The scale of development may need to be adapted. Appropriate
strategies and positive impacts will take time to develop.
5. Distribution - promoting Pro-poor Tourism requires some analysis of the
distribution of both benefits and costs - and how to influence it.
6. Learning - as much is untested, learning from experience is essential. Pro-poor
Tourism also needs to draw on lessons from poverty analysis, environmental
management, good governance and small enterprise development.
Pro-poor Tourism may be defined as tourism which benefits the poor more than the
rich and which places a greater welfare weight on the well-being of the poor than that of
the rich. Although there is much overlap between Pro-poor Tourism and alternative
concepts of tourism, there are some differences. An interesting question is how PPT
Sustainable Tourism
Community base-Tourism
Eco-Tourism
Pro-Poor
Sustainable Tourism
Community base-Tourism
Eco-Tourism
Pro-Poor
34
differs from other forms of ―alternative‖ tourism. The answer lies in the final stage of the
net benefit, as outlined below.
2.3 Sustainable Tourism: Definition and Concepts of Sustainable Tourism
The past three decades have shown the popularity of the concept of sustainable
development, partly due to the activities of environmental campaign organisations. The
idea of sustainable development was first highlighted by the International Union for the
Conservation of Nature and Natural Resources (IUCN, 1980) in its World Conservation
Strategy. This was followed by the World Commission on Environment and Development
Report in 1987, entitled ―Our Common Future‖ (WCED, 1987), which placed the concept
of sustainable development centre stage and promoted it as a vehicle for deliverance.
“Our Common Future” described sustainable development as “development that
meets the needs of the present without compromising the ability of future
generations to meet their own needs” (WCED, 1987). Sustainability as a concept
may be viewed from opposites: at one extreme is economic sustainability where
what is being sustained is the economy at whatever cost; diametrically opposed to
this is ecological sustainability, where the natural environment takes priority over
any economic development (Page et al, 2001).
Swarbrooke (1999) provides a useful definition of sustainable tourism:
“tourism which is economically viable but does not destroy the resources on which
the future of tourism will depend, notably the physical environment and the social
fabric of the host community”, observing the need to achieve a balance in the
tourists‟ use of tourist resources and environments they visit and consume.
According to the World Tourism Organization (2004),
“sustainable tourism development required the informed participation of all
relevant stakeholders, as well as strong political leadership to ensure wide
participation and consensus building. Achieving sustainable tourism is a
continuous process requiring constant monitoring of impacts, introducing the
necessary preventive and/or corrective measures as necessary. Sustainable
tourism should also maintain a high level of tourist satisfaction and ensure a
35
meaningful experience to the tourists, raising their awareness about sustainability
issues and promoting sustainable tourism practices.”
For Cater (1993),
“sustainable tourism can be defined as tourism meeting the needs of the host
population in terms of improved living standards (in both short and long terms), ...
satisfying the demands of a growing number of tourists and at the same time
safeguarding the natural environment.”
The opening editorial of the first edition of the Journal of Sustainable Tourism
defines sustainability as a positive approach intended to reduce the tensions and friction
created by complex interactions between the tourism industry, visitors, the environment
and communities.
Despite many positive initiatives for ecologically and socially tolerable forms of
tourism, the conflict between the development of global tourism and the central goals of
environmental policy, such as protecting climate, maintaining biological diversity and
protecting energy and water resources, will continue to increase. Only ‗sustainable‘
tourism is viable for the future (meaning) tourism that is ecologically, socially compatible,
culturally appropriate and yields economic benefits for the local population (Insula, 2004).
This is not very different from the view that something should be left for future
generations. As such, sustainable development builds on the old principle of conservation,
but it offers a more proactive stance, incorporating continued economic growth in a
manner that is at once more ecological and more equitable.
Sustainable tourism is also closely linked to responsible tourism. According to the
2002 Cape Town Declaration,
“responsible tourism is tourism which: minimises negative social, economic and
environmental impacts; generates greater economic benefits for local people and
enhances the well-being of host communities; improves working conditions and
access to the industry; involves local people in decisions that affect their lives and
36
life chances; makes positive contributions to the conservation of natural and
cultural heritage embracing diversity; provides more enjoyable experiences for
tourists through more meaningful connections with local people, and a greater
understanding of local cultural, social and environmental issues; provides access
for physically challenged people, and is culturally sensitive, encourages respect
between tourists and hosts, and builds local pride and confidence.”
Tourism in developing countries is driven by local communities, seen as being the
principle resource upon which tourism depends. Local support is indispensable in
developing a sustainable tourist product (Brohman, 1996). The role of the community is
thus a key component to ensuring the sustainability of tourism development (Campbell
1994, Masberg and Morales 1999, Ross and Wall 1999). Of great importance in
community-led sustainable development is good understanding among all the parties
concerned, not only in terms of the relationship between local communities and their
environment, but also an approach that acknowledges and addresses the political,
economic and cultural tensions within communities (Richards and Hall, 2000). One
meaningful way in which sustainable tourism may be evaluated is to examine how it can
meet the needs of the host population in terms of improved living standards both in the
short and long term.
Within this context, sustainable tourism can thus be seen as a general term implying
an element of community involvement in tourism and a concern with the poor. It relates
directly to the long-term aim of Pro-poor Tourism development and leads to the
incorporation of community development issues into the tourism industry. It is clear that
sustainable tourism does not imply a ‗no-growth‘ policy, but it does recognise that limits to
growth exist and that environments must be managed in a long-term way.
The empowerment of local communities is an important step in ensuring that these
communities maximise their benefits and have some control over tourism. To achieve
effective participation in tourism planning, the local community needs to be empowered to
decide what forms of tourism programmes they want to be developed in their respective
communities, and how the tourism costs and benefits are to be shared among different
stakeholders (Akama, 1996).
37
This is not so different from the idea put forward by Kamsma and Bras (2000), who
said that opportunities for local people will be enhanced if they can participate in tourism
as entrepreneurs and through involvement in the ownership and operation of facilities, not
only as employees in the hotel or restaurant sector.
Bramwell et al (1996) highlight four arguments for intra-generational equity in the
sustainability debate. First, it is the local community, especially disadvantaged social
groups, who bear the burden of negative costs. Second, poverty encourages unsustainable
practices, with people seeking quick returns to meet immediate needs. Third, high charges
to use some scarce resources tend to exclude poorer people. Finally, it is hard to justify
caring about fairness to future generations without extending this concern to people in
society today.
It can thus be seen that tourism projects require long-term oversight. Without
monitoring, it cannot be said whether tourism is becoming more sustainable or not.
Objective criteria are required against which progress can be checked (Dymond, 1997).
This is becoming an accepted part of sustainable development on an international scale.
As a result of the impact of tourism on humans and the environment, sustainable
tourism development is an issue for all levels of tourism to address – international,
national, regional, and local. The host community, region, or nation must define the
tourism philosophy and vision for the area as well as establishing social, physical, and
cultural carrying capacities in the area. Destinations are responsible for implementing the
community sustainable development plan in their management plans. The individual
tourism firm or operator must observe local regulations and contribute to improving
sustainable development based on experience with tourists. Residents of the host
community or region must encourage tourists to accept the parameters of the sustainable
development plan, and the tourists must understandsustainable development and accept its
terms (Nickerson, 1996).
The issue of tourism and sustainability has always been questioned, where on the
one hand poverty and social desperation necessitate a greater imperative for the local
community to benefit from tourism development, while on the other hand the inability of
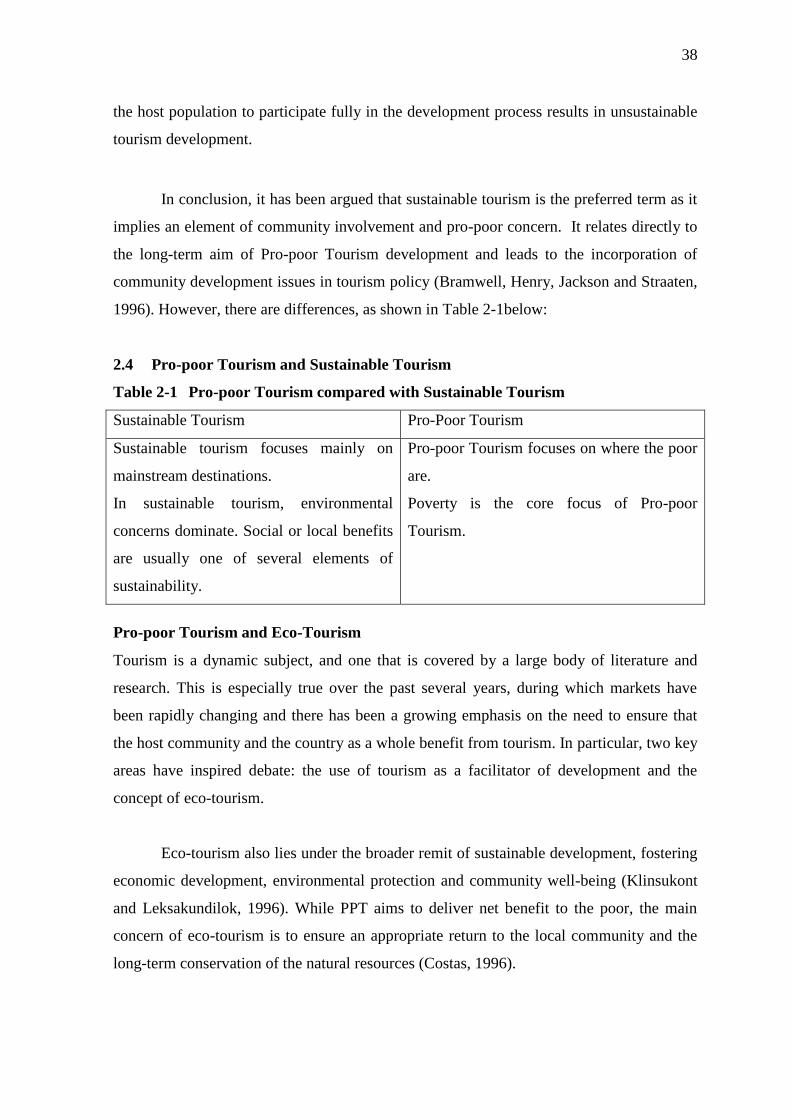
38
the host population to participate fully in the development process results in unsustainable
tourism development.
In conclusion, it has been argued that sustainable tourism is the preferred term as it
implies an element of community involvement and pro-poor concern. It relates directly to
the long-term aim of Pro-poor Tourism development and leads to the incorporation of
community development issues in tourism policy (Bramwell, Henry, Jackson and Straaten,
1996). However, there are differences, as shown in Table 2-1below:
2.4 Pro-poor Tourism and Sustainable Tourism
Table 2-1 Pro-poor Tourism compared with Sustainable Tourism
Sustainable Tourism Pro-Poor Tourism
Sustainable tourism focuses mainly on
mainstream destinations.
In sustainable tourism, environmental
concerns dominate. Social or local benefits
are usually one of several elements of
sustainability.
Pro-poor Tourism focuses on where the poor
are.
Poverty is the core focus of Pro-poor
Tourism.
Pro-poor Tourism and Eco-Tourism
Tourism is a dynamic subject, and one that is covered by a large body of literature and
research. This is especially true over the past several years, during which markets have
been rapidly changing and there has been a growing emphasis on the need to ensure that
the host community and the country as a whole benefit from tourism. In particular, two key
areas have inspired debate: the use of tourism as a facilitator of development and the
concept of eco-tourism.
Eco-tourism also lies under the broader remit of sustainable development, fostering
economic development, environmental protection and community well-being (Klinsukont
and Leksakundilok, 1996). While PPT aims to deliver net benefit to the poor, the main
concern of eco-tourism is to ensure an appropriate return to the local community and the
long-term conservation of the natural resources (Costas, 1996).
39
It thus involves education and the interpretation of the natural environment and is
managed in such a way as to be ecologically sustainable, rather than focusing on growth-
oriented prospects.
The concepts of eco-tourism, nature tourism and the like are difficult to define and
ambiguous in their meaning. They are not mutually exclusive terms and different theorists
have different ideas about what each one constitutes; ‗eco-tourism‘ has been used by many
tourism companies to encourage people who desire tourism with a ‗clean conscience.‘ One
definition that has been suggested is as follows; ‗responsible travel to natural areas that
conserves the environment and sustains the well-being of local people‘ (Blangy and Wood,
1993). This inclusiveness of the well-being of the local community is one aspect that is not
always used in definitions of the term. Some argue that eco-tourism should be nature based
and focus predominantly on the natural environment (Wilson and Garrod, 2003). Lindberg,
Enriquez and Sproule (1996) also suggest that ‗tourism should satisfy conservation and
development objectives in order to be considered eco-tourism‘. There are many conflicting
terms, which led to the discussion of the subject at the World Ecotourism Summit when it
was decided that: ‗…ecotourism embraces the principles of sustainable tourism,
concerning the economic, social and environmental impacts of tourism‘ (cited in Cater,
2004, p.485). This shows that those involved in tourism are realising that there is a need to
balance the requirements of the environment and the people of the host communities.
Ceballos-Lascurain in 1993, whose statement eventually became the official
definition adopted by the IUCN in 1996,
“ecotourism is a form of sustainable tourism—all forms of tourism can become
more sustainable but not all forms of tourism can be ecotourism. Ecotourism is
environmentally responsible travel and visitation to relatively undisturbed natural
areas, in order to enjoy, study and appreciate nature (and any accompanying
cultural features—both past and present), that promotes conservation, has low
visitor impact, and provides for beneficially active socio-economic involvement of
local populations.”
40
Tourism, particularly ‗eco-tourism‘ or ‗nature tourism‘, is a continually growing
sector and plays a vital role in the economies of many countries, especially less
economically developed ones which can become heavily reliant on the tourism trade
(Hammond, 2004). Barkin (1996) highlights the importance of ‗green‘ productive projects
to give communities the chance to generate goods and services that will enhance their
standard of living. This need to help and ensure the well-being of the host community is
often labelled ‗Pro-poor Tourism‘ and is an area which is receiving increasing attention.
Cater (1994) stipulates the need to replace traditional livelihoods that are removed
with alternative income strategies. However, some effective strategy must be put in motion
as ‗…[indigenous populations] will encourage eco-tourism and will be more likely to
participate in conservation programmes if they can benefit from such activities and are
included in the management process‘ (Wearing, 2001).
Many countries now recognise the potential for tourism to increase the standard of
living for their people and are making efforts to reduce the economic leakages that many
large-scale multi-national corporations facilitate. Organisations such as Tourism Concern
increase the awareness of the business sector and the consumer of the need for more pro-
poor strategies. Eco-tourism, sustainability and debates concerning poor people‘s benefit
are issues that governments and the private sector mustconsider as they come under
pressure from civil society groups, non-governmental organizations (NGOs) and,
increasingly, the consumer, to ensure that their practices are ethically and morally sound.
The idea that any development must be linked to conservation of local resources
brings up the idea of corporate responsibility in the tourism industry, something that is
constantly being grappled with, particularly with the rise of theories like Pro-poor Tourism
(Briedenham, 2004). The pro-poor concept, while linked with other eco-tourism
perspectives, focuses more on increasing opportunities for poor communities to help
themselves, and actively participate in the development of their own welfare (Binns,
Elliott, Potter and Smith, 2004).
Participation of local communities in eco-tourism and its management is however,
something that must be fulfilled (Mowforth and Munt, 2003; Ashley, 2000; Campbell,
1999)
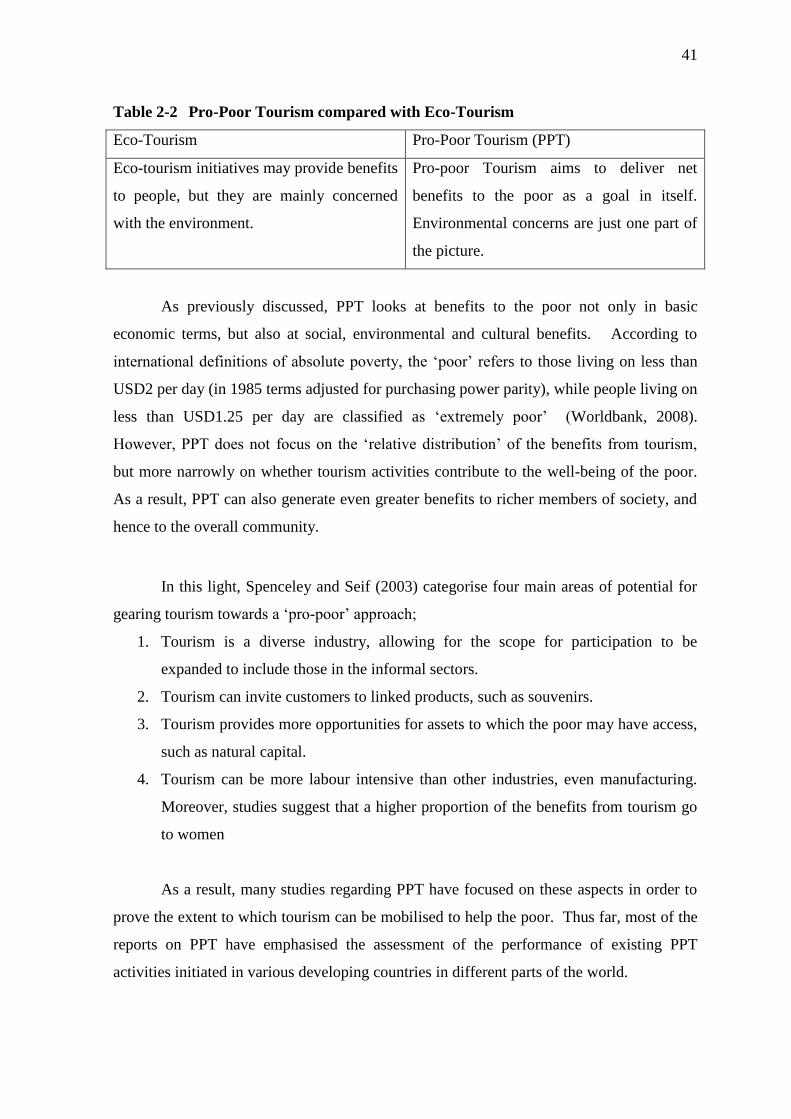
41
Table 2-2 Pro-Poor Tourism compared with Eco-Tourism
Eco-Tourism Pro-Poor Tourism (PPT)
Eco-tourism initiatives may provide benefits
to people, but they are mainly concerned
with the environment.
Pro-poor Tourism aims to deliver net
benefits to the poor as a goal in itself.
Environmental concerns are just one part of
the picture.
As previously discussed, PPT looks at benefits to the poor not only in basic
economic terms, but also at social, environmental and cultural benefits. According to
international definitions of absolute poverty, the ‗poor‘ refers to those living on less than
USD2 per day (in 1985 terms adjusted for purchasing power parity), while people living on
less than USD1.25 per day are classified as ‗extremely poor‘ (Worldbank, 2008).
However, PPT does not focus on the ‗relative distribution‘ of the benefits from tourism,
but more narrowly on whether tourism activities contribute to the well-being of the poor.
As a result, PPT can also generate even greater benefits to richer members of society, and
hence to the overall community.
In this light, Spenceley and Seif (2003) categorise four main areas of potential for
gearing tourism towards a ‗pro-poor‘ approach;
1. Tourism is a diverse industry, allowing for the scope for participation to be
expanded to include those in the informal sectors.
2. Tourism can invite customers to linked products, such as souvenirs.
3. Tourism provides more opportunities for assets to which the poor may have access,
such as natural capital.
4. Tourism can be more labour intensive than other industries, even manufacturing.
Moreover, studies suggest that a higher proportion of the benefits from tourism go
to women
As a result, many studies regarding PPT have focused on these aspects in order to
prove the extent to which tourism can be mobilised to help the poor. Thus far, most of the
reports on PPT have emphasised the assessment of the performance of existing PPT
activities initiated in various developing countries in different parts of the world.
42
However, most reports have discussed only the general impact of tourism on
social, cultural, economic or environmental concerns, rather than assessing systematically
the ability of tourism to foster and improve the development of the poor.
During 2000-2001, a need was perceived for work that could move the discussion on
PPT down to the level of practice and effective policy implementation, as well as research
on specific initiatives being implemented by different actors, such as government and
NGOs, and the impacts that these initiatives were having on various poor groups
(Cattarinich, 2001). In the UK, a DFID project in 2000, examining six case studies of PPT
initiatives, provided a good opportunity to review experiences of PPT strategies. The study
hoped to identify the lessons learned from PPT strategies, look at what was being done,
examine what progress and constraints had emerged, and see what impacts there had been
on the poor (Ashey, 2002). Looking at all six case studies, Ashley, Roe and Goodwin
(2001) concluded that the initiatives differed enormously in both type and scale. At a local
level, PPT can play a mostsignificant role in livelihood security and poverty reduction.
However, a wide range of other impacts on livelihood cannot be quantified.
2.5 Pro-poor Tourism Strategies
Strategies for PPT can be categorised in accordance with the local benefit generated, and
be divided into three types (Ashley, Roe and Goodwin, 2001):
1. Strategies focused on economic benefits through the expansion of employment and
local wages, and the expansion of business opportunities for the poor in terms of their
access to opportunities for input into tourism operations or the final products that can
be sold to tourists. This includes the development of collective community income,
which could range from small earnings to collective income that can benefit the
majority. However, this income is liable to be misused, and in order to ensure that the
poor can reap the full benefit it is important to design tourism strategies in such a way
that they can effectively tackle obstacles to economic participation, including lack of
skills, low understanding of tourism, poor product quality and limited market access.
43
2. Strategies to enhance livelihood benefits, which generally focus on capacity building,
training and empowerment, as well as the mitigation of the environmental impact of
tourism on the poor and the management of competing demands for access to natural
resources between tourism and local people. Such measures include improved access
to services and infrastructure such as health care, water supplies and transportation.
Literature suggests that such strategies include the mitigation of negative effects, such
as cultural intrusion, and that consultation with the poor can also help ensure positive
benefits directly to the community.
3. Strategies focused on policy, process, and participation to create supportive policies
and planning frameworks that enable the poor to participate in decision-making as well
as partnerships with the private sector. Strategies may include ones laying the
foundations for further discussion, such as facilitating information flows and
communication.
Cattarinich (2001) also documents PPT strategies and initiatives, including
economic, cultural, environmental, policy, and other initiatives that developing countries
have implemented. The review suggests that the sophisticated nature of the tourism sector
could prevent it from acting as a catalyst to shape pro-poor growth, and that in order to
maximise its potential other surrounding supporting policies should be re-evaluated.
Moreover, Cattarinich also argues for the adoption of certain roles by different
stakeholders as a way of ensuring that tourism becomes more ‗pro-poor‘. In this regard,
tourism stakeholders can be categorised as follows:
Private sector companies– with consumers, private sector companies are the
driving force of the tourism industry. While most are profit motivated, in some
cases they operate on a non-profit basis, such as Porini Ecotourism in Kenya.
Government- national governments frequently promote tourism as part of a macro-
economic growth strategy, while local governments focus more on micro-economic
aspects.
44
International donors4- including institutions and foreign aid agencies based in
industrialised countries. Despite their diverse objectives, they tend to provide
financial or other forms of support to tourism development without direct profit
incentives. Tourism is seldom invoked by donors as a distinct strategy for poverty
reduction, although many are now reconsidering their positions on tourism support
(Deloitte & Touche, IIED and ODI, 1999).
Local, national and international NGOs– formally recognised organisations, they
are in theory independent of both states and the private sector and tend to operate
on a non-profit basis (Cattarinich, 2001). Virtually every area of social concern is
represented by a group of NGOs, and several NGOs use tourism primarily as a
strategy for environmental/wildlife and/or cultural conservation, and/or poverty
alleviation.
Community groups– otherwise known as community-based organisations (CBOs),
community groups are formal or informal associations of residents from a
particular locale (e.g. one or more villages and possibly nearby areas). All residents
of a village may join in a tourism venture, or involvement in tourism may be
limited to only a few residents.
Tourists or travellers– these are the consumers of tourism products, whose desires
determine demand in the industry.
Looking at the co-operation of various stakeholders, Rogerson (2002) has stressed
the importance of Local Economic Development (LED) on poverty reduction, noting that
very few government-linked tourism plans are directly related to poverty reduction and that
government intervention as part of appropriate policy frameworks is thus necessary to
support the poor. He suggests that whilst tourism in itself is insufficient as a poverty
reduction strategy, it could potentially play a significant role in a broader strategy for pro-
poor economic growth.
4 Good examples are the World Bank, United Nations and the Asian Development Bank.
45
2.6 Literature review on Pro-Poor Tourism: International Case study
There are a number of critical issues on PPT strategies that can be identified from the
existing literature, namely:
1. Market access of the poor
The overall success of a PPT project depends on the access of the poor to the tourism
market, both in terms of their ability to break into the market, and in terms of the physical
distance between poor people and outlets of products or the location of PPT projects. The
existing market participants or elites, as well as existing products, could threaten the ability
of the poor to penetrate the market with PPT products. Intervention from the authorities,
marketing links, intensive communication and realistic expectations are thus imperatives if
a PTT project is to succeed.
Geographical distance can equally be a barrier for the poor to access potential
income opportunities. Renard has shown how in St. Lucia, the problem lies in the limited
time the cruise ship tourists have to visit the inland communities, which in turn leaves them
little time to spend their money on products and souvenirs (Renard, 2000). Similarly,
Saville has shown that in Humia, Nepal, rural people derive little benefit from tourism
because communities along the trekking route are far from the airport town where
arrangements for services and supplies are organised (Saville, 2001). This implies that
measures to disperse tourists to poorer areas are also important in increasing market access
and enhancing tourism as a pro-poor growth driver.
2. Marketing
The success of a PPT project should not simply be measured in terms of the attraction of
increasing numbers of tourists, but also in the establishment of a secure and appropriate
market for the poor. This commercial sustainability requirement includes the
attractiveness and quality of the products as well as good marketing schemes, of critical
importance if a PPT project has to compete within the crowded market for tourist products.
This could be accomplished by establishing effective links with the private sector and
seeking their involvement on product development (Renard, 2001; Poultney and
Spenceley, 2001; Spenceley and Seif, 2003), securing the support of a National Tourism
Board (Savillle, 2000 and Williams, White and Spenveley, 2001), improving marketing
46
skills (Nicanor, 2001) and matching products to the right markets (Poultney and Spenceley,
2001). Small enterprises, particularly in the informal sector, often provide the greatest
opportunities for the poor (Braman, 2001). The attractiveness and quality of the products
themselves is also of critical importance (Mahony and Van Zyl, 2001). Equally important
is product differentiation, which, through the creation of unique selling propositions
(USPs), strengthens the impact of the PPT project by ensuring a competitive advantage.
Goodwin, 2008; Goodwin & Row, 2006 have made the same point, the importance of
the market and commercial viability from the outset.
3. Training
Human resources are the life-blood of the tourism industry, and thus training, education
and capacity building are very high on the agenda of tourism businesses. The tourism
industry has been criticised for only offering menial jobs to local people while importing
expatriates to work at management level and thus contributing to leakages (Meyer, 2006).
At the same time, the poor often lack an understanding of the interests of the tourists. It is
thus vital that PPT projects focus on appropriate training for the poor, in order to increase
their awareness and understanding of tourists as well as the tourism products in which they
are interested (Saville, 2001). Policy support from the government, therefore, is crucial
(Poultney and Spenceley, 2001 and Braman, 2001). Kareithi (2003) for example, looks at
the Shanzu Traditional Workshop in Kenyain terms of its PPT development program, in
which disabled women learn production skills and gain business experience. The
workshop is open to visitors to show them how the women live and work, and there is a
shop selling their products. On some occasions it may also be necessary to draw on private
sector expertise for training and product development, in order to overcome competition
within the tourism industry and to meet with requirements for high product quality.
4. Strong community-based organisation
A main obstacle to the success of programme implementation has been the weakness of
local and community-based organisations (Renard, 2001). PPT is most effective when
different stakeholders work together (Spenceley and Seif, 2003).This calls for involving an
explicit community association, and investment in communication. Likewise, capacity
building to narrow the skills and capacity gap is essential for effective collaboration.
Addressing both issues will also help alleviate expectation mismatches among
stakeholders, and thus help minimise the potential for an initiative to fail.
47
It is therefore important to communicate and deliver short-term benefits while developing
long-term schemes such as capacity building (Spenceley and Seif, 2003).
5. Environmental impact of tourism on the poor
Existing literature tends to place little focus on the issue of environmental action.
However, Braman (2001) suggests that PPT is intimately related to environmental
sustainability, while Saville (2001) argues that PPT is also integrated within broader rural
development work, including activities surrounding natural resource management. It is
notable that the most commonly cited negative impact of tourism relates to the degradation
of natural resources used by the poor. It is also crucial that the environmental focus of
sustainable tourism is balanced against attention to socioeconomic issues. In order to do
this, authorities and other stakeholders need to develop the implementation and monitoring
tools that currently exist for ‗green‘ improvements. In tackling the issues of water, waste
and energy, the aim should not be simply to maximise efficiency and conservation per se,
but also to reduce consumption practices that particularly affect poor resource users
(Ashley, Roe and Goodwin, 2002). Although PPT was explicitly differentiated from green tourism,
nature-based, little PPT research focused on traditional CBT, capacity building and ecotourism
initiatives (Goodwin,2009)
6. Addressing the social and cultural impact of tourism
There is some concern that tourism development may lead to destinations losing their
cultural identity by catering for the perceived needs of tourists, particularly those from
international markets. The typical behaviour of tourists, whether taking photographs or
enacting ‗Western‘ habits, is often regarded as cultural intrusion, while sex tourism
exploits women. The existing literature on the anthropology of tourism illustrated that
tourism could change the cultures of both the tourist hosts and guests (Selwyn, 1996)
Smith(1996) described tourism‘s impact on tourists and hosts with the 4Hs concepts.
1.Habitat, a geographical form to access climate, landforms and space that people have to
live with and where they will establish the activity that will engage them, 2. Heritage of the
population as it will affect the value system, worldview and activity, 3.History, a
transitioning concept of events which alter heritage view, perception and fundamental
lifestyle, and 4.Handicraft, a way to identify values that the hosts like and want to preserve,
including music and dancing.Nonetheless, PPT appears to be welcomed by local residents,
48
probably in part a reflection of the degree of control that local residents have, which is not
common to all tourism. Braman has shown, for instance, that in Amazonian communities
efforts to keep visitor numbers very low to minimise cultural intrusion have conflicted with
local people's desire to increase revenues (Braman, 2001). However, research shows that
most tourists want to experience the personality and true character, communities and
attractions of the localities they visit. They expect to see and do very different things than
those they would experience at home, and this includes experiencing the real life and
lifestyle of the destinations they visit.
On the other hand, research has also highlighted a gradual change on the part of local
residents as funds and external cultures intrude. This, therefore, requires a delicate
balancing act between the necessities for locals to maintain their root identity while at the
same time retaining their competitive edge in the tourism market.
7. Supportive policy and planning framework
Other than the major policies and measures in driving tourism towards pro-poor
approaches, the literature on PPT has proposed the following necessary policies and
supporting framework:
• Lobbying government for supportive policies and legislation (Renard, 2001;
Nicanor, 2001; Williams, White, and Spenceley, 2001)
• Lobbying the provincial conservation authority to invest in destination marketing
and infrastructure development and to lift restrictions on development (Poultney
and Spenceley, 2001)
• Promoting inter-departmental initiatives and coordination (Mahony and Van Zyl,
2001; Renard, 2001)
• Linking the National Tourism Board with sustainable tourism networks and other
tourism for poverty alleviation programs (Saville, 2001; Williams, White, and
Spenceley, 2001)
• Using government power to allocate concessions to influence investors (Mahony
and Van Zyl, 2001)
49
8. Promoting participation
Most of the literature highlights local involvement in both employment and the decision
making of the poor, particularly at the level of local government. While the principle issue
as far as employment is concerned has been the leakage of jobs to the white collar sector
(or leakage to external personnel), the participation of the poor in planning is also an
important concern. The poor are often excluded from decision-making processes and
institutions, making it very unlikely that their priorities will be reflected in the decisions
made.
There seem to be three distinct ways to enhance the participation of the poor in
decision making. First, by facilitating participatory planning processes at the local level
(Saville, 2001;Williams, White, and Spenceley, 2001; Renard, 2001), second, by
increasing communication with government and enhancing the voice of poor tourism
producers at the policy level though their own organizations (Nicanor, 2001; Saville,
2001;Williams,White, and Spenceley, 2001), and third, by giving the poor a legal stake in
investments, so that they can participate as stakeholders rather than as passive recipients.
However, where the community is large, it is difficult to see how participation in decision-
making is very meaningful.
9. Bringing the private sector into pro-poor partnerships
Tourism involved the interaction of other components such as communication
transportation, destination and accommodation among others. Sectors cannot be handled
alone by the government as pillars of tourism development. Therefore, the private sector
must be involved in the development and promotion of tourism in any country that intends
to make tourism the main economy earning (Judith, 2011)
There are varying ways and degrees to which the private sector becomes involved
in PPT. On the plus side, private sector involvement can (1) enhance the brand and ensure
higher exposure, (2) facilitate the diversification of products for the guests or tourists, (3)
be cost-saving by enhancing bargaining power, and (4) give better access to financing.
The major cost is that the partnership could obstruct the self-sustaining concept for the
poor and may divert income away from the poor and into private sector businesses.
50
In this regard, a trade-off is unavoidable. Overall, the literature suggests that the
long-term gain could be considerable, but that challenges for implementation remain.
Success is therefore dependent on whether the private sector is willing to invest in the
pursuance of long-term benefits (Ashley and Mitchell, 2005).
Some form of private sector involvement seems to be essential, particularly if
marketing is to be effective. Four of the case studies under review include direct efforts to
develop partnerships between the private sector and communities (Poultney and Spenceley
2001; Braman, 2001; Nicanor, 2001; Mahony and VanZyl, 2001). White and Spenceley
(2001) suggest lobbying for linkages with the private sector, while Nicanor (2001) and
Braman (2001) both recommend close arrangements between a community and a tour
operator. Later, the Pro-Poor Tourism Partnership reasserted that PPT cannot succeed
without successful development of tourism destinations and hence it is very importance to
measuring impacts and ensuring commercial viability and inclusion of the private sector
(Ashley, Roe, & Goodwin, 2001, p. 42 Ashley & Roe, 2003). Bath and Goodwin, 2003
demonstrate a successful result of bringing the private sector to PPT in Gambia, South
Africa(Ashley, Poultney, & Hayson, 2005) and Tanzania(Goodwin, 2007) Each initiative
demonstrated that close engagement with the private sector ensured that the ventures could
have significant impact on the livelihoods of the poor.
Since the DFID policy paper launched its inception of PPT and a strong market-
oriented approach to tourism to unlock opportunity for the poor in 1999, it was explicitly
asserted that PPT strategies must be integrated with general tourism development to enable
the poor to benefit from economic opportunities. (DFID, 1999)
PPT was often spoken of as though it were a product. It has also been confused
with ‗poorism‘ (Baran, 2008). UNWTO research tried focusing on other mechanisms, i.e
employment, sale of goods, services to tourism businesses, taxes and levies, philanthropy
and infrastructure gains as well as tourism enterprise development by the poor rather than
measuring impacts on poverty(UNWTO, 2004). Harrison (2008, p. 851) argued that PPT
should ‗focus more on researching the actual and potential role of mass tourism in
alleviating poverty and bringing ‗development‘.
51
Success in PPT requires engaging with the mainstream industry and working with
them to maximise their positive economic impacts on local economic developmentand
poverty reduction. In the future, there should be more research to achieve sustainable long-
term poverty reduction linkages with mainstream industry (Goodwin, 2009).
These issues in international PPT have been assessed rigorously and should provide
useful guidelines for future research, at the same time as facilitating the design of policies
to better benefit the poor. The next chapter will continue to discuss PTT strategies, but
will emphasise the impact on the livelihood of the poor through the use of a comprehensive
framework. This study should in turn act as a building block towards the development of
an answer to the question of how PPT could impact the livelihood of the poor in Thailand.
2.7 Pro-poor Tourism in the Greater Mekong Sub-region (GMS)
The Greater Mekong Sub-region (GMS) consists of portions of five countries in mainland
Southeast Asia and adjacent China: Cambodia, Lao PDR, Myanmar, Thailand, Vietnam
and China‘s Yunnanprovince. The GMS is not a geological region, but a development
initiative proposed by the Asian Development Bank in 1992, and specifically excludes the
region of Chinese Tibet from which the MekongRiver emanates. Previous region-wide
concern with the MekongRiver focused on flood control.
Tourists from around the world are increasingly drawn to the ‗exoticism‘ of the
diverse ethnic minorities in the region, which appeal to the imaginations of mainly western
travellers. National governments, development donor agencies and numerous international
organisations are paying close attention to the official reduction of poverty in the Mekong
region and are considering tourism development to benefit the poor (who form the majority
of local residents), astourism and tourism products are sources of employment and
comprise an increasing share of GDP in the riparian countries.
Pro-poor Tourism seeks to redefine the relationship between tourists, tourism-
sector businesses and the local communities which are the primary focus of this new sector
of tourism. Pro-poor Tourism comprises tourism-related activities which bring about net
benefits for the poor, increasing their overall quality of life and sense of well-being in
diverse ways, including economic, social, environmental and cultural benefits.
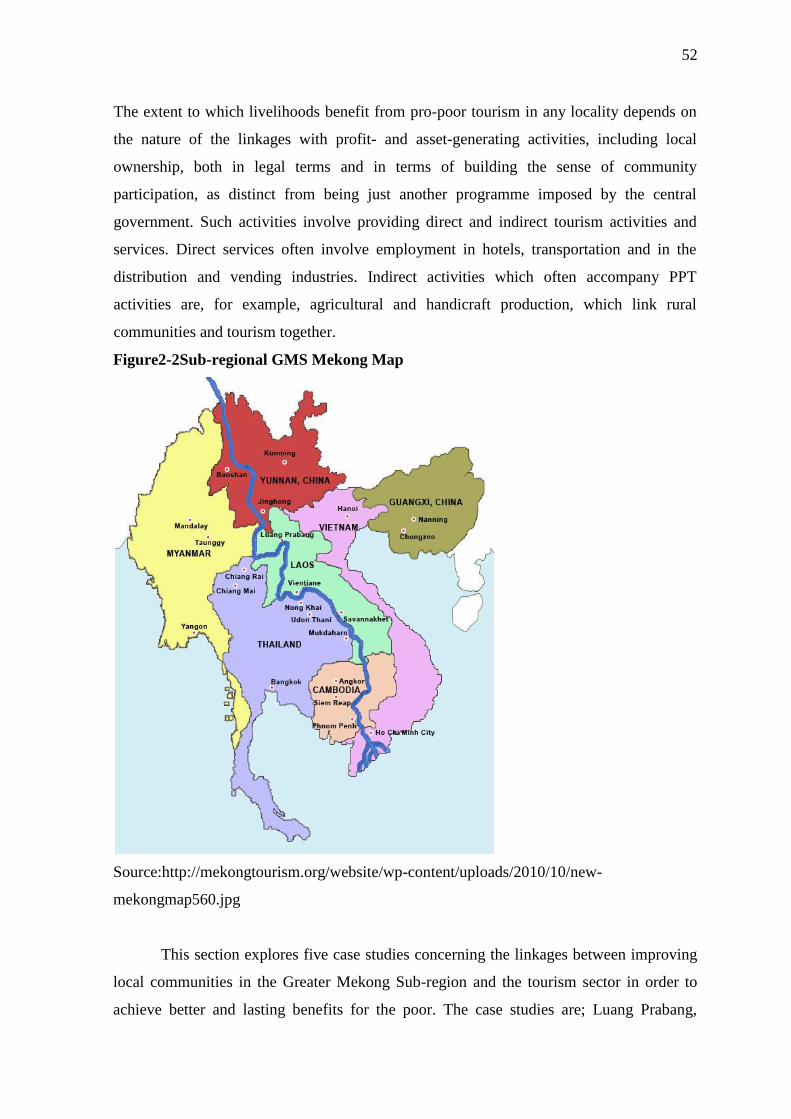
52
The extent to which livelihoods benefit from pro-poor tourism in any locality depends on
the nature of the linkages with profit- and asset-generating activities, including local
ownership, both in legal terms and in terms of building the sense of community
participation, as distinct from being just another programme imposed by the central
government. Such activities involve providing direct and indirect tourism activities and
services. Direct services often involve employment in hotels, transportation and in the
distribution and vending industries. Indirect activities which often accompany PPT
activities are, for example, agricultural and handicraft production, which link rural
communities and tourism together.
Figure2-2Sub-regional GMS Mekong Map
Source:http://mekongtourism.org/website/wp-content/uploads/2010/10/new-
mekongmap560.jpg
This section explores five case studies concerning the linkages between improving
local communities in the Greater Mekong Sub-region and the tourism sector in order to
achieve better and lasting benefits for the poor. The case studies are; Luang Prabang,
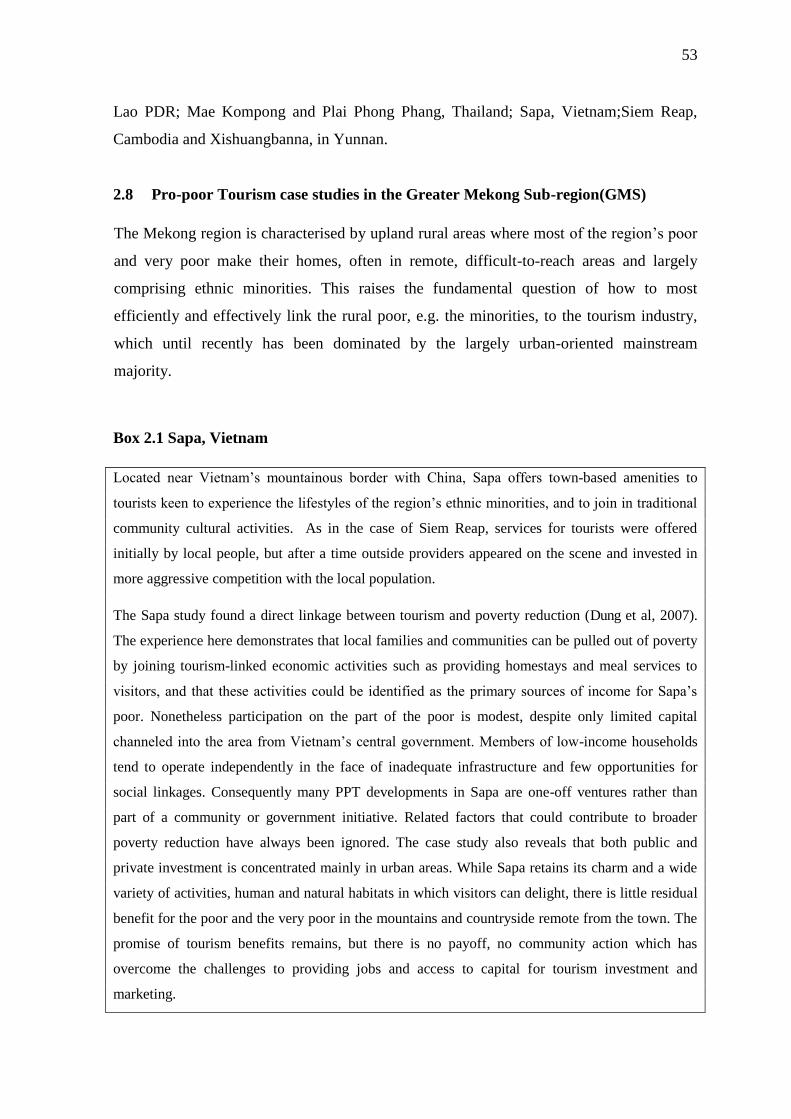
53
Lao PDR; Mae Kompong and Plai Phong Phang, Thailand; Sapa, Vietnam;Siem Reap,
Cambodia and Xishuangbanna, in Yunnan.
2.8 Pro-poor Tourism case studies in the Greater Mekong Sub-region(GMS)
The Mekong region is characterised by upland rural areas where most of the region‘s poor
and very poor make their homes, often in remote, difficult-to-reach areas and largely
comprising ethnic minorities. This raises the fundamental question of how to most
efficiently and effectively link the rural poor, e.g. the minorities, to the tourism industry,
which until recently has been dominated by the largely urban-oriented mainstream
majority.
Box 2.1 Sapa, Vietnam
Located near Vietnam‘s mountainous border with China, Sapa offers town-based amenities to
tourists keen to experience the lifestyles of the region‘s ethnic minorities, and to join in traditional
community cultural activities. As in the case of Siem Reap, services for tourists were offered
initially by local people, but after a time outside providers appeared on the scene and invested in
more aggressive competition with the local population.
The Sapa study found a direct linkage between tourism and poverty reduction (Dung et al, 2007).
The experience here demonstrates that local families and communities can be pulled out of poverty
by joining tourism-linked economic activities such as providing homestays and meal services to
visitors, and that these activities could be identified as the primary sources of income for Sapa‘s
poor. Nonetheless participation on the part of the poor is modest, despite only limited capital
channeled into the area from Vietnam‘s central government. Members of low-income households
tend to operate independently in the face of inadequate infrastructure and few opportunities for
social linkages. Consequently many PPT developments in Sapa are one-off ventures rather than
part of a community or government initiative. Related factors that could contribute to broader
poverty reduction have always been ignored. The case study also reveals that both public and
private investment is concentrated mainly in urban areas. While Sapa retains its charm and a wide
variety of activities, human and natural habitats in which visitors can delight, there is little residual
benefit for the poor and the very poor in the mountains and countryside remote from the town. The
promise of tourism benefits remains, but there is no payoff, no community action which has
overcome the challenges to providing jobs and access to capital for tourism investment and
marketing.
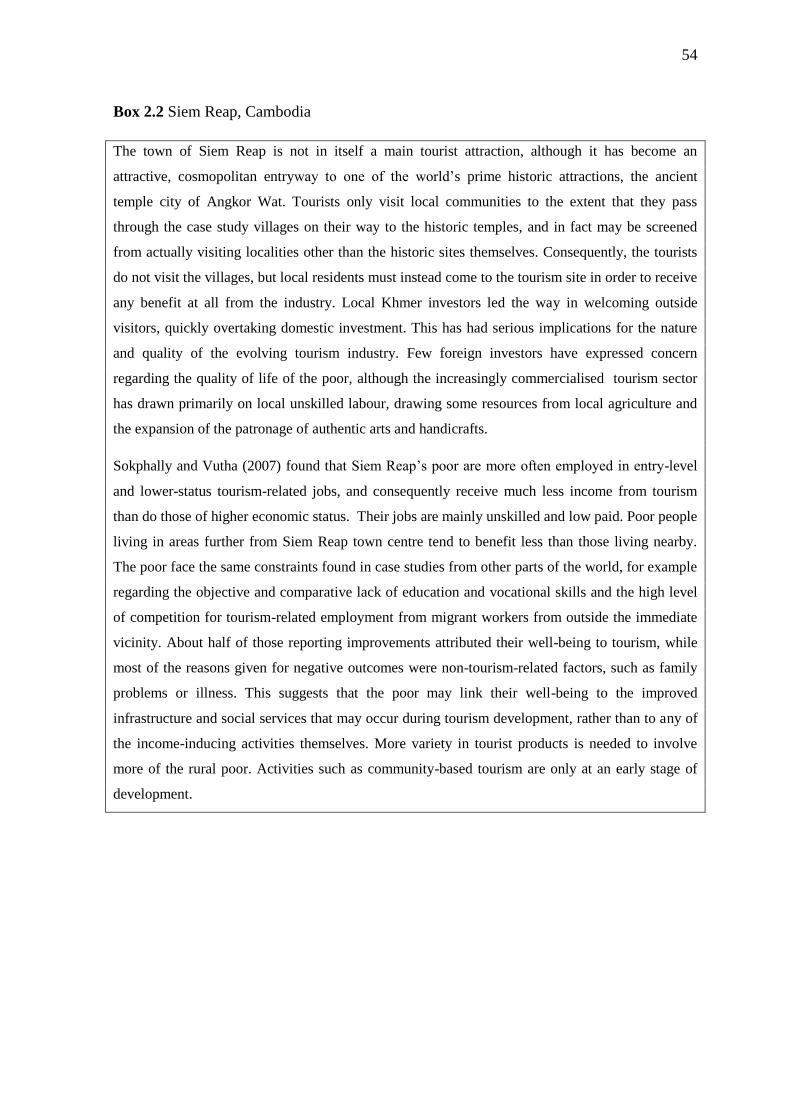
54
Box 2.2 Siem Reap, Cambodia
The town of Siem Reap is not in itself a main tourist attraction, although it has become an
attractive, cosmopolitan entryway to one of the world‘s prime historic attractions, the ancient
temple city of Angkor Wat. Tourists only visit local communities to the extent that they pass
through the case study villages on their way to the historic temples, and in fact may be screened
from actually visiting localities other than the historic sites themselves. Consequently, the tourists
do not visit the villages, but local residents must instead come to the tourism site in order to receive
any benefit at all from the industry. Local Khmer investors led the way in welcoming outside
visitors, quickly overtaking domestic investment. This has had serious implications for the nature
and quality of the evolving tourism industry. Few foreign investors have expressed concern
regarding the quality of life of the poor, although the increasingly commercialised tourism sector
has drawn primarily on local unskilled labour, drawing some resources from local agriculture and
the expansion of the patronage of authentic arts and handicrafts.
Sokphally and Vutha (2007) found that Siem Reap‘s poor are more often employed in entry-level
and lower-status tourism-related jobs, and consequently receive much less income from tourism
than do those of higher economic status. Their jobs are mainly unskilled and low paid. Poor people
living in areas further from Siem Reap town centre tend to benefit less than those living nearby.
The poor face the same constraints found in case studies from other parts of the world, for example
regarding the objective and comparative lack of education and vocational skills and the high level
of competition for tourism-related employment from migrant workers from outside the immediate
vicinity. About half of those reporting improvements attributed their well-being to tourism, while
most of the reasons given for negative outcomes were non-tourism-related factors, such as family
problems or illness. This suggests that the poor may link their well-being to the improved
infrastructure and social services that may occur during tourism development, rather than to any of
the income-inducing activities themselves. More variety in tourist products is needed to involve
more of the rural poor. Activities such as community-based tourism are only at an early stage of
development.
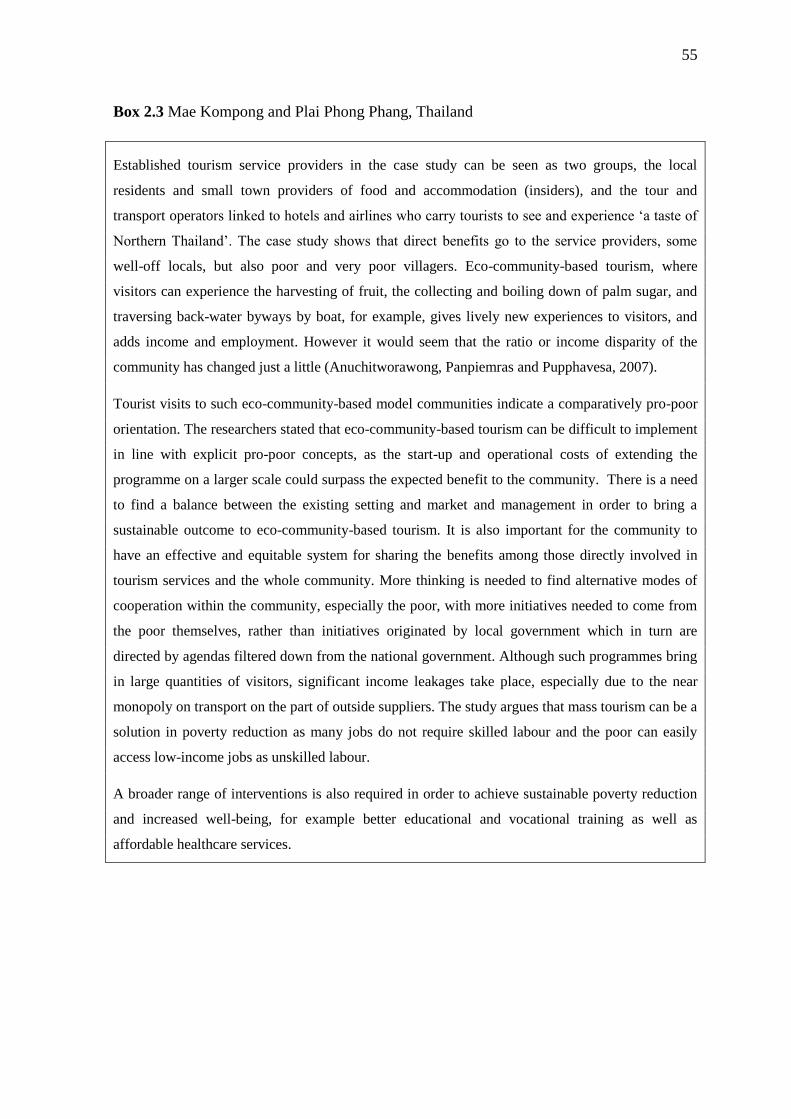
55
Box 2.3 Mae Kompong and Plai Phong Phang, Thailand
Established tourism service providers in the case study can be seen as two groups, the local
residents and small town providers of food and accommodation (insiders), and the tour and
transport operators linked to hotels and airlines who carry tourists to see and experience ‗a taste of
Northern Thailand‘. The case study shows that direct benefits go to the service providers, some
well-off locals, but also poor and very poor villagers. Eco-community-based tourism, where
visitors can experience the harvesting of fruit, the collecting and boiling down of palm sugar, and
traversing back-water byways by boat, for example, gives lively new experiences to visitors, and
adds income and employment. However it would seem that the ratio or income disparity of the
community has changed just a little (Anuchitworawong, Panpiemras and Pupphavesa, 2007).
Tourist visits to such eco-community-based model communities indicate a comparatively pro-poor
orientation. The researchers stated that eco-community-based tourism can be difficult to implement
in line with explicit pro-poor concepts, as the start-up and operational costs of extending the
programme on a larger scale could surpass the expected benefit to the community. There is a need
to find a balance between the existing setting and market and management in order to bring a
sustainable outcome to eco-community-based tourism. It is also important for the community to
have an effective and equitable system for sharing the benefits among those directly involved in
tourism services and the whole community. More thinking is needed to find alternative modes of
cooperation within the community, especially the poor, with more initiatives needed to come from
the poor themselves, rather than initiatives originated by local government which in turn are
directed by agendas filtered down from the national government. Although such programmes bring
in large quantities of visitors, significant income leakages take place, especially due to the near
monopoly on transport on the part of outside suppliers. The study argues that mass tourism can be a
solution in poverty reduction as many jobs do not require skilled labour and the poor can easily
access low-income jobs as unskilled labour.
A broader range of interventions is also required in order to achieve sustainable poverty reduction
and increased well-being, for example better educational and vocational training as well as
affordable healthcare services.
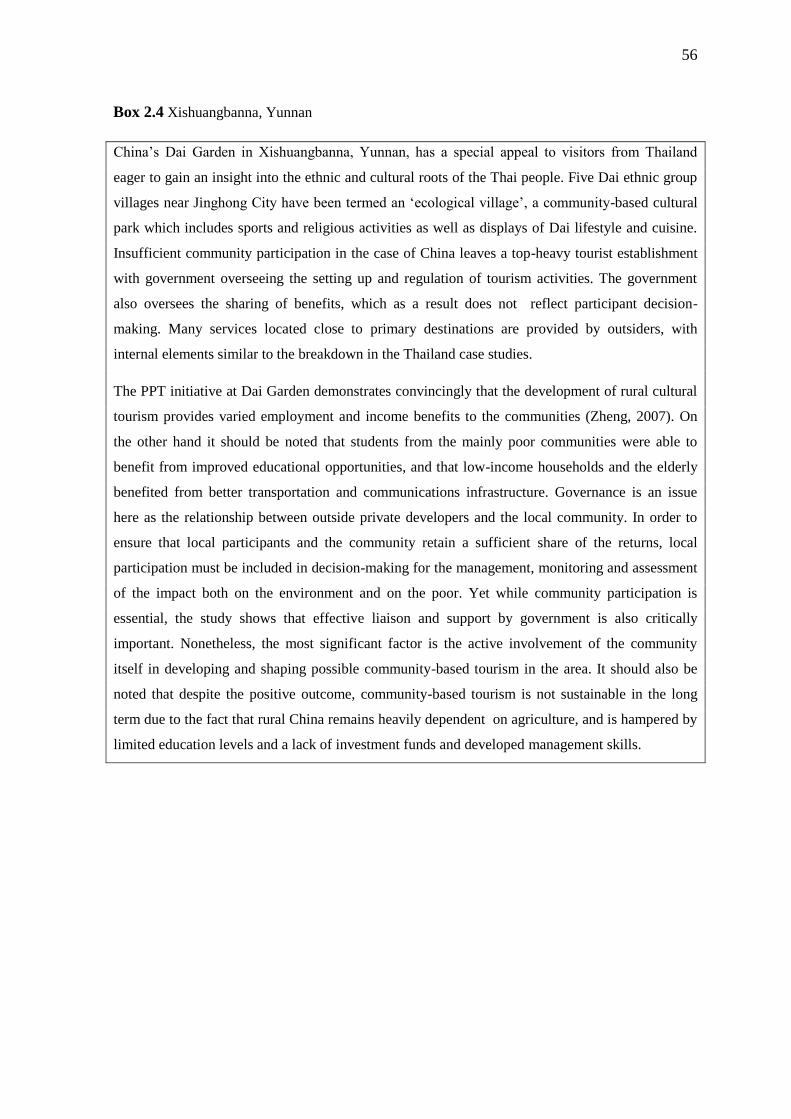
56
Box 2.4 Xishuangbanna, Yunnan
China‘s Dai Garden in Xishuangbanna, Yunnan, has a special appeal to visitors from Thailand
eager to gain an insight into the ethnic and cultural roots of the Thai people. Five Dai ethnic group
villages near Jinghong City have been termed an ‗ecological village‘, a community-based cultural
park which includes sports and religious activities as well as displays of Dai lifestyle and cuisine.
Insufficient community participation in the case of China leaves a top-heavy tourist establishment
with government overseeing the setting up and regulation of tourism activities. The government
also oversees the sharing of benefits, which as a result does not reflect participant decision-
making. Many services located close to primary destinations are provided by outsiders, with
internal elements similar to the breakdown in the Thailand case studies.
The PPT initiative at Dai Garden demonstrates convincingly that the development of rural cultural
tourism provides varied employment and income benefits to the communities (Zheng, 2007). On
the other hand it should be noted that students from the mainly poor communities were able to
benefit from improved educational opportunities, and that low-income households and the elderly
benefited from better transportation and communications infrastructure. Governance is an issue
here as the relationship between outside private developers and the local community. In order to
ensure that local participants and the community retain a sufficient share of the returns, local
participation must be included in decision-making for the management, monitoring and assessment
of the impact both on the environment and on the poor. Yet while community participation is
essential, the study shows that effective liaison and support by government is also critically
important. Nonetheless, the most significant factor is the active involvement of the community
itself in developing and shaping possible community-based tourism in the area. It should also be
noted that despite the positive outcome, community-based tourism is not sustainable in the long
term due to the fact that rural China remains heavily dependent on agriculture, and is hampered by
limited education levels and a lack of investment funds and developed management skills.
57
Box 2.5 Luang Prabang, Lao PDR
Interestingly, research by the Lao government suggests that poverty in Luang Prabang is
falling faster than anywhere else in the country, largely due to the impact of tourism and
spinoffs to the local community at all levels. However, it is unclear how much this
assessment is influenced by, or reflects, national government policy and how much
independence the local community actually has (Leebouapao et al, 2007). Despite the
desire for more tourism and tourism revenues, community initiatives are not always
wholeheartedly welcomed, but direct tourism income applied to goods and services is also
positively affecting other economic sectors, especially farming and handicrafts. Longer-
term low-end tourists, discouraged in neighbouring Thailand, are attracted to Luang
Prabang and other Lao PDR destinations, and provide significant economic and cultural
impacts in specific locales, where they explore Lao cuisine, accommodation, transport, and
social life, although in the process also providing distractions to Lao society itself,
especially in lifestyles and values.
A survey of 200 households showed that location is an important factor determining who
benefits from tourism-related activities. For example, households in the Luang Prabang
town centre gain significantly more benefit from improved incomes than households
located in small villages outside the town. More well-off households in town also benefit
from the increasing value of land (Leebouapao et al, 2007).
2.9 Issues arising from PPT case studies in GMS countries
2.9.1 Unequal benefits from PPT
The study by Anuchitworawong Panpiemras and Pupphavesa (2007) strongly equates tourism
with income inequity. The authors state that their research shows that the vulnerability of
the tourist trade leads to greater income disparity, rather than serving the interests of the
majority population in the areas under review. While the idea of Pro-poor Tourism is
appealing as a concept, in practice it may do the reverse from what it sets out to achieve.
Furthermore, while a variety of tourism products and attractions in an area is theoretically
thought to provide more income opportunities for the poor, lesser activities may actually
provide greater benefits for the poorer members of a community.
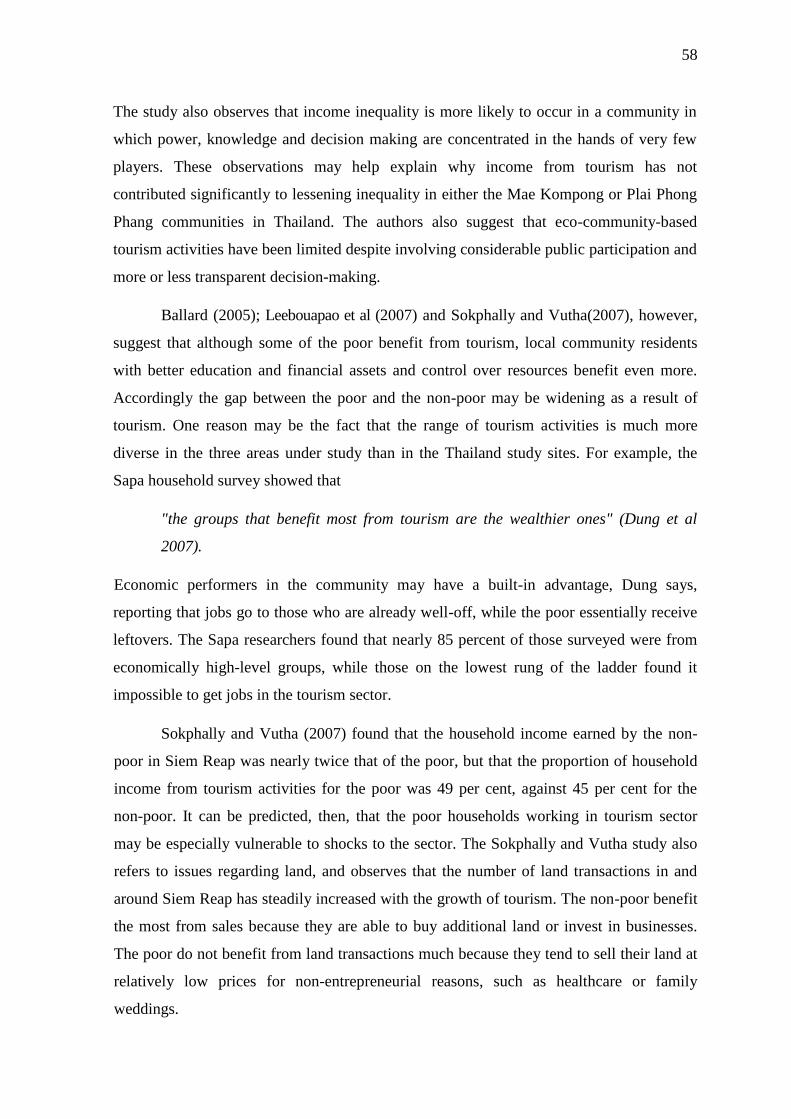
58
The study also observes that income inequality is more likely to occur in a community in
which power, knowledge and decision making are concentrated in the hands of very few
players. These observations may help explain why income from tourism has not
contributed significantly to lessening inequality in either the Mae Kompong or Plai Phong
Phang communities in Thailand. The authors also suggest that eco-community-based
tourism activities have been limited despite involving considerable public participation and
more or less transparent decision-making.
Ballard (2005); Leebouapao et al (2007) and Sokphally and Vutha(2007), however,
suggest that although some of the poor benefit from tourism, local community residents
with better education and financial assets and control over resources benefit even more.
Accordingly the gap between the poor and the non-poor may be widening as a result of
tourism. One reason may be the fact that the range of tourism activities is much more
diverse in the three areas under study than in the Thailand study sites. For example, the
Sapa household survey showed that
"the groups that benefit most from tourism are the wealthier ones" (Dung et al
2007).
Economic performers in the community may have a built-in advantage, Dung says,
reporting that jobs go to those who are already well-off, while the poor essentially receive
leftovers. The Sapa researchers found that nearly 85 percent of those surveyed were from
economically high-level groups, while those on the lowest rung of the ladder found it
impossible to get jobs in the tourism sector.
Sokphally and Vutha (2007) found that the household income earned by the non-
poor in Siem Reap was nearly twice that of the poor, but that the proportion of household
income from tourism activities for the poor was 49 per cent, against 45 per cent for the
non-poor. It can be predicted, then, that the poor households working in tourism sector
may be especially vulnerable to shocks to the sector. The Sokphally and Vutha study also
refers to issues regarding land, and observes that the number of land transactions in and
around Siem Reap has steadily increased with the growth of tourism. The non-poor benefit
the most from sales because they are able to buy additional land or invest in businesses.
The poor do not benefit from land transactions much because they tend to sell their land at
relatively low prices for non-entrepreneurial reasons, such as healthcare or family
weddings.
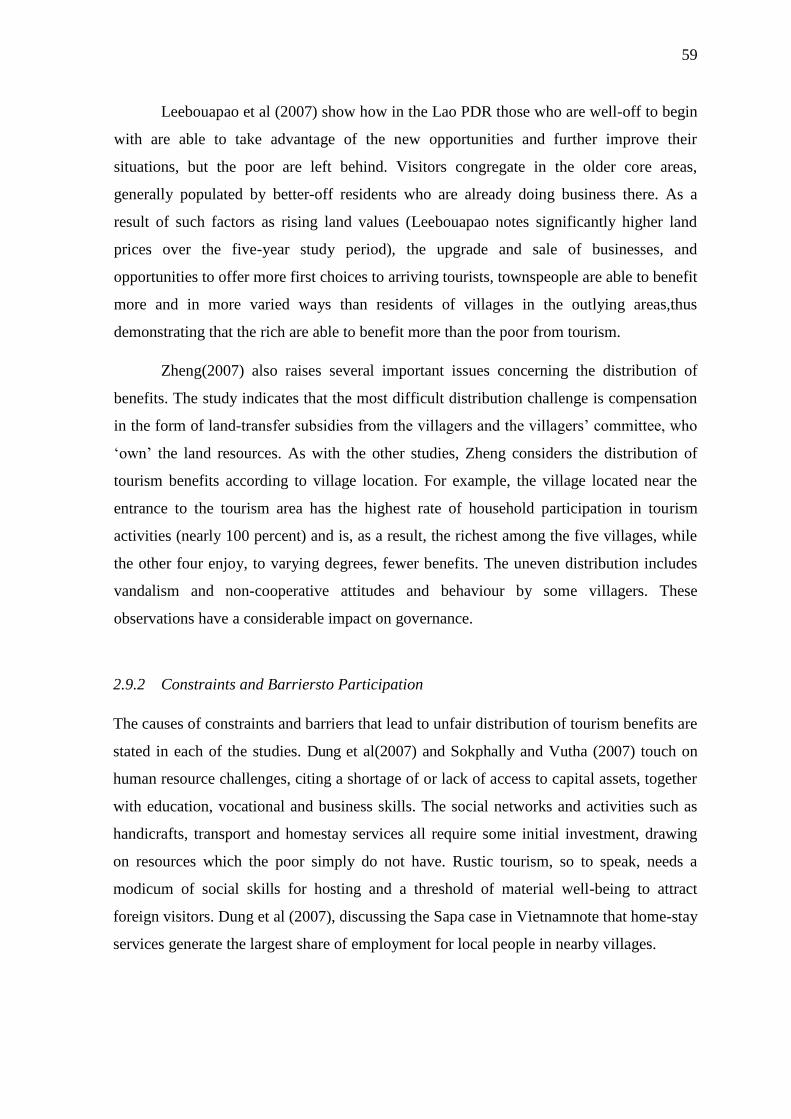
59
Leebouapao et al (2007) show how in the Lao PDR those who are well-off to begin
with are able to take advantage of the new opportunities and further improve their
situations, but the poor are left behind. Visitors congregate in the older core areas,
generally populated by better-off residents who are already doing business there. As a
result of such factors as rising land values (Leebouapao notes significantly higher land
prices over the five-year study period), the upgrade and sale of businesses, and
opportunities to offer more first choices to arriving tourists, townspeople are able to benefit
more and in more varied ways than residents of villages in the outlying areas,thus
demonstrating that the rich are able to benefit more than the poor from tourism.
Zheng(2007) also raises several important issues concerning the distribution of
benefits. The study indicates that the most difficult distribution challenge is compensation
in the form of land-transfer subsidies from the villagers and the villagers‘ committee, who
‗own‘ the land resources. As with the other studies, Zheng considers the distribution of
tourism benefits according to village location. For example, the village located near the
entrance to the tourism area has the highest rate of household participation in tourism
activities (nearly 100 percent) and is, as a result, the richest among the five villages, while
the other four enjoy, to varying degrees, fewer benefits. The uneven distribution includes
vandalism and non-cooperative attitudes and behaviour by some villagers. These
observations have a considerable impact on governance.
2.9.2 Constraints and Barriersto Participation
The causes of constraints and barriers that lead to unfair distribution of tourism benefits are
stated in each of the studies. Dung et al(2007) and Sokphally and Vutha (2007) touch on
human resource challenges, citing a shortage of or lack of access to capital assets, together
with education, vocational and business skills. The social networks and activities such as
handicrafts, transport and homestay services all require some initial investment, drawing
on resources which the poor simply do not have. Rustic tourism, so to speak, needs a
modicum of social skills for hosting and a threshold of material well-being to attract
foreign visitors. Dung et al (2007), discussing the Sapa case in Vietnamnote that home-stay
services generate the largest share of employment for local people in nearby villages.
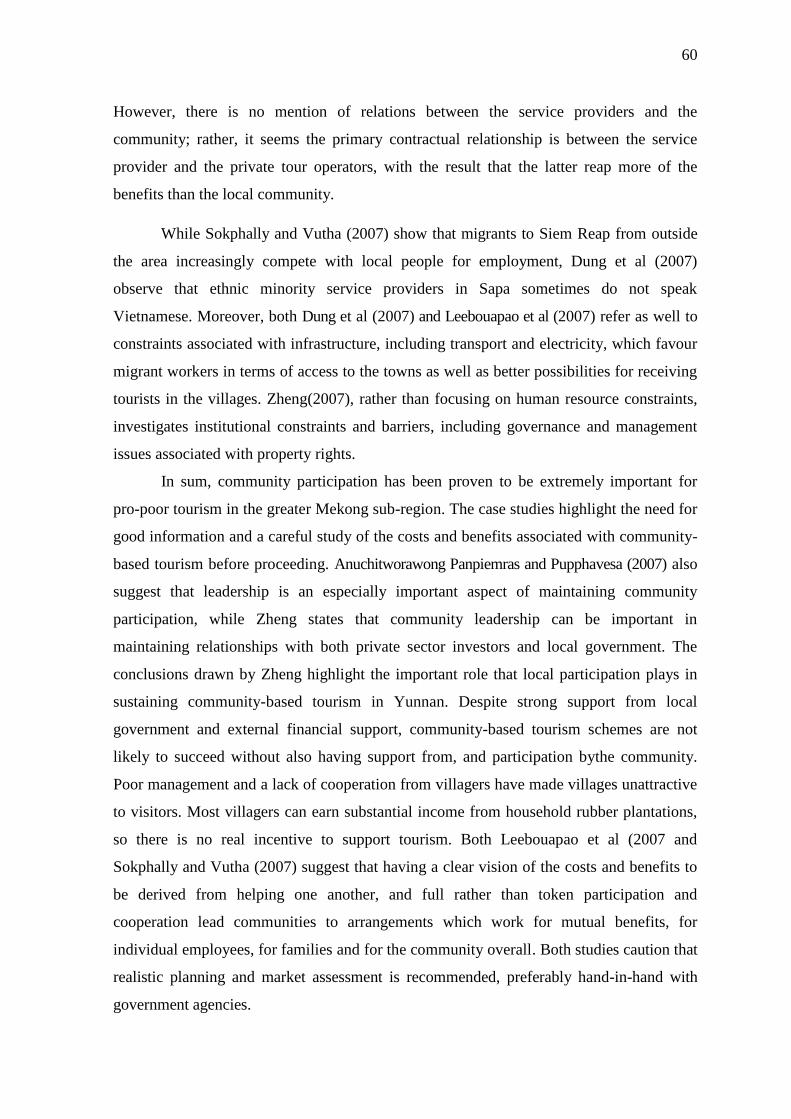
60
However, there is no mention of relations between the service providers and the
community; rather, it seems the primary contractual relationship is between the service
provider and the private tour operators, with the result that the latter reap more of the
benefits than the local community.
While Sokphally and Vutha (2007) show that migrants to Siem Reap from outside
the area increasingly compete with local people for employment, Dung et al (2007)
observe that ethnic minority service providers in Sapa sometimes do not speak
Vietnamese. Moreover, both Dung et al (2007) and Leebouapao et al (2007) refer as well to
constraints associated with infrastructure, including transport and electricity, which favour
migrant workers in terms of access to the towns as well as better possibilities for receiving
tourists in the villages. Zheng(2007), rather than focusing on human resource constraints,
investigates institutional constraints and barriers, including governance and management
issues associated with property rights.
In sum, community participation has been proven to be extremely important for
pro-poor tourism in the greater Mekong sub-region. The case studies highlight the need for
good information and a careful study of the costs and benefits associated with community-
based tourism before proceeding. Anuchitworawong Panpiemras and Pupphavesa (2007) also
suggest that leadership is an especially important aspect of maintaining community
participation, while Zheng states that community leadership can be important in
maintaining relationships with both private sector investors and local government. The
conclusions drawn by Zheng highlight the important role that local participation plays in
sustaining community-based tourism in Yunnan. Despite strong support from local
government and external financial support, community-based tourism schemes are not
likely to succeed without also having support from, and participation bythe community.
Poor management and a lack of cooperation from villagers have made villages unattractive
to visitors. Most villagers can earn substantial income from household rubber plantations,
so there is no real incentive to support tourism. Both Leebouapao et al (2007 and
Sokphally and Vutha (2007) suggest that having a clear vision of the costs and benefits to
be derived from helping one another, and full rather than token participation and
cooperation lead communities to arrangements which work for mutual benefits, for
individual employees, for families and for the community overall. Both studies caution that
realistic planning and market assessment is recommended, preferably hand-in-hand with
government agencies.
61
2.9.3 Infrastructure
The case studies highlight the importance of transport infrastructure to tourism sites in the
Mekong region, with good infrastructure usually resulting in the distribution of more
benefits to the poor. One issue is the inability of some local producers to keep up with the
increased demand for goods and services. The volume of tourism to the Angkor region
meant that local farmers, craftsmen and other producers could not meet the demand for
some consumer goods and services, and the sudden flow of international tourists meant
that more outside people had to be imported to fill the market need (Ballard,
2005;Sokphally and Vutha,2007). Local producers could not meet the demand either in
volume or quality, and local entrepreneurs could not invest at the rate required. As a result,
investors turned to outside providers for food products, supplies, handicrafts and
transportation, as well as skilled labour. While some local people continue to benefit from
tourism, an unequal share of benefits has shifted from local producers, especially the poor,
to external investors and suppliers.
Providing a contrast is the case of Luang Prabang, which, with its limited access by
air, tends to attract adventure and budget travellers coming by road (Leebouapao et al, 2007).
In Sapa, Vietnam, one must reach the town by rail or road, which brings both budget and
higher-end comfort-seeking travellers (Dung et al, 2007). In both the Lao and Vietnamese
studies, adventure and comfort travellers tend to spend more on local goods and services,
providing more benefit for at least some of the local poor.
2.9.4 Local Governance
Local communities themselves can manage the growth of tourism and are able to do this
without significant outside government support, as seen in the cases of Mae Kompong and
Plai Phong Phang in Thailand. An eco-tourism project from a community base in Mae
Kompong was run by a nine-member committee responsible for establishing the rules and
regulations governing tourism in the village and setting prices for goods and services, thus
providing consumer protection for tourists and ensuring a fair return for the local service
providers. The village committee also set local regulations for the equitable distribution of
profits to the village participants who were all members of the local cooperative
(Anuchitworawong Panpiemras and Pupphavesa, 2007).
62
The case of Dai Garden in China involves private commercial investors who
entered the community from outside and developed a large area for tourism, taking
advantage of the area‘s distinctive natural surroundings and the colourful culture of ethnic
groups in the area. The company compensated villagers for land that was expropriated for
development. According to the plan, villagers were then supposed to receive benefits such
as having their electricity bills paid and guaranteed employment for at least one member of
every family. In a type of modified homestay, villagers could charge tourists for visits to
their homes, and sell fruit and traditional barbecued food. In addition to other benefits,
such as an improved and expanded road network built by the company and scholarships for
village students, some villagers also expected to receive a proportion of the admission fees.
The company plans eventually to give shares to the villagers and to exchange assets, such
as traditional bamboo houses, for shares (Zheng2007).
2.9.5 Regulatory and Land Use Concerns
One good indicator of regulatory impacts on tourism development is the behaviour of land
markets in the main tourist areas (Sokphally and Vutha, 2007; Leebouapao et al, 2007 and
Dung, 2007). Leebouapao et al, (2007) note that government regulations define exactly
how land may be used in Luang Prabang, while Dung (2007) suggests that in Sapa
difficulties in converting agricultural land to commercial use may be a constraint to
tourism development. Sokphally and Vutha (2007), on the other hand, argue that the
booming real estate market in Siem Reap is not subject to any regulation at all, and
agricultural and residential land, even that owned by the state, is freely converted to
commercial use.
2.9.6 Human Resource and Business Development
Two of the most significant barriers to preventing the poor from participating more in
tourism are the lack of employment skills and financial capital (Anuchitworawong
Panpiemras and Pupphavesa, 2007; Dung,2007; Leebouapao et al,2007;Sokphally and Vutha
2007; Zheng 2007). The case studies demonstrate that there is a vital role for government
in human resource development and skill acquisition. Vocational training and skill
development are crucial to reducing leakages in the labour sector and promoting jobs for
local young men and women. Special effort, however, must be made to target such
63
opportunities to young people from poor households, who are routinely excluded due to
their inability to meet all the selection criteria.
More affordable credit should also be made readily available to small- and
medium-sised enterprises (SMEs) in the tourism sector. Lower interest rates, more flexible
repayment schedules and fewer collateral requirements could be targeted at SMEs that
train and hire the poor, or at individuals or households wishing to start their own small
businesses. Group lending associations for the poor could also be introduced in
collaboration with NGOs in areas where community-based tourism is being initiated. As
with other aspects of PPT development, investment strategies that target the poor must be
mainstreamed into the overall approach to tourism.
2.9.7 Government support in Marketing
Anuchitworawong Panpiemras and Pupphavesa (2007), Dung (2007), Leebouapao et al (2007),
Sokphally and Vutha (2007), and Zheng (2007) all underscore the important role of
government in promoting tourism. While regional collaboration among the governments of
the GMS can and should play a significant role in marketing locations in the GMS as
popular tourist destinations, the national governments must play a lead role in ensuring that
the poor have better opportunities to participate fully in, and benefit from, tourism growth.
A significant component of pro-poor approaches to tourism is to strengthen the capacity of
local governments to play supportive roles and promote community participation in
tourism development and stronger, more effective, public-private partnerships. In cases
involving outside investors or other outside actors such as tour agents, there is also an
important role for local government in mediating between external and local interests
(Zheng, 2007).
2.9.8 In conclusion
The case studies revealed that poverty reduction programmes often end up benefitting
general locales, while failing to target those where extreme poverty exists(Ballard, 2005;
Anuchitworawong, Panpiemras and Pupphavesa, 2007; Dung etal, 2007; Leebouapao et al,
2007, Sokphally and Vuttha, 2007; Zheng,2007).
64
Despite general indicators to the contrary, the studies reveal that that tourism does
bring some benefit to at least some households of the poor at the outer fringes of the
benefit pool, and some communities that are beyond the reach of primary benefits, but the
results differ country by country. Nonetheless, the extended lifting of community well-
being has not happened as planned.
Consequently it should be noted that tourism policies in the Greater Mekong Sub-
region have been inadequate in their design and application to begin with, and have proved
to be insufficiently beneficial to the poor populations they are, in theory, designed to serve.
We see four primary reasons for this:
1. Greater Mekong Sub-region tourist spending mainly involves direct services, including
hotels and transport, often provided by urban-based sectors of society which are
already relatively rich in resources. The poor hold poorly paid jobs which are more
marginal to the main tourism activities.
2. Ethnic minorities comprise most of the poor in the GMS, and they live in rural and
remote areas, whereas tourism investment is generally made directly in urban areas or
in business services conducted by urban dwellers.
3. Statistical analysis and planning of tourism in the GMS tracks spending on goods and
services rather than perceiving local populations and their produce as the target of the
enterprise.
4. Well-defined and varied constraints are the measure of reality for the poor, who cannot
escape the impact of their relative lack of social readiness to meet urban and
international visitors due to limited educational and social learning opportunities. Such
constraints are also reflected in limited vocational skills and a lack of access to capital.
There is clearly sufficient evidence to indicate that the time has come to reassess
the relationship between tourism and poverty reduction. The first priority is to apply the
findings and design, and implement more appropriate Pro-poor Tourism policies
throughout the Greater Mekong Sub-region. The crux of the challenge is to integrate Pro-
poor Tourism policies into core development planning, thus taking pro-poor poverty
reduction planning from the sidelines into the core tourism strategies, plans and
programmes of the GMS countries.
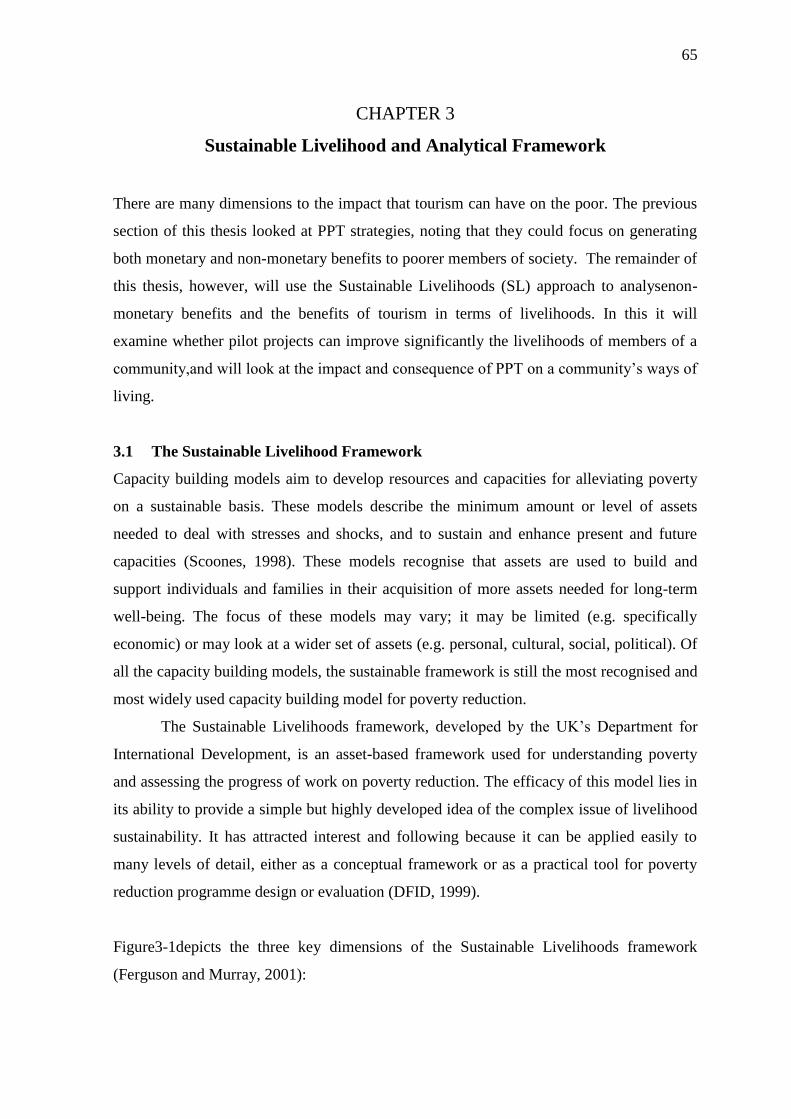
65
CHAPTER 3
Sustainable Livelihood and Analytical Framework
There are many dimensions to the impact that tourism can have on the poor. The previous
section of this thesis looked at PPT strategies, noting that they could focus on generating
both monetary and non-monetary benefits to poorer members of society. The remainder of
this thesis, however, will use the Sustainable Livelihoods (SL) approach to analysenon-
monetary benefits and the benefits of tourism in terms of livelihoods. In this it will
examine whether pilot projects can improve significantly the livelihoods of members of a
community,and will look at the impact and consequence of PPT on a community‘s ways of
living.
3.1 The Sustainable Livelihood Framework
Capacity building models aim to develop resources and capacities for alleviating poverty
on a sustainable basis. These models describe the minimum amount or level of assets
needed to deal with stresses and shocks, and to sustain and enhance present and future
capacities (Scoones, 1998). These models recognise that assets are used to build and
support individuals and families in their acquisition of more assets needed for long-term
well-being. The focus of these models may vary; it may be limited (e.g. specifically
economic) or may look at a wider set of assets (e.g. personal, cultural, social, political). Of
all the capacity building models, the sustainable framework is still the most recognised and
most widely used capacity building model for poverty reduction.
The Sustainable Livelihoods framework, developed by the UK‘s Department for
International Development, is an asset-based framework used for understanding poverty
and assessing the progress of work on poverty reduction. The efficacy of this model lies in
its ability to provide a simple but highly developed idea of the complex issue of livelihood
sustainability. It has attracted interest and following because it can be applied easily to
many levels of detail, either as a conceptual framework or as a practical tool for poverty
reduction programme design or evaluation (DFID, 1999).
Figure3-1depicts the three key dimensions of the Sustainable Livelihoods framework
(Ferguson and Murray, 2001):
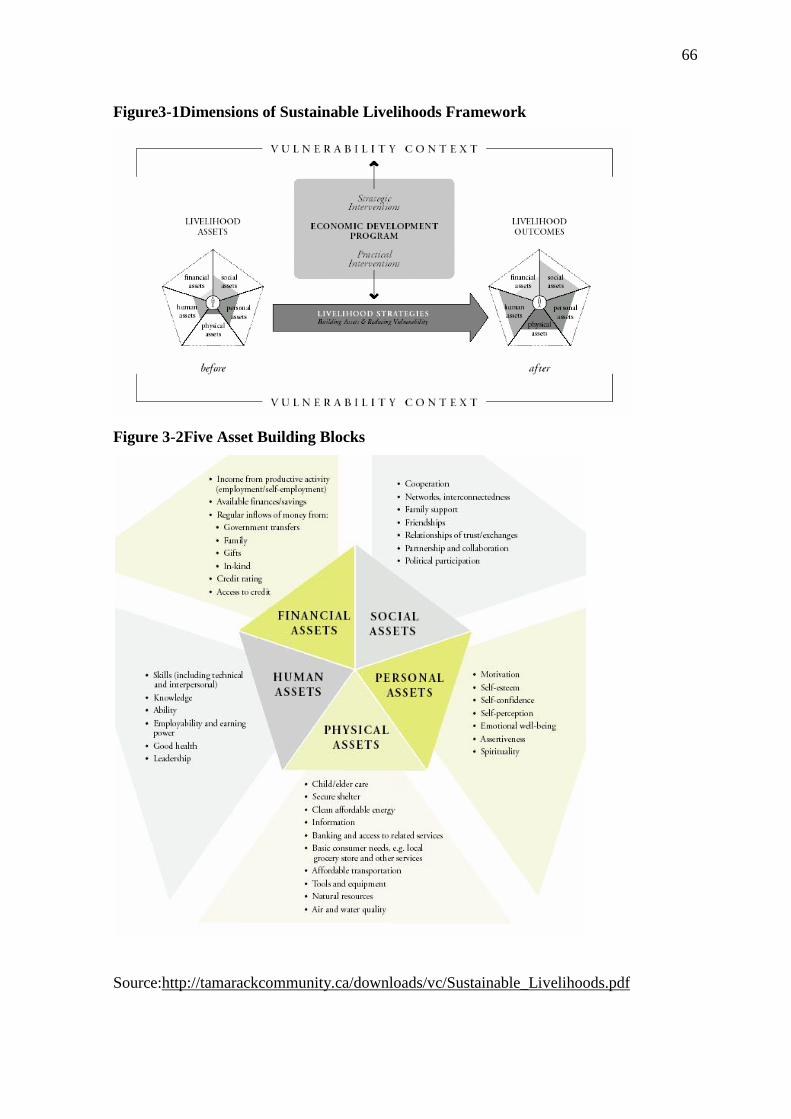
66
Figure3-1Dimensions of Sustainable Livelihoods Framework
Figure 3-2Five Asset Building Blocks
Source:http://tamarackcommunity.ca/downloads/vc/Sustainable_Livelihoods.pdf
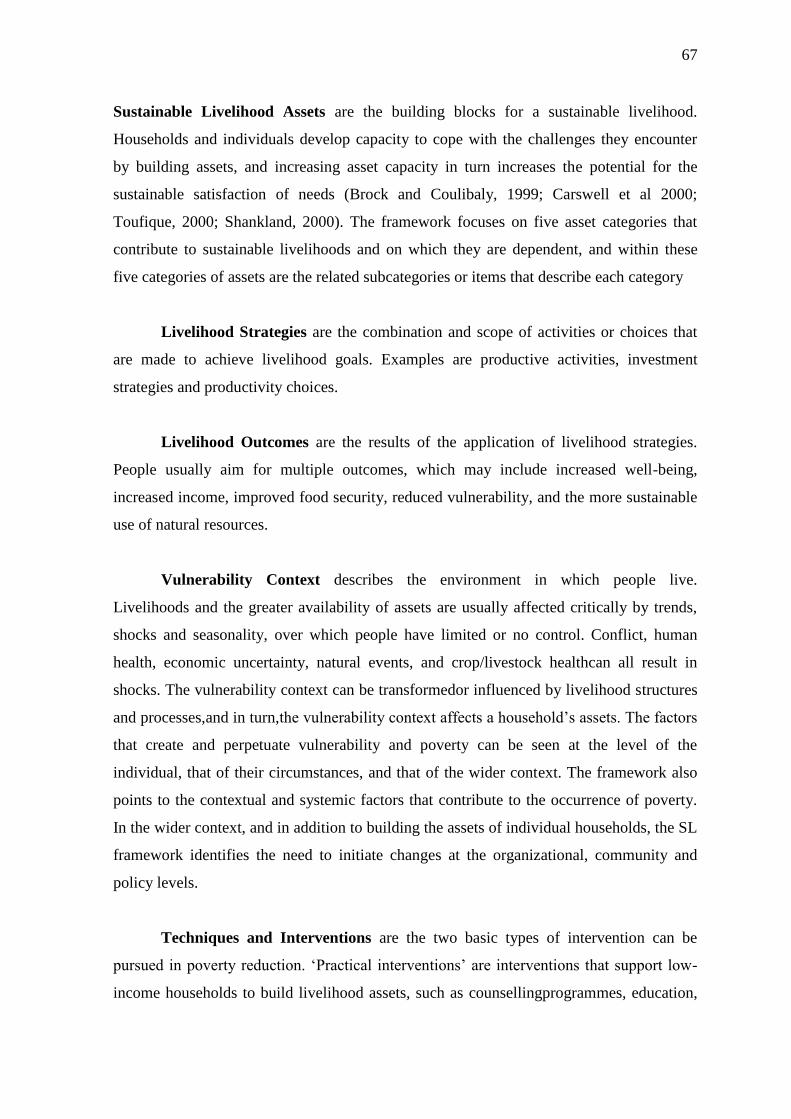
67
Sustainable Livelihood Assets are the building blocks for a sustainable livelihood.
Households and individuals develop capacity to cope with the challenges they encounter
by building assets, and increasing asset capacity in turn increases the potential for the
sustainable satisfaction of needs (Brock and Coulibaly, 1999; Carswell et al 2000;
Toufique, 2000; Shankland, 2000). The framework focuses on five asset categories that
contribute to sustainable livelihoods and on which they are dependent, and within these
five categories of assets are the related subcategories or items that describe each category
Livelihood Strategies are the combination and scope of activities or choices that
are made to achieve livelihood goals. Examples are productive activities, investment
strategies and productivity choices.
Livelihood Outcomes are the results of the application of livelihood strategies.
People usually aim for multiple outcomes, which may include increased well-being,
increased income, improved food security, reduced vulnerability, and the more sustainable
use of natural resources.
Vulnerability Context describes the environment in which people live.
Livelihoods and the greater availability of assets are usually affected critically by trends,
shocks and seasonality, over which people have limited or no control. Conflict, human
health, economic uncertainty, natural events, and crop/livestock healthcan all result in
shocks. The vulnerability context can be transformedor influenced by livelihood structures
and processes,and in turn,the vulnerability context affects a household‘s assets. The factors
that create and perpetuate vulnerability and poverty can be seen at the level of the
individual, that of their circumstances, and that of the wider context. The framework also
points to the contextual and systemic factors that contribute to the occurrence of poverty.
In the wider context, and in addition to building the assets of individual households, the SL
framework identifies the need to initiate changes at the organizational, community and
policy levels.
Techniques and Interventions are the two basic types of intervention can be
pursued in poverty reduction. ‗Practical interventions‘ are interventions that support low-
income households to build livelihood assets, such as counsellingprogrammes, education,
68
employment training, economic literacy and savings programmes, and support for small
business development. ‗Strategic interventions‘ are interventions aimed at improving the
vulnerability context, and focused on social and economic change at the systemic level,
such as community building and organizing, alliance building, policy work and advocacy
(Helmore and Singh, 2001).
Figure3-3 DFID‘s Sustainable Livelihoods Framework
Source: Farington et al,(1999) and Scoones(1998)
The Sustainable Livelihoods Framework is the most widely recognised and the first
frameworkfor sustainable livelihood (Chambers and Conway, 1992). Others authors have
modified it to emphasise other components, but all share the principles, elements and
interrelationships between the elements (Ashley and Carney, 1999). These elements are
influenced by social difference, including sex, age, ethnicity and other factors.
For example, men and women may have different access to natural capital (land,
for instance), and influence over policies and therefore be impacted differently. This
difference needs to be considered in analysing livelihoods at all levels. Power also
influences livelihood assets, structures, processes, strategies, outcomes and vulnerabilities,
and there are different interests, conflicts and tensions within and between communities.
Poor communities can have the least access to assets and become the most vulnerable to all
kinds of shocks.
H= Human Capital
N=Natural Capital
F=Financial Capital
P=PhysicalCapital
S=Social Capital
Transforming Structures
• Levels of Government• Private Sector
and Processes
• Laws• Policies• Cultures• Instructors
Transforming Structures
• Levels of Government• Private Sector
and Processes
• Laws• Policies• Cultures• Instructors
Livelihood Strategies
• Agricultural Intensification/ Extensification• Diversification• Migration
Livelihood Strategies
• Agricultural Intensification/ Extensification• Diversification• Migration
Vulnerability Context
• Shocks• Trends• Seasonality
Vulnerability Context
• Shocks• Trends• Seasonality
Livelihood Outcomes (Monetary, Tangible, or intangible)
• More income
• Increase well being
• Reduce vulnerability
• Improved food security
• More sustainable use of natural resource base
• Empowerment
Livelihood Outcomes (Monetary, Tangible, or intangible)
• More income
• Increase well being
• Reduce vulnerability
• Improved food security
• More sustainable use of natural resource base
• Empowerment
Livelihood Assets
S
H
N
P F
S
H
N
P F
S
H
N
P F
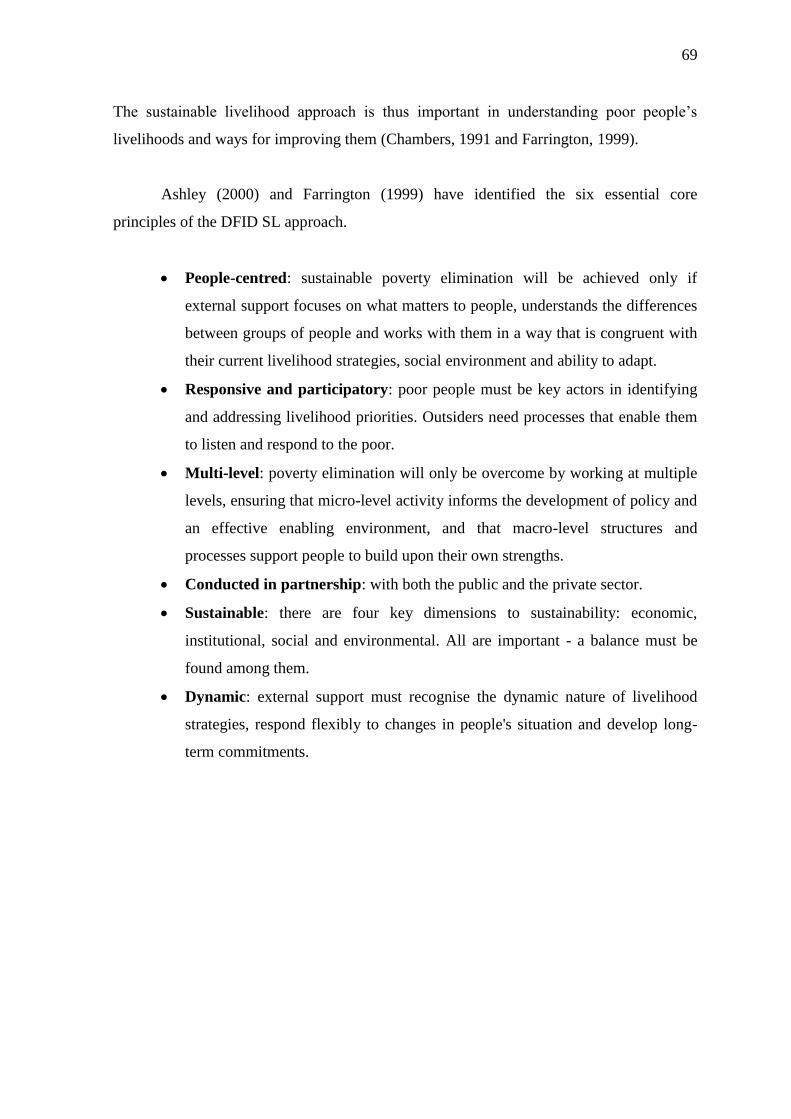
69
The sustainable livelihood approach is thus important in understanding poor people‘s
livelihoods and ways for improving them (Chambers, 1991 and Farrington, 1999).
Ashley (2000) and Farrington (1999) have identified the six essential core
principles of the DFID SL approach.
People-centred: sustainable poverty elimination will be achieved only if
external support focuses on what matters to people, understands the differences
between groups of people and works with them in a way that is congruent with
their current livelihood strategies, social environment and ability to adapt.
Responsive and participatory: poor people must be key actors in identifying
and addressing livelihood priorities. Outsiders need processes that enable them
to listen and respond to the poor.
Multi-level: poverty elimination will only be overcome by working at multiple
levels, ensuring that micro-level activity informs the development of policy and
an effective enabling environment, and that macro-level structures and
processes support people to build upon their own strengths.
Conducted in partnership: with both the public and the private sector.
Sustainable: there are four key dimensions to sustainability: economic,
institutional, social and environmental. All are important - a balance must be
found among them.
Dynamic: external support must recognise the dynamic nature of livelihood
strategies, respond flexibly to changes in people's situation and develop long-
term commitments.
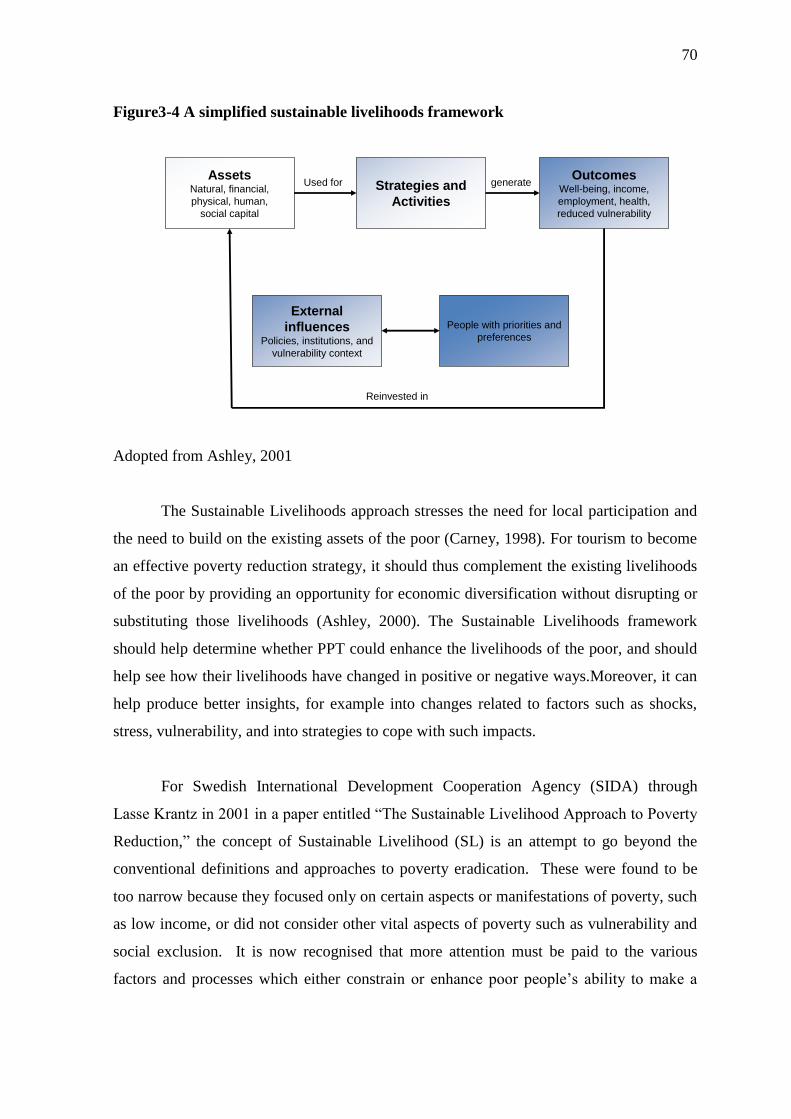
70
Figure3-4 A simplified sustainable livelihoods framework
Adopted from Ashley, 2001
The Sustainable Livelihoods approach stresses the need for local participation and
the need to build on the existing assets of the poor (Carney, 1998). For tourism to become
an effective poverty reduction strategy, it should thus complement the existing livelihoods
of the poor by providing an opportunity for economic diversification without disrupting or
substituting those livelihoods (Ashley, 2000). The Sustainable Livelihoods framework
should help determine whether PPT could enhance the livelihoods of the poor, and should
help see how their livelihoods have changed in positive or negative ways.Moreover, it can
help produce better insights, for example into changes related to factors such as shocks,
stress, vulnerability, and into strategies to cope with such impacts.
For Swedish International Development Cooperation Agency (SIDA) through
Lasse Krantz in 2001 in a paper entitled ―The Sustainable Livelihood Approach to Poverty
Reduction,‖ the concept of Sustainable Livelihood (SL) is an attempt to go beyond the
conventional definitions and approaches to poverty eradication. These were found to be
too narrow because they focused only on certain aspects or manifestations of poverty, such
as low income, or did not consider other vital aspects of poverty such as vulnerability and
social exclusion. It is now recognised that more attention must be paid to the various
factors and processes which either constrain or enhance poor people‘s ability to make a
AssetsNatural, financial,
physical, human,
social capital
Strategies and
Activities
OutcomesWell-being, income,
employment, health,
reduced vulnerability
External
influencesPolicies, institutions, and
vulnerability context
People with priorities and
preferences
Used for generate
Reinvested in
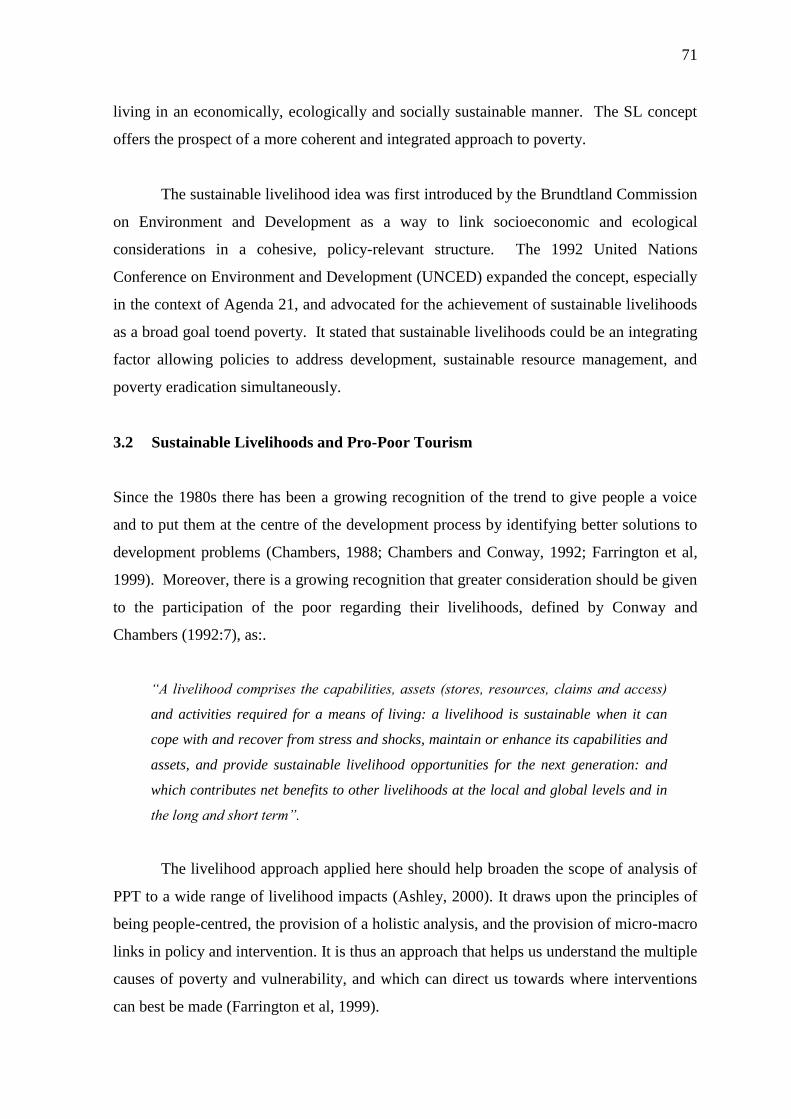
71
living in an economically, ecologically and socially sustainable manner. The SL concept
offers the prospect of a more coherent and integrated approach to poverty.
The sustainable livelihood idea was first introduced by the Brundtland Commission
on Environment and Development as a way to link socioeconomic and ecological
considerations in a cohesive, policy-relevant structure. The 1992 United Nations
Conference on Environment and Development (UNCED) expanded the concept, especially
in the context of Agenda 21, and advocated for the achievement of sustainable livelihoods
as a broad goal toend poverty. It stated that sustainable livelihoods could be an integrating
factor allowing policies to address development, sustainable resource management, and
poverty eradication simultaneously.
3.2 Sustainable Livelihoods and Pro-Poor Tourism
Since the 1980s there has been a growing recognition of the trend to give people a voice
and to put them at the centre of the development process by identifying better solutions to
development problems (Chambers, 1988; Chambers and Conway, 1992; Farrington et al,
1999). Moreover, there is a growing recognition that greater consideration should be given
to the participation of the poor regarding their livelihoods, defined by Conway and
Chambers (1992:7), as:.
“A livelihood comprises the capabilities, assets (stores, resources, claims and access)
and activities required for a means of living: a livelihood is sustainable when it can
cope with and recover from stress and shocks, maintain or enhance its capabilities and
assets, and provide sustainable livelihood opportunities for the next generation: and
which contributes net benefits to other livelihoods at the local and global levels and in
the long and short term”.
The livelihood approach applied here should help broaden the scope of analysis of
PPT to a wide range of livelihood impacts (Ashley, 2000). It draws upon the principles of
being people-centred, the provision of a holistic analysis, and the provision of micro-macro
links in policy and intervention. It is thus an approach that helps us understand the multiple
causes of poverty and vulnerability, and which can direct us towards where interventions
can best be made (Farrington et al, 1999).
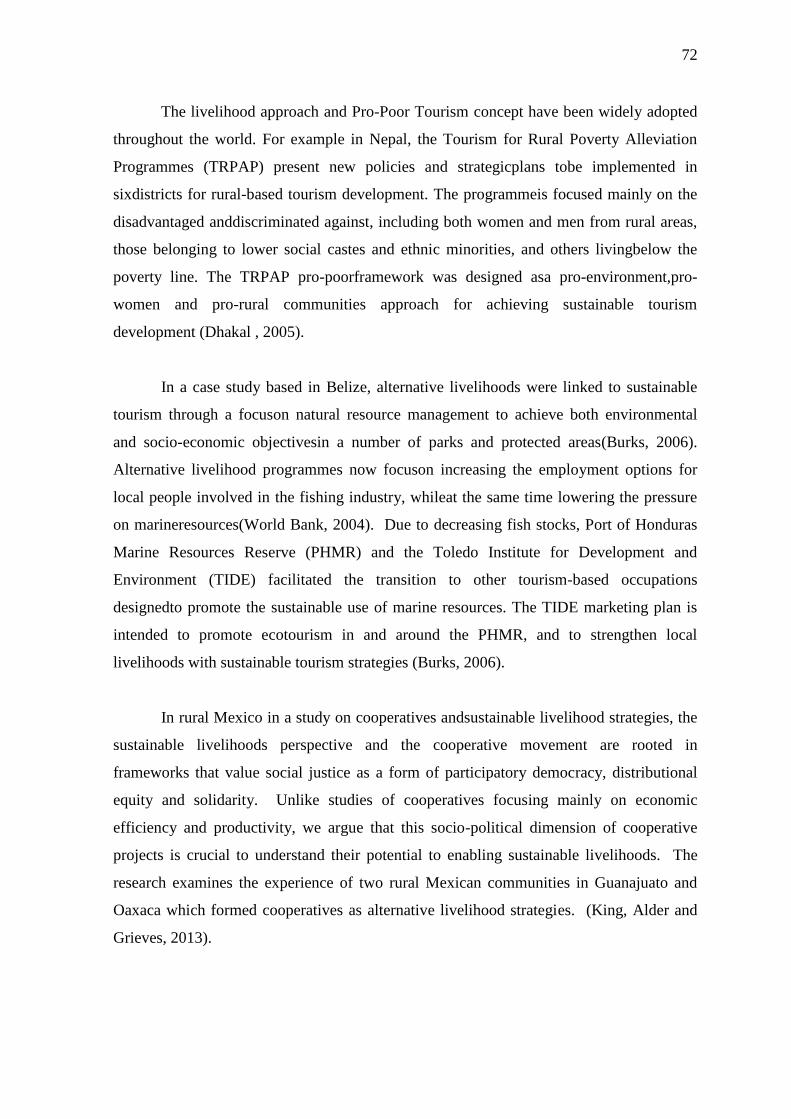
72
The livelihood approach and Pro-Poor Tourism concept have been widely adopted
throughout the world. For example in Nepal, the Tourism for Rural Poverty Alleviation
Programmes (TRPAP) present new policies and strategicplans tobe implemented in
sixdistricts for rural-based tourism development. The programmeis focused mainly on the
disadvantaged anddiscriminated against, including both women and men from rural areas,
those belonging to lower social castes and ethnic minorities, and others livingbelow the
poverty line. The TRPAP pro-poorframework was designed asa pro-environment,pro-
women and pro-rural communities approach for achieving sustainable tourism
development (Dhakal , 2005).
In a case study based in Belize, alternative livelihoods were linked to sustainable
tourism through a focuson natural resource management to achieve both environmental
and socio-economic objectivesin a number of parks and protected areas(Burks, 2006).
Alternative livelihood programmes now focuson increasing the employment options for
local people involved in the fishing industry, whileat the same time lowering the pressure
on marineresources(World Bank, 2004). Due to decreasing fish stocks, Port of Honduras
Marine Resources Reserve (PHMR) and the Toledo Institute for Development and
Environment (TIDE) facilitated the transition to other tourism-based occupations
designedto promote the sustainable use of marine resources. The TIDE marketing plan is
intended to promote ecotourism in and around the PHMR, and to strengthen local
livelihoods with sustainable tourism strategies (Burks, 2006).
In rural Mexico in a study on cooperatives andsustainable livelihood strategies, the
sustainable livelihoods perspective and the cooperative movement are rooted in
frameworks that value social justice as a form of participatory democracy, distributional
equity and solidarity. Unlike studies of cooperatives focusing mainly on economic
efficiency and productivity, we argue that this socio-political dimension of cooperative
projects is crucial to understand their potential to enabling sustainable livelihoods. The
research examines the experience of two rural Mexican communities in Guanajuato and
Oaxaca which formed cooperatives as alternative livelihood strategies. (King, Alder and
Grieves, 2013).
73
A paper entitled Sustainable Livelihoods through Conservation of Wetland Resources: a
case of economic benefits from Ghodaghodi Lake, Western Nepal, investigating
participation of local ethnic groups in wetland conservation, determined the economic
benefits they received, and assessed socio-economic factors affecting dependency on
wetlands. Some 217 wetland resource-user households around Ghodaghodi Lake, western
Nepal were surveyed. Data were analysed using descriptive statistics, t-tests and ordinary
least squares regressions. The wetland resources contributed significantly to the household
economy of the local people. Each household extracted lake resources at an annual worth
of NPR 4379 (63USD), equivalent to 12.4 percent of household total gross income.
Although the people maintained a positive attitude toward wetland conservation, their
participation in the conservation effort was inadequate. Socioeconomic factors such as
larger household size, older age of the head of the family, and larger area of agricultural
land increased the rate of resource extraction. In contrast, when households were involved
with local conservation organizations, resource extraction was reduced. It is then
recommended the following resource conservation and livelihood strategies:
implementation of community-based conservation approaches to increase system
productivity, adoption of biogas plants, and improved cooking stoves to reduce fuelwood
consumption coupled with conservation awareness programmes (Lamsal, Prant, Kumar
and Atreya, 2015).
In Northern Peru in the village of Kuelap, a study identified livelihood
diversification activities in the village as a form of pro-poor tourism appropriate to
community members. The study, which used Sustainable Livelihoods Analysis (SLA) to
validate compatibility with existing livelihoods, found that the activities reducedconflict
for resource use and ensured the commercial viability of activities for both products and
services. The study argues that pro-poor tourism development make for more sustainable
and risk-free rural livelihoods more sustainable. Pro-poor initiatives can be taken at all
levels, but to be successful as an approach, pro-poor initiativesmust be taken as a core
theme in the overall management of a project, and must therefore be initiated from above
(Woods, 2005).
74
In this study, where PPT is used as a strategy for sustainable development, Woods (2005,
p15-16) found that the ability of the community to incorporate tourism into their
livelihoods depended on various factors:
• The form of development chosen for the greater area
• Community access to the tourism market
• The level of demand for products and services which the community can supply
• The compatibility of tourism activities with existing livelihood strategies
• The ability of the community to organise
• The potential for public-private partnerships
3.3 Sustainable Livelihoods (SLA) Approach as an Analytical Framework
This studyis based on an adaptation of the SL approach first introduced as an analytical
framework by DFID in 1988. Since then the framework has gone through several stages of
evolution, with the emphasis shifting in terms of differing aspects of livelihood. In 1993
Oxfam adopted an SL approach with a greater emphasis on strengthening the participation
of the poor in the development process, based on social and human rights considerations,
while a year later CARE introduced an SL approach with more focus on social, human and
economic assets. The SL approach taken up by UNDP highlights technology and political
assets (participation and empowerment) which can rescue people from poverty.
The differences between the various frameworks appear to stem from differing
definitions of ―sustainability‖, which can create difficulties when the framework is
transformed from theory into practice. This current research adopts the framework used by
Caroline Ashley to assess the impact of tourism on rural livelihoods in Namibia
(Ashley,2000), which in turn is based on the DFID approach.
The aim of this Sustainable livelihood impact assessment is to gain a better
understanding of the impact of the project on the livelihoods of local people and project
participants. This framework is considered most appropriate as the PPT project involves
rural development, and enables an analytical examination of how PPT projects have
improved the livelihood outcomes of the rural poor, especially women. Key themes to be
investigated are asset formation, diversification and vulnerability reduction.
75
The SL approach provides an analytical structure that highlights key components of
livelihood against which project impact can be assessed. The inherent assumption is that
people pursue a range of livelihood outcomes by drawing on a range of assets to undertake
a variety of activities. The activities individuals adopt and the way in which they reinvest
in assets is driven in part by their own preferences and priorities (Ashley and Hussein,
2000; Carney, 1999; Chambers and Conway, 1992).
The approach can be applied not only to planning new projects, but also to
reviewing existing ones. This thesis will follow Ashley‘s three key themes for
investigation when conducting livelihood assessment: (1) an overview of current livelihood
strategies, achievements and priorities, (2) the various impacts of the project on livelihood
strategies and achievement, looking at both external and internal factors and (3) the
differencesamong stakeholder groups in the project.
For example in New Zealand, the Sustainable Livelihoods Approach (SLA) was
developed for analysing livelihoods of the poor and to improve the effectiveness the of
livelihoods-related development assistance(NZAID, 2007). The SLA used in New Zealand
succeededan Integrated Rural Development approach, which was similar to the more
current Area-Based Development and Community-Development approaches.
Another example is the use by the International Fund for Agricultural Development
(IFAD) of SLA analysis as a way to improve the understanding of the livelihoods of poor
people. The IFAD SLA has two key components; firstly, the framework to help understand
the complexities of poverty, and secondly, the set of principles that guide action when
addressing and overcoming poverty. Here the SLA is employed to analyse the main factors
affecting the livelihoods of poor people, and to understand the typical relationships among
the factors that affect livelihood. IFAD also uses a SLA in planning new development
activities and when assessing the effects of existing activities on the sustainability of
livelihoods (IFAD, 2011).
In both examples, the SL framework is used as an analytical tool to better
understand people, particularly the rural poor, by placing then at the centre of an
assessment of inter-related influences that affect how poor people create a livelihood for
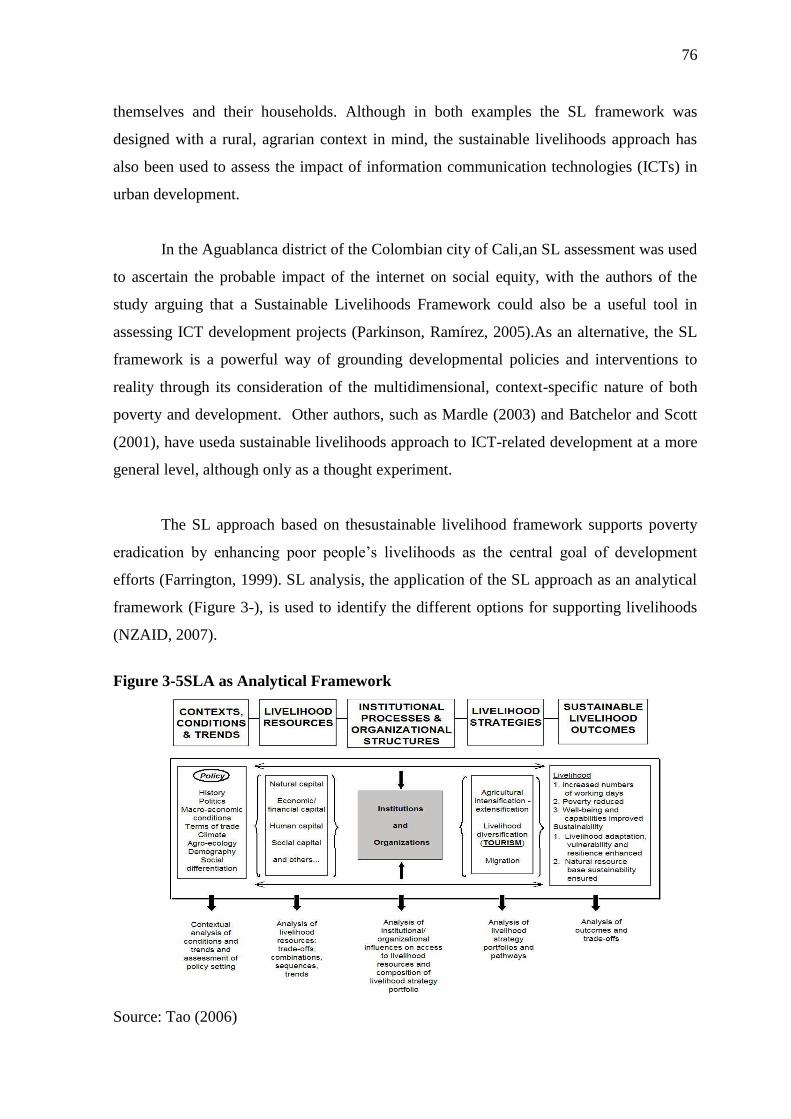
76
themselves and their households. Although in both examples the SL framework was
designed with a rural, agrarian context in mind, the sustainable livelihoods approach has
also been used to assess the impact of information communication technologies (ICTs) in
urban development.
In the Aguablanca district of the Colombian city of Cali,an SL assessment was used
to ascertain the probable impact of the internet on social equity, with the authors of the
study arguing that a Sustainable Livelihoods Framework could also be a useful tool in
assessing ICT development projects (Parkinson, Ramírez, 2005).As an alternative, the SL
framework is a powerful way of grounding developmental policies and interventions to
reality through its consideration of the multidimensional, context-specific nature of both
poverty and development. Other authors, such as Mardle (2003) and Batchelor and Scott
(2001), have useda sustainable livelihoods approach to ICT-related development at a more
general level, although only as a thought experiment.
The SL approach based on thesustainable livelihood framework supports poverty
eradication by enhancing poor people‘s livelihoods as the central goal of development
efforts (Farrington, 1999). SL analysis, the application of the SL approach as an analytical
framework (Figure 3-), is used to identify the different options for supporting livelihoods
(NZAID, 2007).
Figure 3-5SLA as Analytical Framework
Source: Tao (2006)
77
The SL approach provides a framework to help understand the interrelationships of
factors that affect poor people‘s livelihoods, which can be used to facilitate the planning
and implementation of more effective interventions. A study of related literature suggests
that centring development around people rather than the technical inputs results inbetter
opportunities for the achievement of sustainable impacts and significantly improves
poverty reduction. The SL approach:
Identifies existing assets and strategies available to poor women and men and
uses these as a starting point
Helps keep the focus on poor people and their varied livelihood assets,
strategies and outcomes (rather than resources and activities)
Recognises differences based on sex, gender, age, ethnicity, power and poverty
status
Builds on strengths as a means of addressing needs and constraints
Makes explicit the links between policy and institutional issues on the one hand
and micro-level realities on the other, and
Helps in understanding how individual, possibly sector-specific, development
programmes and projects fit into the wider livelihoods agenda and objectives
Using the sustainable framework, tourism and tourism development initiatives can
be examined in the cultural context of indigenous places and people. Tourism
developmentis reflected by dynamic economic, socio-cultural, political, ecological,
technological and institutional forces (Tao, 2006).
The factors that make up the vulnerability context also have a direct impact upon
the options that are open as members of the target community pursue beneficial livelihood
outcomes. It has to be noted that not all the factors listed in the framework are negative or
cause vulnerability (DFID, 1999). For example, policies of indigenous tourism
development may be beneficial to indigenous people. Sources of livelihood capital are
livelihood building blocks.
Scoones (1998, p.7) notes that: ―The ability to pursue different livelihood strategies
is dependent on the basic material and social, tangible and intangible assets that people
have in their possession‖.
78
An example of a combination of livelihood assets used in tourism activities can
help to identify the requirements of different kinds of tourism from individuals, household
and the community. Activities, for example song and dance, can reflect the strengths in
cultural capital among indigenous people, and lead to the successful design of appropriate
tourism programmes.
Using the framework, tourism can be situated as part of the overall livelihood of a
locale, thus making it possible to determine, when assessing the role that tourism plays in
the livelihood strategies of two indigenous communities, whether any linkage exists
between it and other sectors of the local economy and how tourism can be made to better
fit in with existing livelihoods. The links between inputs, outputs and flows of livelihood
resources, actors, and trends in the social environment help to identify whether tourism
might strengthen or weaken local livelihood assets, contribute to or undermine livelihood
outcomes and alter the vulnerability context (Scoones, 1998).
This is not to say that the SL framework is without its critics. One important
criticism has been that SL overemphasises the idea of applying self-help to poor
populations while considering the complexity of livelihoods.
This idea may under-emphasisethe importance of the macro economy and politics
(Toufique, 2001; Toner, 2002; O'Laughlin, 2004). The SL framework is only one way in
which to organise the complexity of issues surrounding poverty (Serrat, 2008). It must also
be made appropriate to local circumstances and priorities. Should the use of SL
frameworks leads researchers to overlook the bigger picture of the impact of development
on local situations, studies would result only in unreliable data for area development
(Parkinson, Ramírez, 2005).
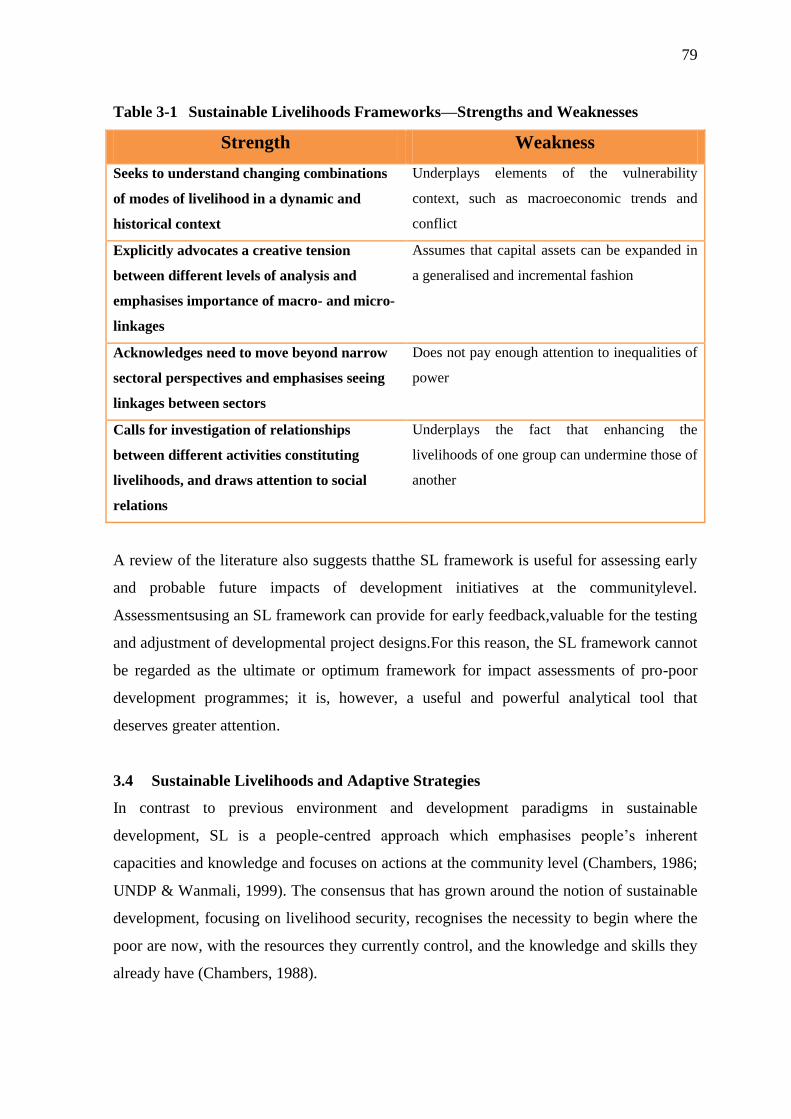
79
Table 3-1 Sustainable Livelihoods Frameworks—Strengths and Weaknesses
Strength Weakness
Seeks to understand changing combinations
of modes of livelihood in a dynamic and
historical context
Underplays elements of the vulnerability
context, such as macroeconomic trends and
conflict
Explicitly advocates a creative tension
between different levels of analysis and
emphasises importance of macro- and micro-
linkages
Assumes that capital assets can be expanded in
a generalised and incremental fashion
Acknowledges need to move beyond narrow
sectoral perspectives and emphasises seeing
linkages between sectors
Does not pay enough attention to inequalities of
power
Calls for investigation of relationships
between different activities constituting
livelihoods, and draws attention to social
relations
Underplays the fact that enhancing the
livelihoods of one group can undermine those of
another
A review of the literature also suggests thatthe SL framework is useful for assessing early
and probable future impacts of development initiatives at the communitylevel.
Assessmentsusing an SL framework can provide for early feedback,valuable for the testing
and adjustment of developmental project designs.For this reason, the SL framework cannot
be regarded as the ultimate or optimum framework for impact assessments of pro-poor
development programmes; it is, however, a useful and powerful analytical tool that
deserves greater attention.
3.4 Sustainable Livelihoods and Adaptive Strategies
In contrast to previous environment and development paradigms in sustainable
development, SL is a people-centred approach which emphasises people‘s inherent
capacities and knowledge and focuses on actions at the community level (Chambers, 1986;
UNDP & Wanmali, 1999). The consensus that has grown around the notion of sustainable
development, focusing on livelihood security, recognises the necessity to begin where the
poor are now, with the resources they currently control, and the knowledge and skills they
already have (Chambers, 1988).
80
―Livelihoods‖ is a more tangible concept than ―development‖; easier to discuss,
observe, describe and even quantify. As has been noted, Chambers and Conway (1992:7)
have argued that livelihood is sustainable only when it can cope with, and recover from,
stresses and shocks and maintain or enhance its capabilities and assets, while ensuring that
the natural resource base is not undermined.As such, adaptive strategies on the one hand
and participation and empowerment on the other form two major planks of the SL
approach.
A livelihood is a means of making a living. It encompasses people‘s capabilities,
assets, income and activities required to secure the necessities of life. A livelihood is
sustainable when it enables people to cope with and recover from shocks and stresses (such
as natural disasters and economic or social upheavals) and enhance their well-being and
that of future generations without undermining the natural environment or resource base.
Helmore and Singh (2001, p.3) argue that the key feature of the SL approach is the
recognition that livelihoods lie at the root of all human development and economic growth;
not just jobs per se, but the wide, infinitely diverse range of activities people engage in to
make their living (Helmore and Singh, 2001).
“Livelihoods are also dependent on entitlements, such as support of family or clan
members that can be called upon in an emergency. Everyone‟s livelihood is made up of
activities, assets, and entitlements, together with the short-term coping mechanisms and
long-term adaptive strategies that the person employs in times of crisis so that in
adjusting to hardship, loss and change, they can maintain a livelihood.”
The suitable application of knowledge, technology, financial services, and
especially government policy can make adaptive strategiesmore productive and more
sustainable. The SL approach inherently reveals the multi-sectoral character of real life, so
that development work is better able to address actual problems as they exist at the
village level. An SL approach can also integrate environmental, social and economic issues
into a holistic framework, providing an opportunity to promote cross-sectoral and cross-
thematic approach that should define research and development (Helmore and Singh, 2001;
UNDP and Wanmali, 1999).
81
The SL approach focuses on the ways in which local people find the means to meet
their basic needs and security through meaningful work, while at the same time minimising
the negative effect on the environment and addressing social justice (Walker, Mitchell and
Wismer, 2001).
3.5 The Impact of Pro-Poor Tourism on Livelihoods
The literature on tourism points to a wide range of impacts that tourism can have on the
poor, both positive and negative. It is therefore vital that these impacts are located within
the SL framework, as this can help improve understanding of PPT initiatives and hence
provide useful guidelines for future policy making.
3.5.1 Impact on Financial Capital
It is argued that PPT initiatives have enhanced access to financial capital in many ways.
First, small enterprises as well as micro entities relating to tourism can have better access
to financing (Renard, 2001; Williams, White and Spenceley, 2001; Nicanor, 2001; Mahony
and Van Zyl, 2001). Second, earners also gain access to credit (Poultney and Spenceley,
2001). And third, the collective income earned by community organisations eventually
becomes a source of investment funding.
Local earnings are the key measure of the financial injection into poor households.
Research by Poultney and Spenceley (2001) shows that at least 34 percent of local
earnings, including wages and payments for services and supplies, are re-spent at the
Wilderness Safari in Africa. By contrast, Saville shows that in the case of Nepal, earnings
are likely to be spent on imported goods, thus reducing the multiplier effect (Saville,
2001). Earnings from locally made crafts are a very important source of income for the
poor in most rural areas, especially in the Amazonian and Ucota enterprises (Williams,
White and Spenceley, 2001).
In most cases, regular earners are relatively skilled, educated and are able to speak
English. Production is often not just for those tourists who visit the area, but also for
wider national and export markets. For example, a craft enterprise in Penduka Namibia,
creates more local income for womenin the area than all the community tourism
enterprises in Namibia put together (Ashley, Roe and Goodwin, 2001). Poultney and
82
Spenceley (2001), Nicanor (2001), and Williams, White and Spenceley (2001) also note
that women form a high proportion of earners in such cases. The tourism literature also
shows the impact of financial gains received from rural crafts and horticulture made by
rural women (Berkes and Gardner,1997; Koeman,1995; Singh,1989; Timothy and
Wall,1997). Intervention may be necessary to prevent the emergence of negative
consequences for the poor, for example high competition (McBeth, 1996). In conclusion,
local support is indispensable for the development of sustainable tourism (Brohman, 1996).
Opportunities for local people will be enhanced if they can become involved in tourism as
entrepreneurs, through involvement in the ownership and operation of facilities.
3.5.2 Impact on Human Capital, Education, Skills and Health
PPT case studies note the positive impact on human capital in terms of enhancing skills
through tourism-related vocational training and the development of business and
organizational skills. Poor young students receive funding from local schools, either
through donations from local businesses (Braman, 2001; Poultney and Spenceley, 2001) or
from the expenditure of community income (Nicanor, 2001). In particular, most tourism
literature suggests that tourism increases opportunities for local women.
Wilkinson and Pratiwi (1995) state that women can be partially independent and
have more control over their lives because of tourism. Kinnaird and Hall (1994) note the
economic significance of tourism resulting from the high proportion of women employed
in the tourist industry in Cornwall. However, these female workers have relatively poor
conditions of employment and their skills levels remain low.Some researchers also report
improved access to healthcare, as private operators can provide emergency assistance in
terms of both transportation and funds. Examples of public health investment driven by
tourism include malaria control measures (Poultney and Spenceley, 2001) and the
provision of drinking water and toilets along trekking routes (Saville, 2001).
3.5.3 Impact on the Physical Environment and Infrastructure
One of the positive outcomes of PPT initiatives can be improvements in infrastructure,
with tourism bringing money into under-developed localities. The provision of
infrastructure, the construction of roads and the supply of electricity, water and sewage
83
disposal, together with the construction of hospitals, schools and shops, becomes necessary
when an area is developed for tourism purposes.
Mahony and Van Zyl (2001) note that at the Manyeleti Game reserve, road and
water access for local communities was improved, while Poultney and Spenceley (2001)
show that at the Wilderness Safari, the extension of water and electricity supplies to tourist
lodges also serves people in the community. However, noise, cleanliness and the provision
of adequate bathroom facilities are identified as specific problems (Nicanor, 2001). In
Thailand, several villages and health resorts have been created or improved for the
purposes of tourism (TAT, 1999). These improvements include the installation of a water
supply and sewerage system, paved paths and electricity, and the planting of trees.
Providing tourist roads may give farmers and other local people greater ease of access to
market centres. However, the growth of tourism is likely to benefit large landowners, who
see the value of their land increase due to tourism development potential. Ensuring that
community enterprises achieve adequate levels of equality thus remains a challenge.
3.5.4 Impact on social capital and community organizations
Most PPT literature reports that community institutions have been strengthened by PPT
projects. Tourism developments have enhanced cohesion and a sense of purpose.
However, the process of institutional development and strengthening is inevitably
complex. There are some negative impacts, such as increased tension over community
funds (Braman, 2001; Poultney and Spenceley, 2001; Mahony and Van Zyl, 2001),
inequitable power balances (Savillle, 2001), problems in the collective management of
resources and enterprises (Renard, 2001), and heavy reliance of community institutions on
external expertise (Braman, 2001; Mahony and Van Zyl, 2001).
The wider tourism literature reveals that the participation of local communities is a
big issue. On Boracay Island, Philippines, Nicholson (1997) notes that despite the
government‘s good intentions, tourism projects have failed due to a lack of local
participation. He concludes that tourism should be based on the ‗needs‘ of local people
and the ‗potential‘ of an area rather than the ‗desirability‘ of locations as perceived by
policy makers. Also on Boracay Island, Trousdale (1999) arguesfor the need for
governance to for the clear delegation of local, regional and national roles and the
84
incorporation of community input to limit the negative effects of tourism development,
while maximising benefits.The Philippines Department of Tourism, he argues, did not pay
attention to local residents or provide sufficient proactive consultation, leading to protests
when tourism plans were to be implemented. The empowerment of local communities is
thus an important step in ensuring that local communities maximise their benefits and have
some control over tourism-related matters. To achieve effective participation in tourism
planning, the local community needs to be empowered to decide what forms of tourism
programmes should be developed in their respective communities, and how the tourism
costs and benefits are to be shared among different stakeholders (Akama, 1996). Sha
(2000) found that people‘s attitudes and participation are related to community support for
tourism development in their area. For Teo and Huang (1995), full participation and
commitment leads to high quality tourism products and authenticity. Siegel (1995) argues
that consensus-building is a good way to increase participation because it identifies areas
of agreement and conflict in a community.
3.5.5 Impact on natural capital
The impact of PPT initiatives on the natural resources of the poor appears to have been
relatively small. In most of the literature, tourism is linked with good management of the
land, coast and other natural resources. Tourism has therefore provided incentives for
conservation activities, including lobbying against industries causing environmental
degradation (Braman,2001)
In conclusion, good planning and protection are essential if PPT projects are to
succeed. Planning and protection must encompass physical resources, ecological
resources, human-use values, and quality of life values. Control measures must be applied
to determine the carrying capacity of a particular destination. An SL framework can help
policy makers to ―gain insight into factors contributing to poverty by identifying groups of
poor people and their livelihood as well as ensure that important livelihood components
and constraints are not overlooked‖ (DFID). The framework can also ―emphasise issues of
vulnerability and the dimensions of sustainability which macroeconomic plans often fail to
integrate adequately‖. However, the drawback of the SL approach is that by only
providinga perspective on poverty and its causes, it may ignore other factors.
85
As a result, in order to effectively design a broad-based policy the SL approach needs to be
complemented by other approaches.
3.6 Tourism, Vulnerability and Livelihood Diversification
Vulnerability involves a combination of factors that determine the degree to which
someone‘s life and livelihood is put at risk by a discrete event in nature or in society
(Blaikie, Cannon, Davis and Wisner, 1994). Other authors have contrasted vulnerability
with 'capability'; the ability to protect one's community, home and family, and to re-
establish one's livelihood (Anderson and Woodrow, 1989). A DFID report (2000) states
that vulnerability can result from long-term trends, such as migration, or changes in the
natural resource base; recurring seasonal changes, such as prices, production or
employment opportunities; and short term shocks , such as illness, disease, natural disaster
or conflict. It may also refer to a measure of a person or group‘s exposure to the effects of
disaster or natural hazards, including the degree to which they can recover from the impact
of that event. Since such events damage livelihoods, vulnerable groups find that it is more
difficult to reconstruct their livelihoods following disaster or any abrupt structural change.
Addressing the issue of vulnerability is thus a very important challenge for ensuring
sustainable livelihoods among the poor.
3.6.1 The Linkage between Tourism and Vulnerability
Blaikie, Cannon, Davis, and Wisner (1994) argue that the causes of vulnerability are
economic, demographic, and political processes. PPT projects are political processes that
reflect the distribution of economic resources and power in a rural society, and which
affect directly the allocation and distribution of resources among different groups of people
in a given area. The implications of PPT in terms of vulnerability within a community are
twofold. On the one hand, tourism itself can act as a shock (i.e. an instigator of
vulnerability) through its impact on resources and income. With the intervention of
tourism, access to livelihoods and resources can become less secure, thus generating higher
levels of vulnerability and exacerbating poverty. Conversely, PPT can collectively provide
greater access and opportunities for the poor as a cushion against vulnerabilities. Focusing
on the first implication, it can be seen that given the aim of PPT to reduce poverty,
vulnerability must be taken into account. Although poverty and vulnerability are related,
they are not the same.
86
Anti-poverty projects like pro-poor projects are designed to raise incomes or
consumption, while anti-vulnerability projects aim to increase security and to reduce the
chances of hazards having a serious impact. Chambers, Pacey, and Thrupp(1989) argue
that there are trade-offs between poverty and vulnerability,in that poverty can be reduced
by investment but that the impact of these interventions may increase vulnerability.
Climate change has also recently become a focus in the issue of vulnerability. A recent
study in Belize, for example, highlights several areas of supply- and demand-based
economic vulnerability to climate change, including the risks to coastal land and
infrastructure, exposure to resource damages such as coral bleaching, and an associated
reduction in demand because of resource changes or risks to personal health and safety. A
preliminary assessment of Belize‘s tourism sector suggests that it is highly vulnerable to
the effects of climate change through both its exposure to climate impacts and its weak
capacity for adaptation. Adaptation measures that reflect these specific sources of
vulnerability should be considered in the light of the country‘s limited capacity to
moderate the harmful effects of climate change. Such measures include diversifying the
portfolio of tourism offerings to emphasise inland attractions, planning for coastal
development with greater caution, and considering the feasibility of artificial reefs as
underwater attractions to alleviate some of the existing pressures on Marine Protected
Areas (Richardson, 2007).
3.6.2 Pro-Poor Tourism, Poverty and Vulnerability
In his 2001 study, Nicanor (2001) notes that rural communities were making an
extraordinarily high level of income from tourism, and that jobs were being created within
local areas and thus helping to prevent migration to urban areas. Most communities which
were previously classed as being poor or very poor had moved up the scale to become
better off. Saville (2001) argues that although people may remain poor according to
international standards, improvements in livelihoods are achievable through PPT
initiatives. While previously households might have struggled to survive, PPT projects
may allow them to make more active choices about their self-development and their
communities, hence shielding them from vulnerability. Braman (2001) found the same
result in Ecuador, where a majority of the households studied, especially those containing
men who worked as tour guides, were able to move upwards from being poor to enjoying a
more stable economic condition. In South Africa, Poultney and Spenceley (2001) have
87
noted that dramatic improvements in household income, especially for female-headed
households, have resulted in greater overall household security.
3.6.3 Tourism and Livelihood Diversification
Livelihood diversification refers to ―attempts by individuals and households to find new
ways to raise incomes and reduce environmental risk, which differ by degree of choice and
the reversibility of the outcome‖(Hussein and Nelson, 1998:3). Ellis (1997) defines
livelihood diversification as ―the process by which rural families construct a diverse
portfolio of activities and social support capabilities in their struggle for survival and in
order to improve their standard of living‖. Livelihood diversification includes both on- and
off-farm activities undertaken to generate income additional to primary production
activities from various sources. This diversification can stem from gradual development
processes or be forced by vulnerability.
In Thailand, agriculture is the principle activity for almost every rural household.
However, it is not the only activity. Livelihood diversification strategies among the poor
in Thailand are broad and various, with tourism being among those included. Tourism may
thus help provide a community with opportunities with which to diversify. Hussein and
Nelson (1998) argue that income diversification in addition to primary production
activities is intended to offset risk and vulnerability. However, in the case of tourism the
outcome of livelihood diversification among the poor might not always be positive.
One of the main livelihood diversification strategies is migration, whereby people
migrate to areas perceived as offering greater opportunities or higher standards of living.
Not surprisingly, much of the literature states that tourism is a cause of migration (Singh,
1989; Siegel,1995; Berker et al, 1997; Nicholson, 1997). Reports show that skilled workers
migrate into an area and take on most of the high-ranking jobs (Singh,1989; Nicholson,
1997). Berker et al, (1997) note that migration and rapid growth have a significant impact
on the environment,transforming small villages to ―semi-urban‖ areas. Griffin and Borele
(1987) conclude that the best way to solve this problem is to cope with tourism growth and
make mass tourism less harmful. One challenge is therefore to promote PPT whilst
keeping migration (or other types of vulnerability) to the minimum.
88
Livelihood diversification via other non-agricultural activities is also very
important. Many of these activities pursued by rural people involve micro-enterprises
(Hussein and Nelson, 1997). Bryceson (1996) argues that rural non-agricultural
employment in sub-Saharan Africa is increasing and that the region is becoming less
agrarian. However, this trend is associated with falling incomes in general. In Thailand,
recent years have witnessed a growth in small- and medium-sized enterprises (SMEs);
PPTis thus likely to be a good avenue for the rural poor to integrate their craft and home-
based work into the tourism industry.
Gender issues also need to be examined when studying livelihood diversification.
Women can employ coping strategies that are not easily available to men (Laier, 1996).
Women dominate activities such as food processing and handicrafts, and in PPT initiatives,
women can sell food or handicrafts to tourists as a good way to earn extra income for rural
households.However, for some women their income diversification strategy is entry into
prostitution (Jiggins, 1986). The inequality of gender relations has led to many women
being sold as commodities through the practice of sex tourism, which is seen to be one of
the most important social problems in the Southeast Asian region (Hall, 1994). Pointing to
prostitution and the provision of sexual services in Thailand and the Philippines, Brydon
and Chant (1989) argue that women's status in Southeast Asia is not necessarily better than
in regions where their involvement in remunerated work is lower.
Looking at Northern Thailand, O'Malley (1988) has suggested that the northern
provinces are structurally disadvantaged within the Thai economy, and that the absence of
alternative income sourcescreates a dependency upon a continuation of the sex industry.
The economically marginal rural areas of the northeast and northern provinces of Thailand
have been the major source of child and female prostitutes, with many families and
villages economically dependent on remittances from sex workers (Wereld, 1979;
Phongpaichit, 1981, 1982). It is clear that entrenched poverty is the main driver behind sex
tourism. The rapid and uneven development of Thailand can force young women to
choose prostitution within tourism as a diversification strategy.It is thus imperative to
ensure better education for women, alongside fundamental changes within the tourism
industry itself.
89
These multiple linkages between PPT and other social and economic factors are crucial
challenges for the poor. The impact on livelihoods depends on the structure of initiatives
and other supporting policies.
3.7 Objectives of the Research under the SL Framework
Using the SL approach, this research attempts to address the impact of a PPT project on
various aspects of the livelihood of the poor. The aim is to address the question:
Have pro-poor tourism development initiatives improved the livelihood outcomes of
the rural poor in Thailand and if so, how, and to what extent?
Based on this key objective, the following chapters examine empirical and survey-based
data that answers the following three sub-questions:
1. What are the livelihood structures and adjustment strategies of the rural poor in
Thailand?
2. How has the PPT project contributed to livelihood diversification and how did
itimpact the social, personal, physical, human and financial assets of the rural
poor?
3. To what extent has PPT reduced the vulnerability of the rural poor?
3.7.1 Expected Outcomes
The expected outcome of this research is threefold:
1. To understand how tourism interventions have improved the livelihood
outcomes of the poor in Thailand.
2. To gain more understanding of the perceptions, values and priorities relating to
PPT among residents within the community.
3. To help identify strategies to enhance the livelihood impacts of tourism on the
poor.
These outcomes are expected to produce guidelines for the appropriate, effective
and more targetedfuture development of PPTstrategies in Thailand.
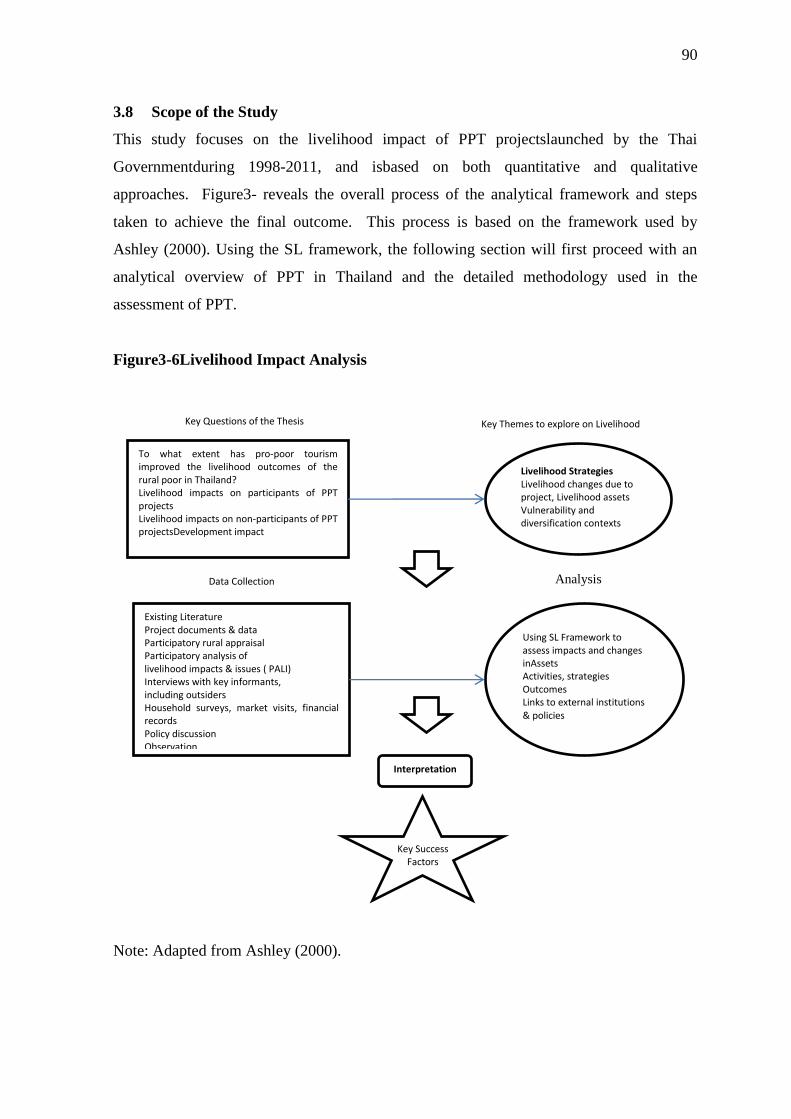
90
3.8 Scope of the Study
This study focuses on the livelihood impact of PPT projectslaunched by the Thai
Governmentduring 1998-2011, and isbased on both quantitative and qualitative
approaches. Figure3- reveals the overall process of the analytical framework and steps
taken to achieve the final outcome. This process is based on the framework used by
Ashley (2000). Using the SL framework, the following section will first proceed with an
analytical overview of PPT in Thailand and the detailed methodology used in the
assessment of PPT.
Figure3-6Livelihood Impact Analysis
Note: Adapted from Ashley (2000).
Livelihood Strategies Livelihood changes due to project, Livelihood assets Vulnerability and diversification contexts
To what extent has pro-poor tourism improved the livelihood outcomes of the rural poor in Thailand? Livelihood impacts on participants of PPT projects Livelihood impacts on non-participants of PPT projectsDevelopment impact
Existing Literature Project documents & data Participatory rural appraisal Participatory analysis of livelihood impacts & issues ( PALI) Interviews with key informants, including outsiders Household surveys, market visits, financial records Policy discussion Observation
Using SL Framework to assess impacts and changes inAssets Activities, strategies Outcomes Links to external institutions & policies
Interpretation
Key Success Factors
Key Themes to explore on Livelihood
Data Collection
Key Questions of the Thesis
Analysis
91
CHAPTER 4
Pro-poor Tourism in Thailand and Project Selection
The previous chapter provided the framework for the analysisof the impact of PPT projects
on people‘s livelihoods,and remarked on a number of challenges to be considered when
assessing project outcome.This chapter will look more closely at PPT development in
Thailand, examining the location of the project under study and other relevant issues. The
end of the chapter will lay out the detailed methodology to proceed with the primary and
secondary data from which to draw conclusions on the impact of PPT, taking the selected
project as a case study, on the livelihoods of the poor in Thailand.
4.1 Tourism Policy in Thailand
In 2001 the Thai government for the first time placed on the National Agenda the use of
tourism as a strategy to reduce poverty and promote sustainable development. This marked
a step-change in the thinking of the government, which had hitherto used the Agenda to
address other social problems, such as drug abuse, education and unemployment. The
Ninth National Economic and Social Development Plan noted that thanks to its abundant
and high quality tourist attractions, Thailand had the potential to be a world-class tourism
destination (TAT, 1995). The Thai government thus employed tourism strategically as one
of the main drivers of the country‘s economic growth. At the same time, it instituted
programmes for the preservation of natural resources through sustainable tourism. The
government also noted that tourism could help alleviate poverty by generating employment
and ensuring better income distribution for the poor. To this end, it encouraged greater co-
operation and participation in PPT development projects from all relevant parties, whether
government agencies, private businesses, NGOs or the general public. It was hoped that
such collaboration would lead to greater efficiency in the management of public sector
resources.
Moreover, the implementation of PPT development projects at central, regional and
local levels was felt to be consistent with the government‘s objective of delegating
administrative authority.The National Tourism Workshop held in Chiang Mai on 20-21
April 2001 saw the joint formation of a National Tourism Policy for the poor, along with
representatives from the TAT, the local governments of all provinces, NGOs and investors.
92
In the hope that tourism would become a tool to reduce the poverty that lay behind social
problems, new policies were launched in line with the new National Agenda, with the aim
of generating direct benefits for the poor in every part of the country.
While the Tenth National Economic and Social Development Plan(2007-2011)
does not explicitly mention PPT as a tool for stimulating growth and development in rural
areas, the concept of PPT remains firmly embedded as the central force behind the One
Tambon One Product (OTOP) scheme, mentioned briefly in Chapter 1. The OTOP
scheme, of which more later, aims at linking communities in networks to serve as the
foundation for developing goods and services to boost added value, and thus increase the
level of employment and income for people in local comminities.
4.2 Pro-poor Tourism in the Greater Mekong Sub-Region
The first pro-poor related project in Thailand was the Village-based Tourism Project,
officially established in 1998 to develop a tourism scheme to conserve local tradition and
simultaneously alleviate rural poverty in the Greater Mekong Sub-region (GMS),
comprising the six countries sharing the Mekong River: Thailand, the Lao PDR, Myanmar,
Cambodia, Vietnam and Yunnan Province in China. The sharing by these areas of common
borders and natural resources gave the impetus for strong co-operation. Tourism then
played an increasingly important role in the economic growth of GMS countries.
Table 4-1 shows that the tourism sector has also made significant contributions to
the national economies of GMS countries. For example, in the Lao PDR, tourism‘s share
of GDP averaged 7.5 percent during the period 2000-05, while in Thailand, the sector‘s
average share was 5.7 percent during 2000-04.
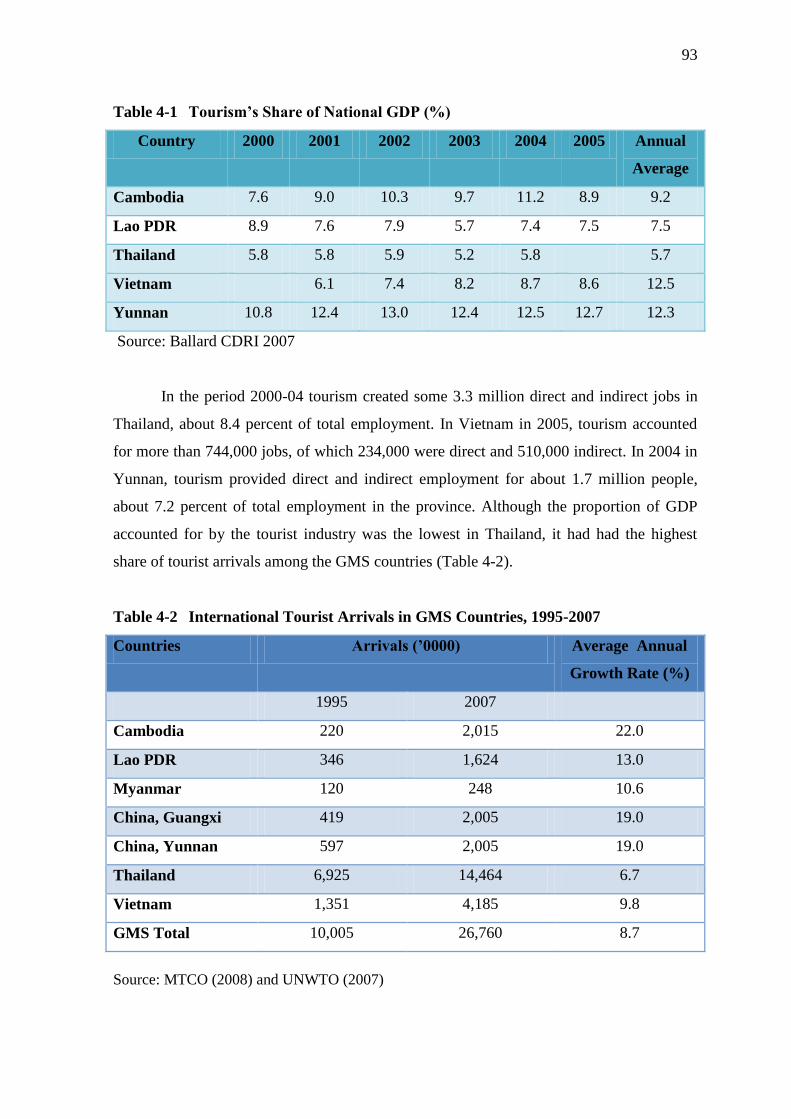
93
Table 4-1 Tourism‘s Share of National GDP (%)
Country 2000 2001 2002 2003 2004 2005 Annual
Average
Cambodia 7.6 9.0 10.3 9.7 11.2 8.9 9.2
Lao PDR 8.9 7.6 7.9 5.7 7.4 7.5 7.5
Thailand 5.8 5.8 5.9 5.2 5.8 5.7
Vietnam 6.1 7.4 8.2 8.7 8.6 12.5
Yunnan 10.8 12.4 13.0 12.4 12.5 12.7 12.3
Source: Ballard CDRI 2007
In the period 2000-04 tourism created some 3.3 million direct and indirect jobs in
Thailand, about 8.4 percent of total employment. In Vietnam in 2005, tourism accounted
for more than 744,000 jobs, of which 234,000 were direct and 510,000 indirect. In 2004 in
Yunnan, tourism provided direct and indirect employment for about 1.7 million people,
about 7.2 percent of total employment in the province. Although the proportion of GDP
accounted for by the tourist industry was the lowest in Thailand, it had had the highest
share of tourist arrivals among the GMS countries (Table 4-2).
Table 4-2 International Tourist Arrivals in GMS Countries, 1995-2007
Countries Arrivals (‘0000) Average Annual
Growth Rate (%)
1995 2007
Cambodia 220 2,015 22.0
Lao PDR 346 1,624 13.0
Myanmar 120 248 10.6
China, Guangxi 419 2,005 19.0
China, Yunnan 597 2,005 19.0
Thailand 6,925 14,464 6.7
Vietnam 1,351 4,185 9.8
GMS Total 10,005 26,760 8.7
Source: MTCO (2008) and UNWTO (2007)
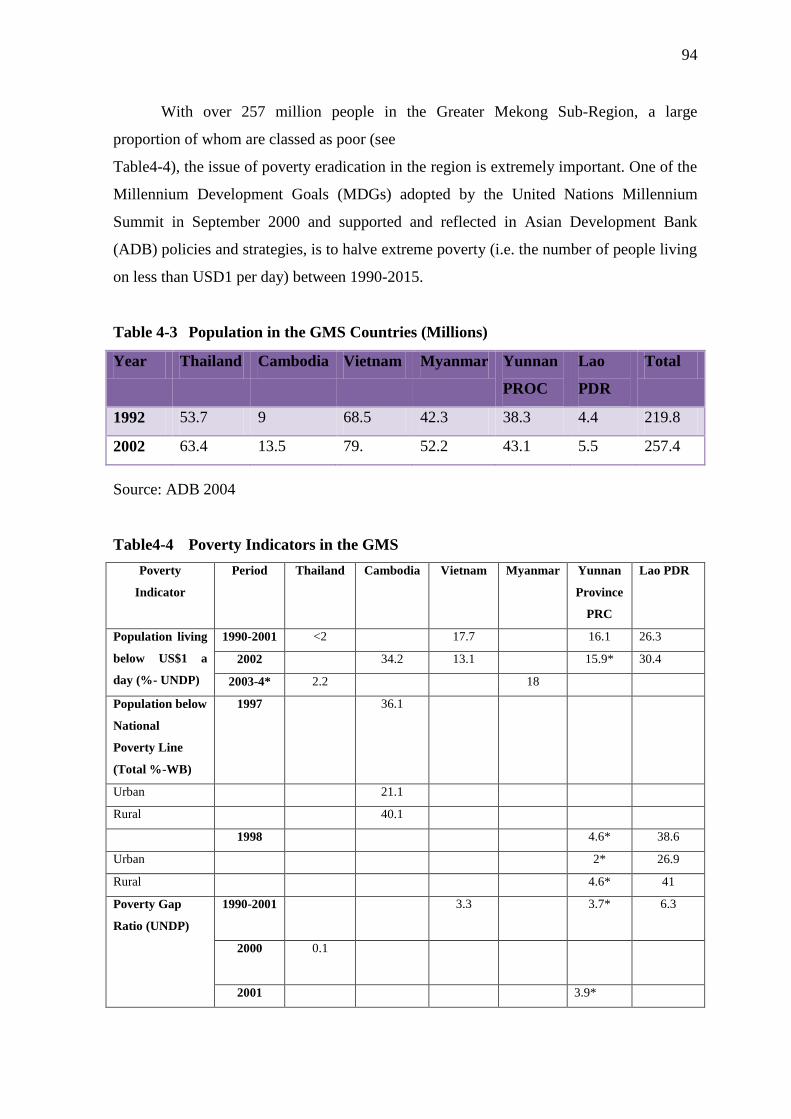
94
With over 257 million people in the Greater Mekong Sub-Region, a large
proportion of whom are classed as poor (see
Table4-4), the issue of poverty eradication in the region is extremely important. One of the
Millennium Development Goals (MDGs) adopted by the United Nations Millennium
Summit in September 2000 and supported and reflected in Asian Development Bank
(ADB) policies and strategies, is to halve extreme poverty (i.e. the number of people living
on less than USD1 per day) between 1990-2015.
Table 4-3 Population in the GMS Countries (Millions)
Year Thailand Cambodia Vietnam Myanmar Yunnan
PROC
Lao
PDR
Total
1992 53.7 9 68.5 42.3 38.3 4.4 219.8
2002 63.4 13.5 79. 52.2 43.1 5.5 257.4
Source: ADB 2004
Table4-4 Poverty Indicators in the GMS
Poverty
Indicator
Period Thailand Cambodia Vietnam Myanmar Yunnan
Province
PRC
Lao PDR
Population living
below US$1 a
day (%- UNDP)
1990-2001 <2 17.7 16.1 26.3
2002 34.2 13.1 15.9* 30.4
2003-4* 2.2 18
Population below
National
Poverty Line
(Total %-WB)
1997 36.1
Urban 21.1
Rural 40.1
1998 4.6* 38.6
Urban 2* 26.9
Rural 4.6* 41
Poverty Gap
Ratio (UNDP)
1990-2001
3.3 3.7* 6.3
2000
0.1
2001 3.9*
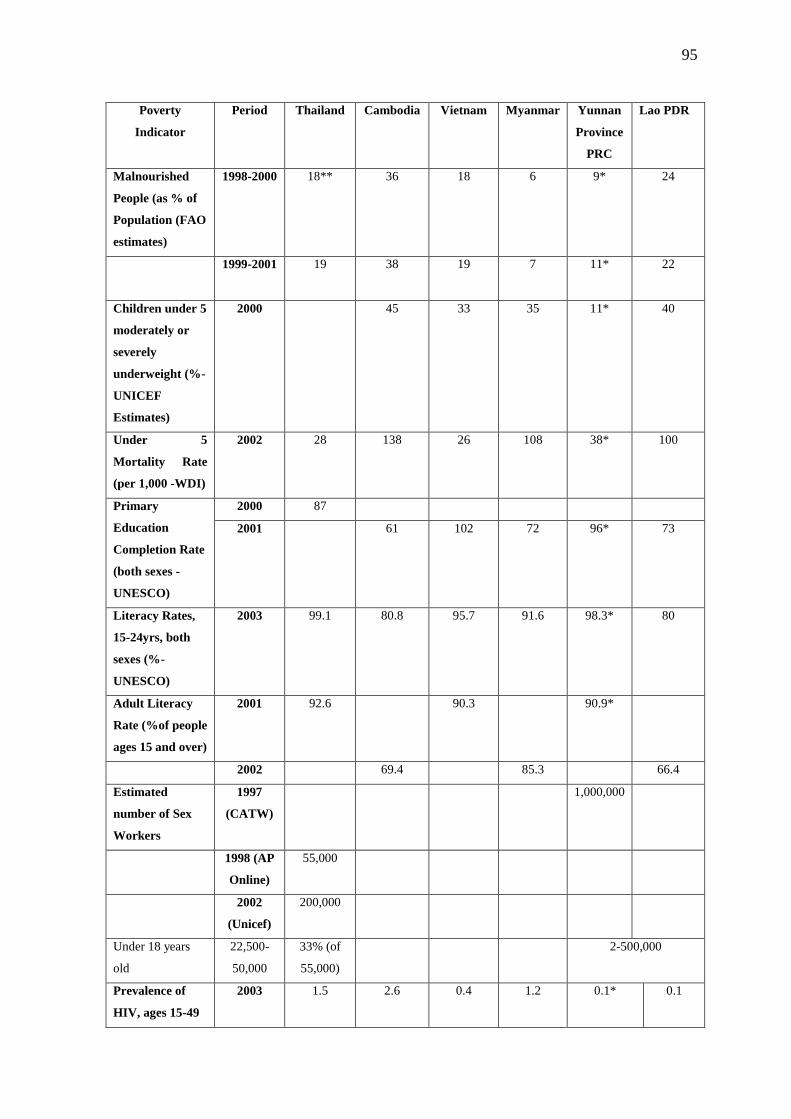
95
Poverty
Indicator
Period Thailand Cambodia Vietnam Myanmar Yunnan
Province
PRC
Lao PDR
Malnourished
People (as % of
Population (FAO
estimates)
1998-2000
18** 36 18 6 9* 24
1999-2001
19 38 19 7 11* 22
Children under 5
moderately or
severely
underweight (%-
UNICEF
Estimates)
2000
45 33 35 11* 40
Under 5
Mortality Rate
(per 1,000 -WDI)
2002 28 138 26 108 38* 100
Primary
Education
Completion Rate
(both sexes -
UNESCO)
2000 87
2001 61 102 72 96* 73
Literacy Rates,
15-24yrs, both
sexes (%-
UNESCO)
2003 99.1 80.8 95.7 91.6 98.3* 80
Adult Literacy
Rate (%of people
ages 15 and over)
2001 92.6 90.3 90.9*
2002 69.4 85.3 66.4
Estimated
number of Sex
Workers
1997
(CATW)
1,000,000
1998 (AP
Online)
55,000
2002
(Unicef)
200,000
Under 18 years
old
22,500-
50,000
33% (of
55,000)
2-500,000
Prevalence of
HIV, ages 15-49
2003 1.5 2.6 0.4 1.2 0.1* 0.1
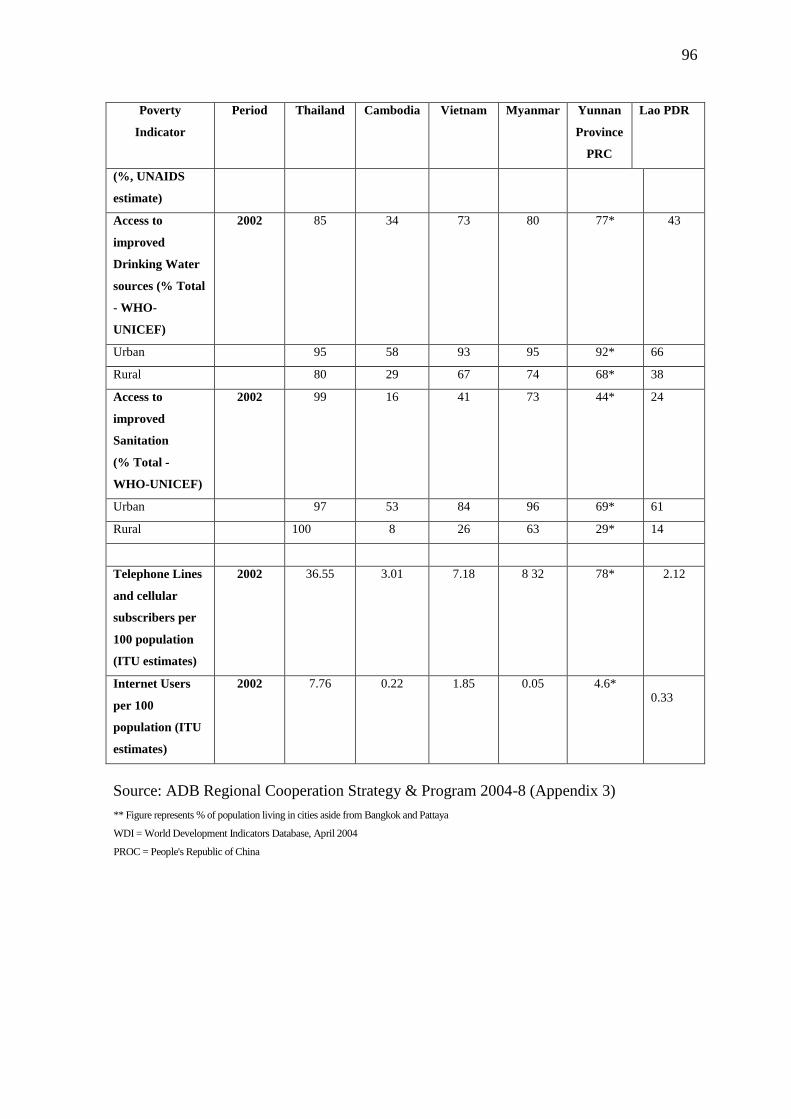
96
Poverty
Indicator
Period Thailand Cambodia Vietnam Myanmar Yunnan
Province
PRC
Lao PDR
(%, UNAIDS
estimate)
Access to
improved
Drinking Water
sources (% Total
- WHO-
UNICEF)
2002 85 34 73 80 77* 43
Urban 95 58 93 95 92* 66
Rural 80 29 67 74 68* 38
Access to
improved
Sanitation
(% Total -
WHO-UNICEF)
2002 99 16 41 73 44* 24
Urban 97 53 84 96 69* 61
Rural 100 8 26 63 29* 14
Telephone Lines
and cellular
subscribers per
100 population
(ITU estimates)
2002 36.55 3.01 7.18 8 32 78* 2.12
Internet Users
per 100
population (ITU
estimates)
2002 7.76 0.22 1.85 0.05 4.6* 0.33
Source: ADB Regional Cooperation Strategy & Program 2004-8 (Appendix 3)
** Figure represents % of population living in cities aside from Bangkok and Pattaya
WDI = World Development Indicators Database, April 2004
PROC = People's Republic of China
97
4.3 PPT in Northern Thailand
As the pro-poor projects for fieldwork are located in northern Thailand, what follows is a
review of tourism literature relating to this region. The north is renowned for its stunning
scenery of beautiful mountains and other natural resources, which has made it a popular
destination for eco-tourism, nature-based tourism and trekking. However, the poverty of
local communities increases the potential for tourism to pose a threat to local livelihoods.In
1990 about one million tourists (20 percent of all foreign tourists in Thailand that year)
visited nature tourism site(TAT, 1995), largely located in the northern provinces.
According to a report by the US Department of Agriculture (USDA), more than 90 percent
of Thailand's jungle tour clients are foreigners, mostly from France, Germany,
Australiaand the US(USDA, 1998). On the domestic side, a TAT survey of Thai tourists
showed that 60 percent preferred natural attractions over cultural, historical, archaeological
or entertainment facilities. Widener (1996) states that 60 percent of the 50 million domestic
tourism trips taken each year in Thailand have a 'nature-based' focus.
Much of the allure of the northern region, especially to foreign visitors, lies in its
ability to provide an ‗exotic‘ experience, both in terms of its natural attractions and its
ethnic groups. Hill trekking is a form of popular tourism involving a combination of
cultural, adventure and nature-based tourism which emerged in the early 1970s as a
culture-orientated activity (Cohen, 1989). By the mid-1980s, trekking involved about
100,000 participants annually (Dearden and Harron, 1994). More than 90 percent of
trekkers are estimated to be foreigners, a large proportion of those engaging in the activity
(Chudintra, 1993).While hill tribes are located throughout mainland Southeast Asia, it has
only been in Thailand that their territories have been made accessible without restriction to
outside visitors (Binkhorst and van der Duim, 1995). In northern Thailand, trekking has
been used as a vehicle for promoting tourism to the region and as an alternative to
traditional practices frowned upon by the central government, such as opium poppy
cultivation and slash-and-burn agriculture.
Eco community-based tourism in northern Thailand has generated some
employment and income. Studies reveal that tourism plays an important role in poverty
reduction because the jobs generated do not require skilled labour and are easily accessible
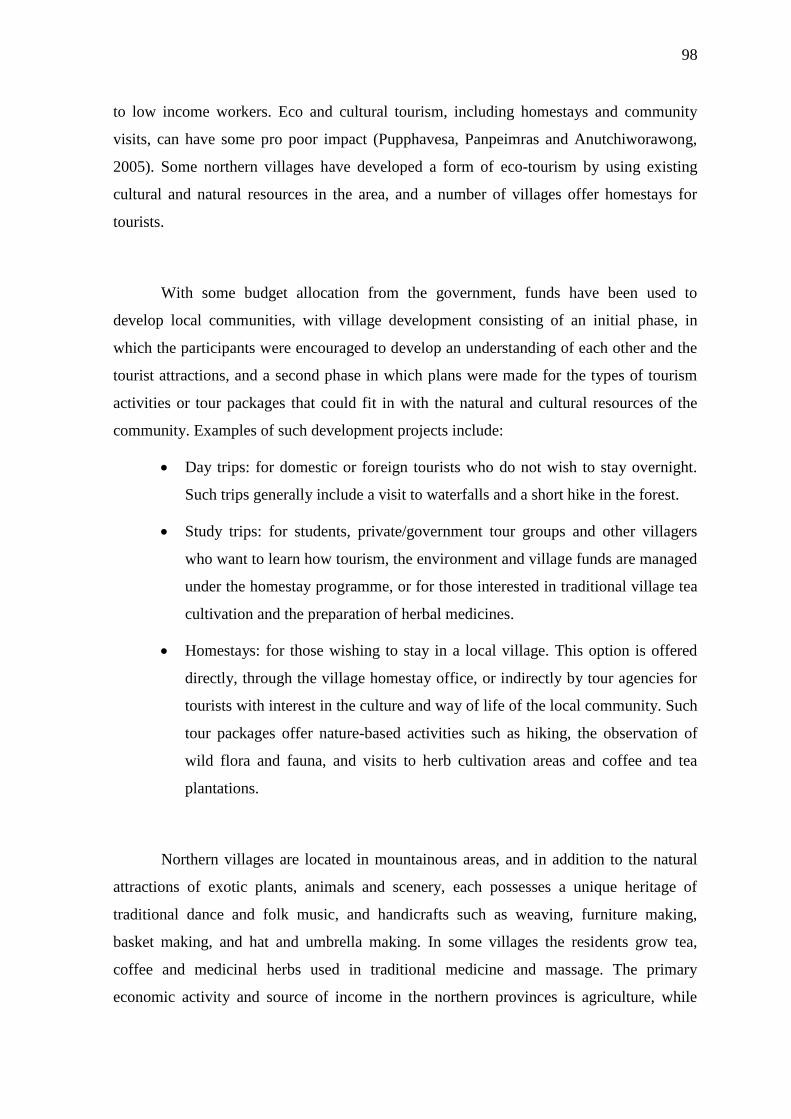
98
to low income workers. Eco and cultural tourism, including homestays and community
visits, can have some pro poor impact (Pupphavesa, Panpeimras and Anutchiworawong,
2005). Some northern villages have developed a form of eco-tourism by using existing
cultural and natural resources in the area, and a number of villages offer homestays for
tourists.
With some budget allocation from the government, funds have been used to
develop local communities, with village development consisting of an initial phase, in
which the participants were encouraged to develop an understanding of each other and the
tourist attractions, and a second phase in which plans were made for the types of tourism
activities or tour packages that could fit in with the natural and cultural resources of the
community. Examples of such development projects include:
Day trips: for domestic or foreign tourists who do not wish to stay overnight.
Such trips generally include a visit to waterfalls and a short hike in the forest.
Study trips: for students, private/government tour groups and other villagers
who want to learn how tourism, the environment and village funds are managed
under the homestay programme, or for those interested in traditional village tea
cultivation and the preparation of herbal medicines.
Homestays: for those wishing to stay in a local village. This option is offered
directly, through the village homestay office, or indirectly by tour agencies for
tourists with interest in the culture and way of life of the local community. Such
tour packages offer nature-based activities such as hiking, the observation of
wild flora and fauna, and visits to herb cultivation areas and coffee and tea
plantations.
Northern villages are located in mountainous areas, and in addition to the natural
attractions of exotic plants, animals and scenery, each possesses a unique heritage of
traditional dance and folk music, and handicrafts such as weaving, furniture making,
basket making, and hat and umbrella making. In some villages the residents grow tea,
coffee and medicinal herbs used in traditional medicine and massage. The primary
economic activity and source of income in the northern provinces is agriculture, while
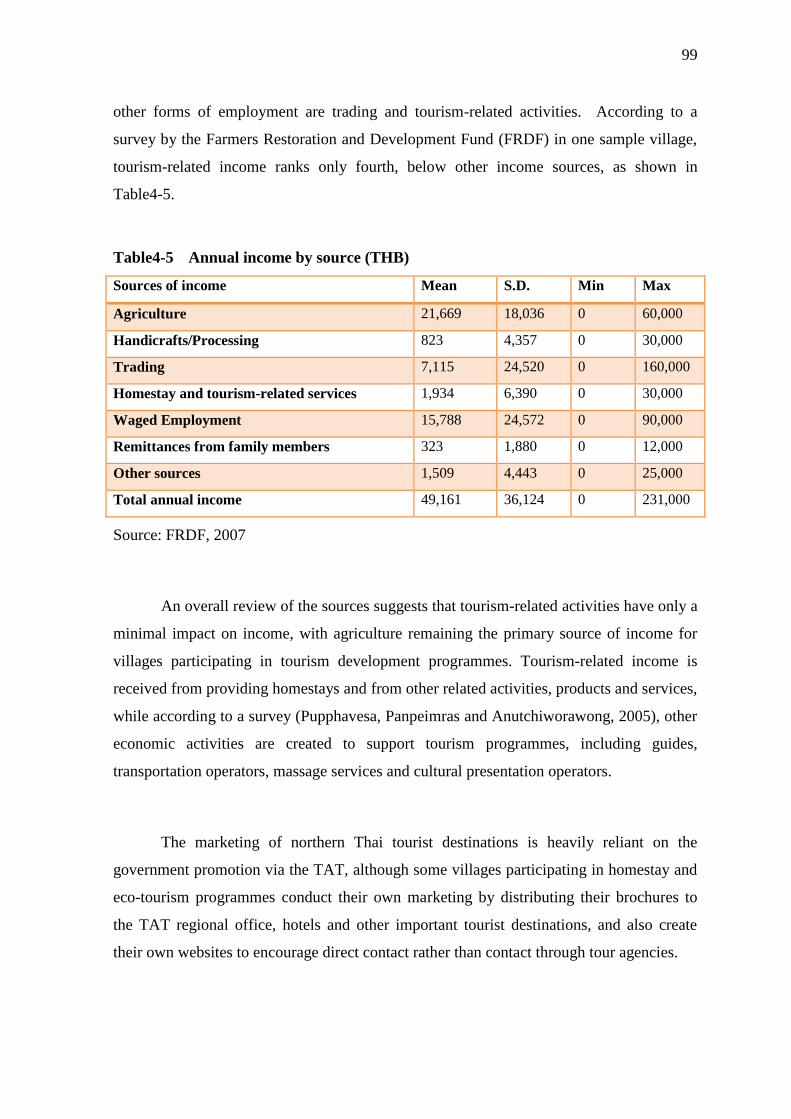
99
other forms of employment are trading and tourism-related activities. According to a
survey by the Farmers Restoration and Development Fund (FRDF) in one sample village,
tourism-related income ranks only fourth, below other income sources, as shown in
Table4-5.
Table4-5 Annual income by source (THB)
Sources of income Mean S.D. Min Max
Agriculture 21,669 18,036 0 60,000
Handicrafts/Processing 823 4,357 0 30,000
Trading 7,115 24,520 0 160,000
Homestay and tourism-related services 1,934 6,390 0 30,000
Waged Employment 15,788 24,572 0 90,000
Remittances from family members 323 1,880 0 12,000
Other sources 1,509 4,443 0 25,000
Total annual income 49,161 36,124 0 231,000
Source: FRDF, 2007
An overall review of the sources suggests that tourism-related activities have only a
minimal impact on income, with agriculture remaining the primary source of income for
villages participating in tourism development programmes. Tourism-related income is
received from providing homestays and from other related activities, products and services,
while according to a survey (Pupphavesa, Panpeimras and Anutchiworawong, 2005), other
economic activities are created to support tourism programmes, including guides,
transportation operators, massage services and cultural presentation operators.
The marketing of northern Thai tourist destinations is heavily reliant on the
government promotion via the TAT, although some villages participating in homestay and
eco-tourism programmes conduct their own marketing by distributing their brochures to
the TAT regional office, hotels and other important tourist destinations, and also create
their own websites to encourage direct contact rather than contact through tour agencies.
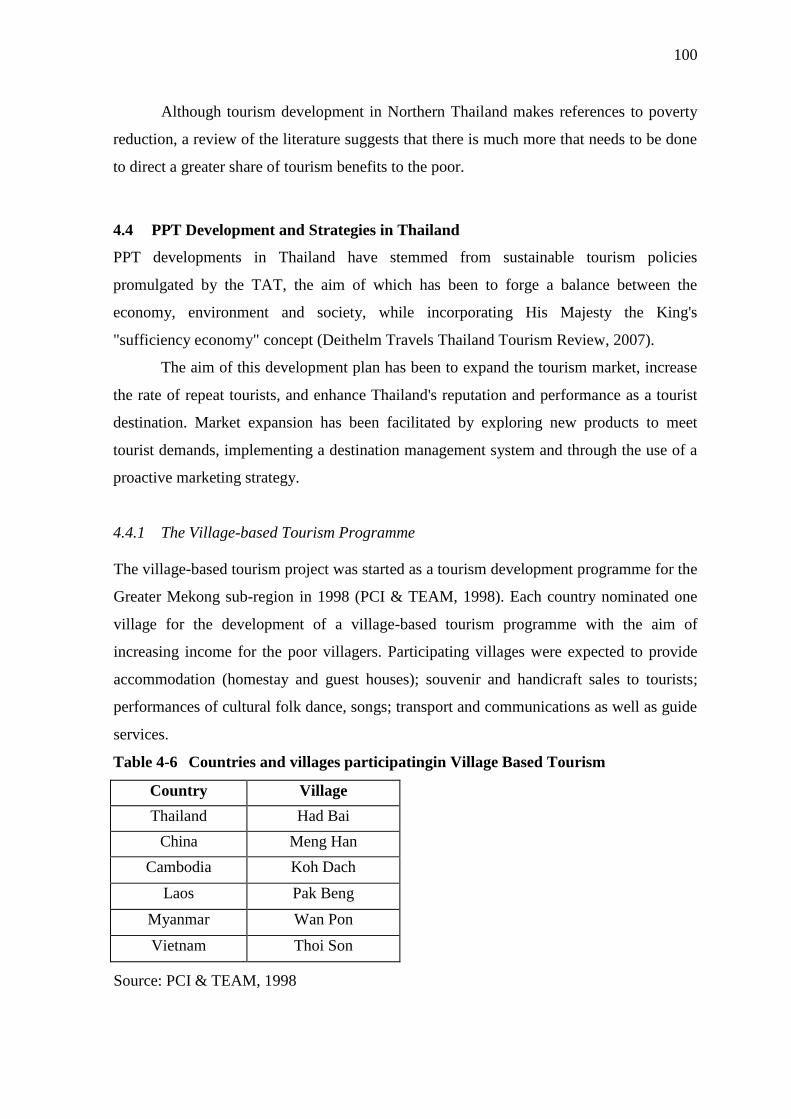
100
Although tourism development in Northern Thailand makes references to poverty
reduction, a review of the literature suggests that there is much more that needs to be done
to direct a greater share of tourism benefits to the poor.
4.4 PPT Development and Strategies in Thailand
PPT developments in Thailand have stemmed from sustainable tourism policies
promulgated by the TAT, the aim of which has been to forge a balance between the
economy, environment and society, while incorporating His Majesty the King's
"sufficiency economy" concept (Deithelm Travels Thailand Tourism Review, 2007).
The aim of this development plan has been to expand the tourism market, increase
the rate of repeat tourists, and enhance Thailand's reputation and performance as a tourist
destination. Market expansion has been facilitated by exploring new products to meet
tourist demands, implementing a destination management system and through the use of a
proactive marketing strategy.
4.4.1 The Village-based Tourism Programme
The village-based tourism project was started as a tourism development programme for the
Greater Mekong sub-region in 1998 (PCI & TEAM, 1998). Each country nominated one
village for the development of a village-based tourism programme with the aim of
increasing income for the poor villagers. Participating villages were expected to provide
accommodation (homestay and guest houses); souvenir and handicraft sales to tourists;
performances of cultural folk dance, songs; transport and communications as well as guide
services.
Table 4-6 Countries and villages participatingin Village Based Tourism
Country Village
Thailand Had Bai
China Meng Han
Cambodia Koh Dach
Laos Pak Beng
Myanmar Wan Pon
Vietnam Thoi Son
Source: PCI & TEAM, 1998
101
Sincethe village-based tourism programme has the same objectives as PPT, it can
be argued that in Thailand the government-initiated interventions and livelihood
development strategies that support tourism development, such as the Village Fund, OTOP
and the promotion of SMEs, may be considered to be PPT support programmes. Both PPT
and village-based tourism here share an explicit set of objectives, which aim to ease
poverty and generate economic opportunities for the poor.
The first objective of the village-based tourism scheme was to give priority to
community participation in planning and managing tourism.These programmes aimed to
develop capacity for ongoing planning and management and create community readiness
for, and acceptance of tourism. Each community has the opportunity to assessthe costs and
benefits of tourism and determining its future in relation to tourism as a form of economic
and community development. Community participation in planning and management
issues was also essential for the pro-poor objectives to be realised, and a series of
community participatory workshops to encourage local understanding of the tourism
industry, cultural products and the community management of tourism was thus provided,
with the aim of developing capacity for ongoing planning and management.
The second objective was to develop tourism products. Training in destination
marketing and product development for both local officials and residents was provided,
and villagers were encouraged to build on the unique aspects of their products and
community.
The third objective was to achieve equitable income distribution within the villages.
If tourism-generated income is to achieve sustainable development the introduction of
good and successful examples of income generation and distribution is essential. It
required capacity building as well as demonstration projects illustrating that equitable
distribution was possible and in fact helps ensure the successful development of a village
destination.
The last objective was to manage natural resources and environment in the project
areas. There are two dimensions to the protection and enhancement of the natural
environment: within the village itself,and for the entire ecosystem of the GMS.
102
4.4.2 Village Funds
Three years after the establishment of the village-based tourism scheme, in 2001, a new
PPTsupport project was launched. The objectives remained broadly similar, but the project
was launched by a different government under a different name, and reached a more
extensive geographical area. On 26 February 2001 the new prime minister, Thaksin
Shinawatra, announced to the National Assembly the establishment of Village and Urban
Revolving Funds.
A key plank of the new government‘s attempts to alleviate poverty at a grassroots
level, the Village Funds provided low-interest loans to spur enterprise and development in
71,364 villages nationwide. Each village was entitled to one million Baht to serve as a
revolving loan facility for long-term local investments and income creation in rural areas at
a community level. Committees consisting of village members were established to screen
project proposals, and the money was borrowed from the Government Savings Bank. By
August 2001, 28.47 billion Baht had been transferred to 28,475 villages, including Had
Bai, the village that forms the case study for this research, of which more below.
4.4.3 “One Tambon One Product” Programme
Launched in conjunction with the Village Fund in 2001, OTOP formed the second plank of
the government‘s overall PPT strategy. Originally named ‗One Village One Product‘, the
name was changed to ‗One Tambon One Product‘ in 2005 (‗tambon‘ being the name of the
administrative unit above village level but below the level of district).
The project was aimed at enabling each community to develop and market its own
local product or products based on traditional indigenous expertise and local know-how.
Each village, or tambon, was required to have its own unique product manufactured with
local raw materials and resources. The promotion of such products, which could be as
diverse as food, handicrafts or local tourist attractions, was intended to help solve the
problem of rural to urban migration, while the innovation and development of products in
each local area was expected to earn extra income for each community. Emphasis was
placed on transforming local resources into high quality products with distinguishable and
marketable features that could win national and international recognition for local
communities.
103
One Tambon One Product (OTOP) is a local entrepreneurship stimulus
programme designed byformer Thai prime minister Thaksin Shinawatra during his 2001-
2006 Thai Rak Thai government. The programme aimed to support locally made and
marketed products of each Thai tambon (sub-district). Drawing inspiration from Japan's
successfulOne Village One Product (OVOP) programme, OTOP encourages village
communities to improve local products' quality and marketing, selecting one superior
product from each tambon to receive formal branding as its "starred OTOP product". It
provides both a local and national stage to promote these products, which include a large
array of local items, including traditional handicrafts, cotton and silk garments, pottery,
fashion accessories, household items and food. After a military juntaoverthrew Thaksin's
government in 2006 following an election cancelled for irregularities, the OTOP
programme was cancelled. However, it was soon revived and rebranded.
Basic Principles of OTOP
There are three principles of OTOP:
1. Local yet Global: Goods and services based on local wisdom and culture achieve
international recognition.
2. Self-Reliance-Creativity: Realise the dream through the OTOP process by
initiating activities based on local potential.
3. Human Resource Development: People are encouraged to develop their versatility
and creative spirits to cope with challenges.
Objectives of the OTOP programme
The OTOP project is aimed at
1. The creation of jobs and the generation of income for local communities
2. The strengthening of the local community through the development of self-reliance
3. The strengthening of local wisdom
4. The strengthening of human resource development
5. The strengthening of creativity within communities through the development of
products drawing on their way of life and local culture
104
There are currently three main OTOP policies, as follows:
1. World-class standards: products manufactured as part of the OTOP scheme must
meet the determined quality standards, must undergo continual development, and
must accord with local culture. They must also be unique, as well as recognised in
the domestic and global markets.
2. Distinctive characteristics: product initiation and development must be pursued
through a brainstorming process in order to ensure the best possible outcome, with
the product itself incorporating and embedding local customs and the tradition of the
community or village.
3. Human resource and technology development: the personnel involved must
possess vision and other necessary competencies, such as planning, marketing skills
and a consumer-oriented mindset. These personnel must be selected from within the
local community for their knowledge and forward thinking, and must be willing to
exchange views and insights in order to help solve problems and develop the
products to be manufactured.
At the heart of the scheme was the concept of self-reliance, with local residents
encouraged to devote energy and creativity to using local resources to manufacture goods
for wider national and international markets. By producing high quality products and with
suitable marketing, villagers could earn their communities extra income. To do this,
villagers engage in mutual co-operation, working together to create products firmly rooted
in local wisdom and culture.
The scheme thus concerned matters of unity, trust and culture as much as material
wealth. The grassroots nature of the scheme was intended as a conduit for Thai culture,
tradition and pride to pass through to the next generation. At the same time, the focus on
natural resources was intended to improve the villagers‘ quality of life while maximizing
profits. By creating rural development jobs and income, it was hoped that villages
participating in the scheme would come to form the main foundation of the country and
Thai society.
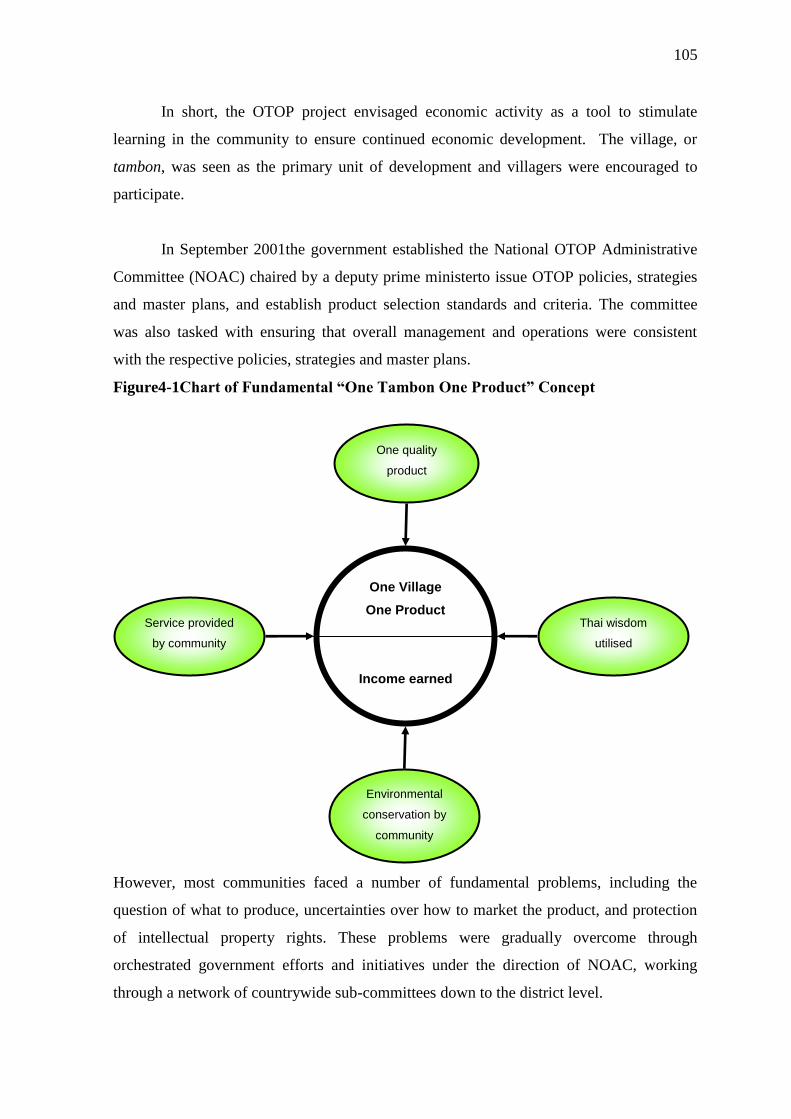
105
In short, the OTOP project envisaged economic activity as a tool to stimulate
learning in the community to ensure continued economic development. The village, or
tambon, was seen as the primary unit of development and villagers were encouraged to
participate.
In September 2001the government established the National OTOP Administrative
Committee (NOAC) chaired by a deputy prime ministerto issue OTOP policies, strategies
and master plans, and establish product selection standards and criteria. The committee
was also tasked with ensuring that overall management and operations were consistent
with the respective policies, strategies and master plans.
Figure4-1Chart of Fundamental ―One Tambon One Product‖ Concept
However, most communities faced a number of fundamental problems, including the
question of what to produce, uncertainties over how to market the product, and protection
of intellectual property rights. These problems were gradually overcome through
orchestrated government efforts and initiatives under the direction of NOAC, working
through a network of countrywide sub-committees down to the district level.
One Village
One Product
Income earned
by community
Service provided
by community
Thai wisdom
utilised
Environmental
conservation by
community
One quality
product
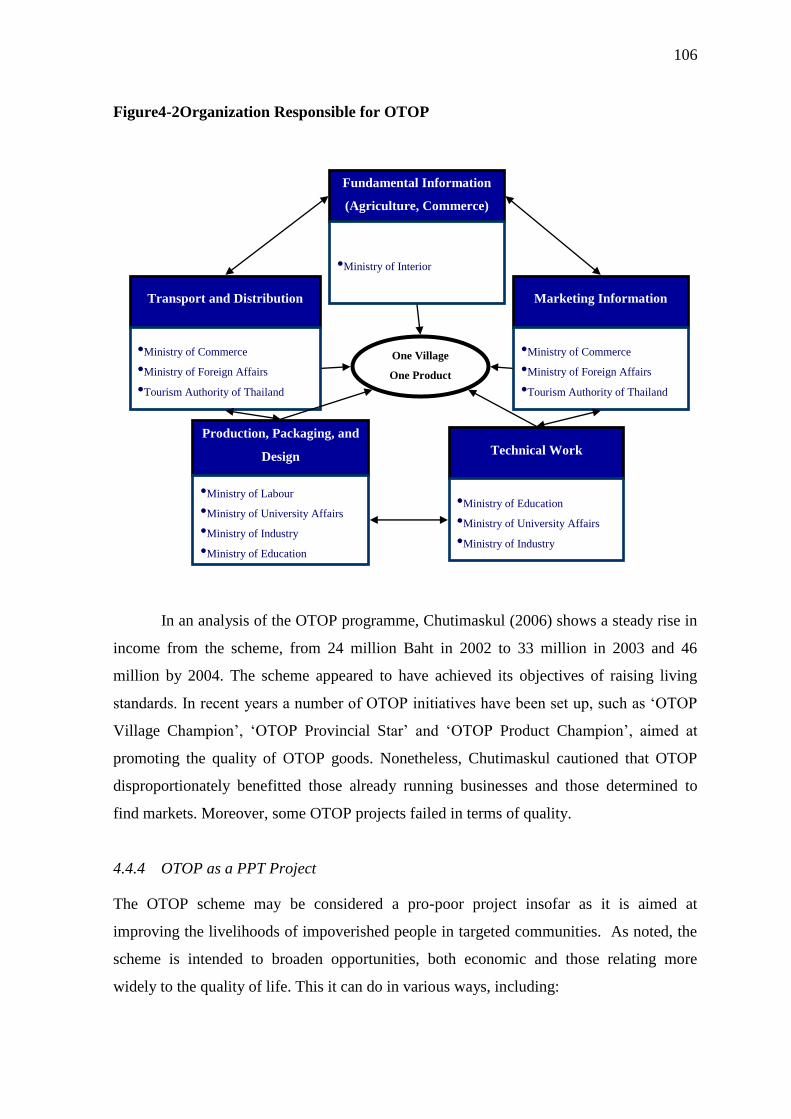
106
Figure4-2Organization Responsible for OTOP
In an analysis of the OTOP programme, Chutimaskul (2006) shows a steady rise in
income from the scheme, from 24 million Baht in 2002 to 33 million in 2003 and 46
million by 2004. The scheme appeared to have achieved its objectives of raising living
standards. In recent years a number of OTOP initiatives have been set up, such as ‗OTOP
Village Champion‘, ‗OTOP Provincial Star‘ and ‗OTOP Product Champion‘, aimed at
promoting the quality of OTOP goods. Nonetheless, Chutimaskul cautioned that OTOP
disproportionately benefitted those already running businesses and those determined to
find markets. Moreover, some OTOP projects failed in terms of quality.
4.4.4 OTOP as a PPT Project
The OTOP scheme may be considered a pro-poor project insofar as it is aimed at
improving the livelihoods of impoverished people in targeted communities. As noted, the
scheme is intended to broaden opportunities, both economic and those relating more
widely to the quality of life. This it can do in various ways, including:
One Village
One Product
Fundamental Information
(Agriculture, Commerce)
•Ministry of Interior
Marketing Information
•Ministry of Commerce
•Ministry of Foreign Affairs
•Tourism Authority of Thailand
Transport and Distribution
•Ministry of Commerce
•Ministry of Foreign Affairs
•Tourism Authority of Thailand
Production, Packaging, and
Design
•Ministry of Labour
•Ministry of University Affairs
•Ministry of Industry
•Ministry of Education
Technical Work
•Ministry of Education
•Ministry of University Affairs
•Ministry of Industry
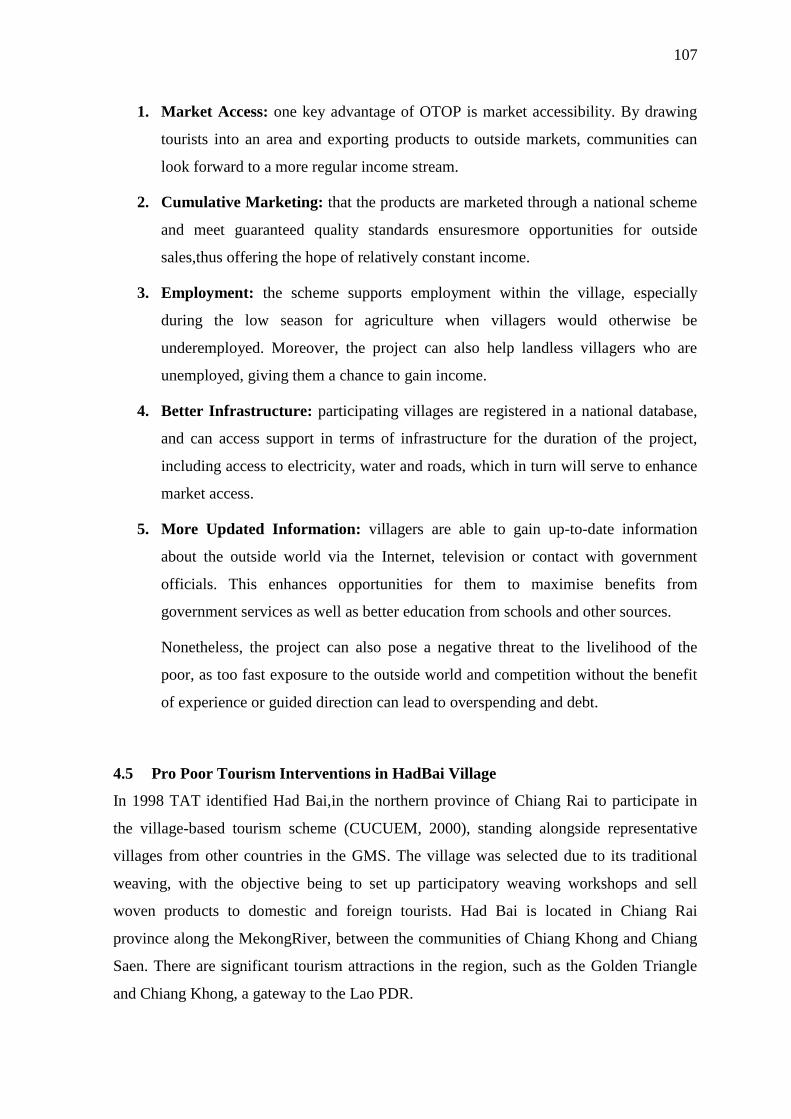
107
1. Market Access: one key advantage of OTOP is market accessibility. By drawing
tourists into an area and exporting products to outside markets, communities can
look forward to a more regular income stream.
2. Cumulative Marketing: that the products are marketed through a national scheme
and meet guaranteed quality standards ensuresmore opportunities for outside
sales,thus offering the hope of relatively constant income.
3. Employment: the scheme supports employment within the village, especially
during the low season for agriculture when villagers would otherwise be
underemployed. Moreover, the project can also help landless villagers who are
unemployed, giving them a chance to gain income.
4. Better Infrastructure: participating villages are registered in a national database,
and can access support in terms of infrastructure for the duration of the project,
including access to electricity, water and roads, which in turn will serve to enhance
market access.
5. More Updated Information: villagers are able to gain up-to-date information
about the outside world via the Internet, television or contact with government
officials. This enhances opportunities for them to maximise benefits from
government services as well as better education from schools and other sources.
Nonetheless, the project can also pose a negative threat to the livelihood of the
poor, as too fast exposure to the outside world and competition without the benefit
of experience or guided direction can lead to overspending and debt.
4.5 Pro Poor Tourism Interventions in HadBai Village
In 1998 TAT identified Had Bai,in the northern province of Chiang Rai to participate in
the village-based tourism scheme (CUCUEM, 2000), standing alongside representative
villages from other countries in the GMS. The village was selected due to its traditional
weaving, with the objective being to set up participatory weaving workshops and sell
woven products to domestic and foreign tourists. Had Bai is located in Chiang Rai
province along the MekongRiver, between the communities of Chiang Khong and Chiang
Saen. There are significant tourism attractions in the region, such as the Golden Triangle
and Chiang Khong, a gateway to the Lao PDR.
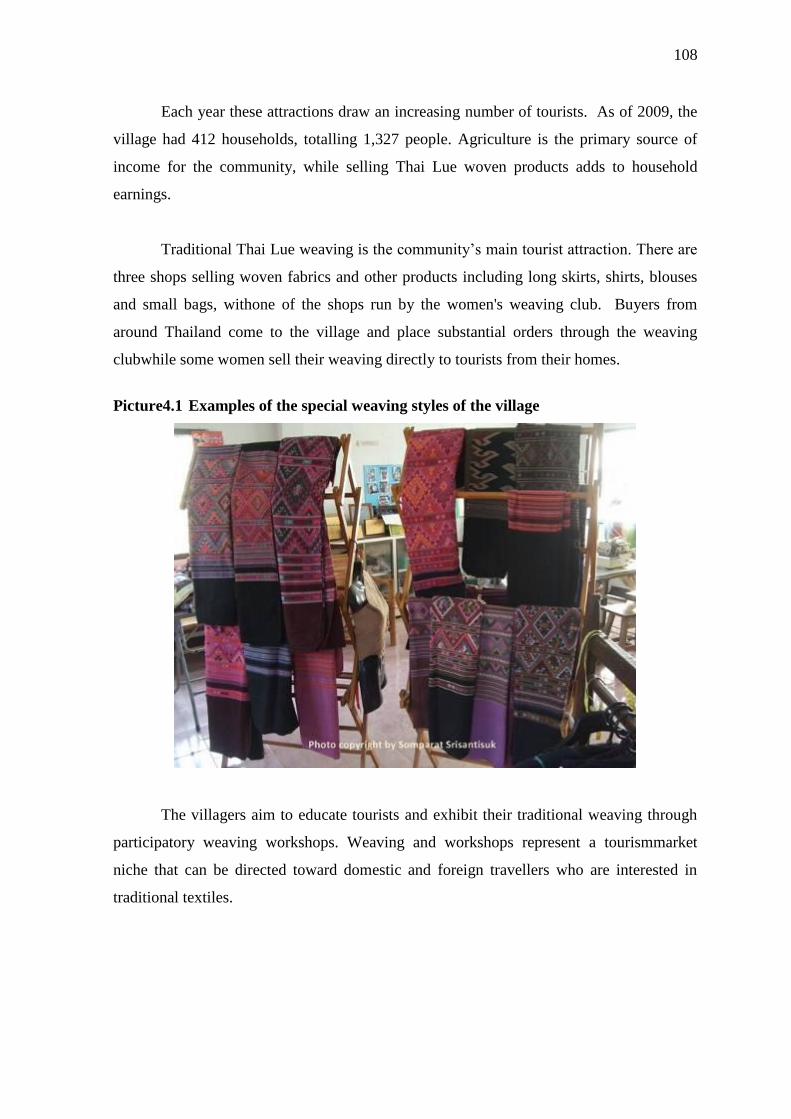
108
Each year these attractions draw an increasing number of tourists. As of 2009, the
village had 412 households, totalling 1,327 people. Agriculture is the primary source of
income for the community, while selling Thai Lue woven products adds to household
earnings.
Traditional Thai Lue weaving is the community‘s main tourist attraction. There are
three shops selling woven fabrics and other products including long skirts, shirts, blouses
and small bags, withone of the shops run by the women's weaving club. Buyers from
around Thailand come to the village and place substantial orders through the weaving
clubwhile some women sell their weaving directly to tourists from their homes.
Picture4.1 Examples of the special weaving styles of the village
The villagers aim to educate tourists and exhibit their traditional weaving through
participatory weaving workshops. Weaving and workshops represent a tourismmarket
niche that can be directed toward domestic and foreign travellers who are interested in
traditional textiles.
109
A CUCUEM evaluation of Had Bai‘s village-based tourism plan in 2000 found that:
1. Although the village itself has few tourist attractions, traditional weaving could be
used as a prime attraction to attract tourists. The fact that the project had received
strong community support, together with good infrastructure and environmental
management, boded well for future support for increased tourism activities. At the
same time, it was important to ensure that the community was ready to manage the
profits that could potentially accrue from tourism growth.
2. Community participation in the planning and management of tourism should be
increased.
3. Further capacity should be built up through education and training. This could
encompass community participation workshops to encourage local understanding
of the tourism industry, and short- and long-term training courses in the English
language to ensure basic conversational skills with potential visitors.
4. Improvements should be made to the village infrastructure and physical planning.
5. Efforts should be made to create a positive visitor experience.The community
needed to improve public facilities such as toilets, cafes and a refuse collection and
disposal system. The researchers recommended that the village leadership and the
local school should develop a programme to educate local children about refuse,
litter and the need to protect their environment. Annual assessments of the
environmental, cultural and social impacts of tourism must be carried out by the
local government and the community.
6. The various agencies responsible for the village should provide better co-operation.
Additional assistance in the implementation of local initiatives could be sourced
through the Department of Industrial Development or other relevant government
departments.
7. The marketing programme should be improved.Had Bai had been marketed
through a brochure produced by the TAT and local tour operators to market the
village as a location to purchase Thai Lue textiles. However, the brochure was
mainly focused on other attractions in Chiang Rai province, and the section on Had
Bai was brief and contained few pictures.
8. The management of natural resources and the environment should be improved.
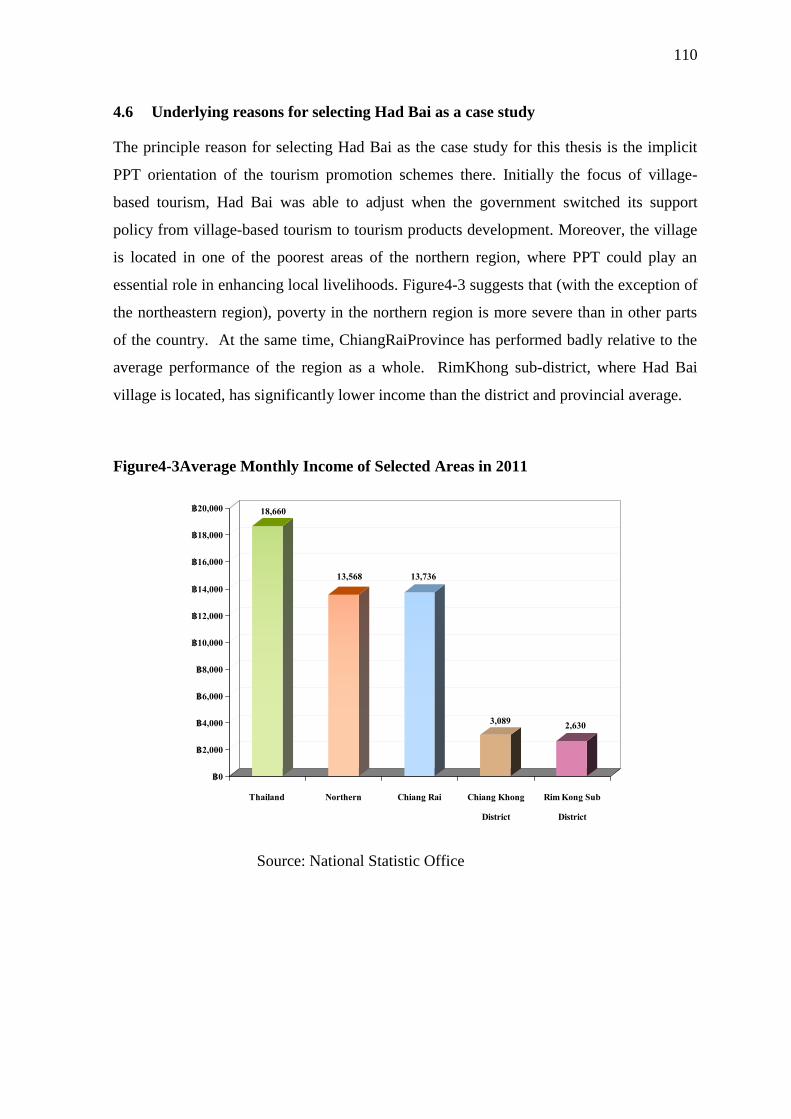
110
4.6 Underlying reasons for selecting Had Bai as a case study
The principle reason for selecting Had Bai as the case study for this thesis is the implicit
PPT orientation of the tourism promotion schemes there. Initially the focus of village-
based tourism, Had Bai was able to adjust when the government switched its support
policy from village-based tourism to tourism products development. Moreover, the village
is located in one of the poorest areas of the northern region, where PPT could play an
essential role in enhancing local livelihoods. Figure4-3 suggests that (with the exception of
the northeastern region), poverty in the northern region is more severe than in other parts
of the country. At the same time, ChiangRaiProvince has performed badly relative to the
average performance of the region as a whole. RimKhong sub-district, where Had Bai
village is located, has significantly lower income than the district and provincial average.
Figure4-3Average Monthly Income of Selected Areas in 2011
Source: National Statistic Office
18,660
13,568 13,736
3,089 2,630
฿0
฿2,000
฿4,000
฿6,000
฿8,000
฿10,000
฿12,000
฿14,000
฿16,000
฿18,000
฿20,000
Thailand Northern Chiang Rai Chiang Khong
District
Rim Kong Sub
District
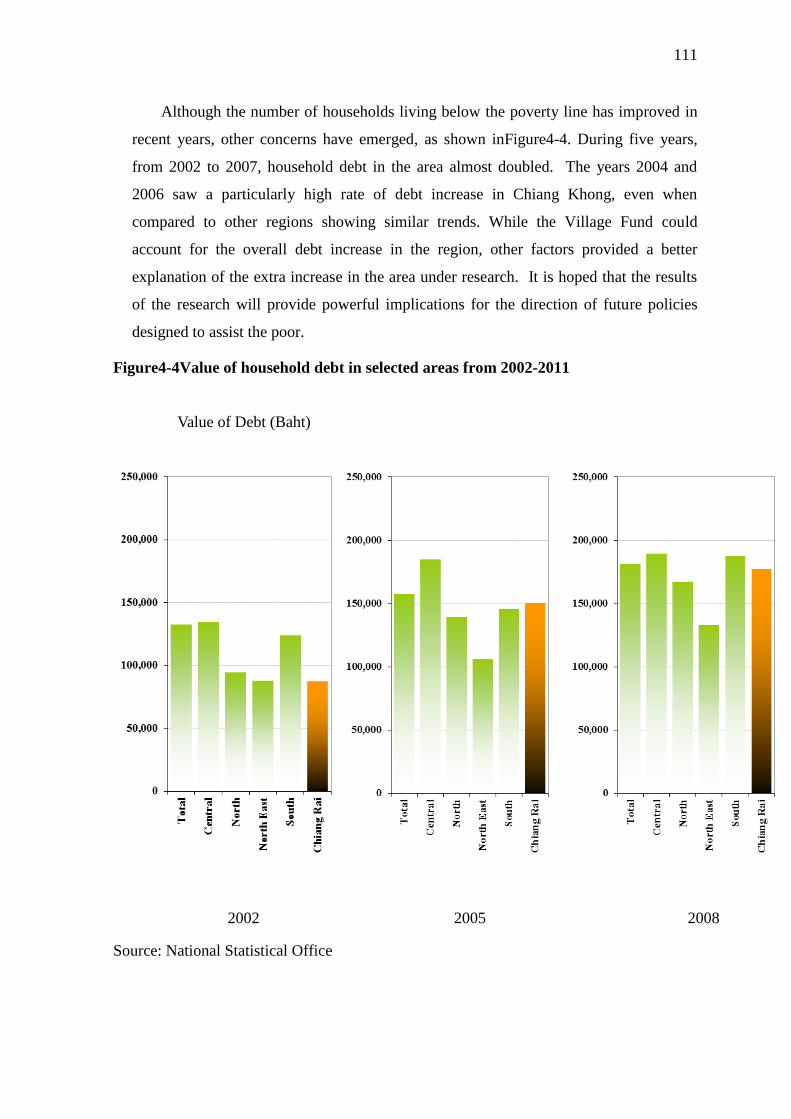
111
Although the number of households living below the poverty line has improved in
recent years, other concerns have emerged, as shown inFigure4-4. During five years,
from 2002 to 2007, household debt in the area almost doubled. The years 2004 and
2006 saw a particularly high rate of debt increase in Chiang Khong, even when
compared to other regions showing similar trends. While the Village Fund could
account for the overall debt increase in the region, other factors provided a better
explanation of the extra increase in the area under research. It is hoped that the results
of the research will provide powerful implications for the direction of future policies
designed to assist the poor.
Figure4-4Value of household debt in selected areas from 2002-2011
Source: National Statistical Office
Value of Debt (Baht)
2002 2005 2008 2011
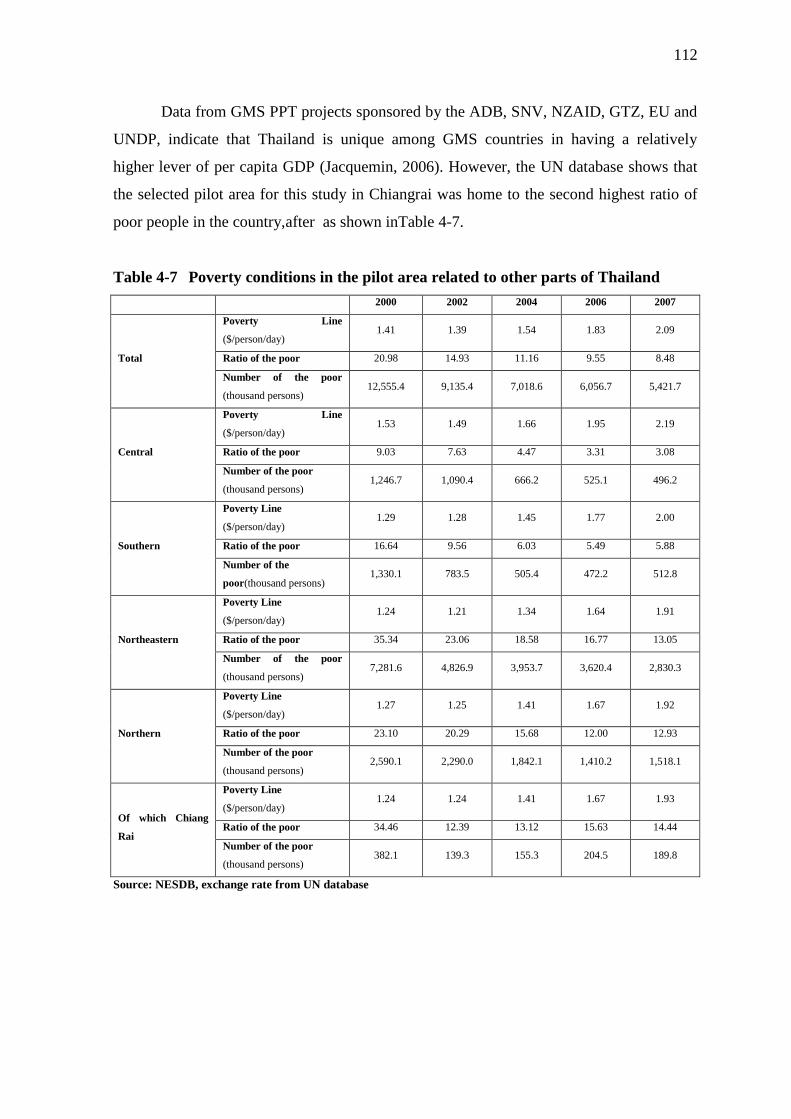
112
Data from GMS PPT projects sponsored by the ADB, SNV, NZAID, GTZ, EU and
UNDP, indicate that Thailand is unique among GMS countries in having a relatively
higher lever of per capita GDP (Jacquemin, 2006). However, the UN database shows that
the selected pilot area for this study in Chiangrai was home to the second highest ratio of
poor people in the country,after as shown inTable 4-7.
Table 4-7 Poverty conditions in the pilot area related to other parts of Thailand
2000 2002 2004 2006 2007
Total
Poverty Line
($/person/day) 1.41 1.39 1.54 1.83 2.09
Ratio of the poor 20.98 14.93 11.16 9.55 8.48
Number of the poor
(thousand persons) 12,555.4 9,135.4 7,018.6 6,056.7 5,421.7
Central
Poverty Line
($/person/day) 1.53 1.49 1.66 1.95 2.19
Ratio of the poor 9.03 7.63 4.47 3.31 3.08
Number of the poor
(thousand persons) 1,246.7 1,090.4 666.2 525.1 496.2
Southern
Poverty Line
($/person/day) 1.29 1.28 1.45 1.77 2.00
Ratio of the poor 16.64 9.56 6.03 5.49 5.88
Number of the
poor(thousand persons) 1,330.1 783.5 505.4 472.2 512.8
Northeastern
Poverty Line
($/person/day) 1.24 1.21 1.34 1.64 1.91
Ratio of the poor 35.34 23.06 18.58 16.77 13.05
Number of the poor
(thousand persons) 7,281.6 4,826.9 3,953.7 3,620.4 2,830.3
Northern
Poverty Line
($/person/day) 1.27 1.25 1.41 1.67 1.92
Ratio of the poor 23.10 20.29 15.68 12.00 12.93
Number of the poor
(thousand persons) 2,590.1 2,290.0 1,842.1 1,410.2 1,518.1
Of which Chiang
Rai
Poverty Line
($/person/day) 1.24 1.24 1.41 1.67 1.93
Ratio of the poor 34.46 12.39 13.12 15.63 14.44
Number of the poor
(thousand persons) 382.1 139.3 155.3 204.5 189.8
Source: NESDB, exchange rate from UN database
113
Moreover, an ADB studyof the development of pro-poor tourism in the GMS
revealed that current tourism in the sub-region fails to benefit many of those living below
the poverty line. Although there are already a number of PPT initiatives in the GMS, much
of the focus has been on single communities or destinations to host either day-or over-night
trips. Analyses of these initiatives reveal that many other factors must be integrated into
the programmes and that current tourism development initiativestill only plays a marginal
role in realising the goals of the GMS Cooperation framework. Jacquemin (2006)argued
that for tourism to make a much greater contribution towards poverty alleviation in the
GMS countries,a wider approach clearly needed to be adopted and that pro-poor projects
must develop the capacity to target the poor directly.
4.7 Why a Single Case Study
Most case studies use at least two sources of data: Multiple sources, even multiple
investigators and sites may be involved in the collection of interview, observation and
administrative documents and performing structured surveys. Even single period case
studies may cover a protracted period: Cases may be studied over a prolonged period or
written at a single point and pursued at future points in time by follow-up case studies.
Case studies which feature multiple or single cases, or even single cases viewed over a
prolonged period of time, or revisited after an interval of time may provide for greater
generalization (Gareth and Smircich, 1980)
Flyvbjerg(2006) explains in his research that there are five common
misunderstandings about case-study research: (1) Theoretical knowledge is more valuable
than practical knowledge; (2) One cannot generalize from a single case, therefore the
single case study cannot contribute to scientific development; (3) The case study is most
useful for generating hypotheses, while other methods are more suitable for hypotheses
testing and theory building; (4) The case study contains a bias toward verification; and (5)
It is often difficult to summarise specific case studies.
Some would say that we cannot generalise from a single case and social science is
about generalising. Others would argue that the case study may be well suited for pilot
studies but not for full-fledged research schemes. Others again would comment that the
case study is subjective, giving too much scope for the researcher‘s own interpretations.
114
Thus the validity of case studies would be wanting. It should be mentioned that the various
strategies of selection are not necessarily mutually exclusive. For example, a case can be at
once extreme, critical, and paradigmatic. The interpretation of such a case can provide a
unique wealth of information, because one obtains various perspectives and conclusions
according to whether it is viewed and interpreted as one or another type of case (Flyvbjerg,
2006). Ragin (1992) states that criticising single-case studies as inferior to multiple case
studies is misguided, since even single-case studies ‗are multiple in most research efforts
because ideas and evidence may be linked in many different ways. Geertz (1995) says
fieldwork involved in most in-depth case studies that ‗The Field‘ itself is a ‗powerful
disciplinary force: assertive, demanding, even coercive, it can be underestimated, but it
cannot be evaded.
With respect to intervention in social and political affairs, Abbott (1992, 79) has
observed that a social science expressed in terms of typical case narratives would provide
‗far better access for policy intervention than the present social science of variables.‘
However, that the revision of the five misunderstandings about case study research
described above, conventional wisdom about case-study research -- for instance that one
cannot generalise on the basis of a single case or that case studies are arbitrary and
subjective ( Stake,1995, Ragin and Becker,1992).
The author hopes that the selection of Had Bai as the village under study will
potentially provide valuable data for assessing the role of current tourism development
initiatives in reducing poverty. Findings from the study in this pilot project could also
provide valuable input into human resource development, infrastructure development,
sharing good practices and policy planning, which in turn canincrease support for PPT in
the future.
115
CHAPTER 5
Detailed Methodology
The previous section provided a review of existing literature in order to obtain an overall
view of approaches to PPT and sustainable livelihoods. Within the scope of this review
relevant issues were examined, including the impacts of PPT on rural livelihoods and
assets of the poor. This chapter will outline the research method used in studying the
effects of PPT livelihood strategies, and will focus on the research design used to present,
interpret and analyze findings from the study.
5.1 Analysis of Datausing the Sustainability Framework in this Study
The research combines a qualitative and a quantitative approach to analyze the impact of
the Village Base Tourism and OTOP, insofar as these relate to PPT, on the livelihood of
the poor in Had Bai. Due to the diverse and dynamic nature of the tourism industry,
involving as it does a wide range of stakeholders and actors, the two approaches are used
to complement each other and facilitate the triangulation of the comprehensive
interpretation of the data collected.
The primary sources of quantitative data were gathered using a self-made
questionnaire based on a sustainable livelihood assessment, while the primary sources of
qualitative data were gathered using guided interviews.Secondary sources of data, used to
validate the findings of the study, included a review of related literature from previous
studies, reports, presentations and internet sources.
The Quantitative Approach is based on the information obtained from the
statistical analysisof sample surveys and structured interviews. The data is quantifiable,
and is sampled from a probability basis whereby a greater number of samples will result in
more unbiased results and implications. Any information derived from this approach is
fully backed by statistics and realities. However, the information derived from such an
approach provides only systematic answers to the questions of interest, which are on
occasion difficult to explain, especially when the samples are diverse. Under such
circumstances it is difficult to draw conclusions without any supporting information based
on opinions or judgment.
116
By contrast, the Qualitative Approach provides information relating to judgments,
attitudes, preferences, priorities and perception about the subjects from the interactive
interviews (Carvalho and White, 1997). The fact that this approach generally brings up
broader information means that assessment is likely to be more difficult than with the
quantitative approach. However, when the two approaches are used in conjunction, the
conclusions can be mutually supportive.
The strength of the quantitative approach lies in the possibility of aggregating the
results and the ease with which it can present strong supporting figures. The information
from the approach is therefore more reliable and can be compared across samples or
groups of samples. More advanced statistical methods can also allow simulation of the
results using different assumptions or policy options. On the other hand, the approach may
be subject to sampling errors, in which inferences about a wider population are made on
the basis of results from a portion of that population, and non-sampling errors, in which the
sample selected may omit important portions of a population or in which some of the
questions are left unanswered, which could statistically and significantly change the results
and implications. Such errors can be mitigated against by increasing the sample size as
well as the sample coverage.
In comparison with the qualitative approach, the quantitative approach may be
more prone to non-sampling errors, as it is harder to control the replies given by the
respondents. At the same time, the qualitative approach tends to be more subject to
sampling errors due to the more selective nature of the samples.
The quantitative approach, with its focus on measurable data, may also miss unquantifiable
information. By seeming to disregard some information as unimportant the outcome may
be distorted, leading in turn to inappropriate policy implications. Additionally, the nature
of the approach, in which the household head is often the main respondent, may not
accurately reflect intra-household allocation.
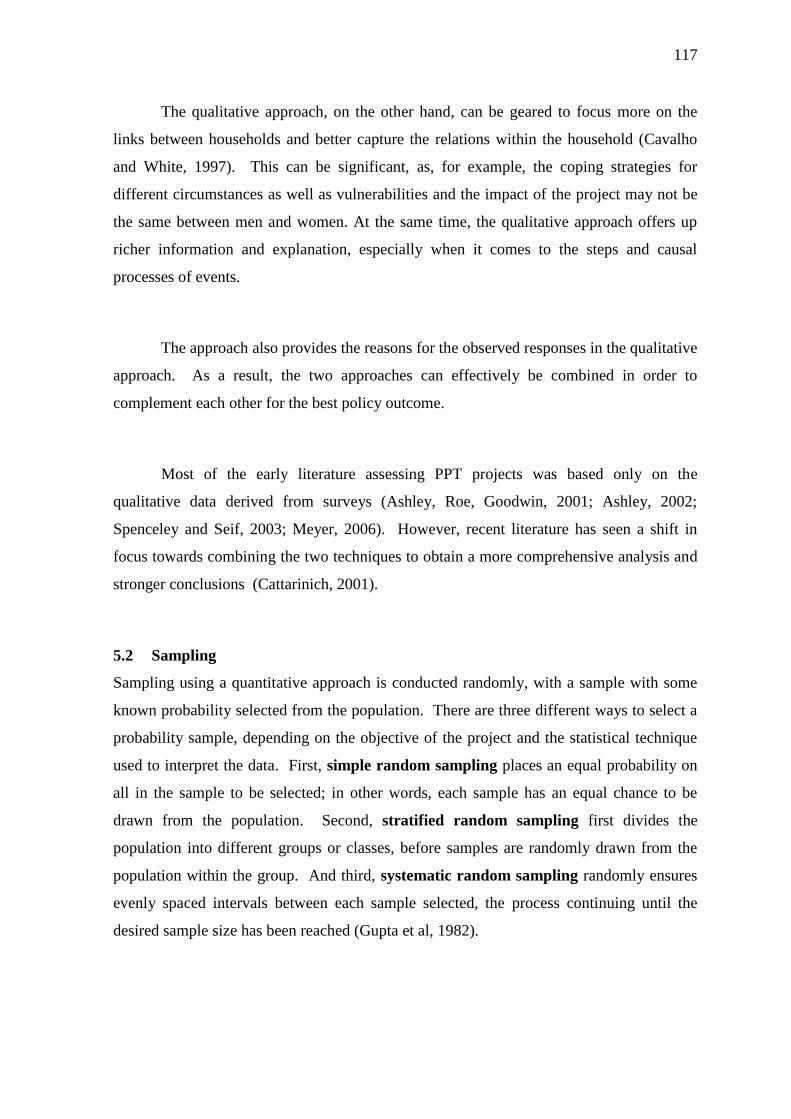
117
The qualitative approach, on the other hand, can be geared to focus more on the
links between households and better capture the relations within the household (Cavalho
and White, 1997). This can be significant, as, for example, the coping strategies for
different circumstances as well as vulnerabilities and the impact of the project may not be
the same between men and women. At the same time, the qualitative approach offers up
richer information and explanation, especially when it comes to the steps and causal
processes of events.
The approach also provides the reasons for the observed responses in the qualitative
approach. As a result, the two approaches can effectively be combined in order to
complement each other for the best policy outcome.
Most of the early literature assessing PPT projects was based only on the
qualitative data derived from surveys (Ashley, Roe, Goodwin, 2001; Ashley, 2002;
Spenceley and Seif, 2003; Meyer, 2006). However, recent literature has seen a shift in
focus towards combining the two techniques to obtain a more comprehensive analysis and
stronger conclusions (Cattarinich, 2001).
5.2 Sampling
Sampling using a quantitative approach is conducted randomly, with a sample with some
known probability selected from the population. There are three different ways to select a
probability sample, depending on the objective of the project and the statistical technique
used to interpret the data. First, simple random sampling places an equal probability on
all in the sample to be selected; in other words, each sample has an equal chance to be
drawn from the population. Second, stratified random sampling first divides the
population into different groups or classes, before samples are randomly drawn from the
population within the group. And third, systematic random sampling randomly ensures
evenly spaced intervals between each sample selected, the process continuing until the
desired sample size has been reached (Gupta et al, 1982).
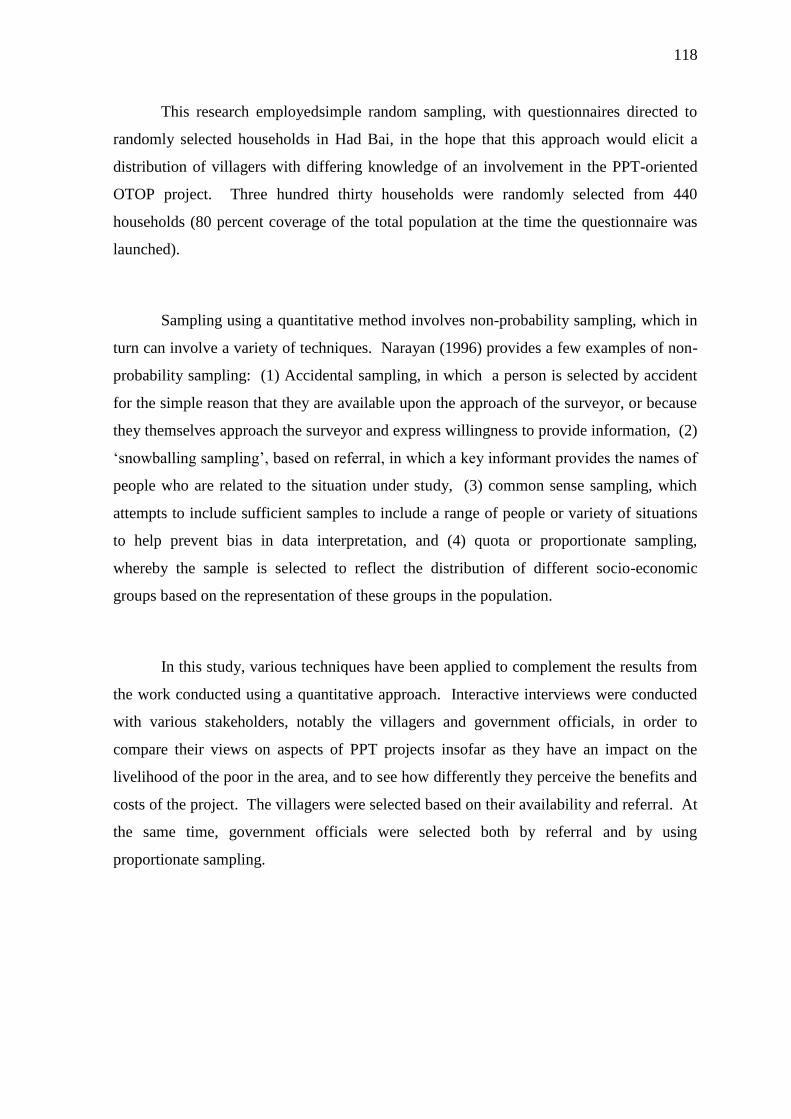
118
This research employedsimple random sampling, with questionnaires directed to
randomly selected households in Had Bai, in the hope that this approach would elicit a
distribution of villagers with differing knowledge of an involvement in the PPT-oriented
OTOP project. Three hundred thirty households were randomly selected from 440
households (80 percent coverage of the total population at the time the questionnaire was
launched).
Sampling using a quantitative method involves non-probability sampling, which in
turn can involve a variety of techniques. Narayan (1996) provides a few examples of non-
probability sampling: (1) Accidental sampling, in which a person is selected by accident
for the simple reason that they are available upon the approach of the surveyor, or because
they themselves approach the surveyor and express willingness to provide information, (2)
‗snowballing sampling‘, based on referral, in which a key informant provides the names of
people who are related to the situation under study, (3) common sense sampling, which
attempts to include sufficient samples to include a range of people or variety of situations
to help prevent bias in data interpretation, and (4) quota or proportionate sampling,
whereby the sample is selected to reflect the distribution of different socio-economic
groups based on the representation of these groups in the population.
In this study, various techniques have been applied to complement the results from
the work conducted using a quantitative approach. Interactive interviews were conducted
with various stakeholders, notably the villagers and government officials, in order to
compare their views on aspects of PPT projects insofar as they have an impact on the
livelihood of the poor in the area, and to see how differently they perceive the benefits and
costs of the project. The villagers were selected based on their availability and referral. At
the same time, government officials were selected both by referral and by using
proportionate sampling.

119
5.3 Data Collection Methods
Using a quantitative approach, pre-designed questionnaires with well-defined (as opposed
to open-ended) questions were given to sampled villagers. It was decided that government
officials would only be questioned using a qualitative approach, as the information needed
was in-depth and specific, rather than simply general demographic data. The answers from
each respondent were recorded and statistically processed and reported.
Such questionnaires contrast with those employed when using a qualitative
approach, which tend to be informal and open-ended, leaving open the possibility of
adding or dropping questions according to the situation and the previous answers given by
the respondents. Participants in the interview play an active role in providing comments
and opinions rather than just simply replying to the questions.
There are various methods of data collection when using a qualitative approach:
(1) Key informant interviews with people with specialist knowledge and experience of the
area of interest. The number of these informants usually varies between 10 and 25
(Carvalho and White, 1997). (2) Focus groups that stimulate discussion among
homogenous participants where the role of the interviewer is simply to facilitate the
interactive exchange of ideas in the group. (3) Community meetings that are open to all
participants to answer pre-designed questions. Interviewers often have to put in extra
effort to encourage the participation of women and marginalised groups. (4) Structured
direct observation requiring an individual or group of observers to observe and collect
information on the sample over a specified period. (5) Participant observation (PO),
whereby the researcher observes a community over a prolonged period by effectively
becoming a part of that community. This method requires more time than structured direct
observation, and is designed to focus more on the social and cultural behaviour of the
community rather than on discrete observation or the physical environment. Additionally,
when using this method it is important that the observer seeks common understanding with
people in the community in order to obtain their perspectives effectively (Kupta, 1993 and
Norton and Stephen, 1995).
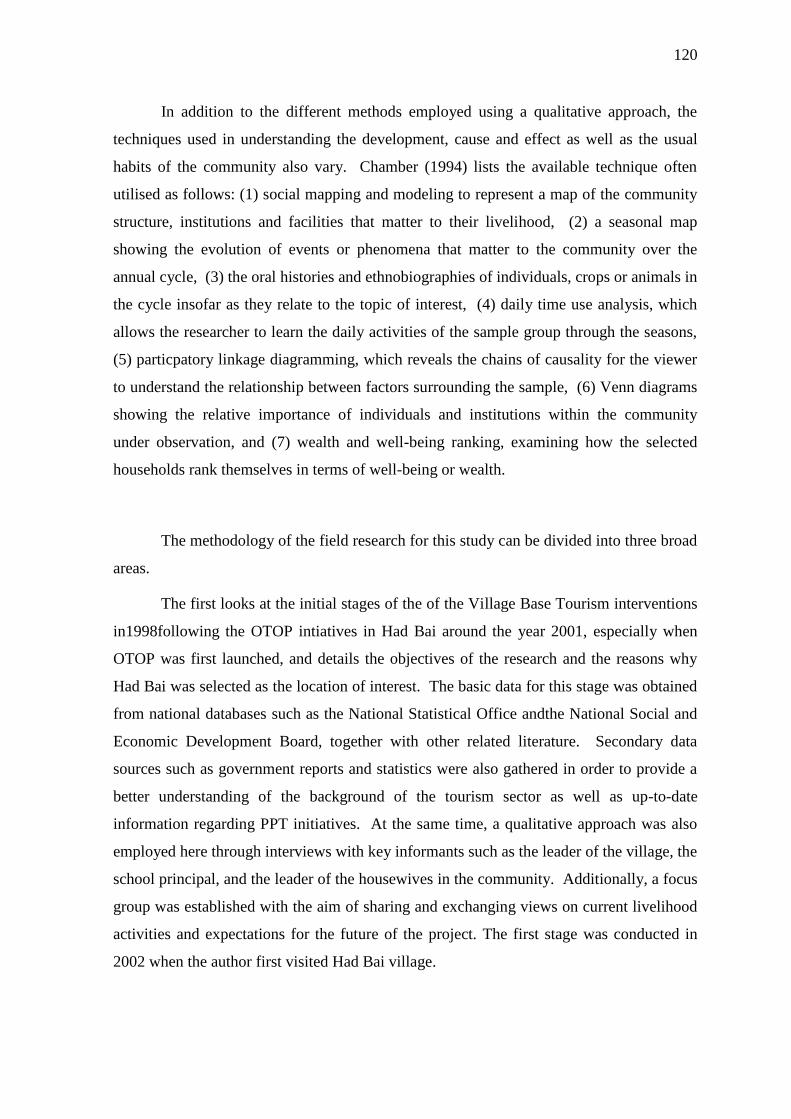
120
In addition to the different methods employed using a qualitative approach, the
techniques used in understanding the development, cause and effect as well as the usual
habits of the community also vary. Chamber (1994) lists the available technique often
utilised as follows: (1) social mapping and modeling to represent a map of the community
structure, institutions and facilities that matter to their livelihood, (2) a seasonal map
showing the evolution of events or phenomena that matter to the community over the
annual cycle, (3) the oral histories and ethnobiographies of individuals, crops or animals in
the cycle insofar as they relate to the topic of interest, (4) daily time use analysis, which
allows the researcher to learn the daily activities of the sample group through the seasons,
(5) particpatory linkage diagramming, which reveals the chains of causality for the viewer
to understand the relationship between factors surrounding the sample, (6) Venn diagrams
showing the relative importance of individuals and institutions within the community
under observation, and (7) wealth and well-being ranking, examining how the selected
households rank themselves in terms of well-being or wealth.
The methodology of the field research for this study can be divided into three broad
areas.
The first looks at the initial stages of the of the Village Base Tourism interventions
in1998following the OTOP intiatives in Had Bai around the year 2001, especially when
OTOP was first launched, and details the objectives of the research and the reasons why
Had Bai was selected as the location of interest. The basic data for this stage was obtained
from national databases such as the National Statistical Office andthe National Social and
Economic Development Board, together with other related literature. Secondary data
sources such as government reports and statistics were also gathered in order to provide a
better understanding of the background of the tourism sector as well as up-to-date
information regarding PPT initiatives. At the same time, a qualitative approach was also
employed here through interviews with key informants such as the leader of the village, the
school principal, and the leader of the housewives in the community. Additionally, a focus
group was established with the aim of sharing and exchanging views on current livelihood
activities and expectations for the future of the project. The first stage was conducted in
2002 when the author first visited Had Bai village.
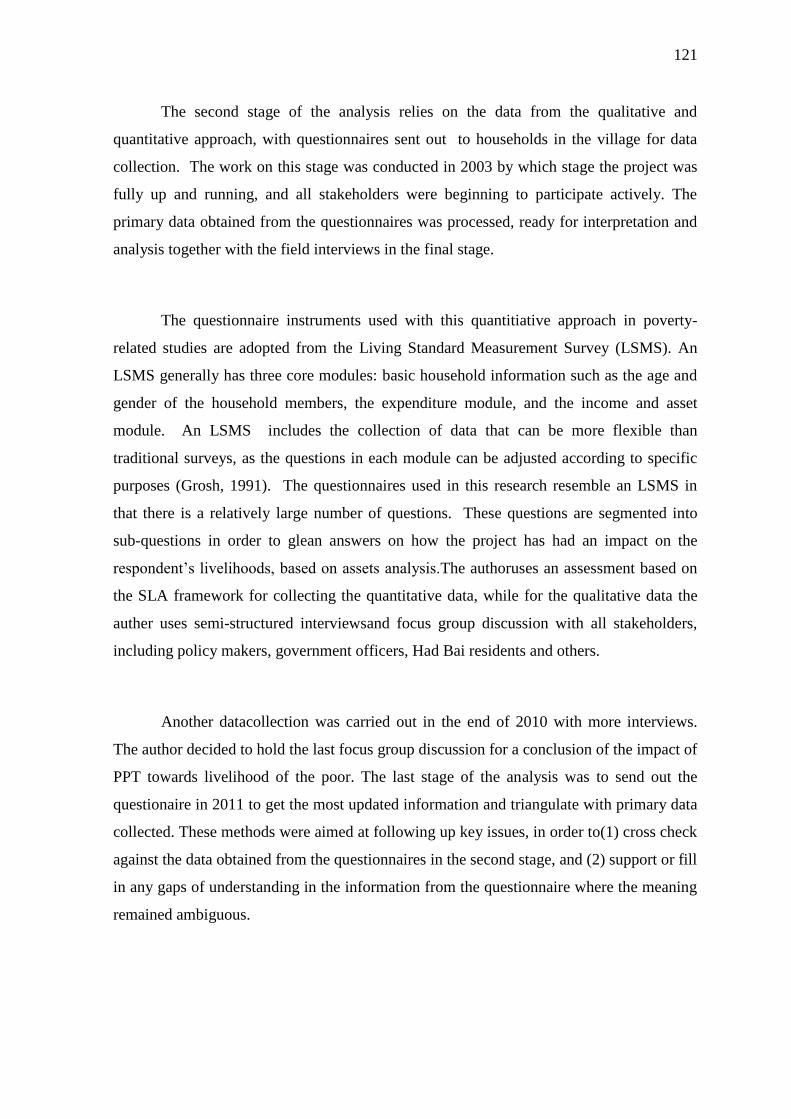
121
The second stage of the analysis relies on the data from the qualitative and
quantitative approach, with questionnaires sent out to households in the village for data
collection. The work on this stage was conducted in 2003 by which stage the project was
fully up and running, and all stakeholders were beginning to participate actively. The
primary data obtained from the questionnaires was processed, ready for interpretation and
analysis together with the field interviews in the final stage.
The questionnaire instruments used with this quantitiative approach in poverty-
related studies are adopted from the Living Standard Measurement Survey (LSMS). An
LSMS generally has three core modules: basic household information such as the age and
gender of the household members, the expenditure module, and the income and asset
module. An LSMS includes the collection of data that can be more flexible than
traditional surveys, as the questions in each module can be adjusted according to specific
purposes (Grosh, 1991). The questionnaires used in this research resemble an LSMS in
that there is a relatively large number of questions. These questions are segmented into
sub-questions in order to glean answers on how the project has had an impact on the
respondent‘s livelihoods, based on assets analysis.The authoruses an assessment based on
the SLA framework for collecting the quantitative data, while for the qualitative data the
auther uses semi-structured interviewsand focus group discussion with all stakeholders,
including policy makers, government officers, Had Bai residents and others.
Another datacollection was carried out in the end of 2010 with more interviews.
The author decided to hold the last focus group discussion for a conclusion of the impact of
PPT towards livelihood of the poor. The last stage of the analysis was to send out the
questionaire in 2011 to get the most updated information and triangulate with primary data
collected. These methods were aimed at following up key issues, in order to(1) cross check
against the data obtained from the questionnaires in the second stage, and (2) support or fill
in any gaps of understanding in the information from the questionnaire where the meaning
remained ambiguous.
122
A self-made questionnaire was used to collect the quantitative data. The
questionnaire was based on the Sustainable Livelihood Framework and designed to elicit
respondents‘ perceptions on the level of improvements in the five sustainable livelihood
assests resulting from the livelihood development of the PPT programmes. The SLA was
used in order to determine the impact of the sustainable tourism policies and stategies
initiated by the Thai govenment to reduce poverty in the community.
With the aim of collecting data on the percieved impact of the interventions on the
livelihood assets of Had Bai residents duringthethirteen-year period from 1998-2011, the
questionnaire was administered to 330 respondents representing each household in the
village. The questionnnaire measured the respondents‘ perceptions of the changes in their
livelihood assets by responding to items relating to the following sustainable livelihood
factors:
1. Social Assets – cooperation, network interconnectedness, family support,
friendships, relationship to trust/ exchanges, partnership and collaboration, and
political participation.
2. Personal Assets – motivation, self-esteem, self-confidence, self-perception,
emotional well-being, assertiveness and spirituality.
3. Physical Assets – child/elderly care, secure shelter, clean affordable energy,
information, banking and access to related services, basic consumer needs,
affordable transportation, tools and equipment, natural resources, air and water
quality.
4. Human Assets – skills, knowledge, ability, employability and earning power, good
health, leadership.
5. Financial Assets – income from productive activity; available finances/savings;
regularity of inflow of money from government transfers, family, gifts and payment
in kind, credit ratings, leadership.
The interviews conducted for the purposes of this study were predominantly in-
depth ones, allowing for qualitative information to be clarified and elaborated upon while
enabling more latitude for the acquisition of in-depth answers(May, 1997).
123
Semi-structured interviews were used with 40 respondents; representatives of
national government, local government, the private sector and village opinion leaders.
Since the primary focus of this research is to shed light on an understanding of the
livelihood outcomes of PPT projects, the quality of the data, rather than the quantity, was
the main concern.
The main methodologies employed in qualitative data collections were (1)
Participatory Rural Appraisal (PRA) (previously called Rapid Rural Appraisal, or RRA),
and (2) Participatory Analysis of Livelihood Impacts & Issues (PALI). The first method
emphasises community-level interviews and considers the views of other stakeholders,
while PALI concentrates more on the impact on livelihoods, which is again particularly
appropriate for this research.
PRA represents an extension and application of insights, approaches and methods.
Inherent in this approach is the empowerment of the poor, as it enables poor people to map,
model, quantify and estimate, rank, score and diagram, and do much of their own
investigation, analysis and planning. As a result, they are more in control of the
investigation and thus able to present valid and reliable information. (Chambers, 1992).
PALI, designed by an African Wildlife Foundation (AWF) team, involves a range
of PRA-type activities to explore livelihood issues and impacts (Ashley and Hussein,
2000). Consisting of group meetings in which participatory appraisal techniques are used
to explore livelihood issues, it allows many people to be reached quickly, thus allowing
large amounts of information to be gathered and consensus to be explored, and allowing
local peopleto assess the pros and cons of a project. While this method aims to extract
information for outsiders rather than to empower, it remains important to place people,
their perceptions and their livelihoods at the centre of analysis.
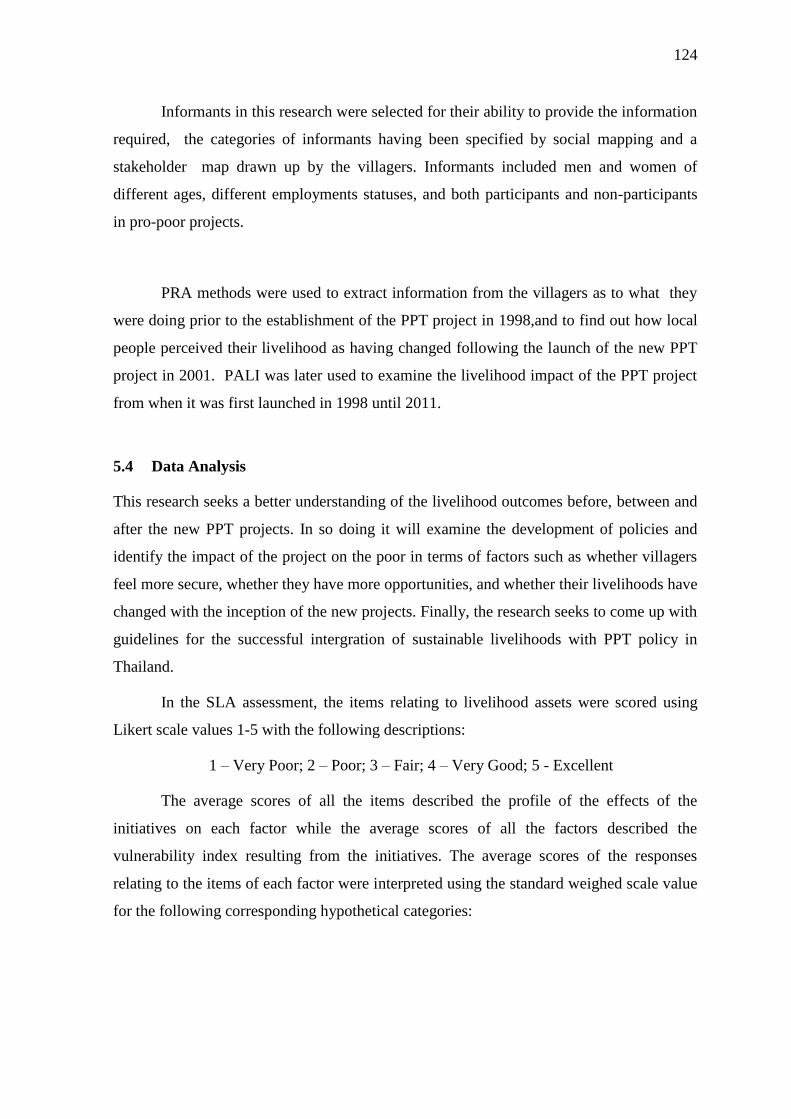
124
Informants in this research were selected for their ability to provide the information
required, the categories of informants having been specified by social mapping and a
stakeholder map drawn up by the villagers. Informants included men and women of
different ages, different employments statuses, and both participants and non-participants
in pro-poor projects.
PRA methods were used to extract information from the villagers as to what they
were doing prior to the establishment of the PPT project in 1998,and to find out how local
people perceived their livelihood as having changed following the launch of the new PPT
project in 2001. PALI was later used to examine the livelihood impact of the PPT project
from when it was first launched in 1998 until 2011.
5.4 Data Analysis
This research seeks a better understanding of the livelihood outcomes before, between and
after the new PPT projects. In so doing it will examine the development of policies and
identify the impact of the project on the poor in terms of factors such as whether villagers
feel more secure, whether they have more opportunities, and whether their livelihoods have
changed with the inception of the new projects. Finally, the research seeks to come up with
guidelines for the successful intergration of sustainable livelihoods with PPT policy in
Thailand.
In the SLA assessment, the items relating to livelihood assets were scored using
Likert scale values 1-5 with the following descriptions:
1 – Very Poor; 2 – Poor; 3 – Fair; 4 – Very Good; 5 - Excellent
The average scores of all the items described the profile of the effects of the
initiatives on each factor while the average scores of all the factors described the
vulnerability index resulting from the initiatives. The average scores of the responses
relating to the items of each factor were interpreted using the standard weighed scale value
for the following corresponding hypothetical categories:
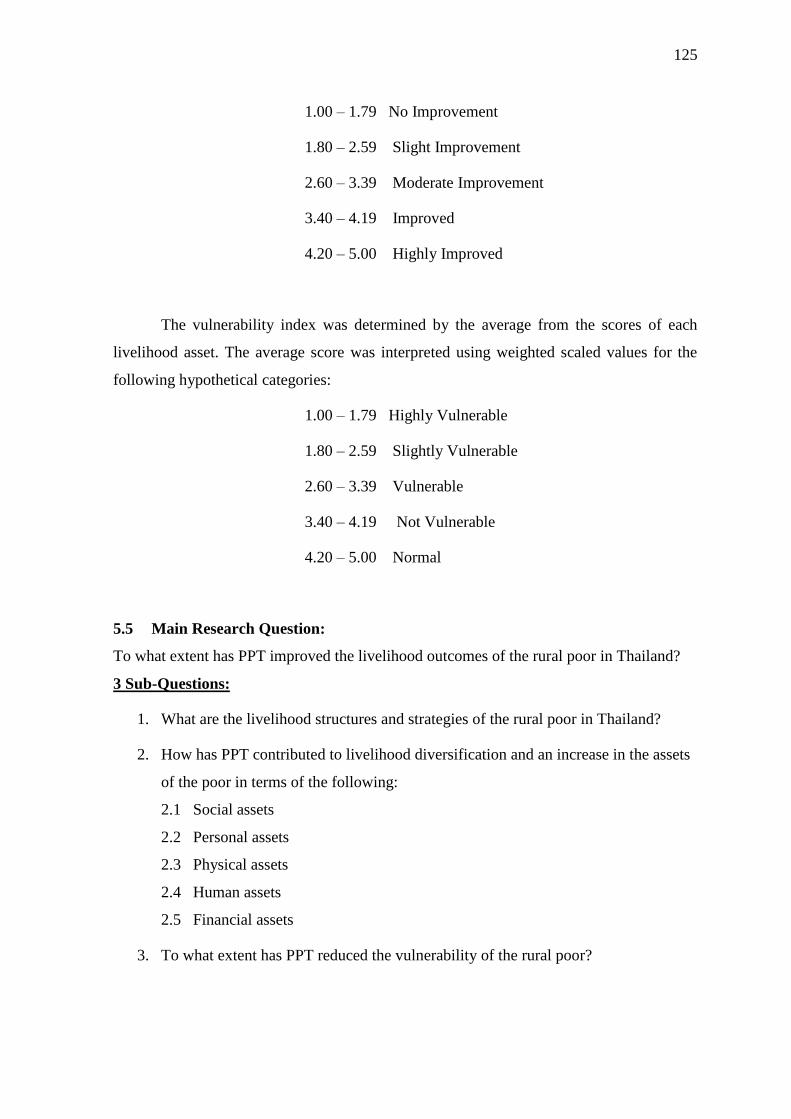
125
1.00 – 1.79 No Improvement
1.80 – 2.59 Slight Improvement
2.60 – 3.39 Moderate Improvement
3.40 – 4.19 Improved
4.20 – 5.00 Highly Improved
The vulnerability index was determined by the average from the scores of each
livelihood asset. The average score was interpreted using weighted scaled values for the
following hypothetical categories:
1.00 – 1.79 Highly Vulnerable
1.80 – 2.59 Slightly Vulnerable
2.60 – 3.39 Vulnerable
3.40 – 4.19 Not Vulnerable
4.20 – 5.00 Normal
5.5 Main Research Question:
To what extent has PPT improved the livelihood outcomes of the rural poor in Thailand?
3 Sub-Questions:
1. What are the livelihood structures and strategies of the rural poor in Thailand?
2. How has PPT contributed to livelihood diversification and an increase in the assets
of the poor in terms of the following:
2.1 Social assets
2.2 Personal assets
2.3 Physical assets
2.4 Human assets
2.5 Financial assets
3. To what extent has PPT reduced the vulnerability of the rural poor?
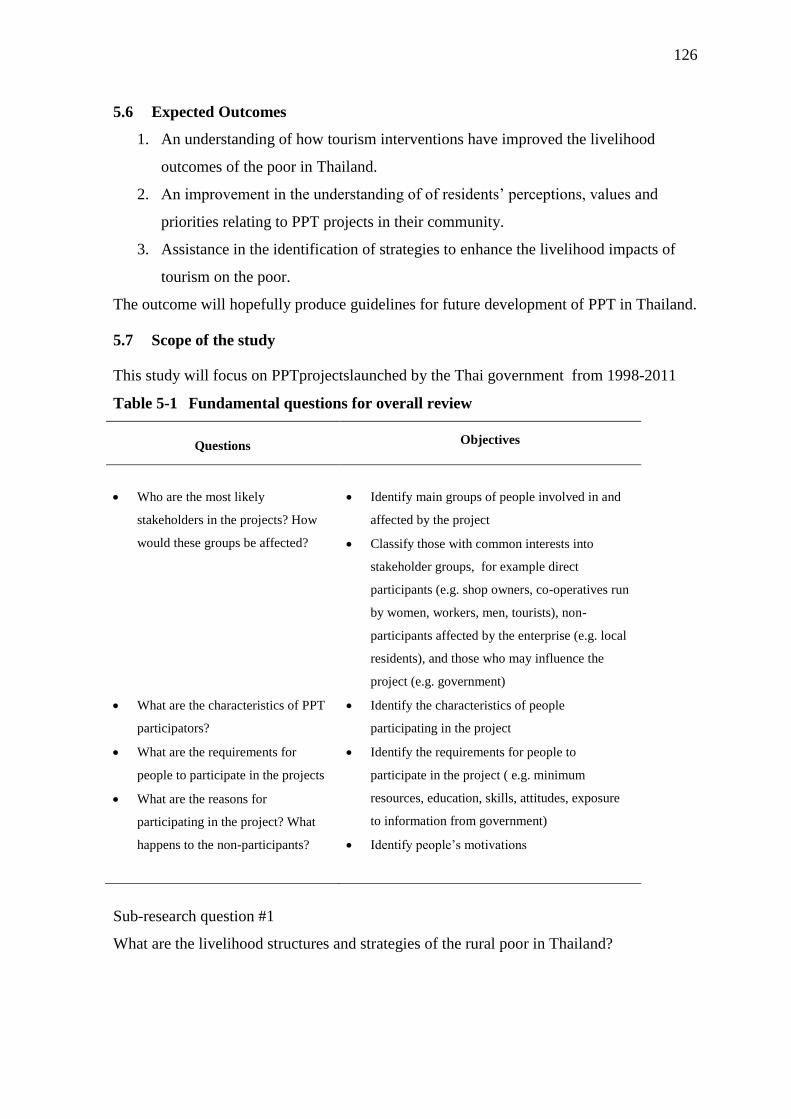
126
5.6 Expected Outcomes
1. An understanding of how tourism interventions have improved the livelihood
outcomes of the poor in Thailand.
2. An improvement in the understanding of of residents‘ perceptions, values and
priorities relating to PPT projects in their community.
3. Assistance in the identification of strategies to enhance the livelihood impacts of
tourism on the poor.
The outcome will hopefully produce guidelines for future development of PPT in Thailand.
5.7 Scope of the study
This study will focus on PPTprojectslaunched by the Thai government from 1998-2011
Table 5-1 Fundamental questions for overall review
Questions Objectives
Who are the most likely
stakeholders in the projects? How
would these groups be affected?
Identify main groups of people involved in and
affected by the project
Classify those with common interests into
stakeholder groups, for example direct
participants (e.g. shop owners, co-operatives run
by women, workers, men, tourists), non-
participants affected by the enterprise (e.g. local
residents), and those who may influence the
project (e.g. government)
What are the characteristics of PPT
participators?
What are the requirements for
people to participate in the projects
What are the reasons for
participating in the project? What
happens to the non-participants?
Identify the characteristics of people
participating in the project
Identify the requirements for people to
participate in the project ( e.g. minimum
resources, education, skills, attitudes, exposure
to information from government)
Identify people‘s motivations
Sub-research question #1
What are the livelihood structures and strategies of the rural poor in Thailand?
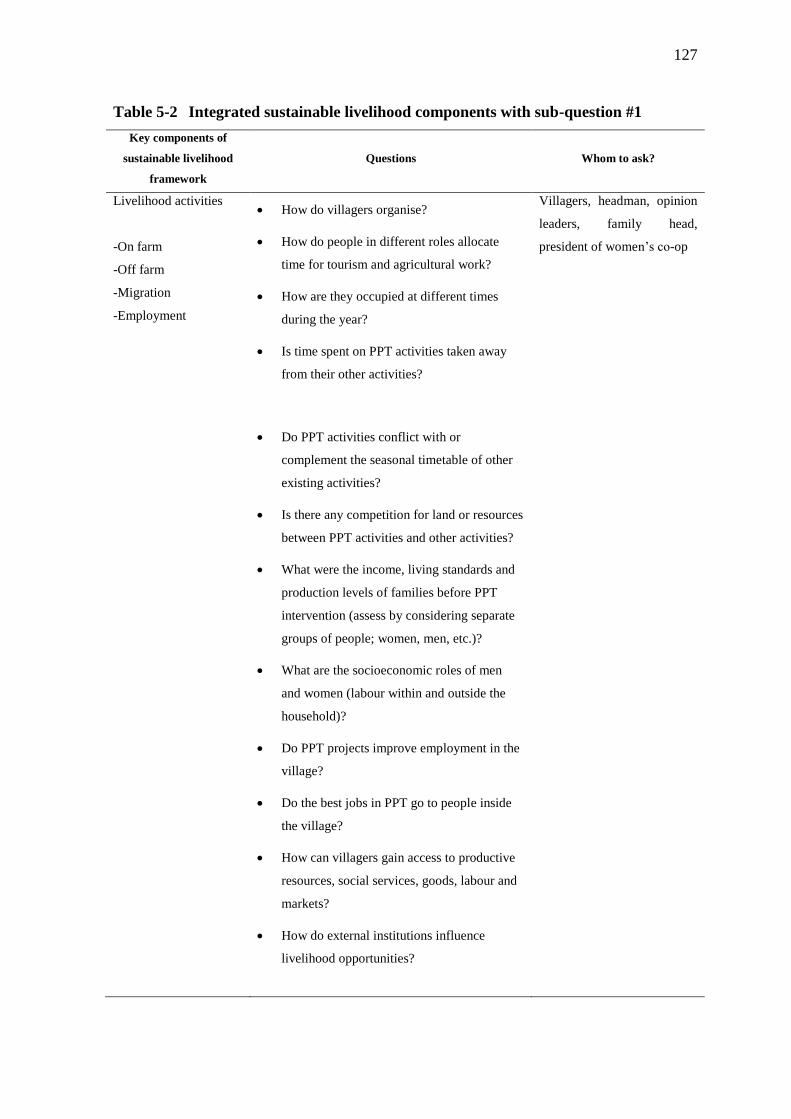
127
Table 5-2 Integrated sustainable livelihood components with sub-question #1
Key components of
sustainable livelihood
framework
Questions Whom to ask?
Livelihood activities
-On farm
-Off farm
-Migration
-Employment
How do villagers organise?
How do people in different roles allocate
time for tourism and agricultural work?
How are they occupied at different times
during the year?
Is time spent on PPT activities taken away
from their other activities?
Do PPT activities conflict with or
complement the seasonal timetable of other
existing activities?
Is there any competition for land or resources
between PPT activities and other activities?
What were the income, living standards and
production levels of families before PPT
intervention (assess by considering separate
groups of people; women, men, etc.)?
What are the socioeconomic roles of men
and women (labour within and outside the
household)?
Do PPT projects improve employment in the
village?
Do the best jobs in PPT go to people inside
the village?
How can villagers gain access to productive
resources, social services, goods, labour and
markets?
How do external institutions influence
livelihood opportunities?
Villagers, headman, opinion
leaders, family head,
president of women‘s co-op
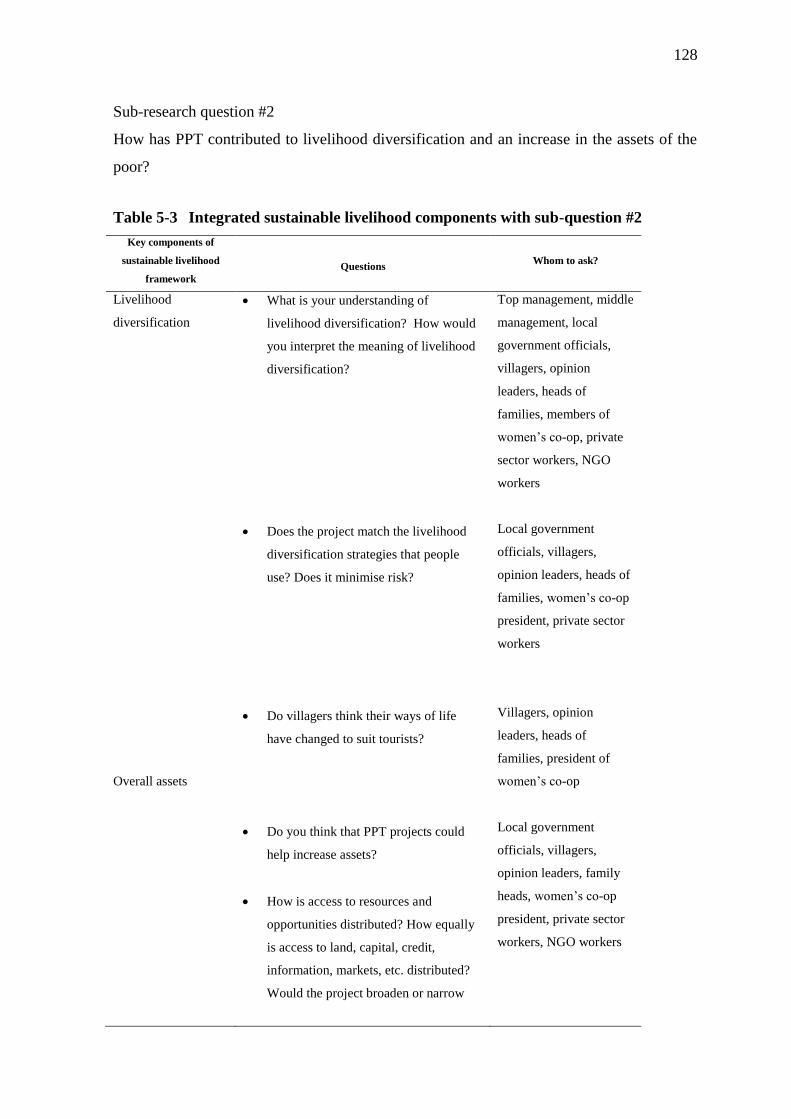
128
Sub-research question #2
How has PPT contributed to livelihood diversification and an increase in the assets of the
poor?
Table 5-3 Integrated sustainable livelihood components with sub-question #2
Key components of
sustainable livelihood
framework
Questions Whom to ask?
Livelihood
diversification
Overall assets
What is your understanding of
livelihood diversification? How would
you interpret the meaning of livelihood
diversification?
Does the project match the livelihood
diversification strategies that people
use? Does it minimise risk?
Do villagers think their ways of life
have changed to suit tourists?
Do you think that PPT projects could
help increase assets?
How is access to resources and
opportunities distributed? How equally
is access to land, capital, credit,
information, markets, etc. distributed?
Would the project broaden or narrow
Top management, middle
management, local
government officials,
villagers, opinion
leaders, heads of
families, members of
women‘s co-op, private
sector workers, NGO
workers
Local government
officials, villagers,
opinion leaders, heads of
families, women‘s co-op
president, private sector
workers
Villagers, opinion
leaders, heads of
families, president of
women‘s co-op
Local government
officials, villagers,
opinion leaders, family
heads, women‘s co-op
president, private sector
workers, NGO workers
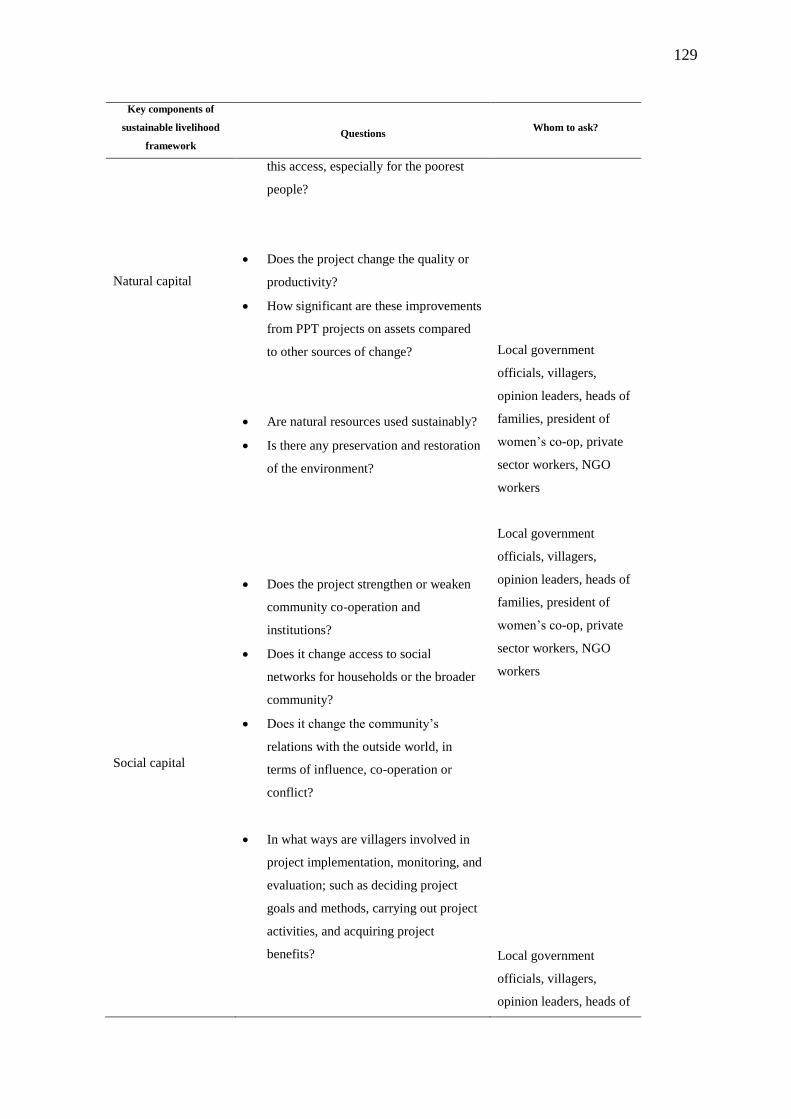
129
Key components of
sustainable livelihood
framework
Questions Whom to ask?
Natural capital
Social capital
this access, especially for the poorest
people?
Does the project change the quality or
productivity?
How significant are these improvements
from PPT projects on assets compared
to other sources of change?
Are natural resources used sustainably?
Is there any preservation and restoration
of the environment?
Does the project strengthen or weaken
community co-operation and
institutions?
Does it change access to social
networks for households or the broader
community?
Does it change the community‘s
relations with the outside world, in
terms of influence, co-operation or
conflict?
In what ways are villagers involved in
project implementation, monitoring, and
evaluation; such as deciding project
goals and methods, carrying out project
activities, and acquiring project
benefits?
Local government
officials, villagers,
opinion leaders, heads of
families, president of
women‘s co-op, private
sector workers, NGO
workers
Local government
officials, villagers,
opinion leaders, heads of
families, president of
women‘s co-op, private
sector workers, NGO
workers
Local government
officials, villagers,
opinion leaders, heads of
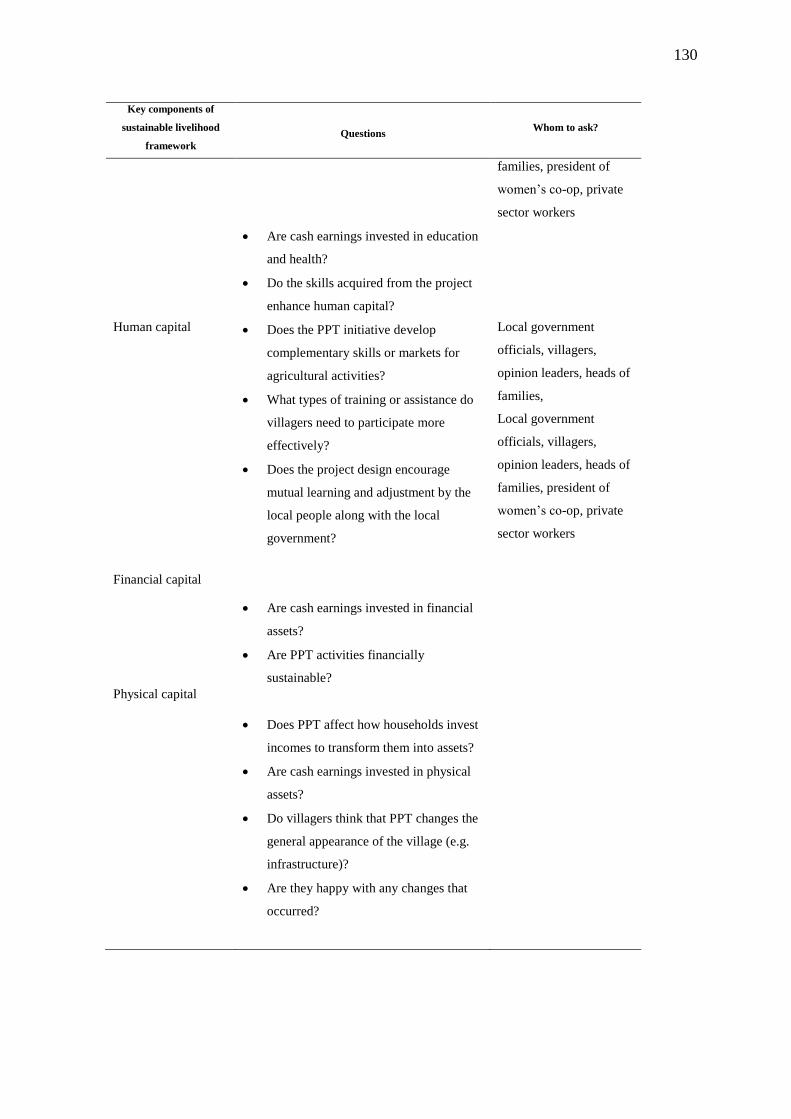
130
Key components of
sustainable livelihood
framework
Questions Whom to ask?
Human capital
Financial capital
Physical capital
Are cash earnings invested in education
and health?
Do the skills acquired from the project
enhance human capital?
Does the PPT initiative develop
complementary skills or markets for
agricultural activities?
What types of training or assistance do
villagers need to participate more
effectively?
Does the project design encourage
mutual learning and adjustment by the
local people along with the local
government?
Are cash earnings invested in financial
assets?
Are PPT activities financially
sustainable?
Does PPT affect how households invest
incomes to transform them into assets?
Are cash earnings invested in physical
assets?
Do villagers think that PPT changes the
general appearance of the village (e.g.
infrastructure)?
Are they happy with any changes that
occurred?
families, president of
women‘s co-op, private
sector workers
Local government
officials, villagers,
opinion leaders, heads of
families,
Local government
officials, villagers,
opinion leaders, heads of
families, president of
women‘s co-op, private
sector workers
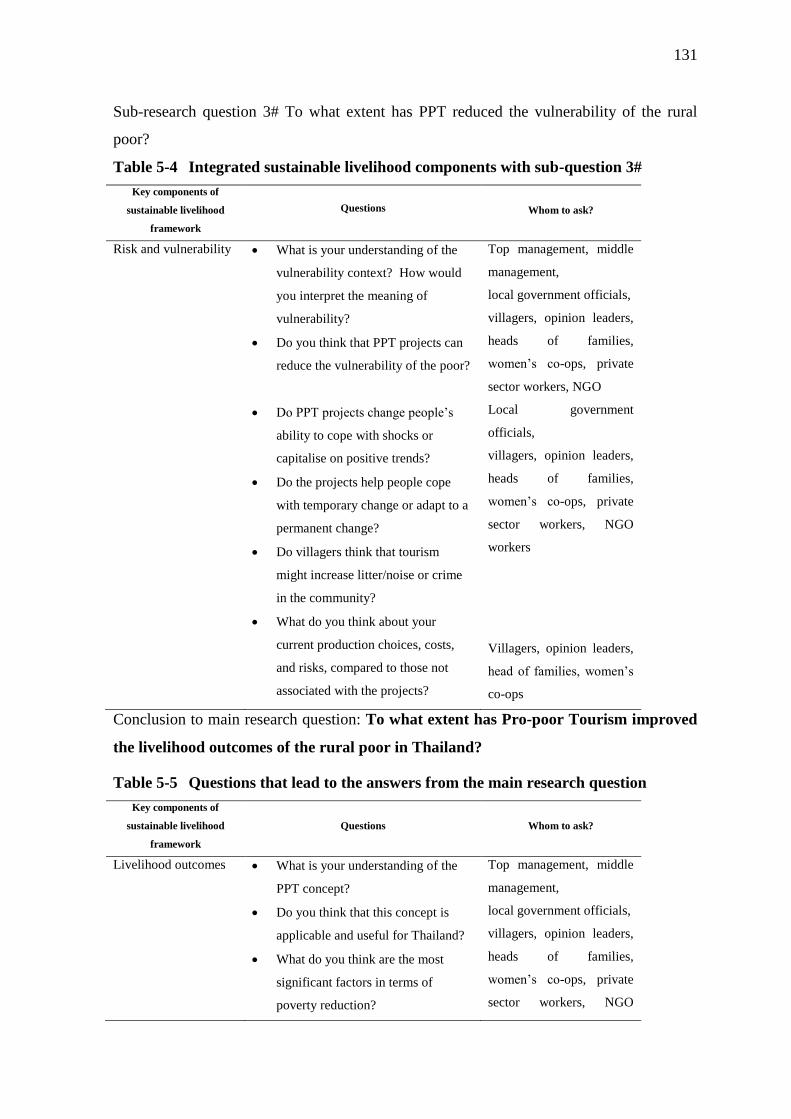
131
Sub-research question 3# To what extent has PPT reduced the vulnerability of the rural
poor?
Table 5-4 Integrated sustainable livelihood components with sub-question 3#
Key components of
sustainable livelihood
framework
Questions Whom to ask?
Risk and vulnerability
What is your understanding of the
vulnerability context? How would
you interpret the meaning of
vulnerability?
Do you think that PPT projects can
reduce the vulnerability of the poor?
Do PPT projects change people‘s
ability to cope with shocks or
capitalise on positive trends?
Do the projects help people cope
with temporary change or adapt to a
permanent change?
Do villagers think that tourism
might increase litter/noise or crime
in the community?
What do you think about your
current production choices, costs,
and risks, compared to those not
associated with the projects?
Top management, middle
management,
local government officials,
villagers, opinion leaders,
heads of families,
women‘s co-ops, private
sector workers, NGO
Local government
officials,
villagers, opinion leaders,
heads of families,
women‘s co-ops, private
sector workers, NGO
workers
Villagers, opinion leaders,
head of families, women‘s
co-ops
Conclusion to main research question: To what extent has Pro-poor Tourism improved
the livelihood outcomes of the rural poor in Thailand?
Table 5-5 Questions that lead to the answers from the main research question
Key components of
sustainable livelihood
framework
Questions Whom to ask?
Livelihood outcomes
What is your understanding of the
PPT concept?
Do you think that this concept is
applicable and useful for Thailand?
What do you think are the most
significant factors in terms of
poverty reduction?
Top management, middle
management,
local government officials,
villagers, opinion leaders,
heads of families,
women‘s co-ops, private
sector workers, NGO
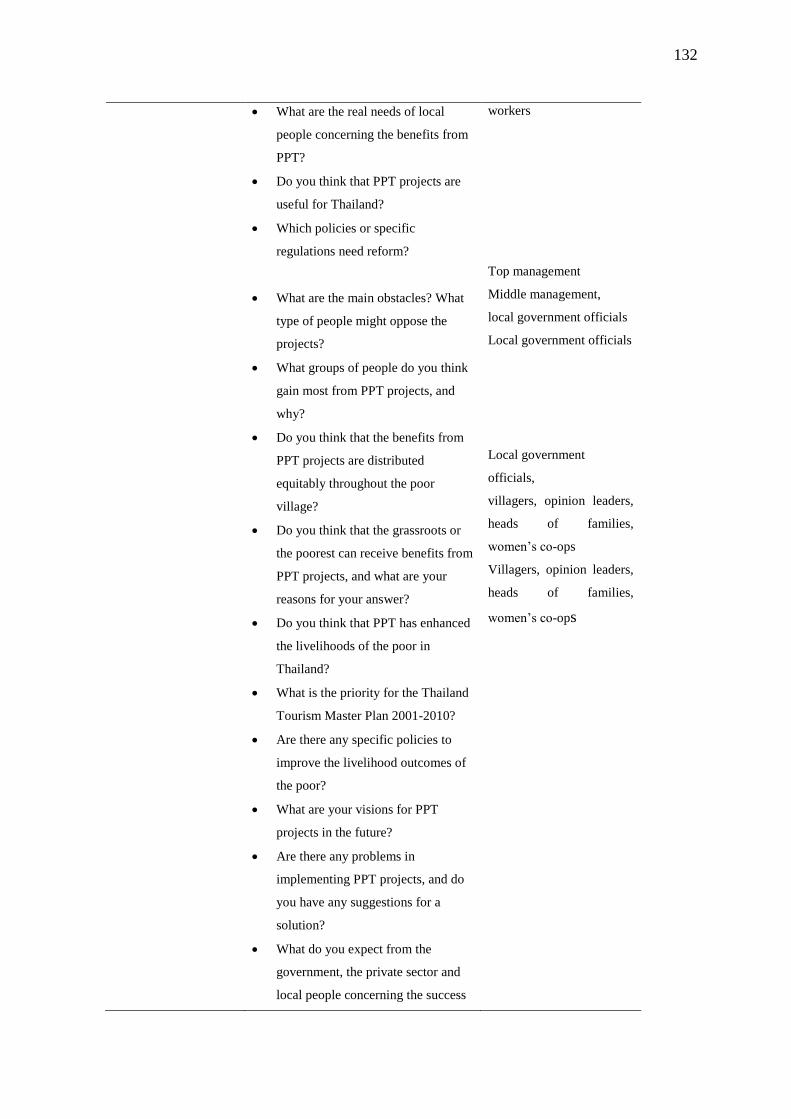
132
What are the real needs of local
people concerning the benefits from
PPT?
Do you think that PPT projects are
useful for Thailand?
Which policies or specific
regulations need reform?
What are the main obstacles? What
type of people might oppose the
projects?
What groups of people do you think
gain most from PPT projects, and
why?
Do you think that the benefits from
PPT projects are distributed
equitably throughout the poor
village?
Do you think that the grassroots or
the poorest can receive benefits from
PPT projects, and what are your
reasons for your answer?
Do you think that PPT has enhanced
the livelihoods of the poor in
Thailand?
What is the priority for the Thailand
Tourism Master Plan 2001-2010?
Are there any specific policies to
improve the livelihood outcomes of
the poor?
What are your visions for PPT
projects in the future?
Are there any problems in
implementing PPT projects, and do
you have any suggestions for a
solution?
What do you expect from the
government, the private sector and
local people concerning the success
workers
Top management
Middle management,
local government officials
Local government officials
Local government
officials,
villagers, opinion leaders,
heads of families,
women‘s co-ops
Villagers, opinion leaders,
heads of families,
women‘s co-ops
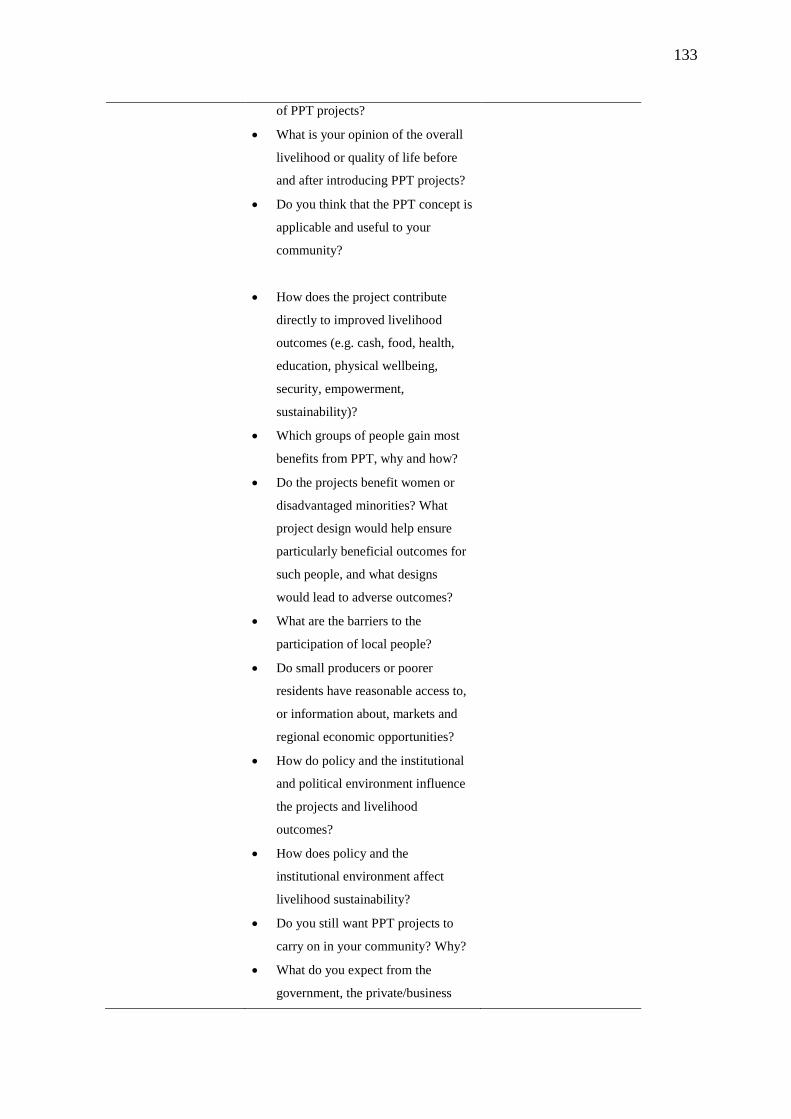
133
of PPT projects?
What is your opinion of the overall
livelihood or quality of life before
and after introducing PPT projects?
Do you think that the PPT concept is
applicable and useful to your
community?
How does the project contribute
directly to improved livelihood
outcomes (e.g. cash, food, health,
education, physical wellbeing,
security, empowerment,
sustainability)?
Which groups of people gain most
benefits from PPT, why and how?
Do the projects benefit women or
disadvantaged minorities? What
project design would help ensure
particularly beneficial outcomes for
such people, and what designs
would lead to adverse outcomes?
What are the barriers to the
participation of local people?
Do small producers or poorer
residents have reasonable access to,
or information about, markets and
regional economic opportunities?
How do policy and the institutional
and political environment influence
the projects and livelihood
outcomes?
How does policy and the
institutional environment affect
livelihood sustainability?
Do you still want PPT projects to
carry on in your community? Why?
What do you expect from the
government, the private/business
134
sector and NGOs in terms of the
success of PPT projects?
Do you have any suggestions or
requests for the government, local
authorities, private/business sectors?
5.8 Limitations
It is also important to list the drawbacks to this study. One limitation is the fact that PPT
projects in Thailandare in flux, with new policy initiatives constantly being issued. As a
result, assessing the impact of PPT projects must be dynamic and continually updated.
Moreover, it is not always easy to determine the causes of changes tothe livelihood of the
poor. The outcomes of other government development initiatives and increasing
connectedness with the outside world can easily be confused with the outcome of PPT
projects, and it can be difficult to isolate the various strands. To counter this problem, the
questionnaire and survey questions were made as specific as possible in order to isolate the
impact of PPT on the respondents‘ livelihoods.
Thesis content
CHAPTER QUESTIONS SOURCE OF
INFORMATION METHODOLOGY
Chapter 1
- Introduction, source and issue of
poverty situation
in Thailand,
- Why other countries
includingThailand adopt PPT project.
- Why study pro-poor
tourism policy?
- Why study pro-poor
tourism policyin Thailand?
- Secondary data
- Reports by
local, and
international
organizations
Analysis of literature
Chapter 2
- Literature review.
- Defining Major tourism concepts and
Pro-poor tourism concepts
- What is Pro-poor tourism?
- How does it differ from the
general promotion of
tourism?
- What others attempt to find
aboutPro- poor tourism?
- Secondary data
- Reports by
local, and
international
organizations
Analysis of literature
Chapter 3
- Literature review on Pro-poor
Tourism and livelihood impact.
- Literature review on how
PPTcontribute to
livelihoodscomponents and
reducesvulnerability.
- What others attempt to find
about pro-poor tourism and
livelihood impact?
- What kind of debate and
issue in the literature about
impact of PPT on the poor
- Secondary data
- Reports by
local, and
international
organizations
Analysis of literature
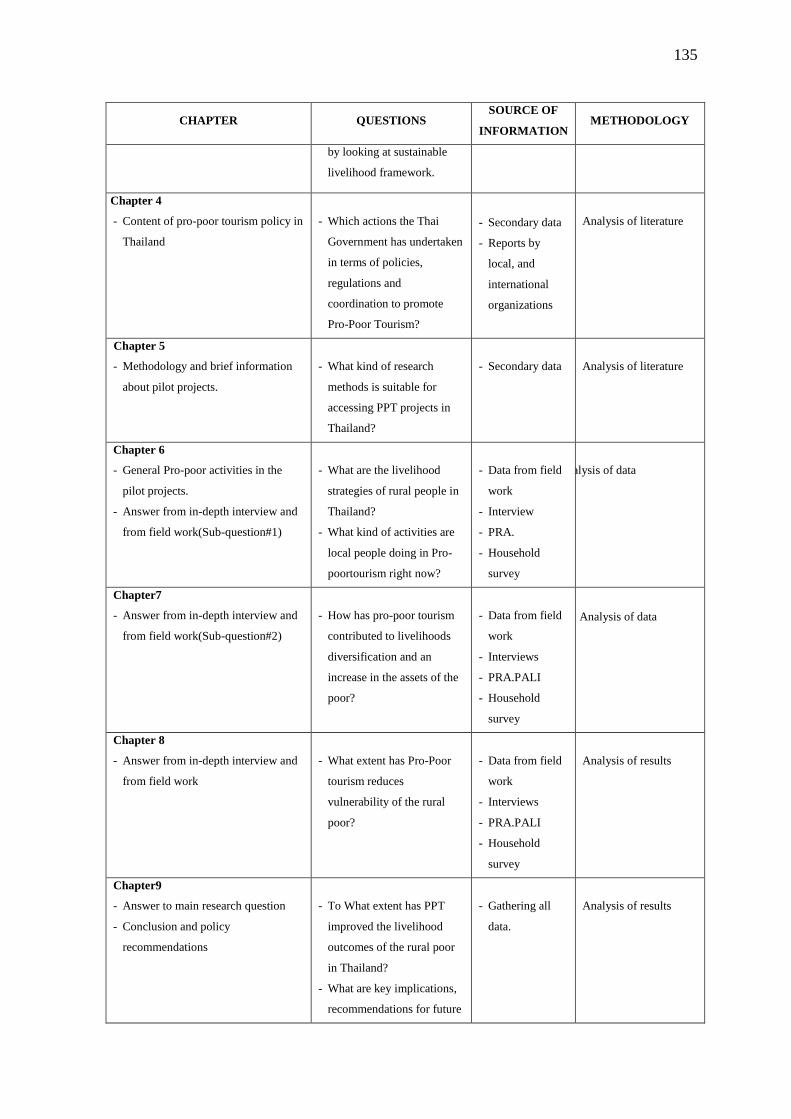
135
CHAPTER QUESTIONS SOURCE OF
INFORMATION METHODOLOGY
by looking at sustainable
livelihood framework.
Chapter 4
- Content of pro-poor tourism policy in
Thailand
- Which actions the Thai
Government has undertaken
in terms of policies,
regulations and
coordination to promote
Pro-Poor Tourism?
- Secondary data
- Reports by
local, and
international
organizations
Analysis of literature
Ch Chapter 5
- Methodology and brief information
about pilot projects.
- What kind of research
methods is suitable for
accessing PPT projects in
Thailand?
- Secondary data
Analysis of literature
Chapter 6
- General Pro-poor activities in the
pilot projects.
- Answer from in-depth interview and
from field work(Sub-question#1)
- What are the livelihood
strategies of rural people in
Thailand?
- What kind of activities are
local people doing in Pro-
poortourism right now?
- Data from field
work
- Interview
- PRA.
- Household
survey
Analysis of data
Chapter7
- Answer from in-depth interview and
from field work(Sub-question#2)
- How has pro-poor tourism
contributed to livelihoods
diversification and an
increase in the assets of the
poor?
- Data from field
work
- Interviews
- PRA.PALI
- Household
survey
Analysis of data
Chapter 8
- Answer from in-depth interview and
from field work
- What extent has Pro-Poor
tourism reduces
vulnerability of the rural
poor?
- Data from field
work
- Interviews
- PRA.PALI
- Household
survey
Analysis of results
Chapter9
- Answer to main research question
- Conclusion and policy
recommendations
- To What extent has PPT
improved the livelihood
outcomes of the rural poor
in Thailand?
- What are key implications,
recommendations for future
- Gathering all
data.
Analysis of results
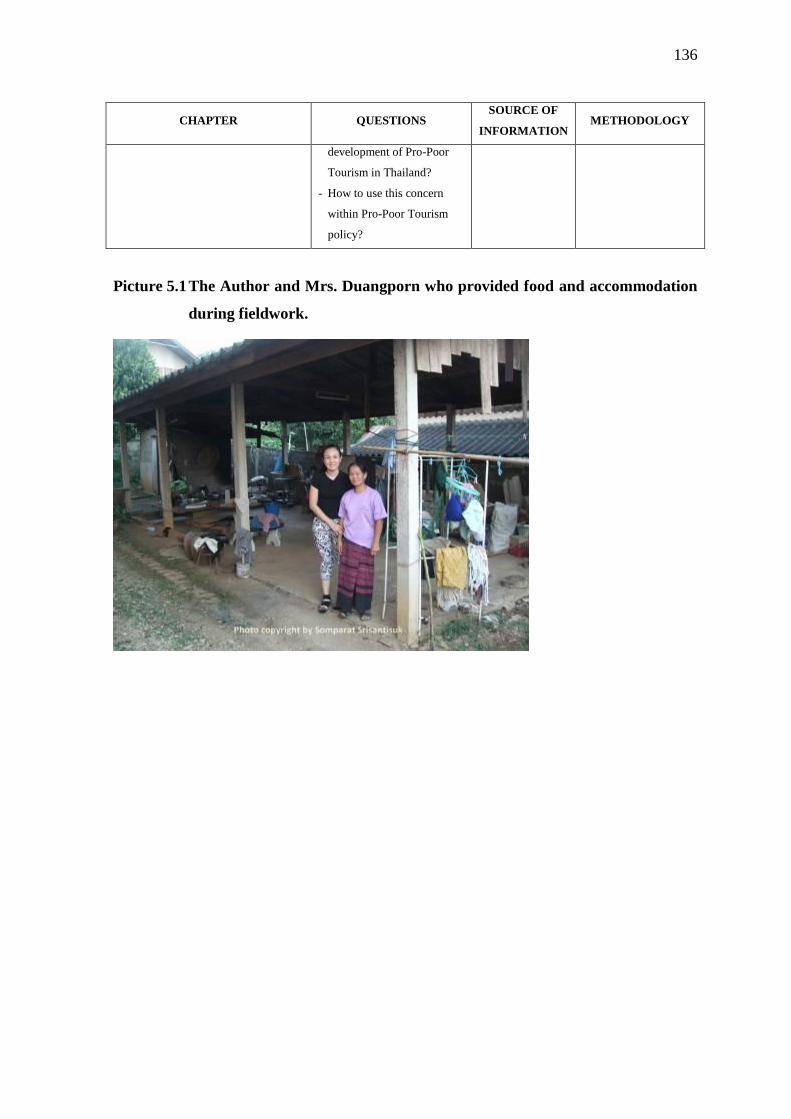
136
CHAPTER QUESTIONS SOURCE OF
INFORMATION METHODOLOGY
development of Pro-Poor
Tourism in Thailand?
- How to use this concern
within Pro-Poor Tourism
policy?
Picture 5.1 The Author and Mrs. Duangporn who provided food and accommodation
during fieldwork.
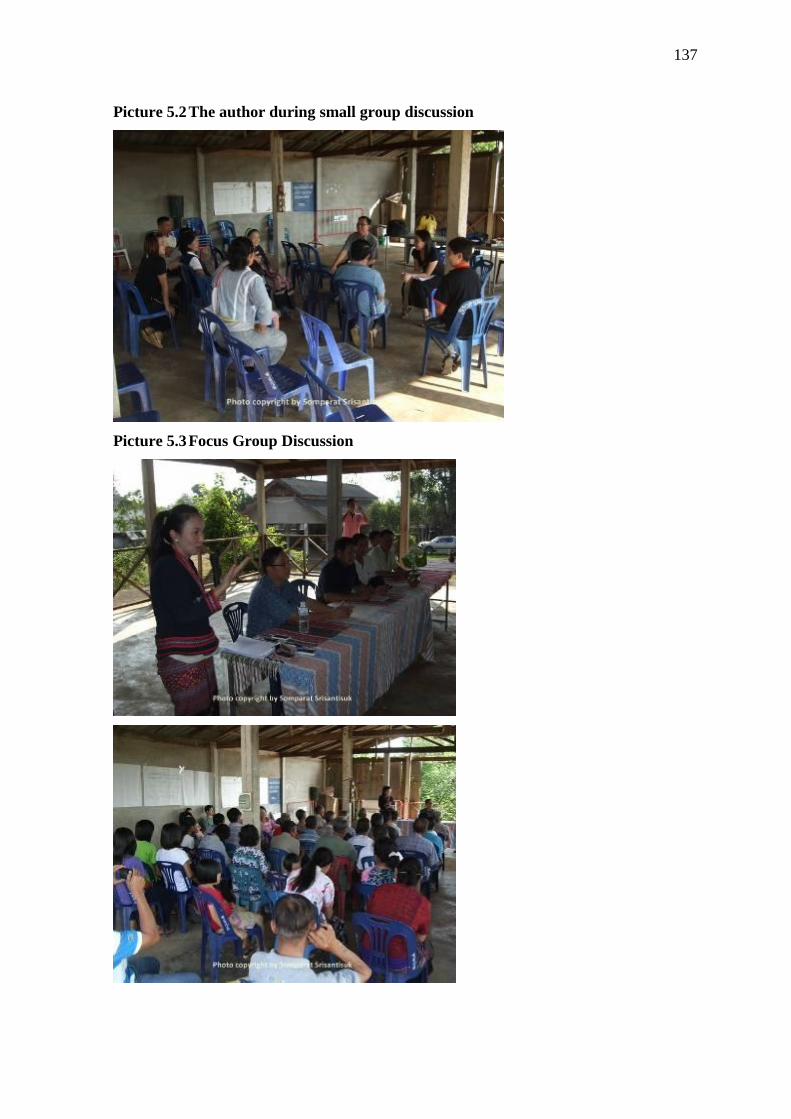
137
Picture 5.2 The author during small group discussion
Picture 5.3 Focus Group Discussion
138
CHAPTER 6
General Pro-poor Activities in the Pilot Project
This chapter describes the livelihood patterns of the poor in the pilot project. It provides
the details of three patterns starting with a short discussion of the general background,
characteristics of the economic structure in the northern region. The livelihood patterns in
the pilot project will be discussed by presenting primary and secondary data describing the
demographics, livelihood structures and strategies of the three groups who participated in
the survey.
6.1 General Background of the Northern Region
The north of Thailand is a mountainous region made up of 17 provinces, having one third
of the total area of the nation, covering 169,600 square kilometres. One fifth of the
Northern area is utilised for agricultural purposes. At the end of 2006, the population in
the North totalled 11.6 million or 17.8 per cent of the total population.
The pilot project in Had Bai Village is located in Chiang Kong district of Chiang
Rai Province, 115 kilometres from the provincial capital. Chiang Khong is known as the
place where giant catfish, locally known as Pla Buk,are cultivated. The Fishery Station in
Chiang Khong is where the largest fresh water fish in the world is bred for release back
into the rivers. From mid-January to Mayduring fishing season, popular sightseeing trips
take tourists to view the scenery along the MekongRiver. Ban Had Bai or Had Bai village
is the popular tourist destination along the river. The cultural attraction of this Thai Lu
community is noted for making beautiful local fabrics (Tripsthailand 2007).Tourists can
come to the village by boat and by road. However, tourists come to Hai Bai mainly by long
tail boat. They board boats at one of 4-5 piers in Chiangsaen, Golden Triangle, enjoy the
scenery of MekongRiver and stop at Had Bai pier. Tourists can also visit by road.
6.2 Economic Structure of the Northern Region
The average growth of the northern economy during 2000-2006 was 3.4 percent, less than
that of the country as a whole which was 5.0 percent. Agriculture has long been the
lifeblood of this region. In 2006, the agricultural sector accounted for 19.3 percent of the
total production of the region. Vegetables and fruit crops have increased in importance to
139
the northern economy, with significant growth in revenues. The major industrial activities
are focused on electronics, sugar processing, and cement, with large earning also made
from the production of ceramics and handicrafts.
6.2.1 Characteristics of the Northern Economy
According to 2006 market prices, the Gross Regional Product (GRP) of the northern
economy was valued at Bt686,218 million, equivalent to 8.8 percent of Thailand‘s Gross
Domestic Product (GDP). Particularly important to the regional economy are the
agricultural and mining sectors, accounting for 20.2 and 11.4 percent of the country‘s
agricultural and mining output respectively. In terms of agriculture, the northern region is a
major source of rice and crop production, with soybeans, maize, rice, and sugarcane being
the principle crops. In aggregate, the production in the northern region of these four crops
accounts for at least a quarter of the total value of these crops produced nationwide. Other
important agriculture products, such as longans, lychees, garlic, tobacco leaves, shallots
and onions are all produced in the north. The northern region is also the source of major
waterways in the central region, as well as Bangkok and its suburban areas. Moreover, it is
also an important source of the country‘s mineral resources, including lignite, limestone,
marl, zinc and crude oil.
6.2.2 Structure of the Northern Economy
The northern economy can be classified into two parts, that is, the upper north and the
lower north.
The upper north covers nine provinces and accounts for approximately 60 percent
of the total area of the whole northern region. More than 50 percent of the upper north is
mainly forest, of which only 15 percent can be used for farming. The area is rich in terms
of tourist attractions and enjoys favourable weather which makes tourist-oriented
businesses such as hotels, resorts, and souvenirs the major economic activities. Key
electricity generating resources are also located here. It is considered as the commercial
gateway to Myanmar, Laos, and China‘s southern region.
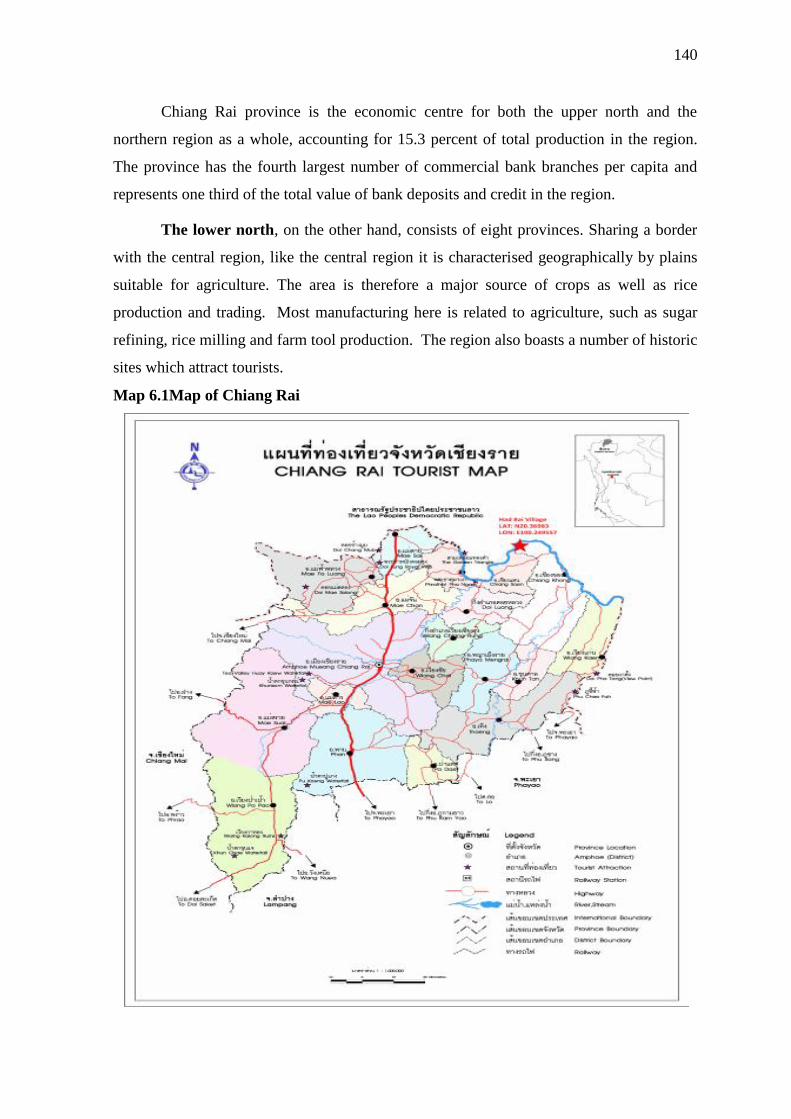
140
Chiang Rai province is the economic centre for both the upper north and the
northern region as a whole, accounting for 15.3 percent of total production in the region.
The province has the fourth largest number of commercial bank branches per capita and
represents one third of the total value of bank deposits and credit in the region.
The lower north, on the other hand, consists of eight provinces. Sharing a border
with the central region, like the central region it is characterised geographically by plains
suitable for agriculture. The area is therefore a major source of crops as well as rice
production and trading. Most manufacturing here is related to agriculture, such as sugar
refining, rice milling and farm tool production. The region also boasts a number of historic
sites which attract tourists.
Map 6.1Map of Chiang Rai
141
Had Bai is in the north part of Chiang Rai Province. As shown in Map 6.1, it is
located on the Mekong River northwest of Chiang Kong district.
The area is at the lower end of income distribution and faces serious problems of
poverty and high levels of debt.
Despite the fact that it benefited from support both from the village-based tourism
initiative and the Village Fund, chronic poverty and the high level of outstanding
household debt remain pressing problems. The introduction of the OTOP scheme thus
posed the question of whether a tourism-based project could alleviate some of these
concerns. Both members of the local community and researchers were interested to see
how the latest government initiatives benefits people in the area. With involvement and
participation of the new group of stakeholders, who have the initiative to enhance the
participation of the poor themselves, this study is interested in assessing the programme‘s
success in solving the problems.
To investigate how the project has helped the village, the research relies on both a
quantitative and a qualitative approach to data collection, as described in Chapter 5. Three
rounds of interviews were conducted with different groups of stakeholders, and
questionnaires were sent out at the time of the second interview to 80 per cent of the
villagers for the overall assessment. Focus groups were also conducted along with transect
walks to collect information on livelihood activities. Secondary data on the fundamental
infrastructure and livelihood structure of the village were obtained from the District
Development Office. The first part of the review sheds light on the basic background
information of the inhabitants in terms of their demographic make-up and livelihood
structure.
6.3 Demographic Data of Had Bai Village 1999 – 2011
The demographic background of the community was taken both from secondary sources
and from key informants during the first round of interviews.
During the past 15 years Had Bai has grown considerably in size, with the number
of households increasing from 273 in 1998 to 309 in 2001, and jumping to 412 by 2011, as
shown inTable 6-1. While the total population followed a broadly similar trend, it was
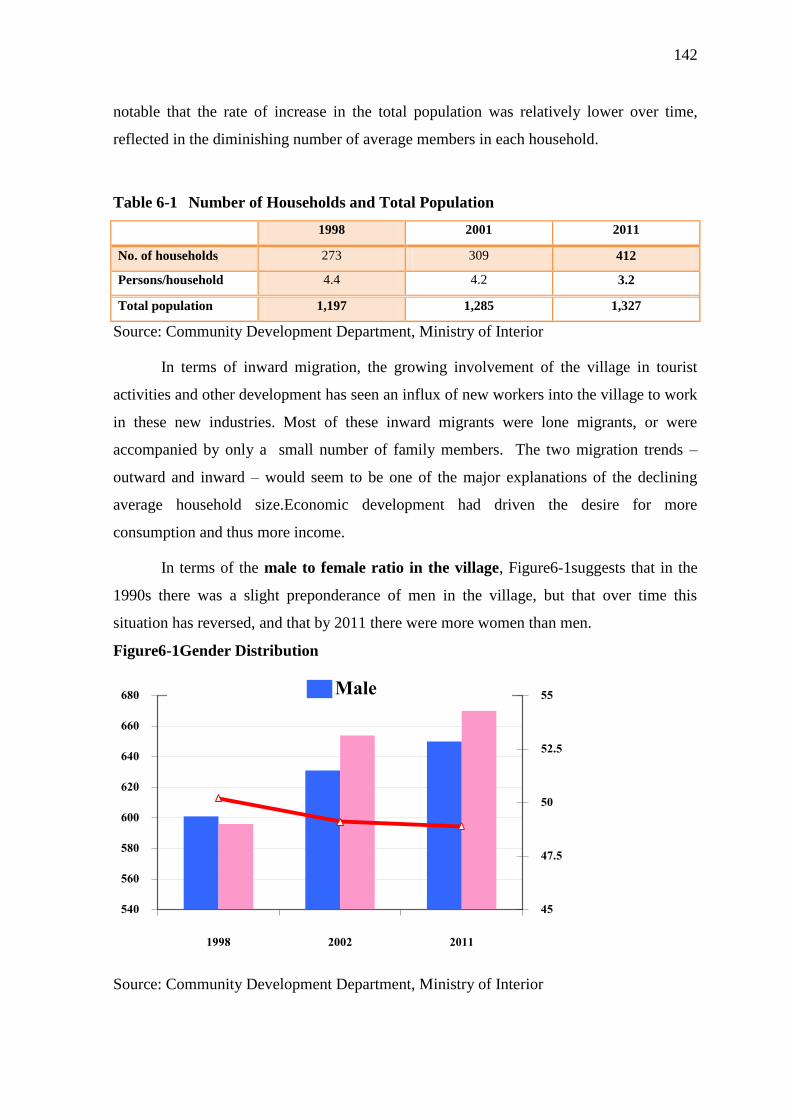
142
notable that the rate of increase in the total population was relatively lower over time,
reflected in the diminishing number of average members in each household.
Table 6-1 Number of Households and Total Population
1998 2001 2011
No. of households 273 309 412
Persons/household 4.4 4.2 3.2
Total population 1,197 1,285 1,327
Source: Community Development Department, Ministry of Interior
In terms of inward migration, the growing involvement of the village in tourist
activities and other development has seen an influx of new workers into the village to work
in these new industries. Most of these inward migrants were lone migrants, or were
accompanied by only a small number of family members. The two migration trends –
outward and inward – would seem to be one of the major explanations of the declining
average household size.Economic development had driven the desire for more
consumption and thus more income.
In terms of the male to female ratio in the village, Figure6-1suggests that in the
1990s there was a slight preponderance of men in the village, but that over time this
situation has reversed, and that by 2011 there were more women than men.
Figure6-1Gender Distribution
Source: Community Development Department, Ministry of Interior
45
47.5
50
52.5
55
540
560
580
600
620
640
660
680
1998 2002 2011
Male
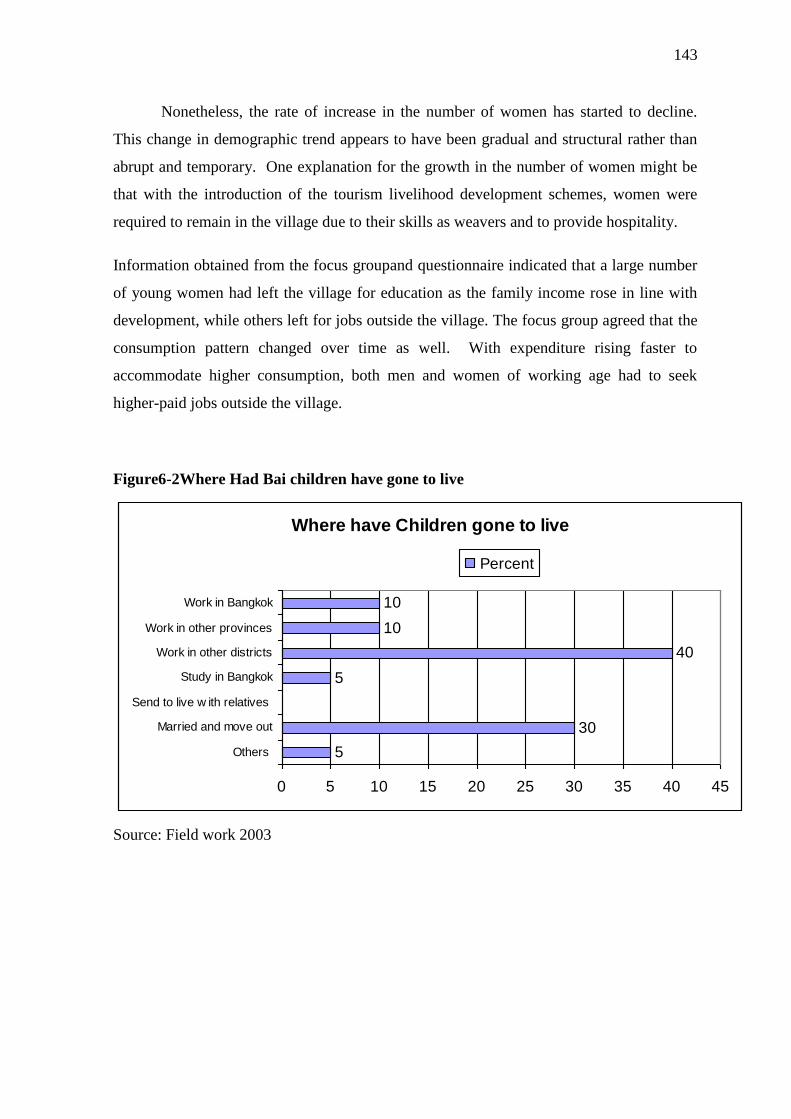
143
Nonetheless, the rate of increase in the number of women has started to decline.
This change in demographic trend appears to have been gradual and structural rather than
abrupt and temporary. One explanation for the growth in the number of women might be
that with the introduction of the tourism livelihood development schemes, women were
required to remain in the village due to their skills as weavers and to provide hospitality.
Information obtained from the focus groupand questionnaire indicated that a large number
of young women had left the village for education as the family income rose in line with
development, while others left for jobs outside the village. The focus group agreed that the
consumption pattern changed over time as well. With expenditure rising faster to
accommodate higher consumption, both men and women of working age had to seek
higher-paid jobs outside the village.
Figure6-2Where Had Bai children have gone to live
Source: Field work 2003
Where have Children gone to live
5
30
5
40
10
10
0 5 10 15 20 25 30 35 40 45
Others
Married and move out
Send to live w ith relatives
Study in Bangkok
Work in other districts
Work in other provinces
Work in Bangkok
Percent
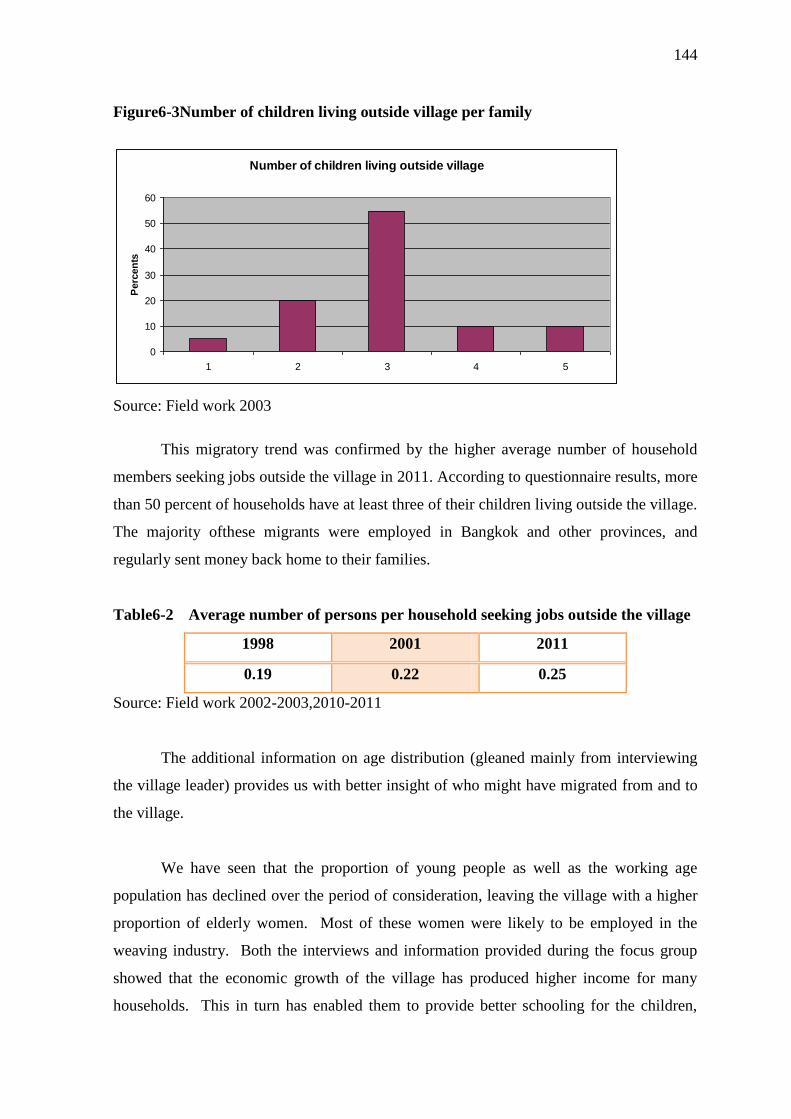
144
Figure6-3Number of children living outside village per family
Source: Field work 2003
This migratory trend was confirmed by the higher average number of household
members seeking jobs outside the village in 2011. According to questionnaire results, more
than 50 percent of households have at least three of their children living outside the village.
The majority ofthese migrants were employed in Bangkok and other provinces, and
regularly sent money back home to their families.
Table6-2 Average number of persons per household seeking jobs outside the village
1998 2001 2011
0.19 0.22 0.25
Source: Field work 2002-2003,2010-2011
The additional information on age distribution (gleaned mainly from interviewing
the village leader) provides us with better insight of who might have migrated from and to
the village.
We have seen that the proportion of young people as well as the working age
population has declined over the period of consideration, leaving the village with a higher
proportion of elderly women. Most of these women were likely to be employed in the
weaving industry. Both the interviews and information provided during the focus group
showed that the economic growth of the village has produced higher income for many
households. This in turn has enabled them to provide better schooling for the children,
Number of children living outside village
0
10
20
30
40
50
60
1 2 3 4 5
Perc
en
ts
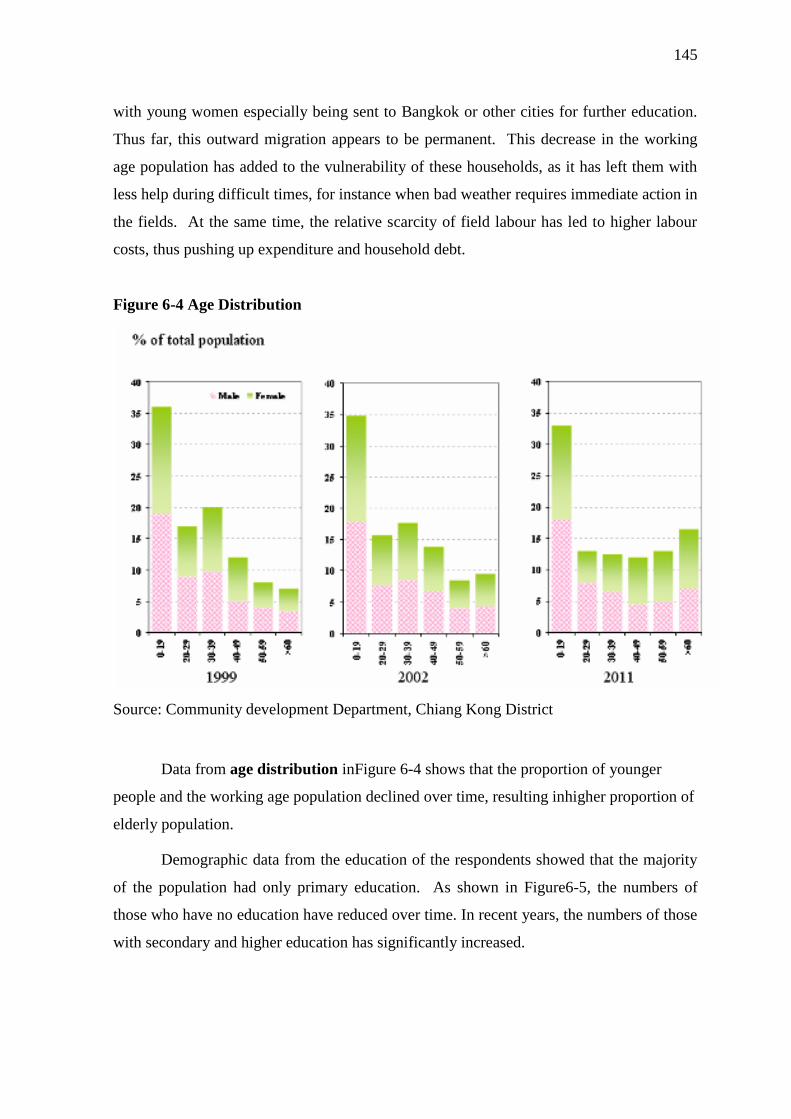
145
with young women especially being sent to Bangkok or other cities for further education.
Thus far, this outward migration appears to be permanent. This decrease in the working
age population has added to the vulnerability of these households, as it has left them with
less help during difficult times, for instance when bad weather requires immediate action in
the fields. At the same time, the relative scarcity of field labour has led to higher labour
costs, thus pushing up expenditure and household debt.
Figure 6-4 Age Distribution
Source: Community development Department, Chiang Kong District
Data from age distribution inFigure 6-4 shows that the proportion of younger
people and the working age population declined over time, resulting inhigher proportion of
elderly population.
Demographic data from the education of the respondents showed that the majority
of the population had only primary education. As shown in Figure6-5, the numbers of
those who have no education have reduced over time. In recent years, the numbers of those
with secondary and higher education has significantly increased.
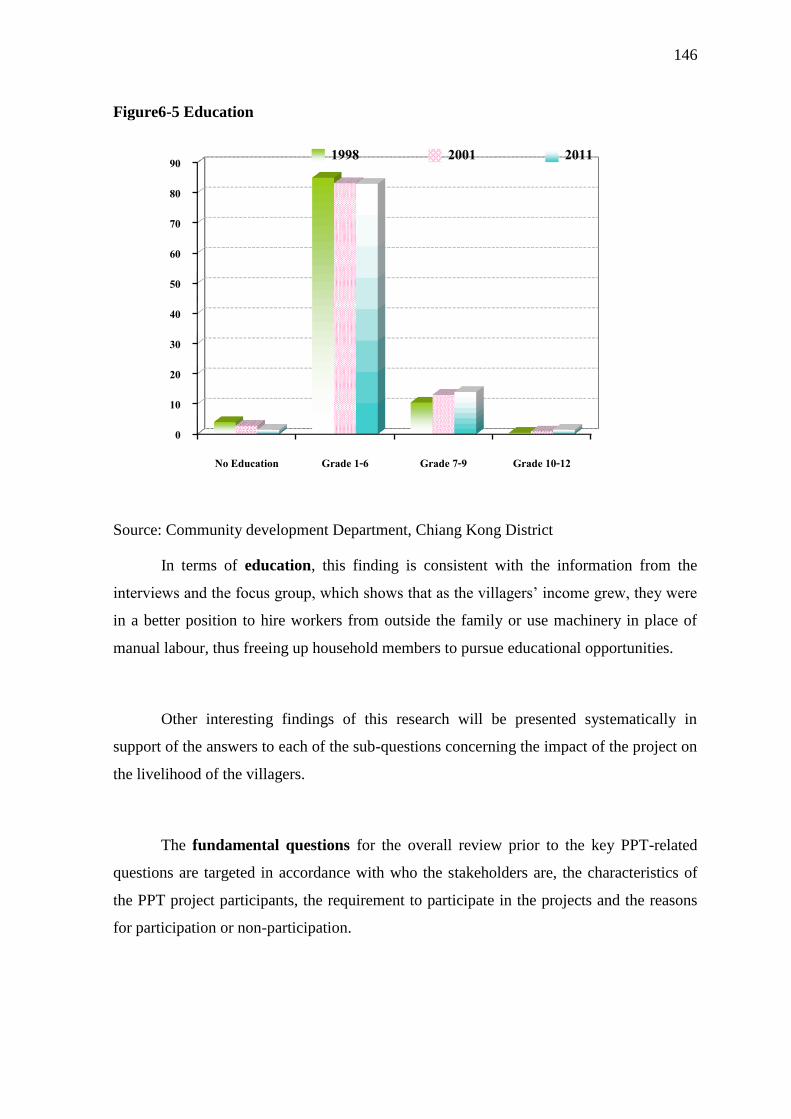
146
Figure6-5 Education
Box 6.3
Source: Community development Department, Chiang Kong District
In terms of education, this finding is consistent with the information from the
interviews and the focus group, which shows that as the villagers‘ income grew, they were
in a better position to hire workers from outside the family or use machinery in place of
manual labour, thus freeing up household members to pursue educational opportunities.
Other interesting findings of this research will be presented systematically in
support of the answers to each of the sub-questions concerning the impact of the project on
the livelihood of the villagers.
The fundamental questions for the overall review prior to the key PPT-related
questions are targeted in accordance with who the stakeholders are, the characteristics of
the PPT project participants, the requirement to participate in the projects and the reasons
for participation or non-participation.
0
10
20
30
40
50
60
70
80
90
No Education Grade 1-6 Grade 7-9 Grade 10-12
1998 2001 2011
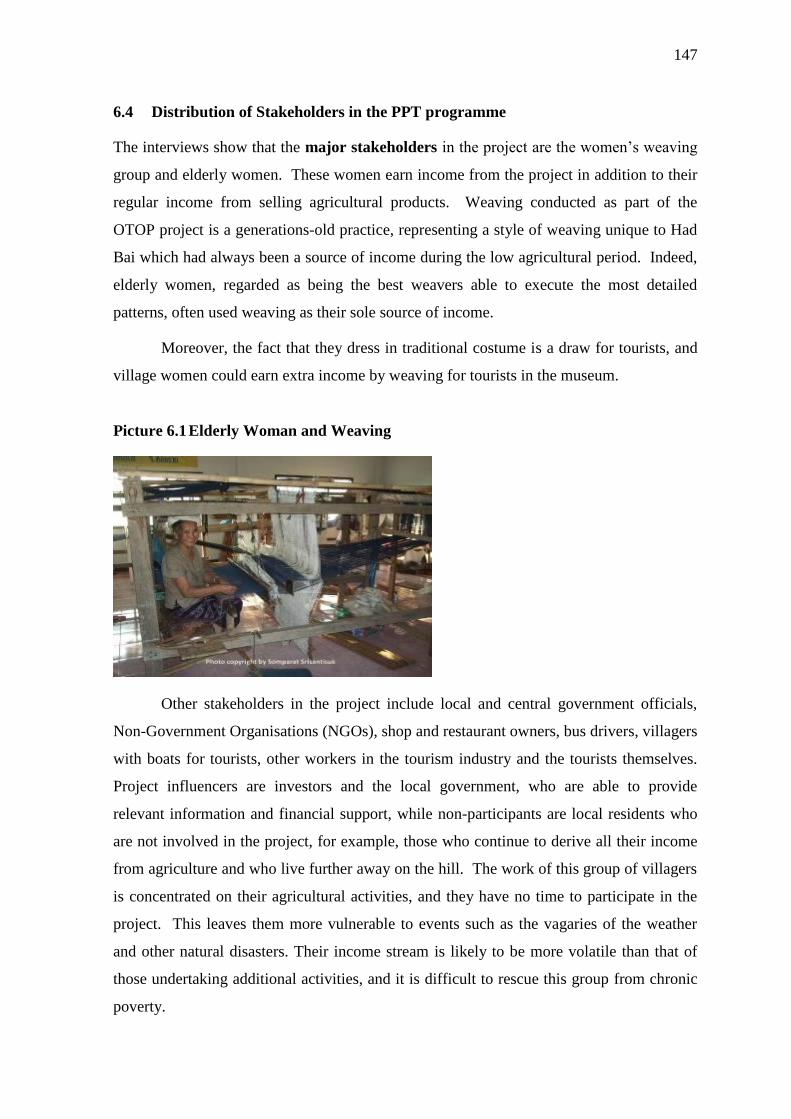
147
6.4 Distribution of Stakeholders in the PPT programme
The interviews show that the major stakeholders in the project are the women‘s weaving
group and elderly women. These women earn income from the project in addition to their
regular income from selling agricultural products. Weaving conducted as part of the
OTOP project is a generations-old practice, representing a style of weaving unique to Had
Bai which had always been a source of income during the low agricultural period. Indeed,
elderly women, regarded as being the best weavers able to execute the most detailed
patterns, often used weaving as their sole source of income.
Moreover, the fact that they dress in traditional costume is a draw for tourists, and
village women could earn extra income by weaving for tourists in the museum.
Picture 6.1 Elderly Woman and Weaving
Other stakeholders in the project include local and central government officials,
Non-Government Organisations (NGOs), shop and restaurant owners, bus drivers, villagers
with boats for tourists, other workers in the tourism industry and the tourists themselves.
Project influencers are investors and the local government, who are able to provide
relevant information and financial support, while non-participants are local residents who
are not involved in the project, for example, those who continue to derive all their income
from agriculture and who live further away on the hill. The work of this group of villagers
is concentrated on their agricultural activities, and they have no time to participate in the
project. This leaves them more vulnerable to events such as the vagaries of the weather
and other natural disasters. Their income stream is likely to be more volatile than that of
those undertaking additional activities, and it is difficult to rescue this group from chronic
poverty.
148
Moreover, not all of these villagers are farming their own land, and the ones who
are renting land are left particularly vulnerable. Not only are they at greater risk of getting
in a position which could increase their vulnerability, but the stresses they encounter are
likely to be of high magnitude than those encountered by other villagers.
The assumptions before starting the research are that the participants of the Pro-
poor Tourism related project were those without much land for cultivation (the chronic
poor); do not have high education (less than grade 6 and cannot find sufficiently-paid jobs
outside the village); savings group; those with weaving skills and unskilled housewives
who may be taught weaving by their skilled counterparts.
Most village households already possess a loom for personal use, although it is
notable that the launch of the tourism product development project, with concomitant
facilitation of market access, led to a tendency for villagers to purchase cheaper clothing
from the market and reserve their hand-woven cloth for sale, which also had the effect of
diluting their cultural heritage.
Men seemed likely to become active participants in tourism-related activities if
they owned long-tailed boats, minibuses which they could drive for villagers and tourists,
or possessed the skills to build looms and other furniture. These men tended to have a
higher income than those in agriculture, but wished to earn additional income for greater
financial security.
The information collected, however, showed that participants were for the most
part those who owned sufficient land, and who were able to rent out part of their land to
landless farmers, while devoting more of their own time to weaving and other tourism-
related activities. The fact that they possessed land, in other words, meant that they were
able to choose between farming and tourism related activities. Income from agriculture is
by definition cyclical, due both to market fluctuations and weather, and many villagers
with the option of diversifying hoped that involvement in the weaving project could in time
iron out income fluctuations.
149
The requirements for participating in the programme are minimal, especially for
those with spare time once their agricultural activities had been seen to. The women have
to join the savings group and deposit money for the purchase of weaving materials, at the
rate of Bt25 per month (GBP0.5 per month at 2010 exchange rates). Men who want to
participate need a long-tailed boat or minibus to transport tourists.
Non-participants, on the other hand, can be divided into two groups: those who
own land, and the landless. The majority of non-participants in the latter group live on the
hill or in a remote areafurther away from the centre of the village. Those in this group rent
land, and engage only in agriculture as a means of paying their rent. Their greater distance
from the village, together with their need to focus on agricultural activities, leaves them no
time to participate in the project.
Some non-participants cannot be described as very poor, having sufficient land and
either farm for themselves or hire workers. These villagers appear to think they have
sufficient income without engaging in additional labour. Nonetheless, agriculture is their
sole source of income and that leaves them vulnerable. As they are paid only once or twice
a year, they must manage their finances carefully. Nonetheless, natural disasters may wipe
out their crops and force them to borrow money.
At the same time, natural disasters may wipe out their crops and force them to
borrow money from elsewhere.
The main motivations expressed for participating in the project are (1) the constant
stream of income rather than one that fluctuates and depends upon the vagaries of nature,
(2) additional income from weaving and tourism, (3) good relationship with investors in
the project, i.e. relatives, friends of the investor, (4) the Bt20,000 loan with seven percent
interest available from the Village fund for participants to invest in their weaving, and (5)
information provided by the government.
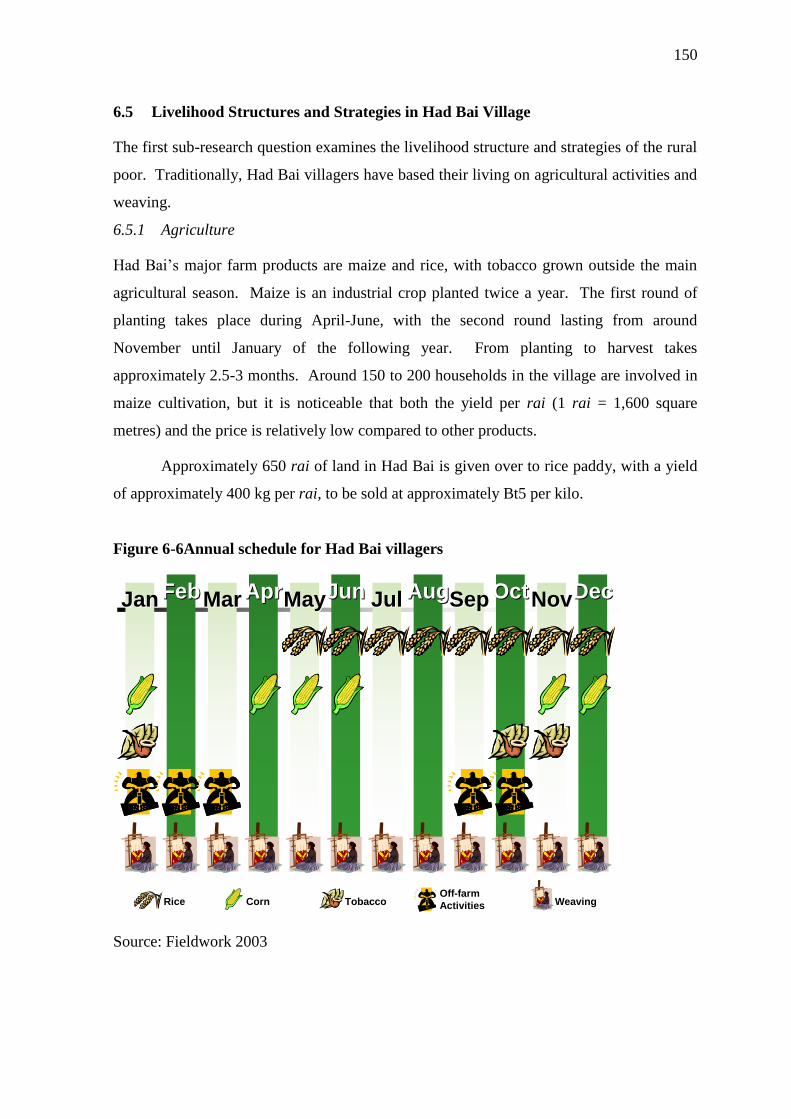
150
6.5 Livelihood Structures and Strategies in Had Bai Village
The first sub-research question examines the livelihood structure and strategies of the rural
poor. Traditionally, Had Bai villagers have based their living on agricultural activities and
weaving.
6.5.1 Agriculture
Had Bai‘s major farm products are maize and rice, with tobacco grown outside the main
agricultural season. Maize is an industrial crop planted twice a year. The first round of
planting takes place during April-June, with the second round lasting from around
November until January of the following year. From planting to harvest takes
approximately 2.5-3 months. Around 150 to 200 households in the village are involved in
maize cultivation, but it is noticeable that both the yield per rai (1 rai = 1,600 square
metres) and the price is relatively low compared to other products.
Approximately 650 rai of land in Had Bai is given over to rice paddy, with a yield
of approximately 400 kg per rai, to be sold at approximately Bt5 per kilo.
Figure 6-6Annual schedule for Had Bai villagers
Source: Fieldwork 2003
JanJan FebFeb MarMar AprAprMayMayJunJun JulJul AugAugSepSep OctOct NovNovDecDec
Rice CornOff-farm
ActivitiesTobacco Weaving
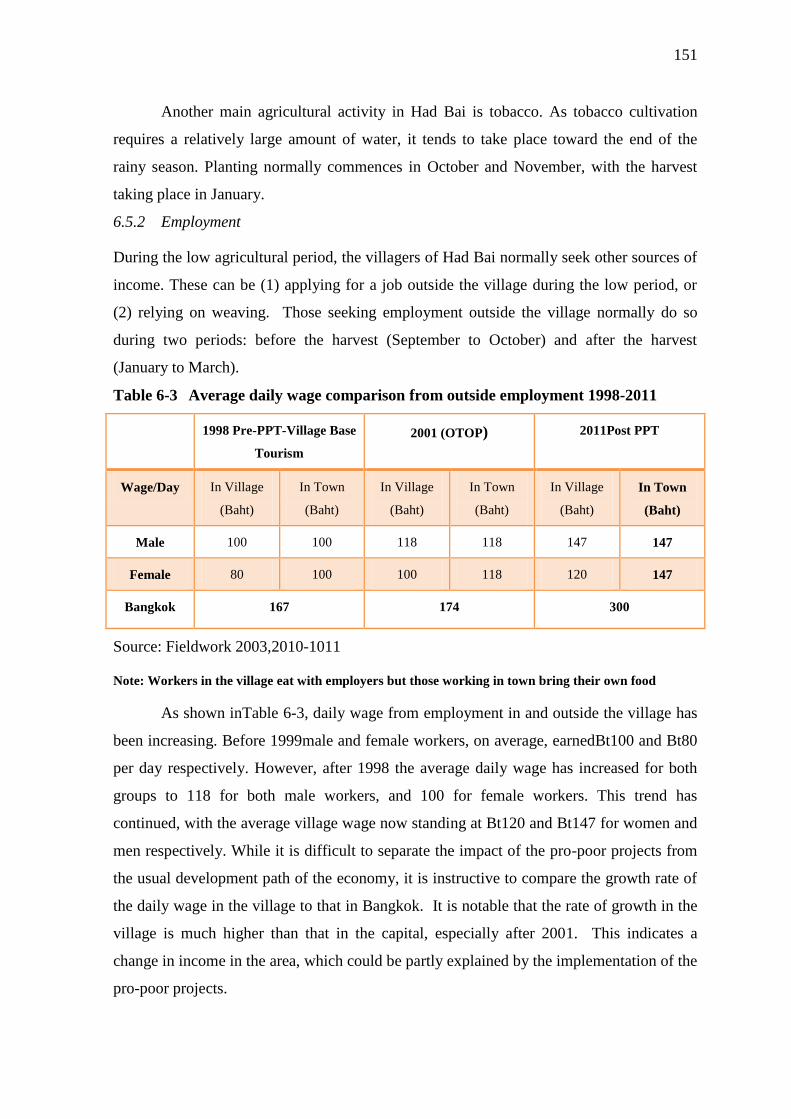
151
Another main agricultural activity in Had Bai is tobacco. As tobacco cultivation
requires a relatively large amount of water, it tends to take place toward the end of the
rainy season. Planting normally commences in October and November, with the harvest
taking place in January.
6.5.2 Employment
During the low agricultural period, the villagers of Had Bai normally seek other sources of
income. These can be (1) applying for a job outside the village during the low period, or
(2) relying on weaving. Those seeking employment outside the village normally do so
during two periods: before the harvest (September to October) and after the harvest
(January to March).
Table 6-3 Average daily wage comparison from outside employment 1998-2011
1998 Pre-PPT-Village Base
Tourism
2001 (OTOP) 2011Post PPT
Wage/Day In Village
(Baht)
In Town
(Baht)
In Village
(Baht)
In Town
(Baht)
In Village
(Baht)
In Town
(Baht)
Male 100 100 118 118 147 147
Female 80 100 100 118 120 147
Bangkok 167 174 300
Source: Fieldwork 2003,2010-1011
Note: Workers in the village eat with employers but those working in town bring their own food
As shown inTable 6-3, daily wage from employment in and outside the village has
been increasing. Before 1999male and female workers, on average, earnedBt100 and Bt80
per day respectively. However, after 1998 the average daily wage has increased for both
groups to 118 for both male workers, and 100 for female workers. This trend has
continued, with the average village wage now standing at Bt120 and Bt147 for women and
men respectively. While it is difficult to separate the impact of the pro-poor projects from
the usual development path of the economy, it is instructive to compare the growth rate of
the daily wage in the village to that in Bangkok. It is notable that the rate of growth in the
village is much higher than that in the capital, especially after 2001. This indicates a
change in income in the area, which could be partly explained by the implementation of the
pro-poor projects.
152
It is also worth pointing out that these are only average wages, and that men, for
instance, could earn Bt150-200 per day as opposed to Bt100 if they undertook potentially
hazardous work such as insecticide spraying.
6.5.3 Weaving
Since the price of agricultural products fluctuates and has in recent years been on a
downward spiral, most households rely on the weaving activities undertaken in spare time
for additional income. There is a bamboo forest around the village, so villagers never have
to buy weaving machines. They cut the bamboo and local trees in the area and assemble
parts of the wood-sticks into weaving machine. As a result, every household has at least
one weaving machine.
The Tai Lue-style Female Weaver Group of Hat Bai Village is a weaver group of
Tai Lue ethic minority group who migrated from Xishuangbanna in the southern Chinese
province of Yunnan to northern Thailand 200 years ago. In spite of being mixed with other
cultures and traditions of other neighbouring ethnic groups as a result of migration, their
cultures have been transferred from generation to generation, especially their unique ethnic
costume and various weaving techniques, e.g. Chok (using of discontinuous supplementary
weft), Kit (using of continuous supplementary weft), Yok Dok or brocade and Koh (using
of continuous supplementary multi-coloured weft) by local female weavers who formed
groups with aims both to preserve their tradition and to increase their household income.
Had Bai‘s weaving is unique. They weave ―up-side down‖. They only see the
back of the pattern while weaving. They have to remember the pattern by heart. They
weave and tide the cotton yarn alternatingly to arrange colours. The beautiful front will be
revealed when finished.Even though silk products in Thailand are more popular than
cotton products but silk products are very difficult to keep in best condition. Cotton
products, especially at Had Bai are easy to preserve. They can be easily washed in a
washing machine. The fabric will become softer the more it has been washed.
153
In 1984, Sukhawadi Tiyatha who was selected to be the chairman of Committee on
Women‘s weaving group Development initiated to her member production of Pha Sin,
tablecloth, place mat, glass mat, traditional blouse from cotton textiles. Their products
were initially produced in traditional way which were made in black and red colours with
animal and flower motif popular among their village‘s visitors. In 1988, Sukhawadi‘ s
products which were showed and sold in Cotton Festival at the Chiangmai Orchid Hotel,
Chiangmai, attracted considerable attention from the visitors and a lot of products were
sold.
In 1993, as a part of the OTOP empowerment programme held by Community
Development Office of Chiang Khong District, 12 members of the group were sent to
attend a training course on grouping, management and financial management for
manufacturing. The Tai Lue-style Female Weaver Group has formally been set up together
with establishment of their money saving group for manufacturing. This group which has
been organised in the form of a committee has its objectives as follows: -
1. To create a supplementary job
2. To preserve the local wisdom
3. To increase income of its members
The Group‘s products initially were various kinds of wraparounds namely Lai Nam
Lai, Lai I Bi, Lai Dok Tho, Lai Bat, Lai Kho Krachae, Lai Dok Nak, Lai Dok Ngao, Lai
Dok Nuai, Lai Kho Noi, plain textile, and other kinds of textile products, e.g.Sabai or Thai
breast cloths,shawls, scarves, Pha Khao Ma cloths, plate mats, bags, shirts for men and
women, pants, etc.Procurement of factors of production, i.e. cotton and synthetic yarns, are
normally carried out by the Group committee which will later sell to the members. The
chairperson is responsible for ordering the goods from shops in Chiangrai and Chiangmai
and the shops later send the goods to the Group accordingly. For some kinds of raw
materials, e.g. chemical dyes, it is ordered by the chairperson from shops in Chiang Rai,
whereas the natural dyes will be procured by the local people. After that cotton and
synthetic yarns will be stored at the Group‘s office and sold to the members who either pay
cash or buy on credit.
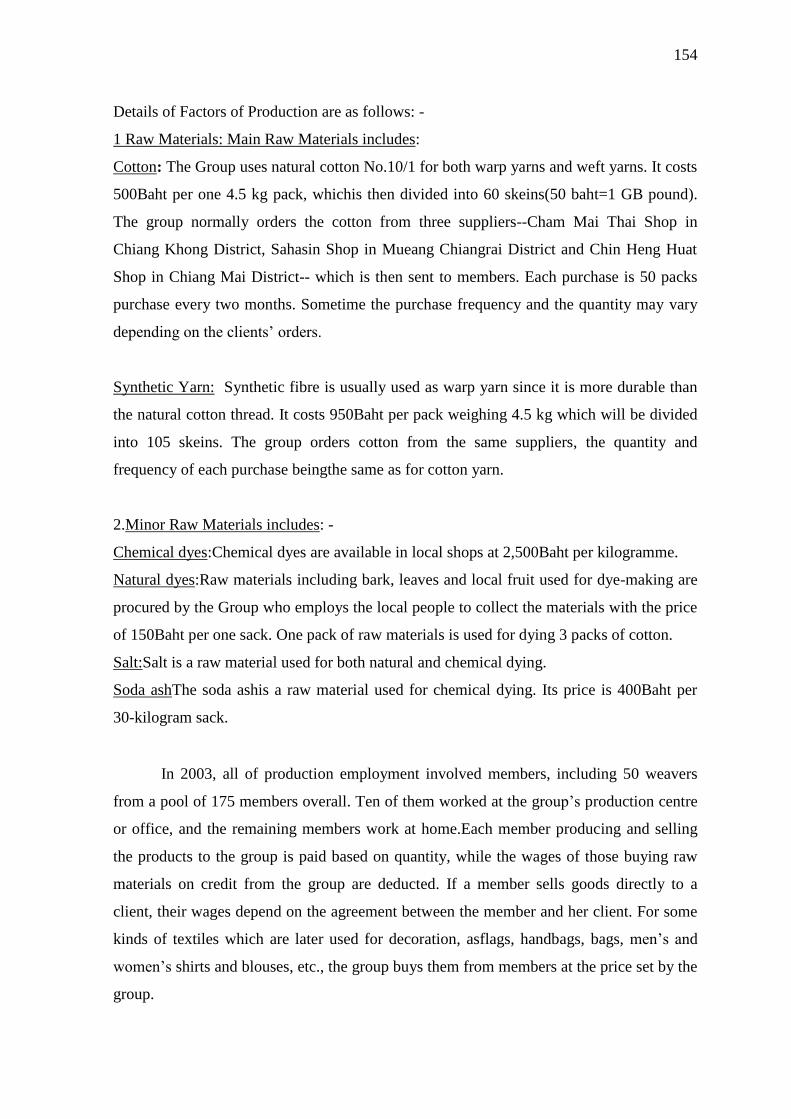
154
Details of Factors of Production are as follows: -
1 Raw Materials: Main Raw Materials includes:
Cotton: The Group uses natural cotton No.10/1 for both warp yarns and weft yarns. It costs
500Baht per one 4.5 kg pack, whichis then divided into 60 skeins(50 baht=1 GB pound).
The group normally orders the cotton from three suppliers--Cham Mai Thai Shop in
Chiang Khong District, Sahasin Shop in Mueang Chiangrai District and Chin Heng Huat
Shop in Chiang Mai District-- which is then sent to members. Each purchase is 50 packs
purchase every two months. Sometime the purchase frequency and the quantity may vary
depending on the clients‘ orders.
Synthetic Yarn: Synthetic fibre is usually used as warp yarn since it is more durable than
the natural cotton thread. It costs 950Baht per pack weighing 4.5 kg which will be divided
into 105 skeins. The group orders cotton from the same suppliers, the quantity and
frequency of each purchase beingthe same as for cotton yarn.
2.Minor Raw Materials includes: -
Chemical dyes:Chemical dyes are available in local shops at 2,500Baht per kilogramme.
Natural dyes:Raw materials including bark, leaves and local fruit used for dye-making are
procured by the Group who employs the local people to collect the materials with the price
of 150Baht per one sack. One pack of raw materials is used for dying 3 packs of cotton.
Salt:Salt is a raw material used for both natural and chemical dying.
Soda ashThe soda ashis a raw material used for chemical dying. Its price is 400Baht per
30-kilogram sack.
In 2003, all of production employment involved members, including 50 weavers
from a pool of 175 members overall. Ten of them worked at the group‘s production centre
or office, and the remaining members work at home.Each member producing and selling
the products to the group is paid based on quantity, while the wages of those buying raw
materials on credit from the group are deducted. If a member sells goods directly to a
client, their wages depend on the agreement between the member and her client. For some
kinds of textiles which are later used for decoration, asflags, handbags, bags, men‘s and
women‘s shirts and blouses, etc., the group buys them from members at the price set by the
group.
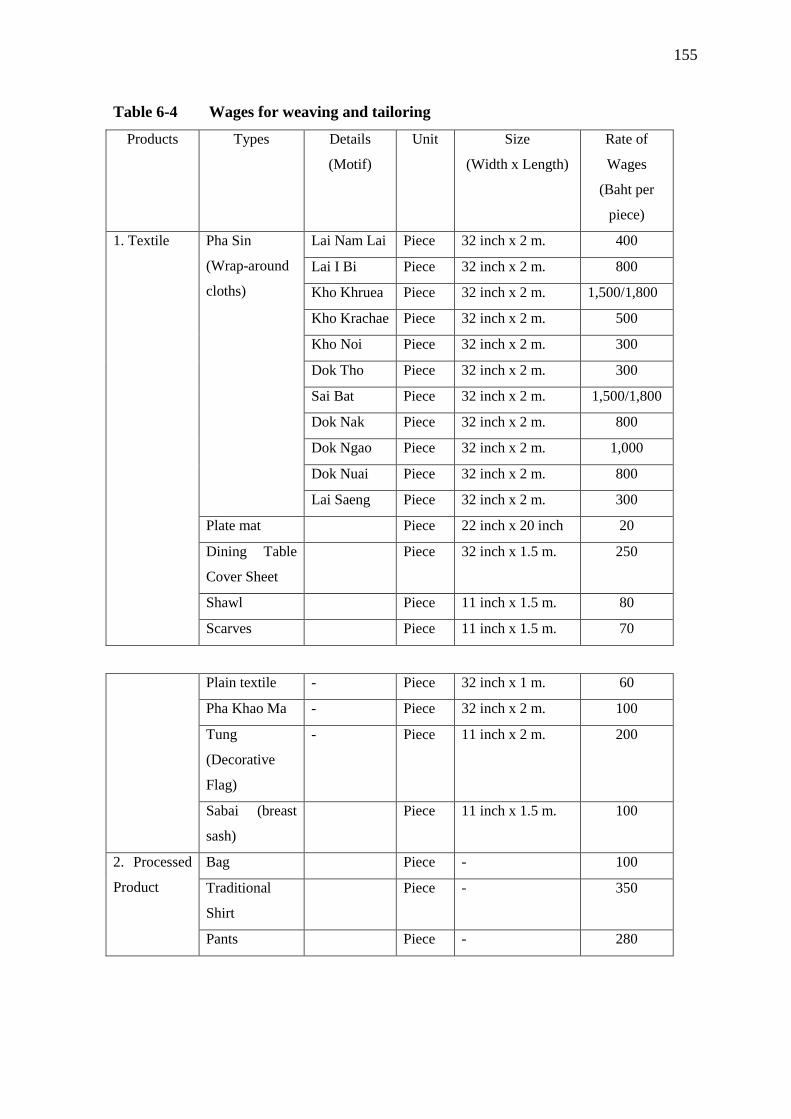
155
Table 6-4 Wages for weaving and tailoring
Products Types Details
(Motif)
Unit Size
(Width x Length)
Rate of
Wages
(Baht per
piece)
1. Textile Pha Sin
(Wrap-around
cloths)
Lai Nam Lai Piece 32 inch x 2 m. 400
Lai I Bi Piece 32 inch x 2 m. 800
Kho Khruea Piece 32 inch x 2 m. 1,500/1,800
Kho Krachae Piece 32 inch x 2 m. 500
Kho Noi Piece 32 inch x 2 m. 300
Dok Tho Piece 32 inch x 2 m. 300
Sai Bat Piece 32 inch x 2 m. 1,500/1,800
Dok Nak Piece 32 inch x 2 m. 800
Dok Ngao Piece 32 inch x 2 m. 1,000
Dok Nuai Piece 32 inch x 2 m. 800
Lai Saeng Piece 32 inch x 2 m. 300
Plate mat Piece 22 inch x 20 inch 20
Dining Table
Cover Sheet
Piece 32 inch x 1.5 m. 250
Shawl Piece 11 inch x 1.5 m. 80
Scarves Piece 11 inch x 1.5 m. 70
Plain textile - Piece 32 inch x 1 m. 60
Pha Khao Ma - Piece 32 inch x 2 m. 100
Tung
(Decorative
Flag)
- Piece 11 inch x 2 m. 200
Sabai (breast
sash)
Piece 11 inch x 1.5 m. 100
2. Processed
Product
Bag Piece - 100
Traditional
Shirt
Piece - 350
Pants Piece - 280
156
The group‘s production process is in the same way as other enterprises, starting
from procuring raw materials and distributing them to members. The group is also
responsible for dying of cotton yarn and employing local people to collectbarks with the
price of 150Baht per sack (one sack of wood barks is used for cotton dying once). In each
time of dying, the Group hires 3 members with the wages of 100Baht per person per day.
After receiving the thread, the member will prepare the cotton thread by putting the threat
into the shuttle for both the weft and the warp yarns. Then another group of people will be
hired to prepare the motif and then the process of weaving is started. With respect to
processedproducts, the fabrics made by the members will be transformed into the products
as required which will be sold to the Group and to the clients.
The price of the Group‘s products can be divided into three levels, including buying
price from the members, wholesale price and retail price. The buying price from the
members is set by the cost of raw materials and labour. The wholesale price is based on the
buying price from the members plus the cost of expenses of the Group and slight profit.
The retail price is based on the wholesale price plus profit anticipated by the Group. The
samples of pricing are as follows: -
Wrap-around with Dok Tho and I-Bi Motif – In one piece of the product, the cost
of production and the transport cost to market is 794.33Baht per piece. The buying price
for the members is set at 750Baht each. The wholesale price is set at 800Baht and
1,000Baht at retail. The profit at wholesale and retail gained by the group based on the cost
of production is 5.67Baht per item and 205.67Baht per item, respectively. Mark up on cost
(Mark-On) for the price buying from the members and the wholesale price are -5.58
percent and 0.71 percent, respectively, which means if the cost is 100Baht, the group will
set the buying price from the members 5.58Baht lower than cost and will gain the profit
from wholesaling 0.71Baht per piece. The mark up on selling price or Mark-Up for retail
price is set at 20.57 percent. This means if the price is set at 100Baht, the Group will gain
20.57Baht per piece as profit.
Wrap-around with Dok Nuai Motif – The cost of production and the market cost of
one piece of wraparound is 1,544.33Baht each. The buying price for members is set at
1,500Baht each. The wholesale price is set at 1,800Baht each and 2,500Baht per piece for
157
the retail price. The profit for the wholesale and the retail gained by the Group based on
the cost of production and the marketing cost is 255.67Baht per piece and 955.67Baht per
piece, respectively. Mark-On for the buying price for the members and the wholesale price
are -2.87% and 16.56%, respectively. This means if the cost is 100Baht, the Group will set
the buying price for the members 2.87Baht per piece lower than the actual cost and will
gain profit from the wholesale 16.56Baht per piece. The Mark-Up for the retail price is set
at 38.23%. This means if the price is 100Baht, the Group will gain 38.23Baht as the profit
from retailing.
The price of the Thai Lue weaving was relatively satisfactory to the villagers. Most
popular weavings cloths come in two standard sizes. A smaller piece of32 inch x 1 m.
which normally takes one week to complete, could be sold in the village for around Bt500,
while the larger size of around32 inch x 2 m., which takes almost a month to finish, can sell
for around Bt2,000. Income from weaving is thus significant, especially when compared
to average monthly income from agriculture of Bt2,000-3,000 baht(or slightly more for
land owners) Moreover, this figures does not include extra income from tourism for those
who also exhibit their weaving in the weaving museum.
During 1997 – 2001, the Group was supported by Community Development Office
of Chiang Khong District who provided them with construction of a production center
building. In 1998, Agriculture Office of Chiang Khong District provided them with budget
for purchasing looms and cotton. In 2001, Rim Khong Subdistrict Administration
Organization provided them with 100,000 Baht budget for purchasing 100-inch loom,
related equipment and cotton. From 2002 to present The Tai Lue-style Female Weaver
Group becomes well-known throughout the region as a result of support from both the
public and the private sectors. The Group is usually invited to participate in trade fairs,
where a number of purchase orders have been made.
The managerial success of the group became a major factor of their achievement in
product development and domestic market expansion. Their recognizable products‘ quality
due to the use of developed techniques also contributed to the winning of many awards,
e.g. Northern Thai-Style Textile Contest Award presented by HM the Queen on the
occasion of HM the Queen‘s Birthday Anniversary in 1993, 4-Star OTOP (One Tambon
158
One Product) Award (Northern Region) in 2003, etc. The group‘s operation did not only
become a new source of income of its members and strengthen the community, but their
achievement in preserving their heritage also resulted in elevating their community-level
enterprise.
6.5.4 Local Resources of Had Bai
Traditional ―Thai Lue‖ Costume:Had Bai ladies wear ankle-length skirts, embroidered
cotton blouses, hair buns with silver hairpins, silver earrings and bracelets while men put
on cotton shirts and pairs of knee-length trousers of Chinese style.
Local Language:―Thai Lue‖ and ―Thai Khuen‖ for both spoken and written.
Music: Lue-stylesinging, flute playing and ―Cheung Dancing‖, Sword dance.
Food: Rice cooked in a section of thick bamboo, vegetable with shrimp paste and chili
sauce, Khong River seaweed spicy soup, roasted seaweed, fried seaweed, boiled bamboo
shoot with shrimp paste and chili sauce.
Festival:
- Traditional New Year (Songkran Day of 12,13 and 14 April);Paying respect to
the elder by pouring pure water into their hands;holding a village celebration;
performing folk play for children;carrying sand from the beach into a temple
- The Buddhist Lent and the end of the Buddhist Lent
- An annual festival of Thailand performed on the full-moon night in November,
when people flint krathongs in the rivers and canal
- Weaving the costume of the monk, usually finished within 24 hours
- The sermon on the Buddha‘s previous life in March
- Traditional Thai Lue wedding ceremony
- -The boat competition in Khong River
- Going into monkhood for the novice in Buddhism, usually at the age below 20.
159
Belief:
- Getting rid of bad luck
- Strengthening one‘s morale when being sick or encountering accidents by the
expert of this field
- The belief of the house ghost, the god and goddess of the mountain, the god of
the temple
Livelihood:
- Thai Lue people earn their living by doing paddy farming, farming grain crops,
vegetables and fruits. The housewives weave clothes in unique design of Thai
Lue by hand. The men of Thai Lue go fishing in Khong River and ponds, go
hunting up on the mountain and make basketry and wicker ware of household
use.
Natural Resourcesand Tourist spots
- Mekong River
- Fish in Mekong River
- Round and beautiful rock of Mekong River
- Gold in Mekong River, particularly on the bank of Laos
- Geographical features of 3 beautiful mountains – Chom Moak Mountain, Huay
Hok Mountain and Huay Hok Waterfall Mountain -- as the village‘s backdrop,
which ―Sri Chom Moak Relic of the Buddha‖ that people respect is situated on
the top of Chom Moak Mountain. In wintertourists enjoy very beautiful sea of
fog in the area.
- The scenery of the beautiful Mekong River (especially when going up to view
the scenery of the Chom Moak Mountain)
- Plants of wild type, wild animals on the mountain e.g. banana forest, bamboo
forest, barking deer, wild boars, wild fowls, various types of birds with
beautiful color, squirrels etc.
- Rice farm and the Combination of Crops Farm under the Royal Project, orange
farm on the mountain, white green garden, tobacco, corns and Indian nuts
- The Royal Buddha Image (The main Buddha statue in Had Bye Temple)
- The shrine of Kai Jae God (god of bantum) under the big tree beside Had Bye
Temple
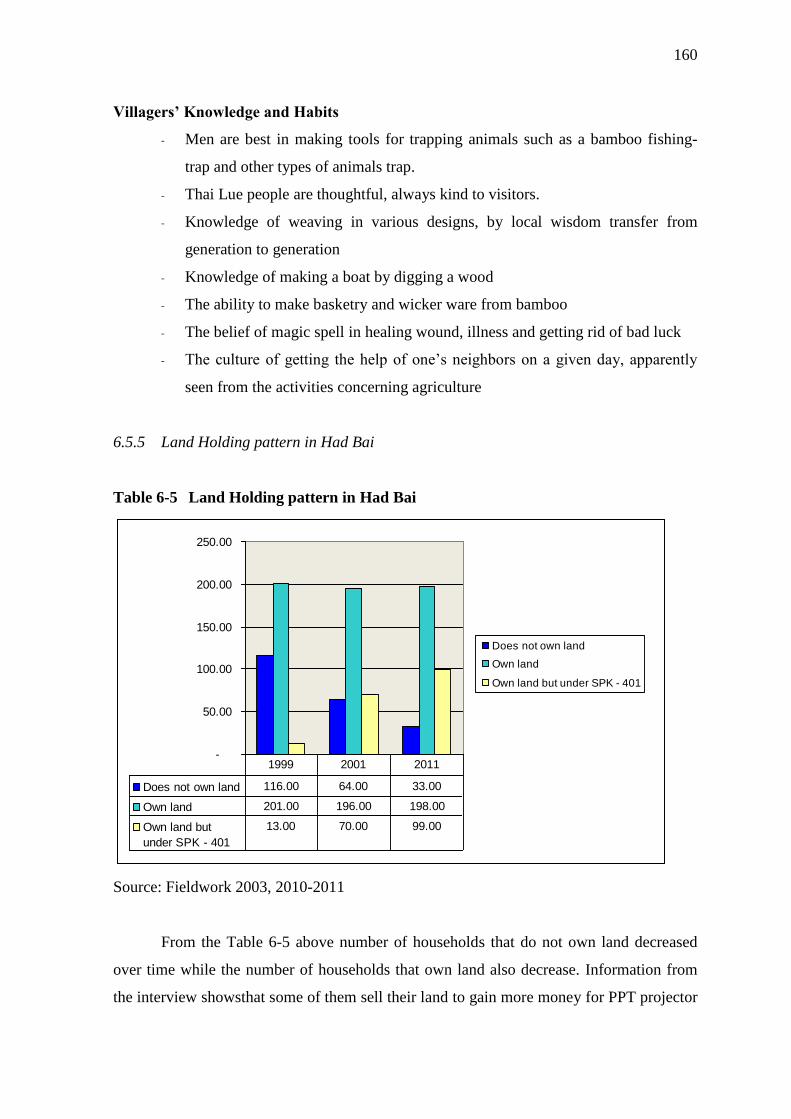
160
Villagers‘ Knowledge and Habits
- Men are best in making tools for trapping animals such as a bamboo fishing-
trap and other types of animals trap.
- Thai Lue people are thoughtful, always kind to visitors.
- Knowledge of weaving in various designs, by local wisdom transfer from
generation to generation
- Knowledge of making a boat by digging a wood
- The ability to make basketry and wicker ware from bamboo
- The belief of magic spell in healing wound, illness and getting rid of bad luck
- The culture of getting the help of one‘s neighbors on a given day, apparently
seen from the activities concerning agriculture
6.5.5 Land Holding pattern in Had Bai
Table 6-5 Land Holding pattern in Had Bai
Source: Fieldwork 2003, 2010-2011
From the Table 6-5 above number of households that do not own land decreased
over time while the number of households that own land also decrease. Information from
the interview showsthat some of them sell their land to gain more money for PPT projector
-
50.00
100.00
150.00
200.00
250.00
Does not own land
Own land
Own land but under SPK - 401
Does not own land 116.00 64.00 33.00
Own land 201.00 196.00 198.00
Own land but
under SPK - 401
13.00 70.00 99.00
1999 2001 2011
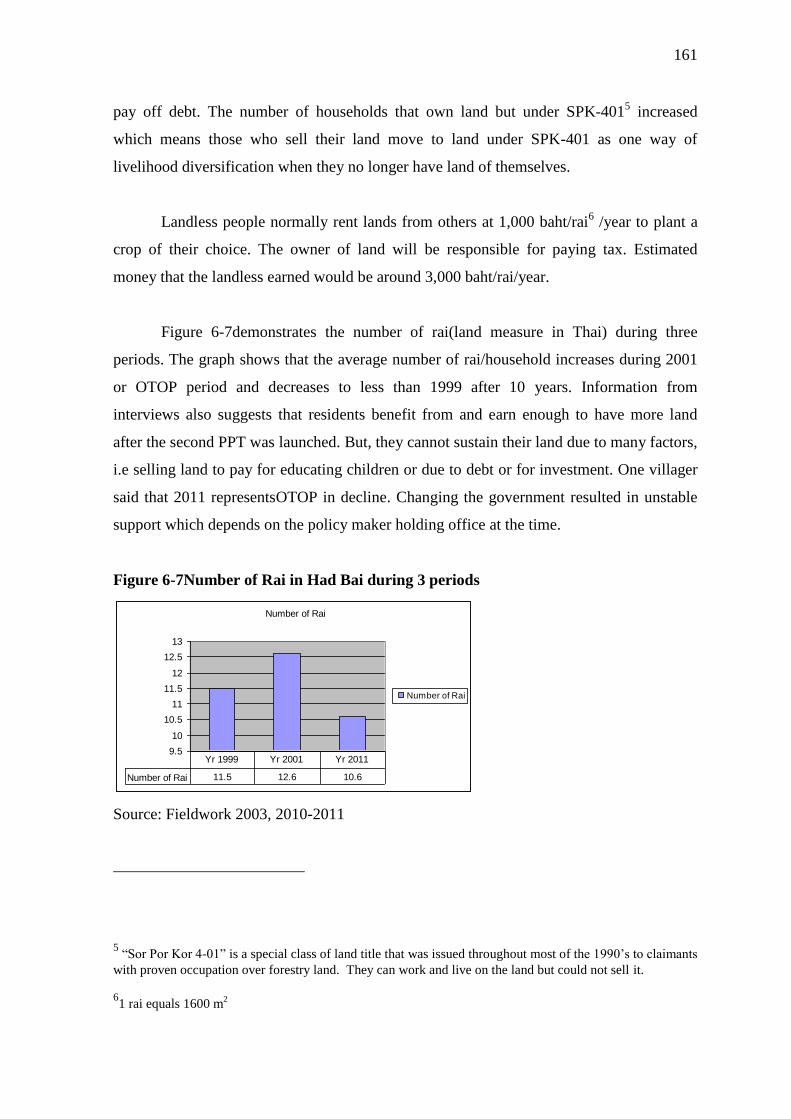
161
pay off debt. The number of households that own land but under SPK-4015 increased
which means those who sell their land move to land under SPK-401 as one way of
livelihood diversification when they no longer have land of themselves.
Landless people normally rent lands from others at 1,000 baht/rai6 /year to plant a
crop of their choice. The owner of land will be responsible for paying tax. Estimated
money that the landless earned would be around 3,000 baht/rai/year.
Figure 6-7demonstrates the number of rai(land measure in Thai) during three
periods. The graph shows that the average number of rai/household increases during 2001
or OTOP period and decreases to less than 1999 after 10 years. Information from
interviews also suggests that residents benefit from and earn enough to have more land
after the second PPT was launched. But, they cannot sustain their land due to many factors,
i.e selling land to pay for educating children or due to debt or for investment. One villager
said that 2011 representsOTOP in decline. Changing the government resulted in unstable
support which depends on the policy maker holding office at the time.
Figure 6-7Number of Rai in Had Bai during 3 periods
Source: Fieldwork 2003, 2010-2011
5 ―Sor Por Kor 4-01‖ is a special class of land title that was issued throughout most of the 1990‘s to claimants
with proven occupation over forestry land. They can work and live on the land but could not sell it.
61 rai equals 1600 m
2
Number of Rai
9.5
10
10.5
11
11.5
12
12.5
13
Number of Rai
Number of Rai 11.5 12.6 10.6
Yr 1999 Yr 2001 Yr 2011
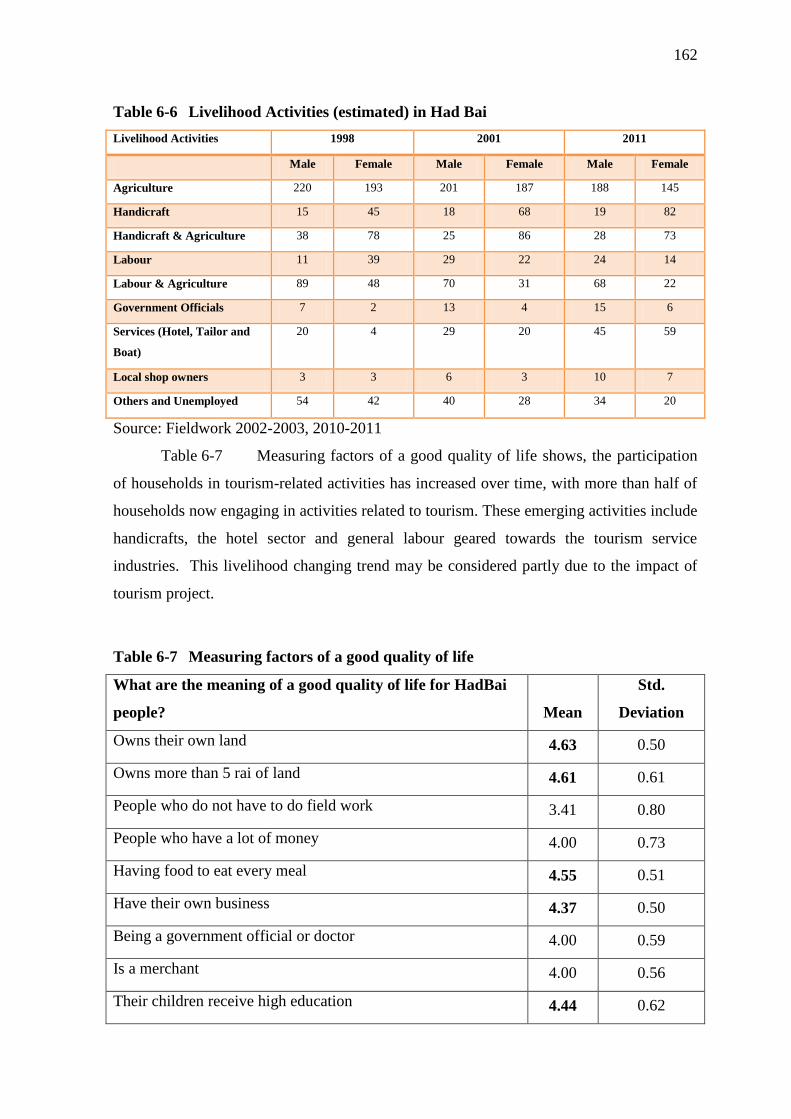
162
Table 6-6 Livelihood Activities (estimated) in Had Bai
Livelihood Activities 1998 2001 2011
Male Female Male Female Male Female
Agriculture 220 193 201 187 188 145
Handicraft 15 45 18 68 19 82
Handicraft & Agriculture 38 78 25 86 28 73
Labour 11 39 29 22 24 14
Labour & Agriculture 89 48 70 31 68 22
Government Officials 7 2 13 4 15 6
Services (Hotel, Tailor and
Boat)
20 4 29 20 45 59
Local shop owners 3 3 6 3 10 7
Others and Unemployed 54 42 40 28 34 20
Source: Fieldwork 2002-2003, 2010-2011
Table 6-7 Measuring factors of a good quality of life shows, the participation
of households in tourism-related activities has increased over time, with more than half of
households now engaging in activities related to tourism. These emerging activities include
handicrafts, the hotel sector and general labour geared towards the tourism service
industries. This livelihood changing trend may be considered partly due to the impact of
tourism project.
Table 6-7 Measuring factors of a good quality of life
What are the meaning of a good quality of life for HadBai
people? Mean
Std.
Deviation
Owns their own land 4.63 0.50
Owns more than 5 rai of land 4.61 0.61
People who do not have to do field work 3.41 0.80
People who have a lot of money 4.00 0.73
Having food to eat every meal 4.55 0.51
Have their own business 4.37 0.50
Being a government official or doctor 4.00 0.59
Is a merchant 4.00 0.56
Their children receive high education 4.44 0.62
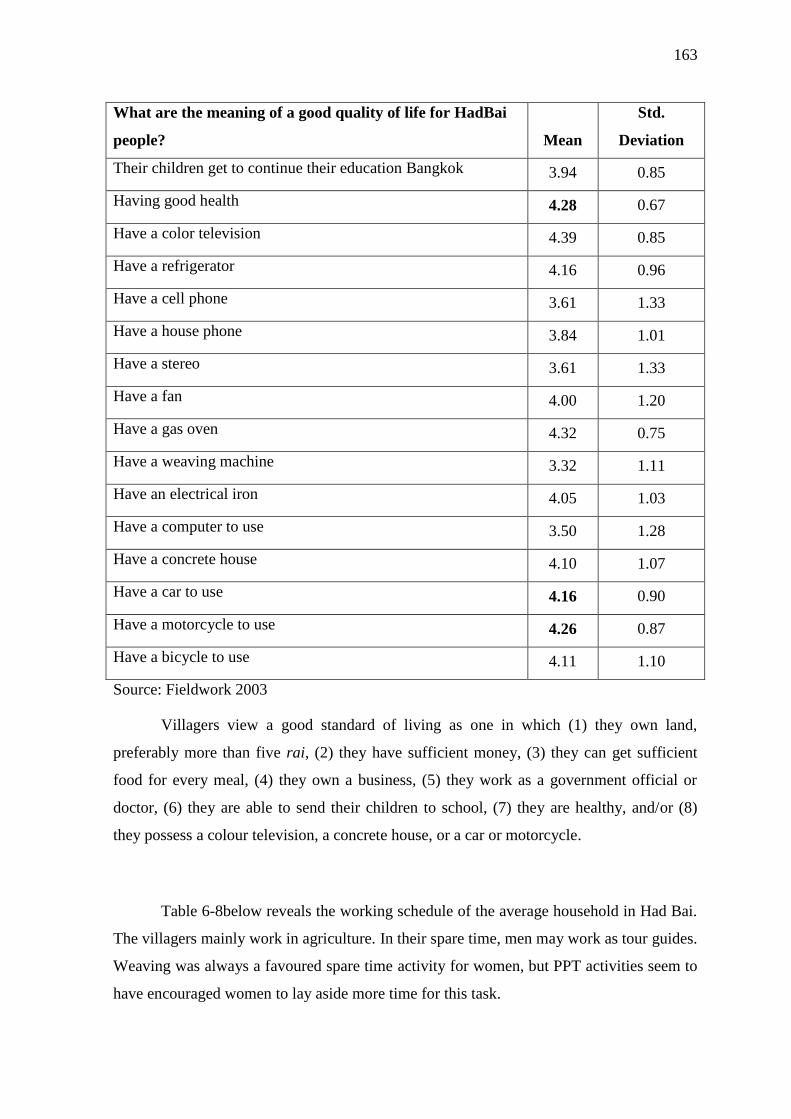
163
What are the meaning of a good quality of life for HadBai
people? Mean
Std.
Deviation
Their children get to continue their education Bangkok 3.94 0.85
Having good health 4.28 0.67
Have a color television 4.39 0.85
Have a refrigerator 4.16 0.96
Have a cell phone 3.61 1.33
Have a house phone 3.84 1.01
Have a stereo 3.61 1.33
Have a fan 4.00 1.20
Have a gas oven 4.32 0.75
Have a weaving machine 3.32 1.11
Have an electrical iron 4.05 1.03
Have a computer to use 3.50 1.28
Have a concrete house 4.10 1.07
Have a car to use 4.16 0.90
Have a motorcycle to use 4.26 0.87
Have a bicycle to use 4.11 1.10
Source: Fieldwork 2003
Villagers view a good standard of living as one in which (1) they own land,
preferably more than five rai, (2) they have sufficient money, (3) they can get sufficient
food for every meal, (4) they own a business, (5) they work as a government official or
doctor, (6) they are able to send their children to school, (7) they are healthy, and/or (8)
they possess a colour television, a concrete house, or a car or motorcycle.
Table 6-8below reveals the working schedule of the average household in Had Bai.
The villagers mainly work in agriculture. In their spare time, men may work as tour guides.
Weaving was always a favoured spare time activity for women, but PPT activities seem to
have encouraged women to lay aside more time for this task.
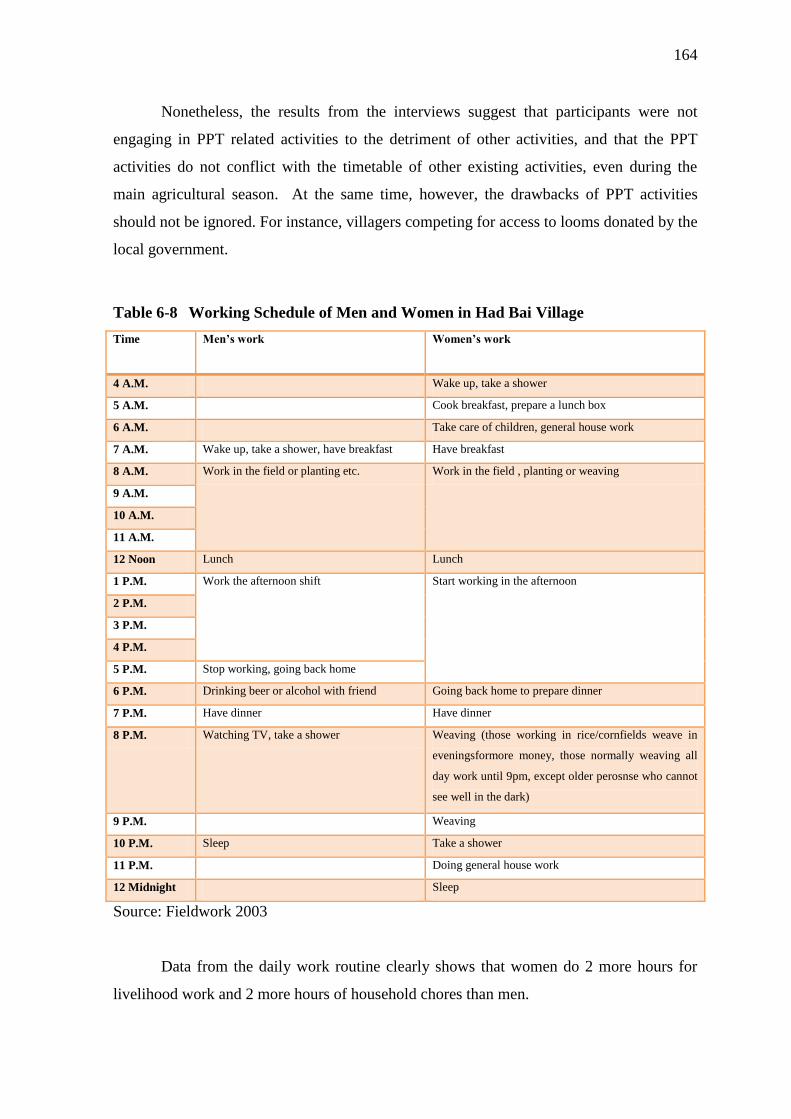
164
Nonetheless, the results from the interviews suggest that participants were not
engaging in PPT related activities to the detriment of other activities, and that the PPT
activities do not conflict with the timetable of other existing activities, even during the
main agricultural season. At the same time, however, the drawbacks of PPT activities
should not be ignored. For instance, villagers competing for access to looms donated by the
local government.
Table 6-8 Working Schedule of Men and Women in Had Bai Village
Time
Men‘s work
Women‘s work
4 A.M. Wake up, take a shower
5 A.M. Cook breakfast, prepare a lunch box
6 A.M. Take care of children, general house work
7 A.M. Wake up, take a shower, have breakfast Have breakfast
8 A.M. Work in the field or planting etc. Work in the field , planting or weaving
9 A.M.
10 A.M.
11 A.M.
12 Noon Lunch Lunch
1 P.M. Work the afternoon shift Start working in the afternoon
2 P.M.
3 P.M.
4 P.M.
5 P.M. Stop working, going back home
6 P.M. Drinking beer or alcohol with friend Going back home to prepare dinner
7 P.M. Have dinner Have dinner
8 P.M. Watching TV, take a shower Weaving (those working in rice/cornfields weave in
eveningsformore money, those normally weaving all
day work until 9pm, except older perosnse who cannot
see well in the dark)
9 P.M. Weaving
10 P.M. Sleep Take a shower
11 P.M. Doing general house work
12 Midnight Sleep
Source: Fieldwork 2003
Data from the daily work routine clearly shows that women do 2 more hours for
livelihood work and 2 more hours of household chores than men.
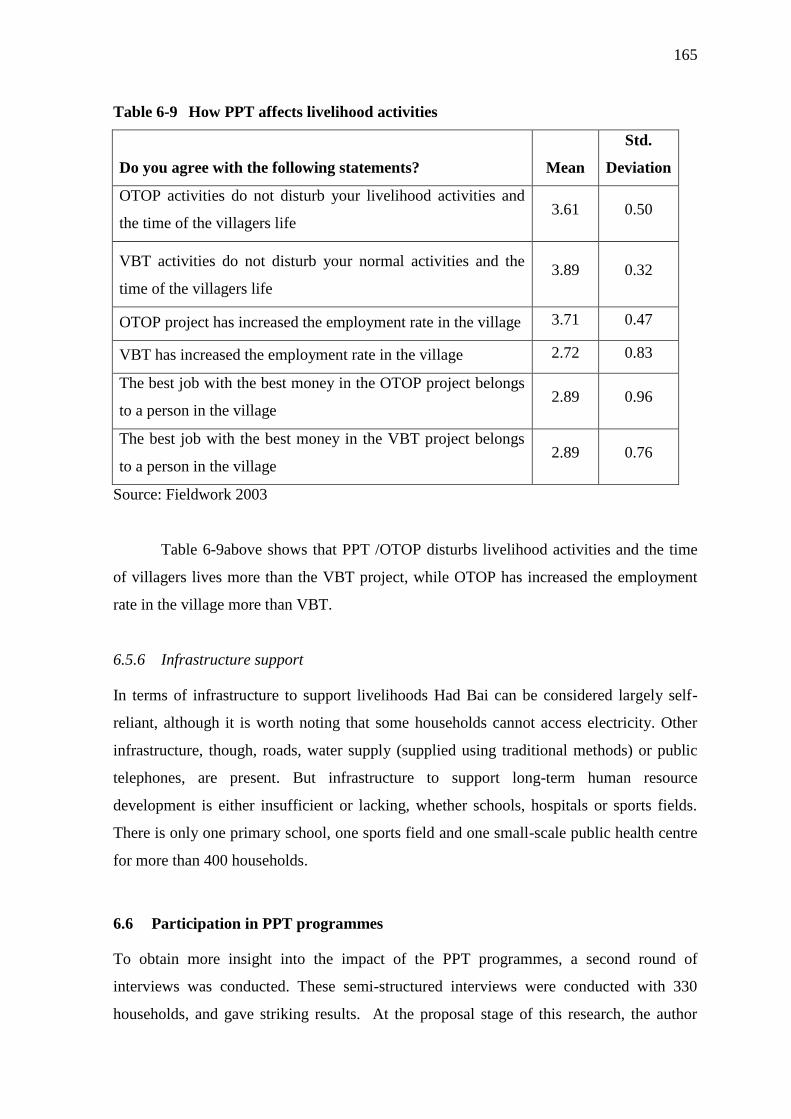
165
Table 6-9 How PPT affects livelihood activities
Do you agree with the following statements? Mean
Std.
Deviation
OTOP activities do not disturb your livelihood activities and
the time of the villagers life 3.61 0.50
VBT activities do not disturb your normal activities and the
time of the villagers life
3.89 0.32
OTOP project has increased the employment rate in the village 3.71 0.47
VBT has increased the employment rate in the village 2.72 0.83
The best job with the best money in the OTOP project belongs
to a person in the village 2.89 0.96
The best job with the best money in the VBT project belongs
to a person in the village 2.89 0.76
Source: Fieldwork 2003
Table 6-9above shows that PPT /OTOP disturbs livelihood activities and the time
of villagers lives more than the VBT project, while OTOP has increased the employment
rate in the village more than VBT.
6.5.6 Infrastructure support
In terms of infrastructure to support livelihoods Had Bai can be considered largely self-
reliant, although it is worth noting that some households cannot access electricity. Other
infrastructure, though, roads, water supply (supplied using traditional methods) or public
telephones, are present. But infrastructure to support long-term human resource
development is either insufficient or lacking, whether schools, hospitals or sports fields.
There is only one primary school, one sports field and one small-scale public health centre
for more than 400 households.
6.6 Participation in PPT programmes
To obtain more insight into the impact of the PPT programmes, a second round of
interviews was conducted. These semi-structured interviews were conducted with 330
households, and gave striking results. At the proposal stage of this research, the author
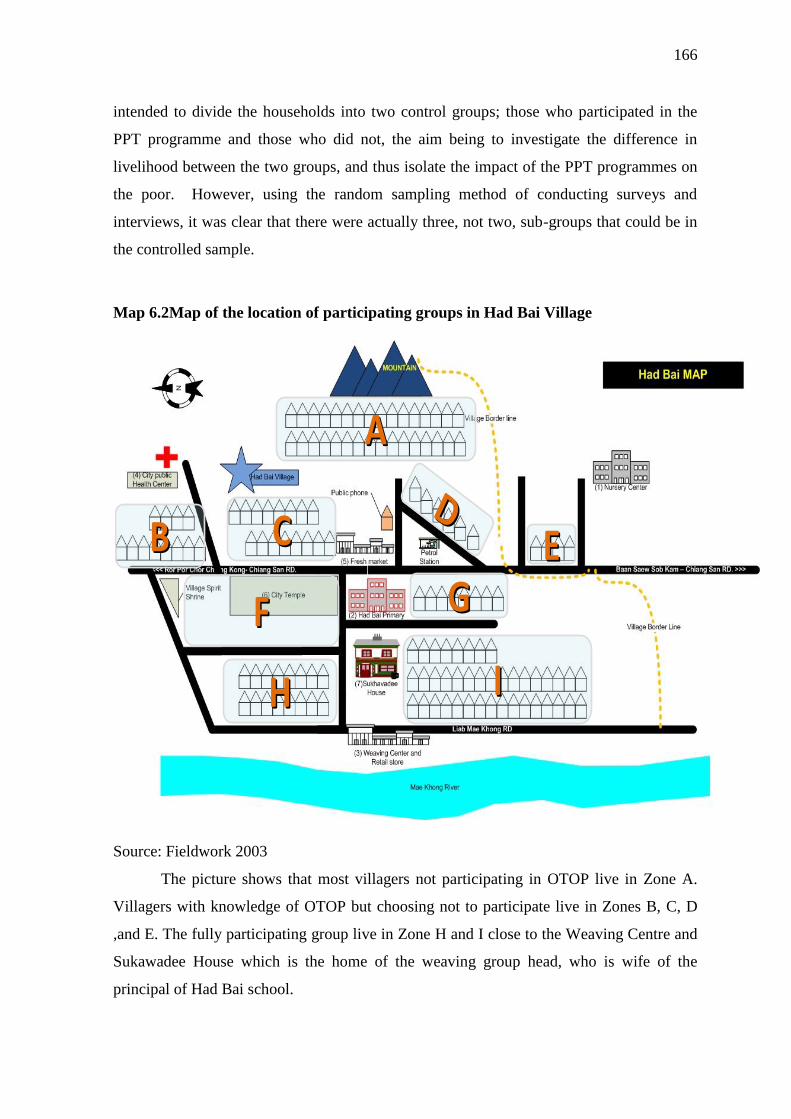
166
intended to divide the households into two control groups; those who participated in the
PPT programme and those who did not, the aim being to investigate the difference in
livelihood between the two groups, and thus isolate the impact of the PPT programmes on
the poor. However, using the random sampling method of conducting surveys and
interviews, it was clear that there were actually three, not two, sub-groups that could be in
the controlled sample.
Map 6.2Map of the location of participating groups in Had Bai Village
Source: Fieldwork 2003
The picture shows that most villagers not participating in OTOP live in Zone A.
Villagers with knowledge of OTOP but choosing not to participate live in Zones B, C, D
,and E. The fully participating group live in Zone H and I close to the Weaving Centre and
Sukawadee House which is the home of the weaving group head, who is wife of the
principal of Had Bai school.
AA
BB CC
HH
GG
II
DDEE
FF
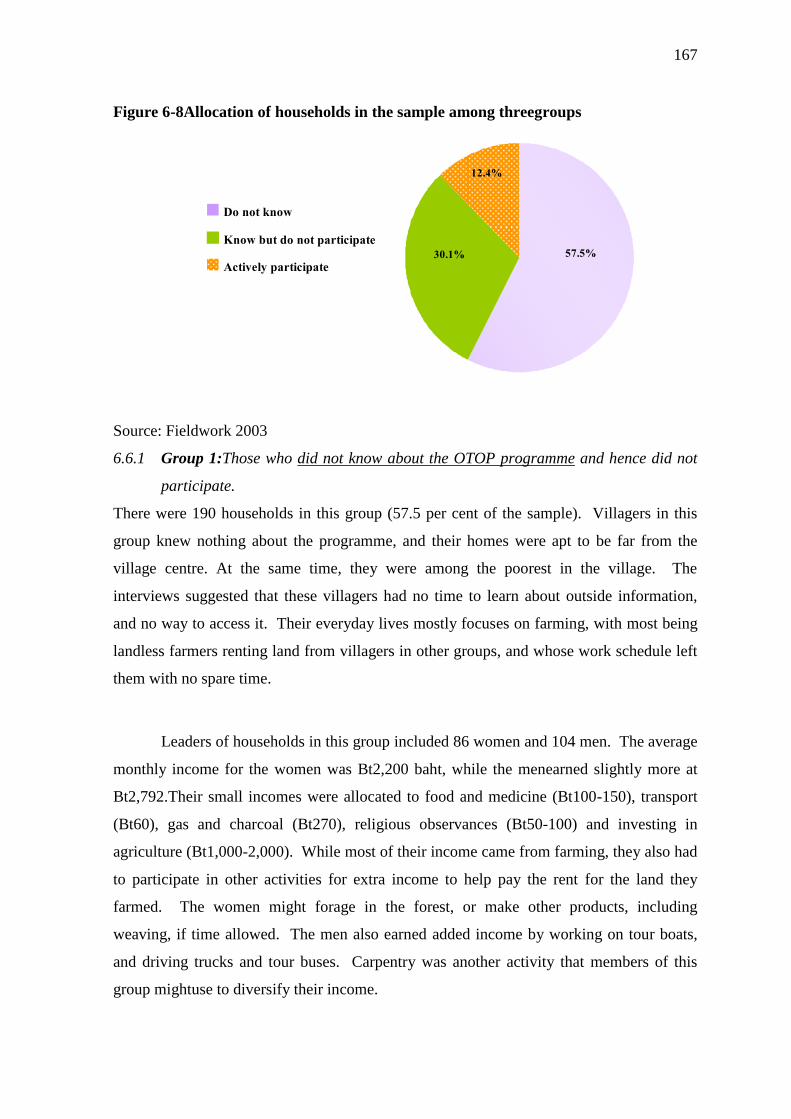
167
Figure 6-8Allocation of households in the sample among threegroups
Source: Fieldwork 2003
6.6.1 Group 1:Those who did not know about the OTOP programme and hence did not
participate.
There were 190 households in this group (57.5 per cent of the sample). Villagers in this
group knew nothing about the programme, and their homes were apt to be far from the
village centre. At the same time, they were among the poorest in the village. The
interviews suggested that these villagers had no time to learn about outside information,
and no way to access it. Their everyday lives mostly focuses on farming, with most being
landless farmers renting land from villagers in other groups, and whose work schedule left
them with no spare time.
Leaders of households in this group included 86 women and 104 men. The average
monthly income for the women was Bt2,200 baht, while the menearned slightly more at
Bt2,792.Their small incomes were allocated to food and medicine (Bt100-150), transport
(Bt60), gas and charcoal (Bt270), religious observances (Bt50-100) and investing in
agriculture (Bt1,000-2,000). While most of their income came from farming, they also had
to participate in other activities for extra income to help pay the rent for the land they
farmed. The women might forage in the forest, or make other products, including
weaving, if time allowed. The men also earned added income by working on tour boats,
and driving trucks and tour buses. Carpentry was another activity that members of this
group mightuse to diversify their income.
12.4%
57.5%30.1%
Do not know
Know but do not participate
Actively participate
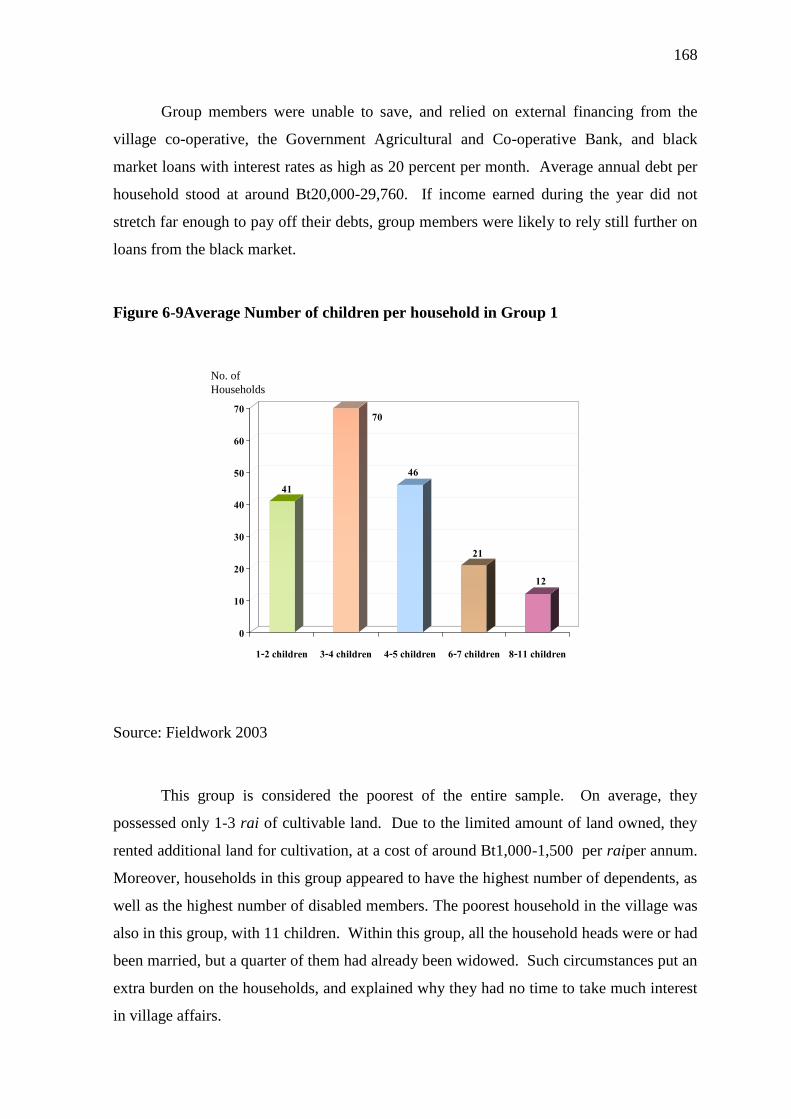
168
Group members were unable to save, and relied on external financing from the
village co-operative, the Government Agricultural and Co-operative Bank, and black
market loans with interest rates as high as 20 percent per month. Average annual debt per
household stood at around Bt20,000-29,760. If income earned during the year did not
stretch far enough to pay off their debts, group members were likely to rely still further on
loans from the black market.
Figure 6-9Average Number of children per household in Group 1
Source: Fieldwork 2003
This group is considered the poorest of the entire sample. On average, they
possessed only 1-3 rai of cultivable land. Due to the limited amount of land owned, they
rented additional land for cultivation, at a cost of around Bt1,000-1,500 per raiper annum.
Moreover, households in this group appeared to have the highest number of dependents, as
well as the highest number of disabled members. The poorest household in the village was
also in this group, with 11 children. Within this group, all the household heads were or had
been married, but a quarter of them had already been widowed. Such circumstances put an
extra burden on the households, and explained why they had no time to take much interest
in village affairs.
41
70
46
21
12
0
10
20
30
40
50
60
70
1-2 children 3-4 children 4-5 children 6-7 children 8-11 children
No. of
Households
169
However, it is worth noting that despite their lower income relative to other groups,
group members tended to have lower liabilities. Having little communication with other
villagers, together with their lack of assetsfor collateral, households in this group had quite
limited access to financingsources. While some were reliant on black market loans, the
interviews showed that many attempted to manage their expenditures effectively rather
than borrow.
In order to manage their income, they sought to follow a ‗sufficiency economy‘
model, in which they optimised their expenditure by only purchasing necessities.
Moreover, the fact that they had very little exposure to the outside world, as well as their
lack of basic infrastructure, helped them to follow a sufficiency economy model more
easily; they had no need for a television or mobile phone, for instance, which might have
added significantly to their expenditure.
A household leader in this group confirmed this with the author:
“With a wife and three children, the average cash I usually carried in the household
was only 5 baht. With only a small piece of land, my food was in the water and forests.
My monetary income was used in paying the rent for extra land and I saw no need to
save or borrow”(Anonymous 2003a)
The family was one of the extreme examples of self-sufficiency. Low income, low
debt, and low asset levels are the major characteristics of this group. While it could be
argued that the PPT programme failed in its objective to reach the poorest, it is worth
noting that members of this group do not perceive themselves to have been disadvantaged
by not participating.
6.6.2 Group 2: Villagerswith knowledge of OTOP, who chose to not participate.
There were 100 households falling into this group (30.1 per cent of the sample). Of the
total households, 27 were led by women and 73 by men. The average land ownership was
more than 15 rai per household. In addition to farming, the major income-generating
170
activity for men, added income was earned from working outside the village and renting
out land, mainly to people in Group 1.
Women earned additional income by selling weaving (but outside the OTOP
scheme), or through trade and livestock rearing. The household leaders in this group were
all married and appeared to have considerably fewer children than the previous group;
most had only 1-2 children and the rest had no more than four children. As their income
was relatively high, most of their children were in school. Their monthly income averaged
around Bt3,528 for women and Bt3,750 for male household leaders. Most expenses
resembled those of the first group, with the exception of significant additional spending on
mobile phones (Bt300 per month) and electricity (Bt450 per month).
However, this group suffered some very clear disadvantages compared to those
households participating in the PPT project, namely:
1. The cost of the weaving materials. Group members faced significantly higher
outlays, as unlike OTOP participants, who by placing large orders could pay at
wholesale prices, they were forced to pay the retail price.
2. The access to markets for the weaving products was limited. Sales fluctuated on a
monthly basis in accordance with demand, and in some months households might
only be able to sell one small piece of weaving, leaving them financially
vulnerable.
As members of this group experienced severe fluctuations of household income,
they had to cover their relatively large expenditure with external borrowing. Even with
their better access to the tourists, the income of their sales did not increase by much.
Moreover, they were more likely than members of the first group to incur debts. The
relatively large level of asset ownership, coupled with ease of access to information,
allowed them greater access to government and village financing. In addition, the credit
line allocated to these households was as high as Bt38,000. This contributed to an average
annual debt of around Bt49,833 for women and Bt48,324 for men.
171
This relatively high level of debt made this group particularly vulnerable;
especially as they had smaller cushions in terms of financing should adverse events take
place in the future.
The major reason given by members of this group for not joining the PPT project
was a perception that investment in the project, which necessitated entering into a co-
operative-like partnership, was inherently risky. They felt that as income from sales might
be partially retained for new investment to improve production, they might do better going
it alone. Nonetheless, they discovered that due to the high cost of weaving materials the
profit from sales was not sufficient to meet their high expenditure, and many of them
became trapped in a spiral of debt. By the final round of interviews some of those
interviewed were reporting that they had been forced to sell a part of their land to relieve
the debt burden. Although tourism provided better access to the outside world, tourism
alone was not sufficient to explain their chronic debt problem, worsened by changing
patterns of consumption brought about by other economic policies and greater rural-urban
connectivity.
6.6.3 Group 3:These villagers actively participated in the OTOP programme.
Forty households were this group, accountingfor 12.4 percent of the total sample.
Interestingly, all 40 participants were women, with farming being their major source of
income. Most had one or two children, with six children being the maximum. Another
unique characteristic was the relatively high average age. More than 75 percent of the
group members were age 51 or higher. As a result of their age, these villagers are
experienced in weaving, and being more skilled than other villagers they were able to
execute very detailed designs which were difficult to imitate. Their average monthly
income was around Bt3,660, with an additional Bt500-1,000 per month from the project.
Those able to sell their products outside the village could even earn Bt 1,000-3,000 on top
of their main income. This level of income was likely to cover the cost of weaving
materials, together with electricity and mobile phone use.
Due to their constant stream of income, the group rarely resorted to borrowing,
except when they faced untoward events or when new investment was needed. As a result,
the average debt per household was a relatively low Bt21,330 baht per annum.
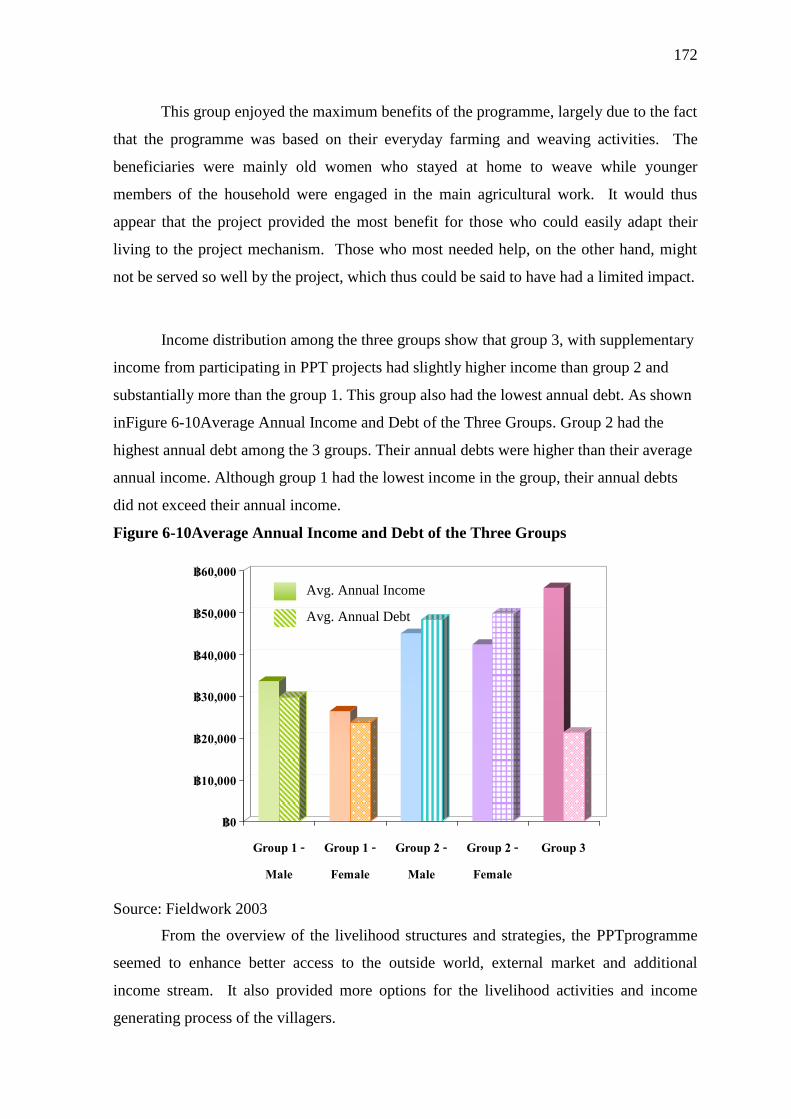
172
This group enjoyed the maximum benefits of the programme, largely due to the fact
that the programme was based on their everyday farming and weaving activities. The
beneficiaries were mainly old women who stayed at home to weave while younger
members of the household were engaged in the main agricultural work. It would thus
appear that the project provided the most benefit for those who could easily adapt their
living to the project mechanism. Those who most needed help, on the other hand, might
not be served so well by the project, which thus could be said to have had a limited impact.
Income distribution among the three groups show that group 3, with supplementary
income from participating in PPT projects had slightly higher income than group 2 and
substantially more than the group 1. This group also had the lowest annual debt. As shown
inFigure 6-10Average Annual Income and Debt of the Three Groups. Group 2 had the
highest annual debt among the 3 groups. Their annual debts were higher than their average
annual income. Although group 1 had the lowest income in the group, their annual debts
did not exceed their annual income.
Figure 6-10Average Annual Income and Debt of the Three Groups
Source: Fieldwork 2003
From the overview of the livelihood structures and strategies, the PPTprogramme
seemed to enhance better access to the outside world, external market and additional
income stream. It also provided more options for the livelihood activities and income
generating process of the villagers.
฿0
฿10,000
฿20,000
฿30,000
฿40,000
฿50,000
฿60,000
Group 1 -Male
Group 1 -Female
Group 2 -Male
Group 2 -Female
Group 3
Avg. Annual Income
Avg. Annual Debt
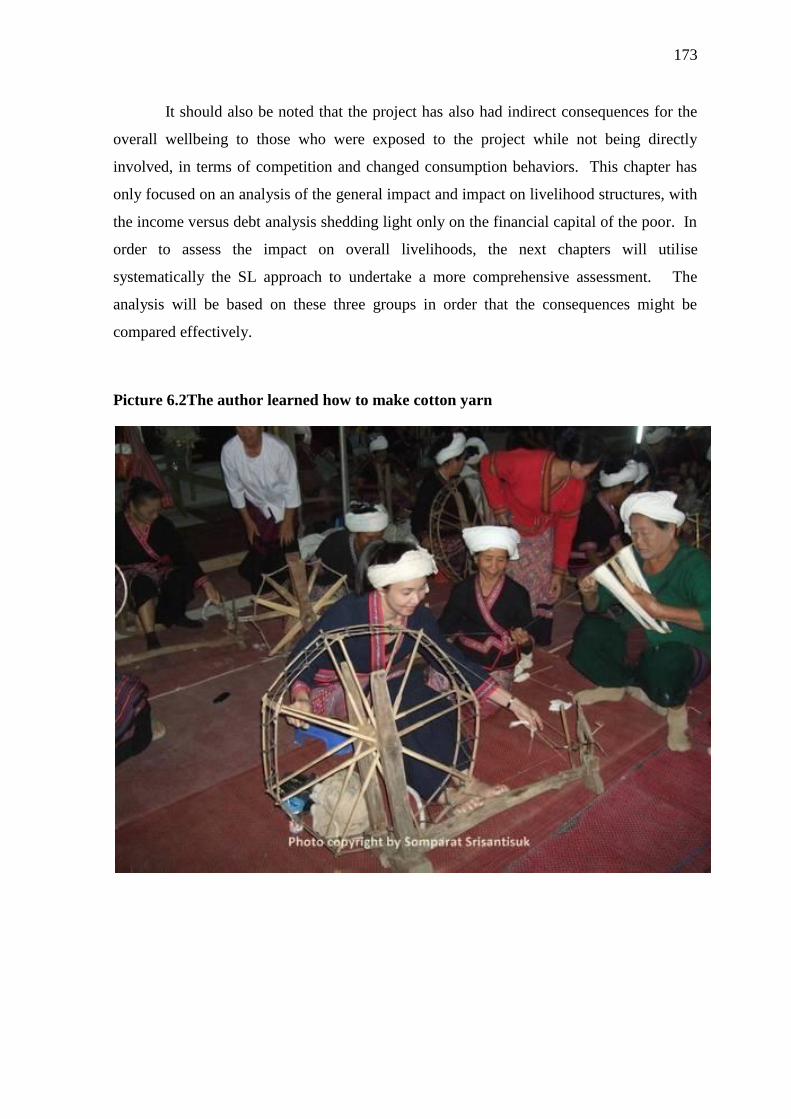
173
It should also be noted that the project has also had indirect consequences for the
overall wellbeing to those who were exposed to the project while not being directly
involved, in terms of competition and changed consumption behaviors. This chapter has
only focused on an analysis of the general impact and impact on livelihood structures, with
the income versus debt analysis shedding light only on the financial capital of the poor. In
order to assess the impact on overall livelihoods, the next chapters will utilise
systematically the SL approach to undertake a more comprehensive assessment. The
analysis will be based on these three groups in order that the consequences might be
compared effectively.
Picture 6.2The author learned how to make cotton yarn
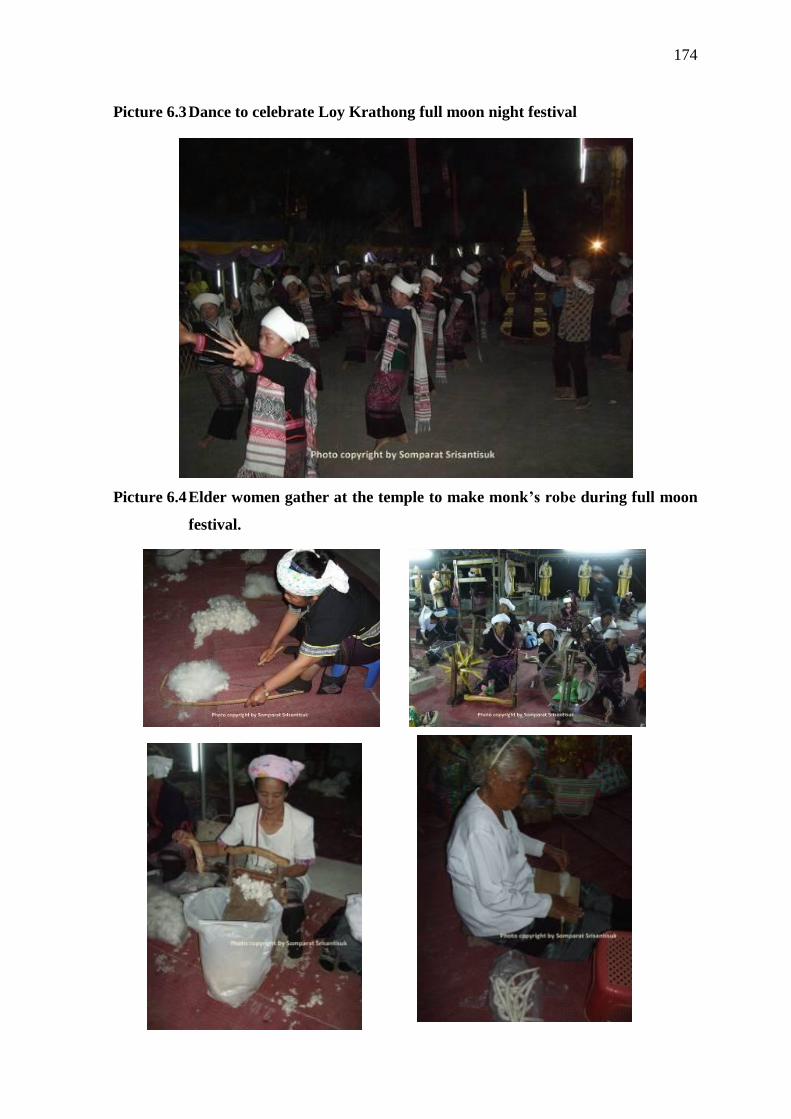
174
Picture 6.3 Dance to celebrate Loy Krathong full moon night festival
Picture 6.4 Elder women gather at the temple to make monk‘s robe during full moon
festival.
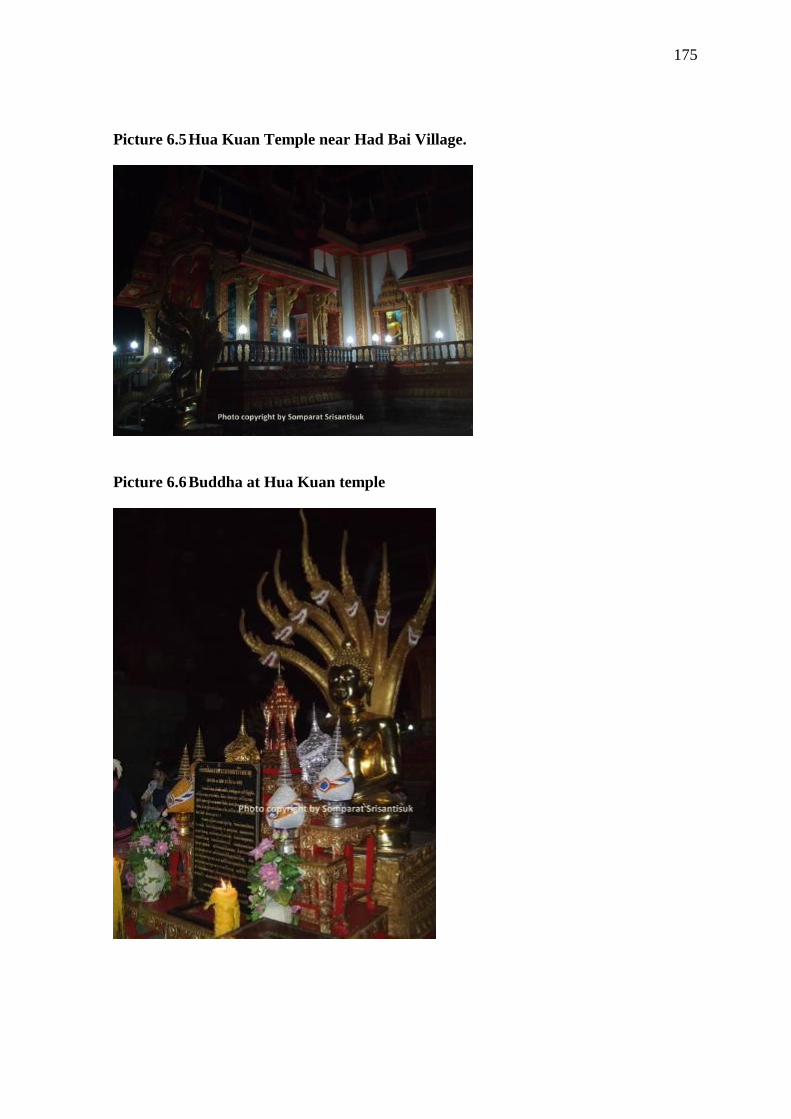
175
Picture 6.5 Hua Kuan Temple near Had Bai Village.
Picture 6.6 Buddha at Hua Kuan temple
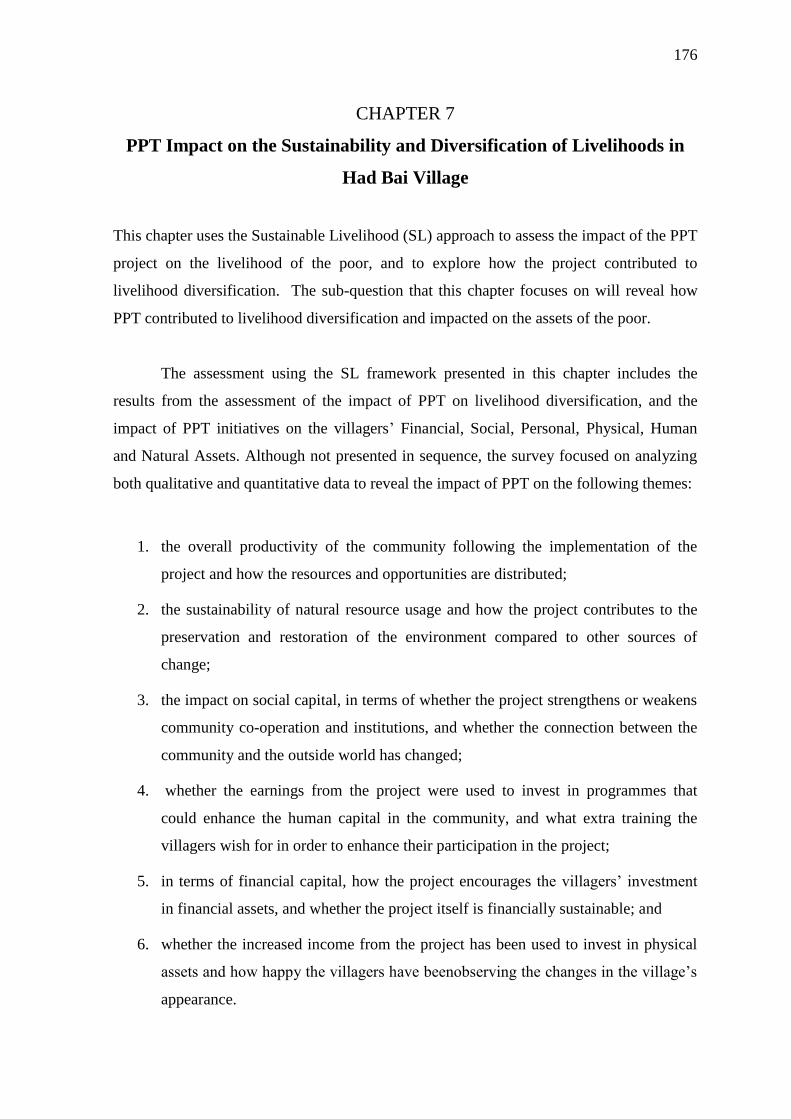
176
CHAPTER 7
PPT Impact on the Sustainability and Diversification of Livelihoods in
Had Bai Village
This chapter uses the Sustainable Livelihood (SL) approach to assess the impact of the PPT
project on the livelihood of the poor, and to explore how the project contributed to
livelihood diversification. The sub-question that this chapter focuses on will reveal how
PPT contributed to livelihood diversification and impacted on the assets of the poor.
The assessment using the SL framework presented in this chapter includes the
results from the assessment of the impact of PPT on livelihood diversification, and the
impact of PPT initiatives on the villagers‘ Financial, Social, Personal, Physical, Human
and Natural Assets. Although not presented in sequence, the survey focused on analyzing
both qualitative and quantitative data to reveal the impact of PPT on the following themes:
1. the overall productivity of the community following the implementation of the
project and how the resources and opportunities are distributed;
2. the sustainability of natural resource usage and how the project contributes to the
preservation and restoration of the environment compared to other sources of
change;
3. the impact on social capital, in terms of whether the project strengthens or weakens
community co-operation and institutions, and whether the connection between the
community and the outside world has changed;
4. whether the earnings from the project were used to invest in programmes that
could enhance the human capital in the community, and what extra training the
villagers wish for in order to enhance their participation in the project;
5. in terms of financial capital, how the project encourages the villagers‘ investment
in financial assets, and whether the project itself is financially sustainable; and
6. whether the increased income from the project has been used to invest in physical
assets and how happy the villagers have beenobserving the changes in the village‘s
appearance.
177
The answers to these questions have been derived from the information made
available through all three rounds of interviews with the stakeholders and related parties.
However, the information from the third round interviews, which were in-depth interviews,
was most extensively processed, and the consistency of the opinions of the interviewees
were cross-checked against the data from the quantitative assessment.
This part of the chapter also attempts to find the point of view of government
officials, how they perceived changes in the lives of OTOP project participants, not only in
terms of employment but also in other aspects. Then, the focus is to analyze if and how the
implementation of the OTOP project affected the assets that were at the disposal of the
rural poor to make their livelihood. A conclusion will then be made to pave way for the
treatment of sub-research question #3 in the following chapter.
7.1 Assessment of PPT Impact on Livelihood diversification
The discussions from the officers‘ point of view are based on the information obtained
from interviews with 15 officials from nine government departments along with one NGO
and a tour company as practitioner involved in different aspects of the implementation of
the OTOP project. The respondents were officials from the Tourism Authority of Thailand
and the Tourism Development Office under the Tourism and Sports Ministry; the
Industrial Promotion Department and SMEs Promotion Office under the Industry Ministry;
from the Export Promotion Department under the Commerce Ministry; the Community
Development Department under the Interior Ministry; from the Agricultural Extension
Department and from the Cooperatives Promotion Department under the Agriculture and
Cooperatives Ministry; and the SME Bank. The results are given below:
7.1.1 Livelihood Diversification
Official studies have revealed the following livelihood diversification strategies villagers
engage in when income from agriculture, the main source of their income, fails to cover
expenditure:
1. borrow money
2. find extra jobs
3. sell hand-woven weave cloth
4. limit spending
5. sellagricultural land
178
The fact that borrowing seems to be the principle source of diversification among
the villagers is a cause of some concern, as it implies a certain misperception of the
villagers about the project could lead to unexpected outcomes in the future. Borrowing
could have adverse consequences, as the villagers need to manage their funds effectively as
well as market the products in which they invest. However, high-ranking officials tended
to stick to the official view that the project would play a large role in livelihood
diversification among the poor, by providing additional opportunities for income and
employment.
All of the officials interviewed agreed that the OTOP project had brought about
changes to the livelihood and assets of project participants.
“The OTOP project enabled the people to have access to financial resources which
they used to buy materials and machines to improve the production of goods.”
(Anonymous2005a)
“With the help from the government in providing training on management and
identifying potential markets, the people could sell more products at higher prices,
which definitely resulted in an increase in income of project participants.”
(Anonymous 2005b)
The most obvious one was an increase in ―income‖ which they believe had helped
reduce the hardship of the local people.
“In cases where the people opened their villages to tourists, OTOP had created
employment opportunities related to tourism business for villagers ranging from work
in the transportation sector. They can also sell food and drink and offer
accommodation businesses.” (Anonymous 2005c)
“Tourism definitely helped distribute income to those involved directly or indirectly
with tourism business, leading to a better living condition of these people.”(
Anonymous 2005d)
179
These views were in contrast with those expressed by mid-ranking officials from
the Tourism Authority of Thailand and the NGO, who raised concerns that the objectives
of the project could be misperceived as the allocation of funds had no clear conditions
attached.
“I personally think that villagers who are the producers of PPT products will gain just
little benefit but mostly the money goes to the leader of the group.”(Anonymous 2003b)
Such observations chimed with those perceived by the author from the interviews,
and pointed to the need for close monitoring and useful advice from government officials
and community leaders during the project promotion and implementation.
7.1.2 PPT initiatives match to the livelihood diversification strategies people use
As mentioned in the earlier chapters, the project has been effective for the selected group
of villagers as it matched with the livelihood diversification strategies of the poor in the
area. The weaving activity has long been the traditional way of life for women in the
village. The project was only trying to provide support in terms of market access and
sustained financial income which produced marginal changes to most of the villagers‘
livelihood strategies.
Results from the interviews show that villagers did not think joining the PPT
projects is one way of adapting their livelihood in order to survive. They also viewthat they
did not change their livelihood in order to interact with tourists or participate in the PPT.
While the villagers did not feel their way of life had been significantly changed to
suit the tourism industry, concerns from the practitioner level officers and the private
sector have been that the by-product from tourism can be harmful. The relatively abrupt
exposure to the outside world without any education or good judgment may alter the
traditional way of living especially consumption pattern (television, mobile phone as well
as the internet) can be too difficult for the poor to manage, both in financial and social
terms. This was coinciding with the increase in household debt observed in the previous
chapters as well as the social problems mentioned above.
180
“Income does not make livelihood better if the poor do not know how to save the
money. Having more income can lead to higher spending which results in no money at
the end. Although they seem to feel less vulnerable.”(Anonymous 2005e)
“The villagers may feel livelihood has been improved during the first stage of the
project. Then, if they cannot sustain the market and have left over stocks and no
income, burden such as debt will follow.” (Anonymous 2005f)
7.1.3 Tourism‟s impact on villagers‟ way of life
Although the OTOP project had created higher income for its participants, in most cases, it
had not altered the fundamental way of life of the people. Villagers who relied on farming
as their major source of income did not abandon work on the farm.
Concerns from the middle rankings and the NGOs have been that the by-product
from tourism can be harmful.
“Some villagers think that PPT especially OTOP is the pride of the village. So,
participants try so hard to make a lot of products to sell in the project. Those who have
to go to work in the field hire someone else to do this job. Some of them even stop their
work just to welcome the tourists.”(Anonymous 2005g)
“I doubt the money and civilization will destroy the purity of these poor people both
inthe physical appearance of the village as well as their value to life and culture.”
(Anonymous 2005b)
“I doubt the money and civilization will destroy the purity of these poor people both in
the physical appearance of the village as well as their value to life and culture.”
(Anonymous 2005b)
Some officials were even concerned the success of the OTOP project might bring material
progress to the rural communities and affect the way the people lived which constituted the
very essence of the OTOP project.
181
In contrast, high ranking officers believed the OTOP project is designed to help people
maximise existing opportunities for earning additional income without affecting their way
of life. With greater employment opportunities in the villages, government officials believe
there would be fewer people migrating from the rural area to seek jobs in the big cities.
This is obviously described bya high ranking TAT officer, as follows:
“…As far as the Tourism Authority of Thailand (TAT) is concerned, the concept of
OTOP tourism is to offer opportunities for tourists to experience the way of life of a
community. It is therefore important that the community maintains their traditional
way of living. What has been introduced to the people is the knowledge required to
manage tourists that come to their villages.… (Anonymous 2005h)
…The TAT does not want to disturb the way of life of the people. Their business usually
starts after the harvest season…. The money they gain from OTOP tourism provides
them with extra income…which helps to reduce the hardship and improve their living
conditions. …”(Anonymous 2005i)
From the above interview, it can be seen that the high ranking officer had hoped the
implementation of the OTOP tourism project would not change the traditional way of
living. Most of the high ranking officers were of the view that villagers did not have to
change their way of life to accommodate tourists. On this point, one NGO commented
that:
“As a matter of fact, they should not change their life to suit tourists. However, I was
aware of the negative impact that might occur. What I could do was to explain to the
people that it was important to keep the essential features of their traditional way of life
as that was the very element that attracted tourists to their villages. Without it, the
project would not have become successful.”(Anonymous 2003b)
However, from the view of the practitioner such as the tour company, villagers‘ way of life
has gradually been altered. An implication can be drawn that other than the villagers
themselves, those officials responsible for the project should not only provide useful
guidance for the short-term adjustment, but they also have to find effective ways to balance
the living of villagers with the tourism expansion in such a way the tradition that is the key
to attracting the tourists itself is optimally preserved in the long run.
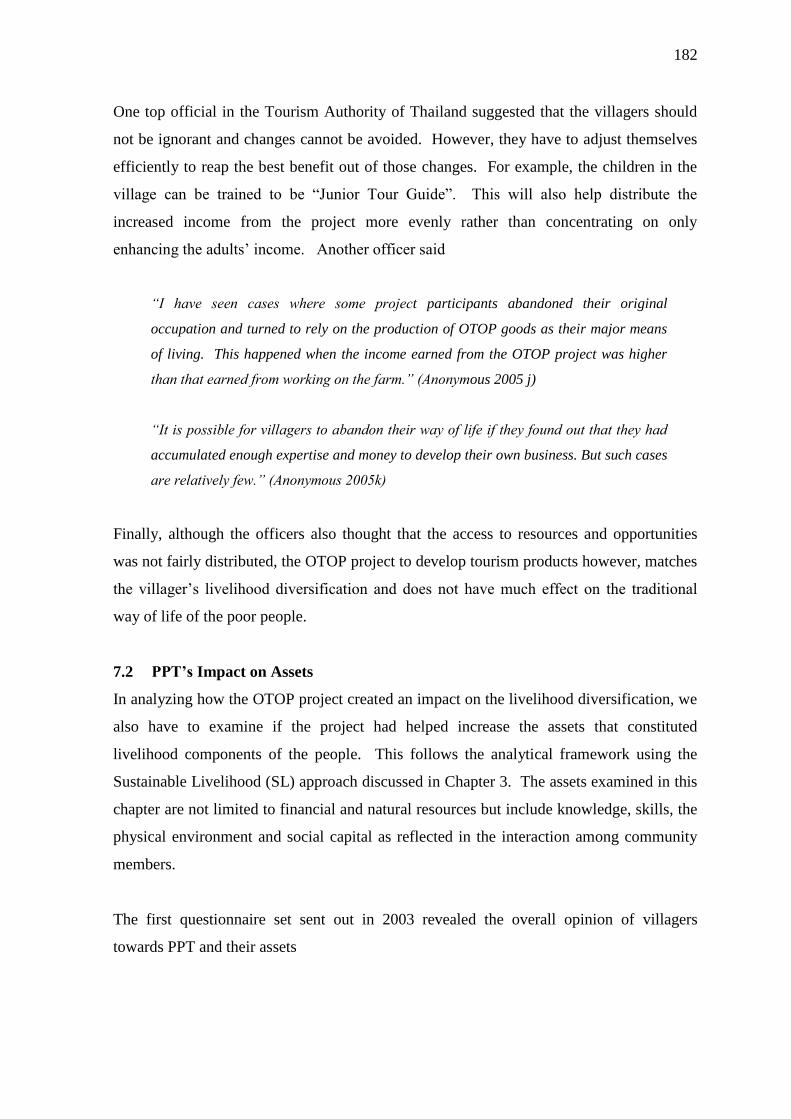
182
One top official in the Tourism Authority of Thailand suggested that the villagers should
not be ignorant and changes cannot be avoided. However, they have to adjust themselves
efficiently to reap the best benefit out of those changes. For example, the children in the
village can be trained to be ―Junior Tour Guide‖. This will also help distribute the
increased income from the project more evenly rather than concentrating on only
enhancing the adults‘ income. Another officer said
“I have seen cases where some project participants abandoned their original
occupation and turned to rely on the production of OTOP goods as their major means
of living. This happened when the income earned from the OTOP project was higher
than that earned from working on the farm.” (Anonymous 2005 j)
“It is possible for villagers to abandon their way of life if they found out that they had
accumulated enough expertise and money to develop their own business. But such cases
are relatively few.” (Anonymous 2005k)
Finally, although the officers also thought that the access to resources and opportunities
was not fairly distributed, the OTOP project to develop tourism products however, matches
the villager‘s livelihood diversification and does not have much effect on the traditional
way of life of the poor people.
7.2 PPT‘s Impact on Assets
In analyzing how the OTOP project created an impact on the livelihood diversification, we
also have to examine if the project had helped increase the assets that constituted
livelihood components of the people. This follows the analytical framework using the
Sustainable Livelihood (SL) approach discussed in Chapter 3. The assets examined in this
chapter are not limited to financial and natural resources but include knowledge, skills, the
physical environment and social capital as reflected in the interaction among community
members.
The first questionnaire set sent out in 2003 revealed the overall opinion of villagers
towards PPT and their assets
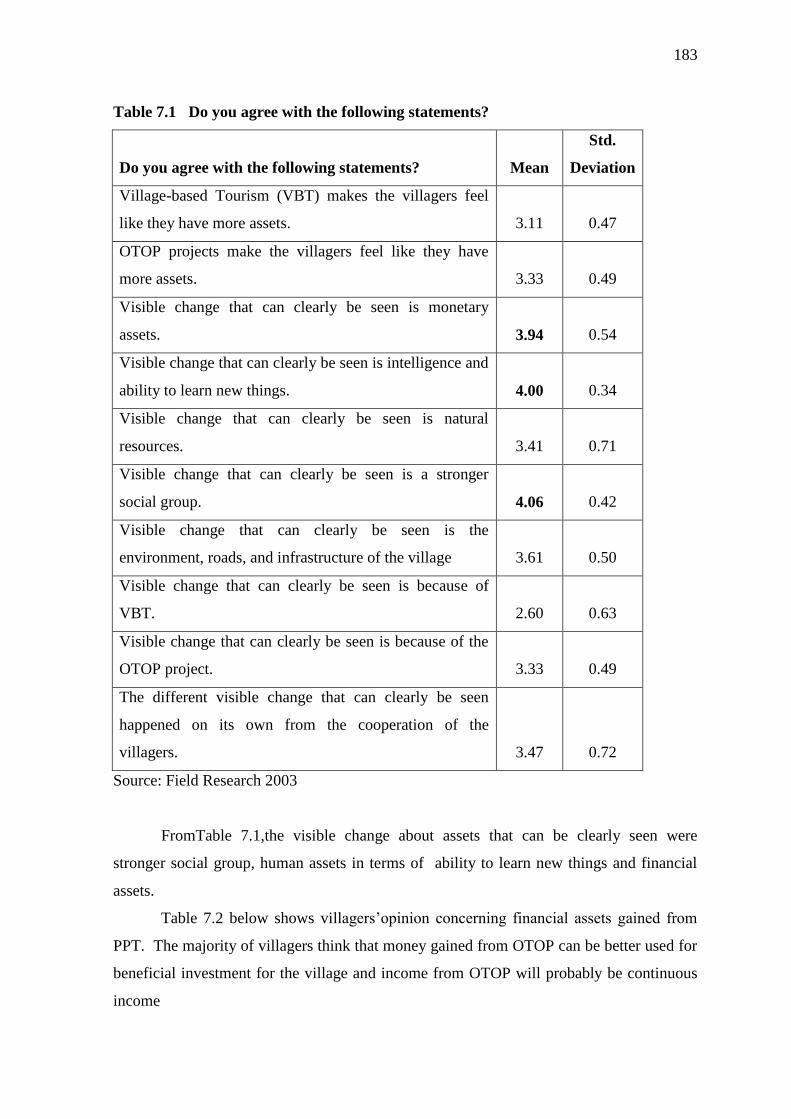
183
Table 7.1 Do you agree with the following statements?
Do you agree with the following statements? Mean
Std.
Deviation
Village-based Tourism (VBT) makes the villagers feel
like they have more assets. 3.11 0.47
OTOP projects make the villagers feel like they have
more assets. 3.33 0.49
Visible change that can clearly be seen is monetary
assets. 3.94 0.54
Visible change that can clearly be seen is intelligence and
ability to learn new things. 4.00 0.34
Visible change that can clearly be seen is natural
resources. 3.41 0.71
Visible change that can clearly be seen is a stronger
social group. 4.06 0.42
Visible change that can clearly be seen is the
environment, roads, and infrastructure of the village 3.61 0.50
Visible change that can clearly be seen is because of
VBT. 2.60 0.63
Visible change that can clearly be seen is because of the
OTOP project. 3.33 0.49
The different visible change that can clearly be seen
happened on its own from the cooperation of the
villagers. 3.47 0.72
Source: Field Research 2003
FromTable 7.1,the visible change about assets that can be clearly seen were
stronger social group, human assets in terms of ability to learn new things and financial
assets.
Table 7.2 below shows villagers‘opinion concerning financial assets gained from
PPT. The majority of villagers think that money gained from OTOP can be better used for
beneficial investment for the village and income from OTOP will probably be continuous
income
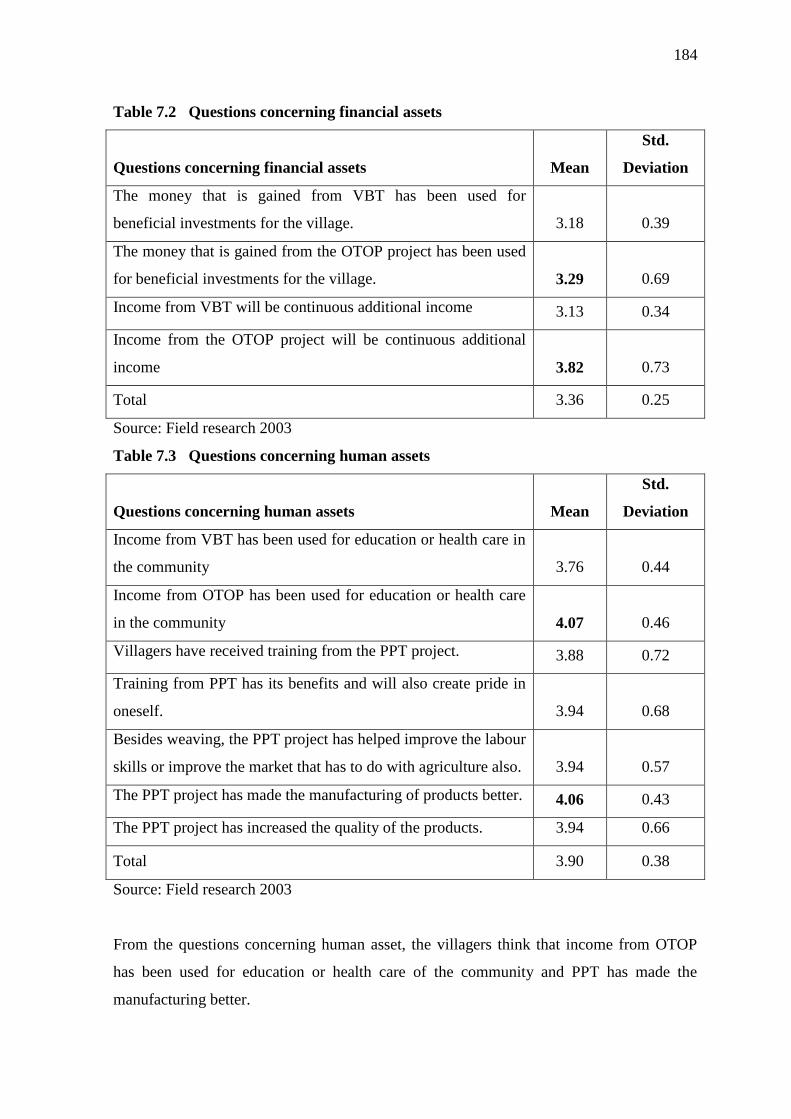
184
Table 7.2 Questions concerning financial assets
Questions concerning financial assets Mean
Std.
Deviation
The money that is gained from VBT has been used for
beneficial investments for the village. 3.18 0.39
The money that is gained from the OTOP project has been used
for beneficial investments for the village. 3.29 0.69
Income from VBT will be continuous additional income 3.13 0.34
Income from the OTOP project will be continuous additional
income 3.82 0.73
Total 3.36 0.25
Source: Field research 2003
Table 7.3 Questions concerning human assets
Questions concerning human assets Mean
Std.
Deviation
Income from VBT has been used for education or health care in
the community 3.76 0.44
Income from OTOP has been used for education or health care
in the community 4.07 0.46
Villagers have received training from the PPT project. 3.88 0.72
Training from PPT has its benefits and will also create pride in
oneself. 3.94 0.68
Besides weaving, the PPT project has helped improve the labour
skills or improve the market that has to do with agriculture also. 3.94 0.57
The PPT project has made the manufacturing of products better. 4.06 0.43
The PPT project has increased the quality of the products. 3.94 0.66
Total 3.90 0.38
Source: Field research 2003
From the questions concerning human asset, the villagers think that income from OTOP
has been used for education or health care of the community and PPT has made the
manufacturing better.
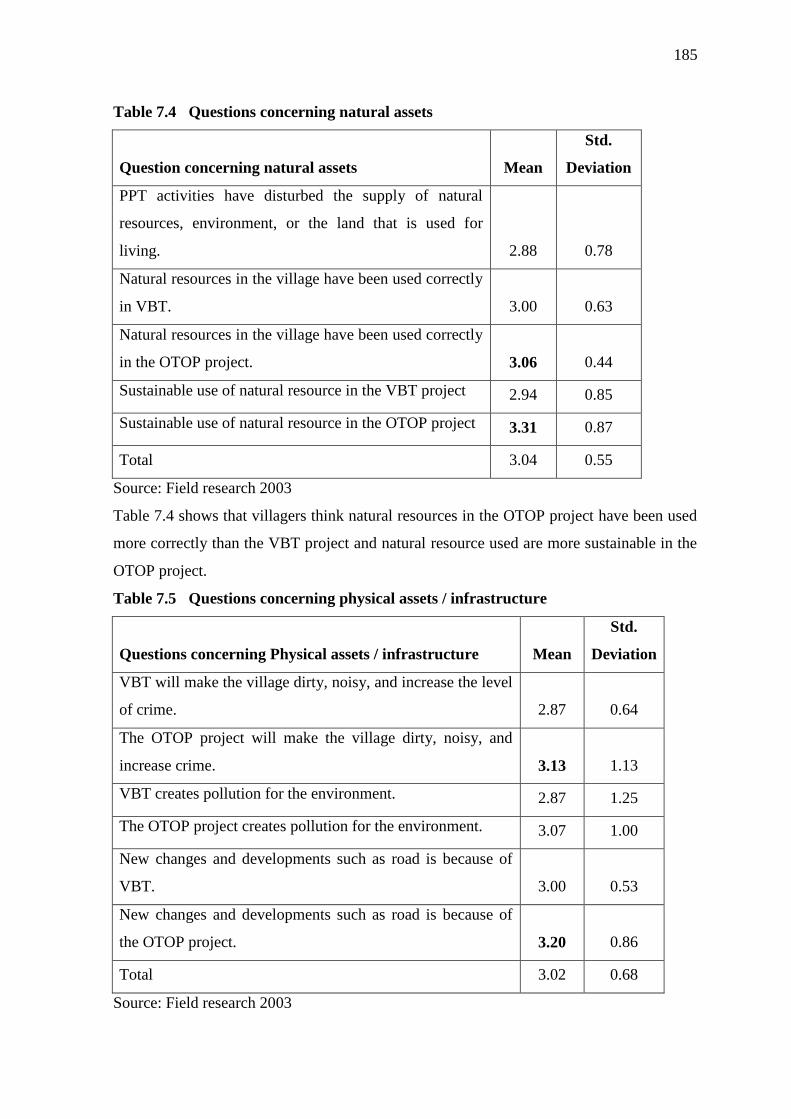
185
Table 7.4 Questions concerning natural assets
Question concerning natural assets Mean
Std.
Deviation
PPT activities have disturbed the supply of natural
resources, environment, or the land that is used for
living. 2.88 0.78
Natural resources in the village have been used correctly
in VBT. 3.00 0.63
Natural resources in the village have been used correctly
in the OTOP project. 3.06 0.44
Sustainable use of natural resource in the VBT project 2.94 0.85
Sustainable use of natural resource in the OTOP project 3.31 0.87
Total 3.04 0.55
Source: Field research 2003
Table 7.4 shows that villagers think natural resources in the OTOP project have been used
more correctly than the VBT project and natural resource used are more sustainable in the
OTOP project.
Table 7.5 Questions concerning physical assets / infrastructure
Questions concerning Physical assets / infrastructure Mean
Std.
Deviation
VBT will make the village dirty, noisy, and increase the level
of crime. 2.87 0.64
The OTOP project will make the village dirty, noisy, and
increase crime. 3.13 1.13
VBT creates pollution for the environment. 2.87 1.25
The OTOP project creates pollution for the environment. 3.07 1.00
New changes and developments such as road is because of
VBT. 3.00 0.53
New changes and developments such as road is because of
the OTOP project. 3.20 0.86
Total 3.02 0.68
Source: Field research 2003
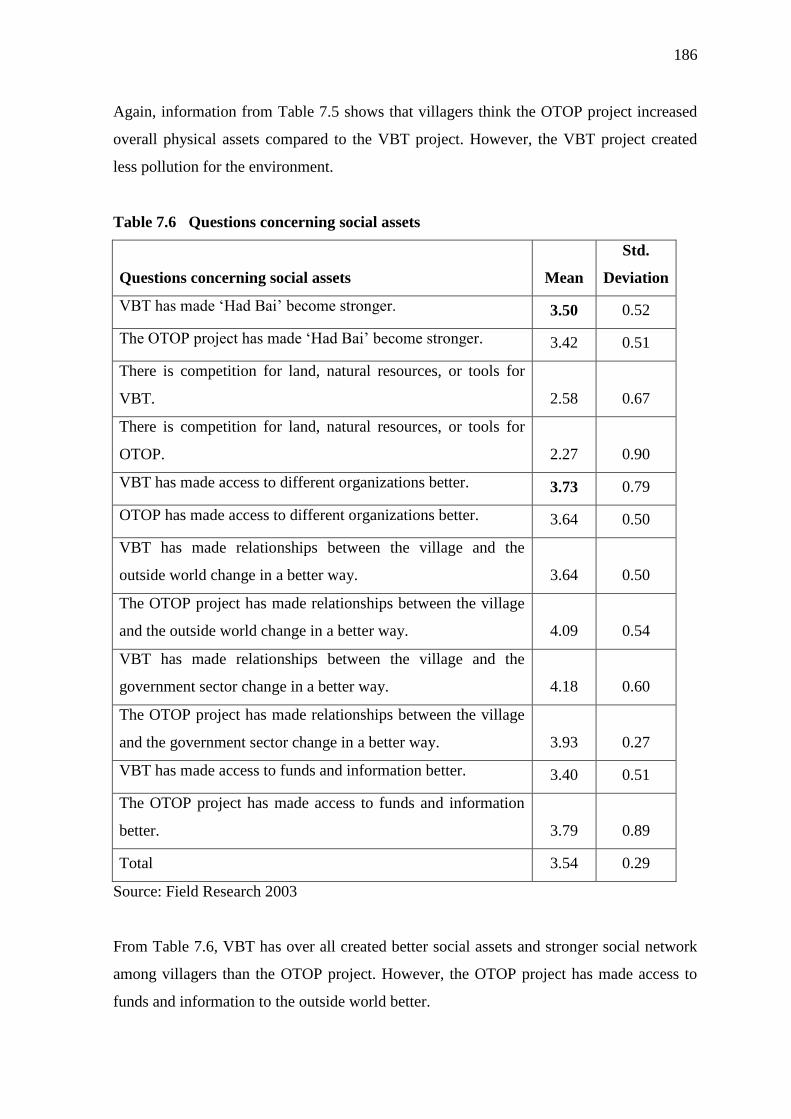
186
Again, information from Table 7.5 shows that villagers think the OTOP project increased
overall physical assets compared to the VBT project. However, the VBT project created
less pollution for the environment.
Table 7.6 Questions concerning social assets
Questions concerning social assets Mean
Std.
Deviation
VBT has made ‗Had Bai‘ become stronger. 3.50 0.52
The OTOP project has made ‗Had Bai‘ become stronger. 3.42 0.51
There is competition for land, natural resources, or tools for
VBT. 2.58 0.67
There is competition for land, natural resources, or tools for
OTOP. 2.27 0.90
VBT has made access to different organizations better. 3.73 0.79
OTOP has made access to different organizations better. 3.64 0.50
VBT has made relationships between the village and the
outside world change in a better way. 3.64 0.50
The OTOP project has made relationships between the village
and the outside world change in a better way. 4.09 0.54
VBT has made relationships between the village and the
government sector change in a better way. 4.18 0.60
The OTOP project has made relationships between the village
and the government sector change in a better way. 3.93 0.27
VBT has made access to funds and information better. 3.40 0.51
The OTOP project has made access to funds and information
better. 3.79 0.89
Total 3.54 0.29
Source: Field Research 2003
From Table 7.6, VBT has over all created better social assets and stronger social network
among villagers than the OTOP project. However, the OTOP project has made access to
funds and information to the outside world better.
187
Information from interviews with villagers shows that access to information resource and
funding of both PPT projects was better from 1998-2001. However, there is no topic about
PPT in the village‘s meeting held once a month. Women can participate in the meeting.
However, only the president of the women‘s weaving group or her committees attended.
On the whole, those who were interviewed thought that the OTOP project helped increase
overall assets of the rural poor. The government injected funds to villages to support the
implementation of the OTOP project, which enhanced financial capital. By participating in
the OTOP project, villagers had to work with one another and with government officials in
planning and implementing the project as well as in solving problems. This way, villagers
could gain experience in running a business and the community became stronger in terms
of social capital. Such experiences were valuable if the villagers wanted to undertake other
economic activities apart from working on the farm which was their traditional occupation.
The OTOP project has also increased the people‘s access to information and knowledge by
providing vocational training to villagers which contributed to the enhancement of human
capital. This knowledge on production technique allowed project participants to produce
local products of better quality.
The project also changed the quality and productivity of the product. The government‘s
local products development programmes increased productivity and then provided venues
for showcasing and marketing the product. The OTOP fair organised by the department of
trade promotion is held once a year in Bangkok. Villagers with OTOP products from all
over the country participate in this event, and in the case of Had Bai, sometimes there are
unfavourable results. One villager said of the experience:
“I remember when the Government told us to weave for one OTOP fair in Bangkok,
and we all weaved all day and night hoping that we can sell them and earn lots of
money. At the end we produced too many cloths and could not sell all. Our money was
spent in buying materials. Now, we do not have money to buy food and we can only
look at these cloths wishing that they were edible.”(Anonymous 2003c)
Interviews yielded valuable insights into the problems of the product development
initiatives. The most recurring problem theme in the interviews was about effectively
188
marketing products after increased productivity. Once precious money is redirected to
production, the failure to recover the capital invested in it posed a frustrating challenge for
rural villagers. As one participant relates her experience:
“The officers told us to provide a variety of styles to sell in the Department Store in
Town. However, they didn‟t tell of the quantity. So, we all produced too many. It is
always the president of the weaving club who got this chance, and she tends to sell her
relatives‟ work first.”(Anonymous 2003 d)
Although the OTOP project is aimed at maximising existing local knowledge - like
weaving, dyeing, wood carving, etc. - by encouraging people to use such knowledge in
producing goods that are unique to their locality, local knowledge alone is not enough to
ensure the success of the OTOP project.
One villager commented on the added cost and risk from the production of high quality
products. Competition from similar but cheaper products across the Laos border also posed
another challenge:
“I spent days weaving this cloth using the best natural materials. Then the customer
came to tell me that my product‟s colour faded. That was not true. They must have
bought from somewhere else. I heard there are fake products sold by Laotians. They
use the cheap chemical dye colour to save cost. How can we sustain our reputation
then?” (Anonymous 2003e)
With an opportunity for profit, competition comes in the form of cheaper products that can
be sold to tourists as a cheap alternative. Thai Lue weaving is not exclusive to Had Bai
Village, it is a cultural tradition of villages with the same ethnicity on both sides of the
border. Some villagers relate their frustration:
“A selfish investor taught how to weave a Thai Lue cloth to Laotian girls across the
river. They have a cheaper daily wage. How can we compete with them?” (Anonymous
2003f)
189
“It took me almost a month to weave this traditional style of Thai Lue, then the girl
from across the river adapted my style to more easily finish the piece of work quickly. I
can also do the same but that is not the real Thai Lue style.” (Anonymous 2003g)
The tourism product development project is a business undertaking and it needs to be
managed effectively in order to be sustained in the long run. Government agencies should
organise several training courses for project participants so that they have the
necessaryknowledge and skills. The training provided to project participants covered
various aspects of business activities ranging from production, packaging, and marketing
to financial management. With such training, villagers were equipped to undertake
economic activities other than farming, which was their traditional occupation.
In conclusion, the villagers and middle ranking practitioners and NGOs did not think there
were significant improvements from PPT projects on assets compared to the other sources,
however, in the government sector, high ranking government officers argued that PPT is
still a great tool to enhance overall livelihood assets.
7.2.1 Impact on Financial Assets
As mentioned earlier in this Chapter, the tourism product development projects like OTOP
helped broaden people‘s access to funds, resulting in an increase in financial assets that
project participants could use to start or expand their businesses. With better access to
financial resources, villagers could buy more materials and new machines which enabled
them to produce better quality goods and sell them at higher prices. Literature also shows
that PPT initiatives have enhanced access to financial capital in many ways. Firstly, loans
are available for micro and small enterprise tourism (Renard 2001; Williams, White and
Spenceley 2001;Nicanor 2001; Mahony and VanZyl 2001). Secondly, earners gain access
to credit (Poultney and Spenceley, 2001). Thirdly, the collective income earned by
community organizations became a source of investment funding.
All of the officials who were interviewed said that one obvious change brought about by
the OTOP project was that the people had more income. The extra money gained from
tourism products development provided for supplementary income for villagers. Although
OTOP project participants did not become rich from OTOP products, the extra income
they earned did help reduce their hardship and enable them to have a better living.
190
The OTOP project had also increased people‘s access to factors of production. This is
especially true with how the increase in access to financial capital could lead to improving
the human capital. In the case of financial capital, the government played an important
role in ensuring people‘s access to adequate funds.
The OTOP project, being a top priority in Thailand‘s government policy, had been
allocated a relatively large budget for its implementation. The government designated the
Small and Medium Enterprises Development Bank of Thailand (SME Bank) as the major
financial institution responsible for channeling the money to rural villages.
Under some conditions requirements were set out by the Bank of Thailand, and were seen
as necessary to ensure that borrowers had the financial discipline and would spend the
money in a productive manner.
Although in principle, there was equal opportunity provided for all villagers to apply for
loans, those who did still had to comply with the same conditions as in any financial
institution. The government bank was no different from any other commercial bank;
villagers who participated in the projects were treated like other customers. The banks did
not provide special privileges to the project participants; the only incentive was the
government‘s promise of support. Participants who did get loans approved discovered that
interest rates were not cheaper either. Such conditions had put limit on people‘s access to
the funds.
This was reflected in the interview given by officials involved with the financing of the
OTOP project.
“In principle, everyone had equal opportunity to access the Bank‟s financial resources,
and the Bank tried to reach their target customers as much as they could. The Bank
adopted a “Direct Call” and “Direct Mail” strategy in order to get in to direct contact
with villagers. But in practice those who applied for credit were subject to conditions
similar to those of other financial institutions before funds could be
approved.”(Anonymous 2005l)
191
Access to funds was not easy for aspiring entrepreneurs who wanted to participate in the
projects, no matter whether the government intention was to alleviate poverty at the grass
roots level; the target population‘s financial asset could only be improved by seeking
employment with fellow villagers fortunate enough to have sufficient collateral to have
loans approved. Participants were after all indebted only to a certified financial institution
following the requirement set out by the Bank of Thailand. Another official commented on
the processing of loans for applicants who participated in the project that:
“…The government said that in considering applications for loans (of OTOP project
participants) it wouldn‟t take into account past credit records but would look ahead
into the future. If the project proposal is feasible and financially sound, the government
would support it. But in reality it does not happen that way. The government banks are
no different from commercial banks. They have similar procedures when considering
loan applications. For example, if you have a piece of land that is still mortgaged with
another bank, it would appear in your record and you would be blacklisted. Moreover,
government banks do not take shorter time to process an application for loans and their
interest rates are no cheaper. …” (Anonymous 2005m)
The officer from the SME Bank confirmed that the government was ready to help villagers
who were not qualified to obtain the funds by advising them how to manage their finances
properly before they reapplied for loans. This was confirmed by Vice President, Franchise
and OTOP Cluster of the SME Bank:
“…Before giving out loans to entrepreneurs, we usually provide them with training so
that they could learn how to run their businesses professionally. They must have
financial discipline, know how to do the bookkeeping and know the cost of their
production. They must have sufficient knowledge on financial management before we
can give them the money…” (Anonymous 2005n)
“…We always try to improve people‟s access to the funds because projects undertaken
without sound financial management would have high risk of failure. Such failure was
undesirable both for the Bank and the villagers themselves….” (Anonymous 2005o)
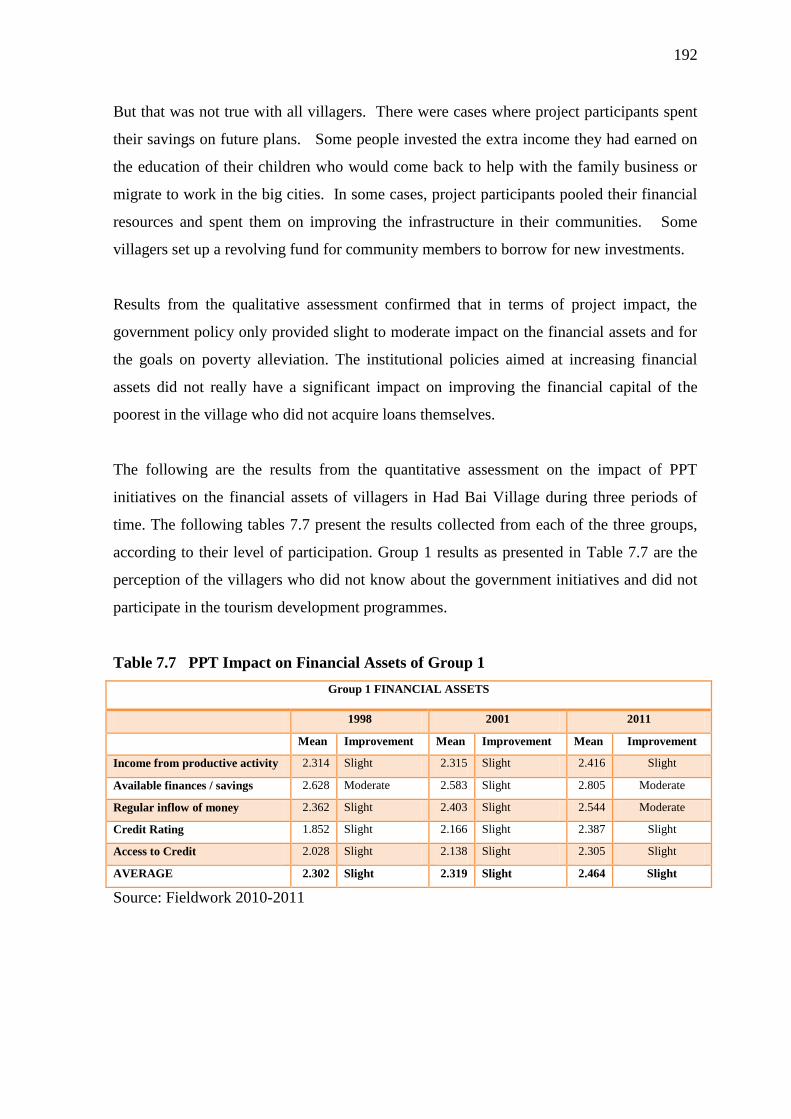
192
But that was not true with all villagers. There were cases where project participants spent
their savings on future plans. Some people invested the extra income they had earned on
the education of their children who would come back to help with the family business or
migrate to work in the big cities. In some cases, project participants pooled their financial
resources and spent them on improving the infrastructure in their communities. Some
villagers set up a revolving fund for community members to borrow for new investments.
Results from the qualitative assessment confirmed that in terms of project impact, the
government policy only provided slight to moderate impact on the financial assets and for
the goals on poverty alleviation. The institutional policies aimed at increasing financial
assets did not really have a significant impact on improving the financial capital of the
poorest in the village who did not acquire loans themselves.
The following are the results from the quantitative assessment on the impact of PPT
initiatives on the financial assets of villagers in Had Bai Village during three periods of
time. The following tables 7.7 present the results collected from each of the three groups,
according to their level of participation. Group 1 results as presented in Table 7.7 are the
perception of the villagers who did not know about the government initiatives and did not
participate in the tourism development programmes.
Table 7.7 PPT Impact on Financial Assets of Group 1
Group 1 FINANCIAL ASSETS
1998 2001 2011
Mean Improvement Mean Improvement Mean Improvement
Income from productive activity 2.314 Slight 2.315 Slight 2.416 Slight
Available finances / savings 2.628 Moderate 2.583 Slight 2.805 Moderate
Regular inflow of money 2.362 Slight 2.403 Slight 2.544 Moderate
Credit Rating 1.852 Slight 2.166 Slight 2.387 Slight
Access to Credit 2.028 Slight 2.138 Slight 2.305 Slight
AVERAGE 2.302 Slight 2.319 Slight 2.464 Slight
Source: Fieldwork 2010-2011
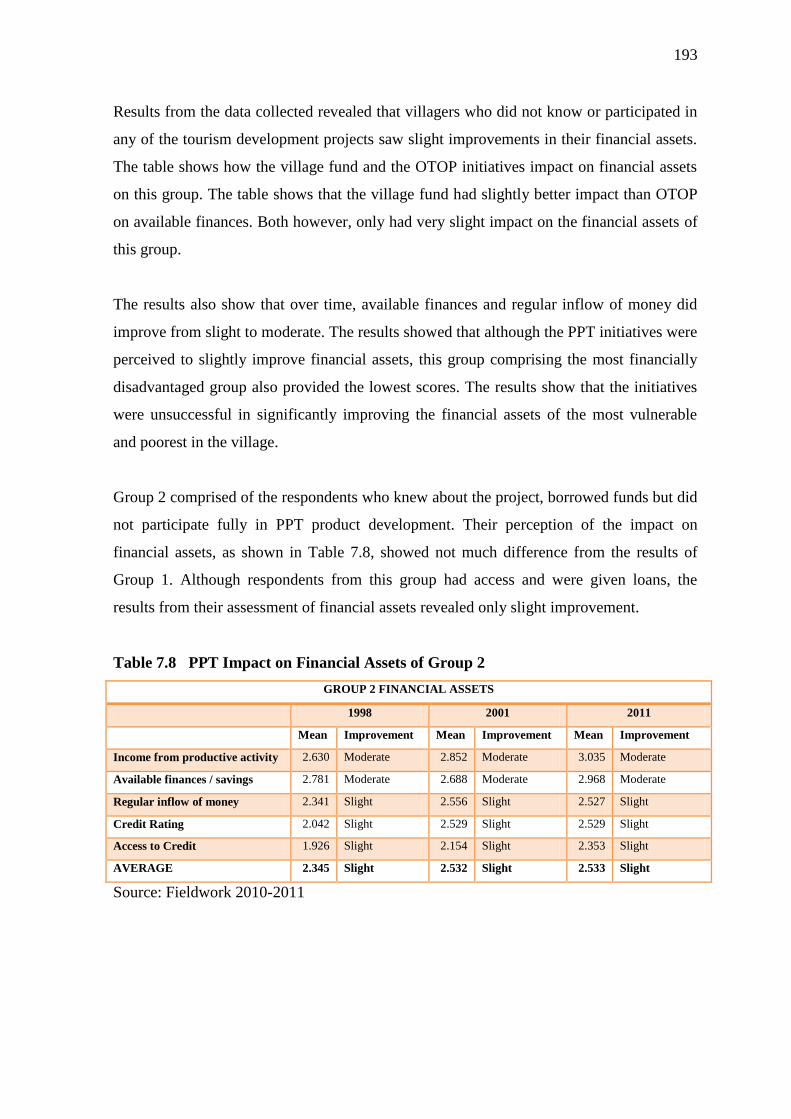
193
Results from the data collected revealed that villagers who did not know or participated in
any of the tourism development projects saw slight improvements in their financial assets.
The table shows how the village fund and the OTOP initiatives impact on financial assets
on this group. The table shows that the village fund had slightly better impact than OTOP
on available finances. Both however, only had very slight impact on the financial assets of
this group.
The results also show that over time, available finances and regular inflow of money did
improve from slight to moderate. The results showed that although the PPT initiatives were
perceived to slightly improve financial assets, this group comprising the most financially
disadvantaged group also provided the lowest scores. The results show that the initiatives
were unsuccessful in significantly improving the financial assets of the most vulnerable
and poorest in the village.
Group 2 comprised of the respondents who knew about the project, borrowed funds but did
not participate fully in PPT product development. Their perception of the impact on
financial assets, as shown in Table 7.8, showed not much difference from the results of
Group 1. Although respondents from this group had access and were given loans, the
results from their assessment of financial assets revealed only slight improvement.
Table 7.8 PPT Impact on Financial Assets of Group 2
GROUP 2 FINANCIAL ASSETS
1998 2001 2011
Mean Improvement Mean Improvement Mean Improvement
Income from productive activity 2.630 Moderate 2.852 Moderate 3.035 Moderate
Available finances / savings 2.781 Moderate 2.688 Moderate 2.968 Moderate
Regular inflow of money 2.341 Slight 2.556 Slight 2.527 Slight
Credit Rating 2.042 Slight 2.529 Slight 2.529 Slight
Access to Credit 1.926 Slight 2.154 Slight 2.353 Slight
AVERAGE 2.345 Slight 2.532 Slight 2.533 Slight
Source: Fieldwork 2010-2011
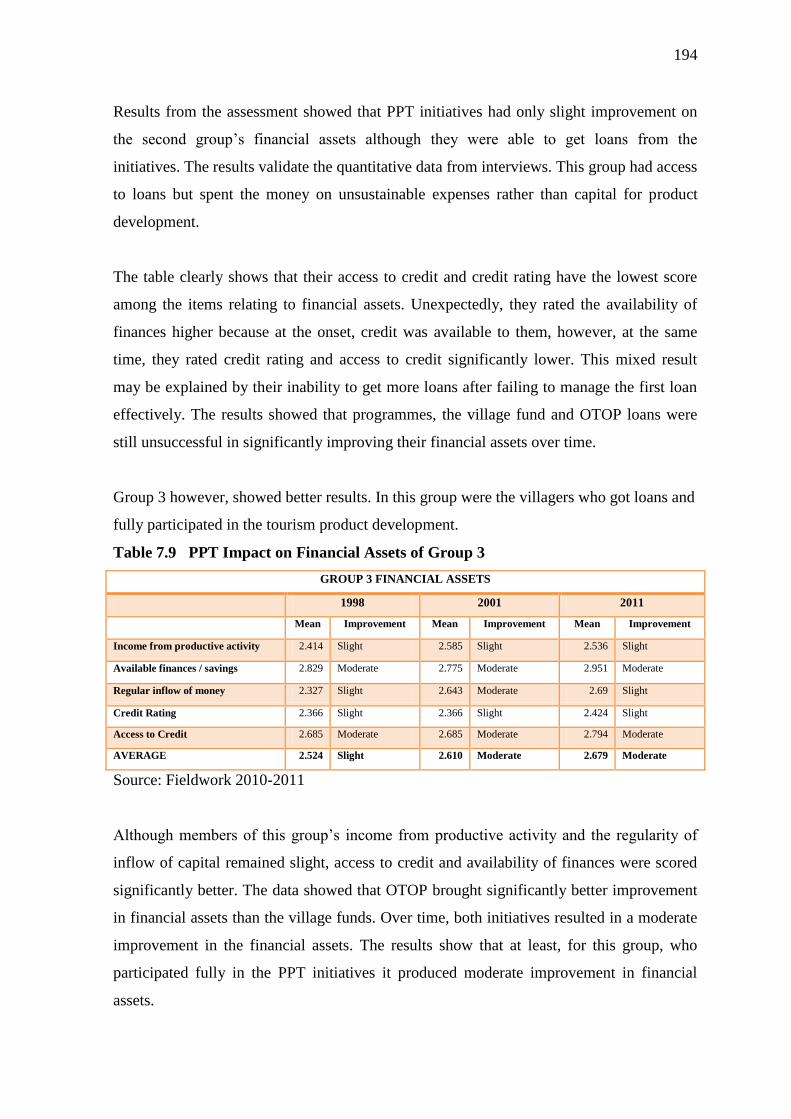
194
Results from the assessment showed that PPT initiatives had only slight improvement on
the second group‘s financial assets although they were able to get loans from the
initiatives. The results validate the quantitative data from interviews. This group had access
to loans but spent the money on unsustainable expenses rather than capital for product
development.
The table clearly shows that their access to credit and credit rating have the lowest score
among the items relating to financial assets. Unexpectedly, they rated the availability of
finances higher because at the onset, credit was available to them, however, at the same
time, they rated credit rating and access to credit significantly lower. This mixed result
may be explained by their inability to get more loans after failing to manage the first loan
effectively. The results showed that programmes, the village fund and OTOP loans were
still unsuccessful in significantly improving their financial assets over time.
Group 3 however, showed better results. In this group were the villagers who got loans and
fully participated in the tourism product development.
Table 7.9 PPT Impact on Financial Assets of Group 3
GROUP 3 FINANCIAL ASSETS
1998 2001 2011
Mean Improvement Mean Improvement Mean Improvement
Income from productive activity 2.414 Slight 2.585 Slight 2.536 Slight
Available finances / savings 2.829 Moderate 2.775 Moderate 2.951 Moderate
Regular inflow of money 2.327 Slight 2.643 Moderate 2.69 Slight
Credit Rating 2.366 Slight 2.366 Slight 2.424 Slight
Access to Credit 2.685 Moderate 2.685 Moderate 2.794 Moderate
AVERAGE 2.524 Slight 2.610 Moderate 2.679 Moderate
Source: Fieldwork 2010-2011
Although members of this group‘s income from productive activity and the regularity of
inflow of capital remained slight, access to credit and availability of finances were scored
significantly better. The data showed that OTOP brought significantly better improvement
in financial assets than the village funds. Over time, both initiatives resulted in a moderate
improvement in the financial assets. The results show that at least, for this group, who
participated fully in the PPT initiatives it produced moderate improvement in financial
assets.
195
Results from earlier interviews supported the more recent quantitative data collected. A
typical comment from one villager in Group 2 revealed the attitude prevalent among the
members of this group.
“I work all day and get only Baht 100, while a village fund offers Baht 20,000 per
household. Why would I not take it At that moment I must grab the money first and
think about how to pay it off later”.(Anonymous 2010a)
“The village fund has just launched its 2nd phase. So there is another Baht 1 million
that can be borrowed for each village. I see many people who still didn‟t return the
money from the first phase, and yet they were still able to borrow more from the second
phase. The village fund committee in the village has nine people. None of them finished
primary school. So, I will not blame them” (Anonymous 2010b)
It can be argued that the elected government at that time appropriated the village fund to
deliver on their populist campaign promises. An NGO worker observed how the financial
assistance marked for village tourism development, and later on the OTOP project to
further develop village products for tourism was otherwise spent unsustainably by some
villagers.
“People had different priorities and spent the extra money they had gained from the
OTOP project differently. Some villagers spent it on improving their houses, having
electricity connected to their village, or to buy cars or motorcycles” (Anonymous
2010c)
A government official‘s task in implementing the projects to villages where they had more
personal connections and relationships from years of public service, however, provided a
more apprehensive perspective to the untraditional process in which the financial
assistance was allocated:
“People in the rural area usually lived simple lives. They would produce as much as
they wanted and not more, even when they had opportunities to make more money. With
such outlook in life, many villagers did not give much importance to savings. They
might not be careful when spending money and risked getting indebted.” (Anonymous
2005f)
196
Several officials also mentioned about those who did not have enough capital to establish
their own business and ended up working for other OTOP producers in their village.
In conclusion, it might be said that the village tourism development financial assistance
strategies available from the village fund and later the OTOP project may have helped raise
income of some of the project participants. This means that the people had more financial
assets at their disposal. Some spent the extra money they had earned on improving their
living condition or supporting their children‘s education; others spent it on improving the
physical environment of their communities or reinvested it through community funds.
The results from the study however, showed that the PPT initiative had only slight to
moderate improvements in the financial assets of villagers in Had Bai Village, but even the
slightest improvement is still improvement, financial improvement that villagers and their
communities could use to further the diversification of their livelihood. However, as the
data indicates, to make PPT financially sustainable, it is important to teach local people
how to spend the extra income in a productive way.
7.2.2 PPT Impact on Social Assets
Social capital refers to community institutions, interaction among community members,
and their interaction with the outside world. Most of the Pro-Poor Tourism literature
reports that community institutions have been strengthened. Tourism developments have
enhanced cohesion and a sense of purpose. However, the process of institutional
development and strengthening is inevitably complex. There are some negative impacts
such as increased tension over community funds (Braman, 2001; Poultney and Spenceley
2001; Mahony and VanZyl 2001), inequitable power balances (Savillle, 2001), problems in
collective management of resources and enterprises (Renard 2001) and heavy reliance of
community institutions on external expertise (Braman 2001; Mahony and VanZyl 2001).
The concept of social capital has been in use for almost a century while the ideas behind it
go back further still. The concept became popular recently, but the term ―Social Capital‖
may first have appeared in a book published in 1916 in the United States that discussed
how neighbours could work together to oversee schools. Author Lyda Hanifan referred to
197
social capital as ―those tangible assets [that] count for most in the daily lives of people:
namely goodwill, fellowship, sympathy, and social intercourse among the individuals and
families who make up a social unit‖. That gives some sense of what‘s meant by social
capital, although today it might be difficult to come up with a single definition that
satisfied everyone. However, we can think of social capital simply as the links, shared
values and understandings in society that enable individuals and groups to trust each other
and so work together.
Social capital is defined by the OECD as ―networks together with shared norms,
values and understandings that facilitate co-operation within or among groups‖. In this
definition, we can think of networks as real-world links between groups or individuals.
Think of networks of friends, family networks, networks of former colleagues, and so on.
Our shared norms, values and understandings are less concrete than our social networks.
Sociologists sometimes speak of norms as society‘s unspoken and largely unquestioned
rules. Norms and understandings may not become apparent until they‘re broken. If adults
attack a child, for example, they breach the norms that protect children from harm. Values
may be more open to question; indeed societies often debate whether their values are
changing. And yet values – such as respect for people‘s safety and security – are an
essential linchpin in every social group. Put together, these networks and understandings
engender trust and so enable people to work together. (OECD.org Insights: Human
Capital, 2010)
In Had Bai, villagers who participated fully in the project activities learned
managerial skills necessary for group work; they shared responsibilities among themselves;
they communicated with one another more than before; and they shared benefits fairly
using cooperative systems. Gradually, they developed a good relationship among
themselves. The training organised by different government agencies provided a good
opportunity for villagers to get closer together. They built their own network, shared
information and experiences and helped each other. The villagers also had to interact more
with the outside world, with both government officials and tourists. They worked closely
with government officials who helped give advice on various issues, from production,
financing, to marketing of OTOP products. This had helped enhance the community‘s
unity and strengthen the community as an institution.
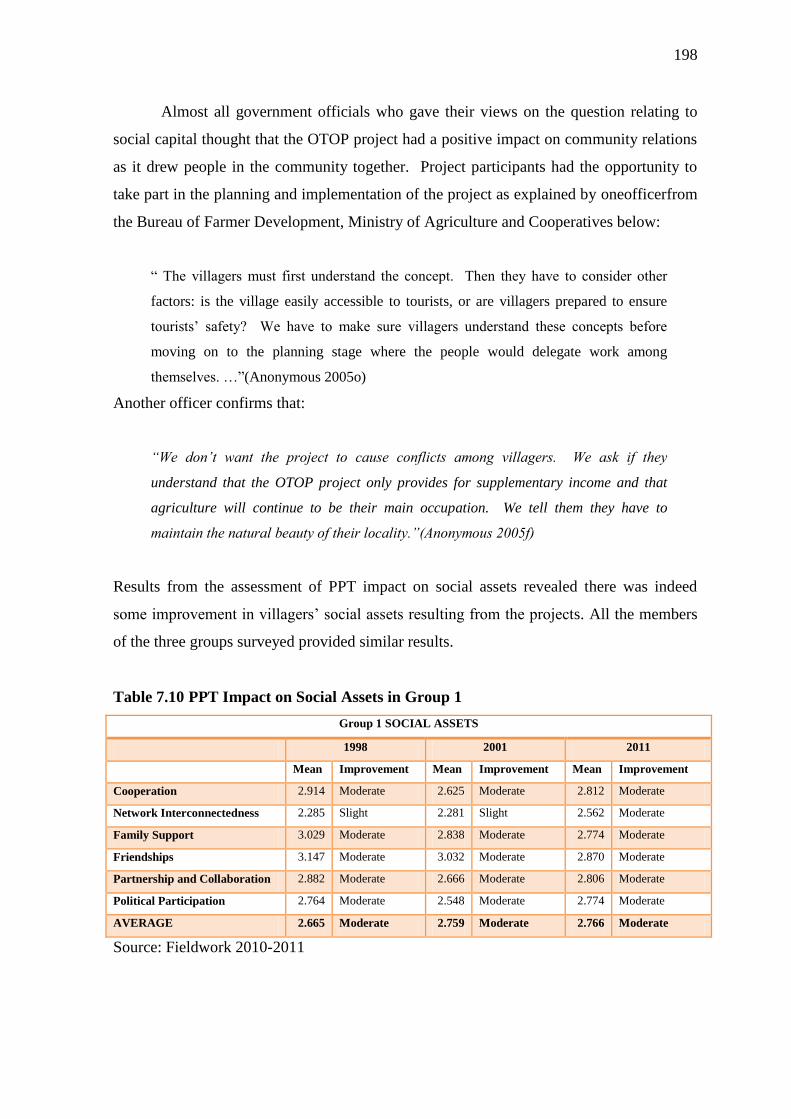
198
Almost all government officials who gave their views on the question relating to
social capital thought that the OTOP project had a positive impact on community relations
as it drew people in the community together. Project participants had the opportunity to
take part in the planning and implementation of the project as explained by oneofficerfrom
the Bureau of Farmer Development, Ministry of Agriculture and Cooperatives below:
― The villagers must first understand the concept. Then they have to consider other
factors: is the village easily accessible to tourists, or are villagers prepared to ensure
tourists‘ safety? We have to make sure villagers understand these concepts before
moving on to the planning stage where the people would delegate work among
themselves. …‖(Anonymous 2005o)
Another officer confirms that:
“We don‟t want the project to cause conflicts among villagers. We ask if they
understand that the OTOP project only provides for supplementary income and that
agriculture will continue to be their main occupation. We tell them they have to
maintain the natural beauty of their locality.”(Anonymous 2005f)
Results from the assessment of PPT impact on social assets revealed there was indeed
some improvement in villagers‘ social assets resulting from the projects. All the members
of the three groups surveyed provided similar results.
Table 7.10 PPT Impact on Social Assets in Group 1
Group 1 SOCIAL ASSETS
1998 2001 2011
Mean Improvement Mean Improvement Mean Improvement
Cooperation 2.914 Moderate 2.625 Moderate 2.812 Moderate
Network Interconnectedness 2.285 Slight 2.281 Slight 2.562 Moderate
Family Support 3.029 Moderate 2.838 Moderate 2.774 Moderate
Friendships 3.147 Moderate 3.032 Moderate 2.870 Moderate
Partnership and Collaboration 2.882 Moderate 2.666 Moderate 2.806 Moderate
Political Participation 2.764 Moderate 2.548 Moderate 2.774 Moderate
AVERAGE 2.665 Moderate 2.759 Moderate 2.766 Moderate
Source: Fieldwork 2010-2011
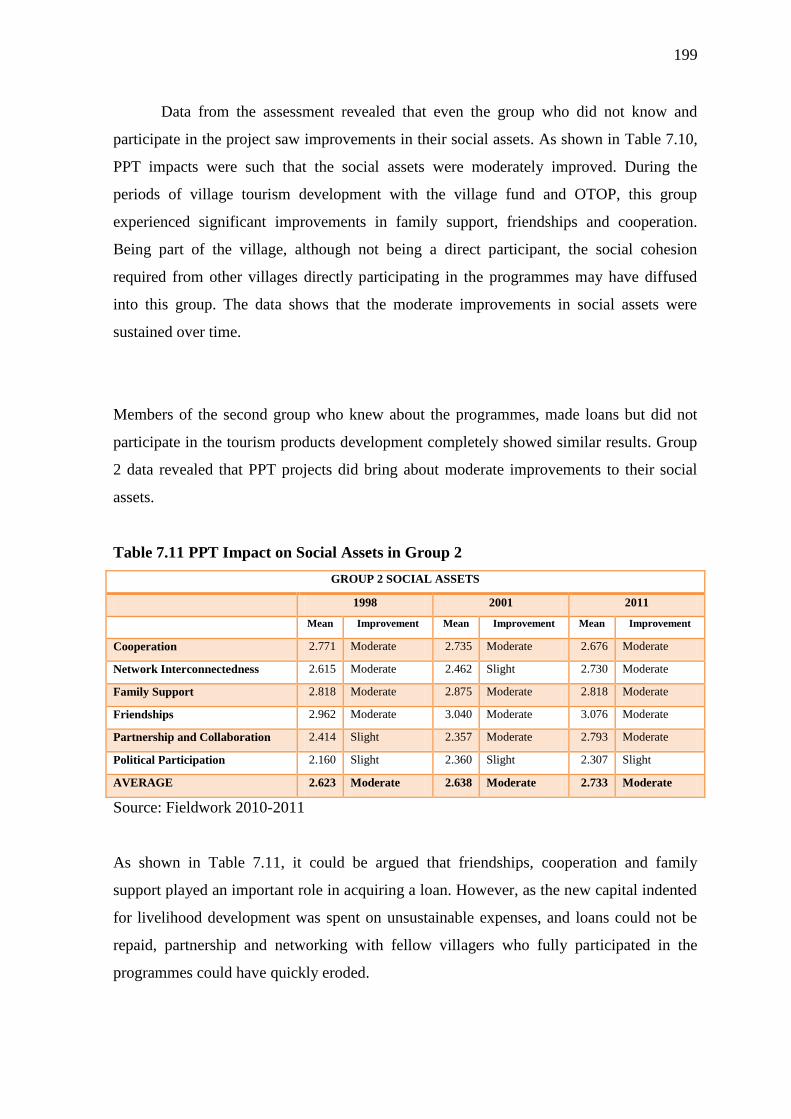
199
Data from the assessment revealed that even the group who did not know and
participate in the project saw improvements in their social assets. As shown in Table 7.10,
PPT impacts were such that the social assets were moderately improved. During the
periods of village tourism development with the village fund and OTOP, this group
experienced significant improvements in family support, friendships and cooperation.
Being part of the village, although not being a direct participant, the social cohesion
required from other villages directly participating in the programmes may have diffused
into this group. The data shows that the moderate improvements in social assets were
sustained over time.
Members of the second group who knew about the programmes, made loans but did not
participate in the tourism products development completely showed similar results. Group
2 data revealed that PPT projects did bring about moderate improvements to their social
assets.
Table 7.11 PPT Impact on Social Assets in Group 2
GROUP 2 SOCIAL ASSETS
1998 2001 2011
Mean Improvement Mean Improvement Mean Improvement
Cooperation 2.771 Moderate 2.735 Moderate 2.676 Moderate
Network Interconnectedness 2.615 Moderate 2.462 Slight 2.730 Moderate
Family Support 2.818 Moderate 2.875 Moderate 2.818 Moderate
Friendships 2.962 Moderate 3.040 Moderate 3.076 Moderate
Partnership and Collaboration 2.414 Slight 2.357 Moderate 2.793 Moderate
Political Participation 2.160 Slight 2.360 Slight 2.307 Slight
AVERAGE 2.623 Moderate 2.638 Moderate 2.733 Moderate
Source: Fieldwork 2010-2011
As shown in Table 7.11, it could be argued that friendships, cooperation and family
support played an important role in acquiring a loan. However, as the new capital indented
for livelihood development was spent on unsustainable expenses, and loans could not be
repaid, partnership and networking with fellow villagers who fully participated in the
programmes could have quickly eroded.
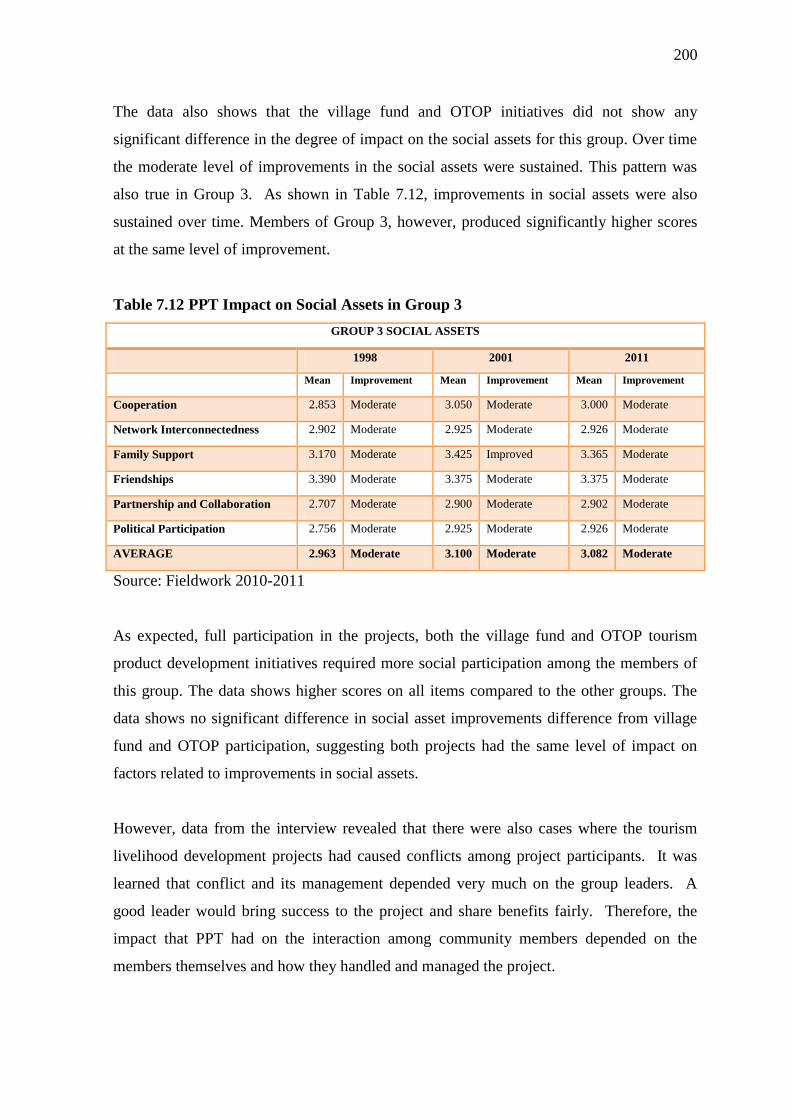
200
The data also shows that the village fund and OTOP initiatives did not show any
significant difference in the degree of impact on the social assets for this group. Over time
the moderate level of improvements in the social assets were sustained. This pattern was
also true in Group 3. As shown in Table 7.12, improvements in social assets were also
sustained over time. Members of Group 3, however, produced significantly higher scores
at the same level of improvement.
Table 7.12 PPT Impact on Social Assets in Group 3
GROUP 3 SOCIAL ASSETS
1998 2001 2011
Mean Improvement Mean Improvement Mean Improvement
Cooperation 2.853 Moderate 3.050 Moderate 3.000 Moderate
Network Interconnectedness 2.902 Moderate 2.925 Moderate 2.926 Moderate
Family Support 3.170 Moderate 3.425 Improved 3.365 Moderate
Friendships 3.390 Moderate 3.375 Moderate 3.375 Moderate
Partnership and Collaboration 2.707 Moderate 2.900 Moderate 2.902 Moderate
Political Participation 2.756 Moderate 2.925 Moderate 2.926 Moderate
AVERAGE 2.963 Moderate 3.100 Moderate 3.082 Moderate
Source: Fieldwork 2010-2011
As expected, full participation in the projects, both the village fund and OTOP tourism
product development initiatives required more social participation among the members of
this group. The data shows higher scores on all items compared to the other groups. The
data shows no significant difference in social asset improvements difference from village
fund and OTOP participation, suggesting both projects had the same level of impact on
factors related to improvements in social assets.
However, data from the interview revealed that there were also cases where the tourism
livelihood development projects had caused conflicts among project participants. It was
learned that conflict and its management depended very much on the group leaders. A
good leader would bring success to the project and share benefits fairly. Therefore, the
impact that PPT had on the interaction among community members depended on the
members themselves and how they handled and managed the project.
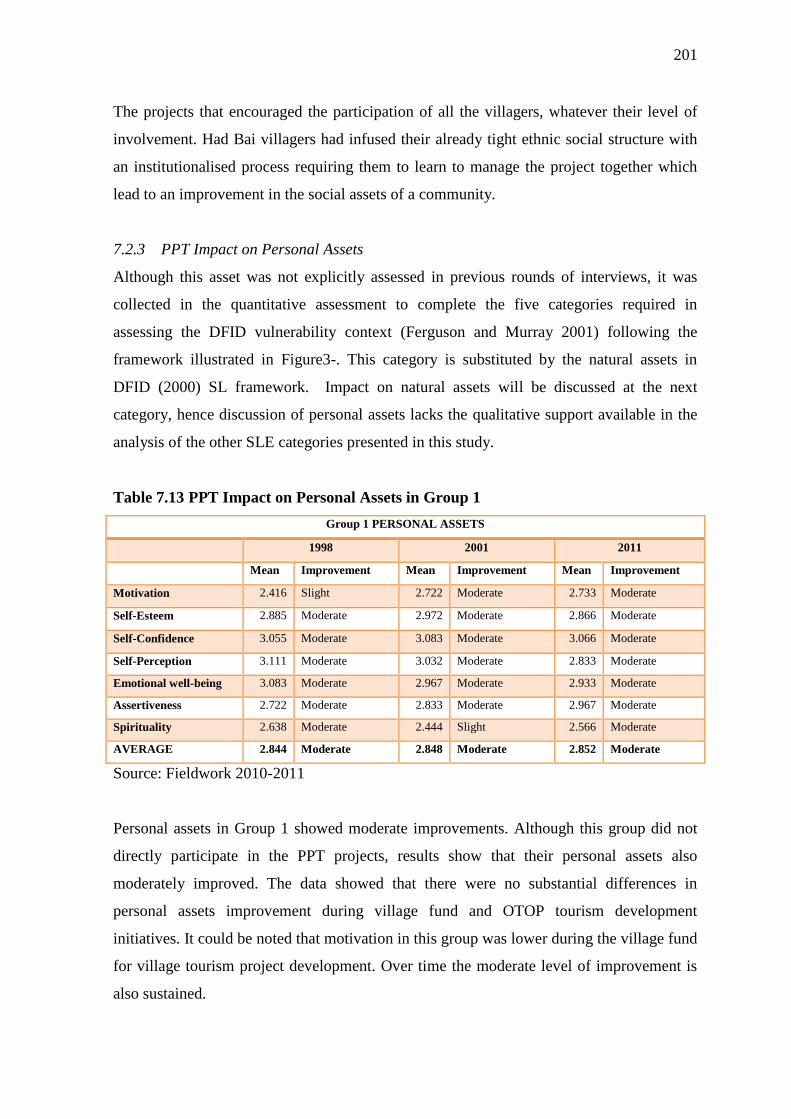
201
The projects that encouraged the participation of all the villagers, whatever their level of
involvement. Had Bai villagers had infused their already tight ethnic social structure with
an institutionalised process requiring them to learn to manage the project together which
lead to an improvement in the social assets of a community.
7.2.3 PPT Impact on Personal Assets
Although this asset was not explicitly assessed in previous rounds of interviews, it was
collected in the quantitative assessment to complete the five categories required in
assessing the DFID vulnerability context (Ferguson and Murray 2001) following the
framework illustrated in Figure3-. This category is substituted by the natural assets in
DFID (2000) SL framework. Impact on natural assets will be discussed at the next
category, hence discussion of personal assets lacks the qualitative support available in the
analysis of the other SLE categories presented in this study.
Table 7.13 PPT Impact on Personal Assets in Group 1
Group 1 PERSONAL ASSETS
1998 2001 2011
Mean Improvement Mean Improvement Mean Improvement
Motivation 2.416 Slight 2.722 Moderate 2.733 Moderate
Self-Esteem 2.885 Moderate 2.972 Moderate 2.866 Moderate
Self-Confidence 3.055 Moderate 3.083 Moderate 3.066 Moderate
Self-Perception 3.111 Moderate 3.032 Moderate 2.833 Moderate
Emotional well-being 3.083 Moderate 2.967 Moderate 2.933 Moderate
Assertiveness 2.722 Moderate 2.833 Moderate 2.967 Moderate
Spirituality 2.638 Moderate 2.444 Slight 2.566 Moderate
AVERAGE 2.844 Moderate 2.848 Moderate 2.852 Moderate
Source: Fieldwork 2010-2011
Personal assets in Group 1 showed moderate improvements. Although this group did not
directly participate in the PPT projects, results show that their personal assets also
moderately improved. The data showed that there were no substantial differences in
personal assets improvement during village fund and OTOP tourism development
initiatives. It could be noted that motivation in this group was lower during the village fund
for village tourism project development. Over time the moderate level of improvement is
also sustained.
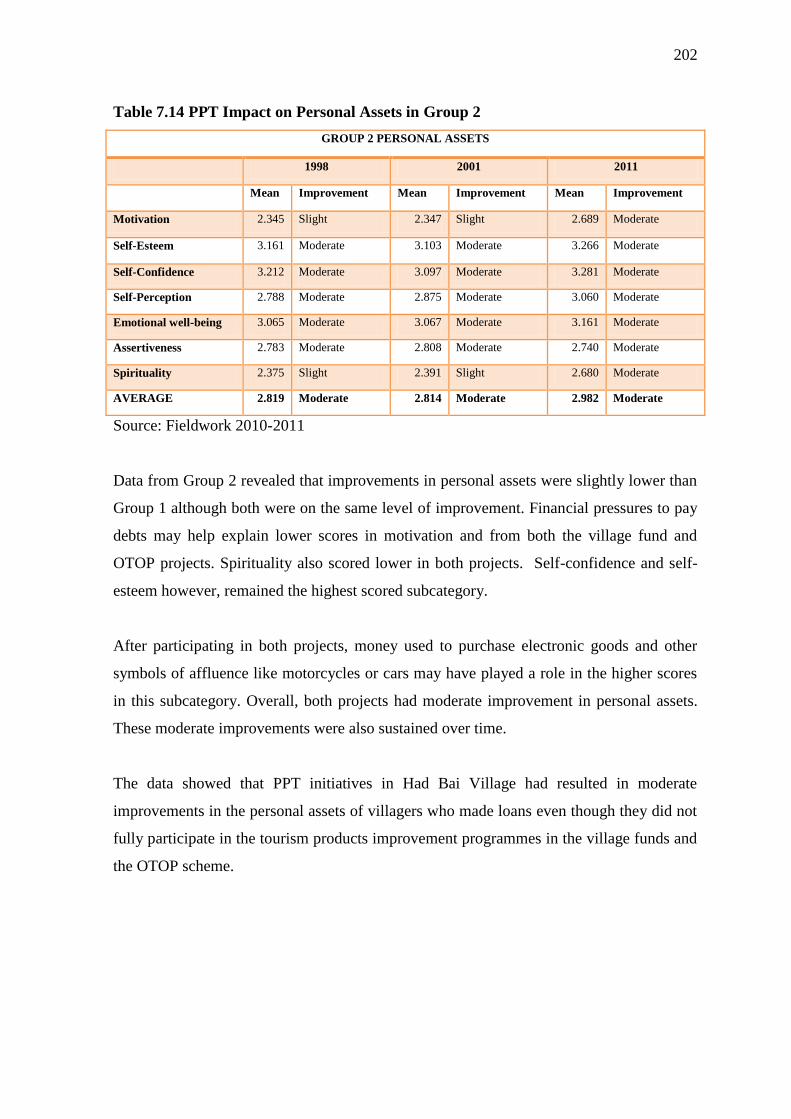
202
Table 7.14 PPT Impact on Personal Assets in Group 2
GROUP 2 PERSONAL ASSETS
1998 2001 2011
Mean Improvement Mean Improvement Mean Improvement
Motivation 2.345 Slight 2.347 Slight 2.689 Moderate
Self-Esteem 3.161 Moderate 3.103 Moderate 3.266 Moderate
Self-Confidence 3.212 Moderate 3.097 Moderate 3.281 Moderate
Self-Perception 2.788 Moderate 2.875 Moderate 3.060 Moderate
Emotional well-being 3.065 Moderate 3.067 Moderate 3.161 Moderate
Assertiveness 2.783 Moderate 2.808 Moderate 2.740 Moderate
Spirituality 2.375 Slight 2.391 Slight 2.680 Moderate
AVERAGE 2.819 Moderate 2.814 Moderate 2.982 Moderate
Source: Fieldwork 2010-2011
Data from Group 2 revealed that improvements in personal assets were slightly lower than
Group 1 although both were on the same level of improvement. Financial pressures to pay
debts may help explain lower scores in motivation and from both the village fund and
OTOP projects. Spirituality also scored lower in both projects. Self-confidence and self-
esteem however, remained the highest scored subcategory.
After participating in both projects, money used to purchase electronic goods and other
symbols of affluence like motorcycles or cars may have played a role in the higher scores
in this subcategory. Overall, both projects had moderate improvement in personal assets.
These moderate improvements were also sustained over time.
The data showed that PPT initiatives in Had Bai Village had resulted in moderate
improvements in the personal assets of villagers who made loans even though they did not
fully participate in the tourism products improvement programmes in the village funds and
the OTOP scheme.
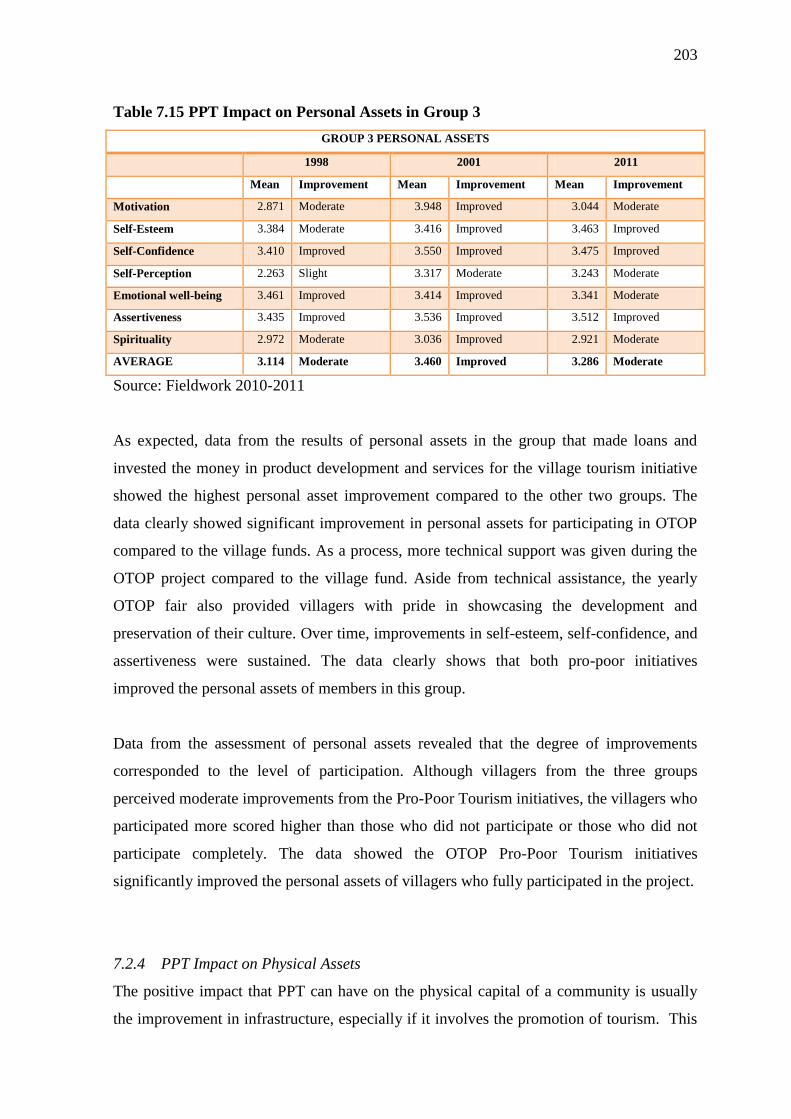
203
Table 7.15 PPT Impact on Personal Assets in Group 3
GROUP 3 PERSONAL ASSETS
1998 2001 2011
Mean Improvement Mean Improvement Mean Improvement
Motivation 2.871 Moderate 3.948 Improved 3.044 Moderate
Self-Esteem 3.384 Moderate 3.416 Improved 3.463 Improved
Self-Confidence 3.410 Improved 3.550 Improved 3.475 Improved
Self-Perception 2.263 Slight 3.317 Moderate 3.243 Moderate
Emotional well-being 3.461 Improved 3.414 Improved 3.341 Moderate
Assertiveness 3.435 Improved 3.536 Improved 3.512 Improved
Spirituality 2.972 Moderate 3.036 Improved 2.921 Moderate
AVERAGE 3.114 Moderate 3.460 Improved 3.286 Moderate
Source: Fieldwork 2010-2011
As expected, data from the results of personal assets in the group that made loans and
invested the money in product development and services for the village tourism initiative
showed the highest personal asset improvement compared to the other two groups. The
data clearly showed significant improvement in personal assets for participating in OTOP
compared to the village funds. As a process, more technical support was given during the
OTOP project compared to the village fund. Aside from technical assistance, the yearly
OTOP fair also provided villagers with pride in showcasing the development and
preservation of their culture. Over time, improvements in self-esteem, self-confidence, and
assertiveness were sustained. The data clearly shows that both pro-poor initiatives
improved the personal assets of members in this group.
Data from the assessment of personal assets revealed that the degree of improvements
corresponded to the level of participation. Although villagers from the three groups
perceived moderate improvements from the Pro-Poor Tourism initiatives, the villagers who
participated more scored higher than those who did not participate or those who did not
participate completely. The data showed the OTOP Pro-Poor Tourism initiatives
significantly improved the personal assets of villagers who fully participated in the project.
7.2.4 PPT Impact on Physical Assets
The positive impact that PPT can have on the physical capital of a community is usually
the improvement in infrastructure, especially if it involves the promotion of tourism. This
204
can be the construction of roads, the supply of electricity and water, and the improvement
of the sewage system. However, according to the information obtained from the
interviews, the impact of PPT projects on the physical environment of the community
tended to be an ecological one. This may be because the OTOP project did not put
emphasis on the development of infrastructure but on human capital as explained by the
interviewee.
PPT literature revealed that improvements in infrastructure can be a good result of Pro-
Poor Tourism initiatives. At Manyeleti Game reserve, road and water access for local
communities is improved (Mahony and VanZyl, 2001). At Wilderness Safari the extension
of water and electricity to tourist lodges also serves people in the community (Poultney and
Spenceley, 2001). However, noise, cleanliness and the provision of adequate bathroom
facilities are also identified as specific problems (Nicanor, 2001). Thus, helping
community enterprises to achieve adequate levels of quality is a challenge.
The PPT initiative to develop tourist products as in the case of the OTOP project involved
a larger scale of production of goods which created more garbage and waste water in the
community. Sometimes chemicals were used in the production process which gave off
unpleasant smell and could be hazardous to the environment. For example, in one
community where project participants engaged in cloth dyeing activities, underground
water was contaminated by the dyes that were left on the ground. In some communities,
people worked together to keep their environment clean; but in others these wastes might
not be disposed of properly and could create problems.
Physical capital is extremely important to the success of PPT. The villagers all said that
PPT was one factor leading to a wider and better road to the village which reduced the
travelling time and gave an option to visiting tourists not wanting to come by long tail boat
via the Mekong River. However, there is no proper signage giving directions to the
village, and villagers said the construction of the new road had caused confusion for some
tourists.
“My friend came over from another village to visit me, and I had cooked several kinds
of food to serve them. I waited and waited and they called the head man later in the
evening to say they drove past Had Bai Village because the new road had changed the
205
view and there was no sign pointing the direction to Had Bai. Even local people cannot
find this village, so how can the tourists come to us?”(Anonymous 2010a)
“I was upset about the new physical structure very much. The new road looks so
confusing and there is no sign or direction where to go to our village. I remember when
my son got married only half of the guests came because the rest were confused and
couldn‟t find the village. It takes another one hour to come back if you miss the
entrance.”(Anonymous 2010d)
“It is good to have a new road. However the road just passes the entrance of the
village. It is very confusing and not practical for visitors to turn left immediately and off
the new road to the same old gravel road”( Anonymous 2010e)
In cases where a community offered or built a place to welcome tourists, good
management was required to regulate the flow of people who would visit the village so as
not to disrupt the locals‘ way of life or cause damage to the environment. Some officers
recommended changes be made to the physical environment of a community to provide
tourist facilities. For example, every village with OTOP tourism had to arrange a meeting
place for tourists, build parking lots for tourist coaches and separate restrooms for men and
women, and an outlet for its OTOP products.
Data from the interviews revealed that the OTOP project could put a strain on the physical
environment of a community as its members produced more or when more tourists visited.
However, this negative impact could be avoided with proper knowledge and good
management.
Data from the quantitative assessment revealed that there were indeed moderate
improvements in the physical assets resulting from the PPT initiatives. Improvements in
physical assets assessed included child/elderly care, security of shelter, affordability of
energy, information, access to banking services, access to basic consumer needs,
transportation, tools and equipment, natural resources, and air and water quality.
Results from the assessment indicated slight variation in levels of improvement and
specific to each subcategory as well. Although the improvements in physical assets were
primarily directed to support the villagers participating in the PPT initiatives, the impact
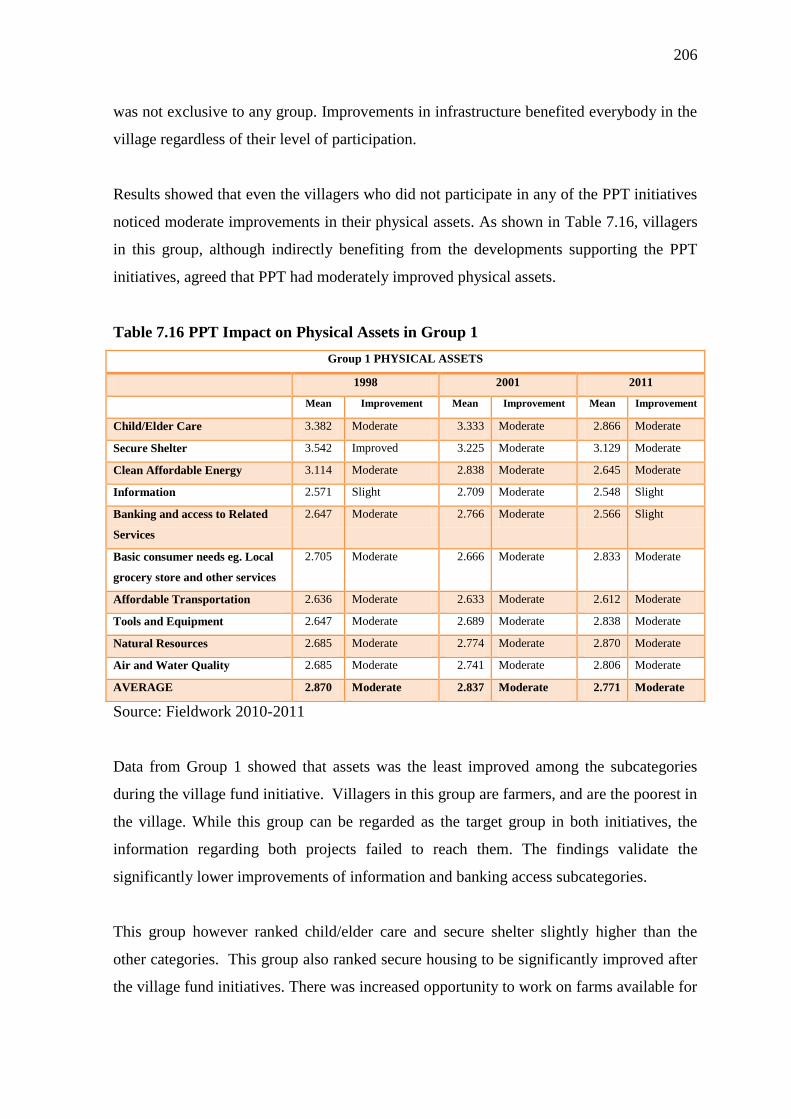
206
was not exclusive to any group. Improvements in infrastructure benefited everybody in the
village regardless of their level of participation.
Results showed that even the villagers who did not participate in any of the PPT initiatives
noticed moderate improvements in their physical assets. As shown in Table 7.16, villagers
in this group, although indirectly benefiting from the developments supporting the PPT
initiatives, agreed that PPT had moderately improved physical assets.
Table 7.16 PPT Impact on Physical Assets in Group 1
Group 1 PHYSICAL ASSETS
1998 2001 2011
Mean Improvement Mean Improvement Mean Improvement
Child/Elder Care 3.382 Moderate 3.333 Moderate 2.866 Moderate
Secure Shelter 3.542 Improved 3.225 Moderate 3.129 Moderate
Clean Affordable Energy 3.114 Moderate 2.838 Moderate 2.645 Moderate
Information 2.571 Slight 2.709 Moderate 2.548 Slight
Banking and access to Related
Services
2.647 Moderate 2.766 Moderate 2.566 Slight
Basic consumer needs eg. Local
grocery store and other services
2.705 Moderate 2.666 Moderate 2.833 Moderate
Affordable Transportation 2.636 Moderate 2.633 Moderate 2.612 Moderate
Tools and Equipment 2.647 Moderate 2.689 Moderate 2.838 Moderate
Natural Resources 2.685 Moderate 2.774 Moderate 2.870 Moderate
Air and Water Quality 2.685 Moderate 2.741 Moderate 2.806 Moderate
AVERAGE 2.870 Moderate 2.837 Moderate 2.771 Moderate
Source: Fieldwork 2010-2011
Data from Group 1 showed that assets was the least improved among the subcategories
during the village fund initiative. Villagers in this group are farmers, and are the poorest in
the village. While this group can be regarded as the target group in both initiatives, the
information regarding both projects failed to reach them. The findings validate the
significantly lower improvements of information and banking access subcategories.
This group however ranked child/elder care and secure shelter slightly higher than the
other categories. This group also ranked secure housing to be significantly improved after
the village fund initiatives. There was increased opportunity to work on farms available for
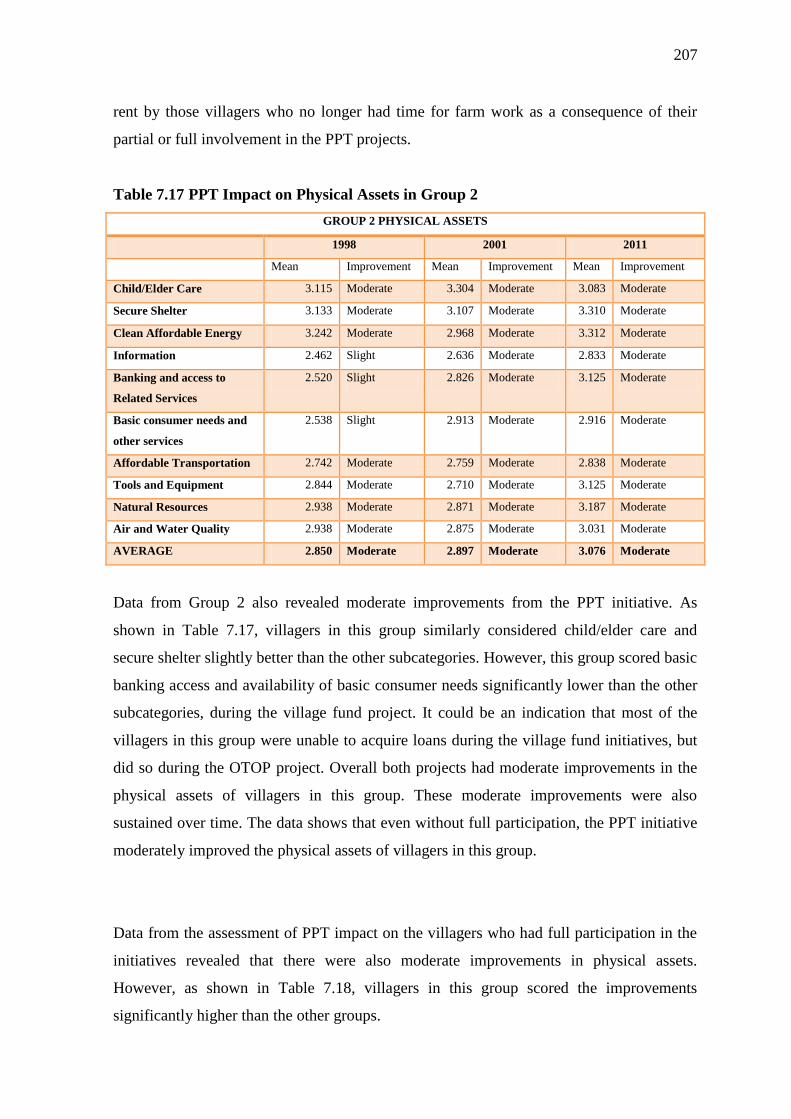
207
rent by those villagers who no longer had time for farm work as a consequence of their
partial or full involvement in the PPT projects.
Table 7.17 PPT Impact on Physical Assets in Group 2
GROUP 2 PHYSICAL ASSETS
1998 2001 2011
Mean Improvement Mean Improvement Mean Improvement
Child/Elder Care 3.115 Moderate 3.304 Moderate 3.083 Moderate
Secure Shelter 3.133 Moderate 3.107 Moderate 3.310 Moderate
Clean Affordable Energy 3.242 Moderate 2.968 Moderate 3.312 Moderate
Information 2.462 Slight 2.636 Moderate 2.833 Moderate
Banking and access to
Related Services
2.520 Slight 2.826 Moderate 3.125 Moderate
Basic consumer needs and
other services
2.538 Slight 2.913 Moderate 2.916 Moderate
Affordable Transportation 2.742 Moderate 2.759 Moderate 2.838 Moderate
Tools and Equipment 2.844 Moderate 2.710 Moderate 3.125 Moderate
Natural Resources 2.938 Moderate 2.871 Moderate 3.187 Moderate
Air and Water Quality 2.938 Moderate 2.875 Moderate 3.031 Moderate
AVERAGE 2.850 Moderate 2.897 Moderate 3.076 Moderate
Data from Group 2 also revealed moderate improvements from the PPT initiative. As
shown in Table 7.17, villagers in this group similarly considered child/elder care and
secure shelter slightly better than the other subcategories. However, this group scored basic
banking access and availability of basic consumer needs significantly lower than the other
subcategories, during the village fund project. It could be an indication that most of the
villagers in this group were unable to acquire loans during the village fund initiatives, but
did so during the OTOP project. Overall both projects had moderate improvements in the
physical assets of villagers in this group. These moderate improvements were also
sustained over time. The data shows that even without full participation, the PPT initiative
moderately improved the physical assets of villagers in this group.
Data from the assessment of PPT impact on the villagers who had full participation in the
initiatives revealed that there were also moderate improvements in physical assets.
However, as shown in Table 7.18, villagers in this group scored the improvements
significantly higher than the other groups.
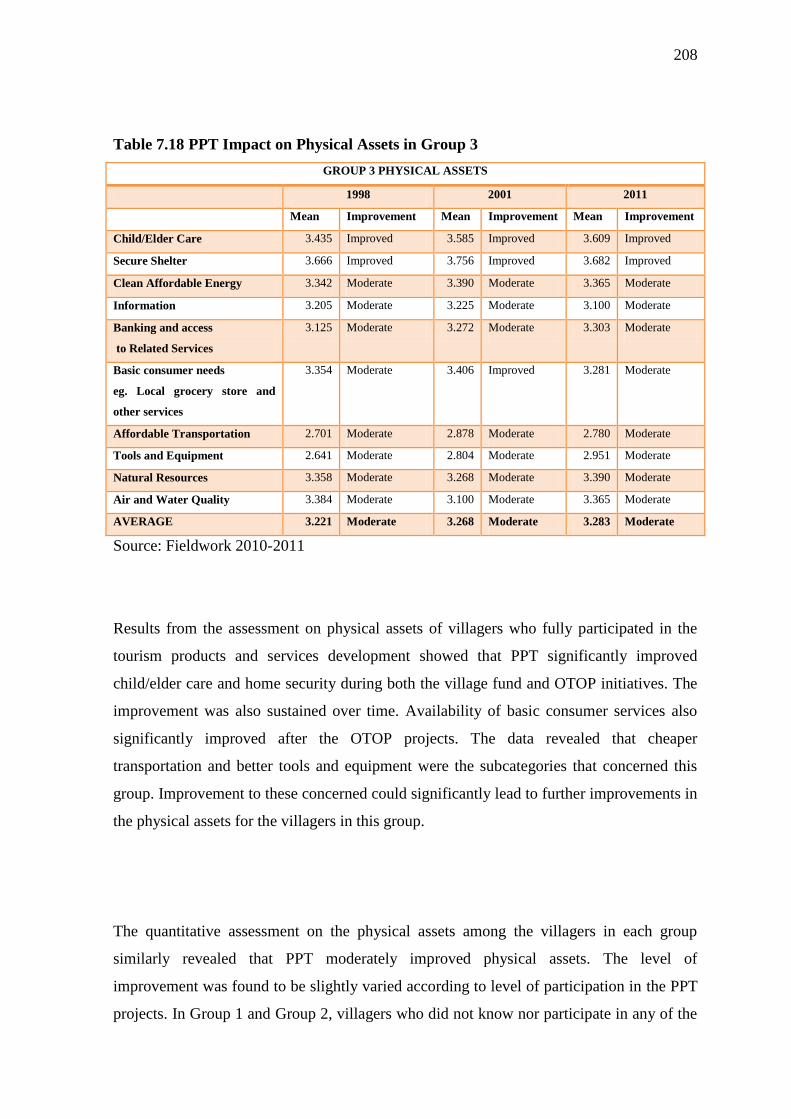
208
Table 7.18 PPT Impact on Physical Assets in Group 3
GROUP 3 PHYSICAL ASSETS
1998 2001 2011
Mean Improvement Mean Improvement Mean Improvement
Child/Elder Care 3.435 Improved 3.585 Improved 3.609 Improved
Secure Shelter 3.666 Improved 3.756 Improved 3.682 Improved
Clean Affordable Energy 3.342 Moderate 3.390 Moderate 3.365 Moderate
Information 3.205 Moderate 3.225 Moderate 3.100 Moderate
Banking and access
to Related Services
3.125 Moderate 3.272 Moderate 3.303 Moderate
Basic consumer needs
eg. Local grocery store and
other services
3.354 Moderate 3.406 Improved 3.281 Moderate
Affordable Transportation 2.701 Moderate 2.878 Moderate 2.780 Moderate
Tools and Equipment 2.641 Moderate 2.804 Moderate 2.951 Moderate
Natural Resources 3.358 Moderate 3.268 Moderate 3.390 Moderate
Air and Water Quality 3.384 Moderate 3.100 Moderate 3.365 Moderate
AVERAGE 3.221 Moderate 3.268 Moderate 3.283 Moderate
Source: Fieldwork 2010-2011
Results from the assessment on physical assets of villagers who fully participated in the
tourism products and services development showed that PPT significantly improved
child/elder care and home security during both the village fund and OTOP initiatives. The
improvement was also sustained over time. Availability of basic consumer services also
significantly improved after the OTOP projects. The data revealed that cheaper
transportation and better tools and equipment were the subcategories that concerned this
group. Improvement to these concerned could significantly lead to further improvements in
the physical assets for the villagers in this group.
The quantitative assessment on the physical assets among the villagers in each group
similarly revealed that PPT moderately improved physical assets. The level of
improvement was found to be slightly varied according to level of participation in the PPT
projects. In Group 1 and Group 2, villagers who did not know nor participate in any of the
209
programmes indirectly benefited from the improvements of physical infrastructure
primarily intended to support the PPT initiatives.
In Group 3, villagers who fully participated in the project revealed significant
improvements in some subcategories, moreover, data indicated that even slight
improvement in transportation, tools and equipment could significantly improve the impact
on the overall physical assets.
7.2.5 PPT Impact on Human Assets
All PPT case studies note positive impacts on human capital in enhanced skills through
tourism-related vocational training and development of business and organizational skills.
Poor young students receive funding from local schools, either through company donations
(Braman, 2001; Poultney and Spenceley, 2001) or from expenditure of community
income(Nicanor, 2001). If the community did not take up Pro-Poor Tourism, they would
have to wait for decades for many of these benefits to come to their location.
In Thailand‘s case, most government officials who were interviewed agreed that one of the
most obvious changes brought about by PPT initiatives like the village fund to support
village tourism and OTOP project to develop tourism products and service in Had Bai
Village, was the impact on the knowledge and skills of the people who participated. The
very concept of the tourism products and services development, as in the OTOP project,
was to make use of traditional knowledge that people in the rural area inherited from
generation to generation to produce goods in a manner that could provide them with
additional sustainable income.
Since the rural people did not have experience in business production, the government,
therefore, had to provide knowledge and training to the people not only in production, but
also in packaging, marketing and financial management to enable them to participate
effectively in the project. Several government agencies were involved in organizing
training according to their respective expertise. For example, the Ministry of Commerce
provided training on how to improve the quality of OTOP products that suited market
demands and with a focus on value creation. The SME Bank gave training on financial
disciplines and management.
210
More importantly, the OTOP project had taught the people the learning process which
could be applied to any new situation. The impact of the training on project participants
was described by an Officer from the Community Development Department, the Ministry
of Interior:
“Villagers have developed knowledge in the production of OTOP goods. For example,
in one village many households may produce the same kind of product. Villagers
learned that if they did not make their products different from the others, they would not
be able to sell them. This led them to become more creative in making their products
more unique to make them more competitive…Some villagers were keen to attend
training courses at their own expense…because they knew the more they learned, the
better the chance to develop their products.” ( Anonymous 2005o)
In general, officials thought that the people had gained knowledge from training courses
organised by various government departments. As they brought such knowledge to
practice, they developed production, marketing and organizational skills. They also
learned to share experiences among themselves which further enhanced their knowledge.
Some interviewees thought that the OTOP project had helped preserve traditional
knowledge. The elderly people in a household would teach the younger generation
members how to use traditional knowledge in producing OTOP products, such as dyeing
techniques using natural materials. Some communities continued to make certain
traditional products, such as the paper parasol of ChiangMaiProvince, because they drew
tourists to their village. Today, the paper parasol can be replaced by other modern
products. Without the OTOP project, such traditional industry might have disappeared.
The PPT project had also resulted in a better use of the rural workforce. Villagers were
taught to produce things they were adept with, usually some kind of handicraft and labour-
intensive products. They were also advised that they should try to make different products
to avoid competition. One villager said:
“Women were given vocational training in their free time after they finished work on
the farm. This was a much more effective way to spend free time for some women who
would otherwise engage in unproductive activities like drinking alcohol and playing
cards.” ( Anonymous 2010d)
211
From the interviews with government officials on the impact of the OTOP project on
human capital, it could be said that an introduction of new knowledge and skills was an
important factor that enabled project participants to take on activities other than their
traditional occupation of farming, thus contributing significantly to livelihood
diversification. From the villagers‘ point of view, the skills acquired from the project
enhanced human capital. The cash earned could be invested in improving the education
and health of people in the village. The PPT initiative did not develop complimentary skills
or a market for agricultural activities. The project design did not encourage mutual learning
and adjustment by the local people and local government. What the villagers need most is
the market to sell the products and marketing knowledge provided by the government.
Results from the quantitative assessment validated data collected from the in- depth
interviews and focus groups. The data, however, showed varying levels of improvements
corresponding to the villagers‘ level of involvement in the projects. Moreover, this
category showed the highest level of improvements among the other categories and also
more significantly improved subcategories.
Data revealed that villagers who did not participate in the PPT initiative also perceived
moderate improvements in human assets although they were not directly involved in any of
the projects. As shown in
Table 7.19, human assets were moderately improved.
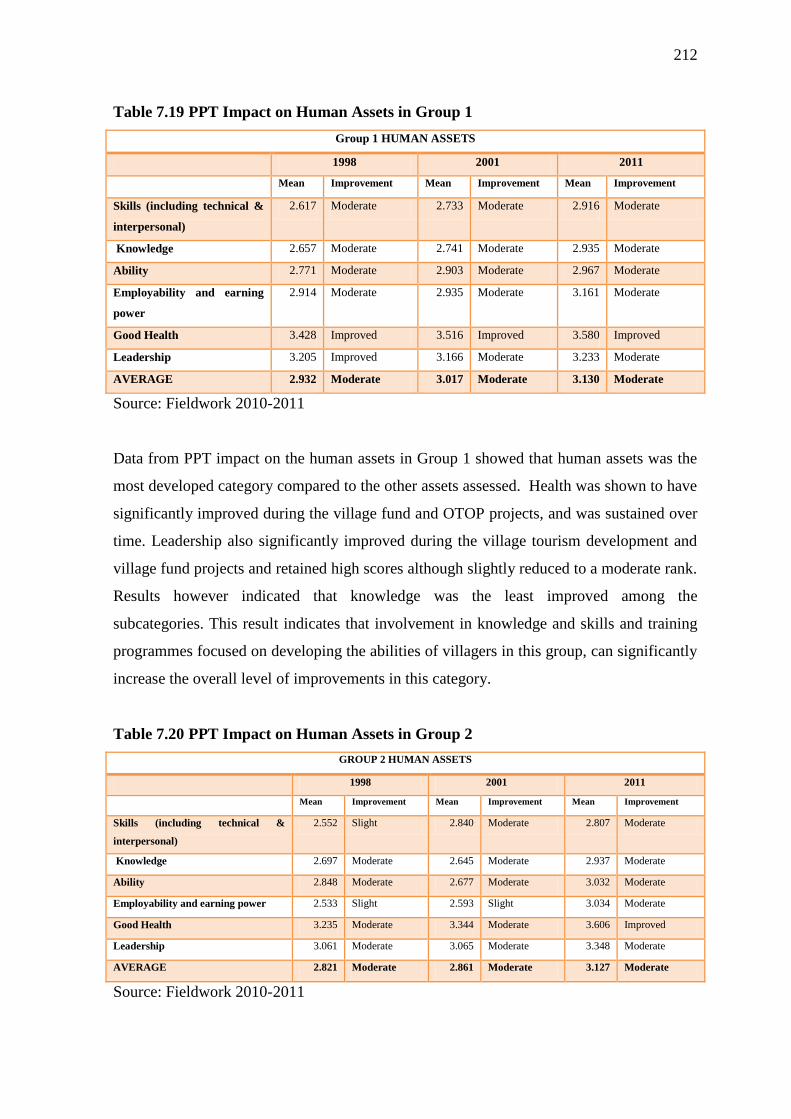
212
Table 7.19 PPT Impact on Human Assets in Group 1
Group 1 HUMAN ASSETS
1998 2001 2011
Mean Improvement Mean Improvement Mean Improvement
Skills (including technical &
interpersonal)
2.617 Moderate 2.733 Moderate 2.916 Moderate
Knowledge 2.657 Moderate 2.741 Moderate 2.935 Moderate
Ability 2.771 Moderate 2.903 Moderate 2.967 Moderate
Employability and earning
power
2.914 Moderate 2.935 Moderate 3.161 Moderate
Good Health 3.428 Improved 3.516 Improved 3.580 Improved
Leadership 3.205 Improved 3.166 Moderate 3.233 Moderate
AVERAGE 2.932 Moderate 3.017 Moderate 3.130 Moderate
Source: Fieldwork 2010-2011
Data from PPT impact on the human assets in Group 1 showed that human assets was the
most developed category compared to the other assets assessed. Health was shown to have
significantly improved during the village fund and OTOP projects, and was sustained over
time. Leadership also significantly improved during the village tourism development and
village fund projects and retained high scores although slightly reduced to a moderate rank.
Results however indicated that knowledge was the least improved among the
subcategories. This result indicates that involvement in knowledge and skills and training
programmes focused on developing the abilities of villagers in this group, can significantly
increase the overall level of improvements in this category.
Table 7.20 PPT Impact on Human Assets in Group 2
GROUP 2 HUMAN ASSETS
1998 2001 2011
Mean Improvement Mean Improvement Mean Improvement
Skills (including technical &
interpersonal)
2.552 Slight 2.840 Moderate 2.807 Moderate
Knowledge 2.697 Moderate 2.645 Moderate 2.937 Moderate
Ability 2.848 Moderate 2.677 Moderate 3.032 Moderate
Employability and earning power 2.533 Slight 2.593 Slight 3.034 Moderate
Good Health 3.235 Moderate 3.344 Moderate 3.606 Improved
Leadership 3.061 Moderate 3.065 Moderate 3.348 Moderate
AVERAGE 2.821 Moderate 2.861 Moderate 3.127 Moderate
Source: Fieldwork 2010-2011
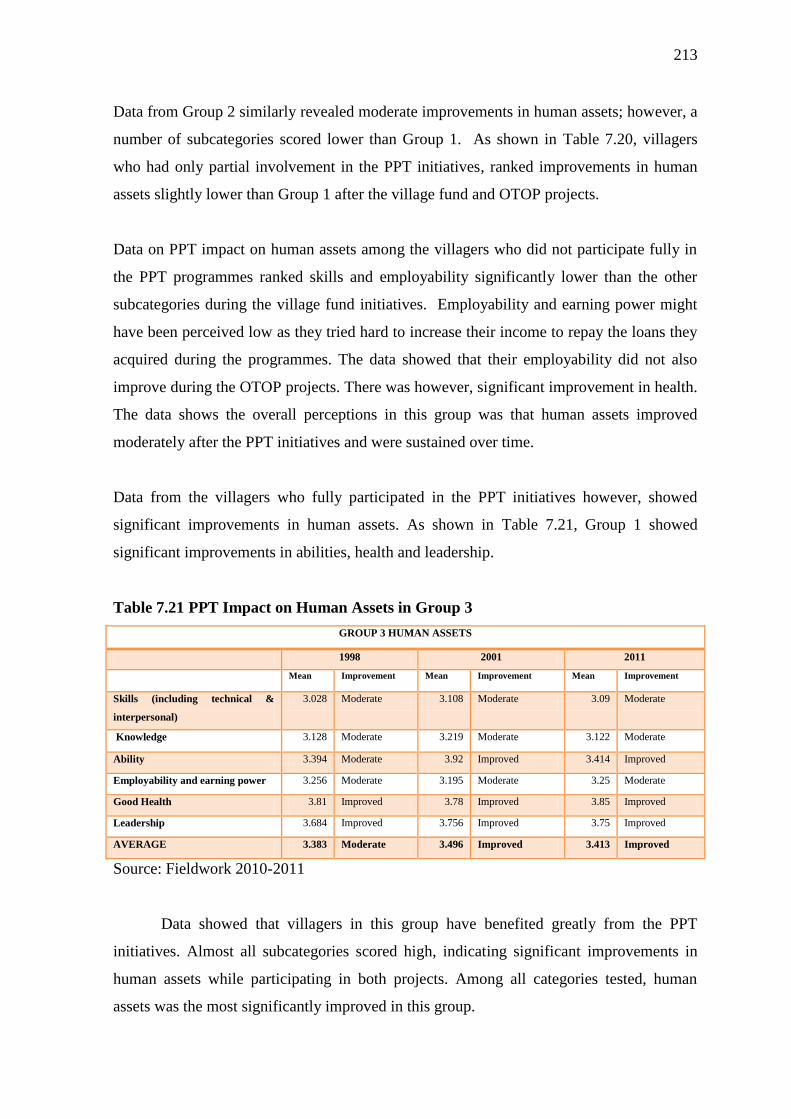
213
Data from Group 2 similarly revealed moderate improvements in human assets; however, a
number of subcategories scored lower than Group 1. As shown in Table 7.20, villagers
who had only partial involvement in the PPT initiatives, ranked improvements in human
assets slightly lower than Group 1 after the village fund and OTOP projects.
Data on PPT impact on human assets among the villagers who did not participate fully in
the PPT programmes ranked skills and employability significantly lower than the other
subcategories during the village fund initiatives. Employability and earning power might
have been perceived low as they tried hard to increase their income to repay the loans they
acquired during the programmes. The data showed that their employability did not also
improve during the OTOP projects. There was however, significant improvement in health.
The data shows the overall perceptions in this group was that human assets improved
moderately after the PPT initiatives and were sustained over time.
Data from the villagers who fully participated in the PPT initiatives however, showed
significant improvements in human assets. As shown in Table 7.21, Group 1 showed
significant improvements in abilities, health and leadership.
Table 7.21 PPT Impact on Human Assets in Group 3
GROUP 3 HUMAN ASSETS
1998 2001 2011
Mean Improvement Mean Improvement Mean Improvement
Skills (including technical &
interpersonal)
3.028 Moderate 3.108 Moderate 3.09 Moderate
Knowledge 3.128 Moderate 3.219 Moderate 3.122 Moderate
Ability 3.394 Moderate 3.92 Improved 3.414 Improved
Employability and earning power 3.256 Moderate 3.195 Moderate 3.25 Moderate
Good Health 3.81 Improved 3.78 Improved 3.85 Improved
Leadership 3.684 Improved 3.756 Improved 3.75 Improved
AVERAGE 3.383 Moderate 3.496 Improved 3.413 Improved
Source: Fieldwork 2010-2011
Data showed that villagers in this group have benefited greatly from the PPT
initiatives. Almost all subcategories scored high, indicating significant improvements in
human assets while participating in both projects. Among all categories tested, human
assets was the most significantly improved in this group.
214
This result validates the data collected from interviews; the PPT projects had
indeed improved human assets of villagers in this group.
The analysis of PPT impact on assets revealed that improvements to assets
correspond to the level of involvement in the projects. Villagers who fully participated in
the tourism products development programmes revealed more improved assets than those
villagers who did not and those who had only partial participation. It is interesting to note
however that in some subcategories, those who did not participate had perceived slightly
better improvements than those who partially participated.
When comparing the effectiveness of the two tourism product and service
development projects in the village, the data reveals that the OTOP project is more
effective in improving the villager‘s assets. On the analysis of effects over time, the data
showed that the effects were sustained. The data therefore, conclusively demonstrated that
the PPT initiatives had indeed resulted in some slight and moderate improvements in some
categories. Comparison of subcategories in each category, however, shows an entirely
different profile. There were actually some subcategories that were shown to have
significantly improved, analysis of subcategories indicating leverage points that could be
used to effectively increase improvements in each asset. Overall, the data clearly
demonstrated that the SL approach can be a very useful tool, not only to assess the
effectiveness of PPT programmes but also to point the way for improving these
programmes.
As previously discussed, the impacts on natural assets were not assessed
quantitatively. This category was only a subcategory in the physical asset category.
However, in the recent adaptations of the SL approach framework, it has been made to
replace the physical category entirely. Natural assets and Physical assets could be
integrated into the framework as separate entities, since both are significant and important
indicators of sustainability. In the following section, findings from the qualitative data will
be used to determine how PPT programmes affected the natural assets in Had Bai Village.
215
7.2.6 PPT Impact on Natural Capital
The impact of PPT projects on the natural resources can be positive or negative depending
on whether the villagers know how to manage these resources. The impact of Pro-Poor
Tourism initiatives on the natural resources of the poor appears to have been relatively
small. In most of the literature, tourism is linked with good management of the land, coast
and other natural resources. Tourism has therefore provided incentives for conservation
activities, including lobbying against degrading industries i.e. oil exploration in the
Amazon (Braman, 2001).
The concept of PPT in Thailand was the utilization of local resources and know-how for
the production of goods or services by the community to create employment and increase
income for rural people.
With the introduction of tourism product development into a local community, people
learned to use materials found in their village to produce goods. Some communities
offered places of attraction for visiting tourists. All of the officials who gave their views
on this issue said the PPT projects with supporting livelihood development initiatives, had
led to greater use of natural resources to increase income. Some communities came to
recognise the value of their resources and moved to protect and conserve them, as an
officer from the Bureau of Farmers Development, Ministry of Agriculture and
Cooperatives said:
“OTOP products use natural resources in the community asraw materials. Villagers
who participated in the project need to increase production, both in terms of quantity
and quality. As they need more raw materials, they have to grow more trees and plants
used in making OTOP products. They also take good care of what they grow to ensure
that they have good materials to produce quality products. Let‟s take the case of the
production of “sa” paper in Chiang Mai‟s OTOP as an example. To make “sa” paper,
villagers have to cut down “sa” trees in the community and use them as raw materials.
As they increase their production, they see that “sa” trees in their community are fast
depleting. They have become aware that without growing more “sa” trees, they will
be left without any raw materials for their production. This also happens to villagers
whose products use herbal plants as raw materials.” (Anonymous 2005o)
216
There was concern from officers that some communities might not be aware that excessive
use of natural resources without any effort to protect them could be unsustainable. The
exploitation of natural resources without a sense of responsibility may create more wealth
for the project participants in the short-term. But in the long run, the community would
stand to lose as the natural resources depleted. There was a case where trees were cut
down in a wide area because villagers wanted to grow the plants used to make “Mak Mao”
wine.
In the case of cultural tourism where the natural resources of a community are the
―product‖ that attracts tourists or where villagers offer opportunities for tourists to
experience their traditional way of life which is usually related to agriculture with
Homestay type accommodation, also known as ―agro-tourism.‖
An official from the Ministry of Agriculture and Cooperatives thought that so far the
villagers were able to preserve the natural endowment in their locality in part because
―agro-tourism‖ is not mainstream but is an alternative tourism not involving large numbers
of tourists. This type of tourism thus does not put much strain on the natural resources and
the small number of tourists is within the capacity of a community to manage.
The author‘s work after joining the Tourism Ministry promoted Homestays
certified by the Ministry of Tourism and Sports of Thailand in 2012. The Department of
Tourism, Ministry of Tourism and Sports has been developing the Homestay Standard
since 2004. In 2014, there were 143 homestays nationwide awarded the standard certificate
from the Department of Tourism. The program aims to utilize the country‘s cultural
centres,.promote social values and increase economic value added by making use of
traditional ways of life, art and culture along with local wisdom to create careers, special
products as well as services which eventually lead to the improvement of local livelihood
and income. Communities nationwide can participate by developing their neighbourhood
and open their houses to welcome tourists. This allows tourists to learn about Thai local
cultures in different parts of the country and experience local activities. Thai homestays
refers to a form of tourism that allows visitors to rent a room from a local family.
217
According to the Hotel Act 2004, the definition of Thailand Homestay Standard is an
accommodation not exceeded more than four rooms with a total capacity of maximum 20
guests, operating as small business which provide additional source of income for the
owner and is registered with the Department of Tourism. This program promote
accommodations and OTOP in local area and hence leading to an improve of livelihood of
the poor.
A host family typically charges 7-10 pounds per tourist per night; this includes
three mealsand up to five tourists to a room on local-style bedding. A detailed analysis of
the food provided, its sources and preparation revealed that ahost family spend an average
30 pounds a month on food supplies( DOT,2013) This monthly cost will cover an average
about 4-5 visitors in a month. The homestay host will typically serve as tourist guide to
guests. Guide and transportfees are not fixed, will usually be negotiated, but are normally
2-3 pounds per tourist pertrip. On the assumed basis of 10 homestay visits in a month, a
homestay provider cananticipate revenue of 70-100 pounds for bedding and meals (depends on the numbers of tourists in each visit) and around 20-30 pounds for guiding.
Interview with the vendor or local market, cultural performance for tourists,
minibuses, owned by villagers during the visit founded that foods and products and
services are noticeably flow very well while having visitors. Moreover the food and
products used for welcome visitors are obtained locally. Thus, although the allocation of
tourists among households was reported only a small number of households that actively
participate in the program, but the distribution of overall livelihood assets is well spread to
everyone in some way.
Despite its growing importance to the domestic tourism market in Thailand, To
promote Homestay as PPT, LT or a tool to reduce povery is still doubted.
Oranratmanee,2009 debate about homestay village being vulnerable to the impacts of rural
tourism. Al though the villager allow the use of a rural home for economic purposes and
for the well-being of the family, there are social and cultural distinctions.
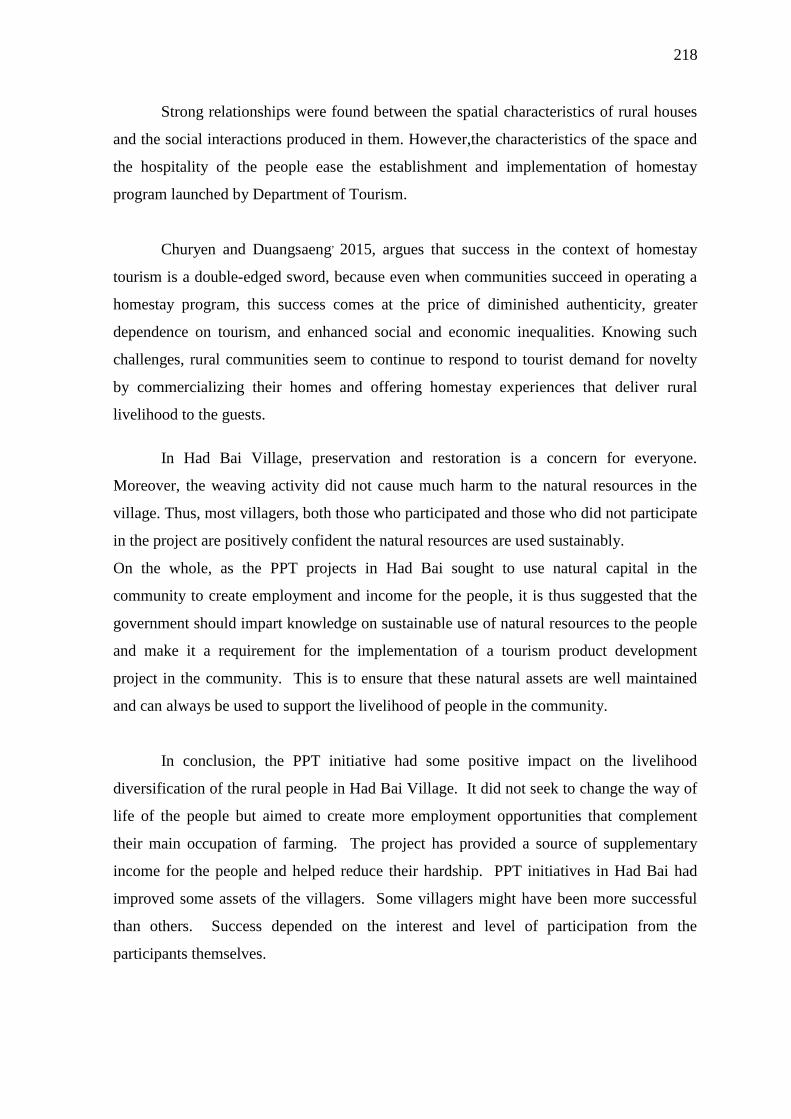
218
Strong relationships were found between the spatial characteristics of rural houses
and the social interactions produced in them. However,the characteristics of the space and
the hospitality of the people ease the establishment and implementation of homestay
program launched by Department of Tourism.
Churyen and Duangsaeng,
2015, argues that success in the context of homestay
tourism is a double-edged sword, because even when communities succeed in operating a
homestay program, this success comes at the price of diminished authenticity, greater
dependence on tourism, and enhanced social and economic inequalities. Knowing such
challenges, rural communities seem to continue to respond to tourist demand for novelty
by commercializing their homes and offering homestay experiences that deliver rural
livelihood to the guests.
In Had Bai Village, preservation and restoration is a concern for everyone.
Moreover, the weaving activity did not cause much harm to the natural resources in the
village. Thus, most villagers, both those who participated and those who did not participate
in the project are positively confident the natural resources are used sustainably.
On the whole, as the PPT projects in Had Bai sought to use natural capital in the
community to create employment and income for the people, it is thus suggested that the
government should impart knowledge on sustainable use of natural resources to the people
and make it a requirement for the implementation of a tourism product development
project in the community. This is to ensure that these natural assets are well maintained
and can always be used to support the livelihood of people in the community.
In conclusion, the PPT initiative had some positive impact on the livelihood
diversification of the rural people in Had Bai Village. It did not seek to change the way of
life of the people but aimed to create more employment opportunities that complement
their main occupation of farming. The project has provided a source of supplementary
income for the people and helped reduce their hardship. PPT initiatives in Had Bai had
improved some assets of the villagers. Some villagers might have been more successful
than others. Success depended on the interest and level of participation from the
participants themselves.
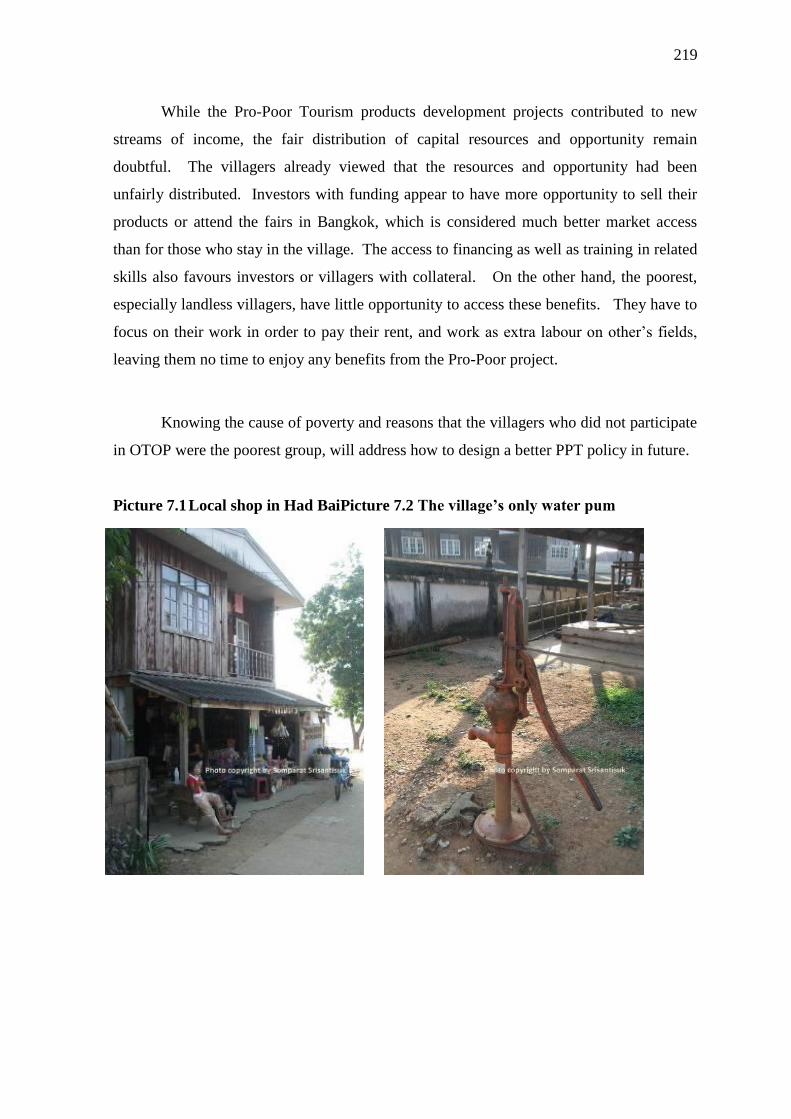
219
While the Pro-Poor Tourism products development projects contributed to new
streams of income, the fair distribution of capital resources and opportunity remain
doubtful. The villagers already viewed that the resources and opportunity had been
unfairly distributed. Investors with funding appear to have more opportunity to sell their
products or attend the fairs in Bangkok, which is considered much better market access
than for those who stay in the village. The access to financing as well as training in related
skills also favours investors or villagers with collateral. On the other hand, the poorest,
especially landless villagers, have little opportunity to access these benefits. They have to
focus on their work in order to pay their rent, and work as extra labour on other‘s fields,
leaving them no time to enjoy any benefits from the Pro-Poor project.
Knowing the cause of poverty and reasons that the villagers who did not participate
in OTOP were the poorest group, will address how to design a better PPT policy in future.
Picture 7.1 Local shop in Had BaiPicture 7.2 The village‘s only water pum
220
CHAPTER 8
PPT Impact on the Vulnerability of the Poor
Vulnerability involves a combination of factors that determine the degree to which
someone‘s life and livelihood is put at risk by a discrete event in nature or in society
(Blaikie, Cannon, Davis and Wisner, 1994). This chapter attempts to answer the third sub-
research question-To what extent has Pro-poor Tourism reduced the vulnerability of
the rural poor?
In analysing if and how pro-poor tourism helps reduce people‘s vulnerability, we
need to examine if the diversification of livelihood brought about by PPT can be sustained
in the long run, how the livelihood diversification impact on their assets, and how PPT
impact on the people‘s ability to cope with change. This chapter will address these
questions by presenting and analysing the results of both the qualitative and quantitative
data collected in this study. The objective of this chapter is to assess the impact of the Pro-
poor Tourism programme on the livelihood in terms of risk and vulnerability reduction, in
other words; to what extent has Pro-poor Tourism reduced vulnerability in Had Bai village.
This chapter is divided into two parts. Part one will present the quantitative level of
vulnerability, it is a discussion and analysis of the data collected using the SLA
assessment. This part presents the levels of vulnerability among the villagers in the three
groups studied. The vulnerability context for each group was determined by comparing the
levels of improvements in the livelihood assets resulting the PPT development
programmes and livelihood strategies affected livelihood outcomes. Both PPT initiatives
were compared by assessing their effectiveness in reducing the vulnerability on each
group.
Part two aims to discuss the drivers of vulnerability. The results, derived mainly
from the qualitative data, support the discussion on the main drivers of vulnerability and
how Pro-poor Tourism initiatives in Had Bai affected the villager‘s vulnerability.
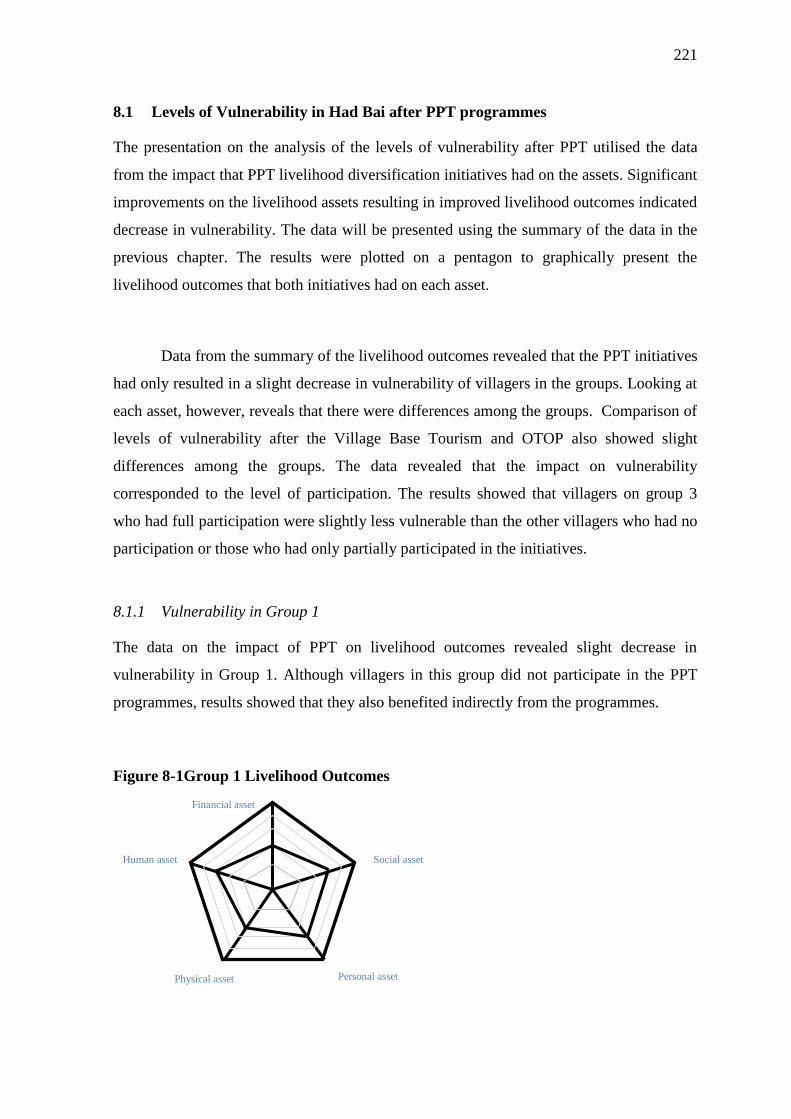
221
8.1 Levels of Vulnerability in Had Bai after PPT programmes
The presentation on the analysis of the levels of vulnerability after PPT utilised the data
from the impact that PPT livelihood diversification initiatives had on the assets. Significant
improvements on the livelihood assets resulting in improved livelihood outcomes indicated
decrease in vulnerability. The data will be presented using the summary of the data in the
previous chapter. The results were plotted on a pentagon to graphically present the
livelihood outcomes that both initiatives had on each asset.
Data from the summary of the livelihood outcomes revealed that the PPT initiatives
had only resulted in a slight decrease in vulnerability of villagers in the groups. Looking at
each asset, however, reveals that there were differences among the groups. Comparison of
levels of vulnerability after the Village Base Tourism and OTOP also showed slight
differences among the groups. The data revealed that the impact on vulnerability
corresponded to the level of participation. The results showed that villagers on group 3
who had full participation were slightly less vulnerable than the other villagers who had no
participation or those who had only partially participated in the initiatives.
8.1.1 Vulnerability in Group 1
The data on the impact of PPT on livelihood outcomes revealed slight decrease in
vulnerability in Group 1. Although villagers in this group did not participate in the PPT
programmes, results showed that they also benefited indirectly from the programmes.
Figure 8-1Group 1 Livelihood Outcomes
Financial asset
Social asset Human asset
Personal asset Physical asset
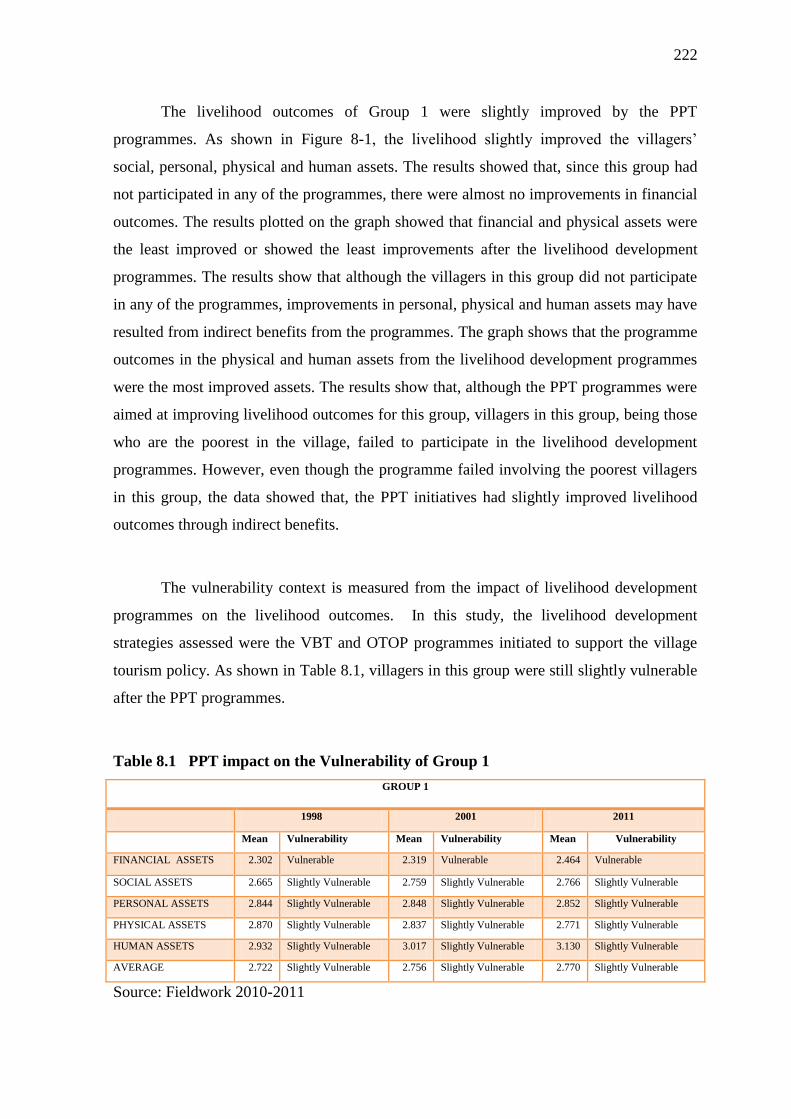
222
The livelihood outcomes of Group 1 were slightly improved by the PPT
programmes. As shown in Figure 8-1, the livelihood slightly improved the villagers‘
social, personal, physical and human assets. The results showed that, since this group had
not participated in any of the programmes, there were almost no improvements in financial
outcomes. The results plotted on the graph showed that financial and physical assets were
the least improved or showed the least improvements after the livelihood development
programmes. The results show that although the villagers in this group did not participate
in any of the programmes, improvements in personal, physical and human assets may have
resulted from indirect benefits from the programmes. The graph shows that the programme
outcomes in the physical and human assets from the livelihood development programmes
were the most improved assets. The results show that, although the PPT programmes were
aimed at improving livelihood outcomes for this group, villagers in this group, being those
who are the poorest in the village, failed to participate in the livelihood development
programmes. However, even though the programme failed involving the poorest villagers
in this group, the data showed that, the PPT initiatives had slightly improved livelihood
outcomes through indirect benefits.
The vulnerability context is measured from the impact of livelihood development
programmes on the livelihood outcomes. In this study, the livelihood development
strategies assessed were the VBT and OTOP programmes initiated to support the village
tourism policy. As shown in Table 8.1, villagers in this group were still slightly vulnerable
after the PPT programmes.
Table 8.1 PPT impact on the Vulnerability of Group 1
GROUP 1
1998 2001 2011
Mean Vulnerability Mean Vulnerability Mean Vulnerability
FINANCIAL ASSETS 2.302 Vulnerable 2.319 Vulnerable 2.464 Vulnerable
SOCIAL ASSETS 2.665 Slightly Vulnerable 2.759 Slightly Vulnerable 2.766 Slightly Vulnerable
PERSONAL ASSETS 2.844 Slightly Vulnerable 2.848 Slightly Vulnerable 2.852 Slightly Vulnerable
PHYSICAL ASSETS 2.870 Slightly Vulnerable 2.837 Slightly Vulnerable 2.771 Slightly Vulnerable
HUMAN ASSETS 2.932 Slightly Vulnerable 3.017 Slightly Vulnerable 3.130 Slightly Vulnerable
AVERAGE 2.722 Slightly Vulnerable 2.756 Slightly Vulnerable 2.770 Slightly Vulnerable
Source: Fieldwork 2010-2011
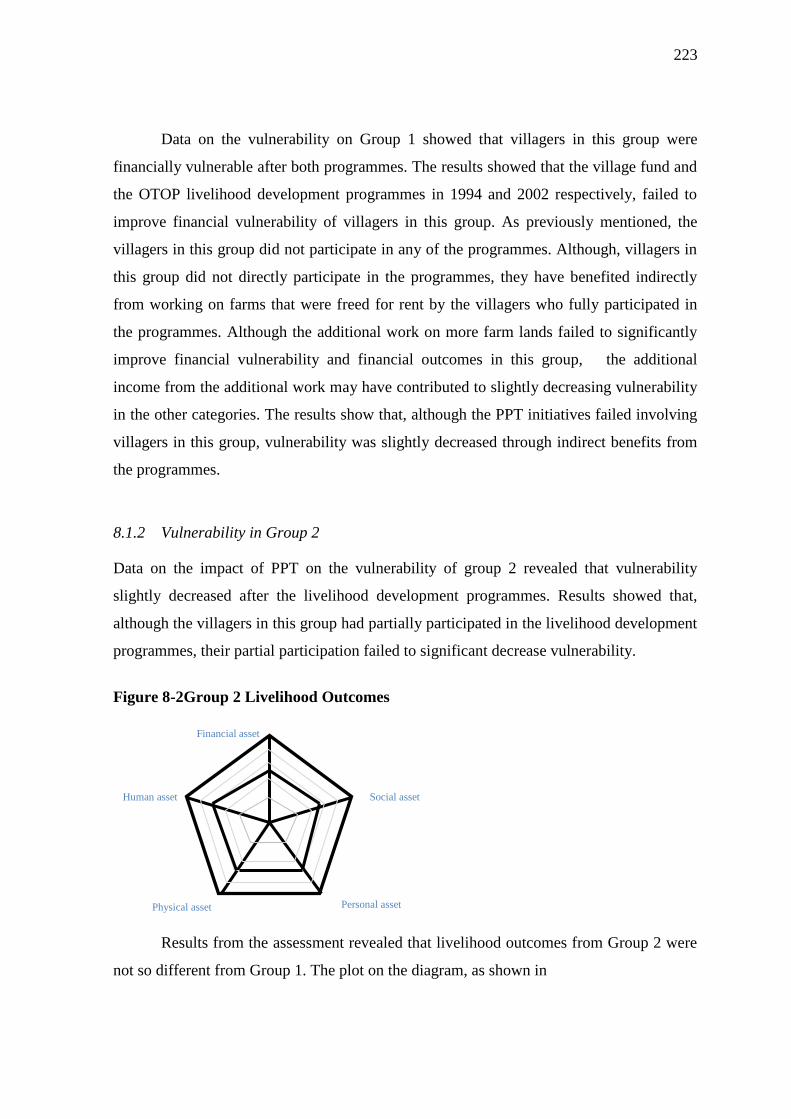
223
Data on the vulnerability on Group 1 showed that villagers in this group were
financially vulnerable after both programmes. The results showed that the village fund and
the OTOP livelihood development programmes in 1994 and 2002 respectively, failed to
improve financial vulnerability of villagers in this group. As previously mentioned, the
villagers in this group did not participate in any of the programmes. Although, villagers in
this group did not directly participate in the programmes, they have benefited indirectly
from working on farms that were freed for rent by the villagers who fully participated in
the programmes. Although the additional work on more farm lands failed to significantly
improve financial vulnerability and financial outcomes in this group, the additional
income from the additional work may have contributed to slightly decreasing vulnerability
in the other categories. The results show that, although the PPT initiatives failed involving
villagers in this group, vulnerability was slightly decreased through indirect benefits from
the programmes.
8.1.2 Vulnerability in Group 2
Data on the impact of PPT on the vulnerability of group 2 revealed that vulnerability
slightly decreased after the livelihood development programmes. Results showed that,
although the villagers in this group had partially participated in the livelihood development
programmes, their partial participation failed to significant decrease vulnerability.
Figure 8-2Group 2 Livelihood Outcomes
Results from the assessment revealed that livelihood outcomes from Group 2 were
not so different from Group 1. The plot on the diagram, as shown in
Financial asset
Social asset Human asset
Personal asset Physical asset
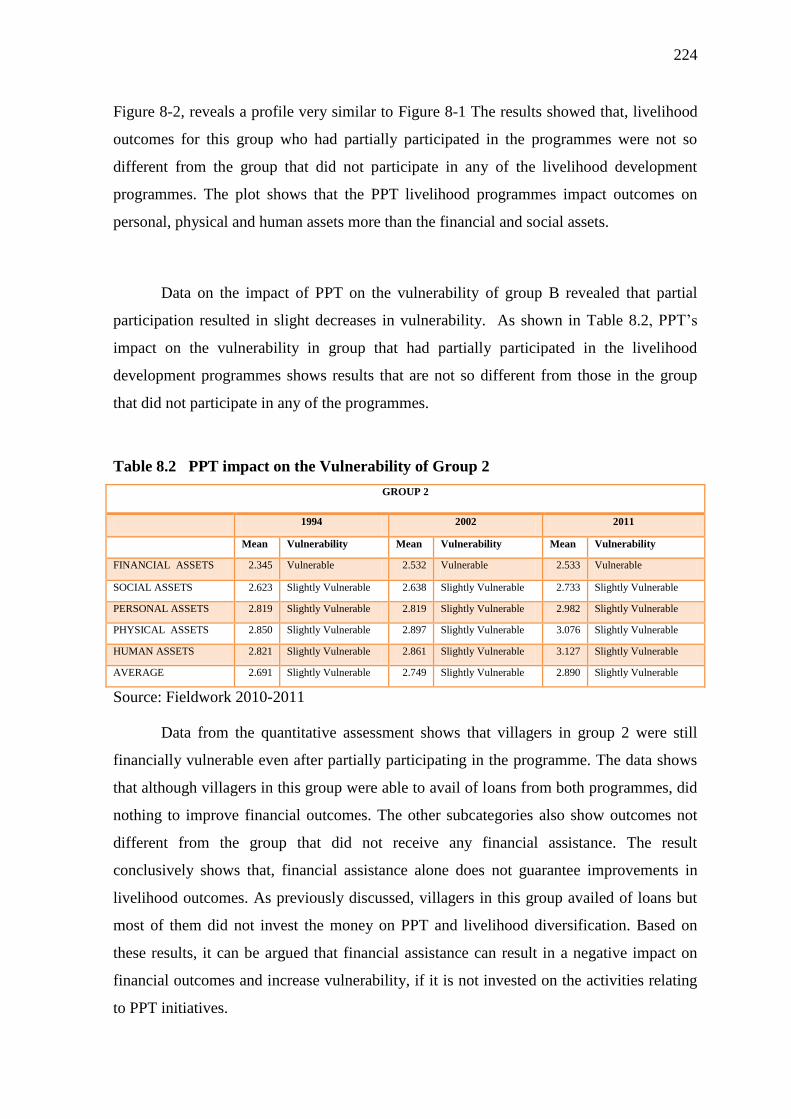
224
Figure 8-2, reveals a profile very similar to Figure 8-1 The results showed that, livelihood
outcomes for this group who had partially participated in the programmes were not so
different from the group that did not participate in any of the livelihood development
programmes. The plot shows that the PPT livelihood programmes impact outcomes on
personal, physical and human assets more than the financial and social assets.
Data on the impact of PPT on the vulnerability of group B revealed that partial
participation resulted in slight decreases in vulnerability. As shown in Table 8.2, PPT‘s
impact on the vulnerability in group that had partially participated in the livelihood
development programmes shows results that are not so different from those in the group
that did not participate in any of the programmes.
Table 8.2 PPT impact on the Vulnerability of Group 2
GROUP 2
1994 2002 2011
Mean Vulnerability Mean Vulnerability Mean Vulnerability
FINANCIAL ASSETS 2.345 Vulnerable 2.532 Vulnerable 2.533 Vulnerable
SOCIAL ASSETS 2.623 Slightly Vulnerable 2.638 Slightly Vulnerable 2.733 Slightly Vulnerable
PERSONAL ASSETS 2.819 Slightly Vulnerable 2.819 Slightly Vulnerable 2.982 Slightly Vulnerable
PHYSICAL ASSETS 2.850 Slightly Vulnerable 2.897 Slightly Vulnerable 3.076 Slightly Vulnerable
HUMAN ASSETS 2.821 Slightly Vulnerable 2.861 Slightly Vulnerable 3.127 Slightly Vulnerable
AVERAGE 2.691 Slightly Vulnerable 2.749 Slightly Vulnerable 2.890 Slightly Vulnerable
Source: Fieldwork 2010-2011
Data from the quantitative assessment shows that villagers in group 2 were still
financially vulnerable even after partially participating in the programme. The data shows
that although villagers in this group were able to avail of loans from both programmes, did
nothing to improve financial outcomes. The other subcategories also show outcomes not
different from the group that did not receive any financial assistance. The result
conclusively shows that, financial assistance alone does not guarantee improvements in
livelihood outcomes. As previously discussed, villagers in this group availed of loans but
most of them did not invest the money on PPT and livelihood diversification. Based on
these results, it can be argued that financial assistance can result in a negative impact on
financial outcomes and increase vulnerability, if it is not invested on the activities relating
to PPT initiatives.
225
8.1.3 Vulnerability in Group 3
Data on the impact of PPT programmes on livelihood outcome and vulnerability in group 3
revealed significantly better results compared to the other groups. Although the overall
interpretation indicate similar results with the other groups even after fully participating in
the PPT programmes, data from the individual categories and comparison of the effects
from each programme reveals a different picture. Comparison of categories shows
significant improvements and significant decreases in vulnerability that was not observed
in the previous groups.
Figure 8-3Livelihood outcomes in Group 3
The profile of livelihood outcomes revealed significant difference in group 3 when
compared to the previous groups. The profile shows more improved outcomes in all
categories. The individual categories show significant improvements when compared to
the other groups. However, there are also similarities, the profile maintains the trend
wherein financial and social categories where scored slightly lower than the personal,
physical and human categories. Financial outcomes was still scored lower than the other
categories, however, it has significantly improved to a higher level compared to the results
from the other groups. Again, similar to the profile from the other groups, the physical and
human categories were the most improved. However, for this group, improvements in the
human assets resulted to the successful elimination of vulnerability in this category. The
profile conclusively contributes to the argument that full participation in PPT initiatives
can develop sustainable livelihoods that will result to reduced vulnerability
Data on the impact of PPT on the vulnerability of Group 3 shows that full
participation in the PPT initiatives significantly reduced vulnerability in some categories.
Financial asset
Social asset Human asset
Personal asset Physical asset
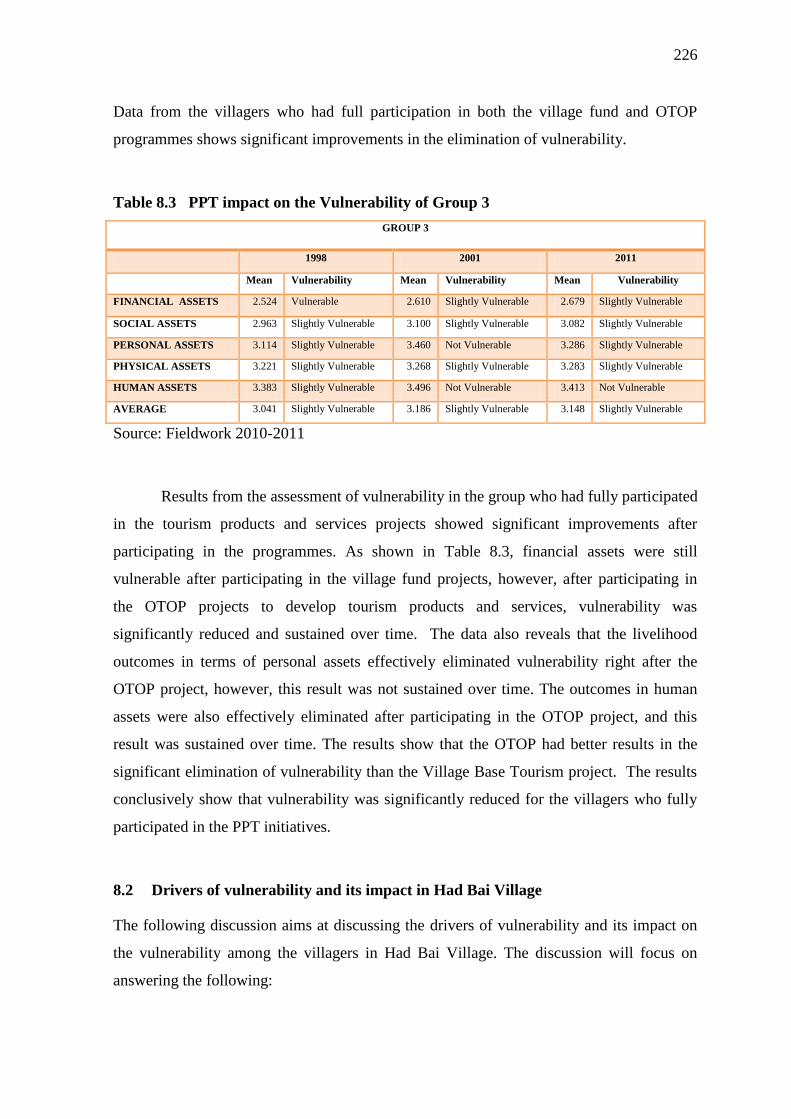
226
Data from the villagers who had full participation in both the village fund and OTOP
programmes shows significant improvements in the elimination of vulnerability.
Table 8.3 PPT impact on the Vulnerability of Group 3
GROUP 3
1998 2001 2011
Mean Vulnerability Mean Vulnerability Mean Vulnerability
FINANCIAL ASSETS 2.524 Vulnerable 2.610 Slightly Vulnerable 2.679 Slightly Vulnerable
SOCIAL ASSETS 2.963 Slightly Vulnerable 3.100 Slightly Vulnerable 3.082 Slightly Vulnerable
PERSONAL ASSETS 3.114 Slightly Vulnerable 3.460 Not Vulnerable 3.286 Slightly Vulnerable
PHYSICAL ASSETS 3.221 Slightly Vulnerable 3.268 Slightly Vulnerable 3.283 Slightly Vulnerable
HUMAN ASSETS 3.383 Slightly Vulnerable 3.496 Not Vulnerable 3.413 Not Vulnerable
AVERAGE 3.041 Slightly Vulnerable 3.186 Slightly Vulnerable 3.148 Slightly Vulnerable
Source: Fieldwork 2010-2011
Results from the assessment of vulnerability in the group who had fully participated
in the tourism products and services projects showed significant improvements after
participating in the programmes. As shown in Table 8.3, financial assets were still
vulnerable after participating in the village fund projects, however, after participating in
the OTOP projects to develop tourism products and services, vulnerability was
significantly reduced and sustained over time. The data also reveals that the livelihood
outcomes in terms of personal assets effectively eliminated vulnerability right after the
OTOP project, however, this result was not sustained over time. The outcomes in human
assets were also effectively eliminated after participating in the OTOP project, and this
result was sustained over time. The results show that the OTOP had better results in the
significant elimination of vulnerability than the Village Base Tourism project. The results
conclusively show that vulnerability was significantly reduced for the villagers who fully
participated in the PPT initiatives.
8.2 Drivers of vulnerability and its impact in Had Bai Village
The following discussion aims at discussing the drivers of vulnerability and its impact on
the vulnerability among the villagers in Had Bai Village. The discussion will focus on
answering the following:
227
1. The interview respondents‘ understanding on the context of vulnerability as well as
risks that they are currently exposed to;
2. Impact of the programmeme on their life and how it reduced vulnerability;
3. Whether the project change the ability to cope with shocks or capitalise on positive
trend;
4. The contribution of the project to the people‘s ability to cope with temporary
change or adapt to a permanent change;
5. Whether tourism contributed to increased litter/pollution and crime in the
community;
6. The impact on people‘s current production choices, costs, and risk as well as the
comparison to those unassociated with the project.
Again, the answers to the afore-mentioned questions were derived from the
information available during all three interviews and assessment with stakeholders and
related entities. The results are as follow:
8.3 How villagers in Had Bai interpret vulnerability
The villagers interpret vulnerability in many aspects of which most of them describe it in
terms of wealth, that is, the state of being poor and insolvent. Many of them think of failure
in agricultural investment or when nothing fills up their stomach. Only a few of them
suggest that it should be considered in terms of natural disaster, such as flooding or failure
in farming.
The answer for the second question tends to be overestimated. Most of the
responses suggest that people advocate the initiation of Pro-poor tourism and agree that it
can reduce the vulnerability of the poor despite the fact that they don‘t fully recognise or
really understand the project. This is simply because they think everything new is good.
228
The answer for the third question reflects the answer of the first two questions.
Most of the people interpret vulnerability in terms of money and do not see its connection
with other types of exposures. Therefore they do not think the project could enhance their
ability to cope with natural disaster.
The following table shows the overall opinion of villagers towards PPT projects
regarding vulnerability.In the assessment, the scores range from 1 to 5 using Likert scale
with the following descriptions:
1 – Strongly Disagree;
2 – Disagree;
3 – Not Sure;
4 – Agree;
5 – Strongly Agree
Table 8.4 below shows that villagers think that OTOP reduces hardship in their life
more than the VBT and also increases ability to deal with and adapt to risk and hardship.
However, VBT has made relationship between the village and the outside world change in
a better way than the OTOP project. People who take part in the VBT also have less risk in
life compared to those who take part in the OTOP.
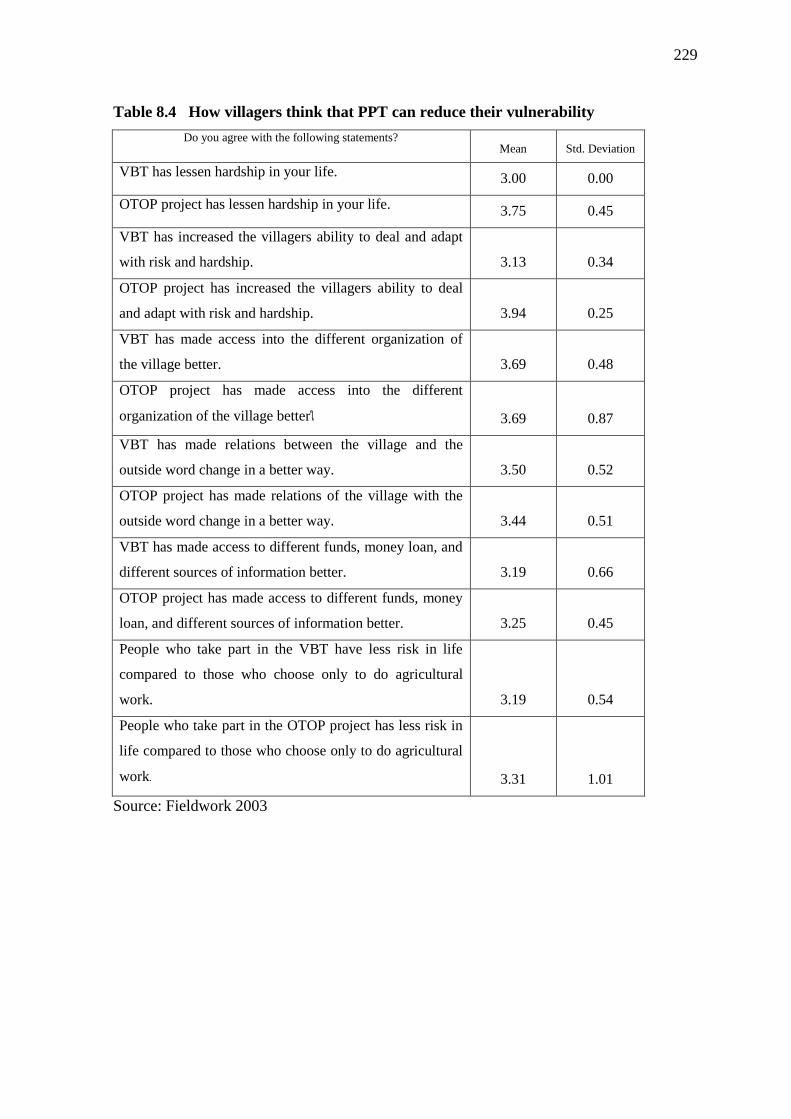
229
Table 8.4 How villagers think that PPT can reduce their vulnerability
Do you agree with the following statements? Mean Std. Deviation
VBT has lessen hardship in your life. 3.00 0.00
OTOP project has lessen hardship in your life. 3.75 0.45
VBT has increased the villagers ability to deal and adapt
with risk and hardship. 3.13 0.34
OTOP project has increased the villagers ability to deal
and adapt with risk and hardship. 3.94 0.25
VBT has made access into the different organization of
the village better. 3.69 0.48
OTOP project has made access into the different
organization of the village betterใ 3.69 0.87
VBT has made relations between the village and the
outside word change in a better way. 3.50 0.52
OTOP project has made relations of the village with the
outside word change in a better way. 3.44 0.51
VBT has made access to different funds, money loan, and
different sources of information better. 3.19 0.66
OTOP project has made access to different funds, money
loan, and different sources of information better. 3.25 0.45
People who take part in the VBT have less risk in life
compared to those who choose only to do agricultural
work. 3.19 0.54
People who take part in the OTOP project has less risk in
life compared to those who choose only to do agricultural
work. 3.31 1.01
Source: Fieldwork 2003
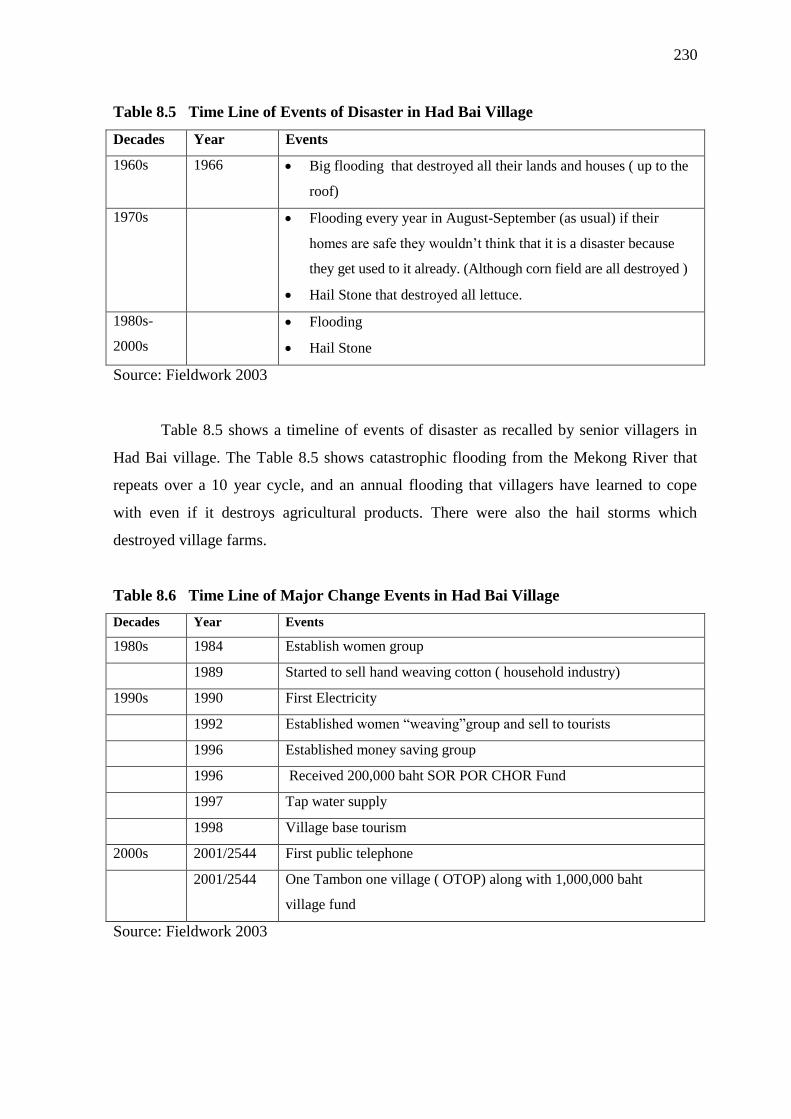
230
Table 8.5 Time Line of Events of Disaster in Had Bai Village
Decades Year Events
1960s 1966 Big flooding that destroyed all their lands and houses ( up to the
roof)
1970s Flooding every year in August-September (as usual) if their
homes are safe they wouldn‘t think that it is a disaster because
they get used to it already. (Although corn field are all destroyed )
Hail Stone that destroyed all lettuce.
1980s-
2000s
Flooding
Hail Stone
Source: Fieldwork 2003
Table 8.5 shows a timeline of events of disaster as recalled by senior villagers in
Had Bai village. The Table 8.5 shows catastrophic flooding from the Mekong River that
repeats over a 10 year cycle, and an annual flooding that villagers have learned to cope
with even if it destroys agricultural products. There were also the hail storms which
destroyed village farms.
Table 8.6 Time Line of Major Change Events in Had Bai Village
Decades Year Events
1980s 1984 Establish women group
1989 Started to sell hand weaving cotton ( household industry)
1990s 1990 First Electricity
1992 Established women ―weaving‖group and sell to tourists
1996 Established money saving group
1996 Received 200,000 baht SOR POR CHOR Fund
1997 Tap water supply
1998 Village base tourism
2000s 2001/2544 First public telephone
2001/2544 One Tambon one village ( OTOP) along with 1,000,000 baht
village fund
Source: Fieldwork 2003
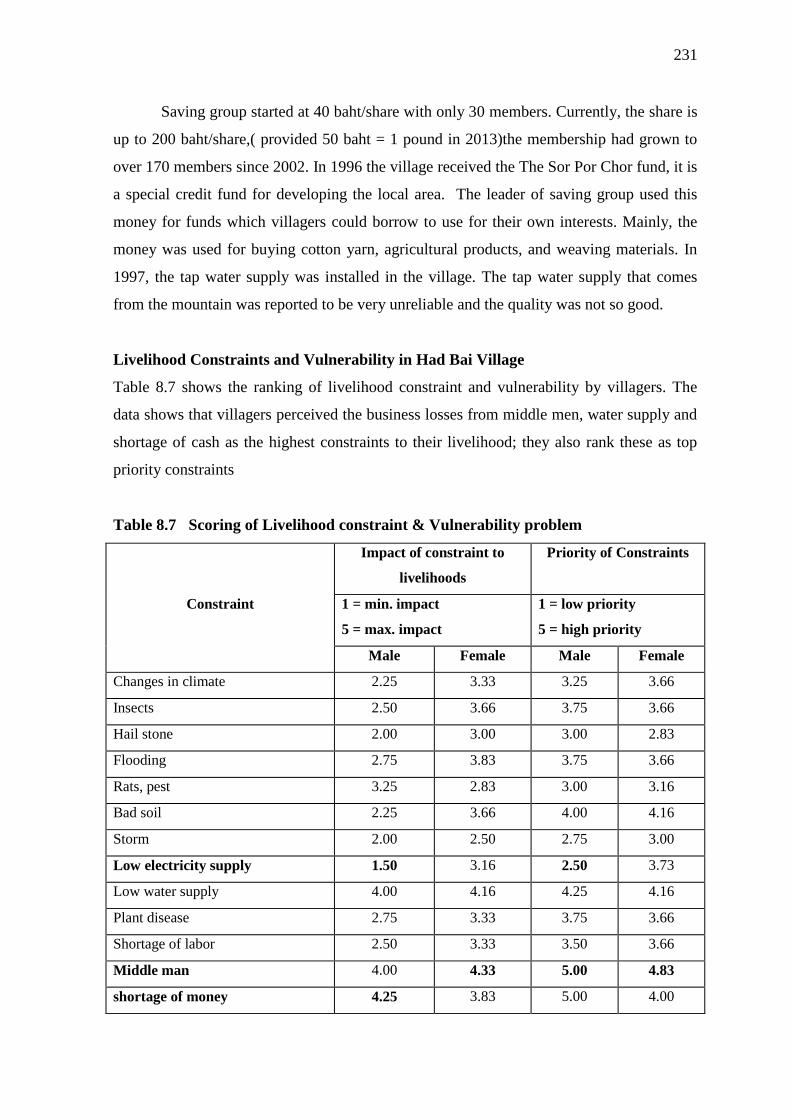
231
Saving group started at 40 baht/share with only 30 members. Currently, the share is
up to 200 baht/share,( provided 50 baht = 1 pound in 2013)the membership had grown to
over 170 members since 2002. In 1996 the village received the The Sor Por Chor fund, it is
a special credit fund for developing the local area. The leader of saving group used this
money for funds which villagers could borrow to use for their own interests. Mainly, the
money was used for buying cotton yarn, agricultural products, and weaving materials. In
1997, the tap water supply was installed in the village. The tap water supply that comes
from the mountain was reported to be very unreliable and the quality was not so good.
Livelihood Constraints and Vulnerability in Had Bai Village
Table 8.7 shows the ranking of livelihood constraint and vulnerability by villagers. The
data shows that villagers perceived the business losses from middle men, water supply and
shortage of cash as the highest constraints to their livelihood; they also rank these as top
priority constraints
Table 8.7 Scoring of Livelihood constraint & Vulnerability problem
Constraint
Impact of constraint to
livelihoods
Priority of Constraints
1 = min. impact
5 = max. impact
1 = low priority
5 = high priority
Male Female Male Female
Changes in climate 2.25 3.33 3.25 3.66
Insects 2.50 3.66 3.75 3.66
Hail stone 2.00 3.00 3.00 2.83
Flooding 2.75 3.83 3.75 3.66
Rats, pest 3.25 2.83 3.00 3.16
Bad soil 2.25 3.66 4.00 4.16
Storm 2.00 2.50 2.75 3.00
Low electricity supply 1.50 3.16 2.50 3.73
Low water supply 4.00 4.16 4.25 4.16
Plant disease 2.75 3.33 3.75 3.66
Shortage of labor 2.50 3.33 3.50 3.66
Middle man 4.00 4.33 5.00 4.83
shortage of money 4.25 3.83 5.00 4.00
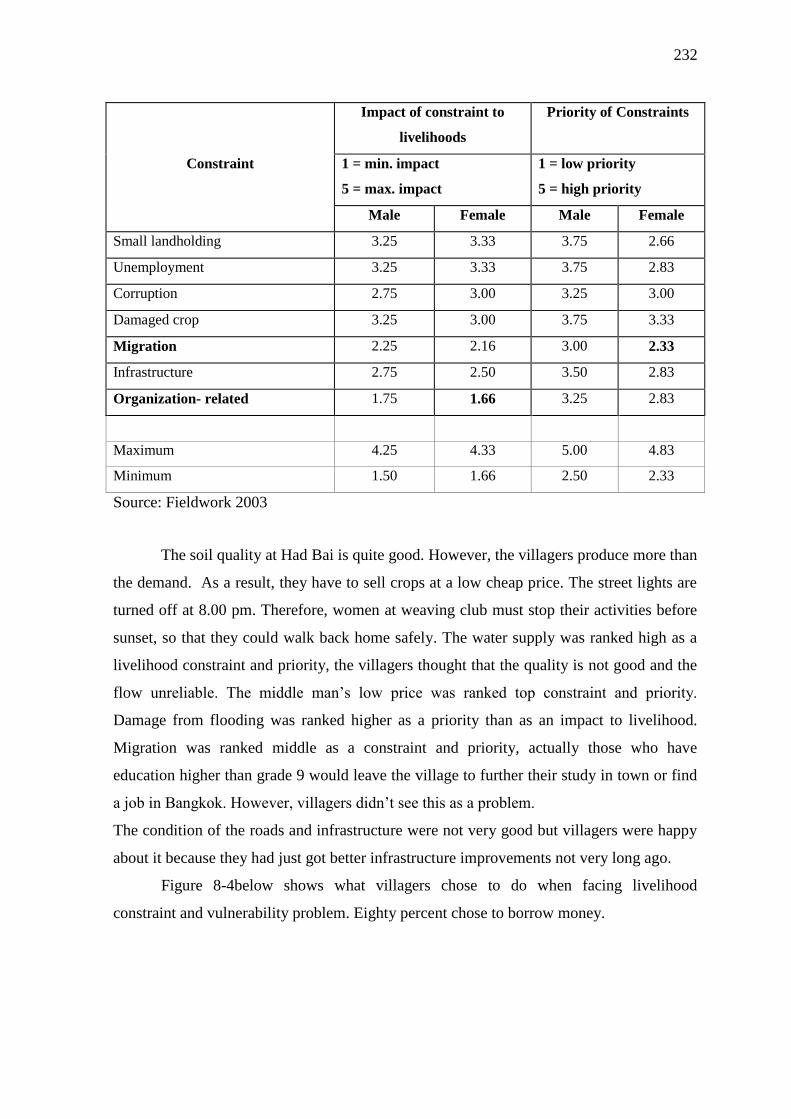
232
Constraint
Impact of constraint to
livelihoods
Priority of Constraints
1 = min. impact
5 = max. impact
1 = low priority
5 = high priority
Male Female Male Female
Small landholding 3.25 3.33 3.75 2.66
Unemployment 3.25 3.33 3.75 2.83
Corruption 2.75 3.00 3.25 3.00
Damaged crop 3.25 3.00 3.75 3.33
Migration 2.25 2.16 3.00 2.33
Infrastructure 2.75 2.50 3.50 2.83
Organization- related 1.75 1.66 3.25 2.83
Maximum 4.25 4.33 5.00 4.83
Minimum 1.50 1.66 2.50 2.33
Source: Fieldwork 2003
The soil quality at Had Bai is quite good. However, the villagers produce more than
the demand. As a result, they have to sell crops at a low cheap price. The street lights are
turned off at 8.00 pm. Therefore, women at weaving club must stop their activities before
sunset, so that they could walk back home safely. The water supply was ranked high as a
livelihood constraint and priority, the villagers thought that the quality is not good and the
flow unreliable. The middle man‘s low price was ranked top constraint and priority.
Damage from flooding was ranked higher as a priority than as an impact to livelihood.
Migration was ranked middle as a constraint and priority, actually those who have
education higher than grade 9 would leave the village to further their study in town or find
a job in Bangkok. However, villagers didn‘t see this as a problem.
The condition of the roads and infrastructure were not very good but villagers were happy
about it because they had just got better infrastructure improvements not very long ago.
Figure 8-4below shows what villagers chose to do when facing livelihood
constraint and vulnerability problem. Eighty percent chose to borrow money.
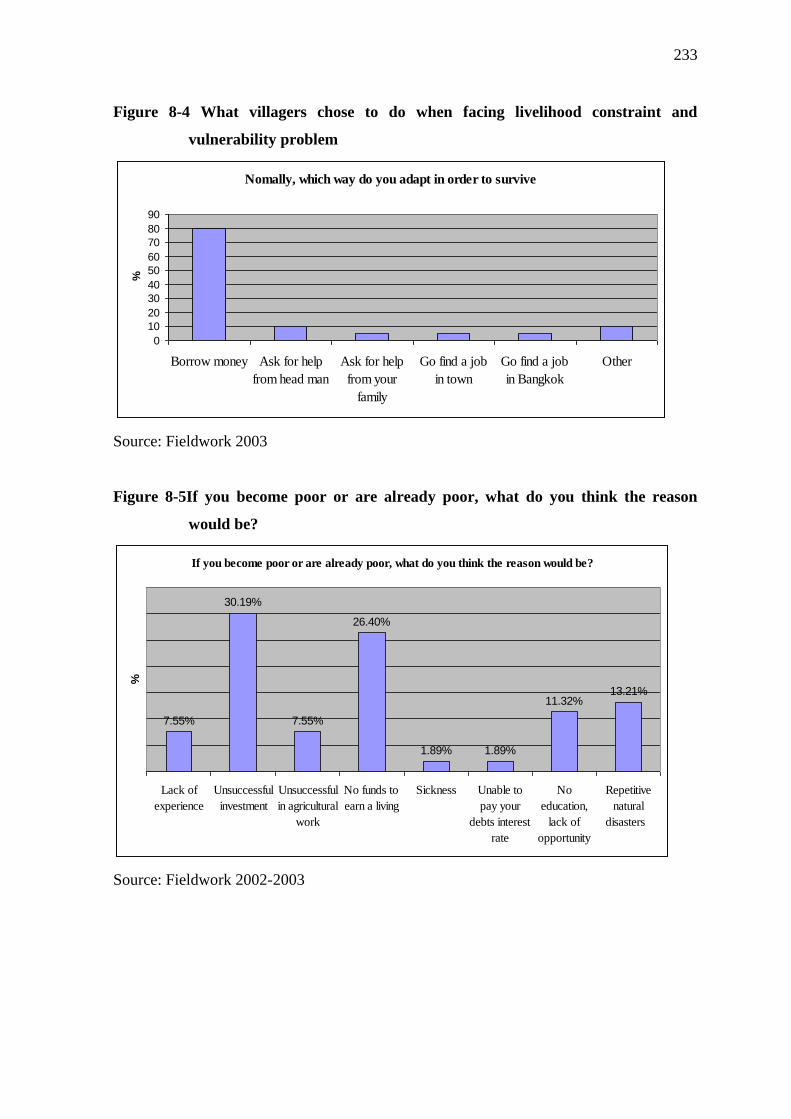
233
Figure 8-4 What villagers chose to do when facing livelihood constraint and
vulnerability problem
Source: Fieldwork 2003
Figure 8-5If you become poor or are already poor, what do you think the reason
would be?
Source: Fieldwork 2002-2003
Nomally, which way do you adapt in order to survive
0
10
20
30
40
50
60
70
80
90
Borrow money Ask for help
from head man
Ask for help
from your
family
Go find a job
in town
Go find a job
in Bangkok
Other
%
If you become poor or are already poor, what do you think the reason would be?
7.55%
30.19%
7.55%
26.40%
1.89% 1.89%
11.32%13.21%
Lack of
experience
Unsuccessful
investment
Unsuccessful
in agricultural
work
No funds to
earn a living
Sickness Unable to
pay your
debts interest
rate
No
education,
lack of
opportunity
Repetitive
natural
disasters
%
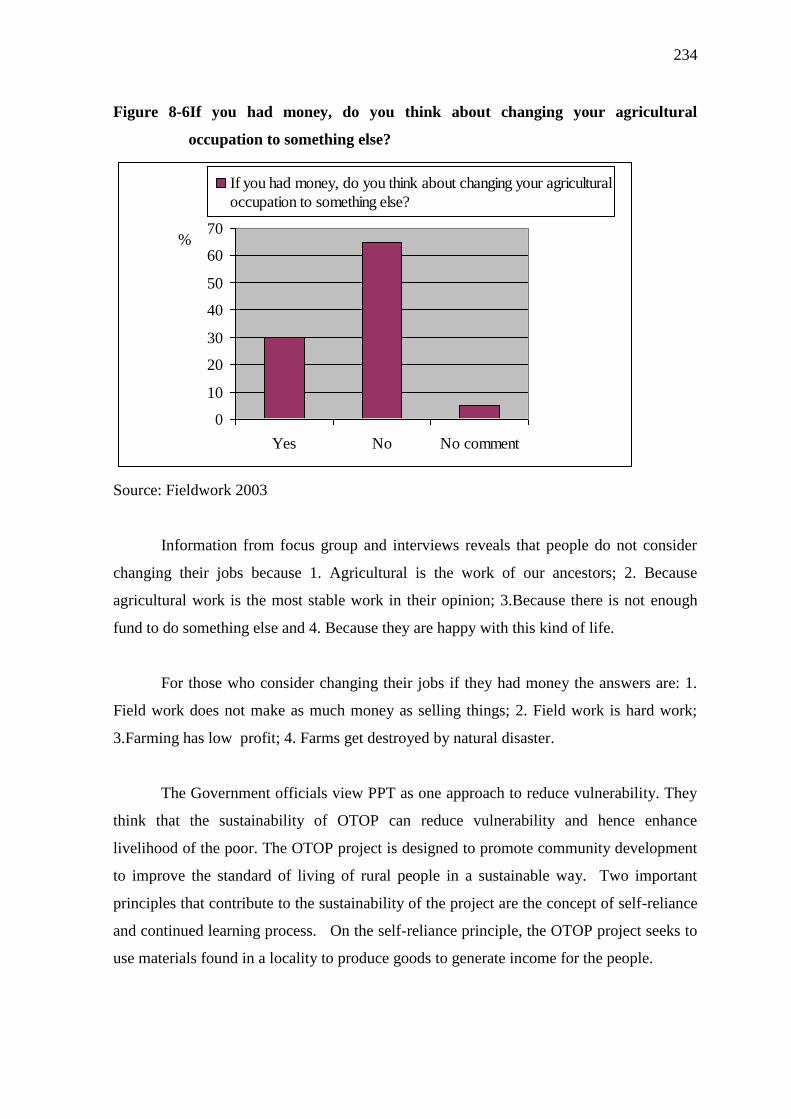
234
Figure 8-6If you had money, do you think about changing your agricultural
occupation to something else?
Source: Fieldwork 2003
Information from focus group and interviews reveals that people do not consider
changing their jobs because 1. Agricultural is the work of our ancestors; 2. Because
agricultural work is the most stable work in their opinion; 3.Because there is not enough
fund to do something else and 4. Because they are happy with this kind of life.
For those who consider changing their jobs if they had money the answers are: 1.
Field work does not make as much money as selling things; 2. Field work is hard work;
3.Farming has low profit; 4. Farms get destroyed by natural disaster.
The Government officials view PPT as one approach to reduce vulnerability. They
think that the sustainability of OTOP can reduce vulnerability and hence enhance
livelihood of the poor. The OTOP project is designed to promote community development
to improve the standard of living of rural people in a sustainable way. Two important
principles that contribute to the sustainability of the project are the concept of self-reliance
and continued learning process. On the self-reliance principle, the OTOP project seeks to
use materials found in a locality to produce goods to generate income for the people.
%
0
10
20
30
40
50
60
70
Yes No No comment
If you had money, do you think about changing your agricultural
occupation to something else?
235
It also aims to use traditional knowledge and know-how in the production process.
However, maximizing local potentials alone is not enough to ensure a sustained
development in the age of globalization. People have to learn to develop their versatility to
cope with challenges. Here, the government will assist them by stimulating a continued
learning process to enhance their knowledge and skills in adapting to constant changes.
When implementing the OTOP project, government departments concerned tried to
translate the two principles on sustainability mentioned above into practice. First of all,
they had to assess if a particular community had the potential and readiness to develop
under the OTOP project. This was explained by officer from Services Promotion Division,
the Tourism Authority of Thailand (TAT), as follows:
“From the point of view of TAT, a village appropriate for OTOP tourism is not merely
a village that offers OTOP products. But that village must have good potential (for
development in tourism) in terms of its linkage with other communities and tourist
attractions. A stand alone village without convenient access cannot be linked to other
tourist destinations….” (Anonymous 2005h)
As for continued learning process, it is more difficult to say to how successful the
government has been in equipping the people with the knowledge to cope with changes.
According to the interviews given by some government officials, villagers had learned to
solve some problems arising from the implementation of the project. For example, some
communities had learned to conserve natural resources used in the manufacture of OTOP
products to ensure that they would always have sufficient supply of raw materials. Others
became aware of the need to address the negative impacts that the production of some
OTOP goods had on their communities‘ environment. Project participants had also
acquired knowledge and management skills for small businesses ranging from production,
packaging and marketing to financial matters. Such knowledge and skills would be useful
for them if they were to undertake other similar economic activities in the future. In
addition, villagers had gained experiences in participating in community activities and
learned, for example, how they could share responsibilities and how to share benefits
derived from OTOP fairlyamong themselves.
236
8.3.1 Coping with Change
However, the knowledge and skills villagers had learned might not be sufficient to deal
with the problems or cope with changes. The areas of concern which were often cited by
government officials in their interviews were the development of OTOP products, access
to markets, the financial management of the project, as well as the attitude and capacity of
the villagers themselves. On the development of OTOP products, the government had a
clear policy to encourage project participants to improve the quality of their products both
in terms of design and value creation by setting 5-level standard for OTOP goods. Officer
of the Department of Agricultural Extension, Ministry of Agricultural and Cooperatives
said that
“the sustainability of the OTOP project depended on the quality of the products. But
the products that were of export quality, or those obtaining standard levels 4-5, were
usually made by producers that were classified as SMEs, not the community-based
groups. The SME producers had been entrepreneurs before; farming was not their
main occupation. They constituted the group which already had some potential to
develop further. For most “genuine” OTOP producers, their products still had not
reached the high standards (levels 4-5). They would produce goods with the same
design and packaging over the years without any change. This showed that OTOP
producers lagged much behind on adding value to their products. This group of OTOP
producers still needed support and technical assistance from the government to
improve the quality of their products.” The same could be said for marketing. Many
OTOP villagers were not adept with promotion activities. Relevant government
departments had to help project participants identify potential customers or market
their products” (Anonymous 2005o)
Most OTOP participants relied on farming for their living and were not familiar
with business undertakings. They had a lot to learn about financial disciplines and
management. Some officials thought that although the OTOP project had been
implemented for some time, villagers were not strong enough to carry out the projects by
themselves.
237
“If left alone without continued assistance from the government, OTOP producers
would be in a very vulnerable position amidst high competition and volatile
economic environment caused by, for example, fluctuation in oil and Gasoline
prices”.
One official even suggested that there should be a ―financial advisor‖ for project
participants.
The success of PPT also depended on the people‘s outlook in life and their interest
and ability to learn new things. For some villagers, they preferred a simple life and would
work as hard as they wanted. One official told that
“Once I visited Chanthaburi Province which was famous for its locally-made mats
called “Krajood” mats. I met a female mat weaver and asked what she would do if she
received large order for mats that exceeded her capacity to deliver. She said simply
that she would only weave as many mats as she could.” (Anonymous 2005a)
Even though the OTOP project has provided for a supplementary source of income
and helped improve the living condition of the rural poor, it is not yet certain how much it
can contribute to a sustained diversification of livelihood to the people. As mentioned
above, many grassroots OTOP producers still have to rely on the government for guidance
and assistance in many aspects. Moreover, many officials who were interviewed believed
that a change in policy could have a negative impact on its effectiveness. Given all of the
reasons mentioned above, it might be said that at present, the OTOP project might help
reduce the vulnerability of the rural poor only to some extent.
8.3.2 Enhancement of the Sense of Security in Life
Earlier in this chapter, some aspects of the livelihood development projects have been
examined to see how they contribute to or affect the sustainability of the project which
provide for diversification of livelihood of the people. If the project can provide extra
income for the people in a more sustained way, people would become less vulnerable to
changes.
238
In this section, the question of vulnerability will be examined from a different aspect, i.e.
how the people felt about their life after having participated in the OTOP project as
perceived by some government officials involved in the execution of OTOP project. If the
people feel their lives are more secure, it might be said that the implementation of the
project has helped reduced the risk and vulnerability in life caused by a sudden or more
subtle change.
It was found out that most government officials who were interviewed thought that
the OTOP project had created in project participants a sense of stability and security in life.
In their views, the fact that the OTOP project provided additional source of income added
to the sense of security in the people, most of whom relied almost solely on farming for
their living. The OTOP project had also offered more employment opportunities for the
people, thus reducing the need for the rural poor to migrate to big cities to seek for jobs.
The fact that villagers could work in their communities allowed them to stay with their
families and helped forge closer relationship among family members.
The knowledge and skills villagers had learned from participating in the OTOP
project also contributed to their sense of security. Vocational training provided by the
government and opened up their opportunities for alternative employment other than
farming. The management skills they had acquired from undertaking business activities
under OTOP project and the experiences gained from working with various stakeholders,
ranging from other project participants, government officials, visitors from outside their
communities, and other villagers who did not participate in OTOP project, should equip
them with necessary tools to cope with changes more effectively.
However, several interviewees expressed concern that some villagers tended to
overspend the extra money earned from OTOP activities and risked getting indebted.
Participating in the OTOP project had exposed villagers to the outside world and the
influence of western culture with emphasis on materialistic values. Some project
participants could cope with such changes and adapt themselves quite well. But other
villagers might get lost in the wave of materialistic culture. It was thus important that the
government took steps to ensure that the people knew how to spend the money wisely and
encourage more savings among villagers.
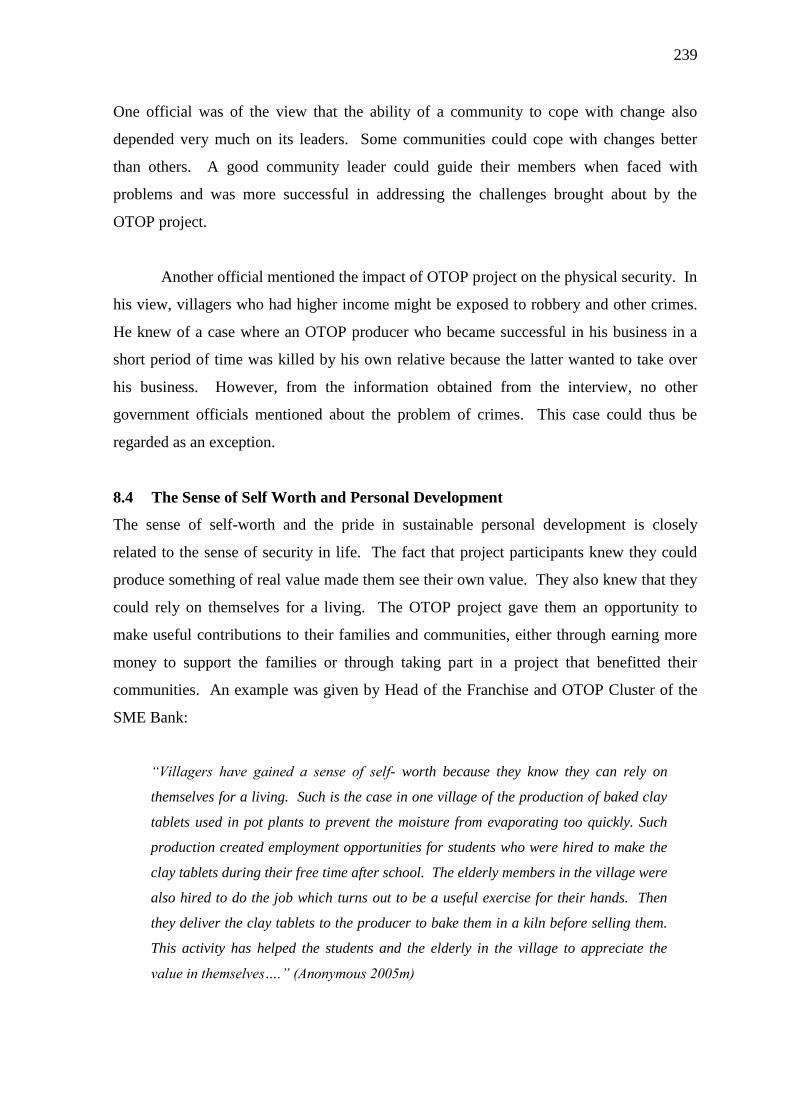
239
One official was of the view that the ability of a community to cope with change also
depended very much on its leaders. Some communities could cope with changes better
than others. A good community leader could guide their members when faced with
problems and was more successful in addressing the challenges brought about by the
OTOP project.
Another official mentioned the impact of OTOP project on the physical security. In
his view, villagers who had higher income might be exposed to robbery and other crimes.
He knew of a case where an OTOP producer who became successful in his business in a
short period of time was killed by his own relative because the latter wanted to take over
his business. However, from the information obtained from the interview, no other
government officials mentioned about the problem of crimes. This case could thus be
regarded as an exception.
8.4 The Sense of Self Worth and Personal Development
The sense of self-worth and the pride in sustainable personal development is closely
related to the sense of security in life. The fact that project participants knew they could
produce something of real value made them see their own value. They also knew that they
could rely on themselves for a living. The OTOP project gave them an opportunity to
make useful contributions to their families and communities, either through earning more
money to support the families or through taking part in a project that benefitted their
communities. An example was given by Head of the Franchise and OTOP Cluster of the
SME Bank:
“Villagers have gained a sense of self- worth because they know they can rely on
themselves for a living. Such is the case in one village of the production of baked clay
tablets used in pot plants to prevent the moisture from evaporating too quickly. Such
production created employment opportunities for students who were hired to make the
clay tablets during their free time after school. The elderly members in the village were
also hired to do the job which turns out to be a useful exercise for their hands. Then
they deliver the clay tablets to the producer to bake them in a kiln before selling them.
This activity has helped the students and the elderly in the village to appreciate the
value in themselves….” (Anonymous 2005m)
240
The pride in sustainable personal development occurs when a person is aware that
he or she has the necessary means and ability to advance his or her personal goal in the
long run.
About half of the officials who were interviewed thought that the OTOP project
had helped people develop themselves in a sustainable way. One interviewee said that the
OTOP project had created a learning process whereby its participants learned about
production, marketing and management techniques. However, a couple of respondents
said the success of OTOP project in promoting personal advancement depended on the
project participants themselves. The people needed to build on the knowledge and skills
they had learned through various training courses organised by the government. It was the
process of learning that would enable the people to continue to learn independently even
after the project was terminated.
But there were some project participants who did not try hard enough to learn by
themselves and waited to be helped by the government. In that case, the OTOP project
was not successful in promoting people‘s advancement in a sustainable way. From the
information obtained from the interview, there seemed to be an emphasis on knowledge as
a major factor that determined whether the project participants would be successful in
making a sustainable personal advancement, which would add to the increase in social
capital of the project participants.
“…Some project participants have learned to help themselves in finding access to
markets for their products, improving the packaging and adapting marketing
techniques without merely waiting for help from the government. But to make OTOP
project more sustainable, the government had to give them consistent support in
product development and financial assistance.…”(Anonymous 2005n)
8.5 Conclusion
It might be said that the PPT projects have helped reduced risk and vulnerability of the
rural poor to a certain extent. The concept of the project itself is designed to create
sustainable alternative livelihood for the people in many ways. It has the purpose of
creating employment opportunities without disturbing the way of life of the people.
241
One of its main principles is to make use of raw materials available in the locality,
traditional knowledge and know-how in the production of goods. This way, the people can
earn more money by relying largely on their own resources.
The government merely plays the role of an advisor and supporter, providing villagers
with the funds, knowledge and skills they are lacking. It is the people themselves who
have to execute the project and decide how they want it to be carried out. By undertaking
the project, the people have gained first-hand knowledge and experiences that are valuable
for livelihood diversification.
However, there were several factors that can affect the sustainability of the
livelihood, thus decreasing the impact that the project may have on reducing vulnerability
of the people.
First of all, the success of the livelihood development through PPT depends very
much on the interest and the ability of the people to learn new things. Villagers who are
hard- working and put in a lot of time and efforts in the project have a better chance of
success. Project participants having some knowledge on production are in a position to
benefit more from the project. Those who have learned to apply and adapt are more likely
to be less vulnerable as they can cope with changes better.
Despite the government‘s intention to make diversification of livelihood
sustainable, many villagers still need support of the government, especially in the areas of
funding, financial management, product development and marketing. Some of these
involve specific skills that will take some time to learn before the project participants can
use these skills effectively. Some products are not destined for local consumption but
aimed at wider domestic and international markets. The dependency on larger markets
makes project participants more or less part of the globalised world. This can put them in a
vulnerable position to some degree, depending on how much they rely on those markets to
sell their products. Project participants must also have financial disciplines to have a
sustainable business. They need to learn the value of savings rather than overspend the
money on non-productive things.
242
All the above-mentioned factors can affect the sustainability of the project. How
much the project helps reduce the people‘s vulnerability depends on the interaction of
these factors which can vary from case to case.
243
CHAPTER 9
Conclusions and Recommendations
The previous chapter presented the results of this study; in this chapter, the key findings
are analysed to determine whether, and to what extent, the PPT programmes were
successful in improving the livelihoods of the poor. After the findings have been presented,
a theoretical reflection discussing the poverty situation revealed in this study will follow.
This chapter will also discuss the strengths and limitations of the conceptual framework
used, and the challenges and implications for PPT policies. Finally, as recommendations
for future research a new PPT model will be proposed, to form the basis for the
development of a new PPT policy incorporating knowledge gleaned from the study.
The discussion in this chapter is organised according to the following topics:
1. Key findings of the work and answer to the main research question: To what
extent has PPT improved the livelihood outcomes of the poor?
2. Theoretical reflections: an understanding of the new poverty situation revealed in
this study, in which it is apparent that household debt can contribute to the problem
of poverty and may hide the true nature of the well-being of the poor.
3. Analytical and methodological lessons: the strengths and limitations of the
conceptual framework.
4. Challenges and implications for PPT policy to alleviate poverty.
5. Recommendations for future research.
9.1 Key Findings
The results from the study conducted shows that there is an inequitable distribution of the
benefits coming from the PPT projects throughout the village. As mentioned in Chapter 5,
the villagers may be divided into three groups according to their level of involvement in
the PPT programmes:
1. Villagers who did not know about OTOP (Group 1)
2. Villagers who knew about OTOP but chose not to participate fully (Group 2)
3. Villagers who participated fully in the OTOP project (Group 3)
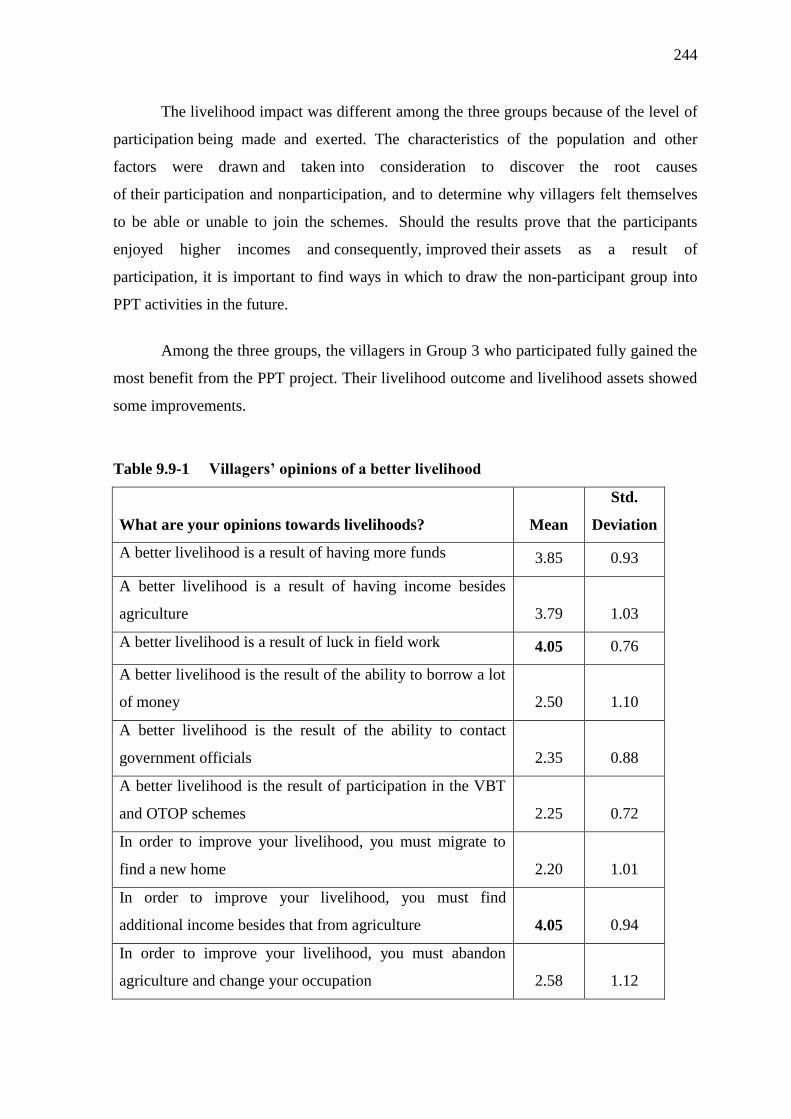
244
The livelihood impact was different among the three groups because of the level of
participation being made and exerted. The characteristics of the population and other
factors were drawn and taken into consideration to discover the root causes
of their participation and nonparticipation, and to determine why villagers felt themselves
to be able or unable to join the schemes. Should the results prove that the participants
enjoyed higher incomes and consequently, improved their assets as a result of
participation, it is important to find ways in which to draw the non-participant group into
PPT activities in the future.
Among the three groups, the villagers in Group 3 who participated fully gained the
most benefit from the PPT project. Their livelihood outcome and livelihood assets showed
some improvements.
Table 9.9-1 Villagers‘ opinions of a better livelihood
What are your opinions towards livelihoods? Mean
Std.
Deviation
A better livelihood is a result of having more funds 3.85 0.93
A better livelihood is a result of having income besides
agriculture 3.79 1.03
A better livelihood is a result of luck in field work 4.05 0.76
A better livelihood is the result of the ability to borrow a lot
of money 2.50 1.10
A better livelihood is the result of the ability to contact
government officials 2.35 0.88
A better livelihood is the result of participation in the VBT
and OTOP schemes 2.25 0.72
In order to improve your livelihood, you must migrate to
find a new home 2.20 1.01
In order to improve your livelihood, you must find
additional income besides that from agriculture 4.05 0.94
In order to improve your livelihood, you must abandon
agriculture and change your occupation 2.58 1.12
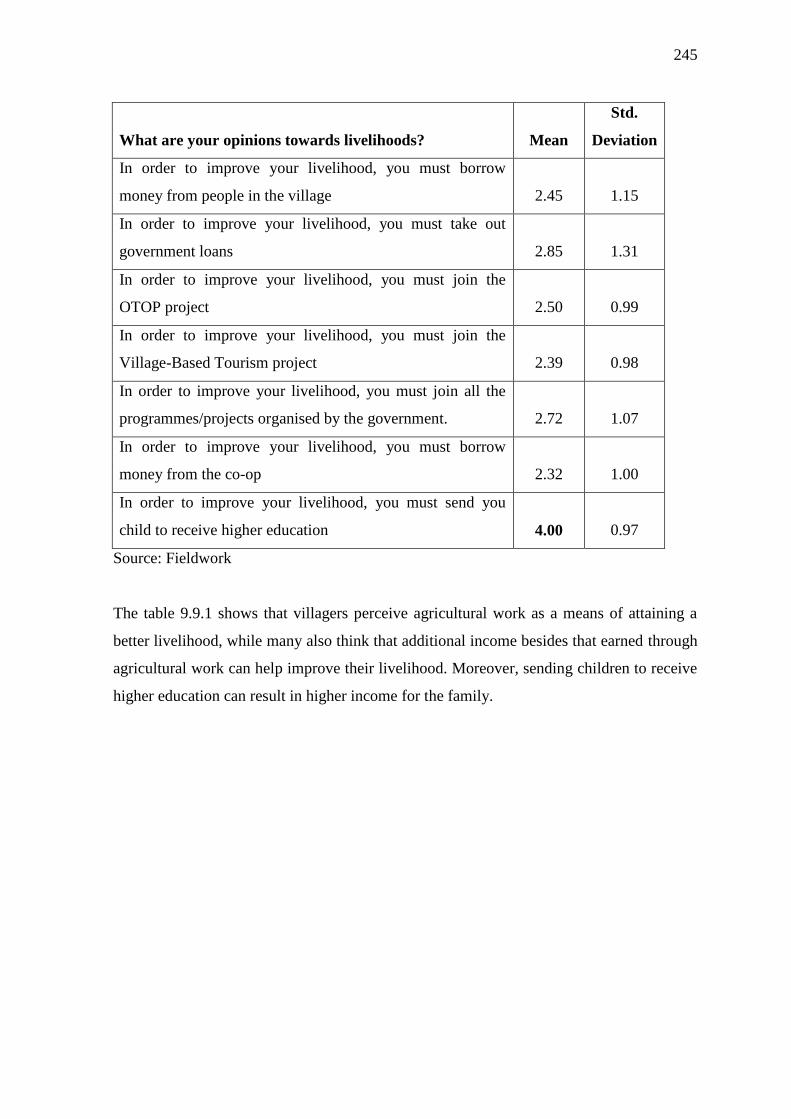
245
What are your opinions towards livelihoods? Mean
Std.
Deviation
In order to improve your livelihood, you must borrow
money from people in the village 2.45 1.15
In order to improve your livelihood, you must take out
government loans 2.85 1.31
In order to improve your livelihood, you must join the
OTOP project 2.50 0.99
In order to improve your livelihood, you must join the
Village-Based Tourism project 2.39 0.98
In order to improve your livelihood, you must join all the
programmes/projects organised by the government. 2.72 1.07
In order to improve your livelihood, you must borrow
money from the co-op 2.32 1.00
In order to improve your livelihood, you must send you
child to receive higher education 4.00 0.97
Source: Fieldwork
The table 9.9.1 shows that villagers perceive agricultural work as a means of attaining a
better livelihood, while many also think that additional income besides that earned through
agricultural work can help improve their livelihood. Moreover, sending children to receive
higher education can result in higher income for the family.
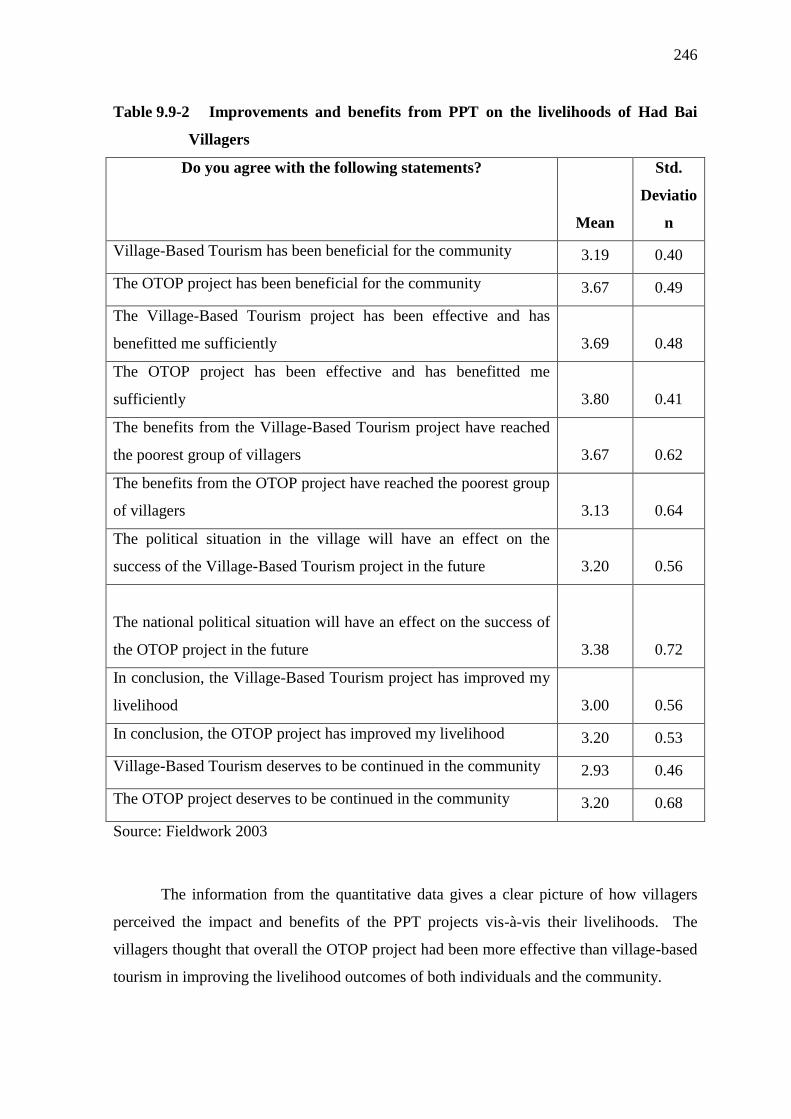
246
Table 9.9-2 Improvements and benefits from PPT on the livelihoods of Had Bai
Villagers
Do you agree with the following statements?
Mean
Std.
Deviatio
n
Village-Based Tourism has been beneficial for the community 3.19 0.40
The OTOP project has been beneficial for the community 3.67 0.49
The Village-Based Tourism project has been effective and has
benefitted me sufficiently 3.69 0.48
The OTOP project has been effective and has benefitted me
sufficiently 3.80 0.41
The benefits from the Village-Based Tourism project have reached
the poorest group of villagers 3.67 0.62
The benefits from the OTOP project have reached the poorest group
of villagers 3.13 0.64
The political situation in the village will have an effect on the
success of the Village-Based Tourism project in the future 3.20 0.56
The national political situation will have an effect on the success of
the OTOP project in the future 3.38 0.72
In conclusion, the Village-Based Tourism project has improved my
livelihood 3.00 0.56
In conclusion, the OTOP project has improved my livelihood 3.20 0.53
Village-Based Tourism deserves to be continued in the community 2.93 0.46
The OTOP project deserves to be continued in the community 3.20 0.68
Source: Fieldwork 2003
The information from the quantitative data gives a clear picture of how villagers
perceived the impact and benefits of the PPT projects vis-à-vis their livelihoods. The
villagers thought that overall the OTOP project had been more effective than village-based
tourism in improving the livelihood outcomes of both individuals and the community.
247
However, village-based tourism was more effective than OTOP in reaching the poorest
group. Thus while the OTOP project might have improved livelihoods generally and
increased assets, it was not truly pro-poor if it failed to reach the poorest group of villagers.
Conversely, although the village-based initiative may not have improved livelihoods and
increased assets as the OTOP project appears to have done, the fact that it had fewer
negative impacts and was better able to reach the poorest means that a new concept of
village-based PPT can be developed to design a new project to benefit everyone in society.
As established in the previous chapters, PPT projects can help increase the overall
assets of a community. However, if this results in a higher debt burden for the villagers,
with them spending their higher income on consumer goods rather than livelihood
diversification, then improvements will not be sustainable. Overspending can lead to
household debt and can become chronic. PPT research in Kenya mentions debt problems
rooted in declining tourism resulting in hardship for the poor, particularly in areas where
livelihoods were tourism-based (Kareithi, 2003). Physical hardship from dramatic declines
in household income were compounded by increased social conflict due to mounting debt
(Kareithi, 2003). Poor families were forced to sell assets such as livestock. There was also
increased exploitation of the poor as they moved from self-employment to other livelihood
options out of desperation. Research by Tangpianpant, 2010 also criticised the same
negative impact on the community.
In addition, this study has uncovered concerns that investors and tourists could
have an unintentional adverse influence on the productivity and quality of the products
being produced under the scheme. The in-depth interviews with villagers raised examples
of such concerns: investors can produce more products to sell to tourists, but the quality of
the hand-woven products might suffer, which in turn can reduce the reputation of the
original products. This could further add to the vulnerability of the poor. However, due to
the significantly better quality of the original weave, some tourists may yetbe willing to
pay more for high quality goods. Officials also raised concerns that the competition from
lower-quality products as well as lower prices could harm the original Had Bai hand
weaving. In this regard the local museum could mediate in promoting and preserving
weaving skills.
248
9.2 Livelihood Outcomes and Vulnerability
No clear picture of the benefits of the PPT initiatives in terms of livelihood improvement
emerged from the in-depth interviews with other stakeholders. The results were extremely
varied, although it is interesting that the comments received from related parties at the
policymaker or academic level focused broadly on the positive aspects of the programme.
The study revealed that the PPT initiatives in Had Bai led to a marginal
improvement in livelihood outcomes and slightly decreased vulnerability.
The results also showed that the PPT projects provided the most benefit to those
who could easily adapt their way of life to the project mechanism. The poorest and most
vulnerable on the other hand were not served so well by the project, thus limiting the
impact on this group. Contrary to the findings of Leaungsomnapa, Promproh, and
Khanwiset (2011), the finding showed that the programmes failed to significantly improve
the lives of those needing it most. The programme was said by policy makers to provide
opportunities for women and the disabled, and opportunities were distributed equitably
throughout the community. However, those at the practitioner level tended to suggest
otherwise, saying that the programme benefits were concentrated in the hands of the
community leaders.
The results revealed that the extra money gained from the various levels of
involvement in the PPT programmes provided supplementary incomes, and that this
additional money did help reduce hardship and enable slightly better living. The greatest
contribution that the project made was perhaps increasing people‘s access to greater
knowledge in tourism-related handicraft production, through the provision of vocational
training which contributed to the enhancement of human capital. This knowledge of
production techniques allowed project participants to produce higher quality local
products.
The study identified livelihood outcomes and vulnerability according to the level of
participation in the PPT initiatives:
249
Group 1: In this group are villagers who knew nothing about the programme and hence
did not participate. Villagers in this group were among the poorest in the village and their
houses were likely to be located geographically distant from the centre of the village. The
majority in this group were landless farmers who rented land from villagers in other
groups. Despite the lower income, members of this group tended to have lower liabilities,
as their lack of assets for collateral provided very limited access to financing resources.
Nonetheless, the fact that agriculture was their sole source of income left them vulnerable
to natural disasters, which could wipe out their crops and force them to borrow money
from elsewhere.
The results showed that the financial outcomes from livelihoods in Group 1 were
improved slightly by the PPT programmes. However since this group had not participated
in any of the programmes the impact on financial and social assets were only marginal;
there were, however, improvements in personal, physical and human assets. Thus even
though the programmes failed to involve the poorest villagers, they did reap some marginal
benefits.
Moreover, the results showed that the PPT programmes did have an impact, albeit
very marginal, on the vulnerability of members of this group. This impact came, however,
not as a direct result of the PPT initiatives, but because villagers in this group were able to
work on farms that were freed for rent by the villagers who participated in the
programmes. This additional income served to slightly decrease vulnerability.
Group 2: Villagers in Group 2 had substantial land holdings of their own. In addition to
farming, the major income-generating activity for men in this group, additional income
was also earned from employment outside the village and renting out land, mainly to
people in Group 1. The relatively large level of asset ownership allowed villagers in this
group greater access to government and village financing; however, even with their better
access to the PPT initiatives, they were more likely to incur debt than members of the other
groups. This resulted in a relatively high level of debt for this group, making them
particularly vulnerable, especially as they had a smaller financial cushion should adverse
events take place.
250
The results revealed that livelihood in Group 2 improved slightly after the
livelihood development programmes, but that the improvements were marginal and were
broadly in line with the results for Group 1. The plot shows that the PPT livelihood
programmes effected more improvements in personal, physical and human assets that they
did in financial and social assets.
Data on the impact of PPT on the vulnerability of members of Group 2 revealed
that partial participation resulted in a slight decrease in vulnerability. Nonetheless, this
decrease was only marginal, and was again broadly similar to the outcome for the group of
non-participants
Group 3: Group 3 villagers participated fully in tourism-related livelihood diversification
programmes. With a constant stream of additional income, the average debt in this group
was relatively low. This group enjoyed the maximum benefits from the programme, largely
due to the fact that the programme was based around their everyday activities of farming
and weaving.
The results showed that livelihood outcomes for Group 3 were significantly better
compared to the other groups. Although the overall picture indicates results similar to
those of the other groups, the data from the individual categories and a comparison of the
effects of each programme reveals a significant improvement in livelihood outcomes not
observed in the previous groups.
An assessment of the vulnerability outcome for the group which fully participated
in the programmes showed that the programmes served to significantly reduce
vulnerability. While the improvements in terms of personal assets were only temporary and
were not sustained, vulnerability in terms of human assets was effectively eliminated after
participation in the OTOP project, and this result was sustained over time. The results
show that the OTOP project brought about better results in the significant elimination of
vulnerability than the Village-Based Tourism project.
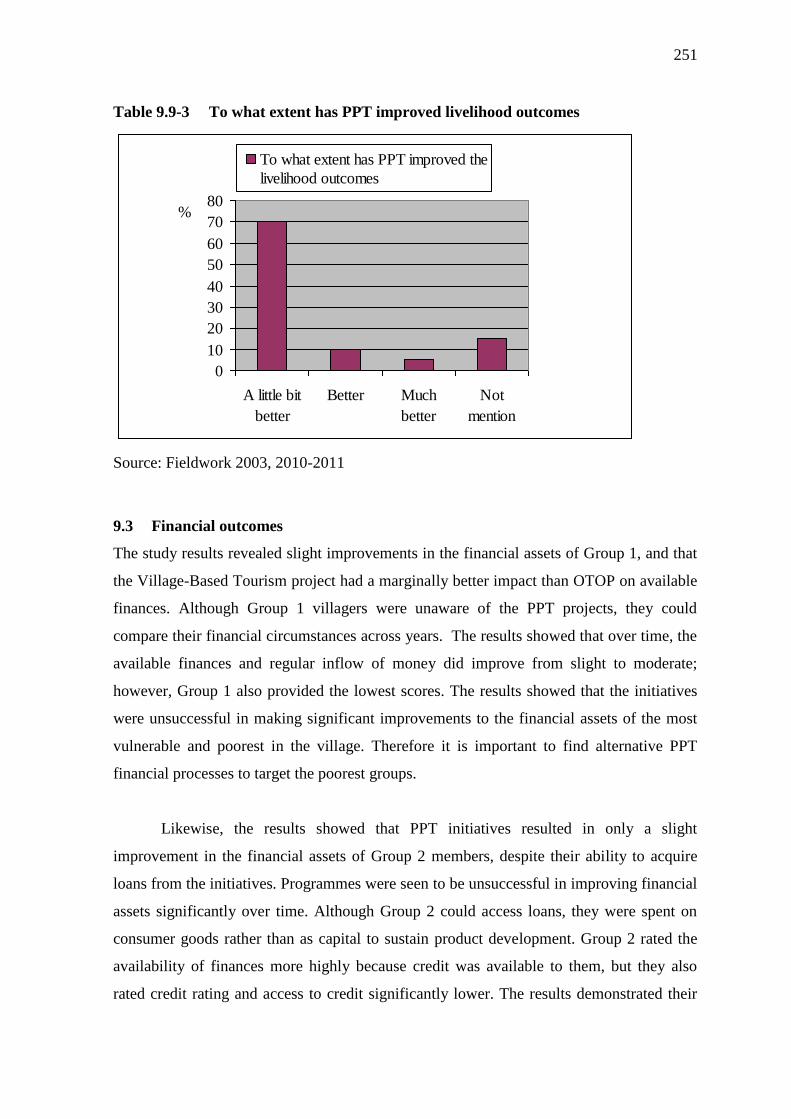
251
Table 9.9-3 To what extent has PPT improved livelihood outcomes
Source: Fieldwork 2003, 2010-2011
9.3 Financial outcomes
The study results revealed slight improvements in the financial assets of Group 1, and that
the Village-Based Tourism project had a marginally better impact than OTOP on available
finances. Although Group 1 villagers were unaware of the PPT projects, they could
compare their financial circumstances across years. The results showed that over time, the
available finances and regular inflow of money did improve from slight to moderate;
however, Group 1 also provided the lowest scores. The results showed that the initiatives
were unsuccessful in making significant improvements to the financial assets of the most
vulnerable and poorest in the village. Therefore it is important to find alternative PPT
financial processes to target the poorest groups.
Likewise, the results showed that PPT initiatives resulted in only a slight
improvement in the financial assets of Group 2 members, despite their ability to acquire
loans from the initiatives. Programmes were seen to be unsuccessful in improving financial
assets significantly over time. Although Group 2 could access loans, they were spent on
consumer goods rather than as capital to sustain product development. Group 2 rated the
availability of finances more highly because credit was available to them, but they also
rated credit rating and access to credit significantly lower. The results demonstrated their
%
0
10
20
30
40
50
60
70
80
A little bit
better
Better Much
better
Not
mention
To what extent has PPT improved the
livelihood outcomes
252
inability to procure additional loans after failing to manage the first loan effectively. These
findings suggest that improvements in screening loan beneficiaries are very important, and
that loans should be granted only to those who will invest money in sustainable livelihood
diversification.
Higher improvement in financial assets was seen among members of Group 3.
Although supplementary income from PPT activities and the regularity of capital inflow
remained slight, access to credit and availability of finances improved, showing that for
this group, at least, full programme participation led to moderate financial assets
improvement. The data showed that OTOP brought about significantly better improvement
in financial assets than did Village-Based Tourism, although over time both initiatives
resulted in a moderate improvement in financial assets. The findings make it clear that
financial improvements can be sustained by increased participation, and that more positive
financial improvements will result from better money management.
9.3.1 The Financial Sustainability of PPT initiatives in Had Bai Village
The study showed that while PPT improved cash earnings of participants to some extent,
non-participants began to encounter debt problems caused by improper use of the
government-injected money. Moreover, while the villagers sold more tourist products,
middlemen purchased them at prices lower than previously. Since local people had to wait
for tourism-generated income, which was sometimes seasonal, some opted for more
reliable incomes by migrating to towns. In addition, the information from the interviews,
focus groups and questionnaires demonstrated that expenses increased slightly after joining
the program. It was found that there was more desire to invest in the production of the
product, especially investing in raw materials used in the production process. Although
there was more demand for the woven products, there was no capital allocated for
purchasing new equipment, and the same old looms continued to be used. Expenses on
durable goods also increased, especially the purchase of mobile phones, motorcycles and
electrical goods. The attitude of that a higher income necessitated the purchase of
consumer goods as status symbols to ‗show face‘ results in unmanageable debts that were
often paid back by borrowing more from creditors from outside the system.
253
After joining the project, the participating families enjoyed some additional
income. The project also encouraged cooperation between people of the same occupation,
jobs and specialties, which meant that they could produce faster. In addition, the
government provided opportunities for products to be showcased in shopping malls and
trade fairs, expanding the market for group members.
9.4 Social outcomes
The results showed that project participation had a positive impact on community relations
as it drew residents together. Fully participant villagers learned managerial skills for group
work, shared responsibilities, communicated better than before, and shared benefits fairly
and cooperatively. Training organised by different government agencies provided a good
opportunity for villagers to come closer together by building work networks, sharing
information and experiences, and improve interaction with both government officials and
tourists, thus helping to enhance and strengthen the unity of the community.
Interaction among community members depended on the members themselves:
how they handled and managed the projects encouraged participation of all villagers.
Whatever their level of involvement, interaction infused the villagers‘ already tight ethnic
social structure with an institutionalised process requiring them to work together, leading
to improved social assets. The findings clearly showed that PPT programmes can have
multiplier effects on social assets, even for those not directly participating.
Results from assessing the three groups provided similar results. Although
members of Group 1 did not participate in the projects, the results revealed that their social
assets were moderately improved, with significant improvements in family support,
friendships and cooperation. Although not directly participating in the programmes, the
increased village social interaction and with villagers in the programmes improved non-
participant social assets as well.
254
Similarly, Group 2 results showed moderate improvement in social assets, as
friendships, cooperation and family support played an important role in acquiring loans.
But when the new capital intended for livelihood development was spent on unsustainable
expenses and loans could not be repaid, partnership and networking with fellow villagers
decreased. A data comparison showed that OTOP and Village-Based Tourism initiatives
equally impacted their social assets, and the improvements were sustained over time. The
findings thus demonstrated that social factors improved though unsustainable debts can
negatively impact social relationships.
The results for Group 3 showed significantly higher levels of improvement in social
assets. The fact that group members participated fully increased social participation and
interaction. The assessment showed that both programmes resulted in the same level of
impact on factors related to improvements in social assets, and the findings demonstrate
that social assets can be improved by programmes requiring community participation and
interaction.
9.5 Personal outcomes
Assessing personal assets showed that the degree of improvement corresponded to the
level of participation. Although the three groups perceived moderate improvements from
the PPT projects, Group 3 scored higher than the other groups. The results showed that the
programmes significantly improved personal assets of villagers participating fully in the
project.
Group 1 results revealed that despite not participating directly in the projects, their
personal assets also improved moderately. Both projects led to similar levels of
improvement in personal assets, but motivation was lower during the Village-Based
Tourism scheme than during the OTOP project. Over time this moderate level of
improvement was sustained. The findings demonstrate that indirect benefits from
livelihood-based PPT programs can also result in improvements in the personal assets of
individuals who are not direct participants.
255
Meanwhile the results for Group 2 suggest that while the programmes also led to a
moderate improvement in their personal assets, the improvements were slightly lower than
for Group 1. Financial pressures to pay off debts lowered scores in motivation and
spirituality during both projects. However, self-confidence and self-esteem were high after
participation in both projects, as members of this group used the money loaned from the
programmes to purchase electronic goods and other symbols of affluence like motorcycles
or cars. The findings show that personal assets suffer from unsuccessful participation, and
that personal improvements that are not sustained indicate problems that need immediate
attention.
Unsurprisingly, Group 3 showed the highest level of improvement in personal
assets compared to the other groups. The OTOP project led to more significant
improvements in personal assets than the Village-Based Tourism project, the former
providing more technical support in the product development process. Moreover, the
annual OTOP fair in Bangkok gave pride as villagers showcased the development and
preservation of their culture. Over time, improvements in self-esteem, self-confidence, and
assertiveness were sustained. The findings show that successful participation in PPT
programmes can lead to sustainable improvements in personal assets.
9.6 Physical outcomes
The results showed that the project did not emphasise the development of infrastructure but
of human capital. Some changes were made to provide facilities to meet tourists, parking
lots for coaches, restrooms and a sales outlet for tourist products.
The results revealed there were indeed moderate improvements in the physical
assets resulting from the PPT initiatives. Although the improvements in physical assets
were primarily directed to support the villagers participating in the PPT initiatives, the
impact was not exclusive to any group, as improvements in infrastructure benefited
everybody regardless of their level of participation.
256
Group 1 data showed that information was least improved among the subcategories.
Although this group, the poorest in the village, was targeted for benefits in both initiatives,
they failed to access information for either project, but had slightly better child/elder care
and secure shelters afterward. The findings showed that infrastructure development in PPT
programmes impacted physical assets even for those not directly participating in the
programmes.
Data from Group 2 showed that even without full participation moderate
improvements in physical assets resulted from the programmes. Banking access and basic
consumer needs availability were significantly lower during the Village-based Tourism
Project, indicating that they could not acquire loans during the Village-based Tourism
initiatives, but could during the OTOP project. Overall, both projects moderately improved
physical assets of villagers in this group, and the improvements were sustained over time.
Results showed that the physical assets of villagers fully participating improved
more than the other groups. Child/elder care and home security, and availability of basic
consumer services were significantly better after the projects. There are still concerns
about transportation, tools and equipment. These concerns needed urgent improvement.
The findings showed that full participation results in more significant and sustainable
improvements in physical assets than for non- or partial participation.
9.7 Human Outcomes
Improvements in the human outcomes resulted from various institutional supports
providing knowledge and training not only in production, but in packaging, marketing and
financial management. Training enabled villagers to participate more effectively in
developing tourism products from inherited traditional knowledge from their elders and
previous generations to produce goodsfor additional sustainable income.
Varying levels of improvement corresponded to villagers‘ degree of involvement.
Improvements in human assets were more significant compared to other outcomes,
especially from PPT programmes.
257
Moderate improvements in human assets resulted even for villagers not directly
involved in any project. The PPT impact on human assets showed that it was the most
improved category compared to other Group 1 assets. Health and leadership significantly
improved and were sustained over time. However, a need for knowledge and skills
training programmes focusing on skill development was shown.
Group 2 similarly revealed moderate improvement in human asset, but lower than
Group 1. Skills and employability lessened during village fund initiatives.
Employability and earning power were low, with difficulty in increasing incomes to repay
loans acquired during the programmes. However, health improved and overall moderate
effects were sustained over time. Interviews and focus group discussions showed that
urgent financial interventions to relieve debt burdens are needed for this group.
Full participation by Group 3 significantly improved human assets like abilities,
health and leadership. Human assets benefited greatly from participating in either project.
The human assets category was the most improved outcome, with Group 3 experiencing
the highest improvements.
Overall the findings showed that, PPT initiatives in Had Bai had its greatest impact
on human outcomes.
9.8 Natural Outcomes
The impact of PPT on natural resources, positive or negative, depended whether villagers
knew how to manage their natural resources. The excessive use of natural resources
without an effort to protect them could be unsustainable. Exploitation of natural resources
creates short-term wealth, but in the long run, the community stands to lose as their natural
resources are depleted.
In Had Bai Village, preservation and restoration concerned everyone. Participants
perceived that weaving did no harm to their natural resources. Participants expressed
confidence that natural resources were used sustainably.
258
However, the study revealed that the livelihood diversification project meant larger
scale production, creating more garbage and wastewater. Chemicals used in production
included environmentally hazardous pollutants. Where participants engaged in cloth
dyeing, groundwater was contaminated by dyes left on the surface. Although they realised
the importance of keeping their environment clean, accumulated wastes were not disposed
of properly and could create future health problems.
There is an urgent need to effect processes and policies to proactively protect
environmental degradation. A sustainable environmental framework will ensure that
natural assets in the village will be maintained and continually support local livelihoods.
9.9 Analytical and Methodological Lessons
The assessment framework used to assess PTT effects in this study was a capacity building
SLA model designed to develop resources and capacities for alleviating poverty on a
sustainable basis. The model described the minimum level of assets needed to deal with
stresses and shocks, and to sustain and enhance present and future capacities
The framework assessed five asset categories with related subcategories to describe
each category. The focus of SLA models may vary; it may be limited or on a wider set of
assets. These models recognised that assets are used to build and support individuals and
families to acquire more assets needed for long-term well-being.
The model used in the qualitative part of the study assessed natural assets not
assessed in the quantitative survey. Ferguson and Murray (2001) presented a five asset
framework with categories and related subcategories slightly different from the DFID
(2000) framework. In the DFID framework, personal category was replaced by the natural
category.
For comparison, both frameworks were used in this study. The first collected
quantitative data; the natural category was but a subcategory of the physical category. The
second framework was used in the qualitative data collection, and personal assets were
eliminated.
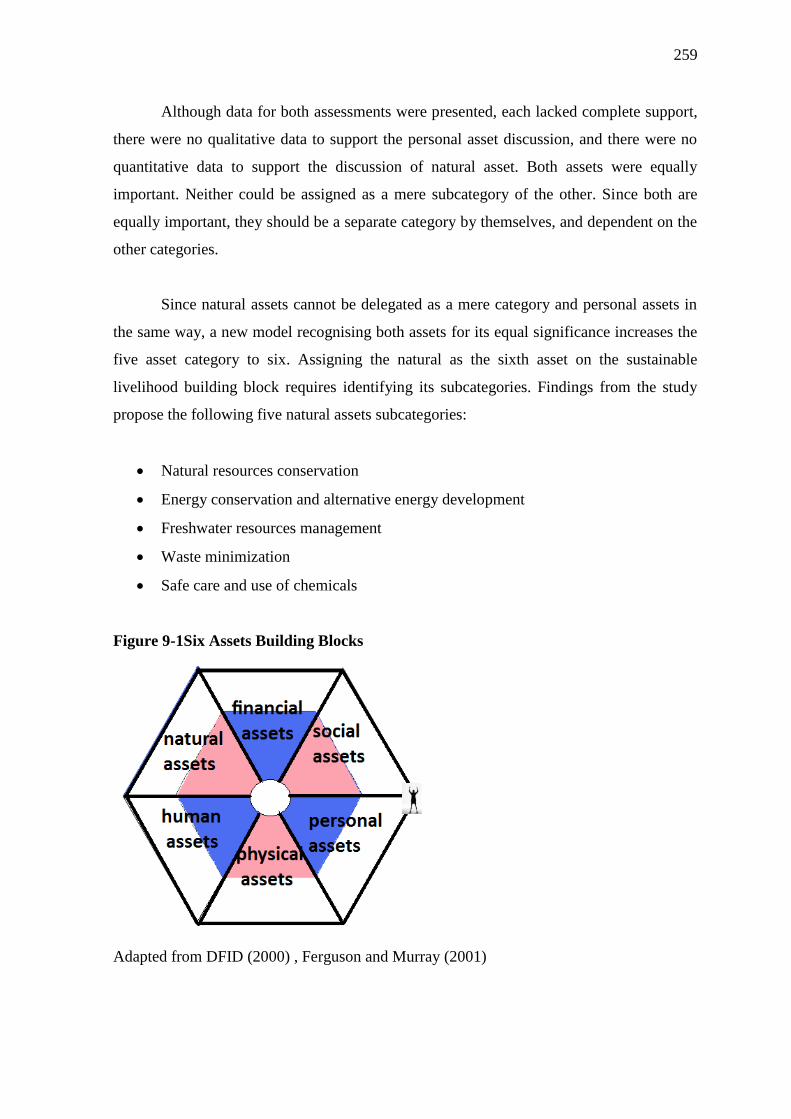
259
Although data for both assessments were presented, each lacked complete support,
there were no qualitative data to support the personal asset discussion, and there were no
quantitative data to support the discussion of natural asset. Both assets were equally
important. Neither could be assigned as a mere subcategory of the other. Since both are
equally important, they should be a separate category by themselves, and dependent on the
other categories.
Since natural assets cannot be delegated as a mere category and personal assets in
the same way, a new model recognising both assets for its equal significance increases the
five asset category to six. Assigning the natural as the sixth asset on the sustainable
livelihood building block requires identifying its subcategories. Findings from the study
propose the following five natural assets subcategories:
Natural resources conservation
Energy conservation and alternative energy development
Freshwater resources management
Waste minimization
Safe care and use of chemicals
Figure 9-1Six Assets Building Blocks
Adapted from DFID (2000) , Ferguson and Murray (2001)
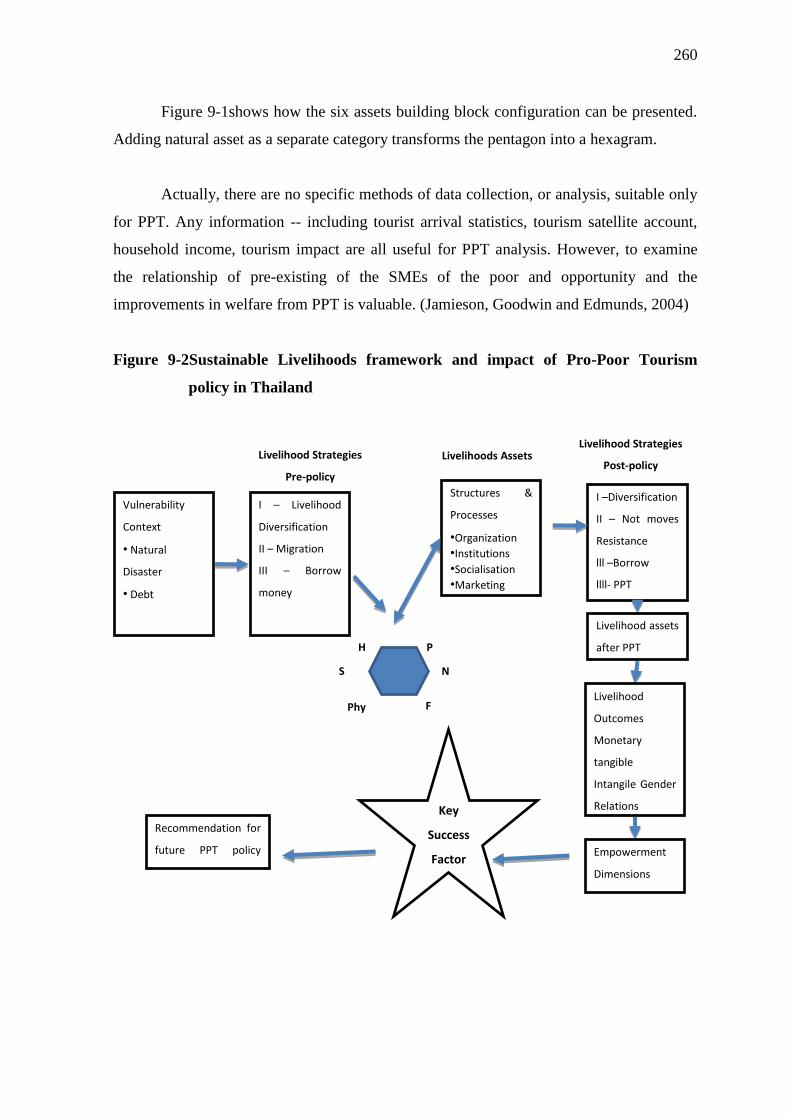
260
Figure 9-1shows how the six assets building block configuration can be presented.
Adding natural asset as a separate category transforms the pentagon into a hexagram.
Actually, there are no specific methods of data collection, or analysis, suitable only
for PPT. Any information -- including tourist arrival statistics, tourism satellite account,
household income, tourism impact are all useful for PPT analysis. However, to examine
the relationship of pre-existing of the SMEs of the poor and opportunity and the
improvements in welfare from PPT is valuable. (Jamieson, Goodwin and Edmunds, 2004)
Figure 9-2Sustainable Livelihoods framework and impact of Pro-Poor Tourism
policy in Thailand
Vulnerability
Context
• Natural
Disaster
• Debt
I – Livelihood
Diversification
II – Migration
III – Borrow
money
Recommendation for
future PPT policy
implimentation
Structures &
Processes
•Organization
•Institutions
•Socialisation
•Marketing System
I –Diversification
II – Not moves
Resistance
lll –Borrow
llll- PPT
Livelihood assets
after PPT
Livelihood
Outcomes
Monetary
tangible
Intangile Gender
Relations
Livelihood Strategies
Pre-policy
Livelihoods Assets Livelihood Strategies
Post-policy
Empowerment
Dimensions
Levels
Key
Success
Factor
H P
N S
Phy
y
F
261
Figure 9-2 shows the sustainable livelihood framework that the author adopted
from DFID (2000), Ashley (2000), Ferguson and Murray (2001) and findings from the
thesis. The new sustainable livelihood framework can help identify the impact of PPT
through the emphasis on one more aspect of assets by adding one more category which is
personal assets. The framework also looks at the livelihood strategies pre-policy and
livelihood strategies post-policy. After evaluating livelihood assets of the PPT projects, the
livelihood outcome can be interpreted. The answer will lead to key success factor and the
recommendation for future policy.
9.10 Challenges and Implications
The study showed that vulnerability significantly reduced only for the villagers who
fully participated in the PPT initiatives. The challenge for sustainable livelihood in PPT
programmes is to design a programme that can significantly benefit the poorest community
members in terms financial, social, personal, physical, human and natural outcomes.
The challenge in tourism product development project as a business undertaking
needs to be managed effectively in order to be sustainable in the long run. Government
agencies should organise several training courses for project participants so that they had
the knowledge and skills necessary. The training provided to project participants covered
various aspects of business activities ranging from production, packaging, and marketing
to financial management. With such training, villagers were equipped to undertake
economic activities other than farming, which was their traditional occupation.
9.10.1 Challenges in financial outcomes
The finding of the study revealed that financial improvements can be only be
sustained by increased participation. Positive financial improvements will only result from
effective and efficient financial resources management.
The study revealed a need for alternative financial processes designed to target the
poorest groups. The challenge is to design a financial component in the PPT programmes
that can provide financial assistance for livelihood diversification to the poorest and most
vulnerable members of the community. However, this facility should also be coupled with
262
strong improvements in screening loan beneficiaries; loans granted should only be invested
on sustainable livelihood diversification.
.
9.10.2 Challenges in social outcomes
The findings of the study revealed that PPT programmes can have multiplier effects in
social assets, even to those who are not direct participants in the development programmes.
However, social factors improved though unsustainable debts can have negative effects on
social relationships.
The challenge in developing social outcomes lies in the awareness that social
outcomes can be easily influenced by increases in financial outcomes. Unsustainable
financial outcomes lead to negative social relationships. PPT initiatives targeting
improvements in social outcomes should include programmes that will increase
community participation and interaction.
9.10.3 Challenges in personal outcomes
The finding in this study showed that indirect benefits from livelihood based PPT
programmes can also result in improvements in the personal assets of individuals who are
not direct participants. However, personal assets suffer in cases of unsuccessful
participation.
The challenge in developing personal outcomes lies in the success of recruiting
greater participation. Successful participation in PPT programmes lead to sustainable
improvements in personal outcomes. When personal improvements are not sustained, this
indicates problems that need immediate attention.
9.10.4 Challenges in physical outcomes
The findings in the study revealed that infrastructure development in village based PPT
programmes easily impacts physical assets even for those who are not directly participating
in the programmes. Improvements in physical infrastructure in the community is not
exclusive, it is improvement shared by all members regardless of their level of
participation.
263
Again the challenge for insuring sustainable physical outcomes at the individual
level is to encourage more full participation. Complete participation will result in more
significant and sustainable improvements compared to no or partial participation.
9.10.5 Challenges in Human Outcomes
Identifying positive results from increase in human outcomes can be difficult in close rural
communities. Therefore, findings may show PPT impact and improvements in humans
greater than all the other categories.
The challenge for improving human outcomes in Had Bai revealed the need for
knowledge and skills training programmes focused on developing abilities of villagers in
group 1. In group 2, the challenge in in finding urgent financial interventions to relieve
debt burdens.
9.10.6 Challenges in natural outcomes
The findings showed that there is an urgent need to include processes and policies enforced
to proactively protect environmental degradation. The challenge is in the effective
implementation of sustainable environmental practices that will to ensure that natural
assets in the village can be maintained and continually support the livelihood of people in
the community.
9.10.7 Challenges in how to sustain the livelihood benefit
As mentioned in chapter 4 the OTOP pro-poor tourism policy is not originally from
Thailand. The Thai Government used the OVOP rural development policy of Oita
prefecture in Japan to develop a similar program in Thailand. However, Japan‘s Oita
OVOP movement has sustained sales until the present. However, many projects in other
countries failed to sustain sales and were discontinued (Mukai and Fujikura, 2015). The
ability to develop unique products which cannot be imitated or to quickly develop a new
unique product if imitated, and to continue active marketing are crucial to make the project
sustainable (Hiramatsu 2006).
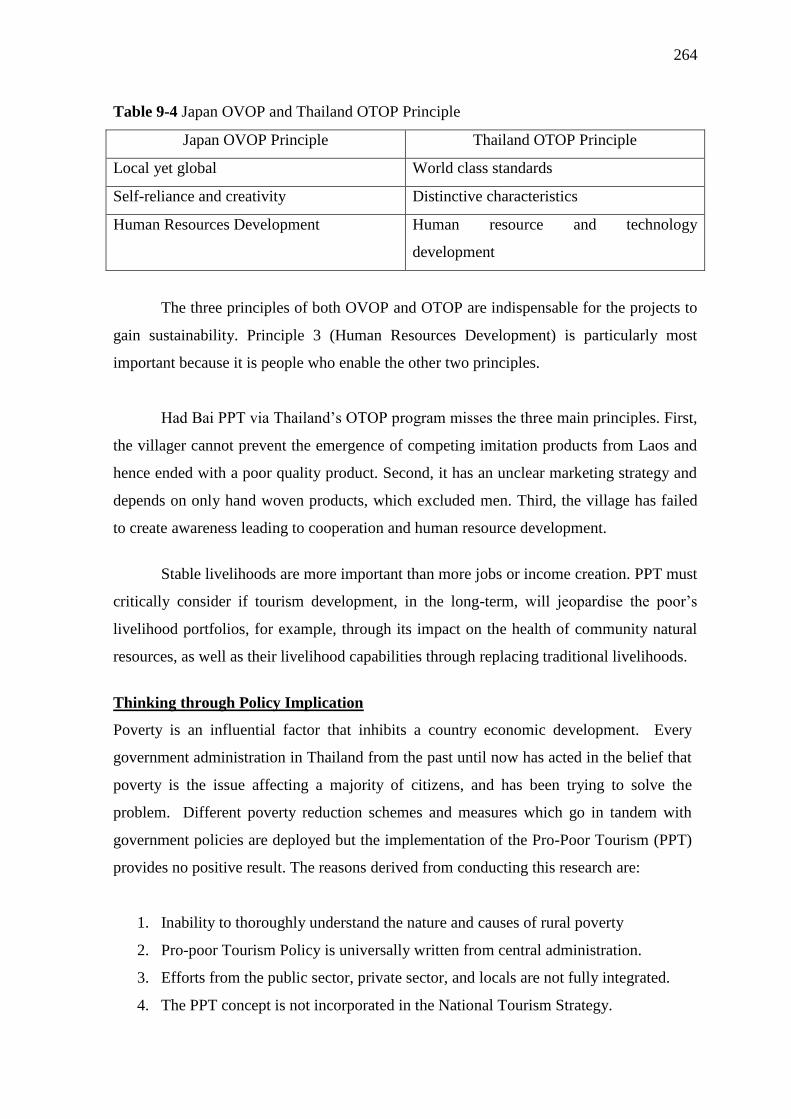
264
Table 9-4 Japan OVOP and Thailand OTOP Principle
Japan OVOP Principle Thailand OTOP Principle
Local yet global World class standards
Self-reliance and creativity Distinctive characteristics
Human Resources Development Human resource and technology
development
The three principles of both OVOP and OTOP are indispensable for the projects to
gain sustainability. Principle 3 (Human Resources Development) is particularly most
important because it is people who enable the other two principles.
Had Bai PPT via Thailand‘s OTOP program misses the three main principles. First,
the villager cannot prevent the emergence of competing imitation products from Laos and
hence ended with a poor quality product. Second, it has an unclear marketing strategy and
depends on only hand woven products, which excluded men. Third, the village has failed
to create awareness leading to cooperation and human resource development.
Stable livelihoods are more important than more jobs or income creation. PPT must
critically consider if tourism development, in the long-term, will jeopardise the poor‘s
livelihood portfolios, for example, through its impact on the health of community natural
resources, as well as their livelihood capabilities through replacing traditional livelihoods.
Thinking through Policy Implication
Poverty is an influential factor that inhibits a country economic development. Every
government administration in Thailand from the past until now has acted in the belief that
poverty is the issue affecting a majority of citizens, and has been trying to solve the
problem. Different poverty reduction schemes and measures which go in tandem with
government policies are deployed but the implementation of the Pro-Poor Tourism (PPT)
provides no positive result. The reasons derived from conducting this research are:
1. Inability to thoroughly understand the nature and causes of rural poverty
2. Pro-poor Tourism Policy is universally written from central administration.
3. Efforts from the public sector, private sector, and locals are not fully integrated.
4. The PPT concept is not incorporated in the National Tourism Strategy.
265
Inability to thoroughly understand the nature and causes of rural poverty
Therefore, for PPT to be effective in poverty reduction there needs to be some adjustment
in the thinking process and guidelines.
Poverty in the rural area is a systemic problem that involves several factors. The
solution is not as simple as giving away money or creating jobs for villagers. To
successfully reduce poverty in rural areas, especially with PPT, a thorough understanding
of the nature and causes of rural poverty needs to be taken into consideration by the
authorities.
Generally, policymakers often define ‗poverty‘ in a monetary dimension, in terms
of income level and the economic status of individuals against standard cost of living or
poverty line.
When poverty is defined by the lack of income to support consumption, policy and
tools to tackling poverty will be directed into increasing household income. Efforts will
be geared to improving factors of production and increasing efficiency, of market
condition instead of the needs of ‗the poor‘. Subsidies will come in the form of loans
which will only benefit SME business owners, but not ‗the poorest‘ as intended.
For this reason, the definition of poverty should also include other factors that are
non-monetary in nature, such as sustainable livelihood or other assets. Then, the
classification of poverty considering both monetary and non-monetary dimensions should
be centrally used by all concerned parties and budget should be allocated strategically to
each class of the poor.
Pro-poor Tourism Policy is universally written from central administration.
Pro-poor Tourism Policy from the central administration doesn‘t take into account the
differences in condition and context that each rural area is in. Many researchers believe
that there is a better chance of success than just ‗one policy fits all‘. (Siriprachai and,
Wisavet and Srisuchart, 2004)
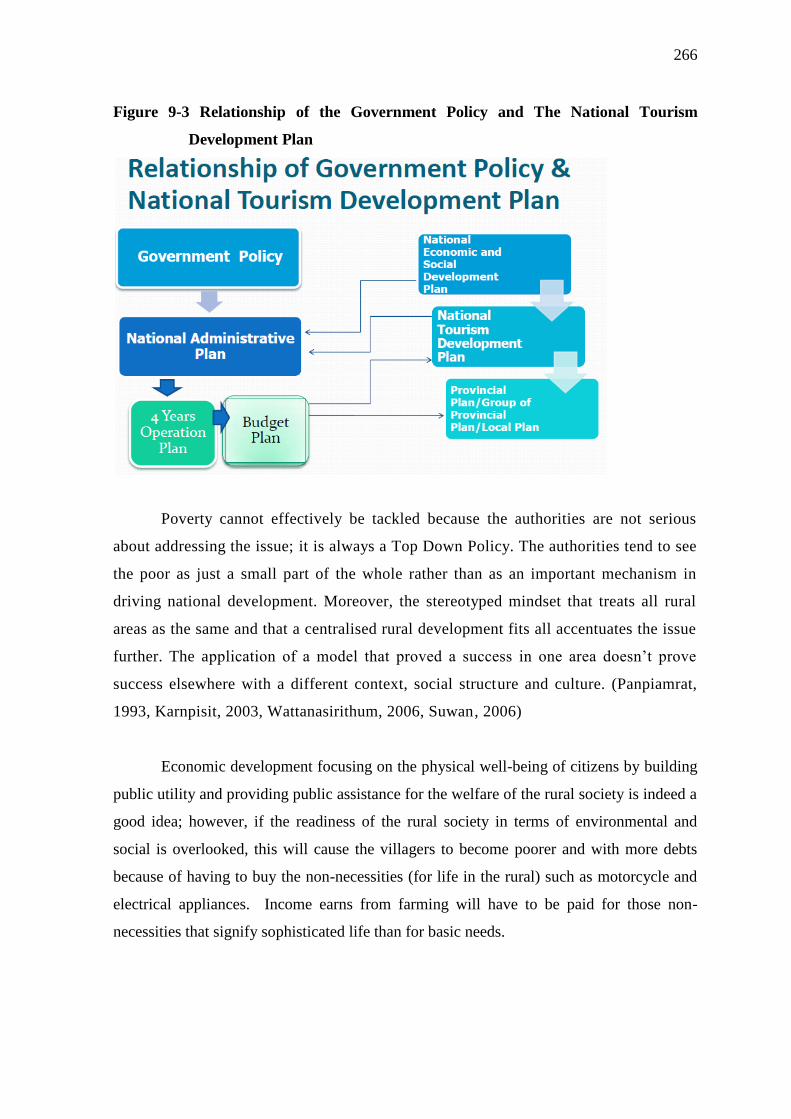
266
Figure 9-3 Relationship of the Government Policy and The National Tourism
Development Plan
Poverty cannot effectively be tackled because the authorities are not serious
about addressing the issue; it is always a Top Down Policy. The authorities tend to see
the poor as just a small part of the whole rather than as an important mechanism in
driving national development. Moreover, the stereotyped mindset that treats all rural
areas as the same and that a centralised rural development fits all accentuates the issue
further. The application of a model that proved a success in one area doesn‘t prove
success elsewhere with a different context, social structure and culture. (Panpiamrat,
1993, Karnpisit, 2003, Wattanasirithum, 2006, Suwan, 2006)
Economic development focusing on the physical well-being of citizens by building
public utility and providing public assistance for the welfare of the rural society is indeed a
good idea; however, if the readiness of the rural society in terms of environmental and
social is overlooked, this will cause the villagers to become poorer and with more debts
because of having to buy the non-necessities (for life in the rural) such as motorcycle and
electrical appliances. Income earns from farming will have to be paid for those non-
necessities that signify sophisticated life than for basic needs.
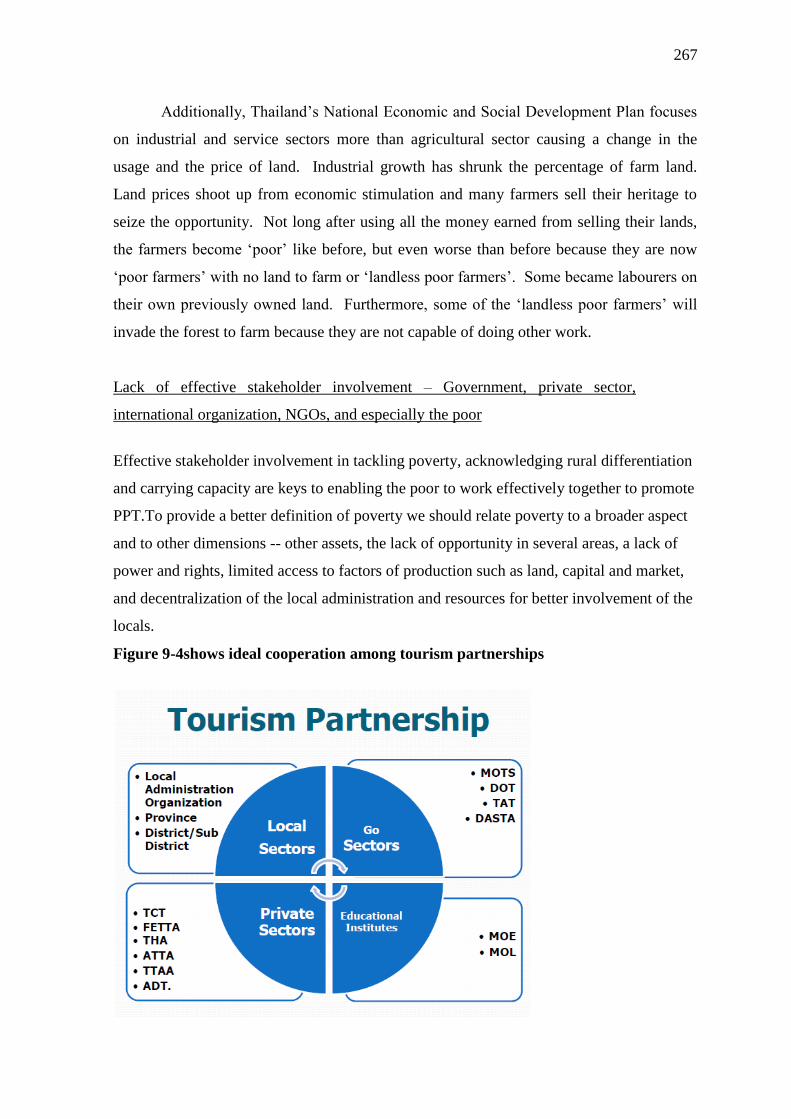
267
Additionally, Thailand‘s National Economic and Social Development Plan focuses
on industrial and service sectors more than agricultural sector causing a change in the
usage and the price of land. Industrial growth has shrunk the percentage of farm land.
Land prices shoot up from economic stimulation and many farmers sell their heritage to
seize the opportunity. Not long after using all the money earned from selling their lands,
the farmers become ‗poor‘ like before, but even worse than before because they are now
‗poor farmers‘ with no land to farm or ‗landless poor farmers‘. Some became labourers on
their own previously owned land. Furthermore, some of the ‗landless poor farmers‘ will
invade the forest to farm because they are not capable of doing other work.
Lack of effective stakeholder involvement – Government, private sector,
international organization, NGOs, and especially the poor
Effective stakeholder involvement in tackling poverty, acknowledging rural differentiation
and carrying capacity are keys to enabling the poor to work effectively together to promote
PPT.To provide a better definition of poverty we should relate poverty to a broader aspect
and to other dimensions -- other assets, the lack of opportunity in several areas, a lack of
power and rights, limited access to factors of production such as land, capital and market,
and decentralization of the local administration and resources for better involvement of the
locals.
Figure 9-4shows ideal cooperation among tourism partnerships
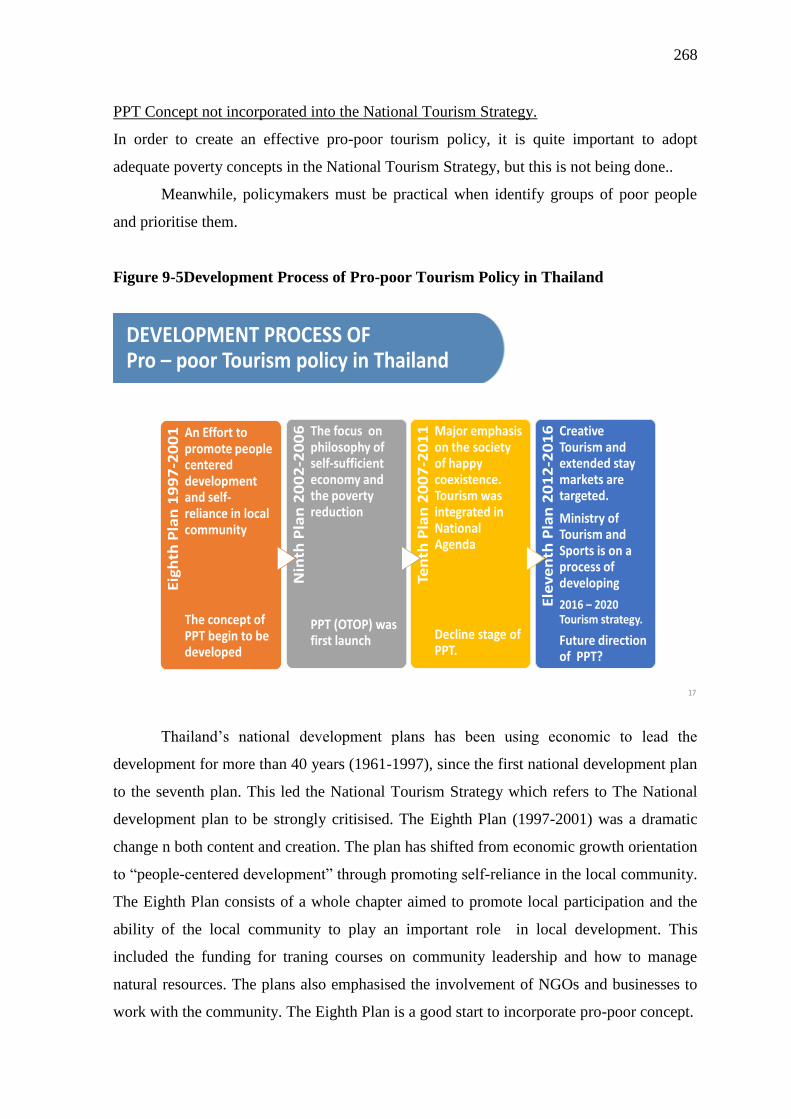
268
PPT Concept not incorporated into the National Tourism Strategy.
In order to create an effective pro-poor tourism policy, it is quite important to adopt
adequate poverty concepts in the National Tourism Strategy, but this is not being done..
Meanwhile, policymakers must be practical when identify groups of poor people
and prioritise them.
Figure 9-5Development Process of Pro-poor Tourism Policy in Thailand
17
DEVELOPMENT PROCESS OF Pro – poor Tourism policy in Thailand
Eig
hth
Pla
n 1
99
7-2
00
1 An Effort to promote people centered development and self-reliance in local community
The concept of PPT begin to be developed
Nin
th P
lan
20
02
-20
06 The focus on
philosophy of self-sufficient economy and the poverty reduction
PPT (OTOP) was first launch
Ten
th P
lan
20
07
-20
11 Major emphasis
on the society of happy coexistence. Tourism was integrated in National Agenda
Decline stage of PPT.
Ele
ve
nth
Pla
n 2
01
2-2
01
6 Creative Tourism and extended stay markets are targeted.
Ministry of Tourism and Sports is on a process of developing
2016 – 2020 Tourism strategy.
Future direction of PPT?
Thailand‘s national development plans has been using economic to lead the
development for more than 40 years (1961-1997), since the first national development plan
to the seventh plan. This led the National Tourism Strategy which refers to The National
development plan to be strongly critisised. The Eighth Plan (1997-2001) was a dramatic
change n both content and creation. The plan has shifted from economic growth orientation
to ―people-centered development‖ through promoting self-reliance in the local community.
The Eighth Plan consists of a whole chapter aimed to promote local participation and the
ability of the local community to play an important role in local development. This
included the funding for traning courses on community leadership and how to manage
natural resources. The plans also emphasised the involvement of NGOs and businesses to
work with the community. The Eighth Plan is a good start to incorporate pro-poor concept.
269
The Ninth Plan (2002-2006), although having less content and commitment to people-
centred development but retained the same aspirations as the Eighth Plan.
The Ninth Plan attempts to balance the concept of people-centred development of the
Eighth Plan with the economic recovery strategies to ease the country from the 1997 crisis
(the Tom Yam Kung crisis).
The plans adopt H.M the King‘s philosophy of Sufficiency Economy in principle and
focuses on poverty reduction for both the economic and tourism sectors. (NESDB 2002)
The stability of the economy improved, poverty was lessened, while the people‘s quality of
life improved greatly as a result of expanded health services, better health insurance in
both quality and quantity covering most of the population, and a decline in drug problems.
But the Thai economy remains vulnerable to external instabilities (NESDB 2007).
The Tenth National Economic and Social Development Plan (2007-2011) was
promulgated in an auspicious year for all Thai people. It was created with ideas using
popular participation of people in all sectors, groups and regions countrywide in every step
of the planning process. There was a consensus to adopt the philosophy of the Sufficiency
Economy as the guideline in conjunction with a holistic people-centered development
approach and to pave the way towards a ―society of happy coexistence‖ to enhance the
wellness of all people, consistent with the will and determination of His Majesty the King.
The Tenth Plan includes tourism in the national agenda. During this period tourism arrivals
increased steadily from 2005 to 2010, at 7.5 percent a year on average, from 11.5 million
in 2005 to 15.8 million in 2010. (MOTS 2011)
The Eleventh Plan (2012-2016), won Cabinet approval on 15 February 2011, Its
objective is to move Thailand‘s tourism competitiveness up at least 15 places, putting it
among the top five destinations in Asia. The plan intends to increase tourism income by at
least 5 percent during the five-year period.
270
In order to achieve this aim, five strategies have been set for implementation. The
first strategy seeks to develop infrastructure and logistics, linking with domestic and
international tourism. The second strategy involves the development and rehabilitation of
tourism sites and improvement of various rules and regulations to enhance the country‘s
potential for accommodating more tourist arrivals.
In the third strategy, emphasis will be placed on the development of the creative
economy, which is the focus in the 11th National Economic and Social Development Plan,
2012-2016. New products and services will be launched, while incentives for tourism trade
and investment will be offered and human resource development will be emphasised.
The fourth strategy seeks to create confidence in Thailand‘s good image among
visitors, so that the country will welcome a greater number of tourists who will spend more
in Thailand. The fifth strategy calls for the participation of the public sector, civil society,
and local administrative organizations in tourism management.
Whether tourism policy will benefit the poor or not is up to the distribution of
political power in decision-making. Richter (1993: 192) argues that tourism policy has so
far been an ‗elite-driven policy‘, and capital requirements mean ‗negotiations which more
closely follow private economic advantage than some ideal of balanced development‘.
Fore tends to mirror the distribution of political influence more generally‘
9.11 Recommendation for Future Research
The author will report information from interviews and focus group discussions as
recommendation for future research. ―Voice of the poor‖ is truly important and cannot be
ignored. The success or failure of the projects depends on both policy itself and the
knowledge and readiness of the poor.
While pro-poor tourism, including the OTOP scheme, might go some way towards
improving the livelihoods of certain sectors within local communities, this research
demonstrated that the poorest continued to lose out. As the informants told the author, the
poorest members of the village had neither the time nor the money to invest in PPT-related
work, thus preventing their participation in the scheme. Nonetheless, they were proud of
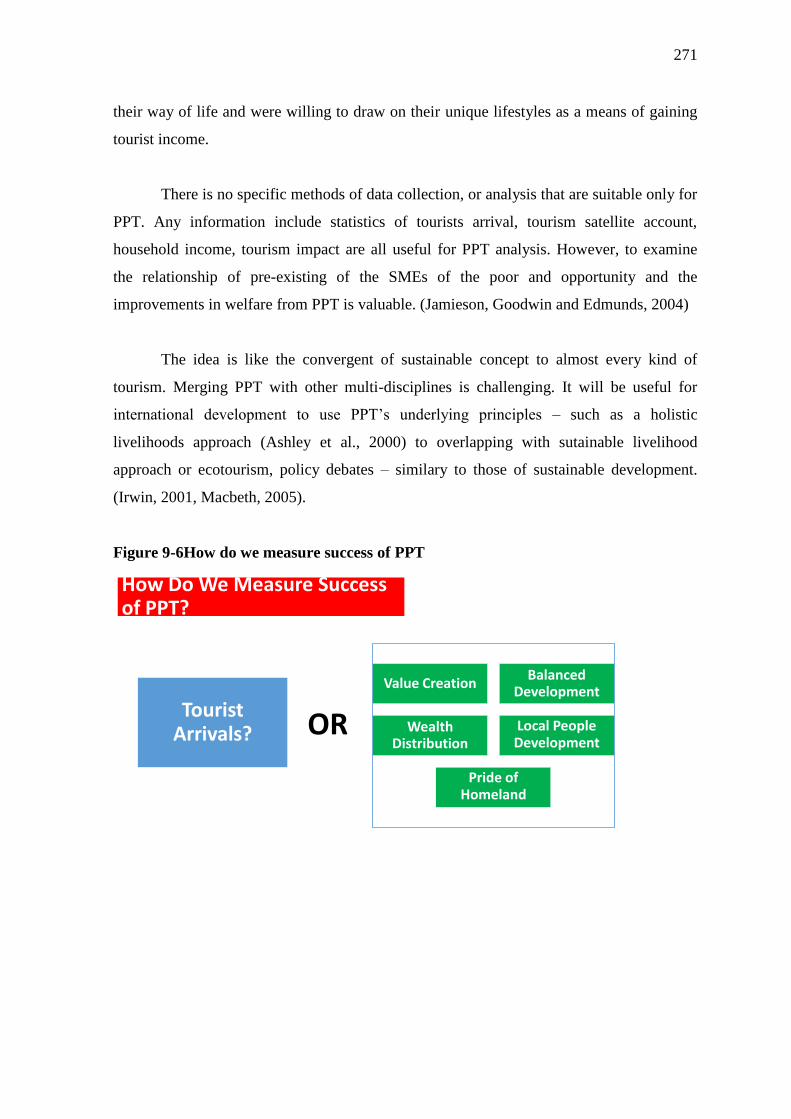
271
their way of life and were willing to draw on their unique lifestyles as a means of gaining
tourist income.
There is no specific methods of data collection, or analysis that are suitable only for
PPT. Any information include statistics of tourists arrival, tourism satellite account,
household income, tourism impact are all useful for PPT analysis. However, to examine
the relationship of pre-existing of the SMEs of the poor and opportunity and the
improvements in welfare from PPT is valuable. (Jamieson, Goodwin and Edmunds, 2004)
The idea is like the convergent of sustainable concept to almost every kind of
tourism. Merging PPT with other multi-disciplines is challenging. It will be useful for
international development to use PPT‘s underlying principles – such as a holistic
livelihoods approach (Ashley et al., 2000) to overlapping with sutainable livelihood
approach or ecotourism, policy debates – similary to those of sustainable development.
(Irwin, 2001, Macbeth, 2005).
Figure 9-6How do we measure success of PPT
How Do We Measure Success of PPT?
Tourist Arrivals?
Value CreationBalanced
Development
Wealth Distribution
Local People Development
Pride of Homeland
OR
272
9.12 Summary of PPT key success factors
Internal Factors
- Participation
- Suitable public relations and marketing plans
- Good database system with regular follow-up and evaluation - Transfer of local
wisdom and cultural heritage
- Good management
- Fair distribution of benefits
- Use of appropriate technology
- Regular product development and training
- Good budgeting/loaning
External Factors
- Reliable allies and networks such as nearby villages
- Participation from outside stakeholders and government officers
- Easy access by tourists
- Communication, road, logistics and infrastructure (tourists can reach and stay in the
community)
In sum, internal factors are the most important factors for the success of PPT.The
key factors for success are based on participation, marketing, and the capability of
community organizations to manage tourism efficiently. Participation means the
participation of everyone in the community according to roles most suited to them in that
particular social set-up. Participation includes thinking, planning, working and evaluation,
all of which are based on understanding, friendship and consideration.
The following section derived from the focus group discussion. The focus group
discussions gathered all stakeholders namely, villagers, practitioners, policy makers,
private sector and the NGOs.
273
The author asked participants in the last focus group discussion held in 2010 what
kind of PPT initiatives would bring the most benefit and improve the livelihood outcomes
of the poor. The participants then suggested “Livelihood Tourism” as an approach that
would allow the poor at all levels to participate more easily and effectively.
The main PPT activity in Had Bai village is weaving. This effectively excludes
men, as weaving is the role of women. However, there are many more activities that could
draw in more participants, such as making brooms, furniture or traditional paper lantern.
The poorest could be taught basic agricultural skills such as how to fish in the Mekong
River and how to plant rice and other crops.
The new poverty situation such as debt problem or negative adverse would affect
PPT in Thailand. Thus, the author would like to suggest alternative PPT in relation to
―Livelihood Tourism‖
9.13 Summary of Livelihood Tourism (LT)
Livelihood Tourism (LT) might therefore be considered as a concept distinct from, albeit
similar to, Community-based Tourism (CBT), of which is might be said to form a sub-set.
While it also shares many characteristics with PPT, unlike the latter it is not only aimed at
benefitting the poor.
LT puts emphasis on having visitors appreciate the stories, skills and products of
the community. ―Story‖ here refers not to works of fiction but to the distinctive oral history
of a community, and the stories of the daily lives of its members. ―Skill‖ refers to those
things that local communities are capable of doing, whether the production of artefacts or
the preparation of special food, or to certain activities. ―Product‖, unlike in the OTOP
scheme, might be multiple and need not be unique to a particular locale. For instance while
poorer members of the Had Bai community might not have the time or capital to engage in
weaving, they could produce good quality brooms, bamboo furniture or local lanterns.
Such activities could be those traditionally performed both by men and women, thus
ensuring a more even rate of participation between the sexes.
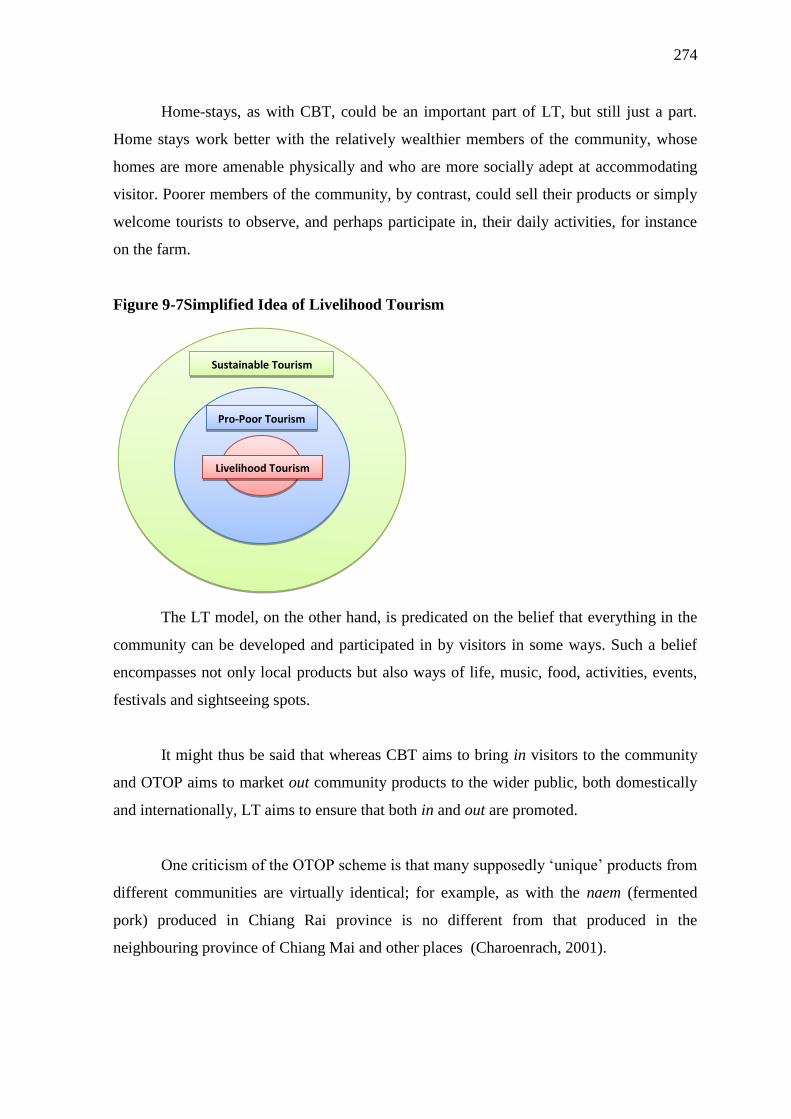
274
Home-stays, as with CBT, could be an important part of LT, but still just a part.
Home stays work better with the relatively wealthier members of the community, whose
homes are more amenable physically and who are more socially adept at accommodating
visitor. Poorer members of the community, by contrast, could sell their products or simply
welcome tourists to observe, and perhaps participate in, their daily activities, for instance
on the farm.
Figure 9-7Simplified Idea of Livelihood Tourism
The LT model, on the other hand, is predicated on the belief that everything in the
community can be developed and participated in by visitors in some ways. Such a belief
encompasses not only local products but also ways of life, music, food, activities, events,
festivals and sightseeing spots.
It might thus be said that whereas CBT aims to bring in visitors to the community
and OTOP aims to market out community products to the wider public, both domestically
and internationally, LT aims to ensure that both in and out are promoted.
One criticism of the OTOP scheme is that many supposedly ‗unique‘ products from
different communities are virtually identical; for example, as with the naem (fermented
pork) produced in Chiang Rai province is no different from that produced in the
neighbouring province of Chiang Mai and other places (Charoenrach, 2001).
Sustainable Tourism
Pro-Poor Tourism
Livelihood Tourism
275
LT, on the other hand, makes use of stories unique to a particular community; for
example the event of the dragon fire on the fifteenth night of the eleventh month is unique
to Nong Khai province, and cannot be copied by other communities. While few
communities have major memories, so to speak, the of past and its relation—the stories
and the people whose stories are told—do have the opportunity to play a larger role in
community memory.
Moreover, the concept of LT can be applied to very small scale villages (moo ban),
unlike OTOP, which, as the name implies, is based at the level of the tambon (sub-district).
Indeed, several villages using an LT model could work together to create a wider network.
For instance, villagers in Had Bai village could work together with their counterparts in
Had Sai Ngoen and Had Sai Thong villages to form a larger tourist attraction, with the
products from these three villages sold together to create a more varied market.
Many cultures have disappeared because of a lack of people able or willing to
continue local cultural traditions and wisdom. In Had Bai, the villagers did not worry
much about natural disasters, noting that they were able to ‗bend with the wind‘, or
become accustomed to them. The real vulnerability they feared was the disappearance of
Thai Lue culture and their livelihoods.
In most small villages, the potential inheritors of these traditions always leave to
work in towns and cities. Despite the relatively well-known handicraft traditions in Had
Bai, the younger generation tends not to appreciate this, instead searching for higher
incomes in urban jobs and leaving the older villagers as guardians of their culture.
It is hoped that if LT could be implemented successfully, villagers would be able to
make a sustainable income from their culture and traditions, and that this in turn would
foster a greater appreciation among the younger generation. Knowledge management
(KM) would also be applied to prevent the loss of the culture chain and livelihood.
276
The concept of LT is based on what I will call a ‗BIM‘ model, where ‗B‘ refers to
brainstorming, ‗I‘ to information and ‗M‘ to management. First, older members of the
community would meet to decide what ―stories‖ they wished to focus on. At the same
time, on the part of the young, some village children (informally) and schoolchildren
(formally) would facilitate community knowledge, spirit and ownership in the process on
the part of the young, which by its very nature contributes to the possibility of an ongoing
community. Second, information would be gathered about the village, sources of funding
and policies, and this information would be shared among the villagers, tourists and others
involved, whether from the government, the private sector or NGOs. Third, a knowledge
management approach would be applied to ensure the transfer of local knowledge from
one generation to the next. As my informants said: ―Who‘s afraid of floods or hailstorms?
What I fear more is that Thai Lue culture will disappear‖. Pro-poor Tourism may benefit
the poor elsewhere in the world, but in Thailand it has worked only to improve the overall
livelihood of lower-income groups, and has scarcely touched the very poorest in society.
The author hopes that “Livelihood Tourism” as an approach can be developed and
will allow the poor at all levels to participate more easily and effectively. The model
emerging from the thesis can help develop more effective Pro-poor Tourism in the future.
The following section details the outcome of the focus group discussion on how to
establish Livelihood Tourism.
9.14 Process of Making Livelihood Tourism (PPT)
9.14.1 Preparation of community readiness for LT
Conduct community meeting or dialogues to evaluate the tourism needs (―want‖ and ―do
not want‖)
Pursue the ―want‖ and disregard the ―do not want‖
Find out the selling points or assess objectively the resources of the community
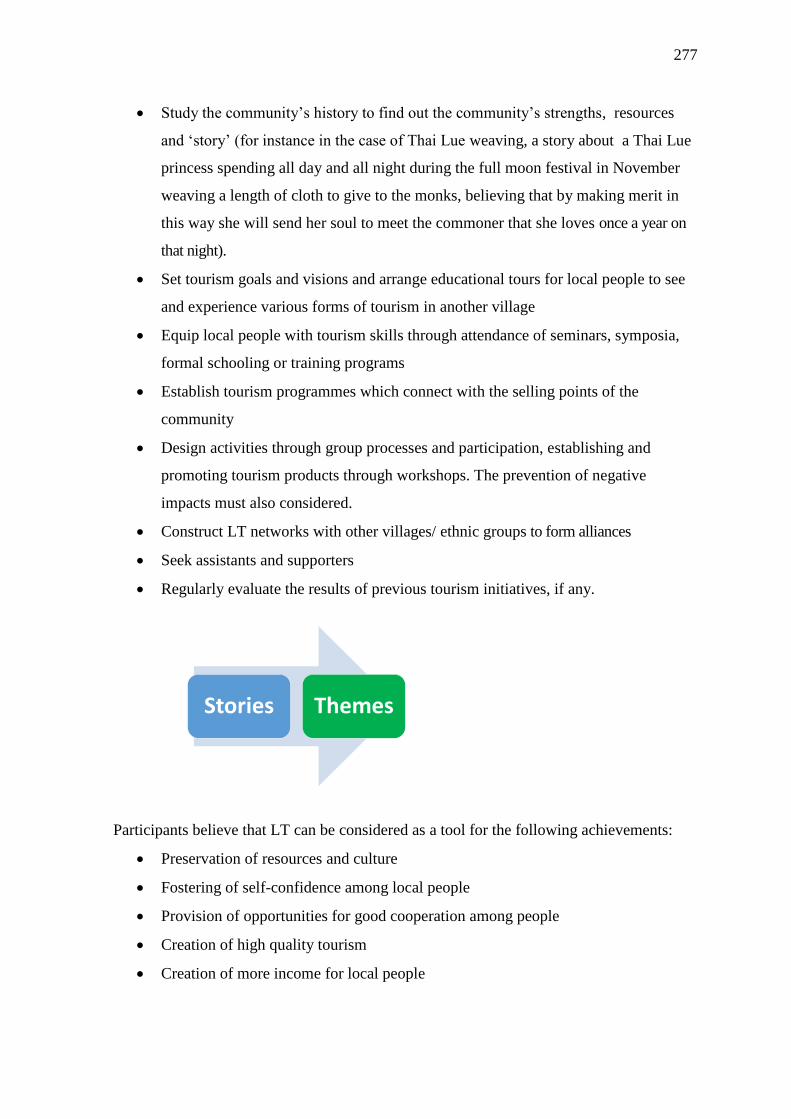
277
Study the community‘s history to find out the community‘s strengths, resources
and ‗story‘ (for instance in the case of Thai Lue weaving, a story about a Thai Lue
princess spending all day and all night during the full moon festival in November
weaving a length of cloth to give to the monks, believing that by making merit in
this way she will send her soul to meet the commoner that she loves once a year on
that night).
Set tourism goals and visions and arrange educational tours for local people to see
and experience various forms of tourism in another village
Equip local people with tourism skills through attendance of seminars, symposia,
formal schooling or training programs
Establish tourism programmes which connect with the selling points of the
community
Design activities through group processes and participation, establishing and
promoting tourism products through workshops. The prevention of negative
impacts must also considered.
Construct LT networks with other villages/ ethnic groups to form alliances
Seek assistants and supporters
Regularly evaluate the results of previous tourism initiatives, if any.
Stories Themes
Participants believe that LT can be considered as a tool for the following achievements:
Preservation of resources and culture
Fostering of self-confidence among local people
Provision of opportunities for good cooperation among people
Creation of high quality tourism
Creation of more income for local people
278
However, they also foresaw the following challenges:
Conservation of natural and cultural resources
Control and management of the suitable use of resources
Provision for the management of sustainable resources
Creation of network connections in LT
Creation of business mechanism environment to support local people
Setting new and solid standards for LT
In summary, LT management requires a clear vision, the preparation and readiness
of the community, effective marketing and cooperation with other bodies. Tourism
resources for LT can be classified into four categories:
1. Merchandises, goods, e.g. OTOP products
2. Natural resources, e.g. rivers, mountains
3. Cultural heritage and lifestyle
4. Historical background
5. Climate and geography
In another discipline the LT resources are classified into three main areas:
- Social Capital
- Cultural Capital
- Natural capital
9.14.2 Key factors for the success of LT
- The identification of tourism resources, with an emphasis on finding the
unique attributes and ‗story‘, and local wisdom of the community which has
been handed down over the generations. - To treasure and maintain tourism
resources
- To conduct research and development into new products and resources
- To educate and share knowledge with local people of all ages- To set up
organizations to manage and support LT
- To conduct extensive public relations work as necessary
- To evaluate both the positive and negative outcomes
- To foster cooperation among people and networks
279
- To ensure good planning and continuous operations, establishing clear policies
for project continuity - To create networks and alliances - To ensure that
good management knowledge is transferred
9.14.3 Marketing for LT
Livelihoods cannot be bought or sold, and in this respect they are invisible goods.
However, they are equally not something that can be copied, and as such, LT can be truly
unique in each village.
However, the success of LT is dependent on a community having proper processes
of public relations. Tourists should be carefully screened to ensure that both sides benefit
from the project.
9.14.4 The four „Ps‟ of LT marketing
Product : LT products consist of livelihoods, goods and services which tourist must come
to visit, touch, see and feel in order to experience the distinctive nature and culture of the
village. The ‗products‘ received by the tourists in the form of service will be of cultural
identity, natural scenery, and the local way of life, and they will enjoy services and warm
welcome from the local people.
Price : Prices should be clear, value-laden and fair for both sides, with the villagers
satisfied with the price and the tourists feeling that they have received value for money.
Place of distribution : In order to introduce LT, government agencies and tour companies
must work together to create suitable schemes for each community. Tourists normally
know about the community though brochures, guidebooks, documentary books, the
internet and tour agencies. Foreign tour agencies should work with Thai tour agencies and
local government in the screening and placement of tourists in various communities. Other
places of information distribution are hotels and local shops. Tour agencies would have to
work closely with communities, who in turn would talk to tour agencies concerning their
requirements. Tour groups should be selected using the following criteria:
280
- Responsibility of company policies and understanding of, and interest in, LT - Ability
to provide training programmes for guides in order to equip them with knowledge of
communities and their responsibilities towards them
- Written contracts between community and tour agencies concerning details of
activities, price and personnel, for instance whether tour guides should be locals or
should be drawn in from outside - Tour agencies should be responsible for making
clear to tourists the sensitivities of the community in terms of culture, livelihood, way
of life, religions, etc.
- Detailed agreements should be drawn up between the tour agencies and communities,
outlining the needs of both sides. Taken into account should be issues related to the
time of the year, season of harvest, seasonal cultural activities, and information
indicating the readiness of the community. The tour agencies should also give
information about the tourists such as their age, sex, interests and any other issues
pertinent to the provision of homestay accommodation
- Evaluation of the feedback from both tourists and local Production of summary reports
indicating the LT situation is important in order that plans might be made for further
development and the necessary data submitted to the government
Promotion : LT can seek to attract tourists by means of promotions such as seasonal low
prices and special activities and services . A tourism resource map, giving tourists
information on what to do in the area, is also extremely important for LT. This map must
show local shops with arrows indicating directions and the clear identification of location
names in both the local language and English. Technology can also be tapped and be taken
advantage with through the use of electronic marketing (e-Marketing). Livelihood tourism
projects in the locality can be advertised through this platform so that as majority are
internet users at this technology age, they will be able to know these things in no time and
be able to save a lot of cost. However, traditional platforms may be continued depending
of whatever is very effective in terms of gathering tourists.
281
9.15 Theoretical Reflection
While the PPT aims to contribute more constant streams of income to the poor, the fair
distribution of resources and opportunities can be argued. The study revealed that the net
benefits from the PPT initiatives in Had Bai were not equally distributed. The villagers in
the lower end of income distribution who did not have collateral did not participate in the
projects, and most of those who were able to acquire loans faced serious financial
problems as well as high levels of debt. Despite the fact that there were some benefits
from both village-based tourism Village Fund and tourism products development OTOP
programmes, vulnerability and the high level of outstanding household debts still remain
as pressing problems.
The results showed however, that participants benefiting most from the initiatives
were those owning sufficient land, and able to rent out land to landless farmers, while
devoting more of their own time to tourism-related production like weaving and other
activities. The poorest, especially the landless villagers, had minimal access to these
benefits. The findings about uneven distribution were affirmed by PPT researcher and
practitioners as acceptable that the poorest may not benefit at all from PPT initiatives while
some of non-poor may well do. (Harrison, 2008)
OVOP projects have not always been successively implemented either in Japan or
overseas. These projects are essentially dependent on the manufacture and sale of local
goods and/or services. The degree to which these products are financially sustainable is
crucial for success. There were some problems, however, such as dissatisfaction that
income was not distributed equally among the producers‘ groups, a decline in prices due to
similarity among products, and a shortage of raw materials (Takei 2007).
PPT in this research can be summarised that actually, PPT is not a specific theory
or model. It can be any form of tourism that delivers net benefits to the poor in the area. As
a result, it is not the kind of tourism involved, but the extent to which it improve the
livelihoods of the poor. The use of the term ‗pro-poor tourism‘ is for everyone promoting
tourism as a tool for poverty reduction, regardless of what kind of tourism and what they
term it.
282
Policy recommendation
This research finds that pro-poor tourism policy should emphasise these guidelines:
1) Measures, strategies, and/or procedures in tackling poverty should not lead to changes
in the way of life, which are deeply embedded to the natural environment, but should
rather integrate into the way of life of the poor.
2) Development of public utilities, public assistance (welfare), and/or other development
activities should take into account the capacity and readiness of the population and its
environment. Introducing the symbols or indicators of civilization to the rural society
that are not ready to accept and that environmental condition is not ready, the rural
villagers will end up into a deeper poverty from having to lend money to pay for new
non-necessities.
3) Improve the quality of the rural population with better education system, better
hygiene, and skill enhancement in earning income for a rural living should be the first
priority for the authority. Secondly, the authority needs to improve the quality of the
environment especially soil, water, and forest which are all important to the lives of the
rural villagers in terms of having direct relation to their primary occupation, farming.
4) Encourage and support the unique identity of each rural village (a self-contained unit
that forgoes external reliability). If there should be a need for connecting with people
outside one‘s own society, it should be those of the same level of society. If there
needs to be a relationship with a bigger society, the rural society should be very careful
with the disadvantages in having to exchange between the two societies. At the same
time, the bigger society that is also totally connected to one‘s own way of life should
lessen the attempt in taking advantage of the smaller society in order to keep a stable
and long-lasting relationship.
5) Approach in tackling poverty has to change from ‗giving‘ to ‗making them capable of
self-help‘ as much as possible. In giving all the best possible help doesn‘t absolutely
demolish poverty. When help runs out, the rural villagers who are used to being helped
will ‗wait‘ or ‗beg‘ for the help. If we change from helping to teaching them all the
skills necessary for self-help, the writer is certain that poverty will decrease or in time
be demolished.
283
6) Tackling poverty is similar to tackling all other problems that involves people. Therefore,
the key is to let the poor rural villagers who take ownership to the problem think of their own
solution and implement the solution on their own. The poor rural villagers know best about
the situation they are in and prioritise what they need the most. Stakeholder both public and
private should take part as ‗chaperon‘ in giving guidance and support needed in terms of
technics and academic than actually solving the problem.
7) The Royal initiative of the ‗Philosophy of Sufficiency Economy‘ by His Majesty King
Bhumibol Adulyadej needs to be put into practice as much and as fast as possible.
With this, poverty will absolutely be demolished for good. Under the ‗Philosophy of
Sufficiency Economy‘, HM King Bhumibol guides us to focus on two important
aspects which are people and environment in terms of human ecology. For ‗people‘
aspect, He guides us to stress on building contentment, unity, awareness and
conscience, making use of local wisdom, and being generous to each other. As for
‗environment‘, He guides us to create biodiversity in the rural area and to give
importance to the carrying capacity
8) For the rural society, development plan from public sector should focus on
fundamental needs such as education, hygiene, and work skill. Development activity
and project should avoid stimulating or influencing the rural population to become
materialism or consumerism. On the contrary, the development activity and project
should target on blending human in with the rural environment. Focus on local
wisdom and reinforce sufficiency economy with humility
Over-all Conclusion:
After considering the findings of the study, both quantitative and qualitative, there appears
to be a close relationship between the following variables: the country‘s tourism policy,
poverty status or condition of a particular locality, sustainable livelihood programs being
implemented in the community and assets of the people living in the community.
Accordingly, if the tourism policy of the country or a locality is geared towards
pro-poor, facilitative of pro-poor initiatives or the eventual improvement of the well-being
of the poor through tourism activities, it can definitely alleviate poverty.
284
Poverty is generally considered as a social disease. It is something that everybody
does not want to happen in his or her life. If it persists and is left unabated, it can pose
serious threats to security, as crime rates will go up. If crime does rise, it will become a
restraining or a ‗pull-down‘ factor to investors wanting to pour in their capital. If there are
no investors in any locality for that matter, the economic condition, as expected, will
stagnate. If the invested funds are used according to their purpose, they can definitely
benefit the community or the market. In the eventual end, the consumers are greatly
benefited.
If livelihood activities like eco-tourism or rural tourism in the chosen locality or the
country are sustained, then it cannot just benefit the present generation, but must serve
future generations as well. Thus, assets of whatever form and kind will continue to
expand.
Government intervention and support is equally important in the equation. At any
given time, the government must be around for regulatory purposes. If the absence of a
regulatory body is quite noticeable, abuses might ensue which can be detrimental to the
consumers. Even more there could be factors needing improvement on the part of
government, such as a presence for streamlined operations, less bureaucracy, efficient
processes and clear demarcation lines for the authorities and responsibility so that harmony
can be achieved.
In the process, however, there may be other things to facilitate or hinder growth and
development. It is just a matter of identifying which factor influences or facilitates which
component. With that, weak points can easily be identified and remedied.
Despite this, tourism continues to be prioritised as a key development option for
economies stimulation. It is a trade off between cultural richness, authentic culture, real
nature or electricity and infrastructure that comes with development
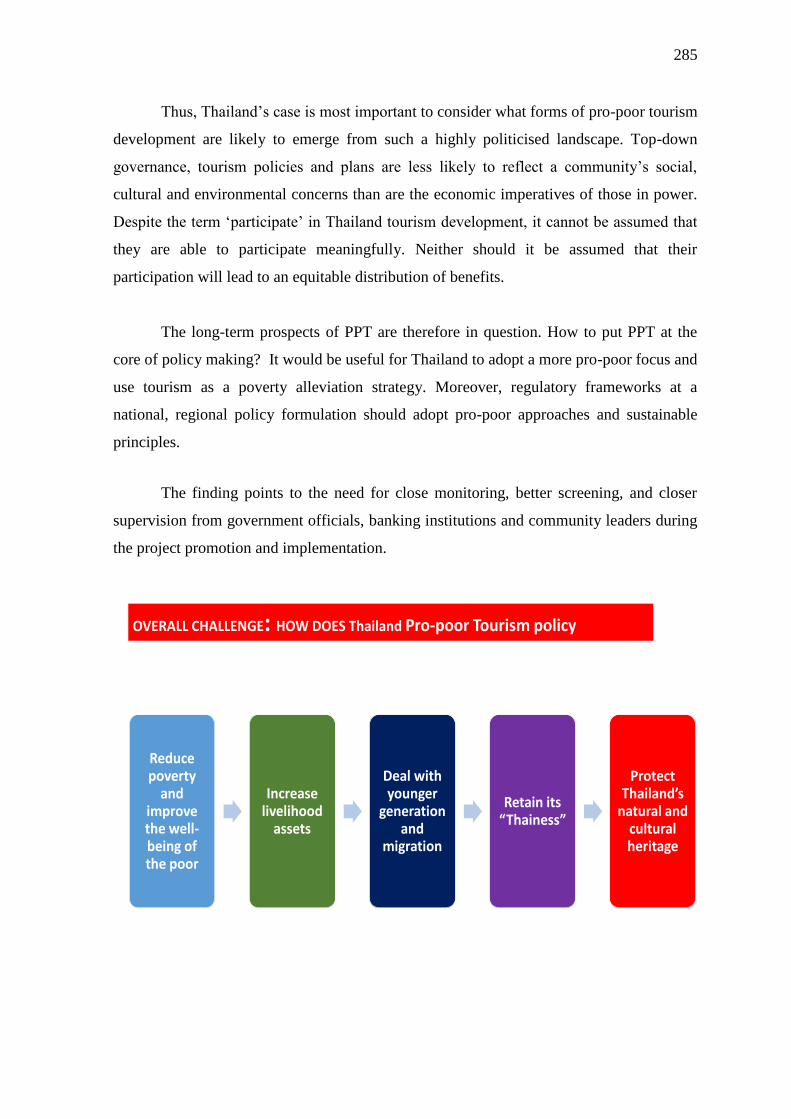
285
Thus, Thailand‘s case is most important to consider what forms of pro-poor tourism
development are likely to emerge from such a highly politicised landscape. Top-down
governance, tourism policies and plans are less likely to reflect a community‘s social,
cultural and environmental concerns than are the economic imperatives of those in power.
Despite the term ‗participate‘ in Thailand tourism development, it cannot be assumed that
they are able to participate meaningfully. Neither should it be assumed that their
participation will lead to an equitable distribution of benefits.
The long-term prospects of PPT are therefore in question. How to put PPT at the
core of policy making? It would be useful for Thailand to adopt a more pro-poor focus and
use tourism as a poverty alleviation strategy. Moreover, regulatory frameworks at a
national, regional policy formulation should adopt pro-poor approaches and sustainable
principles.
The finding points to the need for close monitoring, better screening, and closer
supervision from government officials, banking institutions and community leaders during
the project promotion and implementation.
Reduce poverty
and improve the well-being of the poor
Increase livelihood
assets
Deal with younger
generation and
migration
Retain its “Thainess”
Protect Thailand’s
natural and cultural heritage
OVERALL CHALLENGE: HOW DOES Thailand Pro-poor Tourism policy
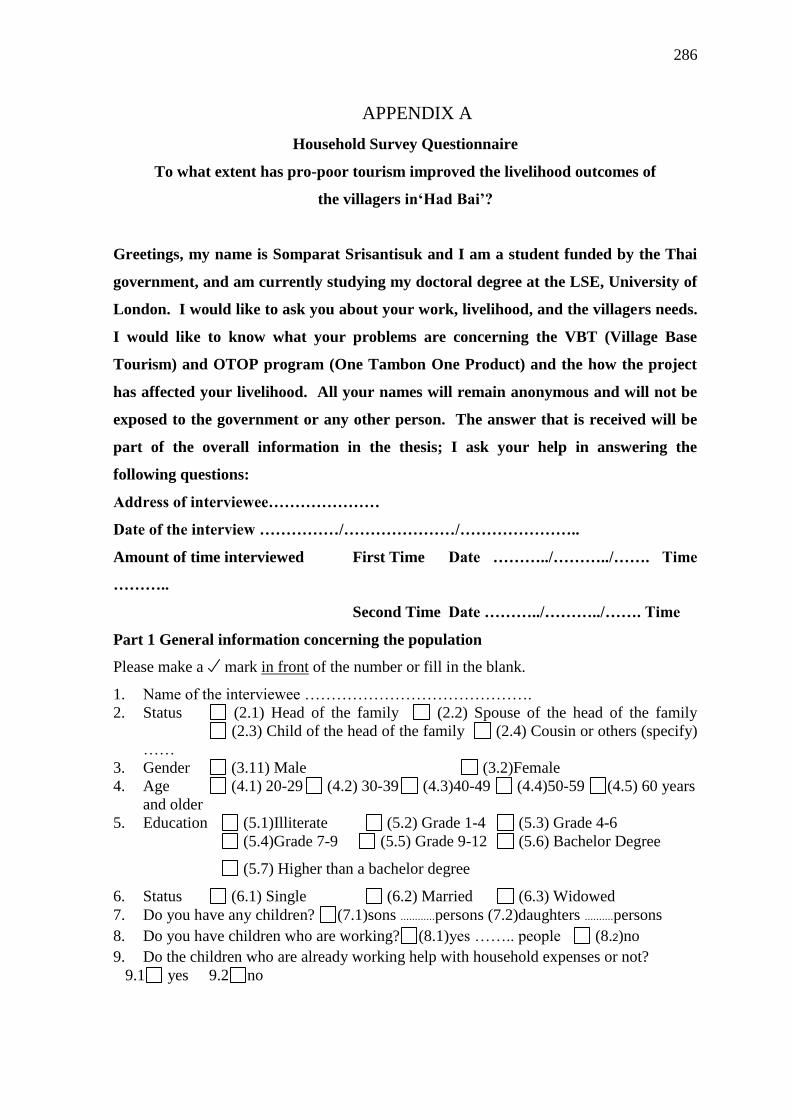
286
APPENDIX A
Household Survey Questionnaire
To what extent has pro-poor tourism improved the livelihood outcomes of
the villagers in‗Had Bai‘?
Greetings, my name is Somparat Srisantisuk and I am a student funded by the Thai
government, and am currently studying my doctoral degree at the LSE, University of
London. I would like to ask you about your work, livelihood, and the villagers needs.
I would like to know what your problems are concerning the VBT (Village Base
Tourism) and OTOP program (One Tambon One Product) and the how the project
has affected your livelihood. All your names will remain anonymous and will not be
exposed to the government or any other person. The answer that is received will be
part of the overall information in the thesis; I ask your help in answering the
following questions:
Address of interviewee…………………
Date of the interview ……………/…………………/…………………..
Amount of time interviewed First Time Date ………../………../……. Time
………..
Second Time Date ………../………../……. Time
Part 1 General information concerning the population
Please make a mark in front of the number or fill in the blank.
1. Name of the interviewee …………………………………….
2. Status (2.1) Head of the family (2.2) Spouse of the head of the family
(2.3) Child of the head of the family (2.4) Cousin or others (specify)
……
3. Gender (3.11) Male (3.2)Female
4. Age (4.1) 20-29 (4.2) 30-39 (4.3)40-49 (4.4)50-59 (4.5) 60 years
and older
5. Education (5.1)Illiterate (5.2) Grade 1-4 (5.3) Grade 4-6
(5.4)Grade 7-9 (5.5) Grade 9-12 (5.6) Bachelor Degree
(5.7) Higher than a bachelor degree
6. Status (6.1) Single (6.2) Married (6.3) Widowed
7. Do you have any children? (7.1)sons ............persons (7.2)daughters ..........persons
8. Do you have children who are working? (8.1)yes …….. people (8.2)no 9. Do the children who are already working help with household expenses or not?
9.1 yes 9.2 no
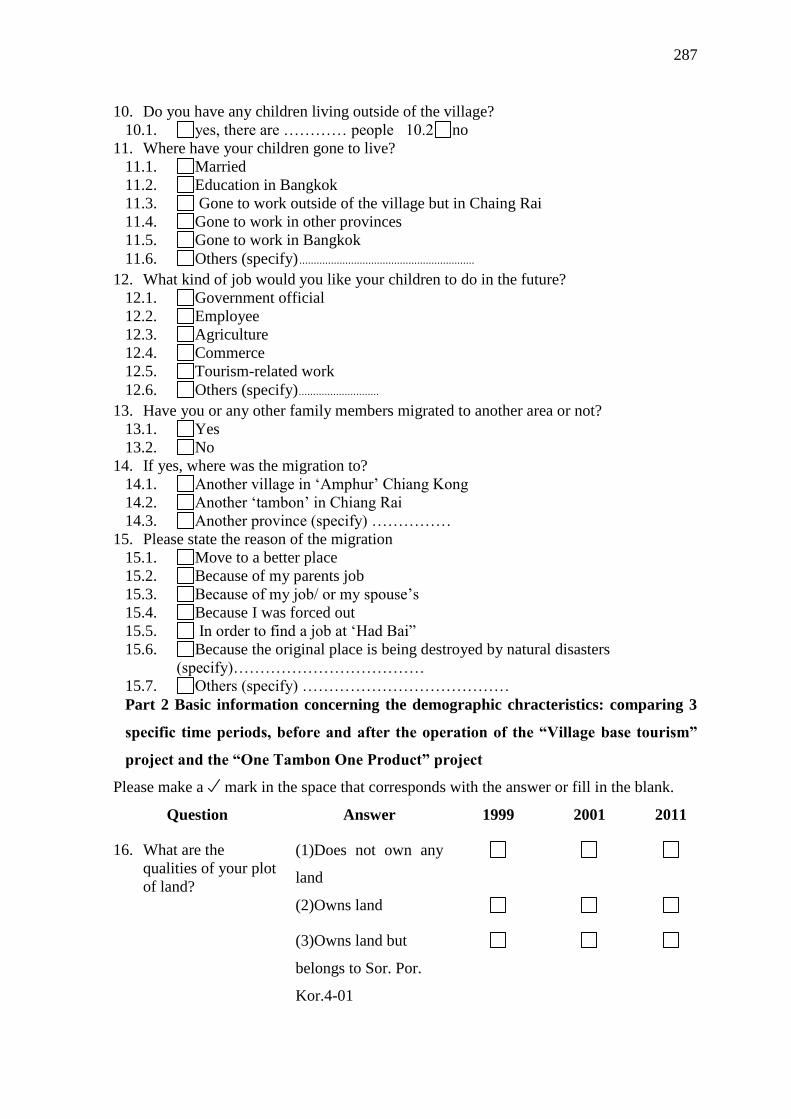
287
10. Do you have any children living outside of the village?
10.1. yes, there are ………… people 10.2 no
11. Where have your children gone to live?
11.1. Married
11.2. Education in Bangkok
11.3. Gone to work outside of the village but in Chaing Rai
11.4. Gone to work in other provinces
11.5. Gone to work in Bangkok
11.6. Others (specify) ............................................................. 12. What kind of job would you like your children to do in the future?
12.1. Government official
12.2. Employee
12.3. Agriculture
12.4. Commerce
12.5. Tourism-related work
12.6. Others (specify)............................ 13. Have you or any other family members migrated to another area or not?
13.1. Yes
13.2. No
14. If yes, where was the migration to?
14.1. Another village in ‗Amphur‘ Chiang Kong
14.2. Another ‗tambon‘ in Chiang Rai
14.3. Another province (specify) ……………
15. Please state the reason of the migration
15.1. Move to a better place
15.2. Because of my parents job
15.3. Because of my job/ or my spouse‘s
15.4. Because I was forced out
15.5. In order to find a job at ‗Had Bai‖
15.6. Because the original place is being destroyed by natural disasters
(specify)………………………………
15.7. Others (specify) …………………………………
Part 2 Basic information concerning the demographic chracteristics: comparing 3
specific time periods, before and after the operation of the ―Village base tourism‖
project and the ―One Tambon One Product‖ project
Please make a mark in the space that corresponds with the answer or fill in the blank.
Question Answer 1999 2001 2011
16. What are the
qualities of your plot
of land?
(1)Does not own any
land
(2)Owns land
(3)Owns land but
belongs to Sor. Por.
Kor.4-01
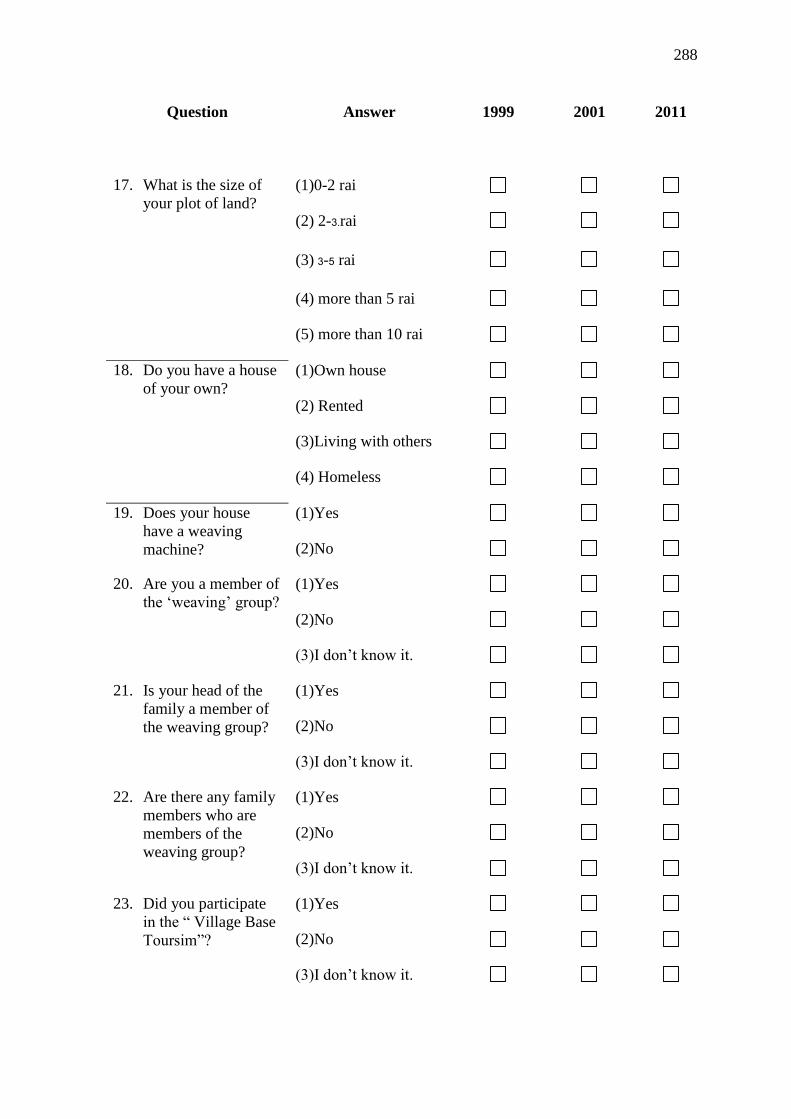
288
Question Answer 1999 2001 2011
17. What is the size of
your plot of land?
(1)0-2 rai
(2) 2-3.rai
(3) 3-5 rai
(4) more than 5 rai
(5) more than 10 rai
18. Do you have a house
of your own? (1)Own house
(2) Rented
(3)Living with others
(4) Homeless
19. Does your house
have a weaving
machine?
(1)Yes
(2)No
20. Are you a member of
the ‗weaving‘ group? (1)Yes
(2)No
(3)I don‘t know it.
21. Is your head of the
family a member of
the weaving group?
(1)Yes
(2)No
(3)I don‘t know it.
22. Are there any family
members who are
members of the
weaving group?
(1)Yes
(2)No
(3)I don‘t know it.
23. Did you participate
in the ― Village Base
Toursim‖?
(1)Yes
(2)No
(3)I don‘t know it.
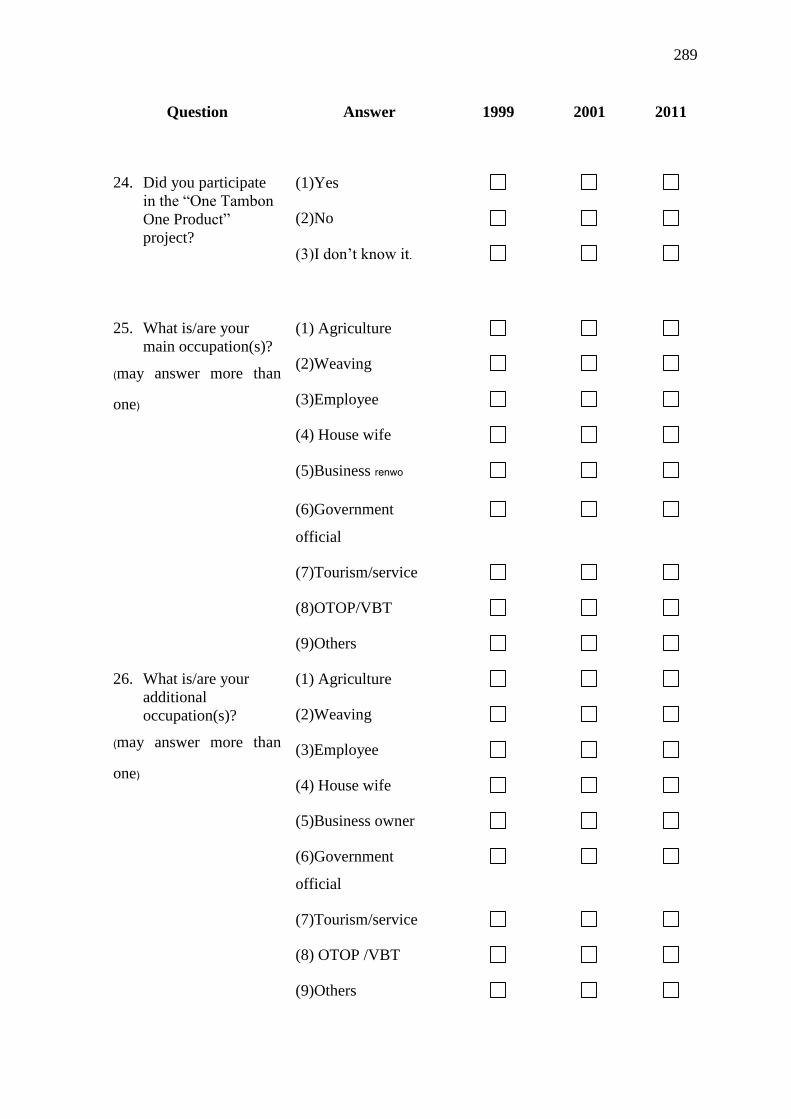
289
Question Answer 1999 2001 2011
24. Did you participate
in the ―One Tambon
One Product‖
project?
(1)Yes
(2)No
(3)I don‘t know it.
25. What is/are your
main occupation(s)?
(may answer more than
one)
(1) Agriculture
(2)Weaving
(3)Employee
(4) House wife
(5)Business renwo
(6)Government
official
(7)Tourism/service
(8)OTOP/VBT
(9)Others
26. What is/are your
additional
occupation(s)?
(may answer more than
one)
(1) Agriculture
(2)Weaving
(3)Employee
(4) House wife
(5)Business owner
(6)Government
official
(7)Tourism/service
(8) OTOP /VBT
(9)Others
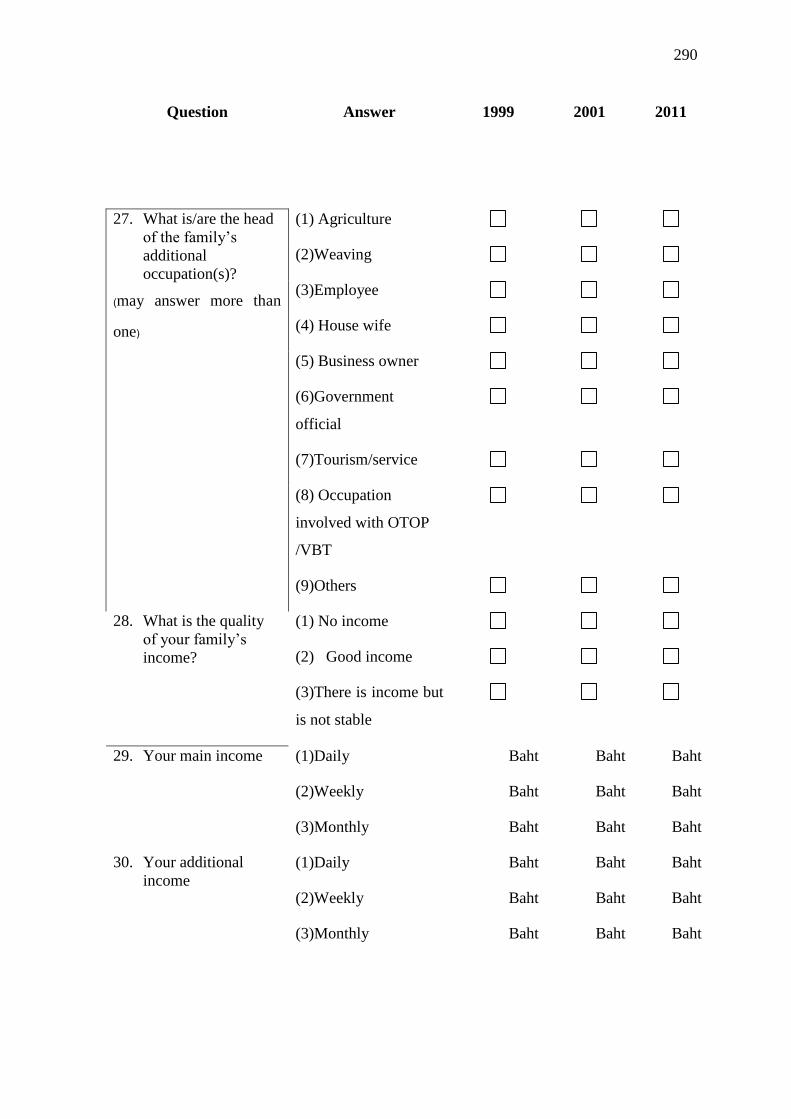
290
Question Answer 1999 2001 2011
27. What is/are the head
of the family‘s
additional
occupation(s)?
(may answer more than
one)
(1) Agriculture
(2)Weaving
(3)Employee
(4) House wife
(5) Business owner
(6)Government
official
(7)Tourism/service
(8) Occupation
involved with OTOP
/VBT
(9)Others
28. What is the quality
of your family‘s
income?
(1) No income
(2) Good income
(3)There is income but
is not stable
29. Your main income (1)Daily Baht Baht Baht
(2)Weekly Baht Baht Baht
(3)Monthly Baht Baht Baht
30. Your additional
income (1)Daily Baht Baht Baht
(2)Weekly Baht Baht Baht
(3)Monthly Baht Baht Baht
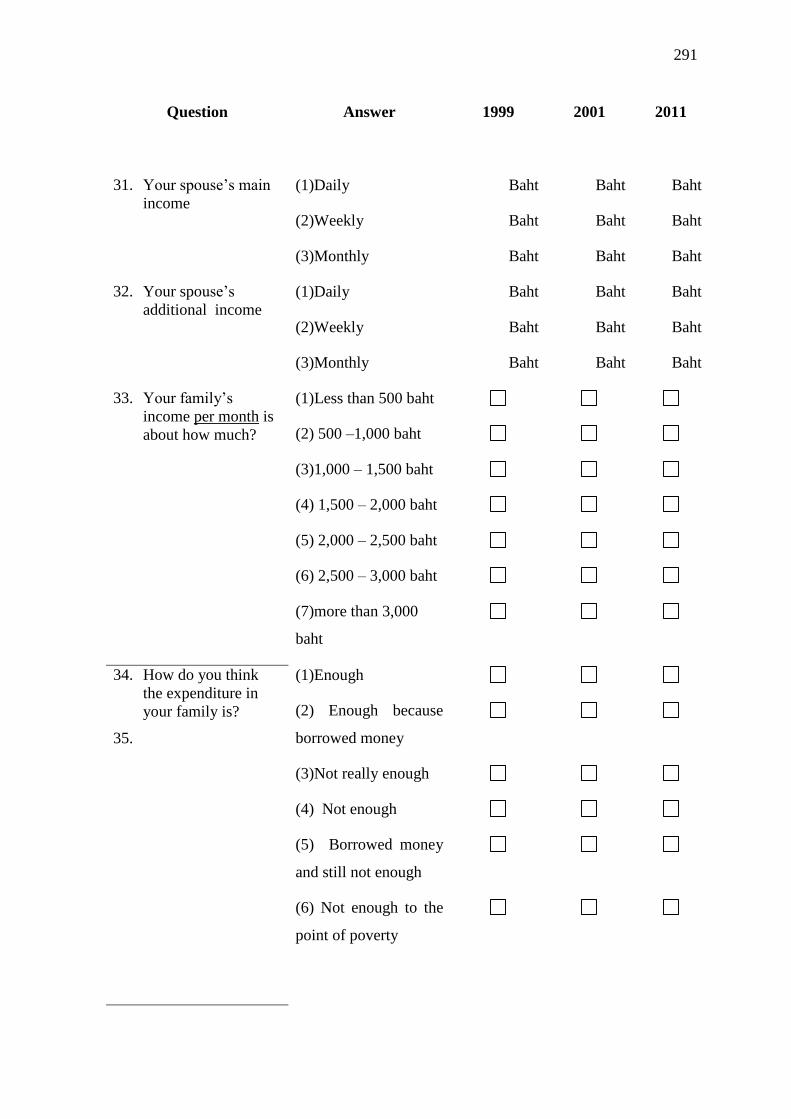
291
Question Answer 1999 2001 2011
31. Your spouse‘s main
income (1)Daily Baht Baht Baht
(2)Weekly Baht Baht Baht
(3)Monthly Baht Baht Baht
32. Your spouse‘s
additional income (1)Daily Baht Baht Baht
(2)Weekly Baht Baht Baht
(3)Monthly Baht Baht Baht
33. Your family‘s
income per month is
about how much?
(1)Less than 500 baht
(2) 500 –1,000 baht
(3)1,000 – 1,500 baht
(4) 1,500 – 2,000 baht
(5) 2,000 – 2,500 baht
(6) 2,500 – 3,000 baht
(7)more than 3,000
baht
34. How do you think
the expenditure in
your family is?
35.
(1)Enough
(2) Enough because
borrowed money
(3)Not really enough
(4) Not enough
(5) Borrowed money
and still not enough
(6) Not enough to the
point of poverty
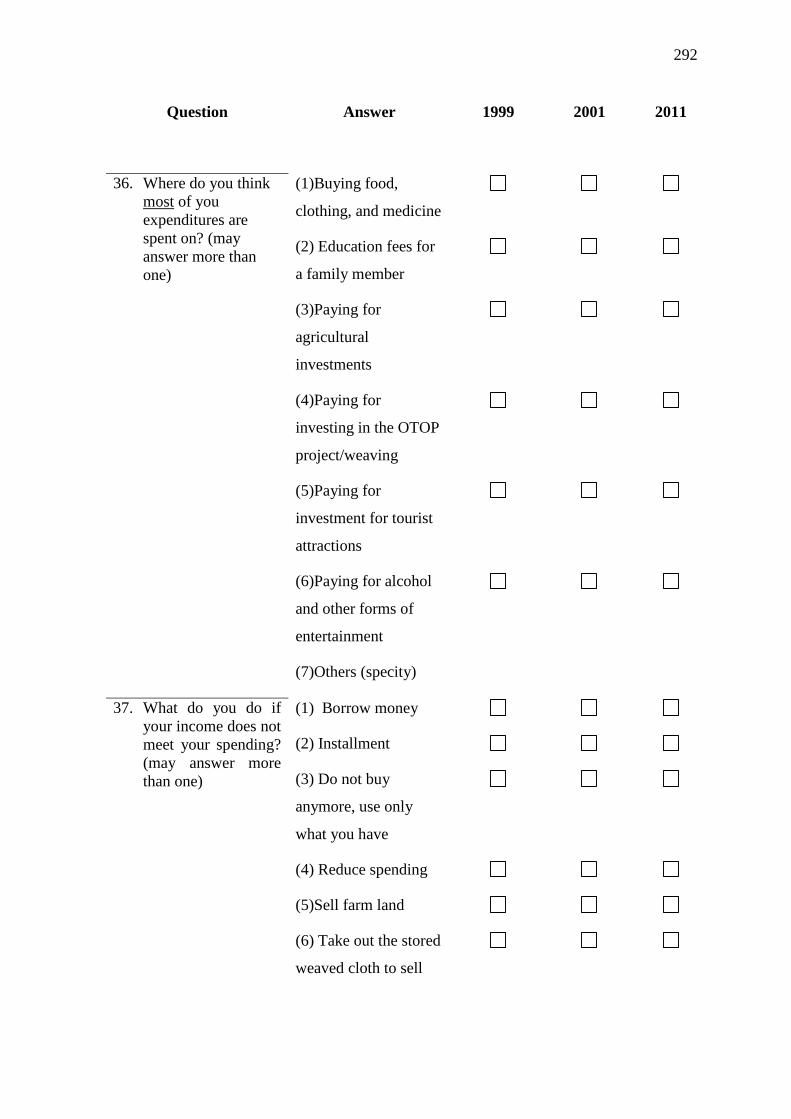
292
Question Answer 1999 2001 2011
36. Where do you think
most of you
expenditures are
spent on? (may
answer more than
one)
(1)Buying food,
clothing, and medicine
(2) Education fees for
a family member
(3)Paying for
agricultural
investments
(4)Paying for
investing in the OTOP
project/weaving
(5)Paying for
investment for tourist
attractions
(6)Paying for alcohol
and other forms of
entertainment
(7)Others (specity)
37. What do you do if
your income does not
meet your spending?
(may answer more
than one)
(1) Borrow money
(2) Installment
(3) Do not buy
anymore, use only
what you have
(4) Reduce spending
(5)Sell farm land
(6) Take out the stored
weaved cloth to sell
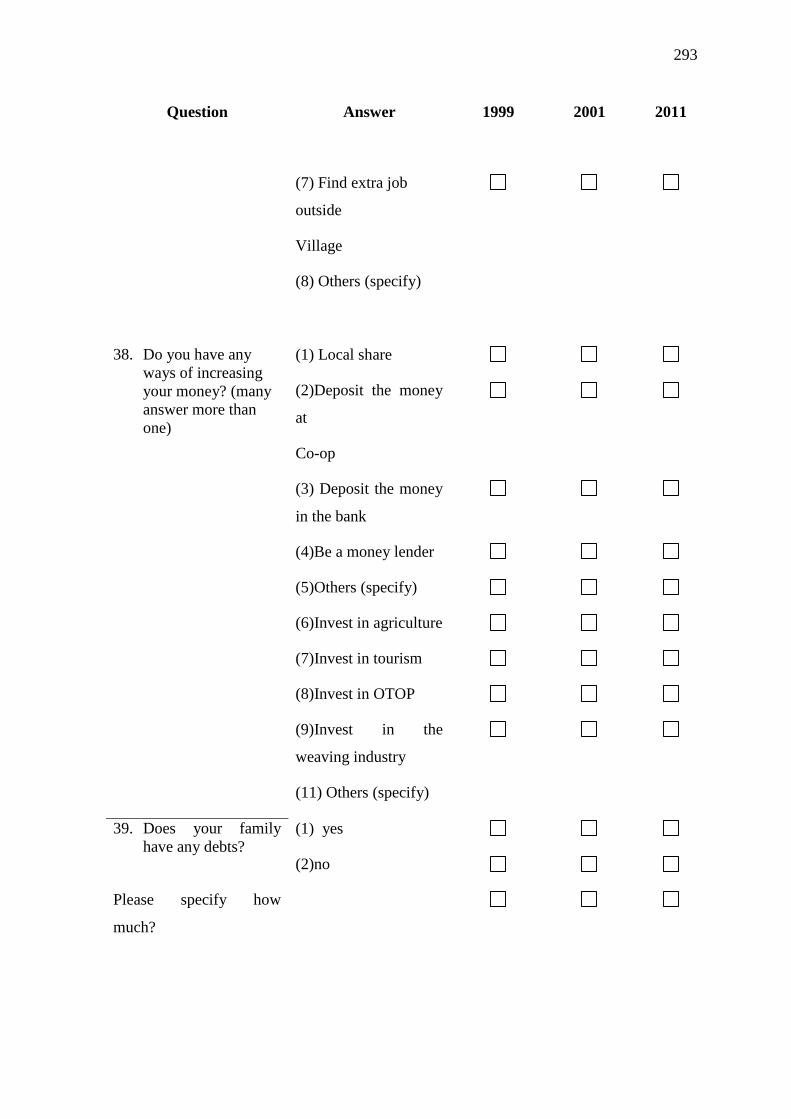
293
Question Answer 1999 2001 2011
(7) Find extra job
outside
Village
(8) Others (specify)
38. Do you have any
ways of increasing
your money? (many
answer more than
one)
(1) Local share
(2)Deposit the money
at
Co-op
(3) Deposit the money
in the bank
(4)Be a money lender
(5)Others (specify)
(6)Invest in agriculture
(7)Invest in tourism
(8)Invest in OTOP
(9)Invest in the
weaving industry
(11) Others (specify)
39. Does your family
have any debts?
(1) yes
(2)no
Please specify how
much?
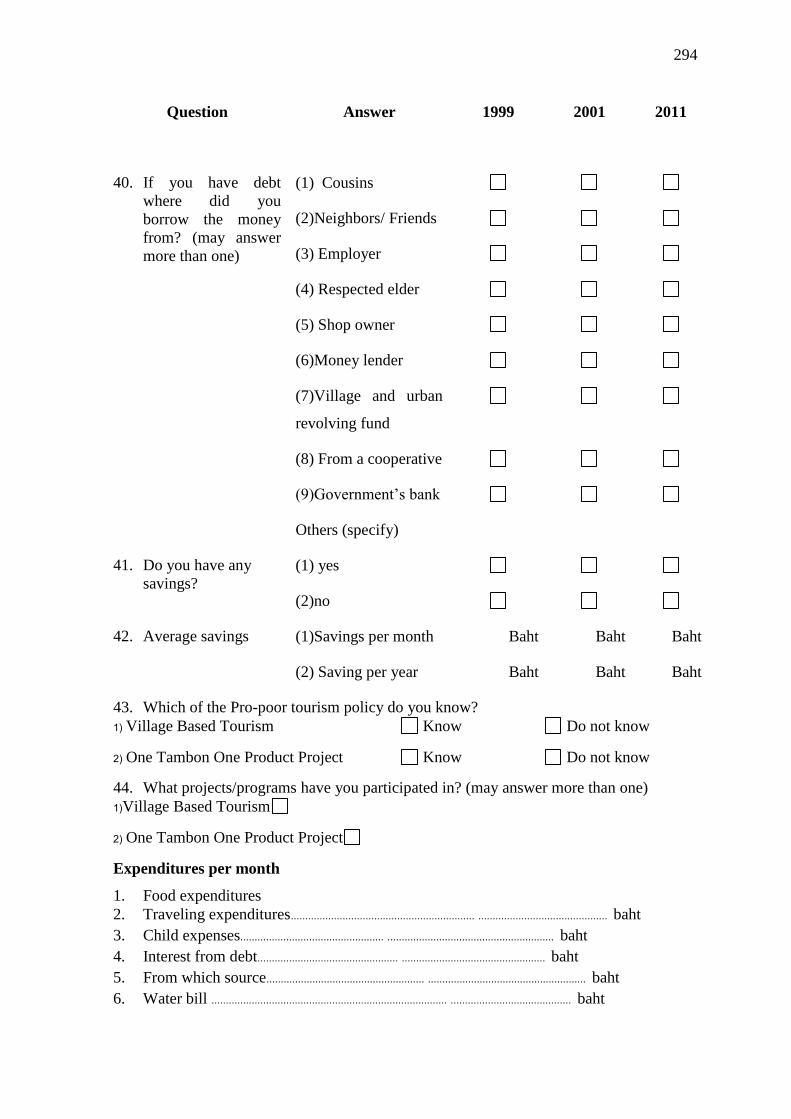
294
Question Answer 1999 2001 2011
40. If you have debt
where did you
borrow the money
from? (may answer
more than one)
(1) Cousins
(2)Neighbors/ Friends
(3) Employer
(4) Respected elder
(5) Shop owner
(6)Money lender
(7)Village and urban
revolving fund
(8) From a cooperative
(9)Government‘s bank
Others (specify)
41. Do you have any
savings?
(1) yes
(2)no
42. Average savings (1)Savings per month Baht Baht Baht
(2) Saving per year Baht Baht Baht
43. Which of the Pro-poor tourism policy do you know?
1) Village Based Tourism Know Do not know
2) One Tambon One Product Project Know Do not know
44. What projects/programs have you participated in? (may answer more than one)
1)Village Based Tourism
2) One Tambon One Product Project
Expenditures per month
1. Food expenditures
2. Traveling expenditures................................................................ ............................................. baht
3. Child expenses.................................................. .......................................................... baht
4. Interest from debt................................................. .................................................. baht
5. From which source....................................................... ....................................................... baht
6. Water bill .................................................................................. .......................................... baht
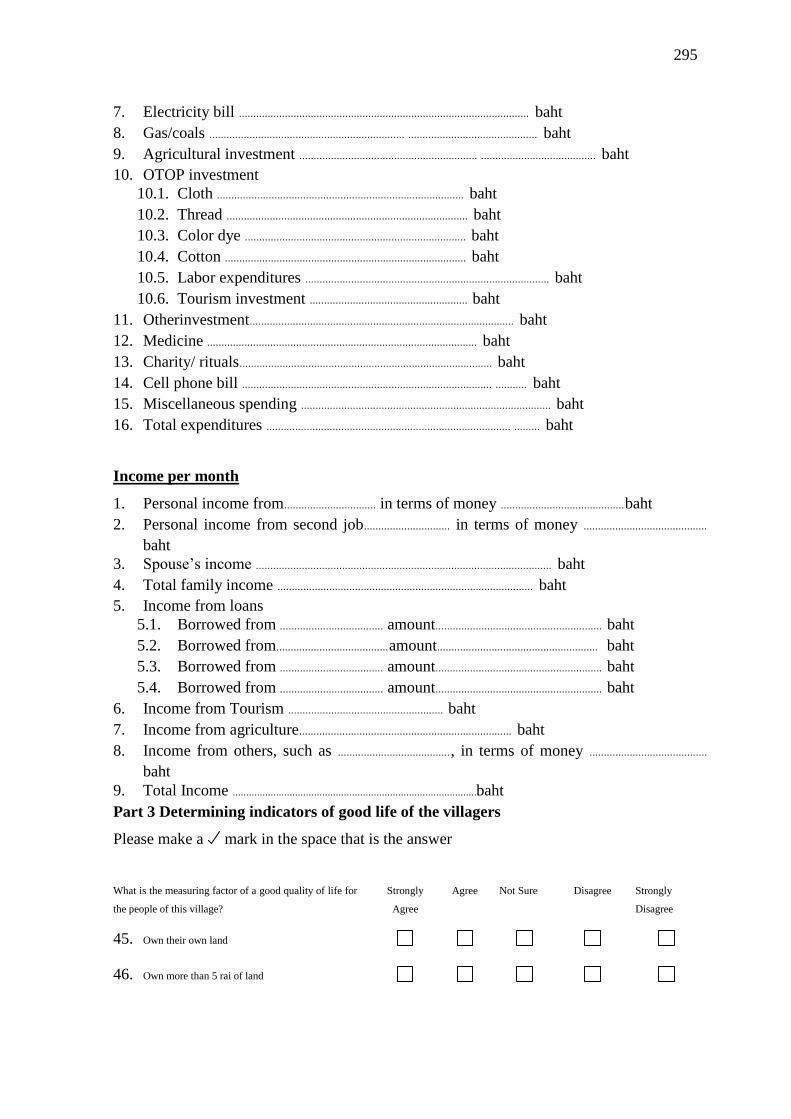
295
7. Electricity bill ..................................................................................................... baht
8. Gas/coals .................................................................... ............................................. baht
9. Agricultural investment .............................................................. ........................................ baht
10. OTOP investment
10.1. Cloth ...................................................................................... baht
10.2. Thread .................................................................................... baht
10.3. Color dye ............................................................................. baht
10.4. Cotton .................................................................................... baht
10.5. Labor expenditures ..................................................................................... baht
10.6. Tourism investment ....................................................... baht
11. Otherinvestment............................................................................................ baht
12. Medicine .............................................................................................. baht
13. Charity/ rituals........................................................................................ baht
14. Cell phone bill ....................................................................................... ........... baht
15. Miscellaneous spending ....................................................................................... baht
16. Total expenditures ..................................................................................... ......... baht
Income per month
1. Personal income from................................ in terms of money ...........................................baht
2. Personal income from second job.............................. in terms of money ........................................... baht
3. Spouse‘s income ....................................................................................................... baht
4. Total family income ......................................................................................... baht
5. Income from loans
5.1. Borrowed from .................................... amount.......................................................... baht
5.2. Borrowed from.......................................amount........................................................ baht
5.3. Borrowed from .................................... amount.......................................................... baht
5.4. Borrowed from .................................... amount.......................................................... baht
6. Income from Tourism ...................................................... baht
7. Income from agriculture.......................................................................... baht
8. Income from others, such as ......................................., in terms of money ......................................... baht
9. Total Income ........................................................................................... baht
Part 3 Determining indicators of good life of the villagers
Please make a mark in the space that is the answer
What is the measuring factor of a good quality of life for
the people of this village?
Strongly
Agree
Agree Not Sure Disagree Strongly
Disagree
45. Own their own land
46. Own more than 5 rai of land
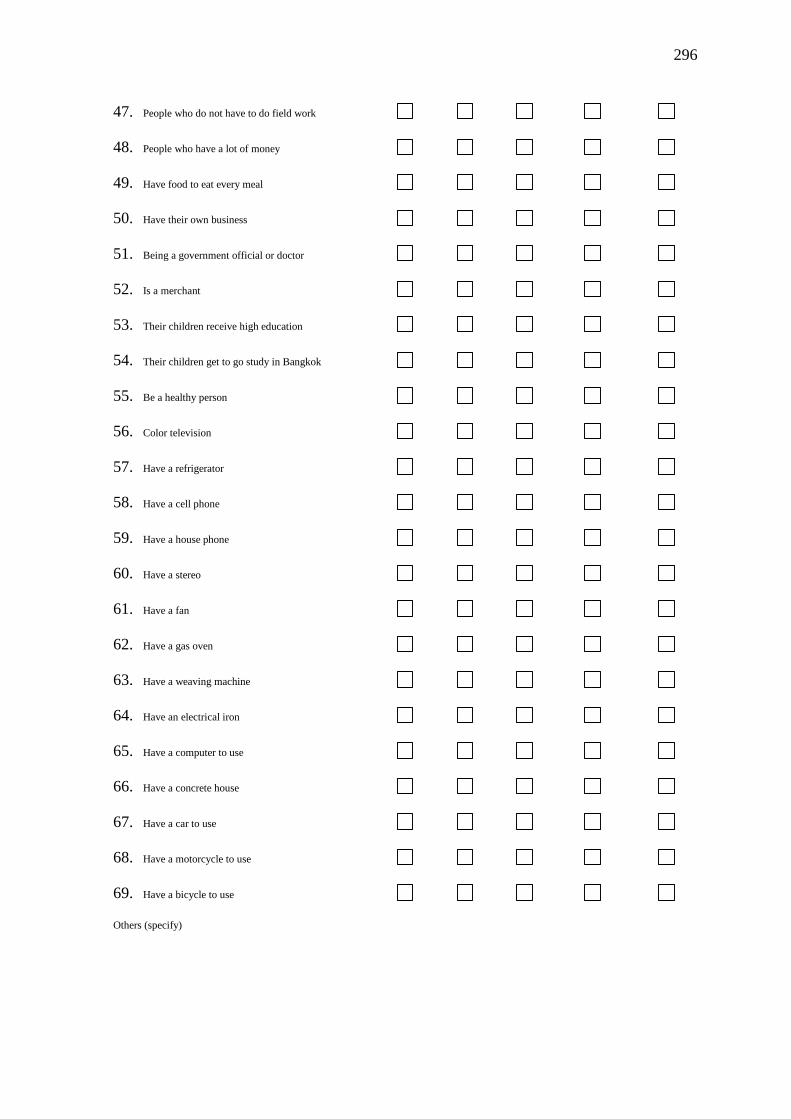
296
47. People who do not have to do field work
48. People who have a lot of money
49. Have food to eat every meal
50. Have their own business
51. Being a government official or doctor
52. Is a merchant
53. Their children receive high education
54. Their children get to go study in Bangkok
55. Be a healthy person
56. Color television
57. Have a refrigerator
58. Have a cell phone
59. Have a house phone
60. Have a stereo
61. Have a fan
62. Have a gas oven
63. Have a weaving machine
64. Have an electrical iron
65. Have a computer to use
66. Have a concrete house
67. Have a car to use
68. Have a motorcycle to use
69. Have a bicycle to use
Others (specify)
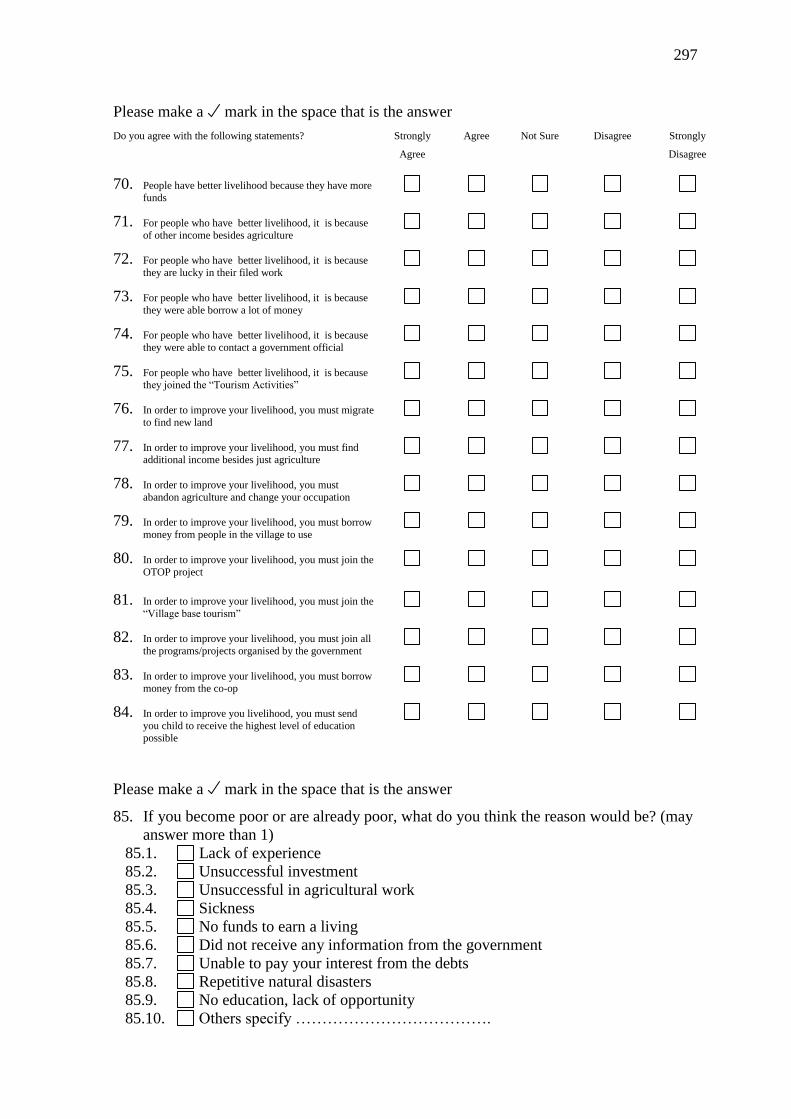
297
Please make a mark in the space that is the answer
Do you agree with the following statements? Strongly
Agree Agree Not Sure Disagree Strongly
Disagree
70. People have better livelihood because they have more
funds
71. For people who have better livelihood, it is because
of other income besides agriculture
72. For people who have better livelihood, it is because
they are lucky in their filed work
73. For people who have better livelihood, it is because
they were able borrow a lot of money
74. For people who have better livelihood, it is because
they were able to contact a government official
75. For people who have better livelihood, it is because they joined the ―Tourism Activities‖
76. In order to improve your livelihood, you must migrate
to find new land
77. In order to improve your livelihood, you must find additional income besides just agriculture
78. In order to improve your livelihood, you must
abandon agriculture and change your occupation
79. In order to improve your livelihood, you must borrow
money from people in the village to use
80. In order to improve your livelihood, you must join the
OTOP project
81. In order to improve your livelihood, you must join the
―Village base tourism‖
82. In order to improve your livelihood, you must join all
the programs/projects organised by the government
83. In order to improve your livelihood, you must borrow
money from the co-op
84. In order to improve you livelihood, you must send
you child to receive the highest level of education
possible
Please make a mark in the space that is the answer
85. If you become poor or are already poor, what do you think the reason would be? (may
answer more than 1)
85.1. Lack of experience
85.2. Unsuccessful investment
85.3. Unsuccessful in agricultural work
85.4. Sickness
85.5. No funds to earn a living
85.6. Did not receive any information from the government
85.7. Unable to pay your interest from the debts
85.8. Repetitive natural disasters
85.9. No education, lack of opportunity
85.10. Others specify ……………………………….
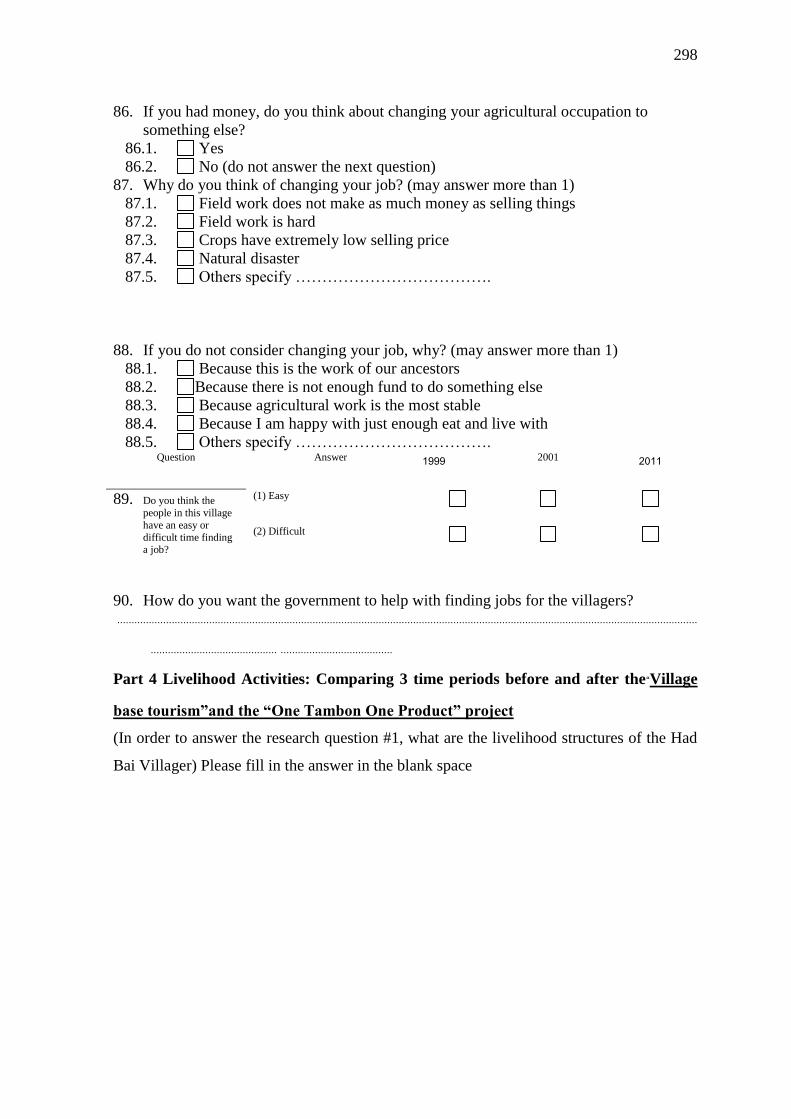
298
86. If you had money, do you think about changing your agricultural occupation to
something else?
86.1. Yes
86.2. No (do not answer the next question)
87. Why do you think of changing your job? (may answer more than 1)
87.1. Field work does not make as much money as selling things
87.2. Field work is hard
87.3. Crops have extremely low selling price
87.4. Natural disaster
87.5. Others specify ……………………………….
88. If you do not consider changing your job, why? (may answer more than 1)
88.1. Because this is the work of our ancestors
88.2. Because there is not enough fund to do something else
88.3. Because agricultural work is the most stable
88.4. Because I am happy with just enough eat and live with
88.5. Others specify ………………………………. Question Answer 1999 2001 2011
89. Do you think the
people in this village
have an easy or
difficult time finding a job?
(1) Easy
(2) Difficult
90. How do you want the government to help with finding jobs for the villagers? ..........................................................................................................................................................................................................
............................................ .......................................
Part 4 Livelihood Activities: Comparing 3 time periods before and after the“Village
base tourism‖and the ―One Tambon One Product‖ project
(In order to answer the research question #1, what are the livelihood structures of the Had
Bai Villager) Please fill in the answer in the blank space
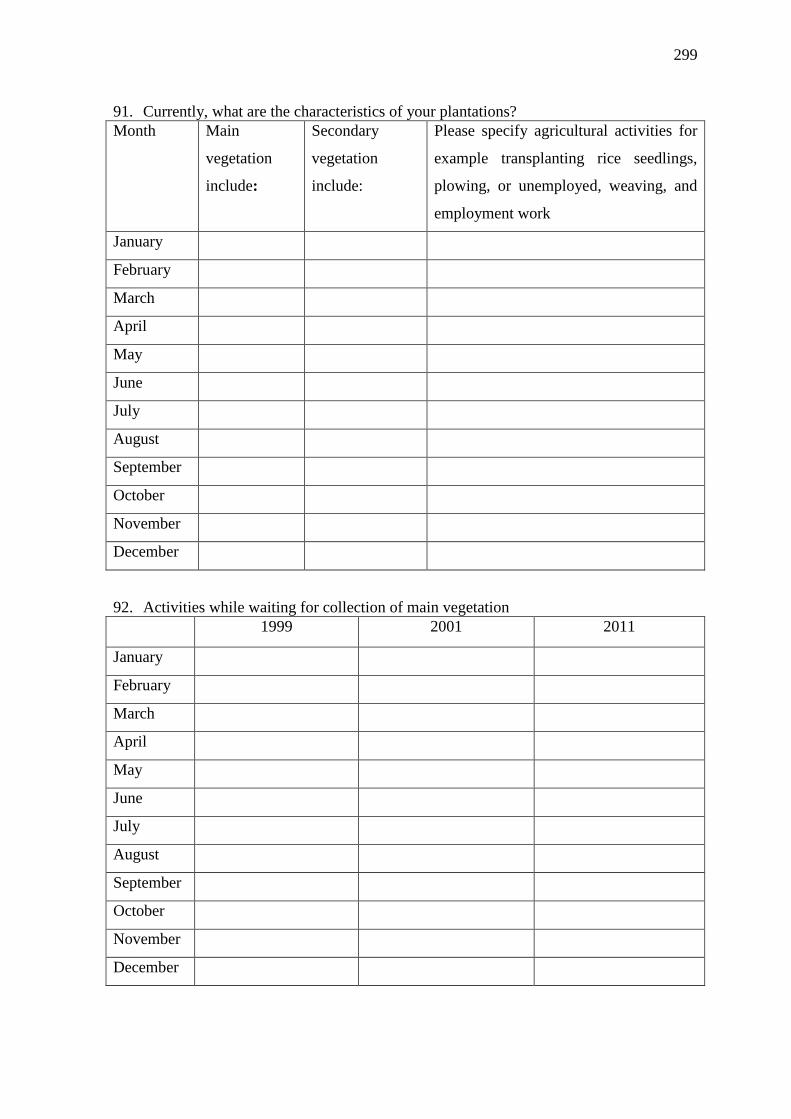
299
91. Currently, what are the characteristics of your plantations?
Month Main
vegetation
include:
Secondary
vegetation
include:
Please specify agricultural activities for
example transplanting rice seedlings,
plowing, or unemployed, weaving, and
employment work
January
February
March
April
May
June
July
August
September
October
November
December
92. Activities while waiting for collection of main vegetation
1999 2001 2011
January
February
March
April
May
June
July
August
September
October
November
December
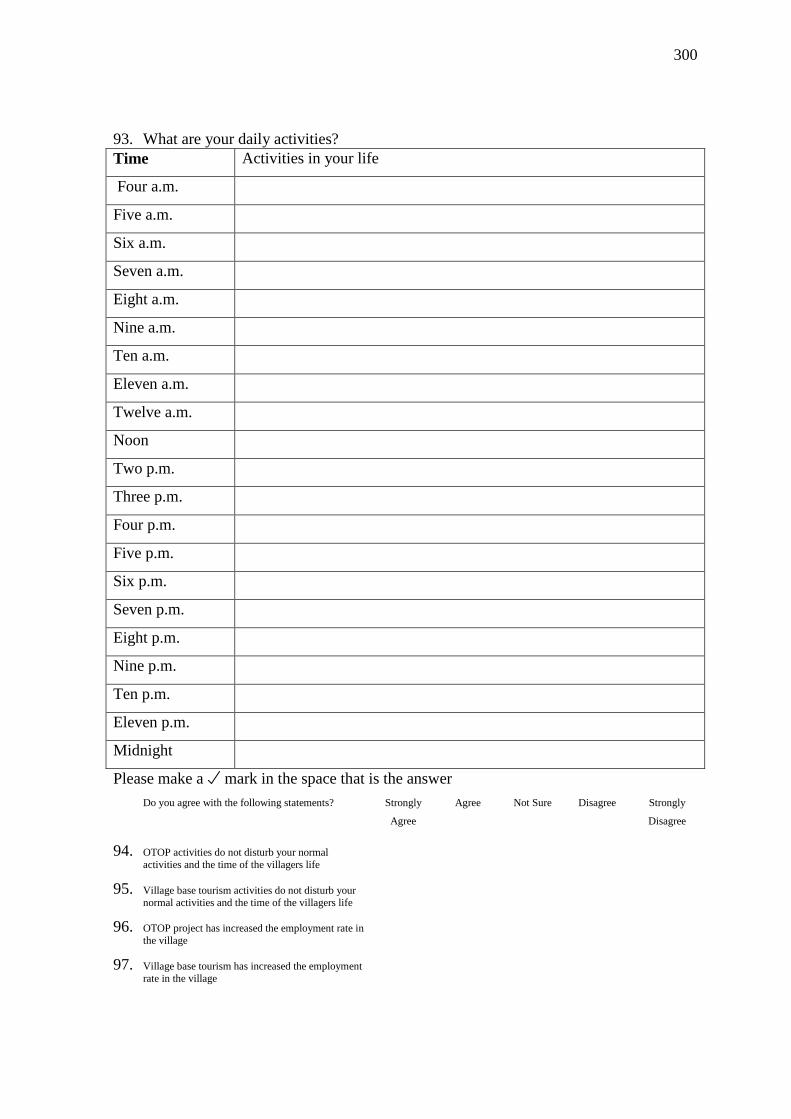
300
93. What are your daily activities?
Time Activities in your life
Four a.m.
Five a.m.
Six a.m.
Seven a.m.
Eight a.m.
Nine a.m.
Ten a.m.
Eleven a.m.
Twelve a.m.
Noon
Two p.m.
Three p.m.
Four p.m.
Five p.m.
Six p.m.
Seven p.m.
Eight p.m.
Nine p.m.
Ten p.m.
Eleven p.m.
Midnight
Please make a mark in the space that is the answer
Do you agree with the following statements? Strongly
Agree Agree Not Sure Disagree Strongly
Disagree
94. OTOP activities do not disturb your normal
activities and the time of the villagers life
95. Village base tourism activities do not disturb your
normal activities and the time of the villagers life
96. OTOP project has increased the employment rate in
the village
97. Village base tourism has increased the employment
rate in the village
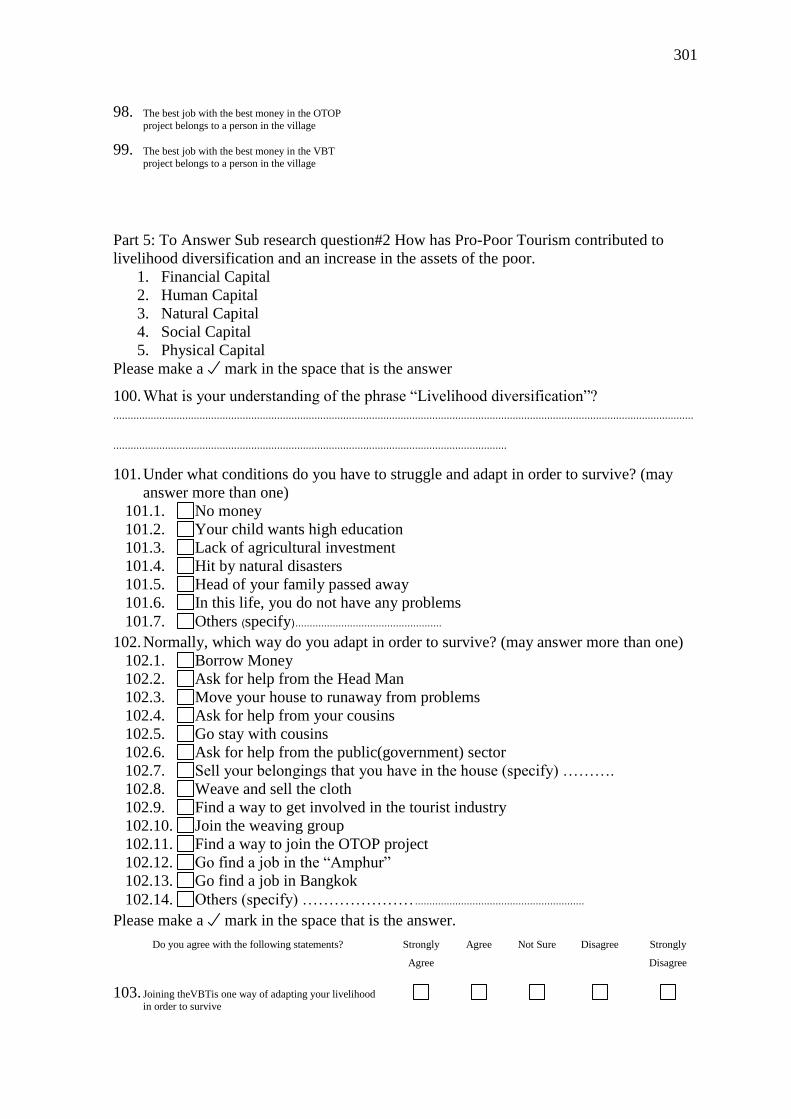
301
98. The best job with the best money in the OTOP
project belongs to a person in the village
99. The best job with the best money in the VBT
project belongs to a person in the village
Part 5: To Answer Sub research question#2 How has Pro-Poor Tourism contributed to
livelihood diversification and an increase in the assets of the poor.
1. Financial Capital
2. Human Capital
3. Natural Capital
4. Social Capital
5. Physical Capital
Please make a mark in the space that is the answer
100. What is your understanding of the phrase ―Livelihood diversification‖? ..........................................................................................................................................................................................................
.........................................................................................................................................
101. Under what conditions do you have to struggle and adapt in order to survive? (may
answer more than one)
101.1. No money
101.2. Your child wants high education
101.3. Lack of agricultural investment
101.4. Hit by natural disasters
101.5. Head of your family passed away
101.6. In this life, you do not have any problems
101.7. Others (specify)................................................... 102. Normally, which way do you adapt in order to survive? (may answer more than one)
102.1. Borrow Money
102.2. Ask for help from the Head Man
102.3. Move your house to runaway from problems
102.4. Ask for help from your cousins
102.5. Go stay with cousins
102.6. Ask for help from the public(government) sector
102.7. Sell your belongings that you have in the house (specify) ……….
102.8. Weave and sell the cloth
102.9. Find a way to get involved in the tourist industry
102.10. Join the weaving group
102.11. Find a way to join the OTOP project
102.12. Go find a job in the ―Amphur‖
102.13. Go find a job in Bangkok
102.14. Others (specify) ………………… ........................................................... Please make a mark in the space that is the answer.
Do you agree with the following statements? Strongly
Agree Agree Not Sure Disagree Strongly
Disagree
103. Joining theVBTis one way of adapting your livelihood
in order to survive
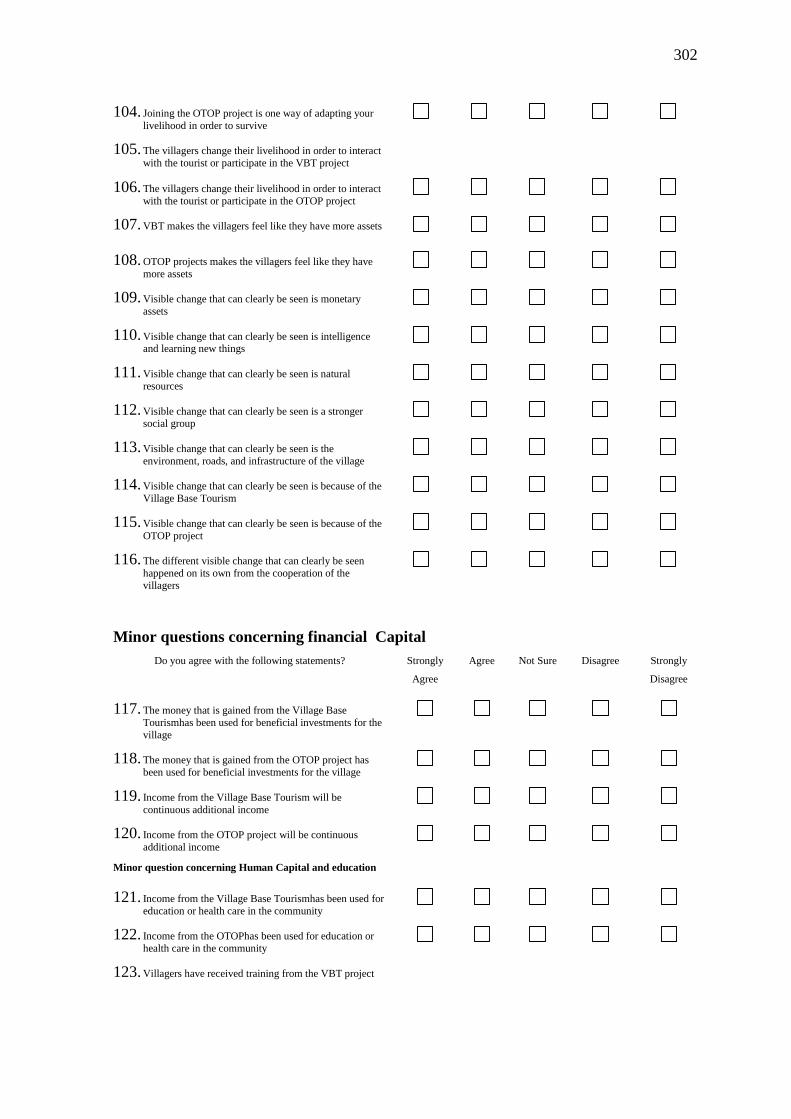
302
104. Joining the OTOP project is one way of adapting your
livelihood in order to survive
105. The villagers change their livelihood in order to interact
with the tourist or participate in the VBT project
106. The villagers change their livelihood in order to interact
with the tourist or participate in the OTOP project
107. VBT makes the villagers feel like they have more assets
108. OTOP projects makes the villagers feel like they have
more assets
109. Visible change that can clearly be seen is monetary
assets
110. Visible change that can clearly be seen is intelligence and learning new things
111. Visible change that can clearly be seen is natural
resources
112. Visible change that can clearly be seen is a stronger social group
113. Visible change that can clearly be seen is the
environment, roads, and infrastructure of the village
114. Visible change that can clearly be seen is because of the
Village Base Tourism
115. Visible change that can clearly be seen is because of the
OTOP project
116. The different visible change that can clearly be seen
happened on its own from the cooperation of the
villagers
Minor questions concerning financial Capital
Do you agree with the following statements? Strongly
Agree Agree Not Sure Disagree Strongly
Disagree
117. The money that is gained from the Village Base
Tourismhas been used for beneficial investments for the
village
118. The money that is gained from the OTOP project has
been used for beneficial investments for the village
119. Income from the Village Base Tourism will be
continuous additional income
120. Income from the OTOP project will be continuous
additional income
Minor question concerning Human Capital and education
121. Income from the Village Base Tourismhas been used for
education or health care in the community
122. Income from the OTOPhas been used for education or
health care in the community
123. Villagers have received training from the VBT project
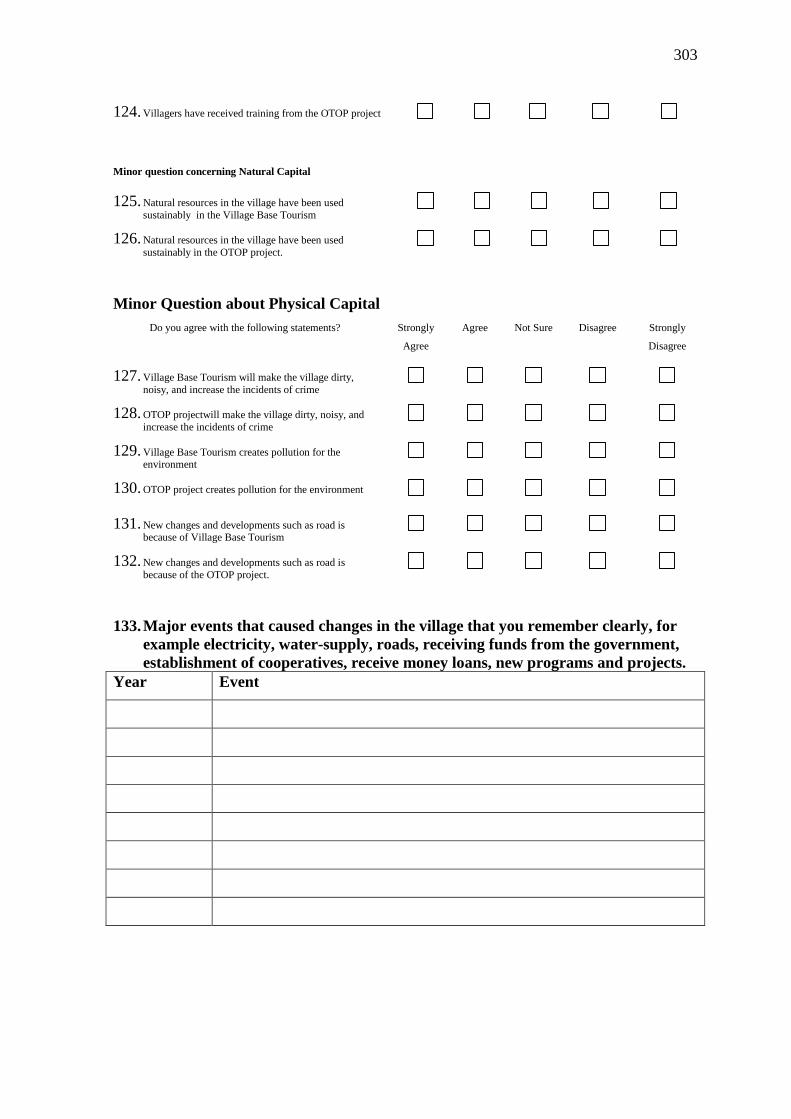
303
124. Villagers have received training from the OTOP project
Minor question concerning Natural Capital
125. Natural resources in the village have been used
sustainably in the Village Base Tourism
126. Natural resources in the village have been used
sustainably in the OTOP project.
Minor Question about Physical Capital
Do you agree with the following statements? Strongly
Agree Agree Not Sure Disagree Strongly
Disagree
127. Village Base Tourism will make the village dirty,
noisy, and increase the incidents of crime
128. OTOP projectwill make the village dirty, noisy, and
increase the incidents of crime
129. Village Base Tourism creates pollution for the environment
130. OTOP project creates pollution for the environment
131. New changes and developments such as road is because of Village Base Tourism
132. New changes and developments such as road is
because of the OTOP project.
133. Major events that caused changes in the village that you remember clearly, for
example electricity, water-supply, roads, receiving funds from the government,
establishment of cooperatives, receive money loans, new programs and projects.
Year Event
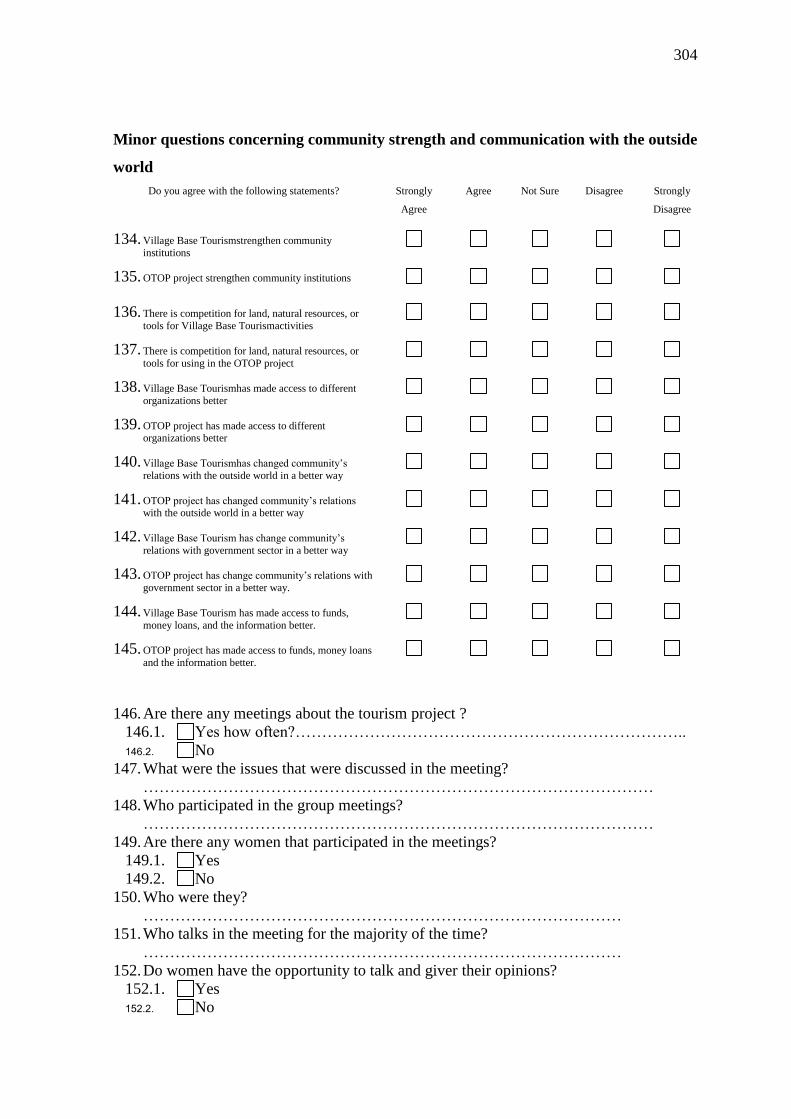
304
Minor questions concerning community strength and communication with the outside
world
Do you agree with the following statements? Strongly
Agree Agree Not Sure Disagree Strongly
Disagree
134. Village Base Tourismstrengthen community
institutions
135. OTOP project strengthen community institutions
136. There is competition for land, natural resources, or
tools for Village Base Tourismactivities
137. There is competition for land, natural resources, or
tools for using in the OTOP project
138. Village Base Tourismhas made access to different
organizations better
139. OTOP project has made access to different organizations better
140. Village Base Tourismhas changed community‘s
relations with the outside world in a better way
141. OTOP project has changed community‘s relations with the outside world in a better way
142. Village Base Tourism has change community‘s
relations with government sector in a better way
143. OTOP project has change community‘s relations with
government sector in a better way.
144. Village Base Tourism has made access to funds,
money loans, and the information better.
145. OTOP project has made access to funds, money loans
and the information better.
146. Are there any meetings about the tourism project ?
146.1. Yes how often?………………………………………………………………..
146.2. No 147. What were the issues that were discussed in the meeting?
……………………………………………………………………………………
148. Who participated in the group meetings?
……………………………………………………………………………………
149. Are there any women that participated in the meetings?
149.1. Yes
149.2. No
150. Who were they?
………………………………………………………………………………
151. Who talks in the meeting for the majority of the time?
………………………………………………………………………………
152. Do women have the opportunity to talk and giver their opinions?
152.1. Yes
152.2. No
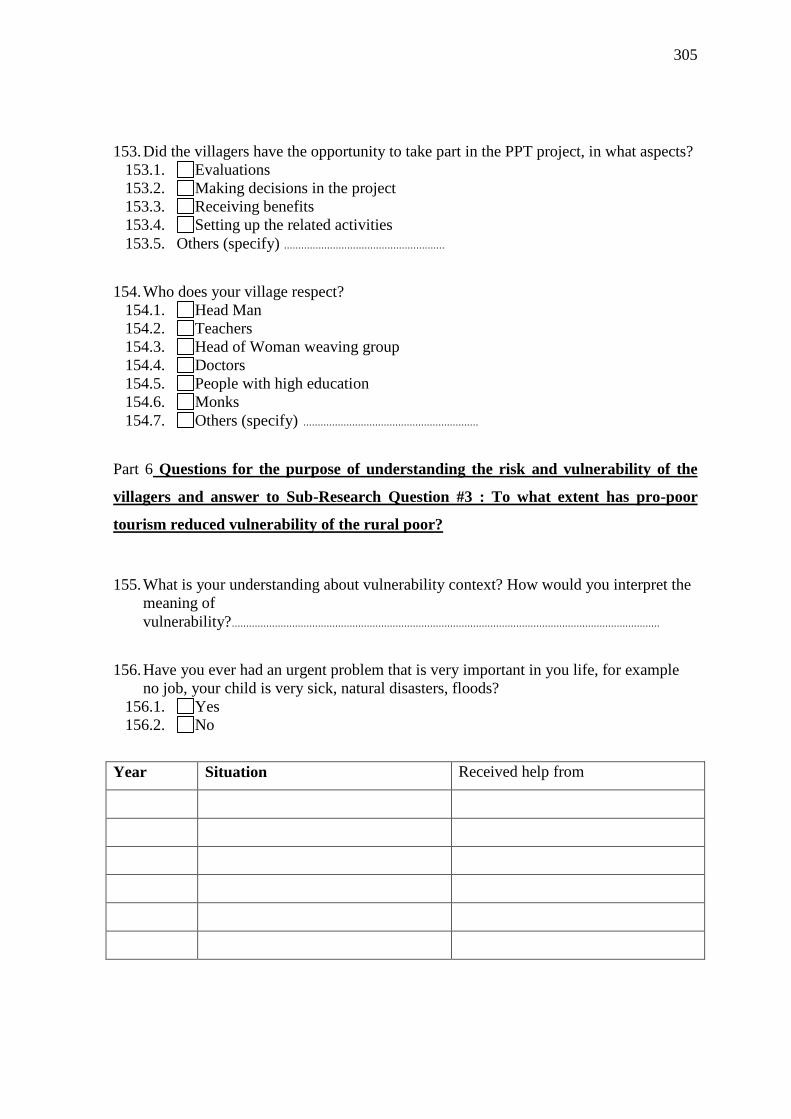
305
153. Did the villagers have the opportunity to take part in the PPT project, in what aspects?
153.1. Evaluations
153.2. Making decisions in the project
153.3. Receiving benefits
153.4. Setting up the related activities
153.5. Others (specify) ........................................................
154. Who does your village respect?
154.1. Head Man
154.2. Teachers 154.3. Head of Woman weaving group
154.4. Doctors
154.5. People with high education
154.6. Monks
154.7. Others (specify) .............................................................
Part 6 Questions for the purpose of understanding the risk and vulnerability of the
villagers and answer to Sub-Research Question #3 : To what extent has pro-poor
tourism reduced vulnerability of the rural poor?
155. What is your understanding about vulnerability context? How would you interpret the
meaning of
vulnerability?.....................................................................................................................................................
156. Have you ever had an urgent problem that is very important in you life, for example
no job, your child is very sick, natural disasters, floods?
156.1. Yes
156.2. No
Year Situation Received help from
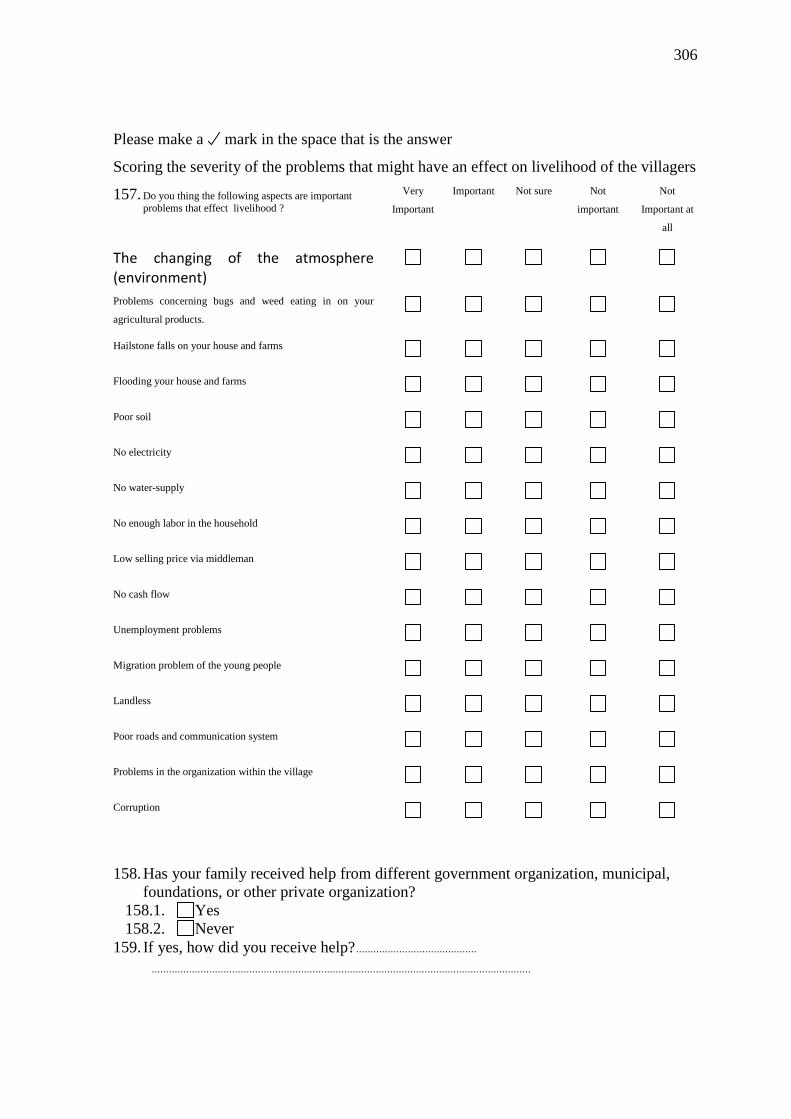
306
Please make a mark in the space that is the answer
Scoring the severity of the problems that might have an effect on livelihood of the villagers
157. Do you thing the following aspects are important
problems that effect livelihood ? Very
Important Important Not sure Not
important
Not
Important at
all
The changing of the atmosphere (environment)
Problems concerning bugs and weed eating in on your
agricultural products.
Hailstone falls on your house and farms
Flooding your house and farms
Poor soil
No electricity
No water-supply
No enough labor in the household
Low selling price via middleman
No cash flow
Unemployment problems
Migration problem of the young people
Landless
Poor roads and communication system
Problems in the organization within the village
Corruption
158. Has your family received help from different government organization, municipal,
foundations, or other private organization?
158.1. Yes
158.2. Never
159. If yes, how did you receive help? .......................................... ....................................................................................................................................
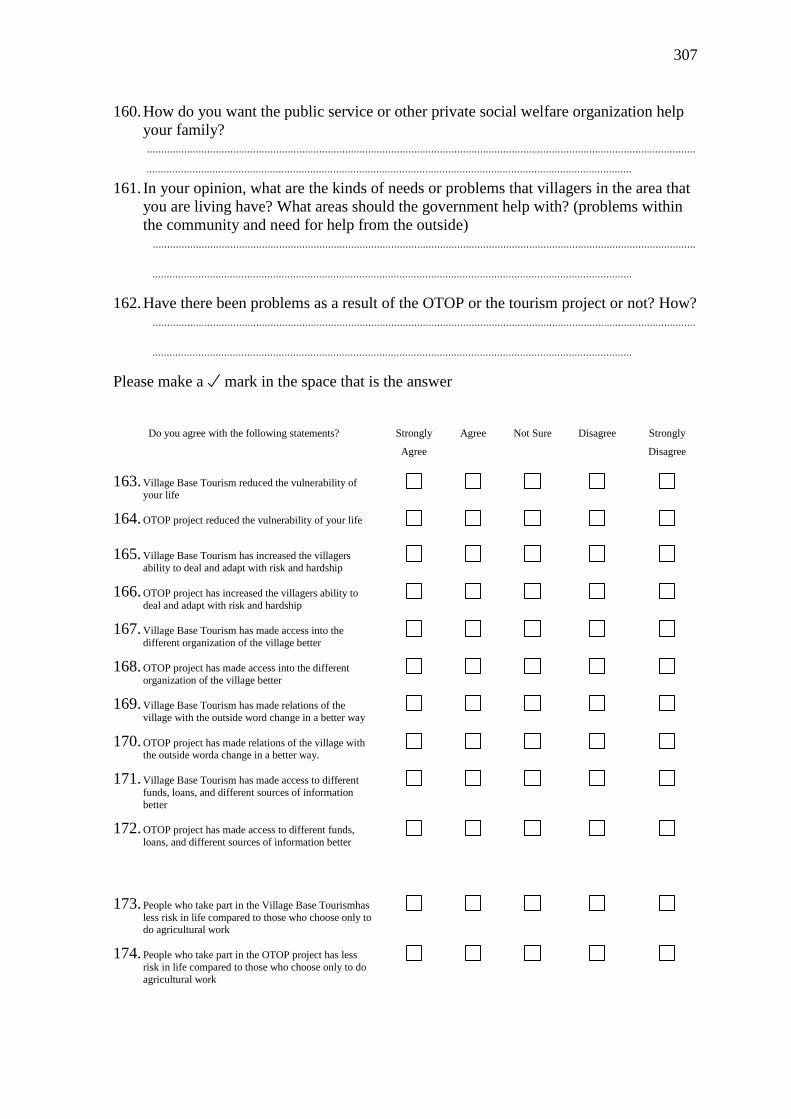
307
160. How do you want the public service or other private social welfare organization help
your family? ........................................................................................................................................................................................................................................................................................................................................................................
161. In your opinion, what are the kinds of needs or problems that villagers in the area that
you are living have? What areas should the government help with? (problems within
the community and need for help from the outside) .............................................................................................................................................................................................
.......................................................................................................................................................................
162. Have there been problems as a result of the OTOP or the tourism project or not? How? .............................................................................................................................................................................................
.......................................................................................................................................................................
Please make a mark in the space that is the answer
Do you agree with the following statements? Strongly
Agree Agree Not Sure Disagree Strongly
Disagree
163. Village Base Tourism reduced the vulnerability of your life
164. OTOP project reduced the vulnerability of your life
165. Village Base Tourism has increased the villagers
ability to deal and adapt with risk and hardship
166. OTOP project has increased the villagers ability to
deal and adapt with risk and hardship
167. Village Base Tourism has made access into the
different organization of the village better
168. OTOP project has made access into the different
organization of the village better
169. Village Base Tourism has made relations of the
village with the outside word change in a better way
170. OTOP project has made relations of the village with the outside worda change in a better way.
171. Village Base Tourism has made access to different
funds, loans, and different sources of information
better
172. OTOP project has made access to different funds,
loans, and different sources of information better
173. People who take part in the Village Base Tourismhas
less risk in life compared to those who choose only to do agricultural work
174. People who take part in the OTOP project has less
risk in life compared to those who choose only to do
agricultural work
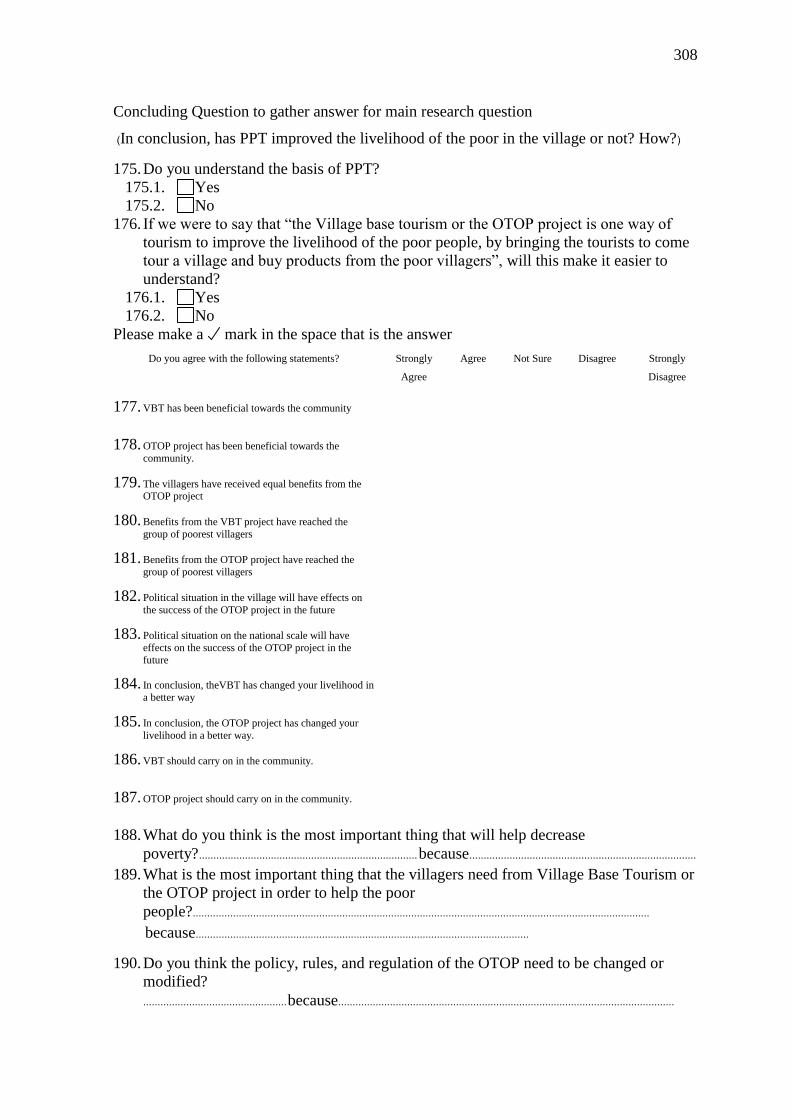
308
Concluding Question to gather answer for main research question
(In conclusion, has PPT improved the livelihood of the poor in the village or not? How?)
175. Do you understand the basis of PPT?
175.1. Yes
175.2. No
176. If we were to say that ―the Village base tourism or the OTOP project is one way of
tourism to improve the livelihood of the poor people, by bringing the tourists to come
tour a village and buy products from the poor villagers‖, will this make it easier to
understand?
176.1. Yes
176.2. No
Please make a mark in the space that is the answer
Do you agree with the following statements? Strongly
Agree Agree Not Sure Disagree Strongly
Disagree
177. VBT has been beneficial towards the community
178. OTOP project has been beneficial towards the
community.
179. The villagers have received equal benefits from the OTOP project
180. Benefits from the VBT project have reached the
group of poorest villagers
181. Benefits from the OTOP project have reached the
group of poorest villagers
182. Political situation in the village will have effects on
the success of the OTOP project in the future
183. Political situation on the national scale will have
effects on the success of the OTOP project in the
future
184. In conclusion, theVBT has changed your livelihood in
a better way
185. In conclusion, the OTOP project has changed your
livelihood in a better way.
186. VBT should carry on in the community.
187. OTOP project should carry on in the community.
188. What do you think is the most important thing that will help decrease
poverty?............................................................................because............................................................................... 189. What is the most important thing that the villagers need from Village Base Tourism or
the OTOP project in order to help the poor
people?...............................................................................................................................................................
because....................................................................................................................
190. Do you think the policy, rules, and regulation of the OTOP need to be changed or
modified?
..................................................because.....................................................................................................................
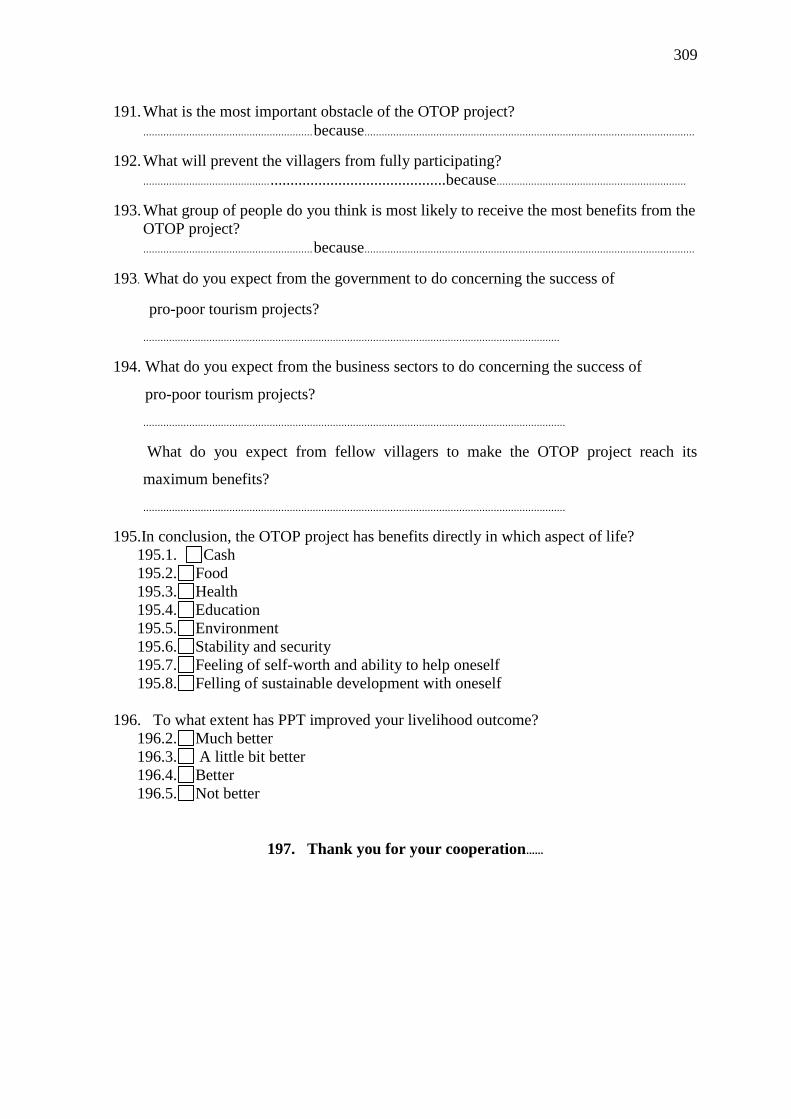
309
191. What is the most important obstacle of the OTOP project?
...........................................................because...................................................................................................................
192. What will prevent the villagers from fully participating?
........................................................................................because..................................................................
193. What group of people do you think is most likely to receive the most benefits from the
OTOP project?
...........................................................because...................................................................................................................
193. What do you expect from the government to do concerning the success of
pro-poor tourism projects?
.................................................................................................................................................
194. What do you expect from the business sectors to do concerning the success of
pro-poor tourism projects?
...................................................................................................................................................
What do you expect from fellow villagers to make the OTOP project reach its
maximum benefits?
...................................................................................................................................................
195.In conclusion, the OTOP project has benefits directly in which aspect of life?
195.1. Cash
195.2. Food
195.3. Health
195.4. Education
195.5. Environment
195.6. Stability and security
195.7. Feeling of self-worth and ability to help oneself
195.8. Felling of sustainable development with oneself
196. To what extent has PPT improved your livelihood outcome?
196.2. Much better
196.3. A little bit better
196.4. Better
196.5. Not better
197. Thank you for your cooperation......
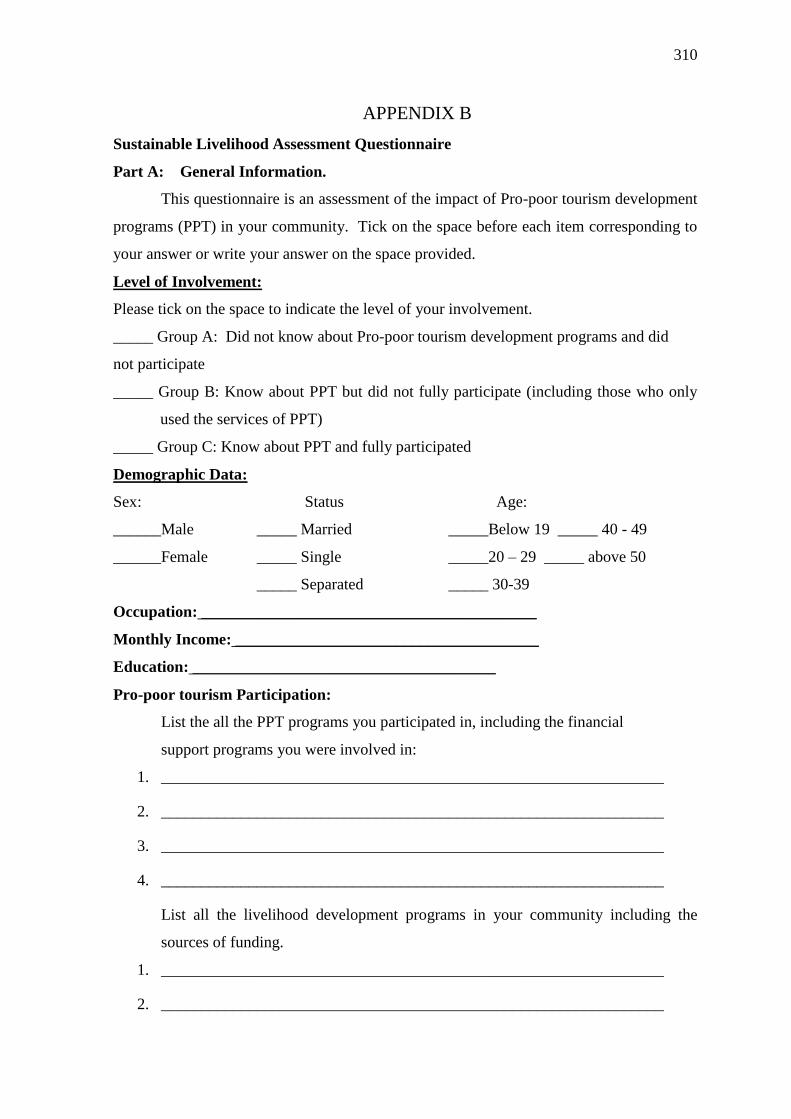
310
APPENDIX B
Sustainable Livelihood Assessment Questionnaire
Part A: General Information.
This questionnaire is an assessment of the impact of Pro-poor tourism development
programs (PPT) in your community. Tick on the space before each item corresponding to
your answer or write your answer on the space provided.
Level of Involvement:
Please tick on the space to indicate the level of your involvement.
_____ Group A: Did not know about Pro-poor tourism development programs and did
not participate
_____ Group B: Know about PPT but did not fully participate (including those who only
used the services of PPT)
_____ Group C: Know about PPT and fully participated
Demographic Data:
Sex: Status Age:
______Male _____ Married _____Below 19 _____ 40 - 49
______Female _____ Single _____20 – 29 _____ above 50
_____ Separated _____ 30-39
Occupation: __________________________________________
Monthly Income: ______________________________________
Education: ______________________________________
Pro-poor tourism Participation:
List the all the PPT programs you participated in, including the financial
support programs you were involved in:
1. _______________________________________________________________
2. _______________________________________________________________
3. _______________________________________________________________
4. _______________________________________________________________
List all the livelihood development programs in your community including the
sources of funding.
1. _______________________________________________________________
2. _______________________________________________________________
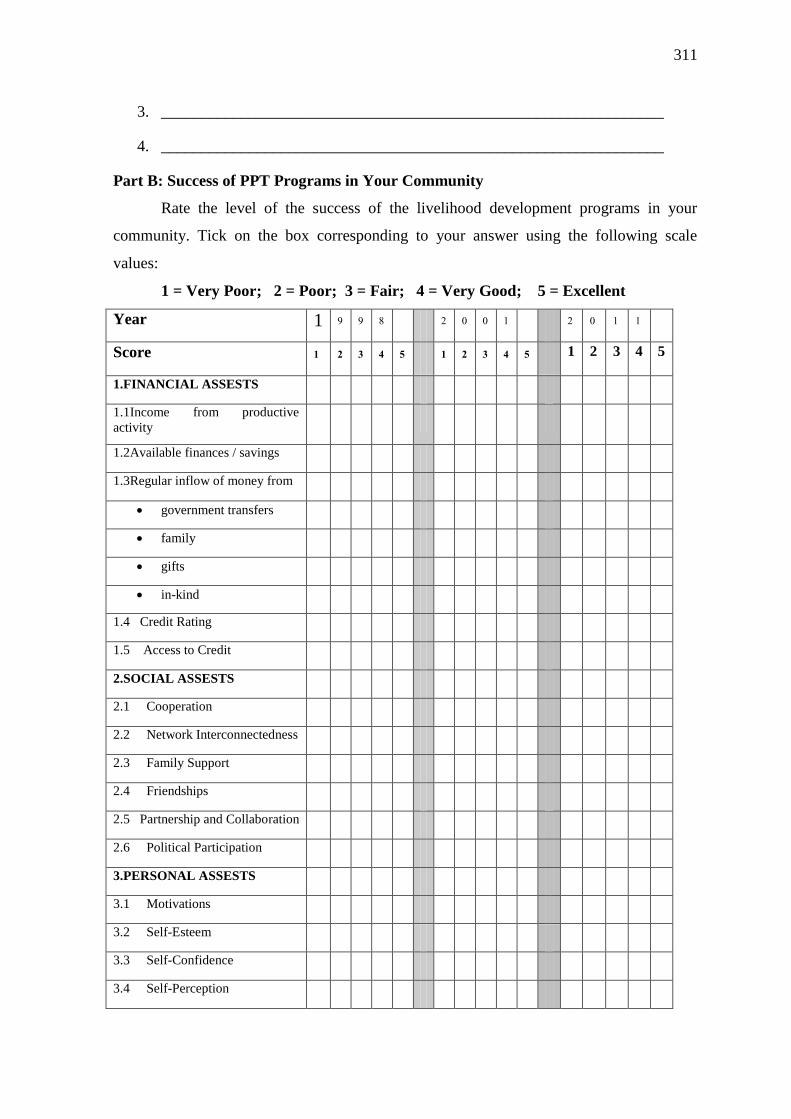
311
3. _______________________________________________________________
4. _______________________________________________________________
Part B: Success of PPT Programs in Your Community
Rate the level of the success of the livelihood development programs in your
community. Tick on the box corresponding to your answer using the following scale
values:
1 = Very Poor; 2 = Poor; 3 = Fair; 4 = Very Good; 5 = Excellent
Year 1 9 9 8 2 0 0 1 2 0 1 1
Score 1 2 3 4 5 1 2 3 4 5 1 2 3 4 5
1.FINANCIAL ASSESTS
1.1Income from productive
activity
1.2Available finances / savings
1.3Regular inflow of money from
government transfers
family
gifts
in-kind
1.4 Credit Rating
1.5 Access to Credit
2.SOCIAL ASSESTS
2.1 Cooperation
2.2 Network Interconnectedness
2.3 Family Support
2.4 Friendships
2.5 Partnership and Collaboration
2.6 Political Participation
3.PERSONAL ASSESTS
3.1 Motivations
3.2 Self-Esteem
3.3 Self-Confidence
3.4 Self-Perception
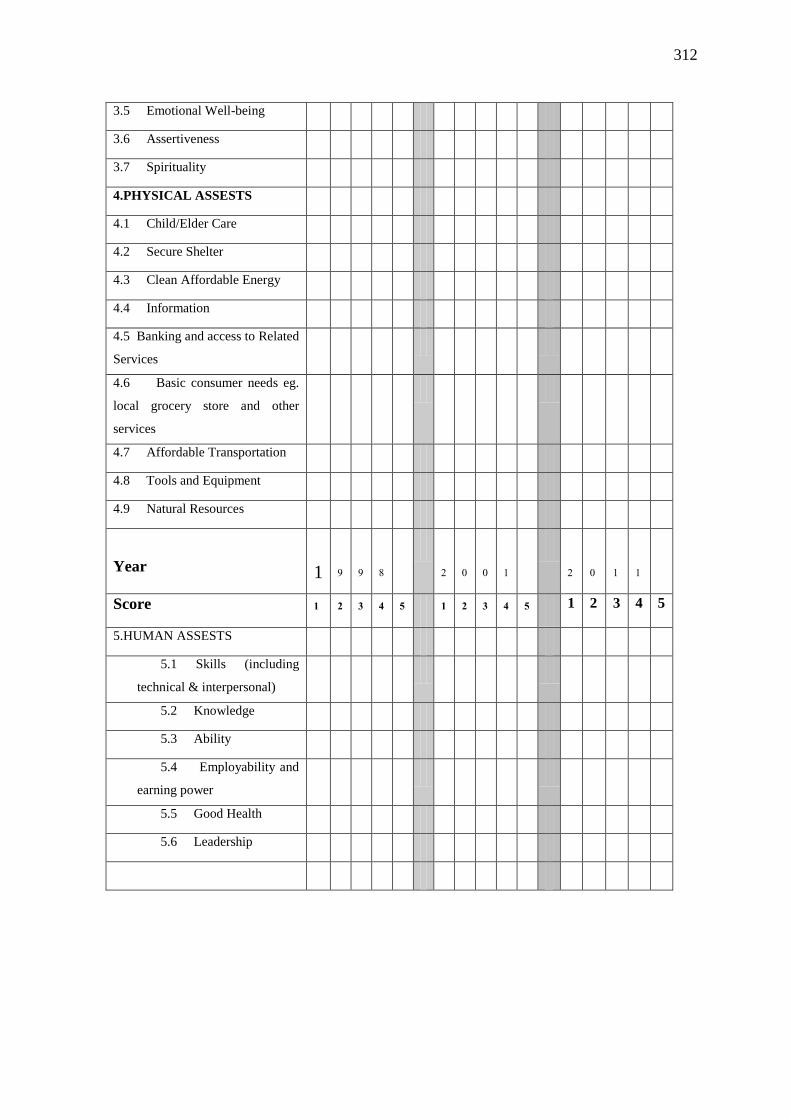
312
3.5 Emotional Well-being
3.6 Assertiveness
3.7 Spirituality
4.PHYSICAL ASSESTS
4.1 Child/Elder Care
4.2 Secure Shelter
4.3 Clean Affordable Energy
4.4 Information
4.5 Banking and access to Related
Services
4.6 Basic consumer needs eg.
local grocery store and other
services
4.7 Affordable Transportation
4.8 Tools and Equipment
4.9 Natural Resources
Year
1
9
9
8
2
0
0
1
2
0
1
1
Score 1 2 3 4 5 1 2 3 4 5 1 2 3 4 5
5.HUMAN ASSESTS
5.1 Skills (including
technical & interpersonal)
5.2 Knowledge
5.3 Ability
5.4 Employability and
earning power
5.5 Good Health
5.6 Leadership
313
Part C: Comments and Suggestions
Please write your personal comments, suggestions or recommendation on how you
think Sustainable Livelihood Development Programs can be improved in the community.
_________________________________________________________________________
_________________________________________________________________________
_________________________________________________________________________
_________________________________________________________________________
_________________________________________________________________________
_________________________________________________________________________
_________________________________________________________________________
_________________________________________________________________________
_________________________________________________________________________
__________________________________________________
314
References
Abbott, Andrew (1992) ‗What Do Cases Do? Some Notes on Activity in
Sociological Analysis‘, in Charles C. Ragin and Howard S. Becker (eds),
What is a Case? Exploring the Foundations of Social Inquiry. Cambridge:
Cambridge University Press, 1992, pp. 53-82
.
Akama, J. (1996). ―Western environmental values and nature-based tourism in Kenya‖
Tourism Management 17(8): 567-574.
Anderson, M. B. and P. J. Woodrow. (1989). ―Rising from the Ashes: Development
Strategies,‖ Times of Disaster. Boulder, Colorado:Westview Press, 51
Anonymous (2003a). Personal Interview with Had Bai male villager. Zone A, Chiang
Rai,16 March.
Anonymous (2003b). Personal Interview with NGO,Chiang Khong district near Had Bai
village. Chiang Rai,16 March.
Anonymous (2003c). Personal Interview with Had Bai female villager. Zone H, Chiang
Rai, 17 March.
Anonymous (2003d). Personal Interview with Had Bai female villager. Zone I, Chiang Rai,
17 March
Anonymous (2003e). Personal Interview with Had Bai female villager. Zone G, Chiang
Rai, 17 March
Anonymous (2003f). Personal Interview with Had Bai female villager. Zone H, Chiang
Rai, 18 March
Anonymous (2003g). Personal Interview with Had Bai female villager. Zone I, Chiang Rai,
18 March
315
Anonymous (2005a). Personal Interview with Tourism Development officer under
Ministry of Tourism and Sports. Bangkok 7 July.
Anonymous (2005b). Personal Interview with Export Promotion Department officer under
Commerce Ministry. Bangkok, 7 July.
Anonymous (2005c). Personal Interview with private sector person. Bangkok, 10 July.
Anonymous (2005d). Personal Interview with Community Development Department
officer under Interior Ministry. Bangkok, 12 July.
Anonymous (2005e). Personal Interview with Cooperatives Promotion Department officer
under Agriculture and Cooperatives Ministry. Bangkok, 13 July
Anonymous (2005f). Personal Interview with Industrial Promotion Department officer.
Bangkok, 13 July
Anonymous (2005g). Personal Interview with tour company managing director. Bangkok,
24 July
Anonymous (2005h). Personal Interview with Officer#1fromTourism Authority of
Thailand. Bangkok, 25 July
Anonymous (2005i). Personal Interview with Officer#2fromTourism Authority of
Thailand. Bangkok, 25 July
Anonymous (2005k). Personal Interview with senior officerfromTourism Authority of
Thailand. Bangkok, 25 July
Anonymous (2005l). Personal Interview with Director fromSME Bank. Bangkok, 26 July
Anonymous (2005m). Personal Interview with Officer fromSME Bank. Bangkok, 26 July
316
Anonymous (2005n). Personal Interview with Vice president, Franchise and OTOP cluster
fromSME Bank. Bangkok, 26 July
Anonymous (2005o). Personal Interview with officer from the Bureau of Farmer
Development, Ministry of Agricultural and Cooperatives. Bangkok, 28 July
Anonymous (2010a). Personal Interview with Had Bai female villager. Zone F, Chiang
Rai, 20 November
Anonymous (2010b). Personal Interview with Had Bai male villager. Zone C, Chiang Rai,
20 November
Anonymous (2010c). Personal Interview with NGO near Had Bai village, Chiang Rai, 21
November
Anonymous (2010d). Personal Interview with Had Bai female villager. Zone D, Chiang
Rai, 21 November
Anonymous (2010e). Personal Interview with Had Bai male villager. Zone B, Chiang Rai,
21 November
Anuchitworawong, C., J. Panpiemras and W. Pupphavesa (2007). Pro-Poor Tourism
Development in Thailand, Bangkok: TDRI.
Ashley, C. (2000). ―The impacts of tourism on rural livelihoods: Namibia‘s Experience‖
ODI Working Paper No 128. London: ODI.
Ashley, C. and K. Hussein (2000). ―Developing Methodologies for Livelihood Impact
Assessment: Experience of the African Wildlife Foundation in East Africa‖ ODI
Working Paper No.129. London: ODI.
Ashley, C., and J. Mitchell (2005). ―Can Tourism Accelerate Pro-Poor Growth in Africa?‖
ODI Opinion No.60, London: ODI.
317
Ashley, C., C. Boyd, C. and H. Goodwin (2000). ―Pro-Poor Tourism: Putting Poverty at
the Heart of the Tourism Agenda‖ Natural Resource Perspectives No. 51, London:
ODI. March 2000.
Ashley, C., & Roe, D. (2003).Working with the private sector on pro-poor tourism:
Opinions and experience from two development practitioners. London: PPT Partnership.
Ashley, C., D. Roe and H. Goodwin (2001).‖ Pro-poor Tourism Strategies, Expanding
opportunities for the poor.‖ Pro-poor tourism briefing No 1, London: ODI, IIED,
CRT.
Ashley, C., D. Roe, and H. Goodwin (2001). ―Pro-Poor Tourism Strategies: Making
Tourism Work for The Poo‖ A review of experience, London: ODI, IIED.
Ashley, C., D. Roe and H. Goodwin (2002). ―The Tourism Industry and Poverty
Reduction: A Business Primer.‖ Pro-poor tourism briefing No 2, London: ODI,
IIED, CRT.
Ashley, C., Poultney, C., &Hayson, G. (2005).Pro-poor tourism pilots in southern Africa.
London: ODI.
Asian Development Bank (2004). ―The Dimensions of Poverty in the Greater Mekong
Subregion. Annex 6‖ Pro-poor Tourism Regional Cooperation Strategy & Program
2004-8. ADB.
Bah, A., & Goodwin, H. (2003). Improving access for the informal sector to tourism in
TheGambia (PPT Working Paper No. 15). London: ODI.
Ballard, M. B (2005). "Linking Tourism to Poverty Reduction: A Siem Reap Case Study."
Annual Development Review 2004-2005 (Phnom Penh: Cambodia Development
Resource Institute)
Bank of Thailand Symposium, (2004). ―Safeguarding Economic Stability: The Role of
Public Policy‖ Paper presented at the 5th Symposium, Shangri-La Hotel, Bangkok,
Thailand 6-7 September, 57-69.
318
Barkin D (1996). Ecotourism: A tool for sustainable development.
http://www.planeta/96/0596monarch.html
Baran, M. (2008).Poorism: The economics of exploitation. Secaucus, NJ: Travel
Weekly. May 5
Berkes, F. and J.S. Gardner (eds) (1997). Sustainability of Mountain Environments in India
and Canada, Winnipeg: University of Manitoba, Natural Resources Institute.
Binkhorst, E. and V. Van der Duim (1995). ―Lost in the jungle of Northern Thailand: The
reproduction of hill-tribe trekking‖ In G. Ashworth and A. Dietvorst (eds) Tourism
and Spatial Transformations: Implications for Policy and Planning, CAB
International, Wallingford, U.K.
Binns, T Elliott, J Potter, R and Smith, D (2004) Geographies of Development, Second
Edition, Pearson Education Limited, Essex
Blaikie, P., T. Cannon, I. Davis and B. Wisner (1994). At Risk: Natural Hazards, People‟s
vulnerability, and disasters, London: Routledge.
Blangy, S. and M.E. Wood (1993). ―Developing and implementing ecotourism guidelines
for wildlands and neighboring communities‖ In K. Lindberg and D. E. Hawkins
(eds.). Ecotourism: A Guide for Planners and Managers. Bennington VT: The
Ecotourism Society.
Braman, S. and Fundación Acción Amazonia (2001). ―Practical Strategies for Pro-Poor
Tourism. Tropic Ecological Adventures – Ecuador‖ PPT Working Paper No 7.
London: ODI, IIED and CRT.
Bramwell, B. (1991). ―Sustainability and Rural Tourism Policy in Britain‖ Tourism
Recreation Research, 16(2). 49-51.
Bramwell, B., and B. Lane (1993). ―Interpretation and sustainable tourism: the potentials
and pitfalls‖ Journal of Sustainable Tourism, 12, 71-80.
319
Bramwell, B., I. Henry, G. Jackson, and J. van der Straaten. (1996). ―A framework for
understanding sustainable tourism‖. In B. Bramwell, I. Henry, G. Jackson, A.G. Prat,
G. Richards and J. van der Straaten (eds). Sustainable Tourism Management:
Principles and Practice. Tilburg: Tilburg University Press, pp. 23-71
Briedenham, J, (2004), ―Corporate Social Responsibility in Tourism-a tokenistic agenda? ―
Tourism in Focus, Autumn 2004, Issue Number 52, Tourism Concern, London
Brock, K. and Coulibaly, N. (1999). ―Sustainable Rural Livelihoods in Mali‖ Research
Report 35. Brighton, UK: Institute of Development Studies.
Brohman, J. (1996). “New directions in tourism for third world development‖ Annals of
Tourism Research, 23(1). 48-70.
Bryceson, D.F (1996). ―Deagarianization and rural employment in sub-Saharan Africa: a
sectoral perspective‖ World Development, 24(1): 97-111
Brydon, L and S. Chant (1989). Women in the Third World: Gender issues in rural and
urban areas, Rutger University Press.
Burks M.R . (2006). ―Linking Livelihoods and Sustainable Tourism for Parks and People
in Belize.‖ A paper submitted to the faculty of Virginia Polytechnic Institute and
State University, May 11, 2006. Falls Church, Virginia
Campbell, D. (1994). ―Eco Tourism booms in South East Asia‖ The Eco Tourism Society
Newsletter, 4(4). 1-3
Campbell, L,M, (1999), ―Ecotourism in Rural Developing Communities‖ The Annals of
Tourism Research, Volume 36, Number 3, Pages 534-553
Carney, D. (1999). ―Approaches to sustainable livelihoods for the rural poor.‖ODI Poverty
Briefing, No.2, London: ODI.
320
Carney, D. (ed) (1998). Sustainable Rural Livelihood: What Contributions Can We Make?,
London: DFID.
Carswell, G., de Haan, A., Dea, D., Konde, A., Shankland, A. and Sinclair, A. (2000)
―Sustainable Livelihoods in Southern Ethiopia‖ Research Report 44. Brighton, UK:
Institute of Development Studies.
Carvalho, S. and H. White (1997). Combining the quantitative and qualitative approaches
to poverty measurement and analysis: The practice and the potential, Washington,
D.C.: World Bank.
Catarinich, X. (2001). ―Pro-poor Tourism Initiative in Developing Countries: Analysis of
Secondary Case Studies‖ Report to PPT Project, London: ODI, IIED and CRT. PPT
Working Paper No. 8, © CRT, IIED and ODI, 2001.
http://www.propoortourism.org.uk.
Cater, E. (1993). ―Ecotourism in the Third World: problems for sustainable tourism
development‖. Tourism Management 14(2): 85-90.
Cater, E. (1994). Cater, E., and G. Lowman. ed. ―Ecotourism in the third world - problems
and prospects for sustainability‖ Ecotourism: a sustainable option?. United
Kingdom: John Wiley and Sons.
Cater, E. (2004) ―Ecotourism: theory and practice. In A.A. Lew, C.M. Hall and A.M.
Williams‖ (eds) A Companion to Tourism. Blackwell Publishing, Oxford, pp. 484–
497.
Héctor, C.(1993). The IUCN Ecotourism Consultancy Programme. México, DF.
Chamber, R. (1988). ―Sustainable Rural Livelihoods: A Key Strategy for People,
Environment and Development‖ In C. Conroy and M. Litvinoff (eds). The Greening
of Aid: Sustainable Livelihoods in Practice, London: Earth scan Publications Ltd., in
association with The International Institute for Environment and Development, 1-17.
321
Chamber, R. (1992). Rapid and Participatory Rural Appraisal, Africanus, 22:1, 6-15.
Chamber, R., and G. Conway (1992). ―Sustainable Rural Livelihoods: Practical Concepts
for the 21st Century‖ IDS Discussion Paper, No.296. Brighton: Institute of
Development Studies, University of Sussex.
Chambers, R. (1988). ―Sustainable Rural Livelihoods: A Key Strategy for People,
Environment and Development‖ In C. Conroy and M. Litvinoff (eds). The Greening
of Aid: Sustainable Livelihoods in Practice, London: Earth scan Publications Ltd., in
association with The International Institute for Environment and Development, 1-17.
Chambers, R. (1992). Rapid and Participatory Rural Appraisal, Africanus, 22:1, 6-15.
Chambers, R., (1994). The Origins and Practice of Participatory Rural Appraisal. World
Development 22(7):953-969
Chambers, R., A. Pacey and L Thrupp (eds) (1989). Farmer First: farmer innovation and
agricultural research, London: Intermediate Technology Publications.
Chambers, R., and G. Conway (1992). ―Sustainable Rural Livelihoods: Practical Concepts
for the 21st Century‖ IDS Discussion Paper, No.296. Brighton: Institute of
Development Studies, University of Sussex.
Charoenrach, T(2001). ―Community Business – Means to Sustainable Community
Development: A Case Study of Kudchum District, Yasothorn Province‖ Master
Degree thesis in Economics. Graduate School Ramkhamhaeng University
Chudintra, S. (1993). ―Nature Tourism Profile: Thailand‖ In Nenon, J. and Drust, P.(eds).
Nature Tourism in Asia Opportunities and Constraints for Conservation and
Economics Development. Forestry Support Program, Washington, D.C. pp.31-41.
322
Churyen, A., Duangsaeng.V and Kontogeorgopoulos A. (2015). ―Homestay Tourism and
the Commercialization of the Rural Home in Thailand‖. Asia Pacific Journal of
Tourism Research, 20(1):29-50
Chutimaskul, W. (2006). ―Thailand's eGovernment for Poverty Reduction and Helping the
Disadvantaged Groups, School of Information Technology, King Mongkut's
University of Technology Thonburi‖ Handout for Capacity Building of eGovernment
initiatives, 24-25 April, 2006 Thailand.
Clarke, J. (1997). ―A framework of approaches to sustainable tourism‖. Journal of
Sustainable Tourism 5: 224-233.
Cohen, E., (1989) ―Primitive and Remote Hill Tribe Trekking in Thailand‖, Annals of
Tourism Research 16(1): 30-61.
Cotas, C. (1996). ―Ecotourism and Its Role in Sustainable Development‖ Paper presented
at 2nd International Conference on Implementation of Ecotourism, Srinakharinwirot
University, Bangok, Thailand, 18-21 July, 1996.
CUCUEM (Canadian Universities Consortium Urban Environmental Management Project
Training and Technology Transfer Program) (2000). Recommendations for
Sustainable Village Tourism Development in the Greater Mekong Subregion,
Bangkok: Asian Institute of Technology (AIT).
Dearden, P and S. Harron (1994). Alternative tourism and adaptive change. Annals of
Tourism Research Vol.21, 81-102.
Dearden, P. (1995). ―Development, the Environment and Social Differentiation in
Northern Thailand‖ In Counting the Costs: Economic Growth and Environmental
Change in Thailand, Jonathan Rigg (ed). pp.111-30, Singapore: Institute of
Southeast Asian Studies.
323
Deloitte and Touche, IIED and ODI (1999). ―Sustainable tourism and poverty elimination
study‖ A report to DFID, London: DFID.
Deloitte and Touche, IIED and ODI (1999). ―Tourism and Poverty‖. Unpublished report to
DFID, London: DFID.
Denzin, N. and Lincoln, Y. (2000). ―Introduction: the discipline and practice of qualitative
research‖ In: Denzin, N. and Lincoln, Y. (eds). Handbook of Qualitative Research,
pp. 1–28. Sage Publications, Thousand Oaks, CA.
Department for International Development (DFID) (1999). Tourism and poverty
Elimination: Untapped Potential, London: DFID.
Department for International Development (DFID) (2000). Sustainable Livelihoods
Guidance Sheets, London: DFID.
Dhakal D. P. (2005). ―Sustainable Rural Tourism For Improved Livelihood Of Local
Communities‖ Economic Policy Network. Policy Paper 4. Prepared for the
Economic Policy Network His Majesty's Government of Nepal/ Ministry of Finance,
Asian Development Bank and Nepal Tourism Board. Singha Durbar, Kathmandu,
Nepal December 2005
Diethelm Travels Thailand Tourism Review 2007. TAT Sustainable Tourism Policy:
Planning a Sustainable Future. The Post Publishing Public Co., Ltd. 2008.
http://www.bangkokpost.com/tourismreview2007/31.html
Dorosh, P. and Klytchnikova, I. (2009) ―How Tourism cab Z and does benefit the poor and
the environment-A case study from Panama‖ Responsible Tourism Serie number
146. World Bank
Dung, T.K, N., Loi, C C., Cuong, H V., and Minh, T.(2007) ―Pro-Poor Tourism in the
GMS‖ Vietnam Case Study, Hanoi: Central Institute for Economic Management
324
Dymond, S. J. (1997) ―Indicators of Sustainable Tourism in New Zealand: a. Local
Government Perspective‖ Journal of Sustainable Tourism, 5 (4): 279-. 293.
Ellis, F (1997). ―Household Strategies and Rural Livelihood Diversification‖ Paper
submitted to the Journal of Development Studies, pp.5.
Farrington, J., Carney, D., Asheley, C., and Turton, C. (1999). ―Sustainable Livelihoods in
Practice: Early Applications of Concepts in Rural Areas‖ ODI Natural Resource
Perspectives, No.42, London: ODI.
Ferguson, M and Murray, J. (2001). ―Women in Transition Out of Poverty. Toronto:‖
Women and Economic Development Consortium. January.
http://www.cdnwomen.org/eng/3/3h.asp
Firestone, W.A. (1987). Meaning in method: The rhetoric of quantitative and qualitative
research. Educational Researcher, 16, 16-21.
Flyvbjerg, Bent, "Five Misunderstandings About Case-Study Research,"
QualitativeInquiry, vol. 12, no. 2, April 2006, pp. 219-245.
Fuller, B (1997). ―Thailand‘s Tourism Vision 2012‖ Paper Published in TDRI Quarterly
Review. Vol.12. No.2 June 1997, pp.14-24
Gareth, M and Smircich, L.,(2011), "The Case for Qualitative Research", Academy of
Management Review vol 5 no 4, pages 491-500.
Geertz, Clifford (1995) After the Fact: Two Countries, Four Decades, One
Anthropologist. Cambridge, MA: Harvard University Press.
Gerosa, V (2003). ―Pro-Poor growth strategies in Africa. Tourism: A viable option for Pro-
Poor growth in Africa?‖ Economic Commission for Africa. Report presented during
the Economic Commission for Africa Economic Policy Research Center Expert
Group Meeting at Munyonyo Speke Resort in Kampala, Uganda , 23-24 June 2003
325
Goodwin, H (2000). Pro-poor Tourism, Opportunity for Sustainable Development, D+C
Development and Cooperation, 5(9/10). 12-14
Goodwin, H. (2007). Measuring and reporting the impact of tourism on poverty.
In D. Airey& J. Tribe (Eds.), Tourism research: New directions, challenges and
applications (Chap.5, pp. 63–75). London: Elsevier.
Goodwin, H. (2008). Pro-poor tourism: A response. Third World Quarterly, 29(5),
869–887.
Goodwin, H (2009) Reflections on 10 years of Pro‐Poor Tourism, Journal of
Policy Research in Tourism, Leisure and Events, 1:1, 90-94,
Goodwin, H., & Rowe, D. (2006).Pro-poor tourism annual register.London: PPT
Partnership.
Gray, J. (1992). ―Earth first can be good business‖ In Hay, J.E., (ed). Promoting a
Sustainable Experience. Proceedings of Ecotourism Conference, University of
Auckland, 12-14 October, 1992, pp.107-110.
Grosh, M. (1991). ―The Household Survey as a Tool for Policy Change: Lessons from the
Jamaikan Survey of Living Conditions‖ LSMS Working Paper No. 80. Washington,
D. C.:World Bank.
Guba, EG, and Lincoln, Y. (1988). ―Do inquiry paradigms imply inquiry methodologies?‖
In DM Fetterman (Ed.). Qualitative approaches to evaluation in education (pp. 89-
115). New York: Praeger.
Gupta, V.K., Nigam, A.K. and Kumar, P., 1982. On a family of sampling schemes with
inclusion probability proportional to size. Biometrika 69, pp. 191–196.
Hall, C. M. (1994). ―Gender and Economic Interest in Tourism Prostitution: The Nature,
Development, and Implications of Sex Tourism‖ In Kinnaird, V and D. Hall (eds).
Tourism: A Gender Analysis. West Sussex: John Wiley & Son Ltd.142-163.
Hammond, R. (2004), ―Certification and accreditation in redefining ecotourism‖, Travel
and Tourism Analyst, No. 5, pp. 47-56.
326
Harrison, D. (2008) Pro-poor Tourism: a critique, Third World Quarterly,
29:5, 851-868, Routledge, London UK
Helmore, K., and Singh,N. (2001)Sustainable Livelihoods: Building On The Wealth Of The
Poor, p.3, Kumarian Press, 2001,
Hiramatsu, M. 2006. Policies and Strategies Toward Local Government. Tokyo:
Toyo Keizai
Hussein, K and J. Nelson (1998). ―Sustainable Livelihood Diversification‖ IDS Working
Paper 69, London: ODI.
ICUN (1980). World Conservation Strategy, IUCN, Gland, Switzerland
IFAD ( International Fund for Agricultural Management(2011) The Sustainable
Livelihoods Approach. http://www.ifad.org/sla/index.htm. accessed 2011
Insula Sustainable Tourism (2004). Concepts of sustainable tourism. In Sustainable
Tourism. (Online). Available: www.insula.org/tourism/pagina_n8.htm.
Irwin, A. (2001) Sociology and the Environment: A Critical Introduction to
Society, Nature and Knowledge. Cambridge: Polity.
Jacquemin, L.(2006). MTCO GMS Tourism& Biodiversity Project Proposal.
Bangkok. UNESCO.
Jamieson, W., H. Goodwin & C. Edmunds (2004), ‗Contribution of tourism to poverty
alleviation: pro-poor tourism and the challenge of measuring impacts‘,
report prepared for the Transport Policy and Tourism Section, Transport
and Tourism Division, ESCAP, November 2004.P19-24
Jiggins, J. (1986). ―Women and seasonality: Coping with crisis and calamity‖, IDS
Bulletin, 17(3). 9-18.
327
Jitsuchon, S. (2003). ―Poverty, economic security and the role of the Thai government‖
Bangkok: TDRI Quarterly Review (December 2003).
Jitsuchon, S., and K. Richter. 2007. ―Thailand‘s Poverty Maps: From Construction to
Application‖ In Coudouel, A. and S. Kenneth (eds). More Than a Pretty Picture;
Using Poverty Maps to Design Better Policies and Interventions Washington DC.
World Bank 241-259
Johnson, L. B. (1967). ―The responsibility of making a comprehensive study and appraisal
of the current economic situations and trends in American rural life‖. President‟s
National Advisory Commission on Rural Poverty, Tucson. 26-27 January, 1967.
Judith,E. (2011) The Role of Private Sector Participation in Sustainable Tourism
Development in Cross River State, Nigeria. International Journal of Business and
Social Science. Vol. 2 No. 2, February 2011.
Kamsma, T. and Bras, K.(2000). ―Gili Trawangan-from desert island to ―marginal‖
paradise: Local participation, small-scale entrepreneurs and outside investors in an
Indonesian tourist destination.‖ In: G. Richards and Hall. D. (eds). Tourism and
Sustainable Community Development, London: Routledge. pp. 170-184.
Kareithi, S. (2003). ―Coping with Declining Tourism, Examples from Communities in
Kenya‖ PPT Working Paper No.13, London: ODI, IIED and CRT.
King, R., Alder, M and Grieves, M. (2013). ―Cooperatives as Sustainable Livelihood
Strategies in Rural Mexico‖. Bulletin of Latin American Research . Apr2013, Vol.
32 Issue 2 166–177.
Kinnaird, V. and D. Hall (1994). Tourism: A Gender Analysis. West Sussex: John Wiley &
Son Ltd.
328
Klinsukont, C. and Leksakuldilok (1996). ―The Eco-Tourism Establishment in a small
Island: Ko Taen‖. In Dhamabutra, P., Stithyudhakarn, V. & Hirunburana, S. eds.,
Paper presented at 2nd International Conference on Implementation of Institute of
Ecotourism, Srinakharinwirot University, Bangkok, Thailand, 18-21 July, 1996.
pp.149-160.
Koeman, A. (1998). Sa Pa, Vietnam: Capacity Building for Sustainable Tourism: Ideas for
the Future. Communications to the Internet Conference on Community Cased
Mountain Tourism sponsored by Mountain Forum, 11 May, 1998,
http://www.2mtnforum.org
Krantz, L. (2001) The Sustainable Livelihood Approach to Poverty Reduction An
Introduction,Swedish International Development Cooperation Agency Division for
Policy and Socio-Economic Analysis,pp.1-2.
Laier, J. K. (1996). ―Gender‖, household food security and coping strategies, University of
Sussex: IDS.
Lamsal, P., K. P. Pant, L. Kumar, and K. Atreya. 2015. Sustainable livelihoods through
conservation of wetland resources: a case of economic benefits from Ghodaghodi
Lake, western Nepal. Ecology and Society 20(1): 10.
Leaungsomnapa, Y., Promproh, S. and Khanwiset, S. (2011). Quality of life,
problems and needs of disabled persons at Thachang Subdistrict
Administrative Organisation, Chanthaburi Province. Prapokklao Hospital
Clinical Medical Education Center, 28 (2), 98-109.
Leebouapao, L., Olaboun, S., Sone, P, Souksavat, P. and Voladet, S. (2007). Pro-Poor
Tourism in the Lao PDR:Vientiane: National Economic Research Institute.
Leksakndilok, A. (2004). Ecotourism and Community-based Ecotourism in the Mekong
Region. Australia, University of Sydney Printing Service , 2004.
329
Lindberg, K., J. Enriquez and K. Sproule. 1996. ―Ecotourism Questioned: Case Studies
from Belize‖ Annals of Tourism Research. 23(3): 543-562.
Livelihoods in Southern Ethiopia‘, Research Report 44. Brighton, UK: Institute of
Development Studies.
Macbeth, J. (2005) Towards an ethics platform for tourism. Annals of Tourism
Research 32 (4), 962–984.
Mahony, K. and Van Zyl, J. (2001) ―Practical strategies for pro-poor tourism, Case studies
of Makuleke and Manyeleti tourism initiatives‖ South Africa, Report to PPT project,
London: ODI.
Masberg, B.A. and Morales, N. (1999). A Case of Strategies in Ecotourism Development,
Aquatic Ecosystem Health and Management, 2, 289-300
May, T. (1997). Social Research: Issues, Methods and Process, 2nd ed, Great Britain:
Open University Press, 111.
McBeth, J. (1996). ―Going Once, Going Twice‖, Far Eastern Economic Review, 21
November 1996, Hong Kong.
McNeely, J., and Dobias, R. (1991). Economic Incentives for Conserving in Thailand,
Ambio, 20(2). 86-90.
Meyer, D. (2006).‖ Caribbean Tourism, Local Sourcing and Enterprise Development:
Review of the Literature‖ PPT Working Paper No 19, London: ODI, IIED and ICRT.
Ministry of Tourism and Sports (MOTS) (2012) ― Thailand Tourism Plan 2012-2016‖,
Bangkok: Ministry of Tourism and Sports.
Ministry of Tourism and Sports (MOTS) (2013) ― 10 Best Thailand Homestay Standard
2013‖, Bangkok: Ministry of Tourism and Sports,
330
Mowforth M and Munt, I, (2003), Tourism and Sustainability: Development and New
Tourism in the Third World, Second Edition, Routledge, New York
Mukai, K. and Fujikura, R., (2015), One village one product: evaluations and
lessons learnt from OVOP aid projects, Development in Practice, 2015
Vol. 25, No. 3, 389–400
MTCO (2008). ―How to foster responsible nature based tourism in the GMS protected
areas?‖, Paper presented at the Biodiversity Conservation and Tourism Development
in the Greater Mekong Subregion, Bangkok, Thailand
MTCO (2008a). ―Mekong Tourism Coordination Office Marketing Plan (2008-2011).‖
Mekong Tourism Coordination Office, Bangkok, Thailand
Muqbil, I.(1994). ―Lessons from the Lisu‖,PATA travel news, March, pp.12-15.
Murray, J., and Ferguson, M., (2001). Women in Transition Out of Poverty. Toronto:
Women and Economic Development Consortium January.
http://www.cdnwomen.org/eng/3/3h.asp.
Narayan, D. (1996). ―Towards Participatory Research‖ World Bank Technical Paper #
307. World Bank, Washington, DC, USA.
National Economic Development Board (NESDB) (2002-2007). The Ninth National
Economic and Social Development Plan, Bangkok: Office of the Prime Minister.
National Economic Development Board (NESDB) (2007-2011). The Tenth National
Economic and Social Development Plan, Bangkok: Office of the Prime Minister.
National Economic Development Board (NESDB) (2011-2015). The Tenth National
Economic and Social Development Plan, Bangkok: Office of the Prime Minister.
New Zealand‘s International Aid and Development Agency (NZAID), 2007. Sustainable
Livelihoods Approach. Guideline. Accessed through:.
http://nzaidtools.nzaid.govt.nz/sustainable-livelihoods-approach/
331
NIB (1982). Thailand 1982; Plans, Problems and Prospects, Bangkok, National Identity
Board.
Nicanor, N. (2001). ―Practical Strategies for Pro-Poor Tourism: NACOBTA, The
Namibian Case Study‖ PPT Working Paper No 4. www.propoortourism.org.uk.
London:ODI, IIED and CRT.
Nicholson, T. (1997). ―Culture, Tourism and Local Strategies for Development‖. Research
report for Department for International Development (DFID): London.
Nickerson, N.P. (1996). Foundations of Tourism. New Jersey: Prentice-Hall.
Oranratmanee,R.(2009). ―Rural homestay: Interrelationships between space, social
interaction and meaning in northern Thailand‖ (Unpublished doctoral dissertation).
School of Architecture, Oxford Brookes University, Oxford.
Oranratmanee, R. (2011). Re-utilizing space: Accommodating tourists in homestay houses
in northern Thailand. Journal of Architectural/Planning Research and Studies
(JARS), 8(1), 35–54
O'Laughlin, B. (2004). Book reviews. Development and Change, 35(2), 385-403.
O'Malley, J. (1988). ―Sex Tourism and Women's Status in Thailand‖, Society and Leisure,
11:1, 99-114.
Page, S.J., P. Brunt, G. Busby and J. Connell. (2001). ―Tourism: A Modern Synthesis.
London: ― Thomson Learning.Paper 72,Brighton: IDS.
Parkinson S, Ramirez R, (2006), ―Using a Sustainable Livelihoods Approach to Accessing
the impact of ICTs in Development‖ The Journal of Community Informatics, Special
Issue:Telecentres, Volume2 No3 (2006)
332
PCI & TEAM (Pacific Consultants International and TEAM Consulting Engineering Co.
Ltd). (1998), ―Mekong Lancang River Tourism Planning Study: Concept Plans‖
Asian Development Bank Regional Technical Assistance Project, TA # 5743 REG,
Bangkok.
Phongpaichit, P. (1981). ―Bangkok masseuses: holding up the family sky‖ Southeast Asia
Chronicle, 78:15-23
Phongpaichit, P. (1982). From peasant girls to Bangkok masseuses, International Labour
Office, Geneva.
Poultney, C., Spenceley, ―A.(2001) Practical strategies for pro‑poor tourism, Wilderness
Safari South Affica: Rocktail Bay and Ndumu Lodge‖ Report to PPT project,
London: ODI, IIED and CRT PPT Briefing, March 2002.
Pro-poor tourism briefing No.2. ODI, IIED, ICRT. March 2002 (President‘s National
Advisory Commission on Rural Poverty, 1967).
Pupphavesa, W., Panpiemras, J., and. Anuchitworawong, C., 2005 Pro-Poor Tourism in
the GMS, Thailand Case Study, Bangkok, Thailand Development Institute
Ragin, Charles C. (1992) ‗―Casing‖ and the Process of Social Inquiry‘, in Ragin,
Charles C. andBecker, Howard S. (eds), What is a Case? Exploring the
Foundations of Social Inquiry. Cambridge: Cambridge University Press, pp. 217-
226.
Ragin, Charles C. and Becker, Howard S. (eds) (1992) What is a Case?
Exploring the Foundations of Social Inquiry. Cambridge: Cambridge
University Press.
Renard, Y.(2001). ―Practical strategies for Pro-Poor Tourism: a case study of the St. Lucia
Heritage Tourism Programme‖ Pro-poor Tourism Working Paper No.7 for the
Centre for Responsible Tourism at the University of Greenwich (CRT), International
Institute for Environment and Development (IIED) and Overseas Development
Institute (ODI)
333
Richards, G. and D. Hall (2000). ―The community: a sustainable concept in tourism
development?‖ In G. Richards and Hall. D.(Eds) Tourism and Sustainable
Community Development, London: Routledge.
Richardson R. (2007) ―Tourism in Belize: Vulnerability and Capacity Assessment‖. Report
Submitted for Belize‟s Second NationalCommunication to the United Nations
Framework Convention on Climate Change . Michigan State University (USA) and
Galen University (Belize) August 2007
Roe, D.(2011) Pro-Poor Tourism: ―Harnessing the World‘s Largest Industry for the
World‘s Poor IIED, UK and Penny Urquhart Khanya, South Africa‖World Summit
on International Development,May 2011
Rogerson, C. M. (2002). Tourism and local economic development: The Case of the
Highlands Meander, Development Southern Africa, 19, 143-166.
Ross, S. and G. Wall (1999). Evaluating Ecotourism: The Case of North Sulawesi,
Indonesia, Tourism Management, 20, 673-682.
Salomon, G. (1991). Transcending the quantitative-qualitative debate: The analytic and
systemic approaches to educational research. Educational Researcher, 20(6). 10-18.
Saville, M. N. (2000). ―Practical strategies for pro‑poor tourism, Case study of pro‑poor
tourism and SNV in Humla District, West Nepal‖ Report to PPT project. ODI, IIED
and CRT, London.
Saville, M. N. (2001). ―Practical strategies for pro‑poor tourism, Case study of pro‑poor
tourism and SNV in Humla District, West Nepal‖ Report to PPT project. ODI, IIED
and CRT, London.
Scoones, I. (1998), ―Sustainable Rural Livelihoods: A Framework for Analysis‖, IDS
Working Paper 72,Brighton: IDS.
334
Serrat, O., 2008. ―The Sustainable Livelihoods Approach‖. Knowledge Solutions. Asian
Development Bank (ADB). Accessed through:
http://www.adb.org/Documents/Information/Knowledge-Solutions/Sustainable-
Livelihoods-Approach.pdf
Selwyn, T. (1996). ―The Tourist Image: Myth and Myth making in tourism‖, London,
Wiley.
Shah, K. (2000). ―Tourism, the poor and other stakeholders: Asian experience‖ ODI Fair-
Trade Tourism Paper. ODI, London.
Shah, K.and V. Gupta (2000). Tourism, the Poor, and Other Stakeholders: Experience in
Asia : London, ODI.
Sherman, P. and J. Dixon (1991). ―The Economics of Nature Tourism: Determining if it
pays.‖ In Whelan, T.(ed) Nature Tourism: Managing for the Environment.
Washington, DC: Island Press, 89-131.
Siegel, P. B., and P.M. Jakus (1995). ―Tourism as a Sustainable Rural Development
Strategy: Building Consensus in Resident Attitude‖ Southern Journal of Rural
Sociology, 11(1): 17-41.
Singh, T. V. (1989). The Kulu Valley Impact of Tourism Development in the Mountain
Area, New Delhi: Himalayan Books.
Sokphally, T. and H. Vutha. (2007). ―Pro-Poor Tourism‖ Siem Reap Case Study,
Cambodia Development Resource Institute, Phnom Penh, Cambodia
Spenceley, A and J. Seif (2003). ―Strategies, Impacts and Costs of Pro-Poor Tourism
Approaches in South Africa‖ PPT Working Paper No. 11, London: ODI, IIED and
CRT. January 2003
335
Stake, Robert E. (1995) The Art of Case Study Research. Thousand Oaks: Sage.
Swarbrooke, J. 1999. Sustainable Tourism Management. Wallingford: CAB International.
Tangpianpant, P.G., (2010). Thaksin Populism and Beyond: A study of Thaksin‘s
Pro-poor Populist Policies in Thailand. Wesleyan University, Connecticut.
p.76
Tao, T. C., (2006) Tourism as a Livelihood Strategy in Indigenous Communities: Case
Studies from Taiwan . Thesis University of Waterloo, Ontario Canada, 2006
Teo, P. and S. Huang, (1995). ―Tourism and heritage conservation in Singapore‖. Annals
of. Tourism Research, Vol. 22, 589-615.
The Nation (1987). ―Agriculture: Dramatic decline‖ The Nation, (1 January 1987). 15-17
Timothy, D. J. and Wall, G. (1997). ―Selling to Tourists: Indonesian Street Vendors‖
Annals of Tourism Research, Vol.24 (2). 322-340.
Toner, A. (2002). Sustainable livelihoods approaches - Can they transform development?
Bradford, BCID, University of Bradford.
Toufique, K. (2001). Rights and livelihoods. Workshop, Dhaka, Bangladesh: Bangladesh
Institute of Development Studies and Power and Participation Research Centre.
Toufique, K.A. (2000) ―Sustainable Rural Livelihoods in Bangladesh: Summary of
Research Findings‖, Research Report 45. Brighton, UK: Institute of Development
Studies.
Tourism Authority of Thailand (TAT) (1995). Thailand Statistical Report, Bangkok:
Tourism Authority of Thailand.
336
Tourism Authority of Thailand (TAT) (1999). Tourism Marketing Plan 2000, Bangkok:
Tourism Authority of Thailand.
Tourism Authority of Thailand (TAT) (2009). Thailand Statistical Report, Bangkok:
Tourism Authority of Thailand.
Trousdale, W. J (1999). ―Governance in context: Boracay Island, Philippines‖ Annals of
Tourism Research, Vol.24(2). 322-340.
U.S. Department of Agriculture, Forest Service (USDA)(1998). Ecotourism in the Asia-
Pacific Region: Issue and Outlook. January 1998.
UNWTO (United Nations World Tourism Organization). (2004). Tourism and poverty
alleviation recommendations for action. Madrid: UNWTO.
UNWTO (2008). ―Tourism Highlights 2008 Edition,‖ United Nations World Tourism
Organization: http://www.world-tourism.org/facts/eng/highlights.htm Viewed
December 2009.
Walker, J, B.Mitchell, and S. Wismer(2001) ―Livelihood strategy approach to community-
based planning and assessment: a case study of Molas, Indonesia‖ Impact
Assessment and Project Appraisal 19(4),297-309
WCED(1987). Our Common Future. Oxford: Oxford University Press.
Wearing, S, (2001), Exploring Socio-economic Impacts on Local Communities in Weaver,
D,B and Wallingford, (2001), The Encyclopaedia of Ecotourism, CABI Publishing,
Wells, M. and K. Brandon (1992). People and Parks: Linking Protected Area Management
with Local Communities, Washington, DC: IBRD and World Bank.
Wereld, O. (1979). Sex tourism to Thailand. In ISIS, Tourism and prostitution,
International Bulletin, 13:9-12.
Whyte, W.(1955). Street Corner Society. Chicago: University of Chicago Press.
337
Widener, P. (1996). ―Green boom curries favour: the Tourism Authority of Thailand
(TAT) is facing a tough juggling act promotion ecotourism whilst limiting damage to
the country‘s eco spots‖, PATA Travel News, June, 34-36.
Wilkinson, P. F and W. Pratiwi (1995) ―Gender and Tourism in an Indonesian Village‖
Annals of Tourism Research, Vol. 22 (2). 283-299
Williams, E., (2000). UCOTA-Uganda Community Tourism Association: A comparison
with NACOBTA
Williams, E., White, A. and Spenceley, A. (2001) ―UCOTA – The Uganda Community
Tourism Association: a comparison with NACOBTA‖ Pro-Poor tourism working
paper No.5, ODI/CRT/IIED, May 2001
Wilson, J.C. and Garrod, B. (2003) ―Introduction‖. In B. Garrod and J.C. Wilson (eds)
Marine Ecotourism: Issues and Experiences. Channel View Publications, Clevedon,
pp. 1–11.
Woods, K. (2005) ―Pro-poor tourism as a means of Sustainable development in Vctubabba
Valley, Northern Peru‖ ICRT occasional Paper No.02
World Bank.(2008) ― The Country-level Poverty data‖ The 2005 International Comparison
Program, World Bank
World Travel and Tourism Council (2014) Travel and Tourism Economic impact 2014,
Thailand.


