Embed Size (px)
Citation preview

s 9(2)(a)
Proacti
vely
Releas
ed

Proacti
vely
Releas
ed

Proacti
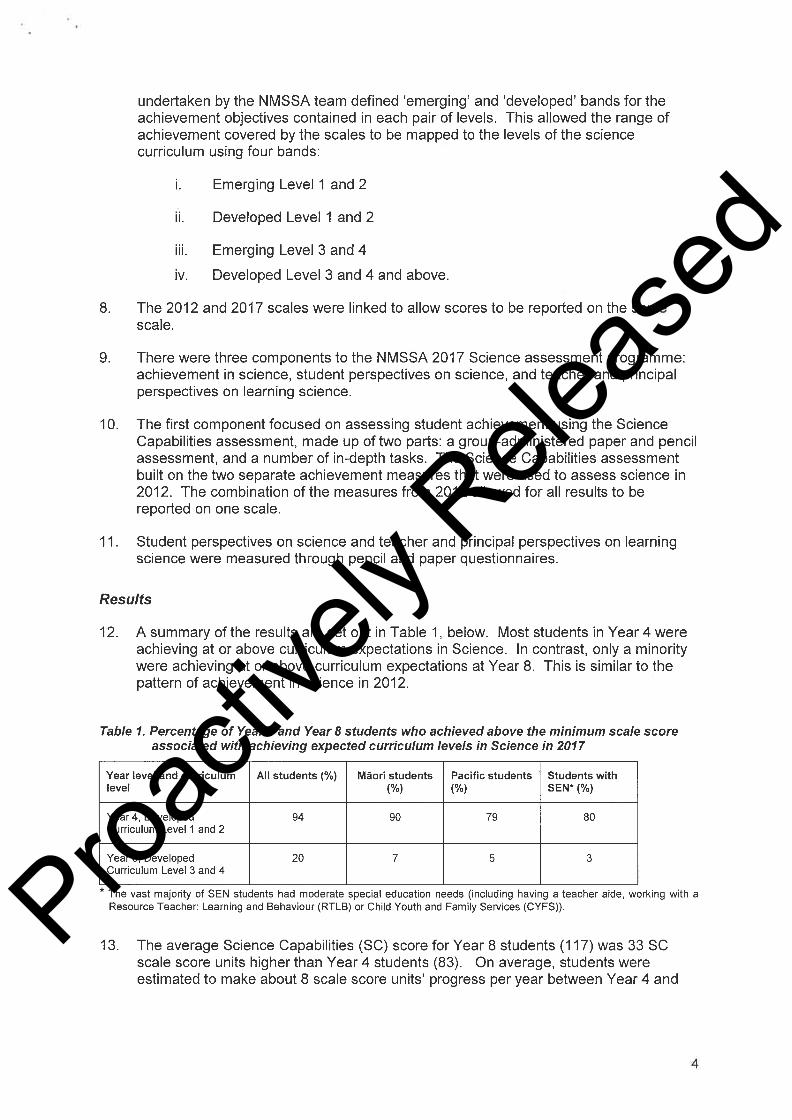
vely
Releas
ed
Proacti
vely
Releas
ed

Proacti
vely
Releas
ed

Proacti
vely
Releas
ed

Proacti
vely
Releas
ed
Proacti
vely
Releas
ed

Proacti
vely
Releas
ed
Proacti
vely
Releas
ed
W ā n a n g a t i a t e P u t a n g a T a u i r a
National Monitoring Studyof Student Achievement
NMSSA
Technical Information 2017Health and Physical Education • Science
NM
SSA • CYCLE 2
NM
SSA Report 18 : TECHNICAL INFORMATION 2017 – Health & Physical Education • Science
NM
SSA • CYCLE 2
NM
SSA Report 18 : TECHNICAL INFORMATION 2017 – Health & Physical Education • Science
ISSN: 2350-3238 (Online only) ISBN: 978-1-927286-45-6 (Online only)
Report 18 NMSSA, Technical Information 2017 – Health and Physical Education • Science
W ā n a n g a t i a t e P u t a n g a Ta u i r a
National Monitoring Studyof Student Achievement
NMSSA Report 18CYCLE 2
Proacti
vely
Releas
ed

Proacti
vely
Releas
ed
Technical Information 2017
Health and Physical Education • Science
Educational Assessment Research Unit
and New Zealand Council for Educational Research
NMSSA Report 18
W a n a n g a t i a t e P u t a n g a Ta u i r a
National Monitoring Study of Student Achievement
Proacti
vely
Releas
ed

© 2018 Ministry of Education, New Zealand
Technical Information 2017 Health and Physical Education, Science (all available online at http://nmssa.otago.ac.nz/reports/index.htm)
National Monitoring Study of Student Achievement Report 18: Technical Information 2017 – Health and Physical Education, Science published by Educational Assessment Research Unit, University of Otago, and New Zealand Council for Educational Research
under contract to the Ministry of Education, New Zealand ISSN: 2350-3238 (Online) ISBN: 978-1-927286-45-6 (Online only)
National Monitoring Study of Student Achievement Educational Assessment Research Unit, University of Otago, PO Box 56, Dunedin 9054, New Zealand
Tel: 64 3 479 8561 • Email: [email protected]
Proacti
vely
Releas
ed

Contents Acknowledgements 4Appendix 1: Sample Characteristics for 2017 5Appendix 2: Methodology for the 2017 NMSSA Programme 12Appendix 3: NMSSA Approach to Sample Weighting 19Appendix 4: NMSSA Sample Weights 2017 26Appendix 5: Variance estimation in NMSSA 32Appendix 6: Variance estimation in 2017 36Appendix 7: Curriculum Alignment of the Learning Through Movement Scale 40Appendix 8: Linking NMSSA Critical Thinking in Health and Physical Education 2013 to 2017 46Appendix 9: Linking NMSSA Science Capabilities 2012 to 2017 51Appendix 10: NMSSA Assessment Framework for Health and Physical Education 2017 55Appendix 11: NMSSA Assessment Framework for Science 2017 70Appendix 12: Plausible Values in NMSSA 77
2017 Project Team EARU NZCER
Management Team Sharon Young Charles Darr Albert Liau
Lynette Jones Jane White
Design/Statistics/ Psychometrics/Reporting
Alison Gilmore Albert Liau Mustafa Asil
Charles Darr Hilary Ferral Jess Mazengarb
Curriculum/Assessment Sharon Young Jane White Catherine Morrison Neil Anderson Gaye McDowell
Sandy Robbins Lorraine Spiller Chris Joyce Rose Hipkins Ally Bull
Programme Support Lynette Jones Jess Mazengarb Linda Jenkins James Rae Pauline Algie Lee Baker External Advisors: Jeffrey Smith – University of Otago, Marama Pohatu – Te Rangatahi Ltd
Proacti
vely
Releas
ed

NMSSA Report 18: Technical Information 2017 – Health and Physical Education, Science 4
Acknowledgements
The NMSSA project team wishes to acknowledge the very important and valuable support and contributions of many people to this project, including:
• members of the reference groups: Technical, Māori, Pacific and Special Education • members of the curriculum advisory panels in learning languages and technology • Principals, teachers and students of the schools where the tasks were piloted and trials were
conducted • principals, teachers and Board of Trustees’ members of the schools that participated in
the 2017 main study including the linking study • the students who participated in the assessments and their parents, whānau and caregivers • the teachers who administered the assessments to the students • the teachers and senior initial teacher education students who undertook the marking • the Ministry of Education Research Team and Steering Committee.
Proacti
vely
Releas
ed

Appendix 1 • NMSSA Report 18: Technical Information 2017 – Health and Physical Education, Science 5
Appendix 1: Sample Characteristics for 2017
Contents:
Samples for 2017 61. Sampling of schools 6
Sampling algorithm 62017 NMSSA sample 7Achieved samples of schools 7
2. Sampling of students 7GAT and InD samples 8
Tables: Table A1.1 The selection of Year 4 students for the GAT and InD samples from 100 schools 8Table A1.2 Comparison of the achieved GAT and InD samples with the expected population characteristics at Year 4 9Table A1.3 The selection of Year 8 students for the GAT and InD samples from 99 schools 10Table A1.4 Comparison of the achieved GAT and InD samples with population characteristics at Year 8 11
Proacti
vely
Releas
ed

6 NMSSA Report 18: Technical Information 2017 – Health and Physical Education, Science • Appendix 1
Samples for 2017 A two-stage sampling design was used to select nationally representative samples of students at Year 4 and at Year 8. The first stage involved sampling schools; the second stage involved sampling students within schools.
A stratified random sampling approach was taken to select 100 schools at Year 4 and 100 schools at Year 8. A maximum of 25 students were randomly selected from each school to form national samples at Year 4 and Year 8.
The Ministry of Education July 2016 school roll returns for Year 3 and Year 7 were used to inform the selection of Year 4 and Year 8 schools in 2017.
1. Sampling of schools Sampling algorithm From the complete list of New Zealand schools select two datasets – one for Year 3 students and the other for Year 7 students.
For the Year 3 sample: • Exclude:
o schools which have fewer than eight Year 3 students o private schools o special schools o Correspondence School o Kura Kaupapa Māori o trial schools o Chatham Island schools.
• Stratify the sampling frame by region and quintile1. • Within each region-by-quintile stratum, order the schools by Year 3 roll size2. • Arrange the strata alternately in increasing and decreasing order of roll size3. • Select a random starting point. • From the random starting point, cumulate the Year 3 roll. • Because 100 schools are required in the sample, the sampling interval is calculated as:
TotalnumberofYear3students100
• Assign each school to a ‘selection group’ using this calculation:
𝑆𝑒𝑙𝑒𝑐𝑡𝑖𝑜𝑛𝑔𝑟𝑜𝑢𝑝 = 𝑐𝑒𝑖𝑙𝑖𝑛𝑔 A𝑐𝑢𝑚𝑢𝑙𝑎𝑡𝑖𝑣𝑒𝑟𝑜𝑙𝑙𝑠𝑎𝑚𝑝𝑙𝑖𝑛𝑔𝑖𝑛𝑡𝑒𝑟𝑣𝑎𝑙F
• Select the first school in each selection group to form the final sample.
Follow the same process for the Year 7 sample.
If a school is selected in both the Year 3 and Year 7 samples, randomly assign it to one of the two samples. Locate the school in the unassigned sample and select a replacement school (next on list). Repeat the process for each school selected in both samples.
1 Decile 1 and 2 comprises quintile 1; Decile 3 and 4 comprises quintile 2; Decile 5 and 6 comprises quintile 3; Decile 7 and 8 comprises
quintile 4; and Decile 9 and 10 comprises quintile 5. 2 Roll size refers to the year level in question e.g. roll size for Year 3 students. 3 This is done so that when replacements are made across stratum boundaries the replacement school is of a similar size to the one it is
replacing.
Proacti
vely
Releas
ed

Appendix 1 • NMSSA Report 18: Technical Information 2017 – Health and Physical Education, Science 7
2017 NMSSA sample The sampling frames constituted 1486 schools for Year 3 and 931 schools for Year 7 after exclusions had been applied. No schools were listed in both samples.
Selected schools were invited to participate in 2017. Therefore 'Year 3 schools' became 'Year 4 schools' and similarly 'Year 7 schools' became 'Year 8 schools'. Those that declined to participate were substituted using the following procedure:
• From the school sampling frame, select the school one row below the school withdrawn. • If this school is not available, re-select by going to one row above the school withdrawn. • If this school is not available, select the school two rows below the school withdrawn. Continue in
this sequence until a substitute is found. In total, 35 schools at Year 4 and 49 schools at Year 8 declined to participate. One Year 8 school was not replaced, due to insufficient time to seek consent from a replacement school and parents.
Achieved samples of schools The achieved sample of 100 schools at Year 4 and 99 schools at Year 8 represented a response rate of 74 percent at Year 4 and 66 percent at Year 8.4
2. Sampling of students After schools agreed to participate in the programme, they were asked to provide a list of all Year 4 (or Year 8) students, identifying any students for whom the experience would be inappropriate (e.g. high special needs (ORS), very limited English language (ESOL), Māori Immersion Level 1, would be absent during the visit, had left the school, health or behavioural issues).
Three intersecting samples were required for the assessment programme: • A group-administered task (GAT) sample for science that included up to 25 students per school
who completed the assessment in science and questionnaires in science, and health and physical education (HPE).
• A subset of (up to) 12 of these students per school formed the group-administered task (GAT) sample for health and PE. These students completed the health and PE computer-based assessments.
• A subset of (up to) eight of these students formed the in-depth (InD) sample that participated in movement game-based activities and interviews in HPE and science.
The procedure for selecting students for the GAT and InD samples was as follows: • Each school provided a list of all students in their school at Year 4 or Year 8 in 2017. A computer-
generated random number between 1 and 1 million was assigned to each student. Students were ranked in order of their random number from lowest to highest.
• The first 25 students in the ordered list were identified as belonging to the GAT science sample. The first 12 students were identified as also belonging to the GAT HPE sample, and the first eight students also belonging to the InD sample.
• The draft school lists of selected students were returned to schools for approval. Principals or contact people were given a second opportunity to identify students for whom the NMSSA assessment would be inappropriate. Any identified students in the GAT sample were replaced with students ranked 26 onwards from the initial list, with earlier rankings 'bumped up', so there were no missing ranks and the maximum GAT sample remained at 25. The resultant list was confirmed and letters of consent were sent to the parents of selected students, via the schools, on our behalf.
• The children of parents who declined to have their child participate were withdrawn from the list and were replaced in the same way as above (if there were sufficient eligible students) – until lists were ‘locked in’ to the master laptop. After this, further replacement students were numbered 26+,
4 School response rate is defined as the number of schools that participated (the achieved sample) as a percentage of the total number of
schools invited to participate including those accepted for the study.
Proacti
vely
Releas
ed
8 NMSSA Report 18: Technical Information 2017 – Health and Physical Education, Science • Appendix 1
with the withdrawn student keeping their existing number, but having a notation that they had been withdrawn. The multiTXT system was used to advise the relevant TA pair that the student list had changed since the one provided at the training week. No replacements were added within two weeks of the date of the school visit, as there was insufficient time to seek parental permission.
• On the day before arrival in each school, TAs checked the final student list. • On-site replacements of students by TAs were made if:
o Any of students 1-8 (the InD sample) were absent or withdrawn (e.g. by the principal) on the first day, prior to the start of assessments. They were replaced by students ranked 9-25, on a best-match basis (e.g. using our gender/ethnicity replacement priorities).
o All other students (up to 25) participated in the GAT science assessments and questionnaire. Twelve students participated in the HPE assessments and questionnaire.
If students were absent or withdrawn (e.g. by the principal) after the start of the assessment programme, no replacements were made.
• The criteria for replacing a student were ethnicity and gender. These criteria were prioritised, so that the replacement student was as closely matched to these criteria as possible. An order of priorities to replace a student was applied. If possible, a replacement student had (i) the same gender and ethnicity. If that was not possible, a student of the (ii) same ethnicity was sought; if that was not possible, then a student of the (iii) same gender and finally, (iv) any student.
GAT and InD samples The following sections describe the achieved GAT and InD samples of students at Year 4 and Year 8, and contrast their demographic characteristics with those of their respective national populations. This allows us to determine the national representativeness of the samples.
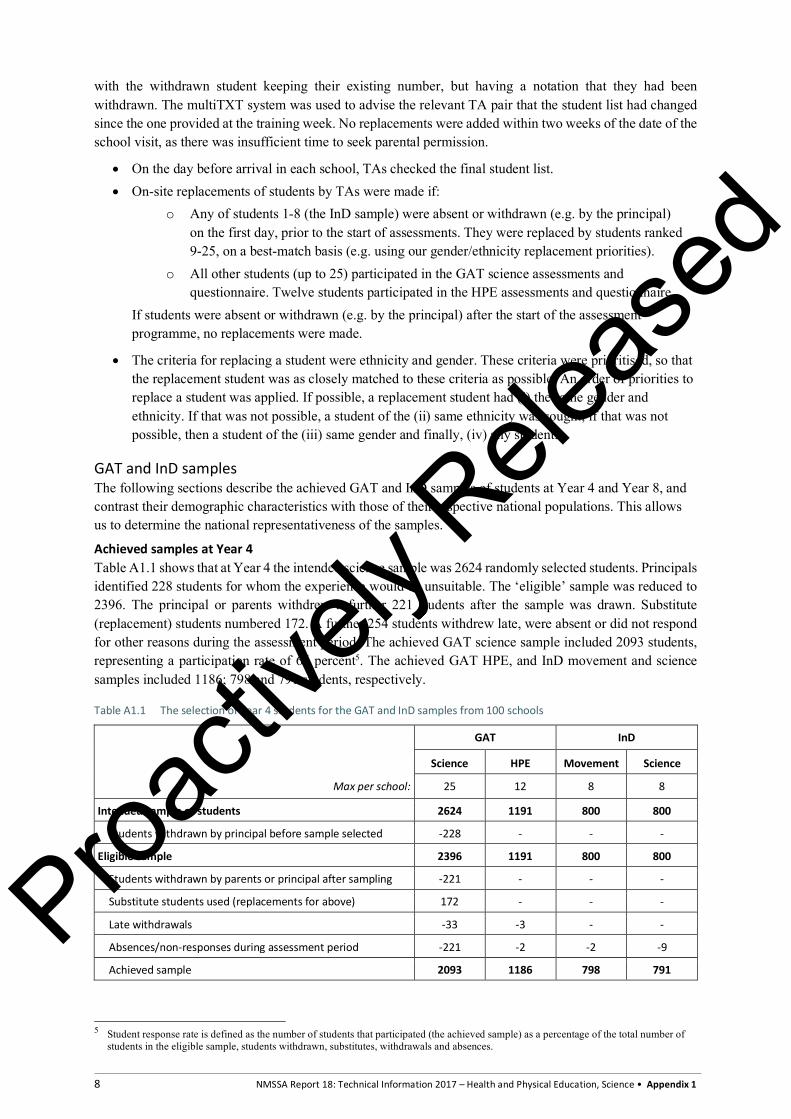
Achieved samples at Year 4 Table A1.1 shows that at Year 4 the intended science sample was 2624 randomly selected students. Principals identified 228 students for whom the experience would be unsuitable. The ‘eligible’ sample was reduced to 2396. The principal or parents withdrew a further 221 students after the sample was drawn. Substitute (replacement) students numbered 172. A further 254 students withdrew late, were absent or did not respond for other reasons during the assessment period. The achieved GAT science sample included 2093 students, representing a participation rate of 66 percent5. The achieved GAT HPE, and InD movement and science samples included 1186; 798 and 791 students, respectively.
Table A1.1 The selection of Year 4 students for the GAT and InD samples from 100 schools
GAT InD
Science HPE Movement Science
Max per school: 25 12 8 8
Intended sample of students 2624 1191 800 800
Students withdrawn by principal before sample selected -228 - - -
Eligible sample 2396 1191 800 800
Students withdrawn by parents or principal after sampling -221 - - -
Substitute students used (replacements for above) 172 - - -
Late withdrawals -33 -3 - -
Absences/non-responses during assessment period -221 -2 -2 -9
Achieved sample 2093 1186 798 791
5 Student response rate is defined as the number of students that participated (the achieved sample) as a percentage of the total number of
students in the eligible sample, students withdrawn, substitutes, withdrawals and absences.
Proacti
vely
Releas
ed

Appendix 1 • NMSSA Report 18: Technical Information 2017 – Health and Physical Education, Science 9
Table A1.2 contrasts the characteristics of the samples with the population.
Table A1.2 Comparison of the achieved GAT and InD samples with the expected population characteristics at Year 4
GAT InD
Population (%)
Science sample N = 2093
(%)
HPE sample N = 1186
(%)
Movement/ Science sample
N = 798 (%)
Gender Boys 51 50 51 51
Girls 49 50 49 49
Ethnicity
European 52 51 51 50
Māori 24 23 25 26
Pacific 10 10 10 10
Asian 10 13 12 12
Other 1 3 2 3
School Quintile
1 17 16
2 17 17
3 16 16
4 22 20
5 28 30
School Type
Contributing (Year 1-6) 61 65
Full Primary (Year 1-8) 36 34
Composite (Year 1-10 & 1-13) 3 1
MOE Region
Auckland 36 36
Bay of Plenty/Rotorua/Taupo 7 7
Canterbury 12 12
Hawkes Bay/Gisborne 5 5
Nelson/Marlborough/West Coast 4 2
Otago/Southland 6 6 Tai Tokerau (Northland) 4 4
Taranaki/Whanganui/Manawatu 7 6
Waikato 9 9 Wellington 11 12
Notes: Ministry of Education July 2016 school roll returns for Year 3. Rounding to integers means that percentages do not always add up to 100 percent. Proa
ctive
ly Rele
ased
10 NMSSA Report 18: Technical Information 2017 – Health and Physical Education, Science • Appendix 1
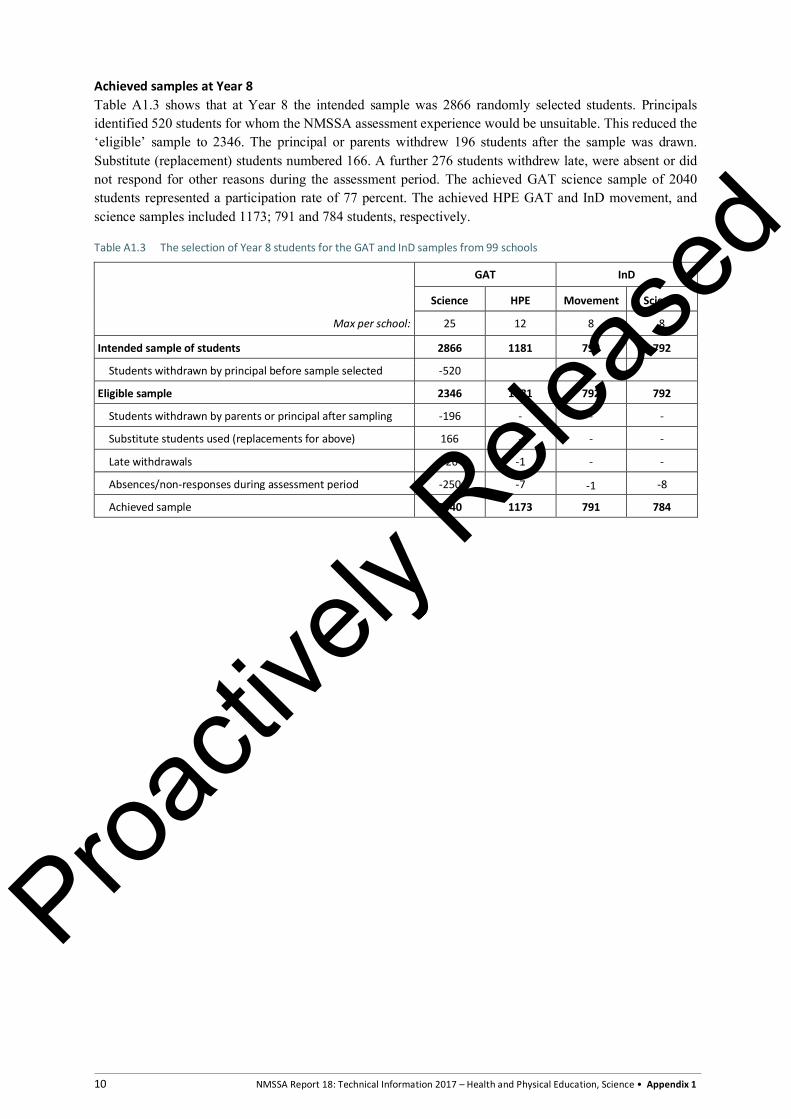
Achieved samples at Year 8 Table A1.3 shows that at Year 8 the intended sample was 2866 randomly selected students. Principals identified 520 students for whom the NMSSA assessment experience would be unsuitable. This reduced the ‘eligible’ sample to 2346. The principal or parents withdrew 196 students after the sample was drawn. Substitute (replacement) students numbered 166. A further 276 students withdrew late, were absent or did not respond for other reasons during the assessment period. The achieved GAT science sample of 2040students represented a participation rate of 77 percent. The achieved HPE GAT and InD movement, and science samples included 1173; 791 and 784 students, respectively.
Table A1.3 The selection of Year 8 students for the GAT and InD samples from 99 schools
GAT InD
Science HPE Movement Science
Max per school: 25 12 8 8
Intended sample of students 2866 1181 792 792
Students withdrawn by principal before sample selected -520
Eligible sample 2346 1181 792 792
Students withdrawn by parents or principal after sampling -196 - - -
Substitute students used (replacements for above) 166 - - -
Late withdrawals -26 -1 - -
Absences/non-responses during assessment period -250 -7 -1
-8
Achieved sample 2040 1173 791 784
Proacti
vely
Releas
ed

Appendix 1 • NMSSA Report 18: Technical Information 2017 – Health and Physical Education, Science 11
Table A1.4 contrasts the characteristics of the samples with the population.
Table A1.4 Comparison of the achieved GAT and InD samples with population characteristics at Year 8
GAT InD
Population (%)
Science sample N = 2093
(%)
HPE sample N = 1186
(%)
Movement/ Science sample
N = 798 (%)
Gender Boys 49 49 50 50
Girls 51 51 50 50
Ethnicity
European 56 55 55 54
Māori 22 23 26 26
Pacific 10 9 7 8
Asian 9 10 9 10
Other 1 2 2 2
School Quintile
1 14 13
2 17 17
3 22 20
4 24 24
5 24 25
School Type
Full Primary (Year 1-8) 35 32
Intermediate 46 44
Secondary (Year 7-15 & 7-10) 14 20
Composite (Year 1-10, 1-15) 5 3
MOE Region
Auckland 34 33
Bay of Plenty/Rotorua/Taupo 8 10
Canterbury 12 11
Hawkes Bay/Gisborne 5 6
Nelson/Marlborough/West Coast 4 3
Otago/Southland 6 6
Tai Tokerau (Northland) 4 5
Taranaki/Whanganui/Manawatu 6 7
Waikato 9 10
Wellington 12 11
Notes: Ministry of Education July 2016 school roll returns for Year 7. Rounding to integers means that percentages do not always add up to 100 percent.
At both year levels the national GAT and InD samples closely matched the characteristics of the population. We have confidence in their national representativeness.
Proacti
vely
Releas
ed

NMSSA Report 18: Technical Information 2017 – Health and Physical Education, Science • Appendix 2 12
Appendix 2: Methodology for the 2017 NMSSA Programme
Contents:
1. The 2017 Health and Physical Education assessment programme 132. Development and trialling of tasks 14
Administration of the assessment tasks 14Critical Thinking in Health and Physical Education 14Learning Through Movement 14
3. 2017 Science assessment programme 15Development of the group-administered part of the SC assessment 15
4. Marking 165. Creating the achievement scales 16
Standardising the scales 16Scale descriptions 16
6. Linking results from cycle 1 to cycle 2 177. Reporting achievement against curriculum levels 178. Development of questionnaires for examining contextual information 179. Administration of the questionnaires 18
Tables: Table A2.1 The key features of the 2013 and 2017 HPE assessment programmes 13Table A2.2 The key features of the 2012 and 2017 Science assessment programmes 15
Proacti
vely
Releas
ed

Appendix 2 • NMSSA Report 18: Technical Information 2017 – Health and Physical Education, Science 13
This appendix outlines the methodology for the 2017 health and physical education (HPE) and science study undertaken by the National Monitoring Study of Student Achievement (NMSSA).
1. The 2017 Health and Physical Education assessment programme The 2017 HPE assessment programme built upon the assessment framework and associated assessment programme developed for the 2013 HPE study. In 2017, we sought to develop a set of group-administered tasks (GAT) for assessing critical thinking in HPE to be administered via laptop to 1200 students at Year 4 and 1200 students at Year 8. We also sought to include a greater number of tasks assessing movement skills in order to construct a separate measurement scale focused on these skills. Table A2.1 summarises the key differences between the assessment programmes in 2013 and 2017. See Appendix 10 for the 2017 assessment framework.
Table A2.1 The key features of the 2013 and 2017 HPE assessment programmes
2013 2017
Assessment approaches
The Critical Thinking in Health and Physical Education (CT) assessment was made up of in-depth (InD) tasks using interviews and individual or group activities. The tasks used mainly health contexts.
Responses from the CT tasks were used to create an IRT measurement scale.
A small number of movement skills in authentic game contexts were developed and reported descriptively. All assessments were videoed.
A separate interview task was focused on students’ understandings of well-being. Results for the well-being task were reported descriptively.
The CT scale was expanded to include more health and movement contexts. The assessment combined new group-administered tasks (GAT) administered on laptops and InD tasks (interviews and movement tasks).
The number of tasks assessing movement skills was increased and responses used to form a new measurement scale called Learning Through Movement (LTM).
The well-being task was retained and once again the results reported descriptively.
Number of students
Eight students per school participated in the InD tasks, giving a total of 800 students at Year 4 and 800 students at Year 8.
Up to 12 students per school participated in the GAT. Eight students per school participated in the movement tasks and eight students per school participated in CT (and science) interviews.
Proacti
vely
Releas
ed

NMSSA Report 18: Technical Information 2017 – Health and Physical Education, Science • Appendix 2 14
2. Development and trialling of tasks The NMSSA team reviewed all 2013 tasks for possible inclusion in the 2017 assessment programme. Some tasks were retained in their original format to be used as link tasks, necessary for making comparisons between 2013 and 2017. Tasks were based on the focus of the HPE learning area, which is defined as: ‘the well-being of the students themselves, of other people and of society through learning in health-related and movement contexts’ (NZC6, p.22). The assessment frameworks for critical thinking in HPE, and movement skills are described in Appendix 7. New and modified tasks were piloted in local schools before being used in a NMSSA trial involving schools in Auckland and Otago. The student responses from the pilots and the trial were used to refine the tasks and support the development of appropriate scoring guides. An Item Response Theory (IRT) model7 was applied to the trial data to help refine the tasks, inform the selection of tasks for the main study and explore the development of two reporting scales – one in Critical Thinking in Health and Physical Education (CT) that paralleled and extended the 2013 scale, and one in Learning Through Movement (LTM).
Administration of the assessment tasks Twenty-four teacher assessors were trained in the administration of tasks during a five-day training programme prior to the main study. Teacher assessors were carefully monitored and received feedback to ensure consistency of administration. During the study, up to 12 students in each school responded to the HPE GAT. Up to eight out of the 12 students participated in the movement tasks and in the interview tasks (for HPE and Science). Student responses were captured on video and paper, and stored electronically for marking.
Critical Thinking in Health and Physical Education The CT assessment included a computer-presented assessment component (GAT), where students responded independently on paper. About 1200 students at each year level answered one of four linked GAT versions of the assessment. In addition, 800 students at each year level participated in a number of InD one-to-one interviews that were video recorded. These tasks probed students’ ability to explore aspects of HPE where their ability to demonstrate what they know and understand might be compromised if they were expected to write their responses. The CT assessment consisted of 16 tasks, four of which were link tasks from the 2013 study.
Learning Through Movement The LTM assessment included seven tasks conducted in authentic game contexts; two tasks were retained from the 2013 study, and one of these tasks was modified.
6 Ministry of Education (2007). The New Zealand Curriculum. Wellington: Learning Media. 7 IRT is an approach to constructing and scoring assessments and surveys that measure mental competencies and attitudes. IRT seeks to
establish a mathematical model to describe the relationship between people (in terms of their levels of ability or the strengths of their attitude) and the probability of observing a correct answer or a particular level of response to individual questions. IRT approaches provide flexible techniques for linking assessments made up of different questions to a common reporting scale. The common scale allows the performance of students to be compared regardless of which form of the assessment they were administered.
Proacti
vely
Releas
ed

Appendix 2 • NMSSA Report 18: Technical Information 2017 – Health and Physical Education, Science 15
3. 2017 Science assessment programme The 2017 science assessment programme built upon the science programme used in 2012. The biggest change was a move from two reporting scales to one. The programme retained many of the tasks used in 2012 and included a range of new tasks. Table A2.2 compares the assessment programmes for 2012 and 2017.
Table A2.2 The key features of the 2012 and 2017 Science assessment programmes
2012 2017
Assessment approaches
Two separate assessments: • a 45-minute group-administered paper-and-
pencil assessment involving selected response and short answer questions called the Knowledge and Communication of Science ideas
• a selection of individual one-to-one interview tasks and individual and team performance activities called the Nature of Science assessment.
Two separate scales were constructed
One assessment made up of two types of tasks: • a 45-minute, paper-and-pencil group-
administered component involving selected response and short answer questions
• a selection of in-depth tasks involving student interviews and independent ‘station’ tasks.
Responses from both components were used to construct one scale: the science capabilities (SC) scale.
Number of students
Up to 25 students per school participated in the paper-and-pencil assessment. Eight of these students per school participated in the in-depth tasks.
Up to 25 students per school participated in the paper-and-pencil assessment. Eight of these students per school participated in the in-depth tasks.
Development of the group-administered part of the SC assessment The group-administered part of the SC assessment was based on the questions developed for the group-administered assessment used in the 2012 study. Assessment development staff within the NMSSA project reviewed the existing items in order to identify areas where new items could be added to support the assessment framework and broaden the pool of questions. They then wrote a collection of new questions to cover these areas. All new questions were carefully reviewed, before being piloted in a range of schools in the Wellington area. The results from the piloting were used to select and fine-tune questions for a larger national trial.
The national item trial was held in March of 2017. The trial involved about 400 students at each of Year 4 and Year 8 and enabled the development team to refine the new items as needed and then select a final bank of questions for use in the main study.
Twelve group-administered assessment forms were constructed for the 2017 study, based on the final pool of questions (seven forms at Year 8 and five at Year 4). Each form was linked to the other forms through the use of common questions.
Development of the in-depth tasks for science A selection of in-depth tasks was also developed as part of the SC assessment. These were designed to be more open-ended than the group-administered tasks and to stimulate extended responses from students.
Development began with a review of in-depth tasks used in 2012. Some of these tasks were adapted for use in 2017. A selection of new tasks was also developed. Most of the tasks were designed to be administered as part of a one-to-one interview with a teacher assessor, while some were designed to be completed independently as part of a group of ‘stations’ activities. Many of the in-depth tasks required students to use equipment or consider a rich stimulus.
An initial group of in-depth tasks were piloted in local schools in Wellington and Auckland in late 2016 and early 2017. Some of these were then used in a larger item trial held in March 2017 that involved a selection of schools in Auckland and Otago. Data from the pilots and trials were used to refine the tasks and their associated scoring rubrics. As a result of the development process, six in-depth tasks were selected for use in the main 2017 study. Five of the final tasks were interview tasks and one was a stations task.
Proacti
vely
Releas
ed

NMSSA Report 18: Technical Information 2017 – Health and Physical Education, Science • Appendix 2 16
Use of the SC assessment in the 2017 NMSSA study Teacher assessors were instructed on how to administer the SC assessment during a five-day training session prior to the main study.
The group-administered part of the SC assessment was administered to up to 25 students in each school. The students in each school did the same assessment form. Up to eight students in each school completed the in-depth tasks.
Linking Year 4 and Year 8 results in Science To enable achievement to be linked across Year 4 and Year 8, three additional group-administered assessment forms were constructed using a mix of questions from both year levels. These were administered to a sample of about 600 Year 6 students from schools across the country. The Year 6 schools used were additional schools not already involved in the NMSSA study.
4. Marking Teacher markers, some of whom had been teacher assessors, and third-year University of Otago College of Education students were employed to mark the tasks. All markers were trained, and quality assurance procedures were used to ensure consistency of marking. The marking schedules were refined as necessary to ensure they reflected the range of responses found in the main study. Students’ scores were entered directly by the markers into the electronic database.
The inter-rater reliability (intra-class correlation coefficient) for 66 percent of the questions was ‘excellent’ (greater than 0.75) and for 34 percent, it was ‘good’ (between 0.60 and 0.74) (Cicchetti, 1994)8).
5. Creating the achievement scales The Rasch IRT model was applied to all student responses from the items in the CT, LTM and SC assessments. This approach included analysing the items used in the assessments for any differential item functioning with respect to year level, gender and ethnicity.
The IRT approach allowed a set of plausible values to be generated for each student involved in the study. Plausible values take into account the imprecision associated with scores on an assessment, which can produce biased estimates of how much achievement varies across a population. Each set of plausible values represents the range of achievement levels a student might reasonably be expected to attain given their responses to the assessment items. Plausible values provide more accurate estimates of population and subgroup statistics, especially when the number of items answered by each student is relatively small.
Standardising the scales For ease of understanding, each scale was standardised so that:
• the mean of Year 4 and Year 8 students combined was equal to 100 scale score units • the average standard deviation for the two year levels was equal to 20 scale score units.
Achievement on the scales ranged from about 20 to 180 units.
The scales locate both student achievement and relative task difficulty on the same measurement continuums using scale scores.
Scale descriptions The scales for HPE and science were described to indicate the range of knowledge and skills assessed.
To create the scale descriptions, the scoring categories for each item (e.g. 0, 1 or 2) in the CT, LTM and SC assessments were located on the respective scales. This meant identifying where the students who scored in each category were most likely to have achieved overall on the scale. Once this had been done for all items, the NMSSA team identified the competencies exhibited as the scale locations associated with the different scoring categories increased, and students’ responses became more sophisticated. The result was a multi-part 8 Cicchetti, D. V. (1994). Guidelines, criteria, and rules of thumb for evaluating normed and standardized assessment instruments in
psychology. Psychological assessment, 6(4), 284. NMSSA used SPSS to calculate inter-marker reliability using one-way random effects model, absolute agreement, average-measures ICC.
Proacti
vely
Releas
ed

Appendix 2 • NMSSA Report 18: Technical Information 2017 – Health and Physical Education, Science 17
description for each scale, providing a broad indication of what students typically know and can do when achieving at different places on the scale.
The descriptions were provided to give readers of NMSSA reports a strong sense of how science and HPE were assessed through the assessments. The scale descriptors were not written to necessarily ‘line up’ with curriculum levels or achievement objectives. They were a direct reflection of what was assessed and how relatively hard or easy students found the content of the assessment.
6. Linking results from cycle 1 to cycle 2 In order to compare results from cycle 1 with those from 2017 separate scale linking exercises were carried out for science and HPE. The exercises involved comparing the scale locations of the common questions used in the assessments at the different points of time. As part of the exercises, the cycle 1 scales were reconstructed using the same plausible values approach that was used in 2017 (plausible values were not used in 2012 and 2013 when science and HPE were first assessed). The linking exercises indicated that transformations could be used to link the scales. These transformations were applied allowing results from both cycles to be compared. Further information about the linking processes can be found in Appendix 6 (HPE) and Appendix 7 (science).
7. Reporting achievement against curriculum levels For science, a curriculum alignment exercise in 2013 was used to determine achievement expectations (cut-scores) on the 2012 science scale associated with achievement at different curriculum levels. Linking the 2012 scale to the 2017 SC scale allowed these cut-scores to be located on the SC scale. A similar curriculum alignment for HPE was carried out in 2014 for HPE. This, along with the scale linking exercise for HPE allowed achievement on the 2017 CT scale to be reported against curriculum levels.
A committee of learning area experts was convened in early 2018 to carry out a curriculum alignment exercise related to the LTM scale. The exercise was used to determine cut-scores related to achieving curriculum level objectives at level 2 and 4 of the HPE curriculum.
8. Development of questionnaires for examining contextual information In order to gain a better understanding of student achievement in New Zealand, NMSSA collects contextual information through questionnaires to students, teachers and principals. A conceptual framework for describing the contextual information to be collected by NMSSA during cycle 2 sought to:
• build (and improve) on the contextual information collected in the first cycle • learn from the literature about important factors that influence achievement and consider them for
including in NMSSA • address the thematic contextual questions set out in the respective assessment plans9.
One new development in cycle 2 was the creation of additional measurement scales to report on different aspects of the contextual information.
For the student questionnaire, items were developed to construct the following scales: • Attitude to Health • Attitude to PE • Attitude to Science • Confidence in Health • Confidence in PE • Confidence in Science.
9 Gilmore, A. (2016). Towards a NMSSA conceptual framework. NMSSA Working Paper.
Proacti
vely
Releas
ed

NMSSA Report 18: Technical Information 2017 – Health and Physical Education, Science • Appendix 2 18
For the teacher questionnaire, items were developed to construct the following scales: • Satisfaction with Teaching • Confidence10 in Teaching Health • Confidence in Teaching PE • Confidence in Teaching Science.
The scales were constructed using the Rasch model. This approach included analysing the items used in the assessments for any differential item functioning with respect to year level, gender and ethnicity. Unlike the achievement measures, plausible values were not generated for the contextual scales. Each scale was standardised in the same way as the achievement scales.
To aid interpretation of the contextual scales, each scale was divided into separate score ranges to provide different reporting categories. For instance, the Attitude to Science scale was broken down into three score ranges. The ‘very positive’ part of the scale was associated with students mainly using the ‘totally agree’ category to respond to each of the questionnaire statements related to attitude, the ‘positive’ section of the scale was associated with students mainly using either ‘agree a lot’ or ‘agree a little’, and the ‘not positive’ part of the scale was associated with students mainly using ‘do not agree at all’.
9. Administration of the questionnaires All students who participated in the Science and HPE assessments were expected to respond to the associated student questionnaire items. Three teachers from each school completed the teacher questionnaire. These were classroom teachers, HPE specialist teachers and science specialist teachers. The principal or a designated school leader (if principal unavailable) from each school completed the principal questionnaire.
10 In the conceptual framework, we refer to this construct as ‘teacher self-efficacy’ but we think readers will be more familiar with the term
‘confidence’
Proacti
vely
Releas
ed
Appendix 3 • NMSSA Report 18: Technical Information 2017 – Health and Physical Education, Science 19
Appendix 3: NMSSA Approach to Sample Weighting
Contents:
1. Introduction 20How to assess the need for weights 20Multiple ethnicities 20
2. Method 20Post-strata 20Calculating weights 21
3. Do the sample weights change the results? An example 21Summary graphics 24Establishing the cut-points 45
Figures: Figure A3.1 Year 4 science achievement 21Figure A3.2 Year 8 science achievement 21Figure A3.3 Comparison of unweighted to weighted estimates 24Figure A3.4 Comparison of weighted and unweighted science scores, by year level 24Figure A3.5 Comparison of Year 4 science scores, by quintile 25Figure A3.6 Comparison of Year 8 science scores, by quintile 25Figure A3.7 Comparison of science scores by gender 25Figure A3.8 Comparisons of Year 4 science scores, by ethnicity 25Figure A3.9 Comparisons of Year 8 science scores, by ethnicity 25
Tables:
Table A3.1 Post-strata (20 cells) for one ethnic group 21Table A3.2 Comparison of Year 4 results for NMSSA science achievement: Weighted and unweighted data 22Table A3.3 Comparison of Year 8 results for NMSSA science achievement: Weighted and unweighted data 23
Proacti
vely
Releas
ed
NMSSA Report 18: Technical Information 2017 – Health and Physical Education, Science • Appendix 3 20
1. Introduction NMSSA reports on achievement levels in different learning areas for Year 4 and Year 8 student populations in New Zealand. The NMSSA sample is drawn so that students in New Zealand have an approximately equal chance of being selected into the sample. To achieve this, NMSSA randomly samples students within randomly-sampled, state and state-integrated schools, using school stratification variables: region, decile and school size.
NMSSA also reports achievement levels for some key subgroups that are not directly accounted for in the initial sample stratification (for instance, gender and ethnicity). These key subgroups may not be properly nationally represented in the achieved sample as they were not included in the original school stratification. Applying post-stratification weights can correct for misrepresentation of subgroups.
Each year NMSSA selects a new sample to assess achievement in up to two learning areas.
This paper describes the general method NMSSA uses to calculate sample weights. Up to the present time, annual investigations into the necessity for incorporating sample weights have resulted in a recommendation that weights are an unneeded addition to analysis.
While NMSSA continues to sample schools and students using the standard NMSSA sample procedure11 , it is unlikely that sample weights will prove necessary to analysis. However, each year the new achievement data is checked for representativeness overall and in key subgroups, and comparisons between using weighted and unweighted data are briefly summarised in the annual technical report.
If, at any time in the future, the use of weights is deemed necessary, the affected technical documents will be updated.
How to assess the need for weights Where sample weights are seen to make no significant difference to the reported results in any of the key reporting groups or subgroups, NMSSA will report findings without reference to sample weights.
Multiple ethnicities NMSSA data is reported allowing for students to belong to multiple ethnic groups. In applying sample weights this must be taken into consideration. Tables of numbers of students by gender and by non-prioritised ethnicity for each school are specially provided to NMSSA by the Ministry of Education (MoE) each year. The publically available July school roll returns contain all other information needed to calculate national probabilities of group (and subgroup) membership.
2. Method The NMSSA sample has two mutually exclusive parts: a Year 4 sample, and a Year 8 sample. The samples are selected to be representative at a national level in each of these year groups. For details of the sampling methodology Appendix 1, Sample Characteristics for 2017. The initial sample stratification variables are region, school decile and roll size in the year group of interest. Students are selected randomly from within each selected school.
Post-strata The achieved NMSSA student sample is post-stratified as follows:
• Quintile (quintiles 1 - 5) • Gender (female/male) • Ethnic group(s)
o NZE/non-NZE o Māori/non-Māori o Pacific/non-Pacific o Asian/non-Asian
11 Appendix 1: Sample Characteristics for 2017.
Proacti
vely
Releas
ed

Appendix 3 • NMSSA Report 18: Technical Information 2017 – Health and Physical Education, Science 21
Each ethnic group is treated separately to allow for students belonging to multiple ethnic groups. Each sample member is initially assigned four separate sample weights, one for each ethnic group.
For each ethnic group a sample member belongs to one of 20 possible strata. See Table A3.1.
Table A3.1 Post-strata (20 cells) for one ethnic group
Calculating weights For each ethnic group weights are calculated as follows:
Weight = GHIJHKLMINOJOPQPHRSTUVWSTXGHIJHKLMINOJOPQPHRYTZ[X\
A final weight taking an average over all four weights is then calculated. This final weight is suitable to be used for reporting purposes if recommended.
3. Do the sample weights change the results? An example What follows is an example of the 2017 results for science achievement. The tables and graphics shown in this section are part of the standard annual weighting investigation procedure.
Figure A3.1 and Figure A3.2 show the overall distributions of science achievement at both Year 4 and at Year 8. They show there is very little difference with respect to unweighted or weighted data.
Figure A3.1 Year 4 science achievement
Figure A3.2 Year 8 science achievement
Qunitile
GenderEthnic group
indicator1 0 1 0 1 0 1 0 1 0 1 0 1 0 1 0 1 0 1 0
Female Male Female Male
2 3 4 5Female Male Female Male Female Male
1
Proacti
vely
Releas
ed

NMSSA Report 18: Technical Information 2017 – Health and Physical Education, Science • Appendix 3 22
In Table A3.2 and 0 very slight differences can be seen across all sub-groups in the mean and standard deviation estimates. However, since all weighted estimates are well within a standard error of the unweighted estimate, weights are not deemed to be necessary to further analysis.
Table A3.2 Comparison of Year 4 results for NMSSA science achievement: Weighted and unweighted data
Mean12 (unweighted)
sd (unweighted)
Mean (weighted)
sd (weighted)
Difference N
All 82.7 0.6 82.2 0.6 -0.5 2094
Girls 84.5 0.8 84.3 0.8 -0.2 1039
Boys 80.4 0.8 80.3 0.8 -0.1 1055
NZE 87.5 0.6 87.4 0.6 -0.1 1238
NZE girls 89.3 0.9 89.2 0.9 -0.1 615
NZE boys 85.8 0.9 85.7 0.9 -0.1 623
Māori 72.9 1.1 72.7 1.1 -0.2 484
Māori girls 76.3 1.4 76.2 1.4 -0.1 234
Māori boys 69.7 1.6 69.6 1.6 -0.1 250
Pacific 66.3 1.6 66.1 1.6 -0.2 254
Pacific girls 69.0 2.1 68.9 2.1 -0.1 136
Pacific boys 63.1 2.4 62.9 2.4 -0.2 118
Asian 88.6 1.4 88.6 1.4 0.0 287
Asian girls 89.8 1.9 89.6 1.9 -0.2 152
Asian boys 87.4 2.0 87.4 2.0 0.0 135
Quintile 1 64.0 1.3 63.9 1.3 -0.1 334
Quintile 2 78.1 1.3 78.1 1.3 0.0 365
Quintile 3 81.7 1.3 81.7 1.3 0.0 341
Quintile 4 87.6 1.1 87.6 1.1 0.0 420
Quintile 5 91.7 0.9 91.7 0.9 0.0 634
12 All measures relating to the NMSSA science scale are recorded in NMSSA scale score units in all tables.
Proacti
vely
Releas
ed

Appendix 3 • NMSSA Report 18: Technical Information 2017 – Health and Physical Education, Science 23
Table A3.3 Comparison of Year 8 results for NMSSA science achievement: Weighted and unweighted data
Mean (unweighted)
sd (unweighted)
Mean (weighted)
sd (weighted)
Difference N
All 116.7 0.5 116.3 0.5 -0.4 2040
Girls 118.6 0.7 118.2 0.7 -0.4 1034
Boys 114.8 0.8 114.5 0.8 -0.3 1006
NZE 121.0 0.6 120.9 0.6 -0.1 1285
NZE girls 122.6 0.8 122.5 0.8 -0.1 667
NZE boys 119.3 0.9 119.2 0.9 -0.1 618
Māori 107.0 1.0 106.7 1.0 -0.3 473
Māori girls 109.7 1.4 109.5 1.4 -0.2 241
Māori boys 104.2 1.4 104.0 1.4 -0.2 232
Pacific 103.7 1.4 103.5 1.4 -0.2 224
Pacific girls 106.2 2.0 105.8 2.0 -0.4 105
Pacific boys 101.6 2.0 101.6 2.0 0.0 119
Asian 122.1 1.7 121.7 1.7 -0.4 205
Asian girls 123.5 2.4 123.1 2.4 -0.4 97
Asian boys 120.7 2.3 120.5 2.3 -0.2 108
Quintile 1 102.0 1.3 101.9 1.3 -0.1 267
Quintile 2 110.2 1.2 110.1 1.2 -0.1 353
Quintile 3 116.1 1.1 116.0 1.1 -0.1 407
Quintile 4 121.5 1.0 121.4 1.0 -0.1 494
Quintile 5 124.7 0.9 124.7 0.9 0.0 519
Proacti
vely
Releas
ed

NMSSA Report 18: Technical Information 2017 – Health and Physical Education, Science • Appendix 3 24
Summary graphics Other standard summary graphics help to arrive at a sensible conclusion.
Figure A3.3 graphs the differences between unweighted and weighted estimates. The magnitude of the differences compared to the 95 percent confidence intervals is very clear. Note that the dotted lines are included as a visual aid only.
Figure A3.3 Comparison of unweighted to weighted estimates
Figures A3.4 to A3.9 provide more standard comparative plots showing distributions of achievement scales in various key subgroups.
Figure A3.4 Comparison of weighted and unweighted science scores, by year level Proa
ctive
ly Rele
ased

Appendix 3 • NMSSA Report 18: Technical Information 2017 – Health and Physical Education, Science 25
Figure A3.5 Comparison of Year 4 science scores, by quintile
Figure A3.6 Comparison of Year 8 science scores, by quintile
Figure A3.7 Comparison of science scores by gender
Figure A3.8 Comparisons of Year 4 science scores,
by ethnicity Figure A3.9 Comparisons of Year 8 science scores, by ethnicity
Proacti
vely
Releas
ed

NMSSA Report 18: Technical Information 2017 – Health and Physical Education, Science • Appendix 4 26
Appendix 4: NMSSA Sample Weights 2017
Contents:
1. Introduction 272. Summary 273. Science Capabilities 284. Critical Thinking in Health and PE tables 30
Tables:
Table A4.1 NMSSA Science Capabilities achievement Year 4: Comparison of estimates with weighted and unweighted data 28
Table A4.2 NMSSA Science Capabilities achievement Year 8: Comparison of estimates with weighted and unweighted data 29
Table A4.3 NMSSA Critical Thinking in Health and PE achievement Year 4: Comparison of estimates with weighted and unweighted data 30
Table A4.4 NMSSA Critical Thinking in Health and PE achievement Year 8: Comparison of estimates with weighted and unweighted data 31
Proacti
vely
Releas
ed

Appendix 4 • NMSSA Report 18: Technical Information 2017 – Health and Physical Education, Science 27
1. Introduction The methodology for calculating sample weights on an annual basis is detailed in Appendix 3.
Each year NMSSA provides a brief summary of the effect of applying sample weights in the analysis of the current year’s data and makes a recommendation as to whether weights should be used or not.
In 2017 NMSSA measured achievement in Science Capabilities (SC), Critical Thinking in Health and Physical Education (CT), and Learning Through Movement (LTM). The 2017 weighting investigation applies to the SC assessment which was completed by the entire NMSSA sample, and the CT assessment completed by a subsample (about half of the complete sample). The LTM assessment was completed by a smaller subsample, and is not included in this analysis. Details of sample and subsample sizes can be found in Appendix 1, Characteristics of the Sample 2017.
All scale locations in the tables that follow are recorded in NMSSA scale score units relating to the learning area in question.
2. Summary All weighted estimates are well within one standard error of the estimated unweighted mean.
The recommendation is to proceed with the 2017 analysis without sample weights.
Tables of estimates13 calculated with and without weights follow.
13 All estimates of means and standard errors in this document are calculated with the full sample size rather than the effective sample size
defined by the design effect calculations.
Proacti
vely
Releas
ed

NMSSA Report 18: Technical Information 2017 – Health and Physical Education, Science • Appendix 4 28
3. Science Capabilities Table A4.1 NMSSA Science Capabilities achievement Year 4: Comparison of estimates with weighted and unweighted
data
Mean (unweighted)
se (unweighted)
Mean (weighted)
se (weighted) Difference N
All 82.7 0.6 82.2 0.6 -0.5 2094
Girls 84.5 0.8 84.3 0.8 -0.2 1039
Boys 80.4 0.8 80.3 0.8 -0.1 1055
NZE 87.5 0.6 87.4 0.6 -0.1 1238
NZE girls 89.3 0.9 89.2 0.9 -0.1 615
NZE boys 85.8 0.9 85.7 0.9 -0.1 623
Māori 72.9 1.1 72.7 1.1 -0.2 484
Māori girls 76.3 1.4 76.2 1.4 -0.1 234
Māori boys 69.7 1.6 69.6 1.6 -0.1 250
Pacific 66.3 1.6 66.1 1.6 -0.2 254
Pacific girls 69.0 2.1 68.9 2.1 -0.1 136
Pacific boys 63.1 2.4 62.9 2.4 -0.2 118
Asian 88.6 1.4 88.6 1.4 0.0 287
Asian girls 89.8 1.9 89.6 1.9 -0.2 152
Asian boys 87.4 2.0 87.4 2.0 0.0 135
Quintile 1 64.0 1.3 63.9 1.3 -0.1 334
Quintile 2 78.1 1.3 78.1 1.3 0.0 365
Quintile 3 81.7 1.3 81.7 1.3 0.0 341
Quintile 4 87.6 1.1 87.6 1.1 0.0 420
Quintile 5 91.7 0.9 91.7 0.9 0.0 634
Proacti
vely
Releas
ed

Appendix 4 • NMSSA Report 18: Technical Information 2017 – Health and Physical Education, Science 29
Table A4.2 NMSSA Science Capabilities achievement Year 8: Comparison of estimates with weighted and unweighted data
Mean (unweighted)
se (unweighted)
Mean (weighted)
se (weighted) Difference N
All 116.7 0.5 116.3 0.5 -0.4 2040
Girls 118.6 0.7 118.2 0.7 -0.4 1034
Boys 114.8 0.8 114.5 0.8 -0.3 1006
NZE 121.0 0.6 120.9 0.6 -0.1 1285
NZE girls 122.6 0.8 122.5 0.8 -0.1 667
NZE boys 119.3 0.9 119.2 0.9 -0.1 618
Māori 107.0 1.0 106.7 1.0 -0.3 473
Māori girls 109.7 1.4 109.5 1.4 -0.2 241
Māori boys 104.2 1.4 104.0 1.4 -0.2 232
Pacific 103.7 1.4 103.5 1.4 -0.2 224
Pacific girls 106.2 2.0 105.8 2.0 -0.4 105
Pacific boys 101.6 2.0 101.6 2.0 0.0 119
Asian 122.1 1.7 121.7 1.7 -0.4 205
Asian girls 123.5 2.4 123.1 2.4 -0.4 97
Asian boys 120.7 2.3 120.5 2.3 -0.2 108
Quintile 1 102.0 1.3 101.9 1.3 -0.1 267
Quintile 2 110.2 1.2 110.1 1.2 -0.1 353
Quintile 3 116.1 1.1 116.0 1.1 -0.1 407
Quintile 4 121.5 1.0 121.4 1.0 -0.1 494
Quintile 5 124.7 0.9 124.7 0.9 0.0 519
Proacti
vely
Releas
ed

NMSSA Report 18: Technical Information 2017 – Health and Physical Education, Science • Appendix 4 30
4. Critical Thinking in Health and PE tables Table A4.3 NMSSA Critical Thinking in Health and PE achievement Year 4: Comparison of estimates with weighted
and unweighted data
Mean (unweighted)
se (unweighted)
Mean (weighted)
se (weighted) Difference N
All 81.1 0.7 80.7 0.7 -0.4 1198
Girls 84.8 0.9 84.7 0.9 -0.1 583
Boys 77.0 1.0 77.0 1.0 0.0 615
NZE 85.7 0.8 85.6 0.8 -0.1 700
NZE girls 90.0 1.1 90.0 1.1 0.0 340
NZE boys 81.6 1.2 81.6 1.2 0.0 360
Māori 74.9 1.4 74.7 1.4 -0.2 298
Māori girls 80.1 1.8 80.0 1.8 -0.1 148
Māori boys 69.8 2.0 69.7 2.0 -0.1 150
Pacific 67.1 2.1 66.9 2.1 -0.2 140
Pacific girls 73.2 2.9 73.0 3.0 -0.2 71
Pacific boys 60.9 2.7 60.8 2.7 -0.1 69
Asian 82.3 1.9 82.2 1.9 -0.1 146
Asian girls 84.9 2.5 84.7 2.5 -0.2 74
Asian boys 79.7 2.7 79.6 2.7 -0.1 72
Quintile 1 66.6 1.7 66.5 1.7 -0.1 193
Quintile 2 78.9 1.6 78.9 1.6 0.0 213
Quintile 3 81.3 1.6 81.3 1.6 0.0 210
Quintile 4 82.5 1.5 82.5 1.5 0.0 234
Quintile 5 88.5 1.1 88.4 1.1 -0.1 348
Proacti
vely
Releas
ed

Appendix 4 • NMSSA Report 18: Technical Information 2017 – Health and Physical Education, Science 31
Table A4.4 NMSSA Critical Thinking in Health and PE achievement Year 8: Comparison of estimates with weighted and unweighted data
Mean (unweighted)
se (unweighted)
Mean (weighted)
se (weighted) Difference N
All 119.0 0.7 118.8 0.7 -0.2 1199
Girls 122.7 1.0 122.5 1.0 -0.2 597
Boys 115.4 0.9 115.2 1.0 -0.2 602
NZE 123.1 0.8 123.0 0.8 -0.1 759
NZE girls 126.6 1.1 126.5 1.1 -0.1 387
NZE boys 119.5 1.2 119.4 1.2 -0.1 372
Māori 111.0 1.3 110.8 1.3 -0.2 308
Māori girls 116.3 1.8 116.2 1.8 -0.1 149
Māori boys 106.1 1.7 105.8 1.7 -0.3 159
Pacific 108.0 2.1 107.8 2.1 -0.2 116
Pacific girls 111.2 3.1 111.2 3.1 0.0 55
Pacific boys 105.1 2.9 104.8 2.9 -0.3 61
Asian 121.6 2.0 121.4 2.1 -0.2 117
Asian girls 124.8 3.4 124.5 3.4 -0.3 50
Asian boys 119.2 2.5 119.2 2.5 0.0 67
Quintile 1 104.8 1.8 104.7 1.8 -0.1 160
Quintile 2 112.7 1.5 112.7 1.5 0.0 210
Quintile 3 118.4 1.5 118.4 1.5 0.0 232
Quintile 4 124.3 1.3 124.3 1.3 0.0 294
Quintile 5 126.3 1.2 126.2 1.2 -0.1 303
Proacti
vely
Releas
ed

NMSSA Report 18: Technical Information 2017 – Health and Physical Education, Science • Appendix 5 32
Appendix 5: Variance Estimation in NMSSA
Contents:
1. Introduction 33Design effects 33
2. Variance estimation for complex survey data 33Incorporating sample weights 33Post-stratification and collapsing rules 33
3. Choosing a variance estimation method for NMSSA 344. Results and recommendations 345. References 35
Proacti
vely
Releas
ed

Appendix 5 • NMSSA Report 18: Technical Information 2017 – Health and Physical Education, Science 33
1. Introduction This appendix describes the standard procedures undertaken to calculate design effects in NMSSA on an annual basis.
Design effects A design effect is the ratio of the variance of an estimate calculated for a complex sample design compared to the variance calculated as if the sample was a simple random sample.
𝑑 =𝑉𝑎𝑟(𝜃)bcdefgh𝑉𝑎𝑟(𝜃)iji
Design effects are calculated for all key groups and subgroups in NMSSA each year. Calculations are generally restricted to assessment data where the whole NMSSA sample has been involved in the assessment.
Effective sample size The design effect tells us the extent of the loss of efficiency in variance estimation caused by the complex sample design. This loss of efficiency can be couched in terms of an effective sample size. In a simple random sample (SRS) the sample size influences the precision (efficiency) with which estimates can be calculated. A decrease in the sample size leads to a decrease in efficiency, and subsequently an increase in the variance of an estimate. Using the design effect we can calculate the effective sample size, the size of a SRS that would give us the same efficiency as our complex sample.
𝑛gkk =𝑛lcdefgh𝑑(𝜃m)
where neff = the effective sample size ncomplex = the sample size selected under the complex design d = design effect q = the estimate in question
2. Variance estimation for complex survey data The NMSSA sample is a stratified cluster sample, with a new sample being selected each year. Schools are the primary sampling unit and are stratified implicitly by region, decile and size. One hundred schools at each of Year levels 4 and 8 are selected. Within selected schools up to 25 students are systematically (randomly) selected rendering an (approximately) equal probability sample of students representing the New Zealand student population.
For reporting purposes key variables are year level, decile, gender and ethnicity.
Incorporating sample weights Each year an investigation is carried out to confirm that it is not necessary to use sample weights in analysis. The current NMSSA sampling method ensures that the achieved sample represents the NZ student population accurately, and it is unlikely that sample weights will be needed unless the sampling method changes. In the event that sample weights are deemed necessary, they can be readily incorporated into the variance estimation routines.
Post-stratification and collapsing rules The NMSSA sample is post-stratified by quintile, gender and ethnic group.
Ethnicity grouping: Throughout general analysis and reporting NMSSA allows for individuals to be assigned to multiple ethnicities. In the current context, however, allowing for multiple ethnicities results in many, very small post-strata. Approximately 10 percent of students at Year 4 and at Year 8 are reported as belonging to multiple ethnicities. For the purposes of variance estimation NMSSA uses a ‘prioritised’ approach to ethnicity. See the stratum collapsing rules below.
Proacti
vely
Releas
ed

NMSSA Report 18: Technical Information 2017 – Health and Physical Education, Science • Appendix 5 34
The Year 4 and Year 8 samples are treated separately. Small post-strata (less than 15 members) post-strata have to be collapsed14. The following collapsing rules are applied, in order, to small post-strata. After each collapsing step, strata are re-assigned and stratum size re-calculated. If there are remaining small strata, the next collapsing step is applied.
1. Remove 'other' classification from students who already belong to any of NZE15, Māori, Pacific, or Asian.
2. Small strata containing dual ethnicities are collapsed into prioritised ethnicity groups: Māori à Pacific à Asian à NZE. Example: A small stratum specified by quintile 3-Female-Māori/Asian would be subsumed into the Quintile 3-Female-Māori stratum.
3. Collapse remaining small ethnicity strata into the appropriate gender group. Example: A small stratum identified by quintile 4-Male-Pacific would be subsumed into a quintile 4-Male stratum.
4. Remaining small strata are collapsed into the appropriate quintile stratum. Example: A small stratum identified by quintile 1-Female would be subsumed into a quintile 1 stratum.
5. Finally any small strata left make up a ‘mop-up’ stratum, with no specific quintile, gender or ethnic identification.
3. Choosing a variance estimation method for NMSSA In previous years NMSSA has carried out analyses using a) Jackknife and b) Taylor series linearisation16 methods for variance estimation, and compared results. These two methods render almost identical results for the NMSSA sample design.
With the introduction of plausible values methodology in NMSSA 2015 to estimate population statistics, it has become practical to use the Taylor series linearisation method for variance estimation in preference to the Jackknife method. Analysis with plausible values involves repeating every analysis multiple times – one for each set of plausible values generated. The Jackknife is a time-consuming, computer-intensive estimation method, whereas the Taylor series approximations can be calculated comparatively quickly.
4. Results and recommendations In NMSSA design effects generally vary between about 1.0 and 2.5. Even with the larger design effects the confidence intervals do not increase in width very much. A general increase in width of less than 1.0 NMSSA scale score point is usually observed.
It is recommended that, for ease of calculation and to absorb most of the variance bias caused by the NMSSA complex sample design, a factor or multiplier of 0.7 should be used to reduce the sample size in standard error calculations. This assumes a design effect of 1.43, which is close to most design effects calculated.
The factor of 0.7 used to calculate an effective sample size is checked each year, employing the standard procedures set out in this paper. Unless it appears that a very different factor should be used, a standard 0.7 is recommended. While the sample selection methods remain the same, this is unlikely to change. See the example on the following page.
14 For the purposes of variance estimation, Heeringa, West, & Berglund (2010 p.43) suggest that collapsing post-strata so that each contains
a minimum of 15-25 members is advisable. 15 New Zealand European 16 Taylor series approximations of complex sample variances for sample estimates of means and proportions have been widely used since
the 1950s (Heeringa et al., 2010). It is not a replication method like the Jackknife and the bootstrap, but uses Taylor series approximations to estimate variances. When the sample is reasonably standard the TSL method generally offers similar results to the Jackknife.
Proacti
vely
Releas
ed

Appendix 5 • NMSSA Report 18: Technical Information 2017 – Health and Physical Education, Science 35
Example: Calculate the standard error of a NMSSA mean
mx = estimated mean of variable x
Under a simple random sample we would use
sm = standard error of the mean = n√p
Applying the recommended factor to account for a complex sample design we use
sm* = standard error* of the mean = n
√p∗r.t
5. References Heeringa, S. G., West, B. T., Berglund, P. A. (2010). Applied survey data analysis. Taylor and Francis Group,
LLC.
Lumley, T. (2004). Analysis of complex survey samples, Journal of statistical software 9(1), pp. 1-19.
Software R Core Team (2014). R: A language and environment for statistical computing. R Foundation for Statistical
Computing: Vienna, Austria. URL http://www.R-project.org/.
Lumley, T. (2014), survey: Analysis of complex survey samples. R package version 3.30. https://rdrr.io/rforge/survey/
Proacti
vely
Releas
ed

NMSSA Report 18: Technical Information 2017 – Health and Physical Education, Science • Appendix 6 36
Appendix 6: Variance Estimation in 2017
Contents:
1. Introduction 372. Tables of design effects 38
Tables:
Table A6.1 Science Year 4 - Comparison of results for different variance estimation methods 38Table A6.2 Science Year 8 - Comparison of results for different variance estimation methods 39
Proacti
vely
Releas
ed

Appendix 6 • NMSSA Report 18: Technical Information 2017 – Health and Physical Education, Science 37
1. Introduction This brief summary supports the general NMSSA variance estimation paper17 with specific findings relating to data in NMSSA 2017.
Design effects were calculated using the data collected for the NMSSA 2017 science assessment. The NMSSA science assessment was completed by the entire NMSSA sample, and therefore provides the most complete information regarding the clustering of students in schools, and consequently the effect on variance estimation.
Design effects for the whole sample, and key subgroups were investigated.
In general, through experience with calculating design effects each year, it has been noted that reducing the sample size by a factor of 0.7 for calculation of population statistics, accounts for most of the design effect related to the clustered nature of the NMSSA sample.
Design effects in 2017 mostly varied between about 1.0 and 2.0. While the design effects in some cases are fairly large (over 2.0 in a few cases), the effect on the width of confidence intervals is small in practice. For the most part the increase in width of the 95 percent confidence intervals is less than 1.0 NMSSA scale score point.
It was recommended that for ease of calculation, and to absorb most of the variance bias caused by the NMSSA complex sample design that the standard multiplier of 0.7 should be used to form an effective sample size in the calculation of statistics dependent on sample size.
Tables showing the effect of the NMSSA complex-sample design on the 2017 science assessment follow.
17 A standard routine for assessing design effects in NMSSA was developed using NMSSA data over the years 2014 and 2015.
Proacti
vely
Releas
ed

38 NMSSA Report 18: Technical Information 2017 – Health and Physical Education, Science • Appendix 6
2. T
able
s of d
esig
n ef
fect
s Ta
ble
A6.1
Sc
ienc
e Ye
ar 4
- Co
mpa
rison
of r
esul
ts fo
r diff
eren
t var
ianc
e es
timat
ion
met
hods
Yea
r 4
Mea
n18
(SRS
19)
Mea
n (T
SL20
) SE
(SRS
) SE
(TSL
) CI
(SRS
) (lo
wer
) CI
(SRS
) (u
pper
) CI
(TSL
) (lo
wer
) CI
(TSL
) (u
pper
) De
sign
effe
ct
CI w
idth
in
crea
se
CI w
idth
in
crea
se
%
N Ef
fect
ive
N
All Y
ear 4
-0
.36
-0.3
6 0.
02
0.03
-0
.39
-0.3
2 -0
.41
-0.3
1 1.
94
0.01
47
39%
20
94
1078
NZE
21
-0.1
1 -0
.11
0.02
0.
03
-0.1
6 -0
.07
-0.1
7 -0
.06
1.69
0.
0141
30
%
1047
62
1
Māo
ri -0
.74
-0.7
4 0.
04
0.04
-0
.81
-0.6
7 -0
.82
-0.6
6 1.
33
0.01
09
15%
48
4 36
6
Paci
fic
-1.2
6 -1
.26
0.07
0.
09
-1.4
0 -1
.12
-1.4
4 -1
.08
1.72
0.
0430
31
%
132
78
Asia
n -0
.03
-0.0
3 0.
05
0.05
-0
.13
0.06
-0
.13
0.07
1.
11
0.00
52
5%
255
231
Fem
ale
-0.2
7 -0
.27
0.03
0.
04
-0.3
2 -0
.22
-0.3
4 -0
.20
1.86
0.
0188
36
%
1030
55
4
Mal
e -0
.44
-0.4
4 0.
03
0.04
-0
.49
-0.3
8 -0
.51
-0.3
6 2.
00
0.02
23
41%
10
50
526
Fem
ale
NZE
-0
.05
-0.0
5 0.
03
0.04
-0
.12
0.01
-0
.13
0.03
1.
63
0.01
82
28%
51
7 31
8
Fem
ale
Māo
ri -0
.60
-0.6
0 0.
05
0.05
-0
.70
-0.5
1 -0
.71
-0.5
0 1.
22
0.00
97
10%
23
4 19
4
Fem
ale
Paci
fic
-1.2
3 -1
.23
0.10
0.
14
-1.4
2 -1
.04
-1.5
0 -0
.96
2.05
0.
0825
43
%
59
30
Fem
ale
Asia
n 0.
00
0.00
0.
07
0.07
-0
.14
0.13
-0
.14
0.13
1.
08
0.00
48
4%
138
130
Mal
e NZ
E -0
.18
-0.1
8 0.
03
0.04
-0
.24
-0.1
1 -0
.26
-0.0
9 1.
72
0.02
09
31%
53
0 30
9
Mal
e M
āori
-0.8
7 -0
.87
0.05
0.
06
-0.9
7 -0
.77
-0.9
8 -0
.75
1.28
0.
0135
13
%
250
197
Mal
e Pa
cific
-1
.28
-1.2
8 0.
10
0.12
-1
.48
-1.0
9 -1
.52
-1.0
5 1.
46
0.04
07
21%
73
51
Mal
e As
ian
-0.0
6 -0
.06
0.07
0.
07
-0.2
0 0.
07
-0.2
0 0.
07
1.09
0.
0057
4%
11
7 10
9
Low
dec
ile
-1.1
1 -1
.11
0.04
0.
06
-1.2
0 -1
.02
-1.2
2 -1
.00
1.66
0.
0254
29
%
325
197
Mid
dec
ile
-0.5
3 -0
.53
0.04
0.
05
-0.6
1 -0
.44
-0.6
3 -0
.42
1.55
0.
0212
25
%
360
233
High
dec
ile
-0.3
9 -0
.39
0.04
0.
05
-0.4
7 -0
.31
-0.4
8 -0
.30
1.19
0.
0077
9%
34
1 28
8
18
All
resu
lts in
tabl
e ar
e qu
oted
in lo
git u
nits
exc
ept w
here
indi
cate
d 19
Sim
ple
rand
om sa
mpl
e 20
Tay
lor s
erie
s lin
earis
atio
n m
etho
d 21
New
Zea
land
Eur
opea
n Proacti
vely
Releas
ed

Appendix 6 • NMSSA Report 18: Technical Information 2017 – Health and Physical Education, Science 39
Tabl
e A6
.2
Scie
nce
Year
8 -
Com
paris
on o
f res
ults
for d
iffer
ent v
aria
nce
estim
atio
n m
etho
ds
Yea
r 8
Mea
n22
(SRS
23)
Mea
n (T
SL24
) SE
(SRS
) SE
(TSL
) CI
(SRS
) (lo
wer
) CI
(SRS
) (u
pper
) CI
(TSL
) (lo
wer
) CI
(TSL
) (u
pper
) De
sign
effe
ct
CI w
idth
in
crea
se
CI w
idth
in
crea
se
%
N Ef
fect
ive
N
All Y
ear 8
1.
02
1.02
0.
02
0.03
0.
99
1.06
0.
97
1.07
2.
17
0.02
47
%
2040
94
3
NZE
1.
21
1.21
0.
02
0.03
1.
17
1.25
1.
15
1.26
1.
63
0.01
28
%
1182
72
9
Māo
ri 0.
63
0.63
0.
03
0.04
0.
57
0.70
0.
54
0.72
1.
72
0.02
31
%
473
276
Paci
fic
0.38
0.
38
0.06
0.
06
0.27
0.
49
0.26
0.
50
1.13
0.
01
6%
147
134
Asia
n 1.
33
1.33
0.
06
0.07
1.
21
1.45
1.
20
1.47
1.
25
0.01
12
%
149
120
Fem
ale
1.10
1.
10
0.02
0.
04
1.06
1.
15
1.04
1.
17
2.11
0.
02
45%
10
21
485
Mal
e 0.
95
0.95
0.
03
0.04
0.
90
1.00
0.
87
1.02
2.
24
0.03
50
%
984
440
Fem
ale
NZE
1.
27
1.27
0.
03
0.04
1.
21
1.32
1.
20
1.34
1.
61
0.02
27
%
612
381
Fem
ale
Māo
ri 0.
74
0.74
0.
05
0.06
0.
65
0.83
0.
62
0.86
1.
71
0.03
31
%
241
141
Fem
ale
Paci
fic
0.42
0.
42
0.08
0.
07
0.25
0.
58
0.27
0.
56
0.78
-0
.02
-12%
57
77
Fem
ale
Asia
n 1.
50
1.50
0.
09
0.08
1.
32
1.67
1.
33
1.66
0.
83
-0.0
2 -9
%
56
68
Mal
e NZ
E 1.
15
1.15
0.
03
0.04
1.
08
1.21
1.
06
1.23
1.
65
0.02
28
%
570
348
Mal
e M
āori
0.52
0.
52
0.05
0.
06
0.42
0.
61
0.40
0.
64
1.58
0.
02
26%
23
2 14
8
Mal
e Pa
cific
0.
36
0.36
0.
08
0.09
0.
21
0.51
0.
19
0.53
1.
34
0.02
15
%
90
70
Mal
e As
ian
1.23
1.
23
0.08
0.
10
1.07
1.
39
1.04
1.
42
1.44
0.
03
20%
93
65
Low
dec
ile
0.42
0.
42
0.04
0.
06
0.34
0.
51
0.32
0.
53
1.53
0.
02
23%
25
3 16
7
Mid
dec
ile
0.76
0.
76
0.04
0.
05
0.68
0.
84
0.66
0.
86
1.40
0.
02
18%
35
3 25
3
High
dec
ile
1.00
1.
00
0.04
0.
04
0.93
1.
08
0.91
1.
09
1.34
0.
01
16%
39
7 29
8
22
All
resu
lts in
tabl
e ar
e qu
oted
in lo
git u
nits
exc
ept w
here
indi
cate
d 23
Sim
ple
rand
om sa
mpl
e 24
Tay
lor s
erie
s lin
earis
atio
n m
etho
d Proacti
vely
Releas
ed

NMSSA Report 18: Technical Information 2017 – Health and Physical Education, Science • Appendix 7 40
Appendix 7: Curriculum Alignment of the Learning Through Movement Scale
Contents:
1. Introduction and background 412. Learning Through Movement (LTM) assessment 42
Administration 423. Alignment to the NZC 42
Knowledge of the scale 42Experiencing the assessments 42Structure 43
4. Alignment process 43Minimal competence at different curriculum levels 43Assessment conditions 44
5. Estimating response distributions 44Level 3 45
6. Post-hoc review of the LTM alignment 457. Results 45
Figures: Figure A7.1 Overview of the NMSSA process 41Figure A7.2 Estimating response distribution grid example 44Figure A7.3 Estimating response distributions - example of grid filled in 44Figure A7.4 Transforming estimated response distributions to scale cut-points 45
Tables:
Table A7.1 Structure for the alignment exercise 43Table A7.2 Final curriculum level cut-points for Learning Through Movement (LTM) assessment 45
Proacti
vely
Releas
ed

Appendix 7 • NMSSA Report 18: Technical Information 2017 – Health and Physical Education, Science 41
1. Introduction and background The underlying objective of NMSSA is to report on student achievement with respect to the New Zealand Curriculum (NZC). To accomplish this objective, assessment data in relevant learning areas is collected each year, and achievement scales are constructed. The scales are then aligned with the levels of the NZC.
In 2017, the learning areas of interest were science, and health and physical education (HPE). HPE included measures of achievement in Critical Thinking in Health and Physical Education (CT) and Learning Through Movement (LTM). The assessment tasks for achievement in HPE are described in detail in Appendix 2. Curriculum alignment was undertaken for LTM only.
This appendix describes the process followed and presents results for the curriculum alignment of the LTM scale. Many features of a curriculum alignment exercise are the same regardless of the learning area. In NMSSA the goal is the same across all learning areas – to align the relevant scale with the levels of the NZC, paying particular attention to level 2 and level 4.
An alignment of an achievement scale to the NZC has not been attempted before in this learning area. The process described here has generated some useful discussion and learning particularly in regard to how conceptual understanding is ‘measured’ in a national monitoring context.
Figure A7.1 shows a high-level overview of NMSSA assessment development. This appendix addresses the transition from ‘NMSSA Scales’ to ‘New Zealand Curriculum’.
Figure A7.1 Overview of the NMSSA process
New Zealand Curriculum
NMSSA Framework
NMSSA Assessments
NMSSA Scale(s)
Proacti
vely
Releas
ed
NMSSA Report 18: Technical Information 2017 – Health and Physical Education, Science • Appendix 742
2. Learning Through Movement (LTM) assessmentAccording to the NZC, in health and physical education, the focus is on ‘the well-being of students themselves, of other people, and of society through learning in health-related and movement contexts’ (p. 22).
The LTM assessment assessed the extent to which students: develop and carry out complex movement sequences; strategise, communicate and co-operate; think creatively – express themselves through movement, and interpret the movement of others; and express social and cultural practices through movement. The LTM assessment focused primarily on two strands of the HPE learning area: movement and motor skills, and relationships with other people. Contexts for assessment tasks using authentic game situations were taken from key areas of learning for HPE: physical activity, outdoor education and sport studies. Collectively, this assessment was called Learning Through Movement (LTM) and a scale was created for the first time in 2017.
Administration Experienced, specially trained classroom teachers conducted the assessments during Term 3. Up to eight students in each school completed these assessments by participating in games and activities in groups of four supervised by two teacher assessors and in one-to-one interviews. About 800 students at each of Year 4 and Year 8 completed the LTM assessment.
Six sets of forms were created at Year 4 and Year 8 each consisting of three stimulus tasks and a selection of questions to accompany each task. The forms were linked to allow the construction of the LTM scale describing progress according to the NZC. Each school had a combination of two of these forms. The LTM scale was constructed from student performances and responses to these assessments.
3. Alignment to the NZCA group of curriculum experts was invited to participate, as part of a panel, in the alignment exercise. The panel was made up of eight members who provided curriculum expertise, together with research, classroom and teaching experience in HPE, particularly physical education. The alignment exercise took the form of a day-long workshop. NMSSA researchers and psychometricians also formed part of the alignment team.
Knowledge of the scale The panel was presented with detailed information to help them gain a thorough understanding of the assessment framework and its relationship to the LTM scale. Questions and discussion were encouraged at all times. This discussion was a critical step in the alignment exercise and considerable time was spent ensuring that the panel was equipped to make consistent and informed judgements about the relationship of the scale to the relevant curriculum levels.
Experiencing the assessments The panel had the opportunity to experience assessments as students had experienced them in the NMSSA main study. Resources and exemplars used during the LTM assessment were provided and assessment tasks were presented on laptops. The relative difficulty, cognitive and movement skills demands of each item were examined and discussed.
Proacti
vely
Releas
ed

Appendix 7 • NMSSA Report 18: Technical Information 2017 – Health and Physical Education, Science 43
Structure The curriculum alignment exercise was undertaken in four sessions. To allow every member of the panel to share their ideas with everybody else, tasks and group membership were altered across sessions. Table A7.1 shows the structure for the day. A panel member is referred to as a ‘judge’.
Table A7.1 Structure for the alignment exercise
GROUP 1 GROUP 2
Session 1 Judge 1 Judge 2 Judge 5 Judge 6 Judge 3 Judge 4 Judge 7 Judge 8
Task 1, Task 2 Task 1, Task 2 MORNING BREAK
Session 2 Judge 1 Judge 5 Judge 3 Judge 7 Judge 2 Judge 6 Judge 4 Judge 8
Task 3, Task 4 Task 4, Task 3 LUNCH BREAK
Session 3 Judge 1 Judge 7 Judge 2 Judge 8 Judge 3 Judge 5 Judge 4 Judge 6
Task 5, Task 6 Task 6, Task 5 AFTERNOON BREAK
Session 4 Judge 1 Judge 4 Judge 2 Judge 3 Judge 6 Judge 7 Judge 5 Judge 8
Task 7 Task 7
Due to time constraints, judges did not discuss and work on Task 7. This possibility had been anticipated and Task 7 had been selected prior to the workshop as a task we could leave out of the alignment process.
4. Alignment processLTM units (tasks and all related items) were presented to the panel on laptops one by one along with an active demonstration in which they participated. Marking schedules and student examplars were also provided. Judgements were made by the panel, as to how pre-defined groups of students would have performed and/or responded to each item.
Each panel member was asked to estimate a distribution of responses to each question. This method of alignment requires defining minimal competence, and consideration of the influence of assessment conditions on student performance. These are discussed below, followed by an outline of the unique elements of the alignment method.
Minimal competence at different curriculum levels In NMSSA we report the percentage of students who have achieved curriculum level 2 and above at Year 4 and curriculum level 4 and above at Year 8.
In order to do this we have to work with groups of learning area experts to determine what is a minimally sufficient level of performance on a range of NMSSA tasks for a student to be categorised as having shown enough knowledge and skills to have achieved each level.
We are then able to convert these minimum performance estimates to locations (cut-scores) on the NMSSA scales we use to report achievement.
The cut-points represent the minimum scale scores where students, on balance, can be considered to have achieved the achievement objectives associated with each of the curriculum levels.
When we consider an NMSSA task as part of a curriculum alignment exercise we need to have two things in mind:
• what is expected at the curriculum level we are interested in• how would students who, overall, have done just enough to have achieved that level perform if
they were administered the task.
Proacti
vely
Releas
ed

NMSSA Report 18: Technical Information 2017 – Health and Physical Education, Science • Appendix 7 44
Assessment conditions It was important for panel members to understand the circumstances under which students completed the NMSSA assessments. The operational constraints of NMSSA assessments meant that, in some ways, the demands of this assessment were not completely in line with normal classroom activities. When students are less familiar with a process, and are less supported by teachers and classroom activities, they will tend to perform at a lower level than they would if the supports were in place.
When thinking about question difficulty and how the conceptualised group of minimally competent students would respond to each question, the panel was reminded to consider the following points.
• Students had no teaching support for this assessment. • There was no classroom discussion to help students develop their thoughts or moves. • Students had no 'scaffolding' in the form of a class PE focus unit.
In judging the difficulty of a question for various groups of minimally competent students, the panel was asked to think about:
• how a primary school student moves, thinks or processes information • the types, levels, and complexity of the movement expected • the knowledge, experience and skills expected • the depth of thought required when answering questions about the strategies they used • whether the context is familiar and/or engaging • the experience students may have had with equipment provided.
5. Estimating response distributions Curriculum alignment required panel members to fill in a grid for each item showing their estimate of the distribution of scores that a group (e.g. they could consider 100) of minimally competent students (at the appropriate curriculum level) would get on that item. Judges provided their judgements using the ‘Curriculum Alignment Software (CAS)’ which was developed by EARU in 2017 specifically for standard setting purposes. Figures A7.2 and A7.3 show the screenshots of an example grid before and after being filled in. The possible scores for this fictitious item of a demo task were: 0, 1, 2 and 3.
Figure A7.2 Estimating response distribution grid example
Figure A7.3 Estimating response distributions - example of grid filled in
Proacti
vely
Releas
ed

Appendix 7 • NMSSA Report 18: Technical Information 2017 – Health and Physical Education, Science 45
From the grids, raw scores were calculated for each item and then averaged across all panel members. The resultant raw scores were transformed into scale scores, which represented the cut-scores on the scale where curriculum level 2 and level 4 started.
Establishing the cut-scores
Figure A7.4 Transforming estimated response distributions to scale cut-scores
The curriculum alignment procedure is a relatively high-stakes exercise for NMSSA assessments. Therefore, before collecting scores, feedback was given to panel members regarding what their judgements meant in terms of the percentage of students achieving at or above various curriculum levels.
Panel members worked in groups of four, but made individual judgements on the distribution grids. This was followed by a more general discussion and a chance to reconsider their estimated distribution of scores. There was no requirement for complete agreement between panel members. However, throughout the day, care was taken to challenge judgements that varied widely, or that appeared to be wildly inconsistent with assessment results. Justifying their thinking to each other assisted panel members in deciding whether to update their original judgements.
Level 3 Panel members were satisfied that level 3 would be appropriately placed half way between the level 2 and level 4 cut-scores.
6. Post-hoc review of the LTM alignment Given the difficulties in precise interpretation of the movement skills in the NZC, the difficulty in applying a consistent concept of 'minimal competence' in this learning area, and concerns about the results of the first workshop, a second session was organised to confirm the first alignment. After careful deliberation the robustness of the first alignment was confirmed and only slight changes were made to the initial alignment to render the final result for NMSSA 2017, shown in Table A7.2.
7. Results Table A7.2 shows the final locations on the LTM scale for the beginning of level 2, level 3 and level 4.
Table A7.2 Final curriculum level cut-scores for Learning Through Movement (LTM) assessment
Level 2 Level 3 Level 4
LTM scale cut-scores (LTM units) 83.13 97.81 112.50
Average of panel raw scores for each item
Average of panel raw scores for each item
Minimal level 4
Minimal level 2 Level 2
Level 3
Level 4 and above
Below Level 2
Scale

NMSSA Report 18: Technical Information 2017 – Health and Physical Education, Science • Appendix 846
Appendix 8: Linking NMSSA Critical Thinking in Health and Physical Education 2013 to 2017
Contents:
1. Introduction 472. Technical differences 2013 to 2017 473. Reconstruction of the 2013 CT scale 48
Some linking issues 48Final transformations 49
4. Trend analysis 49Errors and confidence intervals 49
5. Alignment of the 2017 CT scale to the NZ Curriculum 50Process 50
Figures: Figure A8.1 Overview of linking process for NMSSA Critical Thinking (CT) 47Figure A8.2 Comparison of standard deviations of linking item sets 48Figure A8.3 Final curriculum cut-points on the 2017 NMSSA Critical Thinking (CT) scale 50
Tables: Table A8.1 Comparison of standard deviations of linking item sets 48Table A8.2 Final curriculum cut-points on the 2017 NMSSA CT scale 50

Appendix 8 • NMSSA Report 18: Technical Information 2017 – Health and Physical Education, Science 47
1. IntroductionIn 2017 the National Monitoring Study of Student Achievement collected a second round of data in science, and health and physical education. This provided the first opportunity for NMSSA to carry out analyses that compare results collected at two different time points (cycle 1 and cycle 2).
In order to make comparisons NMSSA carried out an analysis in each learning area to link the assessment results. This appendix summarises the steps conducted to link 2013 and 2017 Critical Thinking in Health and Physical Education (CT) scales.
As with NMSSA science, it was decided to link the 2013 critical thinking scale to the newly constructed 2017 scale, the 2017 scale describing a ‘thicker’ variable than the 2013 scale. In 2013 the CT assessments consisted solely of one-to-one interview tasks administered to a subsample of the main NMSSA sample—about 800 students at each year level. In 2017 some of the tasks developed in 2013 were used again to form a group of link items. New tasks were added to the item bank in 2017, and NMSSA also introduced a written response component to the assessment which was completed by a larger subsample—about 1200 students at each year level.
The 2013 assessment was constructed so that Year 4 students did not complete as many task items as Year 8 students. Some items were common to both year groups, but had been treated as separate items due to year-level differential item functioning (DIF). This led to NMSSA deciding to link Year 4 and Year 8 data from 2013 separately to the 2017 scale. This is shown in Figure A8.1.
Figure A8.1 Overview of linking process for NMSSA Critical Thinking (CT)
2. Technical differences 2013 to 2017As with NMSSA science, some technical aspects of estimation have undergone development since the first cycle of CT. For instance, plausible values have been introduced as a means of improving estimation of population statistics. The changes in estimation techniques mean that the 2013 data needed to be re-analysed in line with the 2017 analysis techniques in order to make legitimate comparisons.
It is important to note that the re-analysis of the 2013 data was done solely for the purposes of the trend analysis. Direct comparisons between published findings in the 2013 NMSSA report and the 2017 report cannot be made. Meaningful comparisons across time are restricted to those reported in the trend analysis sections of the 2017 report.
Year 4 assessment
2013 2017
CT scale
link via common
items
Year 8 assessment
2013
link via common
items
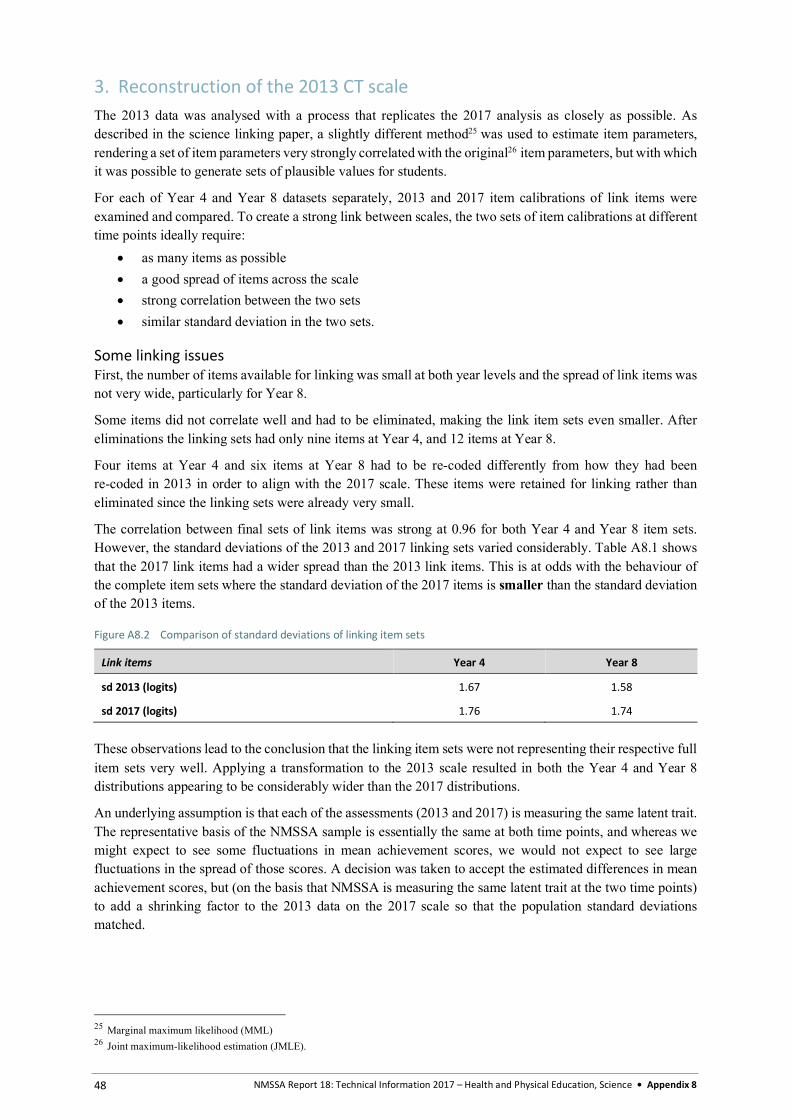
NMSSA Report 18: Technical Information 2017 – Health and Physical Education, Science • Appendix 8 48
3. Reconstruction of the 2013 CT scale The 2013 data was analysed with a process that replicates the 2017 analysis as closely as possible. As described in the science linking paper, a slightly different method25 was used to estimate item parameters, rendering a set of item parameters very strongly correlated with the original26 item parameters, but with which it was possible to generate sets of plausible values for students.
For each of Year 4 and Year 8 datasets separately, 2013 and 2017 item calibrations of link items were examined and compared. To create a strong link between scales, the two sets of item calibrations at different time points ideally require:
• as many items as possible • a good spread of items across the scale • strong correlation between the two sets • similar standard deviation in the two sets.
Some linking issues First, the number of items available for linking was small at both year levels and the spread of link items was not very wide, particularly for Year 8.
Some items did not correlate well and had to be eliminated, making the link item sets even smaller. After eliminations the linking sets had only nine items at Year 4, and 12 items at Year 8.
Four items at Year 4 and six items at Year 8 had to be re-coded differently from how they had been re-coded in 2013 in order to align with the 2017 scale. These items were retained for linking rather than eliminated since the linking sets were already very small.
The correlation between final sets of link items was strong at 0.96 for both Year 4 and Year 8 item sets. However, the standard deviations of the 2013 and 2017 linking sets varied considerably. Table A8.1 shows that the 2017 link items had a wider spread than the 2013 link items. This is at odds with the behaviour of the complete item sets where the standard deviation of the 2017 items is smaller than the standard deviation of the 2013 items.
Figure A8.2 Comparison of standard deviations of linking item sets
Link items Year 4 Year 8
sd 2013 (logits) 1.67 1.58
sd 2017 (logits) 1.76 1.74
These observations lead to the conclusion that the linking item sets were not representing their respective full item sets very well. Applying a transformation to the 2013 scale resulted in both the Year 4 and Year 8 distributions appearing to be considerably wider than the 2017 distributions.
An underlying assumption is that each of the assessments (2013 and 2017) is measuring the same latent trait. The representative basis of the NMSSA sample is essentially the same at both time points, and whereas we might expect to see some fluctuations in mean achievement scores, we would not expect to see large fluctuations in the spread of those scores. A decision was taken to accept the estimated differences in mean achievement scores, but (on the basis that NMSSA is measuring the same latent trait at the two time points) to add a shrinking factor to the 2013 data on the 2017 scale so that the population standard deviations matched.
25 Marginal maximum likelihood (MML) 26 Joint maximum-likelihood estimation (JMLE).

Appendix 8 • NMSSA Report 18: Technical Information 2017 – Health and Physical Education, Science 49
Final transformations The transformation which takes 2013 items and puts them on the 2017 scale for Year 4 items is
𝑑"#$%& = 𝑑"#$%) − 1.09
and for Year 8 items is
𝑑"#$%& = 𝑑"#$%) + 0.46
EAP27 estimates were calculated for the 2013 data using the transformed data item parameters, and sets of plausible values generated.
The estimated Year 4 and Year 8 2013 distributions were then ‘shrunk’ as follows.
𝑏#$%)∗ = 45𝑏#$%) − 𝑏6#$%)7 ∗ 89:;<89:;=
> + 𝑏6#$%)
where b is the estimated student achievement score, and 𝑏6 the relevant observed mean achievement score.
4. Trend analysisVery briefly, trend analysis using these transformations revealed a very small downward movement in the Year 4 mean achievement score, and a slightly larger downward movement in the Year 8 mean achievement score. Interpretation of these movements across time should be cautious. The linking of these two scales presented several technical challenges which had to be approached with a certain amount of pragmatism. Each challenge and each solution will have reduced the certainty with which NMSSA can make claims about movement in achievement scores in this learning area across time. Details of the trend analysis can be found in the main 2017 Health and PE report.
Errors and confidence intervals Linking error When linking two scales such as this, a linking error should always be considered in the analysis. The size of the linking error is dependent on the differences between pairs of link item parameters. The linking error for Year 4 was 0.1139 logits and 0.0985 logits for Year 8. The linking error is calculated as
𝑙𝑖𝑛𝑘𝑖𝑛𝑔𝑒𝑟𝑟𝑜𝑟 =G∑ (𝛿" −𝛿"K)#M"N% ∗ M
MO% , where L is the number of link items
Standard error on differences between means The trend analysis involves examining differences between means at the two time-points for complete year levels and for key subgroups. The general formula for calculating confidence intervals around an observed difference is
1.96 ∗ G𝑠𝑒QRRSTU# + 𝑙𝑖𝑛𝑘𝑖𝑛𝑔𝑒𝑟𝑟𝑜𝑟#
with
𝑠𝑒QRRSTU# = VWXYXZ[;9
\XYXZ[;+
WXYXZ[99
\XYXZ[9]
27 An expected a posteriori (EAP) estimate refers to the expected value of the posterior probability distribution of latent trait scores in a given case.

NMSSA Report 18: Technical Information 2017 – Health and Physical Education, Science • Appendix 850
5. Alignment of the 2017 CT scale to the NZ CurriculumThe 2013 curriculum alignment exercise generated boundaries on the 2013 scale to indicate curriculum level cut-points. These cut-points need to be transferred onto the 2017 scale for comparison. The cut-points were developed by a group of teachers and health and physical education curriculum specialists in a curriculum alignment exercise described in the 2013 NMSSA report.
Due to the various technical issues raised above another pragmatic approach has been taken in order to transfer the 2013 curriculum level cut-points to the 2017 scale.
Process 1. Re-calculate 2013 achievement scores with MML item parameters but with original re-coding on all
items.2. Re-calculate the curriculum cut-points on the distribution given by (1) from the raw scores provided
by the curriculum alignment panel in 2013.3. Re-calculate 2013 achievement scores with MML item parameters, but this time with item re-codes
aligned with the 2017 re-codes. With appropriate transformations, these distributions become theestimated 2013 distributions on the 2017 scale as described above.
4. Use percentile equating (percentiles calculated in (2)) to put curriculum cut-points on thedistributions defined in (3).
5. The curriculum cut-points calculated in (4) can be used on the 2017 scale to estimate the proportionof the Year 4 and Year 8 student populations performing at expected curriculum levels.
Details of results are reported in Health and Physical Education 2017 – Key Findings. Table A8.2 sets out the final estimated curriculum cut-points on the 2017 scale.
Figure A8.3 Final curriculum cut-points on the 2017 NMSSA Critical Thinking (CT) scale
Curriculum levels logits NMSSA units
Level 1/2 -1.47 56.7
Level 2/3 -0.36 92.4

Appendix 9 • NMSSA Report 18: Technical Information 2017 – Health and Physical Education, Science 51
Appendix 9: Linking NMSSA Science Capabilities 2012 to 2017
Contents:
1. Introduction 522. Technical differences 2012 to 2017 523. Reconstruction of the 2012 scale 524. Trend analysis 53
Linking error 53Standard error on differences between means 53
5. Alignment of the 2017 science scale to the NZ Curriculum 53
Figures: Figure A9.1 Overview of linking process for NMSSA science 52
Tables:
Table A9.1 Final curriculum cut-points on the 2017 NMSSA science scale 54

NMSSA Report 18: Technical Information 2017 – Health and Physical Education, Science • Appendix 9 52
1. Introduction In 2017, NMSSA entered a second cycle. That is, achievement in learning areas which have been assessed before have now been assessed for a second time. This has created the opportunity for trend analysis in NMSSA science by linking the science scale constructed in 2012 to the science scale constructed in 2017.
In NMSSA science, the scale constructed in 2017 is considered to be richer (wider/thicker) than the 2012 scale, although measuring the same trait. Many new tasks were added to the 2017 item bank for both the paper-and-pencil, and the interview parts of the science assessment, making the scale more robust. The 2017 analysis also undertook to join both parts of the assessment (written and interview) to construct a single shared scale, whereas in 2012 two separate scales were formed—one for the written part and one for the interview part.
For these reasons NMSSA decided to link the 2012 scale to the existing 2017 scale (rather than the other way round) using only the paper-and-pencil part of the 2012 assessment. This is shown in Figure A9.1.
Figure A9.1 Overview of linking process for NMSSA science
2. Technical differences 2012 to 2017 Some technical details regarding estimation have changed between 2012 and 2017. Primarily, plausible values have been introduced (since 2015) for calculating population estimates. Generating sets of plausible values for the student sample requires a slightly different estimation technique from that used in 2012 for calculating item parameters. These technical changes necessitated a re-analysis of the assessment data from 2012 so that it can be properly compared with the 2017 data.
The re-analysis of 2012 data has been done solely for the purposes of the NMSSA trend analysis. It means that estimates recorded in the 2012 NMSSA science report cannot be directly compared with those in the 2017 report. Meaningful comparisons across time are restricted to those reported in the trend analysis sections of the 2017 reports.
3. Reconstruction of the 2012 scale The 2012 science data was analysed with a process that replicates the 2017 analysis as precisely as possible. In 2012 NMSSA used joint maximum likelihood estimation (JMLE) procedures to estimate both item and person parameters. The reconstruction of the data involved using marginal maximum likelihood (MML) to estimate item parameters. Both estimation methods apply the Rasch model. The main difference between the two estimation procedures is that MML assumes an underlying normal distribution for the student population, whereas JMLE does not.
MML item parameters were generated for the 2012 data, and link item calibrations at both time-points were examined.
2012 written assessment
2012 interview tasks
2017 science scale (includes written and
interview tasks)
link via common
items

Appendix 9 • NMSSA Report 18: Technical Information 2017 – Health and Physical Education, Science 53
A high correlation between calibrations of link items at 2012 and 2017 is required for a strong link. Of the 28 items chosen for linking, four items did not correlate well enough to be included in the link calculation. These items were eliminated from ensuing calculations. The remaining 24 items had a correlation of 0.97, and showed a good spread across the NMSSA science scale. The two sets of item parameters also recorded a similar standard deviation at both time points: 1.18 logits and 1.09 logits at 2012 and 2017 respectively.
The standard deviations were sufficiently similar to warrant a simple shift on the science scale to bring the 2012 calibrations in line with the 2017 calibrations.
The transformation which takes the 2012 MML item parameters to the 2017 scale is:
𝛿"#$%& = 𝛿"#$%# − 0.0333𝑙𝑜𝑔𝑖𝑡𝑠, where di is the estimated parameter of item i
EAP28 person estimates were generated for the 2012 data using transformed MML item parameter estimates, and the usual procedure for generating plausible values was carried out.
The result was a dataset of 2012 data which could be legitimately compared with the 2017 dataset.
4. Trend analysis In brief, the patterns of science achievement across subgroups are very similar in 2012 and 2017. Year level differences are similar, and girls’ and boys’ results differ in similar patterns. Differences between decile groups and ethnicity groups also follow similar patterns. The finer details of the trend analysis are included in the main report Science 2017 – Key Findings.
Linking error When linking two scales such as this, a linking error should always be considered in the analysis. The size of the linking error is dependent on the differences between pairs of item parameters. In this case, since the correlation between the items parameters is very strong, the linking error is small (0.0612 logits). The linking error is calculated as
𝑙𝑖𝑛𝑘𝑖𝑛𝑔𝑒𝑟𝑟𝑜𝑟 =G∑ (𝛿" −𝛿"K)#M"N% ∗ M
MO% , where L is the number of link items
Standard error on differences between means The trend analysis involves examining differences between means at the two time-points for complete year levels and for key subgroups. The general formula for calculating confidence intervals around an observed difference is
1.96 ∗ G𝑠𝑒QRRSTU# + 𝑙𝑖𝑛𝑘𝑖𝑛𝑔𝑒𝑟𝑟𝑜𝑟#
5. Alignment of the 2017 science scale to the NZ Curriculum NMSSA has a particular interest in the achievement level of Year 4 students against Level 2 of the New Zealand Curriculum, and the achievement level of Year 8 students against level 4 of the curriculum.
The 2012 curriculum alignment generated boundaries on the 2012 science scale to indicate curriculum level cut-points. The cut-points were developed by a group of teachers and science curriculum specialists in a book-marking exercise described in the 2012 NMSSA science report. These cut-points were then used to estimate how the Year 4 and Year 8 student population were achieving against year level appropriate curriculum expectations.
28 An expected a posteriori (EAP) estimate refers to the expected value of the posterior probability distribution of latent trait scores in a
given case.

NMSSA Report 18: Technical Information 2017 – Health and Physical Education, Science • Appendix 954
The 2012 curriculum cut-points were located on a scale which had been constructed using JMLE estimation. There is no direct transformation from the 2012 JMLE scale to the 2017 MML scale. NMSSA decided to take an heuristic, but nevertheless logical, approach to place the 2012 curriculum cut-points on the 2017 science scale.
Noting that the correlation between MLE and MML item estimates is very strong (i.e. the ranking of the items from both estimation procedures is almost the same), and taking into account that the original curriculum cut-points were generated with a book-marking procedure, cut-points on the 2017 science scale were simply placed between the same items as they had been on the 2012 scale (Table A9.1).
The NMSSA science team examined the placement of the cut-points to ensure that the locations seemed reasonable when seen alongside the additional 2017 items.
Table A9.1 Final curriculum cut-points on the 2017 NMSSA science scale
Curriculum levels logits NMSSA units
Level 1/2 -1.72 50.5
Level 2/3 0.46 103.1
Level 3/4 1.71 133.2

Appendix 10 • NMSSA Report 18: Technical Information 2017 – Health and Physical Education, Science 55
Appendix 10: NMSSA Assessment Framework for Health and Physical Education 2017
Contents:
1. Introduction 562. Health and physical education in the New Zealand Curriculum 563. Assessing health and physical education 56
The Critical Thinking in Health and PE assessment 564. Curriculum coverage in the CT assessment 595. Marking rubric for CT assessment task: Fitness tracker 626. The Learning Through Movement assessment (LTM) 647. Curriculum coverage in the LTM assessment 668. Marking rubric for LTM assessment task: Stop Ball 67
Figures: Figure A10.1 Setup for task Stop Ball 67
Tables: Table A10.1 Indicators of student achievement in three areas of thinking in HPE at levels 1 to 4 of the NZC 57Table A10.2 Coverage matrix of the Critical Thinking in Health and Physical Education (CT) assessment by strand,
component, question, curriculum level and thinking focus 60Table A10.3 Marking rubric for CT assessment task: Fitness tracker 62Table A10.4 Movement skills and indicators for the Learning Through Movement (LTM) assessment across
the NZC levels 1 – 4 65Table A10.5 Coverage matrix of the Learning Through Movement assessment by component of Strand B,
performance (P) and curriculum level 66Table A10.6 Coverage matrix of the movement skills focus of the Learning Through Movement tasks 66Table A10.7 Marking rubric for Stop Ball 68

NMSSA Report 18: Technical Information 2017 – Health and Physical Education, Science • Appendix 10 56
1. Introduction This appendix describes the assessment approach that the National Monitoring Study of Student Achievement (NMSSA) took to assess health and physical education (HPE) in 2017. It describes how HPE is set out in the New Zealand Curriculum29 (NZC) and outlines the conceptual framework that guided the development of the Critical Thinking in HPE (CT) and Learning Through Movement (LTM) assessments used by NMSSA to assess HPE.
2. Health and physical education in the New Zealand Curriculum The focus of the HPE learning area is on ‘the well-being of the students themselves, of other people and of society through learning in health-related and movement contexts’ (NZC, p. 22). Four underlying and interdependent concepts are at the heart of this learning area: hauora, attitudes and values, a socio-ecological perspective and health promotion. Learning activities in HPE arise from the integration of these four concepts with four strands (and their achievement objectives) and seven key learning areas.
The four strands are: • personal health and physical development • movement concepts and motor skills • relationships with other people • healthy communities and environments.
The seven key areas of learning are: mental health, sexuality education, food and nutrition, body care and physical safety, physical activity, sports studies and outdoor education. HPE encompasses three different but related learning areas: health education, physical education, and home economics.
The NZC (p. 23) states: In health education, students develop their understanding of the factors that influence the health of individuals, groups and society: lifestyle, economic, social, cultural, political, and environmental factors.
In physical education, the focus is on movement and its contribution to the development of individuals and communities. By learning in, through and about movement, students gain an understanding that movement is integral to human expression and that it can contribute to people’s pleasure and can enhance their lives.
3. Assessing health and physical education The 2017 NMSSA assessment programme in HPE was based around students’ understanding of well-being, and two achievement measures: Critical Thinking in Health and PE (CT) and Learning Through Movement (LTM). The CT measure is a continuation and expansion of the measure used in 2013. The LTM measure elaborates on the descriptive assessments that were used in 2013 to assess movement skills and reports achievement in this area using a separate scale.
The Critical Thinking in Health and PE (CT) assessment The CT assessment encompasses the three areas of thinking important to HPE: critical thinking, critical action and creative thinking.
Critical thinking includes thinking about: • self and others: understanding different perspectives and points of view relating to health and well-
being, (including inclusiveness and diversity), justifying one’s opinions and attitudes • information: examining, analysing, critiquing and challenging information • society: understanding the impacts of the (social, environmental, political, cultural) determinants
on well-being.
29 Ministry of Education. (2007). The New Zealand Curriculum. Wellington: Learning Media.

Appendix 10 • NMSSA Report 18: Technical Information 2017 – Health and Physical Education, Science 57
Critical action includes action for: • self: an understanding of strategies and the ability to manage healthy lifestyles and relationships,
risk and resilience • others: the ability to plan and engage in health promotion to bring about change as individuals and
collectively.
Creative thinking supports and enhances well-being for oneself and others and includes: • an understanding of visioning and big picture thinking • the ability to engage in problem solving and finding solutions30 .
Table A10.1 sets out the indicators of student achievement in relation to the three areas of thinking developed by the NMSSA team to assess the achievement objectives at curriculum levels 1 to 4 of the HPE learning area. The development of the indicators were informed by the NZC (2007), NZC exemplars31, Ministry of Education (2016) Draft progressions in HPE32, Ministry of Education (2016) Curriculum in Action33 and Ministry of Education (2017) Sexuality education: A guide for principals, boards of trustees, and teachers34.
Table A10.1 Indicators of student achievement in three areas of thinking in HPE at levels 1 to 4 of the NZC
Critical thinking Critical action Creative thinking
Students can: Students can: Students can:
NZC
Lev
el 1
• Use personal knowledge • Locate/retrieve simple
information from a single source • Communicate ideas using
everyday language • Describe a personal feeling or idea • Describe changes to self and
others
• Use personal knowledge/ experience to inform decision- making
• Recognise issues of personal significance: suggest possible actions
• Relate to others
• Convey an imaginative idea about how to solve a problem, but with little relationship to efficacy
NZC
Lev
el 2
• Locate/ retrieve basic information from a single source and align it with prior knowledge to show a more developed understanding
• Communicate ideas using everyday language to describe objects and events
• Describe benefits to well-being/hauora
• Express an opinion and elaborate with simple reasons
• Describe different values and viewpoints
• Identify a message and make inferences
• Identify main ideas and some details
• Recognise factors that influence choices
• Decide on and justify an action to address an issue; identify some possible positive and negative impacts of proposed actions
• Consider and demonstrate respect, manaakitanga, aroha and responsibility
• Suggest strategies to support others
• Offer solutions to health-related problems and consider how to convey these
30 NMSSA Report 3: Health and Physical Education 2013, p. 13 31 http://www.tki.org.nz/r/assessment/exemplars/hpe/matrices/matrix_phpd_e.html 32 http://hpeprogressions.education.govt.nz/ 33 http://nzcurriculum.tki.org.nz/Curriculum-stories/Media-gallery/Learning-areas/Curriculum-in-action 34 http://health.tki.org.nz/Teaching-in-HPE/Policy-guidelines/Sexuality-education-a-guide-for-principals-boards-of-trustees-and-
teachers/Sexuality-education-in-The-New-Zealand-Curriculum

NMSSA Report 18: Technical Information 2017 – Health and Physical Education, Science • Appendix 1058
Critical thinking Critical action Creative thinking
Students can: Students can: Students can: N
ZC L
evel
3
• Make inferences and provide evidence
• Identify another’s point of view • Look at a proposition from a range
of perspectives • Agree / disagree with a view and
provide a convincing justification• Describe the impact of social and
cultural determinants on well-being/hauora; understand and describe models of well-being/hauora
• Recognise discrimination and assumptions e.g. gender stereotypes and body image messages
• Recognise media and consumer influences e.g. persuasivemessages, target audiences
• Compare and demonstrate ways of establishing and managingrelationships
• Identify and affirm the feelings and beliefs of self and others
• Decide on and justify an action to address an issue; identify some possible positive and negativeimpacts of proposed actions
• Propose possible actions tomitigate discrimination
• Identify risks and plan safety strategies
• Accommodate big picture issues –combine prior knowledge, new knowledge and imaginativethinking to come up with tentative solutions to problems. Ideas are practical and are built on logicalreasoning
• Describe personal strategies for enhancing well-being/hauora, andcoping with social and physical changes e.g. managing competition
NZC
Lev
el 4
• Describe the complexities of an issue and possible impacts ofactions e.g. changingrelationships, discrimination
• Reflect on social, cultural,environmental, and economic factors that impact on the well-being of self, others and society
• Recognise that people can be deliberately positioned and analyse how that has been developed
• Explore and identify a range ofcultural perspectives
• Critique the influence of the media on people’s lives e.g.gender stereotypes, relationships,body image, discrimination
• Decide on and justify an action to address an issue and effect change; identify and evaluate positive and negative impacts of actions
• Access and use information tomake and action safe choices
• Identify and demonstrate positive and supportive relationships
• Recognise ways to manage healthy lifestyles
• Plan strategies to support self andothers in a range of environmentse.g. online
• Recognise how to take individual and collective action to promote community well-being
• Accommodate big picture solutions – combine prior knowledge, new knowledge andimaginative thinking to come up with tentative solutions to problems. Ideas have merit andare rationally justified
• Transfer learning to othersituations

Appendix 10 • NMSSA Report 18: Technical Information 2017 – Health and Physical Education, Science 59
4. Curriculum coverage in the CT assessment Table A10.2 presents the curriculum coverage matrix for the CT assessment tasks by strand, component, question, curriculum level and thinking focus.
For example, the entry for Fitness tracker, is Strand A (Personal health and development), Q3a+b L3/4 (CT/CA). This indicates that Q3a and Q3b of this task were written to cover NZC levels 3 and 4, and assessed critical thinking and critical action. The tasks that provide the link with 2013 HPE assessments are indicated in the task title (LINK).

60 NMSSA Report 18: Technical Information 2017 – Health and Physical Education, Science • Appendix 10
Tabl
e A1
0.2
Cove
rage
mat
rix o
f the
Crit
ical
Thi
nkin
g in
Hea
lth a
nd P
hysic
al E
duca
tion
(CT)
ass
essm
ent b
y st
rand
, com
pone
nt, q
uest
ion,
cur
ricul
um le
vel a
nd th
inki
ng fo
cus
Task
Titl
e St
rand
A:
Pers
onal
Hea
lth a
nd P
hysic
al D
evel
opm
ent
Stra
nd B
: M
ovem
ent
Conc
epts
and
M
otor
Ski
lls1
Stra
nd C
: Re
latio
nshi
ps w
ith O
ther
Peo
ple
Stra
nd D
: He
alth
y Co
mm
uniti
es a
nd E
nviro
nmen
ts
Personal growth and development
Regular physical activity
Safety management
Personal identity
Science and Technology
Challenges and social and cultural factors
Relationships
Identity, sensitivity and respect
Interpersonal skills
Societal attitudes and values
Community resources
Rights, responsibilities, and laws / People and the environment
Com
mun
ity
Plac
es
Q3a
+b L3
/4
(CT/
CA)2
Q
1+2
L2/4
(C
T/CA
) Q
4 L2
/4 (C
T)
Gam
ing
Y8
Q2
L2/3
(C
A/CT
)
Q
7+8
L2/3
(C
RT)
Q3+
4 L3
/4
(CA)
Q
1 L2
/4
(CT/
CRT)
Kai
Q1
L2/3
(CT)
Q
3 L3
(CT)
Q4
L4 (C
T)
Q4
L3/4
(CT)
Q
3 L3
(CT)
Q
2 L3
(C
T/CA
)
Keep
ing
Safe
Q
1a+2
+3
L2/3
(CT)
Q
1b+c
L4
(CT/
CA)
Q
1b+c
L2/4
(C
T/CA
)
Mar
gare
t Mah
y Pl
aygr
ound
Q1
L2/3
(CT)
Q
3 L2
/4 (C
A)
Q
2 L2
/4 (C
T)
Q4
L4 (C
T)
Q5+
6 L4
(CA)
Mrs
Lee
Q3
L3 (C
T)
Q1
L1/2
(CT)
Q
2 L2
/3 (C
T)
Q1
L2 (C
T)
Q4
L4 (C
A)
Pow
erad
e Q
4 L2
/3 (C
T)
Q1+
2+4
L3/4
(C
T)
Toug
h Bo
ris
Q
1 L3
/4 (C
T)
Q2b
L4 (C
T)
Q3
L2/3
/4
(CA)
Char
lott
e’s L
ette
r
Q1+
2b L4
(C
T)
Q
1+2b
L3/4
(C
T)
Q
3 L3
/4 (C
A)

Appendix 10 • NMSSA Report 18: Technical Information 2017 – Health and Physical Education, Science 61
Task
Titl
e St
rand
A:
Pers
onal
Hea
lth a
nd P
hysic
al D
evel
opm
ent
Stra
nd B
: M
ovem
ent
Conc
epts
and
M
otor
Ski
lls1
Stra
nd C
: Re
latio
nshi
ps w
ith O
ther
Peo
ple
Stra
nd D
: He
alth
y Co
mm
uniti
es a
nd E
nviro
nmen
ts
Personal growth and development
Regular physical activity
Safety management
Personal identity
Science and Technology
Challenges and social and cultural factors
Relationships
Identity, sensitivity and respect
Interpersonal skills
Societal attitudes and values
Community resources
Rights, responsibilities, and laws / People and the environment
An Im
port
ant
Mes
sage
4 (LI
NK)
Q1+
2 L2
/3/4
(C
T)
Q3
L1/4
(CA)
New
Sch
ool
Y8/Y
44 (LI
NK)
Q
1/2/
3 L4
(C
T)
Q5
L4 (C
T)
Q1+
2+3
L2
(CT)
Q
5 L2
(CT)
Q
8+9
L2/4
(C
RT)
Fair
Play
3,4 (
LINK
) Q
1+2+
3+4+
5 L2
/3 (C
T)
Q6+
7+8+
9 L3
(CT)
Bar t
he D
oor3
Q1
L2/3
(C
RT)
Step
ping
Pa
tter
ns3
Q4
L4 (C
RT)
Rua
Tapa
wha
3,4
Q7
L3/4
(CT)
Q
8+9
L1/2
/3/4
(CT)
Fitn
ess t
rack
er3
Q1+
2 L2
/3
(CT)
Q
4 L2
/3/4
(C
T)
Q1+
2 L2
/4/5
(C
T)
Q3a
+b
L2/3
/4 (C
T)
Q4
L3/4
(CT)
1 Mov
emen
t ski
lls a
nd P
ositi
ve a
ttitu
des a
spec
ts o
f Str
and
B w
ere
not a
sses
sed
in C
T 2
CT
= Cr
itica
l thi
nkin
g, C
A =
Criti
cal a
ctio
n, C
RT =
Cre
ativ
e th
inki
ng
3 Fro
m p
erfo
rman
ce ta
sks a
lso a
sses
sing
LTM
4
Task
s use
d in
201
3 an
d 20
17 (L
INK)
Wel
l-bei
ng5 (
LINK
) Q
1 L2
/3
5 Wel
l-bei
ng w
as re
port
ed d
escr
iptiv
ely
and
did
not f
orm
par
t of t
he C
T sc
ale

62 NMSSA Report 18: Technical Information 2017 – Health and Physical Education, Science • Appendix 10
5. M
arki
ng ru
bric
for C
T as
sess
men
t tas
k: F
itnes
s tra
cker
Th
is se
ctio
n se
ts o
ut th
e m
arki
ng ru
bric
use
d to
ass
ess s
tude
nts’
per
form
ance
on
the
CT
task
: Fitn
ess t
rack
er.
Tabl
e A1
0.3
Mar
king
rubr
ic fo
r CT
asse
ssm
ent t
ask:
Fitn
ess t
rack
er
Title
: Fi
tnes
s tra
cker
Y4
Leve
l: 4
Ta
sk In
fo:
pict
ure,
vid
eo c
lip, g
raph
Appr
oach
: GA
T Co
l 1
Que
stio
n 1.
Why
mig
ht y
our s
choo
l say
it is
a g
ood
idea
for s
tude
nts t
o ha
ve a
Fitn
ess t
rack
er?
CO
NSTR
UCT:
Crit
ical
thin
king
in H
ealth
and
PE
Stra
nd A
: Per
sona
l Hea
lth &
Phy
sical
Dev
elop
men
t St
rand
B: M
ovem
ent C
once
pts a
nd M
otor
Ski
lls
SCO
RE:
0
1 2
Crite
ria:
Inap
prop
riate
resp
onse
: •
Desc
ribes
wha
t a F
itnes
s tra
cker
doe
s, e
.g. t
o co
llect
in
form
atio
n; to
mea
sure
step
s, ph
ysic
al a
ctiv
ity, h
ow
muc
h en
ergy
is u
sed,
how
muc
h sl
eep,
trac
k w
eigh
t
Gene
ral r
easo
ning
: •
Mon
itorin
g to
chec
k ph
ysic
al a
ctiv
ity a
nd h
ealth
, & tr
ack
heal
th/e
xerc
ise le
vels,
so th
ey ca
n be
fit
• To
get
bet
ter/
impr
ove
• Fu
n w
ay to
chec
k he
alth
just
onc
e
Deep
er re
ason
ing:
Ab
le to
mon
itor s
elf t
o sh
ow d
evel
opm
ent o
ver t
ime;
Pe
rson
al re
spon
sibili
ty; S
choo
l con
cern
ed a
bout
hea
lth a
nd
phys
ical
act
ivity
of s
tude
nts;
Sch
ools
can
plan
pro
gram
mes
to
suit
phys
ical
nee
ds o
f stu
dent
s; T
o en
cour
age
stud
ents
to
be m
ore
activ
e Cr
itical
Think
ing
Iden
tifies
: the
main
pro
blem
&
subs
idiar
y em
bedd
ed or
impli
cit
aspe
cts; r
elatio
nship
s bet
ween
as
pects
; issu
es a
nd n
uanc
es
Ca
n ide
ntify
a mes
sage
and e
labor
ate w
ith si
mple
reas
ons
Regu
lar P
hysic
al Ac
tivity
– D
escr
ibes t
he pe
rson
al be
nefits
to w
ell-
being
of r
egula
r phy
sical
activ
ity (L
evel
2)
Scien
ce a
nd T
echn
ology
– Id
entify
how
equ
ipmen
t enh
ance
s m
ovem
ent e
xper
ience
s (Le
vel 2
)
Can i
denti
fy a m
essa
ge an
d mak
e infe
renc
es
Regu
lar P
hysic
al Ac
tivity
– E
xplai
ns h
ow a
ctivit
y, se
lf-car
e and
we
ll-bein
g ar
e re
lated
(Lev
el 3)
Sc
ience
and
Tec
hnolo
gy –
Des
cribe
s way
s in w
hich r
egula
r ph
ysica
l acti
vity i
s inf
luenc
ed b
y tec
hnolo
gy (L
evel
4/5)
Col 2
Q
uest
ion
2. W
hy m
ight
you
r sch
ool s
ay it
is n
ot a
goo
d id
ea fo
r stu
dent
s to
have
a F
itnes
s tra
cker
? CO
NSTR
UCT:
Crit
ical
thin
king
in H
ealth
and
PE
Stra
nd A
: Per
sona
l Hea
lth &
Phy
sical
Dev
elop
men
t St
rand
B: M
ovem
ent C
once
pts a
nd M
otor
Ski
lls
SCO
RE:
0 1
2
Crite
ria:
Inap
prop
riate
resp
onse
e.g
. hur
ts w
rist
Gene
ral r
easo
ning
: •
Cost
(exp
ensiv
e); Y
ou m
ight
lose
it/b
reak
it; I
t mig
ht b
e st
olen
•
Dist
ract
ing;
A g
imm
ick;
It m
ight
not
wor
k; M
ight
ove
rdo
activ
ity –
com
petit
ion;
It m
ay n
ot b
e ac
cura
te
Deep
er re
ason
ing
(just
ifica
tion)
: •
Priv
acy/
sens
itivi
ty is
sues
- do
n’t w
ant o
ther
s to
know
(in
form
atio
n in
volv
ed);
not a
n ac
cura
te m
easu
re o
f wel
l-be
ing
• Di
scrim
inat
ion
- bul
lyin
g ov
erw
eigh
t peo
ple;
not
scho
ol’s
re
spon
sibili
ty (s
houl
d no
t hav
e to
do
this)
•
Affe
cts p
eopl
e –
emba
rras
sing
Criti
cal T
hink
ing
Iden
tifie
s the
mai
n pr
oble
m a
nd
subs
idia
ry e
mbe
dded
or i
mpl
icit
aspe
cts;
ca
n id
entif
y re
latio
nshi
ps b
etw
een
aspe
cts;
ca
n id
entif
y th
e iss
ues
and
nuan
ces
Ca
n id
entif
y a
mes
sage
and
ela
bora
te w
ith si
mpl
e re
ason
s
Regu
lar P
hysic
al A
ctiv
ity –
Des
crib
es th
e pe
rson
al b
enef
its to
w
ell-b
eing
of r
egul
ar p
hysic
al a
ctiv
ity (L
evel
2)
Scie
nce
and
Tech
nolo
gy –
Iden
tify
how
equ
ipm
ent e
nhan
ces
mov
emen
t exp
erie
nces
. (Le
vel 2
)
Can
iden
tify
a m
essa
ge a
nd m
ake
infe
renc
es
Regu
lar
Phys
ical
Act
ivity
– E
xpla
ins
how
act
ivity
, sel
f-car
e an
d w
ell-b
eing
are
rela
ted.
(Lev
el 3
)
Scie
nce
and
Tech
nolo
gy –
Des
crib
es w
ays
in w
hich
reg
ular
ph
ysic
al a
ctiv
ity is
influ
ence
d by
tech
nolo
gy (L
evel
4/5
)

Appendix 10 • NMSSA Report 18: Technical Information 2017 – Health and Physical Education, Science 63
Col 3
Q
uest
ion
3. O
ne sc
hool
dec
ided
not
to g
ive
stud
ents
a F
itnes
s tra
cker
bec
ause
of t
he fe
elin
gs p
eopl
e in
thei
r sch
ool h
ad
abou
t it.
a)
Nam
e a
feel
ing
thos
e pe
ople
may
hav
e ha
d.b)
Why
mig
ht th
ey fe
el th
is w
ay?
CONS
TRUC
T: C
ritic
al th
inki
ng in
Hea
lth a
nd P
E St
rand
C: R
elat
ions
hips
With
Oth
er P
eopl
e
SCO
RE:
0 1
2 Cr
iteria
: Fe
elin
g w
ith n
o ju
stifi
catio
n, e
.g. j
ealo
us O
R no
feel
ing
men
tione
d
Inap
prop
riate
resp
onse
e.g
. too
tigh
t, ca
n’t a
fford
it
Feel
ing
(rel
ated
to se
lf) w
ith g
ener
al ju
stifi
catio
n:
•Em
barr
asse
d be
caus
e th
ey h
ave
few
step
s•
Disa
ppoi
nted
bec
ause
they
are
not
fit
•An
xiou
s bec
ause
they
feel
like
they
mig
ht b
reak
it o
rbe
dist
ract
ed (s
ense
of r
espo
nsib
ility
) •
Anno
yed
beca
use
no m
oney
left
for o
ther
spor
ts g
ear
Feel
ing
(bey
ond
self)
with
dee
per j
ustif
icat
ion:
•
Emba
rras
sed/
feel
exp
osed
– fe
el w
orse
abo
ut th
eir
body
– e
ffect
on
self-
este
em –
oth
ers w
ill k
now
abo
ut
thei
r ste
ps o
r wei
ght –
priv
acy
issue
s •
Scar
ed fo
r stu
dent
s who
will
get
bul
lied/
mad
e fu
n of
ab
out t
heir
wei
ght o
r lac
k of
fitn
ess
•Se
lf co
nsci
ous/
nerv
ous a
s the
y m
ay n
ot fe
el a
s act
ive
as o
ther
s (m
akin
g co
mpa
rison
s with
oth
ers’
hea
lth)
Criti
cal T
hink
ing
Iden
tifie
s: th
e m
ain
prob
lem
&
subs
idia
ry e
mbe
dded
or
impl
icit
aspe
cts;
rela
tions
hips
be
twee
n as
pect
s; is
sues
and
nu
ance
s
Iden
tity,
Sen
sitiv
ity a
nd R
espe
ct –
Des
crib
es th
e fe
elin
gs
of o
ther
s (Le
vel 2
) Ca
n re
cogn
ise f
eelin
gs f
rom
ano
ther
per
spec
tive
and
sugg
est r
easo
ns fo
r thi
s Id
entit
y,
Sens
itivi
ty a
nd R
espe
ct
– Re
cogn
ises
way
s pe
ople
can
disc
rimin
ate
agai
nst e
ach
othe
r (Le
vel 3
/4)
Col 4
Q
uest
ion
4. W
hat d
oes t
his a
dver
t wan
t you
to b
elie
ve a
bout
hav
ing
a Fi
tnes
s tra
cker
? CO
NSTR
UCT:
Crit
ical
thin
king
in H
ealth
and
PE
Stra
nd A
: Per
sona
l Hea
lth &
Phy
sical
Dev
elop
men
t St
rand
D: H
ealth
y Co
mm
uniti
es a
nd E
nviro
nmen
ts
Lite
racy
Acr
oss t
he C
urric
ulum
SCO
RE:
0 1
2 Cr
iteria
: In
appr
opria
te re
spon
se e
.g. w
hat a
Fitn
ess t
rack
er
does
/tel
ls yo
u: co
lour
s, si
zes,
com
fort
able
, num
ber o
f st
eps,
buy
it
Lite
ral m
essa
ges f
rom
the
vide
o:
•Yo
u’ll
be fi
t/ac
tive
•It’
s goo
d fo
r you
•Yo
u w
ill k
now
mor
e ab
out y
our h
ealth
•
Ever
yone
has
one
•Yo
u’ll
be c
ool
•Yo
u’ll
be h
ealth
y•
You
can
take
it a
nyw
here
•Yo
u ca
n ex
erci
se in
man
y di
ffere
nt w
ays
Give
s a d
eepe
r mes
sage
: •
Happ
y (s
elf-e
stee
m, f
eelin
gs)
•Ba
lanc
ed a
nd b
ette
r life
•Yo
u ca
n do
any
thin
g•
You
will
wan
t to
do M
ORE
exe
rcise
(lin
ks to
mot
ivat
ion/
cha
lleng
e)•
Age
does
n’t m
atte
r•
It w
ill m
ake
you
MO
RE a
ctiv
e•
Ever
yone
has
thei
r ow
n fit
Criti
cal T
hink
ing
Iden
tifie
s: th
e m
ain
prob
lem
an
d su
bsid
iary
em
bedd
ed o
r im
plic
it as
pect
s; re
latio
nshi
ps
betw
een
aspe
cts;
issu
es a
nd
nuan
ces
Reco
gnise
s med
ia im
ages
Pe
rson
al I
dent
ity:
Iden
tify
qual
ities
tha
t co
ntrib
ute
to a
se
nse
of se
lf-w
orth
(Lev
el 2
/3)
Soci
etal
At
titud
es
and
Valu
es:
Iden
tify
how
co
mm
unity
/med
ia
fact
ors
influ
ence
ph
ysic
al
activ
ity
prac
tices
(Lev
el 3
)
Reco
gnise
s th
e in
fluen
ce o
f m
edia
im
ages
and
sub
tle
mes
sage
s e.g
. ste
reot
ypin
g Co
nsid
ers h
ow th
e ad
vert
’s ve
rbal
, visu
al a
nd a
udio
-visu
al
elem
ents
sup
port
inf
eren
ces
that
the
adv
ertis
ers
wan
t cu
stom
ers t
o m
ake
Pers
onal
Ide
ntity
: Re
cogn
ises
how
soc
ial
mes
sage
s an
d st
ereo
type
s in
the
med
ia c
an a
ffect
feel
ings
of s
elf-w
orth
(L
evel
4)
Soci
etal
Att
itude
s an
d Va
lues
: De
scrib
e lif
esty
le f
acto
rs
and
med
ia in
fluen
ces
that
con
trib
ute
to th
e w
ell-b
eing
of
peop
le (L
evel
4)

NMSSA Report 18: Technical Information 2017 – Health and Physical Education, Science • Appendix 10 64
6. The Learning Through Movement assessment (LTM) The LTM assessment used authentic movement contexts (games) to assess students’ ability to do things such as:
• develop and carry out complex movement sequences • strategise, communicate and co-operate • think creatively – express themselves through movement, and interpret the movement of others • express social and cultural practices through movement35.
The LTM assessment focused primarily on the strand: Movement concepts and motor skills. Contexts for assessment tasks were taken from the key areas of learning for HPE of physical activity, outdoor education and sport studies. Some of the tasks used in 2013 were part of the LTM assessment in 2017.
Table A10.4 sets out the indicators of student achievement in relation to achievement objectives from levels 1 – 4 of the HPE learning area, and the movement skills and indicators, across the NZC levels 1 – 4. Indicators of students’ achievement were developed by the NMSSA team in association with PE experts. The indicators were informed by:
• Ovens, A. & Smith, W. (2006) The components of skills (p. 80)36 • Sport New Zealand (2017) Developing fundamental movement skills37 • Ministry of Education Draft progressions in HPE38 • Athletics New Zealand (2017) Get set go: Fundamental movement skills for kiwi kids.39 • Ministry of Education Curriculum in Action40 • Ministry of Education (2016) Sexuality education: A guide for principals, boards of trustees,
and teachers41.
35 NMSSA Report 3: Health and Physical Education 2013, p. 13. 36 Ovens, A. & Smith, W. (2006) Skill: Making sense of a complex concept. Journal of Physical Education New Zealand, 39(1), 72-82. 37 https://sportnz.org.nz/managing-sport/search-for-a-resource/guides/fundamental-movement-skills 38 hpeprogressions.education.govt.nz 39 http://www.athletics.org.nz/Get-Involved/As-a-School/Get-Set-Go 40 health.tki.org.nz/Key-collections/Curriculum-in-Action-series 41 health.tki.org.nz/Teaching-in-HPE-/Policy-guidelines/Sexuality-education-a-guide-for-principals-boards-of-trustees-and-teachers

Appendix 10 • NMSSA Report 18: Technical Information 2017 – Health and Physical Education, Science 65
Tabl
e A1
0.4
Mov
emen
t ski
lls a
nd in
dica
tors
for t
he L
earn
ing
Thro
ugh
Mov
emen
t (LT
M) a
sses
smen
t acr
oss t
he N
ZC le
vels
1 –
4
Stud
ents
can
: Sk
ills
Indi
cato
rs:
NZC Level 1
•pl
ay to
geth
er in
pos
itive
way
s •
enga
ge in
gam
es a
nd p
hysic
al
activ
ities
and
incl
ude
othe
rs
Across the New Zealand Curriculum levels
Mov
emen
t: O
bjec
t Con
trol
(c
atch
/pas
s/st
rike)
•
Dem
onst
rate
goo
d po
stur
e •
Tech
niqu
e is
appr
opria
te a
nd q
uick
Mov
emen
t: Lo
com
otio
n
(run
/ste
p/ju
mp/
dodg
e/ev
adeh
op/l
and)
•
Mov
emen
t dyn
amics
are
effi
cient
, flu
id a
nd b
alan
ced
•M
ovem
ents
are
succ
essf
ul
Stra
tegi
es/t
actic
s/fo
llow
rule
s •
Iden
tify,
des
crib
e an
d ju
stify
gam
e st
rate
gies
– o
wn
and
oppo
nent
s •
Follo
w ru
les o
f a g
ame
Crea
tivity
/ada
ptab
ility
•
Show
abi
lity
to c
reat
e or
per
form
a ra
nge
of co
mpl
ex n
ovel
mov
emen
ts o
r m
ovem
ent s
eque
nces
flui
dly/
rhyt
hmic
ally
and
succ
essf
ully
– w
ith a
ndw
ithou
t equ
ipm
ent
•Su
gges
t and
just
ify e
quip
men
t/re
sour
ce a
dditi
ons
Team
wor
k/co
-ope
ratio
n/
com
mun
icatio
n •
Wor
k co
llabo
rativ
ely
•Ex
pres
s and
acc
ept i
deas
•
Com
mun
icate
wel
l •
Take
dire
ctio
n •
Show
lead
ersh
ip
•Be
inclu
sive
•Ju
stify
idea
s •
Criti
que
and
anal
yse
e.g.
giv
e fe
edba
ck
Perc
eptiv
enes
s •
Iden
tify
and
desc
ribe
PE re
sour
ces a
nd e
nhan
cem
ents
•
Iden
tify
and
desc
ribe
envi
ronm
enta
l cha
ract
erist
ics
•Id
entif
y an
d de
scrib
e pe
rson
al o
r soc
ial i
nflu
ence
s •
Iden
tify
adap
tive,
resp
onsiv
e an
d ef
fect
ive
beha
viou
r•
Desc
ribe
mul
tiple
spec
ific m
ovem
ents
and
mov
emen
t opp
ortu
nitie
s

NMSSA Report 18: Technical Information 2017 – Health and Physical Education, Science • Appendix 10 66
7. Curriculum coverage in the LTM assessment Table A10.5 presents the curriculum coverage matrix for the LTM assessment tasks by component of Strand B and task, while Table A10.6 presents the curriculum coverage matrix by movement focus of each task.
For example, the first entry for ‘Obstacle Course’, P1+2+4+5 L2/3/4 indicates that Performance elements 1, 2, 4 and 5 of this task were written to cover NZC levels 2, 3 and 4, and assessed movement skills. The Rua Tapawhā task provided the link with 2013 movement skills assessments.
Table A10.5 Coverage matrix of the Learning Through Movement assessment by component of Strand B, performance (P) and curriculum level
Task Title Strand B: Movement Concepts and Motor Skills
Movement skills Positive attitudes Science and technology Challenges / social & cultural factors
Obstacle Course P1+2+4+5 L2/3/4 P1+3 L2/3/4 P4+5 L2/3/4 P4+5 L4
Noodle Strike P1+2 L2/3/4 P2 L2/3/4
Pass and Catch P1+2+3+4 L2/3/4 P3+4 L1/2/4
Rippa Tag P1+2 L2/3/4 P2 L3/4
Stepping Patterns P1+2+3+5 L2/3/4 P3 L1/2/4 P5 L4
Stop Ball P1+2+3 L2/3/4 P3 L3/4 P2 L2
Rua Tapawhā (LINK) P1+2+3+4+7+8+9+10 L2/3/4
P1+2+3+4 L3/4 P10 L2
Table A10.6 Coverage matrix of the movement skills focus of the Learning Through Movement tasks
Task
Movement skills focus
Technical skills Strategies/ tactics/ follow
rules
Creativity/ adaptability
Teamwork/ co-operation/
communication
Perceptiveness of movement Object control Locomotion
Obstacle Course run/walk P P P
Noodle Strike strike P P
Pass and Catch pass/catch P
Rippa Tag run/evade/dodge P
Stepping Patterns step/run/hop/land P P P
Stop Ball run/walk P P
Rua Tapawhā pass/catch

Appendix 10 • NMSSA Report 18: Technical Information 2017 – Health and Physical Education, Science 67
8. Marking rubric for LTM assessment task: Stop Ball Students’ performance on each task was using a movement analysis scale that defined ‘high-range skills’, ‘mid-range skills’, ‘low-range skills’ and ‘insufficient/did not participate’. Specific definitions that applied to a particular task and the movement skills involved.
This section sets out the marking rubric and the movement analysis scale used to assess students’ performance on Stop Ball.
Figure A10.1 Setup for task Stop Ball

68 NMSSA Report 18: Technical Information 2017 – Health and Physical Education, Science • Appendix 10
Tabl
e A1
0.7
Mar
king
rubr
ic fo
r Sto
p Ba
ll
Title
: St
op B
all
Leve
l: 4
& 8
Task
Info
: Ge
ar: 4
smal
l hoo
ps, 4
foam
bal
ls M
arki
ng: m
ark
2 st
uden
ts a
t a ti
me
for C
ol 1
and
Col
2, t
hen
mar
k st
uden
ts in
divi
dual
ly fo
r int
ervi
ew
Col 1
Lo
com
otio
n (W
alki
ng /
Run
ning
) CO
NSTR
UCT:
Mov
emen
t ski
lls
Loco
mot
ion
SCO
RE:
0 1
2 3
Crite
ria:
Inap
prop
riate
resp
onse
Stud
ent d
ispla
ys in
suffi
cien
t mov
emen
ts
Stud
ent d
ispla
ys lo
w-r
ange
mov
emen
ts
Stud
ent d
ispla
ys m
ainl
y m
id-r
ange
m
ovem
ents
St
uden
t disp
lays
all/
alm
ost a
ll
high
-ran
ge m
ovem
ents
L2
Pr
actis
e m
ovem
ent s
kills
L3
Deve
lop m
ore c
omple
x mov
emen
t seq
uenc
es
and
strat
egies
in a
rang
e of
situ
ation
s L4
De
mon
strate
cons
isten
cy an
d con
trol o
f m
ovem
ent in
a ra
nge o
f situ
ation
s
High
-ran
ge
• Hi
ps, k
nees
, ank
les b
ent c
onsis
tent
ly th
roug
hout
gam
e (c
rouc
hed
stan
ce)
• Co
nsist
ently
mov
es o
n th
e ba
lls o
f the
feet
(toe
s / m
id-fo
ot st
rike
patt
ern
whe
n m
ovin
g)
• Co
nsist
ently
lean
s in
dire
ctio
n of
des
ired
mov
emen
t / le
ads w
ith le
g clo
sest
to
dire
ctio
n of
des
ired
mov
emen
t / a
rms a
nd le
gs in
opp
ositi
on (r
unni
ng)
• M
ovem
ents
con
siste
ntly
flui
d / l
ooks
bal
ance
d / n
o ex
tra
mov
emen
ts /
quic
k ch
ange
of d
irect
ion
Low
-ran
ge
• Li
ttle
ben
ding
of h
ips,
knee
s and
ank
les d
urin
g ga
me
(upr
ight
stan
ce)
• In
frequ
ently
(if a
t all)
lean
s in
dire
ctio
n of
des
ired
mov
emen
t / le
ads w
ith
leg
furt
hest
aw
ay fr
om d
irect
ion
of d
esire
d m
otio
n
• Je
rky
or st
iff m
ovem
ents
/ fr
eque
ntly
ove
rbal
ance
s / fr
eque
nt e
xtra
m
ovem
ents
/ m
ovem
ents
slow
•
Flat
foot
ed w
hen
mov
ing
Mid
-ran
ge
• Hi
ps, k
nees
and
ank
les u
sual
ly b
ent t
hrou
ghou
t gam
e •
Occ
asio
nally
on
the
balls
of t
he fe
et w
hen
mov
ing
• O
ccas
iona
lly le
ans i
n di
rect
ion
of d
esire
d m
ovem
ent,
arm
s and
legs
mos
tly in
op
posit
ion
•
Mov
emen
ts u
sual
ly fl
uid
and
quic
k, o
ccas
iona
l ext
ra m
ovem
ent
Insu
ffici
ent
• La
ck o
f eng
agem
ent /
Rem
oves
them
selv
es fr
om a
ctiv
ity /
Stop
s mid
-gam
e.
Lo
com
otio
n (w
alki
ng/r
unni
ng)
W
orki
ng a
naly
sis te
rms
Stud
ent’s
per
form
ance
Wor
king
ana
lysis
term
s St
uden
t’s p
erfo
rman
ce
High
-ran
ge C
onsis
tent
ly g
ood
post
ure
Lo
w-r
ange
Ge
nera
lly p
oor p
ostu
re
Te
chni
que
cons
isten
tly a
ppro
pria
te a
nd q
uick
Te
chni
que
usua
lly p
oor a
nd sl
ow
M
ovem
ent d
ynam
ics co
nsist
ently
effi
cien
t, flu
id
and
bala
nced
M
ovem
ent d
ynam
ics n
ot e
fficie
nt, f
luid
and
ba
lanc
ed
Mid
-ran
ge
Mos
tly g
ood
post
ure
In
suffi
cien
t La
ck o
f eng
agem
ent /
Rem
oves
them
selv
es
from
act
ivity
/ St
ops m
id-g
ame
Tech
niqu
e m
ostly
effe
ctiv
e an
d qu
ick
Mov
emen
t dyn
amics
som
etim
es e
fficie
nt, f
luid
an
d ba
lanc
ed

Appendix 10 • NMSSA Report 18: Technical Information 2017 – Health and Physical Education, Science 69
Col 2
St
uden
t fol
low
s rul
es o
f the
gam
e CO
NSTR
UCT:
Mov
emen
t ski
lls
Follo
w R
ules
SC
ORE
: 0
1 2
Crite
ria:
Inap
prop
riate
resp
onse
Lack
of e
ngag
emen
t/Re
mov
es th
emse
lves
fr
om a
ctiv
ity/S
tops
mid
-gam
e
Stud
ent d
oesn
’t fo
llow
gam
e ru
les
Stud
ent m
ostly
follo
ws t
he ru
les o
f the
gam
e St
uden
t con
siste
ntly
follo
ws r
ules
of t
he g
ame
e.g.
take
s bal
l fro
m e
ither
side
of
hoo
p, p
lace
s (no
t thr
ows)
bal
l in
hoop
, tak
es b
alls
one
at a
tim
e
L2
Prac
tise
mov
emen
t ski
lls
L3
Deve
lop
mor
e co
mpl
ex m
ovem
ent s
eque
nces
and
stra
tegi
es in
a ra
nge
of si
tuat
ions
Col 3
Q
1. W
hat s
trat
egie
s did
you
use
to p
lay
stop
bal
l?
Q2.
Did
they
wor
k?
Q3.
Why
/ w
hy n
ot?
Q4.
Wha
t str
ateg
ies d
id th
e ot
hers
use
?
CONS
TRUC
T: M
ovem
ent s
kills
St
rate
gies
/Tac
tics
SCO
RE:
0 1
2 3
Crite
ria:
Inap
prop
riate
resp
onse
e.g
. run
ning
Not
abl
e to
iden
tify
a st
rate
gy w
ith
resp
ect t
o ga
me
play
or d
escr
ibes
how
the
gam
e is
play
ed
Low
-ran
ge:
Able
to id
entif
y ge
nera
l str
ateg
ies b
ut w
ith
no/li
mite
d ju
stifi
catio
n e.
g. ru
n fa
st, g
et to
a
hoop
qui
ckly
Mid
-ran
ge:
Ab
le to
iden
tify
ONE
stra
tegy
with
resp
ect
to g
ame
play
and
just
ify w
hy it
was
ef
fect
ive
or n
ot e
.g. w
ait t
o se
e w
here
ot
hers
are
goi
ng; r
un fa
st a
s oth
ers s
low
High
-ran
ge:
Ab
le to
iden
tify
TWO
or m
ore
stra
tegi
es
with
resp
ect t
o ga
me
play
and
just
ifies
w
hy it
was
effe
ctiv
e or
not
- m
ust i
nclu
de
one
stra
tegy
bas
ed o
n ow
n sk
ills a
nd o
ne
stra
tegy
bas
ed o
n op
pone
nts’
gam
e pl
ay,
e.g.
wat
ch w
here
oth
ers a
re m
ovin
g so
th
at I
can
take
bal
ls fr
om h
oops
; the
ot
hers
ran
fast
so th
ey c
ould
get
to th
e ho
op b
efor
e m
e
L2
Pr
actis
e m
ovem
ent s
kills
L3
De
velo
p m
ore
com
plex
mov
emen
t se
quen
ces a
nd st
rate
gies
in a
rang
e of
sit
uatio
ns
L4
Dem
onst
rate
con
siste
ncy
and
cont
rol o
f m
ovem
ent i
n a
rang
e of
situ
atio
ns
St
rate
gies
/ Ta
ctic
s
W
orki
ng a
naly
sis te
rms
Stud
ent’s
per
form
ance
High
-ran
ge
Iden
tifie
s 2 o
r mor
e st
rate
gies
and
just
ifies
– o
wn
and
oppo
nent
s’ ga
me
play
Mid
-ran
ge
Iden
tifie
s 1 st
rate
gy a
nd ju
stifi
es –
obs
ervi
ng o
ther
s’ be
havi
our
Lo
w-r
ange
Id
entif
ies 1
stra
tegy
and
just
ifies
– o
wn
actio
ns
In
suffi
cien
t Un
able
to id
entif
y a
stra
tegy

NMSSA Report 18: Technical Information 2017 – Health and Physical Education, Science • Appendix 11 70
Appendix 11: NMSSA Assessment Framework for Science 2017
Contents:
1. Introduction 712. Science in The New Zealand Curriculum 713. The relationship of the framework to The New Zealand Curriculum 714. Continuity between the 2012 and 2017 science frameworks 72
Tables:
Table A11.1 The relationship between the Nature of Science substrands and the science capabilities 71Table A11.2 Comparison between the 2012 and 2017 science frameworks 72Table A11.3 The NMSSA science framework (2017) 73

Appendix 11 • NMSSA Report 18: Technical Information 2017 – Health and Physical Education, Science 71
1. Introduction This appendix outlines the conceptual framework used to support the development of the 2017 science assessment.
2. Science in The New Zealand Curriculum Science in The New Zealand Curriculum (NZC) is about exploring how the natural world, the physical world and science itself work so that students can participate as critical, informed and responsible citizens in a society in which science plays a significant role.42
Within the NZC the science learning area is organised under two types of strands: The Nature of Science (NOS) strand, which is about "what science is and how scientists work"43, and four context strands, which provide guidance about appropriate science knowledge to be developed.
Four science capabilities: critical inquiry, making meaning in science, taking action, and knowing science, have been identified as being important to learning science. These are not named in Science in NZC, but they do encapsulate the statements about the science learning area and achievement objectives, as well as incorporating key competencies.
Table A11.1 The relationship between the Nature of Science substrands and the science capabilities
Nature of Science substrands
Understanding about science
Investigating in science
Communicating in science
Participating and contributing
Matching science capabilities
• Gather and interpret data
• Use evidence • Critique evidence
• Gather and interpret data
• Use evidence • Critique evidence
• Interpret representations
• Engaging in science
3. The relationship of the framework to The New Zealand Curriculum The science claim that heads up the NMSSA 2017 science framework provides a ‘big picture’ view of the expectations of about what students can do in science, and is closely aligned to the ‘doing’ part of the science essence statement.
In NZC, the core strand of NZC, the Nature of Science (NOS), is divided into four substrands, although these divisions are somewhat arbitrary as the substrands overlap and interact. Three of the science capabilities identified in this framework – critical inquiry, making meaning in science, and taking action – cross over the four NOS substrands.
The first three aspects that make up the framework below are linked to the science capabilities (shown in brackets). The science capabilities have been developed to clarify for teachers how the Nature of Science might look in their classrooms. They are shown in the framework to support the Ministry’s work in this area.
For each of the first three aspects, the sub-claim at each level has been derived from the Nature of Science achievement objectives, identifying the elements pertaining to the particular science capability.
The indicators were developed with the intention of capturing the complexity of progress in learning science. The numbering is used to denote the level of complexity, not curriculum levels. A dotted line has been used, however, to indicate a possible alignment of the indicators with the curriculum levels. In developing the indicators evidence was drawn from many sources, both national and international research and assessment programmes, and including the scale descriptions and other analyses from the 2012 NMSSA science assessment.
42 The New Zealand Curriculum, p. 17 43 The New Zealand Curriculum, p. 28

NMSSA Report 18: Technical Information 2017 – Health and Physical Education, Science • Appendix 11 72
The fourth aspect of the framework, knowing science, has been approached in a slightly different way. The sub-claims have been derived from an overview of the context strands’ achievement objectives. Signalled science concepts were identified, and these were then written as more specific knowledge statements. International and national research about important ideas in science was also considered.
4. Continuity between the 2012 and 2017 science frameworks Table A11.2 Comparison between the 2012 and 2017 science frameworks
2012 2017
Two frameworks were developed, leading to two scales; Knowledge and Communication of Science Ideas, and Nature of Science. The correlation between the two scales was strong (students performed similarly on each scale).
The two frameworks have been combined and reorganised, but retain the same elements. Existing assessment tasks, both paper and pencil and in-depth, will fit the new framework.
The NOS substrands were considered individually. The NOS strand has been considered holistically, with three science capabilities common to each sub-strand identified. Links have been made to the science capabilities (developed since 2012).
Different assessment approaches were used for each framework; paper-and-pencil tasks for Knowledge and Communication of Science Ideas, and in-depth tasks for Nature of Science.
The framework covers both pencil-and-paper and in-depth tasks.
A knowledge component was described. The knowledge component is unchanged, except for a sub-claim added for each level.

Appendix 11 • NMSSA Report 18: Technical Information 2017 – Health and Physical Education, Science 73
Tabl
e A1
1.3
The
NMSS
A sc
ienc
e fr
amew
ork
(201
7)
Scie
nce
clai
m:
Stud
ents
can
com
mun
icat
e th
eir d
evel
opin
g sc
ienc
e id
eas a
bout
the
natu
ral p
hysic
al w
orld
, and
how
scie
nce
itsel
f wor
ks.
Aspe
ct (s
cien
ce c
apab
ilitie
s)
Sub
clai
ms:
S
tude
nts c
an –
In
dica
tors
Nature of Science
Understanding about science • Investigating in science • Communicating in science • Participating and contributing
Criti
cal i
nqui
ry
(Gat
her a
nd in
terp
ret d
ata,
Us
e ev
iden
ce, C
ritiq
ue e
vide
nce)
L1/2
Ask
and
inve
stig
ate
simpl
e sc
ienc
e qu
estio
ns.
1.
Ask
ques
tions
bas
ed o
n ob
serv
atio
ns a
nd e
xper
ienc
es; t
est i
tem
s for
yes
/no
resp
onse
s; id
entif
y ob
viou
s pat
tern
s; d
escr
ibe
simila
ritie
s and
diff
eren
ces;
mak
e sim
ple
infe
renc
es
from
dat
a; c
ompa
re th
eir i
deas
with
oth
ers’
idea
s.
L3/4
Desig
n, c
arry
out
and
crit
ique
sim
ple
scie
nce
inve
stig
atio
ns.
2.
Deve
lop
ques
tions
that
can
be in
vest
igat
ed; p
lan
and
carr
y ou
t a st
raig
htfo
rwar
d in
vest
igat
ion
rele
vant
to th
e qu
estio
n be
ing
aske
d; c
heck
une
xpec
ted
resu
lts; d
escr
ibe
simpl
e ca
usal
rela
tions
hips
; use
sim
ilarit
ies a
nd d
iffer
ence
s to
sort
and
clas
sify.
3.
Sele
ct a
n ap
prop
riate
met
hod
for i
nves
tigat
ing
a qu
estio
n; p
redi
ct a
pos
sible
out
com
e;
desig
n an
d ca
rry
out a
sim
ple
but s
yste
mat
ic sc
ienc
e in
vest
igat
ion;
use
evi
denc
e to
de
velo
p an
exp
lana
tion;
iden
tify
easil
y-ob
serv
able
pat
tern
s rel
ated
to ti
me
and
chan
ge,
and
use
thes
e to
mak
e pr
edict
ions
; mak
e ju
dgem
ents
abo
ut h
ow w
ell a
n in
vest
igat
ion
answ
ered
the
ques
tion.
Abov
e L4
4.
De
sign
inve
stig
atio
ns th
at in
volv
e m
ultip
le v
aria
bles
; ide
ntify
whi
ch d
ata
are
rele
vant
to
answ
erin
g a
scie
nce
ques
tion;
use
evi
denc
e to
des
crib
e m
ulti-
step
caus
al re
latio
nshi
ps;
susp
end
judg
emen
t if t
here
is in
suffi
cient
evi
denc
e to
ans
wer
the
inve
stig
ated
que
stio
n;
eval
uate
the
suita
bilit
y of
inve
stig
ativ
e m
etho
ds u
sed.
Mea
ning
mak
ing
in sc
ienc
e
(Inte
rpre
t rep
rese
ntat
ions
, Cr
itiqu
e ev
iden
ce)
L1/2
Shap
e sim
ple
desc
riptio
ns a
nd e
xpla
natio
ns to
co
mm
unica
te th
eir s
cienc
e id
eas.
1.
Loc
ate
basic
info
rmat
ion
from
sim
ple
repr
esen
tatio
ns a
nd te
xt; c
omm
unic
ate
thei
r ide
as
usin
g th
eir o
wn
non-
scie
ntifi
c rep
rese
ntat
ions
; use
eve
ryda
y la
ngua
ge to
des
crib
e ob
ject
s an
d ev
ents
.
2.
Acc
urat
ely
rest
ate
wha
t dat
a in
sim
ple
repr
esen
tatio
ns a
nd te
xts s
how
s; co
mpa
re,
cont
rast
and
mak
e sim
ple
infe
renc
es a
bout
dat
a, b
ased
on
pers
onal
exp
erie
nce;
use
pr
ecise
des
crip
tive
lang
uage
; com
mun
icat
e un
ders
tand
ing
of a
scie
nce
idea
usin
g in
form
al
conv
entio
ns.
L3/4
Shap
e sim
ple
scie
nce
text
s for
spec
ific
purp
oses
, usin
g a
rang
e of
app
ropr
iate
scie
nce
sym
bols,
con
vent
ions
and
voc
abul
ary.
3.
Use
and
inte
rpre
t a ra
nge
of sc
ienc
e te
xts,
conv
entio
ns a
nd v
ocab
ular
y to
:
desc
ribe
patt
erns
and
tren
ds in
dat
a an
d ob
serv
atio
ns; d
evel
op sc
ienc
e ex
plan
atio
ns w
ith
som
e lin
ks to
acc
epte
d sc
ienc
e kn
owle
dge;
loca
te a
nd in
terp
ret i
nfor
mat
ion
in o
ther
s’ ex
plan
atio
ns; i
dent
ify th
e au
thor
’s pu
rpos
e in
usin
g a
part
icula
r rep
rese
ntat
ion.
Abov
e L4
4.
Se
lect
repr
esen
tatio
ns th
at a
re fi
t for
pur
pose
; ide
ntify
stre
ngth
s and
wea
knes
ses o
f re
pres
enta
tions
and
writ
ten
text
; dev
elop
des
crip
tions
and
exp
lana
tions
that
dra
w o
n av
aila
ble
evid
ence
and
scie
nce
know
ledg
e.

74 NMSSA Report 18: Technical Information 2017 – Health and Physical Education, Science • Appendix 11
Scie
nce
clai
m:
Stud
ents
can
com
mun
icat
e th
eir d
evel
opin
g sc
ienc
e id
eas a
bout
the
natu
ral p
hysic
al w
orld
, and
how
scie
nce
itsel
f wor
ks.
Aspe
ct (s
cien
ce c
apab
ilitie
s)
Sub
clai
ms:
S
tude
nts c
an –
In
dica
tors
Taki
ng a
ctio
n
(Eng
age
with
scie
nce,
Crit
ique
ev
iden
ce)
L1/2
Sugg
est a
ctio
ns in
resp
onse
to a
n iss
ue, b
ased
on
per
sona
l ide
as a
nd e
xper
ienc
es.
1.
Reco
gnise
scie
nce
capa
bilit
ies o
f an
issue
of p
erso
nal i
mpo
rtan
ce; s
ugge
st p
ossib
le
actio
ns.
L3/4
Draw
on
thei
r em
ergi
ng sc
ienc
e id
eas t
o di
scus
s iss
ues a
nd su
gges
t act
ions
, and
cr
itiqu
e th
eir a
nd o
ther
s’ id
eas
2.
Deci
de o
n an
d ju
stify
an
actio
n to
add
ress
an
issue
; ide
ntify
som
e po
ssib
le p
ositi
ve a
nd
nega
tive
impa
cts o
f pro
pose
d ac
tions
.
3.
Desc
ribe
som
e co
mpl
exiti
es o
f an
issue
and
pos
sible
impa
cts o
f act
ions
, dra
win
g on
thei
r sc
ienc
e un
ders
tand
ings
.
Abov
e L4
4.
Ev
alua
te c
ompe
ting
pers
pect
ives
abo
ut a
n iss
ue; u
se e
vide
nce
from
scie
nce
to a
rgue
for o
r ag
ains
t a p
ropo
sed
actio
n.

Appendix 11 • NMSSA Report 18: Technical Information 2017 – Health and Physical Education, Science 75
Scie
nce
clai
m:
Stud
ents
can
com
mun
icat
e th
eir d
evel
opin
g sc
ienc
e id
eas a
bout
the
natu
ral p
hysic
al w
orld
, and
how
scie
nce
itsel
f wor
ks.
Aspe
ct (s
cien
ce c
apab
ilitie
s)
Sub
clai
ms:
S
tude
nts c
an –
In
dica
tors
Context strands
• Living World • Planet Earth and Beyond • Physical World • Material World
Know
ing
scie
nce
Sub-
clai
ms
Stud
ents
kno
w a
nd c
an u
se:
L1/2
Som
e ba
sic sc
ienc
e id
eas a
bout
thei
r eve
ryda
y ex
perie
nces
and
obs
erve
d w
orld
.
Livi
ng W
orld
•
All l
ivin
g th
ings
nee
d fo
od, w
ater
, air,
war
mth
and
shel
ter t
o su
rviv
e.
• Li
ving
thin
gs a
re a
dapt
ed to
live
in a
par
ticul
ar e
nviro
nmen
t.
• Th
ere
are
lots
of d
iffer
ent
livin
g th
ings
in th
e w
orld
. Pl
anet
Ear
th a
nd B
eyon
d •
Plan
et E
arth
pro
vide
s liv
ing
thin
gs w
ith a
ir, w
ater
and
shel
ter.
• Pl
anet
Ear
th’s
feat
ures
are
chan
ged
by w
eath
er, e
arth
quak
es, v
olca
nic e
rupt
ions
, w
ater
, ero
sion
and
peop
le. A
ny c
hang
es th
at o
ccur
to o
r in
an e
nviro
nmen
t affe
ct
ever
ythi
ng li
ving
ther
e.
• Pl
anet
Ear
th’s
light
and
hea
t com
e fr
om th
e su
n.
Phys
ical
Wor
ld
• A
shad
ow fo
rms o
n a
surf
ace
whe
n an
obj
ect i
s bet
wee
n a
light
sour
ce a
nd th
e su
rfac
e.
• He
at tr
avel
s fro
m o
ne p
lace
to a
noth
er. I
t tra
vels
thro
ugh
som
e m
ater
ials
mor
e qu
ickl
y th
an o
ther
s. •
Push
es a
nd p
ulls
mak
e ob
ject
s mov
e.
Mat
eria
l Wor
ld
• Di
ffere
nt m
ater
ials
have
diff
eren
t pro
pert
ies.
• W
ater
exis
ts in
thre
e st
ates
– so
lid, l
iqui
d an
d ga
s. Th
e st
ate
is de
pend
ent o
n its
te
mpe
ratu
re.
• A
mat
eria
l’s p
rope
rtie
s affe
ct h
ow it
inte
ract
s with
oth
er th
ings
.

76 NMSSA Report 18: Technical Information 2017 – Health and Physical Education, Science • Appendix 11
Scie
nce
clai
m:
Stud
ents
can
com
mun
icat
e th
eir d
evel
opin
g sc
ienc
e id
eas a
bout
the
natu
ral p
hysic
al w
orld
, and
how
scie
nce
itsel
f wor
ks.
Aspe
ct (s
cien
ce c
apab
ilitie
s)
Sub
clai
ms:
S
tude
nts c
an –
In
dica
tors
L3/4
Som
e sim
ple
scie
nce
conc
epts
, inc
ludi
ng
begi
nnin
g un
ders
tand
ings
of a
bstr
act s
cienc
e co
ncep
ts
Livi
ng W
orld
•
All l
ivin
g th
ings
nee
d fo
od, w
ater
, air,
war
mth
and
shel
ter t
o su
rviv
e, a
nd h
ave
diffe
rent
way
s of m
eetin
g th
ese
need
s. •
Livi
ng th
ings
hav
e st
rate
gies
for r
espo
ndin
g to
chan
ges,
both
nat
ural
and
hum
an
indu
ced,
in th
eir e
nviro
nmen
t.
• Li
ving
thin
gs o
n Pl
anet
Ear
th c
hang
e ov
er lo
ng p
erio
ds o
f tim
e an
d ev
olve
diff
eren
tly
in d
iffer
ent p
lace
s. Sc
ient
ists h
ave
part
icula
r way
s of c
lass
ifyin
g liv
ing
thin
gs.
Plan
et E
arth
and
Bey
ond
• Pl
anet
Ear
th is
mad
e up
of w
ater
, air,
rock
s and
soil,
and
life
form
s, an
d th
ese
are
our
plan
et’s
reso
urce
s. •
Wat
er is
a fi
nite
reso
urce
that
is c
onst
antly
recy
cled
. The
wat
er c
ycle
impa
cts o
n ou
r w
eath
er, t
he la
ndsc
ape
and
life
on E
arth
. •
Plan
et E
arth
is p
art o
f a v
ast s
olar
syst
em th
at c
onsis
ts o
f the
Sun
, pla
nets
and
m
oons
. Ph
ysic
al W
orld
•
The
sun
is th
e or
igin
al so
urce
of a
ll en
ergy
on
Plan
et E
arth
. •
Heat
, lig
ht, s
ound
, mov
emen
t and
ele
ctric
ity a
re fo
rms o
f ene
rgy.
Ene
rgy
can
tran
sfor
m fr
om o
ne fo
rm to
ano
ther
. •
Cont
act f
orce
s (e.
g. fr
ictio
nal)
and
non-
cont
act f
orce
s (e.
g. g
ravi
ty a
nd m
agne
tism
) af
fect
the
mot
ion
of o
bjec
ts.
Mat
eria
l Wor
ld
• M
ater
ials
can
be g
roup
ed in
diff
eren
t way
s acc
ordi
ng to
thei
r phy
sical
and
chem
ical
pr
oper
ties.
• M
atte
r is m
ade
up o
f tin
y pa
rticl
es th
at b
ehav
e di
ffere
ntly
as h
eat i
s add
ed o
r re
mov
ed.
• W
hen
mat
eria
ls ar
e he
ated
or m
ixed
with
oth
er m
ater
ials
the
resu
lting
cha
nges
may
be
per
man
ent o
r rev
ersib
le.

Appendix 12 • NMSSA Report 18: Technical Information 2017 – Health and Physical Education, Science 77
Appendix 12: Plausible Values in NMSSA
Contents:
1. Introduction 78Software 78
2. Plausible values 78What are plausible values? 78Why use plausible values? 78Advantages and disadvantages of plausible values in NMSSA 79Plausible values and NMSSA assessment design 79
3. Estimation methods and processes relevant to NMSSA 80Joint maximum likelihood estimation (JMLE) 80Marginal maximum likelihood estimation (MMLE) 80Expected a posteriori estimation (EAP) 81Plausible values 81Latent regression 81
4. Calculating population statistics from plausible values 81References 82Software 82
NMSSA Report 18: Technical Information 2017 – Health and Physical Education, Science • Appendix 12 78
1. Introduction At the end of 2013, NMSSA carried out an investigation44 as to the practical implications of introducing plausible values (PV) methodology into the NMSSA data analysis. Following on from this investigation, the NMSSA Technical Reference Group that met in December 2014 recommended that plausible values should be used in future NMSSA analyses. Plausible values were used for the first time in NMSSA 2015.
Plausible values methodology has been in use for some time in larger national and international studies of student achievement (e.g. NAEP45, PISA46, TIMMS47). Plausible values can recover population statistics more accurately than other methods especially where assessments are necessarily very short and individual scores subsequently form estimated population distributions with imprecise standard deviations.
Plausible values are now incorporated into all NMSSA achievement analysis and estimation. This appendix provides a generic description of how NMSSA uses plausible values methodology. It begins with a brief description of what plausible values are, and why NMSSA now uses this approach. This is followed by some discussion on issues considered by NMSSA with respect to plausible values. Finally, some aspects of relevant estimation methods are laid out and examples of formulae to calculate population statistics from plausible values are provided.
Software NMSSA uses the Test Analysis Modules (TAM) package (Kiefer, Robitzsch & Wu) in R (R Core Team, 2015) to generate sets of plausible values.
While plausible values methodology has been in use for some time internationally, smooth and efficient ways of generating and working with plausible values has not been readily available. The TAM R-package is relatively new software and offers very straightforward solutions for programming processes, and working with multiple sets of plausible values.
2. Plausible values What are plausible values? The purpose of NMSSA is to monitor New Zealand population achievement standards in Year 4 and Year 8 across the New Zealand Curriculum (NZC). The statistics of interest are population means, standard deviations, percentages of student populations achieving at various curriculum levels, and standard errors associated with these statistics. To estimate these statistics NMSSA constructs assessments in the learning area under investigation for a nationally representative sample of students to complete. Each student in the sample is subsequently assigned an achievement estimate on a Rasch measurement scale (Rasch, 1960). Each of these estimates contains a degree of uncertainty. One way to express the degree of uncertainty of measurement at the individual level is to provide several estimates for each student reflecting the magnitude of the measurement error of the individual's estimate. If the measurement error is small, then multiple scores for a student will be close together. If the measurement error is large, then multiple scores for a student will be further apart. These multiple scores for an individual, sometimes known as multiple imputations, are plausible values. In other words, plausible values represent a range of scores that a student might reasonably have, given that student's responses to the assessment.
Why use plausible values? When individual students complete assessments that contain only a small number of questions the proficiency estimates generated for the students are relatively imprecise. In this situation traditional Item Response Theory (IRT) methods suitable for calculating individual level results can produce biased variance estimates for groups. This bias increases as the number of questions asked of each individual decreases (Wu, 2005).
44 Internal NMSSA paper: Plausible Values - An Investigation 45 https://nces.ed.gov/nationsreportcard/tdw/analysis/est_pv_individual.asp 46 https://www.oecd.org/pisa/sitedocument/PISA-2015-Technical-Report-Chapter-9-Scaling-PISA-Data.pdf 47 https://nces.ed.gov/timss/timss15technotes_weighting.asp

Appendix 12 • NMSSA Report 18: Technical Information 2017 – Health and Physical Education, Science 79
A plausible values approach generates multiple values to represent the probable distribution of a student’s achievement. These plausible values can be used to produce an unbiased view of the spread and location of achievement for a group of students (von Davier et al., 2009). This is particularly important when group results are being compared. For example, if we want to estimate the effect size of the difference in means between Year 4 and Year 8 achievement in a particular learning area, an over-estimated variance will under-state the effect size, and an under-estimated variance will over-state the effect size.
Advantages and disadvantages of plausible values in NMSSA Advantages Advantages include, but are not necessarily limited to:
• shorter assessments leading to reduced burden – for schools, students and administrators• accurate population statistics with very short assessments – perhaps around 10 items• greater coverage of learning areas within a fixed assessment time through the use of large item banks• generation of less 'granulated' scale scores, making estimation of percentages above and below
curriculum level cut-points more accurate• amelioration of the effects of an off-target assessment i.e. ceiling and floor effects.
Disadvantages Possible disadvantages are:
• change of analysis methods across cycles of NMSSA where comparisons are needed• inconsistency of scale construction methodologies across NMSSA scales, between (and possibly
within) cycles• increased complexity of analysis methodology• extra resource required to extend frameworks and construct larger item banks• extra resource required for using and reporting more complex analysis methods.
Plausible values and NMSSA assessment design The NMSSA objective is two-fold:
1. Construct valid and reliable measurement scales in the relevant learning areas2. Report population achievement statistics as accurately, and as precisely as practicable.
Plausible values methodology allows us to implement any of the following to one degree or another: • shorter assessments (10 – 20 items/score points)• simultaneous assessment of a wider selection of learning areas than previously possible• more in-depth coverage of a single curriculum learning area.
There is, however, a limit on the extent to which any of these can be applied.
Achieving a balance Some aspects of the NMSSA design are fixed:
• sample size – cannot be increased• time allowed on site in schools – cannot be increased, though it is possible that time in schools may
be more efficiently allocated in the future with the use of online assessments tools• minimum number of responses per item – ideally this should be around 500 to obtain precise item
parameter estimates• high quality linkage between forms and year groups must be maintained.
Within these limitations we can vary: • assessment length• number of forms• item bank size.

NMSSA Report 18: Technical Information 2017 – Health and Physical Education, Science • Appendix 12 80
The following formula shows the relationship between sample size (fixed), number of responses per item required (fixed minimum), assessment length and item bank size.
samplesize
numberofresponsesperitem = numberofitemsinbank
numberofitemsperassessment
The idea of having much shorter assessments and being able to cover larger curriculum areas in greater depth is very appealing. However, while this formula is useful for rough calculations, there are some additional practical constraints that need to be considered in the context of NMSSA.
• The fewer items per assessment form, the more forms NMSSA needs to construct. • Designing a set of well-linked forms becomes increasingly complex the more forms there are. • The structure of the NMSSA sample is fixed. Up to 27 students from each of 100 schools are selected
at each of Year 4 and Year 8. While it is often practical for students in each school to complete a variety of different forms, sometimes (as in the case of a group-administered assessment like English: listening) it is not.
• Individual items may not be delivered in isolation. Often items are organised in units, with several items belonging to one stimulus for example. These items have to move together making linking and even spreading of items across forms more difficult.
• Many items or units will only be suitable for certain year groups. That is, it is often the case that some units or items are not allowed to appear in some forms.
• Each form must constitute a realistic stand-alone assessment, even if it is short.
As an example, both the English: listening and English: viewing assessments in 2015 required a design involving 25 linked forms with each form contributing between 13 and 17 score points. In 2014, English: reading required only 10 linked assessment forms, with each form contributing 30 or more score points.
3. Estimation methods and processes relevant to NMSSA This section contains short descriptions of estimation techniques related to this paper. These descriptions guide the reader through the processes employed by NMSSA to arrive at population estimates of achievement using plausible values.
Joint maximum likelihood estimation (JMLE) The joint maximum likelihood estimation (JMLE) method was used in NMSSA analysis from 2012 to 2014. The method was devised by Wright & Panchapakesan (1969). The estimate of the Rasch parameter occurs when the observed raw score for the parameter matches the expected raw score. 'Joint' means that the estimates for the persons and items are obtained simultaneously. While JMLE person parameters generate unbiased estimates of population means, population standard deviations are generally over-estimated with JMLE. This bias in the estimates of standard deviation increases the fewer items each individual completes (Wu, 2005).
Marginal maximum likelihood estimation (MMLE) With marginal maximum likelihood estimation (MMLE) item difficulties are structural parameters. Person abilities are incidental parameters, integrated out for item parameter (difficulty) estimation by imputing a person measure distribution. The item difficulties can then be used for estimating EAP person abilities (see below) in a subsequent step (Linacre, 2015).

Appendix 12 • NMSSA Report 18: Technical Information 2017 – Health and Physical Education, Science 81
Expected a posteriori estimation (EAP) Expected a posteriori (EAP) person estimation is derived from Bayesian statistical principles. It requires assumptions about the expected parameter distribution – usually a normal distribution (Linacre, 2015). As a consequence, EAP person estimates are usually more normally distributed than person estimates derived using JMLE which have no distributional assumptions applied. EAP person estimates provide unbiased estimates of population means as do JMLE person estimates. However, estimates of population standard deviations are under-estimated. The bias in the estimates of population standard deviations becomes more marked as assessments become shorter (Wu, 2005).
Plausible values To generate plausible values we use MMLE to estimate item parameters and EAP estimation to estimate person parameters. An EAP person estimate represents the mean of an individual’s estimated score distribution. To generate a set of plausible values a random draw is taken from each individual’s estimated score distribution. In NMSSA, 50 such sets of plausible values are generated.
Latent regression If there is an interest in estimating statistics for population subgroups of students, such as year level, gender, or ethnic group, the generation of plausible values needs to take these group structures into account (Wu, 2005). For example, for an assessment administered to students in Year 4 and Year 8, it is most likely the case that the combined sample of Year 4 and Year 8 students is really a mixture of two underlying normal distributions with different means.
Any population sub-group which is to be reported on in the main NMSSA reports must be accounted for in the latent regression analysis. These variables (defining subgroup membership) are sometimes called 'conditioning variables'. The subgroup population estimates are conditional on subgroup membership.
In NMSSA, the variables defined in the latent regression are year level, gender, ethnic group membership and school decile group.
4. Calculating population statistics from plausible values When calculating population statistics, the statistic of interest (a mean, or a standard deviation for example) is calculated 50 times, once for each set of plausible values. To achieve the final population estimate, the mean over all 50 results is taken. In this way both sampling error and measurement error are accounted for (Beaton et al., 1995).
For example a population (or subpopulation) mean would be estimated by
𝑚 =1𝑃67
1𝑁6𝑋:;
<
;=>
?@
:=>
Where P = number of sets of plausible values being used
N = number of persons in the sample
Xpi = the achievement estimate, X, of person i in the pth set of plausible values
A population standard deviation is estimated by:
𝑠 =1𝑃6
B71
𝑁 − 16(𝑋E − 𝑋:;)G<
;=>
?@
:=>

NMSSA Report 18: Technical Information 2017 – Health and Physical Education, Science • Appendix 12 82
References Beaton A.E., & Gonzalez. E. (1995). NAEP primer. Chestnut Hill, MA: Boston College: Boston.
von Davier, M., Gonzalez, E., Mislevy, R.J. (2009). What are plausible values and why are they useful, IERI Monograph Series: Issues and Methodologies in Large-scale Assessments (Vol. 2, pp. 9-36). Hamburg/Princeton, NJ: IEA-ETS Research Institute.
Linacre, J.M. (2015). A User's Guide to WINSTEPS, Program Manual 3.91.0
Rasch, G. (1960). Probabilistic models for some intelligence and achievement tests. Copenhagen: Danish Institute for Educational Research.
Wright B. Panchapakesan N. (1969), A procedure for sample-free item analysis, Educational and Psychological Measurement, April 1969, vol. 29, no. 1, pp.23-48
Wu, M. (2005) The role of plausible values in large-scale surveys, Studies in Educational Evaluation, Volume 31, 114-128.
Software R Core Team (2015). R: A language and environment for statistical computing. R Foundation for Statistical
Computing, Vienna, Austria. URL http://www.R-project.org/.
Kiefer, T., Robitzsch, A. & Wu, M. (2014). TAM: Test analysis modules. R package version 1.14. http://CRAN.R-project.org/package=TAM
Linacre, J. M. (2014). Winsteps® Rasch measurement computer program. Beaverton, Oregon: Winsteps.com


W ā n a n g a t i a t e P u t a n g a T a u i r a
National Monitoring Studyof Student Achievement
NMSSA
Technical Information 2017Health and Physical Education • Science
NM
SSA • CYCLE 2
NM
SSA Report 18 : TECHNICAL INFORMATION 2017 – Health & Physical Education • Science
NM
SSA • CYCLE 2
NM
SSA Report 18 : TECHNICAL INFORMATION 2017 – Health & Physical Education • Science
ISSN: 2350-3238 (Online only) ISBN: 978-1-927286-45-6 (Online only)
Report 18 NMSSA, Technical Information 2017 – Health and Physical Education • Science
W ā n a n g a t i a t e P u t a n g a Ta u i r a
National Monitoring Studyof Student Achievement
NMSSA Report 18CYCLE 2
NMSSA The National Monitoring Study of Student Achievement (NMSSA) is designed to assess and understand student achievement across the New Zealand curriculum at Years 4 and 8 in English-medium state and state-integrated schools. The study is organised in five-year cycles. The first cycle ran from 2012 to 2016. Health and physical education (PE) was last assessed in 2013.
The NMSSA health and physical education studyIn 2017, we assessed health and PE using nationally representative samples of students from 100 schools at Year 4 and 100 schools at Year 8.
There were three assessments.
Critical Thinking in Health and PE (CT). Computer-presented tasks and one-to-one interviews related to critical thinking, critical action and creative thinking in relation to self, others and society.
Learning Through Movement (LTM). Tasks related to movement skills, movement sequences and strategic actions within a game context.
Well-being (hauora). Understanding of well-being discussed in one-to-one interviews.
Scores on CT and LTM were located on separate measurement scales linked to curriculum expectations at levels 2, 3 and 4 (see graphs on the right). Items in the CT assessment that were used in both 2013 and 2017 allowed scores on CT to be compared across cycles. This was the first cycle involving the LTM scale.
Contextual information about teaching and learning in health and PE was gathered from students, teachers and principals using a set of questionnaires.
Key achievement findingsIn 2017 On both CT and LTM, most students in Year 4 were achieving at or above level 2 curriculum
expectations and less than half the students in Year 8 were achieving at level 4 curriculum expectations.
There were statistically significant differences in average scores on CT and LTM related to gender, ethnicity and school decile1. On average and at both year levels:
� girls scored higher than boys on CT and lower on LTM
� non-Māori students scored higher than Māori students
� non-Pacific students scored higher than Pacific students
�students in high decile schools scored higher than those in mid decile schools who, in turn, scored higher than those in low decile schools.
During the well-being (hauora) interview, the majority of students identified physical, mental/emotional and social aspects of well-being. Fewer students identified spiritual aspects.
Changes between 2013 and 2017 The average score on CT at Year 8 decreased by 6 CT units between 2013 and 2017. The difference
was statistically significant. There was no statistically significant change at Year 4.
The percentage of Year 8 students achieving at curriculum level 4 in 2017 was lower than in 2013.
Students’ understandings of well-being were similar in 2013 and 2017.
Distribution of scores on the Critical Thinking (CT) scale
Distribution of scores on the Learning Through Movement (LTM) scale
Percentage of students meeting curriculum expectations in 2017
Year Curriculum level
Critical Thinking
Learning Through
Movement
4 Level 2 + 88 63
8 Level 4 33 45
1 The ‘low’ decile band comprised students in decile 1 to 3 schools, the ‘mid’ decile band, students in decile 4 to 7 schools and the ‘high’ decile band, students in decile 8 to 10 schools.
Summary of results from the 2017 National Monitoring Study of Student Achievement for teachers and principals
Achievement in health and physical education
NMSSA
2017
0
20
40
60
80
100
120
140
160
180
Scal
e sc
ore
(CT)
< Level 2
Level 2
Level 3
Level 4+
Year 4 Year 8
0
20
40
60
80
100
120
140
160
180
Scal
e sc
ore
(CT)
< Level 2
Level 2
Level 3
Level 4+
Year 4 Year 8
0
20
40
60
80
100
120
140
160
180
Scal
e sc
ore
(CT)
< Level 2
Level 2
Level 3
Level 4+
Year 4 Year 8
0
20
40
60
80
100
120
140
160
180
Scal
e sc
ore
(CT)
< Level 2
Level 2
Level 3
Level 4+
Year 4 Year 8
0
20
40
60
80
100
120
140
160
180
Scal
e sc
ore
(CT)
< Level 2
Level 2
Level 3
Level 4+
Year 4 Year 8
0
20
40
60
80
100
120
140
160
180
Scal
e sc
ore
(LTM
)
< Level 2
Level 2
Level 3
Level 4+
Year 4 Year 8
0
20
40
60
80
100
120
140
160
180
Scal
e sc
ore
(LTM
)
< Level 2
Level 2
Level 3
Level 4+
Year 4 Year 8
0
20
40
60
80
100
120
140
160
180
Scal
e sc
ore
(LTM
)
< Level 2
Level 2
Level 3
Level 4+
Year 4 Year 8
0
20
40
60
80
100
120
140
160
180
Scal
e sc
ore
(LTM
)
< Level 2
Level 2
Level 3
Level 4+
Year 4 Year 8
0
20
40
60
80
100
120
140
160
180
Scal
e sc
ore
(LTM
)
< Level 2
Level 2
Level 3
Level 4+
Year 4 Year 8
W ā n a n g a t i a t e P u t a n g a T a u r i a
Contextual findings: Learning and teaching in health and PE
Further reporting on health and PE, including a report written specifically for teachers and curriculum leaders, can be found at http://nmssa.otago.ac.nz. National Monitoring Study of Student Achievement, Educational Assessment Research Unit, University of Otago, Box 56, Dunedin 9054, New Zealand email: [email protected] • tel: 0800 808 561 • fax: 03 479 7550
Students’ attitudes and confidence in health and PE•Moststudentswerepositiveandconfidentaboutlearninghealthatschool.•Moststudentswereverypositiveandconfident/veryconfidentaboutlearninginPE.
Opportunities to learn health and PE at schoolStudents experienced a wide range of activities in both health and PE. However, the opportunities to learn in PE frequently (‘often’ or ‘very often’) were greater than in health.
The four most frequent learning opportunities reported by teachersHealth Physical Education
Year 4 %
Year 8 %
Year 4 %
Year 8 %
Practise the skills they need to relate well to other people 88 90 Learn about playing fair 90 92
Learn ways to manage their feelings (e.g. if they feel angry or sad) 84 73 Take part in fitness activities 86 76
Learn about the different ways they can keep themselves healthy and happy 66 75 Practise the skills they need to work with others
in team games 81 89
Learn the skills needed to make healthy decisions 58 72 Learn new skills and ways to be active 67 84
The four least frequent learning opportunities reported by teachersHealth Physical Education
Year 4 %
Year 8 %
Year 4 %
Year 8 %
Find out about other people’s ideas about health 31 34 Learn games, dance, or movement from different cultures (e.g. Māori or Pacific games) 44 32
Share things they have learnt about health with others (e.g. make a poster, talk to people, write a letter)
27 43 Explore the meaning of sports in their lives (like clubs, Olympics) 34 39
Get feedback from you about their learning in health 27 44 Share the things their family or whānau do to be active 32 23
Critically analyse the underlying meaning of health messages (e.g. ads and music videos) 11 31 Plan ways to keep their class and school community
active 28 28
Teachers’ and principals’ perspectives on health and PE•MostteachersenjoyedteachinghealthandPEandwereconfidentaboutteachingboth.
•Year8teacherstendedtobemoreconfidentinteachinghealthandPEthanYear4teachers.
•Mostschoolsusedexternalproviders.ThemostcommonwereLifeEducation(inhealth)andnational,regionalandlocalsports clubs and associations (in PE).
•PrincipalsratedtheprovisionforlearninginPEintheirschoolhigherthanforhealth,andforbothhealthandPE, the provision at Year 8 was rated more highly than at Year 4.
Percentage of principals’ ratings of their school’s overall provision for learning in health/PE
Physical EducationHealth
%
Poor
60
50
40
30
20
10
0Fair Good Very good
0
10
20
30
40
50
60
Poor Fair Good Very good
Year 4
Year 8
Year 4
Year 8
0
10
20
30
40
50
60
Poor Fair Good Very good
Year 4
Year 8
Year 4
Year 8
%
60
50
40
30
20
10
0Poor Fair Good Very good

NMSSAThe National Monitoring Study of Student Achievement (NMSSA) is designed to assess student achievement across the New Zealand curriculum (NZC) at Years 4 and 8 in English-medium state and state-integrated schools. The study is organised in five–year cycles. The first cycle ran from 2012 to 2016. Science was last assessed in 2012.
The NMSSA science studyIn 2017, we assessed science using nationally representative samples of about 2,300 students from 100 schools at each of Year 4 and Year 8. Up to 25 students in each school took part in an assessment called the Science Capabilities assessment.
Scores on the assessment were located on the Science Capabilities (SC) measurement scale (see graph at top right). Common items used in 2012 and 2017 allowed score comparisons to be made across the cycles of assessment.
Contextual information about teaching and learning in science was gathered from students, teachers and principals using a set of questionnaires.
Key achievement findingsIn 2017 Most students (94 percent) in Year 4 were achieving at or above curriculum expectations
(developed level 1 and 2), while in Year 8 a minority (20 percent) were achieving at or above curriculum expectations (developed level 3 and 4)1 .
The difference in average scores between Year 4 and Year 8 indicates that students made about 8 SC units of ‘progress’ per year between Year 4 and Year 8.
Girls scored higher, on average, than boys by 4 SC units at both year levels.
Non-Māori students scored higher, on average, than Māori students by 12 SC units at both year levels.
Non-Pacific students scored higher, on average, than Pacific by 18 SC units at Year 4 and 14 SC units at Year 8.
At both year levels, students from high decile schools2 scored higher, on average, than those from mid decile schools, who, in turn, scored higher than those from low decile schools. At Year 4, the difference between the average scores for students in the high and low decile bands was 23 SC units. At Year 8, it was 20 SC units.
Changes between 2012 and 2017 Differences in the overall average scores for Year 4 and Year 8 students between 2012 and
2017 were not statistically significant.
Statistically significant increases in average achievement scores were recorded for several population subgroups including: Year 4 Asian students, Year 8 girls, Year 8 Māori students, Year 8 Pasifika students, and Year 4 and Year 8 students in low decile schools.
1 In the New Zealand Curriculum, achievement objectives for science are the same for levels 1 and 2 and almost the same for levels 3 and 4. To differentiate between different levels of performance at levels 1 and 2, and levels 3 and 4, a curriculum alignment exercise in 2012 defined an ‘emerging’ and ‘developed’ expectation for the achievement objectives contained in each pair of levels.2 The ‘low’ decile band comprised students in decile 1 to decile 3 schools, the ‘mid’ decile band, students in decile 4 to 7 schools and the ‘high’ decile band, students in decile 8 to decile 10 schools.
Summary of results from the 2017 National Monitoring Study of Student Achievement for teachers and principals
Achievement in science
NMSSA
2017
2017 score distribution for Year 4 and Year 8 students on the
Science Capabilities (SC) scale
Change in average scores for Year 4 and Year 8 students on the Science
Capabilities scale between 2012 and 2017
0
20
40
60
80
100
120
140
160
180
Scal
e sc
ore
(SC)
EmergingLevel 1 & 2
DevelopedLevel 1 & 2
EmergingLevel 3 & 4
DevelopedLevel 3 & 4
Year 4 Year 8
0
20
40
60
80
100
120
140
160
180
Scal
e sc
ore
(SC)
EmergingLevel 1 & 2
DevelopedLevel 1 & 2
EmergingLevel 3 & 4
DevelopedLevel 3 & 4
Year 4 Year 8
0
20
40
60
80
100
120
140
160
180
Scal
e sc
ore
(SC)
EmergingLevel 1 & 2
DevelopedLevel 1 & 2
EmergingLevel 3 & 4
DevelopedLevel 3 & 4
Year 4 Year 8
0
20
40
60
80
100
120
140
160
180
Scal
e sc
ore
(SC)
EmergingLevel 1 & 2
DevelopedLevel 1 & 2
EmergingLevel 3 & 4
DevelopedLevel 3 & 4
Year 4 Year 8
0
20
40
60
80
100
120
140
160
180
Scal
e sc
ore
(SC)
EmergingLevel 1 & 2
DevelopedLevel 1 & 2
EmergingLevel 3 & 4
DevelopedLevel 3 & 4
Year 4 Year 8
2012 2017
Scal
e sc
ore
(SC
units
)
20
40
60
80
100
120
140
160
180Year 4Year 8
W ā n a n g a t i a t e P u t a n g a T a u r i a
Contextual findings: Learning and teaching in science
Further reporting on science, including a report written specifically for teachers and curriculum leaders can be found at http://nmssa.otago.ac.nz. National Monitoring Study of Student Achievement, Educational Assessment Research Unit, University of Otago, Box 56, Dunedin 9054, New Zealand email: [email protected] • tel: 0800 808 561 • fax: 03 479 7550
Students’ attitude to science and confidence in science• Moststudentswerepositiveaboutlearningscienceatschoolandexpressedconfidenceassciencelearners.
Distribution of scores for Year 4 and Year 8 students on the Attitude to Science scale
Distribution of scores for Year 4 and Year 8 students on the Confidence in Science scale
Students’ perceptions of the difficulty of their science learning •Moststudentsratedthedifficultyoftheirsciencelearning
as ‘about right for me’.
Year 4 and Year 8 students’ responses about the difficulty of their science programme
Opportunities to learn science at schoolStudents were given a list of learning opportunities in science and asked whether they did each one ‘sometimes’, ‘often’, ‘very often’ or ‘never’.
Percentage of Year 4 and Year 8 students reporting that learning opportunities in science happened at least sometimes
Learning opportunity Year 4 %
Year 8 %
Do science investigations about something the teacher has chosen 85 81
Ask questions about science things that I am curious about 85 82
Find information by myself about science 85 81
Go on trips outside of school to learn more about a science topic 81 65
Share things I have learned about science with others 78 77
Do science investigations 72 71
Study topics that are connected to my family or whānau 70 64
Have experts or visitors come to the classroom to explain science ideas 68 52
Talk with my teacher about my learning in science 68 67
Enter science competitions or fairs 41 43
Distribution of scores for Year 4 and Year 8 teachers on the Confidence in Teaching Science scale
Teachers’ and principals’ perspectives on science•Mostteachersindicatedthattheyenjoyedteachingscienceand
were confident about teaching it.
• AgreaterpercentageofYear8teachersthanYear4teachersindicated that they had a qualification related to science.
•Overall,themajorityofteachersindicatedthattheyhadadequateaccess to a range of resources for teaching science. However, 30 to 40 percent of teachers at both year levels did not agree that they had access to suitable spaces to teach science or appropriate teaching materials.
• Teachersgenerallyreportedinfrequentopportunitiesforprofessional interactions with colleagues about teaching science.
• AtYear8,67percentofprincipalsratedtheirschool’soverallprovision in science as either ‘good’ or ‘very good’ compared with 46 percent of those at Year 4.
• FiftypercentofprincipalsatYear4and40percentatYear8indicated that teachers in their school had little or no access to external professional learning and development in science.
0
20
40
60
80
100
120
140
160
180
Scal
e sc
ore
(Att
itude
to S
cien
ce)
Not positive
Positive
Very positive
Year 4 Year 8
0
20
40
60
80
100
120
140
160
180
Scal
e sc
ore
(Con
�den
ce in
Sci
ence
)
Not con�dent
Con�dent
Very con�dent
Year 4 Year 8
0
20
40
60
80
100
Too
easy
Abo
ut ri
ght f
or m
e
Too
hard
Too
easy
Abo
ut ri
ght f
or m
e
Too
hard
Year 4 Year 8
%
0
20
40
60
80
100
120
140
160
180
Scal
e sc
ore
(Con
�den
ce in
Tea
chin
g Sc
ienc
e)
Not con�dent
Con�dent
Very con�dent
Year 4 Year 8

Communications Approach
November 15, 2018
Release of 2017 National Monitoring Study of Student Achievement (NMSSA) Reports:
• Science
• Health and physical education (HPE)
• Technical report
Release of the He Whakaaro | Education Insights report - What can the NMSSA tell us about student progress and achievement?
Situation The University of Otago conducts research and publishes NMMSA reports for the Ministry of Education.
Part of this work is commissioned to NZCER. The Minister’s office received a copy of the Ministry’s He Whakaaro | Education Insights report, which outlines what NMSSA tells us about ‘Student Progress and Achievement’, on 2 November.
The 2017 Science, and Health & Physical Education (HPE) reports and related briefing/communications plan will be forwarded to the Minister’s office on Friday, 16 November 2018.
The reports will be available on Education Counts and the NMSSA website on 30 November 2018.
Information leaflets will be available in the Education Gazette to inform school leaders and other readers of the findings in early 2019.
The second NMSSA cycle has begun. This means that we can now compare the performance of Year 4 and 8 students in New Zealand Curriculum (NZC) learning areas over time.
Although there were no changes in average Science achievement overall, there were small but statistically significant increases in scores for some groups:
o Year 4 Asian students
o Year 8 girls
o Year 8 Māori students

2
o Year 8 Pacific students
o Year 4 and Year 8 students in low decile schools
Year 8 students also performed at a lower level in HPE than they did four years ago – this has reduced from 46% in 2013 to 33% in 2017.
Further, the average score for Year 8 students in HPE decreased by 6 scale score units, the equivalent of just over half a years’ learning. Significant decreases were seen in boys, New Zealand European students, Māori students, and for students in all decile bands (low, mid and high).
Despite the decrease in overall HPE scores, students had a good understanding of well-being. Most students were able to accurately explain using pictures and words what people could do and have in their lives to keep healthy and happy. More than 80% of students at both year levels identified aspects of mental/emotional and social well-being, while more than half identified physical aspects (60% of Year 4 and 72% of Year 8), and less than one-fifth of students identified spiritual wellbeing (7% of Year 4 and 17% of Year 8). Students’ understanding of well-being was generally similar to what was found in 2013, with two exceptions. More Year 4 students in 2017 identified social aspects of well-being and a greater percentage of students at both year levels identified aspects of spiritual well-being in 2017 than 2013.
The He Whakaaro | Education Insights report on ‘Student Progress and Achievement’ shows overall progress has been too slow between Year 4 and Year 8 for most students to meet the demands of the Level 4 curriculum by the end of Year 8. In each learning area there was a drop in the proportion of students achieving at the expected curriculum level between Year 4 and Year 8, except in English:Reading (where the same proportion were at the expected level in both years 58% and 59% respectively).
Context The NMSSA assesses the strengths and weaknesses across the New Zealand curriculum over a five-year cycle, and pays specific attention to the achievement and progress of priority learners – Māori, Pacific, and students with specific education needs. Year 8 results continue to be low across-the-board for science. Science scores are the lowest of all subject levels at 20% (with below 10% of priority learners achieving at or above the expected curriculum level). There is a range of possible reasons why achievement levels in Science (and other learning areas) is not consistent with the outcomes at secondary level – where last year almost 80% of school leavers had participated in science at NCEA Level 1, and more than 63% of school leavers attained science at Level 1 or above.
Although we don’t have the evidence to confirm the contribution of these possibilities, variable achievement in Science between primary and secondary settings could be because:
• Local curriculum design is variable. Work is underway to create awareness about the need to strengthen it, against the intended aspirations of the national curriculum.
• Expectations of different learning areas in the curriculum may be too easy at Level 2, and/or too difficult at /Level 4, or too low at Level 1 of NCEA
• New Zealand is less likely to have teachers with training in specialised subjects such as maths and science at these year groups, than the international average.

3
• NMSSA testing happens in term three and it is likely that more students would be at the expected level at the end of term four.
The NMSSA results for science are somewhat consistent with those from the PISA 2015 New Zealand Summary Report, which showed 13% of 15-year-olds in New Zealand were high performing, and 17% were low performers.
The 2014 Trends in International Mathematics and Science Study (TIMSS) results are similar. New Zealand has a wider range in achievement, and more low performing students than many other countries. Six percent of Year 5 students and 10% of Year 9 students are ‘advanced’ and can do the most complex and difficult science questions. However, 12% of both Year 5 and Year 9 students performed below ‘low’. These students did not correctly complete the simple, basic questions that we would expect them to do at their year levels.
Year 8 results in HPE declined over the four year period. This may be related to how HPE programmes are delivered. Most schools reported using external providers to support or deliver up to 40% of their HPE programmes. Only a small percentage of students did not have external providers providing or supporting their HPE programmes (2-11%). Principals rated the provision for learning in PE in their school higher than for health, especially at Year 8.
Activity plan
Activity When Who’s responsible
Reports loaded on Education Counts and NMSSA websites
November 30 EDK
Reactive responses to media Ongoing after the release of the reports on November 30
Ministry media team.
Leaflets in the Education Gazette outline results to schools
Early in 2019 Otago University/ Ministry’s channels team
Sharing insights and learning tasks with schools
End of term 1, 2019 ELSA
These reports will be available on Education Counts on 30 November 2018. Leaflets will be included in the Education Gazette in early 2019. This will inform school leaders and other readers about the NMSSA findings for Science, and Health and PE.
The Ministry is also working to share the specific insights gained from the NMMSA studies with schools. This will help schools to clarify how students progress in their learning between Years 4 and 8, across curriculum learning areas.
This resource will also provide insights into how to develop rich tasks to support schools in the design of their local curriculum. Examples of student responses to tasks will also show teachers the type of learning that should be exhibited. We expect this resource for Science and Health & PE to be available later in term 1, 2019.

4
We intend on holding a series of webinars to talk directly to principals and teachers about the 2017 findings. These will allow teachers and principals engage in a live presentation of NMSSA findings, to ask questions and to let the NMSSA team and the Ministry access the views and reaction of the sector to the findings.
Key messages • A responsive education system requires robust information about student progress and
achievement. NMSSA is designed to give a broad picture of student achievement across the NZC at the primary level.
• Information about progress and achievement is important for students, teachers, families and whānau, and the Government.
• It enables:
o Teachers to understand the rate at which their students are learning and use the information to assist learning,
o Parents and whānau to focus on their child’s progress and support them with their next learning steps, and
o Governments to make better decisions about where resources should go and how policies should be shaped.
Science results • The 2017 NMSSA results for science are largely consistent with results from 2012.
• Science at Year 8 continues to be low, with only 20% of students achieving at or above the expected curriculum level, compared with 94% at Year 4.
• The overall Year 8 result for science is not consistent with the science outcomes we see for older students. Almost 80% of school leavers have participated in science at NCEA Level 1, and 63% of school leavers attain Level 1 or above NCEA science. The improvement in science achievement in later years of schooling is likely to reflect the move from general to specialised subject areas in high school.
• We are urging principals and school leaders to place a stronger focus on learning in science – as part of strengthening their local curriculum across all subjects.
• The NMSSA results show Year 4 and Year 8 students generally feel positive about learning science.
• Teachers are generally confident teaching science and reported that science instruction was for 11-20 hours per term on average. This represents about 5% of available teaching time, meaning that students may have less opportunity to learn science than some other learning areas. Opportunity to learn reflects a number of influences, including the status of the learning area, the significance in terms of system assessment purposes, the opportunity cost of choosing to teach science at the expense of other subjects, and competing foci for teachers. The low reported rate of students entering science competitions supports the idea that science is not a core focus subject in many primary schools.
Health and PE results • It is disappointing to see the decrease across-the-board in achievement levels for HPE in
Year 8.
5
• Schools use a wide range of HPE providers – which may contribute to inconsistency in teaching this subject. More schools reported using external providers to assist with the design and/or delivery of their HPE programmes in 2017 than in 2014. In 2014, 45% of Year 4 teachers and 33% of Year 8 teachers reported using external providers. By 2017, between 89-98% of principals indicated that external providers were used in their schools.
• The Ministry is also reviewing the recommendations from the Education Review Office in the recent Sexuality Education Report, to understand how we can best strengthen teaching and learning about well-being and other subjects, against the ministry’s sexuality education guidelines.
• The results show year 4 and year 8 students generally feel positive about learning HPE and teachers are generally confident teaching HPE.
Student Progress and Achievement • The Science and HPE results are consistent with those in the He Whakaaro | Education
Insights report on ‘Student Progress and Achievement’. This shows overall progress is between Years 4 and 8 is too slow to meet the demands of Level 4 of the curriculum by the end of Year 8.
o In each learning area except English:Reading, there is a drop in the proportion of students achieving at the expected curriculum level between Year 4 and Year 8.
o For example, in Mathematics and Statistics, 81% achieved at the expected curriculum level in Year 4, but for Year 8 the proportion dropped to 41%.
o Science achievement at Year 8 continues to be particularly low, with only 20% of students achieving at or above the expected curriculum level, compared with 94% at Year 4.
• International studies show that New Zealand students in this upper primary age group are less likely to have teachers who have training in specialised subjects like maths and science.
• We are encouraging principals and school leaders to place a stronger focus on progress and achievement across the entire curriculum. This includes strengthening their local curriculum in line with the aspirations envisaged in The NZ Curriculum.
• These NMSSA results are being communicated to schools through a variety of channels – including leaflets in the Education Gazette in early 2019.
• The Ministry is also working to share the specific insights gained NMSSA studies with schools. This will help schools to clarify how students progress in their learning between Years 4 and 8, across curriculum learning areas.
• This resource will also provide insights into how to develop rich tasks to support schools in the design of their local curriculum. Examples of student responses to tasks will also show teachers the type of learning that should be exhibited. We expect this resource for Science and HPE to be available later in term 1, 2019.
• The Ministry’s Curriculum, Progress and Achievement programme is working to ensure schools are supporting all children to experience rich opportunities to learn across the curriculum – moving beyond a focus on reading, writing and maths.
• The Ministry has recently refined and made available to Kāhui Ako, a toolkit to assist in local curriculum design (soon to be renamed The Local Curriculum Design Tool). Work is under way to enable individual schools and kura to access the toolkit as well.

6
• The Government’s Education Work Programme and Kōrero Mātauranga or Education Conversation has invited all New Zealanders – students, whānau, teachers, employers, and parents – to contribute their views on how to build an even better education system.
• The Tomorrow’s Schools Review is also looking at how the education system can ensure it meets the needs and aspirations of all learners. The Review is focussing on equity and excellence across the education system.
Questions and answers What changes have there been in Student Progress and Achievement in the five years between 2012 and 2017? The achievement gap between students in low SES communities and those in relatively advantaged communities has not narrowed over time. This means that, on average, low SES students are still about two and a half years behind their peers at Year 4 and the gap remains at Year 8. These reports show progress continues to be too slow between Year 4 and Year 8. The rates of progress across genders and socio-economic status levels are similar to five years ago. Better progress is being made, however, in some learning areas than others. For example, almost the same proportion of Year 4 and Year 8 students are at the expected level in English:Reading – 58% and 59% respectively. For the system to be responsive we need robust information about student progress. We will be communicating these results widely so principals and school leaders have the information they require to adjust local curriculum and delivery as needed to improve student learning across all subject areas. Why are the results for science at year 8 level still so low five years on – just 20 percent achieving at or above the expected curriculum level, compared to 94 percent at year 4? Unlike the literacy and mathematics curricula, detailed specification of expectations and progression in terms of content are limited for science. Low achievement in Year 8 could be related to the need for teachers to have specialist science knowledge. Few teachers reported having a science major or advanced/additional science training or qualifications (less than 5% at Year 4 and less than 20% at Year 8). This may explain the higher scores (almost one year of progress difference) of Year 8 students at secondary schools compared to those at intermediate or full primary schools. It is important to note that nearly all secondary schools in the study were mid and high decile schools. Around 60% of teachers indicated that they had engaged in science-related professional learning and development (PLD) in the last five years, while about 20% reported never having been involved in science PLD. Teachers had mixed views regarding the quality of professional support they received for teaching science, with the largest group rating it as ‘fair’. Teachers from low decile schools were more likely to rate it as ‘very poor’ than those from mid and high decile schools, particularly at Year 4. Many teachers also indicated that they had never observed a colleague teach science (55% at Year 4 and 33% at Year 8). Science had also not been a school-wide focus in many schools, particularly at Year 4. Science teaching practices may also have an impact on student learning. An upcoming OECD working paper The science of teaching science: an exploration of science teaching practices, uses 2015 Programme for International Student Assessment (PISA) data, mainly from the perspective of the 15-year-old students’ experiences of teaching practices. The paper found that compared to other PISA countries, New Zealand has a high use of inquiry-based science teaching in low socio-economic

7
status (SES) schools and schools with poor disciplinary climates, where higher use is associated with lower science performance. It’s worth noting that the Year 8 NMSSA results for science are not consistent with the science outcomes we see for older students. Around 63% of school leavers attain science at NCEA Level 1 or above. The purpose of this periodic NMSSA monitoring is to draw out trends like these – so we can increase awareness among schools leaders and principals as to where there are improvements or declines in student progress and achievement in these primary years.
These results highlight the need to strengthen the design of local curriculum to ensure students experience rich learning that reflects the depth and breadth of the New Zealand Curriculum.
What is being done to improve the level of learning?
We’re helping teachers to upskill, and schools to strengthen their local curriculum design – to better reflect the aspirations of the national curriculum. Science is currently one of four national priorities for centrally-funded professional learning and development. These are areas where we want to see a lift in student outcomes. Using the inquiry process to identify a school/kura/CoL’s focus for centrally funded PLD will enable leaders and teachers to ‘get underneath’ their achievement data to find out what is contributing to the results they are seeing. In this way, schools, kura and CoLs will focus on changes and improvements that will lift outcomes in these priority areas.
The Ministry has recently refined and made available to Kāhui Ako, a toolkit to assist in local curriculum design (soon to be renamed The Local Curriculum Design Tool). Work is under way to enable individual schools and kura to access the toolkit as well.
The NMSSA results are being communicated to schools through a variety of channels – including leaflets in the Education Gazette. We encourage principals and school leaders to closely consider how they may be able to place more focus on learning in the subjects of science, health and PE. The Ministry is also working to share the specific insights gained from NMSSA studies with schools. This will help schools to clarify how students progress in their learning between years 4 and 8, across curriculum learning areas.
This resource will also provide insights into how to develop rich tasks to support schools in the design of their local curriculum. Examples of student responses to tasks will also show teachers the type of learning that should be exhibited. We expect this resource for Science and Health & PE to be available later in term 1 2019.
The Ministerial Advisory Group for the Curriculum, Progress and Achievement work programme is currently consulting on nine emerging ideas - which are designed to ensure every child experiences rich opportunities to learn and progress.
An Advisory Group has worked closely with a sector Reference Group to gather a range of different on-the-ground perspectives. Schools and kura are being encouraged, however, not to wait for the outcome of recommendations to the Minister – but to start the shift now.

8
Why are students not achieving so well in health and physical education compared to 2013?
The purpose of this periodic monitoring is to draw out trends like these – so we can increase awareness among schools leaders and principals as to where there are improvements or declines in student progress and achievement.
Principals rate the provision for learning in PE in their schools higher than for health, especially at Year 8.
Evidence suggests that many schools are relying on external providers to cover some parts of the HPE curriculum (such as sexuality education and well-being). Most schools reported using external providers to support or deliver up to 40% of their HPE programme.
Schools use a range of providers to assist in the delivery or design of their HPE programme, with principals of schools who took part in NMSSA identifying more than 100 different external providers for both health and PE. Over-reliance on external providers could mean that schools’ local curriculum design may not be providing sufficient opportunities to learn in some of these key areas.
What will be done to improve achievement in health and physical education?
The Government is already looking at ways to ensure students learn and are assessed on their progress and achievement across the full curricula. The Ministerial Advisory Group for the Curriculum, Progress and Achievement work programme is currently consulting on nine emerging ideas - which are designed to ensure every child experiences rich opportunities to learn and progress.
An Advisory Group has worked closely with a sector Reference Group to gather a range of different on-the-ground perspectives. Schools and kura are being encouraged, however, not to wait for the outcome of recommendations to the Minister – but to start the shift to focussing on progress and achievement across the full curricula.
The Ministry is developing a resource which will enable the sharing of specific insights gained from the National Monitoring Study for Student Achievement (NMSSA) with schools. This will help schools to clarify how students progress in their learning between Years 4 and 8, across curriculum learning areas.
This resource will also provide insights into how to develop rich tasks to support schools in the design of their local curriculum. Examples of student responses to tasks will also show teachers the type of learning that should be exhibited. We expect this resource for Science and HPE to be available later in term 1, 2019.
The Ministry has recently refined and made available to Kāhui Ako, a toolkit to assist in local curriculum design (soon to be renamed The Local Curriculum Design Tool). Work is under way to enable individual schools and kura to access the toolkit as well.
Reactive media statement Recent results in student progress and achievement at upper primary level are evidence of the need to strengthen how local curriculum is designed and delivered by schools. “We’re encouraging schools and principals to place a stronger focus on progress and achievement across the full range of subjects,” says Ellen MacGregor-Reid, the Ministry’s deputy director of Early Learning and Student Achievement.

9
“Additional tools are being made available to help schools design their local curriculum and delivery to more fully reflect the aspirations of the national curriculum.” Ms MacGregor-Reid says the NMSSA studies are designed to show where improvements need to be made in primary education, and individual subjects. “The latest NMSSA studies show that the percentage achieving as expected in science at Year 8 continues to be far too low, and it is disappointing to see a dip in achievement in health and PE at that Year 8 level.” “We urge schools to use the Local Curriculum Design Tool to strengthen and broaden the learning they deliver to students. We’re also sharing specific insights gained from the studies, including examples of the type of learning that should be exhibited. “Schools should not wait for the outcome of the Government’s Curriculum, Progress and Achievement work programme to make this shift.” The Ministerial Advisory Group for the programme has recently consulted on nine Emerging Ideas, designed to ensure every child experiences rich opportunities to learn and progress. Ms MacGregor-Reid says work on a long-term Education Workforce Strategy is also underway in partnership with representatives across the sector, to plan for the right roles and the right mix of capabilities for the delivery of both Māori medium and English medium education in the future.
“This is pioneering work in which we are taking a ‘clean slate’ to planning for changes in the way we provide education, and potentially a very different workforce in the medium term and up to the year 2032.”


