Embed Size (px)
Citation preview
Ž .Global and Planetary Change 29 2001 135–147www.elsevier.comrlocatergloplacha
Probable reasons for enhanced cyclogenesis in the Bay of Bengalduring July–August of ENSO years
O.P. Singh), Tariq Masood Ali Khan, Md. Sazedur RahmanSAARC Meteorological Research Centre, 7th Floor, Abhawa Bhaban, Agargaon, Dhaka, Bangladesh
Accepted 5 October 2000
Abstract
This work presents the results of a study made to identify the probable causes of the higher frequency of monsoondepressions over the northern and adjoining central Bay of Bengal during July–August of ENSO years. For this purpose,
Ž . Ž .0.58 grid point satellite-derived NOAA–AVHRR sea surface temperature SST data and Multivariate ENSO Index MEIdata for the period 1985–1998 have been used. SST distributions over various parts of Bay of Bengal have been obtained for
Ž . Ž .MEI )1 Warm ENSO phase and MEI -y1 Cold phase . The analysis has been carried out for the entire summermonsoon season with special emphasis on July–August, during which the majority of monsoon depressions occur. q 2001Published by Elsevier Science B.V.
Ž . Ž . Ž .Keywords: El NinorSouthern Oscillation ENSO ; monsoon depression; sea surface temperature SST ; multivariate ENSO Index MEI ;˜Ž .Southern Oscillation Index SOI ; Summer monsoon; Bay of Bengal; La Nina; Cyclonic vorticity˜
1. Introduction
Monsoon depressions are important synoptic sys-tems of the summer monsoon season lasting fromJune to September of each year. These systemsdevelop at the eastern end of the monsoon troughlocated over extreme north of Bengal known as theHead Bay of Bengal, and generally move northwest-wards along the trough. The significant part of mon-soon rainfall over the eastern regions of India andBangladesh is associated with these systems. On anaverage, four to six depressions form over the Bay of
) Corresponding author. Tel.: q880-2-9124508; fax: q880-2-8111670.
Ž .E-mail addresses: [email protected] O.P. Singh ,Ž [email protected], [email protected] T.M. Ali Khan .
Bengal every year during the summer monsoon sea-son, their frequency being highest during August.
Monsoon systems exhibit large inter-annual varia-Ž .tions Shukla, 1987; Chang and Krishnamurti, 1987 .
Ž .As El NinorSouthern Oscillation ENSO is known˜Žto cause worldwide weather anomalies Chan, 1985;
.Gray and Sheaffer, 1991; Rao, 1997 , it is expectedthat some components of inter-annual variations ofAsian summer monsoon have their linkages with the
Ž .ENSO Singh and Ali Khan, 1999 . The Bay ofBengal seems to respond to ENSO epochs actively.There seems to be an appreciable increase in thefrequency of monsoon depressions during July–August of ENSO years. For instance, during thestrongest ENSO event of 1982, six monsoon depres-sions formed over the Bay of Bengal in July–Augustagainst the normal frequency of about three. Simi-larly, during the recent ENSO of 1997, four depres-sions formed over the Bay whereas no depression
0921-8181r01r$ - see front matter q 2001 Published by Elsevier Science B.V.Ž .PII: S0921-8181 00 00090-4
( )O.P. Singh et al.rGlobal and Planetary Change 29 2001 135–147136
formed during the La Nina event of 1998 in these 2˜months. This gives some indication of the type ofrelationship between the ENSO and monsoon de-pression frequency. However, there is a need toinvestigate this relationship along with the probablereasons quantitatively.
2. Data
The frequencies of monsoon depressions formingin the Bay of Bengal have been obtained from thestorm atlas published by the India Meteorological
Ž .Department I.M.D. Atlas, 1979 . The sources ofdata pertaining to the Southern Oscillation IndexŽ . Ž . Ž .SOI , El Nino warm and La Nina cold episodes˜ ˜for the period 1882–1998 are: Climate PredictionCenter, Washington, DC, USA and Bureau of Mete-orology, Australia. MEI data have been obtainedfrom NOAA–CIRES Diagnostic Center, Universityof Colorado, Boulder, CO, USA. The NOAA–AVHRR SST data have been obtained from NASAPhysical Oceanography Distributed Active ArchiveCenter at the Jet Propulsion Laboratory, California,USA.
3. Results and discussion
( )3.1. Correlation coefficients CCs between SOI andmonsoon depression frequency in the Bay Bengal
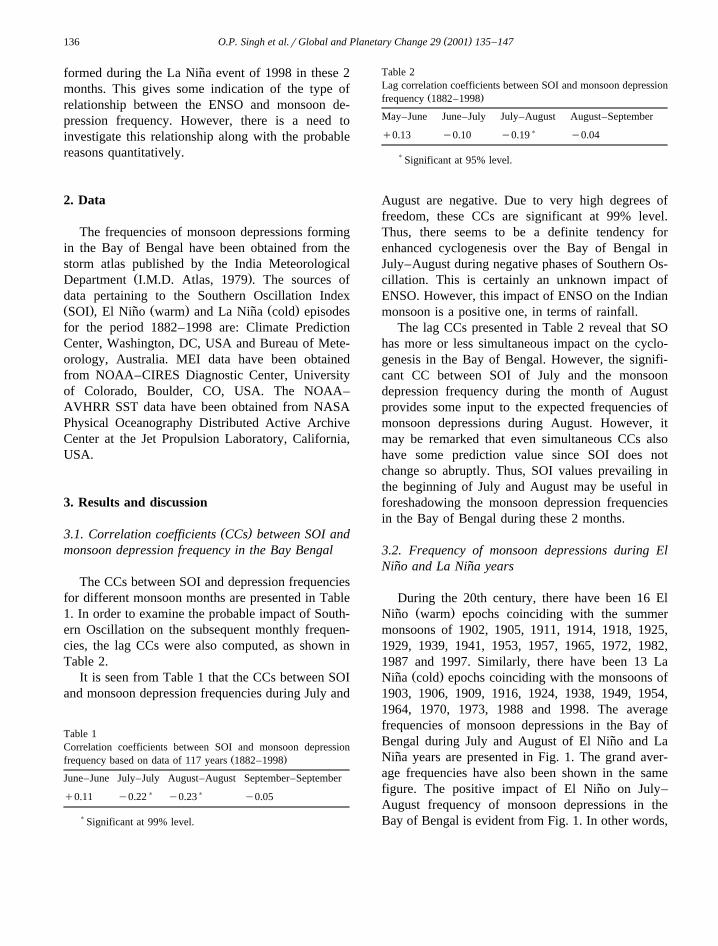
The CCs between SOI and depression frequenciesfor different monsoon months are presented in Table1. In order to examine the probable impact of South-ern Oscillation on the subsequent monthly frequen-cies, the lag CCs were also computed, as shown inTable 2.
It is seen from Table 1 that the CCs between SOIand monsoon depression frequencies during July and
Table 1Correlation coefficients between SOI and monsoon depression
Ž .frequency based on data of 117 years 1882–1998
June–June July–July August–August September–September) )q0.11 y0.22 y0.23 y0.05
)Significant at 99% level.
Table 2Lag correlation coefficients between SOI and monsoon depression
Ž .frequency 1882–1998
May–June June–July July–August August–September)q0.13 y0.10 y0.19 y0.04
)Significant at 95% level.
August are negative. Due to very high degrees offreedom, these CCs are significant at 99% level.Thus, there seems to be a definite tendency forenhanced cyclogenesis over the Bay of Bengal inJuly–August during negative phases of Southern Os-cillation. This is certainly an unknown impact ofENSO. However, this impact of ENSO on the Indianmonsoon is a positive one, in terms of rainfall.
The lag CCs presented in Table 2 reveal that SOhas more or less simultaneous impact on the cyclo-genesis in the Bay of Bengal. However, the signifi-cant CC between SOI of July and the monsoondepression frequency during the month of Augustprovides some input to the expected frequencies ofmonsoon depressions during August. However, itmay be remarked that even simultaneous CCs alsohave some prediction value since SOI does notchange so abruptly. Thus, SOI values prevailing inthe beginning of July and August may be useful inforeshadowing the monsoon depression frequenciesin the Bay of Bengal during these 2 months.
3.2. Frequency of monsoon depressions during ElNino and La Nina years˜ ˜
During the 20th century, there have been 16 ElŽ .Nino warm epochs coinciding with the summer˜
monsoons of 1902, 1905, 1911, 1914, 1918, 1925,1929, 1939, 1941, 1953, 1957, 1965, 1972, 1982,1987 and 1997. Similarly, there have been 13 La
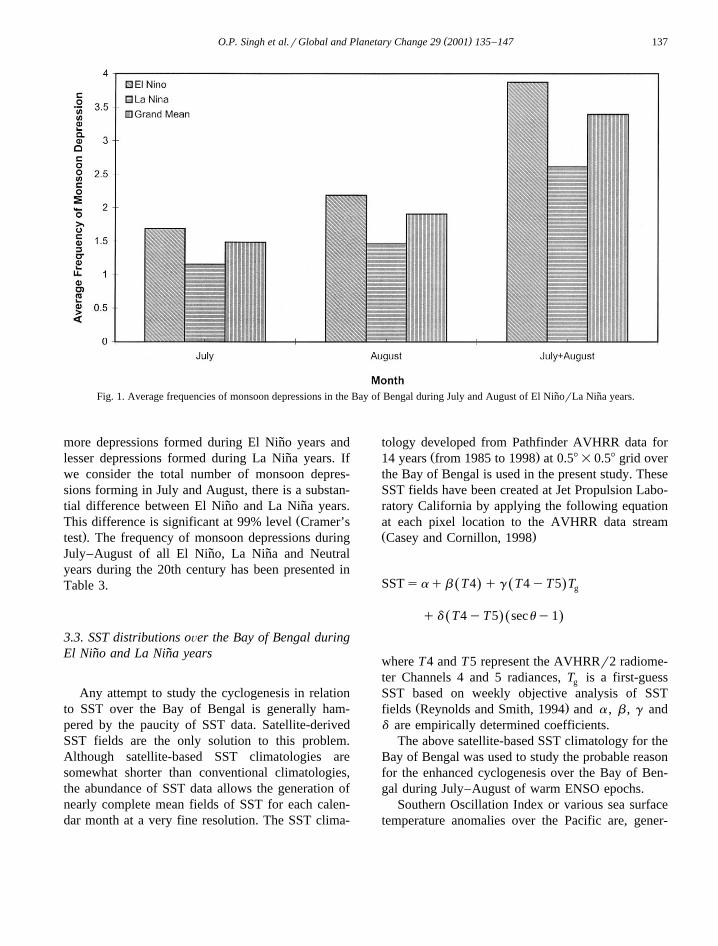
Ž .Nina cold epochs coinciding with the monsoons of˜1903, 1906, 1909, 1916, 1924, 1938, 1949, 1954,1964, 1970, 1973, 1988 and 1998. The averagefrequencies of monsoon depressions in the Bay ofBengal during July and August of El Nino and La˜Nina years are presented in Fig. 1. The grand aver-˜age frequencies have also been shown in the samefigure. The positive impact of El Nino on July–˜August frequency of monsoon depressions in theBay of Bengal is evident from Fig. 1. In other words,
( )O.P. Singh et al.rGlobal and Planetary Change 29 2001 135–147 137
Fig. 1. Average frequencies of monsoon depressions in the Bay of Bengal during July and August of El NinorLa Nina years.˜ ˜
more depressions formed during El Nino years and˜lesser depressions formed during La Nina years. If˜we consider the total number of monsoon depres-sions forming in July and August, there is a substan-tial difference between El Nino and La Nina years.˜ ˜
ŽThis difference is significant at 99% level Cramer’s.test . The frequency of monsoon depressions during
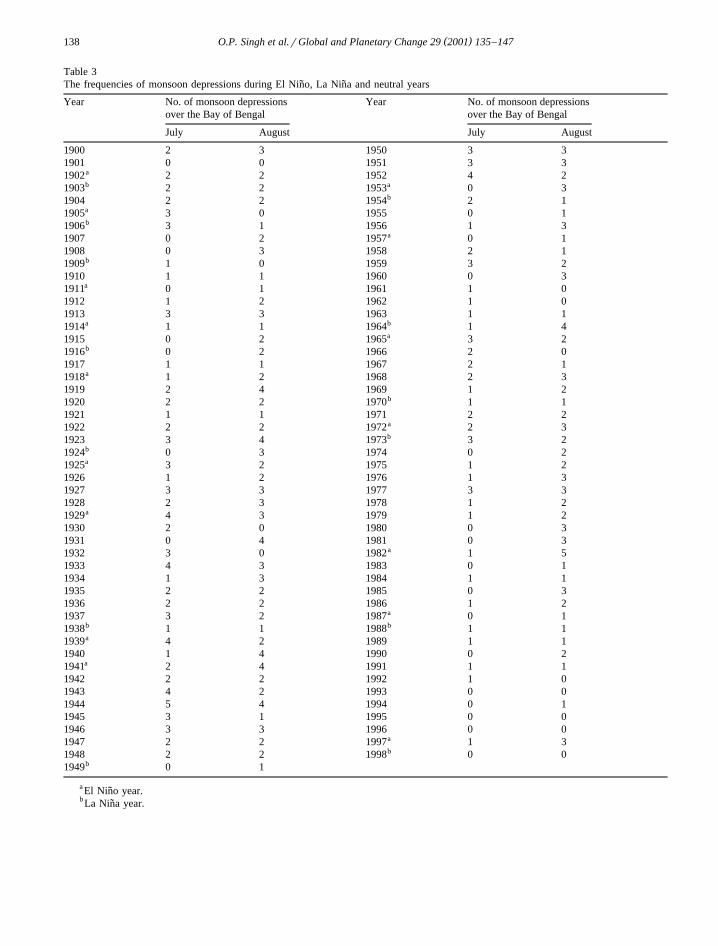
July–August of all El Nino, La Nina and Neutral˜ ˜years during the 20th century has been presented inTable 3.
3.3. SST distributions oÕer the Bay of Bengal duringEl Nino and La Nina years˜ ˜
Any attempt to study the cyclogenesis in relationto SST over the Bay of Bengal is generally ham-pered by the paucity of SST data. Satellite-derivedSST fields are the only solution to this problem.Although satellite-based SST climatologies aresomewhat shorter than conventional climatologies,the abundance of SST data allows the generation ofnearly complete mean fields of SST for each calen-dar month at a very fine resolution. The SST clima-
tology developed from Pathfinder AVHRR data forŽ .14 years from 1985 to 1998 at 0.58=0.58 grid over
the Bay of Bengal is used in the present study. TheseSST fields have been created at Jet Propulsion Labo-ratory California by applying the following equationat each pixel location to the AVHRR data streamŽ .Casey and Cornillon, 1998
SSTsaqb T4 qg T4yT5 TŽ . Ž . g
qd T4yT5 secuy1Ž . Ž .
where T4 and T5 represent the AVHRRr2 radiome-ter Channels 4 and 5 radiances, T is a first-guessg
SST based on weekly objective analysis of SSTŽ .fields Reynolds and Smith, 1994 and a , b , g and
d are empirically determined coefficients.The above satellite-based SST climatology for the
Bay of Bengal was used to study the probable reasonfor the enhanced cyclogenesis over the Bay of Ben-gal during July–August of warm ENSO epochs.
Southern Oscillation Index or various sea surfacetemperature anomalies over the Pacific are, gener-
( )O.P. Singh et al.rGlobal and Planetary Change 29 2001 135–147138
Table 3The frequencies of monsoon depressions during El Nino, La Nina and neutral years˜ ˜Year No. of monsoon depressions Year No. of monsoon depressions
over the Bay of Bengal over the Bay of Bengal
July August July August
1900 2 3 1950 3 31901 0 0 1951 3 3
a1902 2 2 1952 4 2b a1903 2 2 1953 0 3
b1904 2 2 1954 2 1a1905 3 0 1955 0 1b1906 3 1 1956 1 3
a1907 0 2 1957 0 11908 0 3 1958 2 1
b1909 1 0 1959 3 21910 1 1 1960 0 3
a1911 0 1 1961 1 01912 1 2 1962 1 01913 3 3 1963 1 1
a b1914 1 1 1964 1 4a1915 0 2 1965 3 2
b1916 0 2 1966 2 01917 1 1 1967 2 1
a1918 1 2 1968 2 31919 2 4 1969 1 2
b1920 2 2 1970 1 11921 1 1 1971 2 2
a1922 2 2 1972 2 3b1923 3 4 1973 3 2
b1924 0 3 1974 0 2a1925 3 2 1975 1 2
1926 1 2 1976 1 31927 3 3 1977 3 31928 2 3 1978 1 2
a1929 4 3 1979 1 21930 2 0 1980 0 31931 0 4 1981 0 3
a1932 3 0 1982 1 51933 4 3 1983 0 11934 1 3 1984 1 11935 2 2 1985 0 31936 2 2 1986 1 2
a1937 3 2 1987 0 1b b1938 1 1 1988 1 1a1939 4 2 1989 1 1
1940 1 4 1990 0 2a1941 2 4 1991 1 1
1942 2 2 1992 1 01943 4 2 1993 0 01944 5 4 1994 0 11945 3 1 1995 0 01946 3 3 1996 0 01947 2 2 1997a 1 3
b1948 2 2 1998 0 0b1949 0 1
a El Nino year.˜b La Nina year.˜
( )O.P. Singh et al.rGlobal and Planetary Change 29 2001 135–147 139
ally, taken as measure of ENSO while linking differ-ent weather anomalies to ENSO. It is felt that theseindices may be more suitable for the weather anoma-lies over the Pacific Rim region including Australia.For the Indian Ocean region, an index that integratescomplete ENSO information would be more appro-
Ž .priate. Multivariate ENSO Index MEI is one suchindex. The MEI is calculated as the first Principal
Ž .Component PC of six variables over the tropicalPacific, viz. sea surface temperature, sea level pres-sure, Zonal and meridional components of the sur-face wind, surface air temperature and total cloudi-
Ž .ness fraction of the sky Wolter and Timlin, 1993 .Positive values of MEI indicate warm ENSO phaseŽ . ŽEl Nino and negative ones represent cold phase La˜
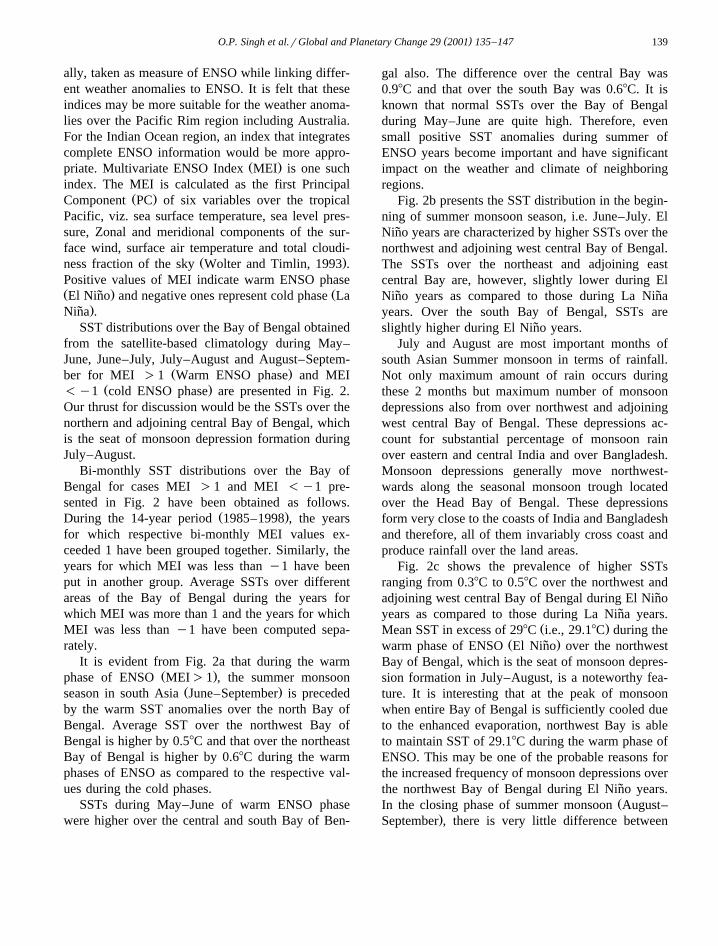
.Nina .˜SST distributions over the Bay of Bengal obtained
from the satellite-based climatology during May–June, June–July, July–August and August–Septem-
Ž .ber for MEI )1 Warm ENSO phase and MEIŽ .-y1 cold ENSO phase are presented in Fig. 2.
Our thrust for discussion would be the SSTs over thenorthern and adjoining central Bay of Bengal, whichis the seat of monsoon depression formation duringJuly–August.
Bi-monthly SST distributions over the Bay ofBengal for cases MEI )1 and MEI -y1 pre-sented in Fig. 2 have been obtained as follows.
Ž .During the 14-year period 1985–1998 , the yearsfor which respective bi-monthly MEI values ex-ceeded 1 have been grouped together. Similarly, theyears for which MEI was less than y1 have beenput in another group. Average SSTs over differentareas of the Bay of Bengal during the years forwhich MEI was more than 1 and the years for whichMEI was less than y1 have been computed sepa-rately.
It is evident from Fig. 2a that during the warmŽ .phase of ENSO MEI)1 , the summer monsoon
Ž .season in south Asia June–September is precededby the warm SST anomalies over the north Bay ofBengal. Average SST over the northwest Bay ofBengal is higher by 0.58C and that over the northeastBay of Bengal is higher by 0.68C during the warmphases of ENSO as compared to the respective val-ues during the cold phases.
SSTs during May–June of warm ENSO phasewere higher over the central and south Bay of Ben-
gal also. The difference over the central Bay was0.98C and that over the south Bay was 0.68C. It isknown that normal SSTs over the Bay of Bengalduring May–June are quite high. Therefore, evensmall positive SST anomalies during summer ofENSO years become important and have significantimpact on the weather and climate of neighboringregions.
Fig. 2b presents the SST distribution in the begin-ning of summer monsoon season, i.e. June–July. ElNino years are characterized by higher SSTs over the˜northwest and adjoining west central Bay of Bengal.The SSTs over the northeast and adjoining eastcentral Bay are, however, slightly lower during ElNino years as compared to those during La Nina˜ ˜years. Over the south Bay of Bengal, SSTs areslightly higher during El Nino years.˜
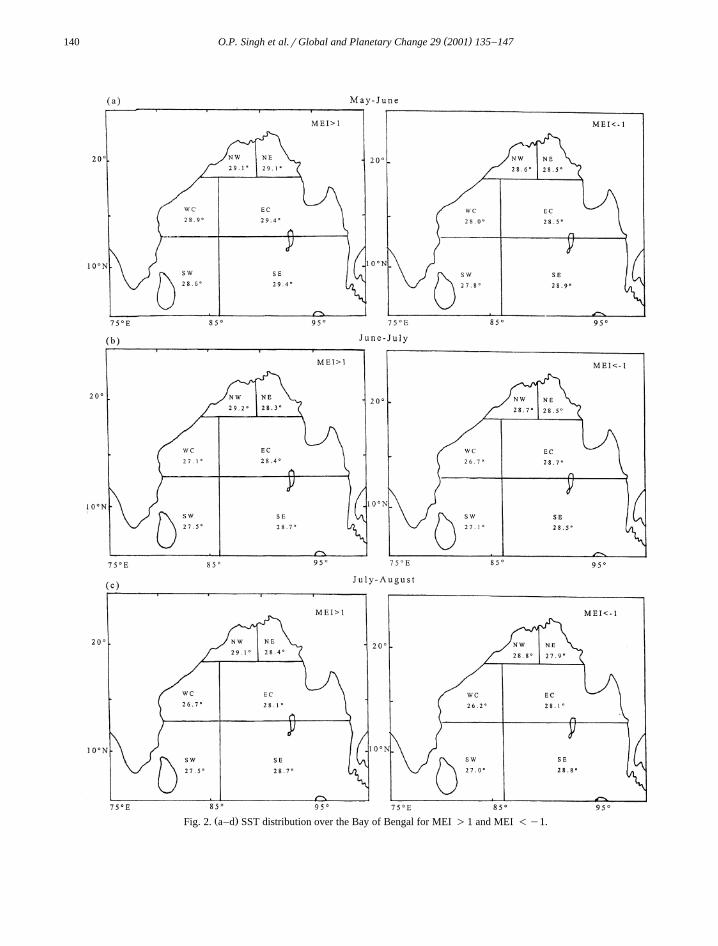
July and August are most important months ofsouth Asian Summer monsoon in terms of rainfall.Not only maximum amount of rain occurs duringthese 2 months but maximum number of monsoondepressions also from over northwest and adjoiningwest central Bay of Bengal. These depressions ac-count for substantial percentage of monsoon rainover eastern and central India and over Bangladesh.Monsoon depressions generally move northwest-wards along the seasonal monsoon trough locatedover the Head Bay of Bengal. These depressionsform very close to the coasts of India and Bangladeshand therefore, all of them invariably cross coast andproduce rainfall over the land areas.
Fig. 2c shows the prevalence of higher SSTsranging from 0.38C to 0.58C over the northwest andadjoining west central Bay of Bengal during El Nino˜years as compared to those during La Nina years.˜
Ž .Mean SST in excess of 298C i.e., 29.18C during theŽ .warm phase of ENSO El Nino over the northwest˜
Bay of Bengal, which is the seat of monsoon depres-sion formation in July–August, is a noteworthy fea-ture. It is interesting that at the peak of monsoonwhen entire Bay of Bengal is sufficiently cooled dueto the enhanced evaporation, northwest Bay is ableto maintain SST of 29.18C during the warm phase ofENSO. This may be one of the probable reasons forthe increased frequency of monsoon depressions overthe northwest Bay of Bengal during El Nino years.˜
ŽIn the closing phase of summer monsoon August–.September , there is very little difference between
( )O.P. Singh et al.rGlobal and Planetary Change 29 2001 135–147140
Ž .Fig. 2. a–d SST distribution over the Bay of Bengal for MEI )1 and MEI -y1.
( )O.P. Singh et al.rGlobal and Planetary Change 29 2001 135–147 141
Ž .Fig. 2 continued .
the SSTs over the north Bay of Bengal during ElNino and La Nina years.˜ ˜
The foregoing discussions reveal that there isindeed a tendency for the enhanced formation ofmonsoon depressions in the Bay of Bengal duringJuly–August of warm phases of ENSO. SST distri-butions obtained from satellite-based climatologyshow that the areas of northwest and adjoining westcentral Bay of Bengal are warmer in July–Augustduring the warm phases of ENSO. This may be acontributing factor for the enhanced cyclogenesis.But as we know, in addition to SST, large-scalevertical motion field is also a dominant factor in theformation of tropical systems like monsoon depres-sions, it would not be correct to draw a one-to-onecorrespondence between the SST and the frequencyof monsoon depressions over the Bay of Bengal. Ifthe large-scale negative vertical motion field duringwarm phase of ENSO extends up to the north Bay ofBengal then probably, the positive SSTs alone maynot be sufficient to produce more number of depres-sions over that area. It is probably due to this reasonthat we do not find very high correlation coefficientsbetween SOI and monsoon depression frequency.But the results of present study certainly establishthat there is a tendency for enhanced formation ofmonsoon depressions over the Bay of Bengal duringJuly–August of warm ENSO phase and that the
SSTs are higher over the sea areas of monsoondepression formation.
3.4. Northward shift of low leÕel cyclonic Õorticityzone and the axis of the monsoon trough
Having discussed the monsoon depression fre-quency in relation to SST distribution over the Bayof Bengal, we now examine some circulation fea-tures like the axis of the monsoon trough and thelocation of the low level cyclonic vorticity zone overthe north Bay of Bengal during the El Nino and the˜La Nina years. Monsoon trough is one of the impor-˜
Ž .tant components of the Asian monsoon Rao, 1976 .Its eastern end is located over the Head Bay ofBengal, which is the seat of cyclonic vorticity in thelower troposphere with deep moist convection. Due
Ž .to the availability of low level positive cyclonicvorticity and high sea surface temperature, this is theregion where monsoon depressions form and movewestward along the monsoon trough.
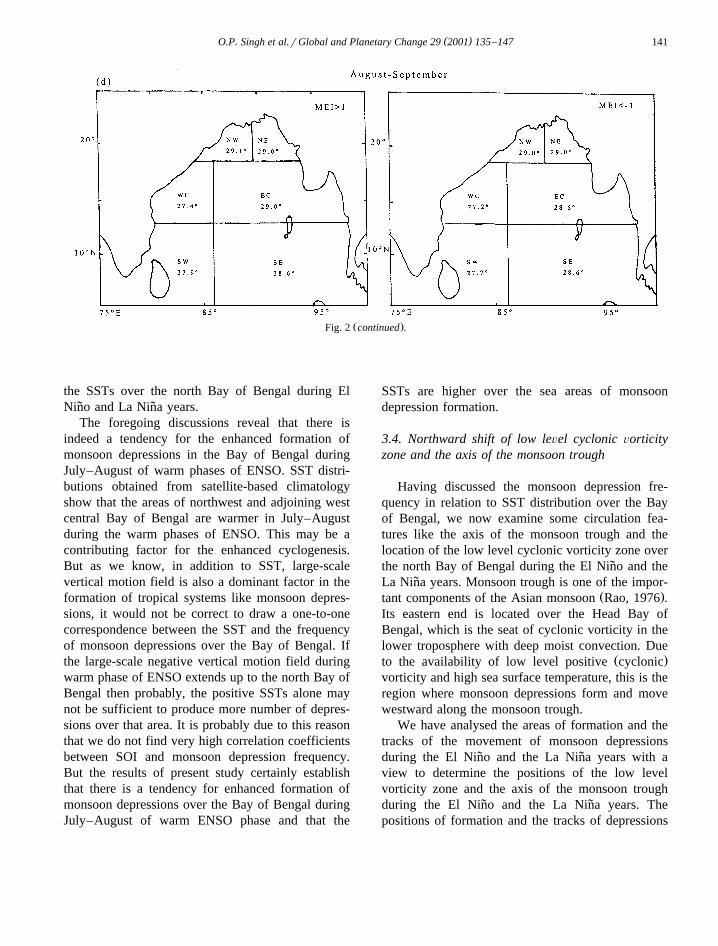
We have analysed the areas of formation and thetracks of the movement of monsoon depressionsduring the El Nino and the La Nina years with a˜ ˜view to determine the positions of the low levelvorticity zone and the axis of the monsoon troughduring the El Nino and the La Nina years. The˜ ˜positions of formation and the tracks of depressions
( )O.P. Singh et al.rGlobal and Planetary Change 29 2001 135–147142
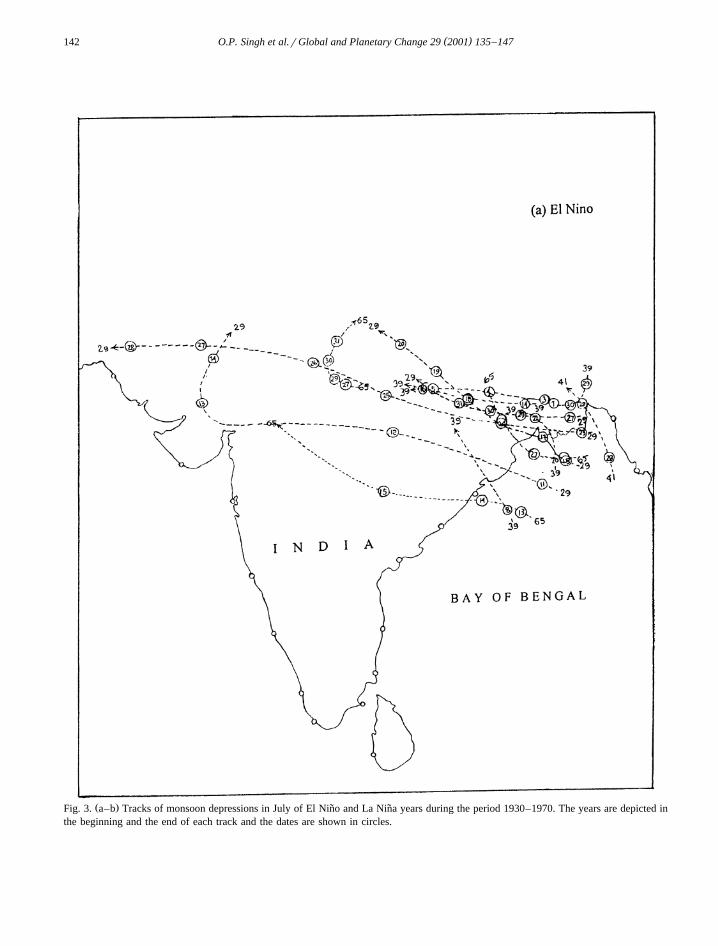
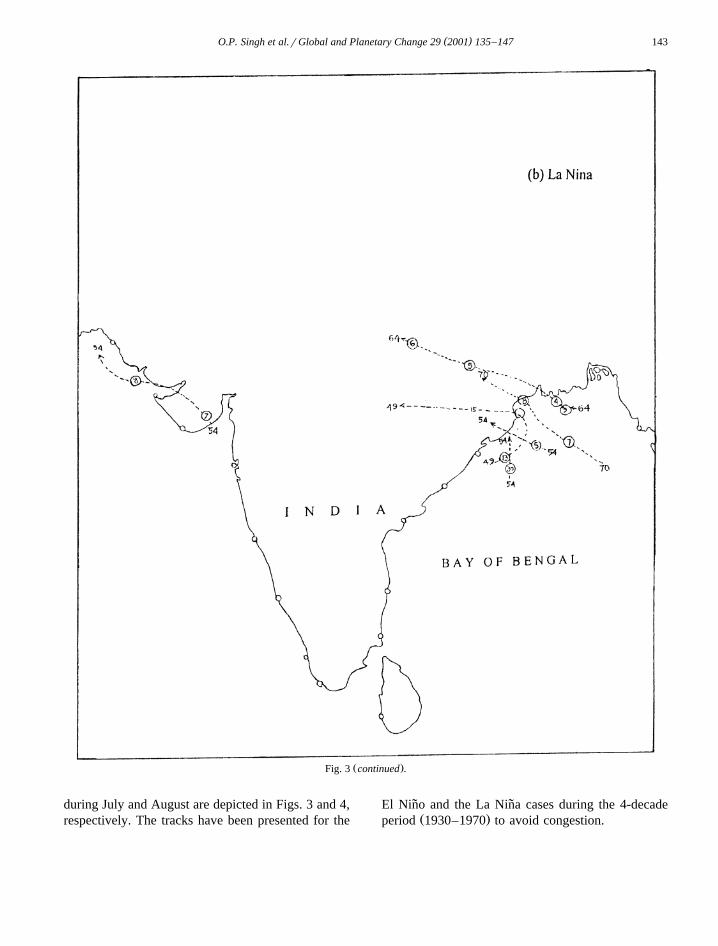
Ž .Fig. 3. a–b Tracks of monsoon depressions in July of El Nino and La Nina years during the period 1930–1970. The years are depicted in˜ ˜the beginning and the end of each track and the dates are shown in circles.
( )O.P. Singh et al.rGlobal and Planetary Change 29 2001 135–147 143
Ž .Fig. 3 continued .
during July and August are depicted in Figs. 3 and 4,respectively. The tracks have been presented for the
El Nino and the La Nina cases during the 4-decade˜ ˜Ž .period 1930–1970 to avoid congestion.
( )O.P. Singh et al.rGlobal and Planetary Change 29 2001 135–147144
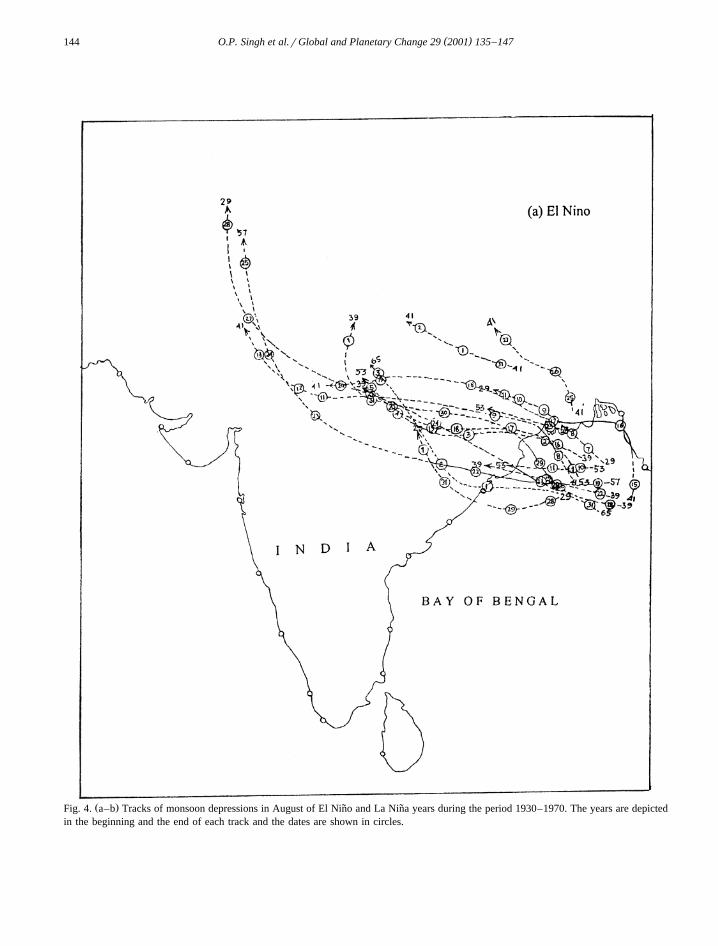
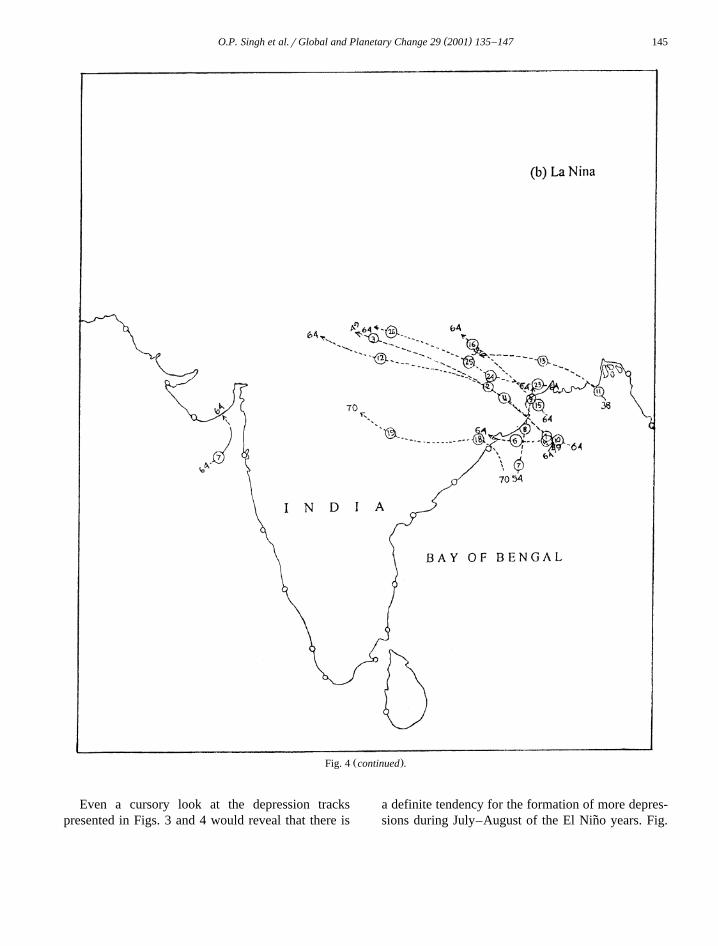
Ž .Fig. 4. a–b Tracks of monsoon depressions in August of El Nino and La Nina years during the period 1930–1970. The years are depicted˜ ˜in the beginning and the end of each track and the dates are shown in circles.
( )O.P. Singh et al.rGlobal and Planetary Change 29 2001 135–147 145
Ž .Fig. 4 continued .
Even a cursory look at the depression trackspresented in Figs. 3 and 4 would reveal that there is
a definite tendency for the formation of more depres-sions during July–August of the El Nino years. Fig.˜
( )O.P. Singh et al.rGlobal and Planetary Change 29 2001 135–147146
3 shows that the mean position of the formation ofthe depressions is shifted northward during July ofthe El Nino years as compared to that during the˜same month of the La Nina years. More depressions˜have formed over the extreme north Bay of Bengalduring the El Nino years though a few of them have˜formed over the central Bay of Bengal also. But asthe axis of monsoon trough is highly dynamic andfluctuates from central Bay of Bengal to the foothillsof Himalayas within a particular southwest monsoonseason, on inter-annual scale the variability of itsmean position only is relevant. The mean positionsof monsoon trough axis and the area of formation ofthe depressions are quite north during the El Nino˜years as compared to the positions during the LaNina years. Another significant feature during El˜Nino years is the longer tracks of the depressions.˜Thus, the depressions during the El Nino years have˜longer life span and more rainfall potential as com-pared to those forming during the La Nina years.˜Fig. 4 reveals more or less similar features duringAugust also.
As the SST increases northward rapidly over theBay of Bengal during the southwest monsoon, thenorthward shift of low level positive vorticity zoneand the monsoon trough axis provides warmer seawaters in the area of formation of the monsoondepressions during the El Nino years. Two basic˜ingredients needed for the depression formation are;higher SST and positive low level vorticity. Duringthe El Nino monsoons, the first condition becomes˜more favourable for the depression formation due tothe prevalence of higher SSTs over the Bay ofBengal equipped with the northward shift of the areaof formation of the depressions. Another factor thatis likely to contribute to the enhanced cyclogenesisduring the El Nino years is the intensity of the˜monsoon trough which gets strengthened when itsaxis moves northward due to the orography of theHimalayas. Thus, the increased SST and the intensityof the monsoon trough provide stronger vertical fieldsfor the genesis of the monsoon depressions duringthe El Nino years.˜
4. Concluding remarks
In conclusion, it may be stated that there exists atendency for the increased frequency of the monsoon
depressions in the Bay of Bengal during July–Augustof warm ENSO phase. Satellite-based climatologyfor the period 1985–1998 revealed the prevalence ofhigher SSTs over the northwest and adjoining westcentral Bay of Bengal during the monsoons of warmENSO epochs. The analysis of the tracks of themonsoon depressions in the Bay of Bengal duringthe El Nino and the La Nina years showed that there˜ ˜is a northward shift in the area of formation and thetrack of movement of the monsoon depressions dur-ing the El Nino years. Thus, the low level cyclonic˜vorticity zone over the north Bay of Bengal and theaxis of the monsoon trough shift northward duringthe El Nino monsoons. As the SST gradient over the˜Bay of Bengal is from south to north during thesouthwest monsoon season, the northward shift of
Žthe low level cyclonic vorticity zone which is the.zone of vertical velocity facilitates the cyclogenesis
during the El Nino years due to increased SST and˜the intensity of low level cyclonic vorticity zone inthe Bay of Bengal.
Acknowledgements
This research work has been carried out at SAARCŽ .Meteorological Research Centre SMRC , Dhaka,
Bangladesh. Authors are thankful to Dr. Peter Bateand Dr. Neville Nicholls from Bureau of Meteorol-ogy, Australia, Climate Prediction Center, Washing-ton, DC, USA and NOAArCIRES climate Diagnos-tic Center, University of Colorado, Boulder, USA forproviding the historical SOI and MEI data. NASAPhysical Oceanography Distributed Active ArchiveCenter at the Jet Propulsion Laboratory, California,USA provided the satellite-derived SST data. Thanksare also due to Mr. Salah Uddin, Miss FahmidaAktar and Mr. Majajul Alam Sarker of SMRC forassistance in the preparation of the manuscript.
References
Casey, K.S., Cornillon, P., 1998. A comparison of satellite and insitu-based sea surface temperature climatologies. J. Clim. 12,1848–1863.
Chan, J.C.L., 1985. Tropical cyclone activity in the northwestPacific in relation to El NinorSouthern Oscillation Phe-˜nomenon. Mon. Weather Rev. 113, 599–606.
( )O.P. Singh et al.rGlobal and Planetary Change 29 2001 135–147 147
Chang, C.P., Krishnamurti, T.N., 1987. Monsoon Meteorology.Oxford University Press, Oxford, 544 pp.
Gray, W.M., Sheaffer, J.D., 1991. El Nino and QBO influences on˜tropical cyclone activity. In: Glantz, M.M., Katz, R.W.,
Ž .Nichols, N. Eds. , Teleconnections Linking WorldwideAnomalies. Cambridge Univ. Press, pp. 257–284.
I.M.D. Atlas, 1979. Tracks of storms and depressions in the Bayof Bengal and the Arabian Sea, India Meteorological Depart-ment, New Delhi, India, 186 pp.
Rao, Y.P., 1976. Southwest monsoon, Meteorological Monograph,Synoptic Meteorology, No. 1r1976, India Meteorological De-partment, 367 pp.
Rao, A.V.R.K., 1997. Tropical cyclone synoptic methods of fore-casting. Mausam 48, 239–256.
Reynolds, R., Smith, T., 1994. Improved global sea surfacetemperature analyses using optimum interpolation. J. Clim. 7,929–948.
Shukla, J., 1987. Interannual variability of monsoons. Monsoons.Wiley, New York, 632 pp.
Singh, O.P., Ali Khan, T.M., 1999. Changes in the frequencies ofcyclonic storms and depressions over the Bay of Bengal andthe Arabian Sea, SAARC Meteorological Research CentreReport No. 2, 121 pp.
Wolter, K., Timlin, S., 1993. Monitoring ENSO in COADS with aseasonally adjusted principal component index, Proc. of the17th Climate Diagnostics Workshop. Norman OK, NOAArNMGrCAC, NSSL, Oklahoma, Clim. Survey CIMMS and theSchool of Meteor, University of Oklahoma, pp. 52–57.


