Embed Size (px)
Citation preview
CHAPTER I
Introduction
It proved, really a complicated task to get a systematic and
standardized measurement of the satisfaction level of
students pertaining to the services and facilities provided
by any academic institution since its very beginning to up
till now. Although ample stocks of efforts have continually
been put in place by researchers and intelligential segments
of society aimed at to formulate and evolve a convincing
tool for reliably measuring the overall limits of
satisfaction of the students but this aspect still warrants
extreme attention to unearth its some unaddressed areas and
thereby inviting research based exploration to get reached
up to its main axis.
The investment for Educational motives is the most
profitable sector that returns the outcome manifold as it
also provides a bedrock for a holistic socio economic
betterment of society. Analysts and Researchers are of view
that only a coordinated and strongly synergized educational
system can play effective role to enhance the level of
holistic and cognitive performance of the students.
In this regard, the educational institutions also keep a
greater worth/pivotal role, if they are run through such a
management which is gifted with highest intellectual
capabilities & operational wisdom. Another main factor
required for effective Educational’ administration (that can
be ranked as key factor), is the Readiness or Willingness of
the management, those who are tasked for obtainment of the
educational goals by providing the quality services for
nurturing brilliance and talent amongst students/ new
generation, In order to come up with a progressive outlook
and convincing results in accordance to the public
expectations and aspiration of the students.
Although varied academic preferences and quality perception
about the educational environment should be the top most
priority of the higher authorities of the educational
institute (Palacio, Meneses and Perez 2002).
Study conducted into the matter revealed that the students
of higher academic level in higher educational institution
always found very keen in quality education and perfection
of soothing environment, in system at study place, to get
satisfied their self-esteem, to develop them with all the
pre-requisites /capabilities to become an effective icon in
educational sector.
According to Rowley(1996) the students affiliated with
institution that can perform delivery of better and quality
educational service for their students in line with the
aspiration and expectation of students (which the students
want for their strong academic and carrier accomplishment),
mostly come forward as a capable & good performers with a
background of high educational elegance. It is an admitted
fact that usually the students seek compassionate treatment,
polite response and assurance during their academic journey
process. They are always aspirant of such an environment
which facilitates to get them well equipped with extra
educational potency to compete the challenges of modern era.
Aforesaid in view, it is easily perceptible that the
administration and management of any higher educational
institution can manage to facilitate the students with
quality assurance and overall personality grooming so that
the students can take optimal results of it (LeBlanc ,
Nguyen 1997).
Williams (2002) in his survey conducted regarding
“satisfaction” provides a real image of service providing
institutions, which oftenly desired by the students of
universities and colleges about their mapped out schedules,
modes of services and programs because satisfaction levels
provide a complete and conspicuous look of facilities and
environment provided by the university to its students. In
backdrop of the satisfaction of students with their
educational experience, which is an important tool to
determine the quality of teaching & learning as well as the
institutional effectiveness? Moreover, satisfaction levels
of students are also a main corroborative factor in
portraying the quality of services and effectiveness of
these services as a guideline for the administrative
hierarchies of the universities. The fluctuating factor of
satisfaction has always been a reason of paying attention
for the administration to evaluate the level of standard and
quality of educational environment, which the students
deserve as their basic purpose. Rapid economic and
technological changes casting effects on educational
institutions and stressing them to modify their program,
structure as well as teaching and learning process according
to the needs for which the students are aspirants.
Mai (2010) in a conducted study, suggesting that the
“satisfaction” of students achieved through their
educational experience is an important tool to ascertain the
institutional effectiveness and quality of teaching and
services. The evaluations process helps the institutions to
reframe their action plan and strategy to evolve quality of
teaching and these evaluations are directly measured in way
towards the students’ satisfaction with overall university
experience.
In this regard the main factor of contentment rests with the
students for being the end users/beneficiaries of all such
facilities which are provided by the university.
It is easily perceptible that the students as beneficiaries
of university have a direct linkage of receiving services of
the university by paying suitable amount as charges of all
curricular & extracurricular combination of activities in
the university. This factor obliviously causing increase in
aspiration level of students, as it is an easy tool to
evaluate, whether the University as service providers
effectively addressing the needs of student or otherwise. If
students are not satisfied with the quality and quantity of
the facilities provided by the university then it would be
presumed failure of university in provision of quality
services delivery. Its noteworthy here that while evaluating
any program in terms of its services and facilities it
should have to consider following things in common 1.What to
measure? 2. Who to measure? 3. Where to measure? 4. Why to
measure? 5. What to measure? When to measure?
Keeping in view the broader contextual perspective &
thematic weightage I have selected this topic for research.
In line with my selected topic I have undertaken my
educational venture of measuring the satisfaction of the
students regarding services and facilities of programs of
Institute Of University of the Punjab .I have only selected
master degree programs of P.U.
Statement of the Problem.
A study to explore students' satisfaction level regarding
services and facilities provided by university of the
Punjab."
As regard to the Problem statement which carries three main
points to consider and by keeping the foregoing in view I
did following to accomplish my task
1) I checked Satisfaction level of the students by
considering them as the customers of the university.
2) I selected only master degree programs of P.U to
measure the satisfaction level of student.
3) I only considered the aspect of services and facilities
to measure the satisfaction level of the students.
Objectives of the study
The main intention of this Purpose oriented
study/measurement was to ascertain/ explore the fact whether
the students of P.U were satisfied with the existing level
of the quality and quantity of the services and facilities
provided by P.U to them or not and what they really want &
what level of gape was there between the desired &
prevailing level of service delivery.
1. To get an intensive assessment of the level of
satisfaction of students of P.U regarding services and
facilities provided by university of the Punjab.
2. To check the varied level of satisfaction of the
students of P.U regarding services and facilities
provided by university of the Punjab on grades basis.
3. To determine the variation of level of satisfaction of
the students of P.U regarding programs based services
and facilities provided by university of the Punjab.
4. To ascertain the variation of level of satisfaction of
the students of P.U regarding, semester wise services
and facilities provided by university of the Punjab.
5. To check the variation of level of satisfaction of the
students of P.U regarding services and facilities
provided by university of the Punjab among shifts.
Hypothesis
H°1 Students of P.U are not satisfied with the services and
facilities provided by the University of the Punjab
H°2 there is no significant difference in satisfaction of
the students of P.U regarding services and facilities
provided by the University of the Punjab among
different grades
H°3 there is no significant difference in the satisfaction
regarding services and facilities provided by the
University of the Punjab among different programs
H°4 There is no significant difference in satisfaction
regarding services and facilities provided by the
University of the Punjab among the different semesters
H°5 There is no significant difference in satisfaction
regarding services and facilities provided by the
University of the Punjab among different shifts
H°6 There is no significant difference in satisfaction
regarding services and facilities provided by the
University of the Punjab among different genders
Significance of study
Since 1952 P.U continually contributing through its purpose
oriented working to produce quality teachers& young leaders
equipped with the requisite skills in almost every field of
study, whoever its worth mentioning here that no deliberated
efforts have been ever made to measure the satisfaction of
students enrolled in master degree programs of P.U to
ascertain as whether they are (students) fulfilling their
objectives in a soothing and conducive learning environment
or not as tuitions fee and other charges are considerably
increasing in each following semester. Students often
complain about high charges and less service quality of
master degree programs of P.U. This study will help to
evaluate& determine that whether the service quality and the
facilities provided by master degree programs of P.U is
satisfactory or not. How much there is possible room for
further improvement & what evolutionary/revolutionary
holistic steps should be taken at gross root level to
address the aspirations of student and make them feeling a
soothing and conducive learning environment around them
during learning process.
Instrument
The instrument used for this study was only a structured
questionnaire which was given to the students to know their
opinions. A structured questionnaire was developed to
conduct a deliberated survey research. Liket scale was used
where rating were measured in terms of satisfaction and
dissatisfaction from 1-5. The questionnaire was devised by
regarding the interest level of all kind of learners to get
a broad spectrum feedback regarding the topic
Population
The population of this study was university of the Punjab
students. In these students, there were the students only
from the Master’s degree.
Sample
There are thirteen faculties in the University of the
Punjab. I conveniently selected three faculties at first
stage. The faculties which i selected ,was faculty of
Education, Faculty of Quality and tech managment, and
Faculty of gander studies. Further from these three
faculties Iselected four departments from each faculty.
From each department i collected data of forty pupils. In
these fourty pupils there were the pupils of first year,
second year as well as morning and evening.
Data collection
I personally visited the selected departments of university
of the Punjab and gave the questionnaires to the students of
selected degree programs. They filled those questionnaires
and got back data at the spot.
Data Analysis
A 5-point Likert scale was used in questionnaire and
responses were quantified as the below;
1 = Highly satisfied
2 = satisfied
3 = Neutral
4 = Dissatisfied
5 = Highly dissatisfied
Using SPSS 15.0, data were analyzed and tabulated.
Frequencies, Percentages, Mean, were calculated..
Limitations of study
Due to time and financial constrains I could not select all
institutes and faculties of university of the Punjab in my
research work.
Delimitations
There are many Faculties of university of the Punjab but my
study is delimited to three faculties of P.U. I took only
master degree programmes.
Due to certain reasons of inevitable nature i.e. time
constraint and scarcity of other resources; I could not
select all degree programmes of P.U. I had to select three
faculties of P.U and four departments of each faculty. These
degree programs have two shifts (Morning & evening).I could
not approach to each student due to some time constraints
that’s why I select only 40 students from each degree by
regarding the balanced participation of male & female
students’ folks.
Definition and description of terminologies
Satisfaction
Fulfillment of one’s wishes, expectations, or needs, or the
pleasure derived from this" Law the payment of a debt or
fulfillment of an obligation or claim in full and final
satisfaction of the claim what is felt to be owed or due to
one, especially in reparation of an injustice or wrong: the
work will come to a halt if the electricity and telephone
people don’t get satisfaction
Customer level of approval when comparing a product's
perceived performance with his or her expectations. Also
could refer to discharge, extinguishment, or retirement of
an obligation to the acceptance of the obligor, or
fulfillment of a claim. While satisfaction is sometimes
equated with performance, it implies compensation or
substitution whereas performance denotes doing what was
actually promised. See also accord and satisfaction.
(Thomas, Galambos, 2004)
Programme
A plan of action aimed at accomplishing a clear business
objective, with details on what work is to be done, by whom,
when, and what means or resources will be used. A series of
steps to be carried out for specific goals to be
accomplished.
(Benjamin, Hollings, 1995)
Evaluation
An appraisal of the value of something
Evaluation is the systematic investigation of the merit,
worth or significance of an object, hence assigning value to
a program’s efforts means addressing those three inter-
related domains.(Scriven, 1999).
Program Evaluation
Program Evaluation is the systematic application of
scientific methods to assess the design, implementation,
improvement or outcomes of a program (Rossi & Freeman,
1993).
Curriculum
All the learning which is planned and guided by the school,
whether it is carried on in groups or individually, inside
or outside the school. (John Kerr,2009).
Curriculum is a cultural reproduction in a structured way.
It is even more: It should also value independent thinking
in the context of the widest sense of social responsibility.
(Smith, Stanley & Shores, 2000).
CHAPTER II
Literature Review
Kotler,dumlao and erdman (2008) who defines satisfaction as
a person’s feeling of pleasure that result from comparing
product’s perceived performance to their expectation. It
means if the performance, stall value of any product matches
the expectation, the customer will obliviously get
satisfied. As per contextual meaning in terms of higher
education, the matter of satisfaction is what students do
expect to avail from their educational institution aimed at
making them eligible to become productive and successful
person in their practical span of lives.
Student Satisfaction
Kotler, Clarke(1987). Termed the Satisfaction, as a
deliberated outcome of any task or job that pleases one’s
esteem and aspiration. Satisfaction is a willful
accomplishment which results in one’s contentment and it
plays a major role in determining the validity and accuracy
of a system especially the educational system. It is the
study narrates that as higher the level of satisfaction the
higher will be the level of students’ grooming their skill
development, course knowledge and mentality.
Zeithaml(1988) Satisfaction is the sub sequential outcome of
an institution’s administrative as well as educational
system’s concurrent performance because the students will be
more satisfied and self directed for completing their
studies if the institution provides an enabling conducive
environment that may allows facilitates learning i.e. the
institution contains proper infrastructure for educational
utility backed with essential indicators of professional and
academic development. It is commonly felt view that the
students will be more stimulated, motivated, loyal and good
performers if their institution holds essential educational
facilities with teaching and training staff. The teachers’
indoors and out of class performance is a significant
feature for elaborating students’ impartiality, motivation
and satisfaction. The students’ rate their course
instructors’ performance and his approach of teaching as the
prime indicators in their educational development and
successful completion of their studies, because higher the
intellectual ability of the instructor the better will be
the students’ evaluation cycle.
(Edstrom, 2008) and consequently more will be the
reliability on the teaching staff .Teachers’ ability,
excellence, coordination and reasonability greatly influence
students’ class Journal of Management Research performance.
The students are greatly influenced by the educational
activities in their teacher or instructor coordinates for
them. It is stated that the teachers who teach with
punctuality, accuracy, reasonability with logical approach
in a student friendly manner are more popular. Because
students level of satisfaction increases by working with
those course instructors and lecturers who properly handle
the assignments, projects, exams and facilitate students’
logical reasoning and aptitude development.
The level and service of quality in the educational sector
particularly in the higher educational institutions is the
fundamental aspect of educational excellence. According to
(Alridge , Rowley, 2001) as far as the students perceived
regarding the institution’s quality and standardized
learning environment facilitated with intellectual ability,
appropriate learning and infrastructure facilities their
interest in their organization will explicitly be retained.
The students are motivated from the academic as well as the
administrative efficiency of their institution.
Spooree(2007) viewed that the organizational harmony,
teachers’ intellectual ability, professional growth,
transparency in students’ assessment, feedback and training
are the important features that mentally develops the
students. The maintenance of other essentials of quality
service in education i.e. well managed and updated
libraries, security systems, medical facilities, class
decoration and facilitation with multimedia and sitting
arrangements along with administrative staff’s cooperation
play a main role in educational support and overall growth
According to Soutar and McNeil (1996) both educational and
managerial issues of an institute are extremely worthy in
determining the performance of students, development of
institutional reflection and quality assurance Elliot ,
Shin (2002) found that the highly considerable changes in
the model that appear to directly impact on overall customer
satisfaction with university performance.
(1) Instructional Excellence
(2) Ability to get desired classes /level
(3) Inspirational & Knowledgeable
(4) Knowledgeable faculty
(5) Overall standard and quality of instruction
(6) Tuition paid is a worthwhile investment
(7) Access to tutor/ advisor
(8) Safe and secure accommodation /campus.
(9) Openness of policy about the requirements for major
Journal of Management Research
(10) Availability of advisor /tutor
(11) IT/ computer labs, facility
(12) Fair transparent approach of faculty and access to
information
Bolton , Drew (1991) Where the students also get motivated
from the steadfastness of the facilities they are provided
with, as an advanced quality they perceive the higher will
be magnetism for their affiliation .The accessibility of
other educational services like scholarly sense, advisors,
career analysis, department are the features that an
institution needs for its students’ better performance and
satisfaction but the services quality is mostly recognized
by the cooperation of the administrative staff as well as
the faculty staff with the students. Majority of the
students get discouraged if they found that the staff is not
compassionate /sympathetic and kind towards them and even
not keen for quality assurance of the institution. For this
purpose the institution must train its staff members, in a
way that it may create a sense of facilitation through quick
and timely delivery of harmonization, assistance, sympathy
and understanding.
Teaching, learning and class room facilities
Bano,humaira&nasreen(2013) in their discreet investigative
study are determinants of student's satisfaction with the
stance that in higher education the influence level of
satisfaction found that students are satisfied with higher
education in Pakistan. However, the level of satisfaction
varies on gender basis due to their socio economic status.
He further identified that teachers and classroom facilities
are the key factor to enhance the student's satisfaction at
higher education. Various researchers identified that image
of university, quality of instructors, education, test
books, intimation before attending university, methods of
teachers, administration of courses and the key factor to
develop and enhance student's satisfaction at higher
education or universities.
The Student’s Satisfaction Related to the Faculty
Lee (1997). The student’s satisfaction is interlinked with
the faculty especially with the first years impression that
in a student’s life in terms of financial aid, academics,
resources and experience of the university. These factors
involved in affecting the students’ satisfaction. He
conducted a study on students’ satisfaction in central
university of England and finally concluded that there were
clear problems with resources that produce a sense of
dissatisfaction amongst the students. The study also added
that the faculty of the university is an important factor
that affects the satisfaction of students. The faculty
performance and classes were the determinant of the
satisfaction of the students with education and their
attachment to the institution
Sapri. (2009) in his conducted study and probed some factors
that affects the satisfaction level of the students
regarding the higher educational facilities & service
scheme. The study comprise of the accommodation and social
facilities, supports service, teaching and learning
facilities and service environmental factors. That results
of the study concluded that the factors about teaching-
learning were most important factors that affect level of
the students’ satisfaction.
Services and facilities and students satisfaction
Low(2000).The relation between students and institutions is
twofold, schools and students have correlation in term of
financial needs because students depend on institutes to
impart knowledge and help to forge meaningful career in
future. Educational institutes are conducting student
satisfaction survey with the aim to improve the quality of
service, offered to students. Satisfaction is an outcome of
provided service. He found that student’s main criteria for
selection of university is quality of education and service
offered by the university. Low (2000), notes that provision
of service quality is key source of attraction, satisfaction
and retention of students and it has direct impact on
funding, job security and viability of educational
institute. He stated that there is significance & difference
between services and facilities and students satisfaction.
Various researchers have given their findings regarding
students’ concern for quality and use of students to measure
the quality of service provided. As Gold (2001) says that
students should be considered as primary customers and
educational institutes should focus on student-centered
education. Students should be assessed as the product of the
institute.
Satisfaction and Performance of Students
As per Lumsden (1994), finding in light of his research
“Satisfaction of students has been one of the commonly
discussed topics in higher education. Satisfaction of
students is directly related to the learning performance of
students. It is an element that leads students towards
learning process. Numerous studies are conducted ascertain
the satisfaction and students academic performance. Various
researchers have defined students’ satisfaction. i.e, they
analyzed satisfaction as students level of indulgence in
education. Marshal (1987) said that students’ satisfaction
is a force that is beneficial to the learner. He contended
that satisfaction of learning is dependent upon quality
associated with the learning and teaching process.
Autonomous satisfaction was reported to be significantly
associated with the students’ perceptions of course quality,
in terms of the meaningfulness and value of the educational
experience .he argues that satisfaction has an effect on
effort that finally casts positive results which lead to an
increase in abilities. Successful candidates are more
satisfied then candidates faced failure.
Impact of Library Facilities on Students
Satisfaction
Zeithaml, Parauraman, and Berry (1993)A university library
contributes greatly to the overall institution fulfilling
its mission and achieving academic success. University
libraries playing multi dimensional role to disseminate
information to achieve this aim/goal. University libraries
also offer different kinds of services, physical facilities,
collections of documents, access to information, and study
spaces. The traditional services and role of university
libraries is rapidly changing with passage of time due to
the increase in information providers (vendors, Google,
Amazon, etc.),
Though the increase level of the users expectations, the
application of modern technologies, global competition in
the information service sector, the digital revolution, the
introduction of numerous information formats and the rising
costs of physical information materials the role of
libraries in each university has gained a greater worth to
address the needs, experiences, expectations, and
perceptions of the end user (students) they are to overcome
challenges. Assessment of library service quality helps in
identifying any shortcoming, for reducing the gap existed
between customers ‘perceptions and expectations, in a view
to resources, for current and future planning.
As per the findings of service-quality literature Hernon ,
McClure(1990);Taylor (1986) it has been identified that
customers have a central position in the assessment of
service quality and claims the customers authorized to
judge the quality. The common services are becoming
unresponsive to the current exigencies required for
acquisition of information. This aspect stresses the
Library authorities should recognize the different needs of
students on preferential ground by regarding the feedback of
library users it is also suggestible that all programs and
initiatives regarding current and future services must be
user-centered. Libraries in the developed countries have
perceived this reality and focused on meeting their
customers ‘needs. The libraries in the advanced countries
changed their main focus on in-puts to outcome-based
assessment of the quality of services; however, in
developing countries like Pakistan, libraries are shorts to
facilitate the needs. Contradictory to the above depicted
facts in the developed world, in Pakistan users’ perceptions
of library service quality is not regularly assessed (Rehman
and Pervaiz 2007).
There is no data available to inform library managers,
policy makers, universities, and the Higher Education
Commission (HEC) about users’ expectations and perceptions
or about gaps between perceptions and expectations across
individual services, dimensions, and user groups in
developed countries is commonly available.
Students perceptions and expectations with library services.
Parasuraman, Zeithaml,and Berry (1991) in their research it
has stated that a service performance below the ZOT(zone of
tolerance) could create dissatisfaction and disappointment,
and causing decrease the reliability and loyalty of
customer. A performance level within or above the ZOT
indicates that minimum standard has been met and it
increases their loyalty, dependence and satisfaction for
service providing organization. Putting together minimum
agreed service quality its desired and perceived service
quality provides a great reason of understanding as to how
the libraries are performing from the perspective of its
users (students). It further reveals that libraries were
meeting minimum requirements of the users who are to be
satisfied overall by the staff, by arranging his
accessibility for and facilitate the study-space related
services and all dimensions in the ambit of ZOT Though few
researches indicated that users ’minimum requirements if not
met in specifically in terms of the service quality
dimensions, there will be varied feedback regarding the
effectiveness of the quality of service providers. So it
can be suggestible that users (especially faculty and
graduate students) who are considered amongst the high
expectation seeking information control and frame of opinion
to get the level of efficacy of their library. On the
contrary, users (except undergraduates) have seen having
poor and low level of expectations for the library-as a
place and have a broader opinion pertaining to the fact to
analyzed that how their libraries can perform in a better
way.
Reid (2008) has categorized few basic characteristics,
fundamentals that employers normally expect from the
graduates of the university. These included specific know
how, craft experience & knowledge, intellectual brilliance,
potentiality to work in modern organizations, interpersonal
& intra personal interactive and communicatory skills.
Reid, Trudeau (2008) describe that there are numerous
invisible characteristics that required by the market and
that include: readiness/willingness to learn, be
democratic/consultative and positive to work in multi-
cultured environment as team player, conflicts and emerging
problem solving skills, analytical/conceptualization
abilities, leadership and managerial qualities,
adaptability, flexibility, ability to summarize & resolve
key issues and above all the integrity & sincerity toward
obtainment of the team/organizational goals. It is the fact
that attainment of these skills and abilities are usually
desired/predefined by the parents prior or while deciding to
send their children for acquisition of higher education in
universities.
Crawford, svenson(1991) indicated that in Pakistan students
are still considered as customers of the university as it
was in England some years back, because they were to pay the
tuition fees. Students are the direct receiver/end users of
the services delivered by any educational
institution/university. The services are usually being
provided by the university with a preoccupied mindset that
the students are their customers the satisfaction and
dissatisfaction, matters a lot for the overall repo & tempo
of the university as the two year degree programme,
comprising of various semesters at each level that should
deliver highly convincing & purpose oriented results. For
authentication of this assumption, we have conducted survey
aimed at measurement of the satisfaction level of the
students, as results after series of assessing multifarious
aspectual angles it came to limelight that presently there
is teaching, assessment and support services are being
provided by their university through already mapped out
courses/ curriculum. These results will ultimately be used
as standard by University and financing donors etc as well
to constitute and functionalize a general assessment
committee of university to review the holistic performance.
Such a ranking /position of a university during any
systematic assessment by any committee or through other
reliable sources will portray an image which will ultimately
reflect upon reputation of University. This image will lead
as bedrock to set targets for satisfaction of the students
which obliviously result attracting/attachment towards that
very specific institution. Is of view, indeed recruitment
and retention of students has been moved to the top of most
universities agendas. If the retention is low that will
definitely lower the attention of the funding agent just as
government (Rowley, 2003).
MithileshwarJha (1993) has categorized the customer
satisfaction, a term that used frequently in marketing
entrepreneurs which illustrates the efficacy of any product
or service rendered by any company that entertain the
expectation of customers with regard to their feedback
regarding the overall service standard and its effectiveness
in winning the confidence of end users (students). In this
regard during a survey conducted wherein the participation
was of 2000 senior marketing persons working in various
managerial hierarchies. Amongst them 71% of total
participants tuned satisfaction over the customer
satisfaction an termed the matrix very corresponding/
convincing in managing the interlinked business interaction
between producers and consumers as well as monitoring and
evaluation of the business.
Abraham Koshy (2005) has classified the term satisfaction as
score card. It has been treated as vital key performance
indicator in business and often as part of sustainable
scorecard. In a competitive business environment wherein the
culture of business competition exists instead of
monopolistic sense there the customer satisfaction is
regarded as a key determining factor and becomes key element
in devising business strategy and action plan as it plays
pivotal role in rating the satisfaction paradigm of
customers within an organizational setup and also cast
powerful effects. In backdrop of the obtained data/ feedback
of customer the organization focus employees on importance
of successfully coming up with the expectations of
customers. Furthermore, any fluctuation or rating dip, the
management modifies/ revisits the action plan in line with
the relative proportion that impacts upon sales and
profitability. These metrics quantify an important dynamic.
Because when a brand (product) wins loyal customers, it
gains booming marketing that proves highly effective in all
respect.
Therefore, it is essential for businesses to manage the
customer satisfaction as its foremost priority whilst for
this purpose firms needing reliable and corroborative
measure of satisfaction. Moreover, to ascertain the level of
satisfaction firms are usually undertaking gallop surveys &
ask customers to verify and rank the Satisfaction level
aimed to determine the new formulation and necessary action
plan for further booming the production. A luxury resort,
for example, might receive a lower satisfaction rating than
an economical motel/resort, notwithstanding to its
facilities and services, even if superior in absolute terms.
There is a substantial body of pragmatic literature that
formulate the benefits of customer satisfaction for firms..
The disconfirmation, model is based upon the comparison of
customer theory, while rating an individual expectation
theorem specifically. When expectations are confirmed then
it can be presumable that products accurately performing in
line with the desired/ set expectation whereas, poor
performance of products beyond all expectation will
negatively confirmed. The disconfirmation stands always
positive when product performs in accordance with the
expectation
.There are four constructs upon which traditional
disconfirmation paradigm constituted as per the mentioned
expectations, performance, disconfirmation and satisfaction.
Satisfaction is considered as an outcome of purchase and
use, resulting from the buyers’ comparison of expected
rewards and incurred costs of the purchase in relation to
the anticipated consequences. In operation, satisfaction is
somehow similar to attitude as it can be evaluated as the
sum of satisfactions with some features of product. In the
literature, cognitive and affective models of satisfaction
are also developed and considered as alternatives
Methodologies to Measure Satisfaction
NoriakiKano(1980) Kano model is a theory of product
development and customer satisfaction that classifies
customer preferences/ priority into five categories:
Attractive, One-Dimensional, Must-Be, Indifferent, Reverse.
The Kano model offers some insight into the product
attributes which are perceived to be important to customers.
Parasuraman,zithamel&berry (1988) presented SERVQUAL or
RATER that is a service-quality framework that has been
incorporated into customer-satisfaction surveys (e.g., the
revised Norwegian Customer Satisfaction Barometer) to
indicate the gap between customer expectations and
experience(Kearney,hunsberger&pratt,1994).
Other research and consulting firms have customer
satisfaction solutions as well. These include Customer
Satisfaction Audit process, which incorporates the Stages of
Excellence framework and which helps define a company’s
status against eight critically identified dimensions.
Models to measure service quality and satisfaction
of university students
There are multiple approaches and models/ methodologies to
measure satisfaction of the customers with respect to
services provided by the company but no one is specifically
focusing on students in terms of customers some models are
discussed here.
GAP model
Parasuraman's and his colleges (1988) presented gap model
of service quality .Gap model suggests that to measure
satisfaction of the customers one may measure gap between
expectations and the actual performance of the product.
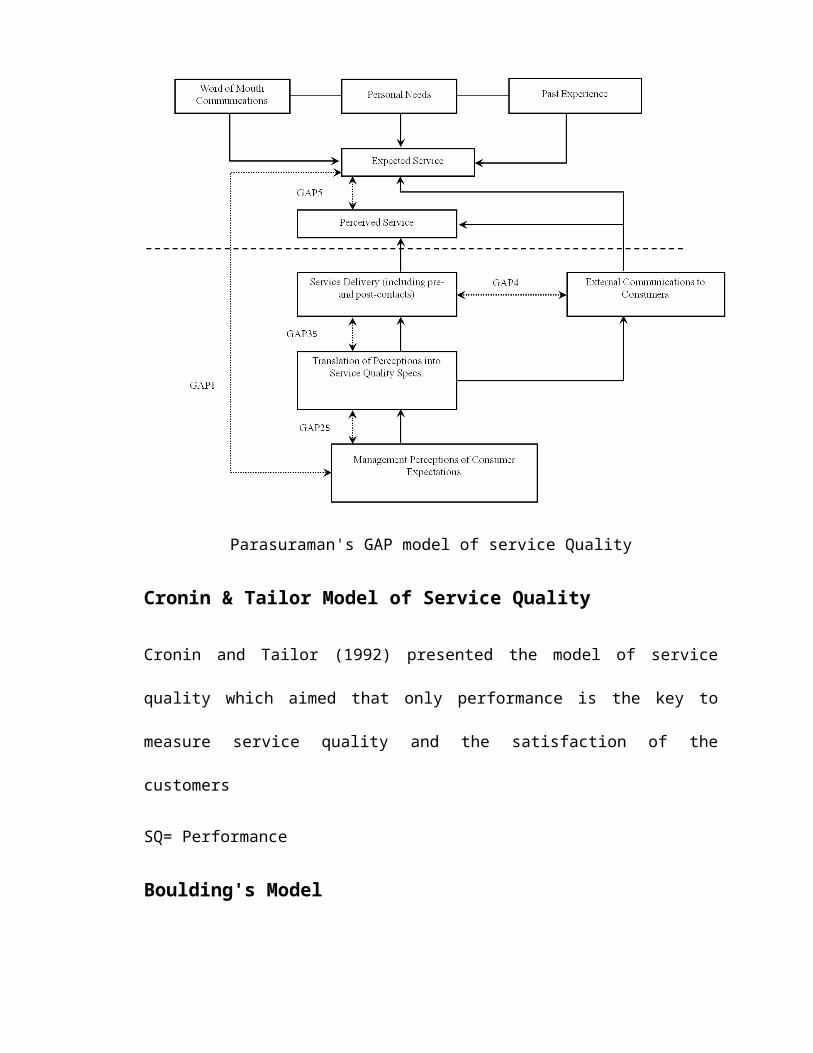
Parasuraman's GAP model of service Quality
Cronin & Tailor Model of Service Quality
Cronin and Tailor (1992) presented the model of service
quality which aimed that only performance is the key to
measure service quality and the satisfaction of the
customers
SQ= Performance
Boulding's Model
Boulding (1993) suggested that Gap model should be accepted
with some amendments. He categorized the expectations into
two main categories
WE= will Expectations
SE= Should expectations
WE should be increased by the service provider and SE should
be decreased for the maximum satisfaction of the customers
(Bouldings, 1993).
Zeithaml Model of Behavoral Intentions
Zeithaml (1996) proposed that if one is going to measure
customer satisfaction and the service quality of any
product, one should measure the behavioral intention (BI) s
of the customers
BI is directly related to financial success
BI is proportional to customer satisfaction/loyalty
(Zeithaml,1996).
The service-product bundle
Jones, Sasser (1993)the outcome of service delivery is a
tangible product, and a bundle of goods and services as the
product offering The service-product bundle refers to the
inseparable offering of many goods and services including
what University of the Punjab has to offer its students.
This bundle consists of three elements:
1. The physical or facilitating goods;
2. The sensual service provided – the explicit service;
and
3. The psychological service – the implicit service.
For a university the facilitating goods include the lectures
and tutorials, presentation slides, supplementary handout,
brochures, documents/materials and other recommended module
text. It also includes the physical facilities such as the
lecture theatres and tutorial rooms and their level of
furnishing, decoration, lighting and layout as well as
supplementary services such as catering and recreational
amenities.The explicit service includes the knowledge levels
of staff, teaching , innovative ability, the consistency of
teaching quality irrespective of personal, ease of making
appointments With staff, the level of difficulty of the
subject content and the workload.The implicit service
includes the treatment of students by staff, including
friendliness and approachability, concern shown if the
student has a problem, respect for feelings and opinions,
availability of staff, capability and competence of staff.
It also includes the ability of the university’s environment
to make the student feel comfortable, the sense of
competence, confidence and professionalism conveyed by the
ambience in lectures and tutorials, feeling that the
student’s best interest is being served and a feeling that
rewards are consistent with the effort put into
coursework/examinations. All of the above are based on
students’ perceptions of the various parts of the service
and the data is usually collected via some form of feedback
questionnaire. (Jones,sasser,1993).
Why collect student feedback?
Rowley, (2003) identified four main logical factors for
collecting the student feedback:
1. To provide verifiable evidence that students have had
the opportunity to comment upon their courses and use
the output to bring further improvement in teaching and
learning environment.
2. To facilitate and enable the student to reflect their
personal observation on pace of their learning process
3. To allow institutions as point of reference and to
provide indicators that will contribute to the
reputation of the university in the marketplace; and
4. To provide students with an opportunity to express
their level of satisfaction with achieved academic
experience.
An above all the logic behind the survey undertaken for the
particular research project described in this paper.
Jones ,Sasser (1993) formulated approaches of measuring
loyalty into three main categories:
1. Intent to re-purchase.With reference to the students,
we may presume that if the students refer others to
that university, it indicates his satisfaction with the
service provider (university).
2. Image of the organization; in this context we may say
that image of university.
3. Secondary behavior – e.g. customer referrals,
endorsements and spreading the word are all extremely
important forms of consumer behavior for an
organization.
Relating these factors into university services, this keeps
implied meaning showing intent to study at a higher level
within the same institution, how frequently and recently a
student used ancillary services, such as the library,
catering and IT services, and lastly the willingness to
recommend the institution to friends, neighbors and fellow
employees to join it.
Issues Impacting on Student Satisfaction
(Hassan,ilias,rehman&razaq,2008)recently reported on the
impact of facilities on undergraduate student choice of
university. They surveyed a number of universities over two
years in order to determine students’ reasons for selecting
a particular university. The average results for the two
years were fairly similar – the top eight reasons being; it
had the right course, availability of computers, quality of
library facilities, good teaching reputation,availability of
quiet areas, availability of areas for self-study, quality
of public transport in the town/city and a friendly attitude
towards students. Clearly, students’ perceptions of a
university’s facilities are one of the main influences on
their decision to enroll.
They found that student satisfaction is decreased when class
sizes are larger in earlier cohorts, and when students are
taking compulsory core modules rather than optional modules.
The quality of any of the service encounters, or moments of
truth experienced by customers forms part of their overall
impression of the whole service provided, and by
implication, their impression of the organization itself.
As Deming (1982) commented, most people from their opinions
based on the people that they see, and they are either
dissatisfied or delighted, or some other point on the
continuum in between. In order to deliver high quality
services to students, universities must manage every aspect
of the student’s interaction with all of their service
offering sand in particular those involving its people.
Services are delivered to people by people, and the moments
of truth can make or break a university’s image
(Banwet ,Datta, 2003)
In order to deliver total student satisfaction, all
employees of a university should adhere to the principles of
quality customer service, whether they be front-line contact
staff involved in teaching or administration, or non-contact
staff in management or administrative roles (Banwet ,Datta,
2003)
In a recent survey conducted with 310 all male Saudi Arabian
students attending the King Fahd University of Petroleum and
Minerals, found that contact personnel was the most
influencing factor in student’s evaluation of service
quality. However, physical environment, layout, lighting,
classrooms, appearance of buildings and grounds and the
overall cleanliness also significantly contributed to
students’ concepts of service quality.
It is studied the role of the faculty administration office
in one UK University on student perceptions of service
quality. He found that it impacted directly on students and
influenced their perceptions of the quality of the whole
institution. The office performance also had a direct impact
on academic and technical staff within the faculty. These
front-line staff in their turn had a direct impact on
students, potential students and other clients.
Banwet and Datta, (2003) believed that satisfied customers
are loyal, and that satisfied students were likely to attend
another lecture delivered by the same lecturer or opt for
another module or course taught by her/him. In their survey
of 168 students who attended four lectures delivered by the
same lecturer, covering perceived service quality,
importance and post-visit intentions, they found that
students placed more importance on the outcome of the
lecture than any other dimension.
Overall Banwet and Datta (2003) found that students’
intentions to re-attend or recommend lectures was dependent
on their perceptions of quality and the satisfaction
they got from attending previous lectures. The quality
of any of the service encounters, or moments of truth
experienced by customers forms part of their overall
impression of the whole service provided and by implication,
their impression of the organization itself .
As Deming (1982) commented, most people from their opinions
based on the people that they see, and they are either
dissatisfied or delighted, or some other point on the
continuum in between. In order to deliver high quality
services to students, universities must manage every aspect
of the student’s interaction with all of their service
offerings.
Banwet and Datta, (2003) believed that satisfied customers
are loyal, and that satisfied students were likely to attend
another lecture delivered by the same lecturer or opt for
another module or course taught by her/him. In their survey
of 168 students who attended four lectures delivered by the
same lecturer, covering perceived service quality,
importance and post-visit intentions, they found that
students placed more importance on the outcome of the
lecture (knowledge and skills gained, availability of class
notes and reading material, coverage and depth of the
lecture and teacher’s feedback on assessed work) than any
other dimension.
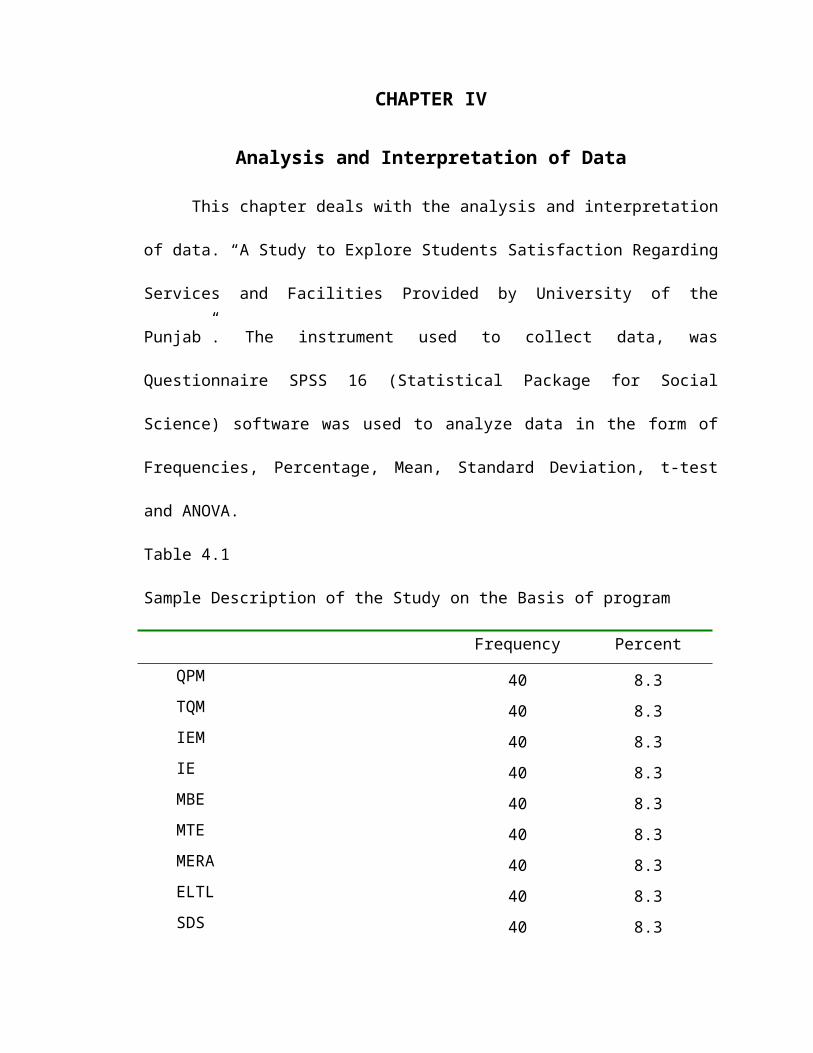
CHAPTER IV
Analysis and Interpretation of Data
This chapter deals with the analysis and interpretation
of data. “A Study to Explore Students Satisfaction Regarding
Services and Facilities Provided by University of the
Punjab”. The instrument used to collect data, was
Questionnaire SPSS 16 (Statistical Package for Social
Science) software was used to analyze data in the form of
Frequencies, Percentage, Mean, Standard Deviation, t-test
and ANOVA.
Table 4.1
Sample Description of the Study on the Basis of program
Frequency PercentQPM 40 8.3
TQM 40 8.3 IEM 40 8.3 IE 40 8.3 MBE 40 8.3 MTE 40 8.3 MERA 40 8.3 ELTL 40 8.3 SDS 40 8.3
Crimnology 40 8.3 Population sciences 40 8.3 Sociology 40 8.3 Total 480 100.0
Above table shows the frequency and percentage of all
the selected program. The selected data of all program were
equal.
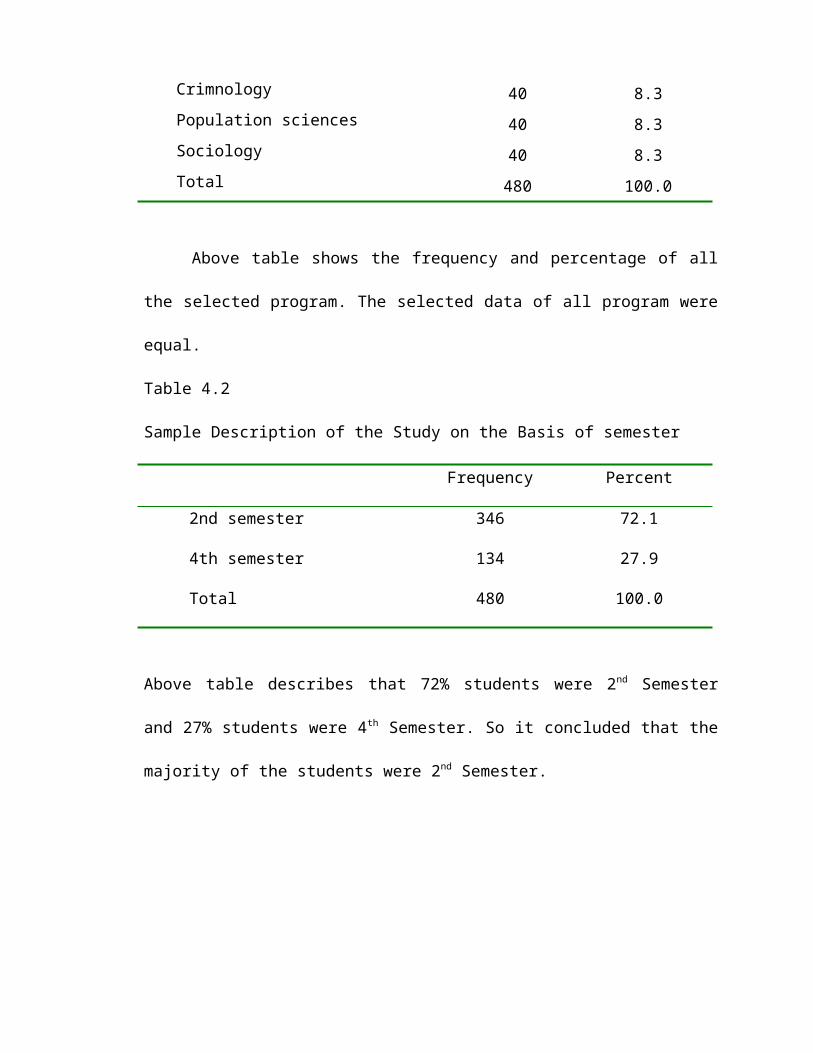
Table 4.2
Sample Description of the Study on the Basis of semester
Frequency Percent
2nd semester 346 72.1
4th semester 134 27.9
Total 480 100.0
Above table describes that 72% students were 2nd Semester
and 27% students were 4th Semester. So it concluded that the
majority of the students were 2nd Semester.
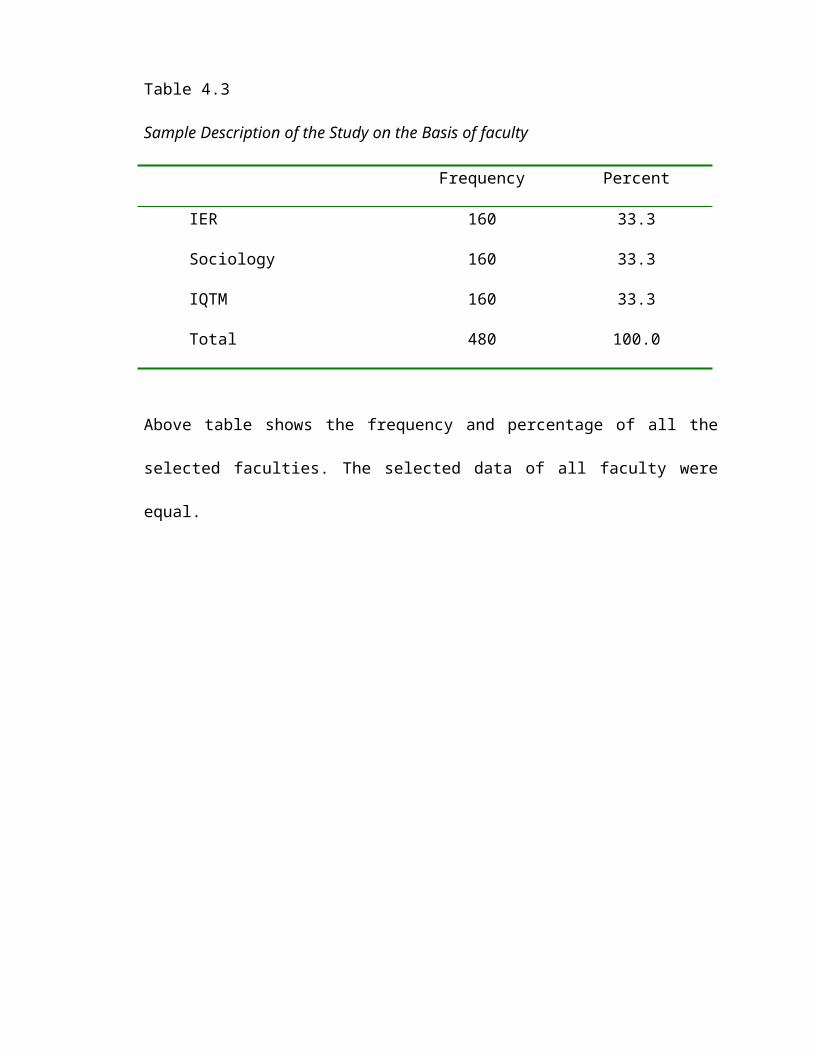
Table 4.3
Sample Description of the Study on the Basis of faculty
Frequency Percent
IER 160 33.3
Sociology 160 33.3
IQTM 160 33.3
Total 480 100.0
Above table shows the frequency and percentage of all the
selected faculties. The selected data of all faculty were
equal.
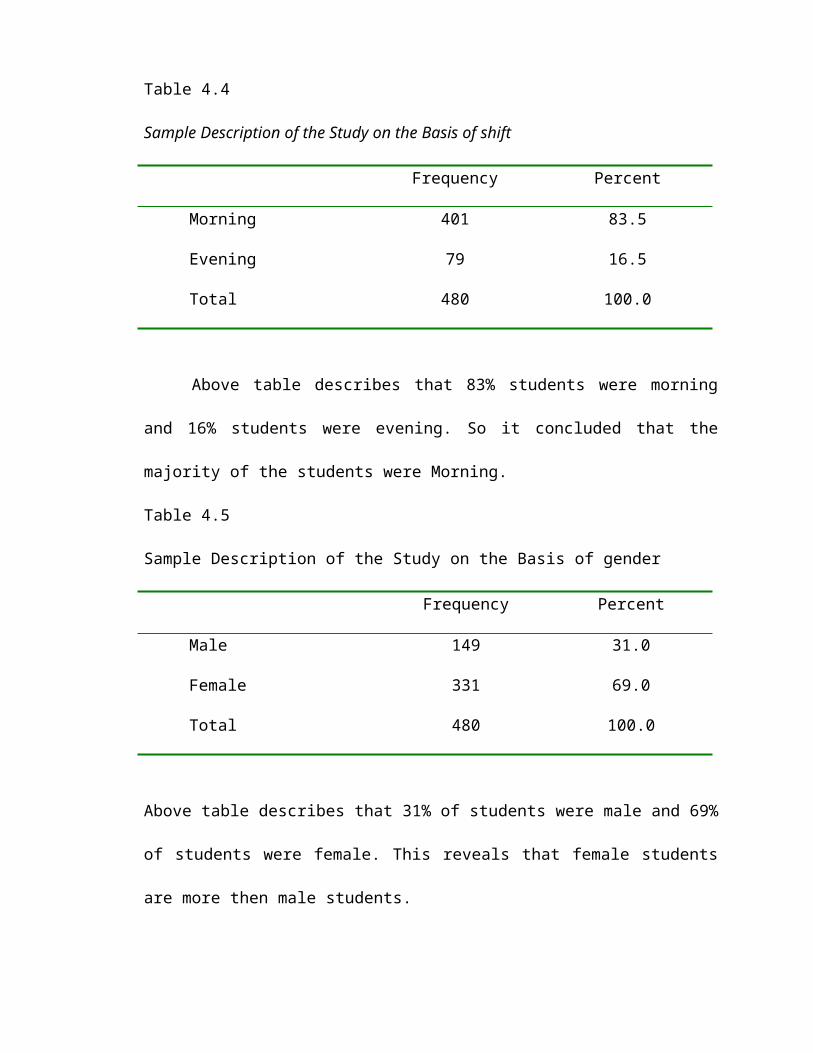
Table 4.4
Sample Description of the Study on the Basis of shift
Frequency Percent
Morning 401 83.5
Evening 79 16.5
Total 480 100.0
Above table describes that 83% students were morning
and 16% students were evening. So it concluded that the
majority of the students were Morning.
Table 4.5
Sample Description of the Study on the Basis of gender
Frequency Percent
Male 149 31.0
Female 331 69.0
Total 480 100.0
Above table describes that 31% of students were male and 69%
of students were female. This reveals that female students
are more then male students.
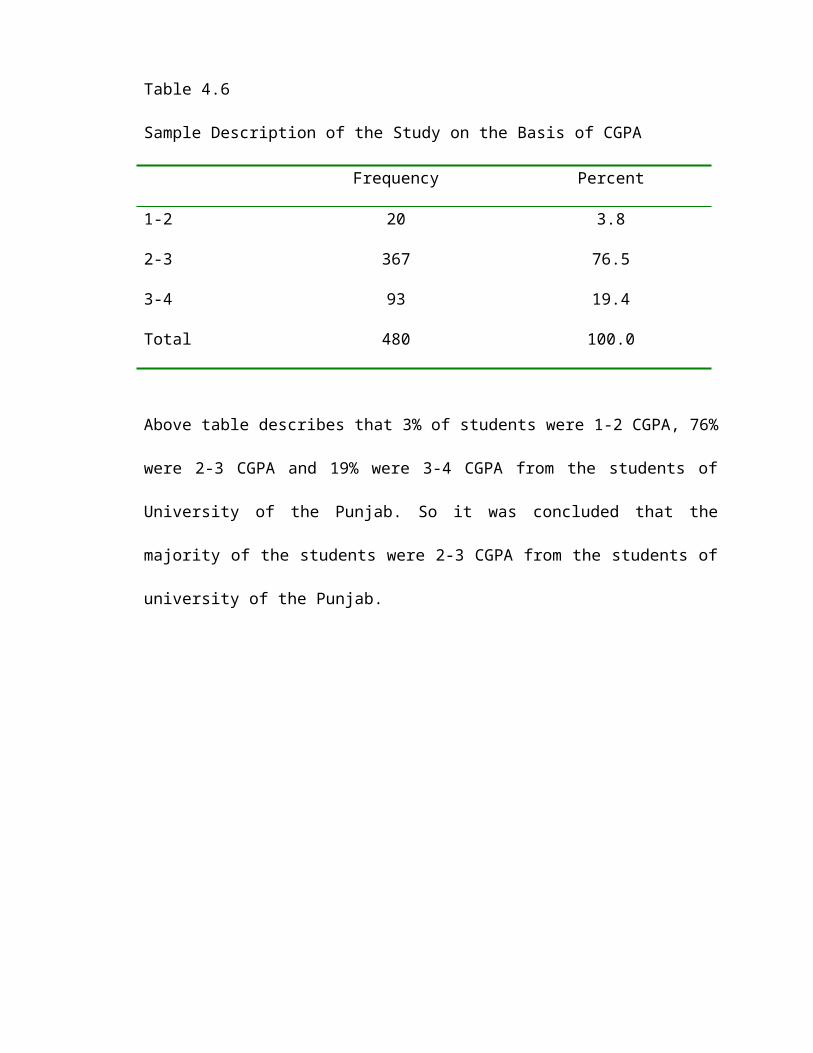
Table 4.6
Sample Description of the Study on the Basis of CGPA
Frequency Percent
1-2 20 3.8
2-3 367 76.5
3-4 93 19.4
Total 480 100.0
Above table describes that 3% of students were 1-2 CGPA, 76%
were 2-3 CGPA and 19% were 3-4 CGPA from the students of
University of the Punjab. So it was concluded that the
majority of the students were 2-3 CGPA from the students of
university of the Punjab.
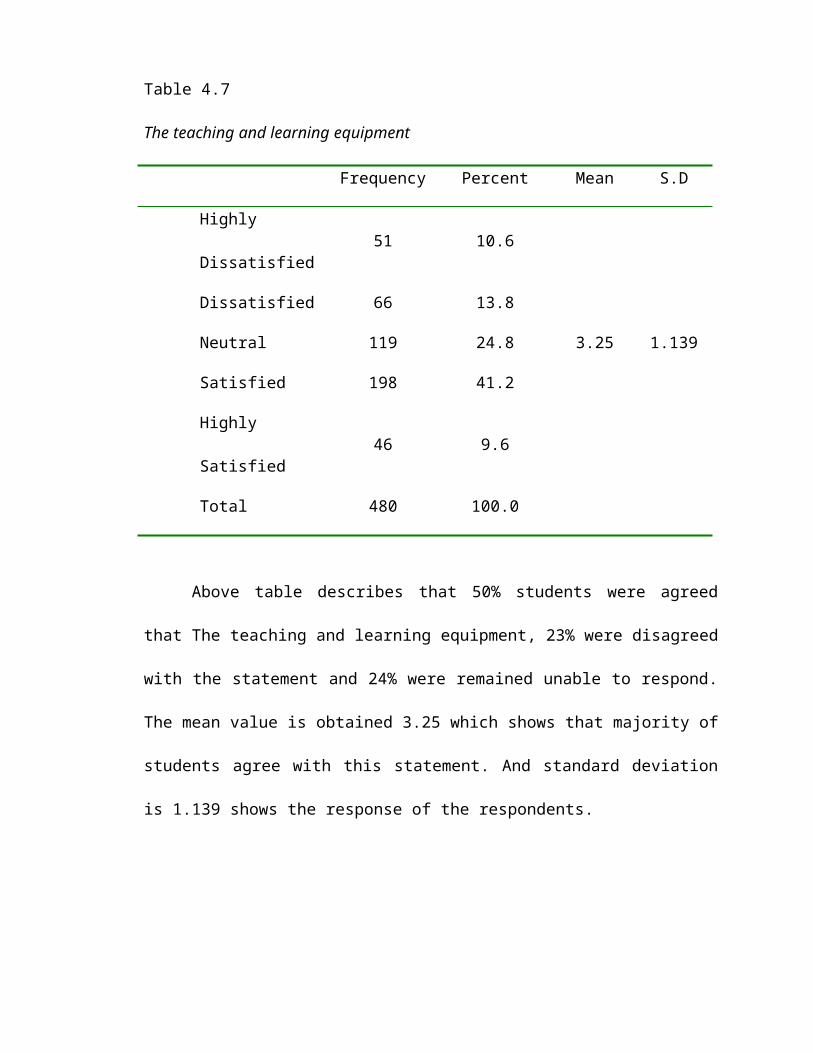
Table 4.7
The teaching and learning equipment
Frequency Percent Mean S.D
Highly
Dissatisfied51 10.6
Dissatisfied 66 13.8
Neutral 119 24.8 3.25 1.139
Satisfied 198 41.2
Highly
Satisfied46 9.6
Total 480 100.0
Above table describes that 50% students were agreed
that The teaching and learning equipment, 23% were disagreed
with the statement and 24% were remained unable to respond.
The mean value is obtained 3.25 which shows that majority of
students agree with this statement. And standard deviation
is 1.139 shows the response of the respondents.

Table 4.8
The quality of lectures
Frequency Percent Mean S.D
Highly
Dissatisfied48 10.0
Dissatisfied 28 5.8
Neutral 119 24.8 3.45 1.092
Satisfied 231 48.1
Highly
Satisfied54 11.2
Total 480 100.0
Above table describes that 59% students were agreed
that The quality of lectures, 15% were disagreed with the
statement and 24% were remained unable to respond. The mean
value is obtained 3.45 which shows that majority of students
agree with this statement. And standard deviation is 1.092
shows the response of the respondents.
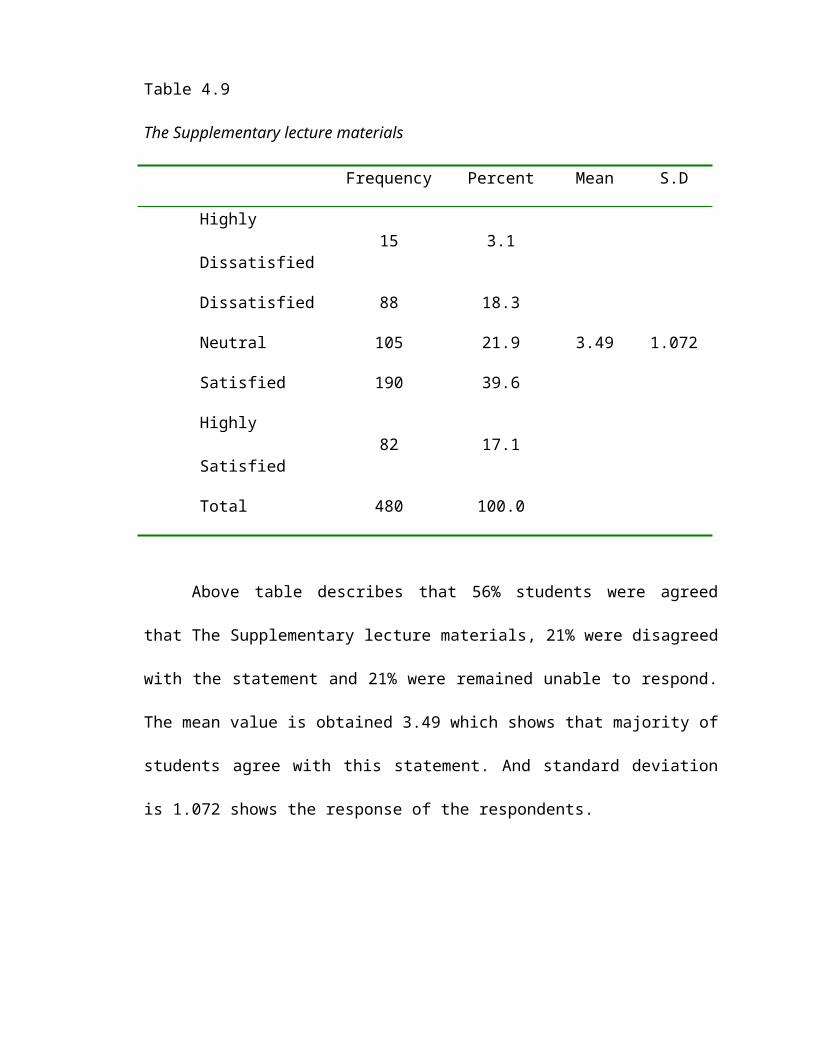
Table 4.9
The Supplementary lecture materials
Frequency Percent Mean S.D
Highly
Dissatisfied15 3.1
Dissatisfied 88 18.3
Neutral 105 21.9 3.49 1.072
Satisfied 190 39.6
Highly
Satisfied82 17.1
Total 480 100.0
Above table describes that 56% students were agreed
that The Supplementary lecture materials, 21% were disagreed
with the statement and 21% were remained unable to respond.
The mean value is obtained 3.49 which shows that majority of
students agree with this statement. And standard deviation
is 1.072 shows the response of the respondents.
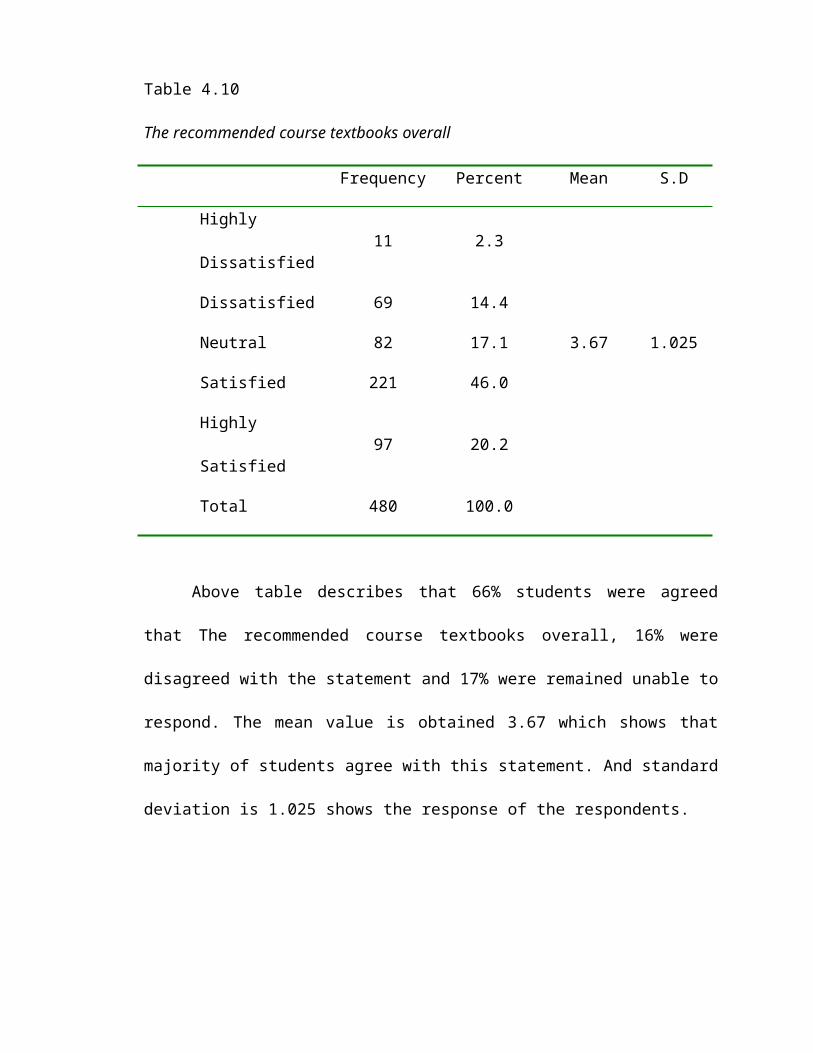
Table 4.10
The recommended course textbooks overall
Frequency Percent Mean S.D
Highly
Dissatisfied11 2.3
Dissatisfied 69 14.4
Neutral 82 17.1 3.67 1.025
Satisfied 221 46.0
Highly
Satisfied97 20.2
Total 480 100.0
Above table describes that 66% students were agreed
that The recommended course textbooks overall, 16% were
disagreed with the statement and 17% were remained unable to
respond. The mean value is obtained 3.67 which shows that
majority of students agree with this statement. And standard
deviation is 1.025 shows the response of the respondents.
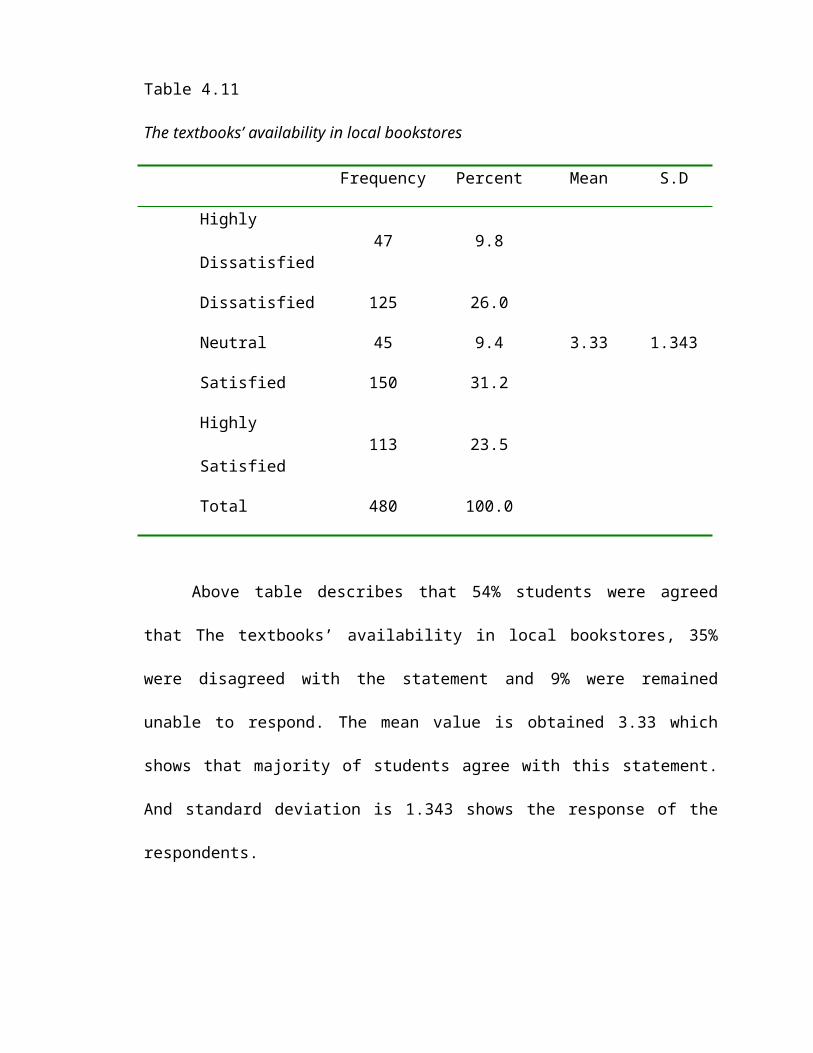
Table 4.11
The textbooks’ availability in local bookstores
Frequency Percent Mean S.D
Highly
Dissatisfied47 9.8
Dissatisfied 125 26.0
Neutral 45 9.4 3.33 1.343
Satisfied 150 31.2
Highly
Satisfied113 23.5
Total 480 100.0
Above table describes that 54% students were agreed
that The textbooks’ availability in local bookstores, 35%
were disagreed with the statement and 9% were remained
unable to respond. The mean value is obtained 3.33 which
shows that majority of students agree with this statement.
And standard deviation is 1.343 shows the response of the
respondents.
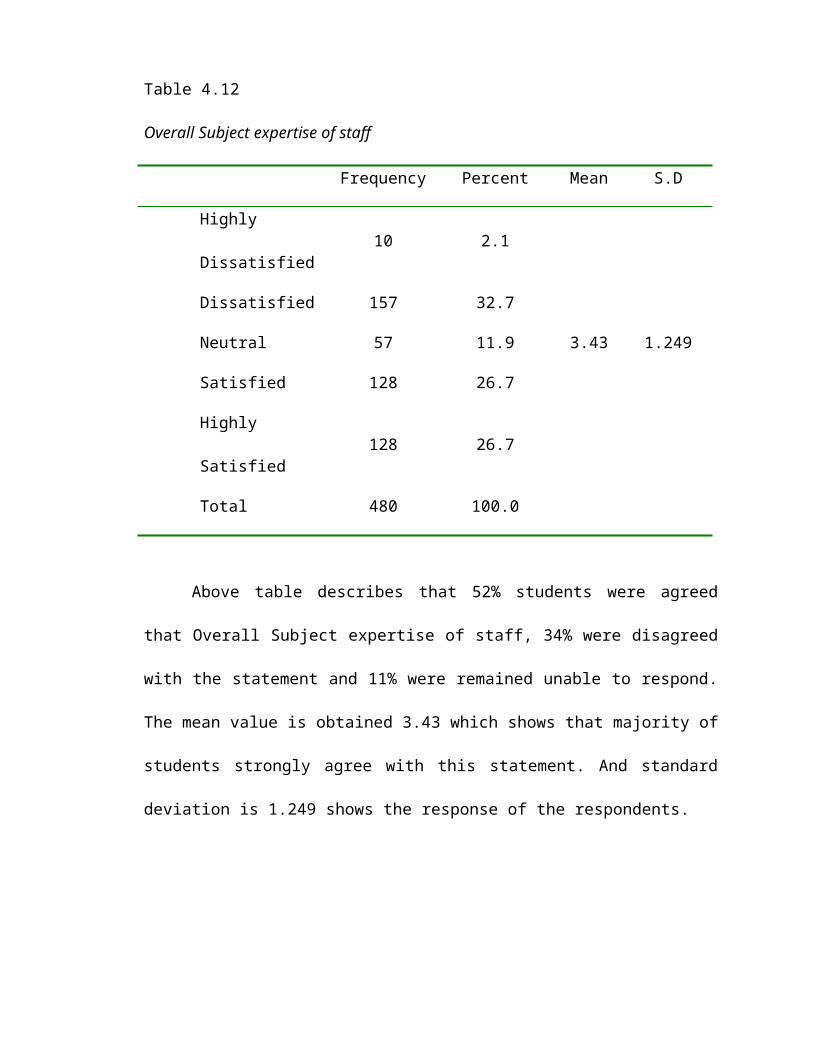
Table 4.12
Overall Subject expertise of staff
Frequency Percent Mean S.D
Highly
Dissatisfied10 2.1
Dissatisfied 157 32.7
Neutral 57 11.9 3.43 1.249
Satisfied 128 26.7
Highly
Satisfied128 26.7
Total 480 100.0
Above table describes that 52% students were agreed
that Overall Subject expertise of staff, 34% were disagreed
with the statement and 11% were remained unable to respond.
The mean value is obtained 3.43 which shows that majority of
students strongly agree with this statement. And standard
deviation is 1.249 shows the response of the respondents.

Table 4.13
Punctuality of teachers
Frequency Percent Mean S.D
Highly
Dissatisfied8 1.7
Dissatisfied 108 22.5
Neutral 117 24.4 3.52 1.154
Satisfied 120 25.0
Highly
Satisfied127 26.5
Total 480 100.0
Above table describes that 51% students were agreed
that Punctuality of teachers, 23% were disagreed with the
statement and 24% were remained unable to respond. The mean
value is obtained 3.52 which shows that majority of students
agree with this statement. And standard deviation is 1.154
shows the response of the respondents.
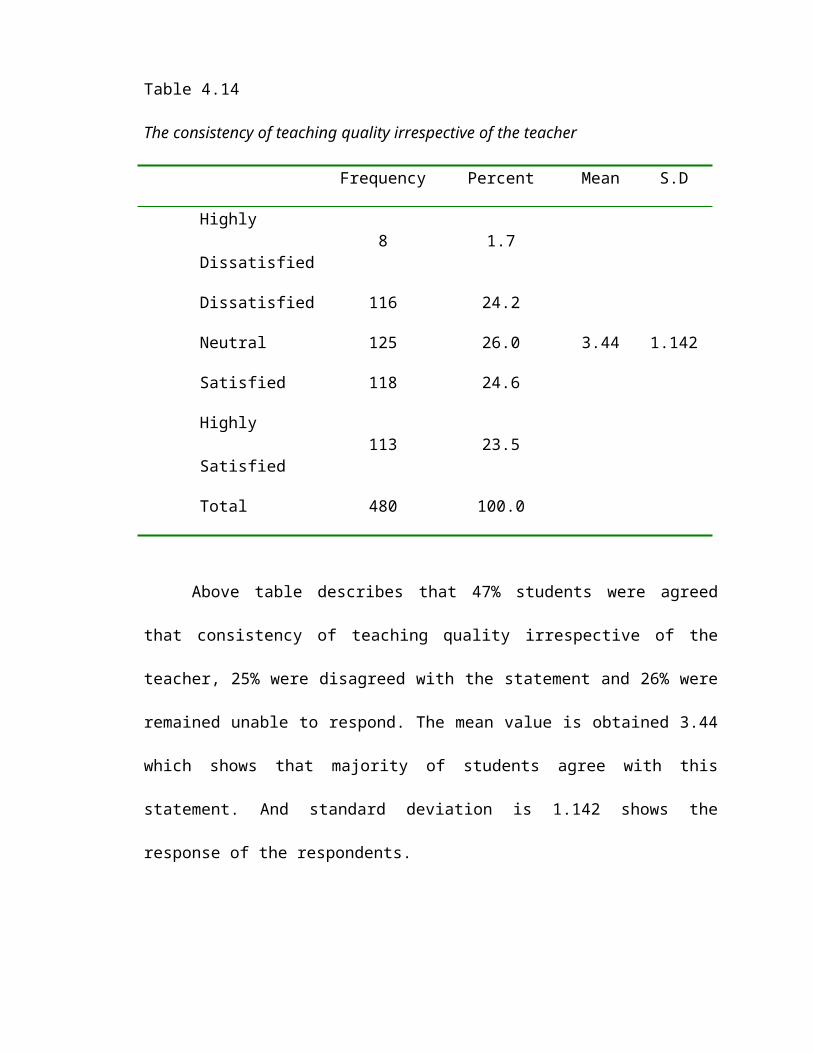
Table 4.14
The consistency of teaching quality irrespective of the teacher
Frequency Percent Mean S.D
Highly
Dissatisfied8 1.7
Dissatisfied 116 24.2
Neutral 125 26.0 3.44 1.142
Satisfied 118 24.6
Highly
Satisfied113 23.5
Total 480 100.0
Above table describes that 47% students were agreed
that consistency of teaching quality irrespective of the
teacher, 25% were disagreed with the statement and 26% were
remained unable to respond. The mean value is obtained 3.44
which shows that majority of students agree with this
statement. And standard deviation is 1.142 shows the
response of the respondents.
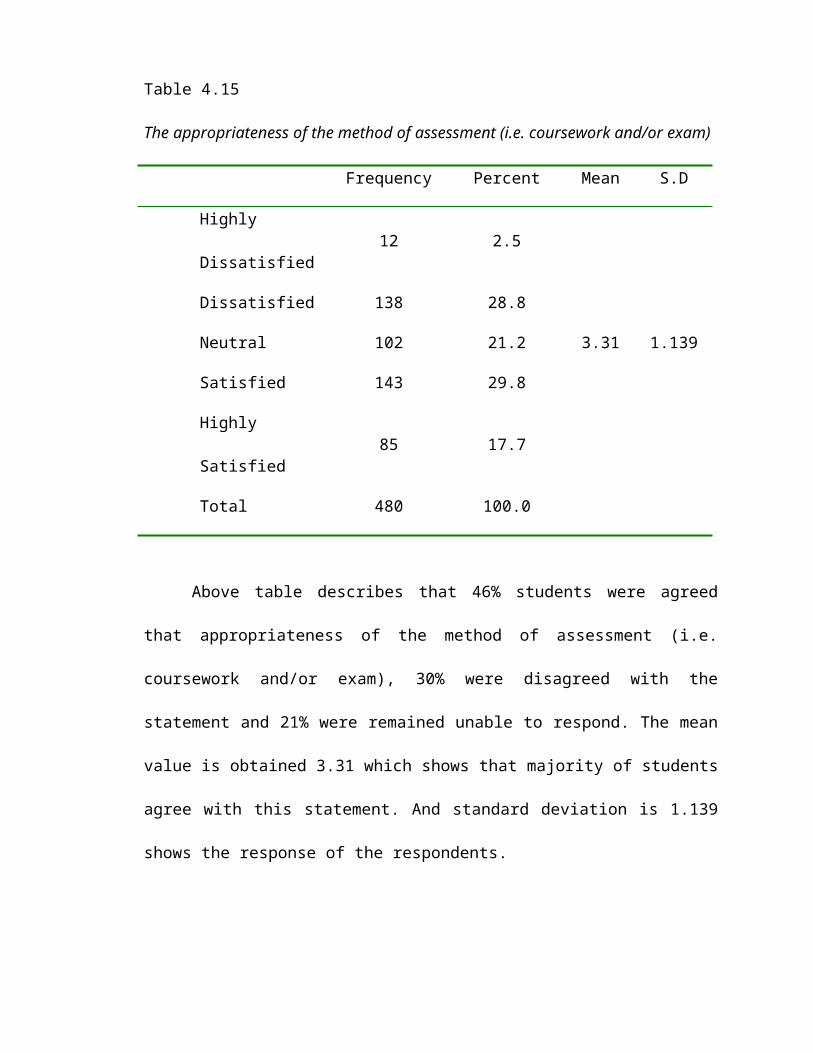
Table 4.15
The appropriateness of the method of assessment (i.e. coursework and/or exam)
Frequency Percent Mean S.D
Highly
Dissatisfied12 2.5
Dissatisfied 138 28.8
Neutral 102 21.2 3.31 1.139
Satisfied 143 29.8
Highly
Satisfied85 17.7
Total 480 100.0
Above table describes that 46% students were agreed
that appropriateness of the method of assessment (i.e.
coursework and/or exam), 30% were disagreed with the
statement and 21% were remained unable to respond. The mean
value is obtained 3.31 which shows that majority of students
agree with this statement. And standard deviation is 1.139
shows the response of the respondents.
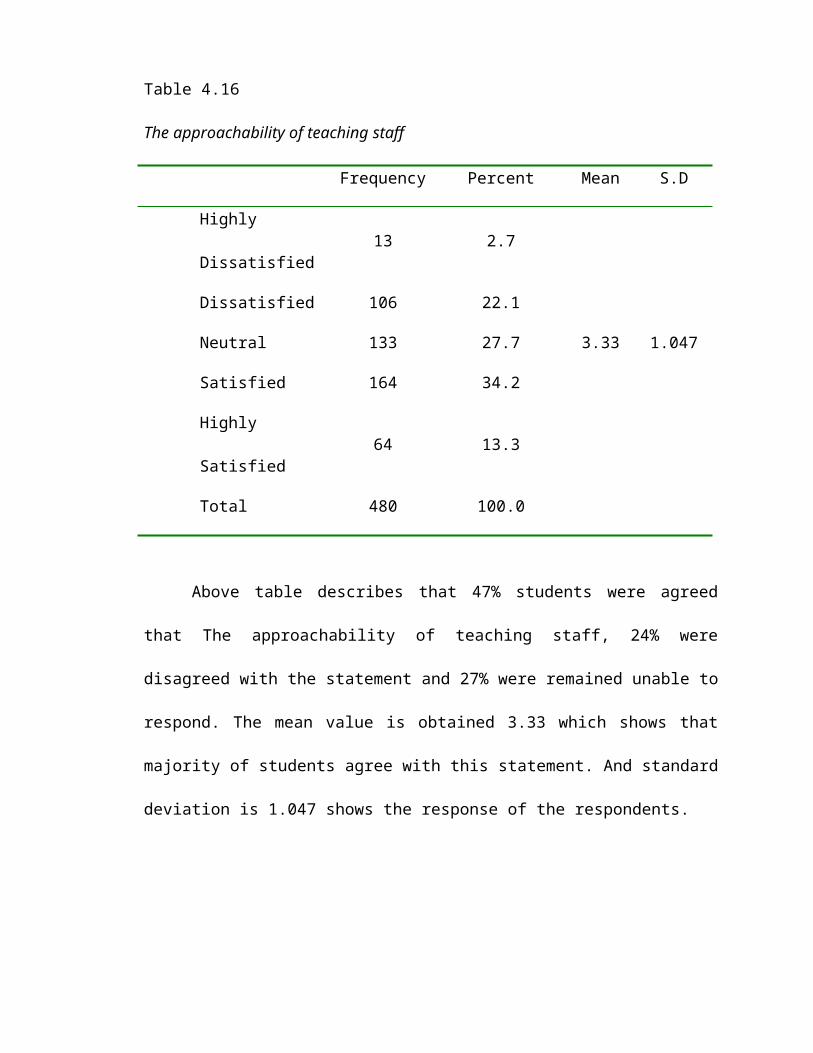
Table 4.16
The approachability of teaching staff
Frequency Percent Mean S.D
Highly
Dissatisfied13 2.7
Dissatisfied 106 22.1
Neutral 133 27.7 3.33 1.047
Satisfied 164 34.2
Highly
Satisfied64 13.3
Total 480 100.0
Above table describes that 47% students were agreed
that The approachability of teaching staff, 24% were
disagreed with the statement and 27% were remained unable to
respond. The mean value is obtained 3.33 which shows that
majority of students agree with this statement. And standard
deviation is 1.047 shows the response of the respondents.
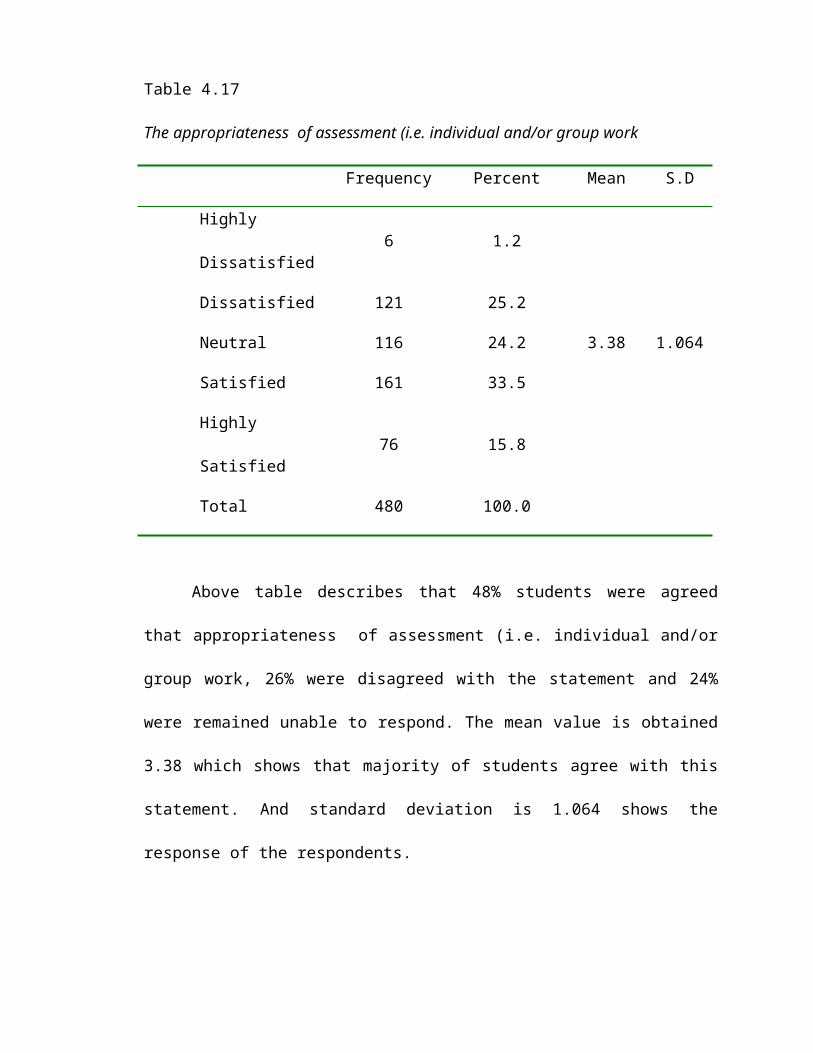
Table 4.17
The appropriateness of assessment (i.e. individual and/or group work
Frequency Percent Mean S.D
Highly
Dissatisfied6 1.2
Dissatisfied 121 25.2
Neutral 116 24.2 3.38 1.064
Satisfied 161 33.5
Highly
Satisfied76 15.8
Total 480 100.0
Above table describes that 48% students were agreed
that appropriateness of assessment (i.e. individual and/or
group work, 26% were disagreed with the statement and 24%
were remained unable to respond. The mean value is obtained
3.38 which shows that majority of students agree with this
statement. And standard deviation is 1.064 shows the
response of the respondents.
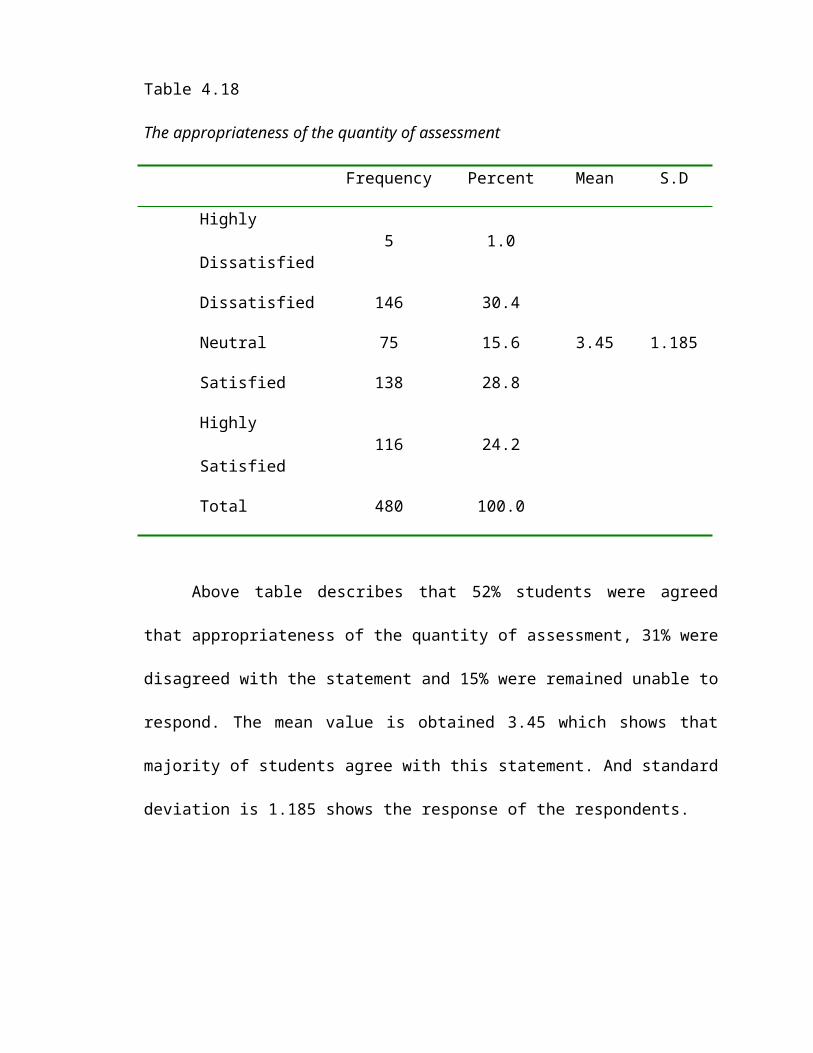
Table 4.18
The appropriateness of the quantity of assessment
Frequency Percent Mean S.D
Highly
Dissatisfied5 1.0
Dissatisfied 146 30.4
Neutral 75 15.6 3.45 1.185
Satisfied 138 28.8
Highly
Satisfied116 24.2
Total 480 100.0
Above table describes that 52% students were agreed
that appropriateness of the quantity of assessment, 31% were
disagreed with the statement and 15% were remained unable to
respond. The mean value is obtained 3.45 which shows that
majority of students agree with this statement. And standard
deviation is 1.185 shows the response of the respondents.
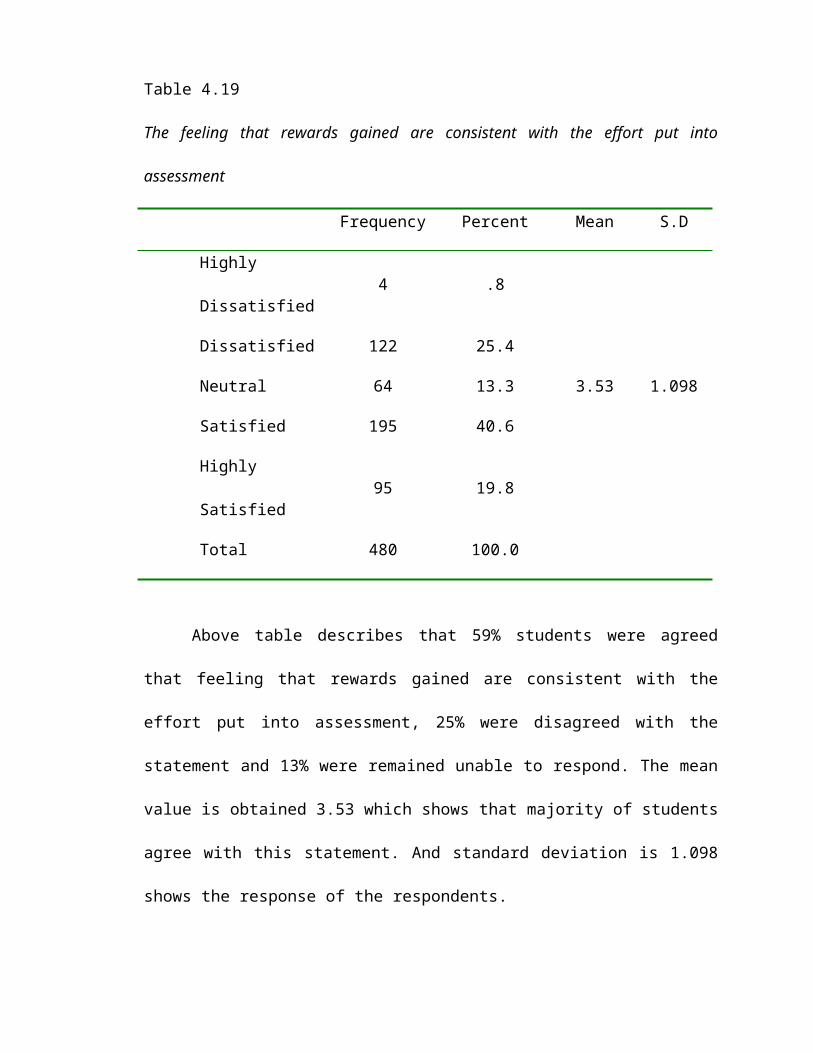
Table 4.19
The feeling that rewards gained are consistent with the effort put into
assessment
Frequency Percent Mean S.D
Highly
Dissatisfied4 .8
Dissatisfied 122 25.4
Neutral 64 13.3 3.53 1.098
Satisfied 195 40.6
Highly
Satisfied95 19.8
Total 480 100.0
Above table describes that 59% students were agreed
that feeling that rewards gained are consistent with the
effort put into assessment, 25% were disagreed with the
statement and 13% were remained unable to respond. The mean
value is obtained 3.53 which shows that majority of students
agree with this statement. And standard deviation is 1.098
shows the response of the respondents.

Table 4.20
The lecture rooms overall
Frequency Percent Mean S.D
Highly
Dissatisfied6 1.2
Dissatisfied 106 22.1
Neutral 67 14.0 3.51 1.011
Satisfied 240 50.0
Highly
Satisfied61 12.7
Total 480 100.0
Above table describes that 62% students were agreed
that lecture rooms overall, 23% were disagreed with the
statement and 14% were remained unable to respond. The mean
value is obtained 3.51 which shows that majority of students
agree with this statement. And standard deviation is 1.011
shows the response of the respondents.

Table 4.21
The lecture room level of cleanliness
Frequency Percent Mean S.D
Highly
Dissatisfied11 2.3
Dissatisfied 61 12.7
Neutral 150 31.2 3.52 .976
Satisfied 184 38.3
Highly
Satisfied74 15.4
Total 480 100.0
Above table describes that 53% students were agreed
that lecture room level of cleanliness, 14% were disagreed
with the statement and 31% were remained unable to respond.
The mean value is obtained 3.52 which shows that majority of
students agree with this statement. And standard deviation
is .976 shows the response of the respondents.

Table 4.22
The lecture room layout
Frequency Percent Mean S.D
Highly
Dissatisfied43 9.0
Dissatisfied 54 11.2
Neutral 112 23.3 3.48 1.197
Satisfied 171 35.6
Highly
Satisfied100 20.8
Total 480 100.0
Above table describes that 55% students were agreed
that lecture room layout, 20% were disagreed with the
statement and 23% were remained unable to respond. The mean
value is obtained 3.48 which shows that majority of students
agree with this statement. And standard deviation is 1.197
shows the response of the respondents.
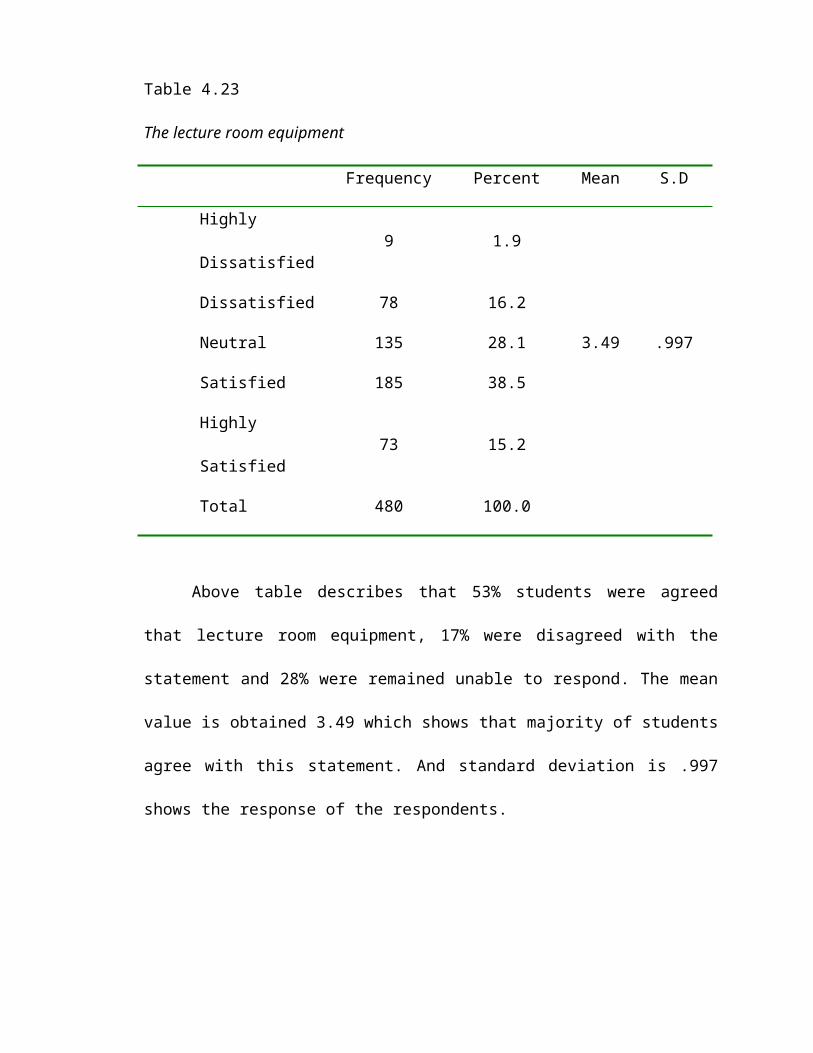
Table 4.23
The lecture room equipment
Frequency Percent Mean S.D
Highly
Dissatisfied9 1.9
Dissatisfied 78 16.2
Neutral 135 28.1 3.49 .997
Satisfied 185 38.5
Highly
Satisfied73 15.2
Total 480 100.0
Above table describes that 53% students were agreed
that lecture room equipment, 17% were disagreed with the
statement and 28% were remained unable to respond. The mean
value is obtained 3.49 which shows that majority of students
agree with this statement. And standard deviation is .997
shows the response of the respondents.

Table 4.24
The lecture room lighting
Frequency Percent Mean S.D
Highly
Dissatisfied10 2.1
Dissatisfied 35 7.3
Neutral 114 23.8 3.78 .948
Satisfied 212 44.2
Highly
Satisfied109 22.7
Total 480 100.0
Above table describes that 66% students were agreed
that lecture room lighting, 9% were disagreed with the
statement and 23% were remained unable to respond. The mean
value is obtained 3.78 which shows that majority of students
agree with this statement. And standard deviation is .948
shows the response of the respondents.

Table 4.25
Audio visual ads in lecture rooms
Frequency Percent Mean S.D
Highly
Dissatisfied9 1.9
Dissatisfied 27 5.6
Neutral 137 28.5 3.76 .912
Satisfied 206 42.9
Highly
Satisfied101 21.0
Total 480 100.0
Above table describes that 63% students were agreed
that Audio visual ads in lecture rooms, 6% were disagreed
with the statement and 28% were remained unable to respond.
The mean value is obtained 3.76 which shows that majority of
students agree with this statement. And standard deviation
is .912 shows the response of the respondents.

Table 4.26
Library overall
Frequency Percent Mean S.D
Highly
Dissatisfied6 1.2
Dissatisfied 28 5.8
Neutral 89 18.5 3.96 .912
Satisfied 213 44.4
Highly
Satisfied144 30.0
Total 480 100.0
Above table describes that 74% students were agreed
that Library overall, 6% were disagreed with the statement
and 18% were remained unable to respond. The mean value is
obtained 3.96 which shows that majority of students agree
with this statement. And standard deviation is .912 shows
the response of the respondents.
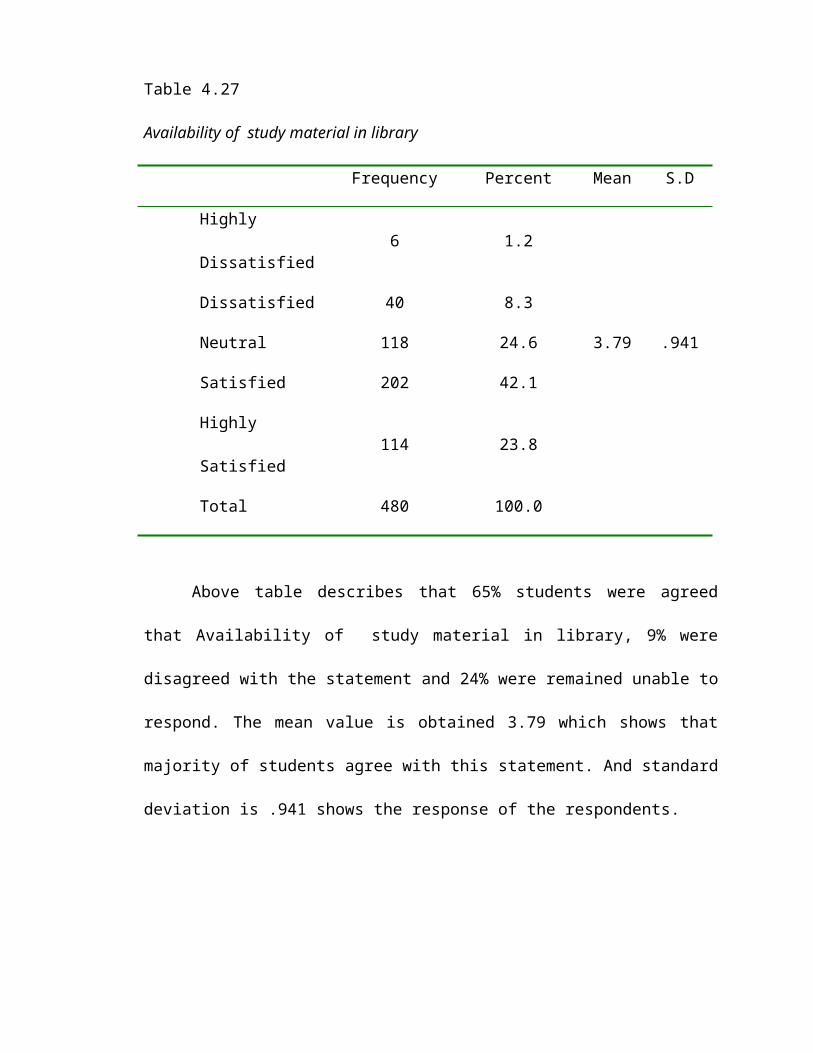
Table 4.27
Availability of study material in library
Frequency Percent Mean S.D
Highly
Dissatisfied6 1.2
Dissatisfied 40 8.3
Neutral 118 24.6 3.79 .941
Satisfied 202 42.1
Highly
Satisfied114 23.8
Total 480 100.0
Above table describes that 65% students were agreed
that Availability of study material in library, 9% were
disagreed with the statement and 24% were remained unable to
respond. The mean value is obtained 3.79 which shows that
majority of students agree with this statement. And standard
deviation is .941 shows the response of the respondents.
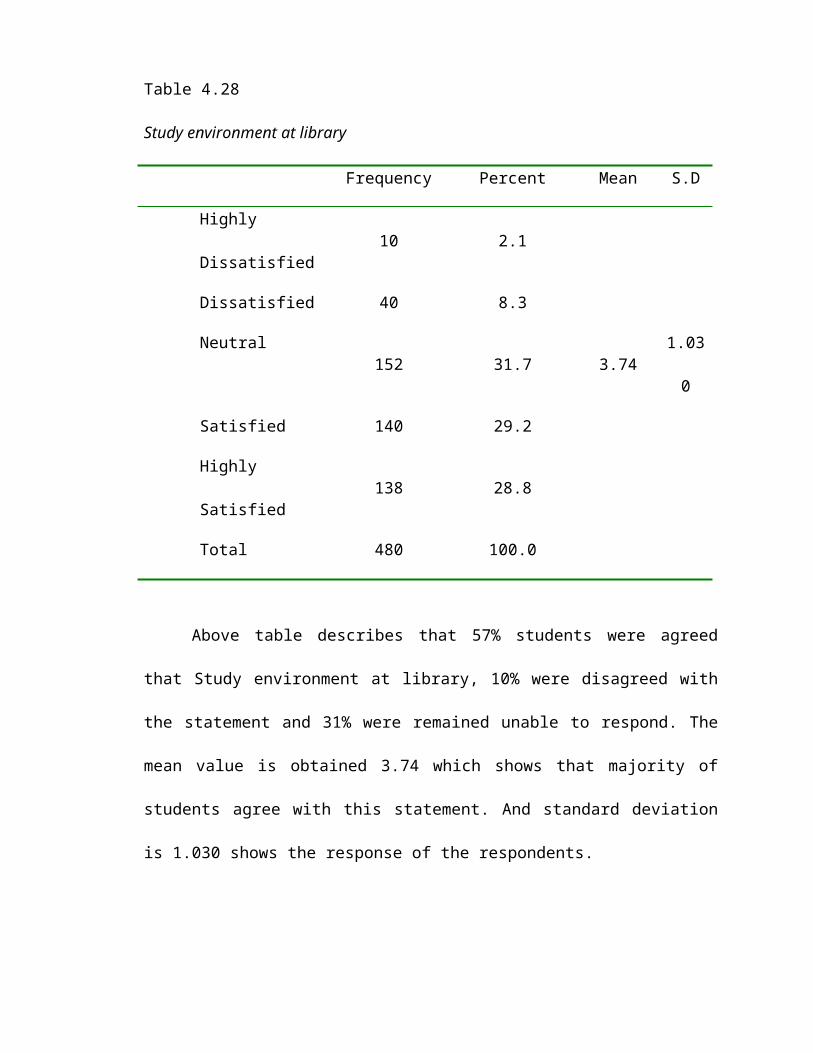
Table 4.28
Study environment at library
Frequency Percent Mean S.D
Highly
Dissatisfied10 2.1
Dissatisfied 40 8.3
Neutral152 31.7 3.74
1.03
0
Satisfied 140 29.2
Highly
Satisfied138 28.8
Total 480 100.0
Above table describes that 57% students were agreed
that Study environment at library, 10% were disagreed with
the statement and 31% were remained unable to respond. The
mean value is obtained 3.74 which shows that majority of
students agree with this statement. And standard deviation
is 1.030 shows the response of the respondents.

Table 4.29
Sitting facility at library
Frequency Percent Mean S.D
Highly
Dissatisfied4 .8
Dissatisfied 41 8.5
Neutral 130 27.1 3.68 .856
Satisfied 235 49.0
Highly
Satisfied70 14.6
Total 480 100.0
Above table describes that 63% students were agreed
that Sitting facility at library, 8% were disagreed with the
statement and 27% were remained unable to respond. The mean
value is obtained 3.68 which shows that majority of students
agree with this statement. And standard deviation is .856
shows the response of the respondents.

Table 4.30
Library timings
Frequency Percent Mean S.D
Highly
Dissatisfied8 1.7
Dissatisfied 42 8.8
Neutral 124 25.8
Satisfied 238 49.6 3.66 .886
Highly
Satisfied68 14.2
Total 480 100.0
Above table describes that 63% students were agreed
that Library timings, 9% were disagreed with the statement
and 25% were remained unable to respond. The mean value is
obtained 3.66 which shows that majority of students agree
with this statement. And standard deviation is .886 shows
the response of the respondents.
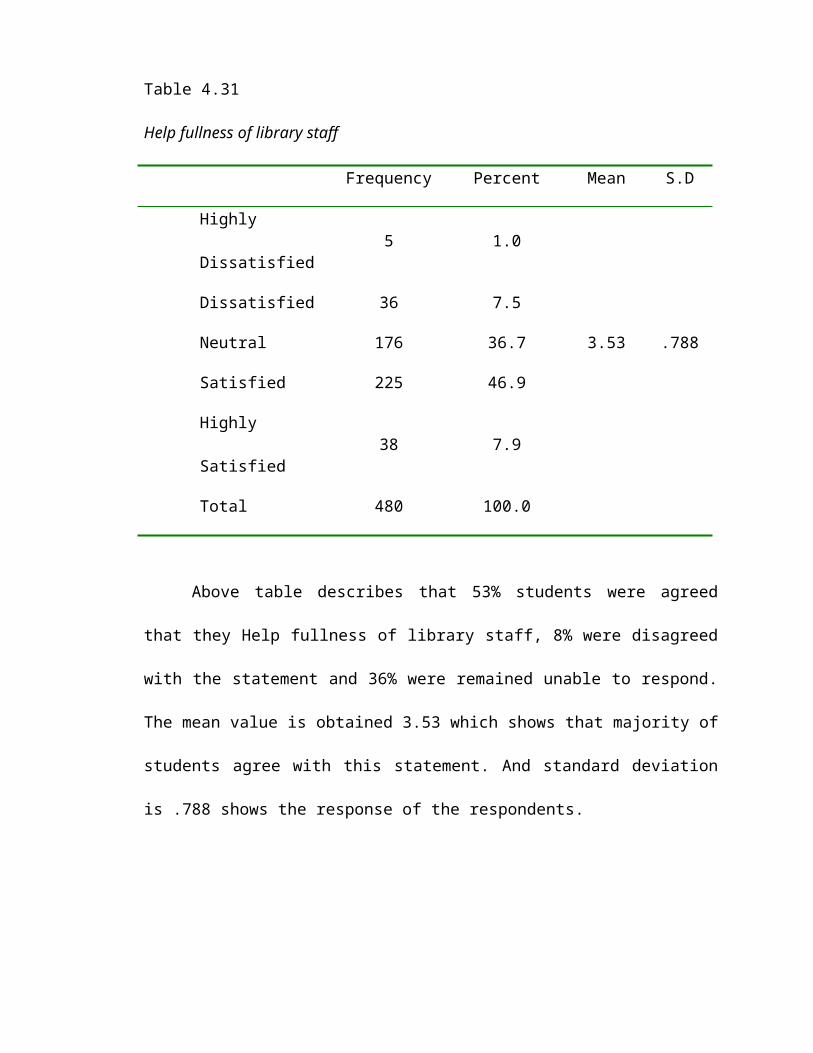
Table 4.31
Help fullness of library staff
Frequency Percent Mean S.D
Highly
Dissatisfied5 1.0
Dissatisfied 36 7.5
Neutral 176 36.7 3.53 .788
Satisfied 225 46.9
Highly
Satisfied38 7.9
Total 480 100.0
Above table describes that 53% students were agreed
that they Help fullness of library staff, 8% were disagreed
with the statement and 36% were remained unable to respond.
The mean value is obtained 3.53 which shows that majority of
students agree with this statement. And standard deviation
is .788 shows the response of the respondents.
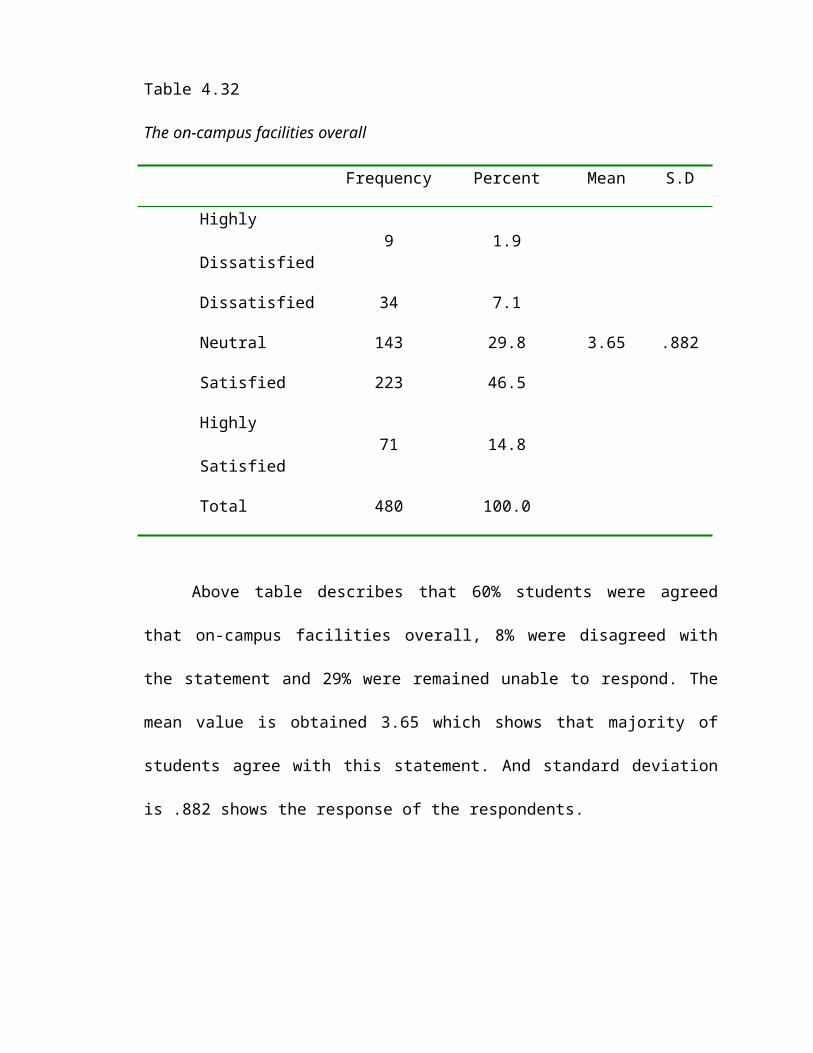
Table 4.32
The on-campus facilities overall
Frequency Percent Mean S.D
Highly
Dissatisfied9 1.9
Dissatisfied 34 7.1
Neutral 143 29.8 3.65 .882
Satisfied 223 46.5
Highly
Satisfied71 14.8
Total 480 100.0
Above table describes that 60% students were agreed
that on-campus facilities overall, 8% were disagreed with
the statement and 29% were remained unable to respond. The
mean value is obtained 3.65 which shows that majority of
students agree with this statement. And standard deviation
is .882 shows the response of the respondents.
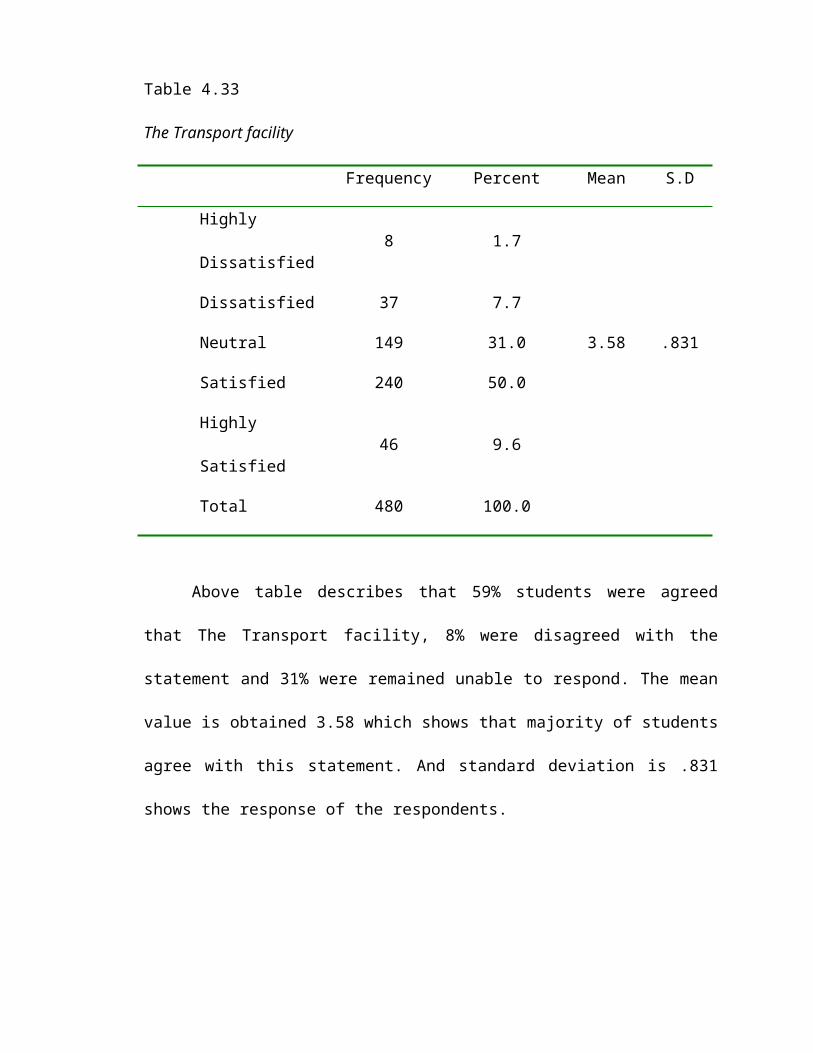
Table 4.33
The Transport facility
Frequency Percent Mean S.D
Highly
Dissatisfied8 1.7
Dissatisfied 37 7.7
Neutral 149 31.0 3.58 .831
Satisfied 240 50.0
Highly
Satisfied46 9.6
Total 480 100.0
Above table describes that 59% students were agreed
that The Transport facility, 8% were disagreed with the
statement and 31% were remained unable to respond. The mean
value is obtained 3.58 which shows that majority of students
agree with this statement. And standard deviation is .831
shows the response of the respondents.

Table 4.34
The Learning Resources Centre
Frequency Percent Mean S.D
Highly
Dissatisfied10 2.1
Dissatisfied 39 8.1
Neutral 71 14.8 3.70 .801
Satisfied 326 67.9
Highly
Satisfied34 7.1
Total 480 100.0
Above table describes that 74% students were agreed
that Learning Resources Centre, 10% were disagreed with the
statement and 14% were remained unable to respond. The mean
value is obtained 3.70 which shows that majority of students
agree with this statement. And standard deviation is .801
shows the response of the respondents.
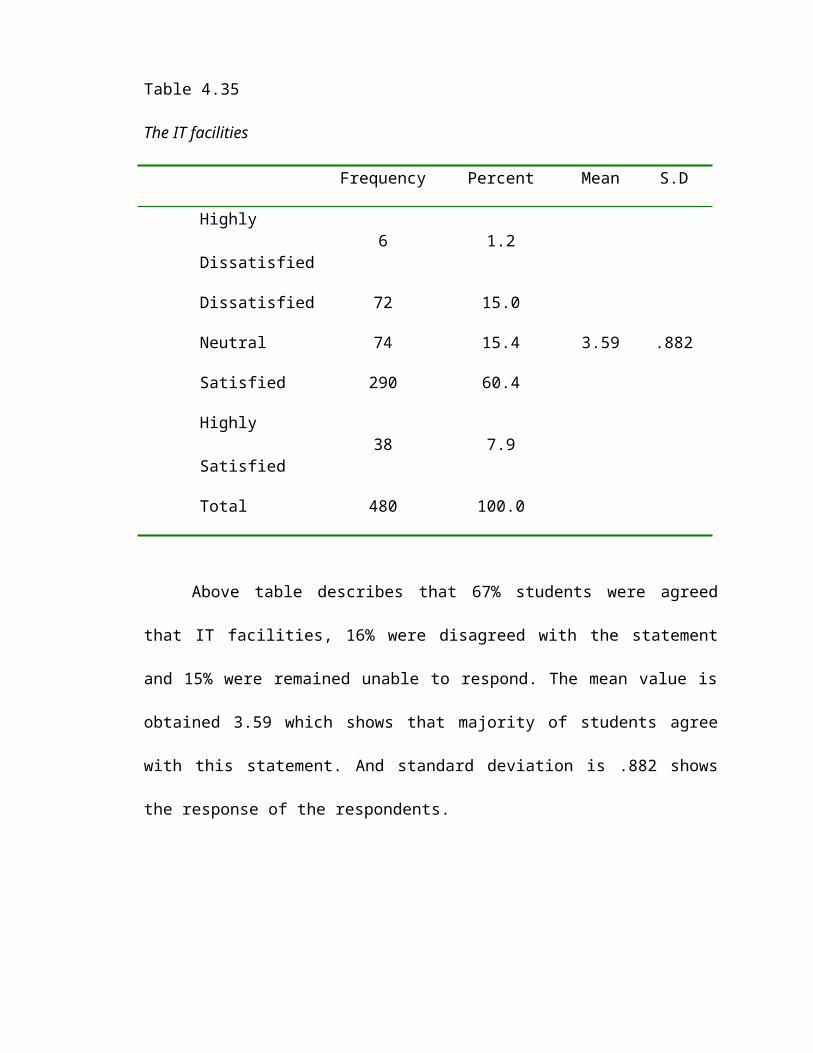
Table 4.35
The IT facilities
Frequency Percent Mean S.D
Highly
Dissatisfied6 1.2
Dissatisfied 72 15.0
Neutral 74 15.4 3.59 .882
Satisfied 290 60.4
Highly
Satisfied38 7.9
Total 480 100.0
Above table describes that 67% students were agreed
that IT facilities, 16% were disagreed with the statement
and 15% were remained unable to respond. The mean value is
obtained 3.59 which shows that majority of students agree
with this statement. And standard deviation is .882 shows
the response of the respondents.

Table 4.36
Computer lab facility
Frequency Percent Mean S.D
Highly
Dissatisfied5 1.0
Dissatisfied 40 8.3
Neutral 91 19.0 3.78 .861
Satisfied 262 54.6
Highly
Satisfied82 17.1
Total 480 100.0
Above table describes that 71% students were agreed
that Computer lab facility, 9% were disagreed with the
statement and 19% were remained unable to respond. The mean
value is obtained 3.78 which shows that majority of students
agree with this statement. And standard deviation is .861
shows the response of the respondents.

Table 4.37
Wi-fi/ internet facility
Frequency Percent Mean S.D
Highly
Dissatisfied9 1.9
Dissatisfied 45 9.4
Neutral 61 12.7 3.80 .895
Satisfied 284 59.2
Highly
Satisfied81 16.9
Total 480 100.0
Above table describes that 75% students were agreed
that Wi-fi/internet facility, 10% were disagreed with the
statement and 12% were remained unable to respond. The mean
value is obtained 3.80 which shows that majority of students
agree with this statement. And standard deviation is .895
shows the response of the respondents.

Table 4.38
The toilet facilities overall
Frequency Percent Mean S.D
Highly
Dissatisfied10 2.1
Dissatisfied 102 21.2
Neutral 59 12.3 3.68 1.163
Satisfied 169 35.2
Highly
Satisfied140 29.2
Total 480 100.0
Above table describes that 64% students were agreed
that toilet facilities overall, 23% were disagreed with the
statement and 12% were remained unable to respond. The mean
value is obtained 3.68 which shows that majority of students
agree with this statement. And standard deviation is 1.163
shows the response of the respondents.

Table 4.39
The recreational facilities overall
Frequency Percent Mean S.D
Highly
Dissatisfied11 2.3
Dissatisfied 42 8.8
Neutral 76 15.8 3.86 .981
Satisfied 224 46.7
Highly
Satisfied127 26.5
Total 480 100.0
Above table describes that 72% students were agreed
that recreational facilities overall, 10% were disagreed
with the statement and 15% were remained unable to respond.
The mean value is obtained 3.86 which shows that majority of
students agree with this statement. And standard deviation
is .981 shows the response of the respondents.

Table 4.40
The availability of parking
Frequency Percent Mean S.D
Highly
Dissatisfied9 1.9
Dissatisfied 46 9.6
Neutral 106 22.1 3.79 .992
Satisfied 197 41.0
Highly
Satisfied122 25.4
Total 480 100.0
Above table describes that 66% students were agreed
that availability of parking, 10% were disagreed with the
statement and 22% were remained unable to respond. The mean
value is obtained 3.79 which shows that majority of students
agree with this statement. And standard deviation is .992
shows the response of the respondents.
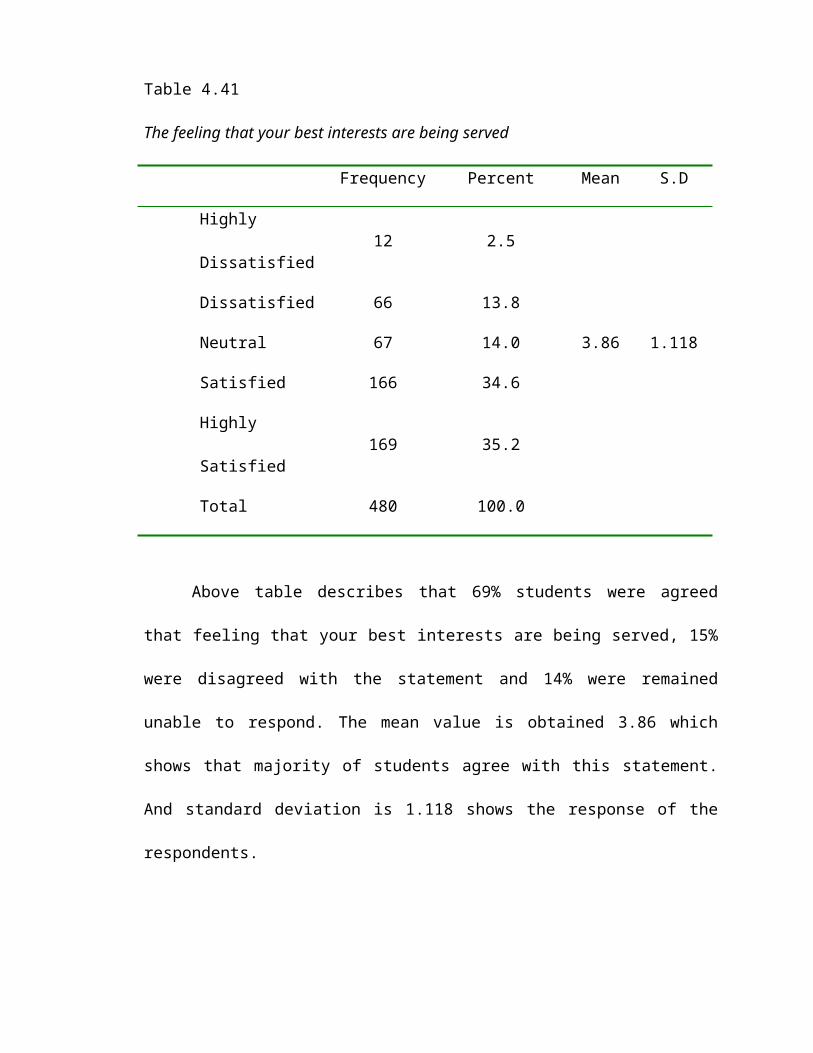
Table 4.41
The feeling that your best interests are being served
Frequency Percent Mean S.D
Highly
Dissatisfied12 2.5
Dissatisfied 66 13.8
Neutral 67 14.0 3.86 1.118
Satisfied 166 34.6
Highly
Satisfied169 35.2
Total 480 100.0
Above table describes that 69% students were agreed
that feeling that your best interests are being served, 15%
were disagreed with the statement and 14% were remained
unable to respond. The mean value is obtained 3.86 which
shows that majority of students agree with this statement.
And standard deviation is 1.118 shows the response of the
respondents.

Table 4.42
The helpfulness of technical staff
Frequency Percent Mean S.D
Highly
Dissatisfied7 1.5
Dissatisfied 42 8.8
Neutral 92 19.2 3.79 .908
Satisfied 245 51.0
Highly
Satisfied94 19.6
Total 480 100.0
Above table describes that 70% students were agreed
that helpfulness of technical staff, 9% were disagreed with
the statement and 19% were remained unable to respond. The
mean value is obtained 3.79 which shows that majority of
students agree with this statement. And standard deviation
is .908 shows the response of the respondents.
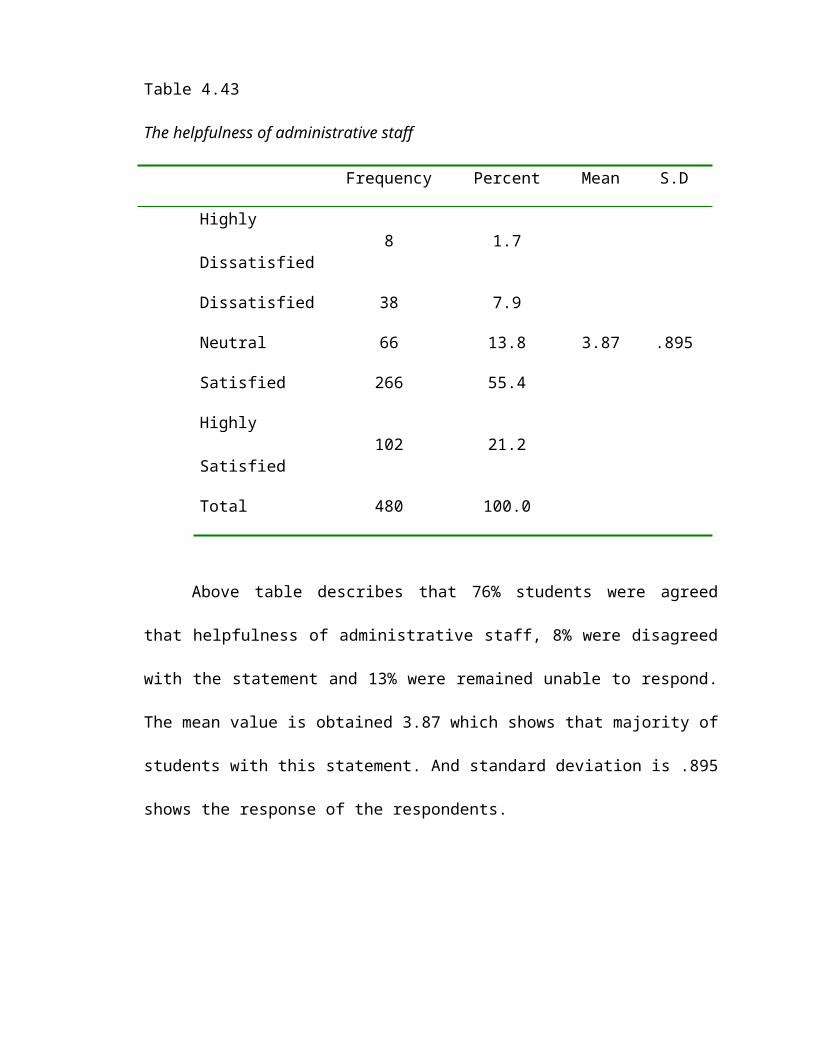
Table 4.43
The helpfulness of administrative staff
Frequency Percent Mean S.D
Highly
Dissatisfied8 1.7
Dissatisfied 38 7.9
Neutral 66 13.8 3.87 .895
Satisfied 266 55.4
Highly
Satisfied102 21.2
Total 480 100.0
Above table describes that 76% students were agreed
that helpfulness of administrative staff, 8% were disagreed
with the statement and 13% were remained unable to respond.
The mean value is obtained 3.87 which shows that majority of
students with this statement. And standard deviation is .895
shows the response of the respondents.

Table 4.44
Extracurricular activities
Frequency Percent Mean S.D
Highly
Dissatisfied10 2.1
Dissatisfied 41 8.5
Neutral 67 14.0 3.93 .985
Satisfied 216 45.0
Highly
Satisfied146 30.4
Total 480 100.0
Above table describes that 75% students were agreed
that Extracurricular activities, 10% were disagreed with the
statement and 14% were remained unable to respond. The mean
value is obtained 3.94 which shows that majority of students
agree with this statement. And standard deviation is .985
shows the response of the respondents.

Table 4.45
The level/difficulty of subject content
Frequency Percent Mean S.D
Highly
Dissatisfied6 1.2
Dissatisfied 33 6.9
Neutral 69 14.4 3.77 .751
Satisfied 331 69.0
Highly
Satisfied41 8.5
Total 480 100.0
Above table describes that 77% students were agreed
that level/difficulty of subject content, 7% were disagreed
with the statement and 14% were remained unable to respond.
The mean value is obtained 3.77 which shows that majority of
students agree with this statement. And standard deviation
is .751 shows the response of the respondents.
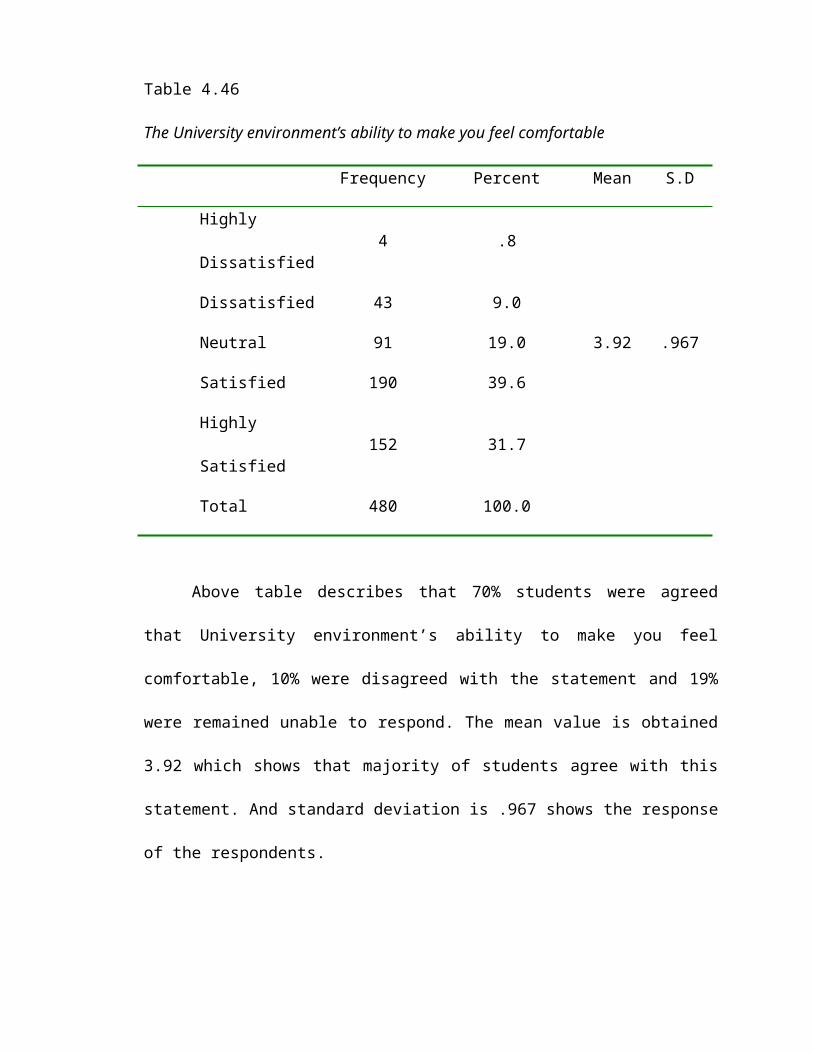
Table 4.46
The University environment’s ability to make you feel comfortable
Frequency Percent Mean S.D
Highly
Dissatisfied4 .8
Dissatisfied 43 9.0
Neutral 91 19.0 3.92 .967
Satisfied 190 39.6
Highly
Satisfied152 31.7
Total 480 100.0
Above table describes that 70% students were agreed
that University environment’s ability to make you feel
comfortable, 10% were disagreed with the statement and 19%
were remained unable to respond. The mean value is obtained
3.92 which shows that majority of students agree with this
statement. And standard deviation is .967 shows the response
of the respondents.
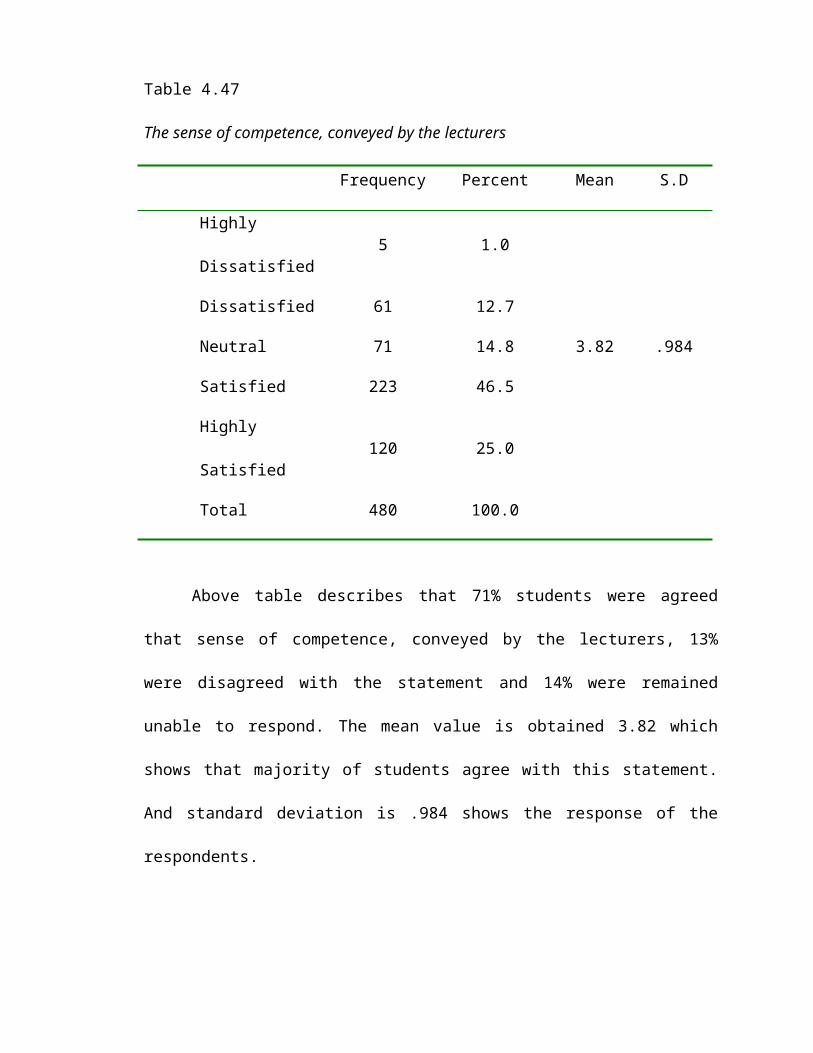
Table 4.47
The sense of competence, conveyed by the lecturers
Frequency Percent Mean S.D
Highly
Dissatisfied5 1.0
Dissatisfied 61 12.7
Neutral 71 14.8 3.82 .984
Satisfied 223 46.5
Highly
Satisfied120 25.0
Total 480 100.0
Above table describes that 71% students were agreed
that sense of competence, conveyed by the lecturers, 13%
were disagreed with the statement and 14% were remained
unable to respond. The mean value is obtained 3.82 which
shows that majority of students agree with this statement.
And standard deviation is .984 shows the response of the
respondents.

Table 4.48
On campus security
Frequency Percent Mean S.D
Highly
Dissatisfied10 2.1
Dissatisfied 34 7.1
Neutral 89 18.5 3.88 .954
Satisfied 219 45.6
Highly
Satisfied128 26.7
Total 480 100.0
Above table describes that 71% students were agreed
that On campus security, 9% were disagreed with the
statement and 18% were remained unable to respond. The mean
value is obtained 3.88 which shows that majority of students
agree with this statement. And standard deviation is .954
shows the response of the respondents.

Table 4.49
Health/hygiene facility
Frequency Percent Mean S.D
Highly
Dissatisfied6 1.2
Dissatisfied 35 7.3
Neutral 78 16.2 3.85 .860
Satisfied 268 55.8
Highly
Satisfied93 19.4
Total 480 100.0
Above table describes that 74% students were agreed
that Health/hygiene facility, 8% were disagreed with the
statement and 16% were remained unable to respond. The mean
value is obtained 3.85 which shows that majority of students
agree with this statement. And standard deviation is .860
shows the response of the respondents.
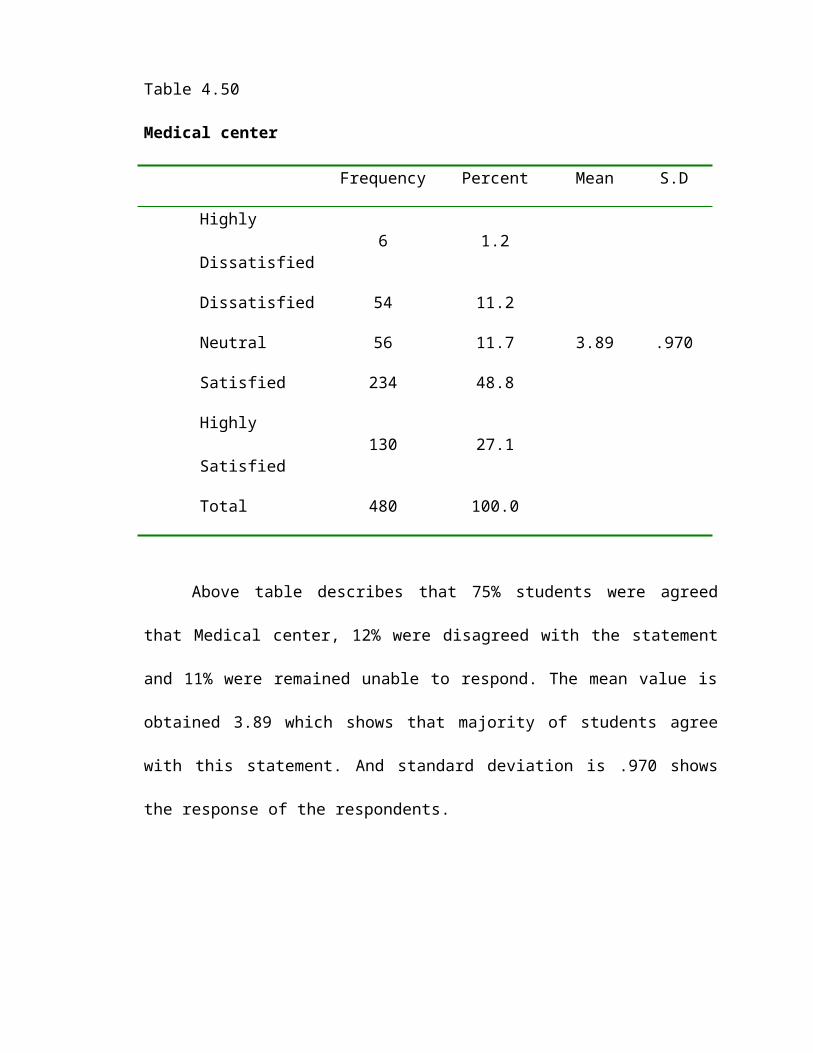
Table 4.50
Medical center
Frequency Percent Mean S.D
Highly
Dissatisfied6 1.2
Dissatisfied 54 11.2
Neutral 56 11.7 3.89 .970
Satisfied 234 48.8
Highly
Satisfied130 27.1
Total 480 100.0
Above table describes that 75% students were agreed
that Medical center, 12% were disagreed with the statement
and 11% were remained unable to respond. The mean value is
obtained 3.89 which shows that majority of students agree
with this statement. And standard deviation is .970 shows
the response of the respondents.
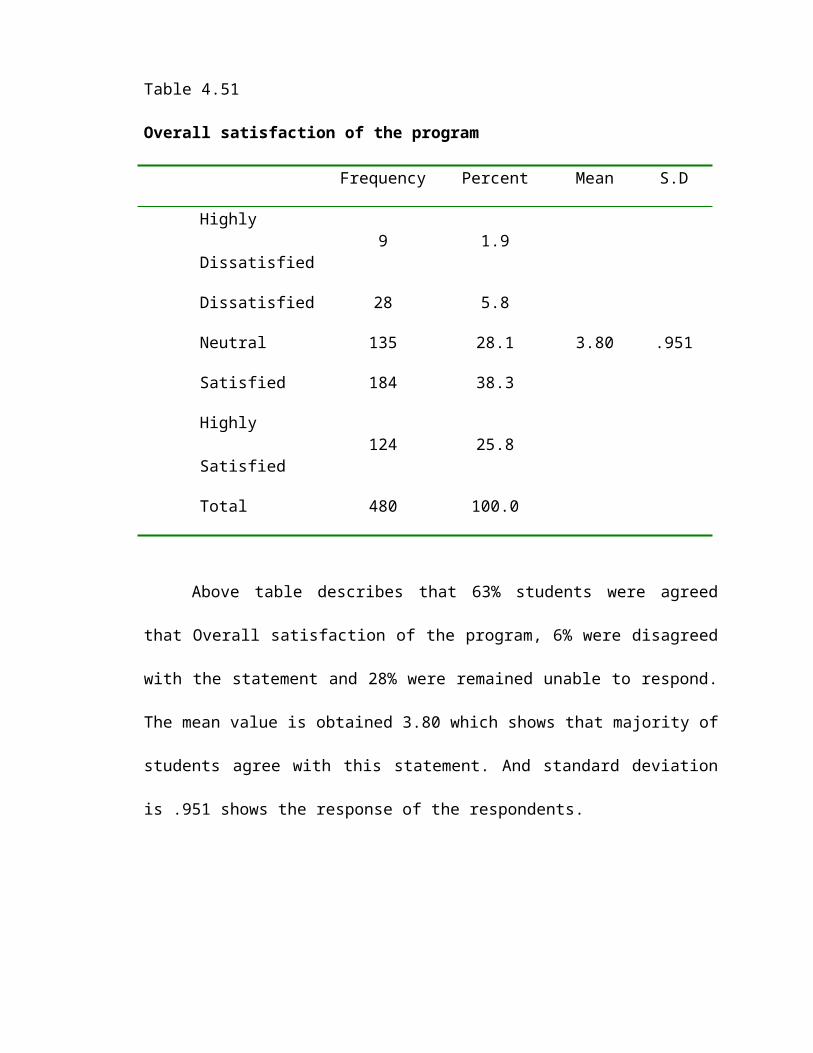
Table 4.51
Overall satisfaction of the program
Frequency Percent Mean S.D
Highly
Dissatisfied9 1.9
Dissatisfied 28 5.8
Neutral 135 28.1 3.80 .951
Satisfied 184 38.3
Highly
Satisfied124 25.8
Total 480 100.0
Above table describes that 63% students were agreed
that Overall satisfaction of the program, 6% were disagreed
with the statement and 28% were remained unable to respond.
The mean value is obtained 3.80 which shows that majority of
students agree with this statement. And standard deviation
is .951 shows the response of the respondents.
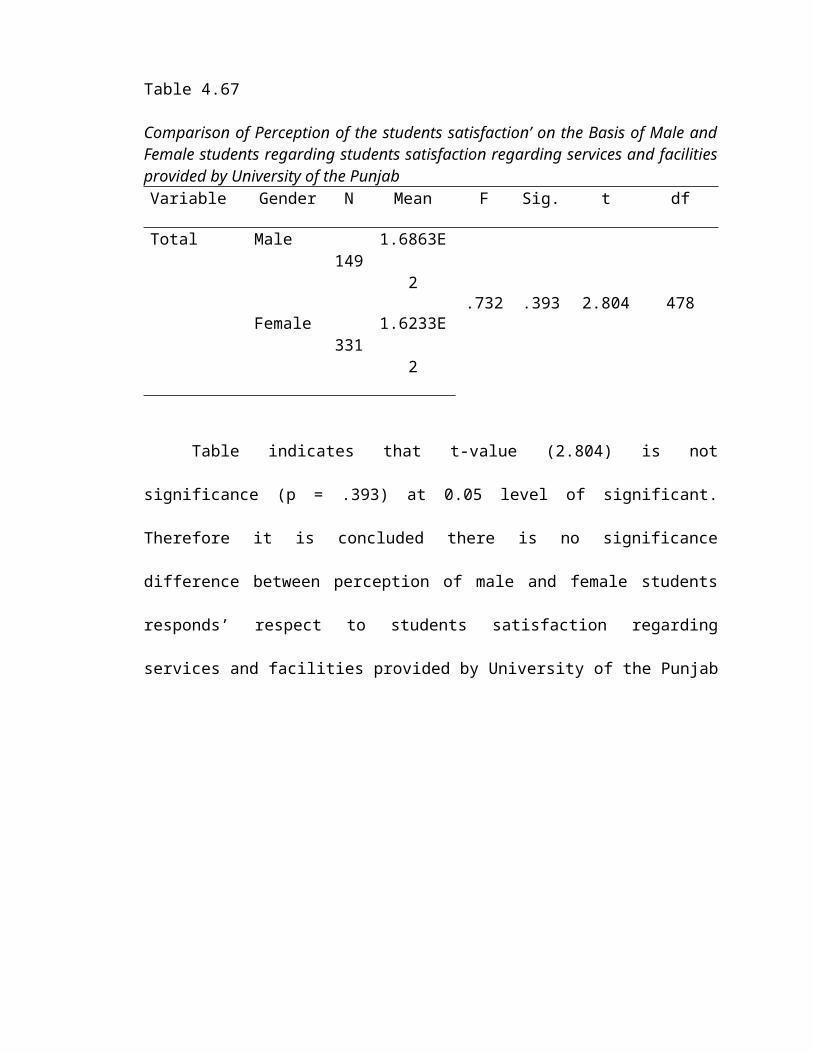
Table 4.67
Comparison of Perception of the students satisfaction’ on the Basis of Male andFemale students regarding students satisfaction regarding services and facilitiesprovided by University of the Punjab Variable Gender N Mean F Sig. t df
Total Male149
1.6863E
2.732 .393 2.804 478
Female331
1.6233E
2
Table indicates that t-value (2.804) is not
significance (p = .393) at 0.05 level of significant.
Therefore it is concluded there is no significance
difference between perception of male and female students
responds’ respect to students satisfaction regarding
services and facilities provided by University of the Punjab
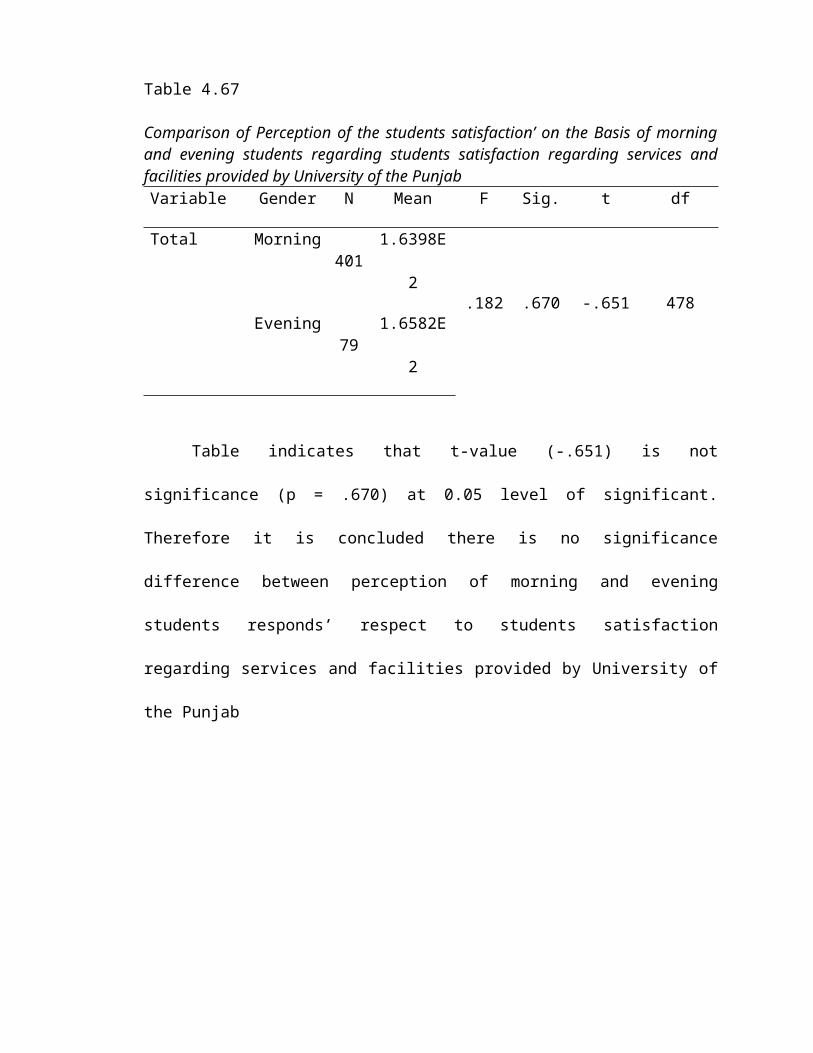
Table 4.67
Comparison of Perception of the students satisfaction’ on the Basis of morningand evening students regarding students satisfaction regarding services andfacilities provided by University of the PunjabVariable Gender N Mean F Sig. t df
Total Morning401
1.6398E
2.182 .670 -.651 478
Evening79
1.6582E
2
Table indicates that t-value (-.651) is not
significance (p = .670) at 0.05 level of significant.
Therefore it is concluded there is no significance
difference between perception of morning and evening
students responds’ respect to students satisfaction
regarding services and facilities provided by University of
the Punjab
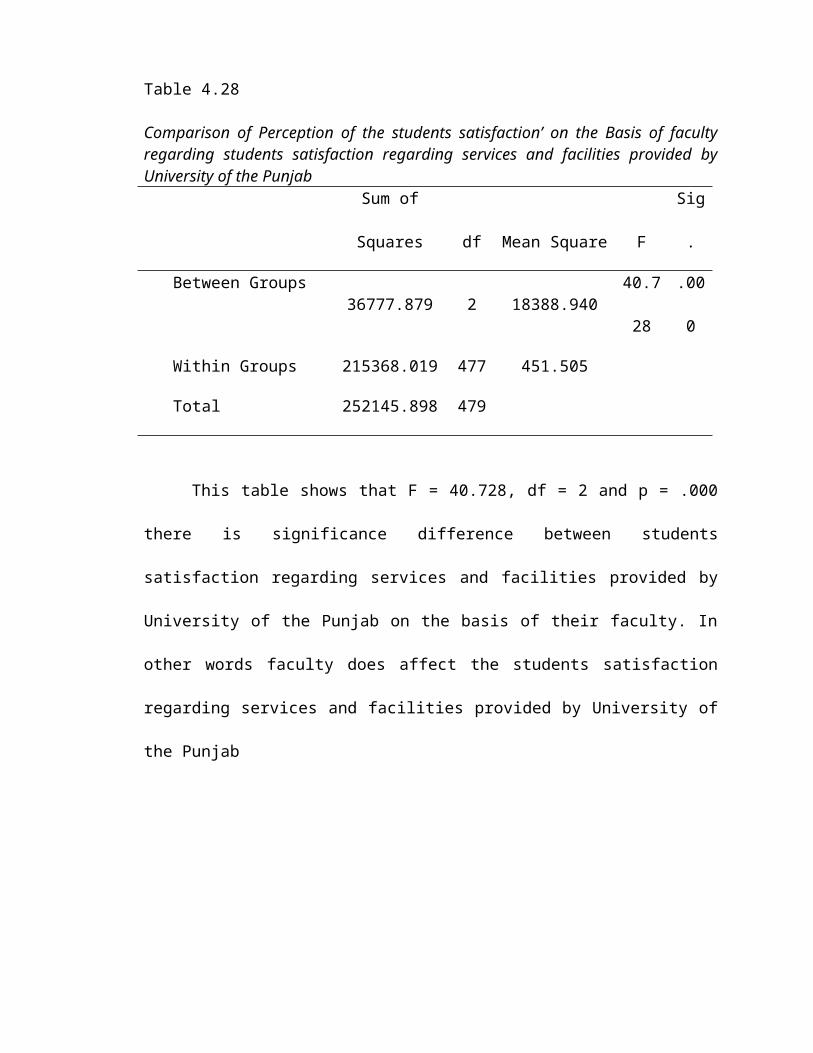
Table 4.28
Comparison of Perception of the students satisfaction’ on the Basis of facultyregarding students satisfaction regarding services and facilities provided byUniversity of the Punjab
Sum of
Squares df Mean Square F
Sig
.
Between Groups36777.879 2 18388.940
40.7
28
.00
0
Within Groups 215368.019 477 451.505
Total 252145.898 479
This table shows that F = 40.728, df = 2 and p = .000
there is significance difference between students
satisfaction regarding services and facilities provided by
University of the Punjab on the basis of their faculty. In
other words faculty does affect the students satisfaction
regarding services and facilities provided by University of
the Punjab
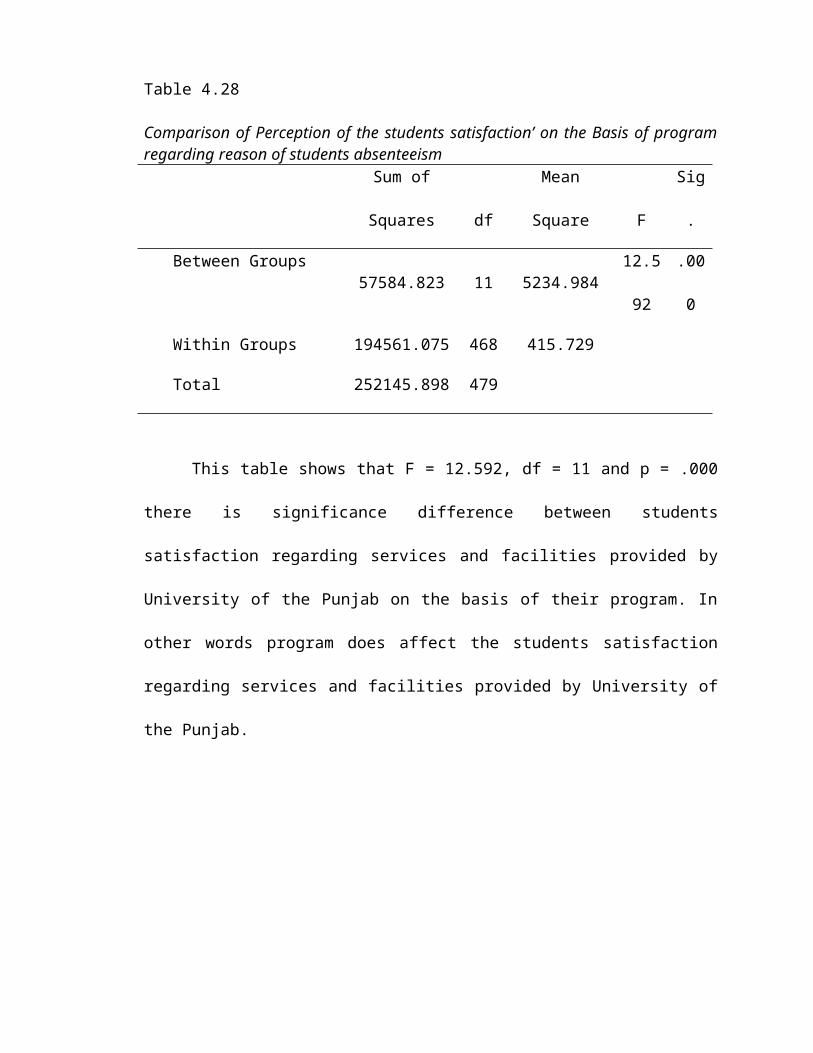
Table 4.28
Comparison of Perception of the students satisfaction’ on the Basis of programregarding reason of students absenteeism
Sum of
Squares df
Mean
Square F
Sig
.
Between Groups57584.823 11 5234.984
12.5
92
.00
0
Within Groups 194561.075 468 415.729
Total 252145.898 479
This table shows that F = 12.592, df = 11 and p = .000
there is significance difference between students
satisfaction regarding services and facilities provided by
University of the Punjab on the basis of their program. In
other words program does affect the students satisfaction
regarding services and facilities provided by University of
the Punjab.
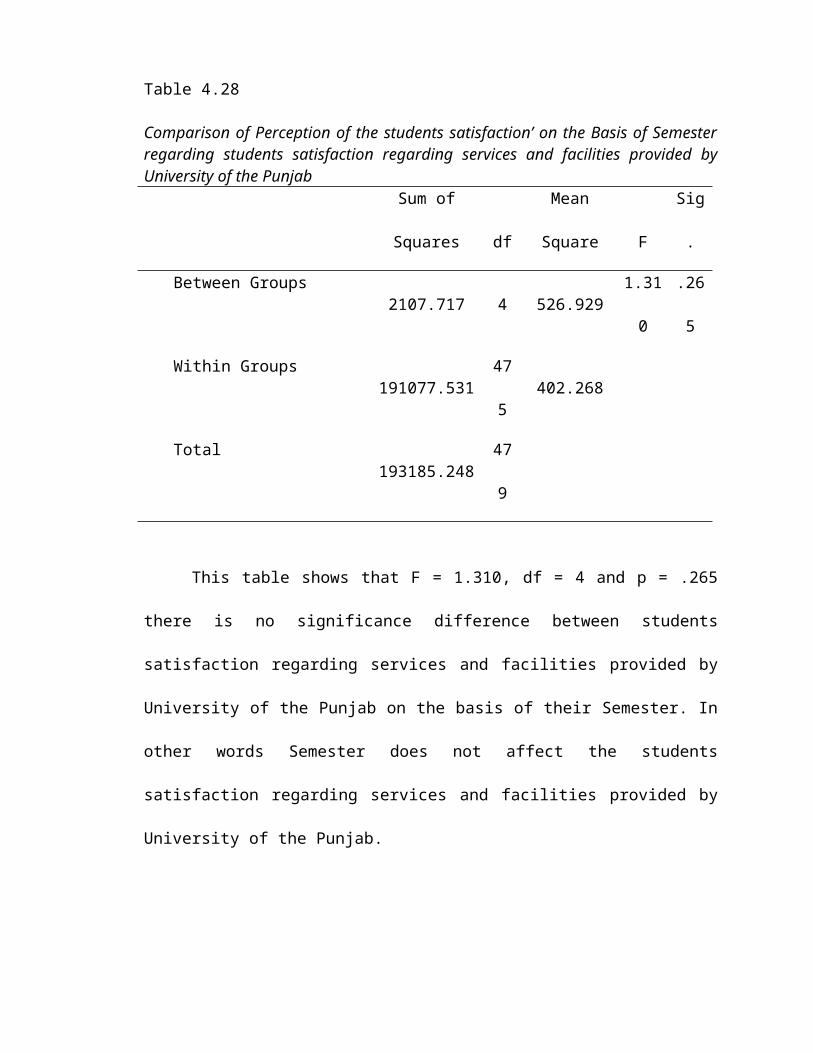
Table 4.28
Comparison of Perception of the students satisfaction’ on the Basis of Semesterregarding students satisfaction regarding services and facilities provided byUniversity of the Punjab
Sum of
Squares df
Mean
Square F
Sig
.
Between Groups2107.717 4 526.929
1.31
0
.26
5
Within Groups191077.531
47
5402.268
Total193185.248
47
9
This table shows that F = 1.310, df = 4 and p = .265
there is no significance difference between students
satisfaction regarding services and facilities provided by
University of the Punjab on the basis of their Semester. In
other words Semester does not affect the students
satisfaction regarding services and facilities provided by
University of the Punjab.
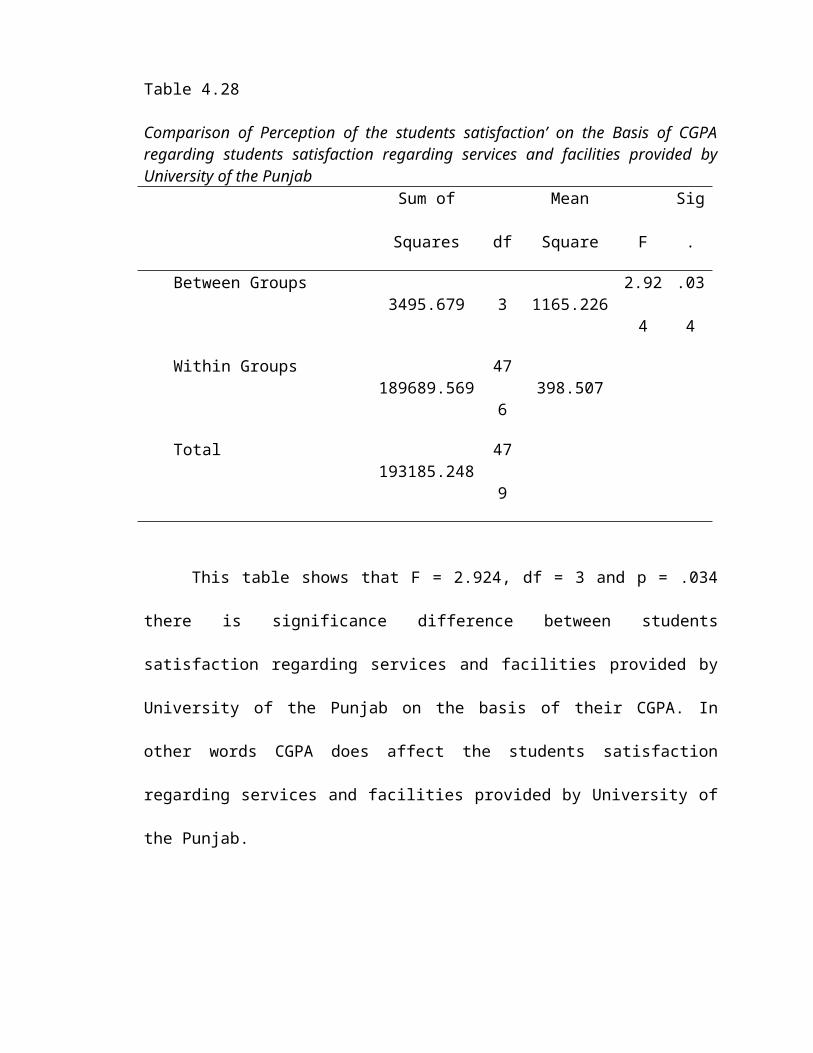
Table 4.28
Comparison of Perception of the students satisfaction’ on the Basis of CGPAregarding students satisfaction regarding services and facilities provided byUniversity of the Punjab
Sum of
Squares df
Mean
Square F
Sig
.
Between Groups3495.679 3 1165.226
2.92
4
.03
4
Within Groups189689.569
47
6398.507
Total193185.248
47
9
This table shows that F = 2.924, df = 3 and p = .034
there is significance difference between students
satisfaction regarding services and facilities provided by
University of the Punjab on the basis of their CGPA. In
other words CGPA does affect the students satisfaction
regarding services and facilities provided by University of
the Punjab.
CHAPTER V
Summary, Findings, Conclusion and Recommendations
Summary
This study was aimed at exploring satisfaction of the Master
degree students regarding facilities and services provided
by the university of the Punjab. The researcher used
quantitative research and descriptive method for this study.
University of the Punjab was selected as a population..
There are total thirteen faculties of P.U. Data was
collected from three faculties.
These faculties also divide into certain degree programmes.
Then further divided these degree programs in seniors and
juniors. Three main faculties were taken and those were
faculty of Education, faculty of quality and tech
management, faculty of gender studies. These faculties were
chosen for data collection on the bases of convenient
sampling.
In this research, total sample size was four hundred and
eighty. Cluster sampling technique was used for sampling.
Stu . Questionnaire was used as an instrument in this
research. After studying different articles and online
available questionnaires about students satisfaction,
questionnaire was developed. For literature review,
researchers have studied many books, articles, research
papers and conference papers. Through questionnaire data was
collected for this research. Data was analyzed through
SPSS17 and analysis of data was presented in tables. The
result of each table was interpreted. Researcher applied
independent sample t test and ANOVA test and also analyzed
frequency, percentage and Mean for Data.
This chapter provides conclusions and recommendations on the
basis of findings, sets out some significant findings in
relation to the research objectives and describes
suggestions and implications for future research.
Findings
1. The result found that 50% students were agreed that The
teaching and learning equipment. The mean value is
obtained 3.25 which shows that majority of students
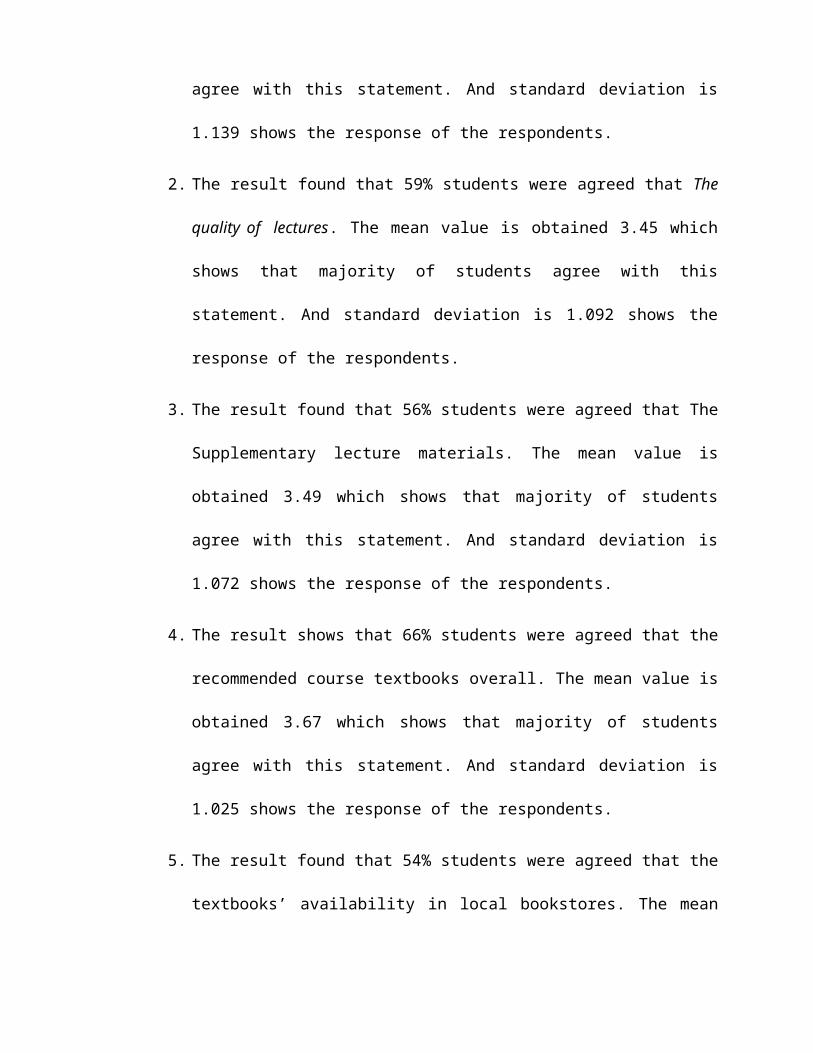
agree with this statement. And standard deviation is
1.139 shows the response of the respondents.
2. The result found that 59% students were agreed that The
quality of lectures. The mean value is obtained 3.45 which
shows that majority of students agree with this
statement. And standard deviation is 1.092 shows the
response of the respondents.
3. The result found that 56% students were agreed that The
Supplementary lecture materials. The mean value is
obtained 3.49 which shows that majority of students
agree with this statement. And standard deviation is
1.072 shows the response of the respondents.
4. The result shows that 66% students were agreed that the
recommended course textbooks overall. The mean value is
obtained 3.67 which shows that majority of students
agree with this statement. And standard deviation is
1.025 shows the response of the respondents.
5. The result found that 54% students were agreed that the
textbooks’ availability in local bookstores. The mean
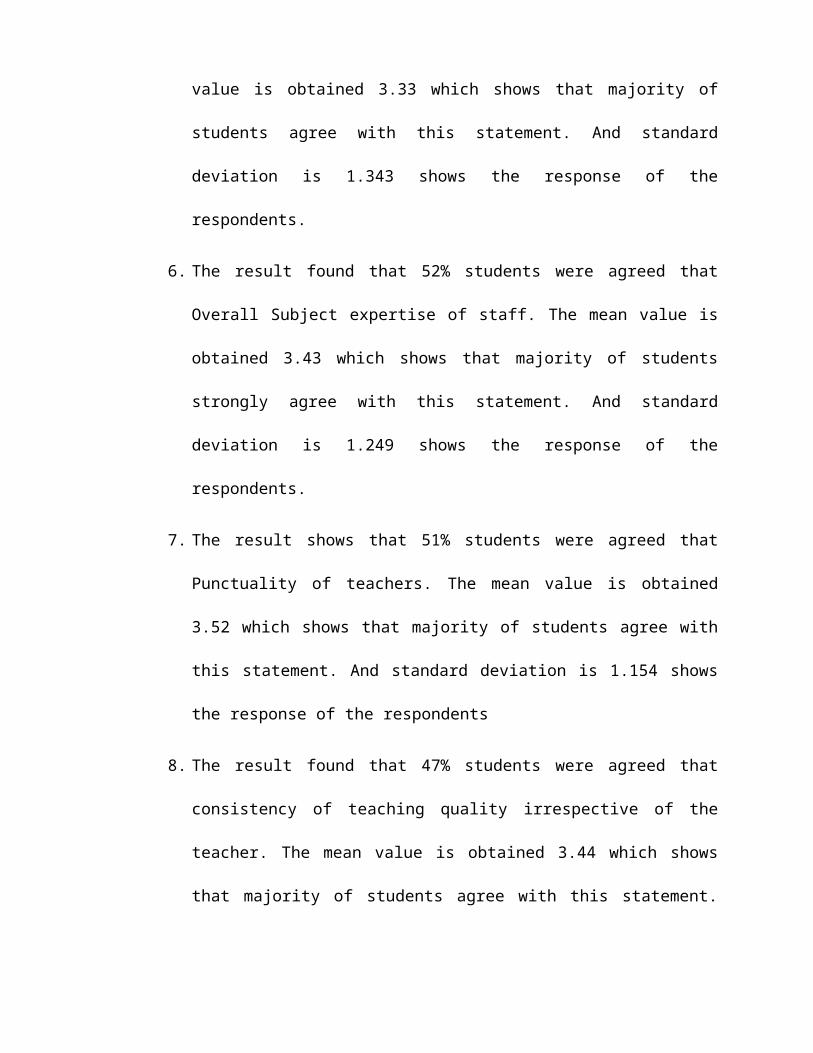
value is obtained 3.33 which shows that majority of
students agree with this statement. And standard
deviation is 1.343 shows the response of the
respondents.
6. The result found that 52% students were agreed that
Overall Subject expertise of staff. The mean value is
obtained 3.43 which shows that majority of students
strongly agree with this statement. And standard
deviation is 1.249 shows the response of the
respondents.
7. The result shows that 51% students were agreed that
Punctuality of teachers. The mean value is obtained
3.52 which shows that majority of students agree with
this statement. And standard deviation is 1.154 shows
the response of the respondents
8. The result found that 47% students were agreed that
consistency of teaching quality irrespective of the
teacher. The mean value is obtained 3.44 which shows
that majority of students agree with this statement.
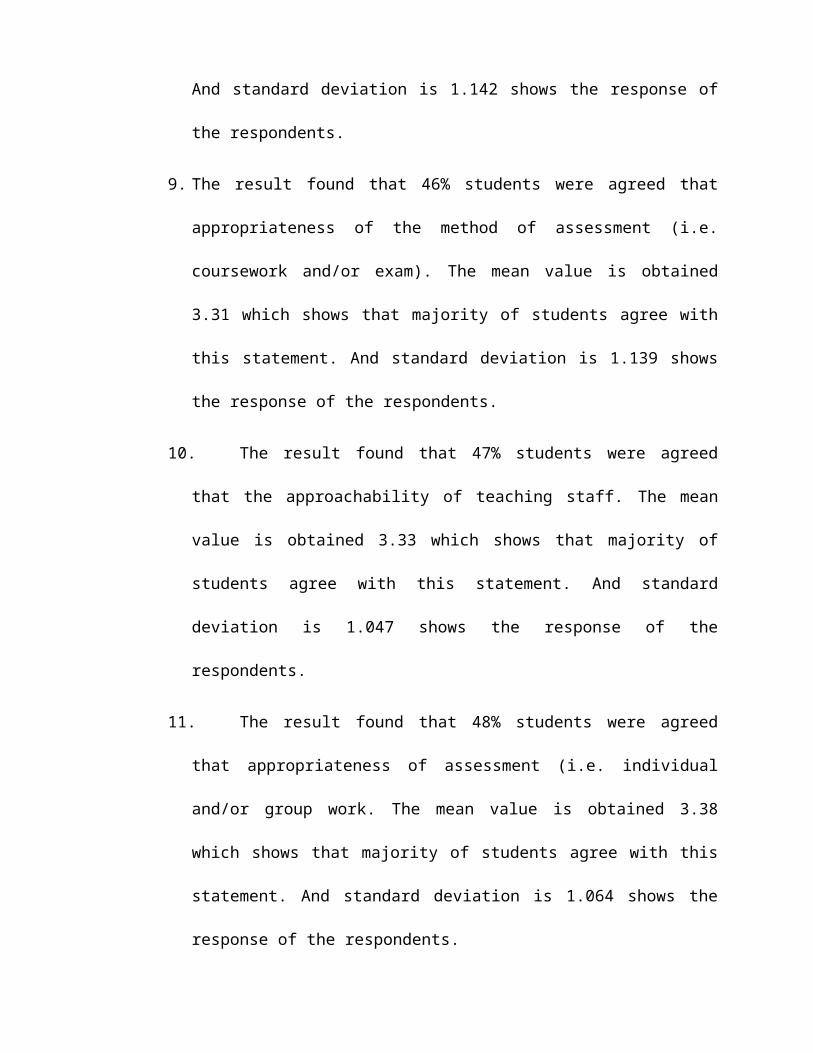
And standard deviation is 1.142 shows the response of
the respondents.
9. The result found that 46% students were agreed that
appropriateness of the method of assessment (i.e.
coursework and/or exam). The mean value is obtained
3.31 which shows that majority of students agree with
this statement. And standard deviation is 1.139 shows
the response of the respondents.
10. The result found that 47% students were agreed
that the approachability of teaching staff. The mean
value is obtained 3.33 which shows that majority of
students agree with this statement. And standard
deviation is 1.047 shows the response of the
respondents.
11. The result found that 48% students were agreed
that appropriateness of assessment (i.e. individual
and/or group work. The mean value is obtained 3.38
which shows that majority of students agree with this
statement. And standard deviation is 1.064 shows the
response of the respondents.
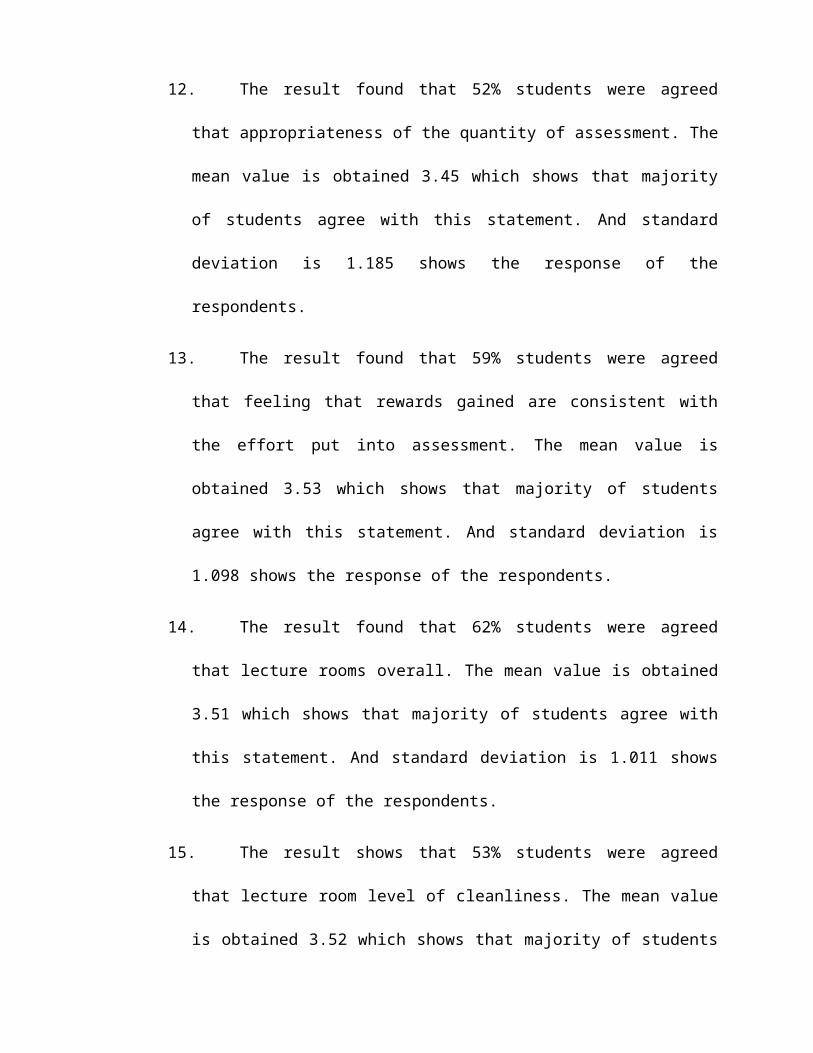
12. The result found that 52% students were agreed
that appropriateness of the quantity of assessment. The
mean value is obtained 3.45 which shows that majority
of students agree with this statement. And standard
deviation is 1.185 shows the response of the
respondents.
13. The result found that 59% students were agreed
that feeling that rewards gained are consistent with
the effort put into assessment. The mean value is
obtained 3.53 which shows that majority of students
agree with this statement. And standard deviation is
1.098 shows the response of the respondents.
14. The result found that 62% students were agreed
that lecture rooms overall. The mean value is obtained
3.51 which shows that majority of students agree with
this statement. And standard deviation is 1.011 shows
the response of the respondents.
15. The result shows that 53% students were agreed
that lecture room level of cleanliness. The mean value
is obtained 3.52 which shows that majority of students
agree with this statement. And standard deviation
is .976 shows the response of the respondents.
16. The result found that 55% students were agreed
that lecture room layout. The mean value is obtained
3.48 which shows that majority of students agree with
this statement. And standard deviation is 1.197 shows
the response of the respondents.
17. The result found that 53% students were agreed
that lecture room equipment. The mean value is obtained
3.49 which shows that majority of students agree with
this statement. And standard deviation is .997 shows
the response of the respondents.
18. The result found that 66% students were agreed
that lecture room lighting. The mean value is obtained
3.78 which shows that majority of students agree with
this statement. And standard deviation is .948 shows
the response of the respondents.
19. The result found that 63% students were agreed
that Audio visual ads in lecture rooms. The mean value
is obtained 3.76 which shows that majority of students
agree with this statement. And standard deviation
is .912 shows the response of the respondents.
20. The result found that 74% students were agreed
that Library overall. The mean value is obtained 3.96
which shows that majority of students agree with this
statement. And standard deviation is .912 shows the
response of the respondents
21. The result found that 65% students were agreed
that Availability of study material in library. The
mean value is obtained 3.79 which shows that majority
of students agree with this statement. And standard
deviation is .941 shows the response of the
respondents.
22. The result found that 57% students were agreed
that Study environment at library. The mean value is
obtained 3.74 which shows that majority of students
agree with this statement. And standard deviation is
1.030 shows the response of the respondents.
23. The result found that 63% students were agreed
that Sitting facility at library. The mean value is
obtained 3.68 which shows that majority of students
agree with this statement. And standard deviation
is .856 shows the response of the respondents.
24. The result found that 63% students were agreed
that Library timings. The mean value is obtained 3.66
which shows that majority of students agree with this
statement. And standard deviation is .886 shows the
response of the respondents.
25. The result shows that 53% students were agreed
that they Help fullness of library staff. The mean
value is obtained 3.53 which shows that majority of
students agree with this statement. And standard
deviation is .788 shows the response of the
respondents.
26. The result found that 60% students were agreed
that on-campus facilities overall. The mean value is
obtained 3.65 which shows that majority of students
agree with this statement. And standard deviation
is .882 shows the response of the respondents.
27. The result found that 59% students were agreed
that The Transport facility. The mean value is obtained
3.58 which shows that majority of students agree with
this statement. And standard deviation is .831 shows
the response of the respondents
28. The result found that 74% students were agreed
that Learning Resources Centre. The mean value is
obtained 3.70 which shows that majority of students
agree with this statement. And standard deviation
is .801 shows the response of the respondents.
29. The result found that 67% students were agreed
that IT facilities. The mean value is obtained 3.59
which shows that majority of students agree with this
statement. And standard deviation is .882 shows the
response of the respondents.
30. The result found that 71% students were agreed
that Computer lab facility. The mean value is obtained
3.78 which shows that majority of students agree with
this statement. And standard deviation is .861 shows
the response of the respondents.
31. The result found that 75% students were agreed
that Wi-fi/internet facility. The mean value is
obtained 3.80 which shows that majority of students
agree with this statement. And standard deviation
is .895 shows the response of the respondents.
32. The result shows that 64% students were agreed
that toilet facilities overall. The mean value is
obtained 3.68 which shows that majority of students
agree with this statement. And standard deviation is
1.163 shows the response of the respondents.
33. The result found that 72% students were agreed
that recreational facilities overall. The mean value is
obtained 3.86 which shows that majority of students
agree with this statement. And standard deviation
is .981 shows the response of the respondents.
34. The result found that 66% students were agreed
that availability of parking. The mean value is
obtained 3.79 which shows that majority of students
agree with this statement. And standard deviation
is .992 shows the response of the respondents.
35. The result found that 69% students were agreed
that feeling that your best interests are being served.
The mean value is obtained 3.86 which shows that
majority of students agree with this statement. And
standard deviation is 1.118 shows the response of the
respondents.
36. The result found that 70% students were agreed
that helpfulness of technical staff. The mean value is
obtained 3.79 which shows that majority of students
agree with this statement. And standard deviation
is .908 shows the response of the respondents.
37. The result found that 76% students were agreed
that helpfulness of administrative staff. The mean
value is obtained 3.87 which show that majority of
students with this statement. And standard deviation is
.895 shows the response of the respondents.
38. The result found that 75% students were agreed
that Extracurricular activities. The mean value is
obtained 3.94 which shows that majority of students
agree with this statement. And standard deviation
is .985 shows the response of the respondents.
39. The result found that 77% students were agreed
that level/difficulty of subject content. The mean
value is obtained 3.77 which shows that majority of
students agree with this statement. And standard
deviation is .751 shows the response of the
respondents.
40. The result found that 70% students were agreed
that University environment’s ability to make you feel
comfortable. The mean value is obtained 3.92 which
shows that majority of students agree with this
statement. And standard deviation is .967 shows the
response of the respondents.
41. The result shows that 71% students were agreed
that sense of competence, conveyed by the lecturers.
The mean value is obtained 3.82 which shows that
majority of students agree with this statement. And
standard deviation is .984 shows the response of the
respondents.
42. The result found that 71% students were agreed
that on campus security. The mean value is obtained
3.88 which shows that majority of students agree with
this statement. And standard deviation is .954 shows
the response of the respondents.
43. The result found that 74% students were agreed
that Health/hygiene facility. The mean value is
obtained 3.85 which shows that majority of students
agree with this statement. And standard deviation
is .860 shows the response of the respondents.
44. The result found that 75% students were agreed
that Medical center. The mean value is obtained 3.89
which shows that majority of students agree with this
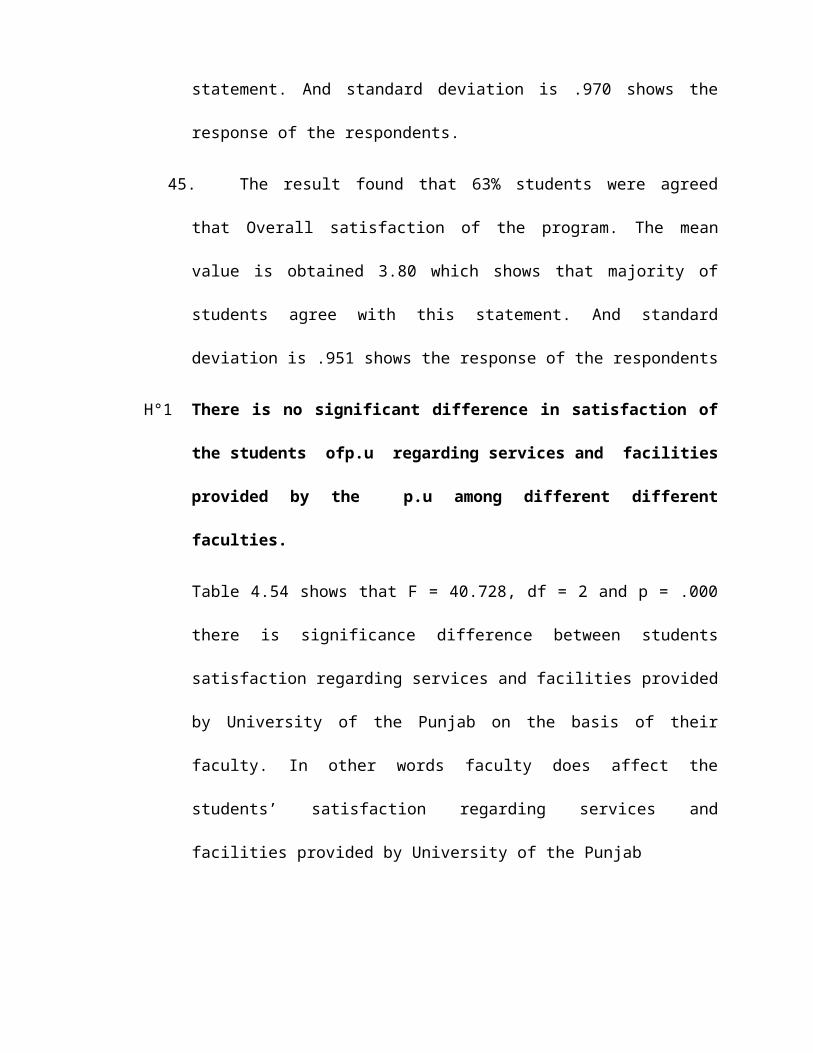
statement. And standard deviation is .970 shows the
response of the respondents.
45. The result found that 63% students were agreed
that Overall satisfaction of the program. The mean
value is obtained 3.80 which shows that majority of
students agree with this statement. And standard
deviation is .951 shows the response of the respondents
H°1 There is no significant difference in satisfaction of
the students ofp.u regarding services and facilities
provided by the p.u among different different
faculties.
Table 4.54 shows that F = 40.728, df = 2 and p = .000
there is significance difference between students
satisfaction regarding services and facilities provided
by University of the Punjab on the basis of their
faculty. In other words faculty does affect the
students’ satisfaction regarding services and
facilities provided by University of the Punjab
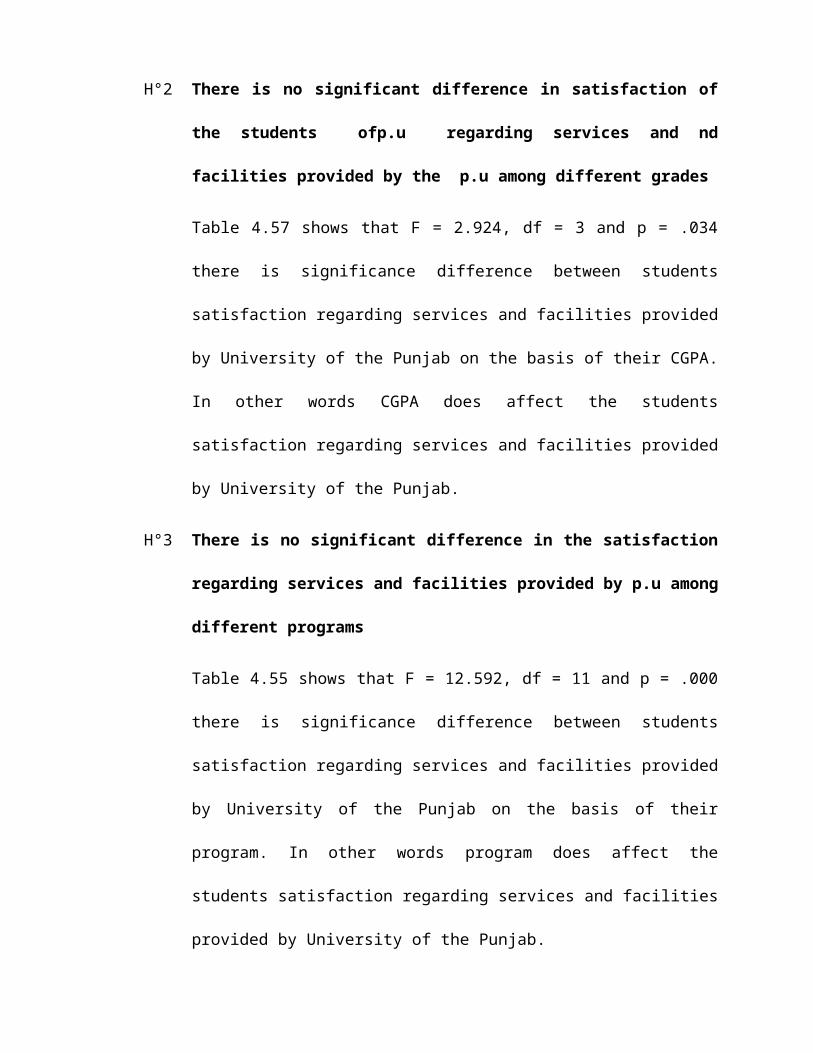
H°2 There is no significant difference in satisfaction of
the students ofp.u regarding services and nd
facilities provided by the p.u among different grades
Table 4.57 shows that F = 2.924, df = 3 and p = .034
there is significance difference between students
satisfaction regarding services and facilities provided
by University of the Punjab on the basis of their CGPA.
In other words CGPA does affect the students
satisfaction regarding services and facilities provided
by University of the Punjab.
H°3 There is no significant difference in the satisfaction
regarding services and facilities provided by p.u among
different programs
Table 4.55 shows that F = 12.592, df = 11 and p = .000
there is significance difference between students
satisfaction regarding services and facilities provided
by University of the Punjab on the basis of their
program. In other words program does affect the
students satisfaction regarding services and facilities
provided by University of the Punjab.
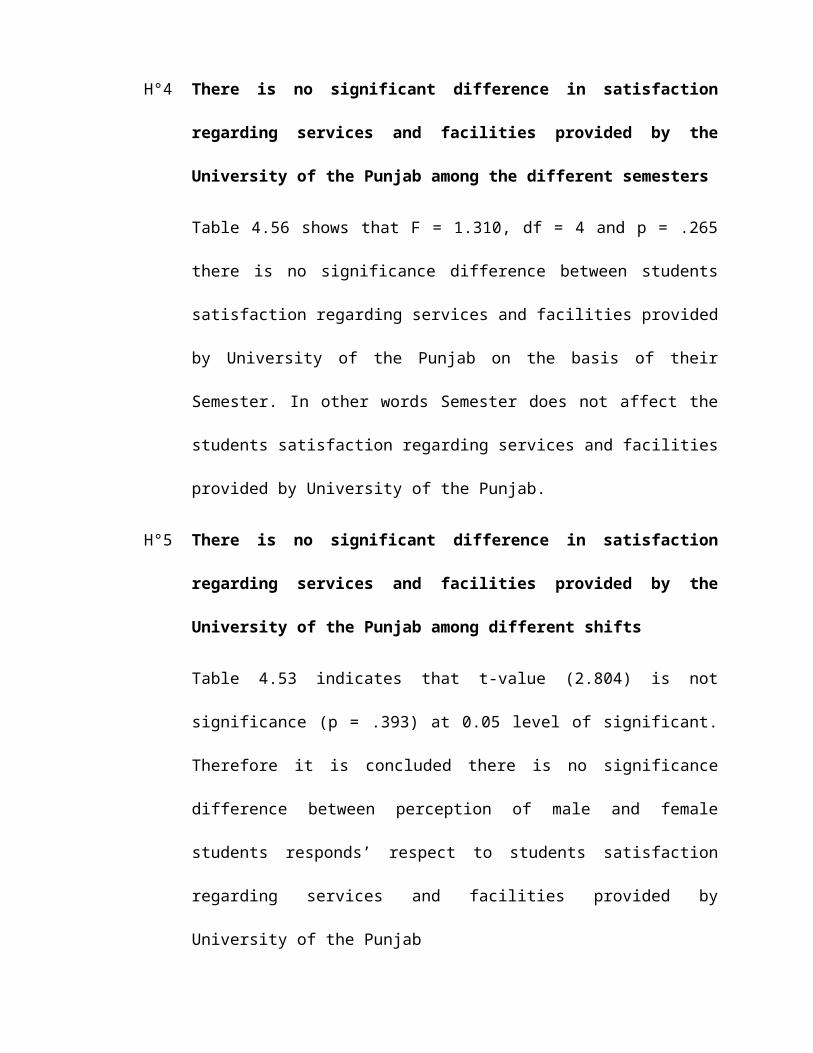
H°4 There is no significant difference in satisfaction
regarding services and facilities provided by the
University of the Punjab among the different semesters
Table 4.56 shows that F = 1.310, df = 4 and p = .265
there is no significance difference between students
satisfaction regarding services and facilities provided
by University of the Punjab on the basis of their
Semester. In other words Semester does not affect the
students satisfaction regarding services and facilities
provided by University of the Punjab.
H°5 There is no significant difference in satisfaction
regarding services and facilities provided by the
University of the Punjab among different shifts
Table 4.53 indicates that t-value (2.804) is not
significance (p = .393) at 0.05 level of significant.
Therefore it is concluded there is no significance
difference between perception of male and female
students responds’ respect to students satisfaction
regarding services and facilities provided by
University of the Punjab
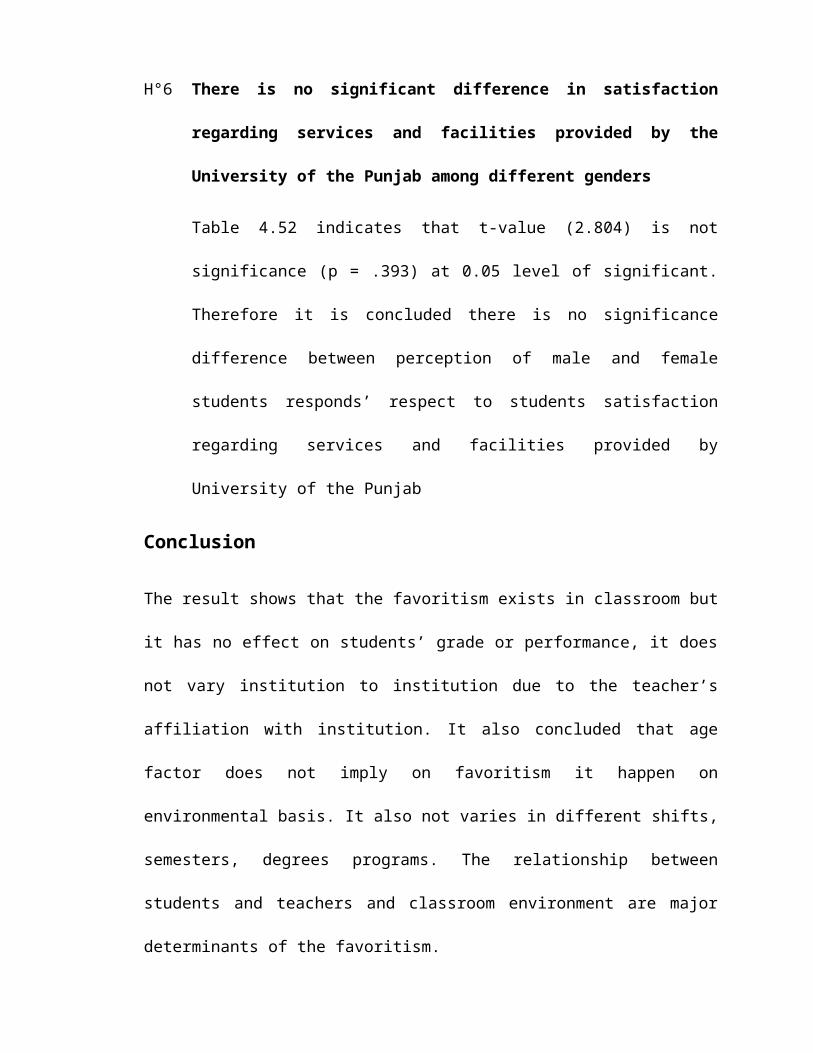
H°6 There is no significant difference in satisfaction
regarding services and facilities provided by the
University of the Punjab among different genders
Table 4.52 indicates that t-value (2.804) is not
significance (p = .393) at 0.05 level of significant.
Therefore it is concluded there is no significance
difference between perception of male and female
students responds’ respect to students satisfaction
regarding services and facilities provided by
University of the Punjab
Conclusion
The result shows that the favoritism exists in classroom but
it has no effect on students’ grade or performance, it does
not vary institution to institution due to the teacher’s
affiliation with institution. It also concluded that age
factor does not imply on favoritism it happen on
environmental basis. It also not varies in different shifts,
semesters, degrees programs. The relationship between
students and teachers and classroom environment are major
determinants of the favoritism.
These research hypotheses were rejected as Ho1, Ho2 and Ho7.
This result shows that there is significance difference in
favoritism among various shifts, grades and favoritism does
not exist.
The research hypotheses were accepted as Ho3, Ho4, Ho5 and
Ho6. This hypotheses result shows that there is no
significance in favoritism among different institution,
ages, programs and semesters.
Overall result shows that there is significance difference
between the opinion of Male and Female Students.
Discussion
Objective 1: To explore whether students of PU are
satisfied with the services and facilities provided by
university of the Punjab or not
It is clarified by the research that there is significance
difference between student satisfaction regarding services
and facilities provided by university of the Punjab. In
other words faculty does affect the student satisfaction
regarding services and facilities provided by University of
the Punjab
Objective 2: Exploration of the impact of grades in
satisfaction level of students of poor grading services and
facilities provided by university of the Punjab.
It is normally considered that the students having high
grades are often highly satisfied with the institution no
matter what quality and quality of services and facilities
is being provided to them. But in our research it is
clarified that there is no impact of grades on satisfaction
level of students of PU regarding services and facilities
provided by university of the Punjab.In other words CGPA
does affect the students satisfaction regarding services and
facilities provided by University of the Punjab.
Objective 3: exploration of the variation of level of
satisfaction of students of pu regarding services and
facilities provided by university of the Punjab through
different programs
It is clarified in our research that there is significant
variation of level of satisfaction of students of pu
regarding services and facilities provided by university of
the Punjab through different programs. Hence we observed
some reasons behind these results, we found that different
programs have different requirements and the student's level
is also different. So they all demand different type of
services and facilities. In other words program does affect
the student satisfaction regarding services and facilities
provided by University of the Punjab.
Objective 4: exploration of variation of level of
satisfaction of students of IER regarding services and
facilities provided by university of the Punjab through
different semesters
There is no significance difference between student’s
satisfaction regarding services and facilities provided by
University of the Punjab on the basis of their Semester. In
other words Semester does not affect the student’s
satisfaction regarding services and facilities provided by
University of the Punjab.
Objective 5: exploration of level of satisfaction of
students of IER regarding services and facilities provided
by university of the Punjab through different shifts
it is concluded there is no significance difference between
perception of morning and evening students responds’ respect
to students satisfaction regarding services and facilities
provided by University of the Punjab
Recommendations
1. On the basis of research findings, the researchers
suggest that comprehensive strategies and policies
should be evolved to enhance satisfaction of the
students regarding services and facilities provided by
university of the Punjab.
2. I will recommend future researchers to research on
more than three faculties of university of the Punjab
and it should be on broader sense.
3. The reviewed literature and discussions concluded that
there is significant difference of level of
satisfaction among students studying in different
faculties. In the light of this interpretation
administration should take care of whole faculties of
PU.
4. Student and teacher evaluation standards and criteria
should be refined and set in accordance with the
demanding nature of academic regulations
5. Mandatory training and counseling should be conducted
to rehabilitate socially isolated / marginalized
teachers as well as students,
6. A general body or teachers associations should be
formed to keep a vigilant eye on the affairs of the
students in classrooms or in universities and other
educational places,
7. Student's feedback should be continually taken and
given worth in policies modification process.
8. Functionality of student councils to get the gap
reduced more in understanding the students aspiration
and proper addressing it in planning phases of the P.U
policies.
DEDICATED, TO.
A
CUTE
MUJRIM
Of
SKG
By wishing the most desirable best of luck with
unflinching sincerity, care, passion, compassion & Love
May Allah Almighty bless her with unparalleled success
in days coming ahead…..
Regards..
From a resident of highest mountainous
ranges…….


