Embed Size (px)
Citation preview
Process optimization €or solid extraction, flavor improvement and fat
removal in the production of soymilk from full fat soy flakes
Stanley Prawiradjaja
A thesis submitted to the graduate faculty
in partiaI fulfillment of the requirements for the degree of
MASTER OF SCIENCE
Major: Food Science and TechnoIogy
Program of Study Committee: Lester A. Wilson, Major Professor
Patricia A. Murphy Phillip Dixon
Iowa State University
Ames, Iowa
2003
Copyright 0 Stanley Prawiradjaja, 2003. All rights reserved.

... 111
iv
TABLE OF CONTENTS
ABSTRACT
INTRODUCTION Thesis organization
LITERATURE REVIEW History Soy foods nutritiona1 quality The flavor of soybean and the lipoxygenme enzyme Soymilk and soymilk processing methods Color, gas chromatography and sensory evaluation Conclusion
THE INFLUENCE OF TEMPERATURE AND FCEHYDRATION TIME ON THE PRODUCTION OF SOYMILK MADE FROM FULL FAT SOY FLAKES
Abstract Introduction MateriaIs and methods Results and discussion Conclusion References Table and graphs
COMPARISON OF LIPOXY GENASE-FREE SOYMILK WITH DEODORIZED SOYMILK
Abstract Introduction Materials and methods Results and discussion Conclusion References Tables
EFFICIENCY IN LIPID REMOVAL FROM SOYMILK MADE FROM FULL FAT SOY FLAKES OR WHOLE SOYBEANS AT THREE SOLID LEVELS
Abstract Introduction Materials and methods Results and discussion Conclusion References Tables and graphs
vi
1 4
6 6 7
10 13 23 32
33 33 34 35 39 44 45 48
62 62 63 65 70 73 73 75
79 79 80 82 86 92 92 94
V
CONCLUSION
APPENDIX I - CONSENT FORM FOR SOYMILK SENSORY EVALUATION
APPENDIX I1 - SENSORY EVALUATION INSTRUCTION
APPENDIX III - SOYMILK SENSORY EVALUATION FORM
APPENDIX IV - SAMPLE SAS PROGRAMS
REFERENCES
ACKNOWLEDGEMENTS
103
i05
i06
107
108
112
120
vi
ABSTRACT
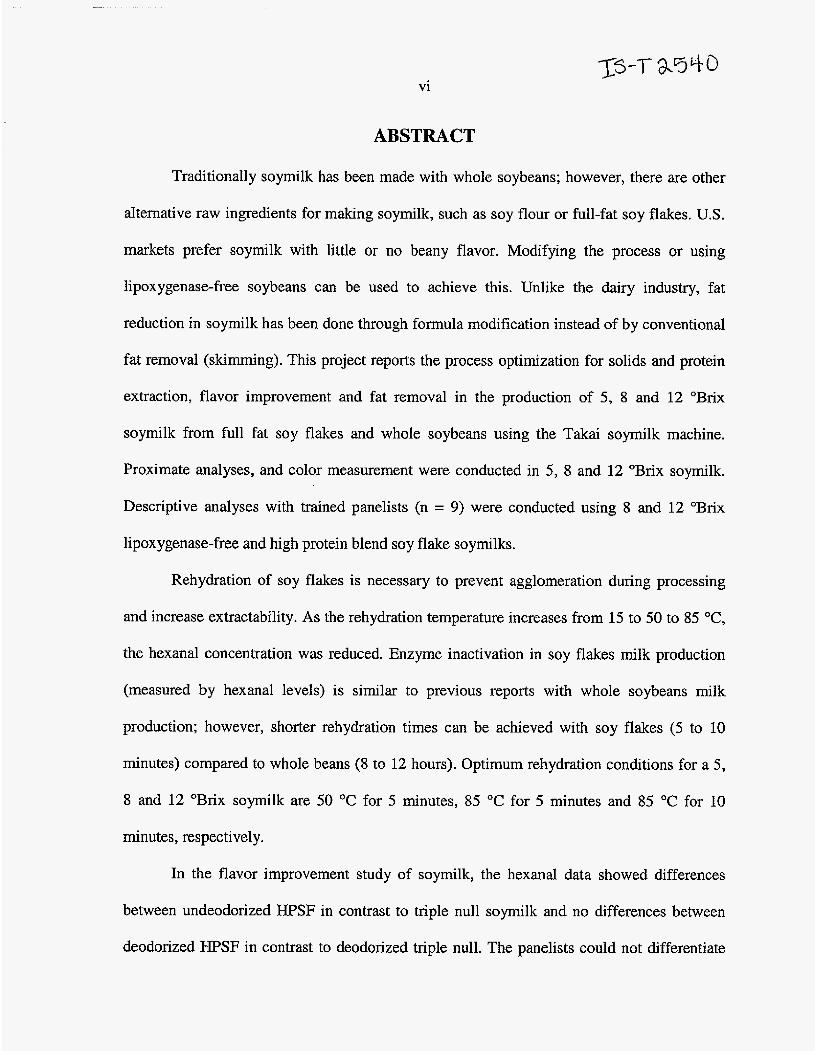
Traditionally soymilk has been made with whole soybeans; however, there are other
alternative raw ingredients for making soymilk, such as soy flour or full-fat soy flakes. US.
markets prefer soymilk with little or no beany flavor. Modifying the process or using
lipoxygenase-free soybeans can be used to achieve this. Unlike the dairy industry, fat
reduction in soymilk has been done through formula modification instead of by conventional
fat removal (skimming). This project reports the process optimization for solids and protein
extraction, flavor improvement and fat removal in the production of 5, 8 and 12 "Brix
soymilk from full fat soy flakes and whole soybeans using the Takai soymilk machine.
Proximate analyses, and color measurement were conducted in 5, 8 and 12 "Brix soymilk.
Descriptive analyses with trained panelists (n = 9) were conducted using 8 and 12 "Brix
lipoxygenase-free and high protein blend soy flake soymilks.
Rehydration of soy flakes is necessary to prevent agglomeration during processing
and increase extractability. As the rehydration temperature increases from 15 to 50 to 85 *C,
the hexanal concentration was reduced. Enzyme inactivation in soy flakes milk production
(measured by hexanal levels) is similar to previous reports with whole soybeans milk
production; however, shorter rehydration times can be achieved with soy flakes (5 to 10
minutes) compared to whole beans (8 to 12 hours). Optimum rehydration conditions for a 5,
8 and 12 "Brix soymilk are 50 "C for 5 minutes, 85 "C for 5 minutes and 85 "C for 10
minutes, respectively.
In the flavor improvement study of soymilk, the hexanal data showed differences
between undeodorized HPSF in contrast to triple null soymilk and no differences between
deodorized HPSF in contrast to deodorized triple null. The panelists could not differentiate
vii
between the beany, cereal, and painty flavors. However, the panelists responded that the
overall aroma of deodorized 8 'Brix triple null and HPSF soymilk are lower than the
undeodorized triple nul1 and HPSF soymilk. The triple nu11 soymilk was perceived to be
more bitter than the WSF soymilk by the sensory panel due to oxidation on the triple null
soy flakes. This oxidation may produce other aroma that was not analyze using the GC but
noticed by the panelists. The sensory evaluation results did show that the deodorizer was able
to reduce the soymilk aroma in HPSF soymilk so it would be similar to triple null soymilk at
8 "Brix level.
Regardless of skimming method and solids levels, the fat from whole soybean milk
was removed less efficiently than soy flake milk (7 to 30% fat extraction in contrast to 50 to
80% fat extraction respectively). In soy flake milk, less fat was removed as the % solid
increases regardless of the processing method. In whole soybean milk, the fat was removed
less efficiently at Iower solids level milk using the commercial dairy slummer and more
efficient at lower solids level using the centrifuge-decant method. Based on the Hunter L, a, b
measurement, the color of the reduced fat soy flake milk yielded a darker, greener and less
yellow colored milk than whoIe soymilk (a cO.O5), whereas no differences were noticed in
reduced fat soybean milk (a ~ 0 . 0 5 ) . Color comparison of whole and slum cow's milk showed
the same trend as in the soymilk.
1
INTRODUCTION
Soymilk is made by a water extraction of soybeans. Its visual appearance is similar to
cow’s milk, and nutritionally more superior to other legumes (Philip and Helen 1973;
Steinkraus and others 1978). In China, soybeans are called the “greater beans” due to their
many health benefits (Simoons 1991). Soybeans have been proposed to be useful as an anti-
carcinogen, a cholesterol-lowering agent, prevent calcium lost, and a phytochemical source
(Messina 1995). Soybeans are an inexpensive source of high quaIity protein. The high quality
protein of soybeans is useful as a protein substitute or a supplement for people in developing
countries (Messina 1995; Iwuoha and Umunnakwe 1996). In the US., the Food and Drug
Administration (FDA) recently approved a health-labeling claim for products containing soy
protein in October 1999. DaiIy consumptions of 25 g (6.25 g per serving) of soy protein may
reduce the risk of heart diseases, due to the cholesterol Iowering effects of soy protein
(Henkel2000).
Based on the market research conducted by SoyaTech in 1999, the sales of soy foods
in the U.S. were projected to increase from $2.1 billion to $3.57 billion by 2002 (Soya Tech
1999). In 2002, Soya Tech released a new report showing that the soy food industry had
already reached $3.2 billion in sales by 2001. Soymilk sales alone in 2001 has reached $550
million and were projected to reach $1 billion in the corning three to five years (Soyatech
2002).
The acceptance of soy foods in the western market is affected, in part by its off-flavor
(Wilson 1985; Feng and others 2001). The off-flavor of soy foods is caused by the activity of
lipoxygenase (WiIkens 1967). This enzyme oxidizes the lipids in soybeans and the products
produced by lipoxygenase produces flavors that are describes as grassy, painty, and beany.
2-3
Many methods have been developed in order to eliminate this off-flavor, such as processing
modifications or eliminating the lipoxygenase enzyme through genetic modifications (Wilson
1996; Kwok 1995). Processing modifications include rapid enzyme deactivation using heat,
such as the Cornel1 method, Illinois method, Rapid Hydration Hydrothermal Cooking
(RHHTC), cold grind under vacuum method (ProSoyaTM), deodorization, antioxidant addition
and alkali treatment methods (Wilson 1985; Kwok 1995; Liu 1997),
Most soymilk processes use whole soybeans as the starting material. However, there
are other raw forms of soybeans that can be used to make soymilk; such as soy flour or full
fat soy flakes (Wilson 1985; Moizuddin et al, 1999). Most studies have looked at optimizing
the production of soymilk using whole soybeans. The use of soy flakes for soymilk
production has not been studied extensively. The purpose of the first study is to optimize the
use of soy flakes for soymilk production based upon solids, protein and flavor properties.
The development of lipoxygenase-free soybeans opened up new opportunities in
creating no “off’-flavored soy foods. Previous studies have shown that these lines of
soybeans can improve the flavor of soy products (Kobayashi and others 1995; Wilson 1996;
Torres 2001). In the dairy industry, it is a common practice to deodorize cow’s milk to
remove any undesirable off-flavors using a flash vacuum-steam deodorizer (Fmall 1980).
The same practice could be utilized on soybean milk. Thus, the objective of the second study
is to evaluate the differences in the flavor of soymilk made from lipoxygenase-free soy flakes
and vacuum deodorized soymilk.
Soymilk has been consumed as a substitute for cow’s milk for centuries. While cow’s
milk with various lipid contents (whole, 2%, I%, and skim) has been available for sometime,
soybean milk counterparts have not. The production of low fat or non-fat soymilk would
4-5
provide more variety for the consumer. Moizuddin and others (1999) has reported the
production of a lower fat tofu made fiom soyflakes. However, little research has looked at fat
removal in soymilk. The optimum conditions for fat removal in soymilk have not been
determined. Thus, the objective of the third study is to evaluate the efficiency of fat removal
from soymilk produced from whole soybeans and soyflake at three solid levels.
THESIS ORGANIZATION
The thesis consists of a general introduction, a literature review and three
manuscripts. The first manuscript is entitled “The influence of temperature and rehydration
time on the production of soymilk made from full fat soy flakes”; the second “Comparison of
Lipoxygenase-free soymilk with deodorized soymilk”; and the thxd “Efficiency in lipid
removal from soymilk made from full fat soy flakes or whole soybeans at three solid levels”.
These papers will be submitted to the Journal of Food Science.
6
LITERATURE REVIEW
HISTORY
In Asia, soybeans have been consumed for thousands of years. Chinese people have
consumed them for two millennia, where as in Japan it has only been consumed about 1000
years (Shurtleff and Aoyagi 1983). In that part of the world, soybeans have been used as one
of the main sources of protein.
In the U.S., soybeans were introduced in 1800 but its many uses were not utilized
until the twentieth century. At the beginning, the use of soy was limited as animal feed. It
was not until 1945 that soybeans were utilized to produce both feed and food oil. From then
on, soybeans production has grown considerably (Snyder and Kwon 1987). Based on the
market research conducted by SoyaTech in 1999, the sales of soy foods in the U.S. were
projected to increase from $2.1 billion to $3.57 billion by 2002 (Soya Tech 1999). In 2002,
Soya Tech released a new report showing that the soy food industry had already reached $3.2
billion in sales by 2001. Soymilk sales alone in 2001. has reached $550 million and were
projected to reach $1 billion in the coming three to five years (Soyatech 2002).
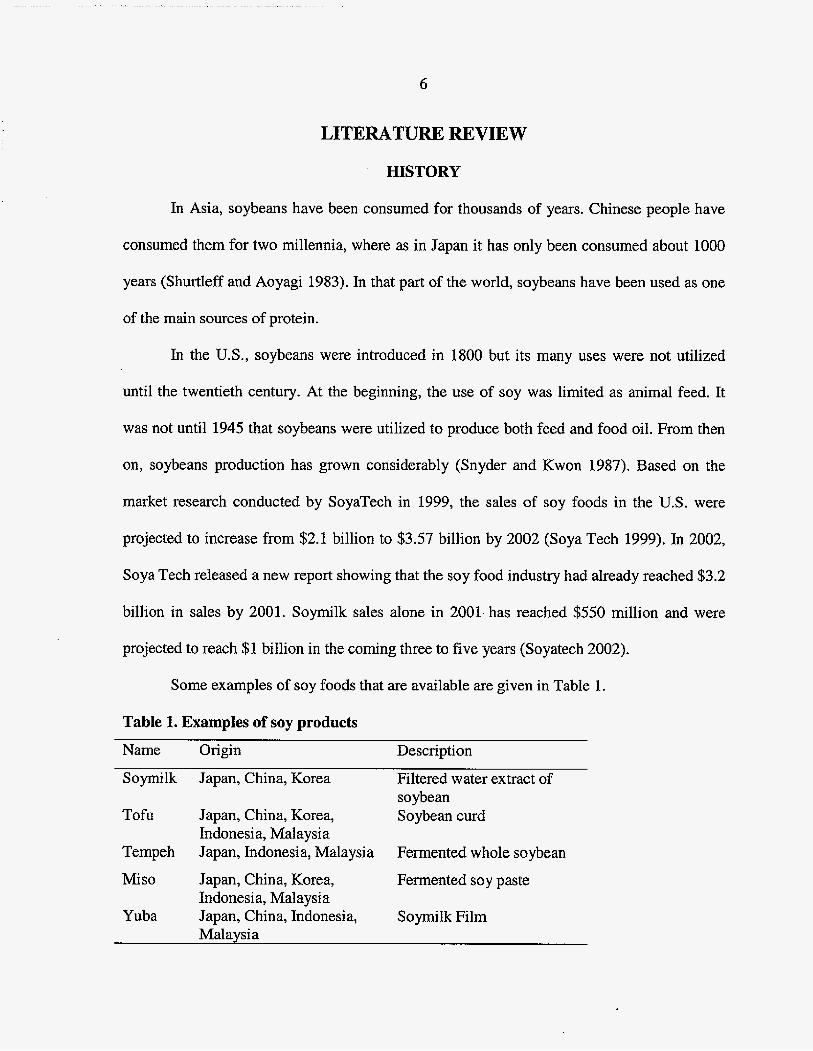
Some examples of soy foods that are available are given in Table 1.
Table I. Examples of soy products
Name Origin Description
Soymilk Japan, China, Korea Filtered water extract of
Tofu Japan, China, Korea, Soybean curd
Ternpeh Japan, Indonesia, Malaysia Fermented whole soybean
Miso Japan, China, Korea, Fermented soy paste
Yuba Japan, China, Indonesia, Soymilk Film
soybean
Indonesia, Malaysia
Indonesia, Malaysia
Malaysia
7
SOY FOODS NUTRITIONAL QUALITY
The excellent quality of soybeans protein has been utilized as a source of protein in
many Asian countries for a long time. Recently, there has been some evidence of soybeans
health benefits. To name a few, soybeans are thought to relieve the effect of postmenopausal
symptoms, osteoporosis and cancer prevention activities for women. Soybeans contain more
protein and are superior in quality to other legumes. Soybeans contain about 20% oil and 43
% protein (Karmas and Harris 1988). Soybeans are rich in the essential amino acid lysine,
but Iow in sulfur containing amino acids. This is why soybeans are sometimes used to
complement other legumes or cereals in food for non-human species. The superior quality of
soybeans has led the use of soybeans as a substitute for animal protein with the advantage of
having less fat in soy foods than animal products. The major applications of soybeans, soy
protein or combination of the two are for soymiIk and tofu production, infant formuIa,
medical nutrition products, animal product substitutes, and bakery products (Snyder and
Kwon 1987; Slavin 1991, Liu 1997).
In the U.S., the Food and Drug Administration (FDA) approved a health-labeling
claim for products containing soy protein in October 1999. Daily consumptions of 25 g (6.25
g per serving) of soy protein may reduce the risk of heart diseases, due to the cholesterol
lowering effects of soy protein. A study conducted at Wake Forest University Baptist
Medical Center reported that soy protein can reduce plasma concentration of total Low
Density Lipoprotein (LDL) cholesterol, but does not decrease the levels of High Density
Lipoprotein (HDL) or the good cholesterol. HDL level has been reported to decrease the
chance of heat disease. (Sirtori and others 1995; Henkel2000)
8
Soybeans contain phytochemical cornpounds called isoff avones. There are three
major estrogenic compounds that are included in the isoflavone family; genistein, daidzein,
and glycitein. In soybeans, isoflavones have 12 isomers; the agI ycons: genistin, genistein,
daidzin, daidzein, glycetin, glycetein; the acetylglucosides: 6"-O-acetyldaidzein, 6"-0-
acetylgenistein, 6"-O-acetylglycetein; the malonylglucosides: 6"-O-malonyldaidzein, 6"-0-
malonylgenistein, and 6'y-O-malonylglycetein (Kudou and others 199 I). The amount of
isoflavones in soybeans varies considerably, from as little as 400 to 2,500-pg/g due to
environmenta1 factors. In soymilk, the isoflavones contents range from 10 to 200-pg/g
(USDA-Iowa State University Database on the Isoflavone Content of Foods - 1999). The
amount of isoflavones in various foods is also dependent upon the method of processing.
Alcohol washed soy flakes, used to produce soy concentrates, usually has greatly reduced
levels of isoflavories. Heat treatment changes the form of the malonyl isoflavones into the
acetyl form. In soymilk processing, all isoflavone from the soybeans is extracted into the
soymilk. However, per serving consumption of soymilk, as expected, would have a lower
concentration of isoflavones due to dilution effect (Wang and Murphy 1994 and 1996).
There are several indications that isoflavones have health benefits, but their
contributions are not yet fully known. Isoflavones have a weak estrogenic activity and in pre-
menopausal women, isoflavones competes with the human estrogen. The ability of
isoflavones to compete with human estrogen is thought to be one of the mechanisms of
isoflavones to prevent cancer. Estrogen is a cell-promoting hormone, which stimulates the
growth and replication of cells. When celIs are replicating, there is a chance of making an
error in genetic replication, which then causes cancer cells. By bloclung the estrogen
hormone activity, isoflavones can then help reduce the number of replications of the cells,
9
which may prevent the occurrence of cancer, Isoflavones have also been shown to prevent
the occurrence of colon and prostate cancer (Messina and Messina 1991). However, other
studies also had shown that isoflavones had no effect in preventing cancer or showing any
esterogenic activity. This uncertainty on the roIe of isoflavones in human body caused FDA
not to make any ruling on health claim related to isoflavones,
Trypsin inhibitor (TI) has been known to be the major anti-nutntional compound in
soybeans. There are two kinds of trypsin inhibitors: Kunitz and Bowman-Birk TI. Kunitz TI
is less heat stable than the Bowman-Birk chymotrypsin inhibitor and trypsin inhibitor,
because it has fewer disulfide Iinkages in the structure. Based on animal studies Kunitz TI
binds to the trypsin enzyme and inactivates it. The inactivation of trypsin causes increase
production of more trypsin by the pancreas, which leads to the enlargement of the pancreas.
The action of TI decreases the digestion of protein in animal studies, and reduces protein
absorption. However, in 1994, Kennedy has shown that the Bowman-Birk TI was able to
prevent the occurrence of cancer cells in hamsters. The results suggested that the Bowrnan-
Birk TI might have an anticancer activity that contributed to the overall health benefits of
soy.
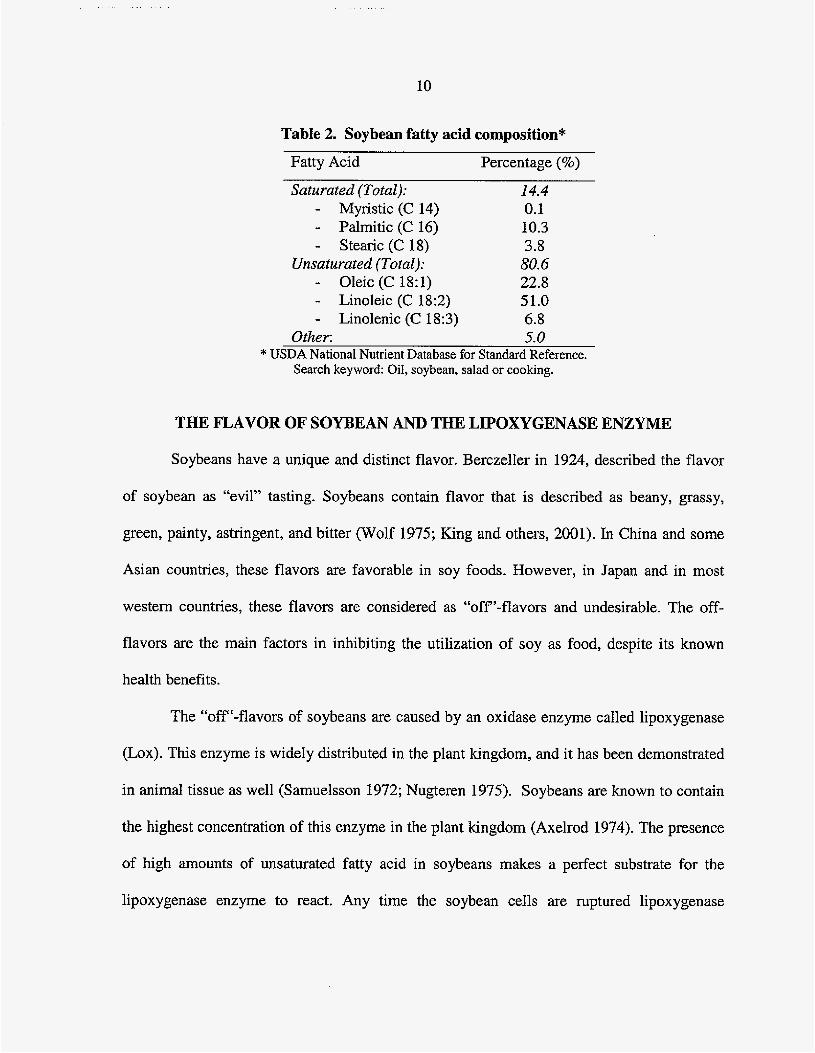
Soybeans contain about 20 % oil with about 80 % of the oil being unsaturated fatty
acids. Linoleic acid (18:2) is the most predominant unsaturated fatty acid in soybeans,
followed by oleic acid (18:l) (Table 2).
10
Table 2, Soybean fatty acid composition*
Fatty Acid Percentage (%)
Saturated (Total): 14.4
- Palmitic (C 16) 10.3 - Stearic (C 18) 3.8
Unsaturated (Total): 80.6 - Oleic (C 18:l) 22.8 - Linoleic (C 18:2) 51.0 - Linolenic (C 18:3) 6.8
Other: 5.0 * USDA NationaI Nutrient Database for Standard Reference.
Search keyword: Oil, soybean, salad or cooking.
- Myristic (C 14) 0.1
THE FLAVOR OF SOYBEAN AND T m LIPOXYGENASE ENZYME
Soybeans have a unique and distinct flavor. Berczeller in 1924, described the flavor
of soybean as “evil” tasting. Soybeans contain flavor that is described as beany, grassy,
green, painty, astringent, and bitter (Wolf 1975; King and others, 2001). In China and some
Asian countries, these flavors are favorable in soy foods. However, in Japan and in most
western countries, these flavors are considered as “off”-ff avors and undesirable. The off-
flavors are the main factors in inhibiting the utilization of soy as food, despite its known
health benefits.
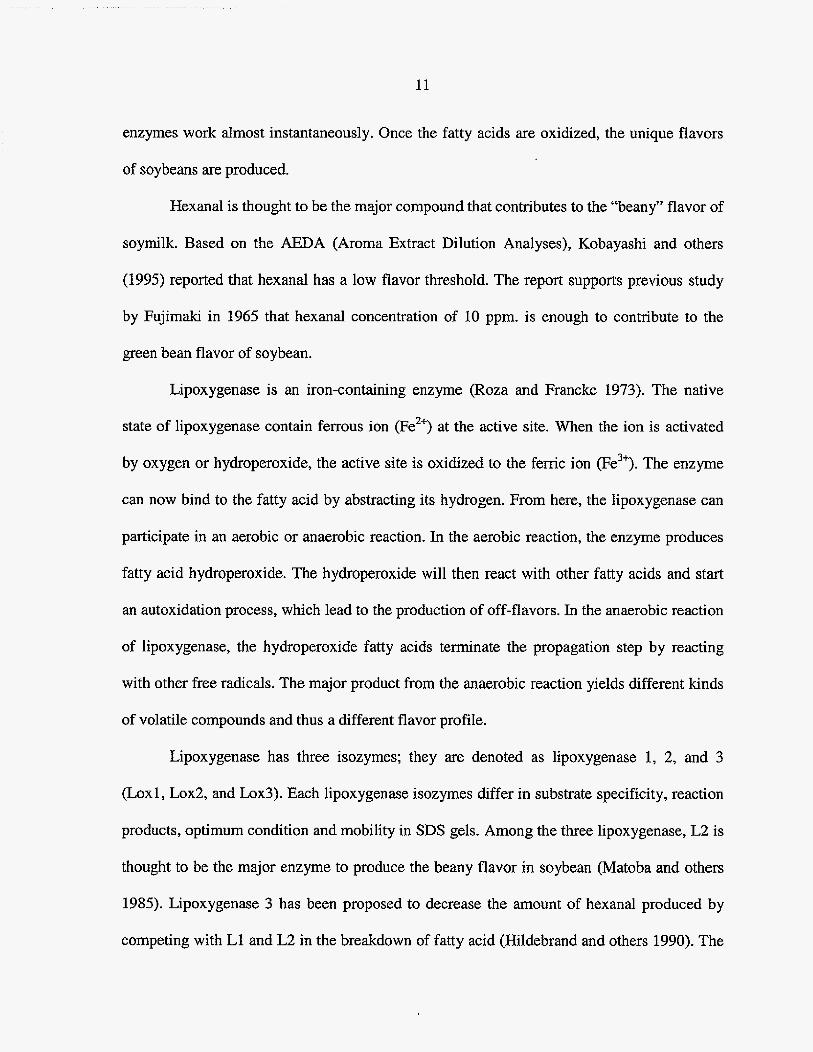
The “off‘-flavors of soybeans are caused by an oxidase enzyme called lipoxygenase
(Lox). This enzyme is widely distributed in the plant kingdom, and it has been demonstrated
in animal tissue as well (Samuelsson 1972; Nugteren 1975). Soybeans are known to contain
the highest concentration of this enzyme in the plant kingdom (Axelrod 1974). The presence
of high amounts of unsaturated fatty acid in soybeans makes a perfect substrate for the
lipoxygenase enzyme to react. Any time the soybean cells are ruptured lipoxygenase
11
enzymes work dmost instantaneously. Once the fatty acids are oxidized, the unique flavors
of soybeans are produced.
HexanaI is thought to be the major compound that contributes to the “beany” flavor of
soymilk. Based on the AEDA (Aroma Extract Dilution Analyses), Kobayashi and others
(1995) reported that hexanal has a low flavor threshold. The repoa supports previous study
by Fujimaki in 1965 that hexanal concentration of 10 ppm. is enough to contribute to the
green bean flavor of soybean.
Lipoxygenase is an iron-containing enzyme (Roza and Francke 1973). The native
state of lipoxygenase contain ferrous ion (Fe2+) at the active site. When the ion is activated
by oxygen or hydroperoxide, the active site is oxidized to the fenic ion @e3’). The enzyme
can now bind to the fatty acid by abstracting its hydrogen. From here, the Iipoxygenase can
participate in an aerobic or anaerobic reaction. In the aerobic reaction, the enzyme produces
fatty acid hydroperoxide. The hydroperoxide will then react with other fatty acids and start
an autoxidation process, which lead to the production of o f f 4 avors. In the anaerobic reaction
of Iipoxygenase, the hydroperoxide fatty acids terminate the propagation step by reacting
with other free radicals. The major product from the anaerobic reaction yields different kinds
of volatile compounds and thus a different flavor profile.
Lipoxygenase has three isozymes; they are denoted as lipoxygenase 1, 2, and 3
(Lox1 , Lox2, and Lox3). Each lipoxygenase isozymes differ in substrate specificity, reaction
products, optimum condition and mobility in SDS gels. Among the three lipoxygenase, L2 is
thought to be the major enzyme to produce the beany flavor in soybean (Matoba and others
1985). Lipoxygenase 3 has been proposed to decrease the amount of hexanal produced by
competing with Ll and L2 in the breakdown of fatty acid (Hildebrand and others 1990). The
12
by-product of lipid oxidation produces a complex array of volatile compounds that
contributed to the off-flavor.
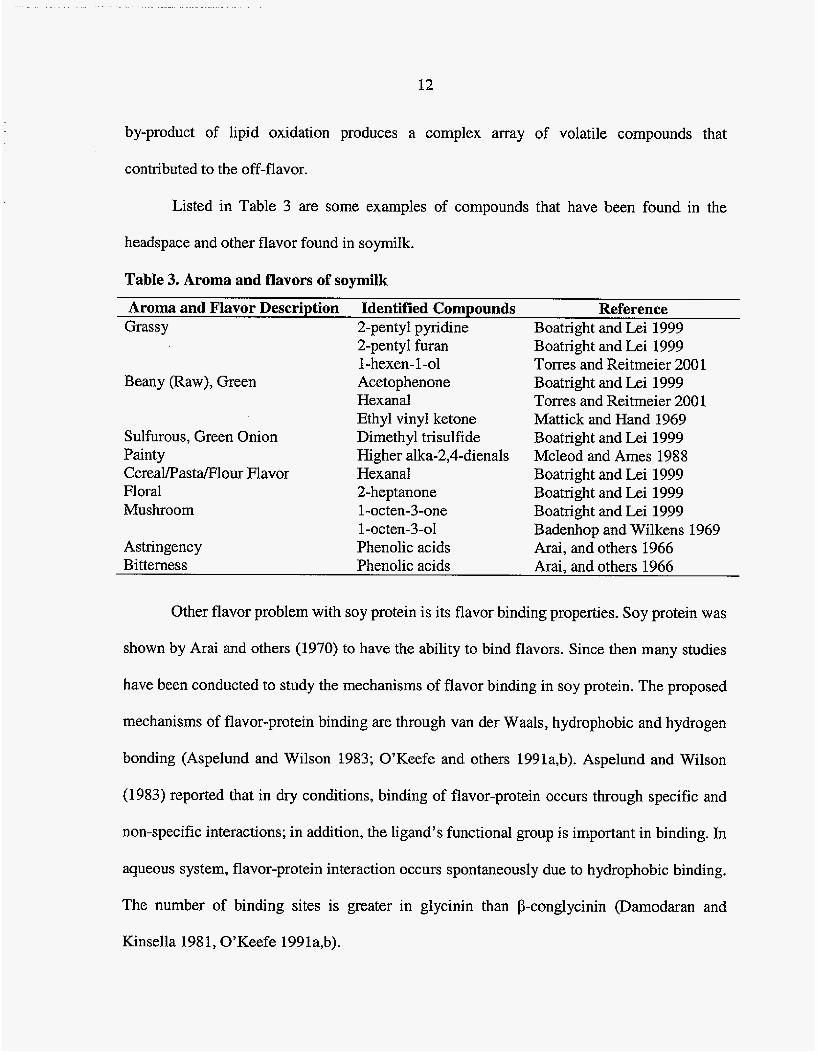
Listed in Table 3 are some examples of compounds that have been found in the
headspace and other flavor found in soymilk.
Table 3. Aroma and flavors of soymilk
Aroma and Flavor Description Identified Compounds Reference Grassy 2-pentyl pyridine Boatright and Lei 1999
2-pentyl furan Boatright and Lei 1999 I-hexen-1-01 Torres and Reitrneier 200 1
Beany (Raw), Green Acetophenone Boatright and Lei 1999 Hexanal Torres and Reitmeier 200 1 Ethyl vinyl ketone Mattick and Hand 1969
Sulfurous, Green Onion Dimethyl trisulfide Boatright and Lei 1999 Painty Higher alka-2,4-dienals Mcleod and Ames 1988 Cereal/Pasta/Flour Flavor Hexanal Boatright and Lei 1999 Floral 2-heptanone Boatright and Lei 1999 Mushroom l-octen-3-one Boatright and Lei 1999
Astringency Phenolic acids Ami, and others 1966 Bitterness Phenolic acids Arai, and others 1966
l-octen-3-01 Badenhop and Wilkens 1969
Other flavor problem with soy protein is its flavor binding properties. Soy protein was
shown by Arai and others (1970) to have the ability to bind flavors. Since then many studies
have been conducted to study the mechanisms of flavor binding in soy protein. The proposed
mechanisms of flavor-protein binding are through van der Waals, hydrophobic and hydrogen
bonding (Aspelund and Wilson 1983; O’Keefe and others 1991a,b). Aspelund and Wilson
(1983) reported that in dry conditions, binding of flavor-protein occurs through specific and
non-specific interactions; in addition, the ligand’s functional group is important in binding. In
aqueous system, flavor-protein interaction occurs spontaneously due to hydrophobic binding.
The number of binding sites is greater in glycinin than P-conglycinin (Damodaran and
Kinsella 1981, O’Keefe 1991a,b).
13
Based on the experiment conducted by O’Reefe et.al. (1991a), the binding curve
never reached saturation up to 1000 ppm of ligands (ketones, hexanol and hexane) which
indicates that soy protein has high binding capacity* In some studies, there are some
indications that ligand binding also changes the confonnationa1 structure of the protein and
increases the binding sites (Kinsella and Damodaran 1980; Damodaran and Kinsella 1981;
Thissen 1982). Likewise heat may also changes the conformational structure of the soy
protein and exposing the nonpolar regions and increasing the binding sites (Crowther and
others 1980).
The autoxidation property of Iipoxygenase enzyme has been reported to be beneficial
in certain applications. In 1934, Haas and Bohn reported the addition of soy flour to wheat
flour (0.75 - 2 % addition) is useful to bleach carotene pigment in wheat flour. The addition
of enzyme active soy flour also has been reported to be beneficial in improving over mixing
and increasing dough stability (Faubion and Hoseney 1981).
SOYMILK AND SOYMILK PROCESSING METHODS
SoymiIk is a water extract of soybeans. It contains about 2.75 % protein, 1.91 % fat
and 1.81 % carbohydrate (USDA National Nutrient Database 2002); the nutritional contents
of soybeans depend on the % solid of soymilk being produced. In soy yogurt, tofu or yuba
production, soymilk is the intermediate step for producing these products. The traditional
Chinese method for soymilk production is soaking the soybeans for 8-12 hours in cold water,
wash, grinding, filtering and then cooking. Heating, in soymilk is an important step because
it helps in the flavor deveIopment, pasteurization, and improving the nutritional quality
(Wilson, Murphy and Gallagher 1992).
14
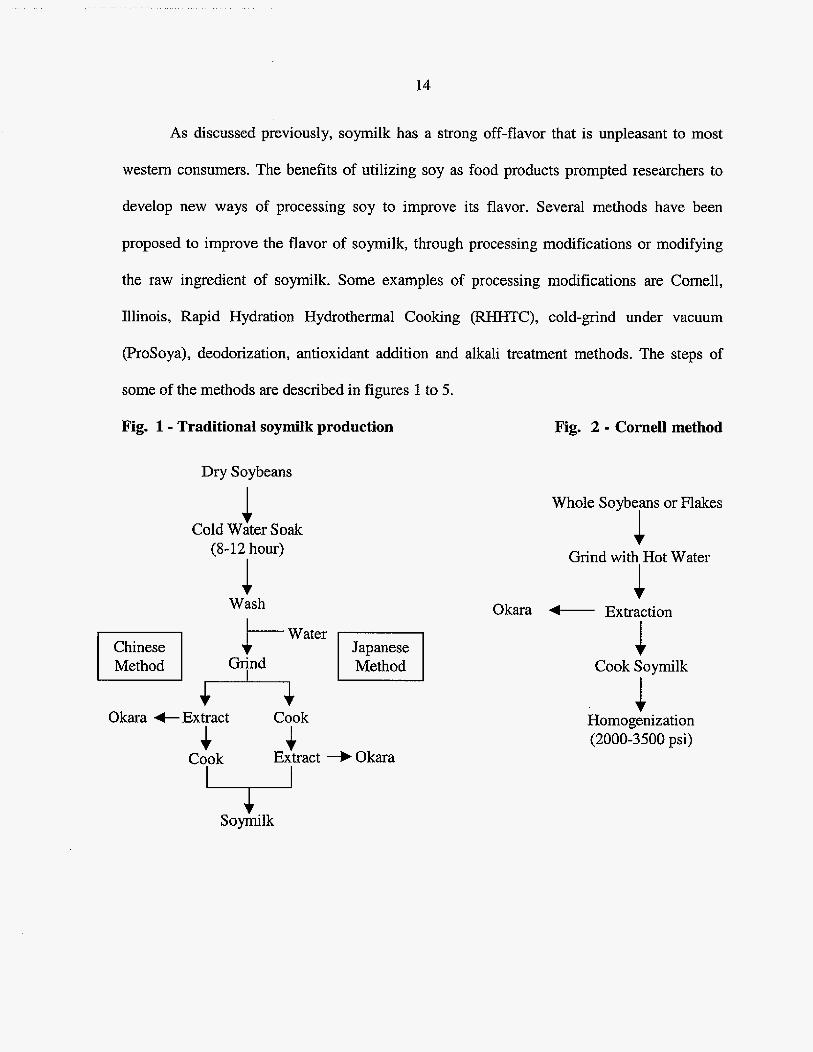
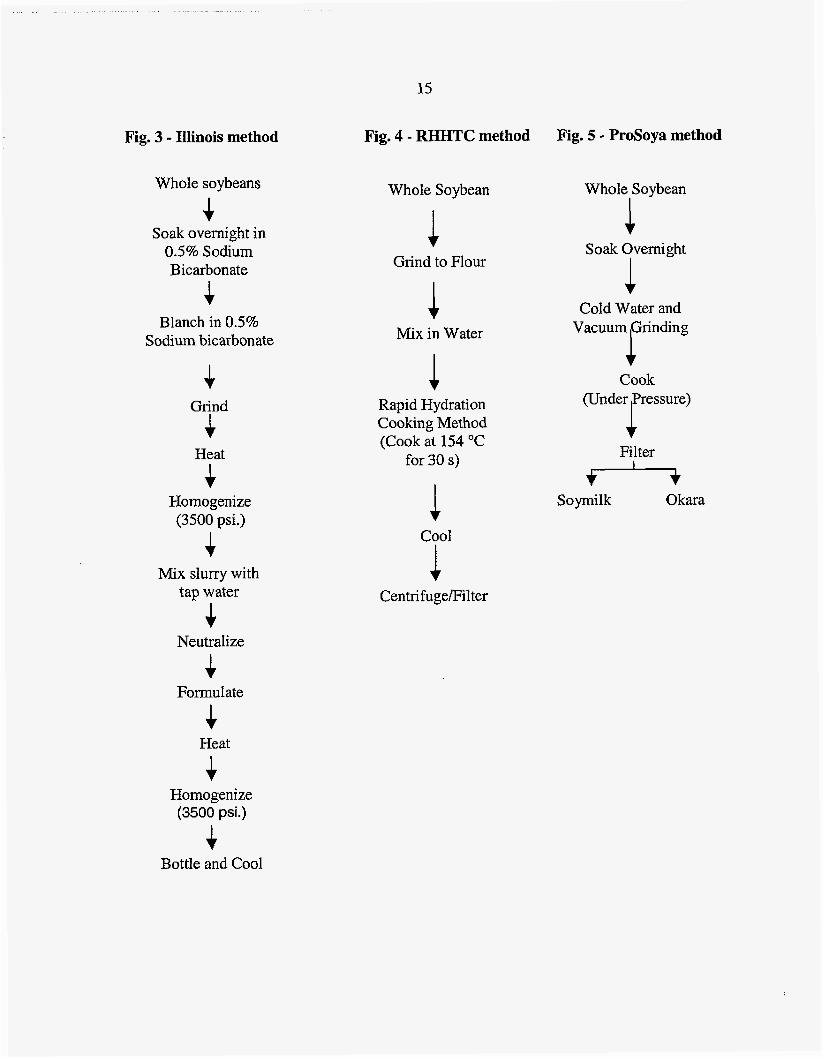
As discussed previously, soymilk has a strong off-flavor that is unpleasant to most
western consumers. The benefits of utilizing soy as food products prompted researchers to
develop new ways of processing soy to improve its flavor. Several methods have been
proposed to improve the flavor of soymilk, through processing modifications or modifying
the raw ingredient of soymilk. Some examples of processing modifications are Cornell,
Illinois, Rapid Hydration Hydrothermal Cooking (RIXHTC), cold-grind under vacuum
(ProSoya), deodorization, antioxidant addition and alkali treatment methods. The steps of
some of the methods are described in figures 1 to 5.
Fig. 1 - Traditional soymilk production Fig. 2 - Cornell method
Dry Soybeans
Chinese I Method I
1 Cold Water Soak
(8-12 hour)
1 Wash
iWater Grind + * *
Okara +Extract Cook
Cook s
Extract -b Okara 4
Li Soymilk
Whole Soybeans or Flakes
1 Grind with Hot Water
I * Okara t Extraction
1 Cook Soymilk
1 Homogenization (2000-3500 psi)
15
Fig. 3 - Illinois method
Whole soybeans
Soak overnight in 0.5% Sodium Bicarbonate +
Blanch in 0.5% Sodium bicarbonate
Grind
4 Heat
4
+ 4
Homogenize (3500 psi.)
Mix slurry with tap water
Neutralize
Forrnul ate
Heat
Fig. 4 - RHHTC method Fig. 5 - ProSoya method
Whole Soybean Whole Soybean
1 Soak Overnight 1 1 1 9
Grind to Flour
Cold Water and Vacuum Grinding
1 1
1
Mix in Water
Cook (Under ressure) Rapid Hydration
Cooking Method (Cook at 154 "C
for 30 s) Filter
Soymilk Okara
Cool
1 CentrifugeFilter
Homogenize (3500 psi.)
Bottle and Cool
16
The Illinois and the RH€€TC method incorporate all of the soybean parts into the
resulting soymilk due to high shear of the process. However, the RH€€TC method uses a
higher temperature (154 O C for 3 s) than the Illinois method (82 "C). The ProSoya and the
Cornel1 method is a modification of the traditional methods. In the ProSoya method, the
soybeans are ground with cold water under vacuum to prevent the incorporation of oxygen
into the fatty acid by lipoxygenase. In the Cornell method, enzyme inactivation is accelerated
by inactivation of the enzyme using wet heat (80 'C and above) during grinding, (Kwok and
Niranjan 1995)
Even though it was reported that the processing modifications reduced off-flavor
development, each method has its own advantages and disadvantages in terms of protein and
solids recovery. The traditionaI and Cornel1 method yield the lowest % solid extraction (55-
65% wt/wt), where the Illinois and the lWHTC method yield the highest % solid extraction
(86-89% wt/wt). For protein extraction the traditional, Cornell and the ProSoya method
extracted about 70-80 % (wt/wt) of protein and the Illinois and RHI-€TC method extracted
about 90-93 % (wt/wt) protein. In the Illinois and the RHHTC method, all of the soybeans
including the okara are included in to the soymilk and therefore increases its % solid and % '
protein extraction (Golbitz 1995; Kwok and Niranjan 1995). In the Illinois method, where
soybeans are blanched for 30 minutes, Johnson and Snyder (1978) showed that the initial
blanching step would heat fixed the protein bodies in the soybeans and make it insoluble
even after the grinding step. If the soybeans are ground with hot water, such as in the Cornell
method, the protein fixation does not occur and better extraction can be obtain. Another
disadvantage of the Illinois and REElTC method is that the suspended insoluble solids may
settle out.
17
Some research suggest that modifying the processing methods by the addition of extra
ingredients such as antioxidants, sodium bicarbonate, oxidase enzymes or masking agents
can improve the flavor of soymilk. It was assumed that the additions of antioxidants capture
the free radicals that are form by the lipoxygenase enzyme, and hence reduces the lipid
oxidation and the lipid oxidations byproducts. In 1991, Vijayvaragiya and Pai evaluated the
use of several antioxidants in preparing soymilk through lipoxygenase enzyme assay. Among
all of the antioxidants that were evaluated, it was found that propyl gallate in combination
with citric acid and ascorbic acid showed the most inhibition of lipoxygenase I isozymes.
Another processing modification empIoys the use of sodium alkali (sodium
hydroxide, sodium carbonate, and sodium bicarbonate) in treating the soybeans either before
or after soymilk making. An example where soybeans were treated before the process is in
the IlIinois method where soybeans were soaked and ground using sodium bicarbonate. The
other application of sodium alkali is by adding it into the soymilk itself (Bourne, and others,
1976). In this case, Bourne reported that the pH change in soymilk was not the one
responsible for the improvement of flavor but instead it was the concentration of the sodium
ions. The addition of an oxidase enzyme was suggested for flavor removaI through oxidation.
The addition of the enzyme would oxidize the already present off-flavor to reduce the
amount of off-flavor (aldehydes to carboxylic acids). A study conducted by Maheshwari and
others (1997) uses porcine liver aIdehyde oxidase (FjAO) enzyme to reduce the amount of
'off' flavor in an aqueous defatted soy flour system. The result from the study showed that
the addition of the enzyme would decrease the amount of 'off' flavors. Last, the additions of
sugars and flavorings could also be used to mask the presence of beany flavor (Torres-
Penarmda and others 2001).
18
Soy flavor improvement can also be done through breeding techniques. Soybeans
plants can be crossbred to produce soybeans that lack the Iipoxygenase (Loxl, Lox2 and
Lox3) enzymes. Soybeans plants that lack the Loxl, h x 2 , Lox3, Loxl2, lLox23, Lox13 or
Lox123 can now be found. Flavor improvement of soymilk has been reported with these
varieties (Kobayashi and others 1995; Wilson 1996; Torres 2001),
As the famous phrase says, “there is more than one way to skin a cat”, there is more
than one-way to make soymilk. Ingredients such as soy flakes, soy flour (full fat or defatted),
soy powder, or soy protein isolate can be used to make soymilk (Johnson and others
1981;Yazici and others 1997; Moizuddin and others 1999). Some advantages of using these
alternative ingredients are by saving time and cost. These ingredients have a larger surface
area and therefore it would need shorter rehydration time to process, thus saving energy (no
grinding step), materials (soak water), sanitation time and cost in comparison to using whole
soybeans (Moizuddin 1999), As with any powdered products, processing difficulties would
be preventing agglomeration during dispersion in liquid.
In the study conducted by Moizuddin and others (1999), they evaluated the use of
whole soybean and soy flakes for tofu production using direct and indirect heat treatment.
They reported that tofu made with soy flakes has Iower fat content (26% db) and the okara
has higher fat content than the tofu (40% db) and okara made with whole soybean in both
processing methods. They proposed that the hulls from whoIe soybeans might play a roIe as a
filtering aid during pressing by providing channels for the fat to escape, where in soy flakes,
the absence of the hull cause caking of the insoluble matter and preventing the fat to escape
(Moizuddin and others 1999),
19
The ‘off‘-flavors of soymilk could be removed from the soymilk through a
deodorization process. The deodorization process is a common procedure in processing dairy
milk. In dairy milk, off-flavors could be caused from a carry over from the cows’ diet. Dairy
milk is commonly deodorized with a flash steam-vacuum deodorizer. The process is done
after the pasteurization step. The deodorizer works by creating a large thin layer of milk
dong the inside wall of the deodorizer and the vacuum would volatilize and remove the off-
flavors. Inside the deodorizer, steam is usually added into the system to compensate for the
loss of moisture during deodorization and to optimize flavor extractions (Farrall 1980).
Shurtleff (1979) describe the use of a vacuum pan (with 40 crn Hg or 7.7 psi. vacuum
pressure) to remove the off-flavor of soymilk which was prepared using the pre-blanch
method. The deodorization step can be applied several times before the formulation process.
In practice, to achieve an acceptable flavored soymilk several combinations of processing
method can be used to prevent the formation of the off-flavors.
To improve the nutritional quality and to provide varieties of soymilk to the
consumer, reduced fat soymilk can be produced. Little research has looked at the production
of reduced fat soymiIk. Conceivably, the fat of soymilk can be removed using the same
method as cow’s milk. In cow’s milk, the cream is separated from the milk using centrifugal
force. During centrifugation, the lower density fat will move inwards whereas the higher
density slum milk and other particles will move outwards of the axis of rotation. A
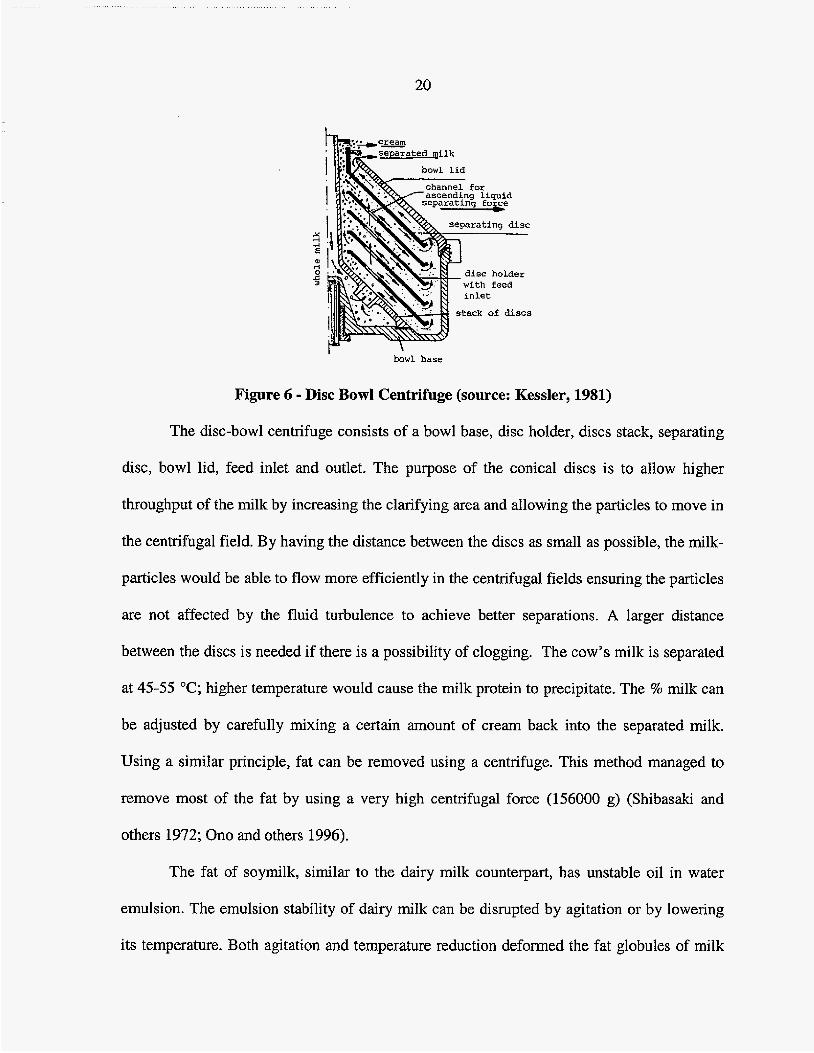
commonly used cream separator is a disc-bowl centrifuge (Fig. 6) ,
20
5 -4
e rl
disc holder .s stack of discs
bowl base
Figure 6 - Disc Bowl Centrifuge (source: Kessier, 1981)
The disc-bowl centrifuge consists of a bowl base, disc holder, discs stack, separating
disc, bowl lid, feed inlet and outlet. The purpose of the conical discs is to allow higher
throughput of the miIk by increasing the clarifying area and allowing the particles to move in
the centrifugal field. By having the distance between the discs as small as possible, the milk-
particles would be able to flow more efficiently in the centrifugal fields ensuring the particles
are not affected by the fluid turbulence to achieve better separations. A larger distance
between the discs is needed if there is a possibility of clogging. The cow's milk is separated
at 45-55 "C; higher temperature wouId cause the milk protein to precipitate. The % milk can
be adjusted by carefully mixing a certain amount of cream back into the separated milk.
Using a similar principle, fat can be removed using a centrifuge. This method managed to
remove most of the fat by using a very high centrifugal force (156000 g) (Shibasaki and
others 1972; Ono and others 1996).
The fat of soymilk, similar to the dairy milk counterpart, has unstable oil in water
emulsion. The emulsion stability of dairy milk can be disrupted by agitation or by lowering
its temperature. Both agitation and temperature reduction deformed the fat globules of milk
21
and causing flocculation of fat globules and causes separation of fat. A destabilization of an
emulsion is caused by a collision of fat droplets in a continuous phase. The collisions would
cause a separation, flocculation or coalescence of the fat droplets. If after the collision
separation occurs, it means a stable emulsion system has been achieved. If the collisions
produce flocculation or coaIescence of fat droplets, the fat droplets form a larger structure,
which cause separation of the fat or an unstable emulsion system. The larger the radius of the
fat droplets the faster is the rate of sedimentation or separation. Homogenization reduces the
size of fat globules and increases its emulsion stability. During homogenization process of
dairy milk, the fat globules incorporate the whey protein and casein into the structure
yielding a stable emulsion of milk. (Buchheim and Dejmek 1997).
The collisions of the fat droplets can be prevented by reducing their kinetic energy or
by having an energy barrier between them. Reducing the kinetic energy of the fat droplets
can be achieved by increasing the viscosity of the continuous phase, for example by adding
gum into the system. An energy barrier between the fat droplets can be achieved by
protecting the fat droplets with an outer Iayer and hence prevent flocculation and
coalescence; a good exampIe is by adding emulsifiers into the system. (Friberg 1997).
Flocculation may also occur by protein bridging, which happens when the tail of the protein
binds to another exposed surface of fat globules and forming a fat droplets cluster.
Protein load is defined as the amount of protein that is absorbed in mg/m2. The
protein load diminishes with the fat surfaces, which means that the smaller the fat droplet
size the higher the probability of the proteins to unfold on the surface of the fat droplets and
forming a thin layer. The protein load may or may not be affected with the method of
22
emulsion preparation; for example, an emulsion prepared using a blender vs. a valve
homogenizer (Tornberg and others 1997).
Soy protein is known to have a good emulsifying capability, It has been added into
various food systems to provide emulsion stability, such as in comminuted meats, coffee
whiteners, mayonnaise, etc. The emulsion properties of the P-conglycinin and glycinin soy
proteins have been studied by several researchers (Kanamoto and others 1977; Aoki and
others 1980)- Kanamoto et a]. (1977) reported that phosphatidylcholine can form complexes
to the soy protein through sonication and bound nonspecificaIly to either the P-conglycinin or
the gl ycinin globulin. Aoki and others reported that P-conglycinin globulin has higher
emulsion stability than glycinin globulin. They also reported that soy protein showed the
lowest emulsion stability and capacity when the soy protein is at the isoelectric region (pH 4-
4.5).
In a study conducted by Guo and others (1997), the movement of lipid during
soymilk heating was observed. In this study, heated soymiIk at different temperatures was
separated into particulate, soluble and floating fractions through centrifugation, They
concluded that fat migration occurs in two stages, In the first stage, fat is released into the
soluble fraction at 65-75 "C and then the fat migrated from the soluble to the floating fraction
at temperature above 75 "C in the second stage. In this study, they also reported that the
release of fat from the particulate to the soluble fraction is due to the denaturation of the
glycinin protein. These findings correspond to the results reported by Aoki and others (1980),
where they reported that emulsifying capacity and stability decreases with heat with the
lowest was observed at 85 "C.
23
COLOR, GAS CHROMATOGRAPHY AND
SENSORY EVALUATION
Hearing, taste, touch, smeIl and vision are all the senses that we use to evaluate food
and all of these senses play a roll in the acceptance of food. Appearance is one of the first
sensory inputs when we examine foods. This sensory input gives us clues on what to expect
from the food. For example, a brown banana indicates over ripeness of the food or clumps in
the milk indicate spoiled milk. The appearance judgment is something that we have been
trained since the day human were able to see and therefore it varies from one person to
another or from one culture to another. Appearances are classified into two areas; color (blue,
red, yellow, etc.) and geometric attributes or appearance (size, shape, glossy or surface
texture). (Hunter and Harold 1987).
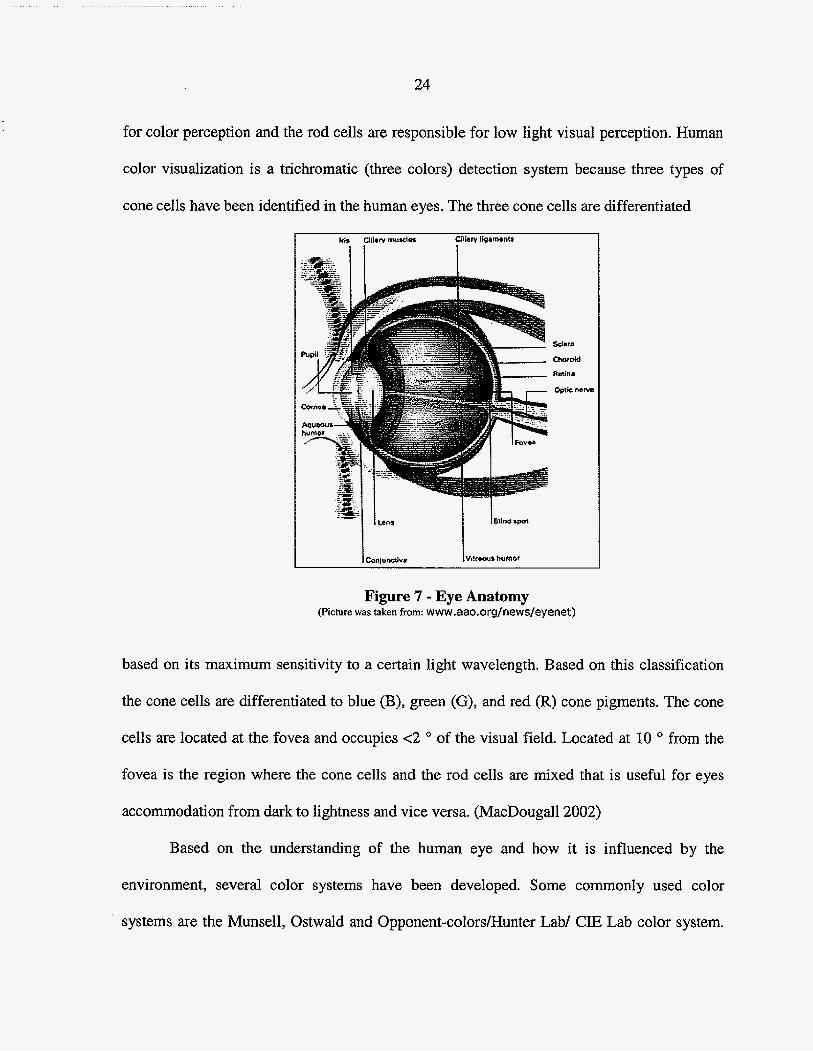
The organ that makes it possible for human to see is the eyes (Fig. 7). The eyes act as
a receptor of light and allow us to see. The light that enters the eyes goes through a flexible
lens that allowed the light to be focused onto the fovea part of the retina. The retina is the
light detecting membrane and fovea is the region at the center of the retina. The amount of
light that goes through the eyes are controlled by the iris, which acts like a diaphragm in a
camera; the less intense is the light the more the iris is opened and the opposite for more
intense light. (MacBougall2002).
The light that is focused into the fovea is then transmitted to the optic nerves and
carried to the brain, which then translates and interprets as a visual image. There are two
light-detecting cells within the retina, the rod and cone cells. The rod cells are more sensitive
than the cone cells, and that is why it is used for in response to darkness or lightness
condition; however it does not have the ability to detect coIor, The cone cells are responsible
24
for color perception and the rod cells are responsible for low light visual perception. Human
color visualization is a trichromatic (three colors) detection system because three types of
cone cells have been identified in the human eyes. The three cone cells are differentiated
Sdara
Figure 7 - Eye Anatomy (Picture was taken from: www.aao.org/news/eyenet)
based on its maximum sensitivity to a certain light wavelength. Based on this classification
the cone ceIls are differentiated to blue (B), green (G), and red (R) cone pigments. The cone
cells are located at the fovea and occupies e2 of the visual field. Located at 10 O from the
fovea is the region where the cone cells and the rod cells are mixed that is useful for eyes
accommodation from dark to lightness and vice versa. (MacDougall2002)
Based on the understanding of the human eye and how it is influenced by the
environment, several color systems have been developed. Some commonIy used color
systems are the Munsell, Ostwald and Opponent-coIors/Hunter Lab/ CIE Lab color system.
25
The color systems are based on 3 dimensional color scale, The vertical scaIe is a measure of
value or brightness or lightness-darkness (terms are based on the individual systems); and the
horizontal scale is a measure of color (in this case the term used could be hue and chroma,
hue and depth or yellowness-blueness and redness-greenness) (Hunter and Harold 1987). The
location of the rod and cone cells within the retina is also used as the basis of the CIE
standard colorimetric observer. Currently there are two accepted standard observer: 2"
(proposed in 1931) and 10" (proposed in 1964) standard observer (MacDougall2002). Since
the type of light being used to illuminate the samples can affect the perceived color
appearance, several standard illuminations have been proposed; such as Illuminant C and
D65. The illumination standard is based on the temperature of the Iight source. The
illuminant C has a light source temperature of 6,770 K and the D65 has a light source
temperature of 6,500K. The commonly use illumination and standard observer is D65 and
10" standard observer. (MacDougall2002)
Instrumental measurements to measure the appearance of various food products
employ the use of uses direct color measurement or photoelectric measurement. Direct color
measurement employs the use of color atlases and compared directly to the samples being
measured. Therefore, in this method the color is measured both objectively and subjectively.
The commonly used color atlases are the MunselI and Swedish NCS atlases. A Lovibond
Tintometer is an instrument that is created to match the color of the sample using colored
filters. The other type of color measurement instruments are the photoelectric instruments.
There are two photoelectric instruments that have been developed for color measurement: the
trichromatic colorimeters and the spectrophotometer system. An example of trichromatic
colorimeters is an instrument developed by Hunter in 1940s. The instruments consist of a
26
light source, three wideband red, green, and blue filters to match 2 O standard observer and
CIE standard illurninant C. Currently more advanced version of Hunter are available as well
as the handheld versions, In a spectrophotometer, instead of using a filter as in the
colorimeters, it uses an integrating spheres and a diffraction grating to measures all spectrum
of visible Iight (380-700 nm). The result is expressed as the ratio between the reflected light
from the sample and a reference light standard and usually expressed as a percentage. In the
modern spectrophotometer, an extra reference beam is used to minimized error and ensuring
stability. With a spectrophotometer, the surface of the sample plays an important role in the
results; i.e. a glossy surface vs. a rough surface. Extra care need to be done when using the
spectrophotometer because the sphere is prone to be contaminated by the sample.
(MacDougall2002)
Instrumental measurement of aroma is available through the invention of gas
chromatography. Chromatography is derived from the word “chroma” which means color
and “graphein” which means to draw. The concept is derived when a black ink is blotted on a
piece of water absorbing paper, and the paper separates the colors that are present in the
black ink into its individual colors. This basic principle is the common principle that drives
the development of various chromatography methods, such as thin layer chromatography
(TLC), gas chromatography (GC) and high performance liquid chromatography (HPLC).
Chromatography methods have the same basic components, which consists of mobile and
stationary phase. The development of various chromatography methods has created a
powerful tool of analysis. Chromatography can be use for the detection of vitamins,
pesticides, sugars, fatty acids, amino acids, food additives, flavor and odor compounds. For
flavor and odor analyses, gas chromatography is a commonly chosen method of analyses.
27
Capillary GC columns consist of fused silica tubing
tubing provides structural support and protection, whereas the
and the stationary phase. The
stationary phase is responsible
for sample separations. Fused silica tubing is made using high purity synthetic quartz (SiOa)
and covered with polyimide for protective coating; and to minimize sample interaction with
the tubing, the inner surface is chemically treated. The poIyamide coating has an upper
temperature limit of 360 "C or short term at 380 OC (McNair 1998, Agilent 2002).
The stationary phase can be made using numerous materials; the most common ones
are polysiloxanes and polyethylene glycol. The polysiloxanes has a siloxane backbone with
each silicon atom having two functional groups. The functional groups attached to the
backbone differentiate the uses of the column and the column properties. The most common
functional groups are methyl, cyanopropyl, trifluoropropyl and phenyl. Some examples of
this type of columns are the DB-1 and the DB-5 columns. The DB-1 column has all of the
polyxsiloxanes backbone substituted with methyl groups. The DB-5 column contains (5%-
Phenyl)-methylpolysiloxanes, which means that phenyl, substituted 5% of the backbone and
the other 95% is substituted with methyl functional groups. The properties of DB-1 and DB-5
column are (1) non-polar, (2) excellent general-purpose column, (3) low bleed, (4) wide
range of applications, (5) high temperature limits, (6) bonded and cross-linked, and (7)
solvent rinsable. The DB-I and DB 5 column can be used for semivolatiles, alkaloids, drugs,
F M s , halogenated compounds, pesticides and herbicides. The different between these two
columns are the degree of polarity of the stationary phase. (McNair 1998, Agilent 2002).
The polyethylene glycol stationary phase is usually non-substituted. These stationary
phases are less stable, less robust and have lower temperature limits than the polysyloxanes
28
stationary phase, however, it has unique separation properties. An example of this type of
column is the DB-Wax column. (McNair 1998, Agilent 2002).
Once the sample is ready to be injected, the sample is desorbed from the syringe by
heating the injection port. During the injection of the sample, three methods of injection can
be applied: split, splitless and in cohmn injection mode. A split mode is used when only high
concentration compounds are of interest and usually this method is used when doing
compound quantification. A splitIess mode is used when the compound of interest is
available in trace amounts or the presence of excess amount of solvent. Using the splitless
method, a large volume of samples is needed. With the split method, recommended samples
should have narrow boiling point ranges, not thermally labile and are non-absorptive on high
surface area supports. Whereas in the splitless method, recommended samples should not
contain Tow boiling point compounds, thermally labile and samples which tend to adsorb on
glass surfaces. (Varian manual 1989, McNair 1998).
Once the samples are separated in the column into each individuaI compounds, the
samples are then detected by the detector. In G.C., the available detectors are Thermal
Conductivity Detector (TCD), Flame Ionization Detectors @!ID), Electron Capture Detector
(ECD), Flame Photomerrjc Detector (FPD) and Nitrogen-Phosphorous Detector (NPD), TCD
has poor sensitivity and is used less in food applications. In food applications, mD is the
most widely used detectors; this detector has good sensitivity for organic compounds. ECD is
widely used in pesticides residue determination and has the ability to detect halogen,
nitrogen, phosphorous, sulfur, metals or conjugated double bonds compounds. FPD and NPD
are selective detectors for sulfur/phosphorous and phosphorous/nitrogen compounds
detection (Reineccus 1994, McNair 1998). The responses that are created by the detector is
29
then converted into electrical response and with the help of an interface, the time needed for
the compound concentration to reach the detector can be recorded as retention time (RT) and
the intensity of the compound as peak height or area. The samples can be identified by
comparing the RT of flavor standards or with the help of a mass spectrophotometer.
Gas chromatography in conjunction with sensory analyses of foods can provide
important information about the flavor properties of a food product. Equilibrium headspace is
defined by Wyllie, and others (1978) as ". . . the gaseous mixture surrounding a sample within
a closed system at equilibrium". Headspace analysis is the analyses of the equihbrated
headspace above the sample for its constituents. In studying the aroma of foods, headspace
analysis is the method of choice because it measures compounds that are responsible for the
aroma of foods. Another advantage is in the measurement of low boiling point flavor
compounds; in most solvent extraction methods, these low boiling point flavor compounds
would be lost during solvent removal. In addition, the presence of the high solvent peak may
hide the some of the low boiling point volatile compounds. Equilibrium headspace sampling
is a rapid and efficient method and the compounds of interests are less likely to be modified
during sample collection (Maarse, 1991). Dynamic headspace analyses method resembles the
flavor release during the ingestion of foods. During the ingestion of foods, the foods are
macerated and aromas are released at a certain rate (samples). These aromas are then carried
to the nose cavities and capture by the various nose receptors (detectors) and the signals are
transmitted to the brain for interpretation.
The disadvantages of using headspace sampling are that volatiles are usually present
in small samples concentrations and water vapor disrupts measurement. Unlike our nose
receptors, which are able to detect very small quantities of volatile compounds, instrumental
30
analysis has not been able to match the sensitivity of the nose. Therefore, in headspace
analyses, a pre-concentration method is needed in order for the G,C+ to detect the
compounds. An exarnpIe of a pre-concentration method is through cryogenic focusing or
using absorbent materials (ex. Charcoal, Tenax, or SPME). In cryogenic focusing, as the
sample is injected, the sample is concentratedlfreeze/liquidized into a thin layer within the
column with the heIp of cryogenic coolant (ex. Liquid nitrogen, dry ice and acetone).
The most sensitive sensory identification instruments do not tell the kind of sensory
stimulus that is perceived by humans. Therefore, instrumental measurements are more useful
when combined with sensory evaluation methods for flavor determination. Sensory
evaluation is defined by Lawless and Heymann (1998) as “a scientific method used to evoke,
measure, analyze and interpret those responses to products as perceived through the senses of
sight, smell, touch, taste and hearing”. A sensory food scientist must be able to master all the
attributes stated by the definitions, which is to “evoke, measure, analyze and interpret”, in
order to gain useful sensory information from a product.
Sensory analysis testing methods can be dassified into discrimination, descriptive
attribute, difference and affective tests. A discrimination test is a test to test for differences
between products; some examples are triangle test, duo-trio test, and sequential test. A
descriptive test is a more detailed sensory test, where the product is analyze and measured for
its specific sensory properties (eg. flavor, aroma, texture, and color). Some examples of
descriptive test are flavor profile@, quantitative descriptive analyses (QDAB), texture profile
(TPA), time intensity descriptive analyses, and sensory Spectrum@. Attribute difference tests
are similar to discrimination test, except it is differentiating specific sensory attributes
between products; some examples are paired comparison, simple ranking, and pair wise
31
ranking test. Affective test are tests to measure the degree of liking or disliking of a product,
there are two types of this test acceptance and preference test. (Lawless and Heymann 1998,
Meilgaard, Civille, Carr 199 1)
Choosing the type of sensory test to be used depends on the type of information
wanted. Some sensory tests cannot be combined with other tests. For example, preference
test cannot be combined with descriptive test; the trained panelists in the descriptive test are
too inform with the product and may bias their preference results on the product. A
Descriptive analyses test is used when more specific sensory information are needed fiom a
product. This test involves familiarizing a group of tester/panelists with the product and
having them describe and measure the flavor intensity of the product. The group of panelists
is lead by a panel leader, which will lead the panelists to be train with the sensory attributes
of the product. The panelists can be screened based on their enthusiasm about the project,
their commitment and their taste sensitivity. (Lawless and Heymam 1998, Meilgaard,
Civille, Carr 1991)
The methods by which the panelists are trained are varied. The panelists can describe
their own set of descriptive terms or they could be provided with a list of descriptive terms
from which they could choose. Once the set of terms are chosen, the panel leader will then
need to calibrate the panelists with the perceived sensory attributes. One way to achieve this
is by providing the panelists with a set of standards, which the panelists need to familiarize
and reach a consensus among the trained panelists on the intensity of the standards on a
scale. In developing the descriptive terms, it is necessary to avoid redundant terms or terms
that describes similar flavor. (Lawless and Heymann 1998, Meilgaard, Civille, Can 1991)
32
Training is the most important part of descriptive analysis, because it is the step
where the human panelists are being calibrated as an instrument for measurement. Depending
on the method, the panel leader can be an active role during the training step, such as in the
flavor profile method, or a passive role, such as in the QDA method. Over a long period of
testing period, the panelists need to be recalibrated to maintain consistency. (Lawless and
Heymann 1998, Meilgaard, Civille, Carr 1991)
The trained panelists then record their responses in a scale that could be analyzed
statistically. An example of a commonly use scales is the line scale. The line scale is a 15 cm
horizontal line anchored with the descriptive words generated by the panelists, located at
both sides of the line placed 1 crn from the ends. The purpose of the anchors is to reduce the
tendency of the panelists to use the center part of the line. Once the data are collected, they
can be analyzed statistically using analysis of variance or multivariate statistical techniques.
(Lawless and Heymann 1998, Meilgaard, Civille, Carr 199 1)
CONCLUSION
Based on the previous studies discussed in this literature review, three research
objectives are proposed for improvement in soymilk processing and new product
development. The purpose of the first study is to optimize the use of soy flakes for soymilk
production based upon solids, protein and flavor properties. The objective of the second
study is to evaluate the differences in the flavor of soymilk made from lipoxygenase-free soy
flakes and deodorized soymilk. The third study is to evaluate the efficiency of lipid removal
from soyrnilk produced from whole soybeans and full fat soy flakes at three solid levels.
33
THl3 INFLmNCE OF TEMPERAWE AND REHYDWTION TIME
ON THE PRODUCTION OF SOYMILK MADE FROM FULL FAT
FLAKES
A paper to be submitted to the Journal of Food Science
S. Prawiradjaja and L.A. Wilson
ABSTRACT
TradtionaIly, soymilk has been made with whole soybeans. However, there are other
alternative raw ingredients for making soymilk, such as soy flour or full-fat soy flakes. The
preferable soymilk flavor for U.S. markets is soymilk with Iittle or no beany flavor.
Modifying the process or using lipoxygenase-free soybeans can be used to achieve this
desired trait. Most studies have looked at processes using whole soybeans. This project
reports the optimized production of soymilk using full-fat soy ff akes by modifying the water
temperature and rehydration time soy flakes were used to make soymilk using a commercial
Takai Soymilk machine. Three different percent solid soymilks (5, 8, and 12 "Brix) were
prepared on separate days. On each processing day, soymilk was prepared by rehydrating
flakes at 0, 5, and 10 minutes with 15, 50 and 85 "C water. Proximate and trypsin inhibitor
analyses were done on the soymilk, okara, and soy flakes. Headspace analyses using gas
chromatography was used to measure hexanal levels. Prior rehydration of soy flakes is
necessary to prevent agglomeration during processing and to increase extractability. As the
rehydration temperature increases from 15 to 50 to 85 *Cy the hexanal concentration was
reduced. The effect of heat on enzyme inactivation (measured by hexanaI levels) is similar to
34
previous reports of the influence of heat during soymilk processing with whole beans.
However, the rehydration times are shorter for the flakes (5 to 10 minutes) compared to
whole beans (8 to 12 hours). The optimum rehydration conditions for a 5, 8 and 12 ‘Brix
soymilk are 50 OC for 5 minutes, 85 “C for 5 minutes, and 85 “C for 10 minutes respectively.
Key words: soymilk, soy flakes, rehydration time, optimization, hexanaI, soy protein
INTRODUCTION
Soymilk is made by a water extraction of soybeans. Its appearance is similar to cow’s
milk, and nutritionally superior to other legumes (Philip and Helen 1973; Steinkraus, and
others 1978). In China, soybeans are called the “greater beans” due to their many health
benefits (Simoons 1991). Soybean consumption has been proposed to be useful as an anti-
carcinogenic activity, a cholesterol-lowering agent, to prevent calcium lost in bones, and as a
phyto-estrogen source (Messina 1995). Soybeans are an inexpensive source of high quality
protein. The high quality protein of soybeans is useful as a protein substitute or a supplement
for people in developing countries (Messina 1995, Iwuoha and Umunnakwe 1996). In the U.
S., the Food and Drug Administration (FDA) recently approved a health-labeling claim for
products containing soy protein in October 1999. Daily consumption of 25 g (or 6.25 g per
serving) of soy protein may reduce the risk of heart disease, due to the cholesterol lowering
effects associated with soy protein (Henkel2000).
Based on the market research conducted by SoyaTech in 1999, the saIes of soy foods
in the U.S. were projected to increase from $2.1 billion to $3.57 billion by 2002 (Soya Tech
1999). In 2002, Soya Tech released a new report showing that the soy food industry had
35
already reached $3.2 billion in sales by 2001. Soymilk sales alone in 2001 have reached $550
million and were projected to reach $1 billion in the coming three to five years (Soyatech
2002).
The acceptance of soy foods in the western market is affected in part due to its off-
flavor (Wilson 1985; Feng and others 2001). The off-flavor of soy foods is caused by the
activity of lipoxygenase enzyme (Wilkens 1967). Many methods have been developed in
order to eliminate this off-flavor such as processing modifications or eliminating the
lipoxygenase enzyme through genetic modifications (Wilson 1996, Kwok 1995). Processing
modifications involve in rapid enzyme deactivation using heat, such as the Illinois method,
hot grind method, rapid hydrothermal coolung (RHC) and pH adjustment methods (Kwok
1995; Liu 1997).
Most soymilk processes use whole soybeans as the starting material, however there
are other raw forms of soybeans that can be used to make soymilk, such as soy flour or full
fat soy flakes (Moizuddin and others 1999). Most studies have looked at optimizing the
production of soymilk using whole soybeans. The use of soy flakes for soymilk production
has not been studied extensively. The purpose of this study is to optimize the use of full fat
soy flakes for soymilk production based on solids, protein and flavor properties.
MATERIALS AND METHODS
Materials
XLRB soy flakes were provided by MicroSoy Corporation (Jefferson, Ia, U.S.A.).
XLRB is a blend of three IA high-protein identity preserve cultivars of soybeans blended for
36
soy flakes production. All chemicals used for analyses were reagent grade (Fisher Scientific,
Fair Lawn, NJ, U.S.A.).
Soymilk production
Soymilk was prepared at the Center for Crops Utilization Research (CCUR) piIot
plant at Iowa State University (Ames, Ia, U.S.A.). The soymilk was produced using the Takai
Automated Soymilk and Tofu System (Takai Tofu and Soymilk Equipment Inc. Japan), using
the method of Moizuddin and others. (1999). The ratio of flakes to water used depends on the
percent solids that were planned on each day of processing. On each processing day, only
one level of solids was made. Soy flakes were rehydrated with a rotating paddle mixer using
25, 50 or 85 "C water. Timing was started at the first contact of flakes with water. At 0
minute rehydration, the flakes were placed directly into the cooking tank. Randomization was
appIied in the order of rehydration time and temperature to rehydrate the soy flakes,
After rehydration at each temperature was completed, the soymiIk slurry was heated
to 95 "C, the soymilk was then held at this temperature 7 minutes for 5" and 8 Obrix soymilk
and 10 minutes for the 12 "brix soymilk to allow pasteurization and reduction of trypsin
inhibitor levels. The hot slurry was then pumped into a 120 mesh, horizontal rotating
cyIindrical screen to separate the insoluble solids. The remaining insoluble solids were roller-
pressed over a 100-mesh screen drum. The soymilk was then homogenized at 7000 psi and
collected in capped 2L plastic bottles. All soymilk samples were immediately sealed and
refrigerated until analyses the following day.
The percent soymilk and okara yield of the process is calculated using the following
equation:
37
Okara I Soymilk Wt. Water Wt. + Soy Flakes Wt.
% Soymilk I Okara Yield = x 100%
Gas chromatography
Headspace analysis (Wilson and others., 1992) was conducted for all soymilk
samples using a Varian 3740 Gas Chromatography (GC) equipped with dual flame ionization
detector (FBI). The temperature of the injector and detector was held constant at 150 "C and
230 "C respectively. The initial column temperature is 50 "C. A DB5 fused glass silica
column (J&W Scientific, Palo Alto, CA) was then programmed to heat at a rate of 10 "C/min
until the column temperature reaches 230 "C and held at this maximum temperature for 3
minutes. Hydrogen and nitrogen gas flow rate was set at 30 d m i n and oxygen flow rate was
set at 300 mllmin. The output from the gas chromatograph was recorded using a Hewlett
Packard integrator model 3390A (Fisher Scientific, Fair Lawn, NJ). Hexanal peak was
identified using a hexanal standard (Sigma Aldrich, St. Louis, MO)
Headspace analyses method
Samples for headspace analyses were prepared by placing twenty five grams of
soymilk into a clear glass bottle and sealed with a Teflon coated septa and standard
aIuminum seal (Supelco, Inc., St. Louis, MO). Samples were incubated with a water bath at
37 "C with continuous stirring for at least 30 minutes. Liquid nitrogen was used to cryo-focus
the headspace sample in the column. Two ml of headspace was sampled using a 5 ml
Hamilton gas-tight syringe and injected at a rate of 1 mI/min. Duplicates of headspace
analysis were done on each samples.
38
Color measurement
The color of soymilk was determined using a 5100 LabScan (Hunter Color Lab,
Fairfax, VA). Soymilk samples were placed into 60 X 15 mm diameter plastic petri dishes
(Fisher Scientific, Fair Lawn, NJ) and measurements were taken on the soymilk surface
using a 0.25-inch sampling port under D65 illumination and 10 O standard observer. Three
measurements of each sample were done at three different sites on the surface of the soymilk.
Proximate analyses
Moisture was analyzed using AOAC method 925.19. (AOAC 2000). Crude protein
was determined using the micro Kjeldahl AOAC methods 955.04(c) and 954.01(AOAC
2000), with Kjeltab TCT was used as the catalyst instead of HgOz. Percent fat content of the
samples was determined by Woodson-Tenent Laboratories Inc. (Des Moines, IA) using acid
hydrolyses AOAC method 989.05 (AOAC 2000).
Statistical analyses
Data were analyzed using one-way analyses of variance (ANOVA) and differences
among treatment means were analyzed by least significant difference (LSD). The optimum
point of rehydration and hexanal peak were determined using response surface regression
analysis. SAS System 8.02 (SAS Institute Inc., Cay , NC) statistical program was used for
the statistical calculation.
39
RESULTS AND DISCUSSION
Processing data
The three different solid levels of soymilk were chosen because they represent the
commonly used soIid level in the production of various soy products. Five 'Brix soymilk is
commonly produced for the production of firm style tofu; 8 'Brix soymilk is the solid Ievel
commonly produced for commercial soymilk; and 12 "Brix soymilk is the solid level
commonly produced for the production o€ base milk for transport efficiency. Traditional
soybean processing method uses cold water for grinding and soaking the soybeans, whereas
in the modified version of soymilk processing uses hot water grinding. Therefore, 15 'C
rehydration was chosen to represent the traditional method; 85 "C rehydration was chosen to
represent the hot water grinding, and 50 "C rehydration was chosen as the middle
temperature point,
Table f shows the yield data collected during the processing stage. It is observed that
the efficiency of the liquid extraction process decreased at 12 'Brix soymilk and at 85 "C
rehydration. The decrease in the extraction efficiency at the higher solids level may be
caused by the inability of the pump to transport the soymilk into the separator and therefore
cause a decrease in soymilk yield.
The okara produced in 8 "Brix soymilk at 85 OC rehydration is higher than at 15 and
50 "C rehydration. These results suggested that the okara retains more water or some protein
bodies was left in the soy flakes due to the higher rehydration temperature and therefore
reduces the soymiIk yield. During the 0 minute rehydration test, soy flake agglomerates were
found and some remained inside the cooking tank with the most severe agglomeration found
for 12 "Brix soymilk which would also reduce production efficiency.
40
Rehydration optimization of soymilk at the 5 "Brix Level
At 5 "Brix level, the % moisture, % protein and % fat of soymilk shown in Figures
la, Ib and IC show that there were no differences in the moisture and protein (Table 2)
content between rehydration times at 15 and 50 "C ( ~ ~ 0 . 0 5 ) . The % moisture of soymilk
were found to be lower at the higher rehydration temperature (50 "C). There was no
statistical significant difference in the % protein of soymilk at all rehydration times and
temperatures.
However, there is a statistical difference ( ~ ~ 0 . 0 5 ) between the % moisture data of the
okara (Table 2). The highest amount of moisture (or lowest amount of solids) in the okara
was found at rehydration at 15 "C for 5 minutes and rehydration at 50 "C for 10 minutes.
Lower % solids in the okara are an indication that the flakes had a better extraction at that
rime and temperature. However, the additional solids extracted were diluted in the Iarger
volume of soymilk so that even though there was a numerically higher extraction at both
temperatures it did not produce a statistical difference in the soymilk. There was no statistical
difference ( ~ ~ 0 . 0 5 ) found in the okara % protein and % fat data (Table 2).
The results show that at 5 "Brix, the flakes to water ratio is low enough to aIlow
proper rehydration of the flakes. The steam injection dong with the agitator inside the
cooking tank is sufficient to rehydrate the flakes without any additional rehydration time.
However, the production of lower solids okara is desirable from the processing standpoint,
because it reduces the amount of waste being generated.
41
Rehydration optimization of soymilk at the 8 "Brix Level
The results show that at 15 "C rehydration, there is no statistical difference ( ~ ~ 0 . 0 5 )
of soymilk solids, protein and fat content between rehydration times (Table 3). At 50 "C
rehydration, the highest % moisture (or lowest % solids) and protein content of soymilk was
found at 0 minute rehydration (a<0.05). At this rehydration temperature, the analyses of the
soymilk fat content did not show any statistical differences. At 85 "C rehydration, the lowest
amount of % moisture (or highest amount of % solids) and % protein was found at 5 minutes
rehydration (a<O.OS), but there was no statistical difference ( ~ ~ 0 . 0 5 ) between 0 and 5
minutes rehydration, The fat content of soymilk showed no statistical differences (a<0.05) at
all temperature and rehydration condition.
The % moisture, % protein and % fat of the okara (Table 3) showed that there is no
statistical difference (~1~0.05) between 15 "C and 50 "C rehydration across all rehydration
times. Lower amount of moisture (or higher amount of solids), protein and fat content of the
okara (cl<O.OS) were found at 85 "C rehydration. There was no difference in the moisture
content of okara between rehydration times at 85 "C. However, the Iowest amount of protein
was found at 0 minute rehydration time at this temperature.
When the amount of each nutrient content (water, protein, fat, carbohydrate and ash)
of okara are caIculated, the okara from 85 "C rehydration retains more water, protein, and fat
(Fig. la, lb, and IC ). In theory, the more solids, protein and fat components left in okara, the
fewer the amounts of solids, protein and fat that go into the soymilk. However, within the
same rehydration time, the % protein, % solid and % fat of soymilk does not show a
significant difference between them. Since, the okara retains more moisture at 85 "C
rehydration, the amount of water that went into the soymilk is reduced as well, and therefore
42
concentrating the soymilk showing higher % composition. These results confirm previous
findings by Johnson and Snyder (1978) that blanching of soybeans with temperature greater
than 85 "C would cause poorer protein extraction of soybeans. The higher rehydration
temperature heat fixed the protein within the cell; in addition, along with the protein trapping,
water and fat globules are trapped as well.
In order to find the optimum rehydration point statistically, the data were analyzed
with a response surface regression analysis. The analysis indcates that optimum solid and
protein extraction can be achieved at 30 "C rehydration for 6 minutes and optimum fat
extraction can be achieved at 40 OC rehydration for 6 minutes (Fig. 2a, Zb, and 2c).
Rehydration optimization of soymilk at the 12 "Brix Level
There were no statistical differences (a < 0.05) in % moisture, % protein and % fat of
soymilk between rehydration times at 15 OC (Table 4). At 50 "C rehydration, there is a
statistical difference (a e 0.05) in % moisture, % protein and % fat of soymilk between 0
minute rehydration and the 5 to 15 minutes rehydration; with the 0 minute having the highest
mount of moisture (or the lowest amount of solids) and the lowest amount protein. At 85 "C
rehydration, statistical differences (a < 0.05) of % moisture of soymilk were found between
rehydration times. The % moisture of soymilk decreases (or % solid of soymilk increases) as
the rehydration time increases (from 5 - 15 minutes). There were no statistical differences (a
< 0.05) in % protein of soymilk at this rehydration temperature.
At 15 OC rehydration, there is no statistical difference (a < 0.05) in the % moisture, %
protein and %fat content of okara (Table 4). At 50 "C rehydration, 0 and 5 minutes
rehydration has lower moisture (or higher solids) and lower fat content than 10 and 15
43
minutes rehydration (a < 0.05), with no statistical difference (a -= 0.05) in the % protein. At
85 "C rehydration, there is no difference in the % moisture content of okara. However, the %
protein of okara decreases over time at this rehydration temperature. The % protein of okara
at 85 "C rehydration was higher (a < 0.05) than rehydration at 15 and 50 *C, which supports
the previous data of protein fixation in the soy flakes cell.
At O-minute rehydration the flakes were noted to agglomerate severely during
processing, which would reduces the extraction efficiency. The decrease in extraction
efficiency seen in 8 'Brix Ievel was not found at this solid level. These results suggest that at
12 O Brix, the flakes to water ratio is high enough to protect the flakes from severe protein
denaturation and additional times allow better soIids and protein extraction. The response
surface regression analysis indicates that optimum solid and protein extraction can be
achieved at 55 "C rehydration for 10 minutes and optimum fat extraction can be achieved at
40 'C rehydration for 10 minutes (Fig. 3a, 3b, and 3c).
GC and color anaIyses results
Figure 4a, 4b and 4c show hexanal concentration (shown as peak area) for 5, 8, and
12 "Brix soymdk. At 5 "Brix (Fig. 4a), there is no statistical difference (a < 0.05) between
rehydration temperatures at the same rehydration time. However, 5 minutes of rehydration
produced a significantly higher hexanaI Ievel at 15 "C.
At 8 'Brix (Fig. 4b), the hexanal content at 15 "C increases over time (a < 0.05),
whereas at 50 "C the hexanal peak increases and then stays the same after 5 minutes of
rehydration (a < 0.05). The combination of enzyme activity and enzyme inactivation at 50 "C
overall produces a lower level than 15 "C. At 85 "C the hexanal peak remains constant across
44
rehydration times, however the values are lower than at 15 or 50 OC (a < 0.05). The results
support previous studies by Wilkens and others. (1967), where the development of off-
flavors was prevented by the blanching step. At 15 "C rehydration, the enzyme was not
inactivated and therefore continues to develop more hexanal over time.
At 12 "Brix (Fig. 4c), temperature and time effects were noted for the hexanal content
of soymilk. At 15 'Cy the highest hexand content occurs at 5 minutes rehydration, whereas at
50 "C the highest hexanal content occurs at 15 minutes rehydration. Across temperature
within the same rehydration time, statistical differences were found at 5 and 15 minutes of
rehydration. The trend that was found at these rehydration times was that lower hexanal
peaks were found at higher rehydration temperature ( ~ ~ 0 . 0 5 ) . The lower hexanal content at
higher temperature (85°C) was similar to the 8 O Brix results. The response surface regression
analysis does not indicate which time and temperature combination would produce the least
amount of hexanal being generated at 8 and 12 "brix soymilk. The analyses indicates that the
least amount of hexanal would be produced at 0 minute and at 0 "C temperature, which
would be reasonable theoretically because the enzyme reaction is prevented .by increasing its
energy of activation and reducing the reaction time (Fig. 5a and Sb). However, it is not
possible to produce soymilk under that condition.
The Hunter color measurement of the soymilk does not show any significant
differences between the treatments of the soymilk (data not shown).
CONCLUSION
Similar to many powdered raw material alternatives to whole soybeans, immediate
introduction to the water would cause the powder to agglomerate. Soy flakes are no
45
difference than its powder counterparts. Initial rehydration step is needed in order to process
soy flakes, unless the equipment is able to break the agglomeration of the product.
High temperature rehydration, similar to previous study with whole soybeans, would
causes protein denaturation, which would heat fixed the protein within the soy flakes. Protein
fixation in soy flakes is followed by fat and water fixation as well. Based on the GC data,
flavor improvement can be achieved though this high temperature rehydration (pre
blanching step) with no significant color changes to the soymilk. Based on this study,
optimum condition for flavor improvement and extraction of soy flakes processing for 5, 8
and 12 'Brix soymilk production can be achieved by rehydration 5 minutes at 50 "C, 5
minute at 85 "C and 10 minute at 85 "C respectively.
REFERENCES
AOAC. 2000. Official Methods of Analysis. 17* Ed. Washington, D.C.: Association of
Official Analytical Chemists.
Davis CS, Nielsen S S , Nielsen NC. 1987. Flavor improvement of soybean preparations by
genetic removal of lipoxygenase 2. J. Am. Oil. Chem. SOC. 64: 1428-1433.
Feng YW, Acree TE, and Lavin EH. 2001. Processing modulation of soymilk flavor
chemistry. In: Takeoka GR, Guntert M, Engel KH, editors. Aroma Active
Compounds in Foods: Chemistry and Sensory Properties. ACS Symposium Series
794. p 25 1-264.
Henkel J. 2002. Soy: Health claims for soy protein. Questions about other components. FDA
Consumer May - June 2000. Washington, D.C.:U.S. Food Drug Administration,
Available from: www .cfsan.fda.gov/-dms/fdsoypr*html. Accessed May 29.
46
Iwuoha CI., Urnunnakwe KE. 1997. Chemical, physical, and sensory characteristics of
soymilk as affected by processing method, temperature and duration of storage. Food
Chemistry. 59(3): 373-379.
Kwok KC, Niranjan K. 199s. Review: Effect of thermal processing on soymilk. InternationaI
Journal of Food Science and Technology. 30: 263-295.
Liu R. 1997. Soybeans: chemistry, technology, and utilization. Chapman & Hall. New York,
N.Y. 532 p.
Messina M. 1995. Modern applications for an ancient bean: Soybeans and the prevention and
treatment of chronic disease. American Institute of Nutrition. 567s -569%
Moizuddin S, Harvey G, Fenton AM, Wilson LA. 1999. Tofu production from soybeans or
full-fat soyflakes using direct and indirect heating processes. J. Food Sci. 64(1): 145-
148.
Philip S, Helen D. 1973. Soybean for Health and Langer Life. New Canaan, Ct.: Keets p 3-4,
73-79.
Simoons FJ, 1991. Food in China. A cultural and Historical Inquiry. Boca Raton, Fl.: CRC
Press Inc. 600 p.
SoyaTech. 1999. The north american soy foods market. Bar Harbor, Me.: SoyaTech Inc. and
SenechaI, Jorgenson & Hale Co., www.soyatech.com. Accessed: June 7.
SoyaTech., 2002. Soya Foods: The US Market 2002. Bar Harbor, Me.: SoyaTech Inc. and
Senechal, Jorgenson & Hale Co., www.soyatech.com. Accessed: June 7,
Steinkraus KH. 1978. Imitation Milk. In: Peterson NS, Johnson AH, editors. Encylopedia of
food science. Westport, Ct.: AVI. p 405-406.
47
Wilkens WF, Mattick LR, Hand DB. 1967. Effect of processing method on oxidative off-
ff avors of soybean milk. Food Technology. 21: 86-89.
Wilson LA. 1985. Flavor binding and the removal of flavors from soybean protein. In:
Shibles R, editor. World Soybean Research Conference m: Proceedings. Boulder and
London: Westview Press. p 158-165.
Wilson LA,, Murphy PA, Gallagher P. 1992. Soyfood. Product Markets in Japan: U S
Export Opportunities. MATMC. Iowa State University. Ames, Ia.
Wilson LA. 1995. Soy Foods. In: Erickson DR, editor. Practical handbook of soybean
processing and utilization, Champaign, 11.: APCS Press. p 428 - 459.
Wilson LA, 1996. Comparison of lipoxygenase-null and lipoxygenase-containing soybeans
for foods. In: Piazza M, editor. Lipoxygenase and lipoxygenase pathway enzymes. St.
Louis, Mo.: AOCS Press. p 209-225.
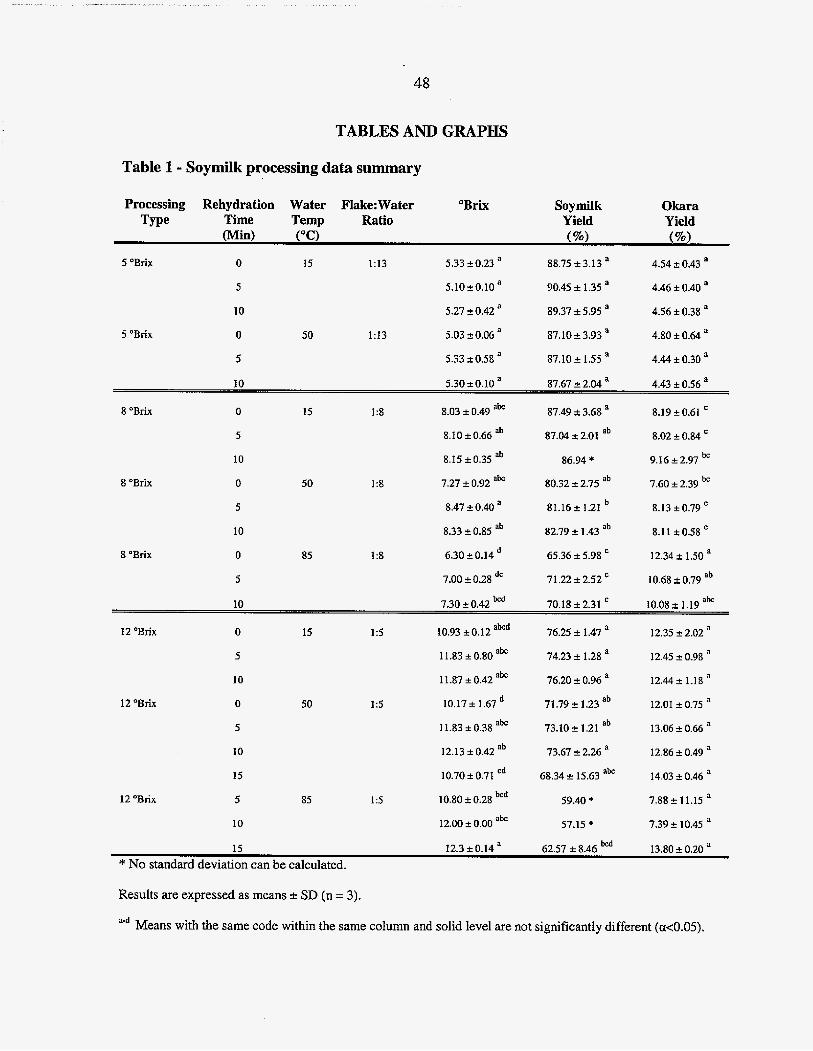
48
TABLES A N D GRAPHS
Table 1 - Soymilk processing data summary
5 "Brix 50 1:13
8 "Brix 50
8 "Brix 85
1:s
1 :8
Processing Rehydration Water F1ake:Water "Brix Soymilk Okara Type Time Temp Ratio Yield Yield
Win) ("0 I%) (%I
5 OBrix 0 I5 1:13 5.33 f 0.23 a 88.75 -+ 3.13 a 4.54 * 0.43 a
5 5.10 i:O.lO a 90.45 5~ 1.35 a 4.46 f 0.40 a
10 5.27 ? 0.42 a 89.37 5~5.95 4.56 f 0.38 a
0 5.03 f 0.06 a 87.10&3.93 a 4.80 f 0.64 a
5 5.33 k 0.58 a 87.10 5 1.55 a 4.44 i: 0.30 a
IO 5.30k0.10 a 87.67 2 2.04 a 4.43 f 0.56 a
8 "Brix 0 15 1:s 8.03 5 0.49 87.49 f 3.68 a 8.19 f 0.61
5 8. IO f 0.66 ab 87.04k2.01 ab 8.02 f 0.84
10 8.15 f 0.35 ab 86.94 * 9.16 f 2.97
0 7.27 2 0.92 80.32 & 2.75 ab 7.60 f 2.39
5 8.47 1: 0.40 a 81.16+ 1.21 8.13 f 0.79
8.1 1 f 0.58 10 8.33 rf: 0.85 ab 82.79 + 1.43 ab
0 6.30 -c 0.14 65.36 f 5.98 12.34 k 1 S O a
5 7.00 0.28 dc 71.22 f 2.52 10.68 k 0.79 ab
bc
bc
d
12 "Brix 50 1:5
12 'Brix 85 1:5
70.18 f 2.31 10.08 k 1.19 ak
12 'Brix 0 15 1:5 10.93 3~0.12 akd 76.25 f 1.47 a 12.35 2.02 a
5 11.83 f 0.80 74.23 f 1.28 a 12.45 2 0.98 a
12.44~ 1.18 a 10 11.87 f 0.42 76.20 i: 0.96 a
0 10.17 f 1.67 71.79f 1.23 ab 12.01 ~0.75 a
5 11.83 k0.38 ak 73.10 f 1.21 ab 13.06 k 0.66 a
10 12.13 f 0.42 ab 13.61 i: 2.26 a 12.86 zt 0.49 a
15 10.70 f 0.71 cd 68.34 15.63 14.03 * 0.46 a
5 10.80 f 0.28 59.40 * 7.88?11.I5 a
10 12.m f 0.00 abc 57.15 * 7.39 -+ 10.45 a
10 7.30 +: 0.42
d
13.80 0.20 a 15 12.3 f 0.14 a 62.57 f 8.46 bd
* No standard deviation can be calculated.
Results are expressed as means * SI) (n = 3).
a-d Means with the same code within the same column and solid Ievel are not significantly different (a<O.OS).
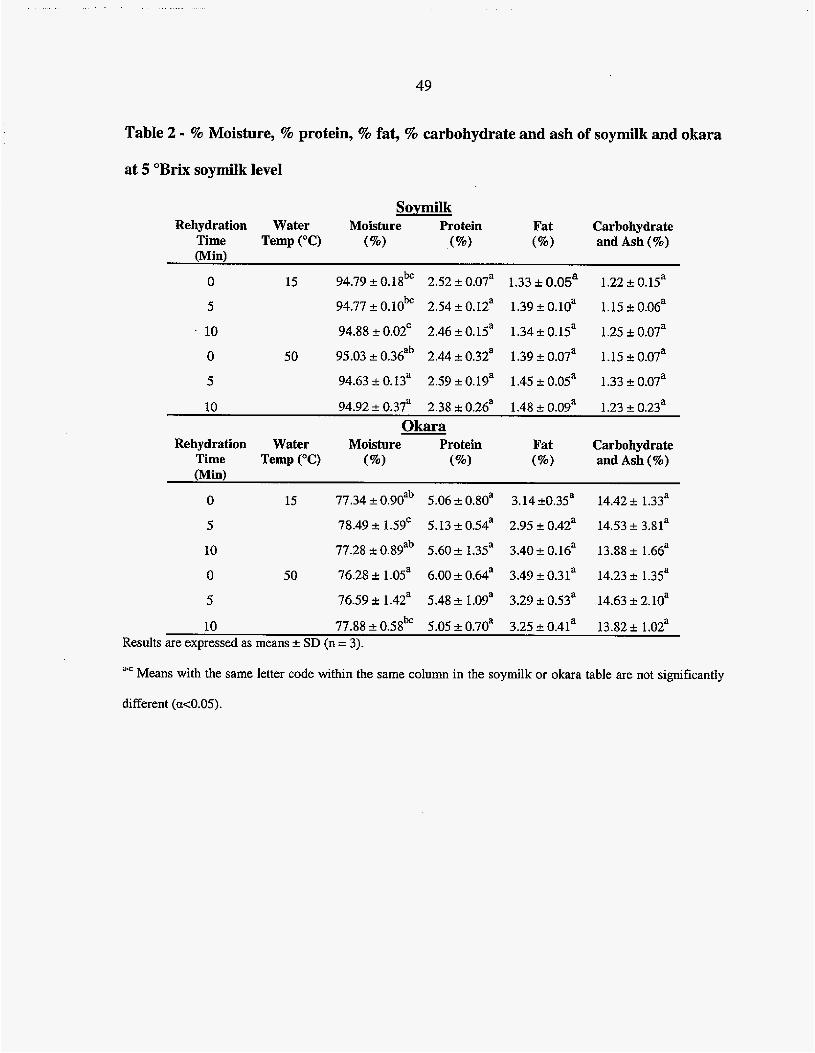
49
Table 2 - % Moisture, % protein, % fat, % carbohydrate and ash of soymilk and okara
at 5 "Brix soymiik level
Soymilk Rehydration Water Moisture Protein Fat Carbohydrate
Time TempPC) (%I and Ash (%)
0 15 94.79 A 0.18" 2.52 f 0.07a 1.33 f 0.05a 1.22 f O M a
5 94.77 f O.lObc 2.54 +. 0.12a 1.39 f O.lOa 1.15 2 O.Otja
. 10 94.88 ~0.02' 2.46 f0.15a 1.34f O M a 1.25 k 0.07a
0 50 95.03 r 0.36 2.44 A 0.32a 1.39 f 0.07a 1.15 0.07a
5 94.63 k 0.13a 2.59 A O.lga 1.45 t 0.05a 1.33 f 0.07a
10 94.92e 0.37a 2.38 A 0.2(ja 1.48 k O.Oga 1.23 + 0.23a
ab
Okara Rehydration Water Moisture Protein Fat Carbohydrate
Time TempPC) (%I (%I (%) and Ash (%) (Mid
0 15 77.34 f 0.90ab 5.06 2 O.XOa 3.14 f0.35a 14.42 f 1.33a
5 78.49 k 1-59' 5.13 k 0.54a 2.95 2 0.42a 14.53 f 3.81a
10 77.28 -c 0.8gab 5.60 f 1.35' 3.40+ O M a 13.88 f 1.66a
0 50 76.28 k l.OSa 6.00 f 0.64' 3.49 t 0.31a 14.23 f 1.3!ja
5 76.59 3. 1.42a 5.48 2 3.29 f 0.53a 14.63 f 2.10a
10 77.88f0.58bc 5.05f0.70a 3.25e0.41' 13.82k 1.02a Results are expressed as means f SD (n = 3).
a.E Means with the same letter code within the same coIumn in the soymilk or okara table are not sigruficantly
different (a<0.05).
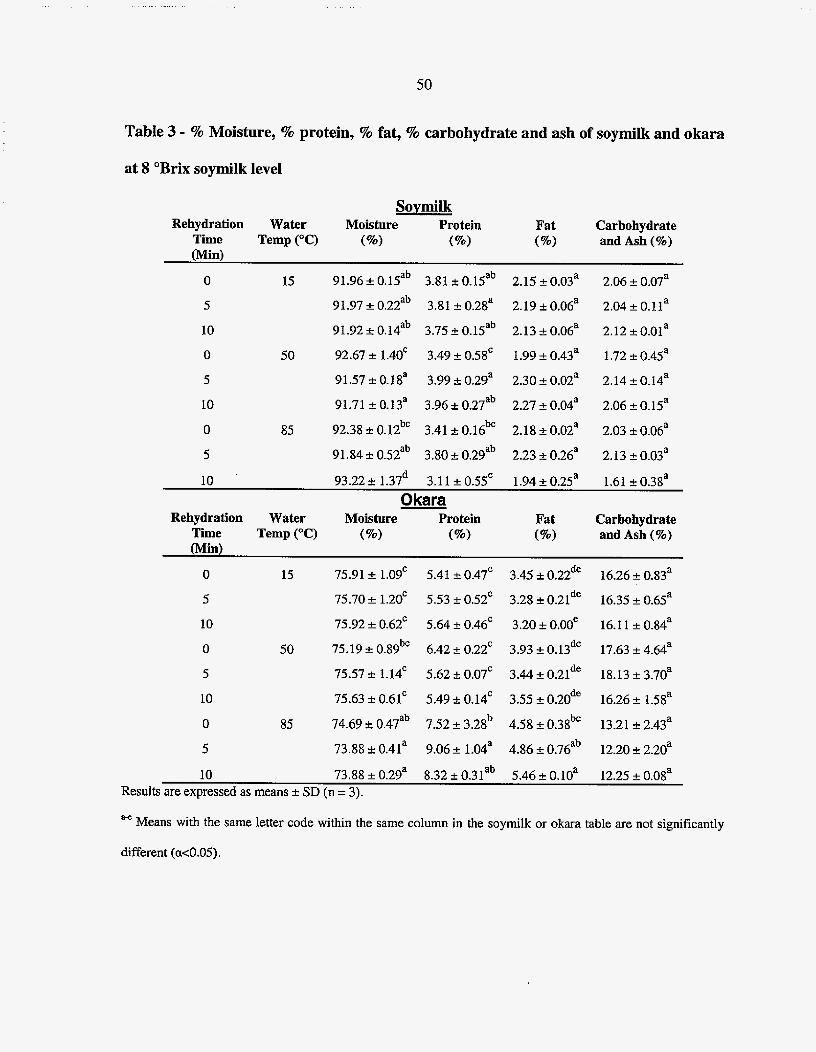
50
Table 3 - % Moisture, % protein, % fat, % carbohydrate and ash of soymilk and okara
at 8 "Brix soymilk level
Soymilk Rehydration Water Moisture Protein Fat Carbohydrate
Time TempPC) I%) I%> and Ash (%) Win)
0 15 91.96 f O.lSab 3.81 f 0.15ab 2.15 f 0.03" 2.06 4 0.07"
5
10
0
5
10
0
5
50
85
91.97 + 0.22ab 3.81 f 0.28a 2.19 f 0.06a 2.04 f O . l l a
91.92 k 0.14 3.75 f 0.15ab 2.13 f 0.06a 2.12 O.Ola
92.67 + 1.40' 3.49 f 0.58' 1.99 f 0.43a 1.72 f 0.45a
91.57f0.18a 3.99f0.29a 2.30+0.02a 2.14+0.14a
91.71 f 0.13a 3.96 f 0.27ab 2.27 f 0.04a 2.06 f O.lSa
92.38 f 0.1Zbc 3.41 f 0.16 2.18 f 0.02a 2.03 k 0.06a
91.84 f 0.52ab 3.80 f 0.29ab 2.23 f 0.2~5~ 2.13 k 0.03a
ab
bc
10 93.22 -t 1.37d 3.11 + 0.55' 1.94 f 0.25a 1.61 2 0.3$
0 kara Rehydration Water Moisture Protein Fat Carbohydrate
Time TemprC) (%) (90'0) and Ash (%) Win)
0 15 75.91 f. 1.09' 5.41 k 0.47' 3.45 k 0.22de 16.26 0.83a
5
10
0
5
10
0
5
50
85
75.70 1.20' 5.53 f 0.52' 3.28 f 0.21de 16.35 f 0.6f1~
75.92+0.62' 5.64f0.46' 3.20+O.0Oe 16.11 f0.84a
75.19*0.89bC 6.42r0.22' 3.93+0.13dC 17.63+4&Ia
75.57 f 1-14' 5.62 f 0.07' 3.44 f 0.21de 18.13 3.70a
75.63 f 0.61' 5.49 f 0.14' 3.55 f O.2Ode 16.26 & I S a
74.69 k 0.47 7.52 f 3.28b 4.58 f 0.38bC 13.21 f 2-43"
73.88 k 0.41a 9.06 f l.Wa 4.86 a 0.76ab 12.20 2 2.20a
ab
IO 73.88 f 0.29a 8.32 f O.3lab 5.46* O.lOa 12.25 f O.Oga Results are expressed as means 2 SD (n = 3).
Means with the same letter code within the same column in the soymilk or okara table are not significantly
different (ac0.05).
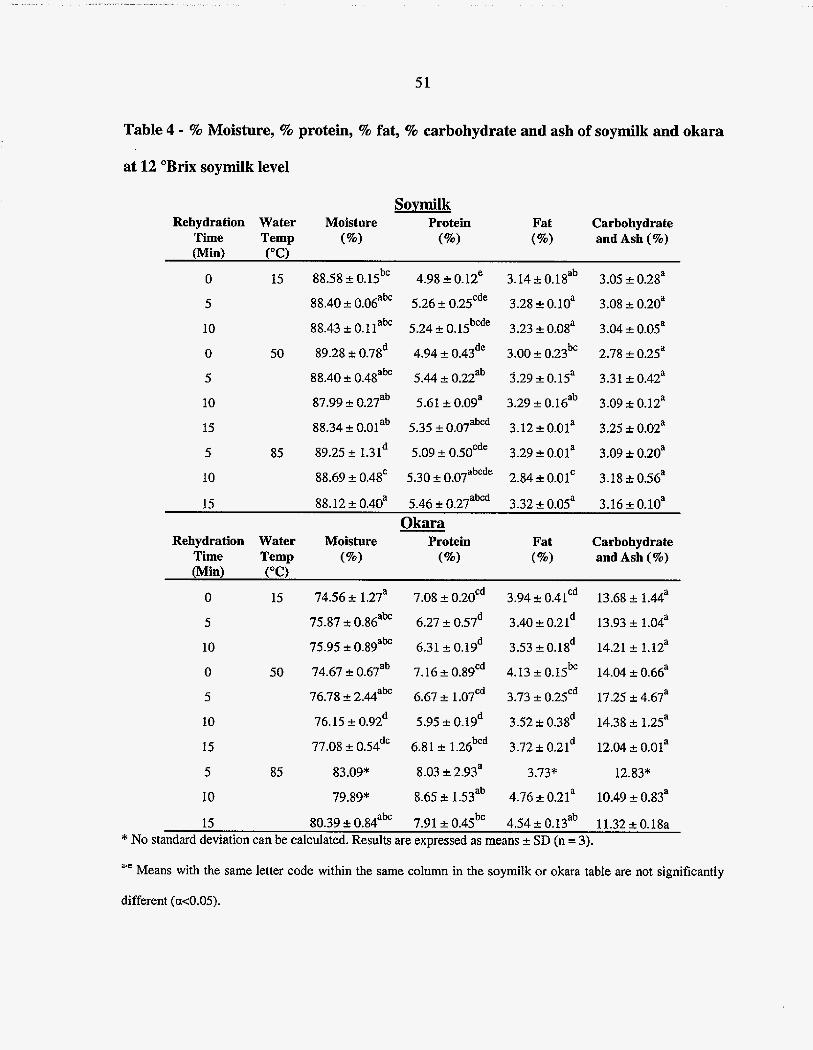
51
Table 4 - % Moisture, % protein, % fat, % carbohydrate and ash of soymilk and okara
at 12 "Brix soymilk level
Soymilk Rehydration Water Moisture Protein Fat Carbohydrate
Time Temp I%) (%) and Ash ( %) (Mm ("C)
0
5
10
0
5
10
15
5
io
15
50
85
88.58 a 0. lSbC 4.98 2 0. 12e 3.14 a 0. l X a b 3.05 2 0.2ga
88.40 2 O.Ofjabc 5.26 a 0.25Cde 3.28 4 0.10" 3.08 k 0.20a
88.43 k O. l l abc 5.24 f O X b c d e 3.23 -c 0.08a 3.04 * 0.05a
89.28 t 0.7Sd 4.94 & 0.43de 3.00 k 0.23bC 2.78 f 0.2Sa
88.40 2 0.4Sabc 5.44 2 0.2Zab 3.29 f 0.15a 3.31 4 0.42a
87.99 a 0.27ab 5.61 a O.Oga 3.29 a 0.16ab 3.09 r 0.12a
88.34 * O.Olab 5.35 k 0.07abcd 3.12 + O.Ola 3.25 k 0.02a
89.25 a 1.31d 5.09 a 0.50cde 3.29 f O.Ola 3.09 k 0.20a
3.18 f 0.56a 88.69 f 0.48' 2.84 f 0.01' abcde 5.30 a 0.07
15 88.12 f O.4Oa 5.46 e 0.27ab* 3.32 k O.OSa 3.16 f O.lOa
Okara Rehydration Water Moisture Protein Fat Carbohydrate
Time Temp (%I and Ash (%) Win) ("C)
50
0 15 74.56 r 1.27a 7.08 & 0.20Cd 3.94 -c O.4lcd 13.68 a l.Ma
5 75.87 k 0.86abf 6.27 a 0.57d 3.40 k 0.21d 13.93 f 1.04a d a 10 75.95 a 0.8gabc 6.31 a 0.19d 3.53 -I- 0.18 14.21 f 1.12
0 74.67 2 0.67ab 7.16 f 0.89cd 4.13 f O X b C 14.04 f 0.66a
5 76.78 a 2.44"b" 6.67 a 1.07d 3.73 f 0.25Cd 17.25 -c 4.67a
10 76.15 +: 0.92d 5.95 f O.lgd 3.52 f 0.3ad 14.38 f lZa
12.04 a O.Ola 15 77.08 k 0.54dc 6.8 1 f 1.26 3.72 f 0.21d bcd
5
10
85 83.09* 8-03 2.93a 3.73" 12.83"
79.89" 8.65 2 1.53 ab 4.76 k 0.21a 10.49 f
7.91 f 0 ~ 5 ~ ' 4.54 a 0 ~ 3 ~ ~ 11.32 2 0.18a abc 15 80.39 -c 0.84
* No standard deviation can be calculated. Results are expressed as means 2 SD (n = 3).
a-e Means with the same letter code within the same column in the soymilk or okara tabIe are not significantly
different (a<0.05).

52
0.20 -.
0.00
Figure l a - Solid content of Okara at 8 "Brix
I I
1.20 1
Means with the same Ietter code are not significantly different (a e 0.05). a-d
Figure l b - Protein content of Okara at 8 "Brix
0.40
0.30 0.35 1
6 0.25 25 2 0.20
0.15
0.05 O.l0 1
b b
b
a\ a- &- a / a
0.00 ! I
15 50 85
Rehydration Temp ("C)
+O Minute +5 Minutes + 10 Minutes
a-b Means with the same letter code are not significantly different (a<O.OS).
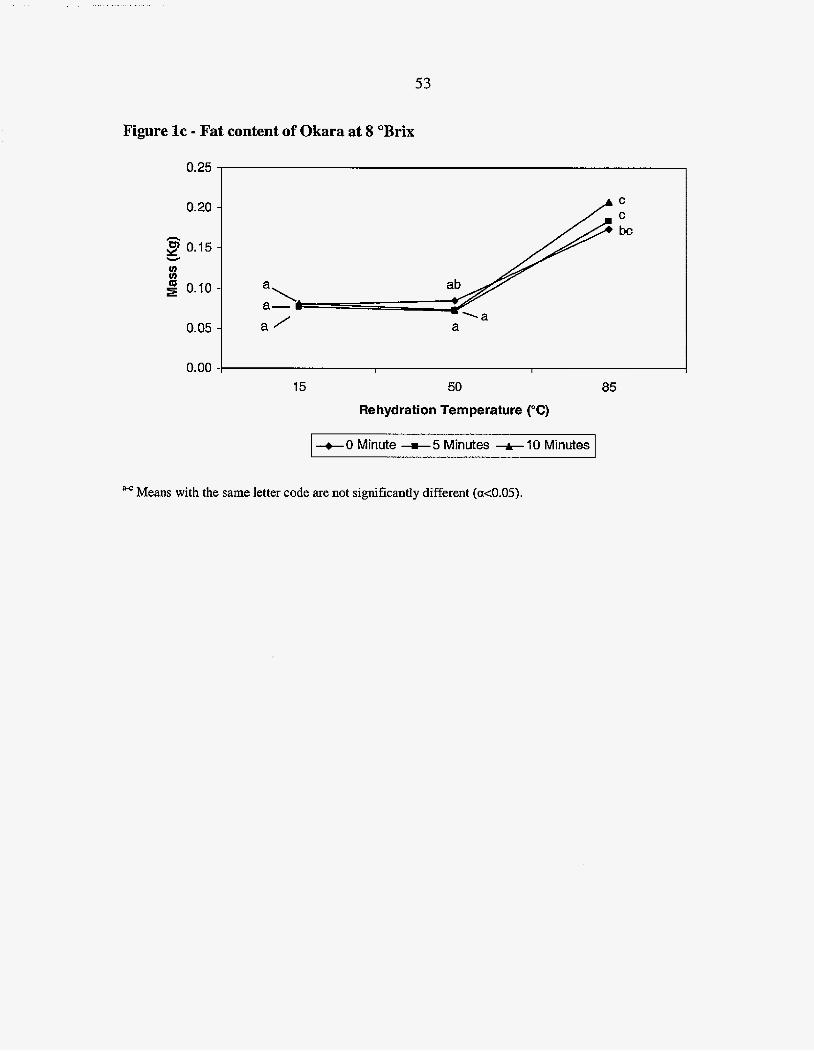
53
0.20 - - y" 0.15 - Y
v) VI 2 0.10 -
0.05 -
Figure IC Fat content of Okara at 8 "Brix
0.25
C
C
bc
a-
a / a
0.00 1 I I
15 50 85
Rehydration Temperature ("C)
I --e0 Minute +5 Minutes +- 10 Minutes I
Means with the same letter code are not significantly different (~~0.05).
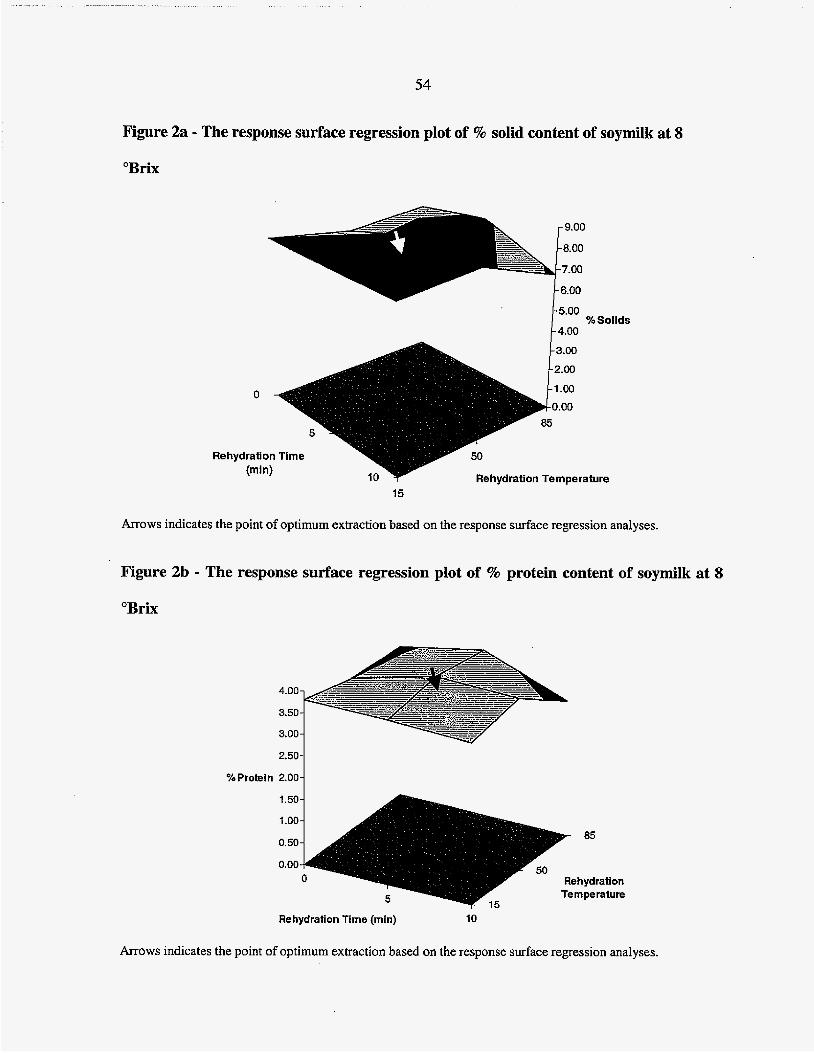
54
Figure 2a - The response surface regression plot of % solid content of soymilk at 8
'Brix
15
Arrows indicates the point of optimum extraction based on the response surface regression analyses.
Figure 2b - The response surface regression plot of % protein content of soymilk at 8
"Brix
3.00-
%Protein 2.00 2*501
Rehydration Time (min) 10
Arrows indicates the point of optimum extraction based on the response surface regression analyses.
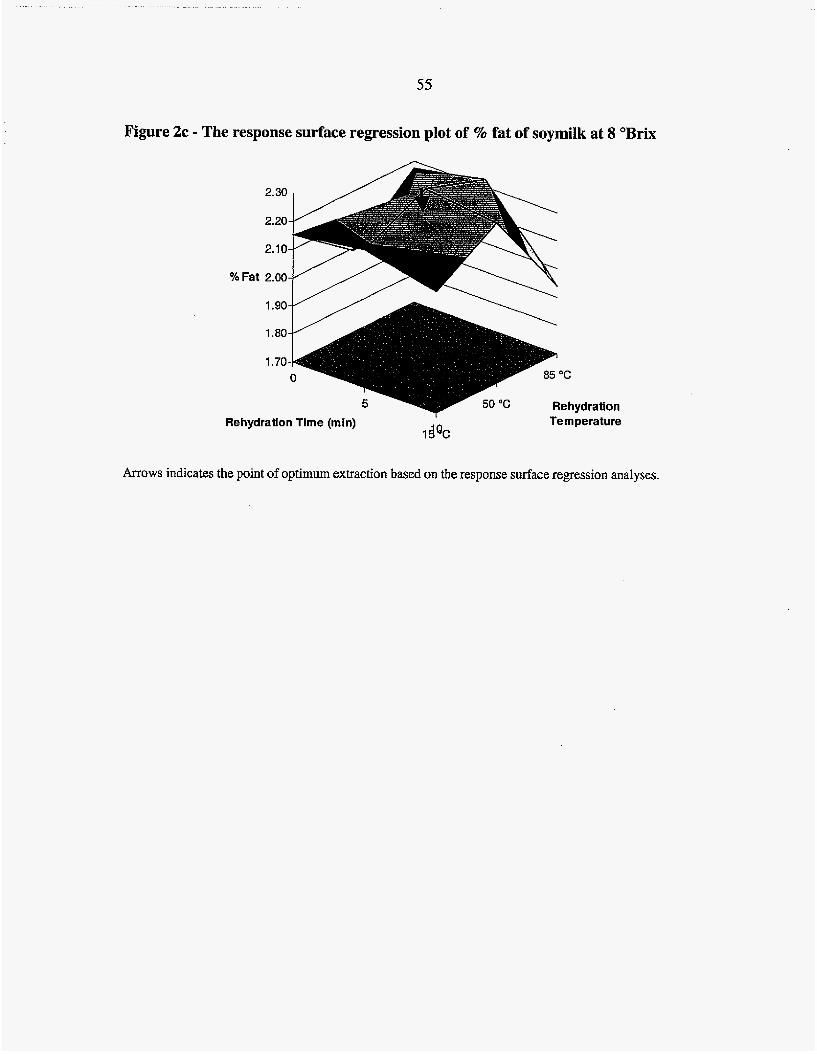
55
Figure 2c - The response surface regression plot of % fat of soymilk at 8 "Brix
I
Rehydration Time (min) Temperature 1dQc
Arrows indicates the point of optimum extraction based on the response surface regression analyses.
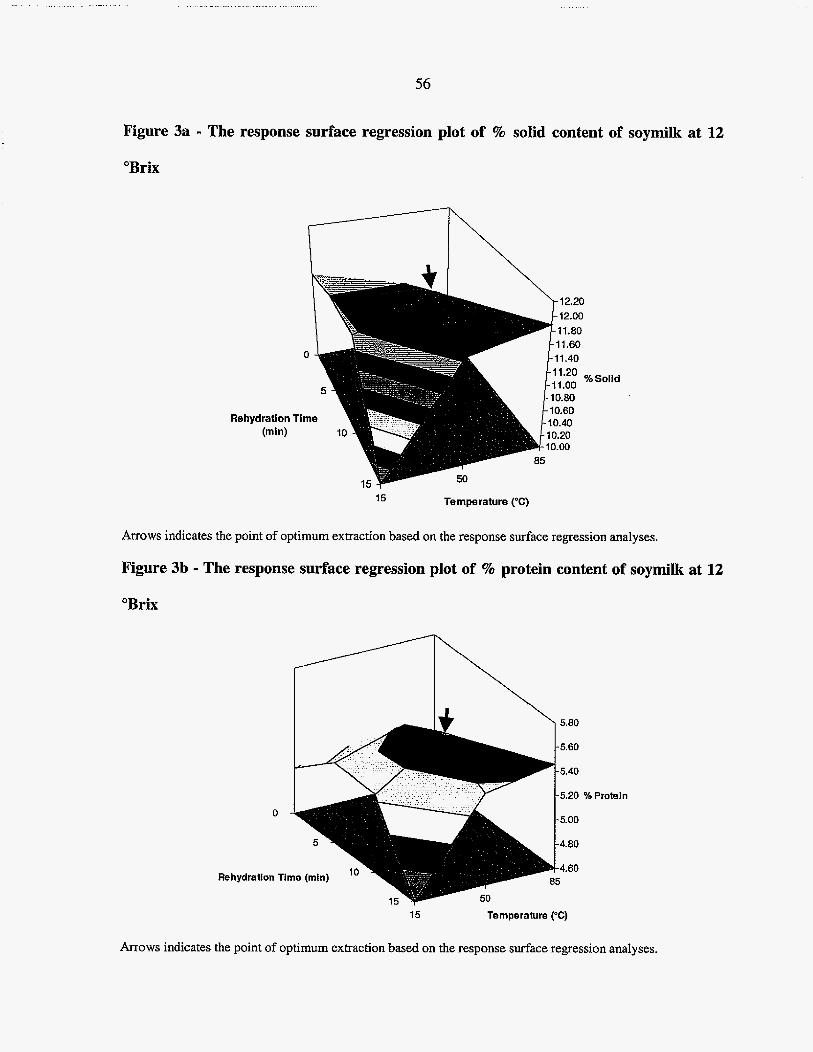
56
Figure 3a - The response surface regression plot of % solid content of soymilk at 12
"Brix
Solid
15 Temperature (OC)
Arrows indicates the point of optimum extraction based on the response surface regression analyses.
Figure 3b - The response surface regression plot of % protein content of soymilk at 12
"Brix
5.80
5.60
5.40
5.20 %Protein
5.00
4.80
4.60
D
Rehydralon Time (mh)
15 Temperature (%)
Arrows indicates the point of optimum extraction based on the response surface regression analyses.
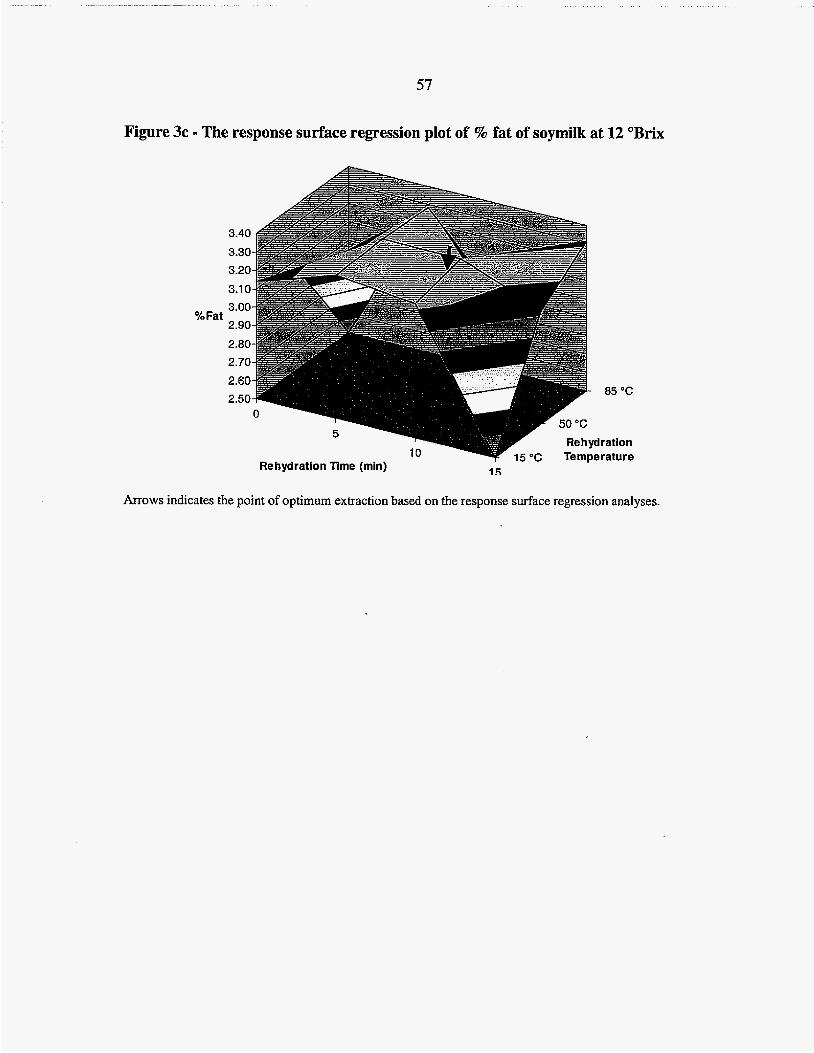
57
Figure 3c - The response surface regression plot of % fat of soymilk at 12 "Brix
?4 It
85 "C
lration irature
Arrows indicates the point of optimum extraction based on the response surface regression analyses.
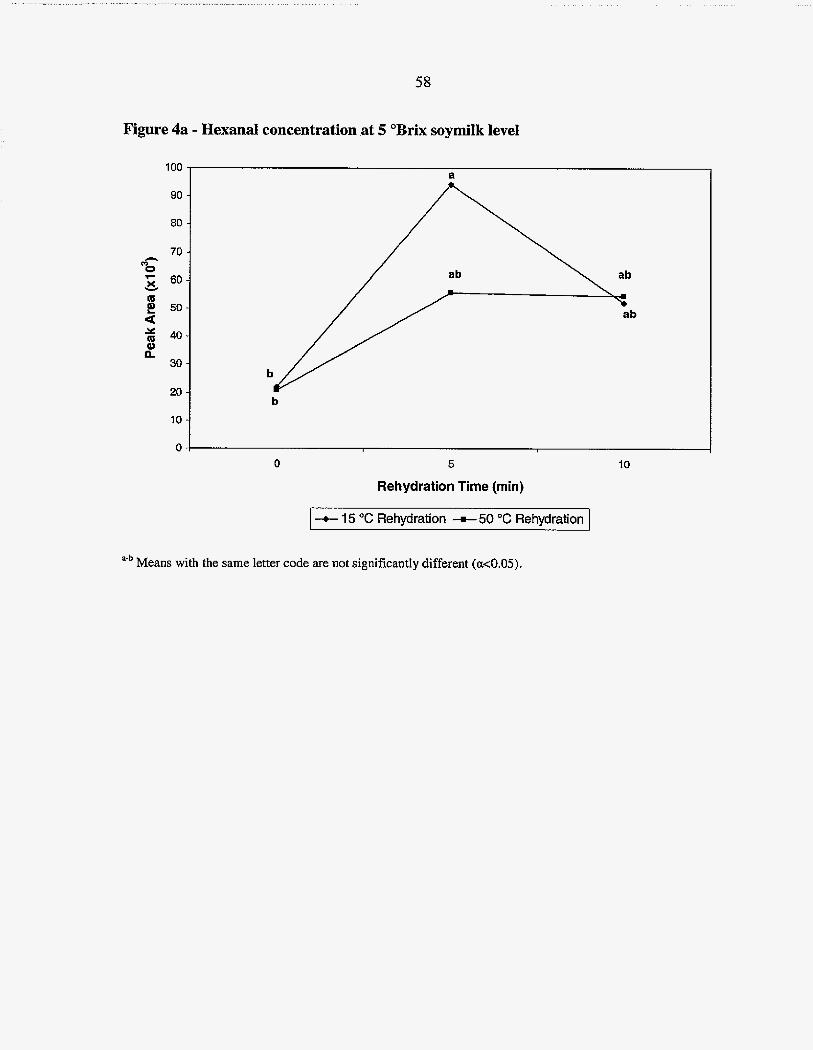
58
90 -
80 -
70 - n
z 60 - m
m
8 2 50 - a Q 40- Y
Q1 a 30 -
20 -
10 -
Figure 4a - Hexanal concentration at 5 "Brix soymilk level
a 100
b
- . 0 5 10
Rehydration Time (min)
I -+ 15 "C Rehydration --c 50 "C Rehydration I a.b Means with the same letter code are not significantIy different (a<O.OS).
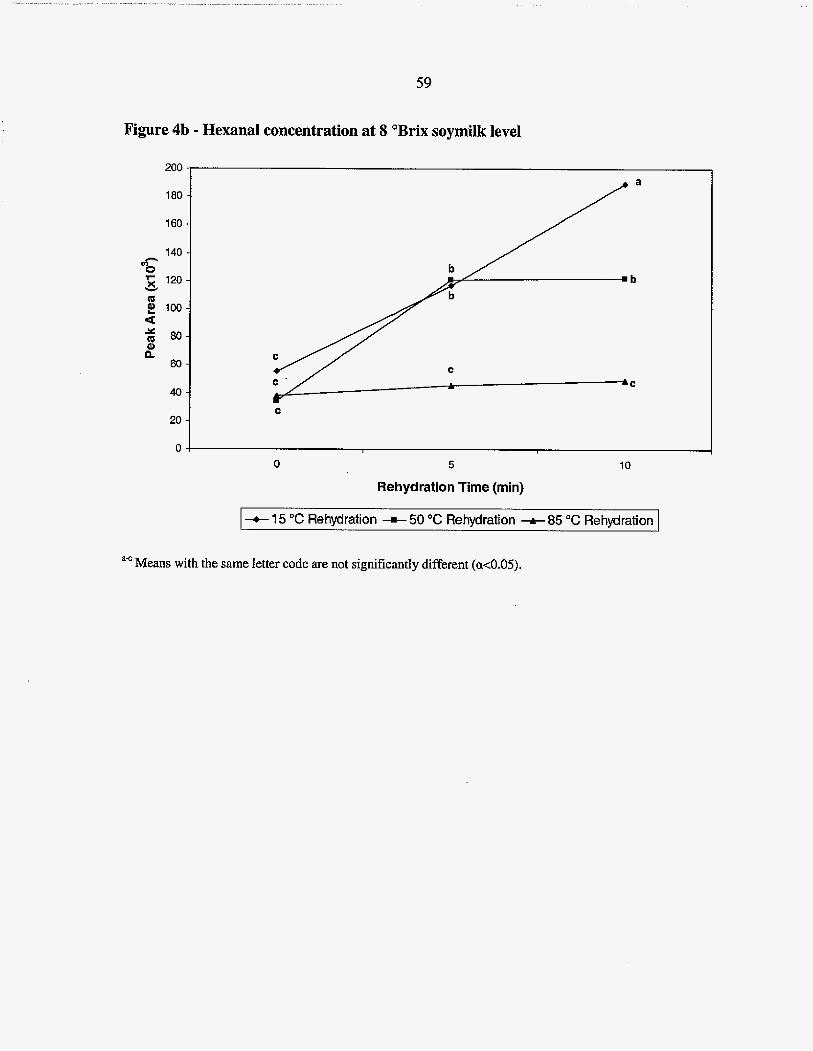
59
Figure 4b - Hexanal concentration at 8 'Brix soymilk level
200
180
160
140 m- - 120 6 g 100
2d 80 3
0
m
4
P 60
40
20
C - ,' C
C
0
0 5 10
Rehydration Time (min)
+- 15 "C Rehydration - 50 "C Rehydration -85 "C Rehydration
Means with the same letter code are not significantly different (~~0.05) . a c
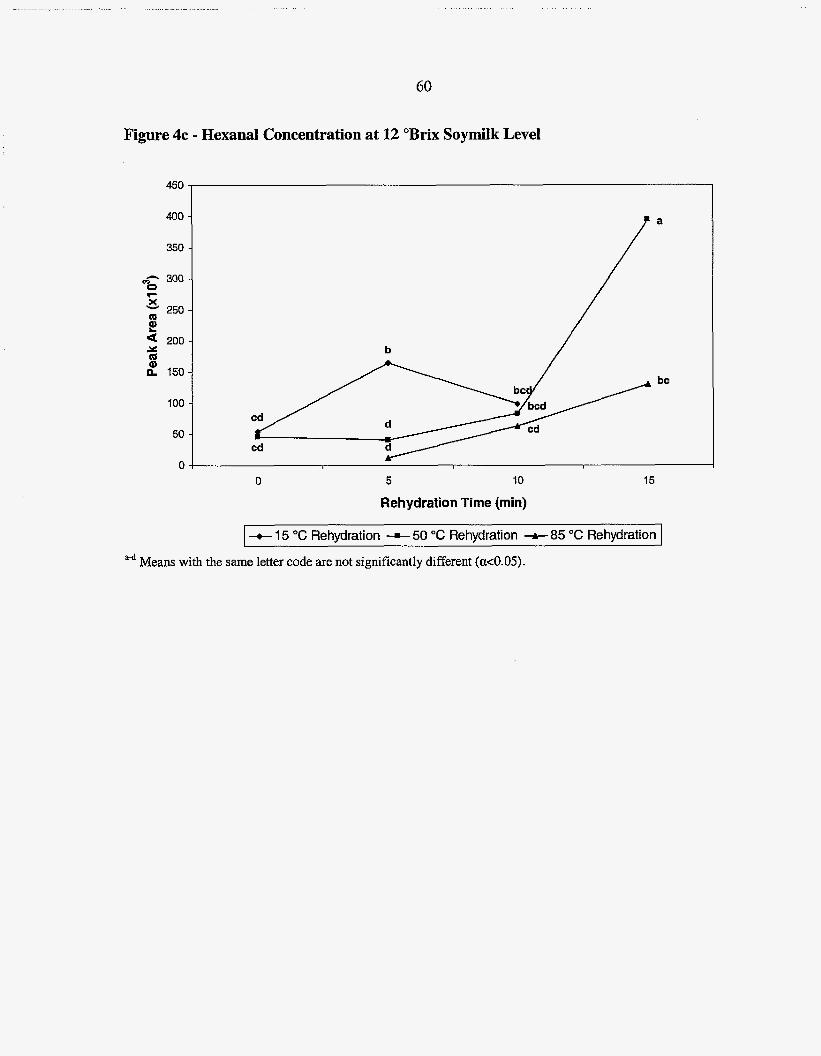
60
Figure 4c - Hexanal Concentration at 12 "Brix SoymiIk Level
450
400
350
100
50
0 0 5 IO
Rehydration Time (min)
15
-+ 15 "C Rehydration --c 50 "C Rehydration + 85 "C Rehydration I Means with the same letter code are not significantly different (a<O.OS). ad
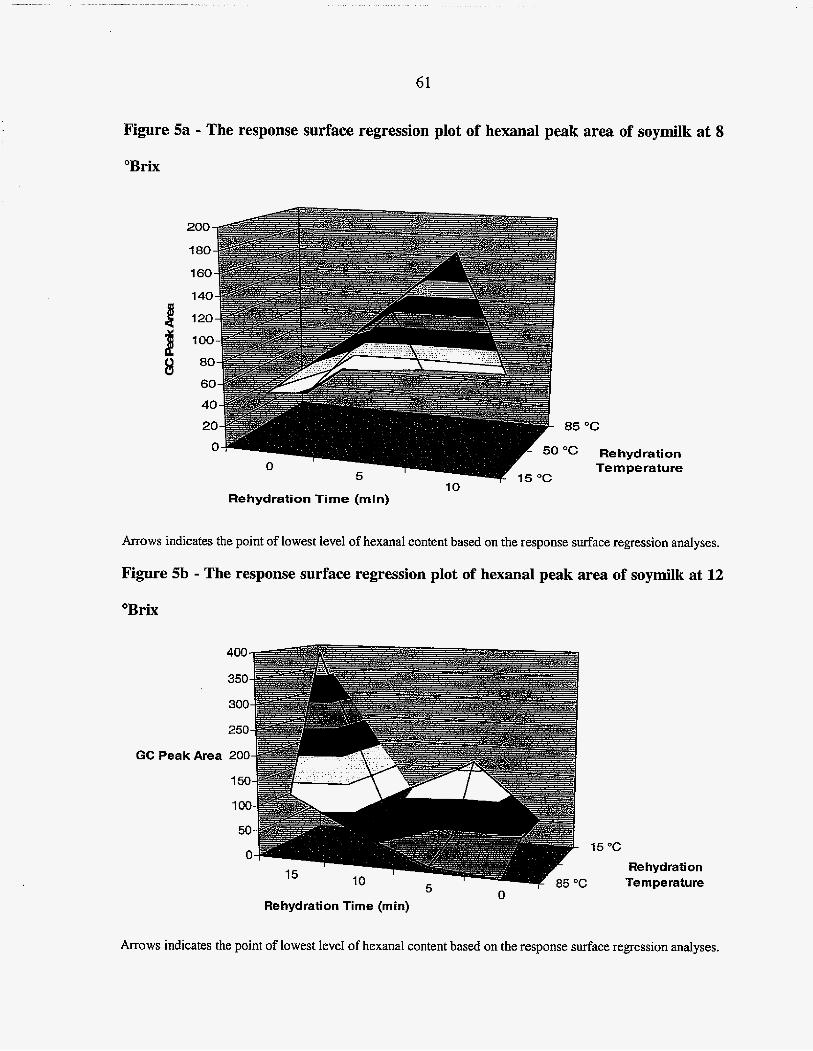
" " .. . ..."._.._.I..... .... .. " .........
61
Figure 5a - The response surface regression plot of hexanal peak area of soymilk at 8
'Brix
g 100-
60
40
20 - 0-, g,
0 5
p 50 "c Rehydration I Temperature
I 15°C i o Rehydration Time (rnin)
Arrows indicates the point of lowest level of hexanal content based on the response surface regression analyses.
Figure 5b - The response surface regression plot of hexanal peak area of soymilk at 12
'Brix
GC Peak Area
10 15
Rehydration Time (rnin)
' 15°C Re hydrati on Temperature
Arrows indicates the point of lowest leveI of hexanal content based on the response surface regression analyses.
62
COMPARISON OR LIPOXYGENASE FFWE SOYMILK WITH
DEODORIZED SOYMILK
A paper to be submitted to the Journal of Food Science
S. Prawiradjaja and L.A. Wilson
ABSTRACT
The differences in the flavor of soymilk made fiom lipoxygenase-free (triple null) soy flakes
and deodorized high protein soy flake (HPSF) soymilk were evaluated. Soymilk at 8 and 12
'Brix were produced and deodorized. The sensory characteristics of the soymilk were
analyzed using instrumental methods (GC and Hunter color measurement) and trained
sensory panelists. Hexanal data showed differences between undeodorized HPSF and triple
null soymilk and no differences between deodorized HPSF and deodorized triple null. The
panelists could not differentiate between the beany, cereal, and painty flavors. The panelists
found that the overall aroma of deodorized 8 "Brix triple null arid deodorized HPSF soymilk
were lower than the undeodorized triple null and HPSF soymilk. The triple null soymilk was
perceived to be more bitter than the HPSF soymilk by the sensory panel due to oxidation of
the triple null soy flakes. This oxidation may produce other aroma that was not analyze using
the GC but noticed by the panelists. Sensory evaluation results did show that the deodorizer
was able to reduce the aroma in HPSF soymilk to the aroma of triple null soymilk at 8 "Brix
level.
Key words: soymilk, deodorizer, lipoxygenase-free, triple null.
63
INTRODUCTION
The problem of ‘off flavors that is found in soybeans has been known to the western
world for a while. Berczeller, in 1924, described the flavor of soybean as “evil” tasting.
Soybeans contain flavor that is described as beany, grassy, green, painty, astringent, and
bitter (Wolf 1975 and King and others 2001). In China and some eastern Asian countries,
these flavors are favorabIe in soy foods. The “off’-flavors of soybeans remain the main
factors in limiting the utilization of soy for food, despite its known health benefits. The “off’-
flavors of soybeans are caused by breakdown of the products of an oxidase enzyme called
lipoxygenase. Soybeans are known to contain the highest concentration of this enzyme in the
plant kingdom (Axelrod 1974). The presence of high amounts of unsaturated fatty acids in
soybeans makes them perfect substrate for the lipoxygenase enzyme to react. Any time the
soybean cells are ruptured, lipoxygenase work almost instantaneously. Once the fatty acids
are oxidized, the unique flavors of soybeans are produced.
Based on the market research conducted by SoyaTech in 1999, the sales of soy foods
in the US . were projected to increase from $2.1 billion to $3.57 billion by 2002 (Soya Tech
1999). In 2002, Soya Tech released a new report showing that the soy food industry had
already reached $3.2 billion in sales by 2001. Soymilk sales alone in 2001 have reached $550
million and were projected to reach $1 billion in the coming three to five years (Soyatech
2002). This growth in sales is partly contributed due to the advancement in soy foods flavor
improvement. Flavor improvement can be done through process modifications, flavoring
additives and breeding techniques. Process modifications, such as the Cornel1 and rapid
hydration hydrothermal cooking (RHHTC), have been deveIoped to acheve immediate
inactivation of the lipoxygenase enzyme (Kwok 1995; Wilson 1996).
64
In dairy milk processing, a method of “off”-flavor removal has been used for many
years, using the method called deodorization. In dairy milk, off-flavors could be caused by
the cows’ diet. Dairy milk is commonly deodorized with a flash steam-vacuum deodorizer.
The process is done continuously immediately after the pasteurization step. The deodorizer
works by creating a large thin layer of milk along the inside wall of the deodorizer and the
vacuum would volatilize and remove the off-flavors. Inside the deodorizer, steam is usually
added into the system to compensate for the loss of moisture during deodorization and to
optimize flavor extractions (Farrall 1980). Shurtleff (1979) describe the use of a vacuum pan
(with 40 cm Hg or 7.7 psi. vacuum pressure) to remove the off flavor of soymilk which was
prepared using the pre-blanch method. The deodorization step can be applied several times
before the formulation process. Tn a study conducted by Hashim and Chaveron (1995),
several commercial, undeodorized and deodorized soymilk was evaluated for its off flavor
component, they reported that in the deodorized samples, about 70% of the hexanal was
removed because of the process. However, this study did not specify the deodorization
method that was used. They also reported that the panelists preferred the deodorized soymilk
in comparison with other soymilk, In practice, to achieve an acceptable flavored soymilk
several combinations of processing method can be used to prevent the formation of the off-
flavors,
Inactivation of soy lipoxygenase can also be done through breeding techniques.
Soybeans plants can be crossbred to produce soybeans that lack the lipoxygenase enzyme.
Soybeans plants that lack the lipoxygenase isozymes can now be found. Flavor improvement
of soymilk has been reported with these varieties (Kobayashi and others 1995; Wilson 1996;
Torres 2001).
65
The effectiveness of the two methods has been individually studied, However, the
effectiveness of the two methods has not been compared. Thus, the purpose of this study is to
evaluate the differences in the flavor of soymilk made from lipoxygenase free soy flakes and
deodorized soy flakes milk.
MATEIUALS & METHODS
Materials
High protein blend soy flakes (WSF) and lipoxygenase-free (triple null) soy flakes
were provided by the MicroSoy Corporation (Jefferson, Ia., U.S.A.). High protein blend soy
flake is a blend of three IA high-protein identity preserve cultivars of soybeans blended for
soy flakes production. The lipoxygenase-free cultivar that is used for flakmg is IA 2032
cultivar. All chemicals used for analyses were reagent grade (Fisher Scientific, Fair Lawn,
N.J.,U.S.A.).
Soymilk production
Soymilk was prepared at the Center for Crops Utilization Research (CCUR) pilot
plant at Iowa State University (Ames, Ia, U.S.A.). The soymilk was processed using the
Takai Automated Soyrnilk and Tofu System (Takai Tofu and Soymilk Equipment Inc.
Japan), using the method of Moizuddin and others (1999). Two levels of solid level are
produced for this study (8 and 12 "B~ix). For 8 "Brix soymilk, 3.7 kg of flakes were used
with 30 L of water; and for 12 "Brix soymilk, 5.52 kg of flakes were used with 30 L of water.
These levels of soymilk are produced and deodorized in a day. The soy flakes were
66
rehydrated with a rotating paddle mixer using 85 "C water for 5 minutes. Timing was
initiated at the first contact of flakes to water.
After the soymilk has reached 95 "C, the soymilk was then held for 7 minutes at this
temperature when producing 8 "brix soymilk and 10 minutes for the 12 "brix soymilk to
allow pasteurization and reduction of trypsin inhibitor levels. The hot slurry was then
pumped into a 120 mesh, horizontal rotating cylindrical screen to separate the insoluble
solids. The remaining insoluble solids were roller-pressed over a 1 OO-mesh screen drum. The
soymilk was then homogenized at 7000 psi and collected in 2 L plastic bottles (undeodorized
soymilk). The remaining soymilk was then deodorized. All soymilk samples were
immediately re5gerated for analyses the following day.
Soy milk deodorization
Soymilk was deodorized using a pilot plant scale ProSoya VS40 deodorizer (ProSoya
Inc., Ottawa, Canada). To reproduce the treatment used in a typical soymilk plant, soymilk
was deodorized twice. Soymilk was reheated by steam injection until it reached 80 "C in the
ProSoya unit. Once the desired temperature has been reached, vacuum is pulled in the
deodorizer tank at the same time steam is introduced inside the deodorization tank. Vacuum
i s maintained inside the tank at 15-psi vacuum pressure. Soymilk is introduced inside the
tank as slow as possible to maintain optimum volatilization of aromas. The process is
repeated again for the second deodorization step. The soymilk was then homogenized at 7000
psi and collected in 2 L plastic bottles. All soymilk samples were immediately refrigerated
until analyses the following day.
67
Gas chromatography (GC)
Headspace analysis (Wilson and others 1992) was conducted for all soymilk samples
using a Varian 3740 Gas Chromatography (GC) equipped with dual flame ionization detector
(FID). The temperature of the injector and detector was held constant at 150 "C. The initial
column temperature is 50 "C. The Eused gIass silica column was then heated at a rate of 10
"Urnin until the column temperature reaches 230 "C and held at this maximum temperature
for 3 minutes. Hydrogen and nitrogen gas flow rate was set at 30 rnl/min and oxygen flow
rate was set at 300 mllmin. The output fiom the gas chromatograph was recorded using a
Hewlett Packard integrator model 3390A (Fisher Scientific, Fair Lawn, N.J., U.S.A+).
Headspace analyses method
Sample for headspace analyses were prepared by placing twenty five grams of
soymilk into a clear glass bottle and sealed with a Teflon coated septa and standard
aluminum seal (Supelco, Inc.). Samples were incubated with a water bath at 37 "C with
continuous stirring for at least 30 minutes. Liquid nitrogen was used to cryo-focus the
headspace sample in the column. Two ml of headspace was sampled using a 5 ml Hamilton
gas-tight syringe and injected to the GC at a rate of 1 ml/min. Duplicates of headspace
analysis were done on each samples. Hexanal peak was identified by comparing the retention
time of a hexanal standard (Sigma Aldrich, St. Louis, Mo., U.S.A.).
The % reduction or % difference of hexanal peak area is calculated using the
following equation:
(Zlndeodorized peak area - deodorized peak area) Undeodorized peak area
YO Reduction = x 100%
68
Differences between the compared peak area
Peak area being compared % Difference = x 100%
Sensory evaluation
Sensory evaluation for panelists training was conducted based on the method
described by Lawless and Heymann (1998). Human subject approval for conducting the
panel was obtained through the Human Subject Research office at Iowa State University
(Ames, Ia, USA.) . The panelists were consisted of 9 graduate students (3 Asian Americans,
1 Latin Americans, and 5 Caucassian Americans) from the Food Science and Human
Nutrition Department at Iowa State University. The panelists were exposed to several variety
of soymilk that is produced at the Center for Crops Utilization Research (CCUR) pilot plant
as well as a commercial sample. The panelists were asked to develop the sensory terms based
on some provided terms as well as the panelists' terms.
Once the panelists have familiarized themselves with the flavor standards, the
panelists were screened based on a triangle test in differentiating the standards and in
identifjmg the intensity of the standards. Those who were successfid in identifying the flavor
standards were accepted to participate in this study. The panelists that passed the initial
screening were then further train in order to reach a consensus between the panelists on the
intensity of each flavor standards.
The panel is conducted in partitioned booth under white light, and the samples are
served at ref?igeration temperature. Each samples of soymilk are presented in a white plastic
cup labeled with three digit random numbers. Thirty ml of soymilk were presented per
samples. Within the sarne solid level, the "Brix of the soymilk samples were adjusted to the
69
same "Brix by diluting them with distiIled water prior to the panel. On each panelist day, the
panelists were asked to evaluate four samples of soymilk. The panelists recorded their
responses in a 15 cm line scale, which are anchored with the intensity description located at
l-crn of the beginning and the end of the line. The soymilk samples are evaluated for their
appearance (whiteness to yellowness), aroma and flavor (weak to strong overall flavor),
cereal, beany, painty flavor, astringency, bitterness and sweetness. The panelists' responses
were measured with a ruler and reported in mm. All data were colIected and analyzed
statistically.
Color measurement
The color of soymilk was determined using a 5100 LabScan (Hunter Color Lab,
Fairfax, VA, U.S.A.). Soymilk samples were placed into 60 X 15 nun diameter plastic petri
dishes (Fisher Scientific) and measurements were taken on the soymilk surface using a 0.25-
inch sampling port under D65 iIlumination and 10" standard observer. Three measurements
of each sample were performed at three different sites on the surface of the soymilk.
Proximate analyses
Moisture was analyzed using method 925.19 (AOAC 2000). Crude protein analysis
was determined using the micro Kjeldahl AOAC methods 955.04(c) and 954.01 (AOAC
2000), with Kjeltab TCT was used as the catalyst instead of HgOz. Percent fat content of the
samples were determined by Woodson-Tenent Laboratories Inc. (Des Moines, LA, U.S.A.)
using acid hydrolysis AOAC method 989,05 (AOAC 2000).
70
Statistical analyses
Sensory analyses were analyzed using general linear model procedure. GC and color
data were analyzed using one-way analyses of variance (ANOVA). SAS System 8.02 (SAS
Institute Inc., Cary, NC) statistical program was used for the statistical calculation.
RESULTS & DISCUSSION
Soymilk composition
There are no statistical differences (a < 0.05) found in the % moisture, % solid, %
protein and % fat between the deodorized and undeodorized soymilk (Table 1) within the
same solid level. The results showed that during the deodorization process, the steam that
was incorporated or condensed in the deodorizer did not dilute the soymilk, which might
affect the sensory evaluation of soymilk.
Gas chromatography and sensory evaluation of deodorized and undeodorized soymilk
The results fi-om hexanal analyses of soymilk with gas chromatography showed that
undeodorized triple null soymilk has a lower hexanal content than undeodorized HPSF
soymilk (a < 0.05) at 8 and 12 "Brix. However, there is no statistical difference (a < 0.0.5)
between the deodorized HPSF soymilk and the undeodorized triple null soymiIk at 8 and 12
"Brix (Table 2). The deodorized triple null soymilk showed no statistical difference with the
undeodorized triple null and deodorized HPSF soymilk. Based on these results, the
deodorizer was able to reduce the amount of hexanal in HPSF soymilk to the level similar to
the hexanal in triple null soymilk.
71
Although statistically there is no difference between the deodorized and undeodonzed
soymilk, the % reduction or % difference data shown in Table 2 shows the best estimate of
reduction fiom the deodorization process or differences between samples. Higher %
reduction of hexanal was found from the 12 "Brix HPSF soymilk compared to the 8 "Brix
HPSF soymik. With the triple null soymilk, 39% of hexanal reduction was found at the 8
"Brix level and 25% reduction was found at the 12 "Brix level. At 8 "Brix soymilk, there is a
difference of 44% between undeodorized HPSF and undeodorized triple null soymilk and at
12 "Brix the difference is 79%+
The amount of hexanal at the end of the process were similar between the 8 and 12
"Brix deodorized soymilk, this result may indicate that this is the maximum odor removal
that can be achieved by the deodorizer. Other possibilities would be that the soy protein binds
to the flavor and the amount detected fi-om the deodorized samples were the hexanaI that is
.still bound by the soy protein.
The color measurements of soymilk were reported in Table 3. There is no statistical
significant difference between the color of undeodonzed and deodorized soymilk within the
same soymilk type (CY -= 0.05). However, the triple null soymilk has a significantly higher 'b'
value (more yellow) than the HFSF soymilk. Moizuddin and others (1999) evaluated the
color of tofu made fi-om soy flakes and whole soybeans processed under direct and indirect
heating processes. They reported that AL of 4, Aa of 0.5 and Ab of 1 were enough for the
trained panelists to observe a significant difference in the color of tofu. Assuming that the
color difference of tofu and soymilk perceived similarly by the trained panelists, the 'b' value
difference between the IZPSF and triple null soymilk should be enough for the panelists to
72
see a difference. As will be discussed in the sensory data, the panelists were able to tell a
difference between the soymilk samples.
Based on the sensory data, the panelists were unable to differentiate the sweetness,
cereal, beany and painty aroma between all samples at both soIid levels (Table 4). However,
the panelists were able to differentiate the soymilk aroma of soymilk at 8 "Brix but not at 12
"B~ix. The trained panelists were also able to differentiate the bitterness and the appearance
of the soymilk. The panelists indicated that at 8 "Brix, soymilk aroma of undeodorized HPSF
(a! < 0.05) is stronger than the undeodorized triple null. In addition, the panelists reported that
the deodorized HPSF soymilk and triple null soymilk are not significantly different between
each other, but both are less strong in soymilk aroma than the undeodorized HPSF and triple
null. For bitterness and appearance of the soymilk, the panelists reported that the triple null
soymilk was more bitter and yellow than the EPSF soymilk (Table 4).
The panelists' responses correspond to the hexanal data at 8 "Brix soymilk. Based on
the GC data, the undeodorized HPSF soymilk has significantly higher amount of hexanal
compared to the deodorized HPSF soymilk, undeodorized and deodorized triple null soymilk.
However, the hexanal data at 12 OBnx do not correspond to the sensory data. Twelve-'Brix
soymilk is not the concentration that is normally consumed by the consumer (commercially 8
"Brix) and it maybe that the flavor is too strong to be differentiated by the panelist. It is also
noted by the panelists that the triple null soymilk perceived to be more bitter and yellow
compared to the HF'SF soymilk. Torres-Penaranda and Reitmeier (2001) reported that in the
evaluation of soymilk made from triple null soybeans stored for 15 months, there is a
significant increase in the bitterness in the soymilk. This bitterness may be developed
through the oxidation of the soybeans or in this case soy flakes. The oxidation of lipid in the
73
soybean also produces other flavor compounds than hexanal. The intense bitterness in the
triple null soymilk may distract the panelist in differentiating the beany, cereal and painty
flavor of soymiik.
CONCLUSION
Based on the GC data, the deodorizer was effective in reducing the original amount of
hexanal in HPSF soymilk to the level found in undeodorized tripIe null soymilk. The sensory
evaluation results did show that the deodorizer was able to reduce the soymilk aroma in
HPSF soymilk so it would be similar to triple null soymilk at 8 "Brix level.
REFERENCES
AOAC. 2000. Official Methods of Analysis. 17fh Ed. Washington, D C : Association of
Official Analytical Chemists.
Axelrod B. 1974. Lipoxygenases, Advances in Chemistry, series 136. J.R. Whitaker (ed.),
ACS Pub. Washington, D.C. p 324-348.
Farrall AW. 1980. Pasteurizing Equipment. In: Farrall AW. Engineering for dairy and food
products. John Wiley and Sons, Inc. New York and London. p 377-385.
Hashim L, Chaveron H. 1995. Isolation and identification of off-flavor components from
soymilk. In: Charambolous G, editor. Food Flavors: Generation, Analysis and
Process Influence. New York, N.Y.: Elsevier. p 1007-1019.
King JM, Chin SM, Svendsens LK, Reitmeier CAY Johnson LA, Fehr WR. 2001. Processing
of lipoxygenase-fiee soybeans and evaluation in foods. JAOCS. 78(4): 353-360.
74
Kobayashi A, Tsuda Y , Hirata N, Kubota K, Kitamma R. 1995. Aroma constituents of
soybean [Glycine m a (L,) rnerril] milk lacking lipoxygenase isozymes. J. Agric.
Food Chem. 43: 2449-2452.
Kwok RC, Niranjan K. 1995. Review: Effect of thermal processing on soymilk. International
Journal of Food Science and Technology. 30: 263-295.
Lawless HT, Heymann H. 1998. Sensory evaluation of food. Principles and practices. New
York, N.Y.: Chapman and Hall. 827 p.
Moizuddin S, Harvey G, Fenton AM, Wilson LA. 1999. Tofu production from soybeans or
full-fat soyflakes using direct and indirect heating processes. J. Food Sci. 64( 1): 145-
148.
Shurtleff W, Aoyagi A, 1979. Tofb and soymilk production. In: Shurtleff W, Aoyagi A. The
book of toh . Volume 11. Lafayette, Calif.: New Age Foods Study Center. p 195-234
SoyaTech. 1999. The North American soy foods market. Bar Harbor, Me.: SoyaTech Inc.
and Senechal, Jorgenson & Hale Co., www.soyatech.com. Accessed: June 7.
SoyaTech. 2002. Soya Foods: The US. Market 2002. Bar Harbor, Me.: SoyaTech Inc. and
Senechal, Jorgenson & Hale Co., www.soyatech.com. Accessed: June 7.
Torres-Penaranda AV, Reitmeier CA, Wilson LA, Fehr m, Narvel JM. 1998. Sensory
characteristics of soymilk and tofu made from lipoxygenase-free and normal
soybeans, 3. Food Sci. 63(6): 1084-1086.
Wilson LA. 1996. Comparison of lipoxygenase-null and lipoxygenase-containing soybeans
for foods. In: Piazza M, editor, Lipoxygenase and Iipoxygenase pathway enzymes. St.
Louis, Mo.: AOCS Press. p 209-225.
75
WoIf WJ. 1975. Lipoxygenase and flavor of soybean protein products. J. Agr. Food Chem.
23(2): 136-141.
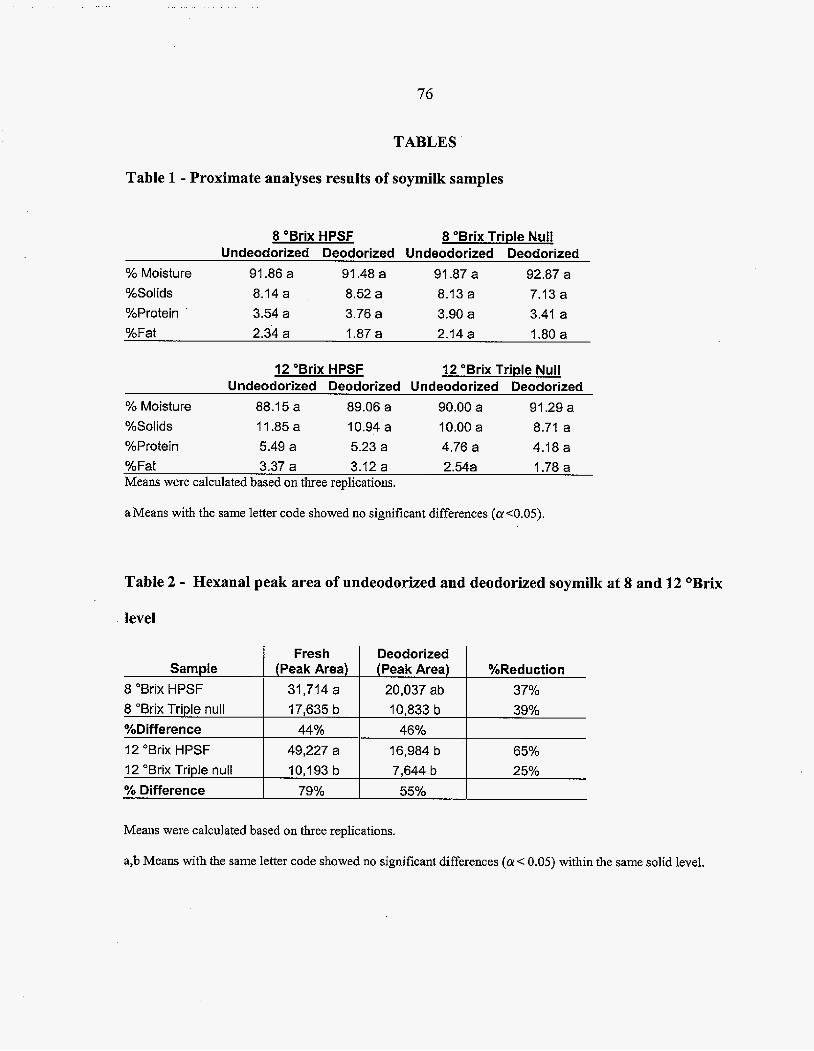
76
Sample
8 "Brix HPSF
& "Brix Triple null %Difference
I 2 "Brix HPSF 12 "Brix Triple null % Difference
TABLES
Table 1 - Proximate analyses results of soymilk samples
(Peak Area) (Peak Area) %Reduction
31,714 a 20,037 ab 37% 17,635 b 10,833 b 39%
49,227 a 16,984 b 65% 44% 46%
10,193 b 7,644 b 25% 79% 55%
8 "Brix HPSF 8 "Brix Triple Null Undeodorired Deodorized Undeodorized Deodorized
% Moisture 91.86 a 91.48 a 91 .&7 a 92.87 a %Solids 8.14 a 8.52 a 8.13 a 7.13 a %Protein . 3.54 a 3.76 a 3.90 a 3.41 a %Fat 2.34 a 1.87 a 2.14 a 1.80 a
Fresh
12 "Brix HPSF 12 "Brix Triple Null Undeodorized Deodorized Undeodorired Deodorized
% Moisture 88.1 5 a 89.06 a 90.00 a 91.29 a %Solids 11.85a 10.94 a 10.00 a 8.71 a %Protein 5.49 a 5.23 a 4.76 a 4.48 a %Fat 3.37 a 3.12 a 2.54a 1.78 a Means were calculated based on three replications.
Deodorized
aMeans with the same letter code showed no significant differences (a 4.05).
Table 2 - Hexanal peak area of undeodorhed and deodorized soymilk at 8 and 12 *Brix
level
Means were calculated based on three replications.
a,b Means with the same letter code showed no significant differences (a < 0.05) within the same solid level.
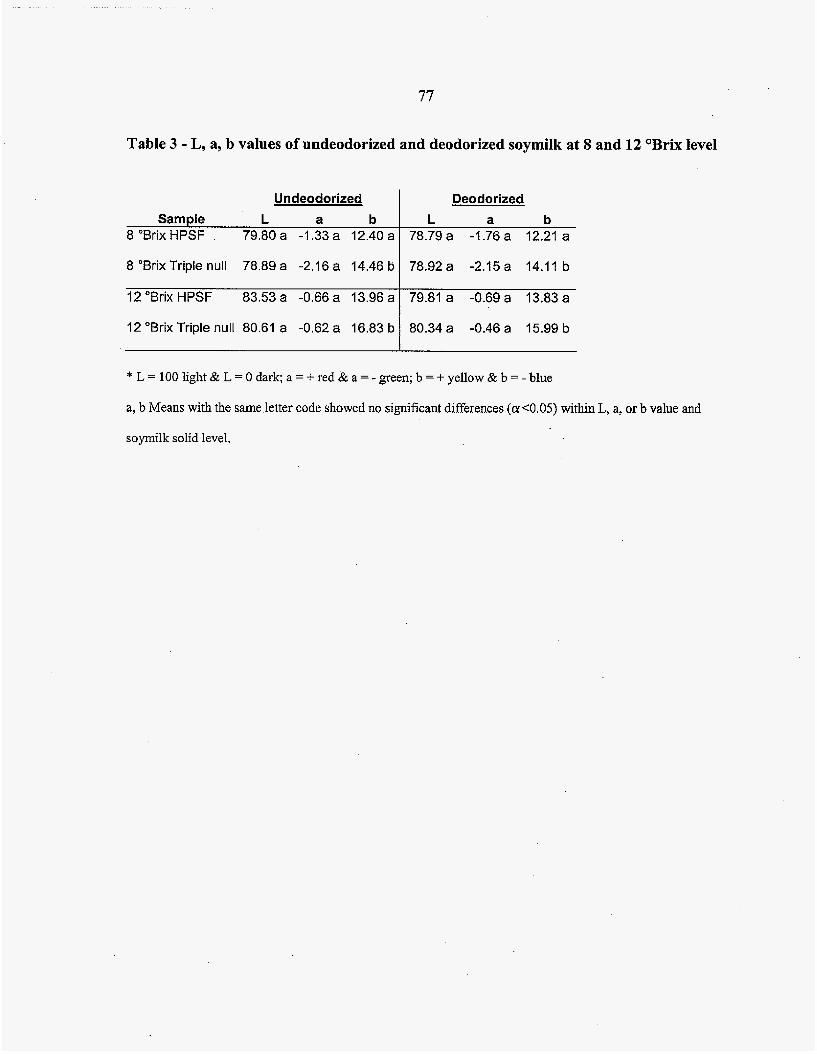
77
Sample L a b 8 "Brix HPSF 79.80 a -1 -33 a 12.40 a
Table 3 - L, a, b values of undeodorized and deodorized soymilk at 8 and 12 OBrix level
L a b 78.79 a -1.76 a 12.21 a
Undeodorized I Deodorized
8 'Brix Triple null 78.89 a -2.16 a 14.46 b
12 "Brix HPSF 83.53 a -0.66 a 13.96 a
12 "Brix Triple null 80.61 a -0.62 a 16.83 b
78.92 a -2.15 a 14.1 I b
79.81 a -0.69 a 13.83 a
80.34 a -0.46 a 15.99 b
* L = 100 light & L = 0 dark; a =+ red & a =- green; b =+ yellow & b = -blue
a, b Means with the same letter code showed no significant differences (a4.05) within L, a, orb value and
soymilk solid level.
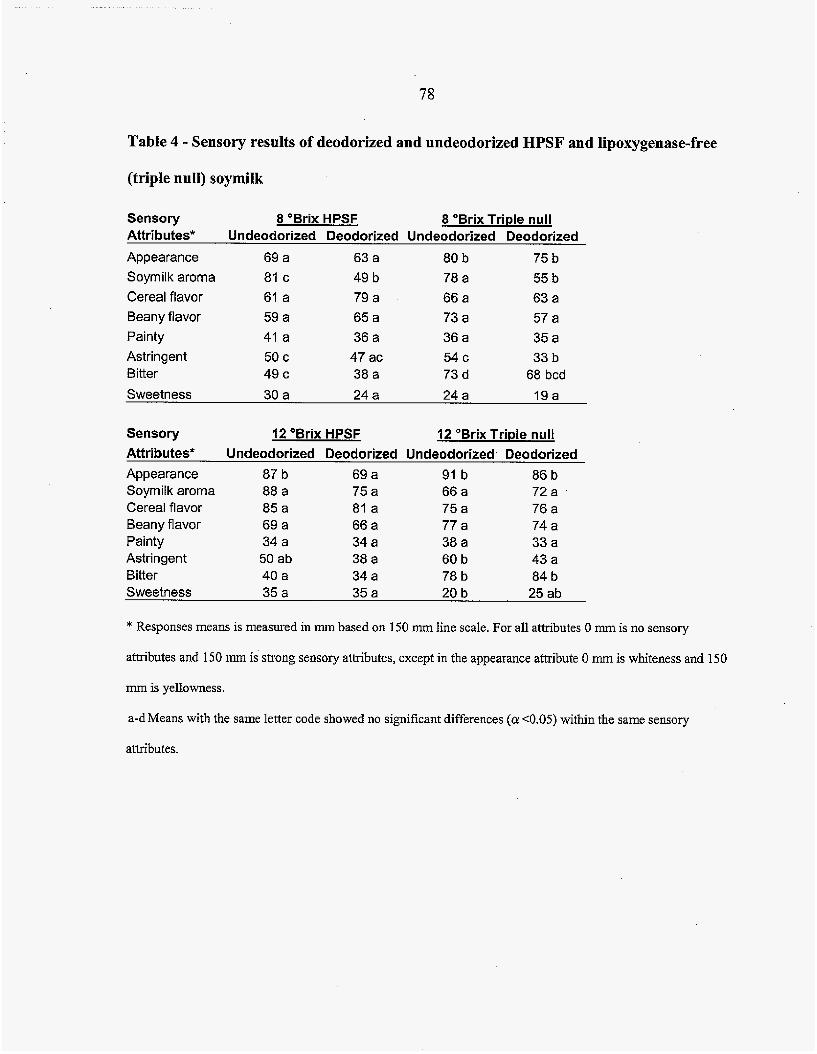
78
Table 4 - Sensory results of deodorized and undeodorhed HPSF and lipoxygenase-free
(triple null) soymilk
Sensory 8 "Brix HPSF 8 "Brix Triple null Attributes* Undeodorired Deodorized Undeodorized Deodorized
Appearance 69 a 63 a 80 b 75 b Soymilk aroma 81 c 49 b 78 a 55 b
Cereal flavor 61 a 79 a 66 a 63 a Beany flavor 59 a 65 a 73 a 57 a
Painty 41 a 36 a 36 a 35 a Astringent 50 c 47 ac 54 c 33 b sitter 49 c 38 a 73 d 68 bcd
Sweetness 30 a 24 a 24 a 19 a
Sensory I 2 "Brix HPSF 12 "Brix Triple null
Attributes* Undeodorized Deodorized Undeodorired Deodorized
Appearance 87 b 69 a 91 b 86 b Soymilk aroma 88 a 75 a 66 a 7 2 a . Cereal flavor 85 a 81 a 75 a 76 a Beany flavor 69 a 66 a 77 a 74 a Painty 34 a 34 a 38 a 33 a Astringent 50 ab 38 a 60 b 43 a Bitter 40 a 34 a 78 b 84 b Sweetness 35 a 35 a 20 b 25 ab
* Responses means is measured in m based on 150 mm line scale. For all attributes 0 mm is no sensory
attributes and 150 mm is strong sensory attributes, except in the appearance attribute 0 m is whiteness and 150
mm is yellowness.
a-dMeans with the same Ietter code showed no significant differences (a<O.O5) within the same sensory
attributes.
79
EFFICIENCY IN LIPID REMOVAL FROM SOYMILK MADE FROM
FULL FAT SOY FLAKE OR WHOLE SOYBEANS AT THRl3E SOLID
LEVELS
A paper to be submitted to the Journal of Food Science
S. Prawiradjaja and L.A. Wilson
ABSTRACT
Soymilk has been consumed as a substitute for cow's milk for centuries and is the
fastest growing soy food in the U.S. Unlike the dairy industry, fat reduction in soyrnilk has
been done through formula modification instead of by conventional fat removal techniques
(skimming). The objective of this study is to evaluate the efficiency of fat removal from
soymilk produced from whole soybeans and full-fat soy flakes at three solid levels; 5, 8, and
12 "Brix. Whole soybeans and soy flakes were used to make soymilk using a commercial
Takai Soymilk machine, Soymilk fat was removed using either a commercial dairy skimmer
or a centrifuge-decant method. Proximate analyses were determined on all fractions of the
skimming process (whole and skimmed soymilk, centrifuge precipitate, and cream). The
color of soymilk was measured using a Hunter color LabScan 5100. Regardless of skimming
method and solids levels, the fat from whole soybean milk was removed less efficiently than
from soy flake milk (7 to 30% fat extraction in contrast to 50 to 80% fat extraction
respectively). In soy flake milk, similar amounts of fat couId be removed from 5 and 8%
solids milk (75% fat extraction) but only 60% fat extraction from 12% solids milk using the
commercial dairy skimmer. In whole soybean milk, the fat was removed less efficiently at
80
lower solids level milk using the commercial dairy skimmer and more efficient at lower
solids level using the centrifuge-decant'method. The L, a, b value of the reduced fat soymilk
showed that soymiIk made from soy flakes yielded a darker, greener and less yellow color
miIk than whole soymilk (a < 0.05). Less observable differences were noticed in reduced fat
whole soybean milk (a e 0.05). Color comparison of whoIe and slum cow's milk showed the
same trend as in the soymilk.
Key words: soymilk, reduced fat and full fat soymilk
INTRODUCTION
In eastern Asia, soymilk has been consumed as cow's miIk substitute for centuries. In
the US, only until recently has there been an increase in the use of soy as a protein source.
Based on the market research conducted by SoyaTech in 1999, the sales of soy foods in the
U.S. were projected to increase from $2.1 billion to $3.57 billion by 2002 (Soya Tech 1999).
In 2002, Soya Tech released a new report showing that the soy food industry had already
reached $3.2 billion in sales by 2001. Soymilk saIes alone in 2001 has reached $550 million
and were projected to reach $1 billion in the coming three to five years (Soyatech 2002).
Cow's milk with various fat contents (whole, 2%, 1%, and skim) has been available
for sometime. Currently not many reduced fat soymilks are available in the grocery store.
The reduced fat soymilk can be made through formula modification. Soymilk can be
produced from soybeans and then additional protein (solids) materials can be added into the
soymilk to increase its solids content followed by dilution of the product. In the end, the
soymilk wouId have compositionally reduced fat but with the same amount of protein
81
compared to regular soymilk. Conceivably, the fat of soymilk can be removed using the same
method as cow's milk. In cow's milk, the cream is separated from the milk using centrifugal
force. In which, during centrifugation, the lower density fat will move inwards whereas the
higher density slum milk and other particles will move outwards of the axis of rotation. A
commonly used fat separator in dairy industry is a disc-bowl centrifuge.
In the study conducted by Moizuddin and others (1999), they evaluated the use of
whole soybean and full fat soy flakes for tofu production in using both direct and indirect
heat treatments. They reported that tofu made with soy flakes had lower fat content and the
okara has higher fat content than the tofu and okara made with whole soybeans in both
processing methods. The hulls from whole soybeans may play a role as a filtering aid during
pressing by providing channels for the fat to escape, where in soy flakes, the absence of the
hull caused caking of the insoluble matter and prevented the fat from escaping (Moizuddin
and others 1999).
Fat removal in soymilk has aIso been studied using a centrifuge method, in which it
was found that most of the fat could be separated as a floating layer which contains a few
proteins (Shibasaki and others 1972; Ono and others 1996). In a study conducted by Guo and
others (1997), the movement of lipid during soymilk heating was observed. In this study,
heated soymilk at different temperatures was separated into particulate, soluble and floating
fractions through centrifugation. They concluded that fat migration occurs in two stages. In
the first stage, fat is released into the soluble fraction at 65-75 "and then the fat migrated
from the soluble to the floating fraction at temperatures above 75 "C in the second stage. In
this study, they also reported that the release of fat from the particulate to the soluble fraction
is due to the denaturation of the glycinin protein. These findings correspond to the results
82
reported by Aoki and others (1980), where they reported that emulsifying capacity and
stability decreases as heat increased with the lowest emulsifying capacity was observed at 85
"C.
The instability of soy flake milk fat emulsions has been observed for three years in
the previous storage study of soy flakes milk conducted by Iowa State University's (ISU)
food processing class. Where in this class, various levels of homogenization pressure on soy
flakes milk (0 - 2000 psi.) was compared to whole soybean milk with the same level of
homogenization (0 - 2000 psi.). The class reported that no floating material was found on the
unhomogenized whole soybean milk until the 7~ day, while floating material (a bright yellow
layer containing fat and protein) was found on the unhomogenized soy flake milk the next
day. These results suggest that a traditional skimming method must be successful to remove
this fat
These mentioned studies have all been under lab scale processing conditions and the
optimum condition for fat removal in soymilk has not been determined. Hence, the objective
of this study is to evaluate the efficiency of fat removal from soymilk produced from whole
soybeans and soy flake at three different solid levels under pilot plant conditions.
MATERIALS & METHODS
Materials
Kgh protein blend soy flakes (HPSF) soy flakes were provided by MicroSoy
Corporation (Jefferson, LA, U.S.A,), Vinton 81 soybeans grown in 2001 were provided by
Pattison Bros (Fayette, IA, U.S.A.). All chemicals used for analyses were reagent grade
(Fisher Scientific, Fair Lawn, NJ, U.S.A.).
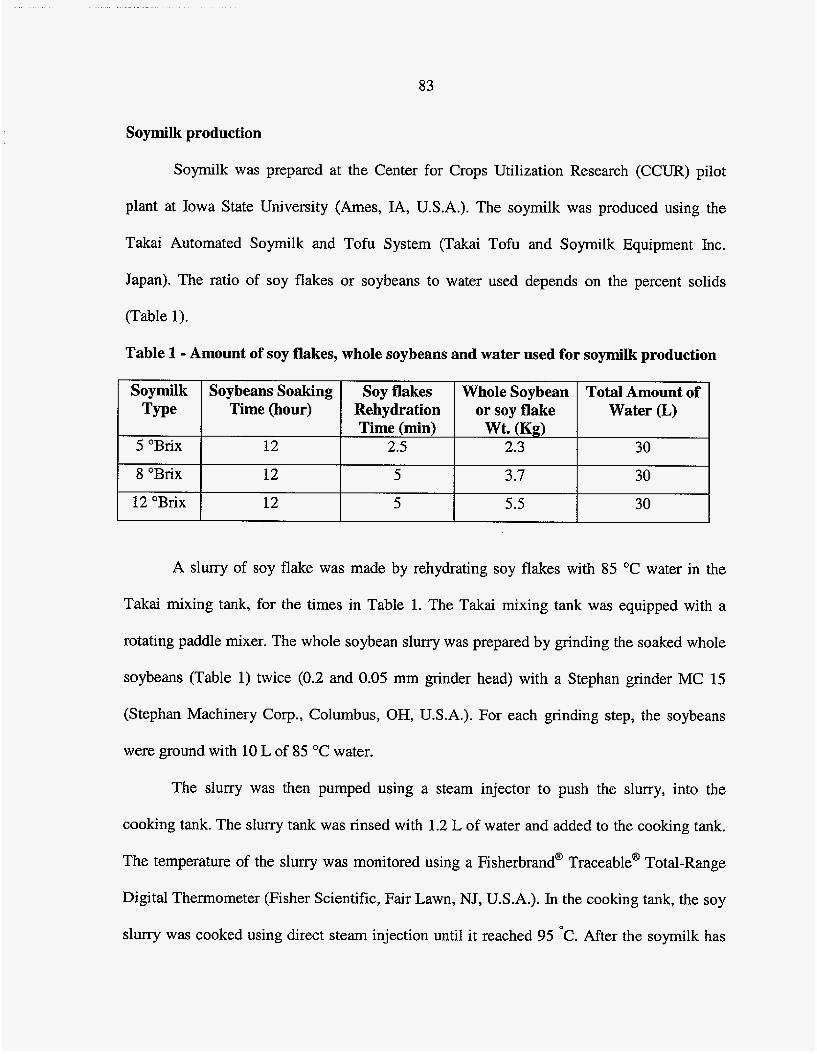
83
Soymilk Type
5 "Brix
8 'Brix
12 "Brix
Soybeans Soaking Soy flakes Whole Soybean Total Amount of Time (hour) Rehydration or soy flake Water (L)
Time (min) Wt. (Kg) 12 2.5 2.3 30
12 5 3.7 30
12 5 5.5 30
A slurry of soy flake was made by rehydrating soy flakes with 85 OC water in the
Takai mixing tank, for the times in Table 1. The Takai mixing tank was equipped with a
rotating paddle mixer. The whole soybean slurry was prepared by grinding the soaked whole
soybeans (Table 1) twice (0.2 and 0.05 rnm grinder head) with a Stephan grinder MC 15
(Stephan Machinery Corp., Columbus, OH, U.S.A.). For each grinding step, the soybeans
were ground with 10 L of 85 "C water.
The slurry was then pumped using a steam injector to push the slurry, into the
cooking tank. The sIurry tank was rinsed with 1.2 L of water and added to the cooking tank.
The temperature of the slurry was monitored using a Fisherbrand@ Traceable@ Total-Range
Digital Thermometer (Fisher Scientific, Fair Lawn, NJ, U.S.A.). In the cooking tank, the soy
slurry was cooked using direct steam injection until it reached 95 OC. After the soymilk has
84
reached 95 ‘C, the soymilk was then held at this temperature for 7 minutes (Moizuddin and
others 1999). The hot slurry was then pumped into a 120 mesh, horizontal rotating cylindrical
screen to separate the insoluble solids from the soymilk. The remaining insoluble solids were
roller-pressed over a 100-mesh stainless steel screen drum. The finished soymilk was then
collected into a 35-L stainless steel milk can. The finished soymilk produced from the Takai
soymilk machine will be designated as “whole soymilk” throughout this paper.
Fat removal of soymilk was done using two methods, dairy creamer and centrifuge-
decanter method. The first method uses a Westfalia Separator AG type LWA205, a pilot
plant scale dairy creamer (Oelde, Germany). Four liters of 5 ‘Brix soymilk and 2 L of 8 and
12 ‘Brix soymilk were pur into the holding bowl and the temperature of soymilk was
adjusted to 65 -70 “C. A lower amount of soymilk was used for the 8 and 12 “Brix soymilk to
Compensate for the larger amount of precipitate that may hinder the skimming process. The
skimmer is set to its maximum speed and the soymilk then entered the skimmer with a flow
rate of 880 ml/min. The cream and reduced fat milk was colIected in stainless steel buckets
and the weight was measured. The weight of the centrifuge bowl of the dairy creamer was
measured before and after the shkimming process. The material inside the centrifuge bowl was
collected in a plastic container. Additional hot water was used to collect all the materials
from the centrifuge bowl. The leftover materials found in the centrifuge were designated as
“centrifuge matter” which consists of precipitate, soymilk, and cream. The soymilk was then
homogenized at 5000 psi (Moizuddin and Wilson 2003a) and collected in a capped 2 L
plastic bottle. All soymilk samples were immediately refrigerated until analyses the
following day.
85
The second technique used was the centrifuge method described by Moizuddin and
others (2003b). The soymilk that was produced from the Takai was collected into 1 L
Ndgene centrifuge bottles and kept refrigerated overnight. The bottle was then centrifuge for
1 hour at 3500-rpm with the temperature held constant at 4 "C using a Sorvall RC 3b plus
centrifuge (Kendro Lab., Newtown, CT, U.S.A.). After 1 hour centrifugation a fat layer,
soymilk and precipitate layer can be seen in the soymilk. The soymilk was separated from the
lipid by decanting it through four layers of cheesecloth. The resulting lipid layer was solid
enough to be retained by the cheesecloth and it was not washed away by the soymilk. All
soymilk samples were immediately refrigerated for analyses.
The percent recovery and percent reduction of the process was calculated using the
following equation:
Output wt.. Input wt.
% Recovery = x 100%
x 100 % Mass of last components Muss of Initial components
% Reduction =
Moisture, protein and fat measurements
Moisture was analyzed using AOAC method 925.19 (AOAC 2000). Crude protein
was determined using the micro Kjeldahl AOAC methods 955.04(c) and 954.01 (AOAC
2000), with Kjeltab TCT was used as the catalyst instead of HgOz. Percent fat content of the
samples was determined using Babcock acid hydrolysis for whole and skim milk (Marshall
RT 1993), modified by adding n-butanol into the soymilk to increase fat collection similar to
86
the method described in Laboratory manual; methods of analysis of milk and its
products( 1959).
Color measurement
The color of soymilk was determined instrumentally using a 5100 LabScan (Hunter
CoIor Lab, Fairfax, VA, U.S.A.). Soymilk samples were placed into 60 X 15 mm diameter
plastic petri dishes (Fisher Scientific) and measurements were taken on the soymilk surface
using a 0.25-inch sampling port under D6S and 10 O standard observer iIlumination. Three
measurements of each sample were done at three different sites on the surface of the soymilk.
Statistical analyses
Proximate analyses data were analyzed using split plot design, and differences among
treatment means were analyzed using proc mixed based on the split plot design. Comparison
between two samples is calculated using paired t-test method. SAS System 8.02 (SAS
Institute Inc., Cay , NC, U.S.A.) statistical program was used for the statistical calculation.
RESULTS & DISCUSSION
Processing of soybean and soy flake milk
The three different solid level of soymilk were chosen because they represent the
commonly used solid level in the production of various soy products. Five 'Brix soymilk is
commonly produced for the production of firm style tofu; 8 'Brix soymilk is the solid level
commonly produced for commercial soymilk; and 12 "Brix soymilk is the solid level
cornmody produced for the production of base milk for transport efficiency. The soyrmlk at
87
the same solid levels that was produced using soybeans and soy flakes showed no statistical
significant difference in composition (Table 2).
Inside the centrifuge bowl of the dairy creamer, a precipitate layer can be found on
the inside cover of the centrifuge. The amount of centrifuge matter was consistently found to
be the same in soybean and soy flake milk at all solid levels. From this process, the %
recovery of soymilk was about 80% at the 8 and 12 "Brix level and 90% at the 5 "Brix level
for both soymilk sources (Table 3).
The higher "Brix level should have a greater amount of fat than the lower "Brix level
and therefore more cream output should be observed. However, cream was only produced
from soy flake milk at 5 and 8 "Brix level, no cream was produced from whole soybean milk
at all solid levels. The different amount of sample that is used for 8 and 12 "Brix whole
soybean milk and soy flake milk at 12 "Brix can be one of the reasons why the soymilk has
no cream output. However, if this were the case, soy flakes milk at 8 'Brix should not
produce a cream output. Further analyses of the soymilk, which will be discussed in the next
section, would explain this observation.
The soymilk produced was saved for centrifugation the next day. Upon refrigeration
for a day, two separate layers, which consist of a yellow floating layer and soymilk, were
observed on the soy flake milk; no separation is observed on the soybean milk. This
observation corresponds to the soymilk storage study conducted by the ISU food processing
class. The amount of the precipitate after the centrifuge process was found to be higher in the
soy flake milk. In both processes, the resulting cream from soy flakes has a bright yellow
color, whereas the cream from the whole soybean has a white color.
Fat removal using the commercial dairy skimmer and the centrifuge method
Inside the centrifuge, centrifuge matter were collected and analyzed for its solid,
protein and fat content. The centrifuge matter from soy flake milk processing showed a
higher % solid, % protein and % fat than from soybean milk at the 5 and 8 "Brix solid level.
At the 12 "Brix solid, the centrifuge matter of soy flake milk only has higher % solid and %
fat compared to soybean milk centrifuge matter (data not shown). These results support the
observation noted earIier in the centrifuge-decant method, which showed larger amount of
precipitate layer found from the centrifuged soy flake milk (Table 2).
Using the dairy skimmer, more fat can be removed from soy flake milk than from
whole soybean milk (Table 4). The amount of fat removed from soy flake milk is about 2-5
fold more than what is removed from whole soybean milk. Across the different "Brix levels
of soy flake milk, there was no statistical difference (a e 0.05) found between the % fat
extracted from 5 and 8 "Brix solids level, but the % fat extracted was found significantly
lower for 12 "Brix solids soymilk. In whole soybean milk, S "brix soymilk had significantly
lower fat extracted than either 8 or 12 'Brix soymilk with no statistical significant difference
found between them (a < 0.05). The same trend is found in % solid extracted its in the % fat
extracted (Table 4). Within the same solid level, there is no statistically significant different
between soy flake and whole soybean milk (a < 0.05) in the % protein extracted (Table 4).
Across all solid levels, there was no significant difference in the % protein extracted in soy
flakes (a e 0.05).
The results from the centrifuge-decant method showed similar results to the dairy
skimmer method. The amount of fat extracted is greater in soy flake milk than in soybean
milk (Table 4). In soy flake milk, the highest % fat extracted is obtained at the 8 "Brix level,
89
and the lowest at the 12 "Brix level. The opposite result is found in whole soybean miIk; the
lowest IeveI of % fat extracted is found at the 8 and 12 "Brix level and the highest is at 5
'Brix level. Compare to the resuIt of soybean milk using the dairy skimmer, the % fat
extracted in this procedure does not follow the same trend (Fig. 3). In the dairy skimmer, the
% fat extracted increases as the solids level of soybean milk (8 and 12 "Brix) increases,
where in the centrifuge-decant method the % fat extracted decreases as the solids level
increases. Within the same soymilk type (soy flakes milk or whole soybean milk), there is no
statistica1 significant difference (a < 0.05) across all "Brix level for protein extracted using
the centrifuge-decant method. However, more protein is extracted from soy flake milk than
whole soybean milk (a < 0.05) (Table 4).
Emulsion stability can be improved by increasing the viscosity or by adding an
emulsifier (Friberg 1997), Based on this theory, as the amount of solids in soymilk increase,
the viscosity of the milk would also increase and hence would increases the emulsion
stability of milk; and therefore, the fat would be harder to be removed at higher % solid. Soy
protein is known to be a good emuIsifier. An increase of soy protein in the milk should
increase the emulsion stability as well. Since there is no difference in the amount of protein
and fat between soy flake and whole soybean milk, they both have the same protein to fat
ratio. The same protein to fat ratio between the two types of milk suggests the amount of
protein interacting with the fat globuIes should be similar. Therefore, the fat removal of
soymilk should be depended on other factors such as the solids level or processing. The result
of soy flake milk seems to support this hypothesis, where there is a decrease in % fat
extraction as the % solid increases (Fig. 3). Whole soybean milk results showed two different
90
and opposite trends in the % fat extraction between the two methods (Fig. 3). Therefore, the
same hypothesis cannot be applied in whole soybean milk.
The lower emulsion stability of soy flake milk helps in the removal of fat from
soymilk (shown by separation upon storage). This lower emuIsion stability of soy flakes may
be explained based on the analyses of the centrifuge matter. Protein extraction by the dairy
slummer was greater in soy flake milk than soybean milk. The larger amount of protein
indicates that soy flakes protein in soymilk is more prone to denaturation than whole soybean
milk protein and this denaturation of protein releases the fat more readily. As indicated by
Guo and others (1997), the denaturation of protein, which is found in the particulate matter of
soymilk, was followed by the increase of fat into the floating Iayer as the soymilk is being
heated. The denaturation of soy flake milk protein perhaps occurs during the hot rehydration
step of making the soymilk.
In addition, there is a possibility that the different method of making soymilk in
soybean and soy flakes (gnnding in soybean against no grind in soy flakes) played a
significant role in the emulsion stability of the soymilk. Since the soybean milk was prepared
through grinding the whole soybeans twice, the small opening at the grinder head (0,05 m)
may partly homogenized the soybean milk and therefore increase the emulsion stability of
the soymilk. An incorporation of more protein into the fat globules during grinding might
increases the soymilk emulsion stability property. The influences of processing method on
emulsion stability have also been reported by Tornberg and others (1977).
In soy flake milk, within the same 'Brix level, there was no statistical difference
found between the two methods (Fig. 3); except at the 5 "Brix, where a higher % fat
extraction was found using the dairy skimmer. In both methods, the least amount of fat
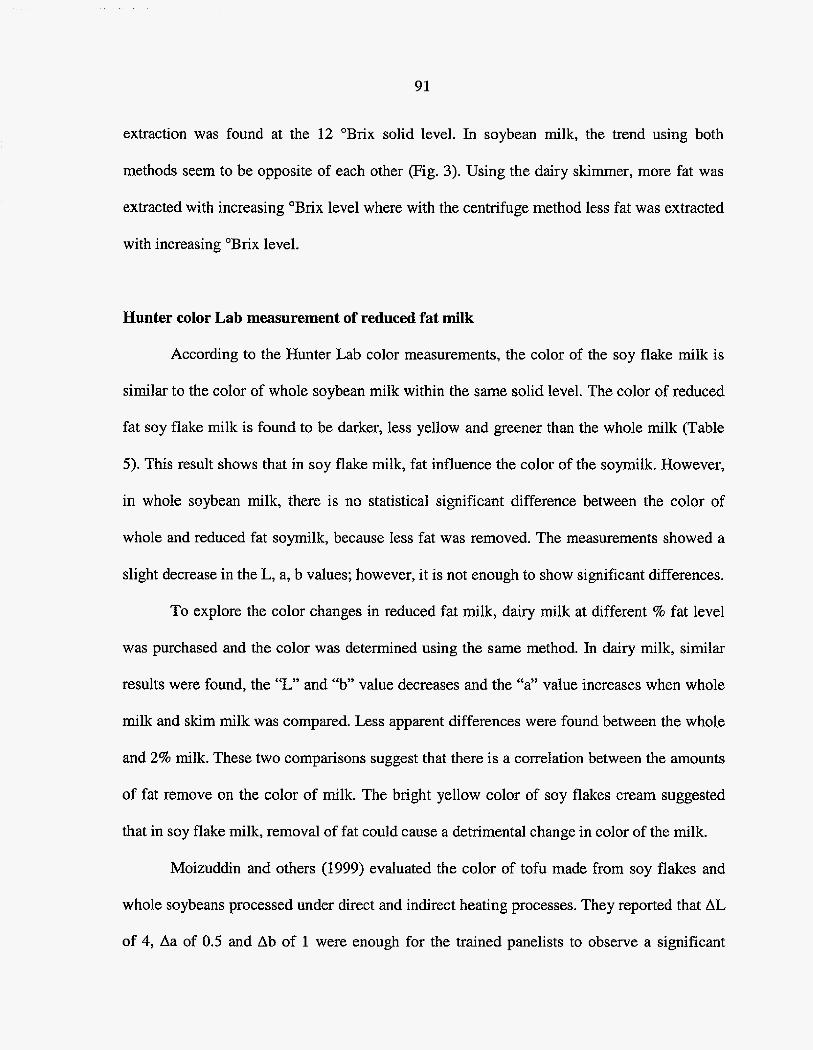
91
extraction was found at the 12 ‘Brix solid level. In soybean milk, the trend using both
methods seem to be opposite of each other (Fig+ 3). Using the dairy skimmer, more fat was
extracted with increasing “Brix level where with the centrifuge method less fat was extracted
with increasing “Brix level.
Hunter color Lab measurement of reduced fat milk
According to the Hunter Lab color measurements, the coIor of the soy flake milk is
similar to the color of whole soybean milk within the same solid level. The color of reduced
fat soy flake milk is found to be darker, less yellow and greener than the whole milk (Table
5). This result shows that in soy flake milk, fat influence the color of the soymilk. However,
in whole soybean milk, there is no statistical significant difference between the color of
whole and reduced fat soymilk, because less fat was removed. The measurements showed a
slight decrease in the E, a, b values; however, it is not enough to show significant differences.
To explore the color changes in reduced fat milk, dairy milk at different % fat level
was purchased and the color was determined using the same method. In dairy milk, similar
results were found, the “L” and “b” value decreases and the “a” value increases when whole
milk and skim milk was compared. Less apparent differences were found between the who1.e
and 2% milk. These two comparisons suggest that there is a correlation between the amounts
of fat remove on the color of milk. The bright yellow color of soy flakes cream suggested
that in soy flake milk, removal of fat could cause a detrimental change in color of the milk.
Moizuddin and others (1999) evaluated the color of tofu made from soy flakes and
whole soybeans processed under direct and indirect heating processes. They reported that AL
of 4, Aa of 0.5 and Ab of 1 were enough for the trained panelists to observe a significant
92
difference in the color of tofu. Assuming that the color difference of tofu and soymilk
perceived similarly by trained panelists, then the color of whole soymilk and reduced fat milk
should be noted to be different if it would undergo a trained panelist sensory evaluation.
CONCLUSION
In both processes, soy flake milk yield a better extraction of fat than soybean milk,
these findings may be attributed to the processing effect of the soy flakes. There is an
indication of a decrease in fat removal with increase of solid levels of soymilk made from
soy flakes. However, the result was not found to be true in soybean milk. The removal of fat
from soymilk is followed by a change in the color of soymilk, and the changes are more
pronounced as more fat is removed.
REFERENCES
AOAC. 2000, Official Methods of Analysis. 17* Ed. Washington, DC: Association of
Official Analytical Chemists.
Aoki €I, Taneyama 0, Inami M. 1980, Emulsifying capacity of soy protein: characteristic of
7s and 11 S proteins. J. Food Sci. 45:534-546
Buchheim W, Dejmek P. 1997. Milk and dairy-type emulsions, In: Friberg SE and Larsson
K, editors. Food emulsions. 3'* Ed., revised and expanded. New York: Macel and
Dekker. p 235-78.
Friberg SE. 1997. Emulsion stability. In: Friberg SE and Larsson K, editors. Food emulsions.
3'd Ed. Revised and expanded. New York: Macel and Dekker. p 1-56.
93
Guo ST, Ono T, Mikami M. 1997. Interaction between protein and lipid in soybean milk at
elevated temperature. J. Agric. Food Chern. 45:460 1-4605.
Marshall RT. 1993. Standard methods for the examination of dairy products. 16th Ed.
Washington, D.C.: American Public Health Association. 546 p.
Milk Industry Foundation. 1959. Laboratory manual; methods of analysis of milk and its
products. Washington, D.C.: Milk Industry Foundation. 838p.
Moizuddin S , Harvey G, Fenton AM, Wilson LA, 1999. Tofu production from soybeans or
full-fat soyflakes using direct and indirect heating processes. J. Food Sci. 64(1): 145-
148.
Moizuddin S, Wilson LA. 2003a. Unpublished data. Iowa State University, Ames Ia.
Moizuddin S , Wilson LA. 2003b , Unpublished data. Iowa State University, Ames la.
Shibasaki K, Okubo K, Sat0 T. 1972. Food chemical studies on soybean proteins part X.
Shifting of protein to cream layer of soybean milk and the emulsifying capacity. J.
Jap. Soc, Food Sci. 19:589 (Japanese).
SoyaTech. 1999. The North American soy foods market. Bar Harbor, Maine: SoyaTech Inc.
and Senechal, Jorgenson & Hale Co., www.soyatech.com. Accessed: June 7.
SoyaTech., 2002. Soya Foods: The U.S. Market 2002. Bar Harbor, Maine: SoyaTech Inc.
and Senechal, Jorgenson & Hale Co., www.soyatech.com. Accessed: June 7.
Tornberg E, Olsson A, Persson K. 1997. Emulsion Stability. In: Friberg SE, Larsson K,
editors, Food emulsions. 3rd Ed. Revised and expanded. New York, New York: Mace1
and Dekker. p 279-359.
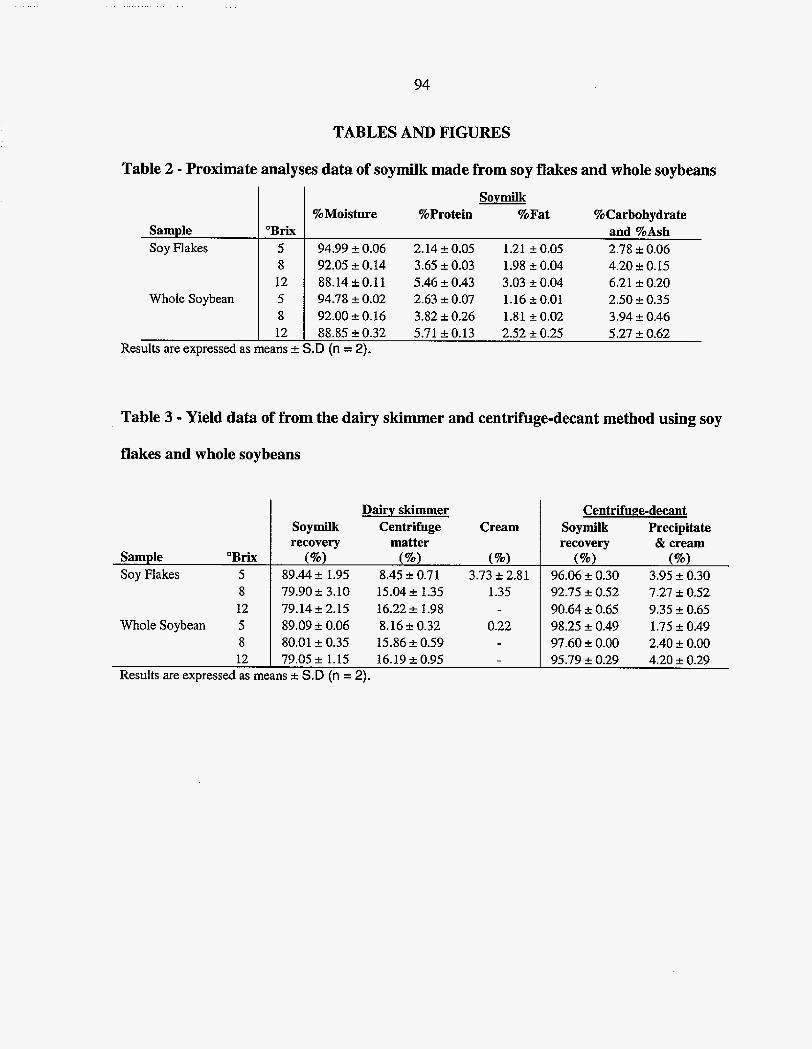
94
Sample Soy Flakes
WhoIe Soybean
TABLES AND FIGURES
Soymilk %Moisture %Protein %Fat %Carbohydrate
"Brix and %Ash 5 94.99 a 0.06 2.14 & 0.05 1.21 a 0.05 2.78 +. 0.06 8 92.05 a 0.14 3.65 f 0.03 1.98 a 0.04 4.20 J- 0.15 12 88.14 -c 0.11 5.46 f 0.43 3.03 k 0.04 6.21 f 0.20 5 94.78 f 0.02 2.63 2 0.07 1.16 h 0.01 2.50 +. 0.35 8 92.00 a 0.16 3.82 f 0.26 1.81 10.02 3.94 -c 0.46 12 88.85 f 0.32 5.71 f 0.13 2.52 1 0.25 5.27 a 0.62
Sample "Brix Soy Flakes 5
Table 3 - Yield data of from the dairy skimmer and centrifuge-decant method using soy
flakes and whole soybeans
(%'a) (%I (960) (%'a) 89.44 a 1.95 8.45 f 0.71 3.73 k 2.81 96.06 f 0.30 3.95 f 0.30
Dairy skimmer Soymilk Centrifuge Cream recovery matter
Centrifuge-decant Soymilk Precipitate recovew & cream 1 79.90 f 3.10 15.04 f 1.35 Ll;
Whole Soybean 79.14 2 2.15 89.09 a 0.06 80.01 a 0.35
16.22 f 1.98 8.16 f 0.32 15.86 +. 0.59
12 79.05 f 1.15 16.19 f 0.95 Results are expressed as means * S.D (n = 2).
92.75 f 0.52 90.64 f 0.65 98.25 f 0.49 97.60 * 0.00 95.79 k 0.29
7.27 f 0.52 9.35 * 0.65 1.75 2 0.49 2.40 f 0.00 4.20 f 0.29
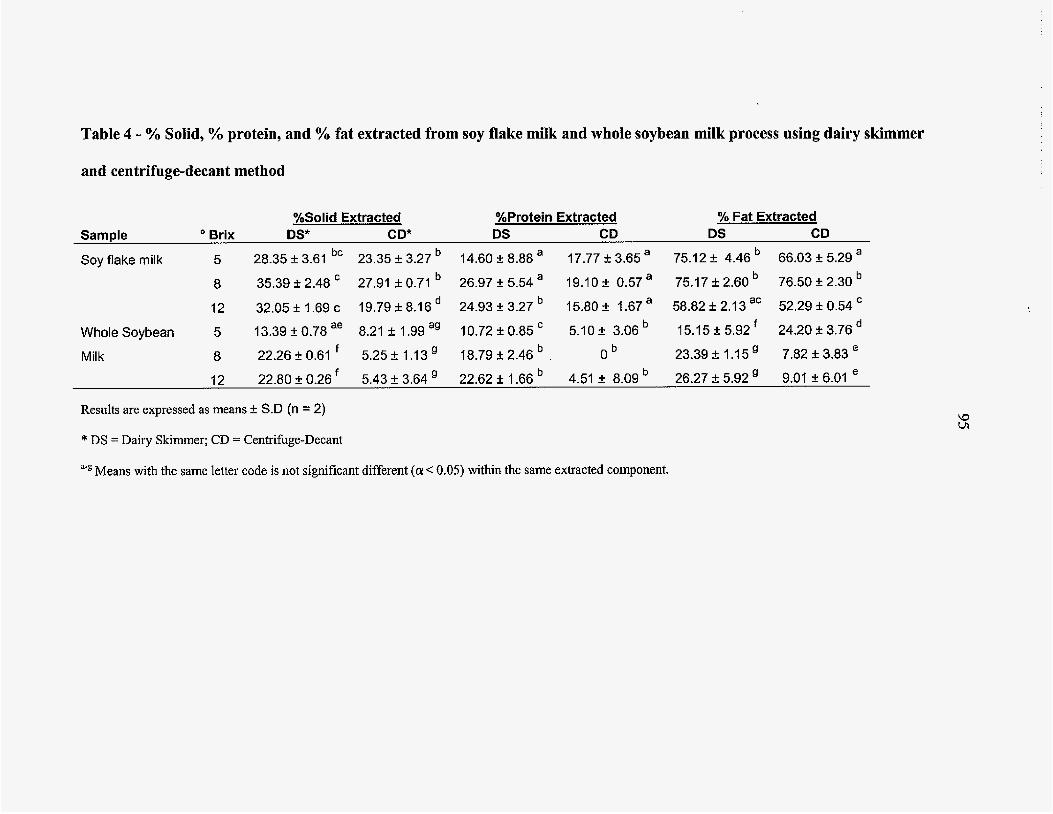
Table 4 - % Solid, % protein, and % €at extracted from soy flake milk and whole soybean milk process using dairy skimmer
and centrifuge-decant method
%Solid Extracted %Protein Extracted % Fat Extracted Sample Brix DS* C D* DS CD DS CD
Soy flake milk 5 28.35 f 3.61 bc 23.35 f 3.27 14.60 f 8.88 a 17.77 f 3.65 a 75.1 2 & 4.46 66.03 1: 5.29 a
8 35.39 f 2.48 27.91 k 0.71 26.97 f 5.54 a 19.10 f 0.57 a 75.17 f 2.60 76.50 e 2.30
12 32.05 f 1.69 c 19.79 k 8.16 24.93 3.27 15.80 f 1.67 a 58.82 f 2.13 52.29 f 0.54
Whole Soybean 5 13.39 & 0.78 ae 8.21 f 1.99 ag 10.72 -t. 0.85 5.10 f 3.06 15.15 f 5.92 24.20 1: 3.76
Milk 8 22.26 1: 0.61 5.25 f 1 .I3 ' 18.79 & 2.46 O b 23.39 f 1.1 5 ' 7.82 1: 3.83 e
12 22.80 f 0.26f 5.43 & 3.64 22.62 f 1.66 4.51 f 8.09 26.27 f 5.92 9.01 f 6.01 e
Results are expressed as means k S.D (n = 2)
* DS = Dairy Skimmer; CD = Centrifbge-Decant
a-g Means with the same letter code is not significant different (a < 0.05) within the same extracted component.
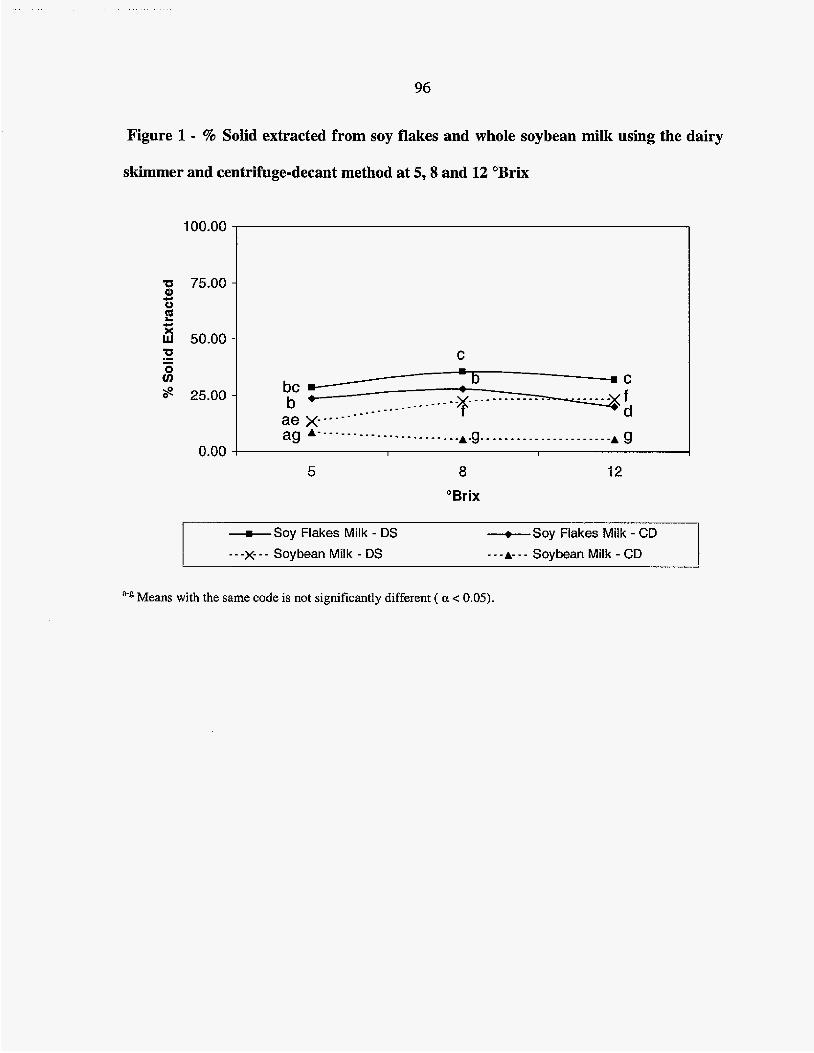
96
Figure 1 - % Solid extracted from soy flakes and whole soybean milk using the dairy
skimmer and centrifuge-decant method at 5,s and 12 "Brix
-Soy Flakes Milk - DS
- - -x- - - Soybean Milk - DS
---+-Soy Flakes Mitk - CD - - -& - - Soybean Milk - CD
Means with the same code is not significantly different ( a < 0.05).
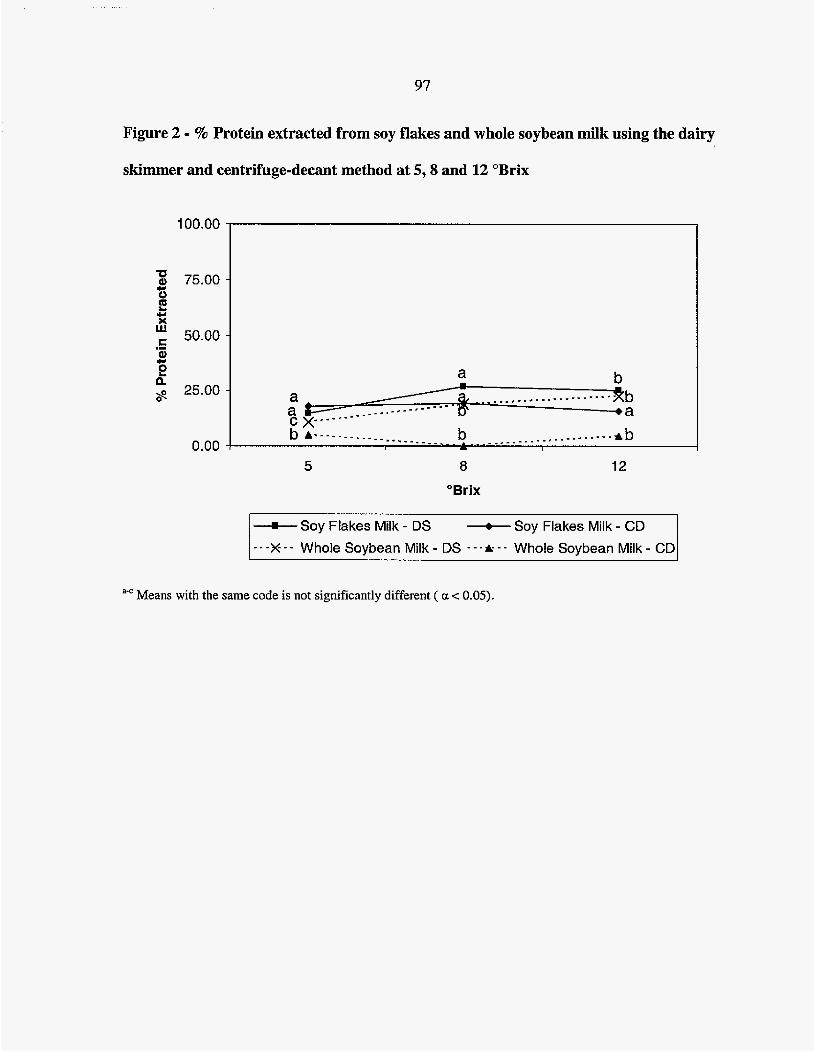
97
Figure 2 - % Protein extracted from soy flakes and whole soybean milk using the dairy
% w 75.00 -
i?
C 50.00 -
0
ICI
.- 8 c E n s 25.00 -
0.00
skimmer and centrifuge-decant method at 5,8 and 12 'Brix
b Tb *a
a . _ _ , _ _ l . _ _ - . _ - - . - . * . -
I . . . . . . . . . . . . . . . . . . . . . I A b b
100.00 ~
5 a 12
"Brix
-Soy Flakes Milk - DS
- - -X - - Whole Soybean Milk - DS - - - P - - Whole Soybean Milk - CD -Soy Flakes Milk - CD
Means with the same code is not significantly different ( a c 0.05).
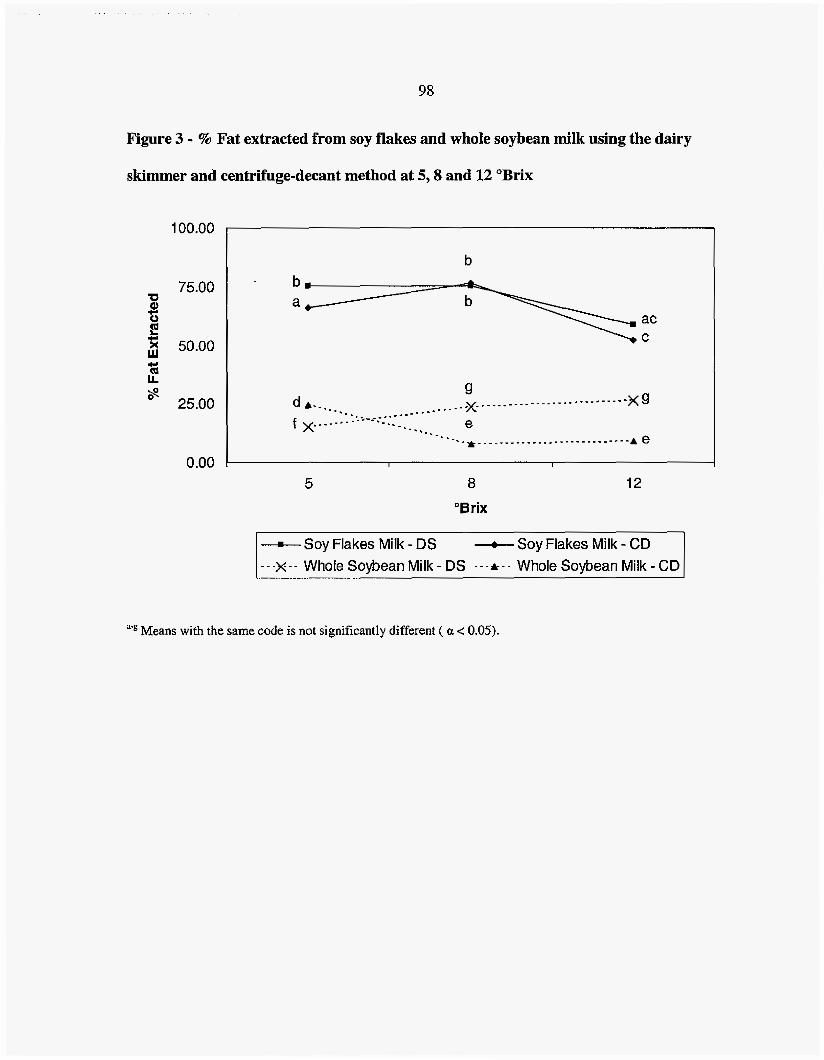
98
Figure 3 - % Fat extracted from soy flakes and whole soybean milk using the dairy
skimmer and centrifuge-decant method at 5 ,8 and 12 'Brix
100.00
75.00 m a u + i? 5 50.00 w CI Q L ' 25.00
0.00
b
1-
5 8 12
"Brix
-Soy Flakes Milk - DS - - -X-- Whole Soybean Milk- DS ---A--- Wholesoybean Milk- CD
-e-- Soy Flakes Milk - CD
a-6 Means with the same code is not significantly different ( a < 0.05).

99
Figure 4 - % Fat and % Protein of whole milk, and reduced fat milk from dairy
skimmer and centrifuge-decant method from soy flake and whole soybean milk at 5
"Brix level.
3.00
2.50
2.00 *, S
E 1.50 d
8 s
1.00
0.50
0. DO
-%Fat - Soy Flakes
-o-% Fat - Soybeans
+%Protein - Soy Flake:
a a
b % W
m a K
C =i Whole Mflk Reduced Fat (Skimmer) Reduced Fat (Centrifuge)
2.04 1.97
2.63 2.66 2.53
Means with the same code is not significantly different ( a < 0.05). a e
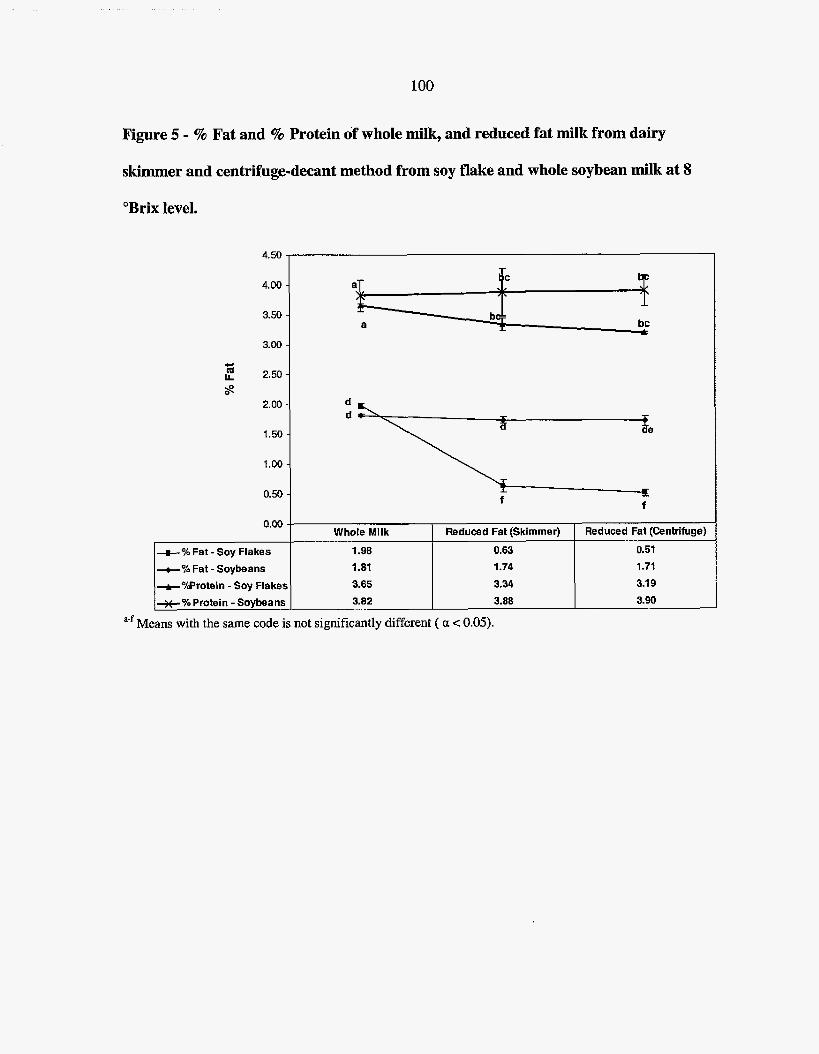
100
Figure 5 - % Fat and % Protein of whole miIk, and reduced fat milk from dairy
skimmer and centrifuge-decant method from soy €lake and whole soybean milk at 8
"Brix level.
4.50
4.00
3.50
3.00
CI
2.50
2.00 s?
1.50
1.00
0.50
0.00
+%Fat - Soybeans
+OMrrotein - Soy Flake!
Whole Mllk
1.98
1.81
3.65 3.82
3.34 3.19
3.86 3.90
Means with the same code is not significantly different ( a < 0.051. a-f
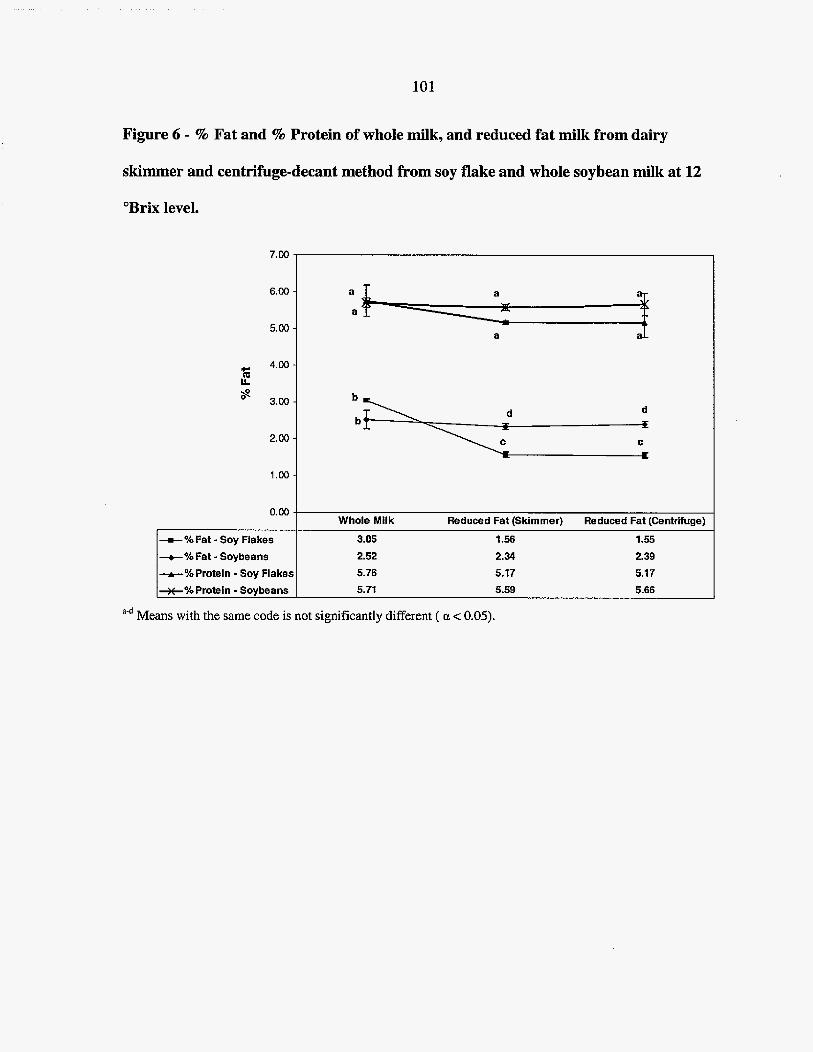
101
Figure 6 - % Fat and % Protein of whole milk, and reduced fat milk from dairy
skimmer and centrifuge-decant method from soy flake and whole soybean milk at 12
"Brix level.
7. 00
6.00
5. Do
- 4.00
$
m LL
3. w
2. DO
1 .w
0.00
-%Fat - Soy Flakes
-+-%Fat - Soybeans
-%Protein - Soy Flake:
a
a
a d
Whole Milk Reduced Fat (Skimmer) Reduced Fat (Centrifuge)
3.05 3-56 1-55
2.52 2.34 239 5.76 5.17 5.17 5.71 5.59 5.66
ad Means with the same code is not significantly different ( a -= 0.05).
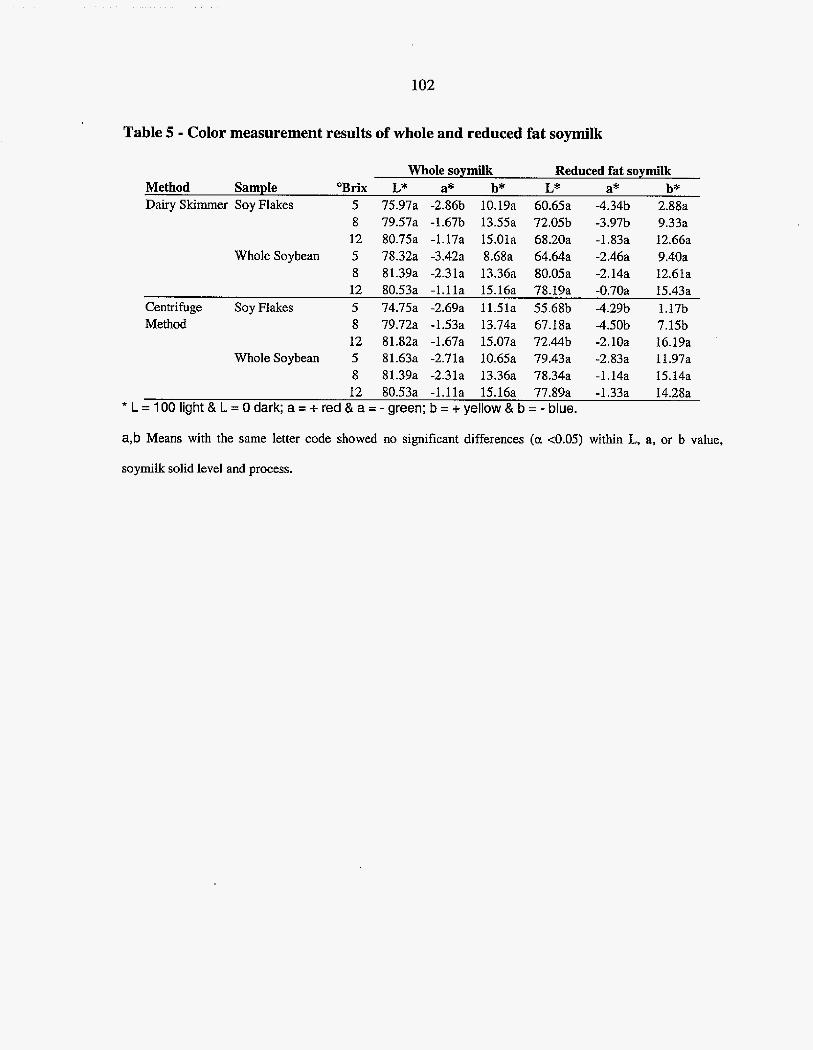
102
Table 5 - CoIor measurement results of whole and reduced fat soymilk
Whole Soybean
Whole Soybean
Whole soymilk Reduced fat soymilk Method Sample 'Brix L* a* b* L* a* b* Dairy Skimmer Soy Flakes 5 75.97a -2.86b 10.19a 60.65a -4.34b 2.88a
8 79.57a -1.67b 13.55a 72.0% -3.97b 9.33a 12 80.75a -1.17a 15.01a 68.20a -1.83a 12.66a 5 73.32a -3.42a 8.68a 64.64a -2.46a 9.40a 8 81.39a -2.31a 13.36a 80.05a -2.14a 12.61a 12 80.53a -1.lla 15.16a 78.19a -0.70a 15.43a
Centrifuge Say Flakes 5 74.75a -2.69a 11.51a 55.68b -4.29b 1.17b Method 8 79.72a -1.53a 13.74a 67.IXa -4SOb 7.15b
12 81.82a -1.67a 15.07a 72.44b -2.10a 16.19a 5 81.63a -2.71a 10.65a 79.43a -2.83a 11.97a 8 81.39a -2.31a 13.36a 78.34a -1.14a 15.14a 12 80.53a -1.lla 15.16a 77.89a -1.33a 14.28a
* L = 100 light ii L = 0 dark; a = + red & a = - green; b = + yellow & b = - blue.
a,b Means with the same letter code showed no significant differences (a <0.05) within L, a, or b value,
soymilk solid level and process.
103
CONCLUSIONS
From the first study, it was concluded that as with other powdered raw material
alternatives to whole soybeans, immediate introduction to the water would cause
agglomeration to the powder. Soy flakes is no difference than its powder counterparts. Initial
rehydration step is needed in order to process soy flakes, unless the equipment is able to
break the agglomeration of the product without homogenizing the milk.
High temperature rehydration, similar to previous study with whole soybeans, would
causes protein denaturation, which would heat fixed the protein within the soy flakes. Protein
fixation in soy flakes is followed by fat and water fixation as well. Based on the GC data,
flavor improvement can be achieved through this high temperature rehydration (pre
blanching step) with no significant color changes to the soymilk. The optimum condition for
flavor and extraction of soy flakes processing for 5 "Brix soymilk can be achieved at 50 "C
for 5 minutes. As for optimum processing condition of 8 and 12 'Brix soymilk, it can be
achieved by rehydration at 5 and 10 minute at 85 "C respectively,
In the flavor improvement of soymilk study, the GC data showed that the deodorizer
was effective in reducing the original amount of hexanal in HPSF soymilk to the level found
in undeodorized triple null soymilk. The sensory evaluation results did show that the
deodorizer was able to reduce the soymilk aroma in HPSF soymilk so it would be similar to
triple null soymilk at 8 "Brix level.
The study on the fat reduction of soymilk leads to the conclusion that in both
processes, soy flake milk yields a better extraction of fat than soybean milk. These findings
may be attributed to the processing effect on the soy flakes. There is an indication of a
104
decrease in fat removal with increase of solid levels of soymilk made from soy flakes.
However, the result does not find to be true in soybean milk. The removal of fat f?om
soymilk is followed by a change in the color of soymilk, and the changes are more
pronounced as more fat is removed.
Based on these completed studies several Euture studies are recommended:
1. The effect of high temperature rehydration of soy flakes on yield and quality of tofu.
2. The quality of soy flakes protein (NSI, structure and so forth) compared to whole
soybean protein.
3. Evaluation of how fat removal changes the sensory properties of reduced fat soymilk.
4. Color changes during the production of soy flakes should be investigated.
5 . The quality of tofu made fiom the reduced fat soymilk.
6. Sensory evaluation of undeodorized and deodorized soymilk should be re-done with a
fresh lipoxygenase-free (triple null) soy flakes or whole soybeans.
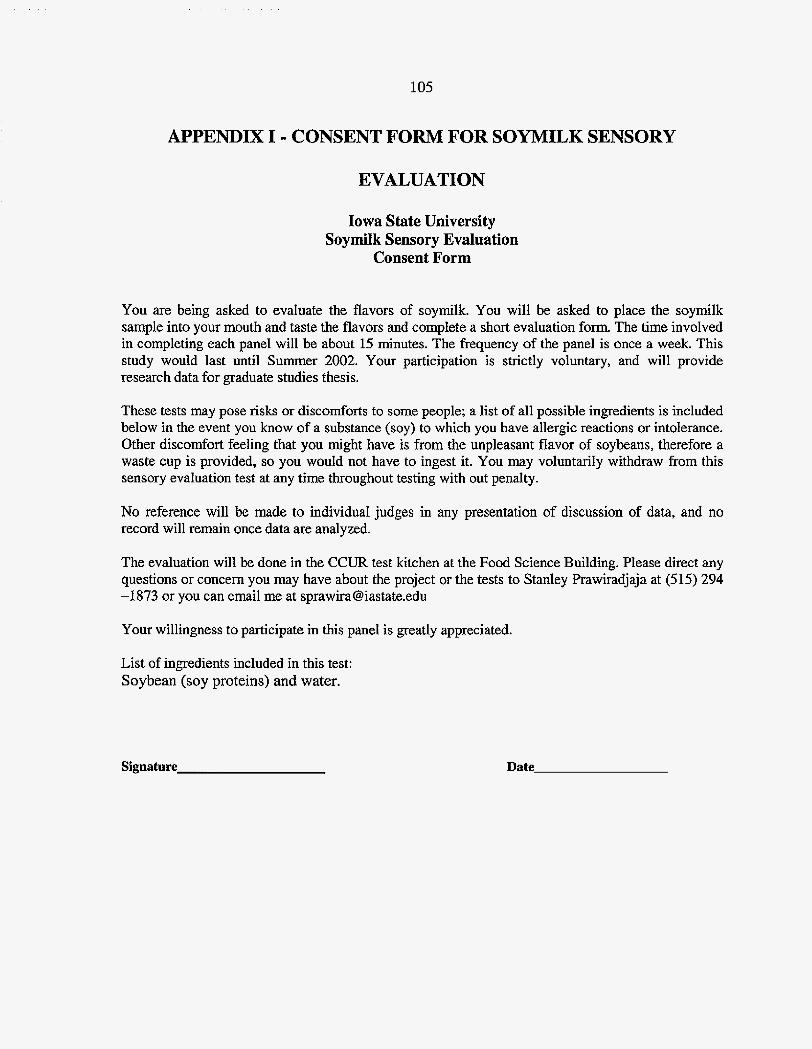
105
APPENDIX I - CONSENT FORM FOR SOYMILK SENSORY
EVALUATION
Iowa State University Soymilk Sensory Evaluation
Consent Form
You are being asked to evaluate the flavors of soymilk. You will be asked to pIace the soymilk sample into your mouth and taste the flavors and complete a short evahation form. The time involved in completing each panel will be about 15 minutes. The frequency of the panel is once a week. This study would last until Summer 2002. Your participation is strictly voluntary, and will provide research data for graduate studies thesis.
These tests may pose risks or discomforts to some people; a list of all possible ingredients is included below in the event you know of a substance (soy) to which you have allergic reactions or intolerance. Other discomfort feeling that you might have is from the unpleasant flavor of soybeans, therefore a waste cup is provided, so you would not have to ingest it. You may voluntarily withdraw from this sensory evaluation test at any time throughout testing with out penalty.
No reference will be made to individual judges in any presentation of discussion of data, and no record will remain once data are analyzed.
The evaluation will be done in the CCUR test kitchen at the Food Science Building. Please direct any questions or concern you may have about the project or the tests to Stanley Prawiradjaja at (5 15) 294 -1873 or you can email me at [email protected]
Your willingness to participate in this panel is greatly appreciated.
List of ingredients included in this test: Soybean (soy proteins) and water.
Date
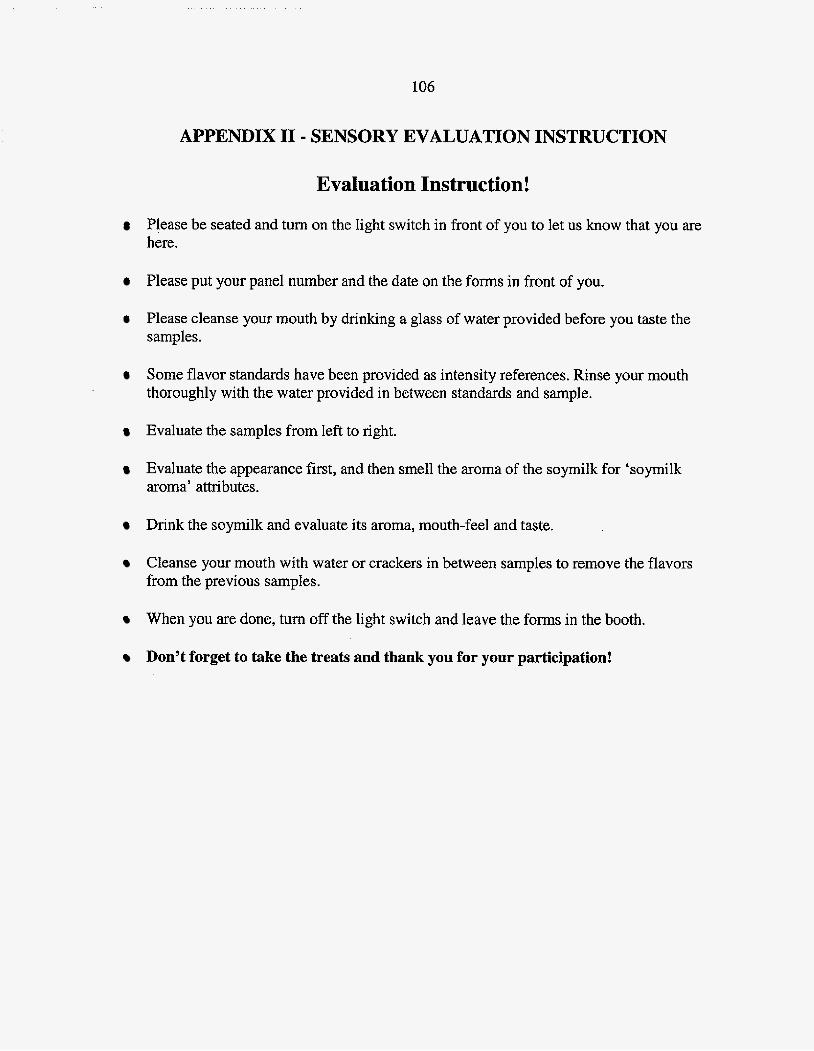
APPENDIX 11 - SENSORY EVALUATION INSTRUCTION
Evaluation Instruction!
Please be seated and turn on the Iight switch in front of you to let us know that you are here.
Please put your panel number and the date on the forms in front of you.
Please cleanse your mouth by drinking a glass of water provided before you taste the samples.
Some flavor standards have been provided as intensity references. Rinse your mouth thoroughly with the water provided in between standards and sample.
Evaluate the samples from left to right.
Evaluate the appearance first, and then smell the aroma of the soymiIk for ‘soymilk aroma’ attributes.
Drink the soymilk and evaluate its aroma, mouth-feel and taste.
Cleanse your mouth with water or crackers in between samples to remove the flavors from the previous samples.
When you are done, turn off the light switch and leave the forms in the booth.
Don’t forget to take the treats and thank you €or your participation!
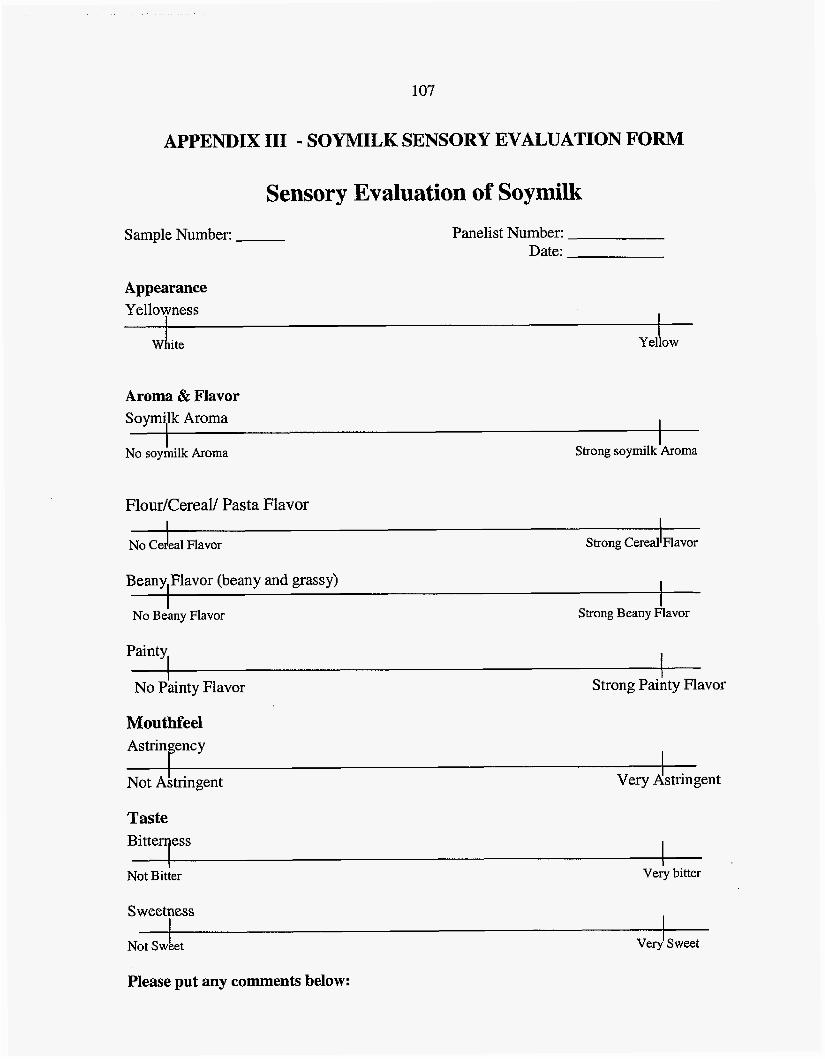
107
APPENDIX I11 - SOYMILK SENSORY EVALUATION FORM
Sensory Evaluation of Soymilk
Sample Number: Panelist Number: Date:
Appearance Yellowness
I W ite Ye1 ow
Aroma & Flavor Soym3k Aroma I
I Strong soymilk Aroma No soymilk Aroma
Flour/Cereal/ Pasta Flavor I I
No d e a l Flavor Strong CereallFlavor
Beany Flavor (beany and grassy) I I
No Beany Flavor Strong Beany Flavor
Painty, t - 1 No Painty Flavor
1 Strong Painty Flavor
Mouthfeel
Not Ahingent very Astringent
Taste
I I Very bitter Not Bitter
Sweetness
Not Swket veryl sweet
Please put any comments below:
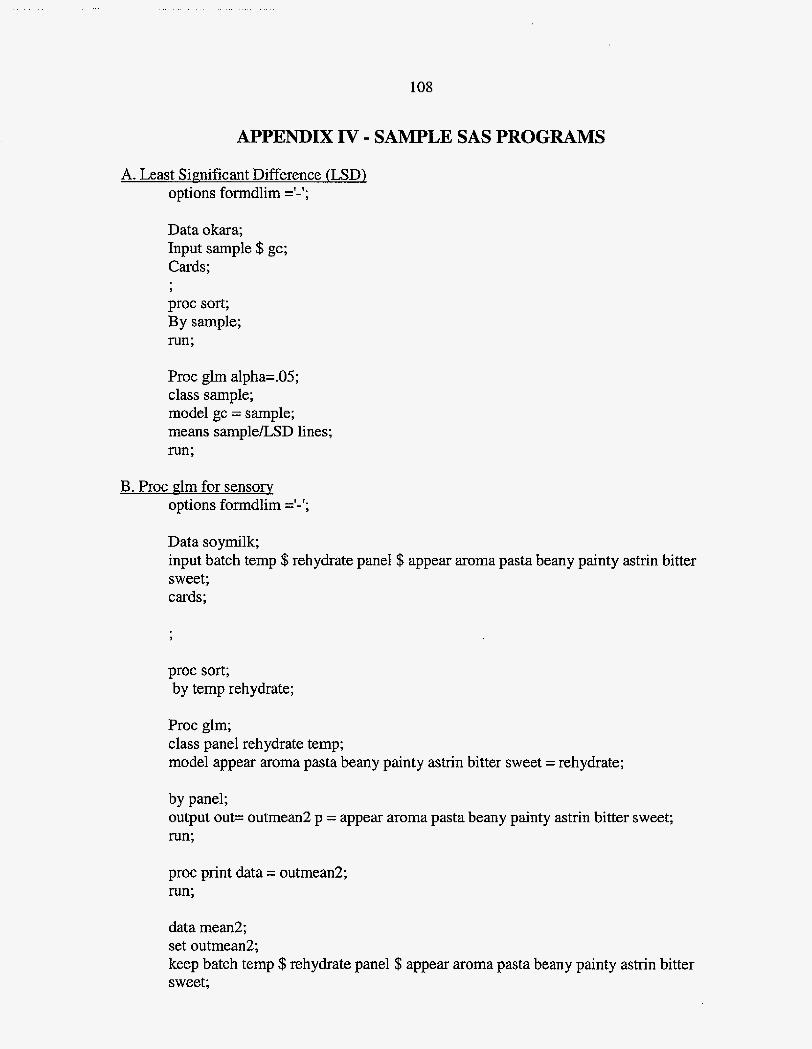
108
APPENDIX IV - SAMPLE SAS PROGRAMS
A. Least Simificant Difference (LSD) options formdlim =I-';
Data okara; Input sample $ gc; Cards;
proc sort; By sample; run;
Y
Proc glm alpha=.05; class sample; model gc = sample; means sampleLSD lines; run;
B. Proc d r n for sensory options formdlim ='-I;
Data soymilk; input batch temp $ rehydrate pane1 $ appear aroma pasta beany painty astrin bitter sweet; cards;
proc sort; by temp rehydrate;
Proc glm; class panel rehydrate temp; model appear aroma pasta beany painty astrin bitter sweet = rehydrate;
by panel; output out= outmean2 p = appear aroma pasta beany painty astrin bitter sweet; run;
proc print data = outmean2; run;
data mean2; set ou tmean 2; keep batch temp $ rehydrate panel $ appear aroma pasta beany painty astrin bitter sweet;
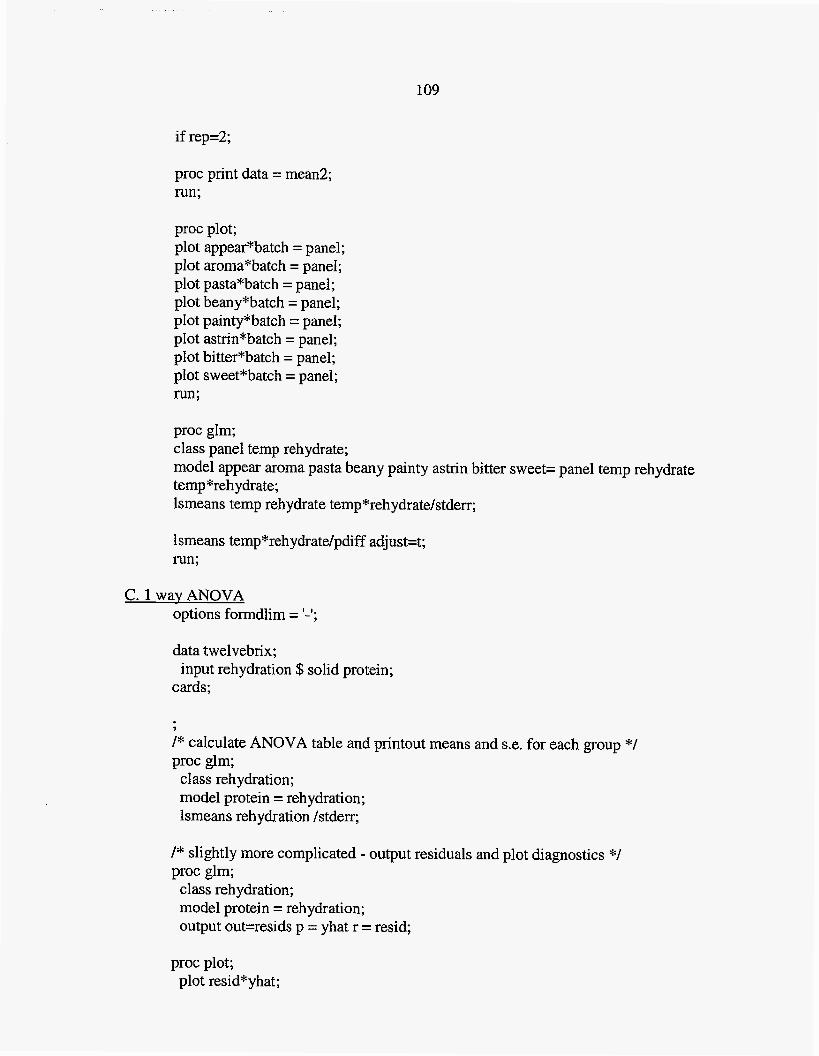
109
if rep=2;
proc print data = mean2; run;
proc plot; plot appear*batch = panel; plot aroma*batch = panel; plot pasta*batch = panel; plot beany*batch = panel; pIot painty*batch = panel; pIot astrin*batch = panel; plot bitter*batch = panel; plot sweet*batch = panel; run;
proc gIm; class panel temp rehydrate; model appear aroma pasta beany painty astrin bitter sweet= panel temp rehydrate temp*rehydrate; lsmeans temp rehydrate ternp*rehydrate/stder;
lsrneans temp*rehydrate/pdiff adjust=t; run;
C. 1 way ANOVA options formdlim = I-’;
data twelvebrix;
cards; input rehydration $ solid protein;
9
/* calculate ANOVA table and printout means and $.e. for each group V proc glm;
class rehydration; model protein = rehydration; lsmeans re hydrati on /s t den;
/* slightly more complicated - output residuals and plot diagnostics */ proc glm;
class rehydration; model protein = rehydration; output out=resids p = yhat r = resid;
proc pIot; plot resid*yhat;
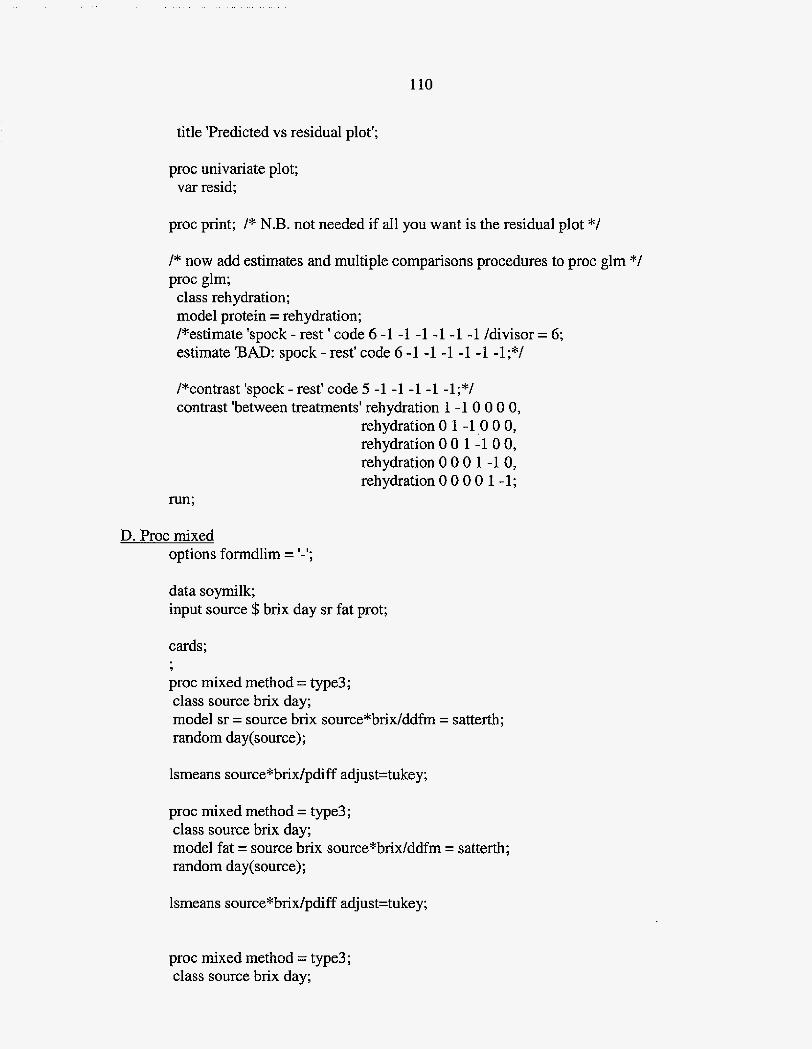
110
title 'Predicted vs residual plot';
proc univariate plot; var resid;
proc print; /* N.B. not needed if aI1 you want is the residual plot */
/* now add estimates and multiple comparisons procedures to proc glm */ proc glm;
class rehydration; model protein = rehydration; /*estimate 'spock - rest ' code 6 -1 -1 -1 -1 -1 -1 /divisor = 6; estimate 'BAD: spock - rest' code 6 -1 -1 -1 -1 -1 -l;*/
/*contrast Ispock - rest' code 5 -1 -1 -1 -1 -l;*/ contrast 'between treatments' rehydration 1 -1 0 0 0 0,
rehydration 0 1 -1 0 0 0, rehydration 0 0 1 I1 0 0, rehydration 0 0 0 1 -1 0, rehydration 0 0 0 0 1 -1;
run;
D. Proc mixed options fomdIim = I-';
data soymilk; input source $ brix day sr fat prot;
cards;
proc mixed method = type3; class source brix day; model sr = source brix source*brix/ddfm = satterth; random day(source);
7
lsmeans source* bridpdiff adj us t=tukey ;
proc mixed method = type3; class source brix day; model fat = source brix source*brix/ddfm = satterth; random day(source);
lsmeans source*brix/pdiff adjust=tukey;
proc mixed method = type3; class source brix day;
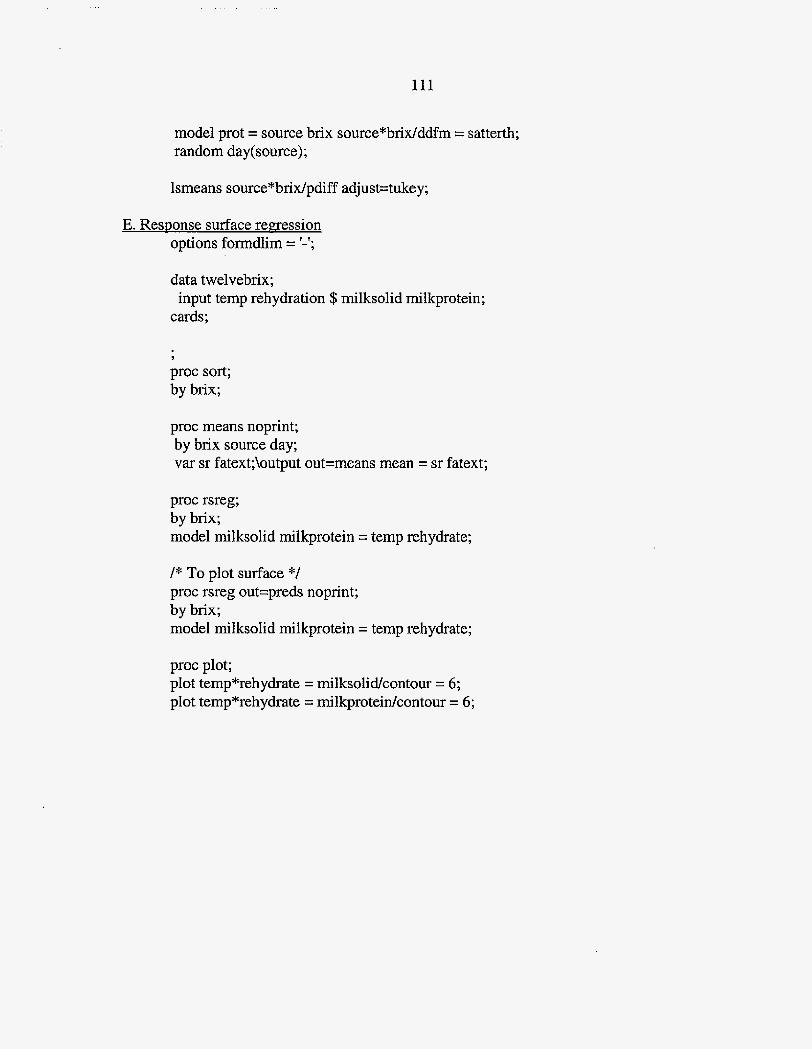
111
model prot = source brix source*brix/ddfm = satterth; random day(source);
lsmeans source*brix/pdiff adjust=tukey;
E. Response surface remession options fomdlim = I-';
data twelvebrix;
cards; input temp rehydration $ milksolid milkprotein;
Y
proc sort; by brix;
proc means noprint; by brix source day; var sr fatext;\output out=means mean = sr fatext;
proc rsreg; by brix; model milksolid milkprotein = temp rehydrate;
/* To plot surface */ proc rsreg out=preds noprint; by brix; model miIksoIid milkprotein = temp rehydrate;
proc plot; plot temp*rehydrate = milksolidkontour = 6; plot temp*rehydrate = milkproteidcontour = 6;
112
REFERENCES
Agilent Website. 2002.GC Reference Library. Agilent. AvailabIe from:
www .chem.agilent.com/cag/cabu/gcreflib,hrm. Accessed: December 20.
Aoh H, Taneyama 0, Inami M. 1980. Emulsifying capacity of soy protein: characteristic of
7s and 11 S Proteins. J. Food Sci. 45:534-546
Arai S , Nogushi M, Yamashita M, Kato H, Fujimaki M. 1970. Studies on flavor components
in soybeans. VI. Some evidence for occurrence of protein-flavor binding. Agric. Biol.
Chem. 34: 1569-1573.
Arai S, Suzuki H, Fujimaki M, Sakurai Y. 1966. Studies on flavor components in soybean
Part II. Phenolic acids in defatted soybean flour. Agr. Biol. Chem. 30(4): 364-369.
Aspelund TG, Wilson LA. 1983. Adsorption of off-flavor compounds onto soy protein: a
thermodynamic study. J. Agric. Food Chern. 31: 539-545.
Axelrod B. 1974. Lipoxygenases. Advances in chemistry, series 136. J.R. Whitaker (ed.),
ACS Pub. Washington, D.C. p 324-348.
Badenhop AF, WiIkens WF. 1969. The formation of l-Octen-3-01 in soybeans during
soaking. 3. h e r . OiI Chem. SOC. 46:179-182.
Bourne MC, Escueta EE, Banzon 3. 1976. Effect of sodium alkalis and saIts on pH and flavor
of soymilk. J. Food Sci. 41: 62-66.
Buchheim W, Dejmek P. 1997. Milk and dairy-type emulsions. In: Friberg SE and Larsson
K, editors. Food emulsions. 3rd Ed. Revised and expanded. New York, N.Y.: Mace1
and Dekker. p 235-78.
113
Crowther A, Wilson LA, Glatz CE. 1980. Effects of processing on adsorption of off-flavors
onto soy protein. J. Food Process Engineering. 4: 99-115.
Davis CS, Nielsen SS, Nielsen NC. 1987. Flavor improvement of soybean preparations by
genetic removal of Iipoxygenase 2. J. Am. Oil. Chem. SOC. 64:1428-1433.
Farrall AW. 1980. Pasteurizing Equipment. In: Farrall AW. Engineering for dairy and food
products. New York and London: John Wiley and Sons, Inc. p 377-385.
Feng YW, Acree TE, and Lavin EH. 2001. Processing modulation of soymilk flavor
chemistry. In: Takeoka GR, Giintert M, Engel KH, editors. Aroma active compounds
in foods: Chemistry and sensory properties. ACS Symposium Series 794. p 251-264.
Friberg SE. 1997. Emulsion stability. In: Friberg SE and Larsson K, editors. Food emulsions.
3'* Ed. Revised and expanded. New York, N.Y.: Mace1 and Dekker. p 1-56.
Fujimaki M, Arai S, Kirigaya N, Sakurai Y. 1965. Studies on flavor components in
soybeans. Agr. Biol. Chem. 29(9): 855-863.
Guo ST, Ono T, Mikami M. 1997. Interaction between protein and lipid in soybean milk at
elevated temperature. J. Agric. Food Chem. 45:4601-4605.
Hashim L, Chaveron H. 1995. Isolation and identification of off-flavor components from
soymilk. In: Charambolous G, editor. Food flavors: generation, analysis and process
influence. New York, N. Y.: Elsevier. p 1007-1019.
Henkel J. 2002. Soy: Health claims for soy protein. Questions about other components. FDA
Consumer May - June 2000. Washington, D.C.:U.S. Food Drug Administration.
Available from: www.cfsan.fda.gov/-dms/fdsoypr.html. Accessed May 29.
Hoeck JAY Fehr WR, Murphy PA, Welke GA. 2000. Influence of genotype and environment
on isoflavone contents of soybean. Crop. Sci. 40:48-51.
114
Hunter RS, Harold RW. 1987. The measurement of appearance. 2nd Ed. New York, N.Y.:
John Wiley and Sons. 411 p.
Iwuoha CI., Umunnakwe ICEe 1997. Chemical, physical, and sensory characteristics of
soymilk as affected by processing method, temperature and duration of storage. Food
Chemistry. 59(3): 373-379.
Johnson KW, Snyder E. 1978. Soymilk: A comparison of processing methods on yields and
composition. J. Food Sci. 43: 349-353.
Johnson LA, Deyoe CW, Hoover WJ. 1981. Yield and quality of soymilk processed by
steam-infusion cooking. J. Food Sci. 46: 239 - 243.
Kanamoto R, Ohtsuru M, %to M. 1977. Diversity of the soybean protein -
phosphatydilcholine complex. Agrix. Biol. Chem. 412021-2026.
Kudou S , Fleury Y, Welt D, Magnolato D, Uchida T, Kitamura K. 1991. Malonyl isoflavone
glycosides in soybean seeds (Glycine max Memill). Agric. Biol. Chem. 55: 2227-
2233.
Kinsella JE, Damodaran S. 1980. Flavor problem in soy proteins; origin, nature, control and
binding phenomenon. In: Charambolous G, editor. The analysis and control of less
desireable flavors in foods and beverages. New York, N.Y.: Academic Press, Inc. p
95-131.
King JM, Chin SM, Svendsens LK, Reitrneier CA, Johnson LA, Fehr WR. 2001. Processing
of lipoxygenase-free soybeans and evaluation in foods. JAOCS. 78(4): 353-360,
Kobayashi A, Tsuda Y, €&rata N, Kubota K, Kitamura K. 1995. Aroma constituents of
soybean [Glycine max (L.) merril] milk lacking lipoxygenase isozymes. 3. Agric.
Food Chem. 43: 2449-2452.
115
Kwok KC, Niranjan IS. 1995. Review: Effect of thermal processing on soymilk. Int. J. Food
Sci. Technol. 30: 263-295.
Lawless €IT? Heymann H. 1998. Sensory evaluation of food. Principles and practices. New
York, N.Y.: Chapman and Hall. 827 p.
Liu K. 1997. Soybeans: chemistry, technology, and utilization. New York, N.Y.: Chapman &
HalI. 532 p.
Maarse H. 1991. Introduction. In: Maarse H, editor. Volatile compounds in foods and
beverages. New York, N.Y.: Marcel Dekker, Inc. p 1-39.
MacDougall DB. 2002. Colour in food. Improving quality. Boca Raton, Fl.: CRC Press LLC.
378 pages.
Maheshwari P, Murphy PA, Nikolov ZL. 1997, Characterization and application of porcine
liver aldehyde oxidase in the off-flavor reduction of soy proteins. J. Agric. Food
Chem. 45: 2488-2494.
Mattick LR, Hand DB. 1969. Identification of a volatile component in soybeans that
contributes to the raw bean flavor. J. Agric. Food Chem. 17(1); 15-17.
Mcleod G, Ames J. 1988. Soy flavor and its improvement, Crit. Rev. Food Sci. Nutr.
27: 219.
McNair HM, Miller JM. 1998. Basic gas chromatography. New York, N.Y.: Wiley
Interscience Publication.. 200p.
Meilgaard M, Civille GV, Can BT. 1991. Sensory evaluation techniques. 2nd Ed. Boca
Raton, Fl.: CRC Press. 354 p.
Messina M. 1995. Modern applications for an ancient bean: Soybeans and the prevention and
treatment of chronic disease. American Institute of Nutrition. 567s -5695.
116
Moizuddin S, Harvey G, Fenton AM, Wilson LA. 1999. Tofu production from soybeans or
full-fat soyflakes using direct and indirect heating processes. J. Food Sci. 64(1): 145-
148.
Nugteren DH. 1975. Arachidonate lipoxygenase in blood plateIets. Biochem. Biophysics.
Acta. 380:299.
O’Keefe SF, Wilson LA, Resurreccion AI?, Murphy PA. 1991a. Determination of the binding
of hexma1 to soy glycinin and P-congIycinin in an aqueous model system using a
headspace technique. J.Agric. Food Chem. 39: 1022-1028.
O’Keefe SF, Resurreccion AP, Wilson LA, Murphy PA. 1991b. Temperature effect on
binding of volatile flavor compounds to soy protein in aqueous model system, J. Food
Sci. 56:802-806.
Philip S , Helen D, 1973. Soybean for health and longer life. New Canaan, Ct.: Keets p 3-4,
73-79.
Reineccius GA. 1994. Gas chromatography. In: Nielsen SS, editor. Introduction to the
chemical analysis of foods. Boston, Ma.: Jones and Bartlett Publishers. p 441-452
Reinli K, Block G. 1996. Phytoestrogen content of foods-A compendium of literature values.
nutrition and cancer. 26(2): 123-148.
Samuelsson B.1972. Biosynthesis of prostaglandins. Fed. Proc. Fed. Am. SOC. Exp. BioI.
31:1442.
Shurtleff W, Aoyagi A. 1979. Tofu and soymilk production. In: Shurtleff W, Aoyagi A. The
book of tofu. Volume II. Lafayette, Calif.: New Age Foods Study Center. p 195-234
Shurtleff W, Aoyagi A. 1983.The book of tofu: Protein source of the future . . . Now! Ten
Speed Press. Berkeley, Calif. p 15-29.
117
Shibasaki K, Okubo K, Sat0 T. 1972. Food chemical studies on soybean proteins part X.
Shifting of protein to cream layer of soybean milk and the emulsifying capacity. J.
Jap. SOC. Food Sci. 19589 (Japanese).
Simoons FJ. 1991. Food in China. A cuItura1 and historical inquiry. Boca Raton, Fl.: CRC
Press h c . 600 p.
Sirtori CR, Lovati MR, Manzoni C, Monetti M, Pazzucconi F, Gatti E. 1995. Soy and
cholesterol reduction: ClinicaI experience. American Institute of Nutrition. 599s-
605s.
Slavin J. 1991. Nutritional benefits of soy protein and soy fiber. J. American Dietetic
Association. 91(7): 816-819.
Snyder HE, Kwon TW. 1987. Soybean utilization. New York, N.Y.: Van Nostrand Reinhold
Company. 346 p.
SoyaTech. 1999. The North American soy foods market. Bar Harbor, Me.: SoyaTech Inc.
and SenechaI, Jorgenson & Hale Co., www.soyatech.com. Accessed: June 7.
SoyaTech., 2002. Soya Foods: The U.S. Market 2002. Bar Harbor, Me.: SoyaTech Inc. and
Senechal, Jorgenson & Hale Co., www.soyatech,corn. Accessed: June 7.
Steinkraus KH. 1978. Imitation Milk. In: Peterson NS, Johnson AH, editors. Encyclopedia of
food science. Westport, Ct.: AVI. p 405-406.
Thissen JA. 1982. Interaction of off flavor compounds with soy protein isoIate in aqueous
systems: Effects of chain length, functional group and temperature. [M.Sc. Thesis].
Ames, Ia.: Iowa State University. 119p. Available from: Iowa State University
Library, Ames, la.
118
Tornberg E, Olsson A, Persson K. 1997. Emulsion stability. In: Friberg SE, Larsson K,
editors. Food emulsions. 3d Ed. Revised and expanded, New York, N.Y .: Mace1 and
Dekker. p 279-359.
Torres AV, Reitrneier CAY Wilson LA, Fehr WR, Narvel JM. 1998. Sensory characteristics
of soymilk and tofu made from lipoxygenase-free and normal soybeans. J. Food Sci.
63(6): 1084-1086.
USDA. 2002. USDA nutrient database. Washington, District of Columbia: USDA.
http://w w w .nal.usda. gov/fnic/cgi -bidnut-search .PI. Search Keyword: So ymilk and
oil, soybean, salad or cooking. Accessed: December 1.
USDA. 2002. USDA-Iowa State University database on the isoflavone content of foods,
Release 1.3 - 2002. Washington, D C : USDA.
http://www.nal.usda.gov/fnic/foodcomp/Data/isoflav/isoflav.html. Accessed: March
27.
Wang HJ, Murphy PA. 1994. Isoflavones content in commercial soybean foods. J. Agric.
Food Chem. 42:1666 - 1673.
Wang HJ, Murphy PA. 1996. Mass balance study of isoflavones during soybean processing.
J. Agric. Food Chem. 442377-2383.
WiIkens WF, Mattick LR, Hand DB. 1967. Effect of processing method on oxidative off-
flavors of soybean milk. Food Technology. 21: 36-89.
Wilson LA. 1985. Flavor binding and the removal of flavors from soybean protein. In:
Shibles R, editor. World Soybean Research Conference m: Proceedings. Boulder and
London: Westview Press. p 158-165.
119
Wilson LA., Murphy PA, Gallagher P. 1992. Soyfood. Product markets in Japan: U.S. export
opportunities. MATRIC. Iowa State University. Ames, la.
Wilson LA. 1995. Soy Foods. In: Erickson DR, editor. Practical handbook of soybean
processing and utilization. Champaign, IL: APCS Press. p 428 - 459.
Wilson LA. 1996. Comparison of lipoxygenase-null and lipoxygenase-containing soybeans
for foods. In: Piazza M, editor. Lipoxygenase and lipoxygenase pathway enzymes. St.
Louis, Missouri: AOCS Press. p 209-225.
Wolf WJ. 1975. Lipoxygenase and flavor of soybean protein products. J. Agr. Food Chern.
23(2): 136-141.
Wyllie SG, Alves S, Filsoof M, Jennings WG. 1978. Headspace sampling: Use and abuse. In:
Charalambous G, editor. Analysis of foods and beverages: Headspace techniques.
New York, N.Y.: Academic Press Inc. p 1-16.
Yazici F, Alvarez VB, Mangino ME, Hansen PMT. 1997. Formulation and processing of a
heat stable calcium-fortified soy milk. J. Food Sci. 62 (3) 535-538.
120
ACKNOWLEDGEMENTS
MAJOR PROFESSOR: I would like to thank Dr. Lester Wilson
for being my mentor and major professor, For all the trust, guidance and supports
that you have given.
.P.O.S. COMMJTTEE: Dr. Philip Dixon in your patience and
assistance in statistical analyses,
Dr. Patricia A. Murphy for being my POS committee member and helping
me with my thesis.
SPONSORS: MicroSoy Inc. Jefferson, Ia
Center for Crops Utilization and Research, Jefferson, Ia Center for Advance Technology Development (IS-T 2452)
CO-WORKERS , COLLEAGUES AND PANELISTS:
Thank you for a11 the patience, energy and help from all of my undergraduate student
helpers and panelists in your assistance in helping me completing this study.
Also, Fransiska Yulianti and Mak Ping Shing for their advices.
ADMINISTRATIVE SUPPORTS: Thank you for all the help in sending, purchasing,
and administrative support from the secretaries from 2312 Food Science Building.
(Mildred M. Peterson, Marylou Weigel, Brenda Emery, Nancy Holcomb, Lani McKinney and Jim Henderson)
FRIENDS: My special thanks go to Fong Ching-Ching
for helping me to get through the thesis writing process.


