Embed Size (px)
Citation preview
at SciVerse ScienceDirect
Journal of Loss Prevention in the Process Industries 30 (2014) 197e206
Contents lists available
Journal of Loss Prevention in the Process Industries
journal homepage: www.elsevier .com/locate/ j lp
How can we use the information provided by process safetyperformance indicators? Possibilities and limitations
Hans Pasman*, William RogersMary Kay O’Connor Process Safety Center, Artie McFerrin Department of Chemical Engineering, Texas A&M University, College Station, TX 77840-3122,United States
a r t i c l e i n f o
Article history:Received 13 March 2013Received in revised form10 June 2013Accepted 10 June 2013
Keywords:Process safetyIndicatorsRisk managementBayesian networks
* Corresponding author. Tel.: þ1 31630551535.E-mail address: [email protected] (H. Pasman
0950-4230/$ e see front matter � 2013 Elsevier Ltd.http://dx.doi.org/10.1016/j.jlp.2013.06.001
a b s t r a c t
To make further progress towards a safer industry, process safety performance indicators are indis-pensable. There are, however, some challenges involved with interpretation of indicator outcomes. Bygoing too far in detail one loses overview, but in not noticing the important detail a false impression ofsafety may be obtained. Aggregation from a detailed level upward may give relief at this point, but whatto do if indicator values do not improve any further? Is there a means to relate indicators to the plant’srisk level? The paper will show that when making use of the new technique of Bayesian networks for riskmanagement, progress may be made. It seems possible to relate technical failure rates with risk factorsacting over time duration and to take action before something breaks down. While originating in baddesign, operation, maintenance, or neglect, these risk factors are influenced in the background byorganizational, management, and human factors, which are subject to indicator monitoring. An examplewill be given of results one can expect when the dependencies are modeled in Bayesian network fashion.Current developments in other areas such as in aviation and offshore platform maintenance appear to beadvancing in the same direction.
� 2013 Elsevier Ltd. All rights reserved.
1. Introduction
All management planning, organizing, implementing, and con-trol with feedback, according to Deming’s Plan, do, check, and actcycle, require indicators on which to base decisions. The WorkingGroup on Chemical Accidents of the OECD (Organization forCooperation and Development with head office in Paris) issued in2003 an interim Guidance on Safety Performance Indicators (OECD,2003), which supported initiatives to establish indicators of, e.g.,the Responsible Care� program of the American Chemical Council,ACC, and the chemical industry. This guidance document was fol-lowed in 2005 by a practical guide of the UK HSE (2006) and,following the Texas City explosion at the BP site, by CCPS publica-tions (CCPS, 2007a, 2007b, and 2010). In fact, the CCPS guidelineson the topic of process safety performance indicators result in closeto 400 possible indicators measuring the effectiveness of 22 man-agement system elements. A major distinction is made betweenlagging and leading indicators, the former based on incidents, in-juries, and damages that surpass a certain critical threshold ofseriousness, and thus can be counted, while the latter are factualdata indicating to what extent one deviates from an ideal situation.
).
All rights reserved.
This distinction is with respect to functioning of the safety man-agement system and the operational condition of the plant inwhich all agreed measures are taken or scheduled plans have beenrealized. The leading indicators have the character of how well oneis prepared. The distinction is not sharply definable, e.g., near missincidents, which give an important signal, can be regarded as lagbut also as lead. Some years ago there was a vivid discussion on thisaspect in Safety Science, stirred up by Hopkins (2009) with otherscommenting, e.g., Hudson (2009) who suggested a relation withbow-tie and risk.
In January 2012 in Brussels, a two-day international conferencededicated to discussion of process safety performance indicatorswas organized by the European Process Safety Centre, EPSC, and theEuropean Chemical Industry Council, CEFIC. This conference wasvery well attended, in particular by industry representatives, fromthe entire global community. Apart from the plenary opening andclosing sessions with lectures and discussions, the more intensivedeliberations were in four parallel working sessions on thefollowing topics:
I. ‘Implementing PSI: share your story so far’II. ‘Broaden the basis e quick start for SMEs’III. ‘Roadmap towards global PSI reporting’IV. ‘Navigating ahead with leading indicators’

H. Pasman, W. Rogers / Journal of Loss Prevention in the Process Industries 30 (2014) 197e206198
In the opening session, the Executive Directore Energy, HSE andLogistics, of CEFIC, William Garcia, speaking also on behalf of theInternational Council of Chemical Associations, ICCA/ResponsibleCare, introduced the thrust of the Safety Governance Perspectivefor the global chemical industry. He further announced an OECDinitiative launched in the third quarter of 2011 through its WorkingGroup on Chemical Accidents, to be presented at a meeting withthe industry in Paris on 15 June 2012. The initiative document willcontain a self-assessment check list, the set-up of a business case,and a “challenge and inspire” paragraph. It all underlined theimportance of developing reliable indicators.
The American position at the Brussels conference was formu-lated by Kenan Stevick of The Dow Chemical Company on behalf ofthe ACC. The objective shall be to develop a single global set oflagging process safety metrics. Incident severity shall be acomponent of any metric. The basis of the metric will be loss ofprimary containment by unintended releases of hazardous mate-rials classified according to the Global Harmonized System, GHS, ina quantity over certain thresholds; in addition, releases causinginjuries with lost time greater than one day, and explosions andfires causing damage larger than V 20,000. The metric schemeshould become an ISO standard. It was further concluded that aperiod of 3e5 years for a company is required to develop a stablesystem with sufficient experience for higher visibility. In connec-tion with SMEs, small and medium enterprises, quite a few prob-lems were mentioned (lack of expertise, large variability in riskawareness, low frequency of incidents hence less stable outcomes,and fear of liability). There is a definite wish to go public with theindicators but not too early. For leading indicators, flexibility isneeded. Three groups of leading indicators were distinguished:mechanical integrity indicators (inspections, controls), action itemsfollow-ups (PHA e Process Hazard Analysis, audit, and near missactions) and training/competence indicators (quality test results,percent of people trained, number of complete roles in processsafety). Companies can select according to their needs.
There was not much discussion about how the metric resultsshould be assessed. The very reason to introduce indicators is thatchanges in process operations, the way one does things in a givenwork environment, and changes in safety climate are usually slow.In other words, the time constants of the change processes arelarge, and a day-to-day observer would see no change. So, one hasto measure indicator values over considerable time and determinetrends. Most examples shown were of continually improvingtrends. This has been the case for years, even for decades with thelost time injury rate (LTIR), the personal safety indicator.1 Yet, therehas to be expected that trends not always will be so positive, thatlines will become horizontal in time and points will also indicate adeterioration of the situation. An up-going slope of a trend line doesnot necessarily mean that the situation has become unsafe, therecould be still sufficient margin, but how to determine and toexplain is the question.
Another intrinsic problematic point not discussed is that in theideal case, where there are no incidents, lagging indicators wouldbe nil, and if all safety management actions were always executedin time, leading indicators also would tend to zero. Also, if onewould actually measure only a few indicators and compare resultsover fixed time spans, it is very likely to find a stochastic behavior ofthe indicator variables due to the many possibilities of howsomething can go wrong or remain deficient. The stochastic naturewould impede drawing conclusions easily unless one can deter-mine over a given time period of assessment a sufficient large
1 As far as the recollection goes of one of the authors, the positive trend in theLTIR is at least present since the mid-1970s.
number of measuring points to perform statistical treatment anddetermine amean or slope and a confidence interval. Because of thecomplexity of a running plant and its organization, another possi-bility is to collect information on many different indicators andcompile the results. As already mentioned CCPS (2007b and 2010)suggest a number close to 400. This large number of indicators willhave the disadvantage that one may lose overview e top man-agement would only want, e.g., some five indicators e, while inaddition the collection of the information will require more effort.The effort can of course bemitigated bymaking good use of existingsources of information and information technology, IT. The problemof abundance of indicators shall have to be solved by aggregation todifferent levels and feeding each assessing level (department, plant,site or floor, middle management, and top management) the in-formation that is within their horizon.
Summarizing, in thispaperweshall try to shed some lightonhowto deal with indicator results other than just looking at downwardgoing trends. For that purpose, we shall make use of the rapidlybecomingpopular Bayesiannetwork technique,which is foundedonthe strict laws of causality and powerful as a predictive tool based onevidence and which is becoming widely applied in various fieldssuch as economics, finance, medicine, social sciences, and recentlyalso in engineering. However, we shall first briefly explain recentwork on aggregation of results of numerous indicators.
2. Indicator aggregation
Hassan & Khan, 2012 developed a method of aggregation andperformed a benchmark study of five facilities involved in oil & gasprocessing, restricting themselves to asset integrity and the effectof maintenance. In the following their main points will be sum-marized. They defined about 40 key indicators sorted into threeelement indicators or main integrity types: mechanical, operationaland personnel. Their method is risk based, which is the optimumway of linking the contribution of an indicator type to its impor-tance for the safety of the plant. In principle for a risk basedmethod, one or more scenarios must be identified in which theinfluence of the particular indicator type on the risk due to a failureof a hardware component or due to an unsafe act can be deter-mined. The study did not get so far as identifying scenarios butresorted to expert opinion expressed as a weight factor for therelative importance (safety relevance) of each indicator by theAnalytic Hierarchical Process, AHP, technique, which applies pair-wise comparisons of alternatives. Expert choices were tested onconsistency.
At the base or operator level, indicators were called specific in-dicators; after aggregation to level 1 to be assessed by the depart-ment, they were called key indicators; again a level higher (level 2)for the middle management activity indicators; at level 3 as elementindicators, being the above mentioned three integrity types, andfinally a merge into the asset integrity indicator, as shown in Fig. 1.An impression of the indicators defined by Hassan and Khan fortheir level 2 and 3 indicators is reproduced in Table 1.
Subsequently, from each specific indicator value a so-called riskfactor was derived. For a lagging indicator, this is done by multi-plying the frequency of an incident with its consequence severity(no details given) and for a leading indicator by multiplying thepercentage achieved of the ideal score (success) with the impor-tance of success. Related specific indicators are grouped, and eachgroup forms a key indicator. The highest risk score in a group istaken as the risk factor corresponding to this key indicator. The nextaggregation step is to the activity indicator level for middle man-agement. This aggregation is accomplished bymultiplying each keyintegrator with its expert determined importance weight andsumming over related key indicators together producing an activity

Fig. 1. Levels of indicator aggregation as defined by Hassan and Khan (2012).
H. Pasman, W. Rogers / Journal of Loss Prevention in the Process Industries 30 (2014) 197e206 199
indicator. This process is repeated again to obtain the top level,element indicators, which by weighted summing yield the assetindicator. Hassan and Khan worked this out for a case comparingfive facilities on a relative basis by converting the indicator valuesinto a risk index consisting of four levels (0e19; 20e44; 45e74 and75e100%). They further performed a sensitivity analysis withrespect to the choice of the weights and examined how a change ofan indicator influenced the risk index result.
It is clear that for an overview of signals needed at each man-agement level, aggregation is an effective course of action. In case ofsafety, a known adage is “the devil is in the detail”. So, to rely on the
Table 1Activity and Element indicators as these are defined in the paper by Hassan andKhan (2012) with corresponding weights given by experts and the consistency inexpert opinion. Underlying at the lowest level are specific indicators which aggre-gate to key indicators.
Indicators Weights Consistency
Index CI (%) Ratio CR (%)
Level 2: activity indicatorArea: mechanical integrityInspection 0.31 0.83 0.93Maintenance 0.24Inspection & maintenance
management0.23
Engineering assessment 0.22Area: operational integrityOperating performance 0.20 0.54 0.48State of SSC 0.21Plant configuration & modification 0.17Engineering safety system 0.22Emergency response arrangement 0.20Area: personnel integrityTraining 0.30 0.40 0.44Staff competence 0.24Permit to work (PTW) 0.23Communication 0.23
Level 3: element indicatorMechanical integrity 0.40 0.71 1.27Operational integrity 0.34Personnel integrity 0.26
top element indicators estimated directly by only judgmentconsulting one’s intuition or on too few underlying indicators maylead to subjectivity and bias and can turn out to be misleading.Hence one must specify a larger number of underlying indicatorvalues to support decisions at each level. However, the way in-dicators were related to risk is in our opinion too coarse. We shallshow an alternative way, but wewill first analyze the problem fieldfurther in depth.
3. Scenarios and risk factors
In a paper by Knegtering & Pasman, 2013 it was argued that in aplant a multiple of risk factors vary in time and have influence onfailure, break-down, and process disturbance in different parts ofthe plant. Temporally enhanced exposure of people, or presence ofvehicles, can also form a risk factor. Examples of short term day-to-day varying factors are rupture of a pipe line, failure of a pump, hotwork, thunderstorm, alarm over-rides, or (important) unattendedalarms. Mid-term factors varying week-to-week or month-to-month are seasonal influences, postponed inspections, delayedmaintenance, late shutdowns, and changes in process materials orcompositions. Finally long-term variations over years are cumula-tive influences, such as corrosion, wear, degradation of the man-agement system, badmanagement of change, loss of competence ofpersonnel, and deterioration of the safety climate. Short term riskfactors can often be traced by (additional) sensors detecting, e.g.,vibrations, weather changes, and odors. Even temporal changes indensities of people present could be measured. Monitoring ofmiddle and long term factors, however, is not that simple but infact, well-chosen leading indicators should produce a measure ofprocess risk trend. So, the possibility of connecting the indicatorconcept and that of risk assessment shall be further explored.
As we have seen, safety in a certain location is not a constant buta fluctuating dynamic quantity. Because safety can be quantifiedonly through determining existing risks, the next step will be a riskanalysis on the basis of scenarios identified with tools such as inPHA (process hazard analysis as described in OSHA’s PSM Standarde OSHA, 1992). In such analyses, the influence of risk factors mustbe incorporated, while the riskmodel must be capable of predicting
H. Pasman, W. Rogers / Journal of Loss Prevention in the Process Industries 30 (2014) 197e206200
risk fluctuations. In other words, ultimately one would need a dy-namic operational risk analysis.
The bow-tie is a tool to obtain a good overview of credible, withPHA identified scenarios of failing components and possible haz-ardous events including preventive and protective risk controls in apart of an installation. With the fault tree of the system of possiblefailing components on the left of the critical hazardous materialrelease (top) event, at the same time forming the initiating eventfor the event tree of phenomena leading to the major hazards onthe right, the bow-tie provides a clear framework for risk quanti-fication. One can therefore envisage the possibility of including riskfactors in the bow-tie. Hudson (2009) discussing the differencebetween lagging and leading indicators already noted that given ascenario depicted in a bow-tie, the leading indicators, together withthe preventive controls, would tend to be to the left of the criticalevent, and the lagging indicators, with the protective controls,would be to the right.
The cause-effect chain depicted in a bow-tie consisting of a faultand event tree is in fact mathematically an example of a directedacyclic graph (DAG), which means nodes representing stochasticvariables reflecting a state (here, a failure mode or an arising effectphenomenon) in a causal relationship represented by node con-necting directed arrows. A more general DAG that offers morepossibilities to describe complex cause-event situations and reflectbetter the shades of the real world is the Bayesian Network.We shalldescribe this increasingly popular approach in the next section.
4. Bayesian Networks
Bayesian Networks (BNs), also called Bayesian Belief Networks(BBNs) to emphasize their ability to include opinion, have beendeveloped the last three decades in the realm of Artificial Intelli-gence to structure reasoning for machine applications. BNs are builton cause-effect relations and Bayesian statistics. The essence is thatby application of the Bayes theorem, one can learn by updatingbased on newobservationse newevidencee or (subjective) expertopinion. Independent variable nodes are called ‘parents’ whiledependent variable nodes are ‘children’. Each node can represent avariable in a multiple of states. The arcs among nodes reflect acausal relationship (‘source’ with ‘sink’), and the dependencies ofoccurrence probabilities of states are expressed by the child node’sconditional probability table (CPT). The structure allows inference,hence diagnosis, to find root causes and to facilitate decisionmaking, so it is applied widely in medical science, economics, socialsciences, and to an increasing extent in engineering.
One of the main developers of the causality theory has beenPearl (2000); an impression of the large variety of present-day BNapplications has been given by, e.g., Fenton and Neil (2013). In thelast decade, several universities (UCLA, Stanford, Pittsburgh, DelftUniversity of Technology) have developed BN software, whichsaves one from the rather cumbersome arithmetic once the struc-ture has been thought of and the data are available. Also, profes-sional software is available such as HUGIN (2012). BNs are excellentin dealing with uncertainty. Present-day software can handle be-side discrete variables also continuous variable distributions.Cooke’s team (Ale et al., 2009) developed non-parametric contin-uous BBNs and the Uninet software in which arcs can be rankcorrelations which can represent ‘soft’ information or influencessuch as expert opinion, see, e.g., Morales, Kurowicka, and Roelen(2008). UniNet was also summarized and explained in our previ-ous paper (Pasman & Rogers, 2013). In Ale et al. (2009) an aviationsafety application is described. Lately, various applications in riskanalysis appear, e.g., Khakzad, Khan, and Amyotte (2011)comparing conventional fault tree with the Bayesian networkapproach, while finding most convincing advantages of BN over
conventional FT, such as in absorbing new evidence, ability topropagate uncertainty, and allowing multi-state variables. In threesubsequent articles, Khakzad, Khan, and Amyotte (2012, 2013a and2013b) showed how dynamic features can be introduced in the bowtie mapped into a Bayesian network. In Khakzad et al. (2012), thisapproach makes use of the property of Bayes theorem by which aprior probability distribution can be updated to a posterior prob-ability distribution with a new observation represented in a like-lihood distribution. This updating pertains to the failure rate valuesand can take the form of an update of the physical conditions forwhich the failure rate value originally holds (covariate model), adifferent component strength than the one for which the failureprobability is determined (static model), or an update based on theobservation of a number of failures or consequence events during acertain time period. The paper of Khakzad et al. (2013a) calls thelatter type of updating ‘adapting’ which yields a true dynamicsafety analysis. In addition, full dynamic operational risk analysiscan be realized by time stepping the network as shown, e.g., byMontani, Portinale, and Bobbio (2005) and is repeated andextended by Khakzad et al. (2013b). The present authors haveshown advantages of BN applications in LOPA (Pasman & Rogers,2013), such as an easily performed cost-benefit analysis takingaccount of distributed failure data and common-cause failure whileproviding confidence bounds. Recently also, a full risk assessmentstudy has been published (Pasman & Rogers, 2012).
In the next section, we shall apply the BN technique to a bow-tieand show the effect of the three top integrity indicators mentionedearlier: mechanical, operational, and personnel integrity via thebow-tie on the final risk of an operation. The software used is thatof the University of Pittsburgh, named GeNIe v.2.0 suited to rununder MS Windows (DSL, 2010). Although a preliminary run wasmade in the discrete net set-up, final calculations were made withthe continuous node type net (The two cannot be mixed, althoughdiscrete variables can be represented by a Bernoulli distribution asone of the distributions in the continuous type nodes). Solution ofthe latter net is not exact by deriving conditional probability tablesbut by convoluting the distributions and solving by sampling. Bothare operating on MS Excel-type infrastructure, and results can befurther worked out in anMS Excel sheet. Nodes can be clicked opento inspect or modify defined equations and data. Results of thecalculations can be shown at each node in figures and graphics asaverages and standard deviations.
5. Bow-tie example
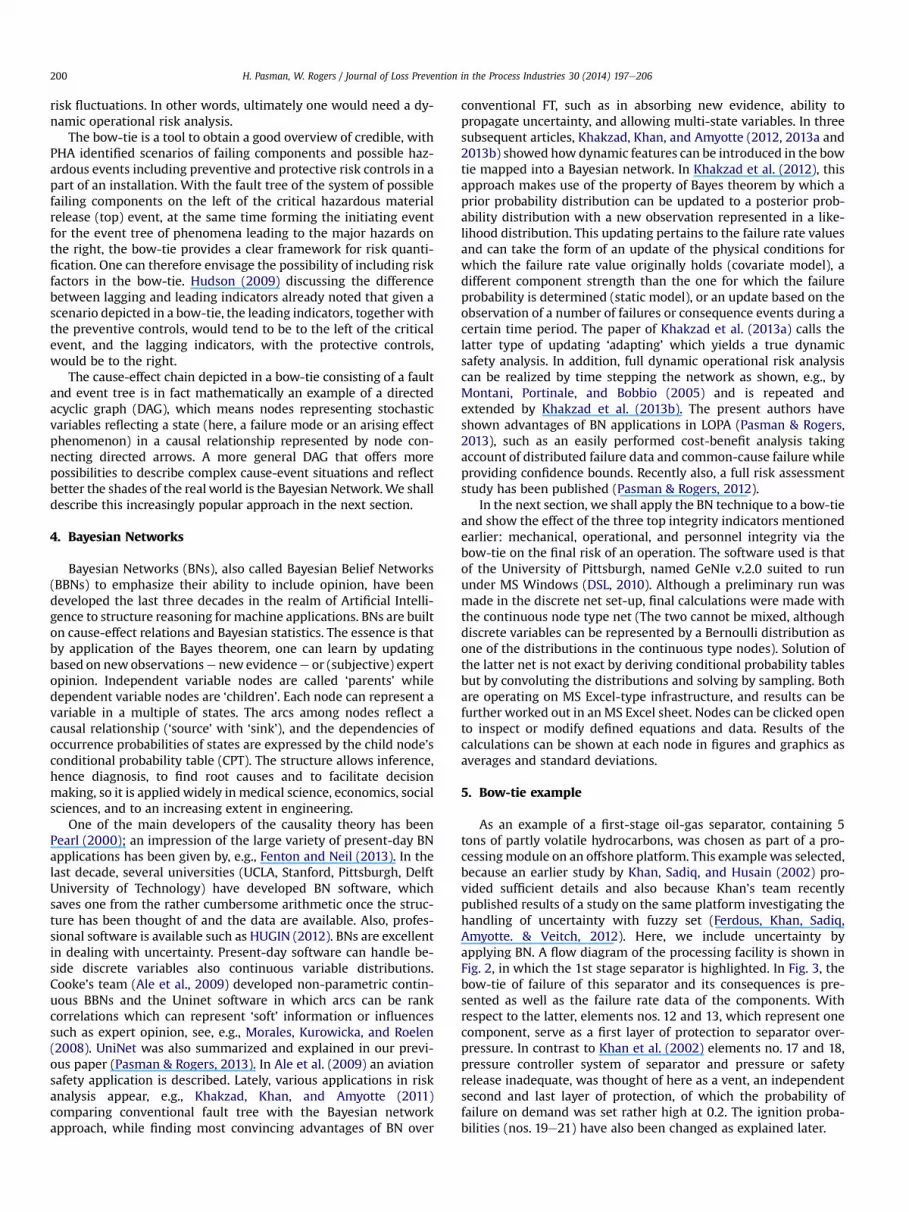
As an example of a first-stage oil-gas separator, containing 5tons of partly volatile hydrocarbons, was chosen as part of a pro-cessingmodule on an offshore platform. This examplewas selected,because an earlier study by Khan, Sadiq, and Husain (2002) pro-vided sufficient details and also because Khan’s team recentlypublished results of a study on the same platform investigating thehandling of uncertainty with fuzzy set (Ferdous, Khan, Sadiq,Amyotte. & Veitch, 2012). Here, we include uncertainty byapplying BN. A flow diagram of the processing facility is shown inFig. 2, in which the 1st stage separator is highlighted. In Fig. 3, thebow-tie of failure of this separator and its consequences is pre-sented as well as the failure rate data of the components. Withrespect to the latter, elements nos. 12 and 13, which represent onecomponent, serve as a first layer of protection to separator over-pressure. In contrast to Khan et al. (2002) elements no. 17 and 18,pressure controller system of separator and pressure or safetyrelease inadequate, was thought of here as a vent, an independentsecond and last layer of protection, of which the probability offailure on demand was set rather high at 0.2. The ignition proba-bilities (nos. 19e21) have also been changed as explained later.

Fig. 2. Process flow diagram of oil processing module on off-shore platform according to Khan et al. (2002). A bow-tie of failure of the 1st stage separator is presented in Fig. 3.
H. Pasman, W. Rogers / Journal of Loss Prevention in the Process Industries 30 (2014) 197e206 201
Consequence analysis in detail was not the purpose of the ex-ercise and is done rather coarsely. Khan et al. (2002) assumed onlyone type of consequence in case of the separator, namely a BLEVEwith fireball and fire and the throw of fragments. However, theconsequences depend on how the separator vessel ruptures. Ifrupture is very fast then an immediate BLEVE and combustion canoccur, but depending on conditions, such as rate of pressure in-crease, condition of the metal of the vessel, and the liquid fillingdegree, the vessel or a connection to it could rupture or tear slowenough for a jet exiting from a hole which in case of no immediateignition is forming a cloud of gas and aerosol. If such a cloud ignites
Fig. 3. Bow-tie of the 1st stage separator of Fig. 2 and associated component failu
after a certain delay, it can explode (VCE or Vapor Cloud Explosion)and produce destructive blast, especially with the confinement bythe equipment on an offshore platform. If the jet ignites immedi-ately a certain area of the platformwill be threatened by fire but thedamage is assumed to be limited and will not be considered here.The exits of a safety valve and vent will be chosen such that anignited jet will not do much harm.
Introducing additional damage generating phenomena by VCEblast besides a BLEVE, results in a more complex event tree. Inaddition, a damage cost calculation has been carried out. Thiscalculation could be performed separate from the BN as a discrete
re rates, adopted with some modifications (see text) from Khan et al. (2002).

Fig. 4. Continuous Bayesian network based on the bow-tie modeled by Khan et al. (2002). Numbered nodes correspond with the component numbers in the Fig. 3 table; OR-andAND-gates are indicated. The event tree part (right) has been expanded with the additional possibility of a vapor/aerosol cloud explosion with a damage cost calculation. The toplevel indicators (left) have been related to the failure rate of some of the components. The corresponding discrete net looks much the same apart from a simpler event tree.
H. Pasman, W. Rogers / Journal of Loss Prevention in the Process Industries 30 (2014) 197e206202
network, but in case of the continuous distribution mode it can befully included in the net. This is because the calculation can handleboth the probability distributions and also the arithmetic of thecost determination, making the computation more convenient.
The effect calculations have been done separately, applying forthe BLEVE the data specified in the latest Dutch RIVM Manualrecommended for QRA (RIVM, 2009, p. 40). Thereby 70% of themass of 5000 kg hydrocarbon is expected to BLEVE, which yields aw60 m radius of 50% lethality damage circle (radiant heat 35 kW/m2; exposure time 9 s). Only part of the people on board will beexposed directly and going in detail results in many questions.However, in view of ensuing fires, which certainly will be ignited asdomino effects, this circle is being maintained. For the vapor cloudexplosion, the Multi-Energy method was applied as described inthe Yellow Book (2005). Assuming that 50% of the released hy-drocarbon participates in the deflagration, it will result in a 50%lethality radius of 105 m at 0.3 bar overpressure.2 Another aspect isthat Khan et al. (2002) did not specify the rig’s dimensions, but foran estimate of damage assumptions a size must be assumed. So, afair sized rig is imagined of 80 � 100 m, costing 800 million USD,with 80 people on board. In view of the limited size of the platform(area 8000 m2) compared to the effect circles of BLEVE (11,310 m2)and VCE (34,500 m2), the 50% lethality perimeter will be mostlyoutside the platform. Therefore, only half the area of the platform isassumed to be hit severely within the 50% lethality bound. Ignitionprobabilities are also chosen to be slightly different. The BLEVE issupposed to ignite immediately (due to the heat generated in themetal by the rupture), while the probability of delayed ignition of
2 Actually RIVM (2009, p. 40) states 0.3 bar as 100% lethal indoors. Due to sec-ondary and tertiary injuries, this figure is used also for lethality outdoors. UK HSEsupports a figure of 0.3 bar for 50% lethality indoors (HSE, 2007).
the vapor cloud by, e.g., a hot surface or a spark of remote electricequipment outside the electrically classified area, is assumed as 0.2.
As has been shown in Pasman and Rogers (2012), the number offatalities by multiplying the homogeneous population density withthe area of the 50% lethality contour yields a sufficient approxi-mation of the total number of people perished. Based on a densityof 1 person per 100 m2, in case of the vapor cloud explosion itmeans a maximum loss of life of 40 people. For the monetary valueof life, 7 million US$ is taken as recommended by Kip Viscusi(2005). It is further supposed that the material damage amountsto US$ 5000 per m2 over the area of 50% lethality (hence here forBLEVE and VCE, half the rig’s surface area). This material damagefigure is not really substantiated, but an estimate was made, giventhe cost to build a rig and assuming that half the cost is on the highside. Damage by follow-on phenomena is not considered, but theseexpected events may lead to a total loss of the rig.
The resulting Bayesian network based on the bow-tie, butextended with respect to the event tree part and cost, is shown inFig. 4. In addition for demonstration of the possibilities, includedare the top three integrity indicators affecting those parts of theinstallation of which it can be assumed that their functioning ishighly dependent on the quality of operation and maintenance. oron appropriate design (component no. 12). In the end, personnelintegrity is considered to be dominating, and it is thereforeassumed also to determine operation and maintenance integrity,although personnel integrity’s direct effect on the functioning ofthe installation will be sensed less. The effect is constituted suchthat personnel integrity is given a certain constant value, while forsimplicity maintenance and operational integrity are assumed hereto have the same value. In case real inputs would be obtained, theseconstant values can easily be replaced by probability distributionsthat can differ from each other and whereby the maintenance andoperational integrity are conditionally independent of personnel

Table 3Results of expected annual loss calculations with Bayesian networks at three levelsof the personnel integrity indicator.
Personnel integrityindicator
Costs M$/yr
Discrete BN Continuous BN
Bernoulli Triangular
Mean Std. Dev.
0.5 1.6 1.7 1.65 1.01 0.5 0.5 0.5 0.32 0.14 0.13 0.14 0.08
H. Pasman, W. Rogers / Journal of Loss Prevention in the Process Industries 30 (2014) 197e206 203
integrity. The effect of an integrity value on failure rate is takenlinearly, that is in case of discrete values affected failure rates aremultiplied by the reciprocal value of the integrity, while in case of atriangular distribution both minimum, mode, and maximum aredivided by the integrity value. (In this respect also, the importanceof the affected components on the functioning of the system as awhole could have been taken into account, but this has not beenanalyzed). Hence, it is assumed that if personnel integrity varies invalue, both operational andmechanical integrity will change by thesame amount. For this assumption, no practical evidence is avail-able yet, and such changes will also not be simultaneous, so tem-poral mismatches may be expected. Given more experience,however, this approach could become refined, and indicator valuesat lower levels with more direct ties to component functioningcould be used instead.
Presented in Table 2 are a few essential example equations ofvariables and conditional probability table relations, which aredefined in the nodes of Fig. 4 and in comparable nodes of a discretenetwork.
In a base case with all integrity values assumed at unity, theoutcome of the network calculation is an expected annual loss ofabout 0.5 million USD. Because of the sampling to solve the equa-tions, the continuous network must repeat the calculation a fewtimes to reach an average result. This loss may never be sustained,but it could also be hitting today (or tomorrow) for the full amountof 300 million USD (We are only looking here at an incident withseparator 1. The installation has several other components bywhich a release can occur.)
An advantage of the continuous distribution network is thepossibility to include the uncertainty in the data and calculate theoverall uncertainty in the final result. This calculation has beenperformed by assuming triangular probability density functionswith a lower boundary, a most likely value, and an upper boundary.This type of function canwell be used for expressing expert opinionand in case only a few data are available. The mode of the distri-bution was adapted such that the mean was equal to the discretevalue of the failure rates. Because this paper serves to demonstratethe method rather than to obtain a reliable numerical result, afactor 3 is chosen for both upward and downward bound of the
Table 2Node equations (node probability variable is shown throughout as PN while PN�1 is the pobtain PN, the probability of the ‘source’ node in the failed or not-failed state is multiplie
Node type/name Equations in continuous netIntegrity node Integrity value = Iv
Failure component PN = Bernoulli(p = Failure rate/ Optional for failure PN = Triangular(Min, Failure rate, OR-gates PN = 1- (1- PN1-1)·(1- PN2-1)·…(1- PNi-1) e
of i source nodes
AND-gates(Pressure builds upand Critical event)
PN = PN1-1·PN2-1·…..PNi-1 etc.
BLEVE PN1 = 0.5 PN-1
Vapor Cloud (VC) PN2 = 0.5 PN-1
Ignition probability PN = 0.2 Population density PNPd = 1/100Value of Life PNVl = 7.106 US$Life value at stake PNLvas = PNPd·PNVl
Effect BLEVE PN1 = PN1-1·4000Effect VC Explosion PN2 = PN2-1·4000Damage Costs Cost = (PN1-1+PN2-1)·( PNLvas + 5000) US
most probable value of the failure rate, spanning almost an order ofmagnitude range. Results of the various BNs at three levels of thedominating personnel indicator are collected in Table 3.
The expected annual losses, EAL, appear to increase by a factor of10, if integrity decreases by only a factor of 4. In case of applying theskew triangular distributions, the averages increase, because the‘center of gravity’ of each distribution shifts to the high side.
At any node in the network, new evidence can be introduced. So,if there is a new observation at the location of a certain componentor in case new indicator data become available to decrease uncer-tainty, the effects of the data can immediately be seen in the finalrisk result. As mentioned, the work of Khakzad et al. (2012, 2013aand 2013b) and Montani et al. (2005) shows how wear or othertemporal effects, such as spares in the operation or critical timedelays, can be introduced as well.
6. Discussion
After having developed the core of this paper, three recent, veryrelevant research contributions were encountered showing thatwhere risk assessors have been working for years to incorporatemanagement factors and human error in their models, a certainbreakthrough appears with the application of Bayesian belief net-works (BBNs). The oldest is by Groth, Wang, and Mosleh (2010)proposing hybrid causal logic (HCL) methodology for risk assess-ment. What they mean is that conventional methods using fault
robability variable of its ‘parent’ or ‘source’ listed in the table of Fig. 3). In the CPT tod by the corresponding conditional probability value in the table.
work CPT’s/equations discrete networkSwitch
Iv) PN = Failure rate; ¬PN = 1- Failure rateMax) Only possible with sensitivity nodetc. in case N1-1 Failed (F) Not failed (NF)
N1-2 F NF F NFN1-i F NF F NF F NF F NF
PN 1 1 1 1 1 1 1 0¬PN 0 0 0 0 0 0 0 1N1-1 Failed (F) Not failed (NF)N1-2 F NF F NFN1-i F NF F NF F NF F NF
PN 1 0 0 0 0 0 0 0¬PN 0 1 1 1 1 1 1 1
PBLEVE = 0.5PVC = 0.5PIg = 0.2
$/yr Cost = 300.106·PCritEvent (PBLEVE + PVC PIg)

H. Pasman, W. Rogers / Journal of Loss Prevention in the Process Industries 30 (2014) 197e206204
trees, event trees, or event sequence diagrams (ESD) based onBoolean logic do not allow incorporation of soft causal factors thatare typical for human action and organizational functioning. BBNshave the capability to model probabilistically such soft causation.They developed a three-layered Hybrid Causal Logic and corre-sponding software called Trilith to model scenarios and to performrisk and safety analysis. The application described is within an in-ternational aviation safety project, CATS or Causal Model of AirTransport Safety already mentioned (Ale et al., (2009)). The toplayer consists of an ESDwith a fault tree underneath and below thatthe BBN. In the final set-up, the BBN comprised 1400 nodes. Avia-tion safety has available multitudinous accident data, which BNsare especially suited to incorporate. Bellamy et al. (2008) developedbow-tie type modeling of human caused accidents on the basis of alarge data collection. One can see a link with indicators arising, andAle’s group is elaborating this avenue further.
Finally, Vinnem et al. (2012) and Gran et al. (2012) at the Uni-versity of Stavanger applied the approach of including humanfactors and management effectiveness to risk modeling of offshoreinstallation maintenance after many years of performing only‘hardware’ oriented barrier and operational risk analysis (BORA). Inparticular for risk modeling of maintenance activities, incorpora-tion of human factors and organizational aspects is indispensable.To that end in a previous study, Vinnem, Seljelid, Haugen, Sklet, andAven (2009) had introduced the concept of risk influencing factoror RIF. The present approach made use of this concept of ‘under-lying’ factors while it was further inspired by the work of Moslehand coworkers mentioned above. Vinnem et al. (2012) and Granet al. (2012) went further, however, in the use of BBNs just as inthe CATS project (Ale et al., 2009). RIFs are thought to influenceboth each other and the failure rates; the latter via human error.Mean strength of influence of a RIF or its importance is by assignedweights and is set by expert judgment. RIFs are structured in twolevels, as shown in Fig. 5 where the lowest level RIFs represent the‘underlying’ management decisions.
Fig. 5. BBN of the two level RIF structure by Vinnem et al. (2012) for the example of a maincontrol of the planning). The downwards directed arrows connect to a bottom layer reprcomparable to indicators. (For better readability the quality of the original figure has been
Actual impact of the RIFs is derived via the input of observedscores. A score is the condensed quality information of previousworkobtained by audits or surveys in the offshore petroleum industryplaced on a six-point scale (A is best of industry, C is average, F isworst), which makes the score strikingly similar to the concept of anindicator. The model, applying generally accepted average humanerror probabilities influenced by the RIFs and the company specificscores collected in a database built over the years, was then validatedagainst observed leaks of various installations owned by the respec-tive companies. Thisyieldshumanerrorprobabilityvalues specific foreach offshore company, needed to test the potential effects of addi-tional risk reducing measures in a variety of offshore applications.
Summarizing, we can conclude that our approach of middle andlong-term effect risk factors based amongst others on indicatorvalues, is not unique. In hindsight it appears that other riskmodelingresearchers are following similar lines of thought. However, it alsoshows that the risk factorapproach is still in its infancyand thatmuchwork still has to be done and data to be collected before the methodreally can be trusted sufficiently to rely on its predictive power.
In case a trustable relation between (mostly leading) indicatorsand risk can be established, the issue of decision criterionwill arise.At what risk level will the alarm bell have to sound and invokemanagement to take action. In our opinion this could be solved thesame way as the safeguarding of an installation by a layer of pro-tection analysis (LOPA) is deemed sufficient. In a LOPA, conse-quences are often only looked at in a semi-quantitativeway and theassessment is based mainly on incident frequency reduction. Thisapproach would be an option here too, and could be done byapplying a well-known risk-matrix coupled to a semi-quantitativeconsequence matrix, as shown in Fig. 6. For a given case, conse-quence and frequency can be plotted in thematrix and risk reduceduntil the shaded triangular bottom left (green) field is reached. Ofcourse, in viewof accumulated risk, the location of the borderline ofrisk acceptance must shift downwards with increasing number ofrisk sources at a site.
tenance planning activity B1.A (failure is incorrect blinding/isolation: Aa. planning; Ab.esenting nodes of score observations obtained in audits and surveys which are thusenhanced.)

Fig. 6. Top: Risk matrix (semi-quantitative) with risk reduction action lines indicatedand Bottom: Corresponding consequence matrix giving comparable characteristiclevels of damage and range of media coverage. The more severe levels 105 and 106 willbe accompanied by adverse reputation damage of the company concerned.
H. Pasman, W. Rogers / Journal of Loss Prevention in the Process Industries 30 (2014) 197e206 205
A nut harder to crack is how much time will be available tocorrect matters in case an increased risk situation is detected. Theamount of time, e.g., conditional mean or median time to failure,will depend on the nature of the risk causing phenomenon and itstime constant of further change. A risk figure itself has no intrinsictime dependency. The risk can realize itself in an upset today butalso in a million years. To shed more light on this aspect, a futureeffort will be made.
7. Conclusions
� By the introduction of process safety indicators, a further shiftto pro-action and to prevention of losses will be made possible.Beside the question which (leading) indicators to choose,several others will be identified if no further improvement ofthe indicator level appears. Or in case it is even worse, what todo if the indicator level decreases? Is it sufficient to focus on theindicators affected, or is the problem at a higher level? In thiscase aggregation of indicators may help to clarify, but aggre-gation may be insufficient by itself to decide whether presentsafety is safe enough.
� Analysis of risks in process plant is a matter of identification ofhazards and possible upset scenarios. The latter consist ofchains of cause and effect events and have been modeled, afteridentification by FMEA or HazOp, by fault and event tree orbow-tie. Recently, Bayesian network software has become thetool of preference, because the fundamental properties of thenetworks make them a universal infrastructure for scenariomodeling and risk management. BNs enable overview, diag-nosis of causes of disturbances, and predictive reasoning.
� With expert judgment input about importance of indicatorvalues for a specific component or sub-system functioning, theeffect of indicator changes can in principle be taken into accountandmade visible in an overall risk level of parts of an installationor for a system as a whole. The approach would therefore open
the way for continuous monitoring of the safety level andproviding indications when and where to correct. In aviationsafety and offshore platformmaintenance, satisfactory attemptsin the same direction have been made. This approach needs,however, a number of researchprojects in operating installationswith safety indicators installed and process safety expertinvolvement to test how well it works. So, who is interested?
References
Ale, B. J. M., Bellamy, L. J., Van der Boom, R., Cooper, J., Cooke, R. M., Goossens, L. H. J.,et al. (2009). Further development of a causal model for air transport safety(CATS): building the mathematical heart. Reliability Engineering and SystemSafety, 94, 1433e1441.
Bellamy, L. J., Ale, B. J. M., Whiston, J. Y., Mud, M. L., Baksteen, H., Hale, A. R., et al.(2008). The software tool story builder and the analysis of the horrible stories ofoccupational accidents. Safety Science, 46, 186e197.
CCPS. (2007b). Guidelines for risk based process safety. Hoboken, NJ: Center forChemical Process Safety e AIChE, John Wiley & Sons, ISBN 978-0-470-16569-0.
CCPS. (2010). Guidelines for process safety metrics. Hoboken, NJ: Center for ChemicalProcess Safety e AIChE, John Wiley & Sons, ISBN 978-0-470-57212-2. Wiley2010.
CCPS. (2007a). Process safety leading and lagging metrics. Center for Chemical Pro-cess Safety e AIChE, Initial release, New York, 20 December http://www.aiche.org/ccps/.
DSL. (2010). GeNIe (Graphical network interface) and SMILE (Structural modeling,inference, and learning engine), version 2.0 software. Decision Systems Labora-tory, University of Pittsburgh. http://genie.sis.pitt.edu/.
Fenton, N., & Neil, M. (2013). Risk assessment and decision analysis with Bayesiannetworks. Boca Raton, FL 33487e2742, USA: CRC Press, Taylor & Francis Group,ISBN 978-1-4398-0910-5.
Ferdous, R., Khan, F., Sadiq, R., Amyotte, P., & Veitch, B. (2012). Handling andupdating uncertain information in bow-tie analysis. Journal of Loss Prevention inthe Process Industries, 25, 8e19.
Gran, B. A., Byeb, R.., Nyheim, O. M., Okstad, E. H., Seljelid, J., Sklet, S., et al. (2012).Evaluationof the riskOMTmodel formaintenanceworkonmajor offshore processequipment. Journal of Loss Prevention in the Process Industries, 25, 582e593.
Groth, K., Wang, Ch, & Mosleh, A. (2010). Hybrid causal methodology and softwareplatform for probabilistic risk assessment and safety monitoring of socio-technical systems. Reliability Engineering and System Safety, 95, 1276e1285.
Hassan, J., & Khan, F. (2012). Risk based asset integrity indicators. Journal of LossPrevention in the Process Industries, 25, 544e554.
Hopkins, A. (2009). Thinking about process safety indicators. Safety Science, 47,460e465. and Reply to Comments, ibidem, 47, 508e510.
HSE. (2006). Developing process safety indicators, a step-by-step guide for chemicaland major hazard industries, HSG254, ISBN 978 0 7176 6180 0. http://www.hse.gov.uk/pubns/books/hsg254.htm.
HSE. (2007). Review of significance of societal risk for proposed revision to land useplanning arrangements for large scale petroleum storage sites. WS Atkins Consul-tants Ltd. HSE Books RR512 http://www.hse.gov.uk/research/rrhtm/rr512.htm.
Hudson, P. T. W. (2009). Process indicators: managing safety by the numbers. SafetyScience, 47, 483e485.
HUGIN. (2012). HUGIN EXPERT graphical user interface/HUGIN decision engine7.6Available at http://www.hugin.com/productsservices/products/release-notes/.
Khakzad, N., Khan, F., & Amyotte, P. (2011). Safety analysis in process facilities:comparison of fault tree and Bayesian network approaches. Reliability Engi-neering and System Safety, 96, 925e932.
Khakzad, N., Khan, F., & Amyotte, P. (2012). Dynamic risk analysis using bow-tieapproach. Reliability Engineering and System Safety, 104, 36e44.
Khakzad, N., Khan, F., & Amyotte, P. (2013a). Dynamic safety analysis of processsystems by mapping bow-tie into Bayesian network. Process Safety and Envi-ronmental Protection, 91, 46e53.
Khakzad, N., Khan, F., & Amyotte, P. (2013b). Risk-based design of process systemsusing discrete-time Bayesian networks. Reliability Engineering and System Safety,109, 5e17.
Khan, F. I., Sadiq, R., & Husain, T. (2002). Risk-based process safety assessment andcontrol measures design for offshore process facilities. Journal of HazardousMaterials, A94, 1e36.
Kip Viscusi, W. (2005). The value of life. Discussion Paper No. 517 06/2005. Cam-bridge, MA 02138: Harvard Law School http://www.law.harvard.edu/programs/olin_center/papers/pdf/Viscusi_517.pdf.
Knegtering, B., & Pasman, H. J. (2013). The safety barometer; how safe is my planttoday? What and how to measure the actual safety level? Journal of Loss Pre-vention in the Process Industries, 26, 821e829.
Montani, S., Portinale, L., & Bobbio, A. (2005). Dynamic Bayesian networks formodeling advanced fault tree features in dependability analysis. In Kolowrocki(Ed.), Advances in safety and reliability (pp. 1414e1422). London: Francis & TaylorGroup, ISBN 0 415 38340 4.
Morales, O., Kurowicka, D., & Roelen, A. (2008). Eliciting conditional and uncondi-tional rank correlations from conditional probabilities. Reliability Engineeringand System Safety, 93, 699e710.

H. Pasman, W. Rogers / Journal of Loss Prevention in the Process Industries 30 (2014) 197e206206
OECD. (2003). Guidance for industry, public authorities and communities for devel-oping SPI programmes related to chemical accident prevention, preparedness andresponse (Interim publication scheduled to be tested in 2003e2004 and revised in2005). OECD environment, health and safety publications series on chemicalaccidents No. 11, Paris, ISBN 92-64-01910-3.
OSHA. (1992). United States Department of Labor, Occupational Safety & HealthAdministration, Process Safety Management Standard, 29 CFR 1910.119, 57 FR6356, February 24.
Pasman, H. J., & Rogers, W. J. (2012). Risk assessment by means of Bayesian net-works: a comparative study of compressed and liquefied H2 transportation andtank station risks. International Journal of Hydrogen Energy, 37, 17415e17425(and erratum 38 (2013) 1662).
Pasman, H. J., & Rogers, W. J. (2013). Bayesian networks make LOPA more effective,QRA more transparent and flexible, and thus safety more definable! Journal ofLoss Prevention in the Process Industries, 26, 434e442.
Pearl, J. (2000). Causality, models, reasoning and inference (1st ed.). New York, USA:Cambridge University Press. ISBN-978-0-77362-8; 2nd Edition, ISBN 978-0-521-89560-6.
RIVM. (01-07-2009). Reference manual Bevi risk assessments version 3.2 e Module B.http://www.rivm.nl/milieuportaal/images/Reference-Manual-Bevi-Risk-Assessments-version-3-2.pdf.
UniNet, developed by the Risk and Environmental Modeling Group at the Depart-ment of Mathematics of the Delft University of Technology, http://www.lighttwist.net/wp/uninet.
Vinnem, J. E., Bye, R., Gran, B. A., Kongsvik, T., Nyheim, O. M., Okstad, E. H., et al.(2012). Risk modelling of maintenance work on major process equipment onoffshore petroleum installations. Journal of Loss Prevention in the Process In-dustries, 25, 274e292.
Vinnem, J. E., Seljelid, J., Haugen, S., Sklet, S., & Aven, T. (2009). Generalizedmethodology for operational risk analysis of offshore installations. Proceedingsof the Institution of Mechanical Engineers, Part O: Journal of Risk and Reliability,223, 87e97.
Yellow Book. (2005). Methods for the calculation of physical effects, PGS 2, DutchGovernment, Ministry VROM (meanwhile changed to Ministry I&M). download-able from website http://www.publicatiereeksgevaarlijkestoffen.nl/publicaties/PGS2.html.


