Embed Size (px)
Citation preview

Geophys. J. Int. (2002) 149, 267–280
Processing, modelling and predicting time-lapse effectsof overpressured fluid-injection in a fractured reservoir
Erika Angerer,1,∗ Stuart Crampin,1,2 Xiang-Yang Li2 and Thomas L. Davis3
1Department of Geology and Geophysics, University of Edinburgh, Grant Institute, West Mains Road, Edinburgh EH9 3JW, UK.E-mails: [email protected]; [email protected] Anisotropy Project, British Geological Survey, Murchison House, West Mains Road, Edinburgh EH9 3LA, UK. E-mail: [email protected] Characterization Project, Colorado School of Mines, Golden, CO 80401, USA
Accepted 2001 September 11. Received 2001 September 7; in original form 2001 May 22
S U M M A R YTime-lapse seismology is important for monitoring subsurface pressure changes and fluidmovements in producing hydrocarbon reservoirs. We analyse two 4-D, 3C onshore surveys fromVacuum Field, New Mexico, USA, where the reservoir of interest is a fractured dolomite. InPhase VI, a time-lapse survey was acquired before and after a pilot tertiary-recovery programmeof overpressured CO2 injection, which altered the fluid composition and the pore-fluid pressure.Phase VII was a similar time-lapse survey in the same location but with a different lower-pressure injection regime.
Applying a processing sequence to the Phase VI data preserving normal-incidence shear-wave anisotropy (time-delays and polarization) and maximizing repeatability, interval-timeanalysis of the reservoir interval shows a significant 10 per cent change in shear-wave velocityanisotropy and 3 per cent decrease in the P-wave interval velocities. A 1-D model incorporatingboth saturation and pressure changes is matched to the data. The saturation changes havelittle effect on the seismic velocities. There are two main causes of the time-lapse changes.Any change in pore-fluid pressures modifies crack aspect ratios. Additionally, when there areoverpressures, as there are in Phase VI, there is a 90◦ change in maximum impedance directions,and the leading faster split shear wave, instead of being parallel to the crack face as it is forlow pore-fluid pressures, becomes orthogonal to the crack face. The anisotropic poro-elasticity(APE) model of the evolution of microcracked rock, calculates the evolution of cracked rockto changing conditions. APE modelling shows that at high overburden pressures only nearlyvertical cracks, to which normal incidence P waves are less sensitive than S waves, remain openas the pore-fluid pressure increases. APE modelling matches the observed time-lapse effectsalmost exactly demonstrating that shear-wave anisotropy is a highly sensitive diagnostic ofpore-fluid pressure changes in fractured reservoirs.
In this comparatively limited analysis, APE modelling of fluid-injection at known pressurecorrectly predicted the changes in seismic response, particularly the shear-wave splitting,induced by the high-pressure CO2 injection. In the Phase VII survey, APE modelling alsosuccessfully predicted the response to the lower-pressure injection using the same Phase VImodel of the cracked reservoir. The underlying reason for this remarkable predictability offluid-saturated reservoir rocks is the critical nature and high crack density of the fluid-saturatedcracks and microcracks in the reservoir rock, which makes cracked reservoirs critical systems.
Key words: anisotropic poro-elasticity (APE), critical systems, fluid-injection, fracturedreservoirs.
1 I N T R O D U C T I O N
The multicomponent 4-D (time-lapse 3-D) 3C reflection survey inVacuum Field, New Mexico, in 1995, by the Reservoir Charac-
∗Now at: WesternGeco, Schlumberger House, Gatwick Airport, WestSussex, RH6 0NZ, UK.
terization Project (RCP), Colorado School of Mines, was the firsttime-lapse shear-wave acquisition in exploration seismology (Rocheet al. 1997). Time-lapse seismology aims to record fluid movementswithin the reservoir, which may indicate, for example, isolated fluidcompartments. Jack (1998) suggests that such integrated geologi-cal, geophysical and petroleum engineering methods are needed tocreate a well-resolved picture of a producing reservoir.
C© 2002 RAS 267
by guest on February 2, 2016http://gji.oxfordjournals.org/
Dow
nloaded from

268 E. Angerer et al.
A large number of investigations of shear-wave propagation haveshown the sensitivity of shear-wave splitting (seismic birefringence)to the presence of aligned microcracks and fractures, rendering therock effectively anisotropic. Shear-wave anisotropy with azimuthalvariations has been observed, for example, in laboratory studies(Rai & Hanson 1988; Duerrast & Siegesmund 1999), earthquakeseismology (Liu et al. 1997; Crampin et al. 1999), and explorationseismology (Winterstein & Meadows 1991; Li & Crampin 1993;Thomsen et al. 1995; Gaiser 1999). Crampin (1994) reviewed allpublished observations of shear-wave splitting and showed that vir-tually all sedimentary, igneous and metamorphic rocks below about1 km depth display shear-wave splitting with the polarization of thefaster aligned subparallel to the direction of maximum horizontalcompressional stress. That is, the faster shear waves are subparallelto the strike of stress-aligned cracks. Thus, the dominant fracturedirection and the crack density can be estimated from the polariza-tion directions and time-delays of the split shear waves. It is nowgenerally accepted that crack directions are related to the subsurfacestress directions, where open cracks are subparallel to the maximumhorizontal stress.
Zatsepin & Crampin (1997) and Crampin & Zatsepin (1997)develop an anisotropic poro-elasticity (APE) model for the evo-lution of fluid-saturated cracks under changing conditions, partic-ularly changes in subsurface stress. APE calculates the pressure-and stress-dependent distribution of microcracks, where the drivingmechanism is fluid migration by flow or dispersion along pres-sure gradients between cracks at different orientations to the stressfield. This causes compliant cracks to open and close dynamicallyand hence modifies the effective elastic constants of the fluid-filledrock, so that the changes can be monitored by shear-wave split-ting. Crampin & Zatsepin (1997) show that changes in shear-wavesplitting are controlled by exactly the same parameters that controllow-level deformation before fracturing occurs.
The objective of this present study is: (1) process the VacuumField surface seismic data so that they can be reliably usedfor anisotropic time-lapse investigations; (2) analyse and identifyanisotropic time-lapse effects; (3) calculate synthetic seismogramsusing APE for models that incorporate subsurface pressure and sat-uration changes from mixing the highly compressible CO2 withthe reservoir fluid for both Phase VI and Phase VII injection datasets. We shall see that the match of modelled to observed seismo-grams is so satisfactory that the response of the rock mass to knownfluid-injection changes is in effect predicted. We shall suggest in anAppendix that this remarkable predictability of fluid–rock interac-tions is caused by the rock being so pervaded by cracks, in particular,fluid-saturated microcracks, that the rocks may be considered to becritical systems. This has several important implications for explo-ration and production geophysics as well as for a wide range of otherearth science activities.
This study (Angerer et al. 2000a,b) shows the importance ofshear-wave splitting as a time-lapse attribute in fractured reser-voirs. We show that it is the principal seismic diagnostic for thedetection of pressure effects, where even hard brittle rocks, suchas dolomite, are suitable for time-lapse seismology. The modellingstudy is a verification and calibration of APE for surface seismicdata.
2 O U T L I N E O F P H A S E V I
Vacuum Field is situated in the Permian Basin in New Mexico, USA.The reservoir interval of interest, the San Andres dolomite, is partof a flat-layered carbonate platform with cyclic deposition, which isoverlain by evaporites and sandstones. Evidence of fracturing can
be seen in cores and thin sections (Scuta 1997). Hydrocarbons havebeen produced for over 60 years making Vacuum Field a maturereservoir, which is now undergoing tertiary recovery in the formof CO2 injections. We first analyse a pilot project in 1995, RCPPhase VI, where CO2 was injected in a single well, CVU-97,for 3 weeks with a large increase in pore-fluid pressure. Twocircular spread multicomponent surveys centred at CVU-97were recorded before and immediately after the injection usingP-wave and two shear-wave vibrator sources with orthogonal ori-entation and recorded by three-component receiver arrays. The‘nine-component’ acquisition geometry is shown in Fig. 1 with thesource lines oriented E–W and the receiver lines oriented N–S. Eachsource location has three sources and each receiver station also hasthree orthogonal components and therefore in total nine compo-nents are recorded per location. This allows one to sample the elasticwavefield with azimuth and offset. However, owing to insufficientquality the analysis was limited to normal move-out-stacked (NMO)data. The data analysis interval times and time-delays are evaluatedfrom picked horizons, so that the shear-wave velocity anisotropyand P-interval velocity can be calculated. Shear-wave anisotropyis found to be the most sensitive parameter and a significant shear-wave splitting time-delay anomaly develops south and east of theinjection well (Davis et al. 1997). Polarization directions are evalu-ated for the overburden and the target interval after layer-strippingfollowing a method developed by Winterstein & Meadows (1991)and Thomsen et al. (1995).
In flat-layer modelling, we select a location in the zone of theshear-wave time-delay anomalies. The aim is to match the observedpre-injection data with synthetic seismograms propagating throughan elastic model of aligned cracks. The synthetic seismograms werecalculated using ANISEIS (Taylor 2000) which is a full waveform,anisotropic modelling package using the reflectivity method. More-over, ANISEIS incorporates APE modelling. The modelling of theinjection is separated into two parts: first, the evaluation of the ef-fects of the saturation change; and second, the evaluation of thepore-fluid pressure changes. The change of the elastic parametersof the reservoir rock owing to CO2 injection is calculated using in-clusion models based on those developed by Endres & Knight (1997)to allow for the pore-fluid pressure communication at seismic fre-quencies. Pressure-dependent CO2 properties have been determinedexperimentally by Wang et al. (1998). The resulting isotropic rockproperties are the starting point for the pressure modelling.
Pressure changes are considered for an initial APE model of acracked rock that was adapted to fit the observations of shear wavesand P waves at the selected location. The measured pore-fluid pres-sure increase of 6.4 MPa causes previously closed nearly verticallow aspect-ratio cracks to open (increase in aspect ratio) during in-jection. The presence of fault zones also suggests preferred crackdirections. All the seismic velocities decrease, particularly the shearwaves with polarizations parallel to the maximum horizontal stressdirection. This causes the observed change in anisotropy and, in par-ticular changes the polarization direction of the faster split shearwave. APE shows that such polarization changes are characteristic ofoverpressured reservoirs. Similar large time-delays and polarizationchanges have been observed previously in an overpressured reser-voir (Crampin et al. 1996; Slater 1997), and in the fault gouge ofthe San Andreas Fault where high pore-fluid pressures are expected(Liu et al. 1997).
3 D A T A P R O C E S S I N G
The main issues in 4-D multicomponent data processing are to createhigh-resolution data with maximum repeatability and in this case the
C© 2002 RAS, GJI, 149, 267–280
by guest on February 2, 2016http://gji.oxfordjournals.org/
Dow
nloaded from

Modelling/predicting fluid injection 269
Figure 1. Acquisition geometry of Vacuum Field, sources run E–W and 3C receivers N–S. CVU-97 in the centre of the circular spread survey was used as thepilot CO2 injection well in 1995.
Figure 2. (a) Shear (S1) and (b) P-wave sections, orientated S to N, with picked horizons, base near-surface: blue; base salt: green; top San Andres:orange; base San Andres: red.
C© 2002 RAS, GJI, 149, 267–280
by guest on February 2, 2016http://gji.oxfordjournals.org/
Dow
nloaded from

270 E. Angerer et al.
Table 1. Shear- and P-wave processing flows.
Shear-wave processing flow P-wave processing flow
Surface statics Surface staticsAlford rotationSurface-consistent deconvolution Surface-consistent deconvolutionTrace edit Trace editSurface-consistent amplitude Surface-consistent amplitude
corrections correctionsOutside mute —Velocity analysis and NMO Velocity analysis and NMO
correction correctionResidual statics —Stack Stack3-D random noise attenuation 3-D random noise attenuation
(RNA) (RNA)fk-dip filter fk-dip filterBandpass filter Bandpass filterResidual amplitude analysis/ Residual amplitude analysis/
compensation compensation4-D matching filter 4-D matching filter
preservation of normal-incidence shear-wave anisotropy. Success-ful anisotropic processing needs to preserve the relative amplitudesbetween the components to preserve shear-wave polarization di-rections, and preserve the relative time-delays between shear-wavearrivals. A synthetic anisotropic seven-layer model based on thestratigraphic setting of the Vacuum Field was created to test theapplicability of standard (P-wave) processing techniques to shear-wave data. The tested processing steps are deconvolution, dip fil-tering, stacking, random noise attenuation (RNA), which is a co-herence filter in the fx-domain, and 4-D matching for time-lapsedata. The criterion to evaluate the applicability is to determine theamount of change of the polarization directions and time-delayswhen applying the various processing techniques in the presenceof noise. In the actual data processing, only parameters thatwere found to preserve normal incidence anisotropy were applied.Table 1 gives an overview of the shear- and P-wave processing se-quences. From each multicomponent data set, we determine oneP-wave data volume and four shear-wave data volumes (orthogonalS1 and S2 geophones recording two orthogonal shear-wave sources).
We use the surface statics correction, Alford rotation (Alford1986), and surface-consistent deconvolution of Roche (1997). Themaximum horizontal stress is in the N118◦E direction, which wecall the S1-direction, and the orthogonal N28◦E, the S2-direction.The data are rotated into this natural coordinate system where thefast split shear-wave polarization is found to be parallel to the S1axis and the slow parallel to S2. Surface-consistent algorithms areused for both P waves and shear waves to increase repeatability asdiscussed by Lumley (1995). When using surface-consistent algo-rithms, amplitude scalars, deconvolution operators and static shiftsare calculated for each source and receiver station. Every data tracehas the operators of its corresponding source and receiver locationapplied. This is more stable than using operators that are calcu-lated trace by trace and are therefore more sensitive to noise. Theoperators for surface-consistent amplitude correction and reflec-tion statics were derived from the S1 components and applied toall shear-wave components within each survey to preserve relativeamplitudes and time-shifts. NMO corrections were then made onall components using a single 3-D velocity function picked fromthe S1 data. Owing to noise problems a narrow mute was appliedthat only included data up to 800 m offset in the target zone. Post-stack noise attenuation procedures include 3-D RNA, two pass 2-D
fk-filtering, and a bandpass filter. 3-D RNA is a multichannelfx-deconvolution process, where within time-windows the coher-ent signals of the data are predicted and the incoherent part, therandom noise, is attenuated. A single variant gain function was de-rived from the combination of S1 and S2 components of each surveyand applied to all four components to ensure the preservation ofrelative amplitudes. In the 4-D analysis, each trace of the first sur-vey is matched to its equivalent trace in the second survey by adeconvolution process. Deconvolution operators, which are calcu-lated on a trace by trace basis, compensate for wavelet and phasechanges between the time-lapse surveys. The operators are esti-mated from time windows above the target as this is regarded asthe repeatable part of a time-lapse survey. The P-wave process-ing flow is similar to the shear-wave flow. Surface-consistent para-meters are derived for each data set individually. The same ve-locity function is applied to both data sets and the first survey isthen matched to the second 4-D survey with better signal-to-noisecharacteristics.
4 D A T A A N A L Y S I S
Fig. 2 shows shear-wave (S1) and P-wave record sections of thefully processed Phase VI data volumes with the interpreted horizonsindicated. Roche (1997) identified the reflections by tying VSP datato the surface seismology. The sections can be roughly divided intothree intervals. The top 850 ms in the shear-wave section (Fig. 2a)are near-surface sandstones and the reflections are cyclic and havehigh-frequency components. The interval between 850 and 1350 msis a salt layer, where there are fewer reflections and the frequencycontent drops. This may be caused by greater homogeneity in the saltlayer. Below the salt lies a sequence of dolomites that contains thetarget interval, the San Andres formation. The top (orange marker)following Roche (1997) lies around 1630 ms, the bottom is pickedaround 1820 ms (red marker). In the dolomites, cyclic reflectionsoccur again, which indicates facies changes owing to cyclic sea levelchanges in deposition. In the shear-wave section, the target intervalreflections are cyclic in the northern part and become less coherentin the south. In the P-wave section, the target is picked as a 100 msinterval lying between 680 ms and 780 ms. Cyclicity appears tobe less a problem in P than it is in shear. Cyclic deposition canlead to tuning effects in the data, which may be either constructiveor destructive interference of reflections from thin layers (Knapp1990). This degrades resolution.
Anisotropic analysis is performed on the stacked data. The hori-zon picks provide interval traveltimes and time-delays of the splitshear waves, which are used to calculate the percentage shear-wavevelocity anisotropy as the normalized difference between the fastand the slow shear-wave velocities. P-wave interval time differencesbefore and after injection are also calculated. Following Harris &Adler (1999), there is a shear-wave picking error of approximately2.7 per cent and a P-wave picking error of 2 per cent. Nine-pointmedian filtering was applied to the horizon picks, which reducesthe error by a factor of
√9 to 0.9 and 0.67 per cent for shear waves
and P waves, respectively. In the difference sections, this error ismultiplied by the square root of two which leads to total errors of1.3 per cent for shear waves and 0.9 per cent for P waves. It istherefore possible to detect significant time-lapse changes. Fig. 3shows the interval time analysis results before and after injectionfor shear and the interval time difference for P waves. Figs 3(a)and (b) are the percentage time delays between the S1 and the S2shear-wave arrivals in the two surveys, and Fig. 3(c) is the percent-age difference in shear-wave anisotropy before and after injection.
C© 2002 RAS, GJI, 149, 267–280
by guest on February 2, 2016http://gji.oxfordjournals.org/
Dow
nloaded from

Modelling/predicting fluid injection 271
Figure 3. Shear-wave anisotropy of the San Andres interval of (a) the pre-CO2, (b) the post-CO2 survey, (c) the difference (pre-CO2–post-CO2); and(d) P-wave interval time difference. The values are in per cent. The wells are indicated and each gridpoint is one common midpoint (CMP). The distancebetween CMPs is 16.75 m.
C© 2002 RAS, GJI, 149, 267–280
by guest on February 2, 2016http://gji.oxfordjournals.org/
Dow
nloaded from

272 E. Angerer et al.
Fig. 3(d) is the interval time-difference plot for P waves. Beforethe injection, the shear-wave time delays lie between ±2 per cent,which means shear-wave splitting is small but lies above the limits ofresolution.
After the injection a zone with negative shear-wave splitting canbe observed in Fig. 3(b) to the south and east of the injection well.The average value of anisotropy in the anomalous zone is −8 percent. Peak values lie around −12 per cent. Both shear-wave arrivalsare differentially later after the injection, where S1 is relatively laterthan S2. This produces a ‘negative anisotropy’ where the shear-wave polarized parallel to the maximum horizontal stress directionis slower than the perpendicularly polarized wave. A similar ob-servation of a negative anisotropy was made in an overpressurizedreservoir by Crampin et al. (1996) based on the analysis of Slater(1997). The shear-wave difference plot, Fig. 3(c), shows that theinjection caused a considerable increase in relative anisotropy of10 per cent. The P-wave interval time difference plot, Fig. 3(d),also shows a zone of velocity decrease to the south and east of theinjection well, with an average velocity change in this zone of 2 percent with peak values of 5 per cent. The zone to the NW of the injec-tion well shows very little changes in P-wave velocities. From theinterval-time analysis it can be concluded that the combined effectsof CO2 injection and pore-fluid pressure increases are decreases inall body-wave velocities occurring mainly to the south and east ofthe injection well.
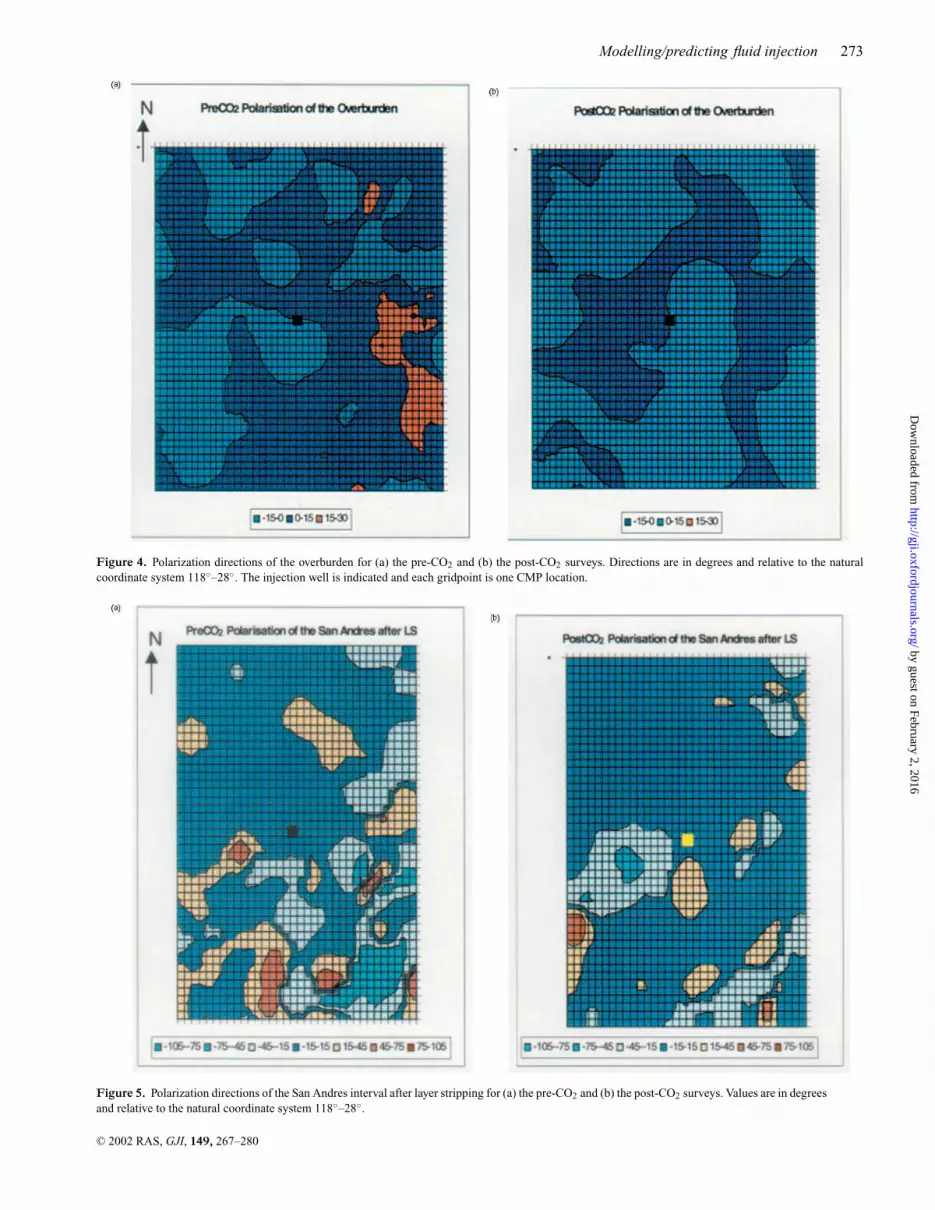
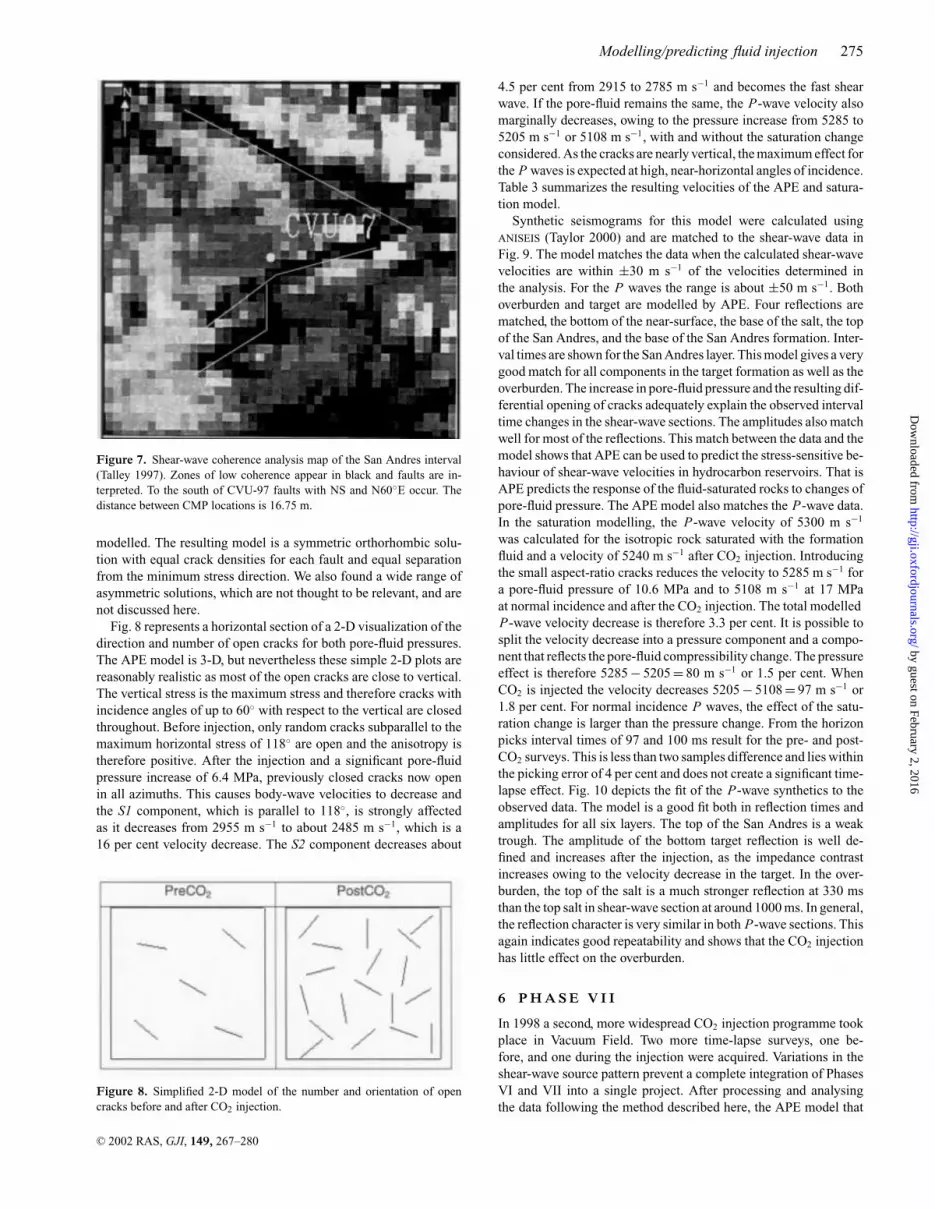
Polarization analysis was performed using the linear transformtechnique (Li & Crampin 1993). In the overburden above the targethorizon, the polarization directions lie mostly within ±15◦ of themaximum horizontal stress direction, see Figs 4(a) and (b) for bothsurveys. It is probably owing to noise that the first (pre-CO2) surveyshows some areas with higher deviations of 15◦–30◦. In general, thisresult is a confirmation that the Alford rotation (Alford 1986) hasbeen performed correctly. To evaluate the polarization directions ofthe target interval a layer stripping procedure was applied follow-ing an approach developed by Thomsen et al. (1995). The horizonpicks of the top of the target provide the total time-delays betweenthe fast and the slow shear waves that accumulate in the overburden,which are on average 12 ms. To strip off the overburden anisotropyof the overburden correctly, the total two-way time-delay is sub-tracted from the slow shear-wave component at each location andthe one-way (half) time-delays are removed from the residual shear-wave components. Fig. 5 shows the resulting polarization directionsof the target interval for the pre-CO2 and the post-CO2 surveys.To the NW, the polarization directions are in general more uniformand aligned parallel to the natural coordinate system. To the SE,the polarizations are very heterogeneous, especially in the pre-CO2
survey. After injection there is better alignment in this quadrant. Apossible explanation is that before the CO2 injection the reservoirmay have been in a heterogeneous condition as both production andwater-injection processes had been in progress for decades. It issuggested that the significant pore-fluid pressure increase betweenthe two surveys may have led to more homogeneously aligned po-larization directions in the whole area. There is no significant po-larization anomaly in the area of the identified time-delay changes.Cycle skipping effects may have introduced ambiguity in the mea-surements and so polarity reversals that follow from Fig. 3(b) cannotbe verified.
5 M O D E L L I N G
In order to interpret and understand the observed time-lapse changesa 1-D model is matched to the data in the zone of the time-delay
anomaly. The model incorporates both saturation and pressurechanges. At first, the effects of a saturation change on the equant(non-aligned) porosity are investigated. It is assumed that suchequant pores are distributed randomly and that the rock is isotropic.The CO2 injection changes the density, compressibility and the vis-cosity of the reservoir fluid. Wang et al. (1998) made a rock physicsstudy on the effects of CO2 injection in a carbonate rock similarto the San Andres dolomite, and provide CO2 density, bulk mod-ulus, and compressional velocity as functions of pore-fluid pres-sure. The fluid bulk modulus of CO2 is significantly lower than thebulk modulus of the reservoir fluid, by at least one order of magni-tude: 0.2 and 0.25 GPa at pore-fluid pressures of 10.6 and 17 MPa,respectively, as opposed to 2.5 GPa for the bulk modulus of thereservoir fluid of oil with 38◦ API gravity and brine. Using Wood’sequation (Batzle & Wang 1992), an average P-wave velocity of780 m s−1 can be determined for a CO2–oil–brine mixture. Thefluid density is 1 g cm−3, which is only slightly below the densityof the original reservoir fluid of 1.06 g cm−3 (Roche 1997).
Endres & Knight (1997) derived a rock physics model that incor-porates fluid-pressure communication into inclusion-based models,and so a single model can be used to calculate rock properties atboth high and low frequencies. At low frequencies the results areequal to the Gassmann (1957) formulation so that the shear modulusis independent of fluid saturation. At low frequencies the pore-fluidpressures can equilibrate and the elastic moduli are smaller than athigh frequencies. The required parameters of this model are the elas-tic moduli of the matrix (71 GPa for the bulk modulus and 31.5 GPafor the shear modulus), which consists of dolomite with up to 20 percent anhydrite, a porosity of 12.7 per cent and the aspect-ratio spec-trum of the pores. An aspect-ratio spectrum was derived so thatthe laboratory measurements of San Andres dolomite (Capello dePassalacqua 1995) and the observations in the seismic data can bematched. For the rock filled with reservoir fluid, this gave a bulkmodulus of 43 GPa and a shear modulus of 23.7 GPa.It is possible to calculate P- and shear-wave velocities of the SanAndres formation for varying CO2 content. Fig. 6 shows how P-wave and shear-wave velocities change when CO2 is injected at17 MPa pore-fluid pressure. The rock saturated with the reser-voir fluid has a P-wave velocity of 5300 m s−1 and a shear-wavevelocity of 2990 m s−1. The P-wave velocity decreases with in-creasing CO2 content, significantly for small amounts of CO2, butwith only a small variation for more than 20 per cent CO2 satu-ration. As the shear modulus is constant, only the density causeschanges in the shear-wave velocities, consequently, as the densitydecreases for increasing CO2 content, the shear-wave velocities in-crease only slightly—less than 0.5 per cent at most, and on aver-age 0.13 per cent at 17 MPa pore-fluid pressure. This change istoo small to be resolved in surface seismic data. Fig. 6 shows thatthere are only minor changes to be expected owing to the change insaturation.
Note that Jack (1998) classifies dolomite as a hard rock that is gen-erally not suitable for time-lapse seismic studies. When the poros-ity is low, the fluid contents have only a minor influence on theelastic moduli. The input isotropic P-wave velocities to the pressuremodelling are 5300 m s−1 for the original saturation and 5240 m s−1
after CO2 injection. The shear-wave velocity remains practicallyconstant at 2990 m s−1 and the density is 2.65 g cm−3. An overviewof the rock parameters before and after CO2 injection is given inTable 2. The elastic constants for these two isotropic, fluid-saturatedrocks form the input for APE modelling where the effects of pres-sure changes are investigated and combined with the saturationchanges.
C© 2002 RAS, GJI, 149, 267–280
by guest on February 2, 2016http://gji.oxfordjournals.org/
Dow
nloaded from
Modelling/predicting fluid injection 273
Figure 4. Polarization directions of the overburden for (a) the pre-CO2 and (b) the post-CO2 surveys. Directions are in degrees and relative to the naturalcoordinate system 118◦–28◦. The injection well is indicated and each gridpoint is one CMP location.
Figure 5. Polarization directions of the San Andres interval after layer stripping for (a) the pre-CO2 and (b) the post-CO2 surveys. Values are in degreesand relative to the natural coordinate system 118◦–28◦.
C© 2002 RAS, GJI, 149, 267–280
by guest on February 2, 2016http://gji.oxfordjournals.org/
Dow
nloaded from

274 E. Angerer et al.
Figure 6. (a) P- and (b) S-wave velocities of the San Andres formation forvarying CO2 content and for two pore-fluid pressures.
The model does not include cracks with very low aspect ratiosof less than 0.001. The reason for this is that these very thin cracksdetermine the soft or compliant porosity and respond to pressurechanges. They are not randomly distributed in the presence of differ-ential stresses, but tend to be aligned perpendicular to the minimumstress direction, and are the cause for the observed shear-wave split-ting. The pore-fluid change in these compliant cracks is incorporatedin APE modelling.
The parameters for APE modelling are five pressures, the crackgeometry of the formation in an unstressed condition and pore-fluidparameters. These (average) pressures are the vertical overburdenpressure, the minimum horizontal stress, the maximum horizontal
Table 2. Overview of changes in the isotropic reservoirrock properties of the San Andres formation when CO2 isinjected (Phase VI).
Rock property Reservoir rock
Original at Injected CO2
10.6 MPa at 17 MPa
Fluid density (g cm−3) 1.06 1Rock density (g cm−3) 2.65 2.64Fluid bulk modulus (GPa) 2.5 0.6Rock bulk modulus (GPa) 43 41Rock shear modulus (GPa) 23.7 23.7P-wave velocity (m s−1) 5300 5240S-wave velocity (m s−1) 2990 2995
stress, the pore-fluid pressure and the critical stress that is needed toclose a small aspect-ratio crack. The pore-fluid pressure of the tar-get zone, provided by Roche (1997), is the only pressure variable ofthe APE model that changes during the injection process. The pore-fluid pressure increased significantly from a ‘normal’ pressure of10.6 MPa to an ‘overpressure’ of 17 MPa during the CO2 injectionand before production resumed when the second survey was ac-quired. The overburden pressure is 30 MPa. With these three pres-sures given, the other pressure parameters were tested to match theobserved anisotropy change. Only for maximum horizontal stressvalues of 16–18 MPa, close to the pore-fluid pressure of 17 MPa, andminimum horizontal stresses from 0 to 5 MPa can suitable modelsbe created. The critical stress is held constant at 1 MPa. The as-pect ratios that fit the data range from 0.000 01 to 0.001. This is avery wide range and shows that at 0◦ incidence shear-wave splittingis not particularly sensitive to aspect ratios. The resulting P-waveand shear-wave velocities of the model incorporating saturation andpressure changes are summarized in Table 3 for normal incidencerays.
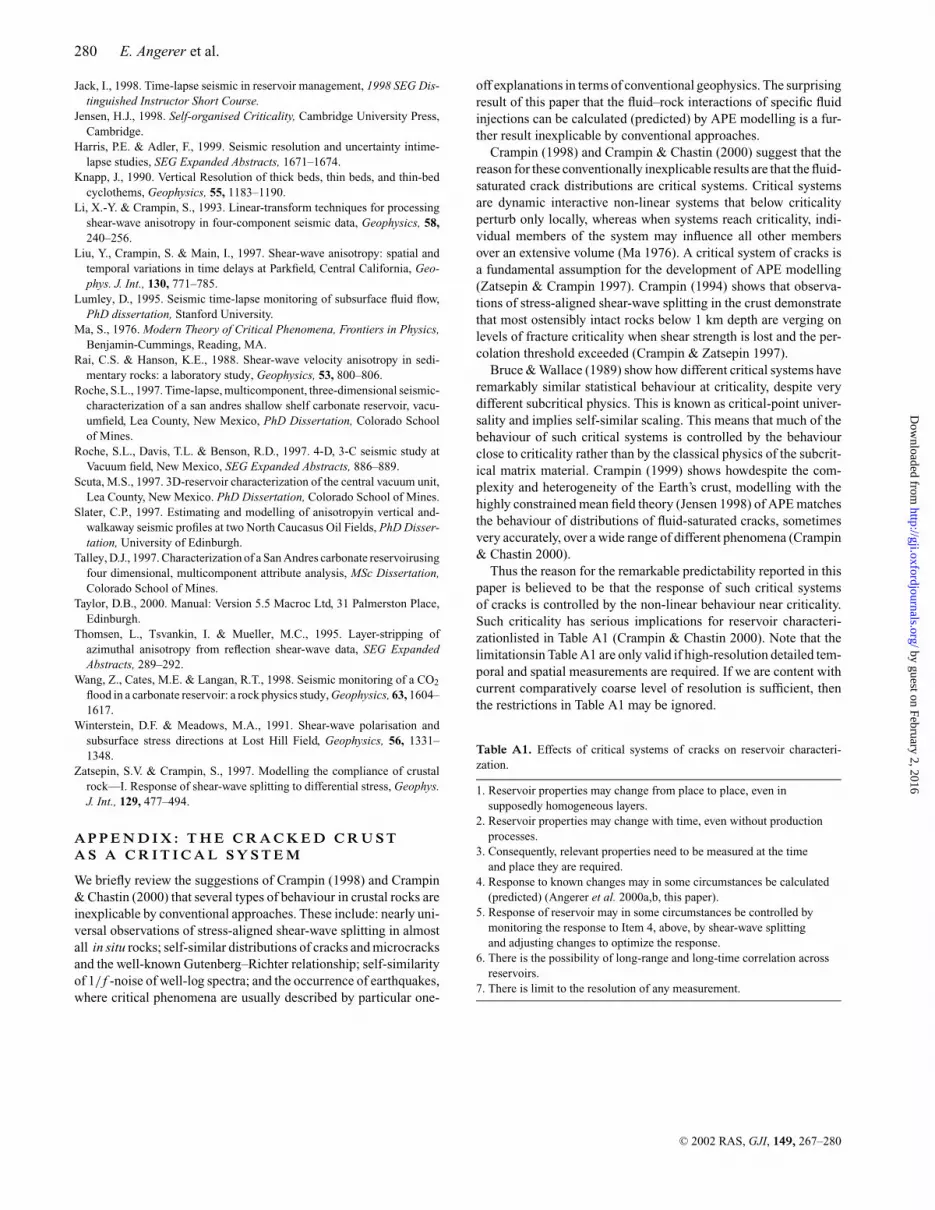
The distribution of cracks in an unstressed state, or the total num-ber of existing cracks, was derived from a shear-wave coherenceanalysis of the reservoir interval (Talley 1997), see Fig. 7. To thesouth of the injection well there are two zones of low coherence,which are interpreted as NS and N60◦E trending faults. The faultscorrelate with the shear-wave velocity difference in Fig. 3(c). Fault-related, vertical cracks are therefore introduced into the APE model.The cracks are scattered within ±10◦ of the given directions. Thisrange agrees with field observations of fault-related crack distri-butions (Anders & Wiltschko 1994) that normally range between±(5◦–20◦) of the fault direction. In the 1980s, well CVU-97 hadalso undergone several stages of acid injection. This may havecreated additional fractures in the vicinity of the well with a possi-ble preferential alignment parallel to existing faults. Acid fracturescan be reopened whenever the pore-fluid pressure is higher than thepressure at the time of the acid injection. Before the CO2 injection,these fault-related cracks are closed but are opened by the high-pressure injection. The modelled total fault-related crack densitiesof each set lies between 0.047 and 0.065. In addition to the two setsof fault-related cracks, 4 per cent randomly oriented cracks were
Table 3. Calculated body-wave velocities for the reservoirincorporating saturation and pressure changes.
Pore-fluid vS1 vS2 vP SWVApressure (MPa) (m s−1) (m s−1) (m s−1) (per cent)
10.6 2955 2915 5285 1.317 2485 2785 5108 −10.7
C© 2002 RAS, GJI, 149, 267–280
by guest on February 2, 2016http://gji.oxfordjournals.org/
Dow
nloaded from
Modelling/predicting fluid injection 275
Figure 7. Shear-wave coherence analysis map of the San Andres interval(Talley 1997). Zones of low coherence appear in black and faults are in-terpreted. To the south of CVU-97 faults with NS and N60◦E occur. Thedistance between CMP locations is 16.75 m.
modelled. The resulting model is a symmetric orthorhombic solu-tion with equal crack densities for each fault and equal separationfrom the minimum stress direction. We also found a wide range ofasymmetric solutions, which are not thought to be relevant, and arenot discussed here.
Fig. 8 represents a horizontal section of a 2-D visualization of thedirection and number of open cracks for both pore-fluid pressures.The APE model is 3-D, but nevertheless these simple 2-D plots arereasonably realistic as most of the open cracks are close to vertical.The vertical stress is the maximum stress and therefore cracks withincidence angles of up to 60◦ with respect to the vertical are closedthroughout. Before injection, only random cracks subparallel to themaximum horizontal stress of 118◦ are open and the anisotropy istherefore positive. After the injection and a significant pore-fluidpressure increase of 6.4 MPa, previously closed cracks now openin all azimuths. This causes body-wave velocities to decrease andthe S1 component, which is parallel to 118◦, is strongly affectedas it decreases from 2955 m s−1 to about 2485 m s−1, which is a16 per cent velocity decrease. The S2 component decreases about
Figure 8. Simplified 2-D model of the number and orientation of opencracks before and after CO2 injection.
4.5 per cent from 2915 to 2785 m s−1 and becomes the fast shearwave. If the pore-fluid remains the same, the P-wave velocity alsomarginally decreases, owing to the pressure increase from 5285 to5205 m s−1 or 5108 m s−1, with and without the saturation changeconsidered. As the cracks are nearly vertical, the maximum effect forthe P waves is expected at high, near-horizontal angles of incidence.Table 3 summarizes the resulting velocities of the APE and satura-tion model.
Synthetic seismograms for this model were calculated usingANISEIS (Taylor 2000) and are matched to the shear-wave data inFig. 9. The model matches the data when the calculated shear-wavevelocities are within ±30 m s−1 of the velocities determined inthe analysis. For the P waves the range is about ±50 m s−1. Bothoverburden and target are modelled by APE. Four reflections arematched, the bottom of the near-surface, the base of the salt, the topof the San Andres, and the base of the San Andres formation. Inter-val times are shown for the San Andres layer. This model gives a verygood match for all components in the target formation as well as theoverburden. The increase in pore-fluid pressure and the resulting dif-ferential opening of cracks adequately explain the observed intervaltime changes in the shear-wave sections. The amplitudes also matchwell for most of the reflections. This match between the data and themodel shows that APE can be used to predict the stress-sensitive be-haviour of shear-wave velocities in hydrocarbon reservoirs. That isAPE predicts the response of the fluid-saturated rocks to changes ofpore-fluid pressure. The APE model also matches the P-wave data.In the saturation modelling, the P-wave velocity of 5300 m s−1
was calculated for the isotropic rock saturated with the formationfluid and a velocity of 5240 m s−1 after CO2 injection. Introducingthe small aspect-ratio cracks reduces the velocity to 5285 m s−1 fora pore-fluid pressure of 10.6 MPa and to 5108 m s−1 at 17 MPaat normal incidence and after the CO2 injection. The total modelledP-wave velocity decrease is therefore 3.3 per cent. It is possible tosplit the velocity decrease into a pressure component and a compo-nent that reflects the pore-fluid compressibility change. The pressureeffect is therefore 5285 − 5205 = 80 m s−1 or 1.5 per cent. WhenCO2 is injected the velocity decreases 5205 − 5108 = 97 m s−1 or1.8 per cent. For normal incidence P waves, the effect of the satu-ration change is larger than the pressure change. From the horizonpicks interval times of 97 and 100 ms result for the pre- and post-CO2 surveys. This is less than two samples difference and lies withinthe picking error of 4 per cent and does not create a significant time-lapse effect. Fig. 10 depicts the fit of the P-wave synthetics to theobserved data. The model is a good fit both in reflection times andamplitudes for all six layers. The top of the San Andres is a weaktrough. The amplitude of the bottom target reflection is well de-fined and increases after the injection, as the impedance contrastincreases owing to the velocity decrease in the target. In the over-burden, the top of the salt is a much stronger reflection at 330 msthan the top salt in shear-wave section at around 1000 ms. In general,the reflection character is very similar in both P-wave sections. Thisagain indicates good repeatability and shows that the CO2 injectionhas little effect on the overburden.
6 P H A S E V I I
In 1998 a second, more widespread CO2 injection programme tookplace in Vacuum Field. Two more time-lapse surveys, one be-fore, and one during the injection were acquired. Variations in theshear-wave source pattern prevent a complete integration of PhasesVI and VII into a single project. After processing and analysingthe data following the method described here, the APE model that
C© 2002 RAS, GJI, 149, 267–280
by guest on February 2, 2016http://gji.oxfordjournals.org/
Dow
nloaded from

276 E. Angerer et al.
Figure 9. Match between stacked shear-wave data (the first five traces of each panel) and the synthetic (the remaining three traces of each panel) for the SanAndres formation and the overburden in the zone of the time-delay anomaly. The interval times in the San Andres are indicated.
had been established for the Phase VI data also matched Phase VIIdata at the chosen location. A small pore-fluid pressure increase of1.4 MPa was estimated during the injection. (Note that this was notenough to cause an overpressure and consequently did not changethe shear-wave polarizations.) The fit of the synthetic data to the realdata is shown in Fig. 11 for the shear waves and in Fig. 12 for theP waves. The S1 velocity change is below resolution. The S2 and
P-wave velocities decrease less than 2 per cent. The polarizationdirections of the shear waves remain unchanged as the pore-fluidpressure increases were below overpressures. This example showsthat it is possible to predict the response of a fractured, fluid-filledrock to subsurface stress and pressure changes. It is also possible tocalculate the seismic response, once a well-calibrated APE modelhas been established for the particular location.
C© 2002 RAS, GJI, 149, 267–280
by guest on February 2, 2016http://gji.oxfordjournals.org/
Dow
nloaded from

Modelling/predicting fluid injection 277
Figure 10. Match between stacked P-wave data (the first five traces of each panel) and the synthetic (the remaining three traces of each panel) for the SanAndres formation and the overburden in the zone of the time-delay anomaly. The interval times in the San Andres are indicated.
7 C O N C L U S I O N S
This paper reports an applied reservoir study where time-lapsemulticomponent seismic data are processed, analysed, interpreted,modelled and the response for known fluid-injection pressures pre-dicted, in an integrated fluid monitoring exercise. Despite the lim-itations in data quality this study identifies significant time-lapsevelocity effects in normal-incidence waves leading to changes inshear-wave velocity anisotropy. Although the reservoir rock inVacuum Field, the San Andres dolomite, is a comparatively hardrock, time-lapse effects occur, due to pressure-dependent changesin crack aspect ratios as injection modifies pore-fluid pressures,and to 90◦-flips in shear-wave polarizations when overpressures areinduced.
Synthetic seismograms based on poro-elastic models, developedby Endres & Knight (1997) and Zatsepin & Crampin (1997), that in-corporate saturation and pressure changes are successfully matchedwith the real data in the vicinity of the central well CVU-97 beforeand after the injected changes. The effect of changing saturation is a1.8 per cent velocity decrease in P-wave velocity but with no changein shear-wave velocity. The effect of the high injected pressure is afurther 1.5 per cent decrease in P-wave velocity, and very signifi-cant changes in shear-wave velocity anisotropy due entirely to thepore-fluid pressure increasing crack aspect ratios. With this modelit is possible to predict the seismic response of hydrocarbon produc-tion operations, and this procedure is the first really comprehensivecalibration of in situ APE modelling.
Observations
There are three main observations for the Phase VI data set. (ThePhase VII data set gives low-pressure results, compatible withPhase VI, but is not described in detail here.)
(1) The absolute value of shear-wave velocity anisotropy changesfrom an average of 2.2 per cent, to −8 per cent after high-pressureCO2 injection in the reservoir to the S and SE of the injection well,where the negative anisotropy represents a change in the polarizationof the faster split shear wave. This zone correlates with zones of lowseismic coherence, indicating the presence of aligned faults andfractures.
(2) After CO2 injection the shear-wave polarities are inter-changed as the shear wave parallel to the maximum stress directionbecomes the slow wave and the shear wave perpendicular to themaximum stress becomes the fast wave.
(3) Near-vertical P-wave velocities also decrease on injectionby 3 per cent, which is about one-third decreasing the shear-wavevelocities.
Main conclusions
(1) The pore-fluid pressure increases cause the differential open-ing of cracks and low-aspect-ratio pores, which leads to decreasesin all body-wave velocities. The shear-wave velocities decrease dif-ferentially and a significant variation in the degree of shear-wavevelocity anisotropy is observed.
C© 2002 RAS, GJI, 149, 267–280
by guest on February 2, 2016http://gji.oxfordjournals.org/
Dow
nloaded from

278 E. Angerer et al.
Figure 11. Match between stacked shear-wave data and APE model for the Phase VII data. The interval times in the San Andres are indicated.
(2) The saturation change caused by injecting CO2 into the reser-voir interval has little effect on the effective elastic properties of thefluid-filled material, even though the compressibility of the CO2
is an order of magnitude smaller than the compressibility of thereservoir fluid.
(3) The principal effect of pressure changes is the preferentialopening and closing of cracks, hence changes from finite to vanish-
ing aspect ratios and vice versa, which causes a change in alignmentand thus anisotropy.
(4) We suggest that it could not be expected from classicalapproaches that the detailed response of reservoir rock to twoknown fluid-injection pressures could be calculated (predicted) byanisotropic poro-elasticity modelling. This behaviour is believed tobe caused by the critical nature of the crack distributions in the crust
C© 2002 RAS, GJI, 149, 267–280
by guest on February 2, 2016http://gji.oxfordjournals.org/
Dow
nloaded from

Modelling/predicting fluid injection 279
Figure 12. Match between stacked P-wave data and APE model for the Phase VII data. The interval times in the San Andres are indicated.
as discussed in the Appendix. The Appendix suggests that the crustas a critical system has profound implications for many standardreservoir characterization procedures.
A C K N O W L E D G M E N T S
The authors would like to thank the Reservoir CharacterizationProject, Colorado School of Mines, for their co-operation and forproviding the seismic data. We thank Macroc Ltd for providing theANISEIS program. Erika Angerer was sponsored by WesternGeco.We are very grateful to Sven Treitel and John Dillon, who re-viewed the paper, and also to Leon Thomsen for their comments andsuggestions that helped to improve the paper. The work of StuartCrampin was partially supported by European Commission ContractNo. EVR-CT1999-40002.
R E F E R E N C E S
Alford, R.M., 1986. Shear data in the presence of azimuthal anisotropy, SEGExpanded Abstracts, 476–479.
Anders, M.H. & Wiltschko, D.V., 1994. Microfracturing palaeostress, andthe growth of faults, J. Struct. Geology, 16, 795–815.
Angerer, E., Crampin, S. & Li, X.-Y., 2000a. Changes in shear waveanisotropy in time-lapse data: a case study, 62nd Conf. EAGE, Glasgow,Extended Abstracts, 1, X-38.
Angerer, E., Crampin, S., Li, X.-Y. & Davis, T.L., 2000. Time-lapse seismicchanges in a CO2 injection process in a fractured reservoir, 70th Ann. Int.SEG Mtg., Calgary, 2, 1532–1535.
Batzle, M. & Wang, Z., 1992. Seismic properties of pore fluids, Geophysics,57, 1396–1408.
Bruce, A. & Wallace, D., 1989. Critical point phenomena: universal physicsat large length scale, in The New Physics, pp. 236–267, ed. Davis, P.,Cambridge University Press, Cambridge.
Capello de Passalacqua, M., 1995. Geology and rock physics of the SanAndres formation in Vacuum Field, New Mexico, MSc Dissertation,Colorado School of Mines.
Crampin, S., 1994. The fracture criticality of crustal rocks, Geophys. J. Int.,118, 428–438.
Crampin, S., 1998. Shear-wave splitting in a critical crust: the next step, inProc. 8th Int. Workshop on Seismic Anisotropy, Boussens, 1998, Rev. Inst.Franc. Pet., 53, 749–763, ed. Rasolofosaon, P.
Crampin, S., 1999. Calculable fluid-rock interactions, J. geol. Soc., 156,501–514.
Crampin, S. & Chastin, S., 2000. Shear-wave splitting in a critical crust: II—compliant, calculable, controllable fluid-rock interactions, in Anisotropy2000, Fractures converted waves and case studies, Proc. 9th Int. Workshopon Seismic Anisotropy, Cape Allen 2000, eds Ikelle, L.T. & Gangi, T.
Crampin, S. & Zatsepin, S.V., 1997. Modelling the compliance of crustal-rock, II—response to temporal changes before earthquakes, Geophys. J.Int., 129, 495–506.
Crampin, S., Zatsepin, S.V., Slater, C. & Brodov, L.Y., 1996. Abnormalshear-wave polarizations as indicators of pressures and over pressures,58th Conf. EAGE, Amsterdam, Extended Abstracts, X038.
Crampin, S., Volti, T. & Stefansson, R., 1999. A successfully stress-forecastearthquake, Geophys, J. Int., 138, F1–F5.
Davis, T.L., Benson, R.D., Roche, S.L. & Talley, D., 1997. 4-D 3-C seismol-ogy and dynamic reservoir characterization—a geophysical renaissance,67th Ann. Int. SEG Meeting, Dallas, Expanded Abstracts 1997, 1, 880–882; see also 883–885 and 886–889.
Duerrast, H. & Siegesmund, S., 1999. Correlation between rock fabricsandphysical properties of carbonate rocks, Int. J. Earth Sci., 88, 392–408.
Endres, A.L. & Knight, R.J., 1997. Incorporating pore geometry and fluidpressure communication into modelling the elastic behaviour of porous-rocks, Geophysics, 62, 106–117.
Gaiser, J.E., 1999. Applications for vector coordinate systems of 3-D con-verted wave data.
Gassmann, F., 1957. Uber die Elastizitat poroser Medien, Z. Naturf., 96,1–24.
C© 2002 RAS, GJI, 149, 267–280
by guest on February 2, 2016http://gji.oxfordjournals.org/
Dow
nloaded from
280 E. Angerer et al.
Jack, I., 1998. Time-lapse seismic in reservoir management, 1998 SEG Dis-tinguished Instructor Short Course.
Jensen, H.J., 1998. Self-organised Criticality, Cambridge University Press,Cambridge.
Harris, P.E. & Adler, F., 1999. Seismic resolution and uncertainty intime-lapse studies, SEG Expanded Abstracts, 1671–1674.
Knapp, J., 1990. Vertical Resolution of thick beds, thin beds, and thin-bedcyclothems, Geophysics, 55, 1183–1190.
Li, X.-Y. & Crampin, S., 1993. Linear-transform techniques for processingshear-wave anisotropy in four-component seismic data, Geophysics, 58,240–256.
Liu, Y., Crampin, S. & Main, I., 1997. Shear-wave anisotropy: spatial andtemporal variations in time delays at Parkfield, Central California, Geo-phys. J. Int., 130, 771–785.
Lumley, D., 1995. Seismic time-lapse monitoring of subsurface fluid flow,PhD dissertation, Stanford University.
Ma, S., 1976. Modern Theory of Critical Phenomena, Frontiers in Physics,Benjamin-Cummings, Reading, MA.
Rai, C.S. & Hanson, K.E., 1988. Shear-wave velocity anisotropy in sedi-mentary rocks: a laboratory study, Geophysics, 53, 800–806.
Roche, S.L., 1997. Time-lapse, multicomponent, three-dimensional seismic-characterization of a san andres shallow shelf carbonate reservoir, vacu-umfield, Lea County, New Mexico, PhD Dissertation, Colorado Schoolof Mines.
Roche, S.L., Davis, T.L. & Benson, R.D., 1997. 4-D, 3-C seismic study atVacuum field, New Mexico, SEG Expanded Abstracts, 886–889.
Scuta, M.S., 1997. 3D-reservoir characterization of the central vacuum unit,Lea County, New Mexico. PhD Dissertation, Colorado School of Mines.
Slater, C.P., 1997. Estimating and modelling of anisotropyin vertical and-walkaway seismic profiles at two North Caucasus Oil Fields, PhD Disser-tation, University of Edinburgh.
Talley, D.J., 1997. Characterization of a San Andres carbonate reservoirusingfour dimensional, multicomponent attribute analysis, MSc Dissertation,Colorado School of Mines.
Taylor, D.B., 2000. Manual: Version 5.5 Macroc Ltd, 31 Palmerston Place,Edinburgh.
Thomsen, L., Tsvankin, I. & Mueller, M.C., 1995. Layer-stripping ofazimuthal anisotropy from reflection shear-wave data, SEG ExpandedAbstracts, 289–292.
Wang, Z., Cates, M.E. & Langan, R.T., 1998. Seismic monitoring of a CO2
flood in a carbonate reservoir: a rock physics study, Geophysics, 63, 1604–1617.
Winterstein, D.F. & Meadows, M.A., 1991. Shear-wave polarisation andsubsurface stress directions at Lost Hill Field, Geophysics, 56, 1331–1348.
Zatsepin, S.V. & Crampin, S., 1997. Modelling the compliance of crustalrock—I. Response of shear-wave splitting to differential stress, Geophys.J. Int., 129, 477–494.
A P P E N D I X : T H E C R A C K E D C R U S TA S A C R I T I C A L S Y S T E M
We briefly review the suggestions of Crampin (1998) and Crampin& Chastin (2000) that several types of behaviour in crustal rocks areinexplicable by conventional approaches. These include: nearly uni-versal observations of stress-aligned shear-wave splitting in almostall in situ rocks; self-similar distributions of cracks and microcracksand the well-known Gutenberg–Richter relationship; self-similarityof 1/ f -noise of well-log spectra; and the occurrence of earthquakes,where critical phenomena are usually described by particular one-
off explanations in terms of conventional geophysics. The surprisingresult of this paper that the fluid–rock interactions of specific fluidinjections can be calculated (predicted) by APE modelling is a fur-ther result inexplicable by conventional approaches.
Crampin (1998) and Crampin & Chastin (2000) suggest that thereason for these conventionally inexplicable results are that the fluid-saturated crack distributions are critical systems. Critical systemsare dynamic interactive non-linear systems that below criticalityperturb only locally, whereas when systems reach criticality, indi-vidual members of the system may influence all other membersover an extensive volume (Ma 1976). A critical system of cracks isa fundamental assumption for the development of APE modelling(Zatsepin & Crampin 1997). Crampin (1994) shows that observa-tions of stress-aligned shear-wave splitting in the crust demonstratethat most ostensibly intact rocks below 1 km depth are verging onlevels of fracture criticality when shear strength is lost and the per-colation threshold exceeded (Crampin & Zatsepin 1997).
Bruce & Wallace (1989) show how different critical systems haveremarkably similar statistical behaviour at criticality, despite verydifferent subcritical physics. This is known as critical-point univer-sality and implies self-similar scaling. This means that much of thebehaviour of such critical systems is controlled by the behaviourclose to criticality rather than by the classical physics of the subcrit-ical matrix material. Crampin (1999) shows howdespite the com-plexity and heterogeneity of the Earth’s crust, modelling with thehighly constrained mean field theory (Jensen 1998) of APE matchesthe behaviour of distributions of fluid-saturated cracks, sometimesvery accurately, over a wide range of different phenomena (Crampin& Chastin 2000).
Thus the reason for the remarkable predictability reported in thispaper is believed to be that the response of such critical systemsof cracks is controlled by the non-linear behaviour near criticality.Such criticality has serious implications for reservoir characteri-zationlisted in Table A1 (Crampin & Chastin 2000). Note that thelimitationsin Table A1 are only valid if high-resolution detailed tem-poral and spatial measurements are required. If we are content withcurrent comparatively coarse level of resolution is sufficient, thenthe restrictions in Table A1 may be ignored.
Table A1. Effects of critical systems of cracks on reservoir characteri-zation.
1. Reservoir properties may change from place to place, even insupposedly homogeneous layers.
2. Reservoir properties may change with time, even without productionprocesses.
3. Consequently, relevant properties need to be measured at the timeand place they are required.
4. Response to known changes may in some circumstances be calculated(predicted) (Angerer et al. 2000a,b, this paper).
5. Response of reservoir may in some circumstances be controlled bymonitoring the response to Item 4, above, by shear-wave splittingand adjusting changes to optimize the response.
6. There is the possibility of long-range and long-time correlation acrossreservoirs.
7. There is limit to the resolution of any measurement.
C© 2002 RAS, GJI, 149, 267–280
by guest on February 2, 2016http://gji.oxfordjournals.org/
Dow
nloaded from


