Embed Size (px)
Citation preview

ENVIRONMENTAL BIOTECHNOLOGY
Production of hydrogen from domestic wastewaterin a pilot-scale microbial electrolysis cell
E. S. Heidrich & J. Dolfing & K. Scott & S. R. Edwards &
C. Jones & T. P. Curtis
Received: 19 July 2012 /Revised: 11 September 2012 /Accepted: 19 September 2012 /Published online: 6 October 2012#
Abstract Addressing the need to recover energy from thetreatment of domestic wastewater, a 120-L microbial electrol-ysis cell was operated on site in Northern England, using rawdomestic wastewater to produce virtually pure hydrogen gas(100±6.4 %) for a period of over 3 months. The volumetricloading rate was 0.14 kg of chemical oxygen demand (COD)per cubic metre per day, just below the typical loading rates foractivated sludge of 0.2–2 kgCODm−3day−1, at an energeticcost of 2.3 kJ/gCOD, which is below the values for activatedsludge 2.5–7.2 kJ/gCOD. The reactor produced an equivalentof 0.015 LH2L
−1day−1, and recovered around 70 % of theelectrical energy input with a coulombic efficiency of 55 %.Although the reactor did not reach the breakeven point of100 % electrical energy recovery and COD removal waslimited, improved hydrogen capture and reactor design couldincrease the performance levels substantially. Importantly, forthe first time, a ‘proof of concept’ has been made, showingthat this technology is capable of energy capture as hydrogengas from low strength domestic wastewaters at ambienttemperatures.
Keywords Microbial electrolysis cell . Hydrogen .
Wastewater . Energy
Introduction
In an era of increasing energy costs and environmentalawareness, wastewater treatment industries need to look atalternative treatment options to reduce their net energyexpenditure. It has been estimated that domestic wastewateralone may contain 17.8 kJ/g of chemical oxygen demand(COD) of energy (Heidrich et al. 2011). There is an increas-ingly urgent need to recover some of this energy, or at thevery least not expend additional energy on treatment; theactivated sludge process uses 2.5–7.2 kJ/gCOD (Pant et al.2011). Energy recovery could be achieved through anaero-bic digestion to methane gas or microbial fuel cell technol-ogy directly to electricity; however, life cycle assessmenthas shown that the production of a higher value productthrough the suite of bioelectrochemical systems may be themost viable solution (Foley et al. 2010). One such technol-ogy is the production of hydrogen in a microbial electrolysiscell (MEC) (Rozendal et al. 2006).
Since the MEC process was first reported (Liu et al.2005; Rozendal et al. 2006), MECs have emerged as apotential option for a new generation of wastewater treat-ment systems (Rozendal et al. 2008a; Foley et al. 2010; Ohet al. 2010). In an MEC, bacteria use the energy stored in theorganic compounds to metabolise and grow, donating elec-trons to an electrode which then travel in a circuit to thecathode producing current (Rozendal et al. 2006; Logan2009). Oxygen is excluded from the cathode, and additionalpower is supplied to the circuit allowing endergonic reac-tions to take place, generating products such as hydrogengas (Liu et al. 2005) and hydrogen peroxide (Rozendal et al.2009). The added potential at the cathode must overcomethe overpotentials in the system and supply the additionalenergy needed for the reaction to proceed. For example, toconvert acetate into hydrogen in a microbial electrolysis, thetheoretical voltage required is 0.14 V, in practice between0.4 and 0.9 V are needed (Logan 2008).
E. S. Heidrich (*) : J. Dolfing : S. R. Edwards : T. P. CurtisSchool of Civil Engineering and Geosciences, NewcastleUniversity,Newcastle upon Tyne NE1 7RU, UKe-mail: [email protected]
K. ScottSchool of Chemical Engineering and Advanced Materials,Newcastle University,Newcastle upon Tyne NE1 7RU, UK
C. JonesNorthumbrian Water Ltd.,Durham DH1 5FJ, UK
Appl Microbiol Biotechnol (2013) 97:6979–6989DOI 10.1007/s00253-012-4456-7
Springer-Verlag Berlin Heidelberg 2012

There are many hurdles to overcome if microbial fuel celltechnologies are to offer a sustainable future for wastewatertreatment (Pant et al. 2012). Progress is being made withnew reactor design (Call and Logan 2008; Rozendal et al.2008b; Cheng and Logan 2011; Wang et al. 2011), im-proved materials (Cheng et al. 2006; Cheng and Logan2008; Zhang et al. 2010; Fan et al. 2011; Sleutels et al.2011; Zhang et al. 2011), greater understanding of theelectrochemical mechanisms involved (Aelterman et al.2008; Clauwaert et al. 2008; Wang et al. 2010; Aboutalebiet al. 2011; Kiely et al. 2011a; Villano et al. 2011) and evenimproved understanding of the microbes that are at work inthese systems (Holmes et al. 2004; Kim et al. 2004; Rabaeyet al. 2004; Lovley 2008; Bretschger et al. 2010; Kiely et al.2011b; Lu et al. 2011; Villano et al. 2011). Many problemshave been overcome, such as using multi electrode systems(Rader and Logan 2010) and finding a low-cost alternativeto the platinum cathode (Zhang et al. 2010). However, mostof this research is performed at laboratory scale, usingsimple substrates, often at a controlled warm temperature.Although of great value in improving our understanding ofMECs, these studies do not tell us about the challenges oreven benefits of running such systems at a larger scale withreal wastewaters in temperate climates. There is a need todemonstrate that these systems can work at a larger scaleand under realistic conditions, elevating the technologyfrom a laboratory curiosity into a practical solution to aglobal environmental problem.
The only previous published pilot-scale MEC study todate is by Cusick et al. (2011) using a 1,000-L pilot-scalereactor run on winery wastewater in California. The reactorproved slow to start up, with pH and temperature controlbeing problematic. When these issues were corrected byheating to 31 °C, controlling the pH and adding acetic acid,the reactor did improve in performance in terms of currentgeneration; however, CH4 rather than H2 was produced.Calculations indicated the CH4 production was likely to beindependent of the current generation. The energy content ofthe CH4 formed during the operation exceeded the input ofelectrical energy (heating not included), but only traceamounts of hydrogen were measured. Methane productionwas attributed to the reactor being membraneless, allowinghydrogen produced at the cathode to be directly consumedby hydrogenotrophic methanogens within the reactor(Cusick et al. 2011). The study has provided valuableinsights into the operation of MECs; however, it has notprovided a proof of concept that real, un-supplementedwastewaters can be used to produce H2 gas at ambienttemperature.
To test whether MEC systems have a chance of achievingthese goals under realistic conditions, a pilot-scale 120-Lreactor was placed on a wastewater treatment site in NorthEast England. This site takes in primarily domestic wastewater
with an average influent total COD of 450 mg/L. The reactorwas built using low-cost alternatives to the standard lab mate-rials used for the cathode and membrane. It was run oninfluent domestic wastewater which after the initial acclima-tisation period was not supplemented with acetate, or pHcontrolled. The reactor was not heated, held inside a largeunheated building, and run throughout a UK spring and sum-mer (5–20 °C minimum and maximum temperatures) and isstill in operation at the time of writing this paper. Theseoperating conditions are likely therefore to represent close toa worst case scenario, i.e. low-concentration feed, non-optimalcomponents, no heating and no additional supplement ofacetate or buffering capacity. The aim of this study was toestablish reactor operation, forming a proof of concept for thistechnology.
Materials and methods
Field site
The pilot-scale reactor was set up and run at Howdonwastewater treatment site, Northumbrian Water Ltd, situatedin the city of Newcastle Upon-Tyne in the North East ofEngland (54°58′N, 01°36′W). An average of 246,500 m3 ofdomestic wastewater is treated daily at this site using96 MWh; the activated sludge process uses around 60 %of this. The wastewater used in the MEC was taken from thegrit channels after primary screening but before settling.
MEC reactor
The reactor was based on a cassette style design, with sixidentical cassettes being placed into a rectangular polypro-pylene tank with a total working volume of 120 L as shownin Fig. 1. The tank has a Perspex plate fitted over the liquidlayer giving a small head room to the anode compartment of2.2 L. Each of the cathode gas tubes from the cassettesprojected above this Perspex sheet. The cassettes were setalong alternate sides of the reactor to allow S-shaped flowand, once in place, gave a final anode volume of 88 L.
Each cassette was constructed using 10-mm-thick plasticsheeting and consisted of an internal cathode section of0.280×0.200×0.048 m deep, with a volume of 2.6 L. Thecathode section was filled with 50 mM pH7 phosphatebuffer which was not replenished during the course of thetrial. The cathode material was stainless steel wire woolgrade 1 (Merlin, UK), 20 g was used in each cathode, givinga projected cathode surface area for each electrode of0.056 m2. A 0.8-m length of stainless steel wire was woundseveral times into the wire wool to make a firm electricalconnection and then to the outside of the cell. Each cathodeelectrical assembly had an internal resistance from the
6980 Appl Microbiol Biotechnol (2013) 97:6979–6989

extremities of the wire wool to the end of the exposed wireof less than 2.75 Ω. The cathode was separated using amembrane wrapped around a plastic frame inserted intothe electrode assembly on both sides. The membrane usedwas RhinoHide (Entek Ltd., UK), a durable low-cost micro-porous membrane typically used as a battery separator. Theanode material was a sheet of carbon felt (Olmec Ad-vanced Materials Ltd., UK), 0.2 m wide by 0.3 m highand 10 mm thick. This was sandwiched between twosheets of stainless steel mesh acting as a current collec-tor. The anode assemblies were also connected by a 0.8-m length of stainless steel wire fed through the centreof the felt material, each electrode having an internalresistance less than 3.4Ω. This electrode assembly is shown inFig. 2. This gave an anode electrode surface area to reactorvolume ratio of 16.4 m2/m3.
The total material cost of the reactor, not includingpumps, power supply and data logging instruments, wasequivalent to £2,344/m3, of which the cathode and mem-brane combined represented less than 2 %.
The reactor was situated on site in a large unheatedbuilding housing the grit channels seen in Fig. 3. Duringoperation, a peristaltic pump (Watson Marlow 520S, Watsonand Marlow, UK) was used to pump water into a prelimi-nary storage tank providing some primary settling. Thewastewater then flowed from the top of the settling tank intobottom of the reactor, through the reactor in an S-like flow andback out to the grit channels. The wastewater was pumped at arate to give a hydraulic retention time (HRT) of 1 day. Twosmall polypropylene sampling vessels, 0.5 L in size and fittedwith dissolved oxygen (DO), pH and temperature probes,were placed one between the settling tank and main reactor,
(d) (e) (d) (c) (a) (b) (c) (d) (e) (d)
(f)
Fig. 1 Schematic diagram ofthe reactor module components:a PVC outer frame, b wire woolcathode, c Rhinohidemembrane fixed around a PVCframe, d stainless steel wiremesh and e anode with wiremesh current collector. Thesecomponents fit together to forma single module (f), and six ofthese go into the reactor vesselwhere wastewater flows aroundthem. Gas is collected throughtubing into a gas bag
Appl Microbiol Biotechnol (2013) 97:6979–6989 6981

the other at the effluent of the reactor. All wastewater sampleswere taken from these sampling vessels.
The gas production from the anode compartment wascaptured from the ports in the Perspex lid, using 3 mm IDPVC tubing (VWR Jencons, UK). The cathode gas wasinitially captured using 4-mm annealed copper gas chro-matograph (GC) tubing connected to each cathode compart-ment using copper compression fittings, (Hamilton GasProducts Ltd, Northern Ireland), but due to rapid corrosion,this was later replaced by 3 mm ID PVC tubing (VWR,UK). Both pipelines contained a gas sampling port.
Analytical procedures
Power was provided to the electrodes using a PSM 2/2Apower supply (Caltek Industrial Ltd., Hong Kong); thevoltage of each cassette was monitored across a 0.1 ΩMulti-comp Resistor (Farnell Ltd., UK) using a Pico AC-16 DataLogger (Pico Technology, UK) and recorded on a computerevery 30 min.
In both the influent settling tank and the effluent tank, theDO and pH were measured using pH and DO submersionprobes (Broadley James Corporation, USA) connected to apH DO transmitter (Model 30, Broadley James Corporation,USA), feeding an electrical output to a Pico EL 037 Con-verter and Pico EL 005 Enviromon Data Logger (Pico
Technology, UK). The pH and DO data were recorded ontothe computer every 30 min, and the probes were re-calibrated weekly. Temperature was logged using 3 EL-USB-TC Thermocouple data loggers (Lascar Electronics,UK) placed in the settling tank, effluent sampling vesseland the reactor itself.
The gas pipelines were connected to optical gas bubblecounters (made ‘in-house’ at Newcastle University), givinga measurement of gas volume. The operation of these coun-ters failed after several weeks of operation. They werereplaced with 1 L and then 5 L Tedlar gas bags (SigmaAldrich, U.K.); the volume of gas was then measured byremoval from the bags initially using a 100-ml borosilicateglass syringe and then using a larger 1-L gas tight syringe(both SGE Analytical Science, Australia). The samplingports on each pipeline were initially used to take a duplicatesamples of cathode gas three times a week, into a 3-mlLabco Evacuated Exetainer (Labco Ltd, UK). Once gasproduction had risen to a higher volume, 2 L of the cathodegas was dispensed from the collecting gas bag into another5-L gas bag which was taken away for analysis. Anode gaswas not measured volumetrically due to leakage but wassampled directly from the anode compartment into a 3-mlexetainers for compositional analysis.
Hydrogen gas was measured using a Membrane InletMass Spectrometer (MIMS, Hiden Analytical, Warrington,UK) using duplicate injections, set against a three pointcalibration made with a range of calibration standards (Sci-entific Technical Gases, UK). These gas measurements wereverified using a Trace Ultra GC with a thermal conductiondetector and a Restek Micropacked 2 m Shincarbon columnusing argon as the carrier gas (Thermo Scientific, USA) alsowith a three-point calibration, both measurements were con-cordant with each other. The oxygen concentration of theanode headspace was also measured using both of theseinstruments. Methane produced was quantified using a SRI8610C GC FID with methaniser, with hydrogen as thecarrier gas (SRI Instruments, USA) using the same calibra-tion approach described above. All measurements for anodeand cathode gas were completed using a 100-μl gas tightsyringe (SGE Analytical Science, Australia).
a b c dFig. 2 Photographs of theelectrode assembly: a PVCouter frame, b wire woolcathode, c Rhinohidemembrane and d anode withwire mesh current collector
Fig. 3 Photograph of the reactor in situ at Howden wastewater treat-ment site
6982 Appl Microbiol Biotechnol (2013) 97:6979–6989

To ensure accuracy, calibration standards used for the gasmeasurements were injected into a Labco evacuated exetainersin the laboratory at the same time (±10 min) as the samplestaken in the field. Tests carried out previously had indicated thatthese containers were not completely gas tight especially forhydrogen. This procedure did not have to be carried out for thecathode gas once operation had been switched to gas bags.
Liquid samples of the influent and effluent were takenthree times a week. The total chemical oxygen demand(COD) and soluble chemical oxygen demand (SCOD) weremeasured in duplicate using Spectroquant COD test kits(25–1,500 mg/L range, Merck & Co. Inc., USA). Volatilefatty acids (VFAs) were determined using an Ion Chromato-graph (IC) Dionex ICS-1000, with an Ionpack ICE ASIcolumn, and heptafluorobutyric acid as the eluent and tetra-butylammonium hydroxide as the regenerant. Anions weremeasured using an IC Dionex ICS-1000, with an IonpackAS 14A column, with carbonate as the eluent. The conduc-tivity of the solution was measured using a conductivitymetre, EC 300 (VWR Ltd., UK).
Reactor control
To eliminate the possibility that hydrogen could be producedabiotically at the voltages applied, a control was run a usingsmall laboratory tubular double chamber PVC reactor with avolume of 78 mL in each chamber. The same electrode materi-als and resistor, similar electrode spacing and the same waste-water at the anode were used as in the larger reactor, although itis likely that the internal resistance of this reactor was lowerthan the large reactor as the wires were shorter. Once assem-bled, and before any biofilm could have developed on theanode, a voltage of 0.7 volts was applied using a regulatedDC power supply PSM 2/2A, (CALTEK, Hong Kong), thePico AC-16 Data Logger (Pico Technology, UK), and recordedon a computer every minute. This voltage was maintained for30 min and then the voltage increased by 0.2 V for a further30 min; this was continued until gas bubbles began to begenerated at the cathode. The cathode gas was sampled andits hydrogen content measured on the GC as described above.
Start-up and operation
The reactor was initially started up in batch mode, allowing allthe oxygen, nitrates and sulphates within the wastewater to beconsumed. Based on the lessons learnt from the previous pilotstudy (Cusick et al. 2011), the wastewater was supplementedwith acetate at a concentration of 0.5 g/L. The applied voltageinitially of 0.6 V was provided by a regulated DC powersupply PSM 2/2A (CALTEK, Hong Kong). The dosing wasrepeated and the reactor refilled after a 2-week period and leftin batch mode for 30 days, during which time, no gas produc-tion was observed. The reactor was then operated as
continuous flow with an HRT of 1 day, also at 0.6 V for afurther 10 days, and the voltage was then increased to 0.9 V. Itwas run at this voltage for 24 days and then finally the voltageincreased to 1.1 V and run for 85 days.
Efficiency calculations
Four efficiency calculations are made in this study on thebasis of the electrical and substrate energy used (Logan2008).
1. Electrical energy recovery (ηE)—energy recovery is theamount of electrical energy put into the reactor that isrecovered as hydrogen.
The electrical energy input WE is calculated as:
WE ¼Xn
1IEps$� I2Rex$t� � ð1Þ
where I is the current calculated for the circuit based on themeasured voltage E and external resistor Rex (I0E/Rex), and Epsis the applied voltage of the power supply, this value is adjustedfor the losses caused by the external resistor (I2Rex), which inreality are negligible. The time increment denoted by Δt repre-sents the conversion of samples taken every 30 min into sec-onds. The data are summed for all six cells over the each batchcycle. The output of energy (Wout) is calculated from themeasured moles of hydrogen produced NH2 and the standardhigher heating value of hydrogen of 285.83 kJ/mol ΔHH2.
Wout ¼ $HH2NH2 ð2ÞThe higher heating value is chosen over the lower heating
value which takes into account the heat lost through theproduction of water vapour during burning. It is expectedthat this H2 product would be used either as a commercialproduct for industry or in a clean H2 consuming fuel cell tocreate electricity, not for combustion. Methane could also beadded to this value to further increase the quantity of outputenergy but was not included for these same reasons. Elec-trical energy recovery (ηE) (excluding pump requirements)can then be calculated as follows:
ηE ¼ Wout
WEð3Þ
2. Total energy efficiency (ηE+S)—the amount of inputenergy both electrical and substrate that is recoveredas hydrogen.
The substrate energy (WS) is calculated as
WS ¼ $CODΔHww COD= ð4Þwhere ΔCOD is the change in COD in grammes, estimatedas the difference in COD of the influent and effluent at the
Appl Microbiol Biotechnol (2013) 97:6979–6989 6983
end of each batch, and ΔHww/COD is the energy content pergramme of COD as measured on similar domestic wastewa-ter of 17.8 kJ/gCOD (Heidrich et al. 2011). Total energyefficiency is then calculated as:
ηEþS ¼ Wout
WE þWSð5Þ
3. Coulombic efficiency (CE)—the amount of hydrogen pro-duced compared to the amount theoretically possible basedon the current or total charge passing through the cell.
Theoretical hydrogen production based on current (NCE)is calculated as:
NCE ¼Pn
1 I$t
2Fð6Þ
where I is the current calculated from the measure voltage andΔt is the conversion of the time interval 30 min to 1 s to givecoulombs per data sample; this is then summed over the sixcells for the whole batch and divided by Faradays constant (F)(96,485 coulombs/mol e−) multiplied by 2 to give moles ofH2. Coulombic efficiency CE is then calculated as:
CE ¼ NCE
NH2ð7Þ
4. Substrate efficiency—the amount of hydrogen producedcompared to the amount theoretically possible based onsubstrate removed in the reactor.
Theoretical hydrogen production based on substrate re-moval (NS) is calculated as:
NS ¼ 0:0625$COD$t ð8ÞAs 64 gCOD can be converted to 4 mol H2, each gramme
of COD is equivalent to 0.0625 mol H2. The change in CODis measured at the end of each batch and used to calculatethe total COD removed from the 88-L reactor over theduration of the sampling period based on an HRT of 1 day.Substrate efficiency is then calculated as:
SE ¼ NS
NH2ð9Þ
The (ηE) correlates directly to the CE by re-arrangementof their respective equations. It is assumed that the phraseI2Rex$t in calculating WE is negligible by comparison to thefirst term (this is observed to be the case in practice):
ηE ¼ $HH2 � 1; 000
2F � EpsCE ð10Þ
This means halving the Eps doubles the ηE if the CE canbe maintained. An increase in CE at the same Eps causes alinear increase in ηE.
Statistical analysis
All statistical tests were run using Minitab 15 (Minitab Inc.,State College, USA).
Results
Start-up and acclimatisation
During the first 30 days of operation, the reactor was run inbatch mode with a supplement of 0.5 g/L of sodium acetate andan input voltage of 0.6 V. During this time, there was noobserved gas production and current density was very lowreaching 0.04 A/m2 after the first 2 weeks. After this period,wastewater was pumped through the reactor with an HRT of1 day with no further addition of acetate. For the subsequent10 days, very little gas was produced and the current densityremained at this very low level. At day40, the input voltage wasraised from 0.6 to 0.9 V. The reactor was run with this input ofvoltage for the next 24 days; the average current density duringthis time reached 0.14 A/m2. Gas production was low, with anaverage of 9 mL/day, with H2 concentrations reaching nearly100 % after air in gas lines had been displaced. The electricalenergy efficiency ηEwas only 1%. The voltagewas then furtherincreased to 1.1 V, and current densities rose to 0.27 A/m2. Thisled to an improvement in gas production, and the reactorentered its hydrogen-producing phase, the results of which areshown below. The start-up period took 64 days.
The electrode resistance with this reactor design is relativelyhigh, creating a high overpotential reducing the efficiency ofthe reactor performance and increasing the electrical load need-ed for hydrogen evolution to occur. The current densities mea-sured when plotted against input voltage indicate that within thereactor the inherent overpotential is around 0.6 V (as seen as thex-intersect in Fig. 4). The current density only increases byaround 0.6 A/m2/V, far lower than two early MEC laboratorystudies of 1.3 A/m2/volt in (Liu et al. 2005) and 1.78 A/m2/voltin (Rozendal et al. 2006). The added voltage of 1.1 V used inthe study actually equates to a potential difference of around0.5 V between the electrodes, well below that required forabiotic hydrogen evolution from water of 1.23 Vat 25 °C.
The control further verified that the current productionwas biological, enabling the electrochemical hydrogen pro-duction. During this test, hydrogen was not produced at thecathode until an applied voltage of 2.5 V was added.
Performance during the hydrogen-producing phase of MECreactor operation
After the long start-up and subsequent increase in the voltage to1.1V, theMECworked for the following 85 days and continuesto do so. The results presented here are for this period.
6984 Appl Microbiol Biotechnol (2013) 97:6979–6989

The volume of gas produced per day was highly variable.However, the gas composition was consistent, H2 100±6.4 %and methane 1.8±0.9 %. No trace of CO2, N2 or O2 could bedetected using the GCs or MIMS. H2S could not be quantified;however, theMIMS did not detect any gas at this atomic weightand there was no detectable odour present. The daily H2 pro-duction is shown in Fig. 5. H2 production gradually increasedduring the first 30 days; after this, the average production wasaround 1.2 L per day (±0.4 L/day) for the reactor, equivalent to0.015 L H2L
−1day−1 (±0.005 L H2L−1day−1).
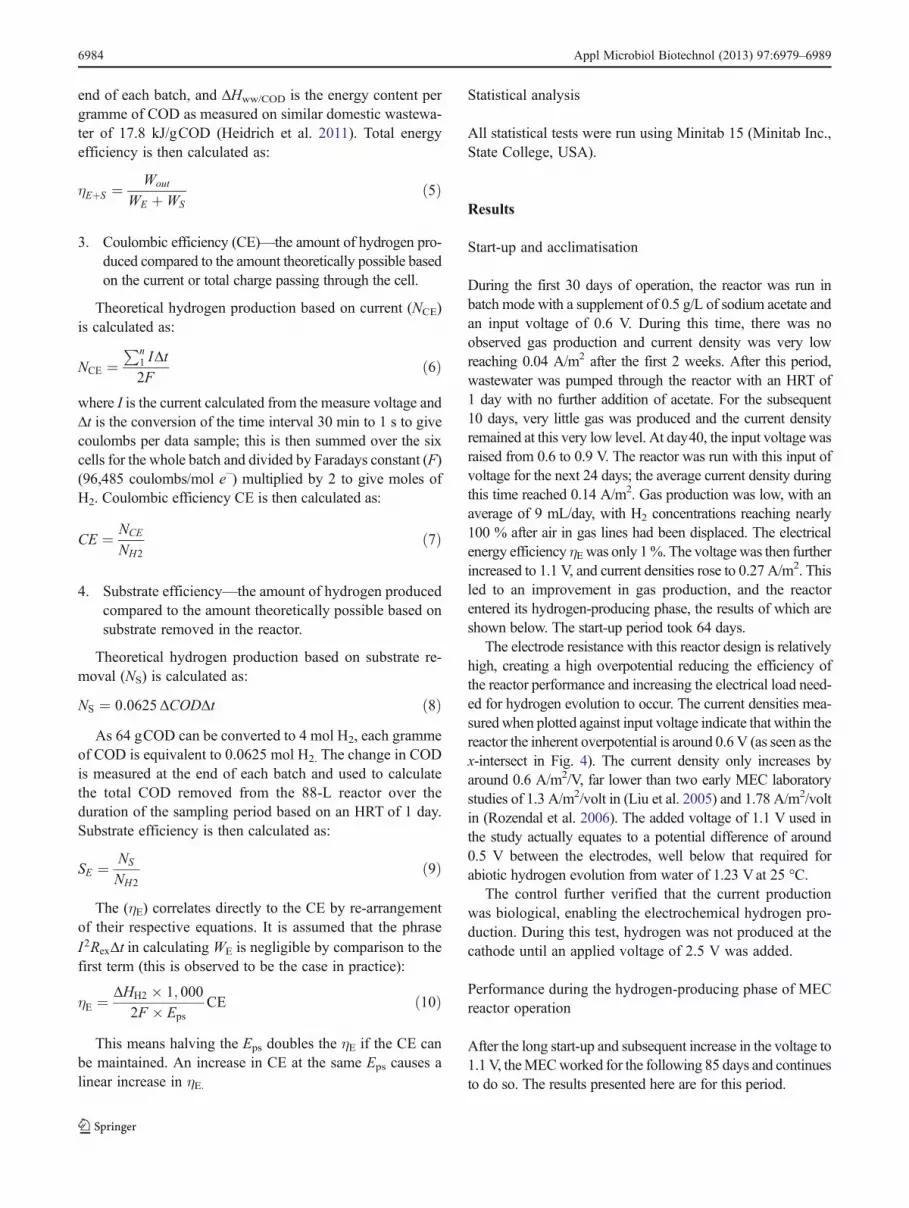
The electrical energy recovery of the cell was quitevariable (as seen in Fig. 6a) but did show an increasingtrend and, on occasion, approached 100 % (complete elec-trical energy recovery), averaging around 68.9 % after day40, though with a high standard deviation of 21.3 %. Thetotal energy efficiency (Fig. 6b) which gives the true per-formance of the cell was also variable (standard deviation18.4 %) and considerably lower as both the electrical andsubstrate energy are considered as inputs. The total energyefficiency does show an increasing trend, reaching the 30 %
level at the end of the study. The peak values are associatedwith very low COD removal measurements (making sub-strate energy input very low) and are not therefore likely tobe representative of the true performance of the reactor.
Coulombic efficiency (Fig. 6c) shows a similar trend toelectrical energy recovery (Fig. 6a), stabilising after 40 days to55.0 % (±17.5 %). The coulombic efficiency (CE) correlateswith electrical energy recovery (ηE) (R200.998, Pearsonscorrelation). This correlation factor is calculated as NE01.29CE using the average input power voltage; this value is alsoseen in the data and is consistent over the course of the study.If the CE could remain at the 60 % and the power inputdropped to 0.9 V, 100 % ηE would be achieved. Alternatively,with 1.1 V power input, CE needs to reach 75 % to achieve100 % ηE. The substrate efficiency (Fig. 6d) was very low, onaverage 16% for whole the operational period with a standarddeviation of 49.8 %. This was due to the variable influent andeffluent TCOD values (as shown in Fig. 7).
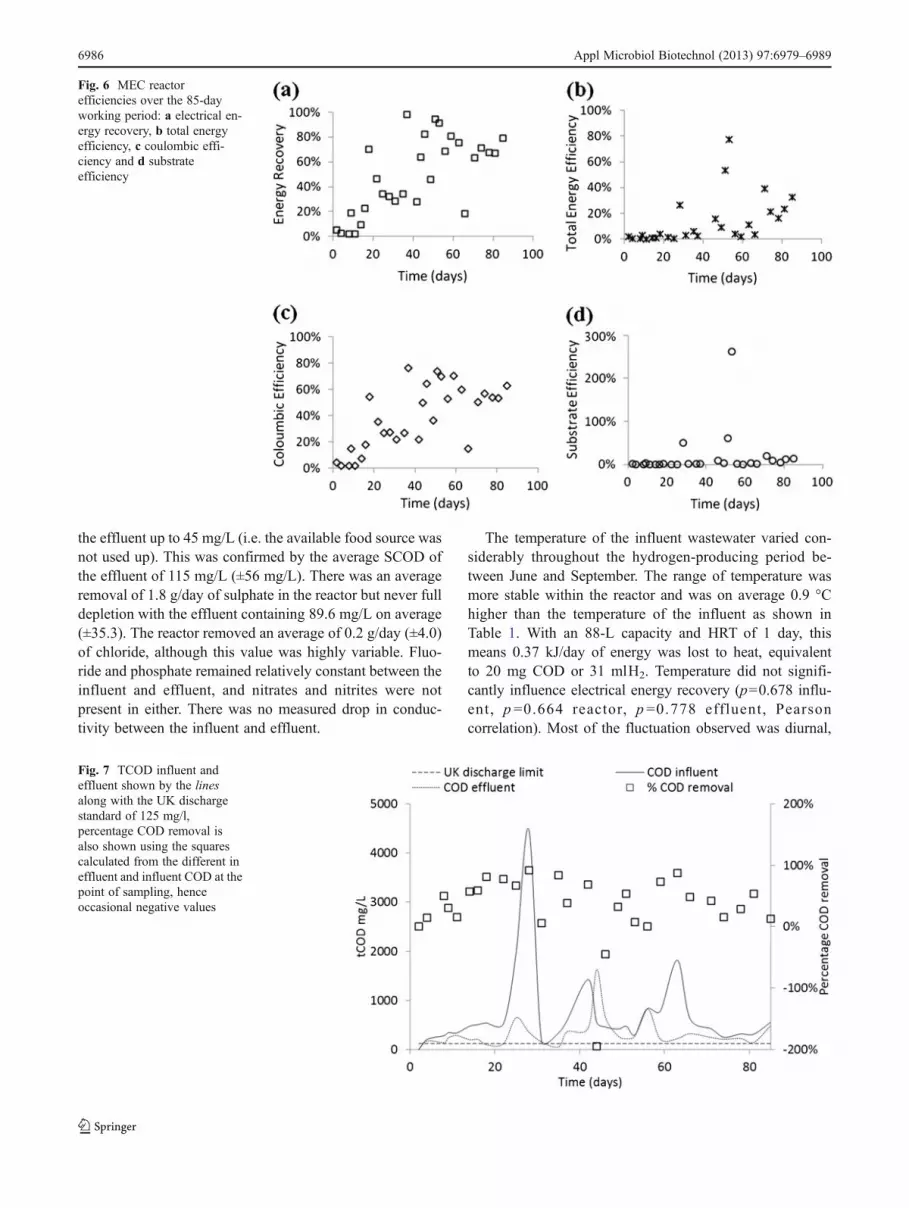
The levels of influent TCOD were highly variable whichis likely to be one of the factors underlying the variation inperformance, as shown in Fig. 7. This was particularly thecase at day30 when the settling tank became full with sludgeand influent COD was extremely high. This variability ledto occasional negative values for percent COD removal. Theaverage removal of 33.7 % (±54.0 %) equates to 0.14 kgCODm−3day−1, below the range for activated sludge of 0.2–2 kgCODm−3day−1 (Grady et al. 1999). However, due tothe low TCOD of the wastewater used, the effluent levelsdid occasionally approach and drop below the UK standardof 125 mg/l (EEC 1991).
Despite the variable influent COD and therefore variableperformance, many of the other measured factors remainedrelatively constant throughout the operational period. Theheadspace of the anode compartment (2.2 L volume)contained elevated levels of CO2 (1.9±0.2 %) and lowlevels of CH4 (0.4±0.1 %), equivalent to 8.8 ml of CH4 or0.006 mgCOD and 0.3 kJ. The gas production at the anodecould not be measured quantitatively due to leakage; how-ever, the low levels of methane, which did not vary or buildup through the course of the study, indicate that this was notlikely to be a major loss of COD. The daily production ofmethane at the cathode was 22 mL/day, equivalent to0.014 mgCOD and 0.8 kJ of energy, approximately 5–6 %of the amount of energy recovered as hydrogen.
The pH values of the influent and effluent were continu-ously monitored; the influent was on average pH7.0 (±0.4)and the effluent pH6.7 (±0.2), never dropping below pH6.The DO of the influent was on average 4.2 mg/L (±1.4) andthe effluent was 0 mg/L (±0.0), equating to 4.2 mgCOD/L ofpotential aerobic COD removal. The O2 levels of the anodeheadspace were below the detection limit of 1.5 %. Theamount of VFAs dropped between the influent and theeffluent, but there was frequently some acetic acid left in
y = 0.64x - 0.4147 R² = 0.9796
0
0.1
0.2
0.3
0.4
0 0.2 0.4 0.6 0.8 1 1.2
Cur
rent
den
sity
(A
/m2 )
Applied Voltage (V)
Fig. 4 Current density as a function of applied voltage as measured inthe pilot-scale reactor after the initial 2-week acclimatisation period,showing the linear regression equation and R2 value. The intersect ofthe x-axis indicates the overpotential of the system
Fig. 5 Hydrogen production during the working phase of reactor afterthe 64-day acclimatisation period, points showing the production rateat each time of sampling and the area showing the cumulative produc-tion of the course of this period
Appl Microbiol Biotechnol (2013) 97:6979–6989 6985
the effluent up to 45 mg/L (i.e. the available food source wasnot used up). This was confirmed by the average SCOD ofthe effluent of 115 mg/L (±56 mg/L). There was an averageremoval of 1.8 g/day of sulphate in the reactor but never fulldepletion with the effluent containing 89.6 mg/L on average(±35.3). The reactor removed an average of 0.2 g/day (±4.0)of chloride, although this value was highly variable. Fluo-ride and phosphate remained relatively constant between theinfluent and effluent, and nitrates and nitrites were notpresent in either. There was no measured drop in conduc-tivity between the influent and effluent.
The temperature of the influent wastewater varied con-siderably throughout the hydrogen-producing period be-tween June and September. The range of temperature wasmore stable within the reactor and was on average 0.9 °Chigher than the temperature of the influent as shown inTable 1. With an 88-L capacity and HRT of 1 day, thismeans 0.37 kJ/day of energy was lost to heat, equivalentto 20 mg COD or 31 mlH2. Temperature did not signifi-cantly influence electrical energy recovery (p00.678 influ-ent, p 00.664 reactor, p 00.778 effluent, Pearsoncorrelation). Most of the fluctuation observed was diurnal,
Fig. 6 MEC reactorefficiencies over the 85-dayworking period: a electrical en-ergy recovery, b total energyefficiency, c coulombic effi-ciency and d substrateefficiency
Fig. 7 TCOD influent andeffluent shown by the linesalong with the UK dischargestandard of 125 mg/l,percentage COD removal isalso shown using the squarescalculated from the different ineffluent and influent COD at thepoint of sampling, henceoccasional negative values
6986 Appl Microbiol Biotechnol (2013) 97:6979–6989

and periods of the more extreme temperatures were shortlived.
Discussion
This pilot-scale reactor produced almost pure hydrogen gasfrom raw influent domestic wastewater at UK ambient tem-peratures for a 3-month period and continues to do so. It isbelieved to be the first successful ‘proof of concept’ forMECs, bringing the prospect of sustainable domestic waste-water treatment and hydrogen production through the use ofbioelectrochemical systems into a new and exciting phase.
The reactor treated raw influent wastewater, removing onaverage 34 % of TCOD, and occasionally reaching the UKdischarge standard of 125 mgCOD/L, equating to a treat-ment rate of 0.14 kgCODm−3day−1, just below the range foractivated sludge. The reactor has performed this task usingless energy than would be needed for aeration in a tradition-al activated sludge process. However, it is clear that CODremoval would need to be improved for the technology to beindustrially viable. The electrical energy recovery on occa-sion nearly reached values of 100 % and was consistentlyaround 70 % during the later stages of the study. At thislevel of performance (i.e. 70 %), the energetic treatmentcosts were 2.3 kJ/gCOD, below the values for activatedsludge of 2.5–7.2 kJ/gCOD (Pant et al. 2011). Clearly,higher COD removal rates would be required for industrialapplication. The costs of additional reactor volume, in-creased HRT or closer electrode spacing would need to beweighed against potential benefits; this kind of economicassessment of the technology is beyond the scope of thisstudy.
To achieve 100 % electrical energy recovery, the CEwould need to increase to 75 %, i.e. 20 % more of thehydrogen theoretically produced based on the current wouldneed to be captured; alternatively, if the overpotentials couldbe reduced by 0.2 V, this would bring the input voltageneeded down to 0.9 V and again 100 % electrical energyrecovery would be achieved (Eq. 10). By implementingimprovements to the reactor, such as increasing electrodesurface areas, reducing the distance between electrodes,reducing electrode resistance (e.g. by using different
materials or thicker wiring), having a more efficient flowpaths, consistent pumping and improved materials, it isbelieved that the ηE could exceed 100 %, making it a netenergy producer. Alternatively, only a 6 % increase in sub-strate efficiency would result in a positive electrical energyrecovery. To engineer this improvement would require agreater understanding of the biological community involvedas well as a greater understanding the engineering aspects ofconstructing a reactor such as the HRT and loading rate, thisshould be a future goal.
The total energy efficiency showed an increasing trendduring the course of the study, levelling out at around 30 %,with around a third of all energy both from the wastewaterand from the power supply being recovered as hydrogengas. Coulombic efficiencies of the reactor were higher,levelling out at around 55 %. It is likely that a large portionof the missing 4 % of CE can be attributed to a loss ofhydrogen gas from the system. Hydrogen is an extremelysmall molecule and is able to permeate most plastics, and istherefore likely to be leaking out of the reactor. In a tightlyengineered system, theoretically the coulombic efficiencycould approach its maximum of 100 %, resulting in anelectrical energy recovery of 129 %. If the hydrogen werebeing lost to hydrogenotrophic methanogens at the anode orcathode, methane would be produced. This is not likely tohave been a significant problem with both the anode andcathode gas containing only low levels of methane equatingin total to 3.5 % loss of the COD removed.
The substrate efficiency of the cell was considerablylower than the other efficiencies measured. This efficiencyrepresents how much of the substrate is actually recoveredas hydrogen and gives an indication of how much substrateis used in the MEC process. Even if the 45 % loss ofhydrogen through leakage (as suggested by the CE of55 %) is accounted for in this calculation, then the substrateefficiency would only increase from 10 % to around 23 %.Losses may be taken to suggest that substrate is being usedin competitive oxidation processes, but only low levels ofoxygen and sulphates entered the cell potentially accountingfor 1.1 and 3.6 % of total COD removal, respectively. Someleakage of oxygen into the reactor headspace cannot beexcluded, but the most likely cause of the incompleteCOD balance is the build-up of sludge in the reactor. Thisis evidenced by the constant COD removal value throughoutthe study despite the increasing efficiency of the reactor;additionally, on three occasions, a very high COD peakentered the reactor, on two of these occasions the peak ofCOD is not seen to leave the reactor. This sludge build-upcould have been reduced using a recirculation pump, in-creasing the flow rate through the reactor.
All of the efficiency losses identified above could beminimised by improving the detailed engineering of thesystem. The two ‘new’ materials used in this study for the
Table 1 Maximum, minimum and average temperature (degrees Cel-sius) of the influent, effluent and reactor±1 standard deviation whichwere continually logged over the experimental period
Influent Reactor Effluent
Maximum 27.0±2.3 21.0±1.2 22.5±1.6
Minimum 8.5±2.3 13.5±1.2 12.0±1.6
Average 15.8±2.3 16.6±1.2 16.6±1.6
Appl Microbiol Biotechnol (2013) 97:6979–6989 6987

membrane and cathode have not been truly evaluated. Moreexpensive alternatives such as Nafion membrane and a Pt-coated cathode may prove to be worthwhile investments ifperformance increases greatly with their use. The high re-sistance of the reactor means the overall efficiencies of thereactor will be low. The resistance observed is more prob-lematic in this larger-scale system than at the laboratoryscale and would also become increasingly challenging withfurther scale up. Reduction in these overpotentials is a cleararea for improvement with future design. The biologicalMEC process works, and works relatively consistently fora period of at least three months. Although tested in realisticconditions, this was over a spring/summer period; survivalover periods of sustained low temperature has yet to beconfirmed.
The relationship between electrical energy recovery, elec-trical power input and coulombic efficiency has been defined;however, the prediction of energy requirements for a larger-scale MEC system may be difficult to make. Theoretical inputvoltages lie far from those needed in reality even for acetatefed cells, typically between 0.4 and 1.0 V compared to the0.114 V theoretically needed (pH7, 298 K) (Logan 2008). Arelatively small change in the electrical power input can have alarge effect of the overall electrical energy recovery; yet, if thisvalue is not high enough to overcome the losses in the cell, nohydrogen will be produced.
Undoubtedly, there are many factors that require furtherinvestigation. Many of the inefficiencies could be overcomeby improved engineering and hydrodynamics. A greater under-standing of the biological processes, community structure andecology (both working with and against the cell performance)would allow for more confident design and manipulation.
For the first time, this research publishes details of aMEC producing hydrogen gas from real domestic wastewa-ter, at a pilot scale, for a sustained period of time, underambient temperature conditions and using low-cost materi-als. ‘Breakeven’ energy recovery was not achieved duringthis research, but given the losses of hydrogen gas and thepotential for improved future design, energy neutral or evenenergy positive wastewater treatment is likely to be possiblewith the use of this technology. This has massive implica-tions for a significant reduction of energy use in this sectorand could lead to the worldwide water industry becoming aleader in the field of sustainability and climate changemitigation. The success of this research at this scale andwith real wastes sets a new and exciting agenda into theapplication of microbial fuel cell technologies into industry.
Acknowledgments The authors would like to thank the staff atNorthumbrian Water Limited, Andrew Moore, Steve Robson and LauraStephenson, as without their support this project would not have beenpossible. The authors also thank Christine Jeans for preparing the reactordiagrams. This work was financially supported by the Engineering andPhysical Sciences Research Council and Northumbrian Water Limited.
References
Aboutalebi H, Sathasivan A, Krishna KCB, Kohpaei AJ (2011)Expediting COD removal in microbial electrolysis cells by increas-ing biomass concentration. Bioresour Technol 102:3981–3984
Aelterman P, Freguia S, Keller J, Verstraete W, Rabaey K (2008) Theanode potential regulates bacterial activity in microbial fuel cells.Appl Microbiol Biotechnol 78:409–418
Bretschger O, Gorby YA, Nealson KH (2010) A survey of directelectron transfer from microbes to electronically active surfaces.In: Rabaey K, Angenent L, Schröder U, Keller J (eds)Bioelectrochemical systems: From extracellular electron transferto biotechnological application. IWA Publishing, London, p 488
Call D, Logan BE (2008) Hydrogen production in a single chambermicrobial electrolysis cell lacking a membrane. Environ SciTechnol 42:3401–3406
Cheng S, Logan BE (2008) Evaluation of catalysts and membranes forhigh yield biohydrogen production via electrohydrogenesis inmicrobial electrolysis cells (MECs). Water Sci Technol 58:853–857
Cheng SA, Logan BE (2011) High hydrogen production rate of mi-crobial electrolysis cell (MEC) with reduced electrode spacing.Bioresour Technol 102:3571–3574
Cheng S, Liu H, Logan BE (2006) Increased performance of single-chamber microbial fuel cells using an improved cathode structure.Electrochem Commun 8:489–494
Clauwaert P, Aelterman P, Pham TH, De Schamphelaire L, Carballa M,Rabaey K, Verstraete W (2008) Minimizing losses in bio-electrochemical systems: the road to applications. ApplMicrobiol Biotechnol 79:901–913
Cusick RD, Bryan B, Parker DS, Merrill MD, Mehanna M, Kiely PD,Liu GL, Logan BE (2011) Performance of a pilot-scale continu-ous flow microbial electrolysis cell fed winery wastewater. ApplMicrobiol Biotechnol 89:2053–2063
EEC (1991) Council directive of 21 May 1991 concerning urban wastewater treatment (91/271/EEC). Page 40. Official Journal of theEuropean Communities.
Fan YZ, Xu ST, Schaller R, Jiao J, Chaplen F, Liu H (2011) Nanoparticledecorated anodes for enhanced current generation in microbialelectrochemical cells. Biosens Bioelectron 26:1908–1912
Foley JM, Rozendal RA, Hertle CK, Lant PA, Rabaey K (2010) Lifecycle assessment of high-rate anaerobic treatment, microbial fuelcells, and microbial electrolysis cells. Environ Sci Technol44:3629–3637
Grady CPL, Daigger GT, Lim HG (1999) Biological wastewater treat-ment, 2nd edn. Marcel Dekker, New York
Heidrich ES, Curtis TP, Dolfing J (2011) Determination of the internalchemical energy of wastewater. Environ Sci Technol 45:827–832
Holmes DE, Bond DR, O'Neil RA, Reimers CE, Tender LR, LovleyDR (2004) Microbial communities associated with electrodesharvesting electricity from a variety of aquatic sediments.Microb Ecol 48:178–190
Kiely PD, Rader G, Regan JM, Logan BE (2011a) Long-term cathodeperformance and the microbial communities that develop in mi-crobial fuel cells fed different fermentation endproducts.Bioresour Technol 102:361–366
Kiely PD, Regan JM, Logan BE (2011b) The electric picnic: synergis-tic requirements for exoelectrogenic microbial communities. CurrOpin Biotechnol 22:378–385
Kim IS, Hwang MH, Jang NJ, Hyun SH, Lee ST (2004) Effect of lowpH on the activity of hydrogen utilizing methanogen in bio-hydrogen process. Int J Hydrog Energy 29:1133–1140
Liu H, Grot S, Logan BE (2005) Electrochemically assisted microbialproduction of hydrogen from acetate. Environ Sci Technol 39:4317–4320
6988 Appl Microbiol Biotechnol (2013) 97:6979–6989

Logan B (2008) Microbial fuel cells. John Wiley & Sons, Inc., NewJersey
Logan BE (2009) Exoelectrogenic bacteria that power microbial fuelcells. Nat Rev Microbiol 7:375–381
Lovley DR (2008) The microbe electric: conversion of organic matterto electricity. Curr Opin Biotechnol 19:564–571
Lu L, Ren NQ, Zhao X, Wang HA, Wu D, Xing DF (2011) Hydrogenproduction, methanogen inhibition and microbial communitystructures in psychrophilic single-chamber microbial electrolysiscells. Energ Environ Sci 4:1329–1336
Oh ST, Kim JR, Premier GC, Lee TH, Kim C, Sloan WT (2010)Sustainable wastewater treatment: how might microbial fuel cellscontribute. Biotechnol Adv 28:871–881
Pant D, Singh A, Van Bogaert G, Gallego YA, Diels L, Vanbroekhoven K(2011) An introduction to the life cycle assessment (LCA) of bioelec-trochemical systems (BES) for sustainable energy and product gener-ation: relevance and key aspects. RenewSust EnergRev 15:1305–1313
Pant D, Singh A, Van Bogaert G, Olsen SI, Nigam PS, Diels L,Vanbroekhoven K (2012) Bioelectrochemical systems (BES) forsustainable energy production and product recovery from organicwastes and industrial wastewaters. Rsc Adv 2:1248–1263
Rabaey K, Boon N, Siciliano SD, Verhaege M, Verstraete W (2004)Biofuel cells select for microbial consortia that self-mediate elec-tron transfer. Appl Environ Microbiol 70:5373–5382
Rader GK, Logan BE (2010) Multi-electrode continuous flow micro-bial electrolysis cell for biogas production from acetate. Int JHydrog Energ 35:8848–8854
Rozendal RA, Hamelers HVM, Euverink GJW, Metz SJ, Buisman CJN(2006) Principle and perspectives of hydrogen production throughbiocatalyzed electrolysis. Int J Hydrog Energ 31:1632–1640
Rozendal RA, Hamelers HVM, Rabaey K, Keller J, Buisman CJN(2008a) Towards practical implementation of bioelectrochemicalwastewater treatment. Trends Biotechnol 26:450–459
Rozendal RA, Jeremiasse AW, Hamelers HVM, Buisman CJN (2008b)Hydrogen production with a microbial biocathode. Environ SciTechnol 42:629–634
Rozendal RA, Leone E, Keller J, Rabaey K (2009) Efficient hydrogenperoxide generation from organic matter in a bioelectrochemicalsystem. Electrochem Commun 11:1752–1755
Sleutels T, Hamelers HVM, Buisman CJN (2011) Effect of mass andcharge transport speed and direction in porous anodes on micro-bial electrolysis cell performance. Bioresour Technol 102:399–403
Villano M, De Bonis L, Rossetti S, Aulenta F, Majone M (2011)Bioelectrochemical hydrogen production with hydrogenophilicdechlorinating bacteria as electrocatalytic agents. BioresourTechnol 102:3193–3199
Wang A, Liu W, Ren N, Zhou J, Cheng S (2010) Key factors affectingmicrobial anode potential in a microbial electrolysis cell for H(2)production. Int J Hydrog Energ 35:13481–13487
Wang AJ, Sun D, Cao GL, Wang HY, Ren NQ, Wu WM, Logan BE(2011) Integrated hydrogen production process from cellulose bycombining dark fermentation, microbial fuel cells, and a microbialelectrolysis cell. Bioresour Technol 102:4137–4143
Zhang YM, Merrill MD, Logan BE (2010) The use and optimization ofstainless steel mesh cathodes in microbial electrolysis cells. Int JHydrog Energ 35:12020–12028
Zhang F, Pant D, Logan BE (2011) Long-term performance of activat-ed carbon air cathodes with different diffusion layer porosities inmicrobial fuel cells. Biosens Bioelectron 30:49–55
Appl Microbiol Biotechnol (2013) 97:6979–6989 6989