Embed Size (px)
Citation preview

Productivity of forests in the Eurosiberian borealregion and their potential to act as a carbonsink Ð a synthesis
E . - D . S C H U L Z E , * J . L L O Y D , * F . M . K E L L I H E R , ² C . W I R T H , * C . R E B M A N N , *
B . L UÈ H K E R , * M . M U N D , * A . K N O H L , * I . M . M I L Y U K O V A , ³ W . S C H U L Z E , §
W . Z I E G L E R , ¶ A . B . V A R L A G I N , ³ A . F . S O G A C H E V , ³ R . V A L E N T I N I , * *
S . D O R E , * * S . G R I G O R I E V , ² ² O . K O L L E , * M . I . P A N F Y O R O V , ³
N . T C H E B A K O V A , ³ ³ and N N V Y G O D S K A Y A ³
*Max-Planck Institute for Biogeochemistry, PO Box 100164, 07701 Jena, Germany, ²Manaaki Whenua, Landcare Research,
PO Box 69, Lincoln, New Zealand, ³Institute of Evolution and Ecology, Russian Academy of Sciences, Leninsky Prospect 33,
117071 Moscow, Russia, §Botanisches Institut, University TuÈbingen, Auf der Morgenstelle 1, 72076 TuÈbingen, Germany,
¶Department of Biophysics and chemical Physics, Comenius University, Mlynska Dolina F1, 84215 Bratislava, Slovakia,
**Dept of Forest Science and Environment, University of Tuscia, 01100 Viterbo, Italy, ²²Ecological Travel Centre, Scienti®c
Park, Korp.1, r.127, Moscow State University, 119899 Moscow, Russia, ³³Forest Institute, Siberian branch of the Russian
Academy of Sciences, Akademgorodok, Krasnoyarsk, 660036 Russia
Abstract
Based on review and original data, this synthesis investigates carbon pools and ¯uxes
of Siberian and European forests (600 and 300 million ha, respectively). We examine
the productivity of ecosystems, expressed as positive rate when the amount of carbon
in the ecosystem increases, while (following micrometeorological convention) down-
ward ¯uxes from the atmosphere to the vegetation (NEE = Net Ecosystem Exchange)
are expressed as negative numbers. Productivity parameters are Net Primary Produc-
tivity (NPP=whole plant growth), Net Ecosystem Productivity (NEP = CO2 assimilation
minus ecosystem respiration), and Net Biome Productivity (NBP = NEP minus carbon
losses through disturbances bypassing respiration, e.g. by ®re and logging). Based on
chronosequence studies and national forestry statistics we estimate a low average NPP
for boreal forests in Siberia: 123 gC m±2 y±1. This contrasts with a similar calculation
for Europe which suggests a much higher average NPP of 460 gC m±2 y±1 for the for-
ests there. Despite a smaller area, European forests have a higher total NPP than Si-
beria (1.2±1.6 vs. 0.6±0.9 3 1015 gC region±1 y±1). This arises as a consequence of
differences in growing season length, climate and nutrition.
For a chronosequence of Pinus sylvestris stands studied in central Siberia during
summer, NEE was most negative in a 67-y old stand regenerating after ®re (± 192 mmol
m±2 d±1) which is close to NEE in a cultivated forest of Germany (± 210 mmol m±2 d±1).
Considerable net ecosystem CO2-uptake was also measured in Siberia in 200- and
215-y old stands (NEE:174 and ± 63 mmol m±2 d±1) while NEP of 7- and 13-y old logging
areas were close to the ecosystem compensation point. Two Siberian bogs and a bog in
European Russia were also signi®cant carbon sinks (± 102 to ± 104 mmol m±2 d±1). Inte-
grated over a growing season (June to September) we measured a total growing season
NEE of ± 14 mol m±2 summer±1 (± 168 gC m±2 summer±1) in a 200-y Siberian pine stand
and ± 5 mol m±2 summer±1 (± 60 gC m±2 summer±1) in Siberian and European Russian
bogs. By contrast, over the same period, a spruce forest in European Russia was a car-
bon source to the atmosphere of (NEE: + 7 mol m±2 summer±1 = + 84 gC m±2 summer±1).
Two years after a windthrow in European Russia, with all trees being uplifted and few
successional species, lost 16 mol C m±2 to the atmosphere over a 3-month in summer,
R
Correspondence: E.-D. schulze, fax +49/ 3641 643701, e-mail
Global Change Biology (1999) 5, 703±722
# 1999 Blackwell Science Ltd. 703

compared to the cumulative NEE over a growing season in a German forest of
± 15.5 mol m±2 summer±1 (± 186 gC m±2 summer±1; European ¯ux network annual aver-
aged ± 205 gC m±2 y±1).
Differences in CO2-exchange rates coincided with differences in the Bowen ratio,
with logging areas partitioning most incoming radiation into sensible heat whereas
bogs partitioned most into evaporation (latent heat). Effects of these different surface
energy exchanges on local climate (convective storms and ®res) and comparisons with
the Canadian BOREAS experiment are discussed.
Following a classi®cation of disturbances and their effects on ecosystem carbon
balances, ®re and logging are discussed as the main processes causing carbon losses
that bypass heterotrophic respiration in Siberia. Following two approaches, NBP was
estimated to be only about 13±16 mmol m±2 y±1 for Siberia. It may reach 67 mmol m±2 y±1
in North America, and about 140±400 mmol m±2 y±1 in Scandinavia.
We conclude that ®re speeds up the carbon cycle, but that it results also in long-term
carbon sequestration by charcoal formation. For at least 14 years after logging, regrowth
forests remain net sources of CO2 to the atmosphere. This has important implications
regarding the effects of Siberian forest management on atmospheric concentrations. For
many years after logging has taken place, regrowth forests remain weaker sinks for
atmospheric CO2 than are nearby old-growth forests.
Keywords: boreal forest, Europe, net biome productivity, net ecosystem productivity, net
primary productivity, Siberia
Received 21 July 1998; resubmitted 10 December and accepted 29 December 1998
Introduction
Global carbon mass balance calculations suggest that
about one third of the anthropogenic CO2 emissions are
incorporated into the terrestrial biosphere every year
(Keeling et al. 1996). One widely held view is that a major
terrestrial carbon sink is located in the northern hemi-
sphere (Tans et al. 1990; Ciais et al. 1995), but another
recent model-experiment suggests that continental USA
is a major region for carbon sequestration (Fan et al.
1998). In addition to the temperate region, the boreal
forest is the most widespread vegetation type in the
northern hemisphere. As a consequence of its vast area it
might also contribute signi®cantly to this sink (Melillo
et al. 1995). The total area of Russian Siberia is 13 million
km2 (Shvidenko & Nilsson 1994) which is about 30%
greater than Europe (10 million km2 area including
European Russia, Stanners & Bourdeau 1995) and 12%
greater than boreal North America (11.5 million km2 of
Canada and Alaska). However, with 600 vs. 300 million
ha of forest, Siberia is much more extensively forested
than Europe or boreal North America (500 million ha).
Nevertheless, model predictions are controversial as to
what extent the boreal region could contribute to the
global carbon sink (Ciais et al. 1995, Fan et al. 1998;
Rayner et al. 1999).
Although the boreal region is the largest contiguous
forested area of the world, estimates of its productivity
vary widely. For example, Melillo et al. (1993) estimated
that the global boreal forest has an average net primary
production (NPP) of 228 gC m±2 y±1 (19 mol C m±2 y±1)
which scales across the boreal forest biome to an NPP of
2.9 3 1015 gC y±1. Including the temperate coniferous
forests and boreal woodlands of the northern hemisphere
this number would increase to about 5.1x 10¹⁵ gC y±1
which is about 10% of global NPP. However, considering
the large fraction of NPP that returns to the atmosphere
by respiration, logging and ®res (Schimel et al. 1996), it
seems unlikely that the extra-tropical region can be a net
carbon sink of order 2±4 3 1015gC y±1 as suggested by
some authors (Ciais et al. 1995). Moreover, a much
smaller sink there would con®rm the predictions of Fan
et al. (1998) and Rayner et al. (1999).
To more precisely understand the productivity of
representative Siberian forest stands, and to evaluate the
proposed role of these forests as a CO2 sink, three
growing season expeditions into the Siberian region have
been undertaken to date. In addition, long-term mea-
surements were commenced at selected sites in 1998. We
measured NPP and net ecosystem productivity (NEP)
which describes the balance between NPP and hetero-
trophic respiration, and the associated above- and below-
ground carbon pool sizes. The newer concept of net
biome productivity (NBP), including larger scale carbon
losses that bypass heterotrophic respiration such as
harvest or ®re (Schulze & Heimann 1998) is also utilized
in the following analysis. Similar measurements made in
Germany allow for comparisons and quanti®cation of
Eurosiberian forest carbon exchange rates. The following
L704 E . - D . S C H U L Z E et al.
# 1999 Blackwell Science Ltd., Global Change Biology, 5, 703±722

synthesis is based on published material, re-evaluation of
existing data, and previously unpublished data.
Materials and methods
Experimental sites in Siberia and Germany were mono-
typic forest stands and bogs representative of the
regional vegetation (Table 1).
1 Larix gmelinii forest of eastern Siberia near Yakutsk
(60°51¢N, 128°16¢E): Deciduous larch covers about 54% of
the forested area in Siberia (Shvidenko & Nilsson 1994)
growing mainly on loamy soils east of the Yenisey river.
The NEE measurements were made above a 125-y old
stand 160 km south of the city Yakutsk. Biomass and
growth were measured in a chronosequence of 49±380-y
old stands growing on loamy permafrost soil (Schulze
et al. 1995). This site was selected because it is at the
centre of this species distribution outside the range of
forest management. It was described by forest authorities
in Yakutsk as the largest pristine region of Larix forest.
2 Pinus sylvestris forest of Central Siberia near Zotino
(60°44¢N, 89°09¢E): Pine covers 12% of the forest area in
Siberia (Shvidenko & Nilsson 1994), mostly to the west of
the Yenisey river. NEE measurements were carried out in
a range of habitats, including 7- and 13-y old logging
areas, 53- and 215-y old natural regenerations after ®re
and an area dominated by lichens. Biomass and growth
of pine were studied in a chronosequence of stands
ranging from 28- to 450-y on sandy soil without
permafrost (Pergelic Cryochrept, Wirth et al. 1999). This
region was indicated by the Krasnoyarsk Institute of
Forest Research to be typical of pine forests growing on
alluvial sands and, interspaced with bogs. This vegeta-
tion type dominates a region extending from the Ural
Mountains to the Yenisey River. The sites were chosen to
be at the margin between managed and nonmanaged
areas. Long-term ¯ux measurements started in 1998 close
to the site of the FIRESCAN experiment (ManoÈ &
Andreae 1994) at `Bor Island'.
3 Picea abies in the `Central Reserve' at Fyedorovskoye
near Nelidovo, about 300 km NW of Moscow (56°27¢N,
32°55¢E): The 35 000 ha forest reserve is one of the few
closed forests remaining in that region and has therefore
been used for ecosystem studies since the 1960s (see
Karpov 1973; Gravenhorst et al. 1998). In the same forest,
¯ux measurements were carried out not only in a mature
forest growing on peat over clay soil but also over a 2-y
old windthrow area where all trees had been broken or
roots uplifted, and regeneration of early successional
broad-leaved species had begun.
4 Sphagnum bogs of European Russia and west Siberia:
European Russia and west Siberia are characterized by
large Sphagnum bog areas. To provide a comparison to the
forest studies at Fyedorovskoye and Zotino, microme-
teorological ¯ux measurements were made above Sphag-
num bogs close to the forest sites. At Fyedorovskoye,
¯uxes were measured in the centre of a 5-km2 large raised
bog. At Zotino, short-term measurements were carried
out in 1996 on a 2-km2 bog, and long-term ¯uxes were
measured in the centre of a 10-km2 Aapa-type bog.
5 Picea abies of West Europe in a managed forest at the
Waldstein Mountains near Bayreuth, Germany (50°09¢N,
11°52¢E): NEE was measured above a 43-y old stand.
Biomass and growth were measured in a chronose-
quence of 28- to 140-y old stands on loamy soil (Mund
1996). The region has been a central study site for
ecosystem research over many years (Schulze et al. 1989a)
and it is presently contributing to the EUROFLUX and
the CANIF project of the EEC. Both projects indicate that
this site is representative of central European coniferous
forest (Bauer et al. 1996; see also Stanners & Bourdeau
1995). Based on 1996/97 carbon exchange data, this site is
close to the average of all European forest measurement
sites (Euro¯ux Report 1997, Contract ENV4-CT95-0078,
EEC DGXII-D2, Brussels, Belgium).
The eddy covariance technique was used to measure
NEE and the partitioning of available energy into
evaporation and sensible heat ¯uxes (Kelliher et al.
1997, 1998, 1999; Hollinger et al. 1998). Biomass and
R
Table 1 Climate and habitat parameters characterizing the experimental sites
Av. temp. Precipitation
Max tree
Annual July Annual May±Sept. Days height Soil Perma
Site (°C) (°C) (mm) (mm) > 5 °C (m) type frost
Yakutsk ± 10 19 213 150 126 23 silt loam yes
Zotino ± 3.3 18 663 349 147 20 sand no
Fyedorovskoye + 3.6 14 714 320 165 24 peat/clay no
Waldstein + 5.8 15 1100 550 210 28 loam no
P R O D U C T I V I T Y O F F O R E S T S I N T H E E U R O S I B E R I A N B O R E A L R E G I O N 705
# 1999 Blackwell Science Ltd., Global Change Biology, 5, 703±722

growth was determined from selective harvesting of
trees in stands of different age (Schulze et al. 1995; Wirth
et al. 1999) and from tree ring analysis (Mund 1996; Wirth
1996). The soil carbon content was quanti®ed in the same
stands. The content of black carbon was determined by
LuÈ hker (1997) using a modi®ed method of Kuhlbusch &
Crutzen (1995).
We are aware of the problems involved in extrapola-
tions from plot data to regions (see Moore 1996). The
regional estimates of NPP in this study are based on
published forest inventories for Europe (Stanners &
Bourdeau 1995) and Siberia (Shvidenko & Nilsson 1994)
using a wood density of 300 kgdw m±3wood +bark for
Siberia, as measured by Schulze et al. (1995) and Wirth
et al. (1999). This density is lower than the wood density
of 479 kgdw m±3wood used by Shvidenko & Nilsson (1999).
In the regional comparison of NPP, a wood density of 400
kgdw m±3wood was used for European conifers. For
European hardwoods, 500 kg dw m±3wood was used
(KoÈrner et al. 1993). Additional plot level NPP and
biomass data were collected at all study sites, and the
contribution of NPP losses by self-thinning was esti-
mated from this plot level information (Schulze et al.
1995; Mund 1996; Wirth et al. 1999). Our NPP data were
compared with regional estimates by Shvidenko &
Nilsson (1994) to ascertain its representativeness. Root
biomass and ®ne root turnover rate were estimated
following Jackson et al. (1997) and Steele et al. (1997) as
well as Vogt et al. (1996). We considered as many Russian
publications as possible, especially concerning biomass
and productivity measurements (Isaev 1991).
Forest biomass and net primary productivity(NPP)
Pinus sylvestris and Larix spp. cover 68% of the Siberian
forested area (Shvidenko & Nilsson 1994), and Picea and
Pinus spp. 51% of the European forest area (Stanners &
Burdeau 1995). Figure 1 summarizes our biomass mea-
surements for these dominant species (Schulze et al. 1995;
Mund 1996; Vygodskaya et al. 1998; Wirth et al. 1999) and
gives regional estimates for North America (Botkin &
Simpson 1990), west Europe (Stanners & Burdeau 1995),
European Russia and Siberia (Shvidenko & Nilsson
1999).
On mesic sites, Siberian Pinus and Larix accumulate
stemwood biomass at less than half the rate of west
European Picea (Fig. 1), the latter being representative of
a broad range of European tree species (Kramer 1988).
While Picea in Europe obtains an above-ground biomass
of about 21 kgdw m±2 in 100 years, Pinus and Larix of
Siberia reached only 7.5 kgdw m±2 at the same age. Thus,
a 380-y old Pinus stand in Siberia has about the same
biomass as a 50-y old Picea plantation in Europe. In
European Russia, the biomass of Picea and Pinus is
intermediate between that of West Europe and Siberia
(Smirnov 1967; Smirnov & Semenova 1970; Vygodskaya
et al. 1998). On favourable sites Siberian Larix (and Pinus,
unpublished) may accumulate biomass at rates compar-
able to European Russia (Utkin 1965) but stands
deteriorate beyond a certain optimum age. This does
not happen under less favourable conditions where
biomass remains constant or may even increase at a
very low rate irrespective of age. For Pinus sylvestris,
variation in the data expresses the range of habitats
under which this species grows in European Russia: low
productivity Sphagnum bogs to highly productive sites
with a herbaceous understorey.
NPP includes growth above- and below-ground.
However, since growth of tree roots is dif®cult to
measure (due to rapid turnover, soil depth and mycor-
rhizal interaction), above-ground-NPP (ANPP) is fre-
quently the only measurement. From forest inventories it
is possible to approximate ANPP from the volume
L
Fig. 1 Living above-ground biomass in
Siberian Pinus (Wirth et al. 1999) and Larix
(Utkin 1965; Schulze et al. 1995) stands as
compared to West European Picea abies
(Mund 1996) and Russian European Picea
obovata (Vygodskaya et al. 1998) and Pinus
sylvestris (Alekseev 1975). Average levels
of biomass in Europe (Stanners &
Bourdeau 1995), of Siberia (Shvidenko &
Nilsson 1999) and North Ameriaca (Botkin
& Simpson 1990) are also shown.
706 E . - D . S C H U L Z E et al.
# 1999 Blackwell Science Ltd., Global Change Biology, 5, 703±722

growth of stem wood (usually termed as net annual
increment) given in yield tables. However, forest
inventories include only the standing crop of intensively
managed forests, neglecting tree death as a component of
NPP in natural unmanaged forests (Schulze 1982; Lloyd
1999; Shvidenko & Nilsson 1999). As stands develop, tree
death by self-thinning can completely offset growth
under nonmanaged conditions. In managed forests,
natural self-thinning is avoided by harvest and this
wood being exported from the forest is included in the
European inventories (Pretzsch 1996). By contrast, in
unmanaged forests dead trees decompose on site and so
are not included in an inventory (Shvidenko & Nilsson
1999). ANPP thus cannot always be approximated by
dividing standing biomass by stand age.
According to our Siberian plot studies, the amount of
wood lost by self-thinning is slightly more than the wood
increment (Fig. 2). Shvidenko & Nilsson (1999) estimate
that Russian tree mortality (913 3 106 m3 y±1) occurs at
about the same rate as stem-wood growth of the standing
crop (966 3 106 m3 y±1). ANPP for Russia can then be
approximated as the sum of these two rates (1879 3 106
m3 y±1 = 2.5 m3 ha±1 y±1). These data agree well with our
plot studies where ANPP of stem wood (accounting for
concurrent growth and tree mortality) averaged
2.7 m3 ha±2 y±1 (or 41 gC m±2 y±1). Our estimate of ANPP
(wood and litter) of 84 gC m±2 y±1 was very close to the
estimates for Larix in Central Siberia by Kajimoto et al.
(1998: 90 gC m±2 y±1). They are in the range of North
American northern boreal forest stands (124 gC m±2 y±1
in Picea mariana and 110 vs. 51 gC m±2 y±1 in old vs.
young Pinus banksiana; Gower et al. 1997). As suggested
in Fig. 1, the range of ANPP depends on site conditions,
so it is expected to be large in the boreal zone. Clearly,
regional differences in ANPP exist, but the available data
are too sparse for calculation of the associated probable
errors. Despite this uncertainty, ANPP seems to be
higher in (Western and Russian) Europe than in Siberia
by a factor of about 3 (Fig. 2). Due to the differences in
forest area, the difference in growth rate between Europe
and Siberia diminishes to factor < 2 at a regional scale.
The growth of coarse roots can be estimated with
reasonable accuracy from ANPP. Coarse root biomass
has been variously estimated as 40% of above-ground
biomass in Siberian stands (Monserud et al. 1996) down
to 30% in Europe (Jackson et al. 1997) and 22±34% in
European Russia (Karpov 1973). These estimates were
included in Fig. 2 but they do not dramatically change
the NPP comparison between Siberia and Europe.
An estimate of NPP is not complete without ®ne root
growth. Jackson et al. (1997) assume that ®ne roots
turnover occurs once per year, contributing on average
33% to NPP of boreal forests. This agrees well with the
estimates of Steele et al. (1997) for the BOREAS sites in
R
Fig. 2 Comparison of carbon pools and ¯uxes of European and Siberian forests. Wood, wood increment in Siberia calculated with
400 kgdw m±3wood, average of Schulze et al. (1995), Wirth et al. (1999) and Shvidenko & Nilsson (1999); Wrus, Wood increment in Rus-
sia; Wwest, Wood increment in West Europe, calculated with 400 kg dw m±3wood average for conifers (E, N, W-Europe) and 500 kgdw
m±3wood for hardwood in S-Europe (KoÈrner et al. 1993); leaves, based on the measured ratios of needle to wood growth (needle
growth (g m±2 y±1) = 0.11 + 1.08 3 wood growth, r = 0.9). Wood growth includes standing crop+self thinning (Mund 1996; Wirth et al.
1999). Th, thinning and self-thinning calculated from average biomass and loss of stems for Siberia (Wirth et al. 1998). For Europe,
losses by self thinning are assumed to take place only in European Russia. In West European forest, this increment would be har-
vested by thinning and thus part of the wood increment. CR, Coarse roots=0.4 3 wood biomass for Siberia (Monserud et al. 1996),
and 0.3 3 wood biomass for Europe (Jackson et al. 1997). Forest area=597.3 3 106 ha for Siberia (Shvidenko & Nilsson 1999) and
303 3 106 ha for Europe including European Russia (Stanners & Bourdeau 1995).
P R O D U C T I V I T Y O F F O R E S T S I N T H E E U R O S I B E R I A N B O R E A L R E G I O N 707
# 1999 Blackwell Science Ltd., Global Change Biology, 5, 703±722
Canada and of Axelsson & Brackenhielm (1980) for
Sweden. By contrast, a survey of published data (Vogt
et al. 1996) suggests below-ground growth on comparable
soil types is on average 17.5% of NPP in boreal forest and
23.7% of NPP in cold temperate forest (range 13±38% of
NPP). Vogt et al. also warn that ®ne root production may
only weakly be correlated to NPP, because litter nutrient
content is a more important determining variable. Fine
root production following Jackson et al. was 49 and 172
gC m±2 y±1 in Siberia and Europe which would exceed
stem-wood growth by a factor of 2±3. This appears high
since ®ne roots may live longer than 1 years in boreal
zone (Kajimoto et al. 1998). On the other hand, the
estimate of Vogt et al. results in a ®ne root growth of
only 2±55 gC m±2 y±1 for Siberia and Europe which seems
to be too low considering nutrient limitations in Siberia.
A ®ne root biomass (< 1 mm in diameter) of 26 gC m±2
was actually measured at the Waldstein site, 27 to 57 gC
m±2 y±1 in European Russia (Karpov 1973), which would
represent growth assuming a turnover of 1 years (H.
Persson, CANIF project, unpubl.). Thus, depending on
the assumptions made for ®ne root growth, NPP ranges
between 102 and 149 gC m±2 y±1 for Siberia and 401 and
518 gC m±2 y±1 in Europe.
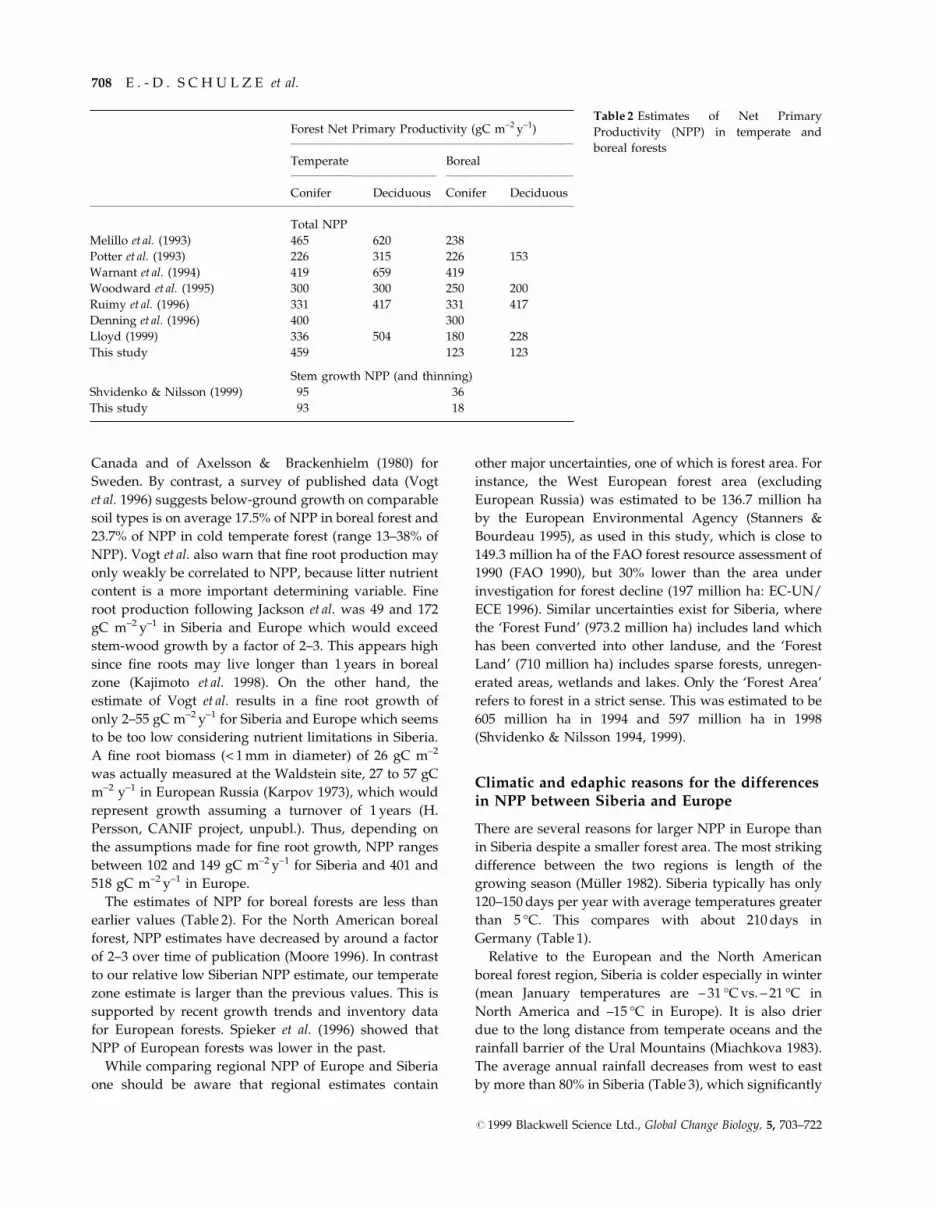
The estimates of NPP for boreal forests are less than
earlier values (Table 2). For the North American boreal
forest, NPP estimates have decreased by around a factor
of 2±3 over time of publication (Moore 1996). In contrast
to our relative low Siberian NPP estimate, our temperate
zone estimate is larger than the previous values. This is
supported by recent growth trends and inventory data
for European forests. Spieker et al. (1996) showed that
NPP of European forests was lower in the past.
While comparing regional NPP of Europe and Siberia
one should be aware that regional estimates contain
other major uncertainties, one of which is forest area. For
instance, the West European forest area (excluding
European Russia) was estimated to be 136.7 million ha
by the European Environmental Agency (Stanners &
Bourdeau 1995), as used in this study, which is close to
149.3 million ha of the FAO forest resource assessment of
1990 (FAO 1990), but 30% lower than the area under
investigation for forest decline (197 million ha: EC-UN/
ECE 1996). Similar uncertainties exist for Siberia, where
the `Forest Fund' (973.2 million ha) includes land which
has been converted into other landuse, and the `Forest
Land' (710 million ha) includes sparse forests, unregen-
erated areas, wetlands and lakes. Only the `Forest Area'
refers to forest in a strict sense. This was estimated to be
605 million ha in 1994 and 597 million ha in 1998
(Shvidenko & Nilsson 1994, 1999).
Climatic and edaphic reasons for the differencesin NPP between Siberia and Europe
There are several reasons for larger NPP in Europe than
in Siberia despite a smaller forest area. The most striking
difference between the two regions is length of the
growing season (MuÈ ller 1982). Siberia typically has only
120±150 days per year with average temperatures greater
than 5 °C. This compares with about 210 days in
Germany (Table 1).
Relative to the European and the North American
boreal forest region, Siberia is colder especially in winter
(mean January temperatures are ± 31 °C vs. ± 21 °C in
North America and ±15 °C in Europe). It is also drier
due to the long distance from temperate oceans and the
rainfall barrier of the Ural Mountains (Miachkova 1983).
The average annual rainfall decreases from west to east
by more than 80% in Siberia (Table 3), which signi®cantly
L
Forest Net Primary Productivity (gC m±2 y±1)
Temperate Boreal
Conifer Deciduous Conifer Deciduous
Total NPP
Melillo et al. (1993) 465 620 238
Potter et al. (1993) 226 315 226 153
Warnant et al. (1994) 419 659 419
Woodward et al. (1995) 300 300 250 200
Ruimy et al. (1996) 331 417 331 417
Denning et al. (1996) 400 300
Lloyd (1999) 336 504 180 228
This study 459 123 123
Stem growth NPP (and thinning)
Shvidenko & Nilsson (1999) 95 36
This study 93 18
Table 2 Estimates of Net Primary
Productivity (NPP) in temperate and
boreal forests
708 E . - D . S C H U L Z E et al.
# 1999 Blackwell Science Ltd., Global Change Biology, 5, 703±722

affects the forest water balance. For the German forest,
tree canopy evaporation typically uses less than half the
summer rainfall but this fraction increases to 70±80% in
European Russia and West Siberia and it actually exceeds
summer rainfall in East Siberia. In East Siberia trees
effectively `mine' soil-water which is provided by the
previous winter's recharge and by thawing of the
permafrost. Drainage to surface-waters occurs mainly
during snow melt (Kelliher et al. 1997). At the central
Siberian site, with no permafrost, the water-holding
capacity of sand is very low (4 mm/0.1 m depth; Kelliher
et al. 1998) but in some cases roots may reach > 3 m soil
depth and thus be adequately supplied with water
despite water de®cits in the surface soil (Zimmermann
et al. 1999).
One to two week long drought periods are a
characteristic feature of the Siberian growing climate
(Kelliher et al. 1997, 1998). For upland soils, this can
quickly lead to water de®cits that detrimentally affect
surface conductance, Gs (Fig. 3a) and evaporation, E
(Fig. 3b) but CO2 assimilation, A, can be less effected
(Fig. 3c). Indeed the latter appeared to even increase
during the early phase of a drying cycle, despite
decreasing Gs. This response of A may be due to a slow
recovery from drought that occurred prior to the rain-
event and later in this drying cycle. Assimilation was
later observed to decrease in a manner similar to E. Since
Siberian light coniferous forests typically have relatively
open canopies (projected crown area/total ground
area = 60±70% for pine, Wirth et al. 1999) and signi®cant
penetration of solar radiation to the ground, high rates of
understorey evaporation can occur. Understorey eva-
poration rates (which may depend on whether ground-
vegetation is present) are linearly related to the available
energy and may even exceed tree canopy transpiration
on ®ne summer days (Fig. 3d,e).
The effect of soil water de®cit is enhanced by
extreme conditions of low air humidity during the
day. In Siberian forests the air saturation de®cit, D,
can be as high as 3 kPa (Kelliher et al. 1997, 1998;
Vygodskaya et al. 1997) or similar to conditions in the
Negev desert (Schulze & Hall 1982) and in great
contrast to Germany (Dmax = 1.6 kPa). Even though
stomata close with increasing D during the day
(Fig. 3f), forest evaporation is less affected (Fig. 3g).
There is thus only limited stomatal control over the
ecosystem evaporation rate, i.e. there is a tendency for
stomata to maintain constant evaporation at high air
saturation de®cits but the contribution of understorey
evaporation offsets the tree canopy response evident
in sap ¯ow measurements (Arneth et al. 1996;
Zimmermann et al. 1999). Under comparable condi-
tions, evaporation rates are 30% lower from Larix
stands than for pine forest which would make the
former better adjusted to the conditions of East Siberia
where rainfall is evidently limiting. The effect of
R
Table 3 The hydrological balance of East Siberia (Kelliher et al. 1997), Central Siberia (Kelliher et al. 1998), European Russia
(Molchanov 1968) and European spruce forest (Schulze et al. 1989a). All data are expressed in mm. Precipitation is taken as a
positive ¯ux into the ecosystem (as indicated by +). In contrast evaporation as a water loss from the system is indicated by (±). Since
soil water depletion supports transpiration of the vegetation in summer it is indicated by (+) while soil water recharge uses rain
water and it is indicated by (±)
Evaporation
Soil Seepage
Location Season Precipitation Wet Dry Water & runoff
East Siberia June±Aug. +112 ±22 ±161 +71 0
Yakutsk Sept.±May +101 0 0 ±71 ±30
Total +213 ±22 ±147 0 ±30
Central Siberia May±Sept. +297 ±60 ±205 ±32
Zotino Oct.±April +300 0 ±40 ±260
Total +597 ±60 ±245 ±292
European Russia Total +525 ±121 ±204 ±200
Northern Taiga Total +550 ±123 ±341 ±86
Mixed boreal forest Total +521 ±136 ±291 ±94
Southern forest steppe April±Sept. +652 ±156 ±287 ±209
Europe Oct.±March +516 ±78 ±5 ±433
Waldstein Total +1168 ±234 ±292 ±643
P R O D U C T I V I T Y O F F O R E S T S I N T H E E U R O S I B E R I A N B O R E A L R E G I O N 709
# 1999 Blackwell Science Ltd., Global Change Biology, 5, 703±722

stomatal closure at high D on CO2 assimilation
(Fig. 3h) is less obvious at the canopy level than the
leaf level (Vygodskaya et al. 1997). This analogy of
increasing scale leading to a lesser apparent effect of
D on H2O and CO2 exchange is striking and it points
to the possibility of similar compensating factors.
In addition to the extreme hydrological conditions,
forest growth in Siberia is constrained by the availability
of nitrogen and other nutrients. This is evident from an
examination of the self-thinning process (Westoby 1984).
For fully stocked pristine Siberian forests, the relation-
ship between stand biomass and tree density does not
follow the general self-thinning line characterized by a
slope of ±0.5 in a double logarithmic plot, and the
measured slopes are substantially lower than the species-
speci®c thinning lines for above-ground competition for
light of most conifers. This deviation can be explained by
strong below-ground competition altering the allometric
growth pattern of trees which determine the slope
(Osawa & Allen 1993; Wirth et al. 1999). It is suggested,
that an overall negative self-thinning slope of ±0.5
characterizes forest ecosystems in which low site quality
limits productivity. The attainable biomass at a certain
stand density can additionally be lowered by ®re
induced mortality, which mainly occur during an early
stage of stand development when trees have not yet
developed a ®re resistant bark (Wirth et al. 1999). In
young stands, ®re reduces stand density without
proportional effects on biomass. Following ®re, the
surviving trees develop towards closing the canopy
again, but due to nutrient and water limitations there is
not suf®cient time to reach the self-thinning line before
the next ®re occurrence. This effectively accelerates the
thinning process at a lower level of biomass than would
be expected from the available light. At a later stage of
development when ®re mortality decreases due to the
L
Fig. 3 Surface conductance (a), evaporation (b) and net CO2 assimilation (c) of Larix gmelinii stands (canopy plus ground cover)
during a period of dry weather, following a 20-mm rainfall. Understorey evaporation of Vaccinium (d) and lichens (e) as related to
available energy at the forest ¯oor. Ecosystem evaporation (f), conductance (g), and CO2 assimilation of Larix gmelinii as related to
the saturation de®cit of the air (h) (from Kelliher et al. 1997, 1998 and previously unpubl. data).
710 E . - D . S C H U L Z E et al.
# 1999 Blackwell Science Ltd., Global Change Biology, 5, 703±722

®re-resistant bark, below-ground competition deter-
mines the spacing of trees.
The effect of competition for nutrients is dif®cult to
quantify in the ®eld. Symptoms of nutrient de®ciency
(yellowing of needles or other nutrient related types of
damage) have not been observed in our Siberia plots
although nitrogen concentrations are extremely low (0.4±
0.6 mmolN gdw±1 in Pinus and 1.1 mmolN gdw
±1 in Larix).
The effect of nitrogen (N) competition becomes more
obvious from the needles of seed-trees left without
competition of neighbouring trees after logging. In such
trees the N concentration in 1-y old needles was
0.94 mmol gdw±1 (n = 9) as opposed to 0.54 mmol gdw
±1
for trees growing in a nearby close canopy that had not
been logged (n = 30). Similarly over 14 years, the radial
stem-wood increment was about 2.5 mm y±1 for the seed
trees but only 0.5 mm y±1 in the unlogged stand.
Surprisingly, the European managed spruce forest
shows a very similar thinning response to the Siberian
forests studied, albeit at a much higher biomass
(Fig. 4). In this case it is because forest management
effectively avoids competition for light by a common
silvicultural practice to cultivate a low density of trees
with special dimensions as construction wood. The
overall effect is that management can act in a very
similar way as ®re on the tree population in a natural
forest.
In contrast to Siberia, N deposition has changed the
recent growth rates of many forests in Europe (Spieker
et al. 1996). Indeed, at present, the volume increment
of German forests is twice as high as in reference
yield tables (Pretzsch 1996). The magnitude of the
effect can be demonstrated by an analysis of ring
growth for individual trees. Taking the German
Waldstein site as an example, Fig. 6a shows that trees
currently 140-y old grew at a much lower rate when
they were young, compared to today's trees from
younger stands. Also, 140-y old trees do not now
show a reduced growth rate as would be expected for
old growth stands (Kramer 1988). They are now
growing at a rate considered typical of young stands.
Although the change in growth has been mainly
related to nitrogen deposition (Schulze 1994a), an
associated interaction with increasing CO2 concentra-
tions is probable (Lloyd 1999).
The stem volume growth rates of Pinus sylvestris
trees in Siberia are lower by a factor of six compared
to Picea abies trees in Germany (note the difference in
y-axis scales in Fig. 6). In contrast to Europe, initial
growth rates of young stands in Siberia has hardly
changed since 1800 although there is a small and
signi®cant trend to increased regeneration-phase
growth for Siberian pine (Wirth 1996). Large effects
of ®re on subsequent tree growth are also evident.
The increased availability of nutrients after ®re
accounts for the initial rapid growth spurt which later
levels off. In the later stages of stand development,
smaller forest ¯oor ®res occur every 20±50 years which
do not destroy the stand, but burn the ground cover,
litter and part of the upper humus layer, and weak or
small trees. These ground-®res result in a 10±20-year
growth depression of the surviving trees due to ®re
damage followed by 10±15 years of accelerated growth
under the reduced competition and higher nutrient
supply. In 1995 the surviving trees in this stand were
in a stage of rapid growth following a major ®re in
the year 1965. The accelerated growth after ®re is an
additional indicator that water and nutrient supply are
major limiting factors, although in some cases the low
microbial activity may ultimately be limited by water
alone.
Net Ecosystem Exchange of CO2 (NEE), watervapour and heat
Net primary productivity supplies organic carbon as
an energy source for heterotrophic organisms, which
in turn recycle nutrients by decomposing the litter to
R
Fig. 4 Self-thinning of Larix gmelinii and
Pinus sylvestris stands in Siberia (Schulze
et al. 1995; Wirth et al. 1999), and Picea abies
in West Europe (Mund 1996).
P R O D U C T I V I T Y O F F O R E S T S I N T H E E U R O S I B E R I A N B O R E A L R E G I O N 711
# 1999 Blackwell Science Ltd., Global Change Biology, 5, 703±722

support plant growth. Thus, a large fraction of carbon
returns to the atmosphere due to microbial respiration
during litter decomposition (Townsend et al. 1995).
Litter mass and quality in combination with site
conditions (e.g. soil moisture) determine the microbial
activity in boreal soils (Ross et al. 1998). Because of the
very close interaction between tree roots, their
ectomycorrhizal fungal sheath and soil microbes, it is
not possible to separate these sources of respiratory
CO2 without major disturbance in forests. The net
ecosystem balance of assimilatory and respiratory
processes can however, be measured by the eddy
covariance technique. The BOREAS study showed how
Net Ecosystem Exchange (NEE) depends strongly on
the vegetation type (Baldocchi & Vogel 1997; Jarvis
et al. 1997; La¯eur et al. 1997) and exhibits strong year-
to-year variation (Goulden et al. 1997) in the boreal
zone.
The range of NEE in Central Siberia is given in Fig. 7
for different Pinus stands and a Sphagnum bog. Data
represent mean (6 SE) values over the same 5±10-day
period in mid-July 1996. Here we use the normal
micrometeorological convention in which downward
¯uxes from the atmosphere (i.e. net photosynthesis) are
denoted as negative. Daytime NEE reached ± 11 mmol
m±2s±1 in a 53-y old regenerating forest supplied with
ground water as well as rainfall. This level of CO2 uptake
was higher than in a 215-y old stand, while
7±13 y-old stands after logging had a daytime NEE close
to the ecosystem compensation point where assimilation
balances respiration (i.e. NEE = 0). During summer the
bog had a daytime NEE similar to the 215-y old forest
stand.
Compared to daytime net assimilation, night-time net
respiration was highest in the fast growing 67-y old
stand, followed by the logging areas. Lowest rates were
in the bog, where waterlogging probably inhibited
decomposition (Fig. 7). Eighty percent of respiration in
the 215-y old stand emanated from the ground (Kelliher
et al. 1999).
Table 4 summarizes the main components of carbon
and energy ¯uxes in Siberia and Europe. Energy
exchange was dominated mostly by sensible heat ¯ux
in forest stands [daily average Bowen ratios (H/LE) > 1]
in Siberia and Europe. This was also observed in
BOREAS (e.g. Baldocchi et al. 1997; Jarvis et al. 1997). At
a Bowen ratio of 2, 67% of incoming net radiation is
dissipated as sensible heat. This was 83% in logging areas
(Bowen Ratio 3±5) but only 38% for the bog (Bowen ratio:
0.6). In the bog the Bowen ratio was still higher than the
equilibrium value due to partial drying of the surface in a
largely rain-free measurement period (see Fig. 3). The
differences in energy dissipation between bogs and
forests in Siberia are important because return of water
vapour to the atmosphere is the major source of water for
precipitation. The delivery of vapor to the atmosphere by
logging areas is 30% lower than that of the bog (Fig. 7b).
The nonevaporated water from the logging areas is lost
to ground and surface waters which are in turn
regionally connected to the bog, at least in part. Reducing
inputs of water vapor to the atmosphere through
evaporation as a consequence of large scale logging in
west Siberia could affect the hydrological balance not
only in situ but also to the east of the continent unless
runoff contributes to increased wetland formation at sites
close to groundwater. In a patchy landscape the genera-
tion of heat from logging areas and the generation of
water vapor from bogs may promote convective storms
and this could in turn affect the ®re cycle. Effects of local
land-use practice on regional climate and stream ¯ow
have been demonstrated elsewhere (Stohlgren et al. 1998).
NEE-¯uxes exhibit even larger site-to-site variability
than the evaporation rates. NEE was most negative in
Europe, closely followed in Siberia by the well-watered
67-y old pine regeneration and a 200-y pristine old
growth forest, and by the bog. The differences in daytime
net assimilation are accentuated by variations in night-
time net respiration. Most strikingly, compared to all
other sites the 150-y old spruce forest near Moscow, the
Fyedorovskoye site, exhibited the most negative (max-
imum) NEE during the day, but this was compensated
by high night respiration to an extent that this stand was
usually a C-source on a 24-h basis. The same effect was
observed in the windthrow area. The 7-and 13-y old
logging areas were carbon sources on a 24-h basis, even
though they are covered by relatively fast growing trees
which were up to 5 m tall. The 24-h NEE of Pinus
sylvestris is similar to those of Pinus banksiana and Picea
mariana during the BOREAS project (Table 4)
Clearly, long-term ¯ux measurements are needed in
Siberia before further conclusions can be drawn. Such
measurements started in 1998. Figure 8 shows cumu-
lative seasonal NEE at the German site Waldstein,
above spruce forest and a bog in European Russia, the
Fyedorovskoye site, and above a 200-y old pine forest
in Central Siberia near Zotino, site at Bor Island. The
Bor Island site in Siberia is not identical to the
location for which data are shown in Fig. 7. It had
similar age to the 215-y old stand but a higher LAI
(1.9). The Sphagnum bog covered a larger area than the
bog whose data are shown in Fig. 7. Measurements
started after snow melt in April for Germany, and in
June for Russia.
From April to September 1998, the German forest net
CO2 uptake accumulated steadily during the growing
season. In September, however, respiration exceeded
assimilation which decreased the cumulative C-assimi-
lated from 19 to 15.5 mol m±2. Measurements started later
L712 E . - D . S C H U L Z E et al.
# 1999 Blackwell Science Ltd., Global Change Biology, 5, 703±722

in the year near Moscow, Fyedorovskoye site, where the
forest was a C-sink only in June. Later, it changed to a C-
source cumulatively delivering 7 mol m±2 to the atmos-
phere by early October. This contrasts with the Siberian
pine forest that exhibited on average a higher rate of daily
C-assimilation than the German forest. It reached a
cumulative net C-uptake of ± 14 mol m±2 by the end of
the growing season. The C-assimilation characteristics of
bogs seem similar in European Russia and Siberia. In both
cases assimilation started later than in nearby forest due to
frozen ground in the wetter bogs and net assimilation
there reached a cumulative level of 7 mol m±2 by the end of
the growing season. The high rate of net C-assimilation for
the Siberian forest compared to the German and European
Russian forest is surprising given the harsh climatic
conditions in Siberia and low NPP. Most unexpected was
the response of the pristine 200-y old spruce forest near
Moscow. Initially this forest had net assimilation in spring
that was lower than at all other sites although daytime
NEE reached the most negative rates. However, respira-
tion there was very high probably due to the 0.5 m deep
peat soil. The response of this forest is very similar to that
of a spruce forest in central Sweden (NOPEX site,
Lindroth et al. 1998). The NOPEX forest changed to an
even stronger C-source than the Fyedorovskoye forest
after 1±2 months of assimilation delivering 9±10 mol m±2
to the atmosphere. Seasonal NEE is thus not simply
related to the NPP, and it can vary greatly from the
photosynthetic capacity (measured as maximum daytime
ecosystem exchange). NEE also depends strongly on
respiration of the organic layer, and this carbon pool
accumulated over decades to centuries. Decomposition
takes place not only in recent litter but also in older layers
(Townsend et al. 1995), and it thus acts as a `ecosystem
R
Table 4 Bowen ratios and daily mid summer ecosystem ¯uxes of water (mm d±1) and carbon dioxide (mmol m±2 d±1), averages of 5±
20 days of measurement in July 1996. n.d. not determined. For comparison the lower part of the table contains data for different
study sites of the BOREAS experiment: (1) Baldocchi et al. 1997; (2) McCaughey et al. 1997; (3) Pattey et al. (1997); (4) Jarvis et al. 1997;
(5) Goulden et al. 1997; (6) La¯eur et al. 1997; (7) Suyker et al. 1997
Ecosystem C-¯ux in July
(mmol m±2s±1)
Av.daily Daily (mmol m±2 d±1) Leaf area
Bowen evaporation day night daily sum index
Location Ratio (mm d±1) max. average in summer (m2 m±2)
Germany
Waldstein
43-y Picea 2.0 1.3 ±15 3.1 ±210 8.1
European Russia
Fyedorovskoye
110-y Picea 1.6 1.9 ±19 6.3 +44 8.0 long-term site
Sphagnum bog 0.7 1.6 ±6 2.1 ±62 n.d. long-term site
Windthrow 1.1 1.3 ±6 4.4 +164 < 1
Siberia
140-y Larix 1.4 1.6 ±7 2.1 ±63 1.4
200-y Pinus 2.1 1.7 ±11 1.5 ±174 1.9 long-term site
215-y Pinus 2.6 1.4 ±9 1.5 ±61 0.6
Lichen woodland 2.0 1.3 ±6 2.0 ±30 0.1
67-y Pinus 0.9 2.6 ±11 1.1 ±192 1.9
7-y logging 5.2 0.8 ±7 1.8 +14 0.2
13-y logging 2.9 1.2 ±4 1.5 +8 0.2
Sphagnum Bog 1 0.6 2.6 ±7 0.7 ±104 n.d.
Sphagnum Bog 2 0.5 3.0 ±6 1.1 ±102 n.d. long-term site
Canada (BOREAS)
Pinus banksiana old 1±2 < 2.5 ±17 n.d. n.d. 1.9±2.2 (1)
Pinus banksiana yg 1±4 2±3 ±6 1.1 ±158 1.1 (2)
Picea mariana 54°N 1±2 1±3 ±8 2.0 ±188 3.7±4.0 (3)
Picea mariana 54°N 1±3 2 ±9 6 ±66 4.5 (4)
Picea mariana 56°N 2 0.6 ±10 5 0 n.d. (5)
Fen 0.1±0.2 1±2 ±10 n.d. +6 n.d. (6)
Fen n.d. n.d. ±13 n.d. ±52 n.d. (7)
P R O D U C T I V I T Y O F F O R E S T S I N T H E E U R O S I B E R I A N B O R E A L R E G I O N 713
# 1999 Blackwell Science Ltd., Global Change Biology, 5, 703±722

memory' which may compensate C-assimilation under
certain conditions (Fyedorovskoye site). Also, Fig. 8
shows, that high NEE is possible at high and low NPP
sites, which was suggested in marine studies (Williams
1998).
The seasonally, integrated NEE over summer also
varied greatly during BOREAS (± 8 to ± 18 molC per
summer season; Jarvis et al. 1997; McCaughey et al.
1997a). However, including winter respiration, the
Picea mariana forest of Goulden et al. (1997) was at or
slightly above its compensation point. This demon-
strates possible signi®cance of winter respiration
(Zimov et al. 1993; Winston et al. 1997). These data
are not yet available for Siberia, but the German forest
was at the compensation point all winter (Rebmann,
unpubl.). Therefore the annual carbon balance was not
affected signi®cantly by the relatively mild European
winter where assimilation continued to balance
respiration. Wetlands also showed a great variability
during BOREAS ranging between an annual carbon
source (+ 0.05 molC m±2: McCaughey et al. 1997b) and
a carbon sink (± 7 molC m±2: Suyker & Verma 1997).
Both Russian Sphagnum bogs were larger C-sinks than
those studied in Canada.
The effects of disturbances on the carbonbalance
In theory, NEE measured by eddy covariance should
represent the long-term ecosystem carbon balance, as
de®ned by NEP. On average, for the years 1996 and 1997
NEE was ± 272 gC m±2 y±1 in a total of 8 ¯ux studies in
temperate coniferous and broad-leaved forests of
Europe, and ± 46 gC m±2 y±1 in 4 boreal coniferous forests
of the EUROFLUX network (Euro¯ux report 1997,
Contract ENV4-CT95±0078, EEC-DGXII D2, Brussels,
Belgium). This rate seems high considering an average
NPP of 459 gC m±2 y±1 across Europe (Fig. 2).
Obviously, NEE over 1-y periods is unlikely to
include disturbances. In Siberia, even continuous
measurements over 2 years have a < 10% chance of
including a ®re in the study. The long-term rate of
carbon sequestration includes periodic but rare dis-
turbances. At present the effect can only be quanti®ed
by inventory data of above and below-ground carbon
pools. Shvidenko & Nilsson (1999) thus estimate a net
carbon ¯ux from the atmosphere into the soil of
± 0.8 mol m±2 y±1 (10.1 gC m±2 y±1) during the period of
1961±83 in Russia. However, in the following 10 years,
Russia changed from a net sink to a net source for
carbon (+ 0.6 mol m±2 y±1 = 7.1 gC m±2 y±1) due to
anthropogenic and natural disturbances. These larger
scale and longer term rates are much lower than the
annual NEE measurements in Siberia, North American
and European temperate and boreal forests (EURO-
FLUX report 1997; BOREAS, special issue J. Geophys
Res. 102D; Fig. 8 of this study). In a regional
assessment of carbon exchange by forests of the
Paci®c north-west of Canada which included anthro-
pogenic disturbances by logging, Cohen et al. (1996)
demonstrated that over time this region is a C-source
with an annual net carbon ef¯ux to the atmosphere as
large as 9 mol CO2 m±2 y±1 despite reafforestation.
Thus, forest inventory data point to much lower
carbon exchange rates than NEE measurements which
needs further examination. We suggest that episodic
disturbances, which change NEE, have not been
included in monitoring programs. This may lead to
erroneous conclusions about longer term carbon
exchange rates. An example of the effect of ecosystem
disturbance is presented in Fig. 8, where a 2-y old
windthrow lost 16 molC m±2 over a 3-month period in
summer, which is more than the rate of assimilation
of the 43-y old spruce forest in Germany. Based on
the decay rate of wood, we estimate that windthrough
may affect the forest carbon balance as long as
30 years (A. Knohl, unpubl.).
Figure 9 classi®es disturbances in terms of the fate of
carbon in ecosystems. There are disturbances that act as
continuous forcing on ecosystems, such as daily, seaso-
nal, or long-term changes in temperature, CO2 concen-
tration and net radiation. The effects of these
environmental ¯uctuations on NEE can be determined
when eddy covariance measurements are conducted
over a period of several years or if these are included
in the resultant carbon models. However, there are also
periodic or rare events which disrupt the ecosystem
exchange, such as uprooting of trees by strong winds or
insect outbreak or ¯ooding. These events may turn
ecosystems temporarily or permanently into different
types of communities, until forest regeneration takes
place. Plant debris from the forest may remain in the
community, but there may also be an increase in soil
respiration by microbial decomposition. Thus even if net
carbon uptake occurred over a decade, it is possible that
this carbon could be lost by severe disturbance in the
following decade. There are also different disturbances,
like logging, grazing and ®re, which export carbon and
nitrogen from an ecosystem bypassing heterotrophic
respiration. In the Russian forests, 87 3 1012 gC y±1 are
harvested, of which 27% remains on site as slash, with
77% removed from harvest site, 16% exported for local
fuel and 57% for industrial products such as paper and
other wood products (Shvidenko & Nilsson 1998). In the
west European forests 180 3 1012 gC y±1 were exported
from the ecosystem by harvesting in 1990 (Stanners &
Bourdeau 1995).
L714 E . - D . S C H U L Z E et al.
# 1999 Blackwell Science Ltd., Global Change Biology, 5, 703±722

Fire is a natural disturbance factor which occurs
regularly in the boreal forest of Siberia with the average
area affected being about 3.5 million ha y±1 (0.6% of the
forest area, Shvidenko & Nilsson 1999). In central Siberia,
we estimate from ®re scares in stem-wood cross sections,
that ground ®res may occur at a relatively higher
frequency (50% probability of a 30-y return period) than
do crown ®res (every 100±200 y). During ground ®res,
the litter and surface organic layer are burnt. Most ®re
frequency models assume a Poisson probability distribu-
tion of occurrence (Johnson & Gutsell 1994). This implies
that ®res are dependent on climate and independent of
fuel load, which is debatable for forests. Figure 6
indicates from the growth depression that occurred in
all age classes that sometimes all stands burn in the same
region irrespective of age and fuel load.
Fire has several consequences at the ecosystem level.
One dramatic effect is that if two crown ®res occur in
close succession or if crown ®res occur over large areas,
the forest may not be able to regenerate due to a lack of
seed trees and sites for germination. In the Siberian pine
forest region, such patches of vegetation dominated by
lichens are frequently encountered. Here pine seems not
able to regenerate unless another ground ®re occurs.
Since the fuel load of lichens is sparse, these patches
usually remain and may become stable lichen woodlands
(see Table 4).
Fire returns the above-ground litter and upper soil
carbon to the atmosphere at a much faster rate than
natural decomposition. Thus, ®re can be simply seen as
accelerating the carbon cycle, decreasing the average
standing biomass and contributing to the observation
that boreal forest stands typically operate below the
theoretical self-thinning line (Fig. 5). However, besides
the conversion of organic matter into CO2, ®re also
immobilizes carbon as charcoal or black carbon (see
below).
Table 5 (upper part) summarizes the carbon stores of
soils at a burnt and an unburnt site on Bor Island, close to
Zotino, and where a large-scale ®re experiment was
undertaken in 1993 (Goldammer & Furyaev 1996). The
unburnt site had an ecosystem carbon density of about
766 molC m±2 with 54% in the above-ground biomass,
37% in the organic layer including dead trees and 9% as
soil organic matter. Trees were not consumed by the
intensive crown ®re but they subsequently died, increas-
ing greatly the `fresh' litter pool. Due to the mobilization
of organic carbon after the ®re, the amount of organic
matter in the soil E-horizon had increased at the time of
sampling which was 3 years after ®re. Overall, ®re
reduced the ecosystem carbon pool by only 23%
although the organic layer (including dead trees) pool
almost doubled.
The effect of ground ®res is not as dramatic (Table 5
lower part). Even though repeated forest ¯oor ®res
apparently occurred in our Siberian chronosequence (see
Fig. 6), carbon density in the litter and O3 + A-layer
increased with stand age.
Shvidenko & Nilsson (1999) estimate that 150 3 1012 gC
(2.1 mol C m±2 y±1) are lost by direct (58 3 1012 gC y±1) and
indirect (92 3 1012 gC y±1) effects of ®re in Russia. The
latter includes post®re respiratory losses.
Black carbon
Black carbon is the fraction of soil carbon considered to
be in a semistable form (Kuhlbusch 1998). It may
originate from microbial activity during decomposition
as well as from charcoal formation due to the incomplete
combustion of biomass during ®res (Haumaier & Zech
1995; Kuhlbusch & Crutzen 1995). Black carbon in soils
can be identi®ed by its level of condensation which may
be measured by the Hydrogen/C or Oxygen/C ratio
(Haumaier & Zech 1995).
R
Fig. 5 Annual growth of tree volume (m3 tree±1 y±1) as derived from tree ring analysis for (a) Picea abies in West Europe (Mund 1996)
and (b) Pinus sylvestris in central Siberia (Wirth 1996).
P R O D U C T I V I T Y O F F O R E S T S I N T H E E U R O S I B E R I A N B O R E A L R E G I O N 715
# 1999 Blackwell Science Ltd., Global Change Biology, 5, 703±722

In the 215-y-old Siberian pine stand (Fig. 10) the
H/Cratio of untreated organic (bulk) material de-
creased from about 1.5 in the litter layer to < 1 in the
soil A and AE horizon (LuÈ hker 1997). However, it
increased again in the soil B-horizon. The organic
material from each horizon contains decomposing
matter as well as charcoal and ®ne, dust-like particles.
The fraction of black carbon in this mixture of
compounds can be quanti®ed after solvent extraction
and a thermal treatment at 340 °C in pure oxygen
(Kuhlbusch 1995). In litter, the H/C-ratio of treated
material was 75% lower than in untreated material,
but in the A-and AE-horizon, nearly the same H/C
ratio was obtained in treated and untreated material,
indicating a large fraction of black carbon.
Table 6 shows the black carbon content by soil horizon
taking into account the loss of weight during combus-
tion. The black carbon content is very low in the litter and
O2-layer (mainly dust-like particles), but it increases in
the lower humus and E-horizons, reaching a maximum
in the EB-horizon (charcoal and dust like particles). Tree
roots were observed to grow as a solid mat in a charcoal
layer of the O3-horizon. On average, we ®nd about 65±70
molC m±2 as black carbon in the organic layer and
mineral soil including the B-horizon. This represents
20±24% of the total soil carbon. The C-horizon contains
an additional 20 mol C m±2 black carbon which is 13% of
the total soil C there.
Net Biome Productivity (NBP)
Schulze & Heimann (1998) advocate that the concept of
NEP needs to be extended to account for disturbances
that lead to carbon losses which bypass heterotrophic
respiration, such as ®re and harvest. The carbon
exchange rate that includes these processes has been
termed `Net Biome Productivity', NBP. We know of no
previous attempts to measure NBP and compare it with
NPP and NEP.
As an example, we shall try to quantify the long-term
effect of ®re. First and following Shvidenko & Nilsson
(1999), assuming that 2.6% of the carbon which was
directly released by ®re (58.1 3 1012 g y±1) was converted
to charcoal (IPPC-Guidelines 1997), on average 16
mmolC m±2 y±1 would enter the soil in this form in
Russia. Obviously, this rate is much smaller than the net
change in Russian carbon stocks of 800 mmol m±2 y±1 for
Russia for 1961±83 (Shvidenko & Nilsson 1999). Follow-
ing Table 6, the soil pro®le in central Siberian pine forest
contained a total of 65±72 mol black C m±2 to the depth of
0.75 m (B-horizon). Assuming 16 mmol C m±2 y±1 charcoal
production, this suggests that the region has been
exposed to ®res for the last 4063 years. This estimate
can be cross-checked by radio-carbon dating. The age of
L
Tab
le5
Th
eco
mp
artm
enta
liza
tio
no
fec
osy
stem
carb
on
(mo
lC/
m2)
ina
Sib
eria
nP
ine
fore
st(0
±0.5
mso
ild
epth
).D
ata
rep
rese
nt
aver
ages
of
3±5
sam
ple
sp
ersi
tew
hic
hw
ere
tak
en
inth
em
idd
leb
etw
een
tree
s,w
hic
hw
asin
mo
stca
ses
ou
tsid
eth
ecr
ow
np
roje
ctio
n
Ab
ov
e-g
rou
nd
liv
eb
iom
ass
So
ilca
rbo
n/
ho
rizo
n
Sta
nd
No
.of
age
tree
sm
±2
Wo
od
Nee
dle
Lic
hen
To
tal
Lit
ter
Dea
dtr
ees
O3
+A
A/
EE
BT
ota
l
bu
rnt
Bo
r0
00
00
1749
20
3124
2294
un
bu
rnt
Bo
r0.
1434
019
5441
325
155
102
3010
3119
8
280.
9565
105
8029
9525
616
1490
660.
2829
928
633
329
230
3222
356
124
139
0.11
403
167
426
4121
819
2011
1110
2
202
0.08
435
195
459
4963
5027
3013
169
215
0.03
274
13n
.d.
287
5136
5041
5161
254
383
0.05
594
237
624
5983
4231
446
182
av.2
8±38
334
518
637
843
120
3624
3118
152
716 E . - D . S C H U L Z E et al.
# 1999 Blackwell Science Ltd., Global Change Biology, 5, 703±722

the Siberian black carbon at the base of where it
accumulates was 5250 years and 4910 years in two
independent soil samples (AMS 14C-analysis laboratory
Kiel, Germany). If the 65 mol black C m±2 accumulated in
about 5000 years, the accumulation rate would be
13 mmol m±2 y±1.
Schlesinger (1990) derived a long-term C-accumulation
rate of 67 mmol m±2 y±1 for North American boreal forest
by an indirect approach of measuring organic carbon
content in an age sequence of soils. Extrapolating from
accumulations of soil nitrogen (and accounting for the
nonlinearity of C-immobilization: Schlesinger 1990), it is
possible that NBP may reach the order of 140±400 mmol
m±2 y±1 in Scandinavia (Schulze et al. 1989b). In all cases
NBP is less than 1 ½ of NPP, but that carbon is
immobilized in a long-term carbon sink.
The Role of intermediate carbon pools as carbon sinks
The differences between NPP, NEP and NBP result
from different time constants for carbon turnover and
these can be associated with or result in intermediate
carbon pools. The importance of these intermediate
pools as global carbon stores has been discussed by
Melillo et al. (1996) with respect to the effects of
elevated CO2. They estimated a lag period of 30 years
for NPP to preceed heterotrophic respiration during
CO2 forcing. When taking into account the disturbance
cycle of ®re and harvest, intermediate pools are
probably turned over faster with management, i.e
the lag would decrease below 30 years. Buying time,
with respect to reduction of carbon emissions, may
thus become more dif®cult if forests are managed
R
Fig. 6 Average daily courses of ecosystem
CO2 exchange of (a) Siberian pristine pine
forest and natural regeneration after ®re,
(b) Regrowth after logging, and (c) a bog
all located near Zotino, Central Yenisey
River, July 1996.
P R O D U C T I V I T Y O F F O R E S T S I N T H E E U R O S I B E R I A N B O R E A L R E G I O N 717
# 1999 Blackwell Science Ltd., Global Change Biology, 5, 703±722

using conventional plantation forestry techniques
(WBGU 1998).
According to the Kyoto protocol to the UN Framework
Convention on Climate Change, the biological sinks of
reforestation and afforestation minus deforestation can
be used to balance anthropogenic emissions of carbon
from fossil fuels (Steffen et al. 1998). In this context it is
important to estimate the net biome effect, because it is
not at all clear if the balance of deforestation and
reforestation will create sources or sinks for carbon
dioxide (WBGU 1998). Firstly, for Siberia, our 200-y old
forests were larger C-sinks during summer (as measured
by NEE) than two younger regenerating forests and
reached a cumulative rate close to a managed spruce
forest in Germany. Secondly, inspecting all biomass
compartments and carbon ¯uxes it emerges that main-
taining old growth pristine forest with a 30-yr ground
®re cycle contributes more to the global carbon budget
(in terms of reducing atmopsheric carbon dioxide
concentrations) than logging pristine forest and estab-
lishing new forest on mineral soil. This is because of the
large amounts of carbon in biomass and in the organic
layer which is lost during logging. Based on our forest
growth curves, it takes > 200 years to replace the living
biomass removed when old-growth forests are logged,
and it will take even longer to replace the soil carbon lost
due to the mechanical disturbance.
Conclusions
Siberian forest productivity is low compared to Eur-
opean forests. On average, NPP is 10.2 mol m±2 y±1 in
Siberia vs. 38 mol m±2 y±1 in Europe (positive sign for
productivity). In summer, NEE (negative sign for ¯uxes
from the atmosphere) is ± 30 to ± 192 mmol m±2 d±1 or ±5
to ± 14 mol m±2 summer±1 in natural systems of Siberia,
but + 11 mol m±2 d±1 in logging areas, as compared to
±210 mol m±2d±1 (± 15.5 mol m±2summer±1) in Germany. A
mature spruce forest in European Russia was a C-source
(+ 7 mol m±2summer±1). NBP (positive sign for product-
ivity) is 13 to 16 mmol m±2 y±1 in Siberia but may reach
> 140 mmol m±2 y±1 in Europe.
L
Fig. 7. Cumulative carbon ¯uxes for
Picea abies in West Europe, Picea abies in
European Russia and Pinus sylvestris in
Central Siberia, as well as of Sphagnum
bogs in European Russia and Central
Siberia. The cumulative carbon losses of a
2-y windthrow area in European Russia
are also shown.
Table 6 Content of total carbon and black carbon (molC/m2)
in different soil layers of a 215-y old stand (av 6 SD). The
samples were taken near the stem (n = 4), in the middle of the
projected crown (n = 3) and the edge of the crown projection
(n = 3), and in the middle between trees (n = 1, see also
Table 5). The C-horizon was sampled only outside the crown
Horizon Total soil C Black C % of total C
Crown centre
L-O2 91.4 6 11 0.51 6 0.06 0.6
03-E 136.1 6 7 19.47 6 1.33 14.3
EB 77.3 6 15 33.41 6 6.70 43.2
B1 25±50 39.6 6 3 15.60 6 2.09 39.4
B2 50±75 20.4 6 2 2.55 6 0.27 12.5
Subtotal 365 72 20
Outside crown
L-O2 50.6 6 8 0.28 6 0.05 0.6
03-E 90.6 6 5 11.65 6 2.29 12.9
EB 51.3 6 7 22.60 6 2.91 44.1
B1 25±50 61.5 6 12 26.32 6 5.66 42.8
B2 50±75 20.1 6 2 3.79 6 1.11 18.9
Subtotal 274 65 24
C 75±300 151.0 6 27 19.55 6 4.63 12.9
718 E . - D . S C H U L Z E et al.
# 1999 Blackwell Science Ltd., Global Change Biology, 5, 703±722

The Bowen ratio is typically high in boreal forests,
especially in logging areas. This results in the generation
of sensible heat, which may affect climate. The interac-
tion of bogs with Bowen ratios < 1 and forest with Bowen
ratios > 1 may enhance convective storms which affect
runoff and the ®re cycle.
Disturbances signi®cantly affect the carbon balance.
Logging areas exhibit an NEE close to zero for up to
13 years despite high NPP in the regenerating stand.
Windthrow also leads to massive C-losses. The C-loss of
the spruce forest in European Russia seems to be related
to an activation of soil organic carbon rather than to a
loss in assimilation capacity. Fire speeds up the carbon
cycle and reduces standing biomass, but adds to the soil
black carbon pool by the production of charcoal.
Old forest stands of Siberia can be signi®cant carbon
sinks and reach a cumulative annual carbon ¯ux that is
close to that in Germany despite a much lower NPP. The
high NEP of Siberian forest is however, at high risk to be
lost by disturbance through ®re. In contrast, forests with
high rates of C-assimilation may be a C-source if high
rates of decomposition of organic carbon in the soil leads
to high ecosystem respiration rate as in the case of the
spruce forest in European Russia where the soil organic
matter is an old peat layer. Thus relations between NPP
and NEP are more complex than previously thought and
they seem to be strongly dependent on processes in the
soil, where C-pools may accumulate or disintegrate over
very long time periods and act as a `ecosystem memory'.
In Siberia, maintaining old growth pristine forest
contributes more to the global net carbon sink than
reforestation after logging.
Acknowledgements
This research began in 1993 with support of the German
Bundesminister fuÈ r ErnaÈhrung, Landwirtschaft und Forsten,
the Humboldt foundation (Max-Planck Forschungspreis), the
New Zealand Foundation for Research, Science and Technol-
ogy, and the New Zealand/German Agreement for Scienti®c
and Technological Co-Operation. The ¯ux measurements in
1996 through 1998 were funded by the Volkswagen Founda-
tion (I/71 846) and later by the EEC (EUROFLUX network at
the Waldstein site and EUROSIBERIAN CARBON FLUX
project at the Fyedorovskoye and the Zotino site). The long-
term measurements were instrumented by the MPI for
Biogeochemistry.
R
Fig. 9. Molar C/H ratios of litter and humus material before
and after combustion at 340 °C in oxygen.
Fig. 8. Classi®cation of ecosystem
disturbances with respect to effects on the
carbon and nitrogen cycle.
P R O D U C T I V I T Y O F F O R E S T S I N T H E E U R O S I B E R I A N B O R E A L R E G I O N 719
# 1999 Blackwell Science Ltd., Global Change Biology, 5, 703±722

References
Alexeyev VA (1975) Light Regime of Forests. Nauka, Leningrad
(Russian).
Arneth A, Kelliher FM, Bauer G et al. (1996) Environmental
regulation of xylem sap ¯ow and total conductance of Larix
gmelinii (Rupr.) Rupr. trees in Eastern Siberia. Tree Physiology,
16, 247±255.
Axelsson B, Brackenhielm S (1980) Investigation sites of the
Swedish Coniferous Forest project ± biological and physio-
logical features. In: Structure and Function of Northern
Coniferous Forests (Persson T, ed.). Ecological Bulletin, 32,
25±64.
Baldocchi DD, Vogel CA, Hall B (1997) Seasonal variation of
energy and water-vapor exchange rates above and below a
boreal jack pine forest canopy. Journal of Geophysical Research,
102D, 28939±28951.
Bauer G, Schulze E-D, Mund M (1996) Nutrient status of the
evergreen conifer Picea abies and the deciduous hardwood
Fagus sylvatica along a European transect. Tree Physiology, 17,
777±786.
Botkin DB, Simpson LG (1990) Biomass of North American
boreal forest. Biogeochemistry, 9, 161±174.
Ciais P, Tans PP, Trolier M, White JWC, Francey RJ (1995) A
large northern hemisphere terrestrial CO2 sink indicated by
the 13C/12C-ratio of atmospheric CO2. Science, 269, 1098±1102.
Cohen WB, Harmon ME, Wallin DO, Fiorella M (1996) Two
decades of carbon ¯ux from forests of the Paci®c Northwest.
Bioscience, 46, 836±844.
Denning SA, Collatz GJ, Zhang C et al. (1996) Simulations of
terrestrial carbon metabolism and atmospheric CO2 in a
general circulation model. Part 1: Surface carbon ¯uxes. Tellus,
48B, 521±542.
Fan S, Gloor M, Mahlman J, Pacala S, Sarmiento J, Takahashi T,
Tans P (1998) A large terrestrial carbon sink implied by
atmospheric and oceanic carbon dioxide data and models.
Science, 282, 456±457.
FAO (1990) Forest resource assessment 1990. Global Synthesis
FAO Forestry Paper, 124, 1±44.
Goldammer JG, Furyaev VV (eds) (1996) Fire in Ecosystems of
Boreal Eurasia. Kluwer, Dordrecht.
Goulden ML, Daube BC, Fan SM, Sutton DJ, Bazzaz A, Munger
JW, Wofsy SC (1997) Physiological responses of black spruce
forest to weather. Journal of Geophysical Research, 102D, 28,987±
28,996.
Gower ST, Vogel JG, Norman JM, Kucharik CJ, Steele SJ, Stow
TK (1997) Carbon distribution and aboveground net primary
production in aspen, jack pine, and black spruce stands in
Saskatchewan and Manitoba. Canadian Journal of Geophysics
Research, 102D, 29,029±29,041.
Gravenhorst G, Vygodskaya NN, Oltchev A (1998) Deutsch-
Russisches Umweltabkommen. Wissenschaftliche Grundla-
gen fuÈ r ein umfassendes Monitoring von OÈ kosystemen
einschlieblich des Monitorings in BiosphaÈrenreservaten und
Schutzgebieten. Forschungszentrum WaldoÈkosysteme, Uni.
GoÈttingen, B57/1998, 280.
Grelle A, Lundberg A, Lindroth A, Moren A-S, Cienciala E
(1997) Evaporation components of a boreal forest: Variation
during the growing season. Journal of Hydrology, 197, 70±87.
Haumaier L, Zech W (1995) Black carbon ± possible source of
highly aromatic components of soil humic acids. Organic
Geochemistry, 23, 191±196.
Hollinger DY, Kelliher FM, Schulze E-D et al. (1998) Forest-
atmosphere carbon dioxide exchange in eastern Siberia.
Agricultural and Forest Meteorology, 90, 291±306.
IPPC-Guidelines (1997) Greenhouse Gas Inventory Reference
Manual, Vol. 3, Footnote 18. IPCC-WGI Technical Support
Unit, Hadley Centre Meteorological Of®ce, Bracknell, UK.
Isaev AS (ed.) Forecast of the Utilization and Reproduction of the
Forest Resources by Economic Regions of the USSR, Vols 1 and 2,
Academy of Sciences of the USSR and the State Forest
Committee of the USSR, Moscow (Russian)
Jackson RB, Mooney HA, Schulze E-D (1997) A global budget for
®ne root biomass, surface area, and nutrient contents.
Proceedings of the National Academy of Sciences of the USA, 94,
7362±7366.
Jarvis PG, Massheder JM, Hale SE, Moncrieff JB, Rayment M,
Scott SL (1997) Seasonal variation of carbon-dioxide, water-
vapor, and energy exchanges of a boreal black spruce forest.
Journal of Geophysical Research, 102D, 28953±28966.
Johnson EA, Gutsell SL (1994) Fire frequency models, methods
and interpretations. Advances in Ecological Research, 25, 239±
287.
Kajimoto T, Matsuura Y, Sofronov MA, Volokitina AV, Mori S,
Osawa A, Abaimov AP (1998) Above- and below-ground
biomass and net productivity of Larix gmelinii near Tura,
central Siberia. Tree Physiology, 18, in press.
Karpov E (1973) Structure and productivity of spruce forests of
south taiga. NAUKA, Leningrad (Russian).
Keeling RF, Piper S, Heimann M (1996) Global and hemispheric
CO2 sinks deduced from recent atmospheric oxygen measure-
ments. Nature, 381, 218±221.
Kelliher FM, Hollinger DY, Schulze E-D et al. (1997) Evaporation
from an eastern Siberian larch forest. Agricultural and Forest
Meteorology, 85, 135±147.
Kelliher FM, Lloyd J, Arneth A et al. (1998) Evaporation from a
central Siberian pine forest. Journal of Hydrology, 205, 279±296.
Kelliher FM, Lloyd J, Arneth A et al. (1999) Carbon dioxide ef¯ux
density from the ¯oor of a central Siberian pine forest.
Agricultural and Forest Meteorology, in press.
KoÈrner Ch, Schilcher B, Pelaez-Riedl S (1993) Bestandesauf-
nahme: anthropogene Klimatunderungen: MoÈgliche Auswir-
kungen auf OÈ sterreich ± MoÈgliche Massnahmen in OÈ sterreich.
OÈ sterreichische Akademie der Wissenschaften Kapitel, 6, 1±46.
Kramer H (1988) Wald-Wachstumskunde. Paul Parey, Hamburg,
374pp.
Kuhlbusch TAJ (1995) Method for determining black carbon in
residues of vegetation ®res. Environmental Science and
Technology, 29, 2695±2702.
Kuhlbusch TA (1998) Black carbon and the carbon cycle. Science,
280, 1903±1904.
Kuhlbusch TAJ, Crutzen PJ (1995) Toward a global estimate of
black carbon in residues of vegetation ®res representing a sink
of atmospheric CO2 and a source of O2. Global Biogeochemical
Cycles, 9, 491±501.
La¯eur PM, McCaughhey JH, Joiner DW, Bartlett PA, Jelinski
DE (1997) Seasonal trends in energy, water and carbon
dioxide ¯uxes in a northern boreal wetland. Journal of
Geophysical Research, 102D, 29,009±29,020.
Lindroth A, Grelle A, MoreÂn AS (1998) Long-term measure-
ments of boreal forest carbon balance reveal large tempera-
ture sensitivity. Global Change Biology, 4, 443±451.
Lloyd J (1999) The CO2 dependence of photosynthesis, plant
L720 E . - D . S C H U L Z E et al.
# 1999 Blackwell Science Ltd., Global Change Biology, 5, 703±722

growth responses to elevated CO2 concentrations and their
interaction with soil nutrient status II. Temperate and boreal
forest productivity and the combined effects of increasing
CO2 concentrations and increased nitrogen deposition at a
global scale. Functional Ecology (in press).
LuÈ hker B (1997) Die Bestimmung Von Wurzelbiomasse Und
KohlenstoffvorraÈten in BoÈden Sibirischer Waldkiefern-BestaÈnde
Nach Brand Und Aufforstung Unter Besonderer BeruÈcksichtigung
Der Quanti®zierung Von Black Carbon. Diplomarbeit, Bayreuth.
ManoÈ S, Andeae MO (1994) Emission of methyl bromide from
biomass burning. Science, 263, 1255±1257.
McCaughey JH, La¯eur PM, Joiner DW, Bartlett PA, Costello
AM, Jelinski DE, Ryan MG (1997) Magnitudes and seasonal
patterns of energy, water, and carbon exchange at a boreal
young jack pine forest in the BOREAS northern study area.
Journal of Geophysical Research, 102D, 28,997±29,007.
Melillo JM, McGuire AD, Kicklighter DW, Moore III B,
Vorosmarty CJ, Schloss AL (1993) Global climate change
and terrestrial net primary production. Nature, 263, 234±240.
Melillo J, Prentice C, Schulze E-D, Farquhar G, Sala O (1995)
Terrrestrial ecosystems: Responses to global environmental
change and feedbacks to climate. In: Climate Change 1995
(Houghton JT et al., eds). IPCC-WGI Chapter, 9, 445±482.
Miachkova NA (1983) Climate of USSR. MGU (Moscow State
University), Moscow, 191pp (Russian).
Molchanov AA (1968) Hydrological Role of Forest. Academy of
Science USSR, Moscow, 488pp (Russian).
Monserud RA, Onuchin AA, Tchebakova NM (1996) Needle,
crown, stem, and root phytomass of Pinus sylvestris stands in
Russia. Forest Ecology and Management, 82, 59±67.
Moore TR (1996) The carbon budget of boreal forests: Reducing
the uncertainty. In: Global Change: Effects on Coniferous Forests
and Grasslands (Breymeyer AI, Hall DO, Melillo JM, Aagren
GI, eds). SCOPE, 56, 17±40.
MuÈ ller M (1982) Selected Climatic Data for a Global Set of Standard
Stations for Vegetation Science. Dr W. Junk, The Hague.
Mund M (1996) Wachstum Und Oberirsische Biomasse Von
FichtenbestaÈnden (Picea Abies L.Karst.) in Einer Periode
Anthropogener StickstoffeintraÈge. Diplomarbeit, Bayreuth.
Osawa A, Allen RB (1993) Allometric theory explains self-
thinnig relationships of mountain beech and red pine. Ecology,
74, 1020±1032.
Pattey E, Desjardins RL, St-Amour G (1997) Mass and energy
exchanges over a black spruce forest during key periods of
BOREAS 1994. Journal of Geophysical Research, 102D, 28,967±
28,975.
Potter CS, Randerson JT, Field CB, Matson PA, Vitousek PM,
Mooney HA, Klooster SA (1993) Terrestrial ecosystem
production: a process model based on global satellite and
surface data. Global Biogeochemistry and Cycles, 7, 811±841.
Pretzsch H (1996) Growth trends of forests in Southern
Germany. European Forest Institute Research Report, 5, 107±131.
Rayner PJ, Enting IG, Francey RJ, Langenfels R (1999)
Reconstructing the recent carbon cycle from atmospheric
CO2, d13C and O2/N2 observations. Tellus, in press.
Ross DJ, Kelliher FM, Tate KR (1998) Microbial processes in
relation to carbon, nitrogen and temperature regimes in litter
and a sandy mineral soil from a central Siberian Pinus
sylvestris forest. Soil Biology and Biochemistry, in press.
Ruimy A, Dedieu G, Saugier B (1996) TURC: a diagnostic model
of continental gross primary productivity and net primary
productivity. Global Biogeochemical Cycles, 10, 269±285.
Schimel D, Alves D, Enting I, Heimann M et al. (1996) Radiative
forcing of climate change. In: Climate Change 1995; the Science
of Climate Change, IPCC ± WGI, 65±132. Cambridge University
Press, Cambridge.
Schlesinger WH (1990) Evidence from chronosequence studies
for a low carbon storage potential of soils. Nature, 348, 232±
239.
Schulze E-D (1982) Plant life forms and their carbon, water and
nutrient relations. In: Encyclopedia of Plant Physiology, vol. 12B,
pp. 616±676. Springer, Heidelberg.
Schulze E-D (1994a) Die Wirkung von Immissionen auf den
Wald. Leopoldina (Reihe, 3) (39), 227±243.
Schulze E-D (1994b) The regulation of plant transpiration:
Interactions of feedforward, feedback, and futile cycles. In:
Flux Control in Biological Systems (Schulze E-D, ed.), pp. 203±
236. Academic Press, San Diego, CA.
Schulze E-D, De Vries W, Hauhs M, RoseÂn K, Rasmussen L,
Tamm CO, Nilsson J (1989a) Critical loads for nitrogen
deposition on forest ecosystems. Water, Soil and Air Pollution,
48, 415±456.
Schulze E-D, Hall AE (1982) Stomatal responses, water loss and
CO2 assimilation rates of plants in contrasting environments.
In: Encyclopedia of Plant Physiology, vol. 12B, pp. 181± 230.
Springer, Heidelberg.
Schulze E-D, Heimann H (1998) Carbon and water exchange of
terrestrial systems. In: Asian Change in the Context of Global
Change (Galloway JN, Melillo J, eds), pp. 145±161. Cambridge
University Press, Cambridge.
Schulze E-D, Lange OL, Oren R (1989b) Forest Decline and Air
Pollution. Ecological Studies 75, Springer, Heidelberg.
Schulze E-D, Schulze W, Kelliher FM et al. (1995) Above-ground
biomass and nitrogen nutrition in a chronosequence of
pristine Dahurian Larix stands in Eastern Siberia. Canadian
Journal of Forest Research, 25, 943±960.
Shvidenko A, Nilsson S (1994) What do we know about the
Siberian forests? Ambio, 23, 396±404.
Shvidenko A, Nilsson S (1999) Phytomass, increment, mortality
and carbon budget of Russian forests. Journal of Climate
Change, in press.
Smirnov VV, Semenova VS (1970) Productivity of stands of
subzone broad leaved-spruce forest. Vegetation Resource, 6,
165±176 (Russian).
Smirnov VV (1967) Productivity of aboveground part of a 75-
year old spruce stand. Vegetation Resource, 3, 505±512
(Russian).
Spieker H, MielikaÈinen K, KoÈhl M, Skovsgaard JP (eds) (1996)
Growth trends in European Forests. In: European Forest
Institute Research, Report 5. Springer, Heidelberg, 372pp.
Stanners D, Bourdeau P (1995) Europe's Environment; the DobrõÂs
Assessment. European Environment Agency, Copenhagen.
Steele SJ, Gower ST, Vogel JG, Norman JM (1997) Root mass, net
primary production and turnover in aspen, jack pine and
black spruce forests in Saskatchewan and Monitoba. Canadian
Tree Physiology, 17, 577±587.
Steffen W, Noble I, Canadell J, Apps M, Schulze E-D, Jarvis P
(1998) The terrestrial carbon cycle: Implications for the Kyoto
protocoll. Science, 280, 1393±1394.
Stohlgren TJ, Chase TN, Pielke RA, Kittel TGF, Baron JS (1998)
Evidence that local land use practice in¯uences regional
RP R O D U C T I V I T Y O F F O R E S T S I N T H E E U R O S I B E R I A N B O R E A L R E G I O N 721
# 1999 Blackwell Science Ltd., Global Change Biology, 5, 703±722

climate, vegetation, and stream ¯ow pattern in adjacent
natural areas. Global Change Biology, 4, 495±505.
Suyker AE, Verma SB (1997) Season-long measurements of
carbon dioxide exchange in a boreal fen. Journal of Geophysics
Research, 102D, 29,021±29,028.
Tans PP, Fung IY, Takahashi T (1990) Observational constraints
on the global atmospheric CO2 budget. Science, 247, 1431±
1438.
Townsend AR, Vitousek PM, Trumbore SE (1995) Soil organic
matter dynamics along gradients in temperature and land use
on the island of Hawaii. Ecology, 76, 721±733.
EC-UN/ECE 1996) Forest Conditions in Europe. European
Commission, Brussels.
Utkin AI (1965) The Forests in Central Yakutia. Academik NAUK
CCCP, Moscow, 206pp (Russian).
Vogt KA, Vogt DJ, Palmiotto PA, Boon P, O'Hara J, Asbjornsen
H (1996) Review of root dynamics in forest ecosystems
grouped by climate, climatic forest types and species. Plant
and Soil, 187, 159±219.
Vygodskaya NN, Milyukova IM, Tatarinov FA et al. (1998)
Carbon stock and deposition in phytomass of the forest
ecosystems of the Central Forest Reserve (eastern European
taiga). University GoÈttingen, 1357, 1±280.
Vygodskaya NN, Milyukova I, Varlagin A et al. (1997) Leaf
conductance and CO2 assimilation of Larix gmelinii under
natural conditions of Eastern Siberian boreal forest. Tree
Physiology, 17, 607±615.
Warnant P, Francois L, Strivay D, Gerard JC (1994) CARAIB: a
global model of terrestrial biological productivity. Global
Biogeochemical Cycles, 8, 255±270.
WBGU (1998) The accounting of biological sinks and sources
under the Kyoto protocoll: A step forward or backward for
global environmental protection. Special Report for the German
Government Alfred-Wegener Institut, Bremerhaven, ISBN 3-
9806309-0-0.
Westoby M (1984) The self-thinning rule. Advances in Ecological
Research, 14, 167±225.
Williams PJ le B (1998) The balance of plankton respiration and
photosynthesis in the open oceans. Nature, 394, 55±57.
Winston GC, Sundquist ET, Stephens BB, Trumbore SE (1997)
Winter CO2 ¯uxes in a boreal forest. Journal of Geophysical
Research, 102D, 28,795±28,804.
Wirth C (1996) Oberirdische Biomasse, Stickstoffhaushalt Und
Populationsdynamik Einer Chronosequenz Von Waldkiefer-
BestaÈnden in Sibirien. Diplomarbeit, Bayreuth, 162pp.
Wirth C, Schulze E-D, Schulze W et al. (1999) Aboveground
biomass, structure and self-thinning of pristine boreal Scots
pine forests as controlled by ®re and competition. Oecologia, in
press.
Woodward FI, Smith TM, Emanuel WR (1995) A global land
primary productivity and phytogeography model. Global
Biogeochemical Cycles, 9, 471±490.
Zimmermann R, Schulze E-D, Wirth C, Schulze EE, McDonald
KC, Vygodskaya NN, Ziegler W (1999) Canopy transpiration
in a chronosequence of central Siberian Scots pine forests.
Global Change Biology, in press.
Zimov SA, Zimova GM, Davidov SP et al.(1993) Winter biotic
activity and production of CO2 in Siberian soils: a factor in the
greenhouse effect. Journal of Geophysical Research, 98, 5017±
5023.
L722 E . - D . S C H U L Z E et al.
# 1999 Blackwell Science Ltd., Global Change Biology, 5, 703±722


