Embed Size (px)
Citation preview

c07.indd 62c07.indd 62 27-05-2013 08:17:4027-05-2013 08:17:40

Profi ting from
Hedge Funds
ffirs.indd iffirs.indd i 29-05-2013 08:16:3029-05-2013 08:16:30

ffirs.indd iiffirs.indd ii 29-05-2013 08:16:3029-05-2013 08:16:30
Profi ting from
Hedge Funds
Winning Strategies for the Little Guy
John Konnayil Vincent
ffirs.indd iiiffirs.indd iii 29-05-2013 08:16:3029-05-2013 08:16:30

Cover Design: Michael Rutkowski
Cover Photography: ©iStockphoto.com/urbancow
Copyright © 2013 by John Wiley & Sons Singapore Pte. Ltd.
Published by John Wiley & Sons Singapore Pte. Ltd.
1 Fusionopolis Walk, #07-01, Solaris South Tower, Singapore 138628
All rights reserved.
No part of this publication may be reproduced, stored in a retrieval system, or transmitted
in any form or by any means, electronic, mechanical, photocopying, recording, scanning,
or otherwise, except as expressly permitted by law, without either the prior written
permission of the Publisher, or authorization through payment of the appropriate photocopy
fee to the Copyright Clearance Center. Requests for permission should be addressed
to the Publisher, John Wiley & Sons Singapore Pte. Ltd., 1 Fusionopolis Walk, #07-01,
Solaris South Tower, Singapore 138628, tel: 65–6643–8000, fax: 65–6643–8008,
e-mail: [email protected].
Limit of Liability/Disclaimer of Warranty: While the publisher and author have used their
best eff orts in preparing this book, they make no representations or warranties with respect
to the accuracy or completeness of the contents of this book and specifi cally disclaim any
implied warranties of merchantability or fi tness for a particular purpose. No warranty may
be created or extended by sales representatives or written sales materials. The advice and
strategies contained herein may not be suitable for your situation. You should consult with
a professional where appropriate. Neither the publisher nor the author shall be liable for
any damages arising herefrom.
Other Wiley Editorial Offi ces
John Wiley & Sons, 111 River Street, Hoboken, NJ 07030, USA
John Wiley & Sons, The Atrium, Southern Gate, Chichester, West Sussex, P019 8SQ,
United Kingdom
John Wiley & Sons (Canada) Ltd., 5353 Dundas Street West, Suite 400, Toronto, Ontario,
M9B 6HB, Canada
John Wiley & Sons Australia Ltd., 42 McDougall Street, Milton, Queensland 4064, Australia
Wiley-VCH, Boschstrasse 12, D-69469 Weinheim, Germany
ISBN 978-1-118-46520-2 (Cloth)
ISBN 978-1-118-46519-6 (ePDF)
ISBN 978-1-118-46517-2 (ePub)
Typeset in 11.5/14 pt. Bembo Std by MPS Limited, Chennai, India.
Printed in Singapore by Ho Printing Pte. Ltd.
10 9 8 7 6 5 4 3 2 1
ffirs.indd ivffirs.indd iv 29-05-2013 08:16:3029-05-2013 08:16:30

To my loving parents,
K. J. Vincent and Annies Vincent,
for their inspiration and guidance
ffirs.indd vffirs.indd v 29-05-2013 08:16:3029-05-2013 08:16:30

ffirs.indd viffirs.indd vi 29-05-2013 08:16:3029-05-2013 08:16:30
vii
Contents
Acknowledgments xiii
Preface xv
Part One: Tracking 12
of the Greatest Money Managers 1
Chapter 1 Introduction 3
13Fs: A Window into Hedge Fund Activity 6
Filtering 13Fs for Relevant Activity 8
Raw 13F Filings from EDGAR 11
Notes 15
Chapter 2 Bill Ackman 17
Philosophy and Style 18
Marquee Trades 19
Portfolio Analysis 20
Notes 23
Chapter 3 Bruce Berkowitz 25
Philosophy and Style 26
Marquee Trades 27
ftoc.indd viiftoc.indd vii 27-05-2013 12:04:3627-05-2013 12:04:36

Portfolio Analysis 28
Notes 31
Chapter 4 Warren Buff ett 33
Philosophy and Style 34
Marquee Trades 35
Portfolio Analysis 37
Notes 39
Chapter 5 Ian Cumming and Joseph S. Steinberg 41
Philosophy and Style 42
Marquee Trades 43
Portfolio Analysis 44
Notes 46
Chapter 6 David Einhorn 47
Philosophy and Style 48
Marquee Trades 49
Portfolio Analysis 50
Notes 53
Chapter 7 Carl Icahn 55
Philosophy and Style 56
Marquee Trades 57
Portfolio Analysis 58
Notes 60
Chapter 8 Seth Klarman 63
Philosophy and Style 64
Marquee Trades 65
Portfolio Analysis 66
Notes 68
Chapter 9 John Paulson 69
Philosophy and Style 70
Marquee Trades 71
Portfolio Analysis 72
Notes 74
viii c o n t e n t s
ftoc.indd viiiftoc.indd viii 27-05-2013 12:04:3727-05-2013 12:04:37

Contents ix
Chapter 10 Wilbur Ross 77
Philosophy and Style 78
Marquee Trades 78
Portfolio Analysis 79
Notes 82
Chapter 11 George Soros 85
Philosophy and Style 86
Marquee Trades 87
Portfolio Analysis 88
Notes 91
Chapter 12 David Swensen 93
Philosophy and Style 94
Marquee Trades 95
Portfolio Analysis 96
Notes 98
Chapter 13 Prem Watsa 101
Philosophy and Style 102
Marquee Trades 103
Portfolio Analysis 105
Notes 107
Part Two: Mechanical Approaches
to Following the Masters 109
Chapter 14 Introduction 111
Manager Selection 113
Asset Allocation and Sentiment Capture 119
Risk Avoidance 121
Constructing Model Portfolios Mechanically:
A Primer 122
Equal Allocation Largest Positions 123
Equal Allocation Largest New Positions 124
Weighted Allocation Largest Positions 124
Weighted Allocation Largest New Positions 126
ftoc.indd ixftoc.indd ix 27-05-2013 12:04:3727-05-2013 12:04:37

x c o n t e n t s
10-5-2 Allocation Largest Positions 128
10-5-2 Allocation Largest New Positions 131
Notes 133
Chapter 15 Equal Allocation Models 135
Portfolio Management and Performance Analysis 136
Bill Ackman: Largest Three 136
Warren Buff ett: Largest Three 138
David Einhorn: Largest Three 141
Combined Portfolio: Largest Positions 143
Combined Portfolio: Largest New Positions 145
Summary 146
Chapter 16 Weighted Allocation Models 149
Portfolio Management and Performance
Analysis 150
Bill Ackman: Largest Three 151
Warren Buff ett: Largest Three 153
David Einhorn: Largest Three 155
Combined Portfolio: Largest Positions 157
Combined Portfolio: Largest New Positions 159
Summary 161
Chapter 17 Ten-Five-Two (10–5–2) Allocation Models 163
Portfolio Management and Performance
Analysis 164
Bill Ackman 165
Warren Buff ett 168
David Einhorn 172
Summary 174
Chapter 18 Alternate Models 177
Portfolio Management and Performance Analysis 178
Bill Ackman: Exact Match Approximation Model 179
David Swensen: Asset Allocation Model 183
Sector Rotation Model 185
Simple Moving Average (SMA) Based Model 188
Summary 191
Note 192
ftoc.indd xftoc.indd x 27-05-2013 12:04:3727-05-2013 12:04:37
Contents xi
Part Three: Learning from the Masters 193
Chapter 19 Introduction 195
Beating the Managers at Their Own Game 198
Trading Alongside the Managers 203
Summary 206
Notes 207
Chapter 20 Fundamental Analysis 209
Margin of Safety 212
Basic Checklist 215
Business Understanding 216
Business Sector and the Company’s Standing 216
Management Integrity and Competency 217
Valuation 217
Emotional Stance 218
Quantitative Measures 219
Profi tability Indicators 219
Management Eff ectiveness 220
Liquidity Indicators 222
Valuation Indicators 224
Fair Value Estimates 227
Risk-Free Equivalent Fair Value 227
Fair Values Based on Earnings Growth 228
Fair Values Based on Benjamin Graham’s
Teachings 230
Fair Values Using Present Discounted Value 234
Summary 240
Notes 241
Chapter 21 Types of Positions and Sizing 243
Diversifi cation and Hedging 244
Keeping Your Powder Dry 251
Building and Sizing Positions 253
Low Probability Positions 261
Summary 262
Notes 263
ftoc.indd xiftoc.indd xi 27-05-2013 12:04:3727-05-2013 12:04:37

Chapter 22 Conclusion 265
Ad Hoc Cloning Strategies 268
Mechanical Cloning Strategies 269
Implementing Manager Strategies 272
About the Author 273
Index 275
xii c o n t e n t s
ftoc.indd xiiftoc.indd xii 27-05-2013 12:04:3727-05-2013 12:04:37
xiii
Acknowledgments
Let me begin by acknowledging the Almighty for the blessings
and wonderful provisions showered upon me throughout my
life. My career progression to wealth management has been no
exception, for it has been a wonderful ride.
Words fail to express the tremendous gratitude I owe Nick Wallwork
at John Wiley, one of the most experienced English language fi nance/
business publishers in the world. My articles at Seeking Alpha, a premier
website for actionable stock market opinion, analysis, and discus-
sion caught Nick ’s attention and he sowed the seeds for this book of
strategies individual investors can implement to create alpha on their
own. His insight and vision deserves credit for this maiden eff ort. On
a related note, I salute Seeking Alpha for developing an ecosystem for
investment researchers to network and develop ideas.
I have also drawn inspiration from several individuals who success-
fully migrated from other fi elds into investment management. Among
them are Dr. Michael Burry, founder of Scion Capital, LLC hedge fund;
Asif Suria, founder of Insider Trade Reports; Mazin Jadallah, founder
of AlphaClone LLC; James Altucher, managing director of Formula
Capital Hedge Fund; Mohnish Pabrai, founder of Pabrai Investment
fbetw.indd xiiifbetw.indd xiii 27-05-2013 10:33:1927-05-2013 10:33:19

xiv a c k n o w l e d g m e n t s
Fund; Francis Chou, president of Chou Associates Management,
Inc.; and several contributors at Seeking Alpha. Their intrepid sense
of going all out in fulfi lling their passion immensely helped my own
transformation.
I extend my sincere thanks to the hedge fund managers profi led
herein for explaining their operating styles through the media over the
years. That was my primary source of information for the profi les in
this book.
I recognize fully the eff orts of Gemma Rosey, development editor; Jules
Yap, editorial executive; Stefan Skeen, senior production editor; Barbara
Hanson, copy editor; and the entire Wiley team for their unwavering
support throughout the development of this book.
My partner in crime and beloved wife, Shara, has been the guiding
and motivating force behind me, giving encouragement at times of dif-
fi culty and setbacks. Her critical suggestions, patient understanding, and
realistic expectations helped me to comprehend the bigger picture. Her
passion and enthusiasm to follow a new path, along with her pleasant
disposition, fascinates me. She put in a tremendous eff ort to edit the
initial drafts of the manuscript.
While we were writing this book, our two wonderful daughters
Ann Gina Konnayil and Becka Jill Konnayil held up really well in a
brand new environment, despite the fact that their parents were working
with a very tight schedule. For that, they deserve our special mention
and admiration.
I am blessed with a lot of well-wishers, friends, and family mem-
bers. I thank all of them for being there.
fbetw.indd xivfbetw.indd xiv 27-05-2013 10:33:1927-05-2013 10:33:19
xv
Preface
Managing one ’s assets appropriately is indeed a monumental
task. While select money managers with the elusive Midas
touch easily outperform the market averages by wide mar-
gins over long periods of time, the majority of other money managers
and individual investors unfortunately underperform the market aver-
ages. As these three groups—fruitful money managers, their struggling
colleagues, and individual investors—represent the bulk of the market, it
is evident the former gains at the expense of the latter two.
The track record of individual investors as a group has plenty of
room for improvement. Equities and mutual funds are generic investment
options available to all individuals, regardless of their net investable asset
status. Net investable assets are the total value of an individual ’s invest-
ments, excluding his or her primary residence and retirement accounts.
Individuals with investable wealth of less than $100,000 are at the lower
end of this spectrum, while the superwealthy, with net investable assets
exceeding $10,000,000, are at the other end. An uptick in the net invest-
able assets of an individual means better investment prospects, as the
chance to wrap one ’s fi ngers around such choice privileges as separately
fpref.indd xvfpref.indd xv 27-05-2013 10:34:3527-05-2013 10:34:35
xvi p r e f a c e
managed account (SMA) composites, hedge funds, private equity part-
nerships, venture capital, angel investment, and so on are available only to
those higher up in the net investable assets ladder. The best among these
exclusive opportunities manage to beat the market averages handsomely.
In order to improve the individual investor ’s situation, fi nancial
gurus such as Vanguard ’s John Bogle 1 professed the strategy of owning
index funds so that an investor can mimic the performance of the mar-
ket. Eliminating the risk of underperforming the market averages is the
chief benefi t of such an approach. However, this relative stability has
a high hidden price, the cost of which becomes apparent only when
one compares the diff erence in the amount of money that could have
been made had the investments beaten the market by a few percentage
points over a long period of time.
Those money managers that are ahead of the curve make it seem
all too easy to post compounded annual returns net of all fees in
the vicinity of a whopping 15 percent or higher. Clearly, consistent
outperformance by wide margins is not an accident, and cannot be
explained away by statistical probabilities. These highly successful
managers have special investment allocation skills that allow them
to take their returns from ordinary to extraordinary levels over long
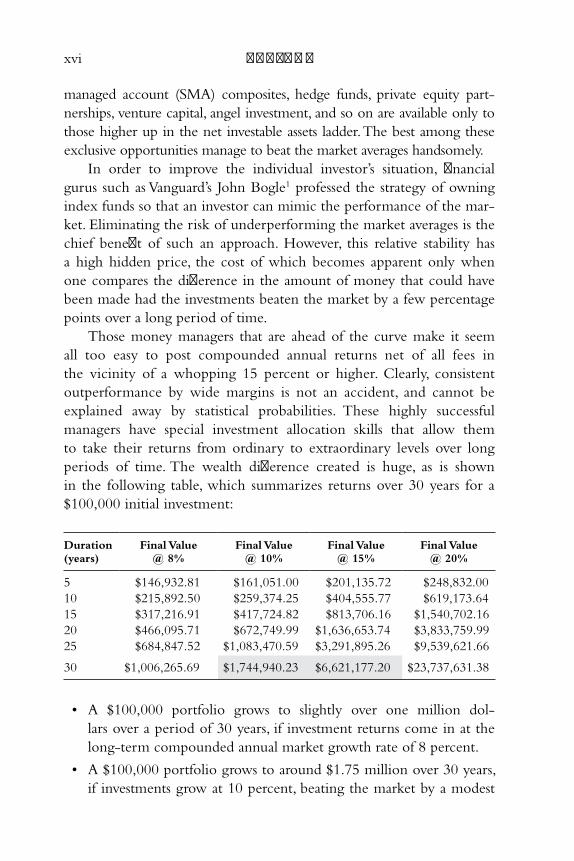
periods of time. The wealth diff erence created is huge, as is shown
in the following table, which summarizes returns over 30 years for a
$100,000 initial investment:
Duration (years)
Final Value @ 8%
Final Value @ 10%
Final Value @ 15%
Final Value @ 20%
5 $146,932.81 $161,051.00 $201,135.72 $248,832.00
10 $215,892.50 $259,374.25 $404,555.77 $619,173.64
15 $317,216.91 $417,724.82 $813,706.16 $1,540,702.16
20 $466,095.71 $672,749.99 $1,636,653.74 $3,833,759.99
25 $684,847.52 $1,083,470.59 $3,291,895.26 $9,539,621.66
30 $1,006,265.69 $1,744,940.23 $6,621,177.20 $23,737,631.38
• A $100,000 portfolio grows to slightly over one million dol-
lars over a period of 30 years, if investment returns come in at the
long-term compounded annual market growth rate of 8 percent.
• A $100,000 portfolio grows to around $1.75 million over 30 years,
if investments grow at 10 percent, beating the market by a modest
fpref.indd xvifpref.indd xvi 27-05-2013 10:34:3527-05-2013 10:34:35
Preface xvii
2 percent. At that level of outperformance, the diff erence in dollar
amount is over $0.75 million for the same time frame.
• A $100,000 portfolio grows to a massive $6.62 million over 30
years, if investments grow at 15 percent, beating the market by 7
percent. At that level of outperformance, the diff erence in dollar
amount hovers close to an incredible $5.62 million, that is, over 6.2
times the returns compared to the market returns.
Having recognized the striking diff erence in returns even mod-
erate levels of outperformance can generate, it is only logical that an
individual investor would also want to pursue strategies aimed at beat-
ing the market indexes with a high level of confi dence. The seemingly
straightforward way for an individual investor to partake in the per-
formance of superstar money managers is to invest directly with them.
Unfortunately, this is easier said than done! The majority of the wizards
don ’t accept a layperson ’s money and invest on their behalf even for a
reasonable fee, for a variety of reasons. The Securities and Exchange
Commission (SEC) regulations aimed at protecting investors from
fraud are a major deterrent. The regulations include:
• Securities Act of 1933 : 2 This law governs the off er and
sale of securities in the United States. Funds off ering to
sell securities must fi rst register and meet either the regis-
tration requirements or an exemption. Section 4(2) of the
Securities Act exempts any transactions by an issuer not
involving any public off ering. To qualify under this exemp-
tion, there are rules under Regulation D (504, 505, and 506,
a set of requirements that govern private off erings). Many
of the investment management fi rms rely on Rule 506
to claim such exemption. Under that rule, off erings can be made
to an unlimited number of accredited investors, and up to 35
other purchasers. Also, such off erings cannot employ general solic-
itation or advertising to market the securities. What does it take to
be an accredited investor? One way to be an accredited investor is
to have a net worth of at least $1 million, alone or with a spouse.
The Dodd-Frank Wall Street Reform and Consumer Protection
Act of 2010 3 further restricted this requirement by exclud-
ing a person ’s primary residence from the net worth calculation.
Another way to qualify is to have income exceeding $200,000 in
fpref.indd xviifpref.indd xvii 27-05-2013 10:34:3527-05-2013 10:34:35
xviii p r e f a c e
each of the two most recent years, or joint income with a spouse
exceeding $300,000. Either of these requirements limits accessibil-
ity to the vast majority of individual investors. The regulatory curb
on advertisements also makes it hard for investment management
fi rms to reach individual investors.
• Securities Exchange Act of 1934 : 4 This law governs the sec-
ondary trading of securities in the United States. The rules under
Section 12(g) require that, if an investment management fi rm
has over 500 holders of record (investors), and assets in excess of
$10 million, it must be registered under the Securities Exchange
Act. In their eff ort to avoid Securities Exchange Act registration,
many investment managers try to have fewer than 500 holders of
record. One way to achieve this is by having a very high minimum
requirement. It is not unusual for highly successful hedge funds to
have this threshold set at upward of $25 million which, needless to
say, excludes a large number of individual investors.
• Investment Company Act of 1940 : 5 This law regulates invest-
ment companies. It requires them to disclose material details about
their fi nancial health and also restricts certain activities, such as
short selling, by mandating coverage requirements. Many funds rely
on statutory exclusions under Section 3(c) that defi ne an invest-
ment company to avoid being classifi ed as an investment com-
pany. Section 3(c) (1) excludes issuers if the outstanding securities
are owned by not more than 100 investors. Funds making use of
this exclusion typically resort to very high minimum investment
requirement to discourage most investors. Section 3(c) (7) excludes
issuers if the outstanding securities are owned exclusively by
qualifi ed purchasers. Who are these qualifi ed purchasers? To be a
qualifi ed purchaser, an individual investor has to own more than
$5,000,000 in investments, which eliminates a high percentage of
investors.
• Investment Advisors Act of 1940 : 6 This regulates the activity of
investment advisors. Many advisers use certain exemptions under
the Dodd-Frank Act of 2010, which among other things, do not
allow holding themselves out generally to the public as an invest-
ment advisor.
fpref.indd xviiifpref.indd xviii 27-05-2013 10:34:3527-05-2013 10:34:35
Preface xix
Moreover, many superlative money managers do not view manag-
ing individual investor accounts as their ticket to fame. Some of their
typical preferred activities include the following:
• Management of university endowment funds, charitable foun-
dation trusts, and similar entities : Some of the world ’s fi nest
money managers are engaged in managing trusts and university
endowments. One of the largest such trusts is the Bill & Melinda
Gates Foundation Trust, with assets over $37 billion; and leading
university endowments include the likes of Harvard ($32 billion)
and Yale ($22 billion). Because they employ the cream of the top
money managers, it is not much of a surprise that these endow-
ments and trusts have fantastic track records.
• Family offi ces : Family offi ces are establishments set up by wealthy
families to manage their money. These offi ces typically provide
auxiliary services, such as tax, estate planning, and other legal mat-
ters. Several eminent money managers have long since exited the
business of investing outsiders’ money through a hedge fund to
investing their own wealth through a family offi ce structure. This
trend has gained momentum recently, following the SEC adoption
of a rule under Dodd-Frank Act defi ning family offi ces that are to
be excluded from the Investment Advisors Act of 1940. The most
high-profi le conversion to date has been Soros Fund Management,
the hedge fund that was run by billionaire George Soros. In July
2011, the fund decided to convert to a family offi ce and return
outside investors’ money, thereby closing the doors on them.
• Management of liquid assets of large corporations : Managing
the cash assets of large corporations is a complicated undertaking
that sometimes gets assigned to professional investment manage-
ment gurus. Managing insurance fl oat is a variation on this theme
and, under this category, are some of the most prominent experts,
such as Warren Buff ett and Ian Cumming. It is possible for individual
investors to own shares of the publicly traded corporations these
giants represent, such as Berkshire Hathaway, Leucadia National,
and so on. However, owning such shares do not provide the indi-
vidual with the same benefi t as would exist if his or her money was
fpref.indd xixfpref.indd xix 27-05-2013 10:34:3527-05-2013 10:34:35
xx p r e f a c e
part of the pool of investments that Buff ett or Cumming manages.
As things stand, it is impossible for individual investors to directly
participate in the money management schemes of such managers.
• Private equity funds , venture capital funds, and other mis-
cellaneous pools : There exists an array of unregistered invest-
ment vehicles that rely on exemptions to maintain their status quo
under the SEC. They are structured as limited partnerships with
investors committing to fund up to a certain amount of money.
Private equity funds are pools of capital that invest in illiquid secu-
rities. When the fund manager identifi es an opportunity, capital
calls to investors allow them to obtain funds just in time and stay
fully invested. Venture capital funds are pools that invest in start-
up opportunities. They are also diff erent in that they play an active
role in the management of portfolio companies and exit as soon
as a good return on investment is realized. Such entities largely
bypass the vast majority of individual investors, as they rely on SEC
exemptions to stay unregistered.
Hedge funds and mutual funds, on the other hand, seek individual
investor capital but many of them are bounded because of their need
to stay outside the radar of federal regulation. Most hedge funds set
the entry bar high—their minimums start at upwards of a million dol-
lars. Hedge funds cannot be marketed like a retail mutual fund. As for
mutual funds, it is very rare to fi nd one that beat the indexes consis-
tently over long periods of time. There are exceptions but there are the
following caveats as well:
• Capital gains : Mutual funds periodically distribute realized capi-
tal gains to their investors; such distributions are taxable. Besides,
mutual funds can have unrealized capital gains that will eventually
be distributed. In that case, a fund can fail to fascinate as an invest-
ment option, even if it has outperformed the indexes consistently
over long periods of time. Sequoia Fund is an example of a highly
successful mutual fund that has outperformed the S&P 500 by
around 4 percent annually over 42 years. The fund, however, has a
net unrealized appreciation of the fund ’s portfolio of over 40 per-
cent of Net Asset Value (NAV), which makes it less desirable for
prospective investors.
fpref.indd xxfpref.indd xx 27-05-2013 10:34:3527-05-2013 10:34:35
Preface xxi
• Fund closings : Some of the best performing mutual funds are
unwilling to take new investors on board. While this puts the fund
beyond the reach of new investors, it is not completely out of cir-
culation, as existing investors are generally allowed to add to their
position. This is most prevalent among the best performing small
cap funds, and is mostly due to the managers’ belief that increasing
the size of the fund could prove detrimental to the fund ’s perfor-
mance. Examples of best performing mutual funds closed to new
investors include the Royce Premier Fund, a small-cap–focused
fund with an outstanding 20-year ~4 percent annual outperfor-
mance of the Russell 2000 index, and the Calamos Convertible
Fund with a 27 year track record of outperformance. The Sequoia
Fund also fi ts into this list.
• High minimums : Some mutual funds also resort to high mini-
mums to keep at bay performance chasers who move in and out
of funds frequently. Consequently, the fund becomes off -limits for
genuine investors, too.
An alternative to investing directly with the best money managers
is to invest in a fund of funds (FoFs). FoFs are investment companies
that invest in other funds instead of investing in individual securities.
On a comparative basis, FoFs have relatively lower investment mini-
mums thus making them more readily accessible to individual inves-
tors. However, many factors such as those listed below make them less
desirable than investing directly with the best money managers:
• Fees and performance : FoFs add another layer of decision mak-
ing between the investor and the fund managers with whom they
invest. On the one hand, the funds are diversifi ed among other
funds, but the extra management layer translates to additional fees
(1 percent or more, plus a performance fee is typical) being tacked
on. Further, as the returns will depend on the profi ciency of the
fund manager as well as on the asset allocation prowess of the FoF
manager, FoFs mostly lag behind the returns achieved by the top
managers.
• Minimum requirements : FoFs generally do not register under
the Securities Act of 1933, so they rely on the private placements
route to attract assets. This results in a much smaller market reach
fpref.indd xxifpref.indd xxi 27-05-2013 10:34:3527-05-2013 10:34:35
xxii p r e f a c e
than that which could have been attained with a retail distribu-
tion network. Consequently, FoFs target high net-worth individu-
als which, in turn, cause them to keep large investment minimums
(upward of $25,000).
• Regulation: Although FoFs may be registered under the
Investment Company Act of 1940, the underlying funds in which
they invest may not be. Investors are extremely dependent on the
ability of the FoF managers to do proper due diligence in the
selection of fund managers with whom they invest. The magni-
tude of this problem was highlighted by the 7 Madoff scandal when
it was disclosed that many FoFs invested with the Ponzi scheme.
Such vulnerability takes the joy out of investing!
Audience
A practical and gratifying alternative to investing directly with the awe-
inspiring money managers is to monitor their moves, comprehend
their investment rationale, and apply their proven strategies to one ’s
own portfolio. Strategies to emulate the moves of remarkable money
managers are the basis of this three-part book. Its purpose is to get
individual investors to the next level by beating market averages with a
high degree of confi dence via incorporating cloning strategies in their
own portfolios.
Overview
Part One begins with an explanation of the regulatory requirements
that permit the public to scrutinize the investment activity of most
money managers, albeit with a time delay. This section explains the
simplest ways and means of cloning investment specialists individually,
by inspecting their diff erent investment styles, philosophies, and trades.
An eclectic selection of 12 investment authorities is presented with
particulars on:
• Characteristics that distinguish their portfolios from others.
• Analysis of their major moves over the years.
fpref.indd xxiifpref.indd xxii 27-05-2013 10:34:3527-05-2013 10:34:35
Preface xxiii
• Discussion of their largest positions (highest percentage allocations
in the portfolio) and largest additions over the years.
• A peek into how selected stock picks, based on their bias (bullish,
bearish, or neutral), would have performed.
The strategies put forth can be implemented into one ’s portfolios with-
out further analysis of the securities themselves. The idea is to capitalize on
the legwork already done by the best money managers or, put simply, let ’s
not keep reinventing the wheel! Each chapter analyzes the strengths and
weaknesses of the strategies to clone the moves of the best money managers
one at a time, and also provides clues as to picking managers to follow.
Part Two discusses schemes that combine the moves of a selected
set of money managers from Part I to construct cloned portfolios.
These strategies apply rule-based criteria to the portfolios of the care-
fully chosen managers, so as to arrive at a list of potential securities
in which to invest. The concept of model portfolios as a structured
mechanical approach to follow the activities of the experts is intro-
duced. A set of portfolio allocation models are presented with particu-
lars on how assets can be spread among the diff erent choices:
• Equal allocation model
• Weighted allocation model
• Ten-fi ve-two allocation model
Nailing down these asset allocations is not complicated. The choices
are based on the source manager ’s largest positions and the largest new
additions. The money moves of a selected set of specialists from those
introduced in Part I are used to present actual portfolios that can be
constructed with this approach. Techniques to rebalance such portfolios
quarterly, based on the changes made during the previous quarter, are
explored. Back-tested progression spreadsheets that show how the port-
folios would have performed over the years are analyzed. A description
of alternatives to the long-only models is also covered:
• Incorporating bond and cash allocations.
• Hedging based on market sentiment.
• Net long versus neutral versus short.
• Cloning the asset allocation.
• Chapter summaries evaluating the strengths and weaknesses of the models.
fpref.indd xxiiifpref.indd xxiii 27-05-2013 10:34:3527-05-2013 10:34:35
xxiv p r e f a c e
Part Three presents rules-based fi ltering techniques based on money
manager trading activity. The concept of building money manager
investment bias spreadsheets to capture their preferences is introduced.
A technique to create a prioritized manager bias spreadsheet by com-
paring the price range the manager traded with the price when the
information became public is presented. The procedure is applied to
the portfolios of the selected managers to create a prioritized manager
bias spreadsheet. A strategy to invest based on these bias spreadsheets
is introduced. A spreadsheet showing the back-tested performance of
stock picks using this procedure against the selected manager portfolios
is presented and analyzed.
This section also cites two other SEC regulatory requirements that
allow the investing public to scrutinize certain other types of activity in
security trading:
• SEC fi lings related to benefi cial ownership of more than 5 percent
in a public company, reported within 10 days of such activity.
• SEC fi lings related to insider trading that directors, offi cers, or 10
percent owners are required to fi le within two days of such activity.
Methods to fi lter and prioritize security selections using infor-
mation from these regulatory fi lings are discussed. A strategy to invest
based on this information is presented. The process is applied to the
fi lings of the selected managers to present stock picks and their perfor-
mance over the holding periods recommended by the strategy.
The best money managers are known to employ several stock
selection strategies. Those techniques are introduced:
• Margin of safety
• Buying low and selling high
• Basic Q&A checklist
• Quantitative checklist
• Fair value estimates (FVE)
The importance of having diff erent types of positions that are opti-
mally sized is covered:
• Low probability versus high probability bets
• Positions that correlate inversely with the overall market
fpref.indd xxivfpref.indd xxiv 27-05-2013 10:34:3527-05-2013 10:34:35
Preface xxv
• Market neutral positions
• Keeping your powder dry
• Right sizing positions
The fi nal chapter pulls everything together, with a discussion on
the relative strengths and weaknesses of the diff erent approaches pro-
posed throughout the book.
Notes
1. John C. Bogle, The Little Book of Common Sense Investing: The Only Way to
Guarantee Your Fair Share of Stock Market Returns (Hoboken, NJ: John Wiley &
Sons, 2007).
2. Securities Act of 1933, May 27, 1933.
3. Dodd-Frank Wall Street Reform and Consumer Protection Act, January 05,
2010.
4. Securities Exchange Act of 1934, June 6, 1934.
5. Investment Company Act of 1940, August 22, 1940.
6. Investment Advisors Act of 1940, Aug. 22, 1940.
7. Bernard Madoff , former non-executive chairman of the NASDAQ stock
market, and the confessed operator of a Ponzi scheme.
fpref.indd xxvfpref.indd xxv 27-05-2013 10:34:3527-05-2013 10:34:35

fpref.indd xxvifpref.indd xxvi 27-05-2013 10:34:3527-05-2013 10:34:35
Part One
TRACKING 12 OF THE GREATEST MONEY
MANAGERS
c01.indd 1c01.indd 1 29-05-2013 08:19:4729-05-2013 08:19:47

c01.indd 2c01.indd 2 29-05-2013 08:19:4829-05-2013 08:19:48
3
Chapter 1
Introduction
Investors are spoiled for choices when it comes to investment styles.
There is no consensus on style even among the greatest money
managers. Choosing of money managers to shadow requires careful
consideration, as not all investment styles are conducive to cloning.
Classifying money managers by their style is a practical initial step. This
can be confusing, for many managers do not adhere solely to one style.
Listed here are the most popular investment styles. Though they are
often interchangeable, there are some diff erences among them:
• Directional : Directional managers forecast the turn of individual
securities, as well as that of the overall market, based on analysis.
Regardless of the type of analysis, the underlying theme is that the
strategies they employ (long/short, managed futures, global macro,
and dedicated shorts) rely on the outcome of the study to make a
buy/sell decision. The long/short strategy, a favorite among money
managers, is when directional bets are made both on the long and
the short side. Global macro strategy banks on the analysis of the
c01.indd 3c01.indd 3 29-05-2013 08:19:4829-05-2013 08:19:48
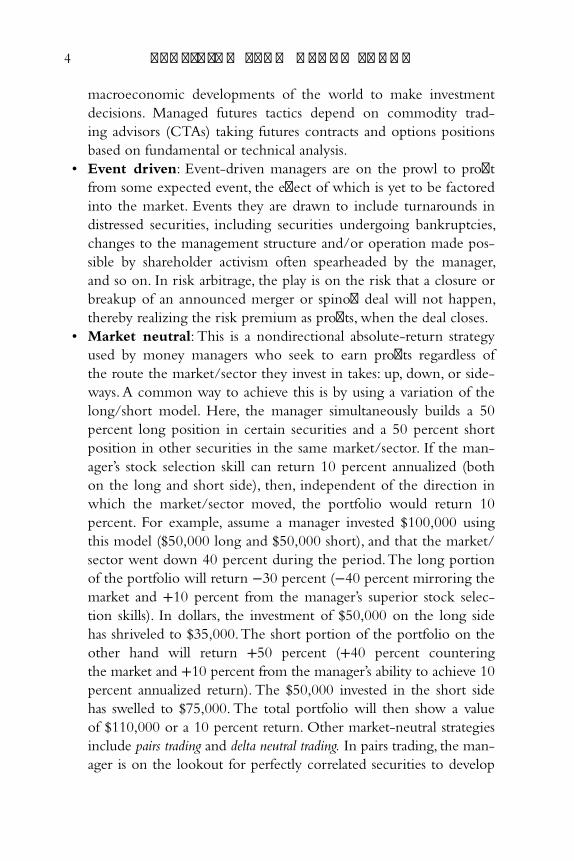
4 p r o f i t i n g f r o m h e d g e f u n d s
macroeconomic developments of the world to make investment
decisions. Managed futures tactics depend on commodity trad-
ing advisors (CTAs) taking futures contracts and options positions
based on fundamental or technical analysis.
• Event driven : Event-driven managers are on the prowl to profi t
from some expected event, the eff ect of which is yet to be factored
into the market. Events they are drawn to include turnarounds in
distressed securities, including securities undergoing bankruptcies,
changes to the management structure and/or operation made pos-
sible by shareholder activism often spearheaded by the manager,
and so on. In risk arbitrage, the play is on the risk that a closure or
breakup of an announced merger or spinoff deal will not happen,
thereby realizing the risk premium as profi ts, when the deal closes.
• Market neutral : This is a nondirectional absolute-return strategy
used by money managers who seek to earn profi ts regardless of
the route the market/sector they invest in takes: up, down, or side-
ways. A common way to achieve this is by using a variation of the
long/short model. Here, the manager simultaneously builds a 50
percent long position in certain securities and a 50 percent short
position in other securities in the same market/sector. If the man-
ager ’s stock selection skill can return 10 percent annualized (both
on the long and short side), then, independent of the direction in
which the market/sector moved, the portfolio would return 10
percent. For example, assume a manager invested $100,000 using
this model ($50,000 long and $50,000 short), and that the market/
sector went down 40 percent during the period. The long portion
of the portfolio will return −30 percent (−40 percent mirroring the
market and +10 percent from the manager ’s superior stock selec-
tion skills). In dollars, the investment of $50,000 on the long side
has shriveled to $35,000. The short portion of the portfolio on the
other hand will return +50 percent (+40 percent countering
the market and +10 percent from the manager ’s ability to achieve 10
percent annualized return). The $50,000 invested in the short side
has swelled to $75,000. The total portfolio will then show a value
of $110,000 or a 10 percent return. Other market-neutral strategies
include pairs trading and delta neutral trading. In pairs trading, the man-
ager is on the lookout for perfectly correlated securities to develop
c01.indd 4c01.indd 4 29-05-2013 08:19:4829-05-2013 08:19:48
Introduction 5
a temporary period of divergence. When a match is found, the
positions are off set (short the outperforming security and long
the underperforming one) to take advantage of the price discrep-
ancy. In delta trading, securities and their related options are com-
bined to create a composite position whose delta is zero ( zero delta
means there is no correlation to the underlying security involved).
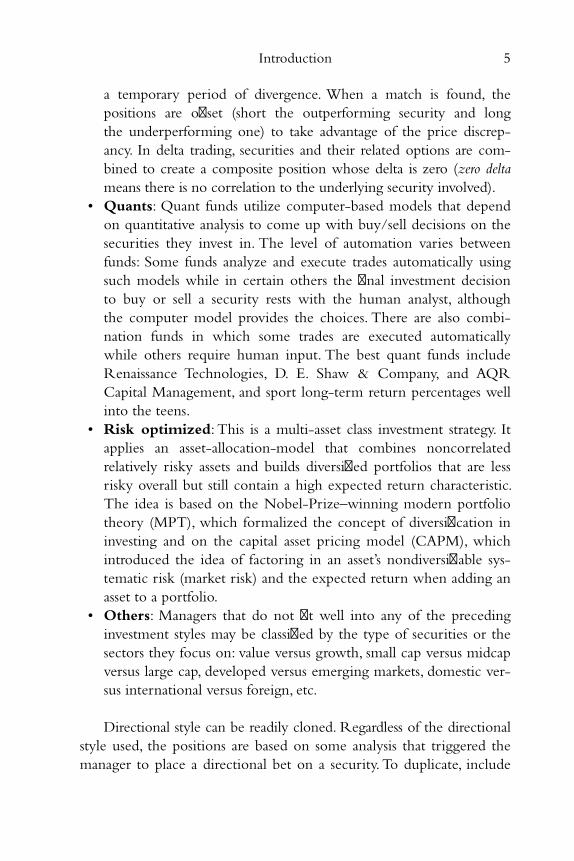
• Quants : Quant funds utilize computer-based models that depend
on quantitative analysis to come up with buy/sell decisions on the
securities they invest in. The level of automation varies between
funds: Some funds analyze and execute trades automatically using
such models while in certain others the fi nal investment decision
to buy or sell a security rests with the human analyst, although
the computer model provides the choices. There are also combi-
nation funds in which some trades are executed automatically
while others require human input. The best quant funds include
Renaissance Technologies, D. E. Shaw & Company, and AQR
Capital Management, and sport long-term return percentages well
into the teens.
• Risk optimized : This is a multi-asset class investment strategy. It
applies an asset-allocation-model that combines noncorrelated
relatively risky assets and builds diversifi ed portfolios that are less
risky overall but still contain a high expected return characteristic.
The idea is based on the Nobel-Prize–winning modern portfolio
theory (MPT), which formalized the concept of diversifi cation in
investing and on the capital asset pricing model (CAPM), which
introduced the idea of factoring in an asset ’s nondiversifi able sys-
tematic risk (market risk) and the expected return when adding an
asset to a portfolio.
• Others : Managers that do not fi t well into any of the preceding
investment styles may be classifi ed by the type of securities or the
sectors they focus on: value versus growth, small cap versus midcap
versus large cap, developed versus emerging markets, domestic ver-
sus international versus foreign, etc.
Directional style can be readily cloned. Regardless of the directional
style used, the positions are based on some analysis that triggered the
manager to place a directional bet on a security. To duplicate, include
c01.indd 5c01.indd 5 29-05-2013 08:19:4829-05-2013 08:19:48
6 p r o f i t i n g f r o m h e d g e f u n d s
one or more of the manager ’s positions in one ’s own portfolio. Event-
driven styles are also easily emulated, although individual investors
will have trouble replicating some of the moves. While it is not com-
plicated to imitate a position that an event driven manager establishes
in a public company, many event-driven managers focus on distressed
securities that are not traded, thereby cordoning off such positions from
individual investors. Some strategies of market neutral style can be
cloned eff ectively. The long/short variant strategy is relatively simple to
replicate in aggregate. To achieve this, identify the positions and ratios
involved, and allocate cash similarly in one ’s own portfolio. On the
other hand, pairs trading and delta trading are tricky. In pairs trading,
the window of opportunity is so tiny that only those who are ahead
profi t. Followers can wind up being too late. In delta neutral, the posi-
tions that combine to achieve a zero delta are complex and may not be
apparent to an outsider. Quant funds are best left alone largely due to
the sheer volume of trades executed during a quarter. Risk optimized
style may be simulated as long as market-traded securities are used. To
follow the strategy, the whole portfolio is cloned.
13Fs: A Window into Hedge Fund Activity
Being privy to the moves of money managers is critical for eff ective
cloning. The regulatory requirement of SEC Form 13F is helpful to
a point in this regard. It insists that institutional investment managers
with investment discretion of $100 million or more in qualifying secu-
rities fi le this form. This rather broad rule applies no matter whether
the investment management fi rm concerned is registered as an invest-
ment advisor per the Investment Advisors Act. As such, almost all
money managers have to fi le Form 13F. Every quarter, the SEC pub-
lishes the list of qualifying securities; the latest list has around 16,000
entries comprising of the shares of stocks listed in NYSE, AMEX, and
NASDAQ, and closed and open-ended investment companies. 1 For
each stock listed, related instruments such as call-and-put options, war-
rants, and so on, are also included. Investment managers have to report
details on the number of securities owned, the market value of the
c01.indd 6c01.indd 6 29-05-2013 08:19:4829-05-2013 08:19:48
Introduction 7
securities as of the end of the quarter for which the report is fi led, etc.
13F fi lings, however, have several limitations:
• Timeliness is not a virtue of 13F. The information is due only
within 45 days from the end of every quarter, making the buy/
sell activity derivable from the reports inherently late by at least
45 days. To put it in perspective, if the buy/sell activity was exe-
cuted on the fi rst day of a particular quarter, this data might be
four and a half months old! This essentially renders cloning useless,
if the strategy of the money manager was time sensitive.
• The 13F does not provide a complete refl ection of a manager ’s
moves as only long holdings in the U.S. markets are reported in
it. Many of the best money managers invest globally in all kinds
of securities and the U.S. listed long selection is only part of their
overall portfolio. The 13F contains information only on this subset.
It does not shed light on the key elements of the manager ’s asset
allocation strategy such as bonds, cash, and other alternative invest-
ments. These limitations severely undermine cloning money man-
agers focused on alternate investment strategies, such as dedicated
short, and income focused, as well as money managers who prefer
investing outside the United States.
• Investment managers can request confi dential treatment of 13F trades
and delay reporting up to one year. 2 The majority of such requests are
rejected, as the onus is on the investment management company to
establish that absence of such immunity would impede their competi-
tive position. Even so, the fi ling company still scores, as they can delay
disclosing the position until the SEC rejection letter is received.
Currently, all 13F fi lings are in text format and are accessible to
the public via the EDGAR (Electronic Data-Gathering, Analysis, and
Retrieval) system. An SEC review (September 2010) of the Section
13F reporting requirements recommended plugging loopholes and
rectifying limitations. Among them are the timely handling of con-
fi dential treatment requests and enforcing the requirement to supply
background documentation. 3 The review also recommended looking
into expanding the defi nition of 13F securities, among other things.
They observed that not only did the current text format used in 13F
c01.indd 7c01.indd 7 29-05-2013 08:19:4829-05-2013 08:19:48
8 p r o f i t i n g f r o m h e d g e f u n d s
fi lings make it very diffi cult to analyze and manipulate the data sub-
mitted, but that there was also lack of uniformity in reporting. The
recommendation calls for a more structured format, such as Extensible
Markup Language (XML). Once the recommendations are imple-
mented, the system will become much more user friendly. Until then,
those wanting to study the moves of money managers have to work
around such limitations.
Filtering 13Fs for Relevant Activity
The information in the 13F fi lings in text format carries all the details
of a fund manager ’s long positions. It is easier if the numbers are ana-
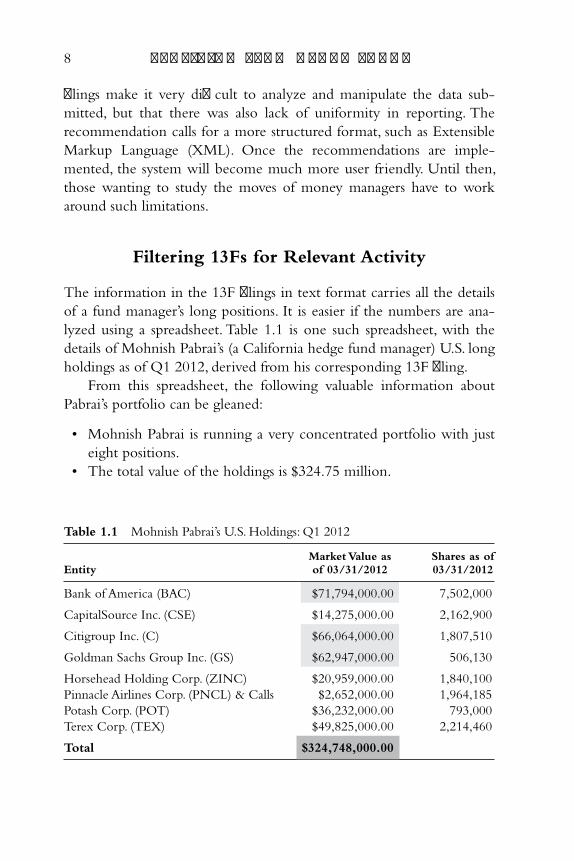
lyzed using a spreadsheet. Table 1.1 is one such spreadsheet, with the
details of Mohnish Pabrai ’s (a California hedge fund manager) U.S. long
holdings as of Q1 2012, derived from his corresponding 13F fi ling.
From this spreadsheet, the following valuable information about
Pabrai ’s portfolio can be gleaned:
• Mohnish Pabrai is running a very concentrated portfolio with just
eight positions.
• The total value of the holdings is $324.75 million.
Table 1.1 Mohnish Pabrai’s U.S. Holdings: Q1 2012
Entity
Market Value as of 03/31/2012
Shares as of 03/31/2012
Bank of America (BAC) $71,794,000.00 7,502,000
CapitalSource Inc. (CSE) $14,275,000.00 2,162,900
Citigroup Inc. (C) $66,064,000.00 1,807,510
Goldman Sachs Group Inc. (GS) $62,947,000.00 506,130
Horsehead Holding Corp. (ZINC) $20,959,000.00 1,840,100
Pinnacle Airlines Corp. (PNCL) & Calls $2,652,000.00 1,964,185
Potash Corp. (POT) $36,232,000.00 793,000
Terex Corp. (TEX) $49,825,000.00 2,214,460
Total $324,748,000.00
c01.indd 8c01.indd 8 29-05-2013 08:19:4829-05-2013 08:19:48
Introduction 9
• Pabrai ’s largest three holdings are Bank of America (BAC),
Citigroup (C), and Goldman Sachs (GS). Combined (~62 per-
cent of the total portfolio), they make for a huge bet on fi nancials.
The percentage is obtained by adding the corresponding fi gures
in the Market Value column and dividing by the total value of the
holdings.
The spreadsheet, however, lacks the comparative information that
provides insight into the manager ’s investment bias during the quarter:
• What are the largest buys in the quarter?
• What are the largest sells in the quarter?
• What positions were newly added in the quarter?
• What positions were eliminated in the quarter?
• How does the portfolio compare to that of the previous quarter?
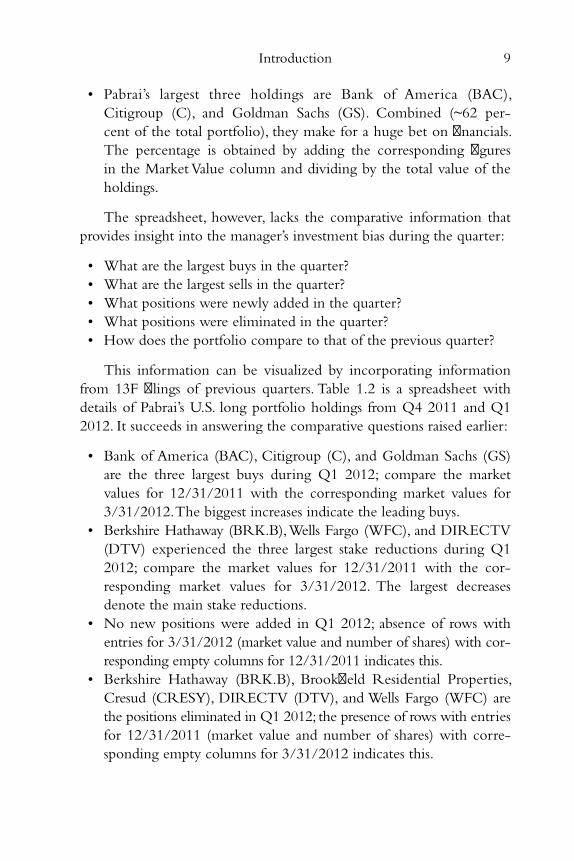
This information can be visualized by incorporating information
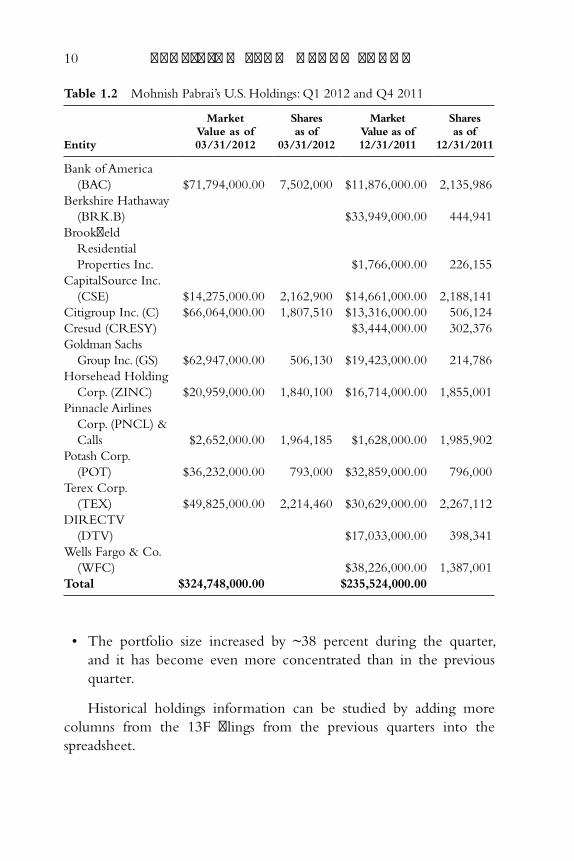
from 13F fi lings of previous quarters. Table 1.2 is a spreadsheet with
details of Pabrai ’s U.S. long portfolio holdings from Q4 2011 and Q1
2012. It succeeds in answering the comparative questions raised earlier:
• Bank of America (BAC), Citigroup (C), and Goldman Sachs (GS)
are the three largest buys during Q1 2012; compare the market
values for 12/31/2011 with the corresponding market values for
3/31/2012. The biggest increases indicate the leading buys.
• Berkshire Hathaway (BRK.B), Wells Fargo (WFC), and DIRECTV
(DTV) experienced the three largest stake reductions during Q1
2012; compare the market values for 12/31/2011 with the cor-
responding market values for 3/31/2012. The largest decreases
denote the main stake reductions.
• No new positions were added in Q1 2012; absence of rows with
entries for 3/31/2012 (market value and number of shares) with cor-
responding empty columns for 12/31/2011 indicates this.
• Berkshire Hathaway (BRK.B), Brookfi eld Residential Properties,
Cresud (CRESY), DIRECTV (DTV), and Wells Fargo (WFC) are
the positions eliminated in Q1 2012; the presence of rows with entries
for 12/31/2011 (market value and number of shares) with corre-
sponding empty columns for 3/31/2012 indicates this.
c01.indd 9c01.indd 9 29-05-2013 08:19:4829-05-2013 08:19:48
10 p r o f i t i n g f r o m h e d g e f u n d s
• The portfolio size increased by ~38 percent during the quarter,
and it has become even more concentrated than in the previous
quarter.
Historical holdings information can be studied by adding more
columns from the 13F fi lings from the previous quarters into the
spreadsheet.
Table 1.2 Mohnish Pabrai’s U.S. Holdings: Q1 2012 and Q4 2011
Entity
Market Value as of 03/31/2012
Shares as of
03/31/2012
Market Value as of 12/31/2011
Shares as of
12/31/2011
Bank of America
(BAC) $71,794,000.00 7,502,000 $11,876,000.00 2,135,986
Berkshire Hathaway
(BRK.B) $33,949,000.00 444,941
Brookfi eld
Residential
Properties Inc. $1,766,000.00 226,155
CapitalSource Inc.
(CSE) $14,275,000.00 2,162,900 $14,661,000.00 2,188,141
Citigroup Inc. (C) $66,064,000.00 1,807,510 $13,316,000.00 506,124
Cresud (CRESY) $3,444,000.00 302,376
Goldman Sachs
Group Inc. (GS) $62,947,000.00 506,130 $19,423,000.00 214,786
Horsehead Holding
Corp. (ZINC) $20,959,000.00 1,840,100 $16,714,000.00 1,855,001
Pinnacle Airlines
Corp. (PNCL) &
Calls $2,652,000.00 1,964,185 $1,628,000.00 1,985,902
Potash Corp.
(POT) $36,232,000.00 793,000 $32,859,000.00 796,000
Terex Corp.
(TEX) $49,825,000.00 2,214,460 $30,629,000.00 2,267,112
DIRECTV
(DTV) $17,033,000.00 398,341
Wells Fargo & Co.
(WFC) $38,226,000.00 1,387,001
Total $324,748,000.00 $235,524,000.00
c01.indd 10c01.indd 10 29-05-2013 08:19:4829-05-2013 08:19:48
Introduction 11
Raw 13F Filings from EDGAR
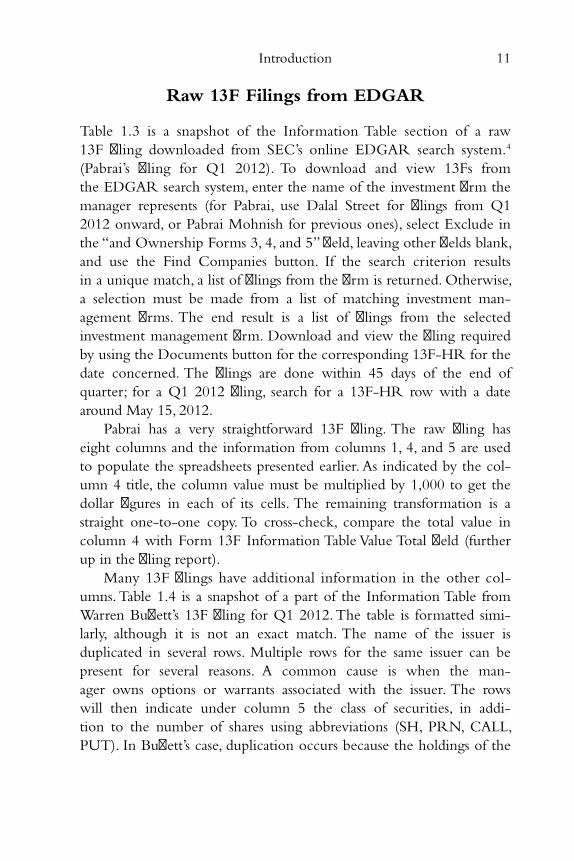
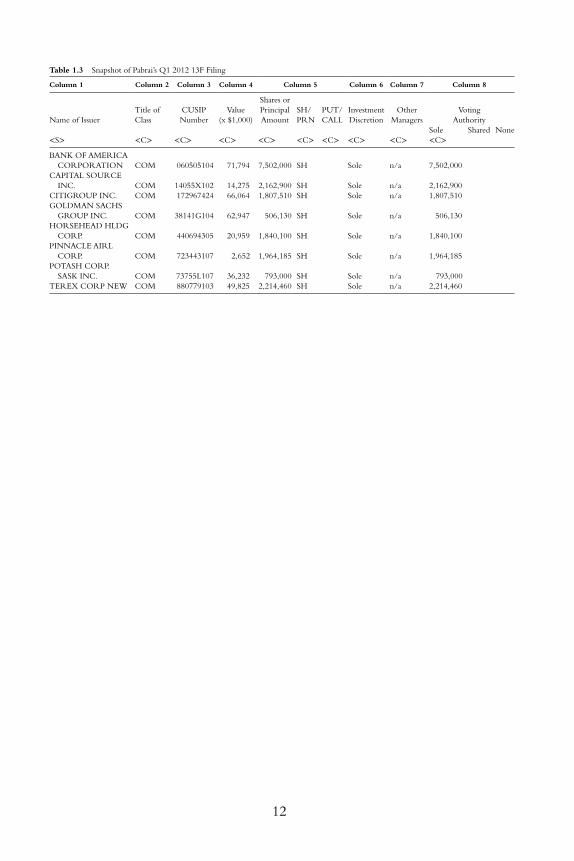
Table 1.3 is a snapshot of the Information Table section of a raw
13F fi ling downloaded from SEC ’s online EDGAR search system. 4
(Pabrai ’s fi ling for Q1 2012). To download and view 13Fs from
the EDGAR search system, enter the name of the investment fi rm the
manager represents (for Pabrai, use Dalal Street for fi lings from Q1
2012 onward, or Pabrai Mohnish for previous ones), select Exclude in
the “and Ownership Forms 3, 4, and 5” fi eld, leaving other fi elds blank,
and use the Find Companies button. If the search criterion results
in a unique match, a list of fi lings from the fi rm is returned. Otherwise,
a selection must be made from a list of matching investment man-
agement fi rms. The end result is a list of fi lings from the selected
investment management fi rm. Download and view the fi ling required
by using the Documents button for the corresponding 13F-HR for the
date concerned. The fi lings are done within 45 days of the end of
quarter; for a Q1 2012 fi ling, search for a 13F-HR row with a date
around May 15, 2012.
Pabrai has a very straightforward 13F fi ling. The raw fi ling has
eight columns and the information from columns 1, 4, and 5 are used
to populate the spreadsheets presented earlier. As indicated by the col-
umn 4 title, the column value must be multiplied by 1,000 to get the
dollar fi gures in each of its cells. The remaining transformation is a
straight one-to-one copy. To cross-check, compare the total value in
column 4 with Form 13F Information Table Value Total fi eld (further
up in the fi ling report).
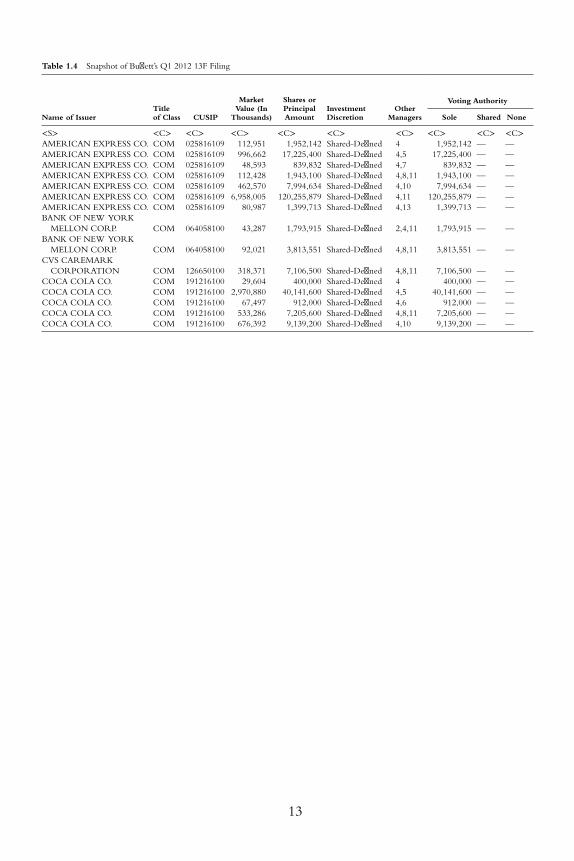
Many 13F fi lings have additional information in the other col-
umns. Table 1.4 is a snapshot of a part of the Information Table from
Warren Buff ett ’s 13F fi ling for Q1 2012. The table is formatted simi-
larly, although it is not an exact match. The name of the issuer is
duplicated in several rows. Multiple rows for the same issuer can be
present for several reasons. A common cause is when the man-
ager owns options or warrants associated with the issuer. The rows
will then indicate under column 5 the class of securities, in addi-
tion to the number of shares using abbreviations (SH, PRN, CALL,
PUT). In Buff ett ’s case, duplication occurs because the holdings of the
c01.indd 11c01.indd 11 29-05-2013 08:19:4829-05-2013 08:19:48
12
Column 1 Column 2 Column 3 Column 4 Column 5 Column 6 Column 7 Column 8
Name of Issuer
Title of
Class
CUSIP
Number
Value
(x $1,000)
Shares or
Principal
Amount
SH/
PRN
PUT/
CALL
Investment
Discretion
Other
Managers
Voting
Authority
Sole Shared None
<S> <C> <C> <C> <C> <C> <C> <C> <C> <C>
BANK OF AMERICA
CORPORATION COM 060505104 71,794 7,502,000 SH Sole n/a 7,502,000
CAPITAL SOURCE
INC. COM 14055X102 14,275 2,162,900 SH Sole n/a 2,162,900
CITIGROUP INC. COM 172967424 66,064 1,807,510 SH Sole n/a 1,807,510
GOLDMAN SACHS
GROUP INC. COM 38141G104 62,947 506,130 SH Sole n/a 506,130
HORSEHEAD HLDG
CORP. COM 440694305 20,959 1,840,100 SH Sole n/a 1,840,100
PINNACLE AIRL
CORP. COM 723443107 2,652 1,964,185 SH Sole n/a 1,964,185
POTASH CORP.
SASK INC. COM 73755L107 36,232 793,000 SH Sole n/a 793,000
TEREX CORP NEW COM 880779103 49,825 2,214,460 SH Sole n/a 2,214,460
Table 1.3 Snapshot of Pabrai ’s Q1 2012 13F Filing
c01.indd 12c01.indd 12 29-05-2013 08:19:4829-05-2013 08:19:48
13
Name of Issuer Title of Class CUSIP
Market Value (In
Thousands)
Shares or Principal Amount
Investment Discretion
Other Managers
Voting Authority
Sole Shared None
<S> <C> <C> <C> <C> <C> <C> <C> <C> <C>
AMERICAN EXPRESS CO. COM 025816109 112,951 1,952,142 Shared-Defi ned 4 1,952,142 — —
AMERICAN EXPRESS CO. COM 025816109 996,662 17,225,400 Shared-Defi ned 4,5 17,225,400 — —
AMERICAN EXPRESS CO. COM 025816109 48,593 839,832 Shared-Defi ned 4,7 839,832 — —
AMERICAN EXPRESS CO. COM 025816109 112,428 1,943,100 Shared-Defi ned 4,8,11 1,943,100 — —
AMERICAN EXPRESS CO. COM 025816109 462,570 7,994,634 Shared-Defi ned 4,10 7,994,634 — —
AMERICAN EXPRESS CO. COM 025816109 6,958,005 120,255,879 Shared-Defi ned 4,11 120,255,879 — —
AMERICAN EXPRESS CO. COM 025816109 80,987 1,399,713 Shared-Defi ned 4,13 1,399,713 — —
BANK OF NEW YORK
MELLON CORP. COM 064058100 43,287 1,793,915 Shared-Defi ned 2,4,11 1,793,915 — —
BANK OF NEW YORK
MELLON CORP. COM 064058100 92,021 3,813,551 Shared-Defi ned 4,8,11 3,813,551 — —
CVS CAREMARK
CORPORATION COM 126650100 318,371 7,106,500 Shared-Defi ned 4,8,11 7,106,500 — —
COCA COLA CO. COM 191216100 29,604 400,000 Shared-Defi ned 4 400,000 — —
COCA COLA CO. COM 191216100 2,970,880 40,141,600 Shared-Defi ned 4,5 40,141,600 — —
COCA COLA CO. COM 191216100 67,497 912,000 Shared-Defi ned 4,6 912,000 — —
COCA COLA CO. COM 191216100 533,286 7,205,600 Shared-Defi ned 4,8,11 7,205,600 — —
COCA COLA CO. COM 191216100 676,392 9,139,200 Shared-Defi ned 4,10 9,139,200 — —
Table 1.4 Snapshot of Buff ett ’s Q1 2012 13F Filing
c01.indd 13c01.indd 13 29-05-2013 08:19:4829-05-2013 08:19:48
14 p r o f i t i n g f r o m h e d g e f u n d s
subsidiaries are separated into diff erent rows. Column 6 indicates with
whom Investment Discretion rests, which is listed as Shared-Defi ned in
Buff ett ’s fi ling, that is, there are multiple managers involved. Column 7
indicates the other managers involved, through a comma-separated
list of indexes. The indexes point to manager details listed in the table
of Other Managers, included earlier in the fi ling. In general, with
duplicate rows, column 5 abbreviation is a good key to base a consol-
idation. In this 13F, the abbreviations are missing as the holdings with
the same issuer name are all the same class of securities and, when
transforming into a spreadsheet, the rows can be summed up into a
single row for each issuer.
Depending on the number of managers one is planning to track,
transformation of the spreadsheet can be accomplished by either
manually copying each item, or by using a simple computer program
or script that can parse the relevant details from the 13F, and out-
put a comma-separated list that can be processed by Excel. It is quite
tedious for investors attempting to follow a number of managers to
go through the process of downloading each 13F Filing, then trans-
forming them into spreadsheets that can be analyzed. SEC off ers a
product called the Edgar Public Dissemination Service (PDS), which
automatically delivers all public fi lings acquired and accepted by
EDGAR, just as the fi lings are sent to the SEC from EDGAR. 5 It is
a privately operated system by Keane Federal Systems, which is also
responsible for setting the annual subscription rates. A subscription
agreement with Keane, along with hardware and software setup com-
patible with their technical guidelines, is needed to receive the fi les.
The system is especially useful to monitor fi lings that are submitted
with very little delay, such as Form 13-D (the benefi cial ownership
report) and 4G (the insider trading report). There are also other
fi rms 6 that specialize in making available a database that can be mined
for specifi c information obtainable from the fi lings received through
EDGAR.
To select a dozen of the best managers an eclectic approach was
used, as it gives the best opportunity to study their styles and come up
with cloning strategies that would suit particular styles. Reputation and
long-term records were relied on as secondary considerations.
c01.indd 14c01.indd 14 29-05-2013 08:19:4829-05-2013 08:19:48

Introduction 15
Notes
1. Offi cial List of SEC ’s Section 13(f) Security Users, at www.sec.gov/divisions/
investment/13fl ists.htm .
2. Details of SEC ’s Section 13(f) Confi dential Treatment Requests, at www.sec
.gov/divisions/investment/guidance/13fpt2.htm .
3. Review of the SEC ’s Section 13(f) Reporting Requirements at www.sec-oig
.gov/Reports/AuditsInspections/2010/480.pdf .
4. SEC ’s EDGAR search system at www.sec.gov/edgar/searchedgar/company
search.html .
5. Details of SEC ’s EDGAR Public Dissemination Service (PDS) at www.sec
.gov/info/edgar/ednews/dissemin.htm .
6. Firms such as Dataroma and AlphaClone.
c01.indd 15c01.indd 15 29-05-2013 08:19:4829-05-2013 08:19:48

c01.indd 16c01.indd 16 29-05-2013 08:19:4829-05-2013 08:19:48
17
Chapter 2
Bill Ackman
Bill Ackman is founder and CEO of the hedge fund manage-
ment fi rm Pershing Square Capital Management, established in
2004. His initial venture was Gotham Partners (1992), cofounded
with classmate David Berkowitz, after receiving an MBA from Harvard
Business School. Drawing on his prior real-estate experience with his
father ’s fi rm Ackman Brothers & Singer, Inc., early investments were
primarily in the real estate sector. In spite of realizing good returns, the
fi rm had a choppy end. Gotham bought a controlling stake in a golf-
course operator, and added to the debt burden by acquiring other
courses. To salvage the struggling golf business, the company planned a
merger with First Union Real Estate Equity and Mortgage Investments,
a cash-rich real-estate business. The union did not materialize, as a
New York judge ruled in favor of certain minority shareholders who
had fi led a lawsuit against the merger. Reports 1 that Eliot Spitzer, the
New York attorney general, would investigate whether Gotham Partners
manipulated stock prices by publishing intentionally misleading research
and/or illegal trading practices, did not bode well for the partnership
In Sweden, the big shareholders propose board members. In the
U.S., board members elect new board members.
—Bill Ackman
c02.indd 17c02.indd 17 27-05-2013 11:50:5727-05-2013 11:50:57
18 p r o f i t i n g f r o m h e d g e f u n d s
either . As redemptions increased, Gotham shelved the fund in an eff ort
to equitably distribute both the liquid and illiquid assets.
Ackman teamed with Leucadia National ’s (LUK) Ian Cumming to
create Pershing Square, LP in 2003, which became Pershing Square
Capital Management in 2004. He launched four diff erent funds
between January 2004 and July 2007, three of which enjoyed stun-
ning returns by outperforming the market averages by double dig-
its annually. The fund that underperformed was Pershing Square IV
(PSIV), formed exclusively to invest in Target Corporation options.
In early 2009, the fund dipped almost 90 percent, forcing Ackman
to issue a public apology. Though eventually it recouped most of its
losses, Ackman admitted that for four years no profi t was made on
investment in Target Corporation.
Philosophy and Style
Bill Ackman is an activist hedge fund manager. Activist investors hold
considerably large (10 percent is typical) stakes in public companies
and persuade management to eff ect changes that they (the activist
investors) are confi dent would make the company more valuable. The
activities range from negotiating directly with management in order to
propose and implement operational changes to full-fl edged proxy bat-
tles that allow gaining control of the company. The proposed changes
can include operational adjustments, executive management changes,
splitting of the company, spinning off businesses, and so on.
Ackman ’s modus operandi can be summed as searching for
undervalued companies, analyzing why they are so, and determin-
ing whether it is worth becoming an activist investor. The idea is to
help resolve the problems responsible for the underrating. Once an
opportunity is identifi ed, Ackman strikes. He swiftly builds a posi-
tion upwards of 10 percent, and engages management to bring
about changes. If his eff orts pan out in time, the market will adjust
to bridge the undervaluation gap returning an impressive yield on
his original investment. At this point, Ackman usually moves on. His
selection process normally excludes mega caps, as it is tough to build
meaningful stakes in them.
c02.indd 18c02.indd 18 27-05-2013 11:50:5727-05-2013 11:50:57
Bill Ackman 19
Mispriced probabilistic investments are another of Ackman ’s
strengths. These situations happen when the investor identifi es that
the market has under- or overestimated the probability of an event.
Ackman generally places small, highly leveraged bets in this area;
if proved right, the payoff is huge and if wrong, the damage is lim-
ited. The purchase of MBIA Credit Default Swaps (CDS) in the early
2000s is a prime example of one such killer investment. CDS contracts
function as insurance policies against default of company debt. As the
market did not anticipate a change in MBIA ’s AAA rating for some
time, its CDS contracts were available cheaply. Ackman ’s astute research
revealed MBIA was incorrectly rated AAA, and that the contracts were
thus mispriced. Ackman followed through and successfully pulled off a
major economic gamble in 2008. The CDS contract price moved up
from a mere 13 to as high as 1200 basis points from 2002 to 2008.
Ackman ’s activity on MBIA is immortalized in Confi dence Game , by
Christine Richard. 2
Marquee Trades
Several of Ackman ’s investments did spectacularly well over the years
and quite a few had reasonable returns. However, there were also some
that had no movement or resulted in losses. As with any investment
style, Ackman ’s is not without risks but, compared with his gains, the
losses pale. The following are among the investment calls that greatly
impacted his portfolio performance.
• Wachovia transaction : The Wachovia investment was among
the largest realized gains in his portfolio in 2008. 3 Ackman picked
up 178 million shares of Wachovia at an average purchase price of
$3.15 in the week following Citigroup ’s announcement to buy
Wachovia ’s banking subsidiaries on September 29, 2008. Per his
investment thesis, Ackman ’s estimate of the value of Wachovia
after the Citigroup transaction was between $8 and $11, while
the stock was trading below $2. This call was spot-on, as Wells
Fargo off ered to buy Wachovia at about $7 per share the follow-
ing week. Ackman had unfl inchingly committed almost an eighth
c02.indd 19c02.indd 19 27-05-2013 11:50:5727-05-2013 11:50:57
20 p r o f i t i n g f r o m h e d g e f u n d s
of his portfolio value to this one transaction whose returns had
an overall portfolio impact of 6.5 percent. The position sizing in
this transaction is a tutorial on how to ensure high conviction bets
have a sizable portfolio impact. This transaction, along with several
others that year, helped the fund outperform the S&P 500 index
by a whopping 24 percent. The index returned −37 percent while
his fund returned −13 percent.
• General growth properties (GGP) : Ackman invested in
General Growth starting in Q4 2008 (when it was trading below
a dollar) and built a 25 percent stake for $60 million. On liquidity
concerns, GGP share price had decreased by over 90 percent. The
investment theory was that the company was solvent, as assets out-
did liabilities. Ackman believed bankruptcy might enable restoring
equity value as the pressure to handle large near-term debt matur-
ities could be extended in such a situation. His conviction proved
true, and GGP emerged from bankruptcy in early 2010 at $15
per share, returning over 25 times on the investment. The posi-
tion sizing is refl ective of Ackman ’s assessment of the risk involved
in the investment. While his investment was limited to less than
1.5 percent of the portfolio, the huge 25-times return made it
absolutely worthwhile, as it contributed substantially to the funds
returns for 2010.
• Short-side bets on mortgage guarantors and bond insurers :
From 2007 to 2008, Ackman played the short side, using CDS con-
tracts and short-selling stock of companies such as Fannie Mae
(FNMA), MBIA (MBI), and Assured Guaranty (AGO). These posi-
tions had a positive double-digit percentage impact on the portfolio.
Here again, perfect position sizing was demonstrated: The CDS
contracts were cheap, allowing the purchase of a large position
with a trivial portfolio portion, but the impact was signifi cant, as
many of them returned multiple times.
Portfolio Analysis
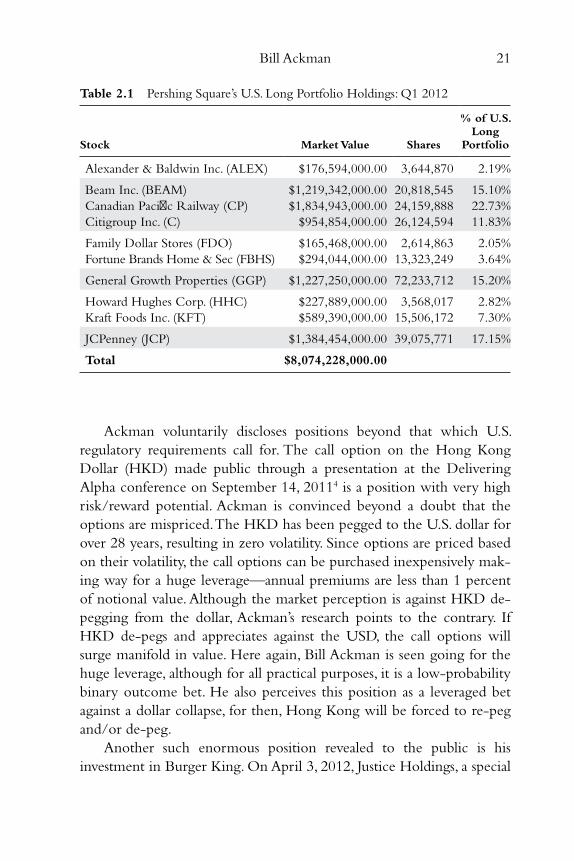
Pershing Square ’s U.S. long portfolio details as of Q1 2012 are listed in
Table 2.1 .
c02.indd 20c02.indd 20 27-05-2013 11:50:5727-05-2013 11:50:57
Bill Ackman 21
Ackman voluntarily discloses positions beyond that which U.S.
regulatory requirements call for. The call option on the Hong Kong
Dollar (HKD) made public through a presentation at the Delivering
Alpha conference on September 14, 2011 4 is a position with very high
risk/reward potential. Ackman is convinced beyond a doubt that the
options are mispriced. The HKD has been pegged to the U.S. dollar for
over 28 years, resulting in zero volatility. Since options are priced based
on their volatility, the call options can be purchased inexpensively mak-
ing way for a huge leverage—annual premiums are less than 1 percent
of notional value. Although the market perception is against HKD de-
pegging from the dollar, Ackman ’s research points to the contrary. If
HKD de-pegs and appreciates against the USD, the call options will
surge manifold in value. Here again, Bill Ackman is seen going for the
huge leverage, although for all practical purposes, it is a low-probability
binary outcome bet. He also perceives this position as a leveraged bet
against a dollar collapse, for then, Hong Kong will be forced to re-peg
and/or de-peg.
Another such enormous position revealed to the public is his
investment in Burger King. On April 3, 2012, Justice Holdings, a special
Table 2.1 Pershing Square’s U.S. Long Portfolio Holdings: Q1 2012
Stock Market Value Shares
% of U.S. Long
Portfolio
Alexander & Baldwin Inc. (ALEX) $176,594,000.00 3,644,870 2.19%
Beam Inc. (BEAM) $1,219,342,000.00 20,818,545 15.10%
Canadian Pacifi c Railway (CP) $1,834,943,000.00 24,159,888 22.73%
Citigroup Inc. (C) $954,854,000.00 26,124,594 11.83%
Family Dollar Stores (FDO) $165,468,000.00 2,614,863 2.05%
Fortune Brands Home & Sec (FBHS) $294,044,000.00 13,323,249 3.64%
General Growth Properties (GGP) $1,227,250,000.00 72,233,712 15.20%
Howard Hughes Corp. (HHC) $227,889,000.00 3,568,017 2.82%
Kraft Foods Inc. (KFT) $589,390,000.00 15,506,172 7.30%
JCPenney (JCP) $1,384,454,000.00 39,075,771 17.15%
Total $8,074,228,000.00
c02.indd 21c02.indd 21 27-05-2013 11:50:5727-05-2013 11:50:57
22 p r o f i t i n g f r o m h e d g e f u n d s
purpose acquisition Company (SPAC) listed in the London Stock
Exchange and backed by Ackman, purchased a 29 percent stake in
Burger King Holdings for $1.4 billion from 3G Capital. The transaction
is rather strange, given its passive approach. The stake was purchased
at a very large premium compared to what 3G Capital paid for the
whole company in a leveraged buyout in 2010. This is a waiting game;
the nature of the wait, however, hinges on Burger King ’s performance
following IPO on the New York Stock Exchange. Justice Holdings is
30 percent owned by Pershing Square and the ownership in Burger
King is around 11 percent.
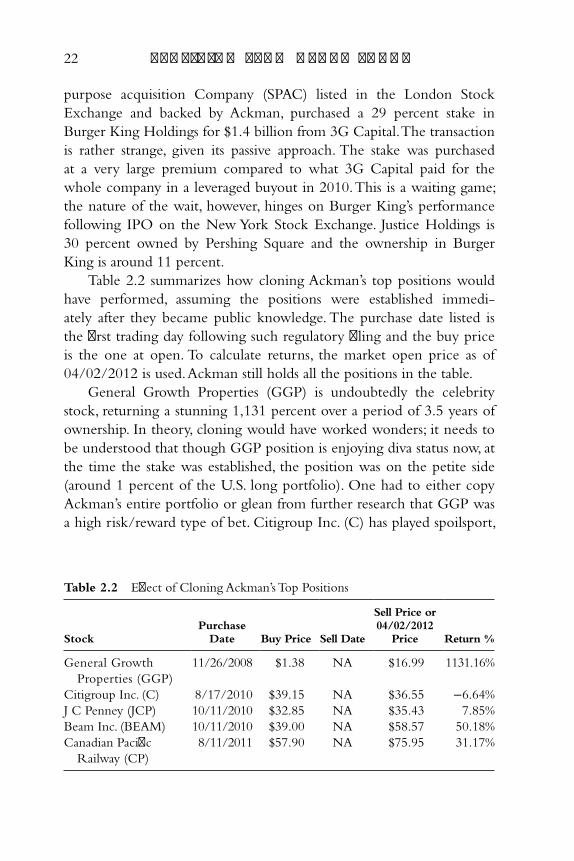
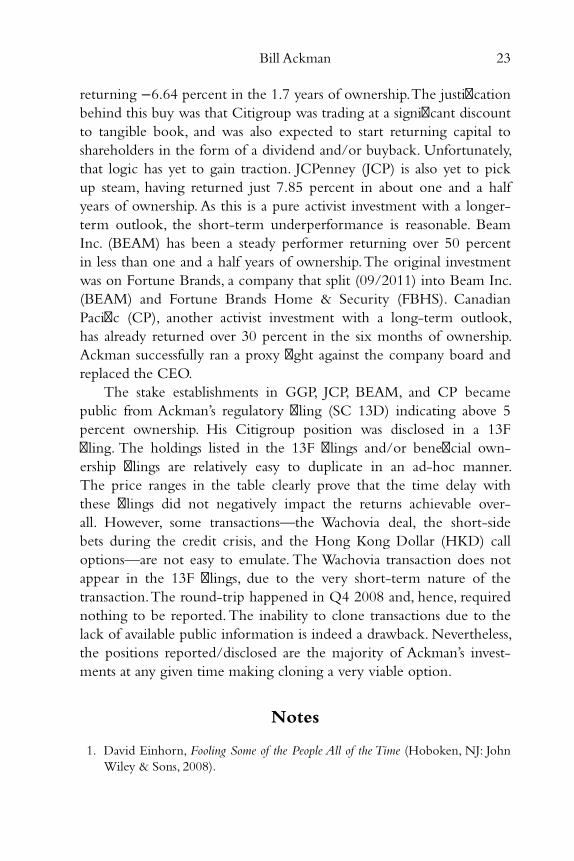
Table 2.2 summarizes how cloning Ackman ’s top positions would
have performed, assuming the positions were established immedi-
ately after they became public knowledge. The purchase date listed is
the fi rst trading day following such regulatory fi ling and the buy price
is the one at open. To calculate returns, the market open price as of
04/02/2012 is used. Ackman still holds all the positions in the table.
General Growth Properties (GGP) is undoubtedly the celebrity
stock, returning a stunning 1,131 percent over a period of 3.5 years of
ownership. In theory, cloning would have worked wonders; it needs to
be understood that though GGP position is enjoying diva status now, at
the time the stake was established, the position was on the petite side
(around 1 percent of the U.S. long portfolio). One had to either copy
Ackman ’s entire portfolio or glean from further research that GGP was
a high risk/reward type of bet. Citigroup Inc. (C) has played spoilsport,
Table 2.2 Eff ect of Cloning Ackman’s Top Positions
Stock Purchase
Date Buy Price Sell Date
Sell Price or 04/02/2012
Price Return %
General Growth
Properties (GGP)
11/26/2008 $1.38 NA $16.99 1131.16%
Citigroup Inc. (C) 8/17/2010 $39.15 NA $36.55 −6.64%
J C Penney (JCP) 10/11/2010 $32.85 NA $35.43 7.85%
Beam Inc. (BEAM) 10/11/2010 $39.00 NA $58.57 50.18%
Canadian Pacifi c
Railway (CP)
8/11/2011 $57.90 NA $75.95 31.17%
c02.indd 22c02.indd 22 27-05-2013 11:50:5727-05-2013 11:50:57
Bill Ackman 23
returning −6.64 percent in the 1.7 years of ownership. The justifi cation
behind this buy was that Citigroup was trading at a signifi cant discount
to tangible book, and was also expected to start returning capital to
shareholders in the form of a dividend and/or buyback. Unfortunately,
that logic has yet to gain traction. JCPenney (JCP) is also yet to pick
up steam, having returned just 7.85 percent in about one and a half
years of ownership. As this is a pure activist investment with a longer-
term outlook, the short-term underperformance is reasonable. Beam
Inc. (BEAM) has been a steady performer returning over 50 percent
in less than one and a half years of ownership. The original investment
was on Fortune Brands, a company that split (09/2011) into Beam Inc.
(BEAM) and Fortune Brands Home & Security (FBHS). Canadian
Pacifi c (CP), another activist investment with a long-term outlook,
has already returned over 30 percent in the six months of ownership.
Ackman successfully ran a proxy fi ght against the company board and
replaced the CEO.
The stake establishments in GGP, JCP, BEAM, and CP became
public from Ackman ’s regulatory fi ling (SC 13D) indicating above 5
percent ownership. His Citigroup position was disclosed in a 13F
fi ling. The holdings listed in the 13F fi lings and/or benefi cial own-
ership fi lings are relatively easy to duplicate in an ad-hoc manner.
The price ranges in the table clearly prove that the time delay with
these fi lings did not negatively impact the returns achievable over-
all. However, some transactions—the Wachovia deal, the short-side
bets during the credit crisis, and the Hong Kong Dollar (HKD) call
options—are not easy to emulate. The Wachovia transaction does not
appear in the 13F fi lings, due to the very short-term nature of the
transaction. The round-trip happened in Q4 2008 and, hence, required
nothing to be reported. The inability to clone transactions due to the
lack of available public information is indeed a drawback. Nevertheless,
the positions reported/disclosed are the majority of Ackman ’s invest-
ments at any given time making cloning a very viable option.
Notes
1. David Einhorn, Fooling Some of the People All of the Time (Hoboken, NJ: John
Wiley & Sons, 2008).
c02.indd 23c02.indd 23 27-05-2013 11:50:5727-05-2013 11:50:57

24 p r o f i t i n g f r o m h e d g e f u n d s
2. Christine Richard, Confi dence Game (Hoboken, NJ: John Wiley & Sons,
2010).
3. William Ackman, Annual Investor Dinner Presentation, Pershing Square
Capital Management, L.P., January 22, 2009.
4. William Ackman, “Linked to Win,” Pershing Square Capital Management,
L.P., Delivery Alpha Conference, September 14, 2011.
c02.indd 24c02.indd 24 27-05-2013 11:50:5727-05-2013 11:50:57
25
Chapter 3
Bruce Berkowitz
Virtually no member of the Forbes 400 list of wealthiest
Americans accumulated signifi cant wealth by being widely
diversifi ed.
—Bruce Berkowitz
Bruce R. Berkowitz is founder and managing member of money
management fi rm Fairholme Capital Management LLC, estab-
lished in 1997. Its fl agship product, the Fairholme Fund (FAIRX),
was fl oated on December 29, 1999. More recently, two other smaller
funds were launched: the Fairholme Focused Income Fund (FOCIX) on
December 29, 2009 and the Fairholme Allocation Fund (FAAFX), which
followed exactly one year later. FAIRX consistently outperformed the S&P
500 index by very wide margins from 2000 to 2009. This performance
was brought into the limelight when Morningstar 1 honored Berkowitz
with the Domestic-Stock Fund Manager of the Decade and the Domestic-
Stock Fund Manager of the Year awards in 2010.
Berkowitz, the fi rst in his family to attend college, graduated with
a bachelor ’s degree in economics from University of Massachusetts,
Amherst, in 1980. He started his career as a data analyst at Strategic
Planning Institute in Cambridge, Massachusetts, and he was soon
transferred to Manchester, England. In 1983, he joined Merrill Lynch,
c03.indd 25c03.indd 25 27-05-2013 12:05:3627-05-2013 12:05:36
26 p r o f i t i n g f r o m h e d g e f u n d s
London, and, by 1989, was the fi nancial consultant and portfolio man-
ager for Shearson Lehman Brothers in the United States. Concentrated
portfolios were his trademark, so much so that, in 1994, he held just two
stocks: Berkshire Hathaway and Fireman ’s Fund Insurance Company.
Berkowitz went solo in 1997 to found Fairholme, partly because the
supervisors at Lehman resented his concentrated portfolio style. After a
decade of superior returns with FAIRX, the FOCIX fund was launched
in 2009 to meet investor demand for a product focused on income ori-
ented investments. A year later, the FAAFX fund was launched, again fol-
lowing investor demand for a smaller fund that could take advantage of
small-quantity ideas; as FAIRX is a very large fund, it is not possible to
meaningfully participate in smaller cap opportunities.
Philosophy and Style
Berkowitz is a contrarian deep-value investor impervious to the fads
and fashions of the stock market. His succinct tagline, “ignore the
crowd,” accurately sums up his investment philosophy. He adheres to
the value investing notion of not associating volatility with risk: Risk is
a measure of the probability of permanent loss of capital while volatility
is short-term price movement that does not signifi cantly aff ect long-
term returns. Berkowitz has acknowledged that his contrarian value
investing style frequently causes him to buy shares cheap, only to see
them get cheaper. 2 To him, these are golden chances to stock up more
for less, as such fl uctuations are a result of volatility, rather than a reduc-
tion in the fair value of the company concerned.
Berkowitz also subscribes to a narrow school within the value-
investing world of running very concentrated portfolios. From a
peripheral standpoint, his portfolio can seem well diversifi ed, as it is
spread over 30 or so diff erent securities. Deeper scrutiny will reveal
that the majority of the money is invested in only a handful of them.
He also holds signifi cant amount of cash at any given time.
Investing mostly in listed securities using a long-only investment
strategy had been his tried and tested approach for the longest time.
During the fi nancial crisis, he migrated to investing in distressed assets
in need of both capital and restructuring. While such a step usually is
c03.indd 26c03.indd 26 27-05-2013 12:05:3727-05-2013 12:05:37
Bruce Berkowitz 27
a precursor to transforming into a hedge fund, Berkowitz is not into
dealing with hedge fund investors, terming them high maintenance. 3
The Fairholme Fund experienced large redemptions in 2011 due
to so-called performance chasing among investors who took to the
fund following his selection as the fund manager of the decade, but dis-
appeared when the fund underperformed in 2011. The cash allocation
helped in riding out the storm and the outfl ows resulted in making his
portfolio sharp; the total number of positions came down from the high
30s to the low 20s during that period. Having permanent capital, for
instance closed-end funds and/or insurance fl oat, would alleviate some
of these issues. Though Berkowitz has voiced a preference for perma-
nent capital, he is yet to commit to any particular option. 4
Marquee Trades
Bruce Berkowitz ’s core expertise lies in analyzing fi nancial companies.
In the late 1980s and early 1990s, his investments in fi nancial institutions
provided manifold returns within a few years. A third of his liquid net
worth at the time was invested in Wells Fargo (WFC), which returned
around seven times in as many years. The investment theory was that
the bank possessed tremendous earnings power whose potential largely
went unrecognized, as the earnings were disguised by provisioning for
loan losses. While the general consensus then was that WFC was cov-
ering up something, Berkowitz was convinced that was impossible. He
saw no room for skeletons when nonperforming loans had a cash-yield
of 6.2 percent, foreclosed assets had stabilized, the loan portfolio had
shrunk 20 percent, and they were paying 17 times their GAAP earnings
in taxes.
The fund identifi ed problems with the real estate market and exited
the fi nancial sector by 2008. Some of the funds were reallocated into
businesses vulnerable to turbulence in the credit markets. Auto and
equipment rental companies such as Hertz (HTZ) and United Rentals
(URI) fi t this category, as they were dependent on short-term asset-
backed fi nancing. In spite of respectable free cash fl ow, the market valued
such companies as though they were on the verge of bankruptcy, on
liquidity concerns. Berkowitz ’s contrarian view begged to diff er from
c03.indd 27c03.indd 27 27-05-2013 12:05:3727-05-2013 12:05:37
28 p r o f i t i n g f r o m h e d g e f u n d s
the market. His assessment was these companies could deleverage eas-
ily by selling equipment and generating signifi cant additional cash fl ow,
which, in turn, would result in higher utilization and increased cash
fl ow. Fairholme Fund also focused on defense and healthcare areas dur-
ing the fi nancial crisis. The fund established huge positions in Pfi zer
(PFE), Forest Labs (FRX), Humana (HUM), United Health (UNH),
Wellcare (WCG), and Wellpoint (WLP) in the healthcare sector and
Boeing (BA), General Dynamics (GD), Northrop Grumman (NOC),
and Spirit Aerosystems (SPR) in the defense sector. Both sectors were
trading in the six-times free-cash–fl ow range, which Berkowitz consid-
ered very cheap. To him, the fear of spending cuts in the defense sec-
tor and nationalization of healthcare were overrated. Per his calculation,
homeland security would be a huge catalyst for the defense sector, and
healthcare companies would thrive even if pushed toward nationaliza-
tion. All told, the fund displayed three years of stellar performance from
2008 to 2010, returning over 60 percent cumulative compared to below
12 percent cumulative for the S&P 500 Index.
For certain types of investments, Berkowitz relies on consul-
tants and a small number of other experts. His biggest project to date
has been in distressed securities, which he debuted in 2009. Charlie
Fernandez, a restructuring expert, was hired in 2007 to guide the fund
in transforming to investing in this area. They invested in distressed
securities, such as AmeriCredit and General Growth Properties (GGP),
and insightfully purchased both senior debt and equity. This business
acumen netted the fund billions of dollars in profi ts within a year.
Portfolio Analysis
Fairholme ’s U.S. long portfolio details as of Q1 2012 are listed in Table 3.1 .
The fund also has a cash allocation of around 10 percent and a large
11 percent allocation to AIA Group, 5 the spinoff of AIG ’s Asia Group
listed in the Hong Kong exchange.
Financials and real estate is practically the whole portfolio! Berkshire
Hathaway (BRK.A and BRK.B) and Leucadia National Corporation
(LUK) have been a presence in the portfolio since its inception,
although the sizing has varied over time. This is due to the unwavering
c03.indd 28c03.indd 28 27-05-2013 12:05:3727-05-2013 12:05:37
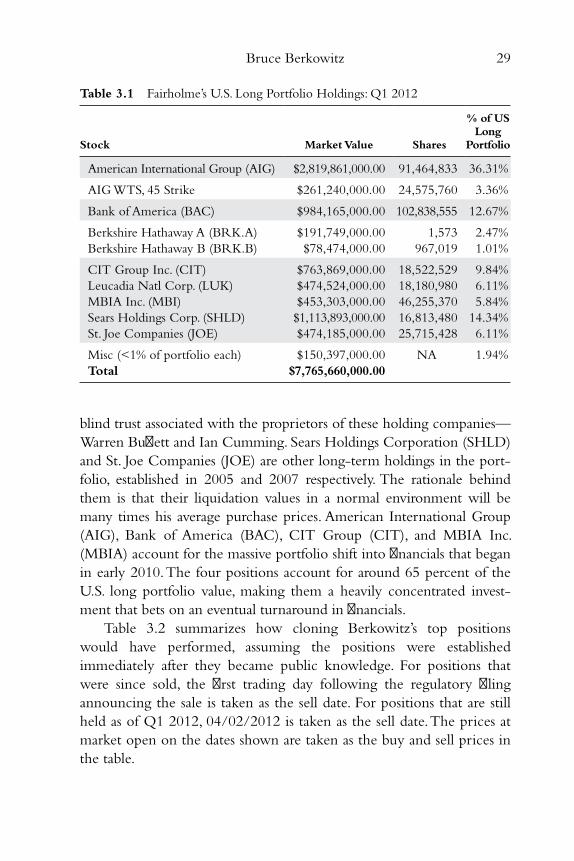
Bruce Berkowitz 29
blind trust associated with the proprietors of these holding companies—
Warren Buff ett and Ian Cumming. Sears Holdings Corporation (SHLD)
and St. Joe Companies (JOE) are other long-term holdings in the port-
folio, established in 2005 and 2007 respectively. The rationale behind
them is that their liquidation values in a normal environment will be
many times his average purchase prices. American International Group
(AIG), Bank of America (BAC), CIT Group (CIT), and MBIA Inc.
(MBIA) account for the massive portfolio shift into fi nancials that began
in early 2010. The four positions account for around 65 percent of the
U.S. long portfolio value, making them a heavily concentrated invest-
ment that bets on an eventual turnaround in fi nancials.
Table 3.2 summarizes how cloning Berkowitz ’s top positions
would have performed, assuming the positions were established
immediately after they became public knowledge. For positions that
were since sold, the fi rst trading day following the regulatory fi ling
announcing the sale is taken as the sell date. For positions that are still
held as of Q1 2012, 04/02/2012 is taken as the sell date. The prices at
market open on the dates shown are taken as the buy and sell prices in
the table.
Table 3.1 Fairholme’s U.S. Long Portfolio Holdings: Q1 2012
Stock Market Value Shares
% of US Long
Portfolio
American International Group (AIG) $2,819,861,000.00 91,464,833 36.31%
AIG WTS, 45 Strike $261,240,000.00 24,575,760 3.36%
Bank of America (BAC) $984,165,000.00 102,838,555 12.67%
Berkshire Hathaway A (BRK.A) $191,749,000.00 1,573 2.47%
Berkshire Hathaway B (BRK.B) $78,474,000.00 967,019 1.01%
CIT Group Inc. (CIT) $763,869,000.00 18,522,529 9.84%
Leucadia Natl Corp. (LUK) $474,524,000.00 18,180,980 6.11%
MBIA Inc. (MBI) $453,303,000.00 46,255,370 5.84%
Sears Holdings Corp. (SHLD) $1,113,893,000.00 16,813,480 14.34%
St. Joe Companies (JOE) $474,185,000.00 25,715,428 6.11%
Misc (<1% of portfolio each) $150,397,000.00 NA 1.94%
Total $7,765,660,000.00
c03.indd 29c03.indd 29 27-05-2013 12:05:3727-05-2013 12:05:37
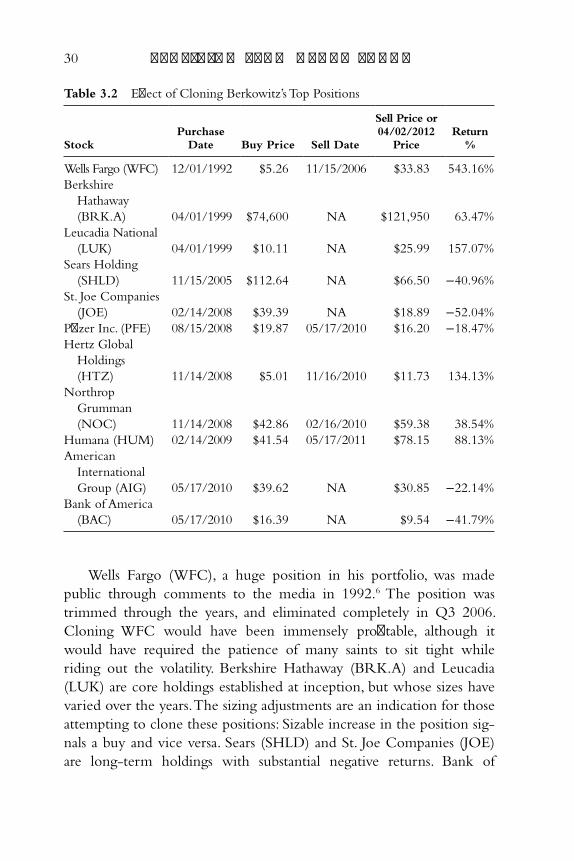
30 p r o f i t i n g f r o m h e d g e f u n d s
Wells Fargo (WFC), a huge position in his portfolio, was made
public through comments to the media in 1992. 6 The position was
trimmed through the years, and eliminated completely in Q3 2006.
Cloning WFC would have been immensely profi table, although it
would have required the patience of many saints to sit tight while
riding out the volatility. Berkshire Hathaway (BRK.A) and Leucadia
(LUK) are core holdings established at inception, but whose sizes have
varied over the years. The sizing adjustments are an indication for those
attempting to clone these positions: Sizable increase in the position sig-
nals a buy and vice versa. Sears (SHLD) and St. Joe Companies (JOE)
are long-term holdings with substantial negative returns. Bank of
Table 3.2 Eff ect of Cloning Berkowitz’s Top Positions
Stock Purchase
Date Buy Price Sell Date
Sell Price or 04/02/2012
Price Return
%
Wells Fargo (WFC) 12/01/1992 $5.26 11/15/2006 $33.83 543.16%
Berkshire
Hathaway
(BRK.A) 04/01/1999 $74,600 NA $121,950 63.47%
Leucadia National
(LUK) 04/01/1999 $10.11 NA $25.99 157.07%
Sears Holding
(SHLD) 11/15/2005 $112.64 NA $66.50 −40.96%
St. Joe Companies
(JOE) 02/14/2008 $39.39 NA $18.89 −52.04%
Pfi zer Inc. (PFE) 08/15/2008 $19.87 05/17/2010 $16.20 −18.47%
Hertz Global
Holdings
(HTZ) 11/14/2008 $5.01 11/16/2010 $11.73 134.13%
Northrop
Grumman
(NOC) 11/14/2008 $42.86 02/16/2010 $59.38 38.54%
Humana (HUM) 02/14/2009 $41.54 05/17/2011 $78.15 88.13%
American
International
Group (AIG) 05/17/2010 $39.62 NA $30.85 −22.14%
Bank of America
(BAC) 05/17/2010 $16.39 NA $9.54 −41.79%
c03.indd 30c03.indd 30 27-05-2013 12:05:3727-05-2013 12:05:37
Bruce Berkowitz 31
America (BAC) and American International Group (AIG), the recently
established fi nancial positions in the table, are also in the negative turf.
This is not a huge surprise for, as a value investor, Berkowitz is often
an early bird; the volatility should not have an impact in the long-
term, if the investment thesis on them unfolds as anticipated. When
attempting to follow Berkowitz ’s trades, it is critical to realize that
price fl uctuations are part of the game. Pfi zer Inc. (PFE) is a position
that shows a small negative return using the cloning model, although
Berkowitz himself probably realized a modest profi t. This is a risk with
most cloning strategies as it is impossible to follow the money man-
agers in real time. But, then again, that risk is fairly minor, especially
with value investors, as they tend to maintain positions for long peri-
ods of time. Per Table 3.2 , Hertz (HTZ), Northrop Grumman (NOC),
and Humana (HUM) show handsome returns. Berkowitz also realized
similar positive returns on them. Overall, Berkowitz ’s portfolio is very
conducive to cloning and the evidence from the table suggests such
strategies are worth mulling over.
Notes
1. Nadine Youssef, “Morningstar Names Bruce Berkowitz, David Herro, and
Bill Gross Fund Managers of the Decade,” PR Newswire , January 12, 2010.
2. Fred Fraenkal, “An Interview with Bruce Berkowitz,” Fairholme Funds Inc.,
February 8, 2012.
3. Scott Cendrowski, “Bruce Berkowitz: The Megamind of Miami,” Fortune ,
December 10, 2010.
4. Margaret Cannella and Bruce Berkowitz, “Columbia Business School Value
Investing Conference Panel,” The Heilbrunn Center, February 10, 2012.
5. “Portfolio Manager ’s Report 2011,” Fairholme Capital Management, LLC,
December 31, 2011.
6. Bruce Berkowitz, “Interview with Outstanding Investor Digest,” Outstanding
Investor Digest VII, no. 9 and 10, November 25, 1992.
c03.indd 31c03.indd 31 27-05-2013 12:05:3727-05-2013 12:05:37

c03.indd 32c03.indd 32 27-05-2013 12:05:3727-05-2013 12:05:37
33
Chapter 4
Warren Buff ett
Warren Buff ett is chairman and CEO of the holding com-
pany Berkshire Hathaway Inc. based in Omaha, Nebraska.
He oversees a number of the conglomerate ’s subsidiaries.
Renowned as the most successful investor of the twentieth century,
Buff ett is among the wealthiest individuals in the world.
Buff ett, born in 1930, is the son of U.S. Congressman Howard
Buff ett. He was fascinated with making money from a very early age,
buying his fi rst stock at the age of 11. His investment philosophy was
profoundly impacted by Benjamin Graham ’s classic, The Intelligent
Investor. Buff ett has declared that book, which he read while in col-
lege, as by far the best book on investing ever written. Buff ett received
his master ’s in economics from Columbia in 1951 under the tutelage
of Benjamin Graham and David Dodd. His investment career also took
off under Graham, when he worked as a securities analyst at Graham-
Newman Corpo ration from 1954 to 1956. The Buff ett partnership was
started in 1957 and the rest, as the world will attest, is history.
Invest within your circle of competence. It ’s not how big the
circle is that counts; it ’s how well you defi ne the parameters.
—Warren Buff ett
c04.indd 33c04.indd 33 27-05-2013 12:19:4427-05-2013 12:19:44
34 p r o f i t i n g f r o m h e d g e f u n d s
The book value of Berkshire had a compounded annual gain
of 19.8 percent between 1965 and 2011 for an overall gain in BV of
513,055 percent. This is against the compounded annual gain of 9.2
percent and overall gain of 6,397 percent of the S&P 500 index for the
same period. 1 The 10.6 percent annual outperformance over a period
of 47 years is truly one of epic proportions that outruns the rest of the
investment community by a huge margin. To provide some perspective,
on a $10,000 investment, that level of outperformance over that long
a time, would have resulted in a terminal value of around $48.69 mil-
lion compared to just around $626,000 with the S&P 500 index. Part
of the BV progress came from the growth in the subsidiaries while the
rest comes from investment returns. Buff ett uses the fl oat of Berkshire
Hathaway ’s insurance operations as the primary fund for his investment
operations.
Philosophy and Style
Warren Buff ett offi cially rejected the effi cient market theory as early
as 1984, after profi ling the investing performance records of nine per-
sons (including himself) who signifi cantly beat the market over long
periods of time. 2 The common thread was that they were all taught
by Benjamin Graham and David Dodd how to exploit gaps between
price and value. The value investing philosophy focuses on the idea that
risk becomes proportionally smaller as the purchase price of a business
drops below intrinsic value.
Buff ett considers his investment style as being 85 percent Benjamin
Graham and 15 percent Philip Fisher. Benjamin Graham is regarded
as the father of value investing, while Philip Fisher is a pioneer in
growth investing. Graham ’s core investing philosophy revolves around
business valuations often being wrong. Patient investors buy busi-
nesses when prices fall well below their intrinsic value and vice versa.
Graham introduced the related concept, margin of safety, which stands
for the diff erence between the purchase price and intrinsic value of
an investment. Obviously, the higher that number, the more attrac-
tive the investment. While Buff ett subscribed to these core ideas
c04.indd 34c04.indd 34 27-05-2013 12:19:4427-05-2013 12:19:44
Warren Buff ett 35
wholeheartedly, he recognized their shortcomings, too: The approach
would overlook high quality businesses at higher valuations. Fisher ’s
investment approach fi lled this void. It seeks out businesses able to
increase earnings consistently over the long term. Once an opportunity
is identifi ed, the plan is to hold it for the very long term. Knowing that
substantial eff ort is required to fi nd such companies, Fisher advocated
maintaining a concentrated portfolio of only a few stocks. To discover
such gems, he preferred the scuttlebutt mode: searching information
about a company through networking.
For Buff ett, fi nding investments with a margin of safety is critical.
Equally important is their ability to grow earnings consistently. Buff ett
runs a concentrated portfolio and expects to hold investments for the
very long term, ideally forever. A double-barreled tactic to investing is
also employed, viz, buying outright businesses with excellent economic
characteristics that are run by outstanding managers and buying parts
of businesses from the open market when it can be done at a pro-rata
price well below what it would take to buy the entire business. Buff ett
also scouts for short-term arbitrage opportunities with excellent annu-
alized returns.
Marquee Trades
Berkshire Hathaway bought several businesses outright, the majority of
which have performed admirably over the years. See ’s Candies, purchased
for ~$25 million in 1972, when earnings were in the $2 million range,
is such an investment. Berkshire ’s 2011 annual report indicates See ’s had
pretax earnings of $83 million; the total of such earnings since See ’s was
acquired amounts to a massive $1.65 billion. The success and the rea-
soning of that investment are storied: See ’s has very low ongoing capex
needs and has a virtual monopoly because customers overwhelmingly
prefer their product compared to the competition. Businesses with these
two characteristics are unaff ected by infl ation as they can raise prices
without aff ecting volume. 3 Other outright purchases, from the 1980s on,
include Nebraska Furniture Mart and Borsheim ’s Fine Jewelry (in the
1980s), Geico Corporation (1995), General Re Corp (1998), Burlington
c04.indd 35c04.indd 35 27-05-2013 12:19:4427-05-2013 12:19:44
36 p r o f i t i n g f r o m h e d g e f u n d s
Northern Santa Fe Corp (2009), and Lubrizol Corporation (2011).
Geico was a minority holding in the portfolio beginning in the 1970s,
and was bought fully in 1995. The performance of these and other such
purchases over the years is refl ected in the stunning book-value growth
of Berkshire Hathaway Inc.
Buff ett ’s long-term minority holdings in American Express (since
1964), Coca-Cola (since 1988), Gillette/Procter & Gamble (Gillette
since 1989), and the Washington Post (since 1973) have all appreciated
multiple times as of 2011. Combined they showed a total unrealized
gain of ~$24 billion. While these investments showcase the power of
patience when holding fundamentally sound businesses, there have
also been investments that returned handsomely over shorter periods
of time: Capital Cities (1979–96) returned over $2.2 billion when The
Walt Disney Company acquired them, PetroChina (2003–08) added
$3.6 billion (880 percent), and Freddie Mac brought in $2.5 billion
(850 percent). To recap, perpetual holdings as well as shorter-term posi-
tions have contributed very signifi cantly to Buff ett ’s portfolio.
Although Buff ett has struck gold repeatedly over the years in
arbitrage opportunities, they have not attracted much publicity. Such
prospects usually involve profi ting from the diff erence in value between
the market price and the announced buyout/liquidation price of a busi-
ness. A variation on the same theme is to off er capital at advantageous
terms to businesses with sound economic characteristics but never-
theless in dire need of capital. This window opens when the business
is experiencing a rough patch, or the macro environment is such that
even better companies have a hard time raising capital. Buff ett ’s initial
purchase of Gillette (1988) fell into this category: Gillette was losing
market share in razors and barely managed to emerge unscathed from a
hostile takeover attempt. By purchasing $600 million of preferred stock
from the company, Buff ett earned a seat on the board and an annual-
ized dividend of 8.75 percent. With this transaction, he owned around
11 percent of the company as well. During the fi nancial crisis, Buff ett
invested in several similar openings with capital injections of multiple
billions each into Goldman Sachs, General Electric, Swiss RE, Dow
Chemical, and Mars/Wrigley. In return, Berkshire Hathaway pocketed
preferred shares or warrants that ensured an income stream while par-
ticipating in the equity upside.
c04.indd 36c04.indd 36 27-05-2013 12:19:4427-05-2013 12:19:44
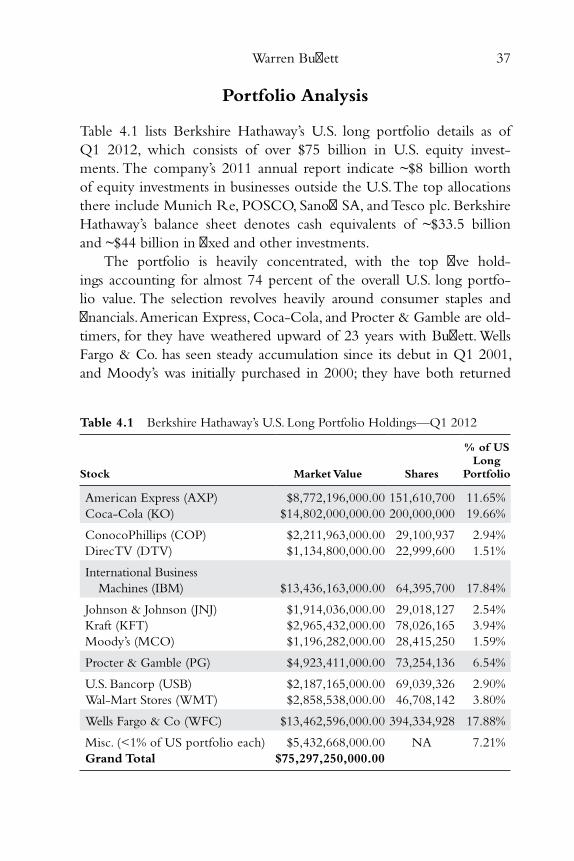
Warren Buff ett 37
Portfolio Analysis
Table 4.1 lists Berkshire Hathaway ’s U.S. long portfolio details as of
Q1 2012, which consists of over $75 billion in U.S. equity invest-
ments. The company ’s 2011 annual report indicate ~$8 billion worth
of equity investments in businesses outside the U.S. The top allocations
there include Munich Re, POSCO, Sanofi SA, and Tesco plc. Berkshire
Hathaway ’s balance sheet denotes cash equivalents of ~$33.5 billion
and ~$44 billion in fi xed and other investments.
The portfolio is heavily concentrated, with the top fi ve hold-
ings accounting for almost 74 percent of the overall U.S. long portfo-
lio value. The selection revolves heavily around consumer staples and
fi nancials. American Express, Coca-Cola, and Procter & Gamble are old-
timers, for they have weathered upward of 23 years with Buff ett. Wells
Fargo & Co. has seen steady accumulation since its debut in Q1 2001,
and Moody ’s was initially purchased in 2000; they have both returned
Table 4.1 Berkshire Hathaway’s U.S. Long Portfolio Holdings—Q1 2012
Stock Market Value Shares
% of US Long
Portfolio
American Express (AXP) $8,772,196,000.00 151,610,700 11.65%
Coca-Cola (KO) $14,802,000,000.00 200,000,000 19.66%
ConocoPhillips (COP) $2,211,963,000.00 29,100,937 2.94%
DirecTV (DTV) $1,134,800,000.00 22,999,600 1.51%
International Business
Machines (IBM) $13,436,163,000.00 64,395,700 17.84%
Johnson & Johnson (JNJ) $1,914,036,000.00 29,018,127 2.54%
Kraft (KFT) $2,965,432,000.00 78,026,165 3.94%
Moody ’s (MCO) $1,196,282,000.00 28,415,250 1.59%
Procter & Gamble (PG) $4,923,411,000.00 73,254,136 6.54%
U.S. Bancorp (USB) $2,187,165,000.00 69,039,326 2.90%
Wal-Mart Stores (WMT) $2,858,538,000.00 46,708,142 3.80%
Wells Fargo & Co (WFC) $13,462,596,000.00 394,334,928 17.88%
Misc. (<1% of US portfolio each) $5,432,668,000.00 NA 7.21%
Grand Total $75,297,250,000.00
c04.indd 37c04.indd 37 27-05-2013 12:19:4427-05-2013 12:19:44
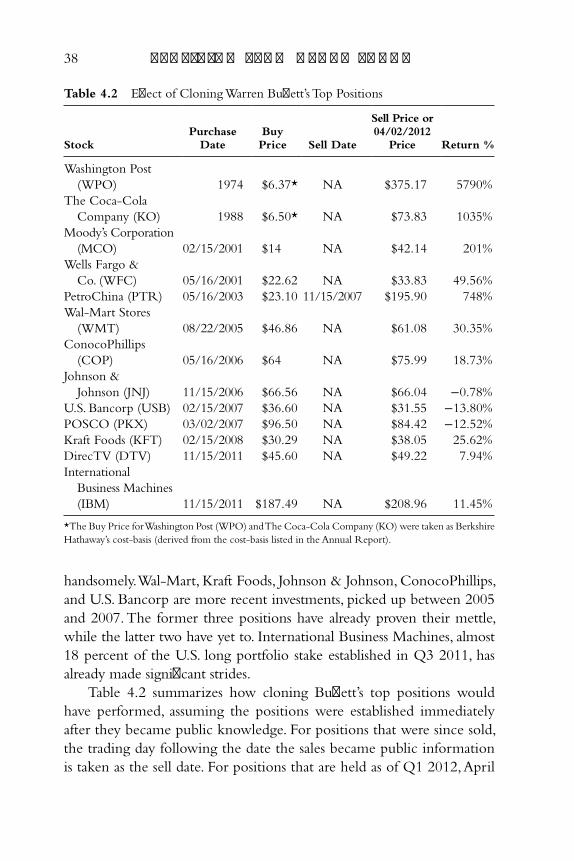
38 p r o f i t i n g f r o m h e d g e f u n d s
handsomely. Wal-Mart, Kraft Foods, Johnson & Johnson, ConocoPhillips,
and U.S. Bancorp are more recent investments, picked up between 2005
and 2007. The former three positions have already proven their mettle,
while the latter two have yet to. International Business Machines, almost
18 percent of the U.S. long portfolio stake established in Q3 2011, has
already made signifi cant strides.
Table 4.2 summarizes how cloning Buff ett ’s top positions would
have performed, assuming the positions were established immediately
after they became public knowledge. For positions that were since sold,
the trading day following the date the sales became public information
is taken as the sell date. For positions that are held as of Q1 2012, April
Table 4.2 Eff ect of Cloning Warren Buff ett’s Top Positions
Stock Purchase
Date Buy Price Sell Date
Sell Price or 04/02/2012
Price Return %
Washington Post
(WPO) 1974 $6.37* NA $375.17 5790%
The Coca-Cola
Company (KO) 1988 $6.50* NA $73.83 1035%
Moody ’s Corporation
(MCO) 02/15/2001 $14 NA $42.14 201%
Wells Fargo &
Co. (WFC) 05/16/2001 $22.62 NA $33.83 49.56%
PetroChina (PTR) 05/16/2003 $23.10 11/15/2007 $195.90 748%
Wal-Mart Stores
(WMT) 08/22/2005 $46.86 NA $61.08 30.35%
ConocoPhillips
(COP) 05/16/2006 $64 NA $75.99 18.73%
Johnson &
Johnson (JNJ) 11/15/2006 $66.56 NA $66.04 −0.78%
U.S. Bancorp (USB) 02/15/2007 $36.60 NA $31.55 −13.80%
POSCO (PKX) 03/02/2007 $96.50 NA $84.42 −12.52%
Kraft Foods (KFT) 02/15/2008 $30.29 NA $38.05 25.62%
DirecTV (DTV) 11/15/2011 $45.60 NA $49.22 7.94%
International
Business Machines
(IBM) 11/15/2011 $187.49 NA $208.96 11.45%
*The Buy Price for Washington Post (WPO) and The Coca-Cola Company (KO) were taken as Berkshire
Hathaway’s cost-basis (derived from the cost-basis listed in the Annual Report).
c04.indd 38c04.indd 38 27-05-2013 12:19:4427-05-2013 12:19:44
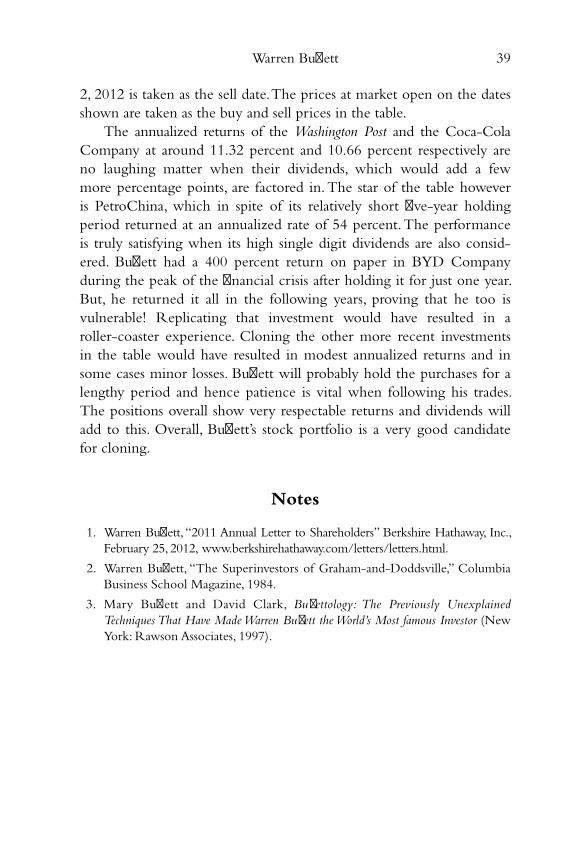
Warren Buff ett 39
2, 2012 is taken as the sell date. The prices at market open on the dates
shown are taken as the buy and sell prices in the table.
The annualized returns of the Washington Post and the Coca-Cola
Company at around 11.32 percent and 10.66 percent respectively are
no laughing matter when their dividends, which would add a few
more percentage points, are factored in. The star of the table however
is PetroChina, which in spite of its relatively short fi ve-year holding
period returned at an annualized rate of 54 percent. The performance
is truly satisfying when its high single digit dividends are also consid-
ered. Buff ett had a 400 percent return on paper in BYD Company
during the peak of the fi nancial crisis after holding it for just one year.
But, he returned it all in the following years, proving that he too is
vulnerable! Replicating that investment would have resulted in a
roller-coaster experience. Cloning the other more recent investments
in the table would have resulted in modest annualized returns and in
some cases minor losses. Buff ett will probably hold the purchases for a
lengthy period and hence patience is vital when following his trades.
The positions overall show very respectable returns and dividends will
add to this. Overall, Buff ett ’s stock portfolio is a very good candidate
for cloning.
Notes
1. Warren Buff ett, “2011 Annual Letter to Shareholders” Berkshire Hathaway, Inc.,
February 25, 2012, www.berkshirehathaway.com/letters/letters.html.
2. Warren Buff ett, “The Superinvestors of Graham-and-Doddsville,” Columbia
Business School Magazine, 1984.
3. Mary Buff ett and David Clark, Buff ettology: The Previously Unexplained
Techniques That Have Made Warren Buff ett the World’s Most famous Investor (New
York: Rawson Associates, 1997).
c04.indd 39c04.indd 39 27-05-2013 12:19:4527-05-2013 12:19:45

c04.indd 40c04.indd 40 27-05-2013 12:19:4527-05-2013 12:19:45
41
Chapter 5
Ian Cumming and Joseph S. Steinberg
Ian Cumming and Joseph Steinberg run Leucadia National Corporation,
a holding company with many subsidiaries, and large investments
in other companies. Subsidiaries include Hard Rock Hotel and
Casino in Biloxi, Mississippi, Idaho Timber, Conwed Plastics, and Crimson
Wine Group. The large investments are in Jeff eries Group, Inc., and
Mueller Industries, Inc.
Cumming and Steinberg, classmates at Harvard Business School
Class of 1970, formed Leucadia in 1980 with the takeover of Talcott
National. Diversifi cation attempts in the 1960s had left Talcott, a factor-
ing business founded in 1854, in fi nancial diffi culties. Leucadia sold
the factoring business and acquired American Investment Company, a
small loan and life insurance business soon after. The insurance operations
were expanded organically and via acquisitions throughout the 1980s. The
pattern continued in 1991 with the acquisition of Colonial Penn for $150
million. The insurance operations of Leucadia ’s businesses are often com-
pared to Warren Buff ett ’s Berkshire Hathaway, as both companies engage
Don ’t overpay, no matter what the madding crowd is up to. 1
—Ian M. Cumming and Joseph S. Steinberg
c05.indd 41c05.indd 41 27-05-2013 08:22:0627-05-2013 08:22:06
42 p r o f i t i n g f r o m h e d g e f u n d s
in using the fl oat in the insurance businesses to invest in a diversifi ed
range of businesses in other sectors.
The book value of Leucadia National grew at a compounded
annual growth rate (CAGR) of 18.5 percent from 1979 to 2011, com-
pared to the 8 percent growth of S&P 500 Index, including dividends. 2
That level of performance is exceptional, but becomes even more so
when the benefi ts of annual dividends and the special dividend of $4.53
per share paid out in 1999 are considered. The 1999 payout is interest-
ing as it off ers a glimpse into their minds: Asset prices increased in the
late 1990s to the point that Cumming and Steinberg were incapable
of fi nding suitable businesses to invest in. In their 1997 letter to share-
holders, they detailed the drastic step of liquidating and returning funds
to investors as a plausible option. They did not follow through on this.
Instead, a special dividend distribution of $812 million to shareholders
was made, proving their preference for returning cash to waiting around
looking for investments in a frothy market. The duo is scheduled to part
ways as Ian Cumming has indicated he doesn ’t plan to pursue renewal
of his contract after the current one expires in June 2015.
Philosophy and Style
Leucadia National ’s investing philosophy is concisely rendered by
a comment from the 2007 Letter to Shareholders: “Investing for the
long-term and fi xing troubled companies’ results in lumpy outcomes.”
The proprietors buy assets and businesses priced substantially below
what they believe will be their intrinsic values, once the issue causing
the undervaluation is resolved. The undervaluation could be due to the
sector being out of favor, or because the business has signifi cant opera-
tional problems. If it is the former, they wait for the market cycle to
change and the concerned industry rebounds. For businesses in trouble,
cash infusions are off ered in exchange for equity and, in the process,
earn a say in fi xing the underlying problems. Either way, once the fore-
seen value is recognized by the market, they leave with a good return
on their investment.
The fundamental theme of most of their twenty-fi rst century
investments is that they expect the underdeveloped world to raise its
c05.indd 42c05.indd 42 27-05-2013 08:22:0727-05-2013 08:22:07
Ian Cumming and Joseph S. Steinberg 43
standard of living in the coming years. Thus, Leucadia has made several
investments in the copper, iron ore, construction, and energy sectors,
believing those areas will improve in value as consumption increases in
other parts of the world.
Their inclination toward profi tability rather than volume or mar-
ket share sets their investment style apart from other value investors.
Their 1993 Letter to Shareholders had the following listed as a guid-
ing principle: “We search for niches, not dominance, on the theory that
the world can tolerate many mice but few elephants.” Thus, the greater
share of their investments is in small and micro-caps. Joint ventures are
another area of focus aimed at sharing expertise, risk, and returns.
Marquee Trades
The best investments in Leucadia ’s fi rst two decades were insurance
related. In 1986, they acquired Baldwin-United Corporation debt for
about $107 million during its reorganization. The name was changed
to Phl Corp, Inc. and Leucadia received 39 percent of common shares,
certain miscellaneous assets, and board nominations. The miscellaneous
assets netted cash distributions of $42 million by 1988. Following a
tender off er, they increased ownership to 63 percent. The prize por-
tion of the deal, however, was the conversion of surplus notes of
Empire Insurance Company into 70 percent of the outstanding com-
mon shares, following their conversion from a mutual company to a
stock company by January 1, 1988. It was a stroke of genius to recog-
nize the hidden value of that instrument in the balance sheet, carried
in the books at $25 million. Another irrefutably cool investment deal
was the purchase of Colonial Penn Insurance Group for $127.9 million
in cash (roughly one-third of GAAP net worth of $390.9 million) in
1991. The deal materialized as Florida Power & Light (FPL) wanted to
sell Colonial Penn, a money-losing subsidiary. The payout came to pass
in 1997—Leucadia waited until it became a money-spinning unit and
sold it for $1.4 billion—a tenfold return in fewer than six years.
A twenty-fi rst century blockbuster deal was a 2006 investment
of $400 million in Fortescue Metals Group for 264 million shares of
common and $100 million 13-year unsecured note that was to receive
c05.indd 43c05.indd 43 27-05-2013 08:22:0727-05-2013 08:22:07
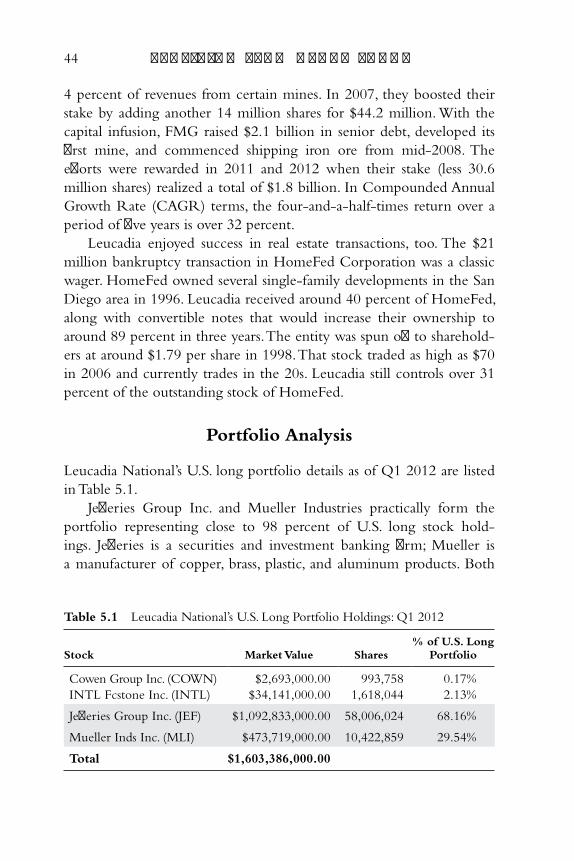
44 p r o f i t i n g f r o m h e d g e f u n d s
4 percent of revenues from certain mines. In 2007, they boosted their
stake by adding another 14 million shares for $44.2 million. With the
capital infusion, FMG raised $2.1 billion in senior debt, developed its
fi rst mine, and commenced shipping iron ore from mid-2008. The
eff orts were rewarded in 2011 and 2012 when their stake (less 30.6
million shares) realized a total of $1.8 billion. In Compounded Annual
Growth Rate (CAGR) terms, the four-and-a-half-times return over a
period of fi ve years is over 32 percent.
Leucadia enjoyed success in real estate transactions, too. The $21
million bankruptcy transaction in HomeFed Corporation was a classic
wager. HomeFed owned several single-family developments in the San
Diego area in 1996. Leucadia received around 40 percent of HomeFed,
along with convertible notes that would increase their ownership to
around 89 percent in three years. The entity was spun off to sharehold-
ers at around $1.79 per share in 1998. That stock traded as high as $70
in 2006 and currently trades in the 20s. Leucadia still controls over 31
percent of the outstanding stock of HomeFed.
Portfolio Analysis
Leucadia National ’s U.S. long portfolio details as of Q1 2012 are listed
in Table 5.1 .
Jeff eries Group Inc. and Mueller Industries practically form the
portfolio representing close to 98 percent of U.S. long stock hold-
ings. Jeff eries is a securities and investment banking fi rm; Mueller is
a manufacturer of copper, brass, plastic, and aluminum products. Both
Table 5.1 Leucadia National’s U.S. Long Portfolio Holdings: Q1 2012
Stock Market Value Shares % of U.S. Long
Portfolio
Cowen Group Inc. (COWN) $2,693,000.00 993,758 0.17%
INTL Fcstone Inc. (INTL) $34,141,000.00 1,618,044 2.13%
Jeff eries Group Inc. (JEF) $1,092,833,000.00 58,006,024 68.16%
Mueller Inds Inc. (MLI) $473,719,000.00 10,422,859 29.54%
Total $1,603,386,000.00
c05.indd 44c05.indd 44 27-05-2013 08:22:0727-05-2013 08:22:07
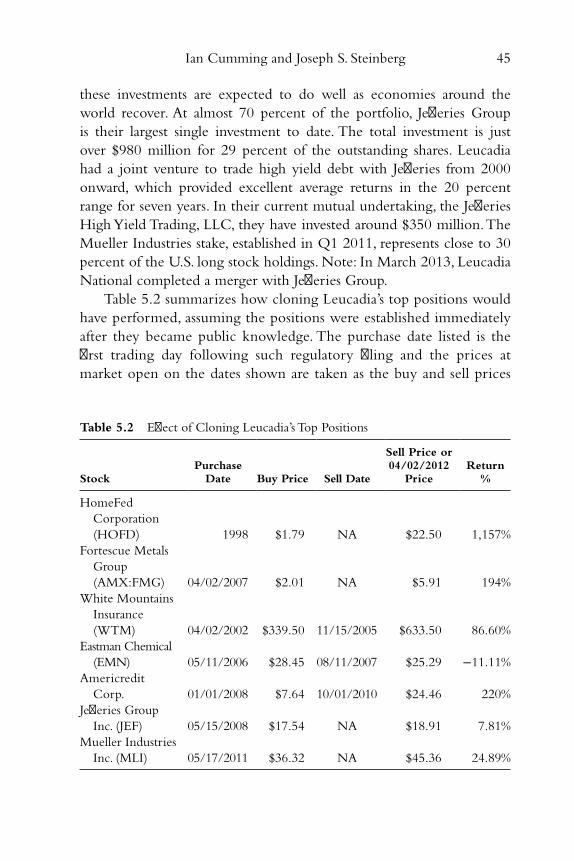
Ian Cumming and Joseph S. Steinberg 45
these investments are expected to do well as economies around the
world recover. At almost 70 percent of the portfolio, Jeff eries Group
is their largest single investment to date. The total investment is just
over $980 million for 29 percent of the outstanding shares. Leucadia
had a joint venture to trade high yield debt with Jeff eries from 2000
onward, which provided excellent average returns in the 20 percent
range for seven years. In their current mutual undertaking, the Jeff eries
High Yield Trading, LLC, they have invested around $350 million. The
Mueller Industries stake, established in Q1 2011, represents close to 30
percent of the U.S. long stock holdings. Note: In March 2013, Leucadia
National completed a merger with Jeff eries Group.
Table 5.2 summarizes how cloning Leucadia ’s top positions would
have performed, assuming the positions were established immediately
after they became public knowledge. The purchase date listed is the
fi rst trading day following such regulatory fi ling and the prices at
market open on the dates shown are taken as the buy and sell prices
Table 5.2 Eff ect of Cloning Leucadia’s Top Positions
Stock Purchase
Date Buy Price Sell Date
Sell Price or 04/02/2012
Price Return
%
HomeFed
Corporation
(HOFD) 1998 $1.79 NA $22.50 1,157%
Fortescue Metals
Group
(AMX:FMG) 04/02/2007 $2.01 NA $5.91 194%
White Mountains
Insurance
(WTM) 04/02/2002 $339.50 11/15/2005 $633.50 86.60%
Eastman Chemical
(EMN) 05/11/2006 $28.45 08/11/2007 $25.29 −11.11%
Americredit
Corp. 01/01/2008 $7.64 10/01/2010 $24.46 220%
Jeff eries Group
Inc. (JEF) 05/15/2008 $17.54 NA $18.91 7.81%
Mueller Industries
Inc. (MLI) 05/17/2011 $36.32 NA $45.36 24.89%
c05.indd 45c05.indd 45 27-05-2013 08:22:0727-05-2013 08:22:07
46 p r o f i t i n g f r o m h e d g e f u n d s
in the table. For positions since sold, the trading day following the
date the sales became public information is taken as the sell date. For
positions that are held as of Q1 2012, April 2, 2012 is taken as the
sell date.
Purchasing HomeFed Corporation following Leucadia ’s lead in the
wake of the spin-off in 1998 would have provided superior returns.
The almost twelve-times return over a period of fourteen years adds
up to an annualized yield of ~20 percent. Cloning the Fortescue,
Americredit, and White Mountains investments would have gener-
ated similarly good results, but over a shorter period: Fortescue indi-
cates annualized returns of over 24 percent over fi ve years, Americredit
~90 percent over twenty-two months, and White Mountains ~20 per-
cent over three-and-a-half years. Eastman Chemical disappointed with
a small negative return over a period of fi fteen months. Jeff eries and
Mueller show positive returns, but their investment thesis is yet to play
out. Since Leucadia runs a very concentrated portfolio of around fi ve
positions, replicating them is not rocket science. Given their philoso-
phy, their positions are very high-conviction bets, which provides some
solace when emulating their shots. At any given time, they usually have
investments in securities not publicly traded, and their subsidiaries
are not publicly traded either making it impossible to clone those
positions directly. A practical alternative is to monitor Leucadia ’s stock
and consider a position when they trade below book value.
Notes
1. Ian Cumming and Joseph Steinberg, “2006 Annual Letter from the Chairman
and President,” Leucadia National Corporation, April 17, 2007, www.leucadia
.com/c-p_letters/luk_c-p2006.pdf.
2. Ian Cumming and Joseph Steinberg, “2011 Annual Letter from the Chairman
and President,” Leucadia National Corporation, April 13, 2012, www.leucadia
.com/c-p_letters/luk_c-p2011.pdf.
c05.indd 46c05.indd 46 27-05-2013 08:22:0727-05-2013 08:22:07
47
Chapter 6
David Einhorn
David Einhorn is founder and president of hedge fund Greenlight
Capital, established in 1996. Einhorn, a 1991 graduate of Cornell
University with a B.A. in government, entered the workforce
as an analyst at Donaldson, Lufkin & Jenrette. Two years later, he tested
the waters in the hedge fund industry with a position at SC Fundamental
Value Fund. Peter Collery, one of its proprietors, was a diligent researcher,
and greatly infl uenced Einhorn ’s investment research outlook. Peter
scrutinized SEC fi lings to vet businesses he was considering investing in:
He analyzed corporate behavioral issues, inconsistencies in the business
description compared to the results, aggressive accounting practices, and
so on. The experience dovetailed nicely when he launched his own
fund a few years later; after all, the devil is in the details.
Einhorn shot into prominence with his shorting of Lehman
Brothers’ stock, and profi ting immensely from its eventual bank-
ruptcy. The stock was shorted initially in 2007, and the position
was announced during a speech at the Grant ’s Spring Investment
Conference in April 2008. 1 The presentation raised concerns about
The goal of the portfolio construction is to try to create alpha on
both sides of the portfolio.
—David Einhorn
c06.indd 47c06.indd 47 27-05-2013 11:46:0027-05-2013 11:46:00
48 p r o f i t i n g f r o m h e d g e f u n d s
Lehman ’s balance sheet not being materially diff erent from Bear
Stearns, a business the government bailed out in March 2008. It also
questioned Lehman ’s accounting practices, observing many more bil-
lions in write-downs that should have been taken than they did.
Although the popular press largely resented Einhorn ’s eff orts at the
time, he was vindicated when, a few months later, Lehman reported
a $2.8 billion quarterly loss on their way to declaring bankruptcy in
September 2008. 2
Einhorn is well-known for his staunch stance against fraudulent
businesses, and his active role in exposing such practices in the market-
place. 3 Warren Buff ett once noted that shorting stocks of companies run
by crooks is diffi cult, because they will fi ght dirty to save themselves.
That captures the essence of the peril in short selling for money manag-
ers. Einhorn witnessed this behavior fi rsthand in the six- year-long battle
with the management at Allied Capital. Einhorn kicked off this saga
in 2002 by recommending the shorting of Allied stock on the grounds
they defrauded Small Business Administration, among other things. 4
Allied countered, alleging Einhorn was engaged in market manipula-
tion, and the SEC announced its intention to investigate Einhorn. In
2007, after Allied and Einhorn had traded several barbs to make the
other appear culpable, the SEC ascertained that Allied violated secu-
rities laws through aggressive accounting practices. Einhorn ’s book,
Fooling Some of the People All of the Time, details his version of this
drama. Despite that experience, Einhorn is a determined advocate of
detecting and rooting out fraud. 5
Philosophy and Style
Greenlight Capital is a long-short value-oriented hedge fund focused
on absolute returns. Since its inception in 1996, the prized Greenlight
Capital, L.P. fund has returned ~20 percent annualized. The absolute
return strategy has worked incredibly well over the years, save for one
negative return year (2008). David Einhorn ’s value investing style exam-
ines the likely causes behind a business being mispriced, then scrutinizes
it to determine whether mispricing actually exists. Einhorn invests only
if the analytical edge is sizable and the mispricing is large. This deviates
c06.indd 48c06.indd 48 27-05-2013 11:46:0027-05-2013 11:46:00
David Einhorn 49
from the traditional value investing approach of fi rst identifying a list of
securities that are low-priced or expensive and analyzing whether the
anomaly is justifi ed. As a long-short fund, Einhorn looks for mispricing
on either side: Undervaluation translates to going long and vice versa.
The long-short style does not involve pairs trading: Each position, long
or short, has to have favorable risk–reward characteristics.
Einhorn ’s approach also gauges the macro picture and the business
cycle when considering an investment. However, he shies from placing
bets based singly on the macro picture analysis or on the business cycle.
The net exposure to the market is modifi ed based on macro study, and
the long-short ratio in specifi c sectors is adjusted according to the busi-
ness cycle analysis. Unlike many hedge fund managers, he shuns leverage,
does not use shorts as a hedge, and is not keen on timing the market.
On the average, Einhorn ’s portfolios sport upward of 30 positions,
both on the long and the short side, though the short positions are sized at
roughly half that of the long positions. A signifi cant bias is placed on the
long side, as markets tend to rise over time. He strongly supports concen-
trated bets with up to 20 percent of the capital in a single long position
and 30 percent to 60 percent of the capital in the top-fi ve long positions.
The approach draws heavily from Joel Greenblatt ’s ideas on running a
concentrated portfolio: Good ideas are hard to fi nd, and so, when one is
spotted, it is important to invest adequately for a good portfolio impact. 6
Marquee Trades
In the initial years since its founding, the fund enjoyed exceptional
success investing in special situations, such as demutualizations and spi-
noff s. In 1997, Greenlight established a position in Summit Holdings
Southeast, a demutualized Florida workers’ compensation specialist,
which more than doubled in June 1998, when Liberty Mutual agreed
to buy the company at $33 per share. The icing on the cake was that
investment was a huge 15 percent of the fund ’s assets; that single posi-
tion signifi cantly impacted the fund ’s performance that year. The short
positions also enjoyed success. Signifi cant contributions were real-
ized from shorting Boston Chicken, Samsonite, Sirrom Capital, and
Century Business Services.
c06.indd 49c06.indd 49 27-05-2013 11:46:0027-05-2013 11:46:00
50 p r o f i t i n g f r o m h e d g e f u n d s
Einhorn has a reputation of being extremely cautious and disci-
plined when shorting businesses. Shorting something solely on valuation
is not his style; the business has to have misunderstood fundamentals and
deteriorating prospects. His preferred shorts are mostly suspected frauds.
Century Business Services and Seitel were both businesses that Einhorn
shorted successfully, based on his perception that their accounting was
fraudulent. Century Business Services was shorted in 1998 when it was
trading at around ~$25. The SEC was informed of the problem. A year
later, the company restated their accounts and, by October 2000, the
stock had dropped below a dollar. With Seitel, Einhorn uncovered the
company was committing hari-kari, reporting earnings while burning
cash. The accounting problem came to light in 2002, when the com-
pany went under and the CEO was sentenced to fi ve years in prison. In
the last decade, Einhorn ’s research has revealed fraud at businesses such
as Chemdex, Orthodontic Centers of America, and Elan. Most of them
were successfully shorted and resulted in immense profi ts over the years.
While short-side success has garnered attention for Greenlight, its
long bets have also performed splendidly. The position in Agribrands (a
spinoff from Ralston Purina), established in 1998, gave Greenlight rea-
son to cheer when in two years the stock doubled following an acquisi-
tion off er from Cargill. Over 20 percent of Greenlight ’s total capital was
allocated to that one investment thereby ensuring good portfolio returns.
Lower conviction long-side bets that had a huge run, but limited portfo-
lio impact, include the 2008 investment in Patriot Coal with an internal
rate of return (IRR) of +2112%, and Jones Apparel Group, which qua-
drupled quickly in 2009. Lanxess, an investment Einhorn identifi ed as the
second most profi table position Greenlight had ever taken, was distinct as
it involved two round trips from 2005 to 2010. The stock was fi rst pur-
chased in 2005 at prices in the teens and sold in 2007 at prices in the 40s.
The same pattern of trades occurred again between 2008 and 2010. 7
Portfolio Analysis
Table 6.1 lists Greenlight Capital ’s U.S. long portfolio details as of Q1 2012.
Apple Inc., established in Q2 2010 at $248.09, is by far the largest
position in the partnership at over 15 percent of the U.S. long portfolio;
c06.indd 50c06.indd 50 27-05-2013 11:46:0027-05-2013 11:46:00
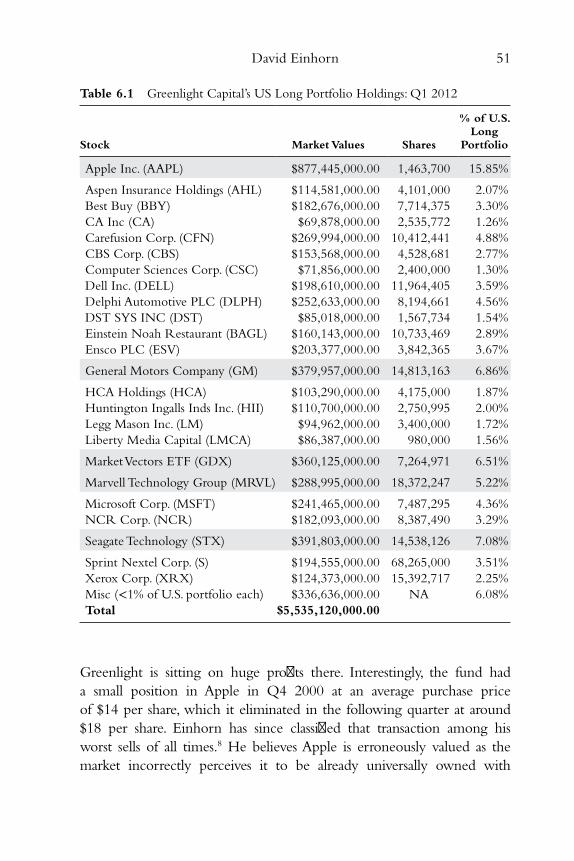
David Einhorn 51
Greenlight is sitting on huge profi ts there. Interestingly, the fund had
a small position in Apple in Q4 2000 at an average purchase price
of $14 per share, which it eliminated in the following quarter at around
$18 per share. Einhorn has since classifi ed that transaction among his
worst sells of all times. 8 He believes Apple is erroneously valued as the
market incorrectly perceives it to be already universally owned with
Table 6.1 Greenlight Capital’s US Long Portfolio Holdings: Q1 2012
Stock Market Values Shares
% of U.S. Long
Portfolio
Apple Inc. (AAPL) $877,445,000.00 1,463,700 15.85%
Aspen Insurance Holdings (AHL) $114,581,000.00 4,101,000 2.07%
Best Buy (BBY) $182,676,000.00 7,714,375 3.30%
CA Inc (CA) $69,878,000.00 2,535,772 1.26%
Carefusion Corp. (CFN) $269,994,000.00 10,412,441 4.88%
CBS Corp. (CBS) $153,568,000.00 4,528,681 2.77%
Computer Sciences Corp. (CSC) $71,856,000.00 2,400,000 1.30%
Dell Inc. (DELL) $198,610,000.00 11,964,405 3.59%
Delphi Automotive PLC (DLPH) $252,633,000.00 8,194,661 4.56%
DST SYS INC (DST) $85,018,000.00 1,567,734 1.54%
Einstein Noah Restaurant (BAGL) $160,143,000.00 10,733,469 2.89%
Ensco PLC (ESV) $203,377,000.00 3,842,365 3.67%
General Motors Company (GM) $379,957,000.00 14,813,163 6.86%
HCA Holdings (HCA) $103,290,000.00 4,175,000 1.87%
Huntington Ingalls Inds Inc. (HII) $110,700,000.00 2,750,995 2.00%
Legg Mason Inc. (LM) $94,962,000.00 3,400,000 1.72%
Liberty Media Capital (LMCA) $86,387,000.00 980,000 1.56%
Market Vectors ETF (GDX) $360,125,000.00 7,264,971 6.51%
Marvell Technology Group (MRVL) $288,995,000.00 18,372,247 5.22%
Microsoft Corp. (MSFT) $241,465,000.00 7,487,295 4.36%
NCR Corp. (NCR) $182,093,000.00 8,387,490 3.29%
Seagate Technology (STX) $391,803,000.00 14,538,126 7.08%
Sprint Nextel Corp. (S) $194,555,000.00 68,265,000 3.51%
Xerox Corp. (XRX) $124,373,000.00 15,392,717 2.25%
Misc (<1% of U.S. portfolio each) $336,636,000.00 NA 6.08%
Total $5,535,120,000.00
c06.indd 51c06.indd 51 27-05-2013 11:46:0027-05-2013 11:46:00
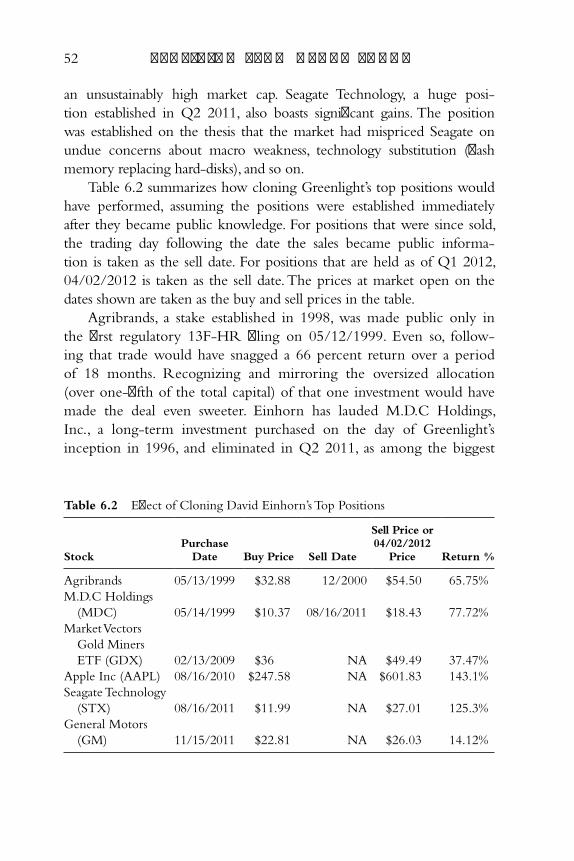
52 p r o f i t i n g f r o m h e d g e f u n d s
an unsustainably high market cap. Seagate Technology, a huge posi-
tion established in Q2 2011, also boasts signifi cant gains. The position
was established on the thesis that the market had mispriced Seagate on
undue concerns about macro weakness, technology substitution (fl ash
memory replacing hard-disks), and so on.
Table 6.2 summarizes how cloning Greenlight ’s top positions would
have performed, assuming the positions were established immediately
after they became public knowledge. For positions that were since sold,
the trading day following the date the sales became public informa-
tion is taken as the sell date. For positions that are held as of Q1 2012,
04/02/2012 is taken as the sell date. The prices at market open on the
dates shown are taken as the buy and sell prices in the table.
Agribrands, a stake established in 1998, was made public only in
the fi rst regulatory 13F-HR fi ling on 05/12/1999. Even so, follow-
ing that trade would have snagged a 66 percent return over a period
of 18 months. Recognizing and mirroring the oversized allocation
(over one-fi fth of the total capital) of that one investment would have
made the deal even sweeter. Einhorn has lauded M.D.C Holdings,
Inc., a long-term investment purchased on the day of Greenlight ’s
inception in 1996, and eliminated in Q2 2011, as among the biggest
Table 6.2 Eff ect of Cloning David Einhorn’s Top Positions
Stock Purchase
Date Buy Price Sell Date
Sell Price or 04/02/2012
Price Return %
Agribrands 05/13/1999 $32.88 12/2000 $54.50 65.75%
M.D.C Holdings
(MDC) 05/14/1999 $10.37 08/16/2011 $18.43 77.72%
Market Vectors
Gold Miners
ETF (GDX) 02/13/2009 $36 NA $49.49 37.47%
Apple Inc (AAPL) 08/16/2010 $247.58 NA $601.83 143.1%
Seagate Technology
(STX) 08/16/2011 $11.99 NA $27.01 125.3%
General Motors
(GM) 11/15/2011 $22.81 NA $26.03 14.12%
c06.indd 52c06.indd 52 27-05-2013 11:46:0027-05-2013 11:46:00
David Einhorn 53
contributors to the partnerships’ returns of all time. Its holding infor-
mation became public knowledge in 1999, and cloning that position
would have provided rewards, although nowhere near as lucrative as
those that Greenlight reaped. Greenlight trimmed its M.D.C. stake sig-
nifi cantly in the interim periods at much higher prices, accounting for
the discrepancy. The Market Vectors Gold Miners ETF position is part
of Einhorn ’s large allocation to investments related to gold. Mimicking
that position would have returned in the vicinity of 37 percent over
three years. Apple Inc. and Seagate Technology are the stars, showing
143 percent and 125 percent returns in fewer than 20 and eight
months, respectively. General Motors, on the other hand, showed mod-
est returns over a fi ve-month holding period. It is evident from the
table that following Einhorn ’s major long moves would be a very prof-
itable endeavor. Shadowing his long investments is easy and worth-
while, for he runs a concentrated portfolio and all positions are assured
a favorable risk-reward characteristic, per his investigation. Since he is
not given to the whims and fancies of the prevailing market, very short
holding periods are a rarity. Thus, the vast majority of his long posi-
tions appear in the quarterly 13F fi lings, albeit with a time delay.
Following his short investments is a diff erent ball game altogether.
The table does not indicate any such investments as that information is
beyond the scope of the 13F fi lings. The public becomes aware of them
only if Einhorn volunteers these facts. All is not lost there, for Einhorn
himself has revealed the specifi cs of such trades on several occasions.
Notes
1. David Einhorn, “Private Profi ts and Socialized Risk,” Grant ’s Spring
Investment Conference, April 8, 2008.
2. Louise Story, “Lehman Battles an Insurgent Investor,” New York Times , June 4,
2008.
3. David Einhorn, “Q3 2008 Letter to Partners,” Greenlight Capital, 10/01/2008.
4. David Einhorn, “Best Idea Speech,” Tomorrow ’s Children Fund conference,
May 15, 2002.
5. David Einhorn, Fooling Some of the People All of the Time: A Long Short Story
(Hoboken, NJ: John Wiley & Sons, 2008).
c06.indd 53c06.indd 53 27-05-2013 11:46:0027-05-2013 11:46:00

54 p r o f i t i n g f r o m h e d g e f u n d s
6. Joel Greenblatt, You Can Be a Stock Market Genius Even If You’re Not Too
Smart: Uncover the Secret Hiding Places of Stock Market Profi ts (New York:
Simon & Schuster, 1997).
7. David Einhorn, “Q4 2010 Letter to Partners,” Greenlight Capital, January
18, 2011.
8. Consuelo Mack and David Einhorn, “WealthTrack Interview,” November
19, 2010.
c06.indd 54c06.indd 54 27-05-2013 11:46:0027-05-2013 11:46:00
55
Chapter 7
Carl Icahn
CEOs are paid for doing a terrible job. If the system wasn ’t so
messed up, guys like me wouldn ’t make this kind of money.
—Carl Icahn
Carl Icahn is chairman of Icahn Enterprises, a diversifi ed public
holding company engaged in businesses such as real estate,
metals, and consumer goods. He is also chairman of American
Railcar Industries and Federal-Mogul Corporation. Born in Brooklyn in
1936, Icahn ’s investment career started in 1961, as a registered represen-
tative of Dreyfus & Company, where he learned options and convertible
arbitrage. He founded the brokerage fi rm Icahn & Co. Inc. in 1968, and
purchased a seat on the New York Stock Exchange.
Icahn started acquiring large stakes in public companies in the late
1970s. The initial businesses he dabbled in included Tappan, whose shares
were trading at a large discount to book value. 1 The proxy fi ght that
ensued ended when the business was bought by Electrolux for a valu-
ation that was more than double what Icahn paid. Icahn pioneered the
art of greenmailing : threatening the takeover of a business after purchasing
a large stake in it, which forces the business to buy the stake back at a
premium. It is akin to blackmailing, as Icahn is paid to walk away, but it
is perfectly legal. Prominent businesses that were successfully subjected to
c07.indd 55c07.indd 55 27-05-2013 08:17:4027-05-2013 08:17:40
56 p r o f i t i n g f r o m h e d g e f u n d s
this game plan include Marshall Field, American Can, Phillips Petroleum,
Uniroyal, and BFGoodrich. Although he made his name as a dreaded
corporate raider, Icahn did successfully increase shareholder value in sev-
eral companies (Texaco, Nabisco Group Holdings, etc.), realizing profi ts
for other shareholders as well. 2 Moreover, his forays included taking over
or acquiring majority stakes and running companies such as TWA (1984
to 1991) and American Railcar (1994 onward).
Imposition of a 50 percent tax on greenmail profi ts, along with
other changes, has rendered greenmailing obsolete. 3 Accordingly, Icahn
made a tactical shift: The current strategy pressures management and
boards to make operational changes to increase shareholder value. If the
company fails to abide by his demands, he launches a proxy battle for
board seats in an attempt to control the company. Depending on the
situation, the demands can include stock buybacks, changes in manage-
ment, spinning off businesses, and so on. Although greenmailing per se
is no longer employed, a variation exists as a bargaining chip; Icahn
off ers to back off from the proxy battle if one or more of his demands
are met.
Philosophy and Style
Carl Icahn ’s approach to investing has constantly evolved over the years
and currently emphasizes activism. At the core of his activism theory is
the belief that there is signifi cant business mismanagement in corporate
America. He has identifi ed a number of corporate governance issues
to target for activism: corporate boards failing to hold their business
executives accountable, egregious executive pay scales, excessive board
member compensation and perks, cumbersome provisions that are
in the way of shareholders having a say in corporate board elections,
and provisions that almost prevent the shareholders from uniting and
causing changes in the way businesses are run. His main ideas on this
theme are available through the website The Icahn Report™, 4 which
functions to unite shareholders against mismanaged businesses and pro-
mote better frameworks. 5
Icahn is convinced that the way in which promotions work in cor-
porate America is responsible for incompetence at the top of many
c07.indd 56c07.indd 56 27-05-2013 08:17:4027-05-2013 08:17:40
Carl Icahn 57
businesses. Political survivors ascend the corporate ladder easily. Those
who steer clear of controversy and are not a threat to the executives
higher up have better chances of being promoted. This results in many
businesses having peacemakers, who are not CEO material. Corporate
boards love having CEOs promoting camaraderie at the top because
they meet the primary interest of the board members, viz, enriching
themselves. Shareholders suff er as accountability simply does not exist.
This also contributes to American businesses losing their edge globally.
Because incompetent management and boards are key reasons for such
businesses to be undervalued, Icahn relentlessly targets them to bring
about changes.
Businesses with restructuring opportunities also beckon Icahn. It is
not that these businesses lack competent executives at the helm; rather,
it is their boards that thwart their eff orts in carrying out large scale
changes, such as splitting of businesses, supporting a merger, and so on.
Marquee Trades
In the late 1980s, Texaco was ordered to pay $10.53 billion dollars
to Pennzoil, as compensation for acquiring Getty Oil, as Pennzoil
already had a deal with Getty Oil. Such was the size of the payment
that Texaco mulled Chapter 11 bankruptcy proceedings to protect its
assets. Icahn smelled opportunity and, after building a 12 percent stake
quickly, approached the CEO of Texaco and demanded they work out
a quick settlement with Pennzoil. This well-oiled plan panned out well;
Texaco agreed to settle the dispute for $3 billion. The rebound in its
stock price allowed Icahn to walk away with a cool $600 million.
The Nabisco transaction that dragged on for six years from 1995
is a testimony to Icahn ’s tenacity. His main demand was to spin off the
cookie business from the tobacco business; he had four failed bids dur-
ing the period. At the end, when Nabisco stated its intention to sell
itself or sell the stake in the cookie business, Icahn off ered to buy the
cookie unit for $5.2 billion. The bid was outbid and the unit taken
away by Philip Morris at a substantial margin. Icahn laughed all the
way to bank; his profi t was over $600 million as his 10 percent stake in
the company increased in value as a result of the premium bid.
c07.indd 57c07.indd 57 27-05-2013 08:17:4027-05-2013 08:17:40
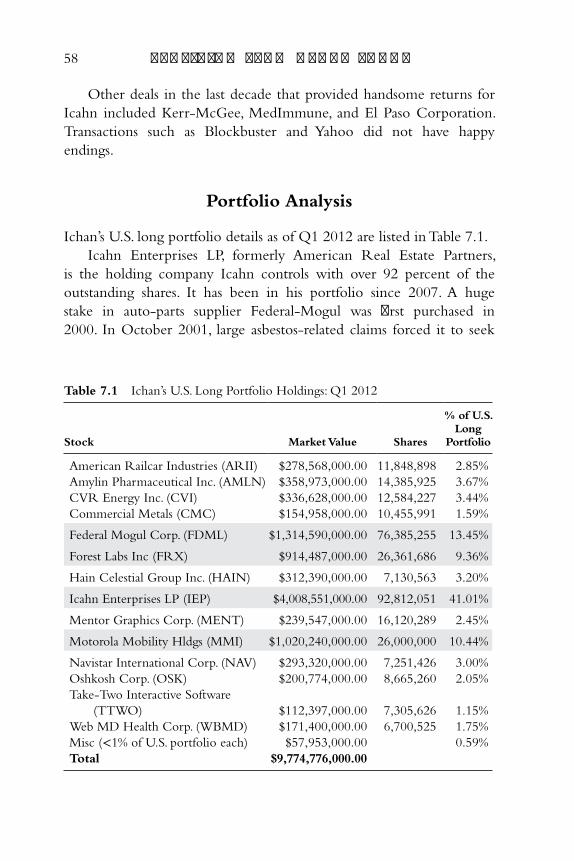
58 p r o f i t i n g f r o m h e d g e f u n d s
Other deals in the last decade that provided handsome returns for
Icahn included Kerr-McGee, MedImmune, and El Paso Corporation.
Transactions such as Blockbuster and Yahoo did not have happy
endings.
Portfolio Analysis
Ichan ’s U.S. long portfolio details as of Q1 2012 are listed in Table 7.1.
Icahn Enterprises LP, formerly American Real Estate Partners,
is the holding company Icahn controls with over 92 percent of the
outstanding shares. It has been in his portfolio since 2007. A huge
stake in auto-parts supplier Federal-Mogul was fi rst purchased in
2000. In October 2001, large asbestos-related claims forced it to seek
Table 7.1 Ichan’s U.S. Long Portfolio Holdings: Q1 2012
Stock Market Value Shares
% of U.S. Long
Portfolio
American Railcar Industries (ARII) $278,568,000.00 11,848,898 2.85%
Amylin Pharmaceutical Inc. (AMLN) $358,973,000.00 14,385,925 3.67%
CVR Energy Inc. (CVI) $336,628,000.00 12,584,227 3.44%
Commercial Metals (CMC) $154,958,000.00 10,455,991 1.59%
Federal Mogul Corp. (FDML) $1,314,590,000.00 76,385,255 13.45%
Forest Labs Inc (FRX) $914,487,000.00 26,361,686 9.36%
Hain Celestial Group Inc. (HAIN) $312,390,000.00 7,130,563 3.20%
Icahn Enterprises LP (IEP) $4,008,551,000.00 92,812,051 41.01%
Mentor Graphics Corp. (MENT) $239,547,000.00 16,120,289 2.45%
Motorola Mobility Hldgs (MMI) $1,020,240,000.00 26,000,000 10.44%
Navistar International Corp. (NAV) $293,320,000.00 7,251,426 3.00%
Oshkosh Corp. (OSK) $200,774,000.00 8,665,260 2.05%
Take-Two Interactive Software
(TTWO) $112,397,000.00 7,305,626 1.15%
Web MD Health Corp. (WBMD) $171,400,000.00 6,700,525 1.75%
Misc (<1% of U.S. portfolio each) $57,953,000.00 0.59%
Total $9,774,776,000.00
c07.indd 58c07.indd 58 27-05-2013 08:17:4027-05-2013 08:17:40
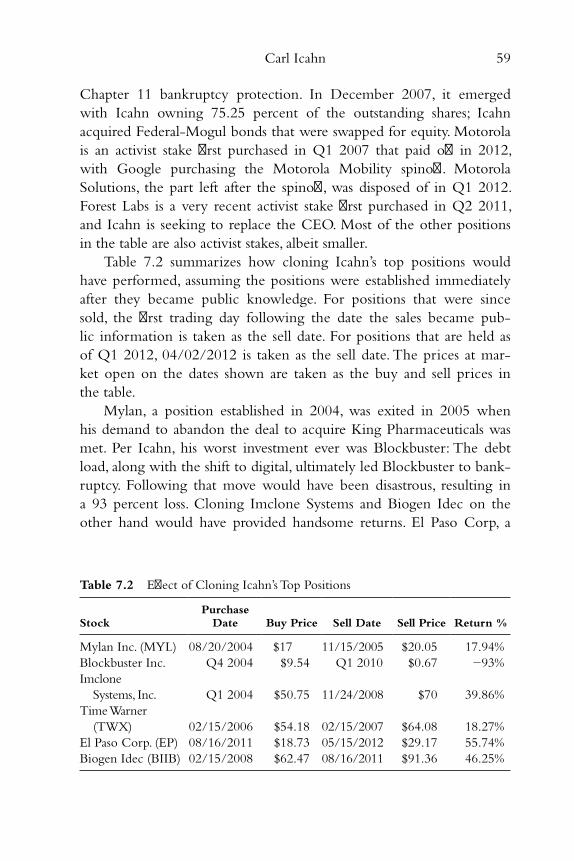
Carl Icahn 59
Chapter 11 bankruptcy protection. In December 2007, it emerged
with Icahn owning 75.25 percent of the outstanding shares; Icahn
acquired Federal-Mogul bonds that were swapped for equity. Motorola
is an activist stake fi rst purchased in Q1 2007 that paid off in 2012,
with Google purchasing the Motorola Mobility spinoff . Motorola
Solutions, the part left after the spinoff , was disposed of in Q1 2012.
Forest Labs is a very recent activist stake fi rst purchased in Q2 2011,
and Icahn is seeking to replace the CEO. Most of the other positions
in the table are also activist stakes, albeit smaller.
Table 7.2 summarizes how cloning Icahn ’s top positions would
have performed, assuming the positions were established immediately
after they became public knowledge. For positions that were since
sold, the fi rst trading day following the date the sales became pub-
lic information is taken as the sell date. For positions that are held as
of Q1 2012, 04/02/2012 is taken as the sell date. The prices at mar-
ket open on the dates shown are taken as the buy and sell prices in
the table.
Mylan, a position established in 2004, was exited in 2005 when
his demand to abandon the deal to acquire King Pharmaceuticals was
met. Per Icahn, his worst investment ever was Blockbuster: The debt
load, along with the shift to digital, ultimately led Blockbuster to bank-
ruptcy. Following that move would have been disastrous, resulting in
a 93 percent loss. Cloning Imclone Systems and Biogen Idec on the
other hand would have provided handsome returns. El Paso Corp, a
Table 7.2 Eff ect of Cloning Icahn’s Top Positions
Stock Purchase
Date Buy Price Sell Date Sell Price Return %
Mylan Inc. (MYL) 08/20/2004 $17 11/15/2005 $20.05 17.94%
Blockbuster Inc. Q4 2004 $9.54 Q1 2010 $0.67 −93%
Imclone
Systems, Inc. Q1 2004 $50.75 11/24/2008 $70 39.86%
Time Warner
(TWX) 02/15/2006 $54.18 02/15/2007 $64.08 18.27%
El Paso Corp. (EP) 08/16/2011 $18.73 05/15/2012 $29.17 55.74%
Biogen Idec (BIIB) 02/15/2008 $62.47 08/16/2011 $91.36 46.25%
c07.indd 59c07.indd 59 27-05-2013 08:17:4027-05-2013 08:17:40
60 p r o f i t i n g f r o m h e d g e f u n d s
position disclosed in the 13G fi ling on 08/15/2011, is defi nitely the
star returning over 55 percent in just nine months.
The risk in following Icahn ’s positions is that he is not consistently
successful in forcing companies to meet his demands. Numerous federal
and state laws make it hard for activism eff orts to succeed. 6
• Poison pill: Many states allow businesses to issue new stock to
rebuff a hostile takeover attempt.
• Staggered board: A number of states allow businesses to spread out
board elections over a period of time, thus blocking attempts to
replace board members en masse.
• Right of domicile: In several states, management has the sole right to
decide where a company is incorporated, making it impossible for
activists to eff ect a change of domicile, even through a majority vote.
Businesses also put in bylaw provisions and other actions detri-
mental to activist eff orts. Those include supermajority provisions that
require large majority approval for major transactions, advance notice
provisions that make it expensive to comply, and so on. Also, in many
businesses, the CEO and chairman of the board is the same individual,
resulting in a confl ict of interest: The CEO represents management,
while the chairman represents shareholders. Despite such problems, the
table reveals several stakes that provide great returns and, hence, follow-
ing him in a selective fashion may be quite worthwhile.
Notes
1. Ken Auletta, “The Raid: How Carl Icahn Came up Short,” The New Yorker ,
03/20/2006, www.newyorker.com/archive/2006/03/20/060320fa_fact4.
2. Diane Brady, “Icahn: The Once and Future Dealmaker,” Businessweek , June 11,
2000, www.businessweek.com/archives/2000/b3685250.arc.htm.
3. Electronic Code of Federal Regulations, “Title 26: Internal Revenue, Part
156—Excise Tax on Greenmail,” www.ecfr.gov/cgi-bin/retrieveECFR?gp=1&
SID=d39fb3e01a2b9f1cc82aeae3020ee210&ty=HTML&h=L&n=26y17.0.1.
1.13&r = PART.
4. Carl Icahn, “The Icahn Report™,” www.icahnreport.com.
c07.indd 60c07.indd 60 27-05-2013 08:17:4027-05-2013 08:17:40

Carl Icahn 61
5. Icahn, Carl. “The Icahn Plan: Join the United Shareholders of America.” Icahn
Report , October 7, 2008, www.icahnreport.com/report/2008/10/join-the-
united.html
6. Icahn, Carl. “100 Million Reasons Why We Need Governance Changes
Now: Join USA.” Icahn Report , October 27, 2008, www.icahnreport.com/
report/2008/10/100-million-rea.html
c07.indd 61c07.indd 61 27-05-2013 08:17:4027-05-2013 08:17:40

c07.indd 62c07.indd 62 27-05-2013 08:17:4027-05-2013 08:17:40
63
Chapter 8
Seth Klarman
The prevailing view has been that the market will earn a high
rate of return if the holding period is long enough, but entry
point is what really matters.
—Seth Klarman
Seth Klarman is founder and president of Baupost Group, LLC, a
hedge fund he founded in 1982. 1 Baupost is among the largest
hedge funds in the world, with almost $30 billion in assets under
management (AUM).
Klarman was born in New York City but grew up in Baltimore; he
had an obsession with numbers from childhood. From baseball statistics he
graduated to stock tables and, by age ten, had already made his fi rst stock
purchase in Johnson & Johnson. While at Cornell, he was introduced to
value investing via a summer internship at Mutual Shares, an investment
fi rm founded in 1949 by Max Heine. Mutual Shares operates on the
value-investing principles espoused by Benjamin Graham and, in 2010,
was ranked as the best performing mutual fund over the last fi fty years. 2
Klarman has since admitted that what he learned there was far superior
to what an academic setting could off er. Immediately upon graduation, he
had another eighteen-month stint at Mutual Shares.
c08.indd 63c08.indd 63 27-05-2013 11:47:1527-05-2013 11:47:15
64 p r o f i t i n g f r o m h e d g e f u n d s
Professor William Poorvu recognized Klarman ’s immense potential
during a course on real estate at Harvard Business School. Soon there-
after, Poorvu and his friends enlisted Klarman ’s help in investing their
money. Thus, Baupost was formed from initial capital of $27 million.
The fund earned annualized returns of ~19% since inception compared
to ~8% for the S&P 500 index for the same stretch of time. At over
$16 billion dollars, the fund is riding high in net gains after all fees
since inception.
Philosophy and Style
Klarman ’s investing philosophy is best covered in his 1991 book Margin
of Safety: Risk-Averse Value Investing Strategies for the Thoughtful Investor.
The fundamental idea is that a security is worth purchasing only if it is
trading at a discount to its underlying value. If securities are picked up
at a substantial discount, losses could be avoided or at least mitigated,
should the scenario that caused the low end of the valuation range play
out. In a nutshell, the discount makes for a cushion, or a margin of
safety. Security valuation is a complex process, returning a range of val-
ues under diff erent scenarios. Rather than compromising on a security
with little or no margin of safety, Klarman prefers to hold onto good
old cash.
Sensitivity analysis is used to determine the width of the margin
of safety under diff erent scenarios. Baupost Group acquired debt of
several fi rms, including Washington Mutual and Ford Motor Credit
Company, during the fi nancial crisis of 2008, based on the sensi-
tivity analysis that determined the value of the bonds in an eco-
nomic depression to be above what they were trading at the time of
purchase.
Klarman ’s viewpoint on market effi ciency and risk diff er starkly
from the academic defi nition. He believes ineffi ciently priced securi-
ties are aplenty at any given time, but that investors need an edge to
fi nd them: truly long-term capital; a fl exible approach that enables you
to move opportunistically across a broad array of markets, securities,
and asset classes; deep industry knowledge; strong sourcing relation-
ships; and a solid grounding in value investing principles. 3 He focuses
c08.indd 64c08.indd 64 27-05-2013 11:47:1527-05-2013 11:47:15
Seth Klarman 65
on risk before return. To him, risk does not imply volatility but rather
the probability of losing and by how much.
He uses an absolute return bottom-up style of investing. Scrutinizing
the economic and macro outlooks is also done: Worry top down but
invest bottom up. This approach is preferred over its reverse, as eco-
nomic and macro forecasting are diffi cult endeavors.
The fund shuns leverage, avoids short selling, and holds a signifi cant
amount of cash. These strategies avoid risk to a great extent, but fail
to contain tail risk. Tail risk is the risk of unlikely, but possible, cata-
strophic events: the specifi c tail risks the fi rm tries to insure against are
stock market corrections, surges in infl ation, and currency devaluation. 4
Strategies include buying put options on market indexes to compensate
for market correction, gold investments to counter currency devalua-
tion, and credit default swaps that climb if the chances of default of the
underlying instrument increase.
Marquee Trades
Baupost Group has trumped in insuring against disaster for quite some
time. Buying way-out-of-the-money puts against frothy market indices,
like the Nikkei, worked for them during the 1980s. The continuous
climb of the U.S. markets in the 1990s made Klarman wary and so he
kept his U.S. allocation very low. Out-of-the-money puts on the U.S.
market indexes were placed to cover the tail risk of a U.S. market crash.
The risk avoidance tactics against a persistently bubbly market made
Baupost underperform the S&P 500 index signifi cantly in the 1990s.
However, his unwavering patience bore fruit in the last decade as the
strategies propelled the fund to the top of the U.S. hedge-fund industry
following strong returns compared to S&P 500 index.
A variation on the insuring theme is his tactic of hedging against
U.S. dollar devaluation. Gold is undoubtedly the shiny favorite, and he
has had signifi cant exposure to this precious metal through owning
gold stocks since 2006. His bets on gold rising in value against the U.S.
dollar have certainly gilded his returns since then.
Seeking gains from mispriced distressed bonds is also a focus
area for Klarman. When Nations Rent, a building equipment rental
c08.indd 65c08.indd 65 27-05-2013 11:47:1527-05-2013 11:47:15
66 p r o f i t i n g f r o m h e d g e f u n d s
business, fi led for bankruptcy in 2001, Baupost invested $100 million
in the debt. During its reorganization in 2002, Klarman plunked down
another $50 million in exchange for stock. By the time the company
emerged from bankruptcy, Baupost controlled about two-thirds of
the business. This move repaid him when, in 2006, Sunbelt Rentals
acquired the company for $1 billion, and Klarman walked away with
mid-20 percent annualized returns.
During the fi nancial crisis, Klarman was extremely busy, invest-
ing as much as $100 million in a single day, mostly in distressed debt.
Bonds of CIT Group and Washington Mutual paid off immensely as
he succeeded in picking them up at a large discount to par and selling
them closer to par during 2010 and 2011. Occasionally, he unearthed
values in U.S. equity, with some trading at two-thirds of net working
capital, a level identifi ed by Graham as a compelling valuation. News
Corporation, a long-term holding of Baupost initially purchased in
2005, traded as low as $5 in 2008. Baupost more than tripled his posi-
tion during that time—his fundamental analysis on News Corp. determined
that the breakup value based on the depressed environment at the time
was $20 and in a more normal environment ranged between $20 and
$30. The gamble worked as the stock recovered quickly.
Portfolio Analysis
Table 8.1 lists Baupost Group ’s U.S. long portfolio details as of Q1 2012.
Viasat, the largest holding in his 13F portfolio, was purchased
in 2008, but most of the position was acquired during the mar-
ket lows of 2009, allowing Baupost large gains on the position. The
stakes in BP PLC, Hewlett Packard Company, and Microsoft were
established in 2011, when they were trading at multiyear lows. The
other major concentrations in the portfolio are in gold miners and
pharmaceuticals.
Table 8.2 summarizes how cloning Klarman ’s top positions would
have performed, assuming the positions were established immediately
after they became public knowledge. For positions that were since sold,
the trading day following the date the sales became public information
c08.indd 66c08.indd 66 27-05-2013 11:47:1527-05-2013 11:47:15
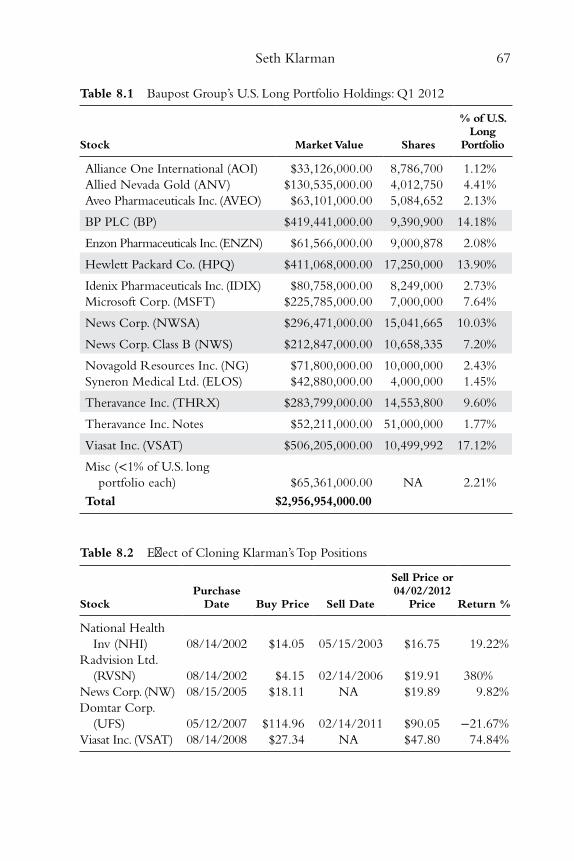
Seth Klarman 67
Table 8.1 Baupost Group’s U.S. Long Portfolio Holdings: Q1 2012
Stock Market Value Shares
% of U.S. Long
Portfolio
Alliance One International (AOI) $33,126,000.00 8,786,700 1.12%
Allied Nevada Gold (ANV) $130,535,000.00 4,012,750 4.41%
Aveo Pharmaceuticals Inc. (AVEO) $63,101,000.00 5,084,652 2.13%
BP PLC (BP) $419,441,000.00 9,390,900 14.18%
Enzon Pharmaceuticals Inc. (ENZN) $61,566,000.00 9,000,878 2.08%
Hewlett Packard Co. (HPQ) $411,068,000.00 17,250,000 13.90%
Idenix Pharmaceuticals Inc. (IDIX) $80,758,000.00 8,249,000 2.73%
Microsoft Corp. (MSFT) $225,785,000.00 7,000,000 7.64%
News Corp. (NWSA) $296,471,000.00 15,041,665 10.03%
News Corp. Class B (NWS) $212,847,000.00 10,658,335 7.20%
Novagold Resources Inc. (NG) $71,800,000.00 10,000,000 2.43%
Syneron Medical Ltd. (ELOS) $42,880,000.00 4,000,000 1.45%
Theravance Inc. (THRX) $283,799,000.00 14,553,800 9.60%
Theravance Inc. Notes $52,211,000.00 51,000,000 1.77%
Viasat Inc. (VSAT) $506,205,000.00 10,499,992 17.12%
Misc (<1% of U.S. long
portfolio each) $65,361,000.00 NA 2.21%
Total $2,956,954,000.00
Table 8.2 Eff ect of Cloning Klarman’s Top Positions
Stock Purchase
Date Buy Price Sell Date
Sell Price or 04/02/2012
Price Return %
National Health
Inv (NHI) 08/14/2002 $14.05 05/15/2003 $16.75 19.22%
Radvision Ltd.
(RVSN) 08/14/2002 $4.15 02/14/2006 $19.91 380%
News Corp. (NW) 08/15/2005 $18.11 NA $19.89 9.82%
Domtar Corp.
(UFS) 05/12/2007 $114.96 02/14/2011 $90.05 −21.67%
Viasat Inc. (VSAT) 08/14/2008 $27.34 NA $47.80 74.84%
c08.indd 67c08.indd 67 27-05-2013 11:47:1527-05-2013 11:47:15
68 p r o f i t i n g f r o m h e d g e f u n d s
is taken as the sell date. For positions that are held as of Q1 2012, April
2, 2012 is taken as the sell date. The prices at market open on the dates
shown are taken as the buy and sell prices in the table.
The stocks in the table did reasonably well using the cloning strat-
egy, with Radvision showing a whopping 380 percent return over
3.5 years. The bulk of the News Corp position, fi rst established in
Q2 2005, was purchased in 2008 at the mid-single-digit price range.
Klarman has done very well with that wager, although the cloning
model shows only a modest return. Domtar Corporation disappointed,
down around 22 percent over a period of almost four years.
Klarman ’s 13F U.S. long portfolio is on the average only a small
portion (~10 percent) of his assets under management. His market
hedges, investments in liquidations, bankruptcies, other distressed instru-
ments, and foreign investments are diffi cult to follow; for competitive
reasons, he plays his cards close to the vest. He rarely gives interviews
or divulges any of his positions to the public voluntarily. Still, given his
philosophy of purchasing securities only if there is a margin of safety,
cloning based on the 13F and other regulatory fi lings is a reasonable
strategy.
Notes
1. “The 20 Biggest Global Hedge Funds,” The Hedge Funds Blog Man, 2012.
2. John Waggoner, “Fundline: Best Fund for Past 50 Years Turned $100 into
$49,000,” USA Today , 1/5/2010, www.usatoday.com/money/perfi /funds/
2010–01–04-mutual-funds-best_N.htm.
3. Seth Klarman, “Letter to Shareholders,” Baupost Group, 06/15/2010.
4. Seth Klarman and Jason Zweig, “Opportunities for Patient Investors,”
Interview at the CFA Institute 2010 annual conference on 05/16/2010,
Financial Analysts Journal , September/October 2010.
c08.indd 68c08.indd 68 27-05-2013 11:47:1527-05-2013 11:47:15
69
Chapter 9
John Paulson
The beauty of shorting a bond is that the maximum you can
lose is the spread over the benchmark; yet if the bond defaults,
you can potentially make more. 1
—John Paulson
John Paulson is founder and president of Paulson & Company, a
hedge fund based in New York City. Paulson grew up in Queens, in
New York City, and enrolled at New York University in 1973.
He became passionate about striking it rich after a visit with his
wealthy uncle in Ecuador. In his fi rst really profi table venture, he made
$25,000 in commissions by facilitating the export of garments from
Quito to department stores in the United States. After receiving a
fi nance degree in 1978, Paulson earned an MBA from Harvard Business
School in 1980 as a Baker Scholar. Following the most lucrative career
option, he took to consulting. Upon realizing the kind of cash that he
was seeking was beyond the reach of even partners in consulting, he
moved to Wall Street.
Paulson got a head start in risk arbitrage in the mid-1970s while
at New York University, via a seminar by Robert Rubin, who was
then a partner at Goldman Sachs. After a stint at private equity fi rm
c09.indd 69c09.indd 69 27-05-2013 10:36:3827-05-2013 10:36:38
70 p r o f i t i n g f r o m h e d g e f u n d s
Odyssey Partners LP, he gained experience in merger arbitrage while
climbing the corporate ladder at Bear Stearns. He founded Paulson
& Company in 1994 with a focus on merger arbitrage and gained a
reputation of investing with very low correlation to the market. The
fund, which was ~$2 million at inception, surpassed $500 million
by 2003. The focus of the fi rm shifted dramatically after 2004, when
Paulson began wagering against the real estate market. The exploits in
that sector are vividly narrated in the book The Greatest Trade Ever: The
Behind-the-Scenes Story of How John Paulson Defi ed Wall Street and Made
Financial History. 2 The fund earned around $15 billion in 2007 and fol-
lowed it up with another $5 billion in 2008, catapulting his fi rm to
near the top of the hedge fund world both in terms of total returns
since inception and by the size of the fi rm. In 2011, the fund ’s perfor-
mance had a reversal, with fl agship Advantage fund losing well over a
third of its value.
Philosophy and Style
John Paulson ’s investment philosophy revolves around the goal of cap-
ital preservation. In its fi rst decade, the fund consistently held diver-
sifi ed merger arbitrage positions, which produced respectable returns
with low volatility and low correlation to the equity markets. Deals
that break are a huge concern, as that would result in loss of capital; the
fi rm ’s research aims to eliminate relatively risky deals. They also weight
the portfolio to high-conviction bets and sometimes resort to shorting
the weaker deals. Spinoff s, recapitalizations, and restructurings are gen-
erally not messed with, as they have more market correlation. Though
the fund takes hundreds of positions every year, it is not unusual for an
individual position with low risk to be allocated up to 12 percent of
the portfolio.
As the assets grew, Paulson extended his focus into other areas,
off ering new products such as event funds, credit funds, recovery
funds, and gold funds. Purists do not consider style drift as a virtue,
for it is extremely hard to be an expert who can create signifi cant out-
performance from multiple areas. Despite this, with impeccable tim-
ing, Paulson pulled off a string of blow-out performances from 2007
c09.indd 70c09.indd 70 27-05-2013 10:36:3927-05-2013 10:36:39
John Paulson 71
to 2010. The winning positions included credit-default swaps on sub-
prime mortgage bonds, shorts of businesses with signifi cant subprime
exposure, distressed debt of businesses in bankruptcy, and holding gold
as a hedge against a falling dollar.
Paulson does not use much leverage in his fl agship funds, although
he did launch leveraged versions of some of his funds. He does not
really consider size as a major deterrent to performance, citing his
achievement while managing billions during the four years prior to
2010. That stance lost some credibility when the funds lost billions in
2011. The style drift, along with the size of the fund, did cause sig-
nifi cant net market exposure, which he plans to curtail with hedging
strategies.
Marquee Trades
By early 2005, Paulson was convinced that subprime mortgages were
headed for trouble. As his analysis pointed out the great risk-reward
potential of credit default swaps (CDS) in such an eventuality, CDS
contracts were used as early as April 2005. Shorting triple-B subprime
securities was another technique used to profi t from the same event. As
the securities were trading at just 1 percent over LIBOR, the downside
risk was 1 percent, while the upside was 100 percent. The positions
took fl ight in early 2007 but, with amazing foresight, Paulson held on
to the majority of them which, in the following months, more than
compensated him with massive returns.
During the credit crisis, Paulson was on the prowl for bargains
in distressed debt. The smartest move from among such bets was an
investment in Delphi Automotive debt, which was converted into
equity at around 67 cents a share. The move proved to be a big hit
when the fi rm emerged from bankruptcy in late 2011 and had an IPO
at a share price of $22.
His fund started building a large exposure to gold in early 2009
with the expectation that infl ation will surge and the U.S. dollar
will tumble. Although the calamity never came to pass, gold still
doubled, thereby accounting for a signifi cant portion of his returns
for 2010. 3
c09.indd 71c09.indd 71 27-05-2013 10:36:3927-05-2013 10:36:39
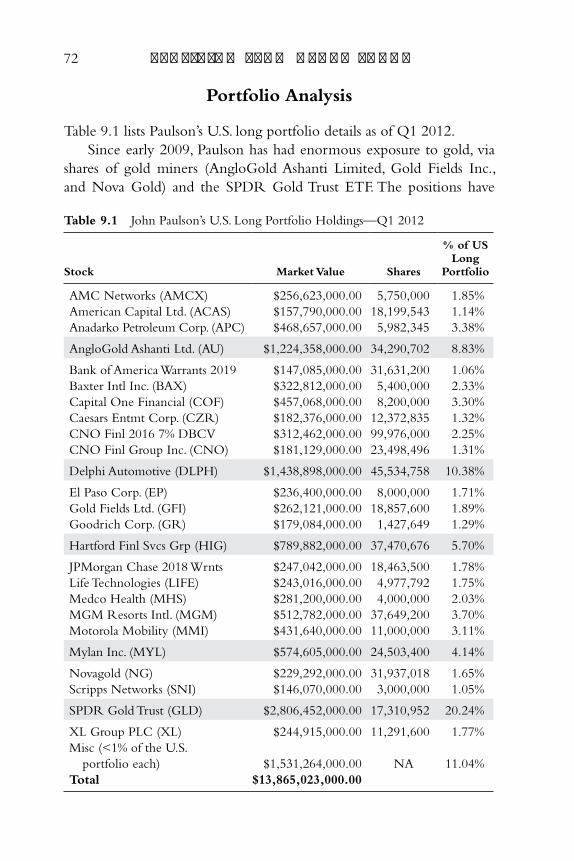
72 p r o f i t i n g f r o m h e d g e f u n d s
Portfolio Analysis
Table 9.1 lists Paulson ’s U.S. long portfolio details as of Q1 2012.
Since early 2009, Paulson has had enormous exposure to gold, via
shares of gold miners (AngloGold Ashanti Limited, Gold Fields Inc.,
and Nova Gold) and the SPDR Gold Trust ETF. The positions have
Table 9.1 John Paulson’s U.S. Long Portfolio Holdings—Q1 2012
Stock Market Value Shares
% of US Long
Portfolio
AMC Networks (AMCX) $256,623,000.00 5,750,000 1.85%
American Capital Ltd. (ACAS) $157,790,000.00 18,199,543 1.14%
Anadarko Petroleum Corp. (APC) $468,657,000.00 5,982,345 3.38%
AngloGold Ashanti Ltd. (AU) $1,224,358,000.00 34,290,702 8.83%
Bank of America Warrants 2019 $147,085,000.00 31,631,200 1.06%
Baxter Intl Inc. (BAX) $322,812,000.00 5,400,000 2.33%
Capital One Financial (COF) $457,068,000.00 8,200,000 3.30%
Caesars Entmt Corp. (CZR) $182,376,000.00 12,372,835 1.32%
CNO Finl 2016 7% DBCV $312,462,000.00 99,976,000 2.25%
CNO Finl Group Inc. (CNO) $181,129,000.00 23,498,496 1.31%
Delphi Automotive (DLPH) $1,438,898,000.00 45,534,758 10.38%
El Paso Corp. (EP) $236,400,000.00 8,000,000 1.71%
Gold Fields Ltd. (GFI) $262,121,000.00 18,857,600 1.89%
Goodrich Corp. (GR) $179,084,000.00 1,427,649 1.29%
Hartford Finl Svcs Grp (HIG) $789,882,000.00 37,470,676 5.70%
JPMorgan Chase 2018 Wrnts $247,042,000.00 18,463,500 1.78%
Life Technologies (LIFE) $243,016,000.00 4,977,792 1.75%
Medco Health (MHS) $281,200,000.00 4,000,000 2.03%
MGM Resorts Intl. (MGM) $512,782,000.00 37,649,200 3.70%
Motorola Mobility (MMI) $431,640,000.00 11,000,000 3.11%
Mylan Inc. (MYL) $574,605,000.00 24,503,400 4.14%
Novagold (NG) $229,292,000.00 31,937,018 1.65%
Scripps Networks (SNI) $146,070,000.00 3,000,000 1.05%
SPDR Gold Trust (GLD) $2,806,452,000.00 17,310,952 20.24%
XL Group PLC (XL) $244,915,000.00 11,291,600 1.77%
Misc (<1% of the U.S.
portfolio each) $1,531,264,000.00 NA 11.04%
Total $13,865,023,000.00
c09.indd 72c09.indd 72 27-05-2013 10:36:3927-05-2013 10:36:39
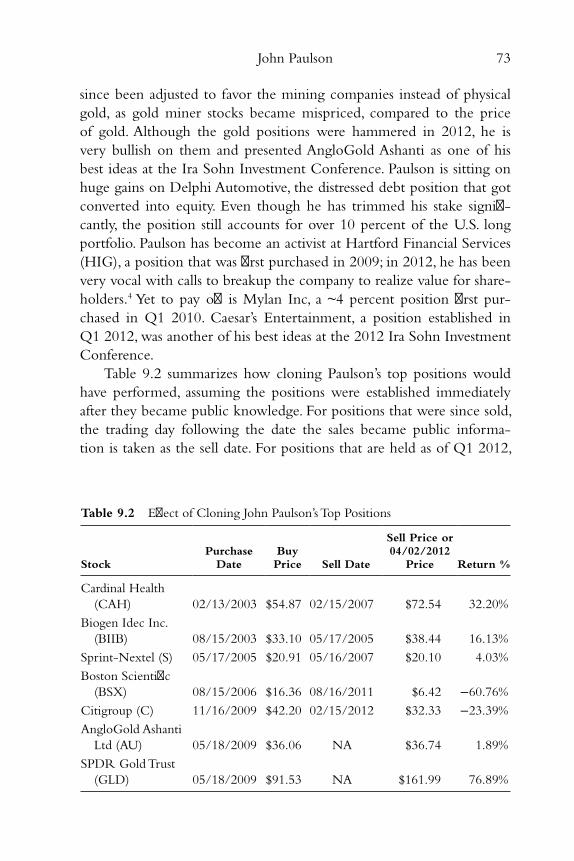
John Paulson 73
since been adjusted to favor the mining companies instead of physical
gold, as gold miner stocks became mispriced, compared to the price
of gold. Although the gold positions were hammered in 2012, he is
very bullish on them and presented AngloGold Ashanti as one of his
best ideas at the Ira Sohn Investment Conference. Paulson is sitting on
huge gains on Delphi Automotive, the distressed debt position that got
converted into equity. Even though he has trimmed his stake signifi -
cantly, the position still accounts for over 10 percent of the U.S. long
portfolio. Paulson has become an activist at Hartford Financial Services
(HIG), a position that was fi rst purchased in 2009; in 2012, he has been
very vocal with calls to breakup the company to realize value for share-
holders. 4 Yet to pay off is Mylan Inc, a ~4 percent position fi rst pur-
chased in Q1 2010. Caesar ’s Entertainment, a position established in
Q1 2012, was another of his best ideas at the 2012 Ira Sohn Investment
Conference.
Table 9.2 summarizes how cloning Paulson ’s top positions would
have performed, assuming the positions were established immediately
after they became public knowledge. For positions that were since sold,
the trading day following the date the sales became public informa-
tion is taken as the sell date. For positions that are held as of Q1 2012,
Table 9.2 Eff ect of Cloning John Paulson’s Top Positions
Stock Purchase
Date Buy Price Sell Date
Sell Price or 04/02/2012
Price Return %
Cardinal Health
(CAH) 02/13/2003 $54.87 02/15/2007 $72.54 32.20%
Biogen Idec Inc.
(BIIB) 08/15/2003 $33.10 05/17/2005 $38.44 16.13%
Sprint-Nextel (S) 05/17/2005 $20.91 05/16/2007 $20.10 4.03%
Boston Scientifi c
(BSX) 08/15/2006 $16.36 08/16/2011 $6.42 −60.76%
Citigroup (C) 11/16/2009 $42.20 02/15/2012 $32.33 −23.39%
AngloGold Ashanti
Ltd (AU) 05/18/2009 $36.06 NA $36.74 1.89%
SPDR Gold Trust
(GLD) 05/18/2009 $91.53 NA $161.99 76.89%
c09.indd 73c09.indd 73 27-05-2013 10:36:3927-05-2013 10:36:39
74 p r o f i t i n g f r o m h e d g e f u n d s
04/02/2012 is taken as the sell date. The prices at market open on the
dates shown are taken as the buy and sell prices in the table.
The returns achieved by cloning Paulson ’s positions are decid-
edly mixed. Following the stake establishment of SPDR Gold Trust
in Q1 2009 would have returned over 75 percent in less than three
years. The same success was not refl ected in AngloGold Ashanti as it
remained fl at during the three years, in spite of the substantial uptick
in the price of gold. The large stake establishments of Cardinal Health
and Biogen Idec in 2003 would have resulted in modest annualized
returns. Cloning the purchase of Boston Scientifi c in Q2 2006 would
have been disastrous—by Q2 2011 when he completely sold-off the
position, the price per share had fallen by over 60 percent. Paulson was
less burnt as he trimmed the holdings in the interim quarters when the
price was higher. He walked away from his large position in Citigroup
with hundreds of millions in profi ts but surprisingly the cloning model
shows negative returns: the time delay before the moves became public,
the short-term holding period, and the volatility of Citigroup shares all
adversely aff ected cloning. 5 In general, cloning money managers who
specialize in risk arbitrage opportunities is not that eff ective. Timing is
so critical that any delay can be fatal.
Many of Paulson ’s moves that raked in billions of dollars in prof-
its were by using securities outside the scope of the 13F regulatory
fi lings. The public became aware about the purchase of CDS contracts
and the shorting of mortgage insurers only when he voluntarily
disclosed the information in early 2007. Shadowing his moves into
similar securities immediately after such disclosure would have resulted
in handsome returns during the credit crisis.
Notes
1. Christine Williamson, “Excellent Timing: Face to Face with John Paulson,”
pionline.com , July 9, 2007.
2. Gregory Zuckerman, The Greatest Trade Ever: The Behind-the-Scenes Story of
How John Paulson Defi ed Wall Street and Made Financial History (New York:
Crown Business, 2010).
c09.indd 74c09.indd 74 27-05-2013 10:36:3927-05-2013 10:36:39

John Paulson 75
3. Sam Jones, “John Paulson ’s Real 2010 Success: Gold,” FT Alphaville ,
01/25/2011, http://ftalphaville.ft.com/2011/01/25/468871/john-paulsons-
real-2010-success-gold/ .
4. SEC Form SC 13D/A, “Hartford: Spin-Off of P&C Business Would Increase
Shareholder Value By 60%,” Paulson & Co. Inc., March 9, 2012, www.sec
.gov/Archives/edgar/data/874766/000119312512106076/d315758dsc13da
.htm .
5. “John Paulson Makes $1bn Betting on Citigroup Recovery,” The Telegraph ,
January 24, 2011.
c09.indd 75c09.indd 75 27-05-2013 10:36:3927-05-2013 10:36:39

c09.indd 76c09.indd 76 27-05-2013 10:36:3927-05-2013 10:36:39
77
Chapter 10
Wilbur Ross
We spend a lot of time trying to fi gure out which industries
will go bad a year from now and then within that universe, we
try to fi gure out which companies are salvageable. 1
—Wilbur Ross
Wilbur Ross, Jr. is CEO and Chairman of WL Ross & Co.
LLC, a subsidiary of Invesco. Invesco is a diversifi ed invest-
ment management fi rm with WL Ross & Co. focused
on turning around fi nancially distressed companies. Ross got his
BA from Yale and an MBA with distinction from Harvard Business
School. After a stellar 24-year career at Rothschild Inc., where he led the
worldwide bankruptcy advisory practice, Ross founded WL Ross & Co.
in 2000. During his last three years at Rothschild, he ran a private equity
fund that inspired him to venture out on his own, raising $450 million to
invest in distressed businesses. WL Ross & Co. came under the fold of
Invesco in 2006. The products off ered by them include funds in the
absolute return and private equity sectors.
Ross is an anomaly among his peers; while most of them courted
conservative investing in their golden years, Ross ’s appetite for risk
took to the skies after starting his own gig at the age of 62. From 2001
to 2004, Ross raked in hundreds of millions of dollars by investing in
dying businesses and giving them a second chance at life. The segments
included steel milling, mining, metals, coal, and textiles. The amazing
c10.indd 77c10.indd 77 27-05-2013 12:21:0027-05-2013 12:21:00
78 p r o f i t i n g f r o m h e d g e f u n d s
part is that these turnarounds happened when the U.S. economy was
reeling from the back-to-back punches of the tech-bubble popping
and the 9/11 terrorist attacks.
Philosophy and Style
Wilbur Ross, known as “the king of bankruptcy,” defi nes his work
as “Go into buildings that aren ’t completely burned down and put
the fi re out.” 2 Inevitably, the plan involves a painful restructuring pro-
cess for the employees and executives of the businesses concerned:
layoff s, fi rings, wage freezes, benefi t reductions, plant closures, and
so on, along with hard negotiations with any unions involved are all
part of the deal. The media overwhelmingly disdains turning around
distressed securities through such actions and describes the activ-
ity with choice terms such as “dirty work,” “vulture capitalists,” and
“bottom feeders.” But not Ross, who sees his work as a phoenix that
rises from the ashes—creating jobs and profi ts from dying businesses
is very benefi cial to society. 3
Ross ’s philosophy encompasses pushing for improved effi ciency
and positive changes at all levels including government policies. He
applauds eff orts in returning U.S. manufacturing jobs through pro-
tectionist policies, such as trade restrictions and import tariff s. In the
global stage, he looks to promoting fair trade practices and has said that
the United States is in danger of exporting its standard of living and
importing unemployment. 4 He sees China as engaged in stealth expor-
tation of U.S. jobs. Until 2008, his investments were in businesses with
a strong U.S. manufacturing base, enabling him to benefi t from his
eff orts in the area. Since the crisis, he has shifted the focus to distressed
securities in the fi nancial sector.
Marquee Trades
For Wilbur Ross, patience pays. He initiates positions only after the tar-
gets lighten up by purging debilitating liabilities such as health-care and
pension obligations, usually in the bankruptcy phase. He consolidated
the assets of numerous bankrupt steel companies in the early 2000s and
engineered a turnaround. At that time, the U.S. steel industry was on life
c10.indd 78c10.indd 78 27-05-2013 12:21:0027-05-2013 12:21:00
Wilbur Ross 79
support, beset by a series of bankruptcies over the prior fi ve years, due
to their high costs and inability to compete. His process swung into high
gear with the purchase of Acme Steel and LTV Steel ’s integrated steel
assets in early 2002. A number of other purchases, including Bethlehem
Steel Corporation, U.S. Steel ’s Gary plate mill, and Weirton Steel, from
2003 to 2004, were modeled after the LTV purchase. International Steel
Group (ISG) was organized using these consolidated assets with the
unions accepting new work rules, and reduced benefi ts and compensa-
tion. A set of positive external events lined up making the turnaround
of ISG seem almost instantaneous: the United States imposed a 30 per-
cent tariff on foreign steel, international demand for steel picked up, and
demand from U.S. automakers improved. Because Ross had foreseen the
probability of some of these events coming to pass, he was able to call his
shots with absolute conviction. In December 2003, ISG held a successful
initial public off ering (IPO), and the company was sold to Mittal Steel in
2005 for $4.5 billion. All told, WL Ross & Co. spent ~$2 billion consoli-
dating assets, and was able to more than double their investment in three
years with this resounding deal.
Over the last decade, Ross adopted comparable strategies to bump
up businesses in three other sectors with similar problems: textiles,
auto parts, and coal. International Textile Group (ITG), International
Automotive Components Group (IAC), and International Coal Group
(ICG) were based on this approach. ITG, a U.S. manufacturer of fab-
rics, was woven in 2004 through the consolidation of the assets of
Burlington Industries, Cone Mills Corporation, Safety Components
International (automotive fabrics), and BST Safety Textiles of Germany.
IAC, a similar endeavor, is the amalgamation of certain assets of Lear
Corporation and Collins & Aikman. The purchase of the nonunion
properties of Horizon Natural Resources through a bankruptcy auction
in May 2004 established ICG. Anker Coal Group came into the fold in
2005 and in 2011 the business was sold to Arch Coal, Inc.
Portfolio Analysis
Table 10.1 lists Wilbur Ross’ U.S. long portfolio details as of Q1 2012.
The 13F indicates a very concentrated portfolio with just seven
holdings accounting for 99 percent of the total portfolio value, of
c10.indd 79c10.indd 79 27-05-2013 12:21:0027-05-2013 12:21:00
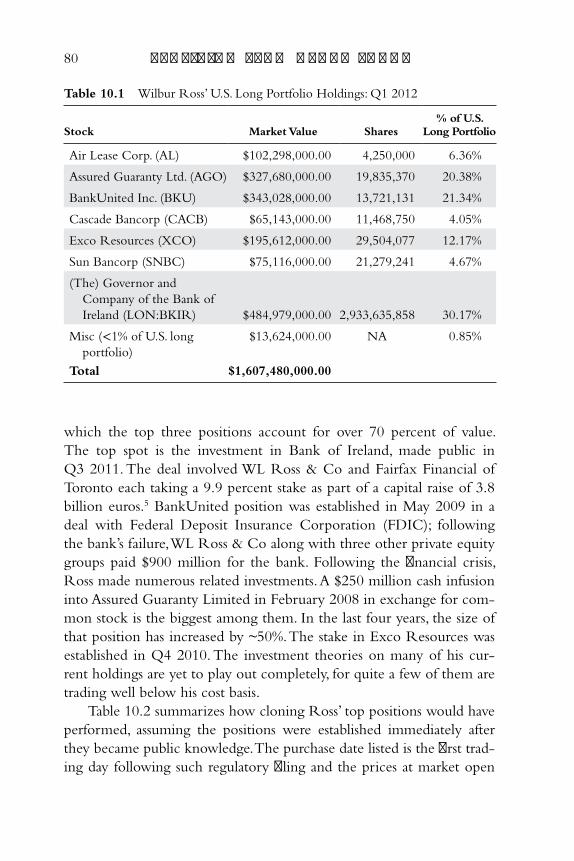
80 p r o f i t i n g f r o m h e d g e f u n d s
Table 10.1 Wilbur Ross’ U.S. Long Portfolio Holdings: Q1 2012
Stock Market Value Shares % of U.S.
Long Portfolio
Air Lease Corp. (AL) $102,298,000.00 4,250,000 6.36%
Assured Guaranty Ltd. (AGO) $327,680,000.00 19,835,370 20.38%
BankUnited Inc. (BKU) $343,028,000.00 13,721,131 21.34%
Cascade Bancorp (CACB) $65,143,000.00 11,468,750 4.05%
Exco Resources (XCO) $195,612,000.00 29,504,077 12.17%
Sun Bancorp (SNBC) $75,116,000.00 21,279,241 4.67%
(The) Governor and
Company of the Bank of
Ireland (LON:BKIR) $484,979,000.00 2,933,635,858 30.17%
Misc (<1% of U.S. long
portfolio)
$13,624,000.00 NA 0.85%
Total $1,607,480,000.00
which the top three positions account for over 70 percent of value.
The top spot is the investment in Bank of Ireland, made public in
Q3 2011. The deal involved WL Ross & Co and Fairfax Financial of
Toronto each taking a 9.9 percent stake as part of a capital raise of 3.8
billion euros. 5 BankUnited position was established in May 2009 in a
deal with Federal Deposit Insurance Corporation (FDIC); following
the bank ’s failure, WL Ross & Co along with three other private equity
groups paid $900 million for the bank. Following the fi nancial crisis,
Ross made numerous related investments. A $250 million cash infusion
into Assured Guaranty Limited in February 2008 in exchange for com-
mon stock is the biggest among them. In the last four years, the size of
that position has increased by ~50%. The stake in Exco Resources was
established in Q4 2010. The investment theories on many of his cur-
rent holdings are yet to play out completely, for quite a few of them are
trading well below his cost basis.
Table 10.2 summarizes how cloning Ross’ top positions would have
performed, assuming the positions were established immediately after
they became public knowledge. The purchase date listed is the fi rst trad-
ing day following such regulatory fi ling and the prices at market open
c10.indd 80c10.indd 80 27-05-2013 12:21:0027-05-2013 12:21:00
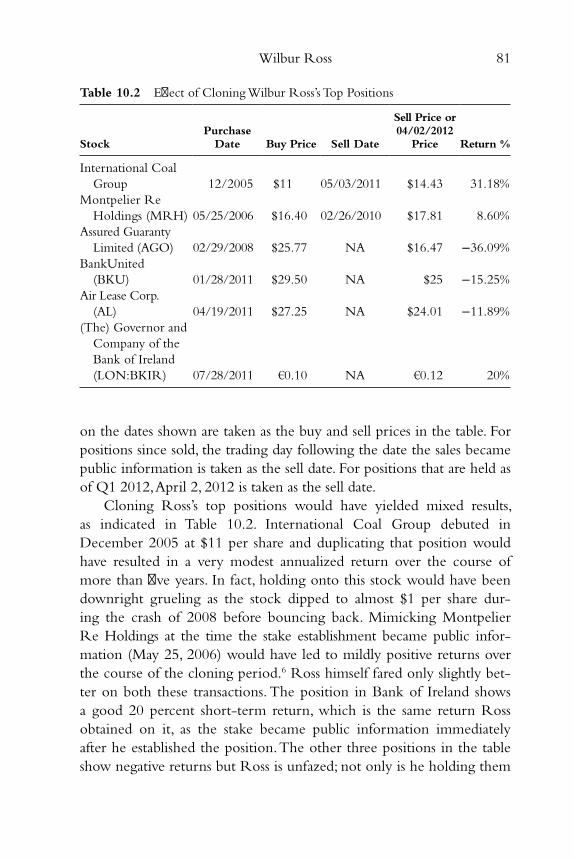
Wilbur Ross 81
on the dates shown are taken as the buy and sell prices in the table. For
positions since sold, the trading day following the date the sales became
public information is taken as the sell date. For positions that are held as
of Q1 2012, April 2, 2012 is taken as the sell date.
Cloning Ross ’s top positions would have yielded mixed results,
as indicated in Table 10.2 . International Coal Group debuted in
December 2005 at $11 per share and duplicating that position would
have resulted in a very modest annualized return over the course of
more than fi ve years. In fact, holding onto this stock would have been
downright grueling as the stock dipped to almost $1 per share dur-
ing the crash of 2008 before bouncing back. Mimicking Montpelier
Re Holdings at the time the stake establishment became public infor-
mation (May 25, 2006) would have led to mildly positive returns over
the course of the cloning period. 6 Ross himself fared only slightly bet-
ter on both these transactions. The position in Bank of Ireland shows
a good 20 percent short-term return, which is the same return Ross
obtained on it, as the stake became public information immediately
after he established the position. The other three positions in the table
show negative returns but Ross is unfazed; not only is he holding them
Table 10.2 Eff ect of Cloning Wilbur Ross’s Top Positions
Stock Purchase
Date Buy Price Sell Date
Sell Price or 04/02/2012
Price Return %
International Coal
Group 12/2005 $11 05/03/2011 $14.43 31.18%
Montpelier Re
Holdings (MRH) 05/25/2006 $16.40 02/26/2010 $17.81 8.60%
Assured Guaranty
Limited (AGO) 02/29/2008 $25.77 NA $16.47 −36.09%
BankUnited
(BKU) 01/28/2011 $29.50 NA $25 −15.25%
Air Lease Corp.
(AL) 04/19/2011 $27.25 NA $24.01 −11.89%
(The) Governor and
Company of the
Bank of Ireland
(LON:BKIR) 07/28/2011 €0.10 NA €0.12 20%
c10.indd 81c10.indd 81 27-05-2013 12:21:0027-05-2013 12:21:00
82 p r o f i t i n g f r o m h e d g e f u n d s
tight, he is also increasing the stakes at lower price points. Ross has a
195 percent unrealized return on his investment in BankUnited, as his
stake was bought from FDIC prior to the IPO at ~$10 per share. 7 The
Air Lease Corp. investment is also prior to the IPO making his cost
basis much lower compared to the IPO price of $27.25. On the other
hand, there is a sizable unrealized loss on the Assured Guaranty Limited
position.
Many of Wilbur Ross ’s positions were established when the busi-
nesses involved were in bankruptcy. It is not possible to simulate such
positions, as the negotiated details of the deals are generally private
information. Ross successfully turned around several businesses and
off ered shares through initial public off erings (IPO). Cloning positions
after the IPO is an option, but the returns are nowhere in the vicin-
ity of those of Ross, as his cost basis would inevitably be much lower.
Overall, ad hoc cloning is not very suited to following Ross ’s moves. A
strategy which fi lters his moves based on position size and whether the
cost-basis achievable by cloning is comparable to Ross ’s own cost basis
should provide good returns, although the number of such positions
will be very limited.
Notes
1. Nicholas Stein, “Man of Steel,” Fortune , 05/26/2003, http://money.cnn
.com/magazines/fortune/fortune_archive/2003/05/26/343116/index.htm.
2. Jack Simon and Wilbur Ross, “Wilbur Ross: I Put Out the Fire of Failed
Businesses,” BBC Today Radio Programme, 06/25/2012, http://news.bbc
.co.uk/today/hi/today/newsid_9731000/9731547.stm.
3. Renee Montagne, Steve Inskeep, and Wilbur Ross, “Wilbur Ross: Finding
His Calling,” National Public Radio ’s Morning Edition , 09/15/2008, www
.npr.org/templates/story/story.php?storyId = 94569826.
4. Daniel Gross, “The Bottom-Feeder King,” New York . 05/21/2005, http://
nymag.com/nymetro/news/bizfi nance/columns/moneyandmind/10279.
5. Lisa O ’Carroll, “Wilbur Ross and Fairfax Rescue Bank of Ireland,” the
Guardian Ireland Business Blog, 07/28/2011, www.guardian.co.uk/business/
ireland-business-blog-with-lisa-ocarroll/2011/jul/28/banking-globalrecession.
6. Steve Gelsi, “Montpelier Re Holdings Gets $100M from Wilbur Ross,”
MarketWatch—Market Pulse, 05/25/2006, http://articles.marketwatch
c10.indd 82c10.indd 82 27-05-2013 12:21:0027-05-2013 12:21:00

Wilbur Ross 83
.com/2006–05–25/news/30927718_1_montpelier-re-holdings-shares-
reinsurance-fi rm.
7. Justin Doom, “BankUnited IPO Raises $783 Million as Blackstone, Carlyle
Reduce Holdings,” Bloomberg News, 01/29/2011, www.bloomberg.com/
news/2011–01–27/bankunited-ipo-raises-783-million-as-buyout-firms-
reduce-stake-in-lender.html.
c10.indd 83c10.indd 83 27-05-2013 12:21:0027-05-2013 12:21:00

c10.indd 84c10.indd 84 27-05-2013 12:21:0027-05-2013 12:21:00
85
Chapter 11
George Soros
There has to be both some form of credit or leverage and some
kind of misconception or misinterpretation involved for a
boom-bust process to develop.
—George Soros
George Soros is founder and chairman of Soros Fund
Management LLC, a hedge fund management fi rm founded
in 1969. Born in Budapest in 1930, he and his family, using
false identities, survived the Nazi occupation that started in 1944.
Soros describes the experience as “exhilarating,” for they not only
endured but helped many others. 1 Soros immigrated to England in
1947, and graduated from the London School of Economics in 1952.
His career started in earnest after a move to New York City
in 1956, as an arbitrage trader at F. M. Mayer. Steadily climbing the
corporate ladder, he became manager of the Double Eagle hedge
fund in 1967, while working for First Eagle Funds. Soon after, he
started his own hedge fund management fi rm, Soros Fund
Management.
c11.indd 85c11.indd 85 27-05-2013 11:23:4727-05-2013 11:23:47
86 p r o f i t i n g f r o m h e d g e f u n d s
Soros Fund Management ’s fl agship product, Quantum Fund,
returned over 30 percent per year in its fi rst two decades. By the late
1980s Soros ranked near the top of the world ’s wealthiest list and
gave up day-to-day management of the fi rm. The aggressive strate-
gies of the fund continued through the 1990s, until his partner Stanley
Druckenmiller quit as portfolio manager in 2000. In 2001, the hedge
fund was renamed Quantum Endowment Fund and converted to a
less aggressive investment vehicle. In 2011, the fund converted to a
family offi ce structure to avoid registration with the SEC as a private
investment adviser per the new rules under the Dodd-Frank act.
Philosophy and Style
George Soros believes in the signifi cance of refl exivity in markets
and his philosophy on the same was published in his 1987 book, The
Alchemy of Finance: Reading the Mind of the Market. 2 Refl exivity revolves
around how expectation/pricing aff ects fundamentals and how those
modifi ed fundamentals in turn aff ect expectation/pricing resulting in
a self-reinforcing pattern that moves markets toward disequilibrium.
With this hypothesis, boom-and-bust cycles that appear periodically in
the markets are easily explained: For example, in the housing bubble,
an increase in overall home prices in the market made banks open to
lending more for the same house. This, in turn, made housing acces-
sible to a broader clientele, further increasing home prices. The trend is
recognized and reinforced, as home prices became artifi cially infl ated
to unsustainable levels (disequilibrium) at which point the trend
reversed, and banks’ willingness to lend plunged, causing a sharp decel-
eration in overall home prices.
Soros ’s investment philosophy is primarily based on holding highly
leveraged short and long positions that enable profi ting from market
trends identifi ed from his refl exivity principles. He is convinced about
the herd mentality of market participants and seeks to exploit such
trends; he moves with the herd for the most part, but exits ahead of
them based on his instinct. The reliance on instinct makes such trades
hard to comprehend and copy.
c11.indd 86c11.indd 86 27-05-2013 11:23:4727-05-2013 11:23:47
George Soros 87
Marquee Trades
Soros ’s early trades amassed profi ts that took advantage of the boom-
bust cycles associated with certain types of equity leveraging. The
conglomerate boom-bust cycle that originated in the late 1960s is a
case in point. Around that time, it dawned on many defense-oriented
businesses enjoying respectable growth rates and strong valuation that
such growth rates were not sustainable. By acquiring low-quality busi-
nesses in diverse areas, they turned themselves into conglomerates. As
the fi rms purchased businesses with their highly valued stock, on a
per-share basis, their growth rates appeared to be accelerating—for
example, if Company X with a Price-to-Earnings (PE) ratio of 20
acquires Company Y with a PE of 10 using Company X ’s stock, the
per-share-earnings of the combined business increases, thereby caus-
ing an illusion of accelerating growth. The misconception led to stock
price appreciation in the short term. Ultimately, the shares crashed
when it became evident that the growth rates were not sustainable.
Soros profi ted both on the uptrend and in the crash that followed.
Soros also benefi ted from the boom-bust cycle in REITs. A legislation
permitting tax-free distribution if 95 percent of the income is dis-
tributed resulted in the mushrooming of mortgage trusts. Their share
prices swiftly doubled, allowing more shares to be issued at infl ated
prices. A few years later, many of these trusts collapsed when the sen-
timent reversed. Soros anticipated the trend and profi ted from the up
cycle. He returned later to play the short side, and realized more than
100 percent profi ts in some of them, as he continued shorting more
shares as the prices fell.
Soros ’s hall-of-fame trade is the shorting of the British pound
in 1992. His fund manager Stanley Druckenmiller ’s macro analy-
sis concluded that the Bank of England didn ’t have enough reserves
to prop up the currency and that it couldn ’t aff ord to raise rates. 3
Soros ’s genius involved recognizing the potential of the trade and
prodding Druckenmiller to go all in. The $10 billion bet paid off in
a few months when the pound sterling was devalued following Great
Britain ’s withdrawal from the European Exchange Rate Mechanism
(ERM) on September 16, 1992 (Black Wednesday). The short position
c11.indd 87c11.indd 87 27-05-2013 11:23:4727-05-2013 11:23:47
88 p r o f i t i n g f r o m h e d g e f u n d s
netted the fund over $1 billion and the trade earned Soros the nick-
name “The Man Who Broke the Bank of England.”
In 2007, upon sensing the imminent fi nancial crisis, Soros returned
to active trading after a hiatus of almost 20 years. His trades since his
comeback are related to taking advantage of the unraveling of what
he terms the “super bubble,” a situation that developed over the last 25
years. 4 Three major trends feed this fi re: ever increasing credit expan-
sion, globalization of fi nancial markets, and removal of fi nancial regu-
lations. He envisages the bursting of the super bubble as the end of
U.S. dominance, and the mighty dollar loses its reserve currency status.
Although the premise has not come to pass, his trades have still been
very successful, with the fund showing handsome returns over the last
four years.
Portfolio Analysis
Table 11.1 lists Soros Fund Management ’s U.S. long portfolio details as
of Q1 2012.
At any given time, Soros holds hundreds of positions spread all over
the map. Over 70 percent of the holdings reported in the 13F fi lings
are positions less than 1 percent each. A handful of sizable long posi-
tions indicates a clear bias on certain individual securities. PowerShares
ETF Trust QQQ PUTS and S&P 500 SPDR PUTS are large short
positions that collectively account for ~12% of the overall portfo-
lio. Shorting the U.S. market indexes confi rms Soros has positions in
place to profi t, should his super-bubble scenario prove spot on over
the long term. Adecoagro SA, a large farming operation from South
America, which had an IPO in early 2011, was established prior to its
IPO. Agricultural boom is the next bubble identifi ed and Adecoagro
is a play on that uptrend. Other potential boom-bust scenarios on his
radar include raw materials, energy, and asset bubbles in certain emerg-
ing markets. Westport Innovations is focused on providing technologies
using natural gas in petroleum-based fuel engines. Here, too, Soros is
positioned to profi t from the boom-bust potential of natural gas adop-
tion trend in the United States and the rest of the world.
c11.indd 88c11.indd 88 27-05-2013 11:23:4727-05-2013 11:23:47
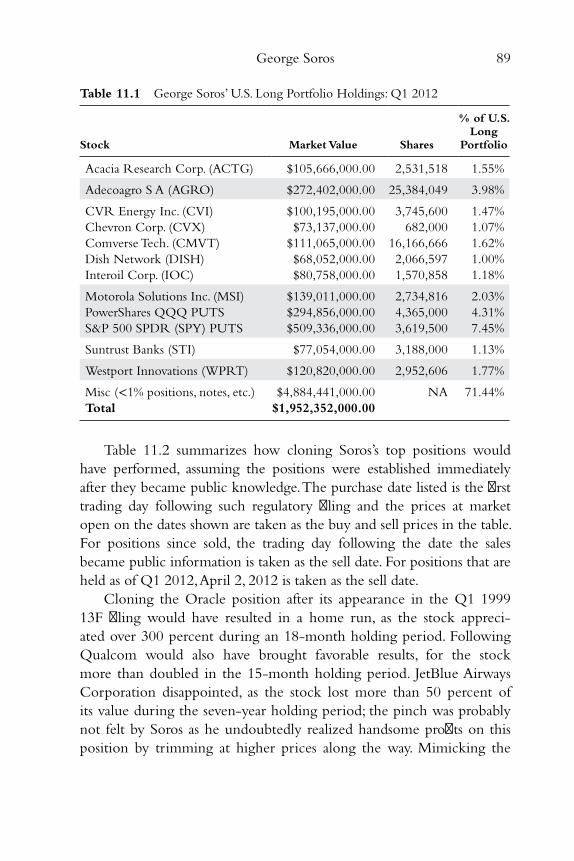
George Soros 89
Table 11.2 summarizes how cloning Soros ’s top positions would
have performed, assuming the positions were established immediately
after they became public knowledge. The purchase date listed is the fi rst
trading day following such regulatory fi ling and the prices at market
open on the dates shown are taken as the buy and sell prices in the table.
For positions since sold, the trading day following the date the sales
became public information is taken as the sell date. For positions that are
held as of Q1 2012, April 2, 2012 is taken as the sell date.
Cloning the Oracle position after its appearance in the Q1 1999
13F fi ling would have resulted in a home run, as the stock appreci-
ated over 300 percent during an 18-month holding period. Following
Qualcom would also have brought favorable results, for the stock
more than doubled in the 15-month holding period. JetBlue Airways
Corporation disappointed, as the stock lost more than 50 percent of
its value during the seven-year holding period; the pinch was probably
not felt by Soros as he undoubtedly realized handsome profi ts on this
position by trimming at higher prices along the way. Mimicking the
Table 11.1 George Soros’ U.S. Long Portfolio Holdings: Q1 2012
Stock Market Value Shares
% of U.S. Long
Portfolio
Acacia Research Corp. (ACTG) $105,666,000.00 2,531,518 1.55%
Adecoagro S A (AGRO) $272,402,000.00 25,384,049 3.98%
CVR Energy Inc. (CVI) $100,195,000.00 3,745,600 1.47%
Chevron Corp. (CVX) $73,137,000.00 682,000 1.07%
Comverse Tech. (CMVT) $111,065,000.00 16,166,666 1.62%
Dish Network (DISH) $68,052,000.00 2,066,597 1.00%
Interoil Corp. (IOC) $80,758,000.00 1,570,858 1.18%
Motorola Solutions Inc. (MSI) $139,011,000.00 2,734,816 2.03%
PowerShares QQQ PUTS $294,856,000.00 4,365,000 4.31%
S&P 500 SPDR (SPY) PUTS $509,336,000.00 3,619,500 7.45%
Suntrust Banks (STI) $77,054,000.00 3,188,000 1.13%
Westport Innovations (WPRT) $120,820,000.00 2,952,606 1.77%
Misc (<1% positions, notes, etc.) $4,884,441,000.00 NA 71.44%
Total $1,952,352,000.00
c11.indd 89c11.indd 89 27-05-2013 11:23:4727-05-2013 11:23:47
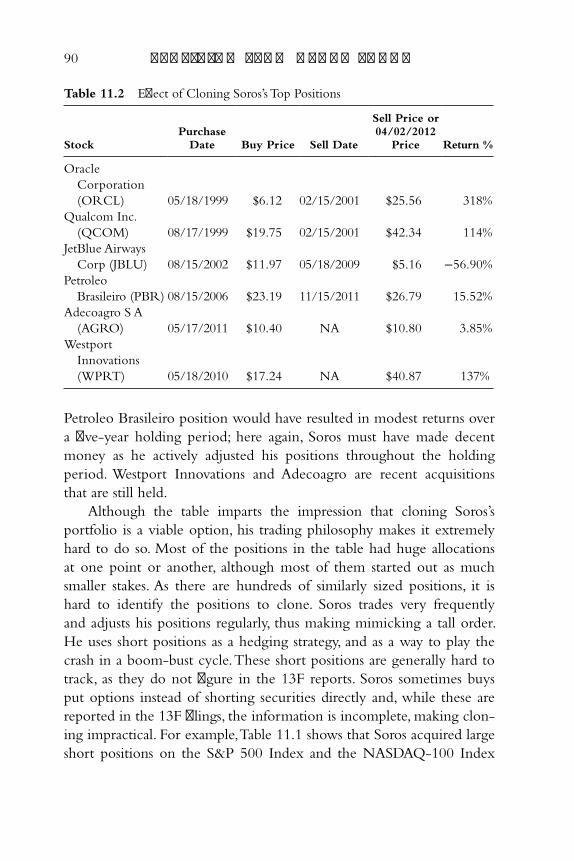
90 p r o f i t i n g f r o m h e d g e f u n d s
Petroleo Brasileiro position would have resulted in modest returns over
a fi ve-year holding period; here again, Soros must have made decent
money as he actively adjusted his positions throughout the holding
period. Westport Innovations and Adecoagro are recent acquisitions
that are still held.
Although the table imparts the impression that cloning Soros ’s
portfolio is a viable option, his trading philosophy makes it extremely
hard to do so. Most of the positions in the table had huge allocations
at one point or another, although most of them started out as much
smaller stakes. As there are hundreds of similarly sized positions, it is
hard to identify the positions to clone. Soros trades very frequently
and adjusts his positions regularly, thus making mimicking a tall order.
He uses short positions as a hedging strategy, and as a way to play the
crash in a boom-bust cycle. These short positions are generally hard to
track, as they do not fi gure in the 13F reports. Soros sometimes buys
put options instead of shorting securities directly and, while these are
reported in the 13F fi lings, the information is incomplete, making clon-
ing impractical. For example, Table 11.1 shows that Soros acquired large
short positions on the S&P 500 Index and the NASDAQ-100 Index
Table 11.2 Eff ect of Cloning Soros’s Top Positions
Stock Purchase
Date Buy Price Sell Date
Sell Price or 04/02/2012
Price Return %
Oracle
Corporation
(ORCL) 05/18/1999 $6.12 02/15/2001 $25.56 318%
Qualcom Inc.
(QCOM) 08/17/1999 $19.75 02/15/2001 $42.34 114%
JetBlue Airways
Corp (JBLU) 08/15/2002 $11.97 05/18/2009 $5.16 −56.90%
Petroleo
Brasileiro (PBR) 08/15/2006 $23.19 11/15/2011 $26.79 15.52%
Adecoagro S A
(AGRO) 05/17/2011 $10.40 NA $10.80 3.85%
Westport
Innovations
(WPRT) 05/18/2010 $17.24 NA $40.87 137%
c11.indd 90c11.indd 90 27-05-2013 11:23:4727-05-2013 11:23:47
George Soros 91
through put options on S&P 500 SPDR and PowerShares QQQ ETFs.
However, the 13F information does not list the strike prices and expi-
ration dates.
Soros ’s strategy is very consistent, as many of his positions attempt
to profi t from boom-bust trends. Therefore, a strategy endeavoring to
identify the trends Soros is playing in and applying the same in one ’s
own portfolio is the best approach to follow Soros.
Notes
1. George Soros, The New Paradigm for Financial Markets: The Credit Crisis of
2008 and What It Means (New York: PublicAff airs, 2008).
2. George Soros, The Alchemy of Finance: Reading the Mind of the Market (New
York: John Wiley & Sons, 1987).
3. Katherine Burton, “Druckenmiller Calls It Quits After 30 Years as Job Gets
Tougher,” Bloomberg, 08/19/2010, www.bloomberg.com/news/2010–08–18/
druckenmiller-calls-it-quits-after-30-years-as-hedge-fund-job-gets-tougher
.html.
4. DealBook. “George Soros Sees a ‘Superbubble,’” New York Times , 04/11/2008,
http://dealbook.nytimes.com/2008/04/11/george-soros-the-face-of-
a-prophet.
c11.indd 91c11.indd 91 27-05-2013 11:23:4727-05-2013 11:23:47

c11.indd 92c11.indd 92 27-05-2013 11:23:4727-05-2013 11:23:47
93
Chapter 12
David Swensen
Only with confi dence created by a strong decision-making
process can investors sell mania-induced excess and buy despair-
driven value.
—David Swensen
David Swensen is chief investment offi cer at Yale University ’s
endowment fund, which is among the largest university
endowments in the United States, with assets over $19 billion
as of 2011. 1 Upon completing his PhD in economics from Yale in 1980,
Swensen spent a few years in Wall Street: at Salomon Brothers as an
associate in corporate fi nance developing new fi nancial technologies
and at Lehman Brothers as a vice president specializing in swap activi-
ties. In 1985, he returned to Yale to run its $1 billion endowment fund
at the insistence of James Tobin and William Brainard, his PhD disserta-
tion advisors. Under Swensen ’s stewardship, the endowment went on to
return over 19 times, and its performance beat institutional fund indices
by wide margins. The results take on an extraordinary hue when the
spending from the endowment is also factored in: From $45 million in
1985, it reached $987 million in 2011. 2 Over the last decade, spending
has grown at an annual rate of 11 percent and as of 2011 accounts for 37
c12.indd 93c12.indd 93 27-05-2013 11:48:0627-05-2013 11:48:06
94 p r o f i t i n g f r o m h e d g e f u n d s
percent of the university ’s revenues. It was just 10 percent of the univer-
sity ’s revenues when Swensen took control.
The 2009 fi scal year was very rare in that the endowment dropped
almost 25 percent. For the same period, global equity markets dropped
around 30 percent. The large negative return drew disapproval from
critics who were quick to pronounce the model broken, and con-
demned it for underestimating the risk of holding equity like instru-
ments. 3 Still, the poor performance of that lone year did not dent
Swensen ’s long-term record.
Swensen ’s outperformance with the Yale Endowment encouraged
other college and university endowments to follow in his footsteps.
Swensen ’s book, Pioneering Portfolio Management: An Unconventional
Approach to Institutional Investment (2000), introduced his strate-
gies and coined the term “the Yale model.” However, the Yale model
failed to assist institutional investors, because they sorely lacked supe-
rior investing skills. 4 Swensen also came across as ineff ective in his
simple index-funds based allocation strategy for individual investors
presented in his book, Unconventional Success: A Fundamental Approach
to Personal Investment (2005). 5 Following his equity oriented index
fund recommendations would have resulted in large negative returns
during the fi nancial crisis. In essence, his eff orts at teaching portfolio
management to institutional investors and individual investors defi -
nitely fall short. But his record at Yale is impeccable.
Philosophy and Style
Yale Endowment ’s portfolio management philosophy is centered
on David Swensen ’s two core ideas: equity bias with a long time
horizon and diversifi cation. 6 Equity bias with a long time horizon is
based on the notion that, in the long term, a diversifi ed portfolio of
equities outperforms debt-based asset classes such as short-term trea-
sury bills and longer-term bonds. In fact, over the last two centuries,
equities handsomely outperformed bonds. From 1925 through 2006,
equity returns varied between 3,000 (diversifi ed stocks) and 16,000
(small cap stocks) times while debt-investment returns varied between
19 (short-term treasury bills) and 72 (bonds) times. The need for
c12.indd 94c12.indd 94 27-05-2013 11:48:0627-05-2013 11:48:06
David Swensen 95
diversifi cation arises from the necessity to limit exposure to volatil-
ity. Without this, the ability to stay solvent and fully invested through
a market crash is hard to achieve. The Yale Endowment follows these
ideas to a T, with an overwhelming majority of the portfolio allocated
in diversifi ed equity like investments and a very small (<5 percent)
bond/cash allocation.
While other portfolio managers rely on market timing and other
trend-following methods, Swensen is not keen on them; to him, they
are zero-sum games. His resources are spent primarily on bottom-up
security selection in equity like assets. The assets are diversifi ed over
effi ciently priced marketable securities (domestic stocks and foreign
stocks) and ineffi ciently priced alternatives (absolute return, private
equity, and real assets). The allocation is heavily tilted in favor of alter-
natives, and those assets accounted for over 80 percent of the portfolio
as of 2011, way up from ~60 percent in 2000 and nil in 1985. Swensen
channels security selection eff orts into market areas that are less effi -
cient, for therein lies true rewards; the diff erence between the top and
bottom quartile performance of funds in the venture capital area is
over 40 percent, while the gap is in the low-single digits in the market-
able security areas. The alternatives are less liquid but are not a concern,
given the endowment ’s long time horizon (forever).
Marquee Trades
In 1989, Yale ’s Investments Offi ce formed an absolute return asset class
and in the process became the fi rst institutional investor to create an
independent asset class for diversifying equity strategies. 7 Over the next
23 years, the strategy paid huge dividends while reducing overall risk.
The excellent returns were mainly attributable to manager skill, equity
like orientation, and investments in less market effi cient areas that fea-
tured outstanding risk-reward characteristics.
Yale initiated investing in private equity (PE) in the form of lever-
aged buyouts as early as 1973 and the venture capital fi eld by 1976.
Undoubtedly, PE is the best performing asset class for Yale, returning an
unprecedented 30.3 percent annualized since inception. Very successful
venture capital investments include companies such as Oracle, Amgen,
c12.indd 95c12.indd 95 27-05-2013 11:48:0627-05-2013 11:48:06
96 p r o f i t i n g f r o m h e d g e f u n d s
Cisco Systems, Netscape Communications, and Dell Computer.
Lucrative investments were also made in companies, such as Yahoo,
Amazon.com , and Juniper Networks during the late 1990s. As the
Internet bubble developed, the endowment reversed course and played
the short side—huge bets against Internet stocks in 1999 and 2000
brought in substantial gains. The about-turn doesn ’t qualify as market
timing for the overall portfolio allocation was not impacted with these
wagers.
The asset class real assets (RA) not only delivered a steady ~10
percent annualized returns, but also provided the portfolio with good
diversifi cation, predictable cash fl ow, and a hedge against infl ation. The
RA asset class includes illiquid and ineffi cient investment options, such
as real estate, oil and gas, and timberland. By collaborating with special-
ized managers with deep market knowledge, Yale is able to play these
fi elds to its advantage. Focus on less effi ciently priced areas, such as nat-
ural forests instead of plantation forests, have also helped the endow-
ment achieve good returns with very low correlation to other asset
classes.
During the fi nancial crisis, a large short position in subprime
mortgage-backed securities helped cushion setbacks in other parts of
the portfolio. The endowment also profi ted from positions in the dis-
tressed securities area, such as bank loans purchased at well below par
during the wake of the fi nancial crisis. Such positions, based largely
on macros analysis, helped protect assets while keeping the allocation
percentages intact.
Portfolio Analysis
Yale ’s U.S. long portfolio details as of Q1 2012 are listed in Table 12.1 .
Yale Endowments 13F long portfolio is very light representing
only ~0.6 percent of the total assets. The bulk of the domestic equity
allocation (6.7 percent as of 2011 fi scal year) is with other fund manag-
ers, as in a fund-of-funds model. Yale, having recognized the effi ciency
of the domestic equity area, prefers active management by engaging
talented fund managers with strong bottom-up research capabilities
to capture the competitive advantage. On the other hand, the petite
c12.indd 96c12.indd 96 27-05-2013 11:48:0627-05-2013 11:48:06
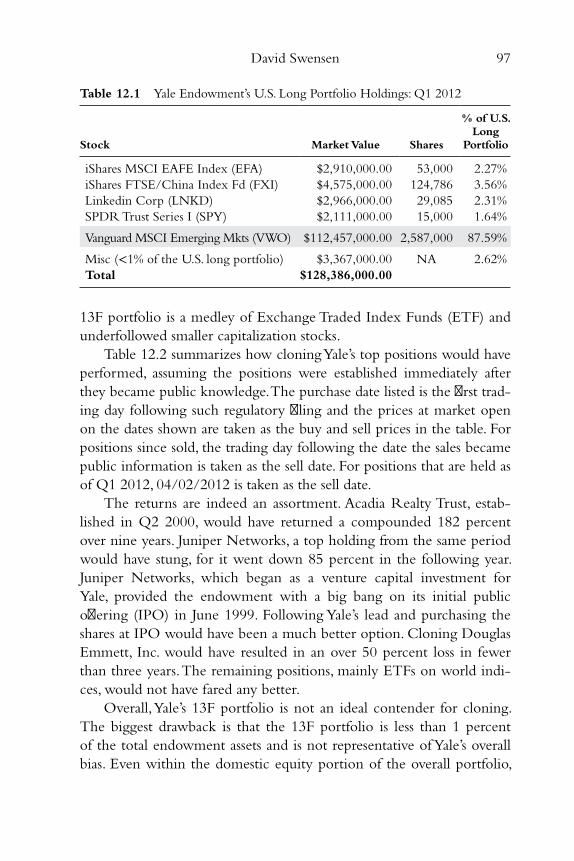
David Swensen 97
13F portfolio is a medley of Exchange Traded Index Funds (ETF) and
underfollowed smaller capitalization stocks.
Table 12.2 summarizes how cloning Yale ’s top positions would have
performed, assuming the positions were established immediately after
they became public knowledge. The purchase date listed is the fi rst trad-
ing day following such regulatory fi ling and the prices at market open
on the dates shown are taken as the buy and sell prices in the table. For
positions since sold, the trading day following the date the sales became
public information is taken as the sell date. For positions that are held as
of Q1 2012, 04/02/2012 is taken as the sell date.
The returns are indeed an assortment. Acadia Realty Trust, estab-
lished in Q2 2000, would have returned a compounded 182 percent
over nine years. Juniper Networks, a top holding from the same period
would have stung, for it went down 85 percent in the following year.
Juniper Networks, which began as a venture capital investment for
Yale, provided the endowment with a big bang on its initial public
off ering (IPO) in June 1999. Following Yale ’s lead and purchasing the
shares at IPO would have been a much better option. Cloning Douglas
Emmett, Inc. would have resulted in an over 50 percent loss in fewer
than three years. The remaining positions, mainly ETFs on world indi-
ces, would not have fared any better.
Overall, Yale ’s 13F portfolio is not an ideal contender for cloning.
The biggest drawback is that the 13F portfolio is less than 1 percent
of the total endowment assets and is not representative of Yale ’s overall
bias. Even within the domestic equity portion of the overall portfolio,
Table 12.1 Yale Endowment’s U.S. Long Portfolio Holdings: Q1 2012
Stock Market Value Shares
% of U.S. Long
Portfolio
iShares MSCI EAFE Index (EFA) $2,910,000.00 53,000 2.27%
iShares FTSE/China Index Fd (FXI) $4,575,000.00 124,786 3.56%
Linkedin Corp (LNKD) $2,966,000.00 29,085 2.31%
SPDR Trust Series I (SPY) $2,111,000.00 15,000 1.64%
Vanguard MSCI Emerging Mkts (VWO) $112,457,000.00 2,587,000 87.59%
Misc (<1% of the U.S. long portfolio) $3,367,000.00 NA 2.62%
Total $128,386,000.00
c12.indd 97c12.indd 97 27-05-2013 11:48:0627-05-2013 11:48:06
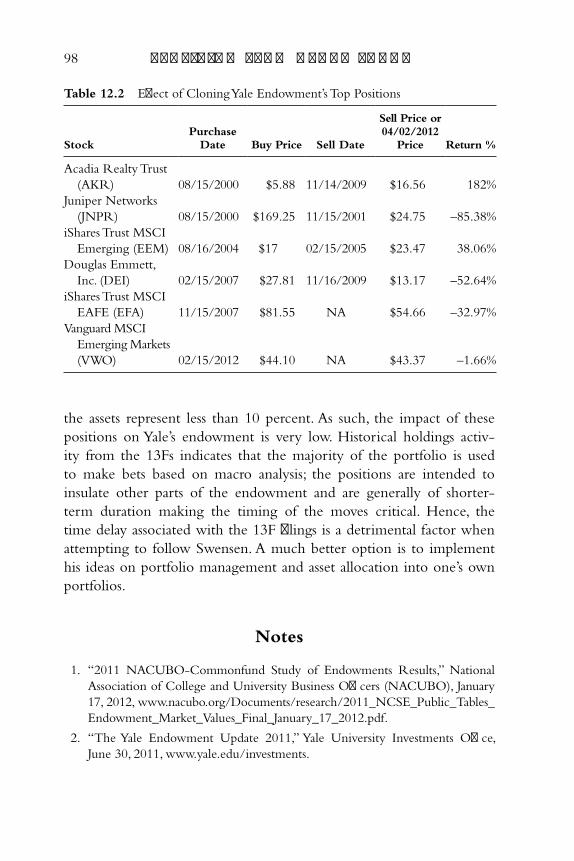
98 p r o f i t i n g f r o m h e d g e f u n d s
the assets represent less than 10 percent. As such, the impact of these
positions on Yale ’s endowment is very low. Historical holdings activ-
ity from the 13Fs indicates that the majority of the portfolio is used
to make bets based on macro analysis; the positions are intended to
insulate other parts of the endowment and are generally of shorter-
term duration making the timing of the moves critical. Hence, the
time delay associated with the 13F fi lings is a detrimental factor when
attempting to follow Swensen. A much better option is to implement
his ideas on portfolio management and asset allocation into one ’s own
portfolios.
Notes
1. “2011 NACUBO-Commonfund Study of Endowments Results,” National
Association of College and University Business Offi cers (NACUBO), January
17, 2012, www.nacubo.org/Documents/research/2011_NCSE_Public_Tables_
Endowment_Market_Values_Final_January_17_2012.pdf .
2. “The Yale Endowment Update 2011,” Yale University Investments Offi ce,
June 30, 2011, www.yale.edu/investments.
Table 12.2 Eff ect of Cloning Yale Endowment’s Top Positions
Stock Purchase
Date Buy Price Sell Date
Sell Price or 04/02/2012
Price Return %
Acadia Realty Trust
(AKR) 08/15/2000 $5.88 11/14/2009 $16.56 182%
Juniper Networks
(JNPR) 08/15/2000 $169.25 11/15/2001 $24.75 –85.38%
iShares Trust MSCI
Emerging (EEM) 08/16/2004 $17 02/15/2005 $23.47 38.06%
Douglas Emmett,
Inc. (DEI) 02/15/2007 $27.81 11/16/2009 $13.17 –52.64%
iShares Trust MSCI
EAFE (EFA) 11/15/2007 $81.55 NA $54.66 –32.97%
Vanguard MSCI
Emerging Markets
(VWO) 02/15/2012 $44.10 NA $43.37 –1.66%
c12.indd 98c12.indd 98 27-05-2013 11:48:0627-05-2013 11:48:06

David Swensen 99
3. “Report Blasts Harvard, Endowment Model,” Bloomberg, May 20, 2010,
www.pionline.com/article/20100520/DAILYREG/100529991.
4. Rick Ferri, “The Curse of the Yale Model,” Forbes , April 16, 2012, www
.forbes.com/sites/rickferri/2012/04/16/the-curse-of-the-yale-model.
5. Aaron Pressman, “Revisiting the Debate over Yale ’s Investing Guru, David
Swensen,” BusinessWeek , June 17, 2009, www.businessweek.com/investing/
insights/blog/archives/2009/06/revisiting_the.html.
6. David Swensen, ECON-252–08: “Financial Markets (2008),” Lecture 9—
Guest Lecture by David Swensen, Open Yale courses, February 13, 2008,
http://oyc.yale.edu/transcript/976/econ-252–08.
7. “The Yale Endowment Update 2000,” Yale University Investments Offi ce,
June 30, 2000, www.yale.edu/investments.
c12.indd 99c12.indd 99 27-05-2013 11:48:0627-05-2013 11:48:06

c12.indd 100c12.indd 100 27-05-2013 11:48:0627-05-2013 11:48:06
101
Chapter 13
Prem Watsa
A clear understanding of the fundamental value of our hold-
ings allows us to go against the crowd. It is lonely at times, but
it works. 2
—Prem Watsa
Prem Watsa is the founder, chairman, and CEO of Fairfax Financial
Holdings Limited, a Toronto, Ontario based insurance and invest-
ment management company. The insurance business is organized
under a decentralized model through subsidiaries, such as Odyssey Re,
Crum & Forster, Zenith Insurance Company, and Northbridge
Financial. The investment management company is centralized, and
operates as Hamblin Watsa Investment Council Limited (HWIC). Watsa,
a chemical engineering graduate from the Indian Institute of Technology
(IIT Madras), obtained his MBA from the Richard Ivey School of
Business, London, Ontario. He was introduced to the Benjamin Graham
style of value investing at his fi rst posting as an analyst at Confederation
Life in 1974. 1
The insurance business greatly appealed to Watsa after his colleague
at GW Investments, Francis Chou, highlighted how Warren Buff ett
invests with insurance fl oat. Fairfax Financial Holdings was established
c13.indd 101c13.indd 101 27-05-2013 08:23:0027-05-2013 08:23:00
102 p r o f i t i n g f r o m h e d g e f u n d s
in 1985, after Watsa took over the reins at Markel Financial, a troubled
trucking insurance business, by providing a cash infusion of $5 million.
Since its inception, Fairfax had a stunning compounded annual growth
rate (CAGR) of 23.5 percent through 2011. The returns, along with
the similarities to Buff ett ’s business model, have earned him the nick-
names “Canadian Warren Buff ett” and “Buff ett of the North.” 3
Fairfax had a rough patch in the early 2000s. On liquidity con-
cerns, the business was affl icted with credit downgrades and, at one
point, the stock was trading at half its book value ($75). The company
was also subjected to what Watsa terms as a “bear raid” by a group
of hedge funds; an $8 billion lawsuit is moving forward. 4 The U.S.
Securities and Exchange Commission (SEC) compounded problems
by subjecting Watsa and the auditors of the business to a reinsurance
accounting probe. Fairfax not only rebounded from these setbacks but
also thrived: During the fi nancial crunch, Fairfax was one of the few
businesses that prospered. Book value grew by 53 percent in 2007, 21
percent in 2008, and 33 percent in 2009.
Philosophy and Style
Prem Watsa ’s investment philosophy is a contrarian long-term value-
oriented style focused on establishing positions at the maximum
pessimism point. A salient trait that propels him against the fl ow is a
thorough understanding of the fundamental value of positions. This
single-minded value approach gives him the strength to stay steadfast
even when the market tumbles. Another vital element that lets him stay
ahead of the curve is fl exibility, a valued lesson imparted by his men-
tor, John Templeton. Shorting was rejected initially, but was called upon
in the late 1980s to profi t from irrational market behavior. Likewise,
hedging was employed as a strategy in the late 1990s as a protection
against heightened tail risk; being prescient is trendy only if positions
are established to profi t from foreseen events.
Watsa looks for parabolic curves in asset pricing, as he considers
such patterns bubbly and without a happy ending. Hedges, if cheaply
available, are established to profi t from them. Over the years, Watsa
c13.indd 102c13.indd 102 27-05-2013 08:23:0027-05-2013 08:23:00
Prem Watsa 103
noticed such patterns in Internet stocks, commodities, housing, gold,
and so on, and profi ted by establishing hedges in some of them.
A major tail risk he is currently insuring against is the possibility of
defl ation in the United States; Watsa sees the current environment in
the United States as being similar to the conditions that prevailed
in the 1930s and also fi nds parallels to Japan from the early 1990s:
0 percent interest rates and 10 percent defi cits year after year.
In the insurance businesses, Watsa focuses fi rmly on the bottom
line. According to him, focusing on growth in the insurance business
is dangerous, for it is easy to grow by cutting price, and under reserv-
ing can go undetected for years. Unlike most other companies, there is
no growth target at all; performance is measured based on underwrit-
ing profi t and reserves. This approach allows the insurance subsidiaries
to shrink in a soft cycle and expand aggressively at other times while
meeting capital constraints. There are no layoff s during soft cycles.
When making acquisition decisions, Watsa is especially partial to
founder-run businesses. Acquired businesses are assured of a friendly
and permanent home. This philosophy is evident with current equity
allocations as well: Fairfax holds large positions in founder-run busi-
nesses such as BlackBerry (previously Research In Motion) and Dell
Inc. He believes the biggest determinant of a company ’s valuation is
its management ’s track record. His valuation theses for potential invest-
ments rely heavily on studying management track records.
Fairfax does not see an edge in consensus when it comes to investing
money. It allocates capital to each of its asset managers and gives them
the liberty to forge ahead with their own investment decisions. Watsa
considers consensus among managers as implying a minimal margin of
safety; when a company is analyzed heavily by the investment commu-
nity, it leaves no room for misconceptions to cause a margin of safety.
Marquee Trades
Prem Watsa ’s initial letter to shareholders in 1985 detailed an ambitious
long-term return objective of 20 percent on common shareholders’
equity. The initial strategy involved re-underwriting and repricing the
c13.indd 103c13.indd 103 27-05-2013 08:23:0027-05-2013 08:23:00
104 p r o f i t i n g f r o m h e d g e f u n d s
entire insurance business. Doing so initially resulted in large losses
and a huge reduction of the entire business. By Q3 1985, the strategy
showed promise; Watsa went against the grain and shrunk the business
even further by holding out for better premiums. The story unfurled
successfully the following year, as it reported a net income of $6.5 mil-
lion. What made it all the more spectacular was that the highest profi t
level Markel had ever achieved in its prior 12-year history was less than
a million.
Equity investments in the starting years were concentrated in the
natural resource, industrial, and banking sectors. The company realized
handsome gains from the portfolio, with signifi cant contributions from
Royal Bank, Princeton Mining, and Algoma Steel. In 1990, it posted a
realized gain of $2.4 million in Nikkei Puts as the Japanese stock mar-
ket declined by ~ 40 percent. Though the balance sheet had signifi cant
unrealized losses then, Watsa held onto them and converted most of
them into realized gains in the bull market that followed. Case in point
was a stake in Magna held at a cost basis of $6.8 million: In 1990, the
position had dwindled down to an unrealized loss of $3.2 million but,
within a year, it altered into a realized gain of $5.4 million.
The big winners of the late 1990s and early 2000s were positions
outside North America. A $200 million investment in the Korean
market (1998–99) fetched Fairfax more than $120 million in profi ts.
Likewise, Latin American stocks generated profi ts of ~$250 million in
2000. Over the years, Fairfax realized signifi cant gains from hedging
strategies: shorting Internet stocks via put contracts, purchasing put
bonds as a way to profi t from a fall in interest rates, S&P 500 Index
puts to profi t from a U.S. market crash, and short positions on indi-
vidual securities. The trade that towered over others came in 2008,
when Fairfax gathered a cumulative gain close to $2 billion from credit
default swaps that had an original acquisition cost in the neighborhood
of $270 million.
All things considered, Fairfax is a great model portfolio that details
how diversifi cation across asset classes along with a healthy dose of
hedging can help harvest gains constantly. Gains are reaped by liqui-
dating the outperforming positions, even though other parts of the
portfolio may be showing unrealized losses. When those underper-
forming positions turn robust in their turn, usually with a shift in
c13.indd 104c13.indd 104 27-05-2013 08:23:0027-05-2013 08:23:00
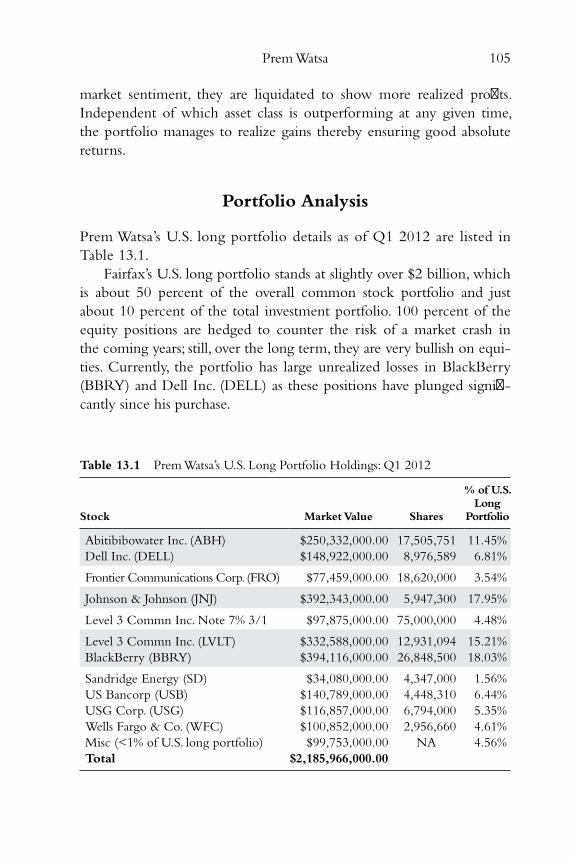
Prem Watsa 105
market sentiment, they are liquidated to show more realized profi ts.
Independent of which asset class is outperforming at any given time,
the portfolio manages to realize gains thereby ensuring good absolute
returns.
Portfolio Analysis
Prem Watsa ’s U.S. long portfolio details as of Q1 2012 are listed in
Table 13.1 .
Fairfax ’s U.S. long portfolio stands at slightly over $2 billion, which
is about 50 percent of the overall common stock portfolio and just
about 10 percent of the total investment portfolio. 100 percent of the
equity positions are hedged to counter the risk of a market crash in
the coming years; still, over the long term, they are very bullish on equi-
ties. Currently, the portfolio has large unrealized losses in BlackBerry
(BBRY) and Dell Inc. (DELL) as these positions have plunged signifi -
cantly since his purchase.
Table 13.1 Prem Watsa’s U.S. Long Portfolio Holdings: Q1 2012
Stock Market Value Shares
% of U.S. Long
Portfolio
Abitibibowater Inc. (ABH) $250,332,000.00 17,505,751 11.45%
Dell Inc. (DELL) $148,922,000.00 8,976,589 6.81%
Frontier Communications Corp. (FRO) $77,459,000.00 18,620,000 3.54%
Johnson & Johnson (JNJ) $392,343,000.00 5,947,300 17.95%
Level 3 Commn Inc. Note 7% 3/1 $97,875,000.00 75,000,000 4.48%
Level 3 Commn Inc. (LVLT) $332,588,000.00 12,931,094 15.21%
BlackBerry (BBRY) $394,116,000.00 26,848,500 18.03%
Sandridge Energy (SD) $34,080,000.00 4,347,000 1.56%
US Bancorp (USB) $140,789,000.00 4,448,310 6.44%
USG Corp. (USG) $116,857,000.00 6,794,000 5.35%
Wells Fargo & Co. (WFC) $100,852,000.00 2,956,660 4.61%
Misc (<1% of U.S. long portfolio) $99,753,000.00 NA 4.56%
Total $2,185,966,000.00
c13.indd 105c13.indd 105 27-05-2013 08:23:0027-05-2013 08:23:00
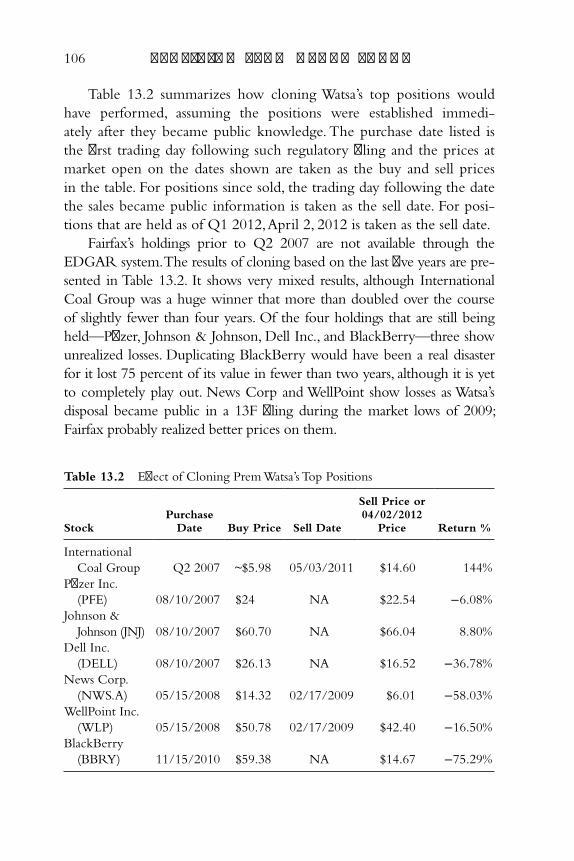
106 p r o f i t i n g f r o m h e d g e f u n d s
Table 13.2 summarizes how cloning Watsa ’s top positions would
have performed, assuming the positions were established immedi-
ately after they became public knowledge. The purchase date listed is
the fi rst trading day following such regulatory fi ling and the prices at
market open on the dates shown are taken as the buy and sell prices
in the table. For positions since sold, the trading day following the date
the sales became public information is taken as the sell date. For posi-
tions that are held as of Q1 2012, April 2, 2012 is taken as the sell date.
Fairfax ’s holdings prior to Q2 2007 are not available through the
EDGAR system. The results of cloning based on the last fi ve years are pre-
sented in Table 13.2 . It shows very mixed results, although International
Coal Group was a huge winner that more than doubled over the course
of slightly fewer than four years. Of the four holdings that are still being
held—Pfi zer, Johnson & Johnson, Dell Inc., and BlackBerry—three show
unrealized losses. Duplicating BlackBerry would have been a real disaster
for it lost 75 percent of its value in fewer than two years, although it is yet
to completely play out. News Corp and WellPoint show losses as Watsa ’s
disposal became public in a 13F fi ling during the market lows of 2009;
Fairfax probably realized better prices on them.
Table 13.2 Eff ect of Cloning Prem Watsa’s Top Positions
Stock Purchase
Date Buy Price Sell Date
Sell Price or 04/02/2012
Price Return %
International
Coal Group Q2 2007 ~$5.98 05/03/2011 $14.60 144%
Pfi zer Inc.
(PFE) 08/10/2007 $24 NA $22.54 −6.08%
Johnson &
Johnson (JNJ) 08/10/2007 $60.70 NA $66.04 8.80%
Dell Inc.
(DELL) 08/10/2007 $26.13 NA $16.52 −36.78%
News Corp.
(NWS.A) 05/15/2008 $14.32 02/17/2009 $6.01 −58.03%
WellPoint Inc.
(WLP) 05/15/2008 $50.78 02/17/2009 $42.40 −16.50%
BlackBerry
(BBRY) 11/15/2010 $59.38 NA $14.67 −75.29%
c13.indd 106c13.indd 106 27-05-2013 08:23:0027-05-2013 08:23:00

Prem Watsa 107
Overall, cloning Watsa ’s portfolio is a good option, in spite of the
fact that the results from the limited data set are mixed so far. He is
very patient and holds positions for extended periods, giving time for
his theses to play out. His long-term value-oriented style is also very
conducive to cloning.
Notes
1. Prem Watsa, “Ben Graham Value Investing Conference,” Richard Ivey School
of Business, Ontario, 02/16/2011, www.bengrahaminvesting.ca/Resources/
Video_Presentations/Guest_Speakers/2011/Watsa_2011.htm.
2. John Reese, “Prem Watsa ’s Stock Picking Aces the Guru Test,” the Globe and
Mail , 06/11/2012, www.theglobeandmail.com/globe-investor/investment-
ideas/prem-watsas-stock-picking-aces-the-guru-test/article4249305.
3. Prem Watsa, “End of Year Letter to Shareholders,” Fairfax Financial Holdings
Limited, 2011.
4. Debbie Baratz,“Fairfax ’s Watsa Moves Forward with $8 Billion Lawsuit,”
ValueWalk, 07/03/2012, www.valuewalk.com/2012/07/fairfaxs-watsa-moves-
forward-with-8-billion-lawsuit.
c13.indd 107c13.indd 107 27-05-2013 08:23:0027-05-2013 08:23:00

c13.indd 108c13.indd 108 27-05-2013 08:23:0027-05-2013 08:23:00

Part Two
MECHANICAL APPROACHES
TO FOLLOWING THE MASTERS
c14.indd 109c14.indd 109 27-05-2013 12:21:5727-05-2013 12:21:57

c14.indd 110c14.indd 110 27-05-2013 12:21:5727-05-2013 12:21:57
111
Chapter 14
Introduction
The evaluation of an eclectic selection of the best fund managers
in the fi rst part of this book introduced a varied number of
investment styles and philosophies. The study substantiated
that, no matter the game plan, the best practitioners are extremely suc-
cessful over the long haul. This section gets into the nuts and bolts of the
next logical step: how to construct mechanically cloned portfolios that
are highly likely to outperform the market. Individual investors, even
those who have absolutely no interest in analyzing businesses or actively
making buy/sell/hold decisions, stand to benefi t immensely from this
approach, for they too can play the fi eld with a fair chance of success.
Research has categorically established that cloning based on dis-
closed positions of active fund managers is a very viable strategy for
individual investors:
• Massachusetts Institute of Technology Department of Economics
in 2000 concluded that copycat funds have the potential to gen-
erate returns comparable to the primitive funds they are designed
c14.indd 111c14.indd 111 27-05-2013 12:21:5727-05-2013 12:21:57
112 p r o f i t i n g f r o m h e d g e f u n d s
to mimic. This research was based on a broad sample of diversifi ed
U.S. equity mutual fund data from 1992 to 1999. 1
• Erasmus University in 2010 analyzed the performance of imper-
sonator funds and their performance characteristics twice, before
and after the 2004 SEC regulation that increased the mandatory
reporting frequency of mutual fund holdings from semiannually to
quarterly. 2 Their conclusion was that portfolio disclosure was costly
to actively managed funds; mimicking portfolios in spite of the lag
was a boon to competitors. The fact that the copycat funds not
only enjoyed elevated performance but also actually managed to
outperform their target funds in both timeframes was a real kicker.
Also, recent performance of the source portfolios was indicative of
imitating being more successful.
• The combined eff orts of three individuals from Harvard Business
School, the London School of Economics, and the Universitat
Pompeu Fabra in 2010 confi rmed that the best ideas of the active
fund managers outperformed the market. 3 They recognized over-
diversifi cation as the cause of poor overall performance of fund
managers, not a lack of stock-picking skills. In essence, the odds
are high for a portfolio based on the best ideas of a selected set of
active fund managers to outperform the market indexes.
• The research project of Mazin Jadallah (founder and CEO of
AlphaClone) yielded impressive results with mechanical cloning
strategies: The project studied the eff ects of lag on mechanically
cloned portfolios and established that a signifi cant portion of them
outperformed the S&P 500 index. 4 Since 2000, two-thirds out-
performed the market and nearly half outdid the same by over 4
percent. The research stamped its approval on mechanically cloned
portfolios outperforming the market indexes. AlphaClone was thus
set up to pursue such strategies.
A word of caution is not amiss here: Cloning some of the top posi-
tions of the managers on an ad-hoc basis does not guarantee superior
returns. The results of cloning presented in Part One for each of the
masters are a testimony to that. The glaring limitations that exist with
the ad-hoc method of cloning are:
• Manager selection is an often overlooked critical factor when con-
structing a mechanically cloned portfolio. As the examples in the
c14.indd 112c14.indd 112 27-05-2013 12:21:5727-05-2013 12:21:57
Introduction 113
earlier section showed, being blindsided by the might of a great
manager whose style is not conducive to cloning does not make
for good returns.
• The ad-hoc approach has no calculation guidelines to determine
how much to allocate for each selection. An asset allocation strat-
egy is an absolute requirement when attempting to clone.
• The manager ’s current sentiment is not captured when replicat-
ing top positions. As most managers build positions in phases, by
the time a position is identifi ed as an ideal cloning candidate based
on size, the average purchase prices the manager achieved might
be very diff erent from the purchase price of the cloned position.
Understanding the manager ’s sentiment is an important consider-
ation when cloning positions mechanically.
These limitations need to be addressed to construct model portfo-
lios with great return potential.
Manager Selection
Academic research provides pointers on choosing and cloning money
managers successfully:
• The American University and the University of Nevada tracked
Warren Buff ett ’s Berkshire Hathaway from 1976 to 2006. 5 They
analyzed the behavior of a portfolio that mimicked the investments
following their public disclosure at the beginning of the subse-
quent month. To say the fi ndings were amazing is putting it mildly.
Over that time period, when Berkshire Hathaway outperformed
the S&P 500 index by an outstanding 11.4 percent, the cloned
portfolio lagged its original only slightly, and managed to outper-
form the S&P 500 index by a striking 10.75 percent.
• Mebane Faber and Eric Richardson presented case studies of
cloning Berkshire Hathaway, Greenlight Capital, and Blue Ridge
Capital, using a very simple mechanical strategy in their book
The Ivy Portfolio. 6 The studies focused on the period from 2000 to
2008, when the S&P 500 had a dismal annualized return of nega-
tive 3.5 percent. The emulated portfolios, on the other hand, not
only outdid the S&P 500 by signifi cant margins, but also exhibited
c14.indd 113c14.indd 113 27-05-2013 12:21:5727-05-2013 12:21:57
114 p r o f i t i n g f r o m h e d g e f u n d s
handsome annualized positive returns: 6.48 percent for Berkshire
Hathaway, 12.58 percent for Greenlight Capital, and 3.5 percent
for Blue Ridge Capital. Although the case studies probably picked
the best performing portfolios from a larger set of money manag-
ers, it does indicate the strong potential for outpacing with certain
fund manager portfolios. It is also signifi cant that all three of these
case studies involved value-oriented managers.
• A University of Toledo research paper (March 2012) probed the
existence of hedge fund herding. 7 The widely held notion is that
hedge funds destabilize markets by excessive trading and by engag-
ing in herding. The primary conclusion of the paper contradicted
such beliefs: Hedge funds were less likely to herd, momentum
trade, and so on, compared to non-hedge–fund institutions. Their
fi nding, when the aggregate institutional demand for a security
increases the returns on them from then on decreases, highlights
the fact that unlike most other professions, seeking consensus for
an investment pick is not a good thing. Investors looking to clone
need to be cognizant of this relevant fact—no matter how tempt-
ing it is to take comfort in the numbers, that security could be a
recipe for underperformance. The study also found disparity in the
data from hedge funds and non-hedge–fund institutions: increase
in hedge fund demand forecasted good returns while increase in
non-hedge–fund demand forecasted poor returns. This outcome
endorses the need for being very careful with manager selection.
• A University of Maryland Department of Finance case study
(2003) showcased replication in a very bullish manner by establish-
ing money as smart in chasing winning managers and mimicking
the trades of such fund managers as a smart strategy. 8 A key part
of the research probed the persistent nature of the performance of
successful managers. Surprisingly, this was tied to both consumer
and manager behavior—consumers by chasing previous year ’s
winning funds and the managers, in their turn, by investing those
infl ows into momentum stocks causing them to spike in value. The
fi ndings led many to question whether manager talent was the rea-
son for the winning stock picks. This brought to light the risk of
cloning managers with good recent performance: The strategy can
be very successful over the short term, but whether the outperfor-
mance will endure is a game of chance.
c14.indd 114c14.indd 114 27-05-2013 12:21:5727-05-2013 12:21:57
Introduction 115
• An Arizona State University research paper (2011) explored why
hedge funds avoided disclosure as far as possible by using 13F con-
fi dential treatment requests. 9 The study confi rmed that managers
sought confi dentiality treatment to protect their research, which
inevitably helps to create market-beating returns. Also, it is a tactic
by which managers avoid front running by other investors. Front
running involves anticipating a fund ’s trades then trading against
it. The fact that the undisclosed positions earn good returns over
the confi dentiality treatment period is very relevant for those into
cloning.
• Commercial databases track the performance of the hedge fund
universe and provide information mined from their 13F fi lings.
The overall performance of the hedge fund industry is shown in
a favorable light in these databases. Studies have stressed that this
reputable act has to do more with reporting biases than the hedge
fund managers as a whole being more skillful stock pickers com-
pared to other investors. A study by the fi nance departments of
Quinnipiac University, University of Kentucky, and University
of Alabama examined the eff ects of selection bias and also the
eff ect of funds that stopped reporting (delisted and/or dead
funds). 10 The outcome was that the funds that chose to report to
commercial databases outperform those that do not. This is espe-
cially true with delisted funds, whose performance is worse than
the funds that continue reporting. Another paper on the same
theme by Burton G. Malkiel of Princeton University and Atanu
Saha of Analysis Group focused on the eff ects of backfi ll bias and
survivorship bias on reported overall hedge fund returns. 11 Backfi ll
bias is the tendency of managers to report previous returns only
if they are favorable, while survivorship bias is based on the fact
that the underperforming hedge funds eventually die out with-
out fi nding a place in the database. The study concluded that
both backfi ll bias and survivorship bias result in reported results
being signifi cantly better than what would have been otherwise,
and that there is substantial risk of selecting a dismally perform-
ing fund. Strategies that attempt to follow the performance of the
hedge fund world are to be used only with caution. For clon-
ing to succeed, it is imperative to be selective when it comes to
picking managers.
c14.indd 115c14.indd 115 27-05-2013 12:21:5727-05-2013 12:21:57
116 p r o f i t i n g f r o m h e d g e f u n d s
From the manager profi les in Part One , it is easy to fi nd the better
managers to shadow:
• Core value managers are the cream of the crop when it comes to
mechanical cloning. Their stock picks are backed by solid bottom-
up research, and they are inclined toward holding tight to their
positions for extended periods of time.
• Managers with a sizable stake in the U.S. markets rank higher in
the preferred list. The 13F holdings disclosed every quarter contain
only the U.S. listed positions and ADRs. Shadowing managers who
invest primarily outside the United States will result in a portfolio
with little bearing on the manager ’s overall portfolio.
• Managers who employ long positions as hedges are not user
friendly when it comes to cloning. With a mechanical cloning
strategy against such manager portfolios, it is impossible to distin-
guish a hedged long position from a position established based on
pure bottom-up valuation research.
• Managers focused on distressed securities are best avoided. By their
very nature, their investment philosophy mandates most of their
positions to be in companies that are either in bankruptcy or on
their way to being so. It is quite normal for them to be messing with
debt positions or securities that are no longer traded. Obviously,
positions that are not mentioned in 13F fi lings are not easily cloned.
Even those that are reported carry a lot of risk. Furthermore,
these positions are usually held in combination with senior debt
holdings—the debt holdings do not make it to the 13F, leaving
mimicking such positions beyond the reach of individual investors.
• Managers who invest mostly in nonpublicly traded securities
should be excluded. The 13F reports will contain no information
on such holdings, rendering cloning impractical.
• Managers focused on turnaround opportunities and other event-
driven prospects are complicated candidates. Their positions are
relatively riskier with no guarantee for success. Moreover, timing is
critical and the chances are great that followers will fi nish off with
a higher cost basis when entering, and lower realized values when
exiting, compared to the manager.
• Managers focused on market neutral trading strategies are best
left alone. The strategies to achieve market neutrality involve a
c14.indd 116c14.indd 116 27-05-2013 12:21:5827-05-2013 12:21:58
Introduction 117
combination of long and short positions. The short positions are
not reported in 13F fi lings, making it impossible to mimic the
complete trade using that information. Timing is a key to pairs
trading, so 13F information on even the long portion of the posi-
tions will be out of date because of the 45-day minimum delay
before positions become public through 13F fi lings.
• Quant fund managers are best given a miss. For the most part, the
information reported by Quant funds through 13F fi lings is out-
dated, overwhelming, and irrelevant. The computer models usually
result in scores of trading and several open positions at any given
point. The 13F fi lings will be chock full of positions that are not
of any real value; for, by then, these positions will already be liqui-
dated and replaced with others.
• Risk optimized managers are best avoided. Managers who focus on
risk optimized strategies are not bounded by U.S. long positions,
making only a portion of their holdings appear in the 13F fi lings.
Risk optimized strategies are eff ective only when the entire portfo-
lio is lifted, complete to the percentage allocation to each position.
Cloning the whole portfolio is a futile task, as the public is aware of
only a portion of the overall portfolio.
• Managers without a long-term track record but with good recent
performance need time to mature. Evidence points to recently suc-
cessful managers being able to maintain their victory run only for
some period. That triumph is attributed more towards customer
and manager behavior rather than investing skills. In short, cloning
such managers likely results in only a chance for short-term success.
Picking managers to clone is more art than science. For the less
creatively inclined, research chips in with helpful clues that allow easy
elimination of managers whose philosophies and style do not lend to
replicating. From the 12 managers profi led in Part One , the following
three were selected as they have characteristics conducive to cloning:
• Bill Ackman : Majority of Ackman ’s positions are, at any given
time, accessible to the public via his 13Fs. Moreover, his activist
investment style tends to favor disclosing positions.
• Warren Buff ett : Some of Buff ett ’s big positions are forever.
A majority of his other positions are long term in nature. His
c14.indd 117c14.indd 117 27-05-2013 12:21:5827-05-2013 12:21:58
118 p r o f i t i n g f r o m h e d g e f u n d s
portfolio is concentrated with the investments guaranteed to have a
margin of safety. All sought-after values!
• David Einhorn : Although Einhorn runs a long/short portfo-
lio with only the long positions featuring in 13F fi lings, per his
research, each long holding is ensured to possess favorable risk-
reward characteristics. Here also, it is a concentrated portfolio with
lengthy holding periods. His overall philosophy and style makes
duplicating a feasible strategy.
The picks are heavily tilted in favor of value-oriented managers
who use bottom-up stock selection.
Bruce Berkowitz is a true value investor who tends to maintain
positions for extended periods of time, a highly esteemed feature when
it comes to cloning. However, his portfolio was not considered, as he
has several specialized mutual funds with the combined picks showing
up in the 13Fs. Ian Cumming and Joseph Steinberg ’s portfolio did not
make the cut, as a majority of their investments are not publicly traded
and hence not reported in their 13F fi lings. Carl Icahn ’s portfolio lost
out, as he specializes in the rather risky area of turnarounds; his cost
basis on many of his positions is unachievable for followers. The min-
ute his stake becomes public, the market would have adjusted to refl ect
the new circumstances. Seth Klarman operates in the bottom-up value
fi eld, which is exactly what the doctor ordered. However, his portfolio
was not selected, as his secretive nature avoids disclosing positions as far
as possible, and because his U.S. long portfolio allocation is very small.
A mimicked portfolio based on his 13Fs would capture the performance
of only a small portion of his overall portfolio. John Paulson ’s portfolio
was excluded, as his expertise is in risk arbitrage. The recent big returns
in his portfolio are from positions outside the scope of 13Fs. Wilbur
Ross did not qualify, as his positions are primarily established during
bankruptcies and hence do not make it to the 13Fs. George Soros ’s
trend trading based on boom-bust cycles is heavily dependent on tim-
ing. Such strategies are diffi cult to shadow, given the 45-day mini-
mum reporting delay for the 13Fs. David Swensen ’s portfolio was not
included as his 13F holdings, which are only a very small part of his
overall portfolio, is not representative of Swensen ’s bias. Although Prem
Watsa ’s long-term value-oriented style is very conducive to cloning, his
c14.indd 118c14.indd 118 27-05-2013 12:21:5827-05-2013 12:21:58
Introduction 119
portfolio was not chosen, as he relies on extensive hedging strategies,
which are generally not included in the 13F fi lings.
The next three chapters will look into the selected manager ’s
13F holdings history to construct, maintain, and analyze mechanically
cloned portfolios.
Asset Allocation and Sentiment Capture
After manager selection, the essential building blocks to constructing a
mechanically cloned portfolio with good return potential are asset allo-
cation plans and sentiment capture choices.
• Asset allocation plans deal with mechanically splitting portfolio assets
among the securities picked by a manager. Zeroing in on a particu-
lar plan is more about assessing the strengths and weaknesses of each
choice and deciding on the best option for a particular situation.
• Sentiment capture involves mechanically selecting a determined
number of positions from a manager ’s portfolio that refl ect, as
accurately as possible, his thought process. Here, too, there exists
a few diff erent options and again it is a question of deciding what
works best for a specifi c situation.
Below are the three most common allocation choices that cover
the gamut:
• Equal allocation : Here, each component of the portfolio receives
equal attention—the same amount is invested in each. If fi ve secu-
rities are involved and the capital is $50,000, then they receive
$10,000 each. Though implementation is easiest for this approach,
its fl aw is that it fails to seize the manager ’s relative conviction
(high conviction picks in the source portfolio will have higher per-
centage allocation and vice-versa but the model will not refl ect
this) among the picks.
• Weighted allocation : Positions with deeper conviction are given
higher percentage allocation and vice-versa. The conviction level is
gauged by the size of the position relative to the manager ’s overall
13F portfolio size.
c14.indd 119c14.indd 119 27-05-2013 12:21:5827-05-2013 12:21:58
120 p r o f i t i n g f r o m h e d g e f u n d s
• 10–5–2 allocation : Based on their size in the source portfolio, the
mechanically cloned portfolio picks are given a fi xed weightage.
The method targets to refl ect the allocation style of certain man-
agers: a very small number of highest conviction positions (over
10 percent), an average number of large high conviction posi-
tions (over 5 percent), and the rest in smaller positions (less than
2 percent).
Two of the most popular sentiment capture choices follow.
• Top holdings (largest positions) : The focus here is on the
manager ’s largest positions. Technically, this strategy succeeds in
capturing the manager ’s highest convictions but stops short of
refl ecting the manager ’s current bias. Some managers remain loyal
to their core holdings even during overvaluation on the premise
they will come out ahead in the long haul; worthwhile compa-
nies capable of continuing their healthy growth rates make this
overvaluation temporary. The core positions are usually the larg-
est holdings in a portfolio, so this cloning model can at times pick
overvalued stocks.
• Best ideas (largest new positions) : The manager ’s largest new
positions are shadowed here. On the upside, it successfully captures
the manager ’s current sentiment, but these positions have to be con-
stantly updated; they will have to be traded in and out based on
every subsequent 13F. Money managers generally exercise patience
and abstain from diving into a position all at once; the new additions
are usually only a percentage of their eventual stakes. These models
capture this style well. However, some value-oriented managers are
notorious for nibbling at new positions, only to dispose of them a
few quarters later. In such cases, the model captures only the noise.
It should also be remembered that this model sidesteps the manager ’s
large long positions that form the core of the portfolio.
A third sentiment capture model selects the most popular posi-
tions from among a set of managers that are followed. The model
goes against the rule: Seeking consensus is not desirable when pursu-
ing good returns. Since the strength is in numbers, numerous managers
will need to be followed to be able to construct a meaningful portfolio
c14.indd 120c14.indd 120 27-05-2013 12:21:5827-05-2013 12:21:58
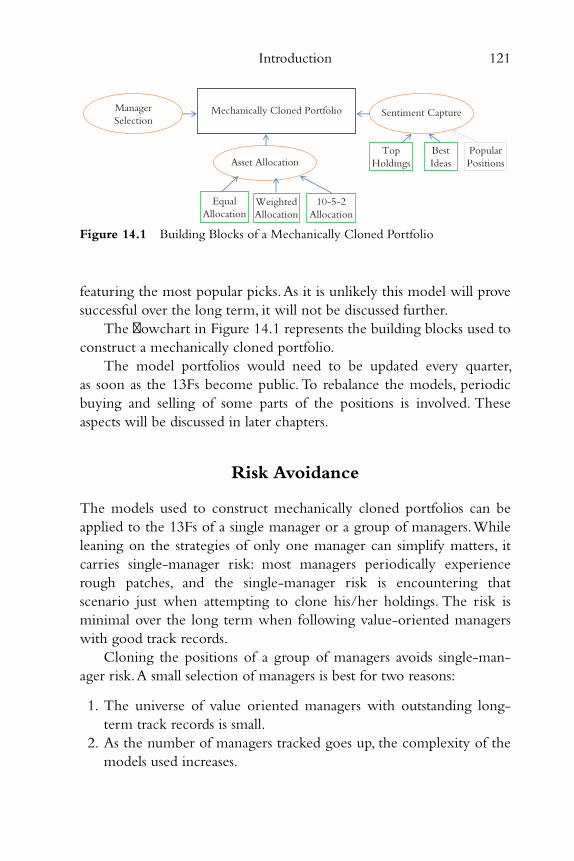
Introduction 121
featuring the most popular picks. As it is unlikely this model will prove
successful over the long term, it will not be discussed further.
The fl owchart in Figure 14.1 represents the building blocks used to
construct a mechanically cloned portfolio.
The model portfolios would need to be updated every quarter,
as soon as the 13Fs become public. To rebalance the models, periodic
buying and selling of some parts of the positions is involved. These
aspects will be discussed in later chapters.
Risk Avoidance
The models used to construct mechanically cloned portfolios can be
applied to the 13Fs of a single manager or a group of managers. While
leaning on the strategies of only one manager can simplify matters, it
carries single-manager risk: most managers periodically experience
rough patches, and the single-manager risk is encountering that
scenario just when attempting to clone his/her holdings. The risk is
minimal over the long term when following value-oriented managers
with good track records.
Cloning the positions of a group of managers avoids single-man-
ager risk. A small selection of managers is best for two reasons:
1. The universe of value oriented managers with outstanding long-
term track records is small.
2. As the number of managers tracked goes up, the complexity of the
models used increases.
Figure 14.1 Building Blocks of a Mechanically Cloned Portfolio
Mechanically Cloned PortfolioManager
Selection
Asset Allocation
Sentiment Capture
Equal
Allocation
Weighted
Allocation
10-5-2
Allocation
Top
Holdings
Best
Ideas
Popular
Positions
c14.indd 121c14.indd 121 27-05-2013 12:21:5827-05-2013 12:21:58
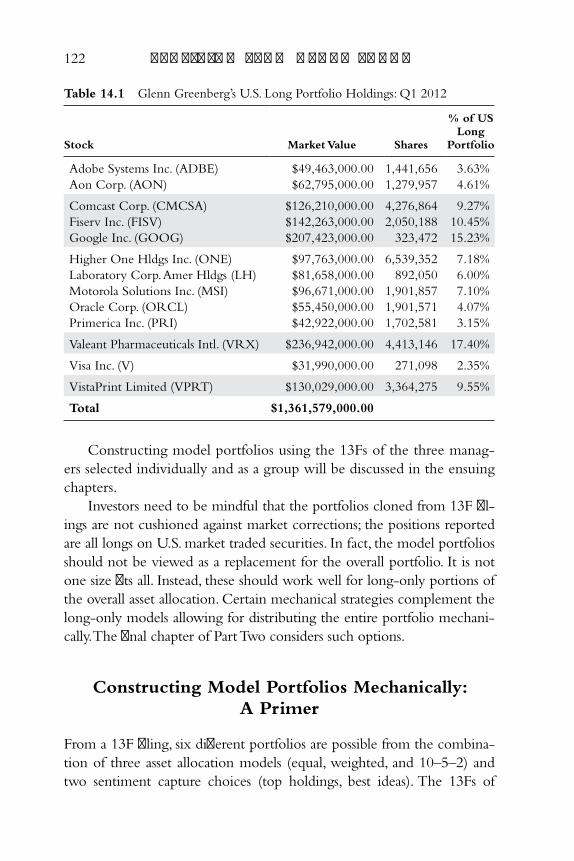
122 p r o f i t i n g f r o m h e d g e f u n d s
Constructing model portfolios using the 13Fs of the three manag-
ers selected individually and as a group will be discussed in the ensuing
chapters.
Investors need to be mindful that the portfolios cloned from 13F fi l-
ings are not cushioned against market corrections; the positions reported
are all longs on U.S. market traded securities. In fact, the model portfolios
should not be viewed as a replacement for the overall portfolio. It is not
one size fi ts all. Instead, these should work well for long-only portions of
the overall asset allocation. Certain mechanical strategies complement the
long-only models allowing for distributing the entire portfolio mechani-
cally. The fi nal chapter of Part Two considers such options.
Constructing Model Portfolios Mechanically:
A Primer
From a 13F fi ling, six diff erent portfolios are possible from the combina-
tion of three asset allocation models (equal, weighted, and 10–5–2) and
two sentiment capture choices (top holdings, best ideas). The 13Fs of
Table 14.1 Glenn Greenberg’s U.S. Long Portfolio Holdings: Q1 2012
Stock Market Value Shares
% of US Long
Portfolio
Adobe Systems Inc. (ADBE) $49,463,000.00 1,441,656 3.63%
Aon Corp. (AON) $62,795,000.00 1,279,957 4.61%
Comcast Corp. (CMCSA) $126,210,000.00 4,276,864 9.27%
Fiserv Inc. (FISV) $142,263,000.00 2,050,188 10.45%
Google Inc. (GOOG) $207,423,000.00 323,472 15.23%
Higher One Hldgs Inc. (ONE) $97,763,000.00 6,539,352 7.18%
Laboratory Corp. Amer Hldgs (LH) $81,658,000.00 892,050 6.00%
Motorola Solutions Inc. (MSI) $96,671,000.00 1,901,857 7.10%
Oracle Corp. (ORCL) $55,450,000.00 1,901,571 4.07%
Primerica Inc. (PRI) $42,922,000.00 1,702,581 3.15%
Valeant Pharmaceuticals Intl. (VRX) $236,942,000.00 4,413,146 17.40%
Visa Inc. (V) $31,990,000.00 271,098 2.35%
VistaPrint Limited (VPRT) $130,029,000.00 3,364,275 9.55%
Total $1,361,579,000.00
c14.indd 122c14.indd 122 27-05-2013 12:21:5827-05-2013 12:21:58
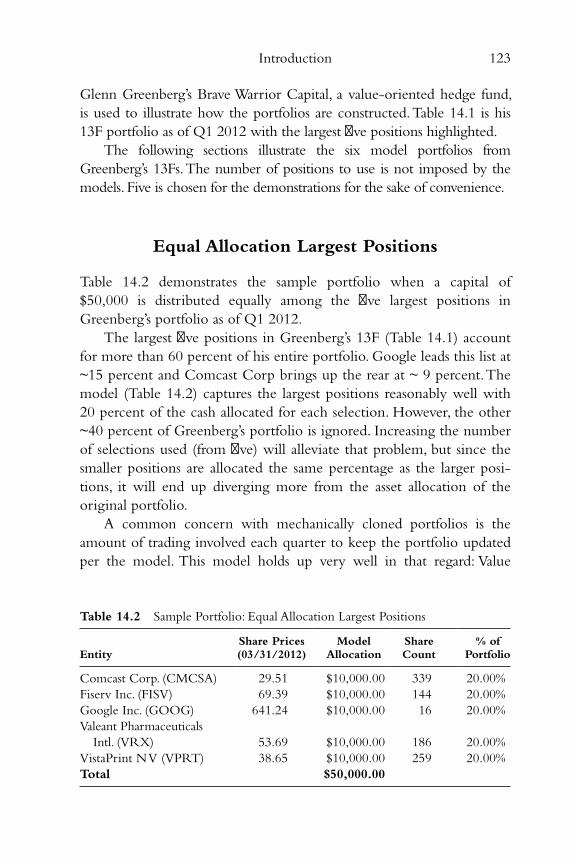
Introduction 123
Glenn Greenberg ’s Brave Warrior Capital, a value-oriented hedge fund,
is used to illustrate how the portfolios are constructed. Table 14.1 is his
13F portfolio as of Q1 2012 with the largest fi ve positions highlighted.
The following sections illustrate the six model portfolios from
Greenberg ’s 13Fs. The number of positions to use is not imposed by the
models. Five is chosen for the demonstrations for the sake of convenience.
Equal Allocation Largest Positions
Table 14.2 demonstrates the sample portfolio when a capital of
$50,000 is distributed equally among the fi ve largest positions in
Greenberg ’s portfolio as of Q1 2012.
The largest fi ve positions in Greenberg ’s 13F (Table 14.1 ) account
for more than 60 percent of his entire portfolio. Google leads this list at
~15 percent and Comcast Corp brings up the rear at ~ 9 percent. The
model (Table 14.2 ) captures the largest positions reasonably well with
20 percent of the cash allocated for each selection. However, the other
~40 percent of Greenberg ’s portfolio is ignored. Increasing the number
of selections used (from fi ve) will alleviate that problem, but since the
smaller positions are allocated the same percentage as the larger posi-
tions, it will end up diverging more from the asset allocation of the
original portfolio.
A common concern with mechanically cloned portfolios is the
amount of trading involved each quarter to keep the portfolio updated
per the model. This model holds up very well in that regard: Value
Table 14.2 Sample Portfolio: Equal Allocation Largest Positions
Entity Share Prices (03/31/2012)
Model Allocation
Share Count
% of Portfolio
Comcast Corp. (CMCSA) 29.51 $10,000.00 339 20.00%
Fiserv Inc. (FISV) 69.39 $10,000.00 144 20.00%
Google Inc. (GOOG) 641.24 $10,000.00 16 20.00%
Valeant Pharmaceuticals
Intl. (VRX) 53.69 $10,000.00 186 20.00%
VistaPrint N V (VPRT) 38.65 $10,000.00 259 20.00%
Total $50,000.00
c14.indd 123c14.indd 123 27-05-2013 12:21:5827-05-2013 12:21:58
124 p r o f i t i n g f r o m h e d g e f u n d s
managers are generally not into frequent trading, so their largest posi-
tions usually remain static. The trading requirement for Q1 2012 was
just one buy/sell transaction to get the model updated from Q4 2011—
Motorola Solutions had to be replaced with VistaPrint.
Overall, the model is very satisfactory when used against value
manager portfolios that keep concentrated positions.
Equal Allocation Largest New Positions
Table 14.3 indicates the alterations to Greenberg ’s portfolio from Q4
2011 to Q1 2012 and highlights the largest fi ve additions (Data source:
13Fs for those two quarters). The model consists of the highlighted fi ve
rows with the $50,000 capital equally distributed.
The model succeeds in capturing the manager ’s sentiment, as all of
the signifi cant additions during the quarter are included. Greenberg ’s
highest conviction position (Table 14.1 ), Valeant Pharmaceuticals, is a
no-show, as it is not among the largest new purchases. Oracle Corpo-
ration, a position doubled as of Q1 2012, persevered. Although the
stake is only 4 percent, the model picked up the manager ’s bullish
sentiment.
A certain level of trading is involved to keep the portfolio updated
on a quarterly basis: Per Greenberg ’s new additions for Q4 2011,
the portfolio would have had Adobe Systems, Oracle Corporation,
Primerica, Valeant Pharmaceuticals, and VistaPrint. In Q1 2012, the
stakes of Oracle and VistaPrint were increased signifi cantly, allow-
ing them to retain their presence in the model. The other three
positions were liquidated to make room for Google, Higher One, and
Laboratory Corp.
Weighted Allocation Largest Positions
The model uses the top fi ve positions highlighted in Table 14.1 but,
instead of allocating each pick $10,000, position sizing aims to approx-
imate the manager ’s allocation in a mechanical fashion. Cloning
becomes exact if positions are established to mimic the manager ’s posi-
tion and its size in the same ratio as it appears in his 13F.
c14.indd 124c14.indd 124 27-05-2013 12:21:5827-05-2013 12:21:58
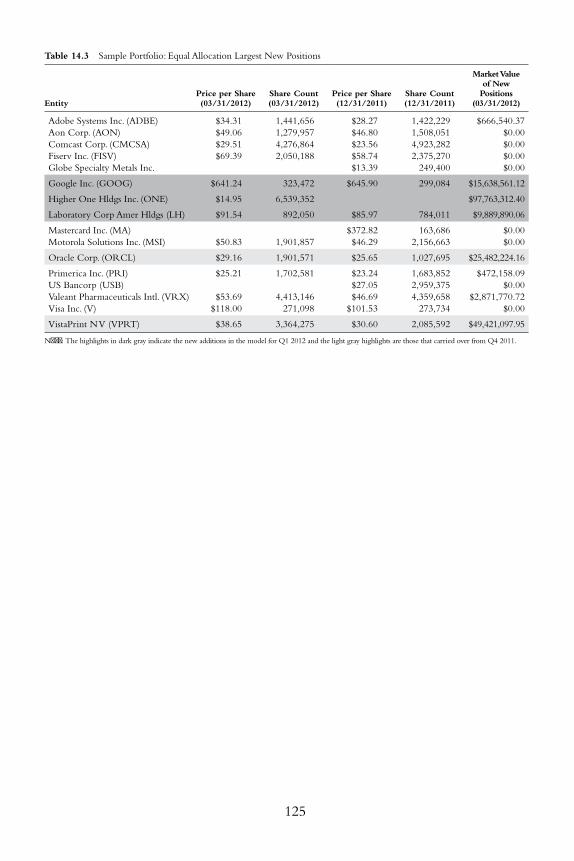
125
Table 14.3 Sample Portfolio: Equal Allocation Largest New Positions
Entity Price per Share (03/31/2012)
Share Count (03/31/2012)
Price per Share (12/31/2011)
Share Count (12/31/2011)
Market Value of New Positions
(03/31/2012)
Adobe Systems Inc. (ADBE) $34.31 1,441,656 $28.27 1,422,229 $666,540.37
Aon Corp. (AON) $49.06 1,279,957 $46.80 1,508,051 $0.00
Comcast Corp. (CMCSA) $29.51 4,276,864 $23.56 4,923,282 $0.00
Fiserv Inc. (FISV) $69.39 2,050,188 $58.74 2,375,270 $0.00
Globe Specialty Metals Inc. $13.39 249,400 $0.00
Google Inc. (GOOG) $641.24 323,472 $645.90 299,084 $15,638,561.12
Higher One Hldgs Inc. (ONE) $14.95 6,539,352 $97,763,312.40
Laboratory Corp Amer Hldgs (LH) $91.54 892,050 $85.97 784,011 $9,889,890.06
Mastercard Inc. (MA) $372.82 163,686 $0.00
Motorola Solutions Inc. (MSI) $50.83 1,901,857 $46.29 2,156,663 $0.00
Oracle Corp. (ORCL) $29.16 1,901,571 $25.65 1,027,695 $25,482,224.16
Primerica Inc. (PRI) $25.21 1,702,581 $23.24 1,683,852 $472,158.09
US Bancorp (USB) $27.05 2,959,375 $0.00
Valeant Pharmaceuticals Intl. (VRX) $53.69 4,413,146 $46.69 4,359,658 $2,871,770.72
Visa Inc. (V) $118.00 271,098 $101.53 273,734 $0.00
VistaPrint N V (VPRT) $38.65 3,364,275 $30.60 2,085,592 $49,421,097.95
Note: The highlights in dark gray indicate the new additions in the model for Q1 2012 and the light gray highlights are those that carried over from Q4 2011.
c14.indd 125c14.indd 125 27-05-2013 12:21:5827-05-2013 12:21:58
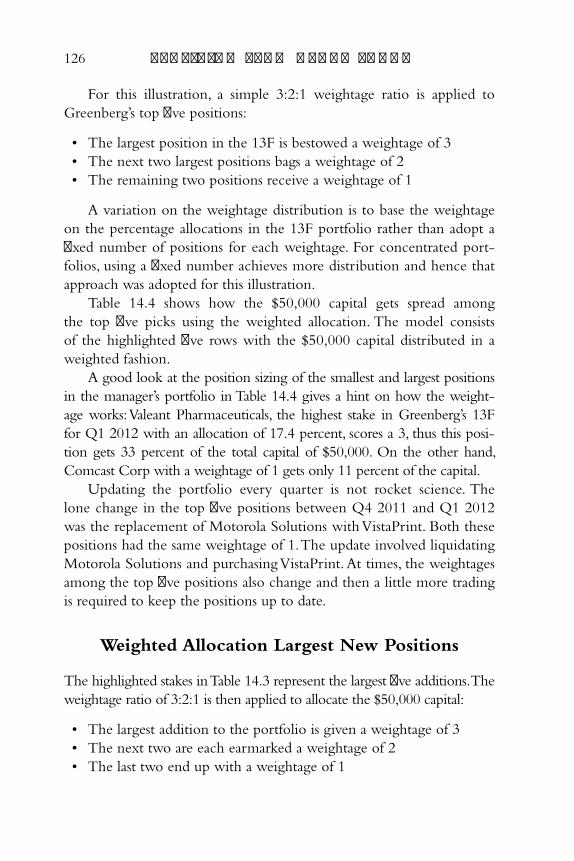
126 p r o f i t i n g f r o m h e d g e f u n d s
For this illustration, a simple 3:2:1 weightage ratio is applied to
Greenberg ’s top fi ve positions:
• The largest position in the 13F is bestowed a weightage of 3
• The next two largest positions bags a weightage of 2
• The remaining two positions receive a weightage of 1
A variation on the weightage distribution is to base the weightage
on the percentage allocations in the 13F portfolio rather than adopt a
fi xed number of positions for each weightage. For concentrated port-
folios, using a fi xed number achieves more distribution and hence that
approach was adopted for this illustration.
Table 14.4 shows how the $50,000 capital gets spread among
the top fi ve picks using the weighted allocation. The model consists
of the highlighted fi ve rows with the $50,000 capital distributed in a
weighted fashion.
A good look at the position sizing of the smallest and largest positions
in the manager ’s portfolio in Table 14.4 gives a hint on how the weight-
age works: Valeant Pharmaceuticals, the highest stake in Greenberg ’s 13F
for Q1 2012 with an allocation of 17.4 percent, scores a 3, thus this posi-
tion gets 33 percent of the total capital of $50,000. On the other hand,
Comcast Corp with a weightage of 1 gets only 11 percent of the capital.
Updating the portfolio every quarter is not rocket science. The
lone change in the top fi ve positions between Q4 2011 and Q1 2012
was the replacement of Motorola Solutions with VistaPrint. Both these
positions had the same weightage of 1. The update involved liquidating
Motorola Solutions and purchasing VistaPrint. At times, the weightages
among the top fi ve positions also change and then a little more trading
is required to keep the positions up to date.
Weighted Allocation Largest New Positions
The highlighted stakes in Table 14.3 represent the largest fi ve additions. The
weightage ratio of 3:2:1 is then applied to allocate the $50,000 capital:
• The largest addition to the portfolio is given a weightage of 3
• The next two are each earmarked a weightage of 2
• The last two end up with a weightage of 1
c14.indd 126c14.indd 126 27-05-2013 12:21:5827-05-2013 12:21:58
127
Table 14.4 Sample Portfolio: Weighted Allocation Largest Positions
Entity Market Value (03/31/2012)
Share Count (03/31/2012)
% of U.S. long portfolio (03/31/2012) Weightage
Model Allocation
Adobe Systems Inc. (ADBE) $49,463,000.00 1,441,656 3.63%
Aon Corp. (AON) $62,795,000.00 1,279,957 4.61%
Comcast Corp. (CMCSA) $126,210,000.00 4,276,864 9.27% 1 $5,555.56
Fiserv Inc. (FISV) $142,263,000.00 2,050,188 10.45% 2 $11,111.11
Google Inc. (GOOG) $207,423,000.00 323,472 15.23% 2 $11,111.11
Higher One Hldgs Inc. (ONE) $97,763,000.00 6,539,352 7.18%
Laboratory Corp Amer Hldgs (LH) $81,658,000.00 892,050 6.00%
Motorola Solutions Inc. (MSI) $96,671,000.00 1,901,857 7.10%
Oracle Corp. (ORCL) $55,450,000.00 1,901,571 4.07%
Primerica Inc. (PRI) $42,922,000.00 1,702,581 3.15%
Valeant Pharmaceuticals Intl. (VRX) $236,942,000.00 4,413,146 17.40% 3 $16,666.67
Visa Inc. (V) $31,990,000.00 271,098 2.35%
VistaPrint N V (VPRT) $130,029,000.00 3,364,275 9.55% 1 $5,555.56
Total $1,361,579,000.00
Note: The highlights in dark gray indicate the new additions in the model for Q1 2012 and the light gray highlights are those that carried over from Q4 2011.
c14.indd 127c14.indd 127 27-05-2013 12:21:5827-05-2013 12:21:58
128 p r o f i t i n g f r o m h e d g e f u n d s
Table 14.5 illustrates how the capital gets allocated across the
largest fi ve additions using this model. The model consists of the high-
lighted fi ve rows with the $50,000 capital distributed in a weighted
fashion.
The model allocates one-third of the capital to Higher One, the
largest new addition for Greenberg in Q1 2012. VistaPrint, a stake
being built by the manager, is represented well in the model with a 22
percent allocation. Overall, the model succeeds in capturing the man-
ager ’s current sentiment reasonably well, with the major new additions
featuring in the portfolio in a weighted fashion.
A fair amount of trading is required to keep this model cur-
rent. Similar to the equal allocation variant, three positions (Adobe,
Primerica, and Valeant) had to be liquidated to make room for Google,
Higher One, and Laboratory Corp in Q1 2012. Besides, the weightage
shift for VistaPrint required another buy/sell.
10–5–2 Allocation Largest Positions
The model aims to establish a common manager trait of allocating over
10 percent of assets each to a very small number of the highest convic-
tion bets, over 5 percent each to an average number of high conviction
stakes, and around 2 percent each for the rest. To shadow this alloca-
tion, the portfolio will need to have upwards of twenty positions. This
illustration approximates the model by restricting the number of posi-
tions to fi ve and allocating the $50,000 capital based on a 10:5:2 ratio.
The fi ve positions are divided into three groups: the best, the better,
and the good:
1. The best position command a weightage of 10
2. The better two positions are each given a weightage of 5
3. The good two positions end up with a weightage of 2
Table 14.6 represents how the $50,000 capital gets allocated among
the top fi ve picks using this model. The model consists of the high-
lighted fi ve rows with the $50,000 capital distributed in a 10:5:2 ratio.
Greenberg runs a very concentrated portfolio: Even the low-
est allocation (Comcast Corp) among his top fi ve accounts for close
c14.indd 128c14.indd 128 27-05-2013 12:21:5827-05-2013 12:21:58
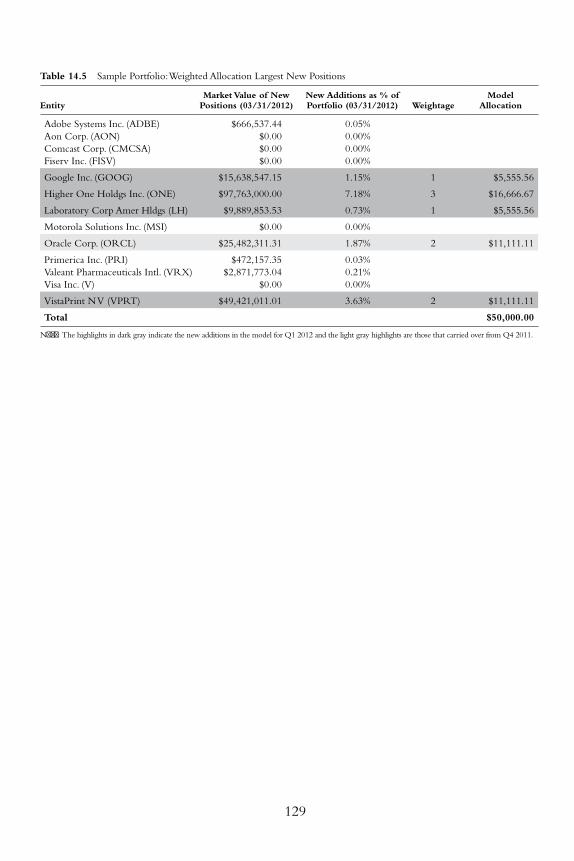
Table 14.5 Sample Portfolio: Weighted Allocation Largest New Positions
Entity Market Value of New
Positions (03/31/2012) New Additions as % of Portfolio (03/31/2012) Weightage
Model Allocation
Adobe Systems Inc. (ADBE) $666,537.44 0.05%
Aon Corp. (AON) $0.00 0.00%
Comcast Corp. (CMCSA) $0.00 0.00%
Fiserv Inc. (FISV) $0.00 0.00%
Google Inc. (GOOG) $15,638,547.15 1.15% 1 $5,555.56
Higher One Holdgs Inc. (ONE) $97,763,000.00 7.18% 3 $16,666.67
Laboratory Corp Amer Hldgs (LH) $9,889,853.53 0.73% 1 $5,555.56
Motorola Solutions Inc. (MSI) $0.00 0.00%
Oracle Corp. (ORCL) $25,482,311.31 1.87% 2 $11,111.11
Primerica Inc. (PRI) $472,157.35 0.03%
Valeant Pharmaceuticals Intl. (VRX) $2,871,773.04 0.21%
Visa Inc. (V) $0.00 0.00%
VistaPrint N V (VPRT) $49,421,011.01 3.63% 2 $11,111.11
Total $50,000.00
Note: The highlights in dark gray indicate the new additions in the model for Q1 2012 and the light gray highlights are those that carried over from Q4 2011.
129
c14.indd 129c14.indd 129 27-05-2013 12:21:5827-05-2013 12:21:58
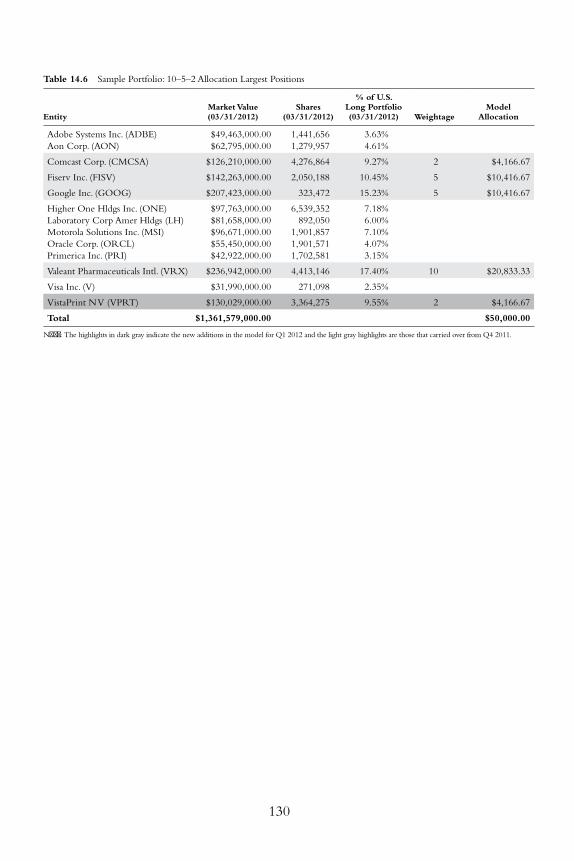
Table 14.6 Sample Portfolio: 10–5–2 Allocation Largest Positions
Entity Market Value (03/31/2012)
Shares (03/31/2012)
% of U.S. Long Portfolio (03/31/2012) Weightage
Model Allocation
Adobe Systems Inc. (ADBE) $49,463,000.00 1,441,656 3.63%
Aon Corp. (AON) $62,795,000.00 1,279,957 4.61%
Comcast Corp. (CMCSA) $126,210,000.00 4,276,864 9.27% 2 $4,166.67
Fiserv Inc. (FISV) $142,263,000.00 2,050,188 10.45% 5 $10,416.67
Google Inc. (GOOG) $207,423,000.00 323,472 15.23% 5 $10,416.67
Higher One Hldgs Inc. (ONE) $97,763,000.00 6,539,352 7.18%
Laboratory Corp Amer Hldgs (LH) $81,658,000.00 892,050 6.00%
Motorola Solutions Inc. (MSI) $96,671,000.00 1,901,857 7.10%
Oracle Corp. (ORCL) $55,450,000.00 1,901,571 4.07%
Primerica Inc. (PRI) $42,922,000.00 1,702,581 3.15%
Valeant Pharmaceuticals Intl. (VRX) $236,942,000.00 4,413,146 17.40% 10 $20,833.33
Visa Inc. (V) $31,990,000.00 271,098 2.35%
VistaPrint N V (VPRT) $130,029,000.00 3,364,275 9.55% 2 $4,166.67
Total $1,361,579,000.00 $50,000.00
Note: The highlights in dark gray indicate the new additions in the model for Q1 2012 and the light gray highlights are those that carried over from Q4 2011.
130
c14.indd 130c14.indd 130 27-05-2013 12:21:5827-05-2013 12:21:58
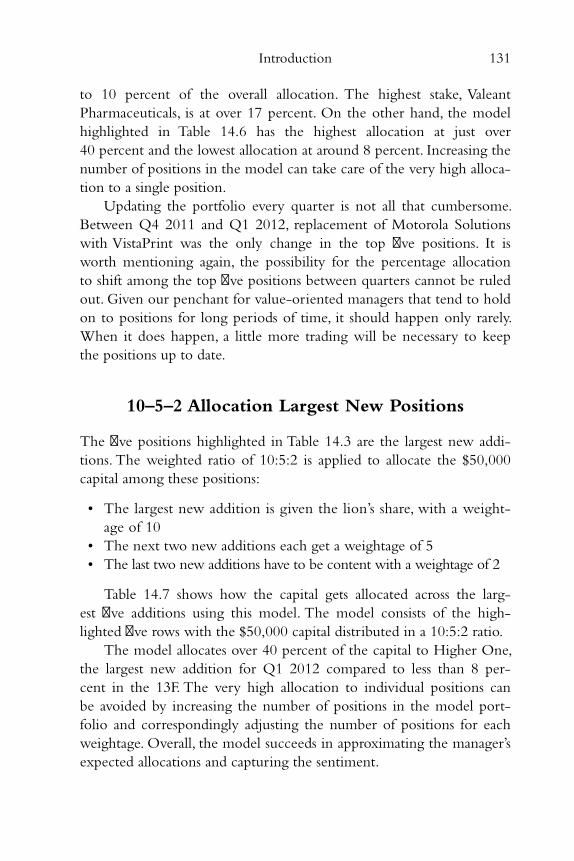
Introduction 131
to 10 percent of the overall allocation. The highest stake, Valeant
Pharmaceuticals, is at over 17 percent. On the other hand, the model
highlighted in Table 14.6 has the highest allocation at just over
40 percent and the lowest allocation at around 8 percent. Increasing the
number of positions in the model can take care of the very high alloca-
tion to a single position.
Updating the portfolio every quarter is not all that cumbersome.
Between Q4 2011 and Q1 2012, replacement of Motorola Solutions
with VistaPrint was the only change in the top fi ve positions. It is
worth mentioning again, the possibility for the percentage allocation
to shift among the top fi ve positions between quarters cannot be ruled
out. Given our penchant for value-oriented managers that tend to hold
on to positions for long periods of time, it should happen only rarely.
When it does happen, a little more trading will be necessary to keep
the positions up to date.
10–5–2 Allocation Largest New Positions
The fi ve positions highlighted in Table 14.3 are the largest new addi-
tions. The weighted ratio of 10:5:2 is applied to allocate the $50,000
capital among these positions:
• The largest new addition is given the lion ’s share, with a weight-
age of 10
• The next two new additions each get a weightage of 5
• The last two new additions have to be content with a weightage of 2
Table 14.7 shows how the capital gets allocated across the larg-
est fi ve additions using this model. The model consists of the high-
lighted fi ve rows with the $50,000 capital distributed in a 10:5:2 ratio.
The model allocates over 40 percent of the capital to Higher One,
the largest new addition for Q1 2012 compared to less than 8 per-
cent in the 13F. The very high allocation to individual positions can
be avoided by increasing the number of positions in the model port-
folio and correspondingly adjusting the number of positions for each
weightage. Overall, the model succeeds in approximating the manager ’s
expected allocations and capturing the sentiment.
c14.indd 131c14.indd 131 27-05-2013 12:21:5827-05-2013 12:21:58
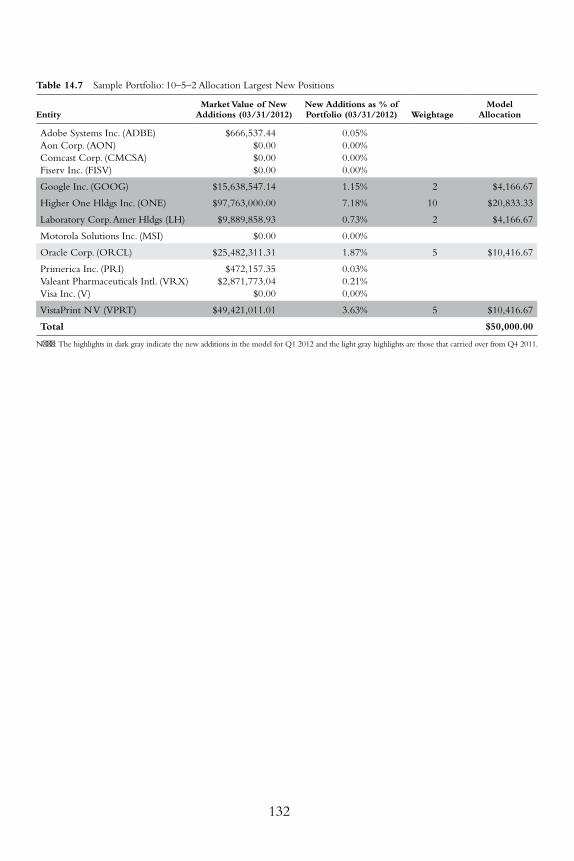
Table 14.7 Sample Portfolio: 10–5–2 Allocation Largest New Positions
Entity Market Value of New
Additions (03/31/2012) New Additions as % of Portfolio (03/31/2012) Weightage
Model Allocation
Adobe Systems Inc. (ADBE) $666,537.44 0.05%
Aon Corp. (AON) $0.00 0.00%
Comcast Corp. (CMCSA) $0.00 0.00%
Fiserv Inc. (FISV) $0.00 0.00%
Google Inc. (GOOG) $15,638,547.14 1.15% 2 $4,166.67
Higher One Hldgs Inc. (ONE) $97,763,000.00 7.18% 10 $20,833.33
Laboratory Corp. Amer Hldgs (LH) $9,889,858.93 0.73% 2 $4,166.67
Motorola Solutions Inc. (MSI) $0.00 0.00%
Oracle Corp. (ORCL) $25,482,311.31 1.87% 5 $10,416.67
Primerica Inc. (PRI) $472,157.35 0.03%
Valeant Pharmaceuticals Intl. (VRX) $2,871,773.04 0.21%
Visa Inc. (V) $0.00 0.00%
VistaPrint N V (VPRT) $49,421,011.01 3.63% 5 $10,416.67
Total $50,000.00
Note: The highlights in dark gray indicate the new additions in the model for Q1 2012 and the light gray highlights are those that carried over from Q4 2011.
132
c14.indd 132c14.indd 132 27-05-2013 12:21:5827-05-2013 12:21:58
Introduction 133
The trading requirements of this model is the same as the weighted
allocation variant; three positions (Adobe, Primerica, and Valeant)
had to be liquidated to make room for Google, Higher One, and
Laboratory Corp in Q1 2012. Also, the weightage shifted for VistaPrint,
prompting another buy/sell.
Notes
1. Mary Margaret Myers, James Poterba, Douglas Shackelford, and John Shoven,
“Copycat Funds: Information Disclosure Regulation and the Returns to
Active Management in the Mutual Fund Industry,” Massachusetts Institute of
Technology, Department of Economics, 10/2001.
2. Marno Verbeek and Yu Wang, “Better than the Original? The Relative
Success of Copycat Funds,” Rotterdam School of Management, Erasumus
University, 11/2/2010.
3. Randy Cohen, Christopher Polk, and Bernhard Silli, “Best Ideas,”
03/15/2010, http://papers.ssrn.com/sol3/papers.cfm?abstract_id=1364827 .
4. Sara Eisen and Mazin Jadallah, “Cloning Hedge Fund Strategies,” Bloomberg
Money Moves, 07/24/2012, www.bloomberg.com/video/cloning-hedge-
fund-strategies-UWkSvAZ1TiGX7pMe_e9EYw.html .
5. Gerald Martin and John Puthenpurackal, “Imitation Is the Sincerest Form
of Flattery: Warren Buff ett and Berkshire Hathaway,” American University
& University of Nevada, 05/15/2008, http://papers.ssrn.com/sol3/papers
.cfm?abstract_id=806246 .
6. Mebane Fabert and Eric Richardson, The Ivy Portfolio: How to Invest Like the Top
Endowments and Avoid Bear Markets (Hoboken, NJ: John Wiley & Sons, 2009).
7. Blerina Reca, Richard Sias, and Harry Turtle, “Hedge Fund Herding and
Crowded Trades: The Apologists’ Evidence,” The University of Toledo,
06/24/2012, http://papers.ssrn.com/sol3/papers.cfm?abstract_id=1906932 .
8. Russ Wermers,“Is Money Really ‘Smart’? New Evidence on the Relation
Between Mutual Fund Flows, Manager Behavior, and Performance
Persistence,” Robert H. Smith School of Business University of Maryland,
05/2003, http://papers.ssrn.com/sol3/papers.cfm?abstract_id=414420 .
9. George Aragon, Michael Hertzel, and Zhen Shi, “Why Do Hedge Funds
Avoid Disclosure? Evidence From Confi dential 13F Filings,” Arizona State
University, 05/16/2011, www.public.asu.edu/~goaragon/Papers/ahs_JFQA_
01jun2012.pdf .
c14.indd 133c14.indd 133 27-05-2013 12:21:5827-05-2013 12:21:58

134 p r o f i t i n g f r o m h e d g e f u n d s
10. Adam Aiken, Christopher Cliff ord, and Jesse Ellis, “Out of the Dark: Hedge
Fund Reporting Biases and Commercial Databases,” Quinnipiac University,
University of Kentucky, and University of Alabama, 03/03/2012, http://
papers.ssrn.com/sol3/papers.cfm?abstract_id=1519914 .
11. Burton Malkiel and Atanu Saha, “Hedge Funds: Risk and Return,” Financial
Analysts Journal 61, no. 6, November/December 2005.
c14.indd 134c14.indd 134 27-05-2013 12:21:5827-05-2013 12:21:58
135
Chapter 15
Equal Allocation Models
The primer in the preceding chapter looked at the work involved
in selecting managers to shadow and mechanically assembling
portfolios based on their stock picks. Such portfolios are pieced
together from a set number of stock picks based on some criteria, and
the assets are distributed equally or in a ratio among the selections.
Models founded on the equal allocation method are the simplest to
implement and are discussed in this chapter.
This chapter focuses on managing and analyzing model portfo-
lios of the three shortlisted managers: Bill Ackman, Warren Buff ett, and
David Einhorn. They are presented individually and combined, using
the Equal Allocation method. For illustration purposes, these portfolios
employ minimal three-stock models based on their largest positions.
The three managers chosen are known to run concentrated portfo-
lios making reasonable coverage possible with three-stock models. The
combined models use one selection each from the three managers for
the largest positions and the largest new positions portfolios to bring
to the table a taste of real-life implementation with multiple managers.
c15.indd 135c15.indd 135 27-05-2013 11:26:3627-05-2013 11:26:36
136 p r o f i t i n g f r o m h e d g e f u n d s
The tables track the evolution of the model portfolios over a period
of three years and indicate back-tested performance for the same time
period.
The models off er no recommendation as to when to rebalance.
Rebalancing on a fi xed schedule can result in unnecessary trades, even
when the components of the portfolio have not diverged much. Here,
rebalancing is applied when the largest position is 50 percent greater
than the smallest position.
Portfolio Management and Performance Analysis
A portfolio of $100,000 and an inception date of August 17, 2009
(the fi rst trading day following the deadline for fi ling 13Fs for Q2
2009) were the assumptions for building these models. At launch
time, the $100,000 was distributed evenly among the manager ’s larg-
est (or largest new) position(s), as indicated in their Q2 2009 13F
forms. Spreadsheets captured the updates performed forty-fi ve days
after every quarter, and rebalancing when the largest position went
over 50 percent of the smallest position. Dividend income was
ignored to provide a precise comparison with the S&P 500 Index
performance.
Bill Ackman: Largest Three
Table 15.1 (A&B) illustrates the model portfolio based on Ackman ’s
largest three positions with an inception date of August 17, 2009, and
its progression for the next three years.
The columns display the portfolio allocation on the date indi-
cated in the header row. The second column (8/17/2009) represents
the allocation of the $100,000 portfolio across the largest three posi-
tions of Ackman ’s Q2 2009 13F and the following columns depict the
mechanics of the portfolio progression on a quarterly basis per the cor-
responding 13F.
As mentioned earlier, the second column in Table 15.1 A indi-
cates the initial allocations made on 08/17/2009. The next column
(11/16/2009) indicates the portfolio progression and reallocation
c15.indd 136c15.indd 136 27-05-2013 11:26:3727-05-2013 11:26:37
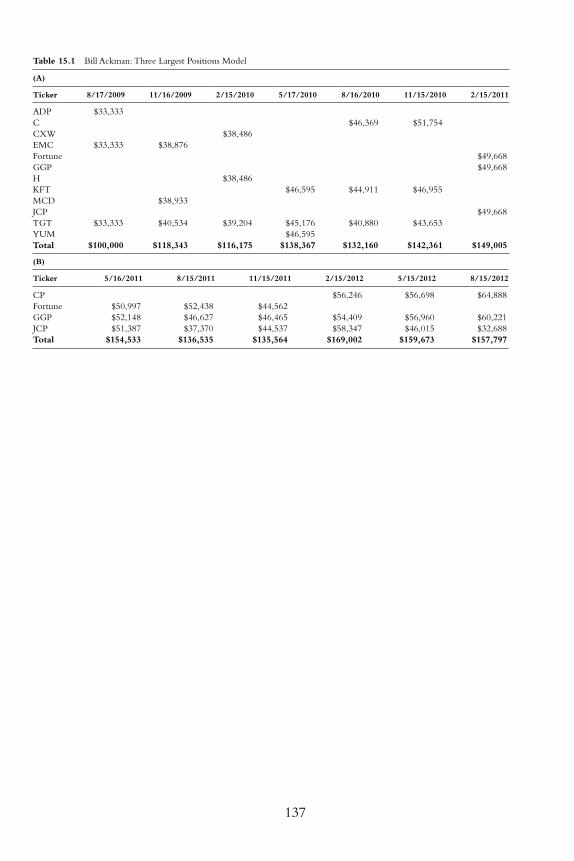
137
Table 15.1 Bill Ackman: Three Largest Positions Model
(A)
Ticker 8/17/2009 11/16/2009 2/15/2010 5/17/2010 8/16/2010 11/15/2010 2/15/2011
ADP $33,333
C $46,369 $51,754
CXW $38,486
EMC $33,333 $38,876
Fortune $49,668
GGP $49,668
H $38,486
KFT $46,595 $44,911 $46,955
MCD $38,933
JCP $49,668
TGT $33,333 $40,534 $39,204 $45,176 $40,880 $43,653
YUM $46,595
Total $100,000 $118,343 $116,175 $138,367 $132,160 $142,361 $149,005
(B)
Ticker 5/16/2011 8/15/2011 11/15/2011 2/15/2012 5/15/2012 8/15/2012
CP $56,246 $56,698 $64,888
Fortune $50,997 $52,438 $44,562
GGP $52,148 $46,627 $46,465 $54,409 $56,960 $60,221
JCP $51,387 $37,370 $44,537 $58,347 $46,015 $32,688
Total $154,533 $136,535 $135,564 $169,002 $159,673 $157,797
c15.indd 137c15.indd 137 27-05-2013 11:26:3727-05-2013 11:26:37
138 p r o f i t i n g f r o m h e d g e f u n d s
after the 13F for Q3 2009 was released. The largest positions almost
remained intact save for the replacement of Automatic Data Processing
(ADP) with McDonald ’s Corporation (MCD). The changes in dollar
fi gures refl ect the increase or decrease in the corresponding stock price
between those two dates.
• EMC Corporation (EMC) and Target Corporation (TGT) held
their spots in the top three for 11/16/2009. The new values for
these holdings are obtained by multiplying the new price per share
by the number of shares of the holding.
• The value realized by selling Automatic Data Processing (ADP) as
of 11/16/2009 was used to acquire the new stake in McDonald ’s
Corporation (MCD).
The next quarter (2/15/2010) saw shifts in the largest posi-
tions again, which in its turn called for more buy/sell trades: EMC
Corporation (EMC) and McDonald ’s Corporation (MCD) were
given the ax, and the proceeds equally split between Corrections
Corporation of America (CXW) and Hyatt Hotels Corporation (H).
Though rebalancing was never a concern during the entire three-
year period, it was in the cards as of 08/15/2012—Canadian Pacifi c
Railway (CP), the largest position, was 50 percent over JCPenney
(JCP), the smallest position. A portion of each of the three stocks held
will need to be either bought or sold so as to make the allocation equal
across the holdings.
As of 8/15/2012, the total value of the portfolio improved to
$157,797 (excluding dividends) for a total return of 57.80 percent. The
S&P 500 Index return during that time period was 43.46 percent.
Warren Buff ett: Largest Three
Table 15.2 (A & B) illustrate the model portfolio based on Buff ett ’s
largest three positions with an inception date of August 17, 2009, and
its progression over the next three years.
The columns display the portfolio allocation on the date indi-
cated in the header row. The second column (8/17/2009) repre-
sents the allocation of the $100,000 portfolio across the largest three
c15.indd 138c15.indd 138 27-05-2013 11:26:3727-05-2013 11:26:37

139
Table 15.2 Warren Buff ett's Largest Three Positions Model
(A)
Ticker 8/17/2009 11/16/2009 2/15/2010 5/17/2010 8/16/2010 11/15/2010 2/15/2011
AXP $45,395 $45,736 $47,013 $50,855
KO $33,333 $38,810 $36,922 $36,532 $38,222 $43,065 $43,222
WFC $33,333 $35,742 $34,057 $40,506 $32,537 $35,033 $42,673
BNI $33,333 $36,163 $44,675
Total $100,000 $110,715 $115,654 $122,434 $116,494 $125,110 $136,750
(B)
Ticker 5/16/2011 Rebalance 8/15/2011 11/15/2011 2/15/2012 5/15/2012 8/15/2012
AXP $55,127 $45,607 $41,742
KO $46,396 $45,607 $45,380 $45,696 $45,965 $51,455 $52,886
IBM $45,504 $46,332 $47,969 $47,814
WFC $35,229 $45,607 $40,958 $41,400 $49,388 $52,777 $55,609
Total $136,821 $136,821 $128,530 $132,600 $141,685 $152,201 $156,310
c15.indd 139c15.indd 139 27-05-2013 11:26:3727-05-2013 11:26:37
140 p r o f i t i n g f r o m h e d g e f u n d s
positions of Buff ett ’s Q2 2009 13F, and the following columns depict
the mechanics of the portfolio progression on a quarterly basis per the
corresponding 13F.
Warren Buff ett was never one to mince words when it comes to
stating his favorite holding period: It is forever. As many of his larger
positions are very long-term holdings, the largest position models
work superbly with his portfolio as the long-term sentiment is cap-
tured in all its glory. Over the three-year tracking period, just fi ve
stocks were utilized by the model and the allocations were altered
only twice.
• Burlington Northern Santa Fe (BNI) gave up its position to
American Express Company (AXP) on 5/17/2010, following
Buff ett ’s Q1 2010 13F fi ling. Berkshire Hathaway bought BNI
outright and, during that quarter, BNI became a wholly owned
subsidiary.
• American Express (AXP) pulled out for International Business
Machines Corp. (IBM) on 11/15/2011. The huge IBM stake dis-
closed in the fi ling easily found its place among the top three
positions.
Rebalancing was required once, after the Q1 2011 13F fi l-
ing (05/16/2011). American Express (AXP) had returned around 70
percent by then, compared to the marginal returns for Wells Fargo
(WFC), thus meeting the rebalancing criteria. To rebalance, a portion
of American Express (AXP) and Coca-Cola (KO) holdings were sold
to buy shares of Wells Fargo (WFC), bringing the allocations equal at
$45,607 apiece. In all, over the three-year period, trading activity was
limited to just seven transactions:
• Sale of BNI to buy AXP with its proceeds on 5/17/2010
• Trade of AXP to purchase IBM on 11/15/2011
• Three buy/sell activities of portions of each stock in the portfolio
on 05/16/2011 for rebalancing
As of 8/15/2012, the total value of the portfolio improved to
$156,310 (excluding dividends) for a total return of 56.31 percent. The
S&P 500 Index return during that time period was 43.46 percent.
c15.indd 140c15.indd 140 27-05-2013 11:26:3727-05-2013 11:26:37
Equal Allocation Models 141
David Einhorn: Largest Three
Table 15.3 (A&B) illustrate the model portfolio based on Einhorn ’s
largest positions, with an inception date of August 17, 2009, and its
progression over the next three years.
The columns display the portfolio allocation on the date indi-
cated in the header row. The second column (8/17/2009) represents
the allocation of the $100,000 portfolio across the largest three posi-
tions of Einhorn ’s Q2 2009 13F and the following columns depict the
mechanics of the portfolio progression on a quarterly basis per the cor-
responding 13F.
Einhorn sports a much more actively traded portfolio and the bus-
tle was mirrored in the model. At inception, the top three holdings in
the model were Pfi zer Inc. (PFE), Teradata Corporation (TDC), and
URS Corporation (URS). Only PFE maintained its status quo in the
top three holding for any length of time, as both TDC and URS were
bumped in the following quarter and replaced with Cardinal Health
(CAH) and CareFusion (CFN). Two quarters later, those two positions
made way for CIT Group (CIT) and Ensco PLC (ESV) (8/16/2010).
The model portfolio value taxied quite a bit before taking off —the
portfolio remained under break even at the one-year mark. The PFE
position barely budged and despite the trading activity the other
two positions also shared a similar fate. From the second year on, the
portfolio gathered momentum, revving with the entry of Apple Inc.
(AAPL) as a top three holding in Q1 2011 (5/16/2011). Three quar-
ters later (2/15/2012), rebalancing criteria was met; the AAPL holding
had already returned close to 50 percent, while the others continued to
post anemic returns.
The portfolio progression pattern of this model off ers a tutorial on
the risks associated with the limited implementation of the models.
• When the number of stocks is reduced to just three, a large
increase or decrease in the share price of a single holding over a
period of time can make or break the performance of the model.
Einhorn ’s model was literally carried by the vast outperformance
of the AAPL position. The lackluster returns provided throughout
by the other two positions did not help at all. While this model
c15.indd 141c15.indd 141 27-05-2013 11:26:3727-05-2013 11:26:37
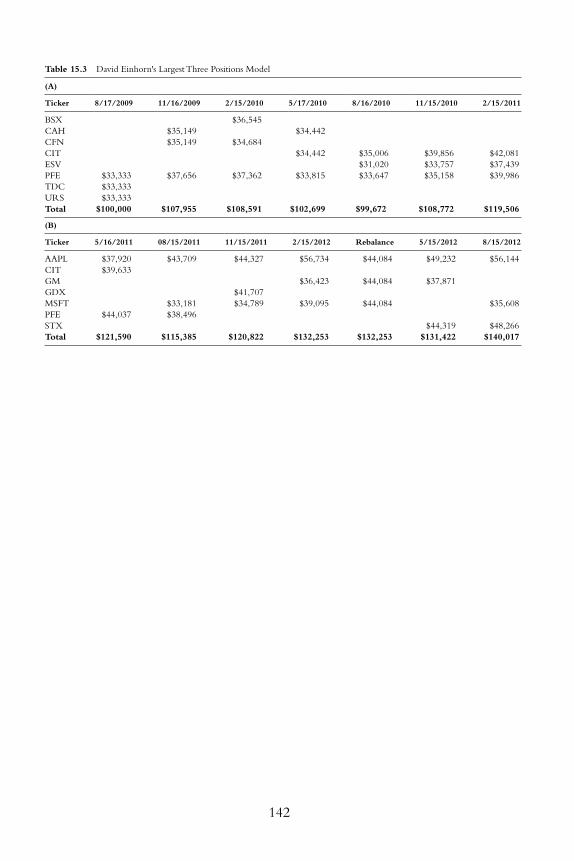
142
Table 15.3 David Einhorn's Largest Three Positions Model
(A)
Ticker 8/17/2009 11/16/2009 2/15/2010 5/17/2010 8/16/2010 11/15/2010 2/15/2011
BSX $36,545
CAH $35,149 $34,442
CFN $35,149 $34,684
CIT $34,442 $35,006 $39,856 $42,081
ESV $31,020 $33,757 $37,439
PFE $33,333 $37,656 $37,362 $33,815 $33,647 $35,158 $39,986
TDC $33,333
URS $33,333
Total $100,000 $107,955 $108,591 $102,699 $99,672 $108,772 $119,506
(B)
Ticker 5/16/2011 08/15/2011 11/15/2011 2/15/2012 Rebalance 5/15/2012 8/15/2012
AAPL $37,920 $43,709 $44,327 $56,734 $44,084 $49,232 $56,144
CIT $39,633
GM $36,423 $44,084 $37,871
GDX $41,707
MSFT $33,181 $34,789 $39,095 $44,084 $35,608
PFE $44,037 $38,496
STX $44,319 $48,266
Total $121,590 $115,385 $120,822 $132,253 $132,253 $131,422 $140,017
c15.indd 142c15.indd 142 27-05-2013 11:26:3727-05-2013 11:26:37
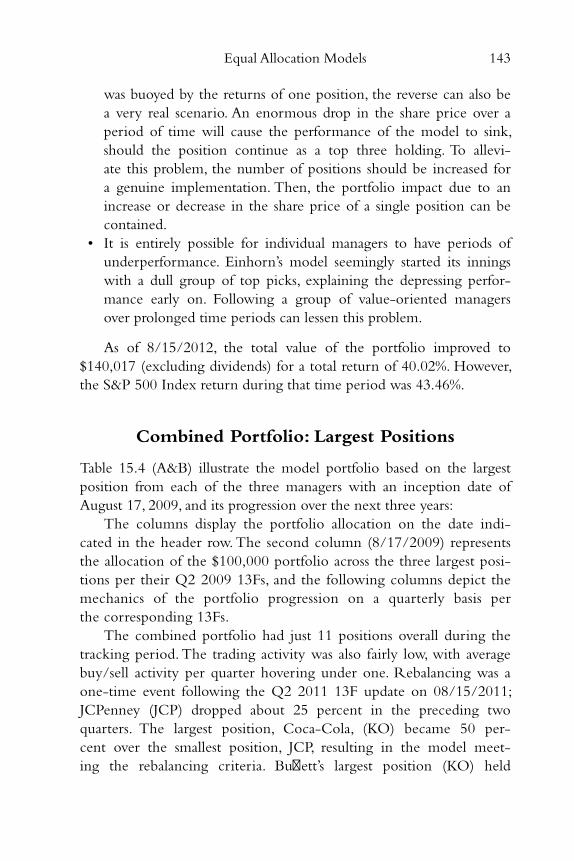
Equal Allocation Models 143
was buoyed by the returns of one position, the reverse can also be
a very real scenario. An enormous drop in the share price over a
period of time will cause the performance of the model to sink,
should the position continue as a top three holding. To allevi-
ate this problem, the number of positions should be increased for
a genuine implementation. Then, the portfolio impact due to an
increase or decrease in the share price of a single position can be
contained.
• It is entirely possible for individual managers to have periods of
underperformance. Einhorn ’s model seemingly started its innings
with a dull group of top picks, explaining the depressing perfor-
mance early on. Following a group of value-oriented managers
over prolonged time periods can lessen this problem.
As of 8/15/2012, the total value of the portfolio improved to
$140,017 (excluding dividends) for a total return of 40.02%. However,
the S&P 500 Index return during that time period was 43.46%.
Combined Portfolio: Largest Positions
Table 15.4 (A&B) illustrate the model portfolio based on the largest
position from each of the three managers with an inception date of
August 17, 2009, and its progression over the next three years:
The columns display the portfolio allocation on the date indi-
cated in the header row. The second column (8/17/2009) represents
the allocation of the $100,000 portfolio across the three largest posi-
tions per their Q2 2009 13Fs, and the following columns depict the
mechanics of the portfolio progression on a quarterly basis per
the corresponding 13Fs.
The combined portfolio had just 11 positions overall during the
tracking period. The trading activity was also fairly low, with average
buy/sell activity per quarter hovering under one. Rebalancing was a
one-time event following the Q2 2011 13F update on 08/15/2011;
JCPenney (JCP) dropped about 25 percent in the preceding two
quarters. The largest position, Coca-Cola, (KO) became 50 per-
cent over the smallest position, JCP, resulting in the model meet-
ing the rebalancing criteria. Buff ett ’s largest position (KO) held
c15.indd 143c15.indd 143 27-05-2013 11:26:3727-05-2013 11:26:37
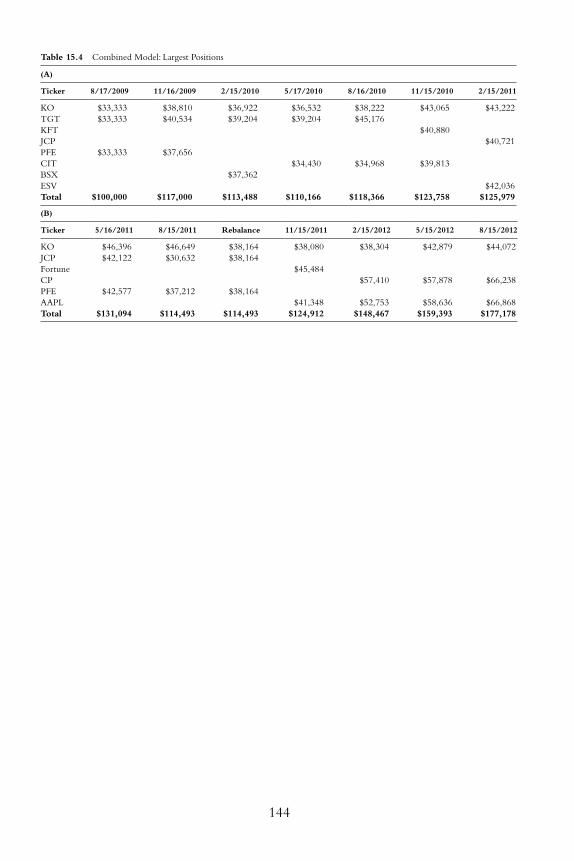
144
Table 15.4 Combined Model: Largest Positions
(A)
Ticker 8/17/2009 11/16/2009 2/15/2010 5/17/2010 8/16/2010 11/15/2010 2/15/2011
KO $33,333 $38,810 $36,922 $36,532 $38,222 $43,065 $43,222
TGT $33,333 $40,534 $39,204 $39,204 $45,176
KFT $40,880
JCP $40,721
PFE $33,333 $37,656
CIT $34,430 $34,968 $39,813
BSX $37,362
ESV $42,036
Total $100,000 $117,000 $113,488 $110,166 $118,366 $123,758 $125,979
(B)
Ticker 5/16/2011 8/15/2011 Rebalance 11/15/2011 2/15/2012 5/15/2012 8/15/2012
KO $46,396 $46,649 $38,164 $38,080 $38,304 $42,879 $44,072
JCP $42,122 $30,632 $38,164
Fortune $45,484
CP $57,410 $57,878 $66,238
PFE $42,577 $37,212 $38,164
AAPL $41,348 $52,753 $58,636 $66,868
Total $131,094 $114,493 $114,493 $124,912 $148,467 $159,393 $177,178
c15.indd 144c15.indd 144 27-05-2013 11:26:3727-05-2013 11:26:37
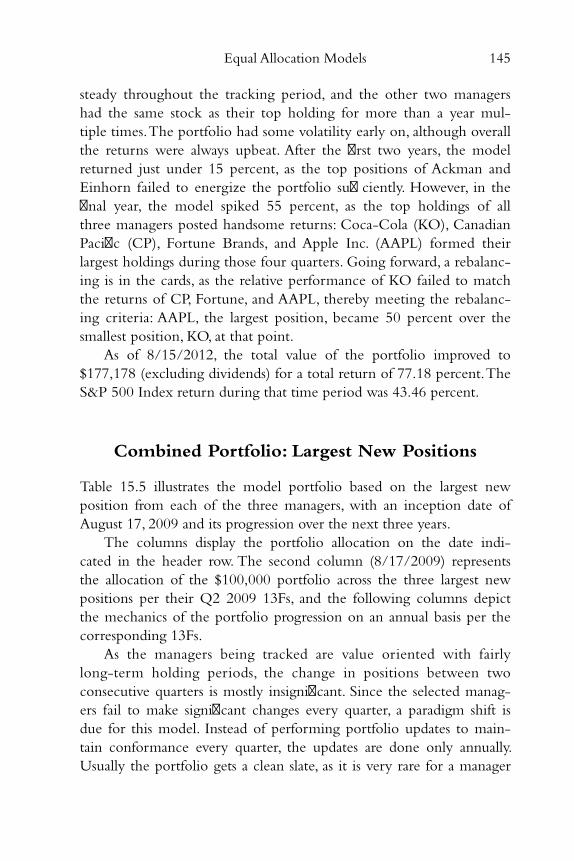
Equal Allocation Models 145
steady throughout the tracking period, and the other two managers
had the same stock as their top holding for more than a year mul-
tiple times. The portfolio had some volatility early on, although overall
the returns were always upbeat. After the fi rst two years, the model
returned just under 15 percent, as the top positions of Ackman and
Einhorn failed to energize the portfolio suffi ciently. However, in the
fi nal year, the model spiked 55 percent, as the top holdings of all
three managers posted handsome returns: Coca-Cola (KO), Canadian
Pacifi c (CP), Fortune Brands, and Apple Inc. (AAPL) formed their
largest holdings during those four quarters. Going forward, a rebalanc-
ing is in the cards, as the relative performance of KO failed to match
the returns of CP, Fortune, and AAPL, thereby meeting the rebalanc-
ing criteria: AAPL, the largest position, became 50 percent over the
smallest position, KO, at that point.
As of 8/15/2012, the total value of the portfolio improved to
$177,178 (excluding dividends) for a total return of 77.18 percent. The
S&P 500 Index return during that time period was 43.46 percent.
Combined Portfolio: Largest New Positions
Table 15.5 illustrates the model portfolio based on the largest new
position from each of the three managers, with an inception date of
August 17, 2009 and its progression over the next three years.
The columns display the portfolio allocation on the date indi-
cated in the header row. The second column (8/17/2009) represents
the allocation of the $100,000 portfolio across the three largest new
positions per their Q2 2009 13Fs, and the following columns depict
the mechanics of the portfolio progression on an annual basis per the
corresponding 13Fs.
As the managers being tracked are value oriented with fairly
long-term holding periods, the change in positions between two
consecutive quarters is mostly insignifi cant. Since the selected manag-
ers fail to make signifi cant changes every quarter, a paradigm shift is
due for this model. Instead of performing portfolio updates to main-
tain conformance every quarter, the updates are done only annually.
Usually the portfolio gets a clean slate, as it is very rare for a manager
c15.indd 145c15.indd 145 27-05-2013 11:26:3727-05-2013 11:26:37
146 p r o f i t i n g f r o m h e d g e f u n d s
to continue having the same stock as the largest new position. In the
model, it never happened at all. The fringe benefi t is that rebalanc-
ing is eliminated: When the positions are all sold to buy new positions
for the updates, rebalancing is automatic. The equal allocations to the
three positions on every column in the spreadsheet, without doing any
explicit rebalancing, make this clear.
As of 8/15/2012, the total value of the portfolio improved to
$157,186 (excluding dividends) for a total return of 57.19%. The S&P
500 Index return during that time period was 43.46%.
Summary
The chapter charted the course of fi ve portfolios over three years. They
served to illustrate how to manage and mechanically maintain equal
allocation based model portfolios on an ongoing basis. Relatively
straightforward spreadsheets are suffi cient to guide the implementation
of the portfolios in a real-life situation. To reiterate, the individual mod-
els used three stock positions for each portfolio for easier illustration.
For the same reason, the combined portfolios stayed in the comfort
zone of single picks from each manager.
Table 15.5 Model of Largest New Positions on the Combined Portfolio
Ticker 8/17/2009 8/16/2010 8/15/2011 8/15/2012
COP $33,333
WMT $40,010
WFC $41,569
IBM $52,395
EMC $33,333
KFT $40,010
JCP $41,569
PG $52,395
PFE $33,333
CIT $40,010
S $41,569
STX $52,395
Total $100,000 $120,030 $124,708 $157,186
c15.indd 146c15.indd 146 27-05-2013 11:26:3727-05-2013 11:26:37
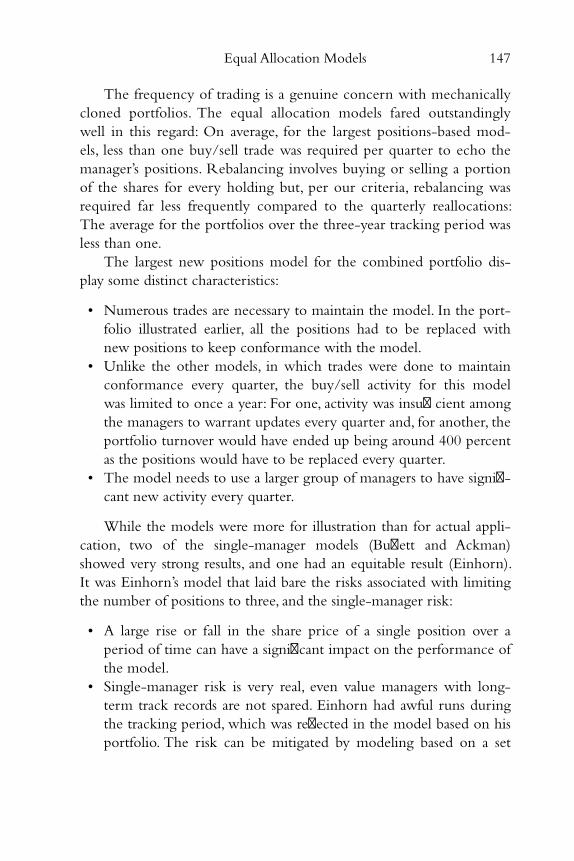
Equal Allocation Models 147
The frequency of trading is a genuine concern with mechanically
cloned portfolios. The equal allocation models fared outstandingly
well in this regard: On average, for the largest positions-based mod-
els, less than one buy/sell trade was required per quarter to echo the
manager ’s positions. Rebalancing involves buying or selling a portion
of the shares for every holding but, per our criteria, rebalancing was
required far less frequently compared to the quarterly reallocations:
The average for the portfolios over the three-year tracking period was
less than one.
The largest new positions model for the combined portfolio dis-
play some distinct characteristics:
• Numerous trades are necessary to maintain the model. In the port-
folio illustrated earlier, all the positions had to be replaced with
new positions to keep conformance with the model.
• Unlike the other models, in which trades were done to maintain
conformance every quarter, the buy/sell activity for this model
was limited to once a year: For one, activity was insuffi cient among
the managers to warrant updates every quarter and, for another, the
portfolio turnover would have ended up being around 400 percent
as the positions would have to be replaced every quarter.
• The model needs to use a larger group of managers to have signifi -
cant new activity every quarter.
While the models were more for illustration than for actual appli-
cation, two of the single-manager models (Buff ett and Ackman)
showed very strong results, and one had an equitable result (Einhorn).
It was Einhorn ’s model that laid bare the risks associated with limiting
the number of positions to three, and the single-manager risk:
• A large rise or fall in the share price of a single position over a
period of time can have a signifi cant impact on the performance of
the model.
• Single-manager risk is very real, even value managers with long-
term track records are not spared. Einhorn had awful runs during
the tracking period, which was refl ected in the model based on his
portfolio. The risk can be mitigated by modeling based on a set
c15.indd 147c15.indd 147 27-05-2013 11:26:3727-05-2013 11:26:37

148 p r o f i t i n g f r o m h e d g e f u n d s
of such managers. This is confi rmed by our combined largest posi-
tions model that strongly outperformed the S&P 500 Index.
To conclude, the small window of three years is obviously way
too small to prove the mettle of these models; the sharpest tool in the
arsenal for the kind of money managers followed is undoubtedly time.
The illustrations bring to the fore single-manager risk and concentra-
tion risk. Real cloning models should employ at least ten positions.
They should also consider using the combined portfolio approach with
upward of fi ve managers.
c15.indd 148c15.indd 148 27-05-2013 11:26:3727-05-2013 11:26:37
149
Chapter 16
Weighted Allocation Models
Weighted allocation brings character to cloning. Models
based on weighted allocation attempt to draw benefi t
from the relative size of the stock picks held in source
managers’ portfolios.
The process of assembling the models from a determined number
of stock picks from a single manager or a group of managers based on
selection criteria is similar to the equal allocation model described in
chapter 15 . The weighted model takes wing when it comes to allotting
assets: Distribution is done based on a weightage associated with each
pick. This weightage is derived from the percentage allocation in the
source manager portfolios.
c16.indd 149c16.indd 149 27-05-2013 11:51:5427-05-2013 11:51:54
150 p r o f i t i n g f r o m h e d g e f u n d s
This chapter presents the evolution of fi ve diff erent weighted alloca-
tion model portfolios from the three shortlisted managers: Bill Ackman,
Warren Buff ett, and David Einhorn. The diff erent types are:
• Three single-manager weighted allocation models demonstrating
the manager ’s largest three positions individually.
• A combined weighted allocation portfolio displaying the largest
position of the three managers.
• A combined weighted allocation portfolio based on the largest
new position of the selected three managers.
Applying quarterly updates to get the portfolios to conform to
the models involve signifi cant trading activity. As with the equal allo-
cation model, a buy/sell trade is necessary whenever the stock picks
change. Things can get cranking if, in the weighted allocation model,
the weightage of the new pick is diff erent from the weightage of the
previous quarter ’s pick it replaced. In such cases, to restore the weight-
ages, rebalancing becomes necessary. Rebalancing can also come calling
when the weightage changes for any of the stock picks. As the odds are
good for at least one of these events to happen, rebalancing trades
are done every quarter.
Portfolio Management and Performance Analysis
A portfolio of $100,000 and an inception date of August 17, 2009
(the fi rst trading day following the deadline for fi ling 13Fs for Q2
2009) were the assumptions for building these models. At launch
time, the $100,000 was distributed among the positions chosen from
the manager ’s portfolio, as indicated in their Q2 2009 13F using pre-
set weightage ratios. Depending on the model, the picks could be
the manager ’s largest or largest new position(s). The updates are made
(including rebalancing) 45 days after every quarter for each model.
Dividend income is ignored to provide a precise comparison with the
S&P 500 Index performance.
The weighted allocation model does not provide guidance as to
what weightages to use or how to map the source portfolio percentage
allocations. To make the illustrations easy to understand, a minimalist
c16.indd 150c16.indd 150 27-05-2013 11:51:5427-05-2013 11:51:54
Weighted Allocation Models 151
three-term ratio of 1:2:3 is used for all fi ve models. The following con-
ventions are used for mapping the largest position(s) based models:
• Weightage 1, if the value of the holdings for the stock pick in the
source portfolio is less than 10 percent of the corresponding 13F
total portfolio value.
• Weightage 2, if the value of the holdings for the stock pick in the
source portfolio is between 10 percent and 20 percent of the cor-
responding 13F total portfolio value.
• Weightage 3, if the value of the holdings for the stock pick in the
source portfolio is above 20 percent of the corresponding 13F total
portfolio value.
Bill Ackman: Largest Three
Table 16.1 (A&B) illustrates the model portfolio based on Ackman ’s
largest three positions with an inception date of August 17, 2009, and
its progression for the next three years.
The second column (8/17/2009) represents the initial alloca-
tion of the $100,000 portfolio across the largest three positions of
Ackman ’s Q2 2009 13F. The following columns depict the mechanics
of the portfolio ’s progression on a quarterly basis per the correspond-
ing 13F on the date indicated in the header row after updates and
rebalancing.
At the time of initial allocation, Automatic Data Processing
(ADP) qualifi ed for 2 points, while EMC Corporation (EMC) and
Target Corporation (TGT) both claimed eligibility for 3 points.
These weightages were justifi ed by their allocations in Ackman ’s
13F fi ling for Q2 2009: 11.34 percent for ADP, 33.89 percent
for EMC, and an unbelievable 43.28 percent for TGT. The assets
were spread in the ratio 2:3:3 among ADP, EMC, and TGT respec-
tively as represented in second column (08/17/2009). The next col-
umn (11/16/2009) is the portfolio progression after the Q3 2009
13F fi ling and refl ects the score after updates and rebalancing. EMC
and TGT retained their top rankings but McDonald ’s (MCD),
which replaced ADP as a top three holding, had to be content with
c16.indd 151c16.indd 151 27-05-2013 11:51:5427-05-2013 11:51:54
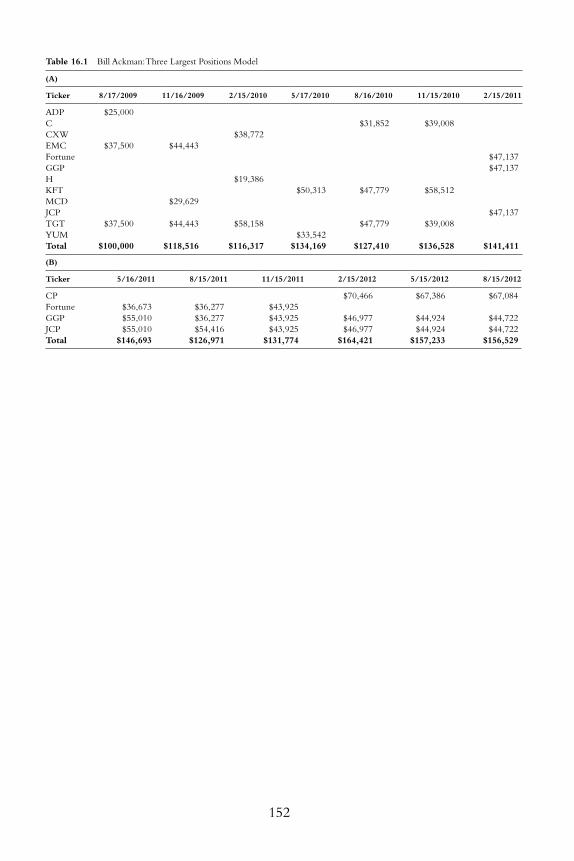
152
Table 16.1 Bill Ackman: Three Largest Positions Model
(A)
Ticker 8/17/2009 11/16/2009 2/15/2010 5/17/2010 8/16/2010 11/15/2010 2/15/2011
ADP $25,000
C $31,852 $39,008
CXW $38,772
EMC $37,500 $44,443
Fortune $47,137
GGP $47,137
H $19,386
KFT $50,313 $47,779 $58,512
MCD $29,629
JCP $47,137
TGT $37,500 $44,443 $58,158 $47,779 $39,008
YUM $33,542
Total $100,000 $118,516 $116,317 $134,169 $127,410 $136,528 $141,411
(B)
Ticker 5/16/2011 8/15/2011 11/15/2011 2/15/2012 5/15/2012 8/15/2012
CP $70,466 $67,386 $67,084
Fortune $36,673 $36,277 $43,925
GGP $55,010 $36,277 $43,925 $46,977 $44,924 $44,722
JCP $55,010 $54,416 $43,925 $46,977 $44,924 $44,722
Total $146,693 $126,971 $131,774 $164,421 $157,233 $156,529
c16.indd 152c16.indd 152 27-05-2013 11:51:5427-05-2013 11:51:54
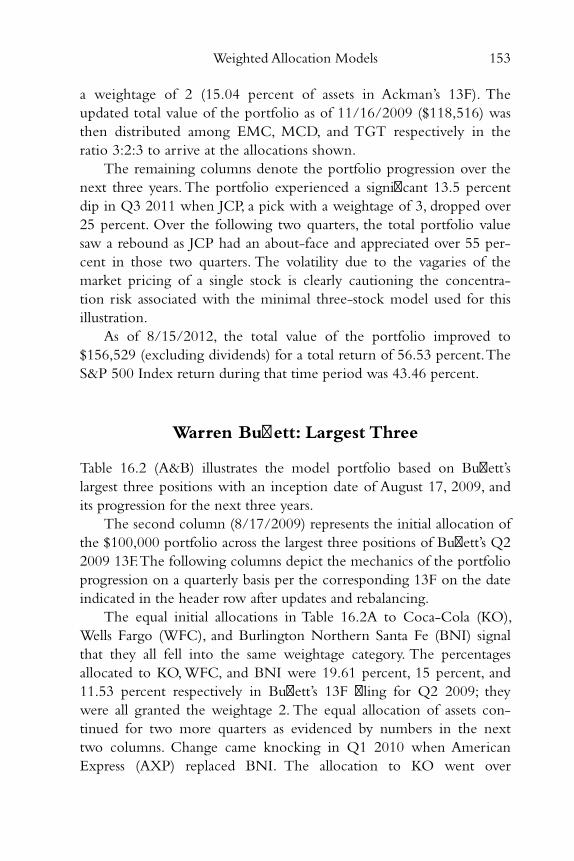
Weighted Allocation Models 153
a weightage of 2 (15.04 percent of assets in Ackman ’s 13F). The
updated total value of the portfolio as of 11/16/2009 ($118,516) was
then distributed among EMC, MCD, and TGT respectively in the
ratio 3:2:3 to arrive at the allocations shown.
The remaining columns denote the portfolio progression over the
next three years. The portfolio experienced a signifi cant 13.5 percent
dip in Q3 2011 when JCP, a pick with a weightage of 3, dropped over
25 percent. Over the following two quarters, the total portfolio value
saw a rebound as JCP had an about-face and appreciated over 55 per-
cent in those two quarters. The volatility due to the vagaries of the
market pricing of a single stock is clearly cautioning the concentra-
tion risk associated with the minimal three-stock model used for this
illustration.
As of 8/15/2012, the total value of the portfolio improved to
$156,529 (excluding dividends) for a total return of 56.53 percent. The
S&P 500 Index return during that time period was 43.46 percent.
Warren Buff ett: Largest Three
Table 16.2 (A&B) illustrates the model portfolio based on Buff ett ’s
largest three positions with an inception date of August 17, 2009, and
its progression for the next three years.
The second column (8/17/2009) represents the initial allocation of
the $100,000 portfolio across the largest three positions of Buff ett ’s Q2
2009 13F. The following columns depict the mechanics of the portfolio
progression on a quarterly basis per the corresponding 13F on the date
indicated in the header row after updates and rebalancing.
The equal initial allocations in Table 16.2 A to Coca-Cola (KO),
Wells Fargo (WFC), and Burlington Northern Santa Fe (BNI) signal
that they all fell into the same weightage category. The percentages
allocated to KO, WFC, and BNI were 19.61 percent, 15 percent, and
11.53 percent respectively in Buff ett ’s 13F fi ling for Q2 2009; they
were all granted the weightage 2. The equal allocation of assets con-
tinued for two more quarters as evidenced by numbers in the next
two columns. Change came knocking in Q1 2010 when American
Express (AXP) replaced BNI. The allocation to KO went over
c16.indd 153c16.indd 153 27-05-2013 11:51:5427-05-2013 11:51:54

154
Table 16.2 Warren Buff ett’s Largest Three Positions Model
(A)
Ticker 8/17/2009 11/16/2009 2/15/2010 5/17/2010 8/16/2010 11/15/2010 2/15/2011
AXP $35,275 $34,069 $36,938 $35,140
KO $33,333 $36,925 $38,643 $52,912 $51,104 $55,407 $52,710
WFC $33,333 $36,925 $38,643 $35,275 $34,069 $36,938 $52,710
BNI $33,333 $36,925 $38,643
Total $100,000 $110,775 $115,929 $123,462 $119,242 $129,282 $140,559
(B)
Ticker 5/16/2011 8/15/2011 11/15/2011 2/15/2012 5/15/2012 8/15/2012
AXP $34,568 $37,239
KO $51,852 $55,858 $57,399 $61,012 $51,292 $67,667
IBM $38,266 $40,675 $51,292 $45,112
WFC $51,852 $37,239 $38,266 $40,675 $51,292 $45,112
Total $138,273 $130,336 $133,930 $142,361 $153,876 $157,890
c16.indd 154c16.indd 154 27-05-2013 11:51:5427-05-2013 11:51:54
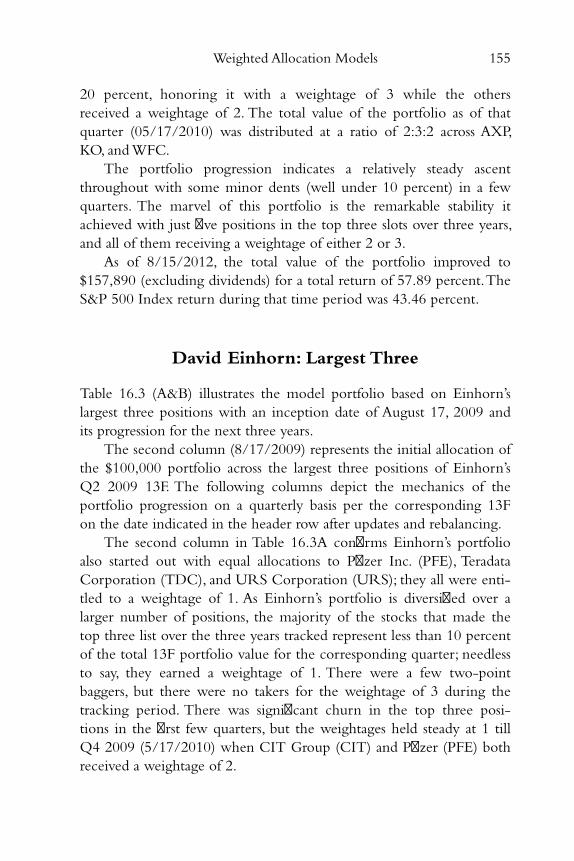
Weighted Allocation Models 155
20 percent, honoring it with a weightage of 3 while the others
received a weightage of 2. The total value of the portfolio as of that
quarter (05/17/2010) was distributed at a ratio of 2:3:2 across AXP,
KO, and WFC.
The portfolio progression indicates a relatively steady ascent
throughout with some minor dents (well under 10 percent) in a few
quarters. The marvel of this portfolio is the remarkable stability it
achieved with just fi ve positions in the top three slots over three years,
and all of them receiving a weightage of either 2 or 3.
As of 8/15/2012, the total value of the portfolio improved to
$157,890 (excluding dividends) for a total return of 57.89 percent. The
S&P 500 Index return during that time period was 43.46 percent.
David Einhorn: Largest Three
Table 16.3 (A&B) illustrates the model portfolio based on Einhorn ’s
largest three positions with an inception date of August 17, 2009 and
its progression for the next three years.
The second column (8/17/2009) represents the initial allocation of
the $100,000 portfolio across the largest three positions of Einhorn ’s
Q2 2009 13F. The following columns depict the mechanics of the
portfolio progression on a quarterly basis per the corresponding 13F
on the date indicated in the header row after updates and rebalancing.
The second column in Table 16.3 A confi rms Einhorn ’s portfolio
also started out with equal allocations to Pfi zer Inc. (PFE), Teradata
Corporation (TDC), and URS Corporation (URS); they all were enti-
tled to a weightage of 1. As Einhorn ’s portfolio is diversifi ed over a
larger number of positions, the majority of the stocks that made the
top three list over the three years tracked represent less than 10 percent
of the total 13F portfolio value for the corresponding quarter; needless
to say, they earned a weightage of 1. There were a few two-point
baggers, but there were no takers for the weightage of 3 during the
tracking period. There was signifi cant churn in the top three posi-
tions in the fi rst few quarters, but the weightages held steady at 1 till
Q4 2009 (5/17/2010) when CIT Group (CIT) and Pfi zer (PFE) both
received a weightage of 2.
c16.indd 155c16.indd 155 27-05-2013 11:51:5527-05-2013 11:51:55
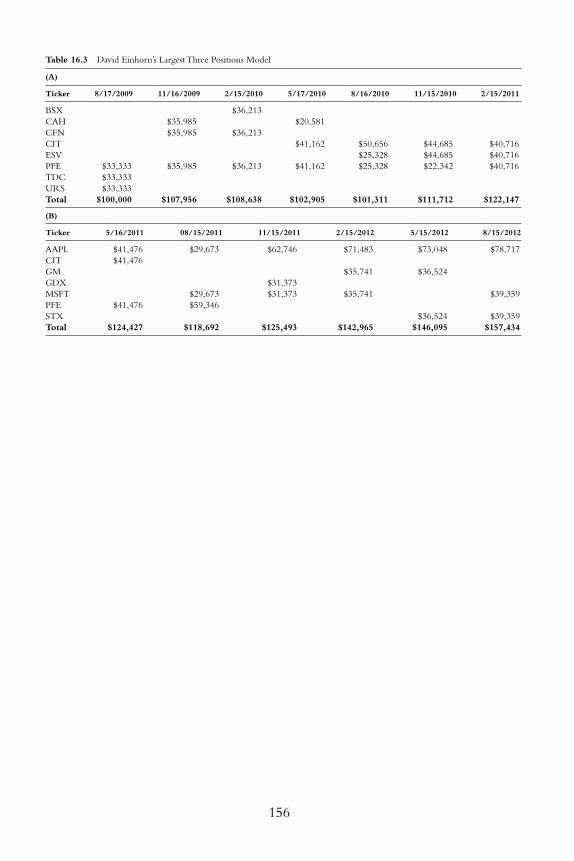
156
Table 16.3 David Einhorn’s Largest Three Positions Model
(A)
Ticker 8/17/2009 11/16/2009 2/15/2010 5/17/2010 8/16/2010 11/15/2010 2/15/2011
BSX $36,213
CAH $35,985 $20,581
CFN $35,985 $36,213
CIT $41,162 $50,656 $44,685 $40,716
ESV $25,328 $44,685 $40,716
PFE $33,333 $35,985 $36,213 $41,162 $25,328 $22,342 $40,716
TDC $33,333
URS $33,333
Total $100,000 $107,956 $108,638 $102,905 $101,311 $111,712 $122,147
(B)
Ticker 5/16/2011 08/15/2011 11/15/2011 2/15/2012 5/15/2012 8/15/2012
AAPL $41,476 $29,673 $62,746 $71,483 $73,048 $78,717
CIT $41,476
GM $35,741 $36,524
GDX $31,373
MSFT $29,673 $31,373 $35,741 $39,359
PFE $41,476 $59,346
STX $36,524 $39,359
Total $124,427 $118,692 $125,493 $142,965 $146,095 $157,434
c16.indd 156c16.indd 156 27-05-2013 11:51:5527-05-2013 11:51:55
Weighted Allocation Models 157
The portfolio progression point to below-par performance
during the fi rst year—returns as of 8/16/2010 were just above
breakeven. The value of the three positions steadily increased for
the next two quarters and, by 5/16/2011, the portfolio reached
a total value of $124,427. With its vast outperformance, Apple Inc.
(AAPL) shouldered the portfolio for the rest of the tracking period.
The weightage ratio method was an improvement over the equal-
allocation model in this case, as AAPL received double the allocation
compared to the other two positions during the last four quarters:
AAPL in Einhorn ’s portfolio was well over 10 percent, thus receiv-
ing a weightage of 2, while the other two positions remained at a
weightage of 1.
As of 8/15/2012, the total value of the portfolio improved to
$157,434 (excluding dividends) for a total return of 57.43 percent. The
S&P 500 Index return during that time period was 43.46 percent.
Combined Portfolio: Largest Positions
Table 16.4 (A&B) illustrates the model portfolio, based on the largest
position from each of the three managers with an inception date of
August 17, 2009, and its progression over the next three years.
The columns display the portfolio allocation on the date indi-
cated in the header row. The second column (8/17/2009) represents
the initial allocation of the $100,000 portfolio across the largest three
positions of Ackman, Buff ett, and Einhorn per their Q2 2009 13F. The
following columns depict the mechanics of the portfolio progression
on a quarterly basis per the corresponding 13F on the date indicated in
the header row after updates and rebalancing.
The second column in Table 16.4 A shows a weightage ratio of
2:3:1 applied across Coca-Cola (KO), Target Corporation (TGT), and
Pfi zer Inc. (PFE) respectively. The percentage allocations of these stocks
in the 13F portfolios of Buff ett, Ackman, and Einhorn as of Q2 2009
were 19.61 percent, 43.28 percent, and 6.34 percent in that order. The
positions and the allocation ratios continued for one more quarter. In
Q4 2009, Einhorn ’s top pick shifted—PFE was replaced with CIT
Group (CIT) without any weightage change. Buff ett ’s top pick did
c16.indd 157c16.indd 157 27-05-2013 11:51:5527-05-2013 11:51:55
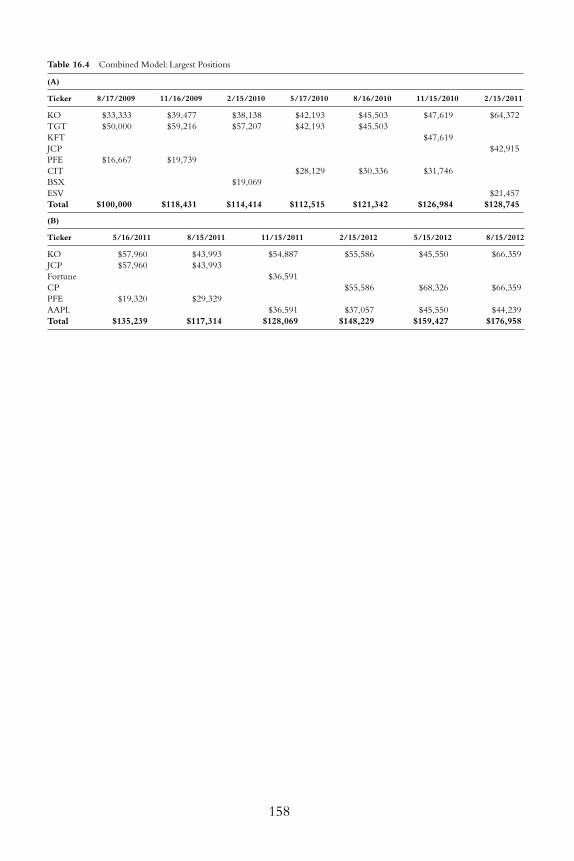
Table 16.4 Combined Model: Largest Positions
(A)
Ticker 8/17/2009 11/16/2009 2/15/2010 5/17/2010 8/16/2010 11/15/2010 2/15/2011
KO $33,333 $39,477 $38,138 $42,193 $45,503 $47,619 $64,372
TGT $50,000 $59,216 $57,207 $42,193 $45,503
KFT $47,619
JCP $42,915
PFE $16,667 $19,739
CIT $28,129 $30,336 $31,746
BSX $19,069
ESV $21,457
Total $100,000 $118,431 $114,414 $112,515 $121,342 $126,984 $128,745
(B)
Ticker 5/16/2011 8/15/2011 11/15/2011 2/15/2012 5/15/2012 8/15/2012
KO $57,960 $43,993 $54,887 $55,586 $45,550 $66,359
JCP $57,960 $43,993
Fortune $36,591
CP $55,586 $68,326 $66,359
PFE $19,320 $29,329
AAPL $36,591 $37,057 $45,550 $44,239
Total $135,239 $117,314 $128,069 $148,229 $159,427 $176,958
158
c16.indd 158c16.indd 158 27-05-2013 11:51:5527-05-2013 11:51:55
Weighted Allocation Models 159
not change throughout the three-year tracking period. However, the
allocation hovered around 20 percent, causing the weightage to shift
between 2 and 3 several times. The essence of Ackman ’s concentrated
portfolio was soundly captured by the model as almost all his top picks
(except two) were awarded a weightage of 3; they consistently had an
allocation well over 20 percent in the source portfolio. Einhorn ’s diver-
sifi cation translated to his top picks always having an allocation less
than 20 percent. Accordingly, the picks from his portfolio had to be
content with a weightage of 1 or 2.
The portfolio progression indicated steady growth for the most
part. One major disappointment occurred in Q2 2011, when JCP
dropped over 25 percent. JCP at that time had a weightage of 3 and
the allocation was ~43 percent in the model. All told, the model
dropped by over 13 percent that quarter. The last three quarters dem-
onstrated a huge bounce back as the top picks of Ackman (Canadian
Pacifi c: CP) and Einhorn (Apple Inc.: AAPL) posted handsome
returns.
As of 8/15/2012, the total value of the portfolio improved to
$176,958 (excluding dividends) for a total return of 76.96 percent. The
S&P 500 Index return during that time period was 43.36 percent.
Combined Portfolio: Largest New Positions
Table 16.5 illustrates the model portfolio based on the largest new
position from each of the three managers with an inception date of
August 17, 2009, and its progression over the next three years.
The columns display the portfolio allocation on the date indicated
in the header row. The second column (8/17/2009) represents the ini-
tial allocation of the $100,000 portfolio across the three largest new
positions of Ackman, Buff ett, and Einhorn per their Q2 2009 13F. The
remaining columns depict the mechanics of the portfolio progression
on a quarterly basis per the corresponding 13F on the date indicated in
the header row after updates and rebalancing.
Similar to the equal allocation model described in the previous
chapter, the updates to this model are also performed only annually
c16.indd 159c16.indd 159 27-05-2013 11:51:5527-05-2013 11:51:55
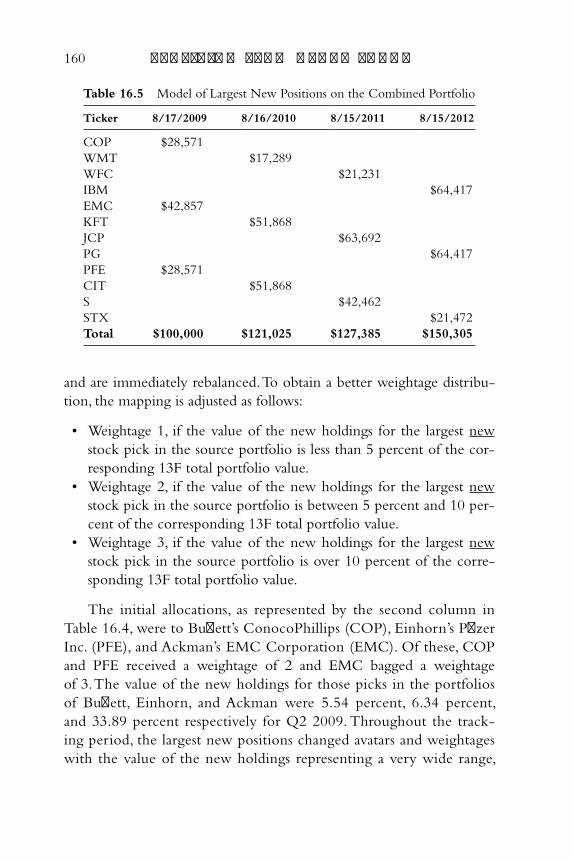
160 p r o f i t i n g f r o m h e d g e f u n d s
and are immediately rebalanced. To obtain a better weightage distribu-
tion, the mapping is adjusted as follows:
• Weightage 1, if the value of the new holdings for the largest new
stock pick in the source portfolio is less than 5 percent of the cor-
responding 13F total portfolio value.
• Weightage 2, if the value of the new holdings for the largest new
stock pick in the source portfolio is between 5 percent and 10 per-
cent of the corresponding 13F total portfolio value.
• Weightage 3, if the value of the new holdings for the largest new
stock pick in the source portfolio is over 10 percent of the corre-
sponding 13F total portfolio value.
The initial allocations, as represented by the second column in
Table 16.4 , were to Buff ett ’s ConocoPhillips (COP), Einhorn ’s Pfi zer
Inc. (PFE), and Ackman ’s EMC Corporation (EMC). Of these, COP
and PFE received a weightage of 2 and EMC bagged a weightage
of 3. The value of the new holdings for those picks in the portfolios
of Buff ett, Einhorn, and Ackman were 5.54 percent, 6.34 percent,
and 33.89 percent respectively for Q2 2009. Throughout the track-
ing period, the largest new positions changed avatars and weightages
with the value of the new holdings representing a very wide range,
Table 16.5 Model of Largest New Positions on the Combined Portfolio
Ticker 8/17/2009 8/16/2010 8/15/2011 8/15/2012
COP $28,571
WMT $17,289
WFC $21,231
IBM $64,417
EMC $42,857
KFT $51,868
JCP $63,692
PG $64,417
PFE $28,571
CIT $51,868
S $42,462
STX $21,472
Total $100,000 $121,025 $127,385 $150,305
c16.indd 160c16.indd 160 27-05-2013 11:51:5527-05-2013 11:51:55
Weighted Allocation Models 161
from 0.85 percent (Buff ett ’s largest new position for Q2 2011) to
33.89 percent (Ackman ’s largest new position for Q2 2009).
As of 8/15/2012, the total value of the portfolio improved to
$150,305 (excluding dividends) for a total return of 50.31 percent. The
S&P 500 Index return during that time period was 43.46 percent.
Summary
The chapter demonstrated how to manage and mechanically maintain
weighted allocation based model portfolios. In general, such portfo-
lios are trade intensive, as in every quarter both the weightage and the
positions involved can change. In the models used, all positions were
tweaked after applying updates every quarter bringing the number of
trades involved equal to the number of positions. The number of trades
can be reduced by choosing to rebalance only if the weightages shifted
between quarters.
For actual implementation of the models, a more granular weight-
age ratio should be considered. The allocation mapping for a fi ve-term
weightage ratio of 1:2:3:4:5 can be worked out as: Weightage 1 for less
than 5 percent, 2 for between 5 percent and 10 percent, 3 for between
10 percent and 15 percent, 4 for between 15 percent and 20 percent,
and 5 for over 20 percent portfolio allocations respectively in the origi-
nal source portfolios. Such an allocation allows eff ective capture of
the manager ’s sentiment when the source portfolio is diversifi ed over
many positions and when using a combined model with a group of
managers.
The three single-manager weighted allocation models demon-
strated credit-worthy outperformance during the three-year tracking
period. While it is easy to be bowled over by the performance of these
models, it is worth recollecting that single-manager portfolios carry
risks. In fact, if these models were based on the portfolios of some
of the other managers introduced in Part I , the performance would
have been an eye opener. Specifi cally, over the time tracked, John
Paulson and Prem Watsa had some terrible picks among their top-
three positions, and the models would have picked up those selections,
causing signifi cant underperformance. Manager selection has a role in
c16.indd 161c16.indd 161 27-05-2013 11:51:5527-05-2013 11:51:55
162 p r o f i t i n g f r o m h e d g e f u n d s
mitigating this risk, but it is very normal for even reputable managers
that fi t the criteria of having a value-oriented bottom-up investment
approach to have periods of vast underperformance compared to the
market indexes.
The combined model using the largest positions showed the best
performance among the fi ve portfolio progressions illustrated. Since
there were only three positions in these minimalist models, a large
variation in the stock price of one or more of those positions will
immediately be refl ected in the model. The performance can fl uctuate
easily as it is entirely possible for the positions to underperform over a
tracking period. To cushion that blow, it is best to employ more posi-
tions in a real cloning model implementation.
The models illustrated how applying weightages to stock picks can
approximate the source portfolio allocations. While the weighted allo-
cation models succeed in capturing the largest positions, a downside is
that the other large positions are completely unheeded by the model.
This is true with the equal allocation based model as well. On the
other hand, limiting the number of positions makes the management
of the cloned portfolios simpler. Overall, such models are a very good
tool by which to implement cloning strategies.
c16.indd 162c16.indd 162 27-05-2013 11:51:5527-05-2013 11:51:55
163
Chapter 17
Ten-Five-Two (10–5–2) Allocation Models
Ten-fi ve-two (10–5–2) allocation models endeavor to shadow a
manager ’s portfolio as diligently as possible. The numbers 10, 5,
and 2 represent the recommended percentage allocations of
individual positions in a well-diversifi ed portfolio. To put this model in
perspective, the allocation distribution for a reasonably sized portfolio of
twenty positions would be: 10 percent for the three highest conviction
positions, 5 percent for the next twelve positions, and 2 percent for the
remaining fi ve positions. For a healthier diversifi cation, the number of
positions at the upper end of the allocation spectrum is reduced and the
number at the lower end is increased. For example, if the number of
positions in the portfolio is increased to thirty, the allocation percentages
of this model could be: 10 percent for the two highest conviction posi-
tions, 5 percent for the next eight, and 2 percent for the remaining 20
positions.
c17.indd 163c17.indd 163 27-05-2013 11:27:4327-05-2013 11:27:43
164 p r o f i t i n g f r o m h e d g e f u n d s
The model can be used as is, provided the total number of posi-
tions in the source portfolio is within the range of 20 to 40. The
technique can be adapted to accommodate those portfolios whose
position size lie outside this range by adhering to the same alloca-
tion ratio but varying the percentage values. For example, an option to
model a portfolio with 60 positions would be to assign 5 percent
to four of the highest conviction positions, 2.5 percent for the next 16,
and 1 percent for each of the remaining 40 positions.
The chapter focuses on applying the model to the selections of
the shortlisted three managers: Bill Ackman, Warren Buff ett, and David
Einhorn, and presenting their progression over the last three years. As
this model aims to closely approximate the manager ’s source portfolio,
a comparison with exactly cloned versions of the manager portfolios
from their corresponding 13Fs is also included.
Portfolio Management and Performance Analysis
In keeping with the models in the prior chapters, the portfolio size
and the inception dates are set at $100,000 and August 17, 2009
(fi rst trading day following the deadline for fi ling 13Fs for Q2 2009)
for these models too. The number of positions used in the models is
directly related to the diversifi cation of the source portfolio. This num-
ber in turn determines the allocation ratios. The updated values, as
well as the progression of the portfolios, including rebalancing (45 days
after every quarter) are captured in the tables given. Dividend income
is ignored to provide a precise comparison with the S&P 500 Index
performance.
The model provides some leeway, as it does not mandate the num-
ber of positions for each percentage allocation. The guideline merely
calls for a very small number of highest conviction positions for the
10 percent allocation, a good number of high conviction positions for
the 5 percent allocation, and the rest for the 2 percent allocation. The
intent is to capture the quintessence of the whole portfolio by elimi-
nating tiny positions irrelevant to performance. A good rule of thumb
to decide on the number of positions with portfolios that are not too
diversifi ed is to use the number after eliminating those position sizes
c17.indd 164c17.indd 164 27-05-2013 11:27:4327-05-2013 11:27:43
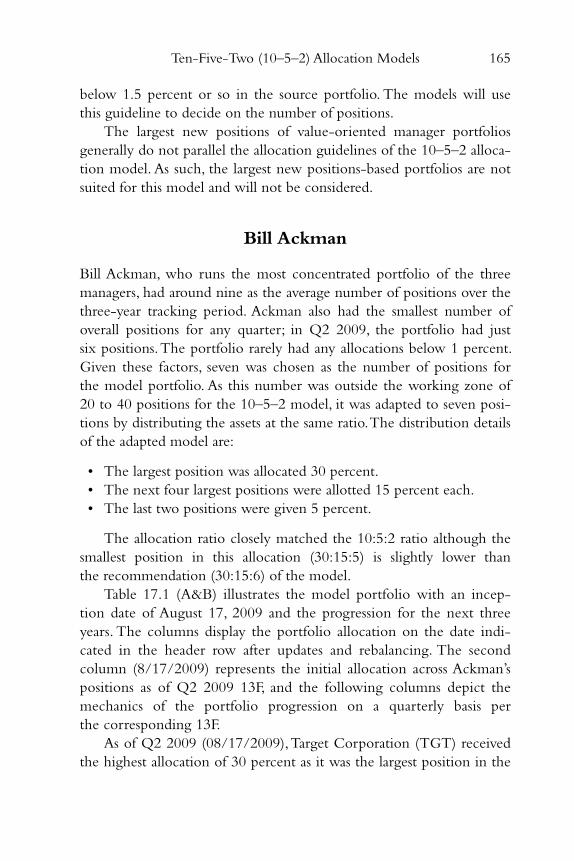
Ten-Five-Two (10–5–2) Allocation Models 165
below 1.5 percent or so in the source portfolio. The models will use
this guideline to decide on the number of positions.
The largest new positions of value-oriented manager portfolios
generally do not parallel the allocation guidelines of the 10–5–2 alloca-
tion model. As such, the largest new positions-based portfolios are not
suited for this model and will not be considered.
Bill Ackman
Bill Ackman, who runs the most concentrated portfolio of the three
managers, had around nine as the average number of positions over the
three-year tracking period. Ackman also had the smallest number of
overall positions for any quarter; in Q2 2009, the portfolio had just
six positions. The portfolio rarely had any allocations below 1 percent.
Given these factors, seven was chosen as the number of positions for
the model portfolio. As this number was outside the working zone of
20 to 40 positions for the 10–5–2 model, it was adapted to seven posi-
tions by distributing the assets at the same ratio. The distribution details
of the adapted model are:
• The largest position was allocated 30 percent.
• The next four largest positions were allotted 15 percent each.
• The last two positions were given 5 percent.
The allocation ratio closely matched the 10:5:2 ratio although the
smallest position in this allocation (30:15:5) is slightly lower than
the recommendation (30:15:6) of the model.
Table 17.1 (A&B) illustrates the model portfolio with an incep-
tion date of August 17, 2009 and the progression for the next three
years. The columns display the portfolio allocation on the date indi-
cated in the header row after updates and rebalancing. The second
column (8/17/2009) represents the initial allocation across Ackman ’s
positions as of Q2 2009 13F, and the following columns depict the
mechanics of the portfolio progression on a quarterly basis per
the corresponding 13F.
As of Q2 2009 (08/17/2009), Target Corporation (TGT) received
the highest allocation of 30 percent as it was the largest position in the
c17.indd 165c17.indd 165 27-05-2013 11:27:4327-05-2013 11:27:43
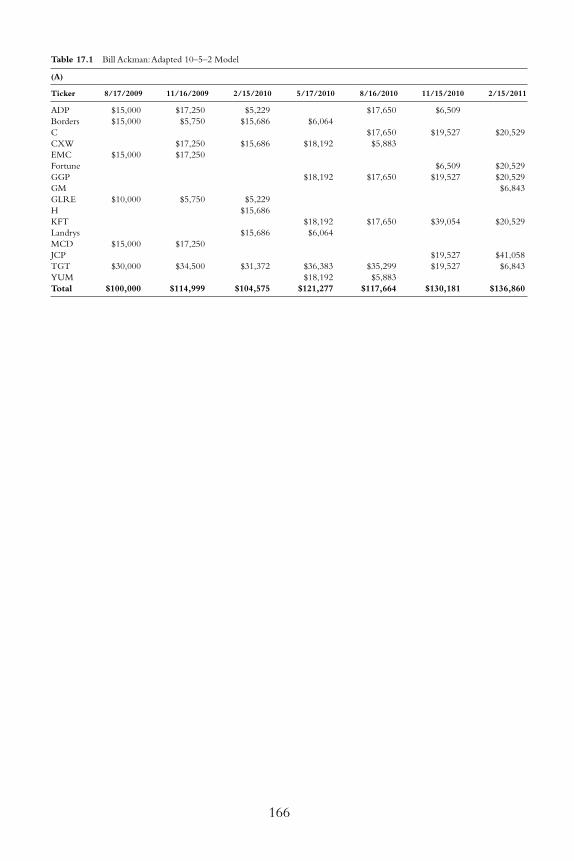
166
Table 17.1 Bill Ackman: Adapted 10–5–2 Model
(A)
Ticker 8/17/2009 11/16/2009 2/15/2010 5/17/2010 8/16/2010 11/15/2010 2/15/2011
ADP $15,000 $17,250 $5,229 $17,650 $6,509
Borders $15,000 $5,750 $15,686 $6,064
C $17,650 $19,527 $20,529
CXW $17,250 $15,686 $18,192 $5,883
EMC $15,000 $17,250
Fortune $6,509 $20,529
GGP $18,192 $17,650 $19,527 $20,529
GM $6,843
GLRE $10,000 $5,750 $5,229
H $15,686
KFT $18,192 $17,650 $39,054 $20,529
Landrys $15,686 $6,064
MCD $15,000 $17,250
JCP $19,527 $41,058
TGT $30,000 $34,500 $31,372 $36,383 $35,299 $19,527 $6,843
YUM $18,192 $5,883
Total $100,000 $114,999 $104,575 $121,277 $117,664 $130,181 $136,860
c17.indd 166c17.indd 166 27-05-2013 11:27:4327-05-2013 11:27:43

167
(B)
Ticker 5/16/2011 8/15/2011 11/15/2011 2/15/2012 5/15/2012 8/15/2012
ALEX $6,882 $7,257
BEAM $21,490 $21,355 $21,772
CP $42,980 $42,710 $21,772
C $20,645 $17,685 $18,054 $7,163 $21,355
FDO $5,895 $6,018 $7,163
FBHS $7,118
Fortune $20,645 $17,685 $36,108
GGP $20,645 $17,685 $18,054 $21,490 $21,355 $21,772
HHC $6,882 $5,895 $7,257
KFT $20,645 $17,685 $18,054 $21,490 $7,118
LOW $6,018
JCP $41,291 $35,369 $18,054 $21,490 $21,355 $21,772
PG $43,543
Total $137,637 $117,897 $120,362 $143,266 $142,366 $145,143
c17.indd 167c17.indd 167 27-05-2013 11:27:4327-05-2013 11:27:43
168 p r o f i t i n g f r o m h e d g e f u n d s
source portfolio. The next four positions—Automatic Data Processing
(ADP), Borders, EMC Corporation (EMC), and McDonald ’s
(MCD)—each received 15 percent of the assets. As Ackman only held
six positions then, the last position, Greenlight Capital Re (GLRE),
received 10 percent of the assets instead of the 5 percent recommended
by the model. The next column (11/16/2009) indicates the portfolio
progression after Ackman ’s Q3 2009 13F fi ling (after updates and rebal-
ancing). This time around, as the source portfolio had seven positions,
the assets were distributed per the model. Though Target Corporation
(TGT) continued as the highest position, there was churn in a cou-
ple of other positions—Corrections Corp. of America (CXW), a new
position, received a 15 percent allocation while Borders slipped from
15 percent to a 5 percent allocation.
The tactic behind the values assigned to positions in the remain-
ing columns is very straightforward: The updated total value of the
portfolio for the corresponding quarter is distributed among the seven
largest positions per the allocation ratio. For example, for Q4 2009
(2/15/2010), the largest seven positions in decreasing order of size
in the source portfolio were Target Corporation (TGT), Corrections
Corp. of America (CXW), Hyatt (H), Landrys, Borders, Greenlight
Capital Re (GLRE), and Automatic Data Processing (ADP). The
updated total portfolio value of $104,575 was distributed across those
positions at 30 percent, 15 percent, 15 percent, 15 percent, 15 percent,
5 percent, and 5 percent respectively.
As of 8/15/2012, the total value of the portfolio improved to
$145,143 (excluding dividends) for a total return of 45.14 percent. The
S&P 500 Index return during that time period was 43.46 percent.
Warren Buff ett
Over the tracking period, Buff ett held a diversifi ed portfolio with
around 35 positions on average. From a mimicking standpoint,
a number of his minute positions (less than 1 percent allocation) can
be categorized as noise. For the model, 14 was the favored number as
that comprised most positions with an allocation above 1.5 percent. As
this number was outside the operating zone of 20 to 40 for the 10–5–2
c17.indd 168c17.indd 168 27-05-2013 11:27:4327-05-2013 11:27:43
Ten-Five-Two (10–5–2) Allocation Models 169
model, it was adapted to 14 positions by distributing the assets at the
same ratio. The distribution is detailed here:
• The largest two positions were issued 15 percent each.
• The next eight largest positions 7.5 percent each.
• The last four positions 2.5 percent.
The allocation ratio of 15:7.5:2.5 matched the 10:5:2 ratio almost
exactly, although the smallest positions were granted a slightly lower
allocation compared to the recommendation (15:7.5:3) of the model.
Table 17.2 (A&B) illustrates the model portfolio with an inception
date of August 17, 2009 and the progression for the next three years.
The columns display the portfolio allocation on the date indicated
in the header row after updates and rebalancing. The second column
(8/17/2009) represents the initial allocation across Buff ett ’s positions as
of Q2 2009 13F, and the following columns depict the mechanics of
the portfolio progression on a quarterly basis per the corresponding 13F.
The model portfolio remained remarkably steady over the three-
year tracking period. Only 22 diff erent positions had a role in the
portfolio in the 12 quarters—given the portfolio size of 14, this meant
that only eight new stakes were introduced over the three years. The
allocation percentages also held fairly fi rm. The progression spread-
sheet brought to light a limitation with the model whereby under
certain rare scenarios allocations are changed unnecessarily between
quarters: Wells Fargo (WFC) had the highest allocation of 15 percent
from inception till Q2 2011. During Q3 2011, Buff ett initiated a very
large position in International Business Machines Corporation (IBM),
whose position size overtook Wells Fargo (WFC) by a slight margin
for that quarter. This margin, though slim, knocked Wells Fargo (WFC)
from its 15 percent pedestal to a 7.5 percent one. The allocation main-
tained status quo for one more quarter, but in Q1 2012 things took a
U-turn; the position size for Wells Fargo (WFC) marginally exceeded
that of International Business Machines (IBM) in Buff ett ’s portfolio
and the allocations had to be reversed in the model.
As of 8/15/2012, the total value of the portfolio improved to
$149,418 (excluding dividends) for a total return of 49.42 percent. The
S&P 500 Index return during that time period was 43.46 percent.
c17.indd 169c17.indd 169 27-05-2013 11:27:4327-05-2013 11:27:43
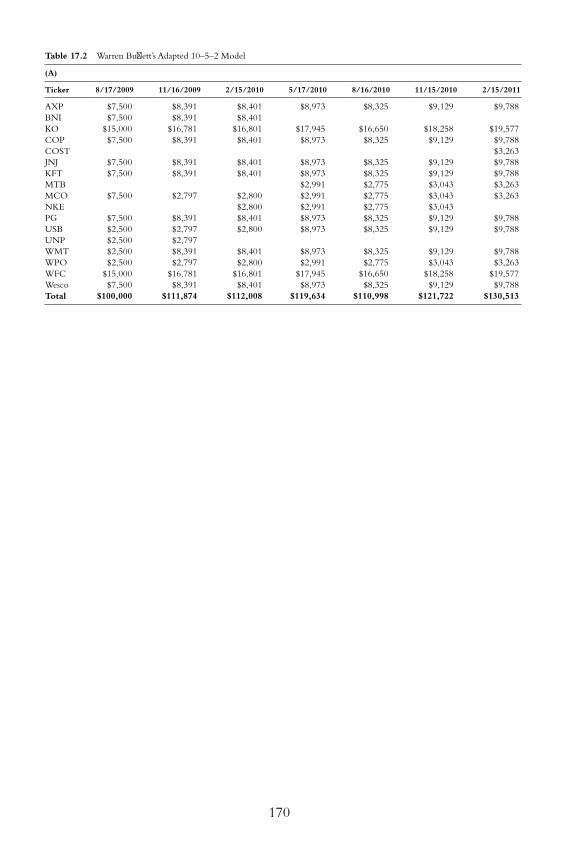
170
Table 17.2 Warren Buff ett’s Adapted 10–5–2 Model
(A)
Ticker 8/17/2009 11/16/2009 2/15/2010 5/17/2010 8/16/2010 11/15/2010 2/15/2011
AXP $7,500 $8,391 $8,401 $8,973 $8,325 $9,129 $9,788
BNI $7,500 $8,391 $8,401
KO $15,000 $16,781 $16,801 $17,945 $16,650 $18,258 $19,577
COP $7,500 $8,391 $8,401 $8,973 $8,325 $9,129 $9,788
COST $3,263
JNJ $7,500 $8,391 $8,401 $8,973 $8,325 $9,129 $9,788
KFT $7,500 $8,391 $8,401 $8,973 $8,325 $9,129 $9,788
MTB $2,991 $2,775 $3,043 $3,263
MCO $7,500 $2,797 $2,800 $2,991 $2,775 $3,043 $3,263
NKE $2,800 $2,991 $2,775 $3,043
PG $7,500 $8,391 $8,401 $8,973 $8,325 $9,129 $9,788
USB $2,500 $2,797 $2,800 $8,973 $8,325 $9,129 $9,788
UNP $2,500 $2,797
WMT $2,500 $8,391 $8,401 $8,973 $8,325 $9,129 $9,788
WPO $2,500 $2,797 $2,800 $2,991 $2,775 $3,043 $3,263
WFC $15,000 $16,781 $16,801 $17,945 $16,650 $18,258 $19,577
Wesco $7,500 $8,391 $8,401 $8,973 $8,325 $9,129 $9,788
Total $100,000 $111,874 $112,008 $119,634 $110,998 $121,722 $130,513
c17.indd 170c17.indd 170 27-05-2013 11:27:4327-05-2013 11:27:43
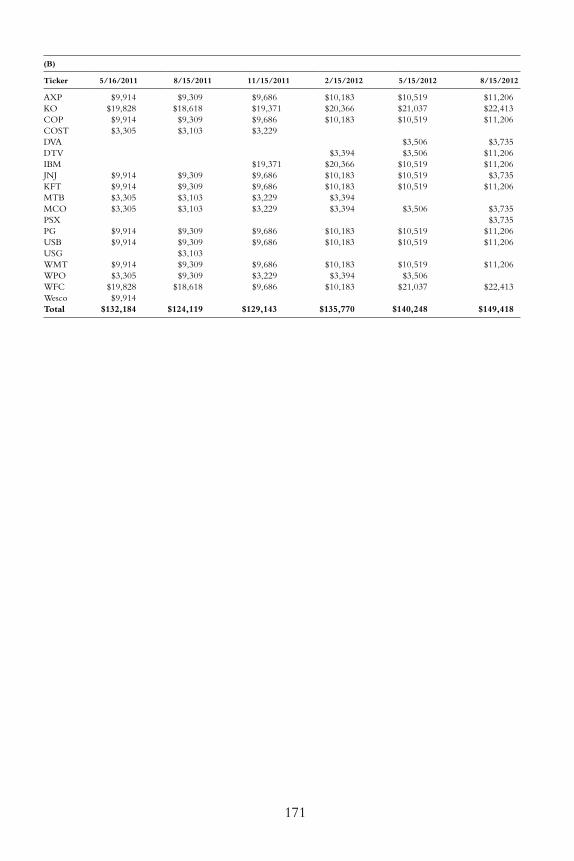
171
(B)
Ticker 5/16/2011 8/15/2011 11/15/2011 2/15/2012 5/15/2012 8/15/2012
AXP $9,914 $9,309 $9,686 $10,183 $10,519 $11,206
KO $19,828 $18,618 $19,371 $20,366 $21,037 $22,413
COP $9,914 $9,309 $9,686 $10,183 $10,519 $11,206
COST $3,305 $3,103 $3,229
DVA $3,506 $3,735
DTV $3,394 $3,506 $11,206
IBM $19,371 $20,366 $10,519 $11,206
JNJ $9,914 $9,309 $9,686 $10,183 $10,519 $3,735
KFT $9,914 $9,309 $9,686 $10,183 $10,519 $11,206
MTB $3,305 $3,103 $3,229 $3,394
MCO $3,305 $3,103 $3,229 $3,394 $3,506 $3,735
PSX $3,735
PG $9,914 $9,309 $9,686 $10,183 $10,519 $11,206
USB $9,914 $9,309 $9,686 $10,183 $10,519 $11,206
USG $3,103
WMT $9,914 $9,309 $9,686 $10,183 $10,519 $11,206
WPO $3,305 $9,309 $3,229 $3,394 $3,506
WFC $19,828 $18,618 $9,686 $10,183 $21,037 $22,413
Wesco $9,914
Total $132,184 $124,119 $129,143 $135,770 $140,248 $149,418
c17.indd 171c17.indd 171 27-05-2013 11:27:4427-05-2013 11:27:44
172 p r o f i t i n g f r o m h e d g e f u n d s
David Einhorn
Einhorn ran a more actively traded portfolio with over 40 posi-
tions on the average over the tracking period. The number of long
stock holdings during the timeframe exceeded over 120 diff erent
positions, although many of them were quite small (less than 1 per-
cent allocation). Given the large number of overall positions and
their allocations, at least 20 positions were required to do justice to
his signifi cant holdings. With 20 positions, the 10–5–2 model can
be applied directly. For a genuine implementation of this model
against Einhorn ’s portfolio, a higher number of positions should be
preferred, but 20 was chosen here to keep the illustrations simpler.
• The largest three positions were apportioned 10 percent each.
• The next 12 largest positions 5 percent each.
• The last fi ve positions 2 percent each.
Table 17.3 shows the model portfolio with an inception date
of August 17, 2009. To keep the table from getting unwieldy, the
data presented is limited to the fi rst two quarters and the last
two quarters. The columns display the portfolio allocation on the
date indicated in the header row after updates and rebalancing.
The second column (8/17/2009) represents the initial allocation
across Einhorn ’s positions as of Q2 2009 13F, and the next column
depicts the portfolio progression for the following quarter, per the
corresponding 13F. The data for the next 11 quarters are given a
miss and the last two columns present the data for Q1 2012 and
Q2 2012.
The model portfolio had 57 diff erent positions over the three years,
while Einhorn ’s 13F holdings over that tracking period easily doubled
that. The average churn between quarters was around six, which was
high compared to the model portfolios based on the other two
managers. The allocations also shifted signifi cantly between quarters
refl ecting Einhorn ’s more active trading philosophy—none of the top
three initial positions that had an allocation of 10 percent retained
their top allocation through the three-year tracking period. Pfi zer
(PFE), which had the longest run, was eliminated in Q3 2011. Apple
c17.indd 172c17.indd 172 27-05-2013 11:27:4427-05-2013 11:27:44
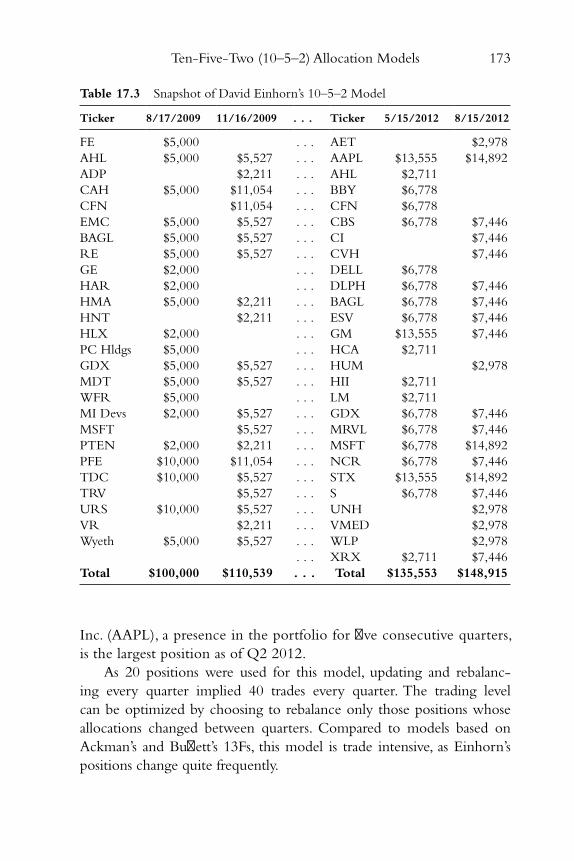
Ten-Five-Two (10–5–2) Allocation Models 173
Inc. (AAPL), a presence in the portfolio for fi ve consecutive quarters,
is the largest position as of Q2 2012.
As 20 positions were used for this model, updating and rebalanc-
ing every quarter implied 40 trades every quarter. The trading level
can be optimized by choosing to rebalance only those positions whose
allocations changed between quarters. Compared to models based on
Ackman ’s and Buff ett ’s 13Fs, this model is trade intensive, as Einhorn ’s
positions change quite frequently.
Table 17.3 Snapshot of David Einhorn’s 10–5–2 Model
Ticker 8/17/2009 11/16/2009 . . . Ticker 5/15/2012 8/15/2012
FE $5,000 . . . AET $2,978
AHL $5,000 $5,527 . . . AAPL $13,555 $14,892
ADP $2,211 . . . AHL $2,711
CAH $5,000 $11,054 . . . BBY $6,778
CFN $11,054 . . . CFN $6,778
EMC $5,000 $5,527 . . . CBS $6,778 $7,446
BAGL $5,000 $5,527 . . . CI $7,446
RE $5,000 $5,527 . . . CVH $7,446
GE $2,000 . . . DELL $6,778
HAR $2,000 . . . DLPH $6,778 $7,446
HMA $5,000 $2,211 . . . BAGL $6,778 $7,446
HNT $2,211 . . . ESV $6,778 $7,446
HLX $2,000 . . . GM $13,555 $7,446
PC Hldgs $5,000 . . . HCA $2,711
GDX $5,000 $5,527 . . . HUM $2,978
MDT $5,000 $5,527 . . . HII $2,711
WFR $5,000 . . . LM $2,711
MI Devs $2,000 $5,527 . . . GDX $6,778 $7,446
MSFT $5,527 . . . MRVL $6,778 $7,446
PTEN $2,000 $2,211 . . . MSFT $6,778 $14,892
PFE $10,000 $11,054 . . . NCR $6,778 $7,446
TDC $10,000 $5,527 . . . STX $13,555 $14,892
TRV $5,527 . . . S $6,778 $7,446
URS $10,000 $5,527 . . . UNH $2,978
VR $2,211 . . . VMED $2,978
Wyeth $5,000 $5,527 . . . WLP $2,978
. . . XRX $2,711 $7,446
Total $100,000 $110,539 . . . Total $135,553 $148,915
c17.indd 173c17.indd 173 27-05-2013 11:27:4427-05-2013 11:27:44
174 p r o f i t i n g f r o m h e d g e f u n d s
As of 8/15/2012, the total value of the portfolio improved to
$148,915 (excluding dividends) for a total return of 48.92 percent. The
S&P 500 Index return during that time period was 43.46 percent.
Summary
The chapter illustrated how to clone and mechanically maintain
single-manager–based model portfolios using 10–5–2 allocation tech-
niques. Trading requirements for such models were infl uenced by the
number of positions and the trading philosophy (active vs. passive) of
the source managers. The three selections used above showed a diverse
range of trading requirements. Ackman ’s model won eff ortlessly in
minimal trading requirements, followed by Buff ett, then Einhorn. As
these managers run relatively concentrated value-oriented portfolios,
with optimized rebalancing, the number of trades required becomes
very manageable, even in the case of Einhorn. Applying the model
to more active portfolios that chalk up hundreds of positions can be
overwhelming. While that may come across as a limitation, the purpose
of the 10–5–2 model is to match the source portfolio performance as
closely as possible. This is practical only by replicating most of the posi-
tions after eliminating the noise. It is to be expected that, if the source
portfolio manager has an active trading style and deals with hundreds
of positions, the cloned portfolio will also refl ect some of that behavior.
The model portfolios demonstrated strong outperformance during
the three-year tracking period. Single-manager risk is inherent with
this model, since its purpose is to clone a single manager ’s picks. The
risk can be cushioned to a certain extent by proper manager selection.
It is a fact of life that even the best value-oriented bottom-up man-
agers go through phases during which they vastly underperform the
indexes. Realistically speaking, the best way to combat this threat is by
being loyal to a selected manager for the very long term. For real-life
implementations, funds set aside for very long-term investments are
good candidates to use for this purpose.
The aim of these model portfolios was to faithfully clone the
source-manager portfolio performance. The fact that the model port-
folios also outperformed the index was a pleasant outcome. Table 17.4
c17.indd 174c17.indd 174 27-05-2013 11:27:4427-05-2013 11:27:44
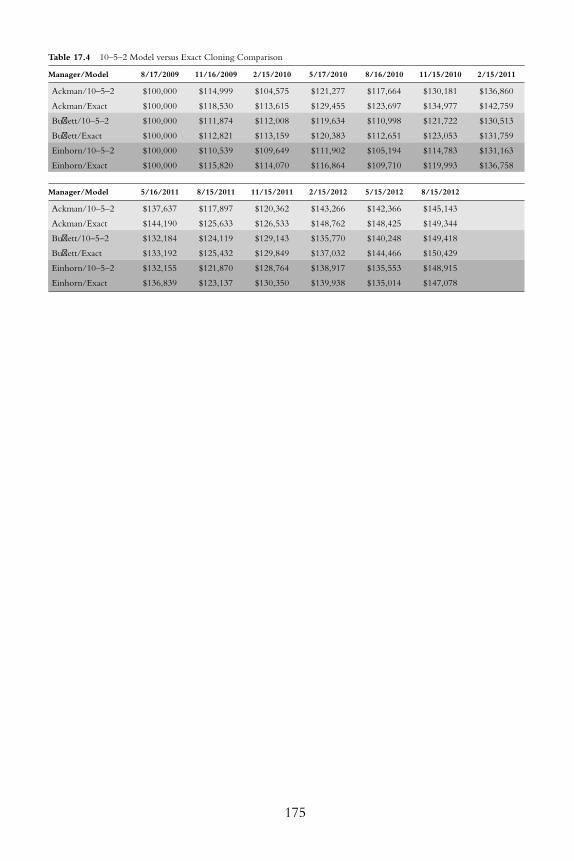
175
Table 17.4 10–5–2 Model versus Exact Cloning Comparison
Manager/Model 8/17/2009 11/16/2009 2/15/2010 5/17/2010 8/16/2010 11/15/2010 2/15/2011
Ackman/10–5–2 $100,000 $114,999 $104,575 $121,277 $117,664 $130,181 $136,860
Ackman/Exact $100,000 $118,530 $113,615 $129,455 $123,697 $134,977 $142,759
Buff ett/10–5–2 $100,000 $111,874 $112,008 $119,634 $110,998 $121,722 $130,513
Buff ett/Exact $100,000 $112,821 $113,159 $120,383 $112,651 $123,053 $131,759
Einhorn/10–5–2 $100,000 $110,539 $109,649 $111,902 $105,194 $114,783 $131,163
Einhorn/Exact $100,000 $115,820 $114,070 $116,864 $109,710 $119,993 $136,758
Manager/Model 5/16/2011 8/15/2011 11/15/2011 2/15/2012 5/15/2012 8/15/2012
Ackman/10–5–2 $137,637 $117,897 $120,362 $143,266 $142,366 $145,143
Ackman/Exact $144,190 $125,633 $126,533 $148,762 $148,425 $149,344
Buff ett/10–5–2 $132,184 $124,119 $129,143 $135,770 $140,248 $149,418
Buff ett/Exact $133,192 $125,432 $129,849 $137,032 $144,466 $150,429
Einhorn/10–5–2 $132,155 $121,870 $128,764 $138,917 $135,553 $148,915
Einhorn/Exact $136,839 $123,137 $130,350 $139,938 $135,014 $147,078
c17.indd 175c17.indd 175 27-05-2013 11:27:4427-05-2013 11:27:44
176 p r o f i t i n g f r o m h e d g e f u n d s
displays how the models fulfi lled their objective of cloning the man-
ager portfolios exactly. It is a comparative spreadsheet that illustrates
the portfolio progression of the models compared to a portfolio that
exactly clones the manager picks.
The three cases show very similar progressions of the three model
portfolios and their corresponding exact clones over the three-year
tracking period. The point of maximum divergence for Ackman ’s
holdings was in Q4 2009 (2/15/2010) at 8.65 percent—the total
value for the exact model at that point was $113,615 compared to
$104,575 for the 10–5–2 model. The divergence narrowed in the lat-
ter part of the tracking period and by Q2 2012 (8/15/2012), it had
closed in to around 2.89 percent. For Einhorn, the maximum diver-
gence occurred in Q2 2009 at 4.78 percent—the total value for the
exact model was at $115,820 versus $110,539 for the 10–5–2 model.
Here again, the divergence narrowed in the latter half of the tracking
period. In fact, by Q2 2012 (8/15/2012), the 10–5–2 model pulled
ahead, with a slight outperformance of 1.25 percent as the total value
at that point came in at $148,915, compared to $147,078 for the
exact model. The two models based on Buff ett ’s 13Fs showed the least
divergence as the two portfolios were neck and neck every quarter;
the divergence was less than 1 percent throughout the tracking period.
At the end of the tracking period, the diff erence in performance was a
mere 0.67 percent.
Although the diff erences were too small to create a ripple, it is good
to analyze the reasons for the divergence at certain points. Ackman not
only runs a very concentrated portfolio but keeps outsized positions.
This results in the portfolio not matching the diversifi cation assump-
tions made by the model. During the fi rst four quarters, Ackman ’s
13F portfolio had an average allocation to Target Corporation (TGT)
of close to 50 percent, with the allocation exceeding a whopping 70
percent in Q4 2009. Also, during several quarters, just three positions
accounted for over 90 percent of the assets. In the case of Einhorn ’s
models, 20 positions were chosen for the 10–5–2 model for illustrative
purposes, although the prudent choice would have been a higher num-
ber. This resulted in some of the signifi cant positions not fi guring in the
model in certain quarters, thus accounting for the slight divergence.
c17.indd 176c17.indd 176 27-05-2013 11:27:4427-05-2013 11:27:44
177
Chapter 18
Alternate Models
Alternate models serve to address some of the limitations
encountered while cloning a money manager ’s portfolio based
on 13Fs. The ten-fi ve-two (10–5–2) allocation model (intro-
duced in the previous chapter) is a very viable option when attempting
to closely clone manager portfolios. But, if the source portfolio does not
fi t the allocation assumptions inherent in the model, the resulting port-
folio performance will show divergence from the source portfolio.
Bill Ackman ’s portfolio implementation model in the last chapter
demonstrated this drawback. An alternate model whose allocations match
the source portfolio positions and eliminates the noise introduced by
very small positions can fi x this drawback. The fi rst model in this section
presents such a portfolio, using Bill Ackman ’s 13F positions as the source.
The 13F based models are suitable only for the domestic-equity
portion of an overall asset allocation plan as those reports show only
such positions. This chapter goes beyond 13Fs to explore models suitable
for use in an overall asset allocation setting . Some of the renowned
c18.indd 177c18.indd 177 27-05-2013 11:48:5827-05-2013 11:48:58
178 p r o f i t i n g f r o m h e d g e f u n d s
managers have recommended asset classes and distributions for indi-
vidual investors. Model portfolios that use the suggested allocations
can be constructed using very liquid exchange traded funds (ETF) and
certain other index mutual funds. Reasonably priced, decidedly liquid,
ETF options and/or index mutual funds are almost always available for
this purpose. Such model portfolios are amazingly simple to maintain.
As the allocation is static and only a small set of ETFs are involved,
periodic rebalancing is a breeze. The ease of maintenance aptly earns
such portfolios the nickname lazy portfolios. David Swensen endorses
such an asset allocation plan for individual investors in his classic book,
Unconventional Success: A Fundamental Approach to Personal Investment. 1
A model portfolio constructed using his recommendation with pro-
gression over the last fi ve years is presented along with an analysis on
how the portfolio holds up over diff erent market cycles.
Asset allocation in lazy portfolios requires a fi xed allocation among
diff erent asset classes. The focus is on diversifying among a set of asset
classes with uncorrelated risk profi les. Although such portfolios reduce
risk and off er something of a safety net in a bear market, they are not
very suitable for generating good absolute returns; they underperform
the averages in bull markets, while failing to provide good positive
returns in bear markets.
Techniques that incorporate market sentiment (judging direction
from historical prices) can be used to generate good absolute returns
in all market conditions. The chapter presents two such models (based on
David Swensen ’s recommended asset allocation) with their progression
over the last fi ve years. Their performance in diff erent market conditions
is analyzed to demonstrate the absolute returns possible with such
portfolios. These techniques can be adapted in combination with
domestic-equity long-only portfolios constructed from 13Fs to arrive at
an asset allocation that is dynamic and suitable for all market conditions.
Portfolio Management and Performance Analysis
The exact match approximation model eliminates the clutter intro-
duced by very small positions, while keeping the relative position sizes
for the rest of the portfolio to match the source portfolio. The size of
c18.indd 178c18.indd 178 27-05-2013 11:48:5927-05-2013 11:48:59
Alternate Models 179
the model portfolio and the inception dates are set at $100,000 and
August 17, 2009 (fi rst trading day following the deadline for fi ling 13Fs
for Q2 2009) respectively in keeping with the assumptions made in the
domestic-equity models presented in previous chapters. The portfolio
progression is assembled from Bill Ackman ’s 13Fs, as his 10-5-2 model
showed the most divergence.
The rest of the alternate models use the same initial portfolio size
of $100,000 but, to illustrate the portfolio performance during the
bear market that started in the latter half of 2008, the inception date is
pushed back to August 15, 2007. The performance analysis during
the bear market helps assess the suitability of the models for overall
asset allocation.
David Swensen ’s recommended asset allocation model uses his sug-
gested allocation percentages and maps them to the most liquid index
ETFs available in the market. It is to be remembered that the actual
percentages recommended are more of an expert opinion than those
based on any proven theory. The intention here is to diversify among
asset classes that have little correlation among them; the allocation rec-
ommendations individually carry higher risk, but the overall risk is
reduced, as they all do not move in one direction.
For the two models that incorporate market sentiment, Swensen ’s
asset allocation is used. The caveat is that the resources are channeled
equally among the asset classes that the models recommend regard-
less of the relative ratios suggested by Swensen. This is done mainly for
illustrative ease. Besides, going with the recommended relative ratios
does not create a huge variance in performance.
Rebalancing is done every quarter and dividends ignored in all
portfolios.
Bill Ackman: Exact Match Approximation Model
The exact match approximation model poses no restriction whatsoever
on the number of positions in the portfolio. In fact, the only criterion
is to ensure that the resulting portfolio covers all the signifi cant posi-
tions in the source portfolio. This is achieved by ignoring positions in
the source portfolio that have an allocation below a certain percentage
c18.indd 179c18.indd 179 27-05-2013 11:48:5927-05-2013 11:48:59
180 p r o f i t i n g f r o m h e d g e f u n d s
number. The cutoff can be based on covering over 90 percent of the 13F
source portfolio value. The higher the coverage the better the match, but
then the number of positions also increase.
For Ackman ’s 13Fs, the cutoff was set at 1.5 percent. With a portfo-
lio as concentrated as his, the model will have a limited number of posi-
tions, even if the entire portfolio were cloned verbatim. Despite this, the
1.5 percent cutoff was chosen to illustrate the workings of the model.
The relative sizes of positions in the model were kept at the same ratio
as in the source portfolio after eliminating the small positions that do
not fi t the model.
Table 18.1 (A&B) illustrates the model portfolio progression over
three years, starting with an inception date of August 17, 2009. The col-
umns display the portfolio allocation on the date indicated in the header
row after updates, eliminations, and rebalancing.
The second column in Table 18.1 A represents the initial alloca-
tions made on 08/17/2009. Ackman ’s portfolio had, at that time, a 0.19
percent allocation on Greenlight Capital RE (GLRE). With the 1.5 per-
cent cutoff in eff ect, the model eliminated that position. The 0.19 percent
allocation was then distributed among the rest of the positions in
the same ratio as the positions in Ackman ’s Q2 2009 13F. This is best
explained with an example. In the source portfolio, as of Q2 2009,
Automatic Data Processing (ADP) was allotted 11.34 percent. However,
the model assigned it 11.36 percent (column 08/17/2009). The calcula-
tion involved is:
• The portion of the GLRE allocation that goes to ADP ’s bucket per
the model: 0.19% * 11.34 %/(100 – 0.19%) = 0.02%.
• This 0.02% is then added to the 13F allocation to ADP to obtain
the ADP allocation in the model: 11.34% + 0.02% = 11.36%.
By Q3 2009 (11/16/2009), the total size of the portfolio increased
to $117,385. The model for that quarter had to reject GLRE (0.15 per-
cent) and Borders (1.05 percent) from the source portfolio. The total
portfolio ($117,385) was allocated among the rest of the positions in
the same ratio as in Ackman ’s 13F to arrive at the allocations shown
in column 11/16/2009. The steps were repeated in a similar fashion to
determine the distributions for the remaining columns.
c18.indd 180c18.indd 180 27-05-2013 11:48:5927-05-2013 11:48:59
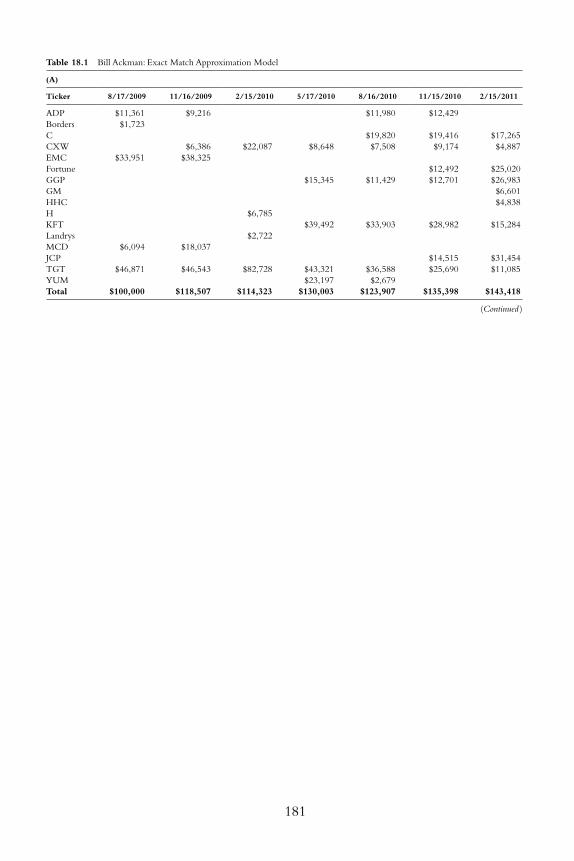
Table 18.1 Bill Ackman: Exact Match Approximation Model
(A)
Ticker 8/17/2009 11/16/2009 2/15/2010 5/17/2010 8/16/2010 11/15/2010 2/15/2011
ADP $11,361 $9,216 $11,980 $12,429
Borders $1,723
C $19,820 $19,416 $17,265
CXW $6,386 $22,087 $8,648 $7,508 $9,174 $4,887
EMC $33,951 $38,325
Fortune $12,492 $25,020
GGP $15,345 $11,429 $12,701 $26,983
GM $6,601
HHC $4,838
H $6,785
KFT $39,492 $33,903 $28,982 $15,284
Landrys $2,722
MCD $6,094 $18,037
JCP $14,515 $31,454
TGT $46,871 $46,543 $82,728 $43,321 $36,588 $25,690 $11,085
YUM $23,197 $2,679
Total $100,000 $118,507 $114,323 $130,003 $123,907 $135,398 $143,418
181
(Continued )
c18.indd 181c18.indd 181 27-05-2013 11:48:5927-05-2013 11:48:59

182
(B)
Ticker 5/16/2011 8/15/2011 11/15/2011 2/15/2012 5/15/2012 8/15/2012
ALEX $4,436 $3,380 $2,742 $3,249 $3,838
BEAM $20,861 $22,436 $25,729
CP $4,094 $31,970 $33,763 $35,004
C $17,688 $19,297 $14,105 $13,441 $17,569
FDO $11,489 $12,206 $9,456 $3,045
FBHS $6,935 $5,410
Fortune $28,141 $21,573 $23,726
GGP $30,320 $23,753 $18,419 $21,221 $22,581 $25,843
HHC $6,875 $4,572 $3,166 $3,083 $4,193 $4,350
KFT $19,024 $15,431 $17,821 $15,463 $10,845
LOW $8,657
JCP $38,277 $26,592 $22,052 $26,865 $25,474 $18,014
PG $36,708
Total $144,762 $126,087 $126,987 $149,295 $148,566 $149,486
Table 18.1 (Continued)
c18.indd 182c18.indd 182 27-05-2013 11:48:5927-05-2013 11:48:59
Alternate Models 183
The small number of positions eliminated and the matching
allocations made to the rest of the positions clearly signal that the
resulting portfolio performance will closely tag the returns for a port-
folio that exactly cloned Bill Ackman ’s 13F positions. As of Q2 2012
(08/15/2012), the model showed a total value of $149,486 compared
to $149,344 for a portfolio that clones exactly. In fact, the largest diver-
gence over the three-year period was less than $1000.
David Swensen: Asset Allocation Model
Swensen ’s asset distribution recommendation calls for the following
allocation percentages:
• Domestic equity: 30 percent
• Foreign developed equity: 15 percent
• Emerging markets equity: 5 percent
• Real estate investment trusts (REIT): 20 percent
• U.S. Treasury Bonds: 15 percent
• Treasury infl ation protected securities: 15 percent
Accordingly, the allocations are mapped to the following Exchange
Traded Funds:
• Domestic equity: Vanguard Total Stock Market ETF (VTI)
• Foreign developed equity: Vanguard FTSE All-World ex-US ETF
(VEU)
• Emerging markets equity: Vanguard MSCI Emerging Markets ETF
(VWO)
• Real estate investment trusts (REIT): Vanguard REIT ETF (VNQ)
• U.S. Treasury Bonds: iShares Barclays 20+ Yr Treasury Bond ETF
(TLT)
• Treasury infl ation protected securities: iShares Barclays TIPS Bond
Fund ETF (TIP)
Table 18.2 illustrates the model portfolio with an inception date of
August 15, 2007 and its progression over the next fi ve years. The col-
umns indicate the portfolio allocation on the date indicated in the
header rows (highlighted) after updates and rebalancing.
c18.indd 183c18.indd 183 27-05-2013 11:48:5927-05-2013 11:48:59
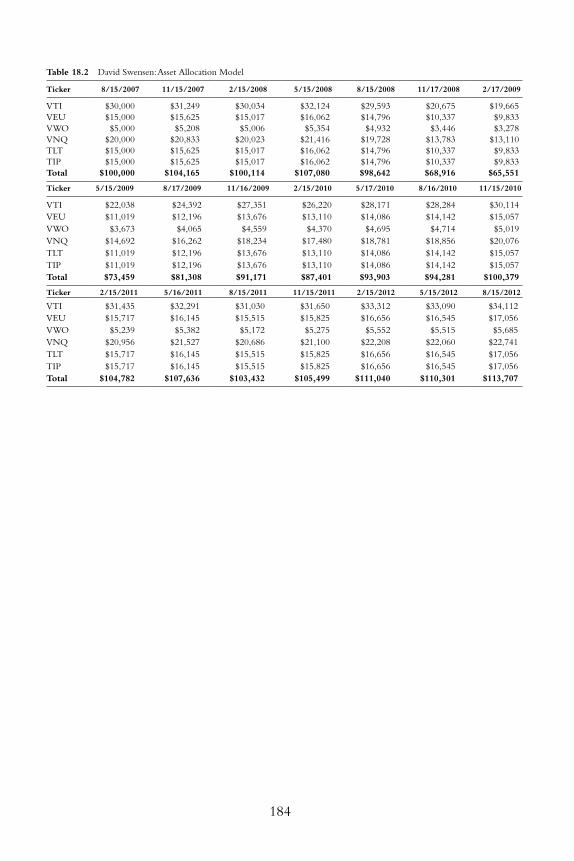
Table 18.2 David Swensen: Asset Allocation Model
Ticker 8/15/2007 11/15/2007 2/15/2008 5/15/2008 8/15/2008 11/17/2008 2/17/2009
VTI $30,000 $31,249 $30,034 $32,124 $29,593 $20,675 $19,665
VEU $15,000 $15,625 $15,017 $16,062 $14,796 $10,337 $9,833
VWO $5,000 $5,208 $5,006 $5,354 $4,932 $3,446 $3,278
VNQ $20,000 $20,833 $20,023 $21,416 $19,728 $13,783 $13,110
TLT $15,000 $15,625 $15,017 $16,062 $14,796 $10,337 $9,833
TIP $15,000 $15,625 $15,017 $16,062 $14,796 $10,337 $9,833
Total $100,000 $104,165 $100,114 $107,080 $98,642 $68,916 $65,551
Ticker 5/15/2009 8/17/2009 11/16/2009 2/15/2010 5/17/2010 8/16/2010 11/15/2010
VTI $22,038 $24,392 $27,351 $26,220 $28,171 $28,284 $30,114
VEU $11,019 $12,196 $13,676 $13,110 $14,086 $14,142 $15,057
VWO $3,673 $4,065 $4,559 $4,370 $4,695 $4,714 $5,019
VNQ $14,692 $16,262 $18,234 $17,480 $18,781 $18,856 $20,076
TLT $11,019 $12,196 $13,676 $13,110 $14,086 $14,142 $15,057
TIP $11,019 $12,196 $13,676 $13,110 $14,086 $14,142 $15,057
Total $73,459 $81,308 $91,171 $87,401 $93,903 $94,281 $100,379
Ticker 2/15/2011 5/16/2011 8/15/2011 11/15/2011 2/15/2012 5/15/2012 8/15/2012
VTI $31,435 $32,291 $31,030 $31,650 $33,312 $33,090 $34,112
VEU $15,717 $16,145 $15,515 $15,825 $16,656 $16,545 $17,056
VWO $5,239 $5,382 $5,172 $5,275 $5,552 $5,515 $5,685
VNQ $20,956 $21,527 $20,686 $21,100 $22,208 $22,060 $22,741
TLT $15,717 $16,145 $15,515 $15,825 $16,656 $16,545 $17,056
TIP $15,717 $16,145 $15,515 $15,825 $16,656 $16,545 $17,056
Total $104,782 $107,636 $103,432 $105,499 $111,040 $110,301 $113,707
184
c18.indd 184c18.indd 184 27-05-2013 11:48:5927-05-2013 11:48:59
Alternate Models 185
As the portfolio consisted of a static list of six ETFs held at a steady
allocation over fi ve years, rebalancing every quarter required only
minor adjustments to the six positions; as the total value of the port-
folio changed from quarter to quarter, position sizes were increased or
decreased to retain the recommended allocation.
During the three-year period (from August 17, 2009), the model
appreciated from $81,308 to $113,707 for a total return of 39.85 per-
cent. Even though the return underperformed the S&P 500 index,
which had a return of 43.46 percent (increased from 979.73 to
1405.53), it was not a surprise, as the portfolio had a signifi cant bond
allocation of ~30 percent. Unlike Swensen ’s equity-oriented Yale
portfolio, for reasons best known to him, his recommendation for indi-
vidual investors has signifi cant bond allocation.
During the fi ve-year period (from August 15, 2007), the model
improved in value from $100,000 to $113,707 for a total return
of 13.71 percent. This compares favorably to the S&P 500 index
which was fl at for the period. At the low point of the bear market
(2/17/2009), the model was down almost 35 percent. The only saving
grace was that the S&P 500 index put on an even more dismal show, as
it dropped from 1406.7 to 789.17, for a loss of almost 44 percent.
In general, the portfolio progression exhibits some protection from
drawdowns in bear markets: The trade-off is that, in bull markets, the
portfolio is likely to underperform compared to the S&P 500 index.
The drawdowns during bear markets make the model unsuitable for
an overall asset allocation plan focused on achieving absolute returns.
Swensen ’s recommended portfolio for individual investors is benefi cial
only for passive investors; if the individual investor is ready to take on a
more active role, there is potential for improvement.
Sector Rotation Model
Sector rotation, a timing model, attempts to trail market trends by allo-
cating assets dynamically to a small subset of the market sectors. At
any given time, certain sectors outperform, while others remain fl at
or underperform. The model endeavors to make allocation shifts peri-
odically, as positive trends are recognized. In short, the approach can
c18.indd 185c18.indd 185 27-05-2013 11:48:5927-05-2013 11:48:59
186 p r o f i t i n g f r o m h e d g e f u n d s
be considered a mechanical equivalent of George Soros ’s trading phi-
losophy, as the idea is to identify trends and conduct trades to profi t
from them.
David Swensen ’s asset allocation recommendations from the pre-
vious section are used to construct this model, too. Trend-following
strategies invariably involve heavy trading when the strategy is imple-
mented based on technical triggers. The model uses a variation that
evaluates trends in the individual asset classes every quarter and allo-
cates assets equally among the two best-performing asset classes from
the previous quarter. The strategy is to shadow the recently outper-
forming asset classes by allocating assets exclusively to them every
quarter. Obviously, the disadvantage is the loss of diversifi cation
benefi ts.
Table 18.3 shows the model portfolio with an inception date of
August 15, 2007, and the progression over the next fi ve years. The
model implementation is really simple as only two positions are main-
tained during any given quarter; two buy/sell trades are all that is
necessary.
At inception (8/15/2007), the best performing asset classes for
the quarter ending 8/15/2007 were foreign developed equity (VEU)
and Treasury infl ation protected securities (TLT). Those ETFs were
fl at during that quarter, while the funds representing the rest of the
asset classes showed negative returns. Accordingly, the $100,000 ini-
tial portfolio value was equally distributed among those two positions.
By the next quarter (11/15/2007), the portfolio increased in value to
$102,486. The two best performing asset classes for that quarter were
emerging markets equity (VWO) and US Treasury bonds (TLT). The
existing positions (VEU and TLT) were liquidated, and the funds
realized were equally distributed between TLT and VWO. The same
procedure was used for the following 18 quarters to work out the allo-
cations for the rest of the columns.
During the three-year period from August 17, 2009, the portfo-
lio increased in value from $103,442 to $149,447, for a total return of
44.47 percent. The returns were satisfactory, for it marginally beat the
43.46 percent return of the S&P 500 index for the same period. Over
the fi ve-year period from August 15, 2007, the portfolio increased in
c18.indd 186c18.indd 186 27-05-2013 11:48:5927-05-2013 11:48:59
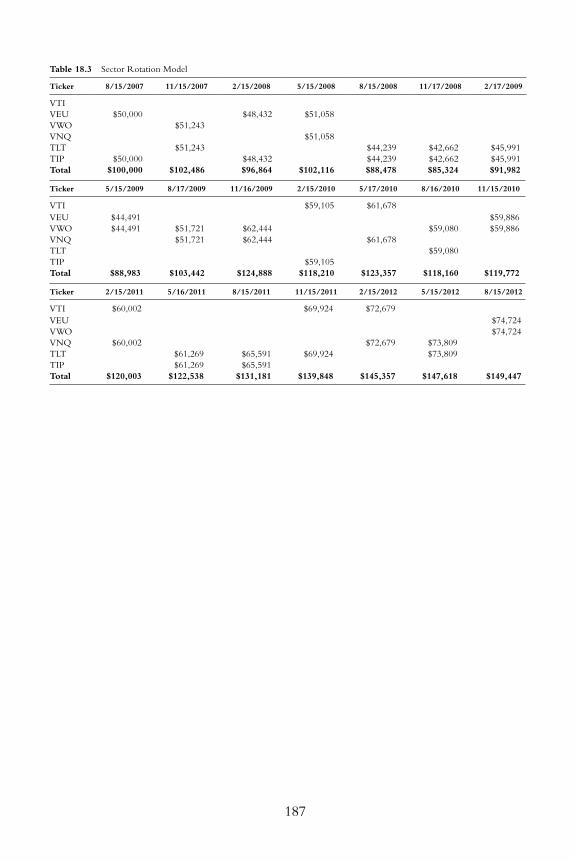
Table 18.3 Sector Rotation Model
Ticker 8/15/2007 11/15/2007 2/15/2008 5/15/2008 8/15/2008 11/17/2008 2/17/2009
VTI
VEU $50,000 $48,432 $51,058
VWO $51,243
VNQ $51,058
TLT $51,243 $44,239 $42,662 $45,991
TIP $50,000 $48,432 $44,239 $42,662 $45,991
Total $100,000 $102,486 $96,864 $102,116 $88,478 $85,324 $91,982
Ticker 5/15/2009 8/17/2009 11/16/2009 2/15/2010 5/17/2010 8/16/2010 11/15/2010
VTI $59,105 $61,678
VEU $44,491 $59,886
VWO $44,491 $51,721 $62,444 $59,080 $59,886
VNQ $51,721 $62,444 $61,678
TLT $59,080
TIP $59,105
Total $88,983 $103,442 $124,888 $118,210 $123,357 $118,160 $119,772
Ticker 2/15/2011 5/16/2011 8/15/2011 11/15/2011 2/15/2012 5/15/2012 8/15/2012
VTI $60,002 $69,924 $72,679
VEU $74,724
VWO $74,724
VNQ $60,002 $72,679 $73,809
TLT $61,269 $65,591 $69,924 $73,809
TIP $61,269 $65,591
Total $120,003 $122,538 $131,181 $139,848 $145,357 $147,618 $149,447
187
c18.indd 187c18.indd 187 27-05-2013 11:48:5927-05-2013 11:48:59
188 p r o f i t i n g f r o m h e d g e f u n d s
value from $100,000 to $149,447, for a total return of 49.45 percent. It
handsomely beat the S&P 500 index, which was fl at during that time
frame. Even on an absolute basis, the fi ve-year total return was respect-
able, considering the bear market during the early part of that period.
The model ’s performance from inception to the lowest point dur-
ing the bear market, which was 02/15/2009, reveals its strength. The
model lost only around 8 percent since inception at that point, com-
pared to a stunning 44 percent loss for the S&P 500 index. There
was little correlation between the returns of the model and that
of the index; the low point for the model portfolio was Q3 2008
(11/17/2008) when it showed a loss of ~15 percent, compared to a
~40 percent loss for the S&P 500 index.
Simple Moving Average (SMA) Based Model
Moving averages are technical indicators used to identify bullish and
bearish trends. Several variations exist but the underlying concept is the
same—compare the current prices to prices of the positions over a period
of time to identify trends. Two such popular averages are the Simple
moving average (SMA) and the exponential moving average (EMA).
In SMA the comparison relies on a simple average of the prices over a
time-period, whereas in EMA the more recent prices are given more
weightage. The 200-day SMA, one of the simplest such indicators, is
the mainstay among technical traders. Its trading strategy in a nutshell
is—if the position considered is above the 200-day SMA, go long, else
liquidate the position and stay in cash.
A variation of the 200-day SMA based trading strategy that elimi-
nates cash allocation is the root for this model. It applies the 200 day
SMA to the asset classes recommended by David Swensen. As his rec-
ommendations are diversifi ed and non-correlated, allocating assets
among the identifi ed longs is a better option than staying in cash. At
inception, the model studies the 200 day SMA and gauges whether
to go long on any of the six ETF positions. The $100,000 portfolio
is then equally distributed among those assets identifi ed as worthy of
going long. At the end of each quarter, the rule is invoked again to
c18.indd 188c18.indd 188 27-05-2013 11:48:5927-05-2013 11:48:59
Alternate Models 189
decide which positions to go long in the following quarter. The assets
are again distributed across the longs identifi ed.
Table 18.4 shows the model portfolio with an inception date of
August 15, 2007, and the progression over the next fi ve years. The
model implementation was very straightforward and the average num-
ber of positions per quarter was around three. The number of trades
necessary to maintain the model quarterly is also fairly low.
At inception (8/15/2007), as only Vanguard MSCI Emerging
Markets ETF (VWO) and iShares Barclays TIPS Bond Fund ETF (TIP)
traded above its 200-day SMAs, the $100,000 portfolio was equally dis-
tributed among those two positions. By the next quarter (11/15/2007),
the portfolio size swelled to $116,806 mainly due to a splendid ~30
percent return in VWO. As of 11/15/2007, in addition to these two
existing positions iShares Barclays 20+ Year Treasury Bond Fund ETF
(TLT) also traded above its 200-day SMA. Therefore, the portfolio
assets were distributed among those three positions for the next quar-
ter. The rest of the columns show the allocations for the subsequent
quarters by applying the same procedure.
During the three-year period from August 17, 2009, the portfo-
lio improved in value from $124,578 to $166,136, for a total return of
33.36 percent. The returns were not great because it underperformed
the 43.46 percent return of the S&P 500 index during the same
period. Over the fi ve-year period from August 15, 2007, the portfo-
lio increased in value from $100,000 to $166,136 for a total return
of 66.14 percent. Now, this performance is stunning, as the S&P 500
index was fl at during this timeframe.
This model showed stellar performance during the bear market that
started in 2008. From inception to the lowest point for the S&P 500,
which was on 02/15/2009, it returned 21.16 percent. The portfolio
delivered very good absolute returns in the face of a bear market that
saw drawdowns of 44 percent in the S&P 500 index. Here again, the
returns are not correlated to the index return as the low point for
the model was Q1 2009 (05/15/2009 column) when the model port-
folio showed a positive return of 12.49 percent compared to ~37 per-
cent loss for the S&P 500 Index.
c18.indd 189c18.indd 189 27-05-2013 11:48:5927-05-2013 11:48:59
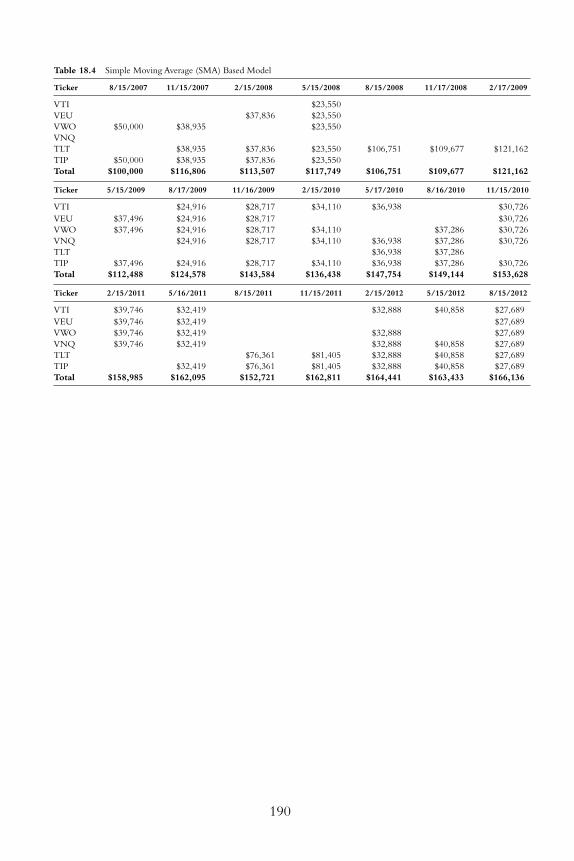
Table 18.4 Simple Moving Average (SMA) Based Model
Ticker 8/15/2007 11/15/2007 2/15/2008 5/15/2008 8/15/2008 11/17/2008 2/17/2009
VTI $23,550
VEU $37,836 $23,550
VWO $50,000 $38,935 $23,550
VNQ
TLT $38,935 $37,836 $23,550 $106,751 $109,677 $121,162
TIP $50,000 $38,935 $37,836 $23,550
Total $100,000 $116,806 $113,507 $117,749 $106,751 $109,677 $121,162
Ticker 5/15/2009 8/17/2009 11/16/2009 2/15/2010 5/17/2010 8/16/2010 11/15/2010
VTI $24,916 $28,717 $34,110 $36,938 $30,726
VEU $37,496 $24,916 $28,717 $30,726
VWO $37,496 $24,916 $28,717 $34,110 $37,286 $30,726
VNQ $24,916 $28,717 $34,110 $36,938 $37,286 $30,726
TLT $36,938 $37,286
TIP $37,496 $24,916 $28,717 $34,110 $36,938 $37,286 $30,726
Total $112,488 $124,578 $143,584 $136,438 $147,754 $149,144 $153,628
Ticker 2/15/2011 5/16/2011 8/15/2011 11/15/2011 2/15/2012 5/15/2012 8/15/2012
VTI $39,746 $32,419 $32,888 $40,858 $27,689
VEU $39,746 $32,419 $27,689
VWO $39,746 $32,419 $32,888 $27,689
VNQ $39,746 $32,419 $32,888 $40,858 $27,689
TLT $76,361 $81,405 $32,888 $40,858 $27,689
TIP $32,419 $76,361 $81,405 $32,888 $40,858 $27,689
Total $158,985 $162,095 $152,721 $162,811 $164,441 $163,433 $166,136
190
c18.indd 190c18.indd 190 27-05-2013 11:48:5927-05-2013 11:48:59
Alternate Models 191
Summary
The mechanical models introduced in this chapter presented a medley
of portfolios suitable for diff erent situations. Bill Ackman ’s 13F port-
folio was used to demonstrate the eff ectiveness of the exact match
approximation model when it comes to cloning manager portfolios
with concentrated positions but seemingly random allocations. The
rest of the chapter presented model portfolios appropriate for use with
an overall asset allocation plan as opposed to just the domestic-equity
portion.
David Swensen ’s asset allocation recommendation based port-
folio progression over the three- and fi ve-year periods demonstrated
the strengths and weaknesses of lazy portfolios. The model underper-
formed the S&P 500 index during the three-year period, but showed
a decent positive return for the fi ve-year period when the S&P 500
Index remained fl at. During the bear market, the portfolio outper-
formed the S&P 500 Index despite losing a third of its value.
Lazy portfolios are a very popular strategy among individual inves-
tors and this fi eld is also swarmed with diff erent recommendations.
Rather than their demonstrated ability to generate good absolute
returns, it is their ease of implementation that makes such portfolios
a popular choice. They are good options only for individual investors
seeking to invest on their own in a largely passive manner. The lazy
portfolios use fi xed allocations to the diff erent equity and debt options,
thereby recommending a diversifi ed mix for distributing the assets.
Although the diversifi cation provides some protection against bear
markets, it is not enough to provide good absolute returns.
The fi nal two portfolios employed David Swensen ’s asset allocation
recommendations but technical indicators decided the positions to go
long in a given quarter. Overall, the results from these portfolios were
quite agreeable in most market conditions. During the bear market,
when the S&P 500 index experienced drawdowns in the 45 percent
range, these portfolios signifi cantly outperformed the index—that too,
with positive returns during that timeframe. The excellent returns over
the 3-year and 5-year timeframes demonstrated the potential of such
portfolios to generate good absolute returns independent of market
conditions.
c18.indd 191c18.indd 191 27-05-2013 11:48:5927-05-2013 11:48:59
192 p r o f i t i n g f r o m h e d g e f u n d s
The earlier chapters in Part Two , covered choices to construct
cloned portfolios based on one or more manager ’s 13F positions. A
carefully chosen mechanical model from the ones presented is a good
choice for the domestic-equity portion of asset allocation for individ-
ual investors; such portfolios tend to outperform the market indexes,
especially over the long term. Manager selection and model selection
based on the investing styles of the managers involved are both central
when following this approach.
For generating respectable absolute returns in an overall asset allo-
cation setting, a strategy that combines a set of asset allocation choices
with recommendations from a market-timing tactic is a marvelous
option. The latter two models presented in this chapter are superb in
that regard, given their relative ease of implementation and poten-
tial for good absolute returns. Even when using a mechanical cloning
model for the domestic-equity portion of one ’s assets, a variation of the
market timing strategy is a good route to consider. The market timing
strategy mandates how much to allocate to each portion of the over-
all asset allocation mix. The portion of the total assets slated for the
domestic-equity portion (implemented using the mechanical cloning
model) for a particular time period is mandated by the market timing
method. The size of the mechanically cloned portfolio is adjusted every
quarter, based on the mandated asset allocation mix. The implementa-
tion of the strategy involves more trades: All positions are to be adjusted
proportionally depending on the change to the domestic-equity portion
of the asset allocation. Though the approach adds a little more com-
plexity, it should be well worth the extra eff ort.
Note
1. David Swensen, Unconventional Success: A Fundamental Approach to Personal
Investment (New York: Free Press, A Division of Simon & Schuster, 2005).
c18.indd 192c18.indd 192 27-05-2013 11:48:5927-05-2013 11:48:59

Part Three
LEARNING FROM THE MASTERS
c19.indd 193c19.indd 193 27-05-2013 08:24:5127-05-2013 08:24:51

c19.indd 194c19.indd 194 27-05-2013 08:24:5127-05-2013 08:24:51
195
Chapter 19
Introduction
Strategies for picking stocks and size positions from money man-
ager trades and their investing techniques are the focus of Part
Three. The techniques employed are a little bit more involved
than the models presented so far. The mechanical models in Part Two
work well for individual investors who prefer to stay relatively passive;
they can still expect to realize superior long-term returns by adhering to
proper manager and compatible model selection.
There are techniques that can be applied to the 13F stock picks
to fi lter positions on the basis of money manager bias. Some models
in Part Two charted this course to arrive at model portfolios based on
fi ltering for the largest new positions. Obviously, those models were
price-neutral, as they factored neither the price at which the manager
traded, nor the price when the information became public. This is a
glaring risk, as the purchase price of the stock involved in the model
portfolio can be like apples and oranges from the manager ’s actual
traded prices due to the time lag (i.e., the time period from when the
c19.indd 195c19.indd 195 27-05-2013 08:24:5127-05-2013 08:24:51
196 p r o f i t i n g f r o m h e d g e f u n d s
manager traded the stock and when that information became public
through a 13F fi ling). The actual time can vary anywhere from 45 days
(if the trade was on the last day of the previous quarter) to as long as
four-and-a-half months (if the trade was on the fi rst day of the previ-
ous quarter). Many a proverbial slip lurks in that duration, in fact, more
so with volatile stocks. Appraising price information is a way to opti-
mize the entry and exit points of a stock pick. This approach calls for
more analysis but the process is defi nitely worthwhile for it is a chance
to trade positions at better prices than the manager.
The time of entry for stock picks from 13Fs can be optimized by
monitoring a set of other regulatory SEC fi lings:
• Schedule 13D and 13G : 1 SEC fi ling requirements call for ben-
efi cial owners acquiring more than 5 percent of a voting class of a
security to fi le one of these forms within ten days of such activity.
The regulation applies to all securities registered under Section 12
of the Securities Exchange Act of 1934. 13G is an abridged ver-
sion of 13D—passive investors holding between 5 percent and 20
percent of the security concerned can opt to fi le 13G instead of
13D. Material changes to the facts in the schedule require fi ling an
immediate amendment. 2
• Forms 3, 4, and 5 : 3 Corporate insiders are required to fi le one or
more of these forms periodically after they become affi liated with
a company registered under Section 12 of the Securities Exchange
Act of 1934. 4 Corporate insiders cover company offi cers, directors,
and more than 10 percent owners.
• Form 3 is the initial form required to be fi led with the SEC, and
that, too, within the ten days of a corporate insider becoming
affi liated with a registered company. Also, when a company is reg-
istered under Section 12, Form 3 must be fi led by all corporate
insiders prior to the eff ective date of the registration statement.
• Corporate insiders are required to fi le Form 4 (statement of own-
ership), when there is a material change in the ownership within
two business days of the transaction that resulted in the change of
ownership. Buy/sell activity in the open market along with com-
pany stock options activity are covered in this form.
c19.indd 196c19.indd 196 27-05-2013 08:24:5127-05-2013 08:24:51
Introduction 197
• Form 5 is an annual fi ling to report transactions that are exempt
from the Form 4 fi ling. It is due within 45 days after the com-
pany ’s fi scal year end.
From the perspective of tracking money managers, these forms
cover only a fragment of their holdings and trading activity. For an
activity to appear in one of these forms, ownership of more than 5
percent of the company ’s outstanding shares is required. Even so, moni-
toring these forms has certain advantages over monitoring 13F activity:
• The information reported is very timely : If the ownership
in the company involved is between 5 and 10 percent, the 13D or
13G reports the activity within 10 days of the associated transaction.
If it exceeds 10 percent ownership, Form 4 reports the activity
within two days of the transaction, making the information even
more valuable.
• High conviction positions get reported : As the reports are
compulsory if the money manager owns more than 5 percent of
the outstanding shares, by their very nature, the activity usually
points to the manager ’s highest conviction positions.
These regulatory fi lings can also be a sign of activist involvement.
Monitoring such fi lings can be particularly productive when applied
against managers who specialize in activist investing. In general, their
large ownership stakes in public companies are a means to eff ectively
sway the executives and the board. As such positions are reported
almost immediately in regulatory fi lings, it is possible to achieve very
similar prices to those of the manager. There are a couple of caveats
with this approach:
• With some of the celebrated activist managers, a price spike is
inevitable as soon as the position is disclosed through regulatory
fi lings. Giving a few days for the price to settle is a worthwhile
plan to limit the damage, and
• Manager selection is critical; even with the best activist managers,
there are no guarantees. Not all activist campaigns are successful,
although the best managers have good track records.
c19.indd 197c19.indd 197 27-05-2013 08:24:5127-05-2013 08:24:51
198 p r o f i t i n g f r o m h e d g e f u n d s
The chapter introduces techniques to pick stocks from 13Fs by
gauging pricing information and by analyzing corporate insider (Forms
3, 4, and 5) and benefi cial owner (13D and 13G) regulatory fi lings.
Beating the Managers at Their Own Game
Arming oneself with a manager bias spreadsheet is the initial step
towards developing a strategy to attain better pricing for money man-
ager stock picks. The variables to be considered are:
• Manager selection : The short-listed managers from Part Two are
used for these illustrations: Bill Ackman, Warren Buff ett, and David
Einhorn.
• Assessing bullish/bearish bias : The latest activity can be deter-
mined by comparing the positions in the 13F for the latest quarter
with the same for the previous quarter. The bias is drawn out by
fi ltering signifi cant trading activity, via cutoff s, based on the size of
positions and the size of the trades during the quarter relative to
the overall 13F portfolio size.
Table 19.1 presents a bias spreadsheet that compares the 13Fs for
Q2 2012 of the three managers with the corresponding 13Fs for Q1
2012. To capture this bias information, the positions were fi ltered using
the following criteria:
• For a position to be considered, it should be, at minimum, 2 per-
cent of the portfolio as of that quarter. This searches for trading
activity among the signifi cant positions.
• Only those positions that were increased or decreased by at least 1
percent of the portfolio were considered. This condition screens for
positions that saw signifi cant trading activity.
The relatively larger number of entries in this table is due to David
Einhorn ’s frequent trading. Among the fi ltered positions, only Procter
& Gamble (PG) had multiple showings. It was traded in opposite
directions by Bill Ackman and Warren Buff ett; Ackman added a very
large position, while Buff ett trimmed his position signifi cantly. Given
Buff ett ’s proclivity for holding on to his larger positions over the very
c19.indd 198c19.indd 198 27-05-2013 08:24:5127-05-2013 08:24:51
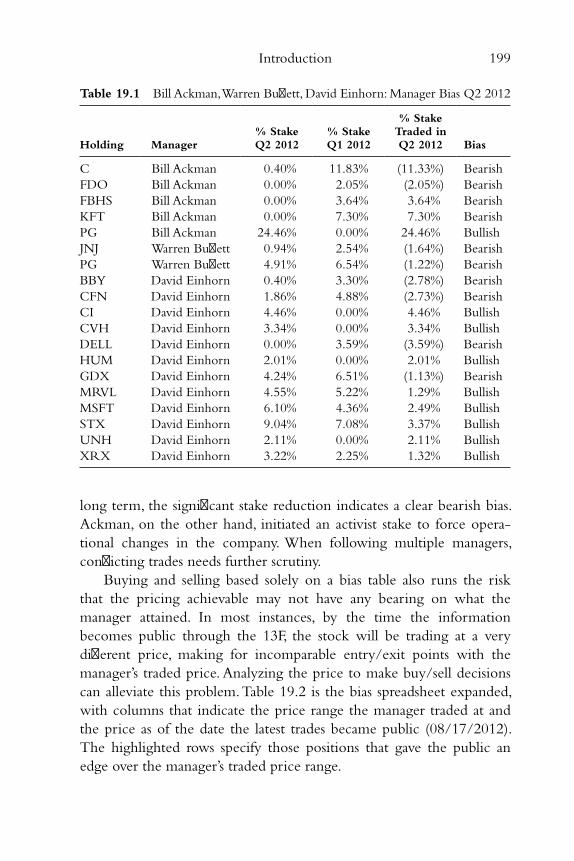
Introduction 199
long term, the signifi cant stake reduction indicates a clear bearish bias.
Ackman, on the other hand, initiated an activist stake to force opera-
tional changes in the company. When following multiple managers,
confl icting trades needs further scrutiny.
Buying and selling based solely on a bias table also runs the risk
that the pricing achievable may not have any bearing on what the
manager attained. In most instances, by the time the information
becomes public through the 13F, the stock will be trading at a very
diff erent price, making for incomparable entry/exit points with the
manager ’s traded price. Analyzing the price to make buy/sell decisions
can alleviate this problem. Table 19.2 is the bias spreadsheet expanded,
with columns that indicate the price range the manager traded at and
the price as of the date the latest trades became public (08/17/2012).
The highlighted rows specify those positions that gave the public an
edge over the manager ’s traded price range.
Table 19.1 Bill Ackman, Warren Buff ett, David Einhorn: Manager Bias Q2 2012
Holding Manager % Stake Q2 2012
% Stake Q1 2012
% Stake Traded in Q2 2012 Bias
C Bill Ackman 0.40% 11.83% (11.33%) Bearish
FDO Bill Ackman 0.00% 2.05% (2.05%) Bearish
FBHS Bill Ackman 0.00% 3.64% 3.64% Bearish
KFT Bill Ackman 0.00% 7.30% 7.30% Bearish
PG Bill Ackman 24.46% 0.00% 24.46% Bullish
JNJ Warren Buff ett 0.94% 2.54% (1.64%) Bearish
PG Warren Buff ett 4.91% 6.54% (1.22%) Bearish
BBY David Einhorn 0.40% 3.30% (2.78%) Bearish
CFN David Einhorn 1.86% 4.88% (2.73%) Bearish
CI David Einhorn 4.46% 0.00% 4.46% Bullish
CVH David Einhorn 3.34% 0.00% 3.34% Bullish
DELL David Einhorn 0.00% 3.59% (3.59%) Bearish
HUM David Einhorn 2.01% 0.00% 2.01% Bullish
GDX David Einhorn 4.24% 6.51% (1.13%) Bearish
MRVL David Einhorn 4.55% 5.22% 1.29% Bullish
MSFT David Einhorn 6.10% 4.36% 2.49% Bullish
STX David Einhorn 9.04% 7.08% 3.37% Bullish
UNH David Einhorn 2.11% 0.00% 2.11% Bullish
XRX David Einhorn 3.22% 2.25% 1.32% Bullish
c19.indd 199c19.indd 199 27-05-2013 08:24:5127-05-2013 08:24:51
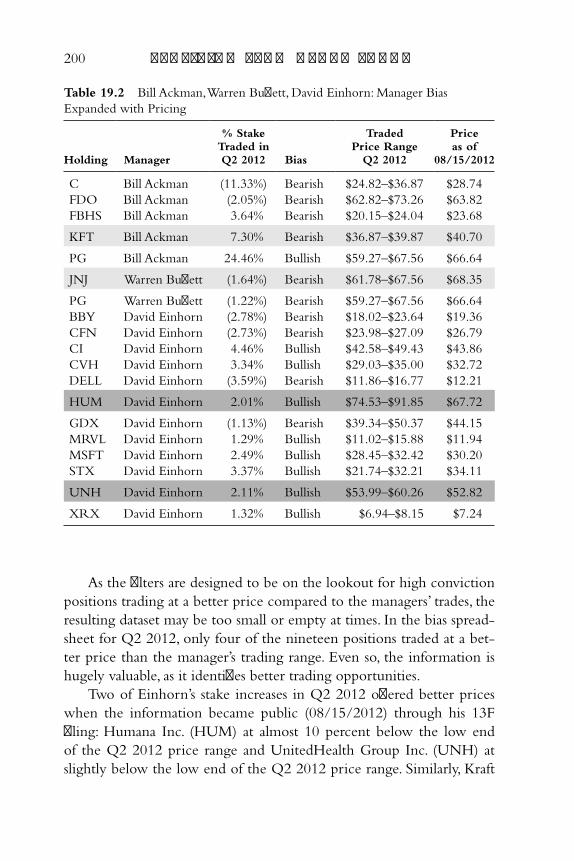
200 p r o f i t i n g f r o m h e d g e f u n d s
Table 19.2 Bill Ackman, Warren Buff ett, David Einhorn: Manager Bias
Expanded with Pricing
Holding Manager
% Stake Traded in Q2 2012 Bias
Traded Price Range
Q2 2012
Price as of
08/15/2012
C Bill Ackman (11.33%) Bearish $24.82–$36.87 $28.74
FDO Bill Ackman (2.05%) Bearish $62.82–$73.26 $63.82
FBHS Bill Ackman 3.64% Bearish $20.15–$24.04 $23.68
KFT Bill Ackman 7.30% Bearish $36.87–$39.87 $40.70
PG Bill Ackman 24.46% Bullish $59.27–$67.56 $66.64
JNJ Warren Buff ett (1.64%) Bearish $61.78–$67.56 $68.35
PG Warren Buff ett (1.22%) Bearish $59.27–$67.56 $66.64
BBY David Einhorn (2.78%) Bearish $18.02–$23.64 $19.36
CFN David Einhorn (2.73%) Bearish $23.98–$27.09 $26.79
CI David Einhorn 4.46% Bullish $42.58–$49.43 $43.86
CVH David Einhorn 3.34% Bullish $29.03–$35.00 $32.72
DELL David Einhorn (3.59%) Bearish $11.86–$16.77 $12.21
HUM David Einhorn 2.01% Bullish $74.53–$91.85 $67.72
GDX David Einhorn (1.13%) Bearish $39.34–$50.37 $44.15
MRVL David Einhorn 1.29% Bullish $11.02–$15.88 $11.94
MSFT David Einhorn 2.49% Bullish $28.45–$32.42 $30.20
STX David Einhorn 3.37% Bullish $21.74–$32.21 $34.11
UNH David Einhorn 2.11% Bullish $53.99–$60.26 $52.82
XRX David Einhorn 1.32% Bullish $6.94–$8.15 $7.24
As the fi lters are designed to be on the lookout for high conviction
positions trading at a better price compared to the managers’ trades, the
resulting dataset may be too small or empty at times. In the bias spread-
sheet for Q2 2012, only four of the nineteen positions traded at a bet-
ter price than the manager ’s trading range. Even so, the information is
hugely valuable, as it identifi es better trading opportunities.
Two of Einhorn ’s stake increases in Q2 2012 off ered better prices
when the information became public (08/15/2012) through his 13F
fi ling: Humana Inc. (HUM) at almost 10 percent below the low end
of the Q2 2012 price range and UnitedHealth Group Inc. (UNH) at
slightly below the low end of the Q2 2012 price range. Similarly, Kraft
c19.indd 200c19.indd 200 27-05-2013 08:24:5127-05-2013 08:24:51
Introduction 201
Foods Inc. (KFT) and Johnson & Johnson (JNJ) off ered better disposal
opportunities than those at which Ackman and Buff ett trimmed theirs.
Trading based on a bias spreadsheet works hand in hand with a
strategy that buys/sells based on one or both of the long and short
opportunities identifi ed in that table. To take advantage of both the
long (bullish bias) and short (bearish bias) opportunities, a long/short
model is ideal but, for this illustration, a simpler long-only model is
used. The strategy scans the 13Fs for signifi cant stake increases using
the following criteria:
• The position size must have been at least 2 percent of the portfolio
in the quarter identifi ed by the 13F (in Table 19.1 ).
• The position size must have improved by at least 1 percent of the
portfolio (in Table 19.1 ).
• Scan for positions trading below the low end (within 1 percent) of
the price range during the quarter.
• Retain the positions until the source manager sells a stake greater
than 1 percent of the 13F portfolio value.
Table 19.3 shows the performance of the positions purchased
using only the long opportunities identifi ed from manager bias spread-
sheets. For Seagate Technology (STX) and Sprint (S), where the Sale
Date column shows NA, the strategy calls to hold on to the positions
as of Q2 2012. The price as of 08/15/2012 was used for calculating the
returns for those holdings.
Scanning the 13Fs of the three managers over the last three years
using the fi lter criteria yielded only seven positions. Applying the strat-
egy to a larger group of managers is one way to address the dearth of
opportunities. The criteria can also be adjusted to net positions trading
below the manager ’s price point at any time after the trade informa-
tion becomes public. The approach is more involved, as constant sur-
veillance is essential to isolate potential opportunities. The 13Fs have to
be monitored as well for a shift in bias.
The fi ltered positions show very encouraging signs in terms of
performance, for the most part; only Boston Scientifi c (BSX) posted
negative returns and that by a very modest percentage. The perfor-
mance of the remaining positions ranged from 11.26 percent (over
six months) for Family Dollar (FDO) to a whopping 184.01 percent
c19.indd 201c19.indd 201 27-05-2013 08:24:5127-05-2013 08:24:51

202
Table 19.3 Bill Ackman, Warren Buff ett, David Einhorn: Manager Bias Based Strategy
Holding Manager Purchase Date Purchase Price Sale Date Sale Price Percentage Return
CXW Bill Ackman 2/15/2010 $19.57 2/15/2011 $25.01 27.80%
ADP Bill Ackman 8/16/2010 $40.07 2/15/2011 $49.55 23.66%
FDO Bill Ackman 8/15/2011 $50.27 2/15/2012 $55.93 11.26%
JNJ Warren Buff ett 8/16/2010 $58.01 2/15/2012 $64.65 11.45%
BSX David Einhorn 2/15/2010 $7.39 5/17/2010 $6.81 (7.85%)
STX David Einhorn 8/15/2011 $12.01 NA $34.11 184.01%
S David Einhorn 11/15/2011 $2.92 NA $5.39 84.59%
c19.indd 202c19.indd 202 27-05-2013 08:24:5127-05-2013 08:24:51
Introduction 203
(over a year) for Seagate Technology (STX). As for overall perfor-
mance, equally sized positions over the time frames indicated would
have posted a total return of 47.85 percent. Given the average holding
period of the selections was 9.4 months, the annualized return would
have been a striking 61.09 percent.
Trading Alongside the Managers
Corporate insider (Forms 3, 4, and 5) and benefi cial owner (13D and
13G) regulatory fi lings off er timely information when a manager takes
a sizable (>5 percent) ownership stake in a stock. The size of the stake
relative to the overall manager portfolio is not carried in the fi ling,
but the information can be derived from the latest 13F portfolio total
value. An educated purchase decision can be made by combining these
two pieces of information. A similar strategy as was used in the previ-
ous section can help with the sell decision: Sell a position when the
manager sells a stake greater than 1 percent of the 13F portfolio value.
The chief benefi t compared to strategies that solely depend on 13F
data is the prospect of trading manager positions very close to their
trading timeline; with that reduced time delay, the odds of achieving
a price range similar to that which the manager attained are increased.
The strategy monitors corporate insider (Forms 3, 4, and 5) and
benefi cial owner (13D and 13G) fi lings for a selected set of managers.
When a new stake is reported, the latest 13F is compared to determine
how large the new stake is, relative to the overall size of the 13F portfo-
lio. To be considered for purchase, the following criteria are to be met:
• The total stakes (new and any existing stakes reported in the latest
13F) must add up to more than 2 percent of the 13F portfolio total
value. This nets signifi cantly large positions that have the potential
for positive portfolio impact.
• The new stake size should be 1 percent or more of the latest 13F
portfolio total value. This confi rms sizable trading activity in the
position concerned.
Table 19.4 shows the performance of positions purchased using
this plan. The sale date for Fortune Brands is Various, as it was split
c19.indd 203c19.indd 203 27-05-2013 08:24:5127-05-2013 08:24:51

204
Table 19.4 Corporate Insider and Benefi cial Ownership Filings Based Strategy
Holding Manager Regulatory Filing Purchase Date Purchase Price Sale Date Sale Price
Percentage Return
BNI Warren Buff ett Form 3 4/6/2007 $81.18 2/15/2010 $100.00 23.18%
TGT Bill Ackman SC 13D 7/16/2007 $68.89 2/15/2010 $48.64 (29.39%)
Long ’s Drug
Stores
Bill Ackman SC 13D 8/5/2008 $48.56 10/30/2008 $71.50 47.24%
JCP Bill Ackman Form 3 10/8/2010 $32.49 NA $23.67 (27.15%)
Fortune
Brands
Bill Ackman Form 3 10/8/2010 $51.00 Various $83.02 62.78%
HHC Bill Ackman Form 3 11/19/2010 $42.23 NA $64.24 52.12%
ALEX Bill Ackman SC 13D 3/31/2011 $45.65 NA $55.28 21.10%
CP Bill Ackman SC 13D 10/28/2011 $64.57 NA $84.38 30.68%
c19.indd 204c19.indd 204 27-05-2013 08:24:5127-05-2013 08:24:51
Introduction 205
into Fortune Brands Home & Security Inc. (FBHS) and Beam Inc.
(BEAM). Ackman signifi cantly reduced his stake in FBHS during Q1
2012, but held steady his stake in BEAM. For the percentage return
calculation, the stock price of FBHS ($23.62 on 05/15/2012) was
added to the stock price of BEAM ($59.40 on 08/15/2012) to arrive
at the sale price. Long ’s Drug Stores was acquired by CVS Caremark
Corporation (CVS) at $71.50 per share in cash and that became
the sale price, and the closing date of the transaction (10/30/2008)
ended up as the sale date. The sale date for JC Penney (JCP), Howard
Hughes Corporation (HHC), Alexander & Baldwin Inc. (ALEX), and
Canadian Pacifi c Railway Limited (CP) is listed as NA, as the strategy
calls for holding on to those stocks. For the percentage return calcu-
lation for those holdings, the sale price was taken as the price as of
08/15/2012.
Predictably, all the positions in the table except one came from
Ackman ’s portfolio. This is because the strategy works very well against
activist managers, as their stakes tend to be well ahead of the 5 percent
cut-off for the benefi cial owner regulatory fi lings (13D and 13G) and,
in many cases, they acquire positions well above the 10 percent cut-off
for the corporate insider regulatory fi lings (Forms 3, 4, and 5). Among
the stock picks in Table 19.4 , four came from Schedule 13D benefi cial
ownership fi lings, while the other four came from Form 3 corporate
insider fi lings.
The selected stakes in the table gave respectable performances
overall. However, two positions posted negative returns: Target
Corporation (TGT) showed negative 29.39 percent, while JCPenney
(JCP) returned negative 27.15 percent. The former is acknowledged as
one of Ackman ’s rare activist investment failures, and the latter is yet
to play out completely, although his position was also under water as
of the date of the percentage return calculation (8/15/2012). The per-
formance of the rest of the positions ranged from 21.10 percent over
a 16-month period for Alexander & Baldwin (ALEX) to 62.78 per-
cent over a 19-month period for Fortune Brands. In terms of over-
all performance, equally sized positions over the timeframes indicated
would have posted a total return of 22.57 percent. Given that the aver-
age holding period of the selections was 19.5 months, the annualized
return would have been 13.88 percent.
c19.indd 205c19.indd 205 27-05-2013 08:24:5227-05-2013 08:24:52
206 p r o f i t i n g f r o m h e d g e f u n d s
Summary
The chapter introduced the concept of money manager bias spread-
sheets, and illustrated their use to unveil opportunities to trade stocks at
better prices than those that the managers themselves achieved:
• Manager bias spreadsheet: The 13Fs from Q2 2012 of the three
managers were used to illustrate the construction of a bias spread-
sheet. This spreadsheet was then expanded to include price points
the manager traded at and the price when the information became
public. The exercise identifi ed opportunities to trade at better price
points compared to those that the manager achieved.
• Performance analysis: The approach was used for the portfolios
of the three managers over the last three years to demonstrate its
eff ectiveness. The ability to trade stocks at better price points com-
pared to the manager trades has a very attractive ring to it, but a
comparatively larger group of managers need to be followed for it
to succeed when it comes to portfolio construction.
A strategy to use a set of benefi cial ownership and corporate
insider regulatory fi lings to trade stocks at almost the same timeline as
the money managers involved was also introduced:
• Benefi cial ownership and corporate insider fi lings: The
benefi cial ownership fi lings (Schedule 13D and 13G) disclose
trading activity within ten days of managers taking more than a
5 percent ownership stake in a company while the corporate
insider fi lings (Forms 3, 4, and 5) disclose trading activity within
two days of managers initiating a more than 10 percent ownership
stake. They off er very timely information, which allows individual
investors an opportunity to trade alongside the managers.
• Performance analysis: The performance of stocks picked using
this approach for the fi lings of the three selected money managers
over the last few years were analyzed. While the performance was
respectable, opportunities were minimal, as only activist manag-
ers favored stakes so large that they mandated disclosure in the
fi lings. As such, the method is most suited for activist manager
portfolios.
c19.indd 206c19.indd 206 27-05-2013 08:24:5227-05-2013 08:24:52
Introduction 207
The next step in the evolution of an individual investor is learning
the techniques the best money managers employ and applying them to
one ’s own portfolio. That sets one on the road to being a super investor!
The rest of the book presents primers on stock selection and position
sizing, based on the techniques the super investors use.
Notes
1. U.S. Securities and Exchange Commission, “Schedule 13D,” www.sec.gov/
answers/sched13.htm , 04/04/2008.
2. U.S. Securities and Exchange Commission, “Exchange Act Sections 13(d)
and 13(g) and Regulation 13D-G Benefi cial Ownership Reporting,” www
.sec.gov/divisions/corpfi n/guidance/reg13d-interp.htm , 11/16/2009.
3. U.S. Securities and Exchange Commission, “Forms 3, 4, 5,” www.sec.gov/
answers/form345.htm , 09/07/2011.
4. U.S. Securities and Exchange Commission, “Exchange Act Section 16 and
Related Rules and Forms,” www.sec.gov/divisions/corpfi n/guidance/
sec16interp.htm , 08/11/2010.
c19.indd 207c19.indd 207 27-05-2013 08:24:5227-05-2013 08:24:52

c19.indd 208c19.indd 208 27-05-2013 08:24:5227-05-2013 08:24:52
209
Chapter 20
Fundamental Analysis
When it comes to selecting stocks, the best money manag-
ers bank on fundamental analysis. Countless articles, books,
and courses have been devoted to this very extensive topic.
The chief objective is to examine the publicly available facts about busi-
nesses to project their future performances. The outcome of this study
helps one make educated judgment calls: fair value estimate (FVE), future
price projections, analysis of potential credit risk, and so on. The data
points used in fundamental analysis gleans information from or about:
• Historical and latest fi nancial facts, such as quarterly and annual
fi nancial statements for public businesses
• Executives and boards of directors
• Competitors, along with their strengths and weaknesses
• Competitive advantages, such as patents and brands
• Target markets
• Industry in which the company operates
• The overall economy
c20.indd 209c20.indd 209 29-05-2013 08:21:4929-05-2013 08:21:49
210 p r o f i t i n g f r o m h e d g e f u n d s
Evaluating each of these items to compile future performance pro-
jections is a monumental undertaking, but investors need not be fazed.
There are tools aplenty. The two basic approaches are top-down and
bottom-up analysis.
1. Top-down: From the overall economy, industries and markets with
the best prospects are determined, and the top businesses among
them chosen.
2. Bottom-up: Stocks are selected based on individual business merit,
and underweights any analysis of the broader market conditions.
Before forging ahead, it is best to take a breather and explore why
money managers are such avid fans of fundamental analysis. Effi cient
market hypothesis (EMH) asserts that it is impossible to consistently
outperform average market returns on a risk-adjusted basis, as the mar-
kets are effi cient. The Nobel Prize winning work, modern portfolio
theory (MPT) and capital asset pricing model (CAPM) forms the sem-
inal research in this area: 1
• MPT emphasizes the benefi ts of diversifi cation when constructing
an investment portfolio.
• CAPM describes the relationship between nondiversifi able risk,
risk-free rate, and expected return in terms of a single variable Beta
(β), where β is a measure of correlated volatility of the asset com-
pared to the overall market as a whole.
CAPM cautions against diversifi able risk, as it is not rewarded with
a higher return. In the context of a portfolio, this can be achieved by
carefully combining assets that cancel out the diversifi able risk. Despite
its elevated standing, CAPM is not without faults. It can account for
only about 70 percent of returns. Moreover, β is not a good measure of
nondiversifi able risk, as it overlooks the macro environment, business
fundamentals, and current price. Eff orts to extend CAPM to account
for the remaining 30 percent of the returns have been decidedly mixed:
• The Fama-French Three Factor Model incorporated measures for
two other factors into the CAPM formula, which succeeded in
explaining 90 percent of the returns. 2 The model was based on the
observation that value stocks (those with a high book-to-market
c20.indd 210c20.indd 210 29-05-2013 08:21:5029-05-2013 08:21:50
Fundamental Analysis 211
ratio), and small-cap stocks were among those stocks that have tra-
ditionally shown excess returns. This fi nding was later refuted as the
historic outperformance was attributed to the assumptions made
about the type of stocks and the nature of their trades, not to their
ability as a group to provide excess returns without a corresponding
increase in nondiversifi able risk. For value stocks, studies showed
value trumped growth over short holding periods (up to a few
years) while the reverse was true for longer-term holding periods. 3
Similarly, a study of small-cap stocks (1981) presented evidence that
the CAPM model was off on its specifi cs, as a non-linear size eff ect
on returns over at least 40 years was observed. 4 Later studies further
stoked suspicion as to whether a small-cap premium actually existed. 5
• An array of multifactor models have appeared since, each attempt-
ing to provide the right mix of factors to explain the unaccounted
returns in CAPM. Success eluded them all.
The inability to pinpoint precisely the reason for a sizable portion
of the returns nails the fact that signifi cant ineffi ciencies exist in the
market, and that excess returns are available to stock pickers. Indeed,
this is the area that many of the best managers focus on to create good
absolute returns!
Value investing , a fundamental analysis-based philosophy, is the quest
to identify stocks that are trading at a large discount from their intrin-
sic values. A sizable percentage of contemporary investment gurus have
stamped their seal of approval on this approach and many among them
are fi rm believers in the bottom-up methodology. The core ideas on
value investing were fi rst conceived by Benjamin Graham and David
Dodd, and were presented in their classic investment book Security
Analysis (1934). 6 This book is regarded as the bible of value investing.
Money manager bias spreadsheets, insider ownership, corporate
insider fi lings, and so on, provide the investor with the advantage of
realizing price points better than, or very close to, that which the man-
ager paid. The downside, though, is that it does not off er insight as to
why a money manager might be trading a particular position. A way
to second guess the manager would be to partake in a value-oriented
fundamental analysis exercise. The chapter focuses on the techniques
the best managers are known to employ, and investors attempting to
c20.indd 211c20.indd 211 29-05-2013 08:21:5029-05-2013 08:21:50
212 p r o f i t i n g f r o m h e d g e f u n d s
shadow them surely stand to benefi t from doing an analysis based on
these methods.
Margin of Safety
Benjamin Graham and David Dodd coined this phrase in 1934 to
describe value investing, and defi ned it as the diff erence between
intrinsic value and market price. Intrinsic value can be estimated by
fundamental analysis. Purchasing securities with a good margin of
safety allows safeguarding capital, should an estimate prove erroneous.
Preservation of capital is crucial to value investing. Normal to frothy
market conditions rarely make it easy for value investors to snag secu-
rities with a reasonable margin of safety. They, therefore, are left hold-
ing cash. While the concept of investing in securities with a margin
of safety is easy to grasp, there are obstacles in following through and
implementing the strategy:
• For the margin of safety to have validity, there needs to be con-
fi dence in the intrinsic value estimate. This can be achieved only
through thorough fundamental research into the securities involved.
Obviously, this calls for a signifi cant time commitment; it takes
experience to excel in this sort of analysis.
• Staying on the sidelines until opportunities materialize is easier said
than done. Holding signifi cant cash based on market conditions is a
hard concept for most individual investors to digest, as they instinc-
tively reason their money isn ’t working, as though it is akin to the
familiar stuff ed money under the mattress.
• Arriving at what is a reasonable margin of safety is more art than
science. The type of security plays a large role; the objective of
capital preservation can be achieved with a lower margin of safety
when purchasing stable growing businesses compared to lower-
quality issues.
Although substantial impediments exist when it comes to suc-
cessfully investing with a good margin of safety, the techniques can be
applied at diff erent levels, based on experience. For investors new to
value investing, a foolproof option would be to purchase securities of
c20.indd 212c20.indd 212 29-05-2013 08:21:5029-05-2013 08:21:50
Fundamental Analysis 213
high-quality businesses (a back of the envelope defi nition would be
steady dividend payments over ten years or so). Preserving capital is
easier to achieve this way, more of a sandbox approach while getting to
speed on intrinsic value estimates. Committing capital only when fi nd-
ing those securities that off er a respectable margin of safety (10 percent
to 15 percent for high-quality issues) can do wonders to a portfolio ’s
performance; patience is indeed a virtue. An investor is better off
erring on the side of conservative intrinsic value estimation when
starting out. That translates to holding on tightly to one ’s cash until a
clear opportunity arises, following an overall market correction. In any
given year, corrections upward of 3 percent occur often, but its fre-
quency decreases as the percentage fi gure increases.
Fundamental analysis is by defi nition imperfect, for not all facts
about a security are made public. In addition, unavailable informa-
tion often causes a security to trade at a lower price; waiting for the
uncertainty to pass can cost investors the opportunity to invest with
a margin of safety. Therefore, fundamental analysis should be regarded
as a quest to obtain a reasonably accurate intrinsic value estimate with
the available information, rather than seeking the absolutely accu-
rate intrinsic value. Better fund managers wait patiently for a market
correction before deploying capital on a large scale. They also scout
meticulously for securities mispriced by the market. Situations where
mispricing of securities is prevalent include:
• Spin-off s : Institutional investors are inclined to dispose of such
securities, as they do not fi t into the general scheme of mutual
fund investment philosophy. Besides, the information is time
delayed; stock-selection screens do not acknowledge these securi-
ties immediately after the spin-off . These factors can lead to a sig-
nifi cant margin of safety in the wake of the spin-off . Small-cap
spin-off s generally get very little spotlight but, regrettably, some-
times management is responsible for this intentional anonymity:
Stock options received as part of the spin-off can have the unfor-
tunate side eff ect of management being incentivized to keep the
fi rst day ’s trading price low, as the exercise price is usually the fi rst
day ’s closing price. Spin-off through a rights off ering can some-
times result in the rights trading at a discount to its value. Rights
c20.indd 213c20.indd 213 29-05-2013 08:21:5029-05-2013 08:21:50
214 p r o f i t i n g f r o m h e d g e f u n d s
off ering is an option for original shareholders to keep their relative
ownership intact after the transaction. The rights end up trading
at a discount, as the original shareholders may not be motivated
to commit more capital for purchasing the new entity. A recent
example best illustrates this: Sears Holdings (SHLD) conducted a
spin-off of Sears Hometown Outlet Stores (SHOS) through
a rights off ering in mid-2012, whereby SHLD holders received the
right (SHOSR) to purchase 0.218091 shares of SHOS at $15 per
share. During the period till the spin-off date, the rights traded in
the $2.50 price range on the average, implying a market price of
$2.50*1/0.218091+$15=$26.46. SHOS started trading at around
$30 in early October netting a quick 10 percent profi t for anyone
who exercised the right. The lack of interest in SHOSR kept the
rights prices down, allowing an opportunity to invest with a mar-
gin of safety.
• Liquidations : There occur situations in which management
decides the best course to adopt for a business is to liquidate its
assets and return the equity to shareholders. Such announce-
ments can cause the stock to slide due to certain behavioral fac-
tors: demand for such issues decrease as some prefer investing in
ongoing businesses, while others shy away, given the uncertainties
regarding the value that will be realized and the timing of the pro-
cess. The lack of demand sometimes opens up a margin of safety
for value investors to exploit.
• Dividend eliminations : Businesses generally reduce or eliminate
dividends when they are in dire need of preserving cash, which is
usually a sign that the business is going through some sort of dis-
tress. Dividend eliminations can cause the alienation of an entire
class of shareholders who rely on dividend income. Consequently,
it is not unusual for the shares to sink signifi cantly in the days and
months following a dividend elimination announcement. The price
plunge can, in turn, open a margin of safety.
• Window dressing : Many mutual funds are famous for replacing
stocks that had large losses with stocks that showed recent outperfor-
mance as they approach the end of the quarter/year. It is a familiar
tactic to misguide prospective shareholders: The quarterly reports to
shareholders show the mutual funds as holding outperforming secu-
rities instead of positions with losses. The activity can result in stocks
c20.indd 214c20.indd 214 29-05-2013 08:21:5029-05-2013 08:21:50
Fundamental Analysis 215
that underperformed during the quarter to further dip by the end of
the quarter, off ering value investors a margin of safety.
• Insider hints : Signifi cantly large net insider buys can point to securi-
ties that have a margin of safety. The idea is to follow the smart money;
while insiders can sell for any reason, they buy signifi cant stakes in the
open market if and only if they can hear the charging bull.
• Acquisitions, thinly traded securities , businesses in distress,
and so on : Huge margins of safety may lurk in these areas but,
to unearth them, very specialized skills are required. It is best to
tread with caution. A relatively safe opportunity can materialize
in the risk-arbitrage area with respect to large announced acqui-
sitions. The spread can still be attractive, despite professional arbi-
trage traders vying for the same pie.
For investing in mispriced securities to be worthwhile, the margin of
safety also needs to be fairly high. Successful investments in such oppor-
tunities is a consequence of the accuracy of intrinsic value estimates—as
the estimates get better with experience, the chance of success increases.
Basic Checklist
Those responsible for complex tasks appreciate the safety net that
checklists off er. Checklists have fi gured in areas in which the tasks are
so complex that great attention to detail and teamwork are required to
complete them successfully. Missing an item can be disastrous. (Examples
include aviation safety 7 and hospital safety, 8 emergency care, surgery, etc.).
Checklists ensure that all pieces of the puzzle are accounted for. They
have since been adapted for use in many industrial operations to limit
errors and to mitigate risk of negligence lawsuits (the checklist is evi-
dence of following proper procedure in such situations).
In the investment arena, fundamental analysis is a complex and
imperfect process in which the game is won by those who make fewer
mistakes overall. A checklist can better conceptualize the nature of the
business. It can also help prevent mistakes induced primarily due to
one ’s inherent emotional fl aws. For example, it is a confi rmed theory
that whenever the market crashes, mutual fund redemptions increase
and infl ows go down and vice-versa. This bizarre phenomenon occurs
because humans are wired to fl ee from distress.
c20.indd 215c20.indd 215 29-05-2013 08:21:5029-05-2013 08:21:50
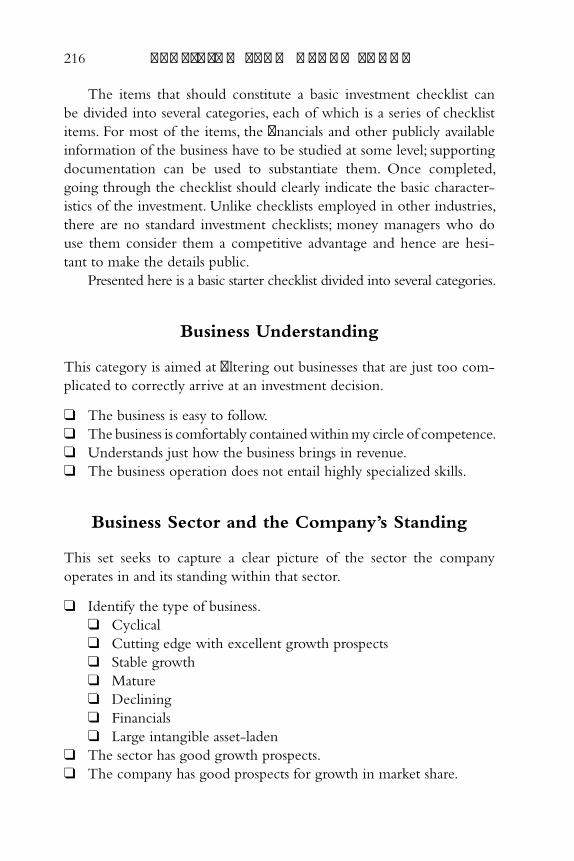
216 p r o f i t i n g f r o m h e d g e f u n d s
The items that should constitute a basic investment checklist can
be divided into several categories, each of which is a series of checklist
items. For most of the items, the fi nancials and other publicly available
information of the business have to be studied at some level; supporting
documentation can be used to substantiate them. Once completed,
going through the checklist should clearly indicate the basic character-
istics of the investment. Unlike checklists employed in other industries,
there are no standard investment checklists; money managers who do
use them consider them a competitive advantage and hence are hesi-
tant to make the details public.
Presented here is a basic starter checklist divided into several categories.
Business Understanding
This category is aimed at fi ltering out businesses that are just too com-
plicated to correctly arrive at an investment decision.
❑ The business is easy to follow.
❑ The business is comfortably contained within my circle of competence.
❑ Understands just how the business brings in revenue.
❑ The business operation does not entail highly specialized skills.
Business Sector and the Company ’s Standing
This set seeks to capture a clear picture of the sector the company
operates in and its standing within that sector.
❑ Identify the type of business.
❑ Cyclical
❑ Cutting edge with excellent growth prospects
❑ Stable growth
❑ Mature
❑ Declining
❑ Financials
❑ Large intangible asset-laden
❑ The sector has good growth prospects.
❑ The company has good prospects for growth in market share.
c20.indd 216c20.indd 216 29-05-2013 08:21:5029-05-2013 08:21:50
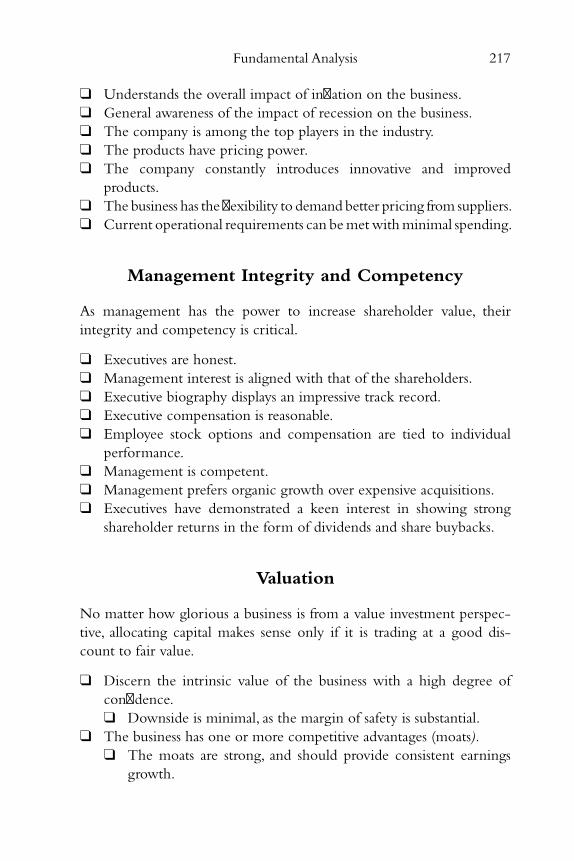
Fundamental Analysis 217
❑ Understands the overall impact of infl ation on the business.
❑ General awareness of the impact of recession on the business.
❑ The company is among the top players in the industry.
❑ The products have pricing power.
❑ The company constantly introduces innovative and improved
products.
❑ The business has the fl exibility to demand better pricing from suppliers.
❑ Current operational requirements can be met with minimal spending.
Management Integrity and Competency
As management has the power to increase shareholder value, their
integrity and competency is critical.
❑ Executives are honest.
❑ Management interest is aligned with that of the shareholders.
❑ Executive biography displays an impressive track record.
❑ Executive compensation is reasonable.
❑ Employee stock options and compensation are tied to individual
performance.
❑ Management is competent.
❑ Management prefers organic growth over expensive acquisitions.
❑ Executives have demonstrated a keen interest in showing strong
shareholder returns in the form of dividends and share buybacks.
Valuation
No matter how glorious a business is from a value investment perspec-
tive, allocating capital makes sense only if it is trading at a good dis-
count to fair value.
❑ Discern the intrinsic value of the business with a high degree of
confi dence.
❑ Downside is minimal, as the margin of safety is substantial.
❑ The business has one or more competitive advantages (moats ).
❑ The moats are strong, and should provide consistent earnings
growth.
c20.indd 217c20.indd 217 29-05-2013 08:21:5029-05-2013 08:21:50
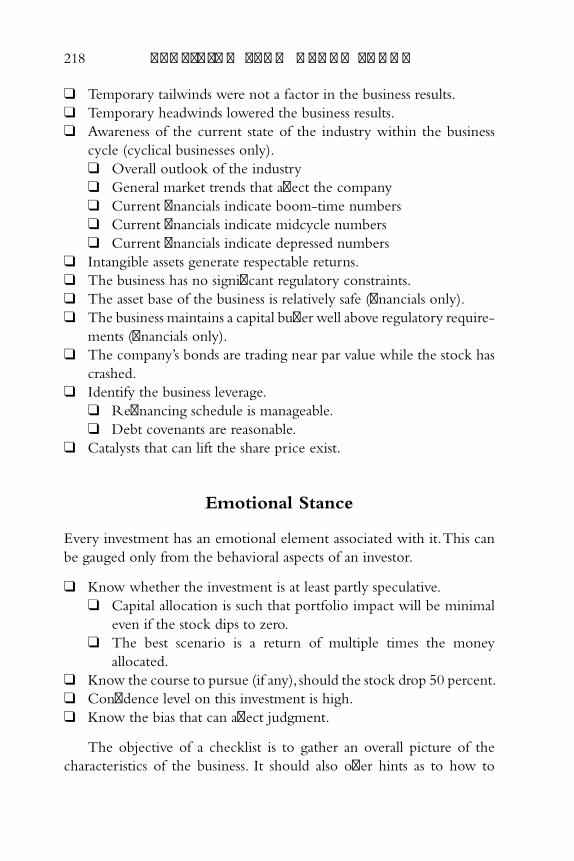
218 p r o f i t i n g f r o m h e d g e f u n d s
❑ Temporary tailwinds were not a factor in the business results.
❑ Temporary headwinds lowered the business results.
❑ Awareness of the current state of the industry within the business
cycle (cyclical businesses only).
❑ Overall outlook of the industry
❑ General market trends that aff ect the company
❑ Current fi nancials indicate boom-time numbers
❑ Current fi nancials indicate midcycle numbers
❑ Current fi nancials indicate depressed numbers
❑ Intangible assets generate respectable returns.
❑ The business has no signifi cant regulatory constraints.
❑ The asset base of the business is relatively safe (fi nancials only).
❑ The business maintains a capital buff er well above regulatory require-
ments (fi nancials only).
❑ The company ’s bonds are trading near par value while the stock has
crashed.
❑ Identify the business leverage.
❑ Refi nancing schedule is manageable.
❑ Debt covenants are reasonable.
❑ Catalysts that can lift the share price exist.
Emotional Stance
Every investment has an emotional element associated with it. This can
be gauged only from the behavioral aspects of an investor.
❑ Know whether the investment is at least partly speculative.
❑ Capital allocation is such that portfolio impact will be minimal
even if the stock dips to zero.
❑ The best scenario is a return of multiple times the money
allocated.
❑ Know the course to pursue (if any), should the stock drop 50 percent.
❑ Confi dence level on this investment is high.
❑ Know the bias that can aff ect judgment.
The objective of a checklist is to gather an overall picture of the
characteristics of the business. It should also off er hints as to how to
c20.indd 218c20.indd 218 29-05-2013 08:21:5029-05-2013 08:21:50
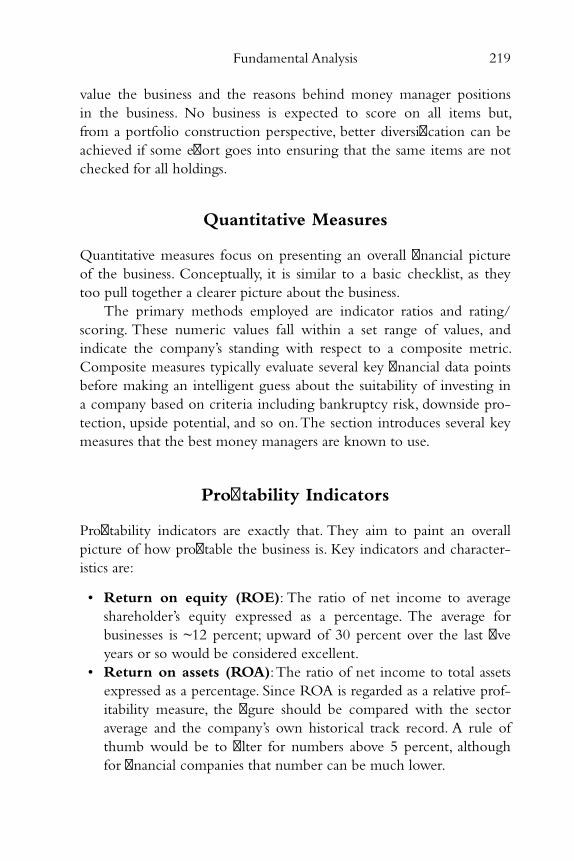
Fundamental Analysis 219
value the business and the reasons behind money manager positions
in the business. No business is expected to score on all items but,
from a portfolio construction perspective, better diversifi cation can be
achieved if some eff ort goes into ensuring that the same items are not
checked for all holdings.
Quantitative Measures
Quantitative measures focus on presenting an overall fi nancial picture
of the business. Conceptually, it is similar to a basic checklist, as they
too pull together a clearer picture about the business.
The primary methods employed are indicator ratios and rating/
scoring. These numeric values fall within a set range of values, and
indicate the company ’s standing with respect to a composite metric.
Composite measures typically evaluate several key fi nancial data points
before making an intelligent guess about the suitability of investing in
a company based on criteria including bankruptcy risk, downside pro-
tection, upside potential, and so on. The section introduces several key
measures that the best money managers are known to use.
Profi tability Indicators
Profi tability indicators are exactly that. They aim to paint an overall
picture of how profi table the business is. Key indicators and character-
istics are:
• Return on equity (ROE) : The ratio of net income to average
shareholder ’s equity expressed as a percentage. The average for
businesses is ~12 percent; upward of 30 percent over the last fi ve
years or so would be considered excellent.
• Return on assets (ROA) : The ratio of net income to total assets
expressed as a percentage. Since ROA is regarded as a relative prof-
itability measure, the fi gure should be compared with the sector
average and the company ’s own historical track record. A rule of
thumb would be to fi lter for numbers above 5 percent, although
for fi nancial companies that number can be much lower.
c20.indd 219c20.indd 219 29-05-2013 08:21:5029-05-2013 08:21:50
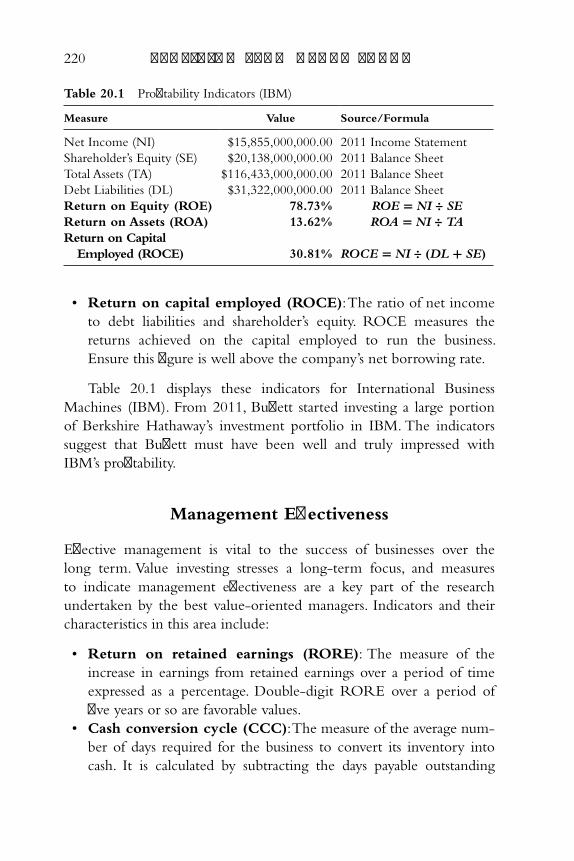
220 p r o f i t i n g f r o m h e d g e f u n d s
• Return on capital employed (ROCE) : The ratio of net income
to debt liabilities and shareholder ’s equity. ROCE measures the
returns achieved on the capital employed to run the business.
Ensure this fi gure is well above the company ’s net borrowing rate.
Table 20.1 displays these indicators for International Business
Machines (IBM). From 2011, Buff ett started investing a large portion
of Berkshire Hathaway ’s investment portfolio in IBM. The indicators
suggest that Buff ett must have been well and truly impressed with
IBM ’s profi tability.
Management Eff ectiveness
Eff ective management is vital to the success of businesses over the
long term. Value investing stresses a long-term focus, and measures
to indicate management eff ectiveness are a key part of the research
undertaken by the best value-oriented managers. Indicators and their
characteristics in this area include:
• Return on retained earnings (RORE) : The measure of the
increase in earnings from retained earnings over a period of time
expressed as a percentage. Double-digit RORE over a period of
fi ve years or so are favorable values.
• Cash conversion cycle (CCC) : The measure of the average num-
ber of days required for the business to convert its inventory into
cash. It is calculated by subtracting the days payable outstanding
Table 20.1 Profi tability Indicators (IBM)
Measure Value Source/Formula
Net Income (NI) $15,855,000,000.00 2011 Income Statement
Shareholder ’s Equity (SE) $20,138,000,000.00 2011 Balance Sheet
Total Assets (TA) $116,433,000,000.00 2011 Balance Sheet
Debt Liabilities (DL) $31,322,000,000.00 2011 Balance Sheet
Return on Equity (ROE) 78.73% R O E = N I ÷ S E
Return on Assets (ROA) 13.62% R O A = N I ÷ T A
Return on Capital
Employed (ROCE) 30.81% R O C E = N I ÷ ( D L + S E )
c20.indd 220c20.indd 220 29-05-2013 08:21:5029-05-2013 08:21:50
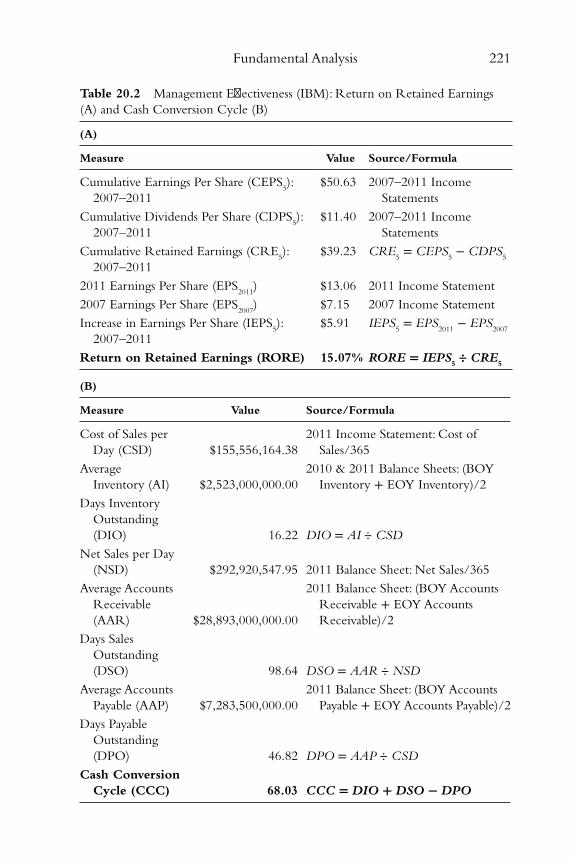
Fundamental Analysis 221
Table 20.2 Management Eff ectiveness (IBM): Return on Retained Earnings
(A) and Cash Conversion Cycle (B)
(A)
Measure Value Source/Formula
Cumulative Earnings Per Share (CEPS 5 ):
2007–2011
$50.63 2007–2011 Income
Statements
Cumulative Dividends Per Share (CDPS 5 ):
2007–2011
$11.40 2007–2011 Income
Statements
Cumulative Retained Earnings (CRE 5 ):
2007–2011
$39.23 C R E 5 = C E P S
5 − C D P S
5
2011 Earnings Per Share (EPS 2011
) $13.06 2011 Income Statement
2007 Earnings Per Share (EPS 2007
) $7.15 2007 Income Statement
Increase in Earnings Per Share (IEPS 5 ):
2007–2011
$5.91 I E P S 5 = E P S
2011 − E P S
2007
Return on Retained Earnings (RORE) 15.07% R O R E = I E P S 5 ÷ C R E
5
(B)
Measure Value Source/Formula
Cost of Sales per
Day (CSD) $155,556,164.38
2011 Income Statement: Cost of
Sales/365
Average
Inventory (AI) $2,523,000,000.00
2010 & 2011 Balance Sheets: (BOY
Inventory + EOY Inventory)/2
Days Inventory
Outstanding
(DIO) 16.22 D I O = A I ÷ C S D
Net Sales per Day
(NSD) $292,920,547.95 2011 Balance Sheet: Net Sales/365
Average Accounts
Receivable
(AAR) $28,893,000,000.00
2011 Balance Sheet: (BOY Accounts
Receivable + EOY Accounts
Receivable)/2
Days Sales
Outstanding
(DSO) 98.64 D S O = A A R ÷ N S D
Average Accounts
Payable (AAP) $7,283,500,000.00
2011 Balance Sheet: (BOY Accounts
Payable + EOY Accounts Payable)/2
Days Payable
Outstanding
(DPO) 46.82 D P O = A A P ÷ C S D
Cash Conversion
Cycle (CCC) 68.03 C C C = D I O + D S O − D P O
c20.indd 221c20.indd 221 29-05-2013 08:21:5029-05-2013 08:21:50
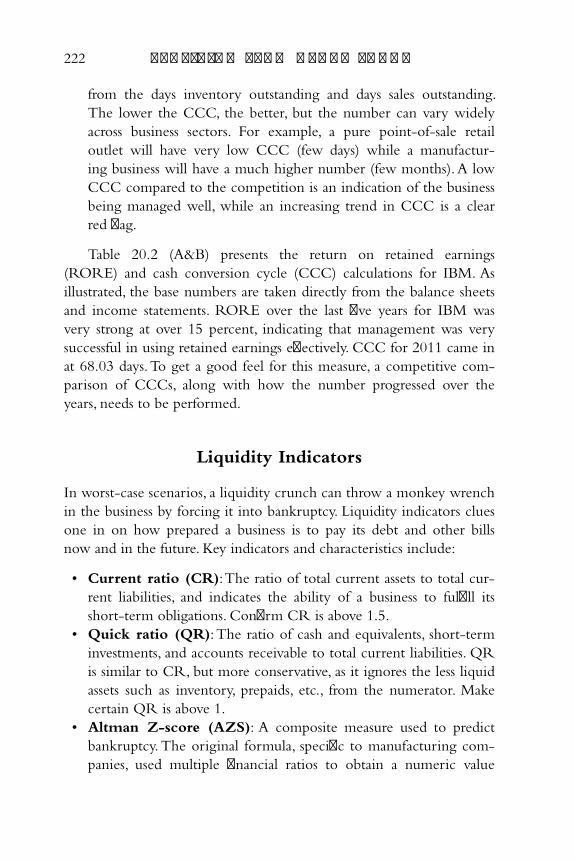
222 p r o f i t i n g f r o m h e d g e f u n d s
from the days inventory outstanding and days sales outstanding.
The lower the CCC, the better, but the number can vary widely
across business sectors. For example, a pure point-of-sale retail
outlet will have very low CCC (few days) while a manufactur-
ing business will have a much higher number (few months). A low
CCC compared to the competition is an indication of the business
being managed well, while an increasing trend in CCC is a clear
red fl ag.
Table 20.2 (A&B) presents the return on retained earnings
(RORE) and cash conversion cycle (CCC) calculations for IBM. As
illustrated, the base numbers are taken directly from the balance sheets
and income statements. RORE over the last fi ve years for IBM was
very strong at over 15 percent, indicating that management was very
successful in using retained earnings eff ectively. CCC for 2011 came in
at 68.03 days. To get a good feel for this measure, a competitive com-
parison of CCCs, along with how the number progressed over the
years, needs to be performed.
Liquidity Indicators
In worst-case scenarios, a liquidity crunch can throw a monkey wrench
in the business by forcing it into bankruptcy. Liquidity indicators clues
one in on how prepared a business is to pay its debt and other bills
now and in the future. Key indicators and characteristics include:
• Current ratio (CR) : The ratio of total current assets to total cur-
rent liabilities, and indicates the ability of a business to fulfi ll its
short-term obligations. Confi rm CR is above 1.5.
• Quick ratio (QR) : The ratio of cash and equivalents, short-term
investments, and accounts receivable to total current liabilities. QR
is similar to CR, but more conservative, as it ignores the less liquid
assets such as inventory, prepaids, etc., from the numerator. Make
certain QR is above 1.
• Altman Z-score (AZS) : A composite measure used to predict
bankruptcy. The original formula, specifi c to manufacturing com-
panies, used multiple fi nancial ratios to obtain a numeric value
c20.indd 222c20.indd 222 29-05-2013 08:21:5029-05-2013 08:21:50
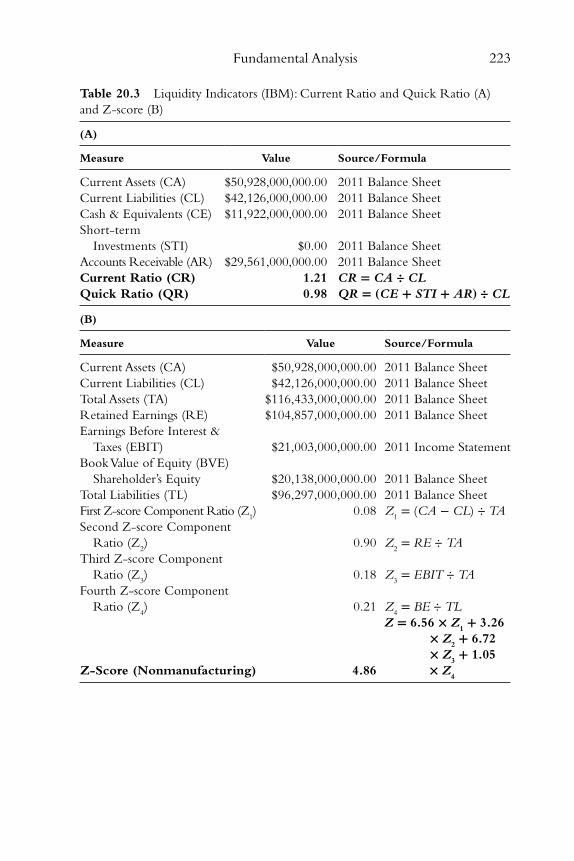
Fundamental Analysis 223
Table 20.3 Liquidity Indicators (IBM): Current Ratio and Quick Ratio (A)
and Z-score (B)
(A)
Measure Value Source/Formula
Current Assets (CA) $50,928,000,000.00 2011 Balance Sheet
Current Liabilities (CL) $42,126,000,000.00 2011 Balance Sheet
Cash & Equivalents (CE) $11,922,000,000.00 2011 Balance Sheet
Short-term
Investments (STI) $0.00 2011 Balance Sheet
Accounts Receivable (AR) $29,561,000,000.00 2011 Balance Sheet
Current Ratio (CR) 1.21 C R = C A ÷ C L
Quick Ratio (QR) 0.98 Q R = ( C E + S T I + A R ) ÷ C L
(B)
Measure Value Source/Formula
Current Assets (CA) $50,928,000,000.00 2011 Balance Sheet
Current Liabilities (CL) $42,126,000,000.00 2011 Balance Sheet
Total Assets (TA) $116,433,000,000.00 2011 Balance Sheet
Retained Earnings (RE) $104,857,000,000.00 2011 Balance Sheet
Earnings Before Interest &
Taxes (EBIT) $21,003,000,000.00 2011 Income Statement
Book Value of Equity (BVE)
Shareholder ’s Equity $20,138,000,000.00 2011 Balance Sheet
Total Liabilities (TL) $96,297,000,000.00 2011 Balance Sheet
First Z-score Component Ratio (Z 1 ) 0.08 Z
1 = ( C A − C L ) ÷ T A
Second Z-score Component
Ratio (Z 2 ) 0.90 Z
2 = R E ÷ T A
Third Z-score Component
Ratio (Z 3 ) 0.18 Z
3 = E B I T ÷ T A
Fourth Z-score Component
Ratio (Z 4 ) 0.21 Z
4 = B E ÷ T L
Z-Score (Nonmanufacturing) 4.86
Z = 6.56 × Z 1 + 3.26
× Z 2 + 6.72
× Z 3 + 1.05
× Z4
c20.indd 223c20.indd 223 29-05-2013 08:21:5029-05-2013 08:21:50
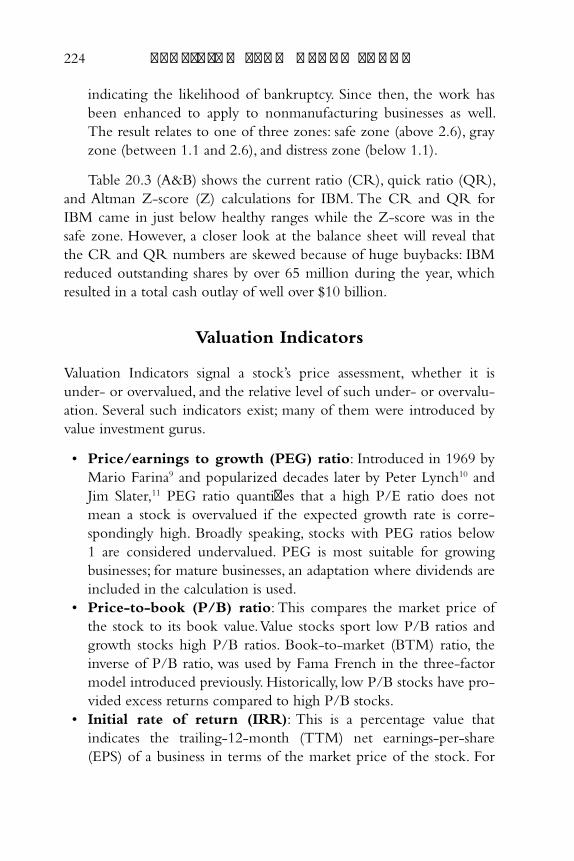
224 p r o f i t i n g f r o m h e d g e f u n d s
indicating the likelihood of bankruptcy. Since then, the work has
been enhanced to apply to nonmanufacturing businesses as well.
The result relates to one of three zones: safe zone (above 2.6), gray
zone (between 1.1 and 2.6), and distress zone (below 1.1).
Table 20.3 (A&B) shows the current ratio (CR), quick ratio (QR),
and Altman Z-score (Z) calculations for IBM. The CR and QR for
IBM came in just below healthy ranges while the Z-score was in the
safe zone. However, a closer look at the balance sheet will reveal that
the CR and QR numbers are skewed because of huge buybacks: IBM
reduced outstanding shares by over 65 million during the year, which
resulted in a total cash outlay of well over $10 billion.
Valuation Indicators
Valuation Indicators signal a stock ’s price assessment, whether it is
under- or overvalued, and the relative level of such under- or overvalu-
ation. Several such indicators exist; many of them were introduced by
value investment gurus.
• Price/earnings to growth (PEG) ratio : Introduced in 1969 by
Mario Farina 9 and popularized decades later by Peter Lynch 10 and
Jim Slater, 11 PEG ratio quantifi es that a high P/E ratio does not
mean a stock is overvalued if the expected growth rate is corre-
spondingly high. Broadly speaking, stocks with PEG ratios below
1 are considered undervalued. PEG is most suitable for growing
businesses; for mature businesses, an adaptation where dividends are
included in the calculation is used.
• Price-to-book (P/B) ratio : This compares the market price of
the stock to its book value. Value stocks sport low P/B ratios and
growth stocks high P/B ratios. Book-to-market (BTM) ratio, the
inverse of P/B ratio, was used by Fama French in the three-factor
model introduced previously. Historically, low P/B stocks have pro-
vided excess returns compared to high P/B stocks.
• Initial rate of return (IRR) : This is a percentage value that
indicates the trailing-12-month (TTM) net earnings-per-share
(EPS) of a business in terms of the market price of the stock. For
c20.indd 224c20.indd 224 29-05-2013 08:21:5029-05-2013 08:21:50
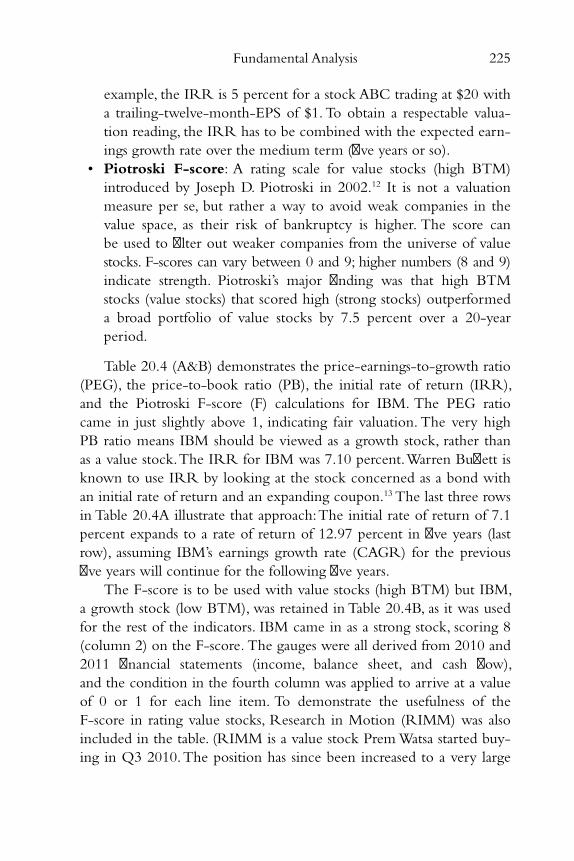
Fundamental Analysis 225
example, the IRR is 5 percent for a stock ABC trading at $20 with
a trailing-twelve-month-EPS of $1. To obtain a respectable valua-
tion reading, the IRR has to be combined with the expected earn-
ings growth rate over the medium term (fi ve years or so).
• Piotroski F-score : A rating scale for value stocks (high BTM)
introduced by Joseph D. Piotroski in 2002. 12 It is not a valuation
measure per se, but rather a way to avoid weak companies in the
value space, as their risk of bankruptcy is higher. The score can
be used to fi lter out weaker companies from the universe of value
stocks. F-scores can vary between 0 and 9; higher numbers (8 and 9)
indicate strength. Piotroski ’s major fi nding was that high BTM
stocks (value stocks) that scored high (strong stocks) outperformed
a broad portfolio of value stocks by 7.5 percent over a 20-year
period.
Table 20.4 (A&B) demonstrates the price-earnings-to-growth ratio
(PEG), the price-to-book ratio (PB), the initial rate of return (IRR),
and the Piotroski F-score (F) calculations for IBM. The PEG ratio
came in just slightly above 1, indicating fair valuation. The very high
PB ratio means IBM should be viewed as a growth stock, rather than
as a value stock. The IRR for IBM was 7.10 percent. Warren Buff ett is
known to use IRR by looking at the stock concerned as a bond with
an initial rate of return and an expanding coupon. 13 The last three rows
in Table 20.4 A illustrate that approach: The initial rate of return of 7.1
percent expands to a rate of return of 12.97 percent in fi ve years (last
row), assuming IBM ’s earnings growth rate (CAGR) for the previous
fi ve years will continue for the following fi ve years.
The F-score is to be used with value stocks (high BTM) but IBM,
a growth stock (low BTM), was retained in Table 20.4 B, as it was used
for the rest of the indicators. IBM came in as a strong stock, scoring 8
(column 2) on the F-score . The gauges were all derived from 2010 and
2011 fi nancial statements (income, balance sheet, and cash fl ow),
and the condition in the fourth column was applied to arrive at a value
of 0 or 1 for each line item. To demonstrate the usefulness of the
F-score in rating value stocks, Research in Motion (RIMM) was also
included in the table. (RIMM is a value stock Prem Watsa started buy-
ing in Q3 2010. The position has since been increased to a very large
c20.indd 225c20.indd 225 29-05-2013 08:21:5029-05-2013 08:21:50
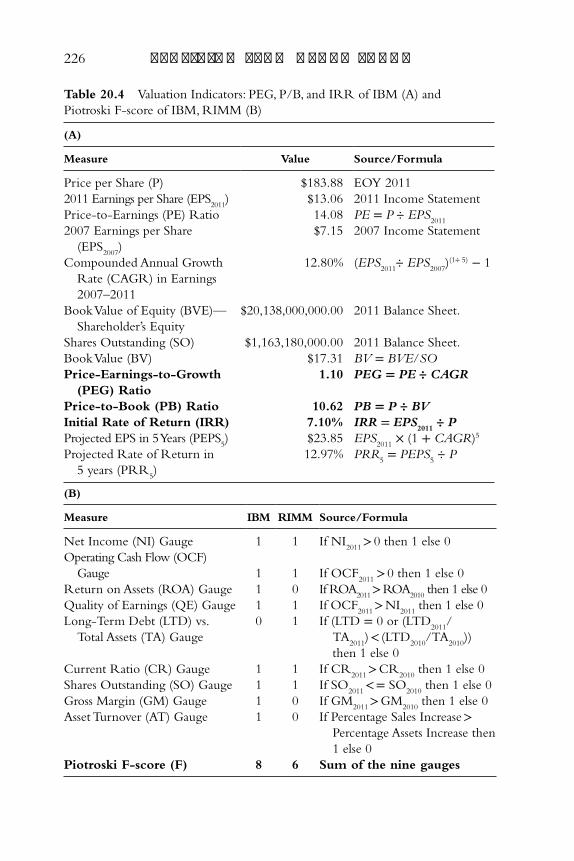
226 p r o f i t i n g f r o m h e d g e f u n d s
Table 20.4 Valuation Indicators: PEG, P/B, and IRR of IBM (A) and
Piotroski F-score of IBM, RIMM (B)
(A)
Measure Value Source/Formula
Price per Share (P) $183.88 EOY 2011
2011 Earnings per Share (EPS 2011
) $13.06 2011 Income Statement
Price-to-Earnings (PE) Ratio 14.08 P E = P ÷ E P S 2011
2007 Earnings per Share
(EPS 2007
)
$7.15 2007 Income Statement
Compounded Annual Growth
Rate (CAGR) in Earnings
2007–2011
12.80% ( E P S 2011
÷ E P S 2007
) ( 1 ÷ 5 ) − 1
Book Value of Equity (BVE)—
Shareholder ’s Equity
$20,138,000,000.00 2011 Balance Sheet.
Shares Outstanding (SO) $1,163,180,000.00 2011 Balance Sheet.
Book Value (BV) $17.31 B V = B V E/ S O
Price-Earnings-to-Growth
(PEG) Ratio
1.10 P E G = P E ÷ C A G R
Price-to-Book (PB) Ratio 10.62 P B = P ÷ B V
Initial Rate of Return (IRR) 7.10% I R R = E P S 2011
÷ P
Projected EPS in 5 Years (PEPS 5 ) $23.85 E P S
2011 × ( 1 + C A G R ) 5
Projected Rate of Return in
5 years (PRR 5 )
12.97% P R R 5 = P E P S
5 ÷ P
(B)
Measure IBM RIMM Source/Formula
Net Income (NI) Gauge 1 1 If NI 2011
> 0 then 1 else 0
Operating Cash Flow (OCF)
Gauge 1 1 If OCF 2011
> 0 then 1 else 0
Return on Assets (ROA) Gauge 1 0 If ROA 2011
> ROA 2010
then 1 else 0
Quality of Earnings (QE) Gauge 1 1 If OCF 2011
> NI 2011
then 1 else 0
Long-Term Debt (LTD) vs.
Total Assets (TA) Gauge
0 1 If (LTD = 0 or (LTD 2011
/
TA 2011
) < (LTD 2010
/TA 2010
))
then 1 else 0
Current Ratio (CR) Gauge 1 1 If CR 2011
> CR 2010
then 1 else 0
Shares Outstanding (SO) Gauge 1 1 If SO 2011
< = SO 2010
then 1 else 0
Gross Margin (GM) Gauge 1 0 If GM 2011
> GM 2010
then 1 else 0
Asset Turnover (AT) Gauge 1 0 If Percentage Sales Increase >
Percentage Assets Increase then
1 else 0
Piotroski F-score (F) 8 6 Sum of the nine gauges
c20.indd 226c20.indd 226 29-05-2013 08:21:5029-05-2013 08:21:50
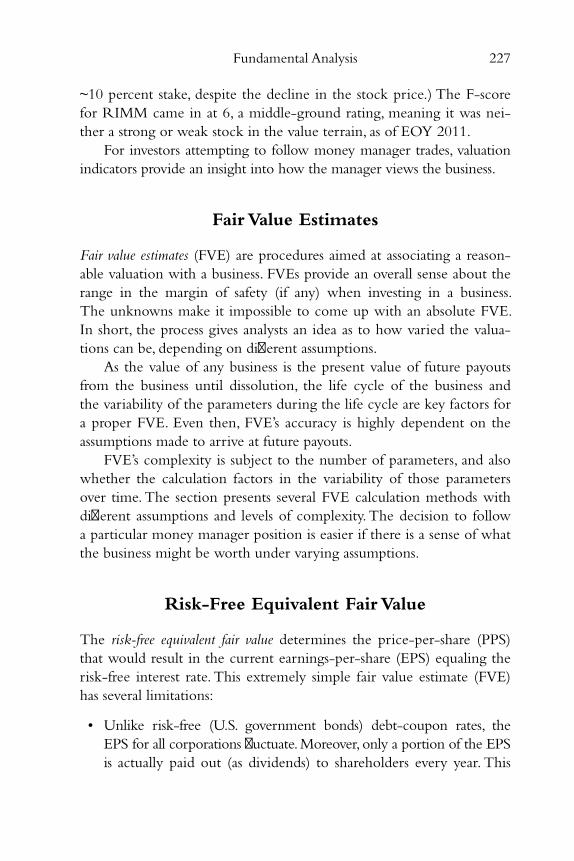
Fundamental Analysis 227
~10 percent stake, despite the decline in the stock price.) The F-score
for RIMM came in at 6, a middle-ground rating, meaning it was nei-
ther a strong or weak stock in the value terrain, as of EOY 2011.
For investors attempting to follow money manager trades, valuation
indicators provide an insight into how the manager views the business.
Fair Value Estimates
Fair value estimates (FVE) are procedures aimed at associating a reason-
able valuation with a business. FVEs provide an overall sense about the
range in the margin of safety (if any) when investing in a business.
The unknowns make it impossible to come up with an absolute FVE.
In short, the process gives analysts an idea as to how varied the valua-
tions can be, depending on diff erent assumptions.
As the value of any business is the present value of future payouts
from the business until dissolution, the life cycle of the business and
the variability of the parameters during the life cycle are key factors for
a proper FVE. Even then, FVE ’s accuracy is highly dependent on the
assumptions made to arrive at future payouts.
FVE ’s complexity is subject to the number of parameters, and also
whether the calculation factors in the variability of those parameters
over time. The section presents several FVE calculation methods with
diff erent assumptions and levels of complexity. The decision to follow
a particular money manager position is easier if there is a sense of what
the business might be worth under varying assumptions.
Risk-Free Equivalent Fair Value
The risk-free equivalent fair value determines the price-per-share (PPS)
that would result in the current earnings-per-share (EPS) equaling the
risk-free interest rate. This extremely simple fair value estimate (FVE)
has several limitations:
• Unlike risk-free (U.S. government bonds) debt-coupon rates, the
EPS for all corporations fl uctuate. Moreover, only a portion of the EPS
is actually paid out (as dividends) to shareholders every year. This
c20.indd 227c20.indd 227 29-05-2013 08:21:5029-05-2013 08:21:50
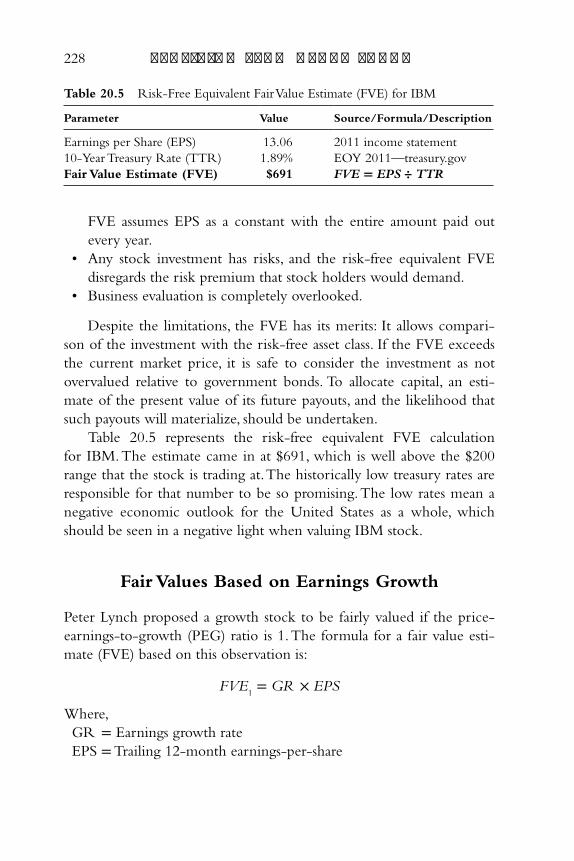
228 p r o f i t i n g f r o m h e d g e f u n d s
FVE assumes EPS as a constant with the entire amount paid out
every year.
• Any stock investment has risks, and the risk-free equivalent FVE
disregards the risk premium that stock holders would demand.
• Business evaluation is completely overlooked.
Despite the limitations, the FVE has its merits: It allows compari-
son of the investment with the risk-free asset class. If the FVE exceeds
the current market price, it is safe to consider the investment as not
overvalued relative to government bonds. To allocate capital, an esti-
mate of the present value of its future payouts, and the likelihood that
such payouts will materialize, should be undertaken.
Table 20.5 represents the risk-free equivalent FVE calculation
for IBM. The estimate came in at $691, which is well above the $200
range that the stock is trading at. The historically low treasury rates are
responsible for that number to be so promising. The low rates mean a
negative economic outlook for the United States as a whole, which
should be seen in a negative light when valuing IBM stock.
Fair Values Based on Earnings Growth
Peter Lynch proposed a growth stock to be fairly valued if the price-
earnings-to-growth (PEG) ratio is 1. The formula for a fair value esti-
mate (FVE) based on this observation is:
F V E 1 = G R × E P S
Where,
GR = Earnings growth rate
EPS = Trailing 12-month earnings-per-share
Table 20.5 Risk-Free Equivalent Fair Value Estimate (FVE) for IBM
Parameter Value Source/Formula/Description
Earnings per Share (EPS) 13.06 2011 income statement
10-Year Treasury Rate (TTR) 1.89% EOY 2011— treasury.gov
Fair Value Estimate (FVE) $691 F V E = E P S ÷ T T R
c20.indd 228c20.indd 228 29-05-2013 08:21:5029-05-2013 08:21:50
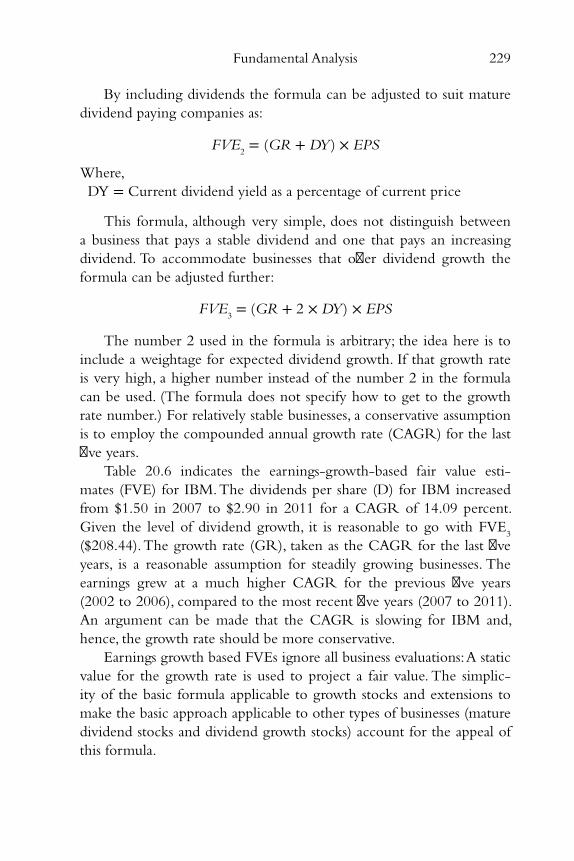
Fundamental Analysis 229
By including dividends the formula can be adjusted to suit mature
dividend paying companies as:
F V E 2 = ( G R + D Y ) × E P S
Where,
DY = Current dividend yield as a percentage of current price
This formula, although very simple, does not distinguish between
a business that pays a stable dividend and one that pays an increasing
dividend. To accommodate businesses that off er dividend growth the
formula can be adjusted further:
F V E 3 = ( G R + 2 × D Y ) × E P S
The number 2 used in the formula is arbitrary; the idea here is to
include a weightage for expected dividend growth. If that growth rate
is very high, a higher number instead of the number 2 in the formula
can be used. (The formula does not specify how to get to the growth
rate number.) For relatively stable businesses, a conservative assumption
is to employ the compounded annual growth rate (CAGR) for the last
fi ve years.
Table 20.6 indicates the earnings-growth-based fair value esti-
mates (FVE) for IBM. The dividends per share (D) for IBM increased
from $1.50 in 2007 to $2.90 in 2011 for a CAGR of 14.09 percent.
Given the level of dividend growth, it is reasonable to go with FVE 3
($208.44). The growth rate (GR), taken as the CAGR for the last fi ve
years, is a reasonable assumption for steadily growing businesses. The
earnings grew at a much higher CAGR for the previous fi ve years
(2002 to 2006), compared to the most recent fi ve years (2007 to 2011).
An argument can be made that the CAGR is slowing for IBM and,
hence, the growth rate should be more conservative.
Earnings growth based FVEs ignore all business evaluations: A static
value for the growth rate is used to project a fair value. The simplic-
ity of the basic formula applicable to growth stocks and extensions to
make the basic approach applicable to other types of businesses (mature
dividend stocks and dividend growth stocks) account for the appeal of
this formula.
c20.indd 229c20.indd 229 29-05-2013 08:21:5029-05-2013 08:21:50
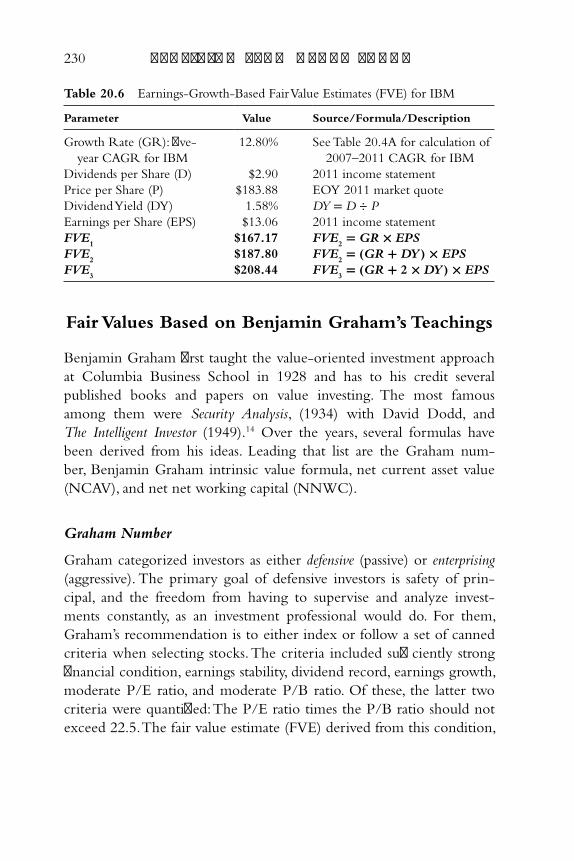
230 p r o f i t i n g f r o m h e d g e f u n d s
Fair Values Based on Benjamin Graham ’s Teachings
Benjamin Graham fi rst taught the value-oriented investment approach
at Columbia Business School in 1928 and has to his credit several
published books and papers on value investing. The most famous
among them were Security Analysis , (1934) with David Dodd, and
The Intelligent Investor (1949). 14 Over the years, several formulas have
been derived from his ideas. Leading that list are the Graham num-
ber, Benjamin Graham intrinsic value formula, net current asset value
(NCAV), and net net working capital (NNWC).
Graham Number
Graham categorized investors as either defensive (passive) or enterprising
(aggressive). The primary goal of defensive investors is safety of prin-
cipal, and the freedom from having to supervise and analyze invest-
ments constantly, as an investment professional would do. For them,
Graham ’s recommendation is to either index or follow a set of canned
criteria when selecting stocks. The criteria included suffi ciently strong
fi nancial condition, earnings stability, dividend record, earnings growth,
moderate P/E ratio, and moderate P/B ratio. Of these, the latter two
criteria were quantifi ed: The P/E ratio times the P/B ratio should not
exceed 22.5. The fair value estimate (FVE) derived from this condition,
Table 20.6 Earnings-Growth-Based Fair Value Estimates (FVE) for IBM
Parameter Value Source/Formula/Description
Growth Rate (GR): fi ve-
year CAGR for IBM
12.80% See Table 20.4 A for calculation of
2007–2011 CAGR for IBM
Dividends per Share (D) $2.90 2011 income statement
Price per Share (P) $183.88 EOY 2011 market quote
Dividend Yield (DY) 1.58% D Y = D ÷ P
Earnings per Share (EPS) $13.06 2011 income statement
F V E 1
$167.17 F V E 2 = G R × E P S
F V E 2 $187.80 F V E
2 = ( G R + D Y ) × E P S
F V E 3 $208.44 F V E
3 = ( G R + 2 × D Y ) × E P S
c20.indd 230c20.indd 230 29-05-2013 08:21:5029-05-2013 08:21:50
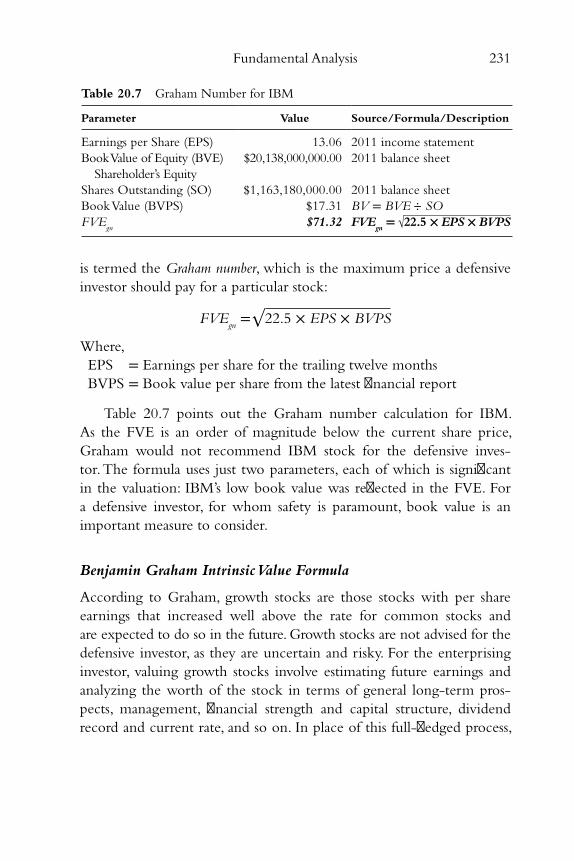
Fundamental Analysis 231
is termed the Graham number , which is the maximum price a defensive
investor should pay for a particular stock:
F V E g n = √ 22.5 × E P S × B V P S
Where,
EPS = Earnings per share for the trailing twelve months
BVPS = Book value per share from the latest fi nancial report
Table 20.7 points out the Graham number calculation for IBM.
As the FVE is an order of magnitude below the current share price,
Graham would not recommend IBM stock for the defensive inves-
tor. The formula uses just two parameters, each of which is signifi cant
in the valuation: IBM ’s low book value was refl ected in the FVE. For
a defensive investor, for whom safety is paramount, book value is an
important measure to consider.
Benjamin Graham Intrinsic Value Formula
According to Graham, growth stocks are those stocks with per share
earnings that increased well above the rate for common stocks and
are expected to do so in the future. Growth stocks are not advised for the
defensive investor, as they are uncertain and risky. For the enterprising
investor, valuing growth stocks involve estimating future earnings and
analyzing the worth of the stock in terms of general long-term pros-
pects, management, fi nancial strength and capital structure, dividend
record and current rate, and so on. In place of this full-fl edged process,
Table 20.7 Graham Number for IBM
Parameter Value Source/Formula/Description
Earnings per Share (EPS) 13.06 2011 income statement
Book Value of Equity (BVE)
Shareholder ’s Equity
$20,138,000,000.00 2011 balance sheet
Shares Outstanding (SO) $1,163,180,000.00 2011 balance sheet
Book Value (BVPS) $17.31 B V = B V E ÷ S O
F V E g n $71.32 F V E
g n = √22.5 × E P S × B V P S
c20.indd 231c20.indd 231 29-05-2013 08:21:5029-05-2013 08:21:50
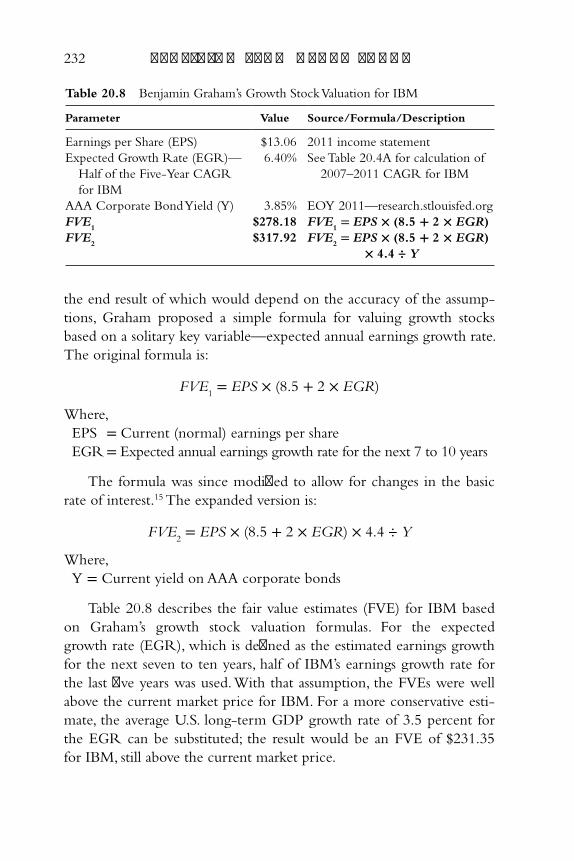
232 p r o f i t i n g f r o m h e d g e f u n d s
the end result of which would depend on the accuracy of the assump-
tions, Graham proposed a simple formula for valuing growth stocks
based on a solitary key variable—expected annual earnings growth rate.
The original formula is:
F V E 1 = E P S × ( 8.5 + 2 × E G R )
Where,
EPS = Current (normal) earnings per share
EGR = Expected annual earnings growth rate for the next 7 to 10 years
The formula was since modifi ed to allow for changes in the basic
rate of interest. 15 The expanded version is:
F V E 2 = E P S × ( 8.5 + 2 × E G R ) × 4.4 ÷ Y
Where,
Y = Current yield on AAA corporate bonds
Table 20.8 describes the fair value estimates (FVE) for IBM based
on Graham ’s growth stock valuation formulas. For the expected
growth rate (EGR), which is defi ned as the estimated earnings growth
for the next seven to ten years, half of IBM ’s earnings growth rate for
the last fi ve years was used. With that assumption, the FVEs were well
above the current market price for IBM. For a more conservative esti-
mate, the average U.S. long-term GDP growth rate of 3.5 percent for
the EGR can be substituted; the result would be an FVE of $231.35
for IBM, still above the current market price.
Table 20.8 Benjamin Graham’s Growth Stock Valuation for IBM
Parameter Value Source/Formula/Description
Earnings per Share (EPS) $13.06 2011 income statement
Expected Growth Rate (EGR)—
Half of the Five-Year CAGR
for IBM
6.40% See Table 20.4 A for calculation of
2007–2011 CAGR for IBM
AAA Corporate Bond Yield (Y) 3.85% EOY 2011— research.stlouisfed.org
F V E 1 $278.18 F V E
1 = E P S × ( 8.5 + 2 × E G R )
F V E 2 $317.92 F V E
2 = E P S × ( 8.5 + 2 × E G R )
× 4.4 ÷ Y
c20.indd 232c20.indd 232 29-05-2013 08:21:5029-05-2013 08:21:50
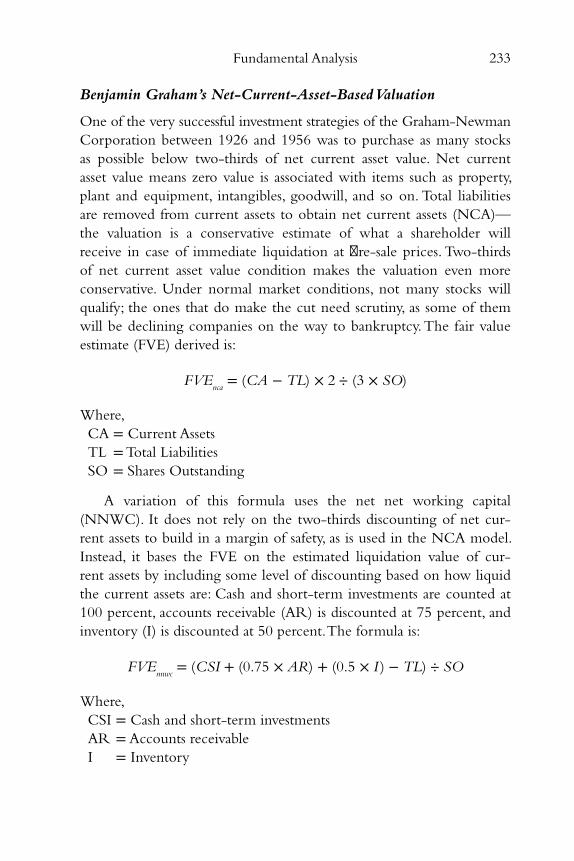
Fundamental Analysis 233
Benjamin Graham ’s Net-Current-Asset-Based Valuation
One of the very successful investment strategies of the Graham-Newman
Corporation between 1926 and 1956 was to purchase as many stocks
as possible below two-thirds of net current asset value. Net current
asset value means zero value is associated with items such as property,
plant and equipment, intangibles, goodwill, and so on. Total liabilities
are removed from current assets to obtain net current assets (NCA)—
the valuation is a conservative estimate of what a shareholder will
receive in case of immediate liquidation at fi re-sale prices. Two-thirds
of net current asset value condition makes the valuation even more
conservative. Under normal market conditions, not many stocks will
qualify; the ones that do make the cut need scrutiny, as some of them
will be declining companies on the way to bankruptcy. The fair value
estimate (FVE) derived is:
F V E n c a
= ( C A − T L ) × 2 ÷ ( 3 × S O )
Where,
CA = Current Assets
TL = Total Liabilities
SO = Shares Outstanding
A variation of this formula uses the net net working capital
(NNWC). It does not rely on the two-thirds discounting of net cur-
rent assets to build in a margin of safety, as is used in the NCA model.
Instead, it bases the FVE on the estimated liquidation value of cur-
rent assets by including some level of discounting based on how liquid
the current assets are: Cash and short-term investments are counted at
100 percent, accounts receivable (AR) is discounted at 75 percent, and
inventory (I) is discounted at 50 percent. The formula is:
F V E n n w c
= ( C S I + ( 0.75 × A R ) + ( 0.5 × I ) − T L ) ÷ S O
Where,
CSI = Cash and short-term investments
AR = Accounts receivable
I = Inventory
c20.indd 233c20.indd 233 29-05-2013 08:21:5129-05-2013 08:21:51
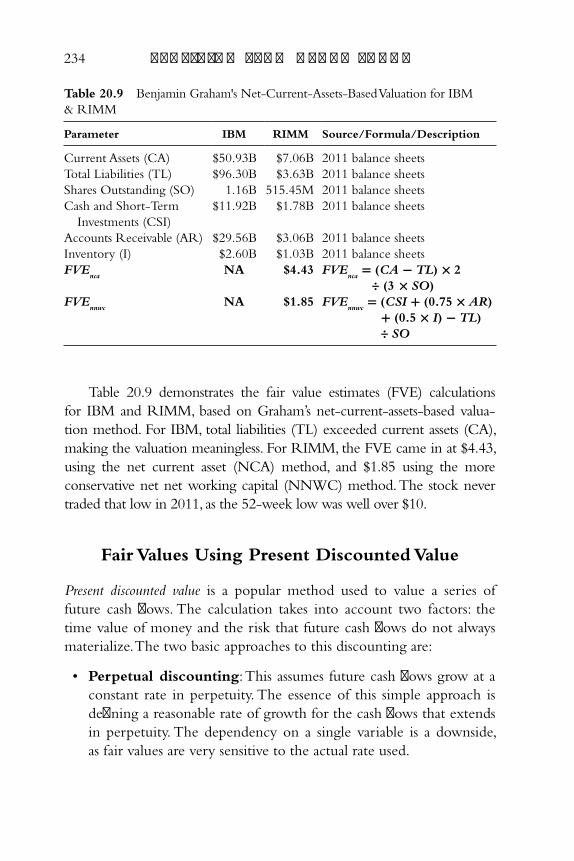
234 p r o f i t i n g f r o m h e d g e f u n d s
Table 20.9 demonstrates the fair value estimates (FVE) calculations
for IBM and RIMM, based on Graham ’s net-current-assets-based valua-
tion method. For IBM, total liabilities (TL) exceeded current assets (CA),
making the valuation meaningless. For RIMM, the FVE came in at $4.43,
using the net current asset (NCA) method, and $1.85 using the more
conservative net net working capital (NNWC) method. The stock never
traded that low in 2011, as the 52-week low was well over $10.
Fair Values Using Present Discounted Value
Present discounted value is a popular method used to value a series of
future cash fl ows. The calculation takes into account two factors: the
time value of money and the risk that future cash fl ows do not always
materialize. The two basic approaches to this discounting are:
• Perpetual discounting : This assumes future cash fl ows grow at a
constant rate in perpetuity. The essence of this simple approach is
defi ning a reasonable rate of growth for the cash fl ows that extends
in perpetuity. The dependency on a single variable is a downside,
as fair values are very sensitive to the actual rate used.
Table 20.9 Benjamin Graham's Net-Current-Assets-Based Valuation for IBM
& RIMM
Parameter IBM RIMM Source/Formula/Description
Current Assets (CA) $50.93B $7.06B 2011 balance sheets
Total Liabilities (TL) $96.30B $3.63B 2011 balance sheets
Shares Outstanding (SO) 1.16B 515.45M 2011 balance sheets
Cash and Short-Term
Investments (CSI)
$11.92B $1.78B 2011 balance sheets
Accounts Receivable (AR) $29.56B $3.06B 2011 balance sheets
Inventory (I) $2.60B $1.03B 2011 balance sheets
F V E n c a
NA $4.43 F V E n c a
= ( C A − T L ) × 2
÷ ( 3 × S O )
F V E n n w c
NA $1.85 F V E n n w c
= ( C S I + ( 0.75 × A R )
+ ( 0.5 × I ) − T L )
÷ S O
c20.indd 234c20.indd 234 29-05-2013 08:21:5129-05-2013 08:21:51
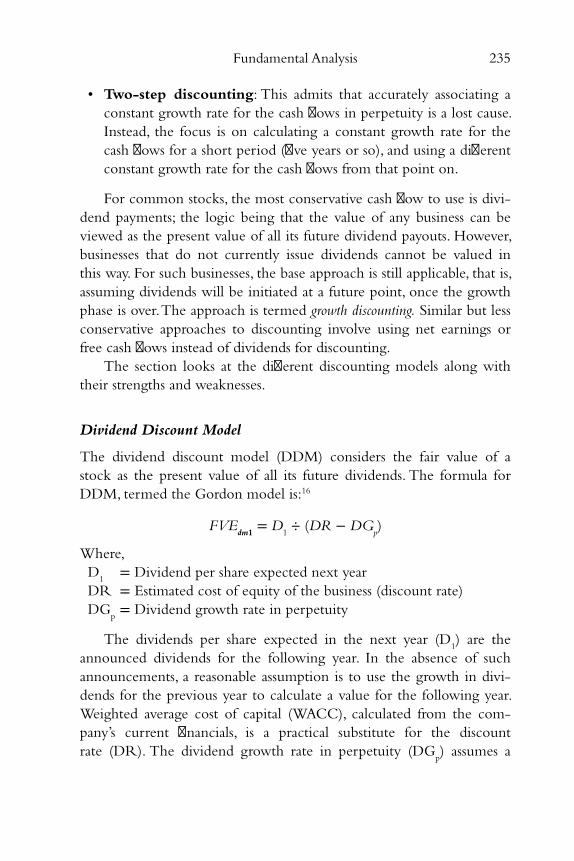
Fundamental Analysis 235
• Two-step discounting : This admits that accurately associating a
constant growth rate for the cash fl ows in perpetuity is a lost cause.
Instead, the focus is on calculating a constant growth rate for the
cash fl ows for a short period (fi ve years or so), and using a diff erent
constant growth rate for the cash fl ows from that point on.
For common stocks, the most conservative cash fl ow to use is divi-
dend payments; the logic being that the value of any business can be
viewed as the present value of all its future dividend payouts. However,
businesses that do not currently issue dividends cannot be valued in
this way. For such businesses, the base approach is still applicable, that is,
assuming dividends will be initiated at a future point, once the growth
phase is over. The approach is termed growth discounting. Similar but less
conservative approaches to discounting involve using net earnings or
free cash fl ows instead of dividends for discounting.
The section looks at the diff erent discounting models along with
their strengths and weaknesses.
Dividend Discount Model
The dividend discount model (DDM) considers the fair value of a
stock as the present value of all its future dividends. The formula for
DDM, termed the Gordon model is: 16
F V E d m 1
= D 1 ÷ ( D R − D G
p )
Where, D
1 = Dividend per share expected next year
DR = Estimated cost of equity of the business (discount rate) DG
p = Dividend growth rate in perpetuity
The dividends per share expected in the next year (D 1 ) are the
announced dividends for the following year. In the absence of such
announcements, a reasonable assumption is to use the growth in divi-
dends for the previous year to calculate a value for the following year.
Weighted average cost of capital (WACC), calculated from the com-
pany ’s current fi nancials, is a practical substitute for the discount
rate (DR). The dividend growth rate in perpetuity (DG p ) assumes a
c20.indd 235c20.indd 235 29-05-2013 08:21:5129-05-2013 08:21:51
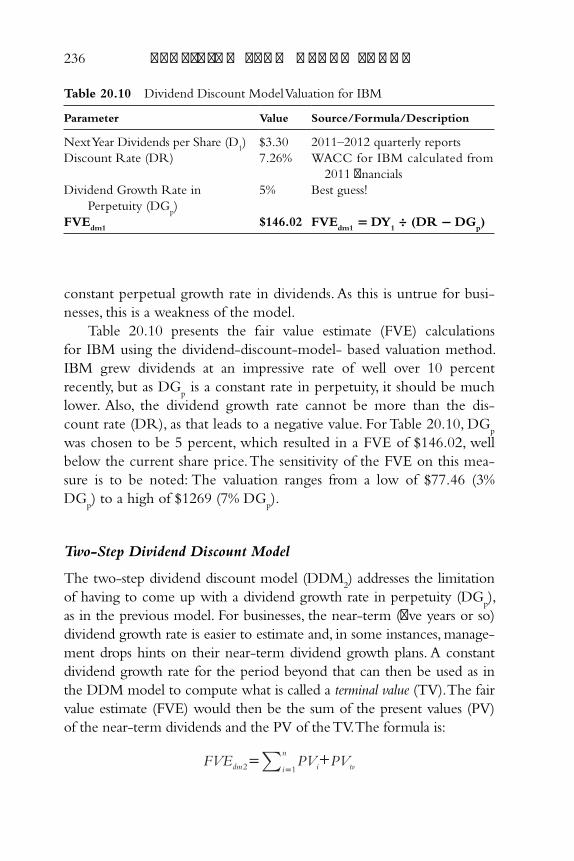
236 p r o f i t i n g f r o m h e d g e f u n d s
constant perpetual growth rate in dividends. As this is untrue for busi-
nesses, this is a weakness of the model.
Table 20.10 presents the fair value estimate (FVE) calculations
for IBM using the dividend-discount-model- based valuation method.
IBM grew dividends at an impressive rate of well over 10 percent
recently, but as DG p is a constant rate in perpetuity, it should be much
lower. Also, the dividend growth rate cannot be more than the dis-
count rate (DR), as that leads to a negative value. For Table 20.10 , DG p
was chosen to be 5 percent, which resulted in a FVE of $146.02, well
below the current share price. The sensitivity of the FVE on this mea-
sure is to be noted: The valuation ranges from a low of $77.46 (3%
DG p ) to a high of $1269 (7% DG
p ).
Two-Step Dividend Discount Model
The two-step dividend discount model (DDM 2 ) addresses the limitation
of having to come up with a dividend growth rate in perpetuity (DG p ),
as in the previous model. For businesses, the near-term (fi ve years or so)
dividend growth rate is easier to estimate and, in some instances, manage-
ment drops hints on their near-term dividend growth plans. A constant
dividend growth rate for the period beyond that can then be used as in
the DDM model to compute what is called a terminal value (TV). The fair
value estimate (FVE) would then be the sum of the present values (PV)
of the near-term dividends and the PV of the TV. The formula is:
FVE PV PVdm i tvi
n
2 =1= +
Table 20.10 Dividend Discount Model Valuation for IBM
Parameter Value Source/Formula/Description
Next Year Dividends per Share (D 1 ) $3.30 2011–2012 quarterly reports
Discount Rate (DR) 7.26% WACC for IBM calculated from
2011 fi nancials
Dividend Growth Rate in
Perpetuity (DG p )
5% Best guess!
F V E d m 1
$146.02 F V E d m 1
= D Y 1 ÷ ( D R − D G
p )
c20.indd 236c20.indd 236 29-05-2013 08:21:5129-05-2013 08:21:51
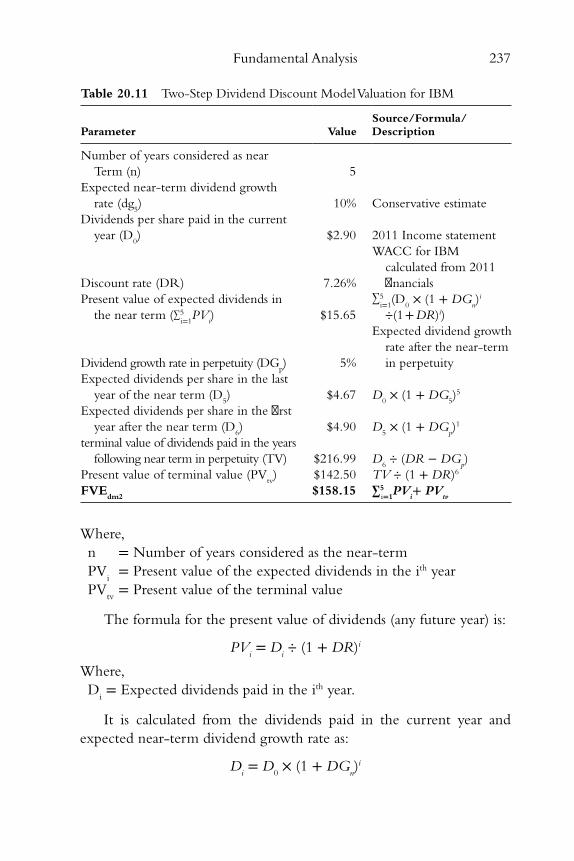
Fundamental Analysis 237
Where,
n = Number of years considered as the near-term
PV i = Present value of the expected dividends in the i th year
PV tv = Present value of the terminal value
The formula for the present value of dividends (any future year) is:
P V i = D
i ÷ ( 1 + D R ) i
Where,
D i = Expected dividends paid in the i th year.
It is calculated from the dividends paid in the current year and
expected near-term dividend growth rate as:
D i = D
0 × ( 1 + D G
n ) i
Table 20.11 Two-Step Dividend Discount Model Valuation for IBM
Parameter Value Source/Formula/Description
Number of years considered as near
Term (n) 5
Expected near-term dividend growth
rate (dg 5 ) 10% Conservative estimate
Dividends per share paid in the current
year (D 0 ) $2.90 2011 Income statement
Discount rate (DR) 7.26%
WACC for IBM
calculated from 2011
fi nancials
Present value of expected dividends in
the near term ( ∑ 5 i= 1
P V i ) $15.65
∑ 5 i= 1
( D 0 × ( 1 + D G
n ) i
÷ (1 + D R ) i )
Dividend growth rate in perpetuity (DG p ) 5%
Expected dividend growth
rate after the near-term
in perpetuity
Expected dividends per share in the last
year of the near term (D 5 ) $4.67 D
0 × ( 1 + D G
5 ) 5
Expected dividends per share in the fi rst
year after the near term (D 6 ) $4.90 D
5 × ( 1 + D G
p ) 1
terminal value of dividends paid in the years
following near term in perpetuity (TV) $216.99 D 6 ÷ ( D R − D G
p )
Present value of terminal value (PV tv ) $142.50 T V ÷ ( 1 + D R ) 6
F V E d m 2
$158.15 ∑ 5 i= 1
P V i + P V
t v
c20.indd 237c20.indd 237 29-05-2013 08:21:5129-05-2013 08:21:51
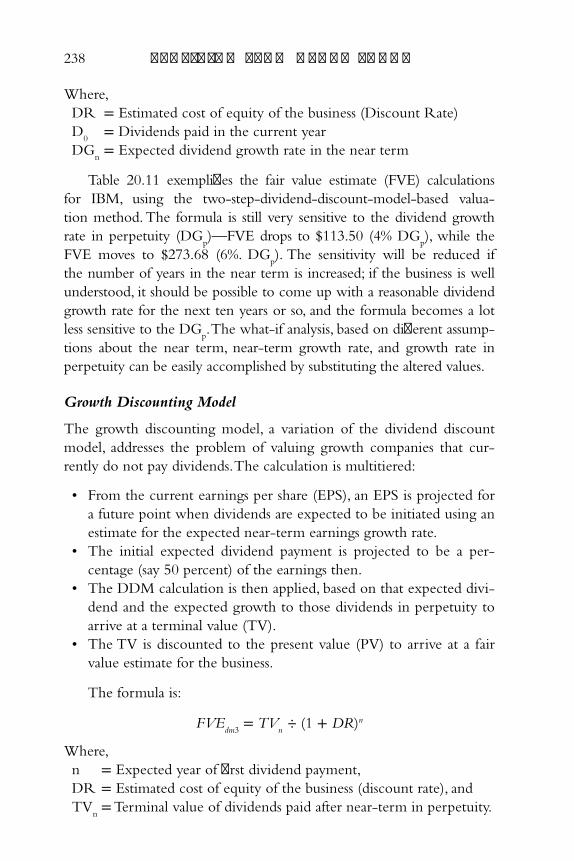
238 p r o f i t i n g f r o m h e d g e f u n d s
Where,
DR = Estimated cost of equity of the business (Discount Rate)
D 0 = Dividends paid in the current year
DG n = Expected dividend growth rate in the near term
Table 20.11 exemplifi es the fair value estimate (FVE) calculations
for IBM, using the two-step-dividend-discount-model-based valua-
tion method. The formula is still very sensitive to the dividend growth
rate in perpetuity (DG p )—FVE drops to $113.50 (4% DG
p ), while the
FVE moves to $273.68 (6%. DG p ). The sensitivity will be reduced if
the number of years in the near term is increased; if the business is well
understood, it should be possible to come up with a reasonable dividend
growth rate for the next ten years or so, and the formula becomes a lot
less sensitive to the DG p . The what-if analysis, based on diff erent assump-
tions about the near term, near-term growth rate, and growth rate in
perpetuity can be easily accomplished by substituting the altered values.
Growth Discounting Model
The growth discounting model, a variation of the dividend discount
model, addresses the problem of valuing growth companies that cur-
rently do not pay dividends. The calculation is multitiered:
• From the current earnings per share (EPS), an EPS is projected for
a future point when dividends are expected to be initiated using an
estimate for the expected near-term earnings growth rate.
• The initial expected dividend payment is projected to be a per-
centage (say 50 percent) of the earnings then.
• The DDM calculation is then applied, based on that expected divi-
dend and the expected growth to those dividends in perpetuity to
arrive at a terminal value (TV).
• The TV is discounted to the present value (PV) to arrive at a fair
value estimate for the business.
The formula is:
F V E d m 3
= T V n ÷ ( 1 + D R ) n
Where,
n = Expected year of fi rst dividend payment,
DR = Estimated cost of equity of the business (discount rate), and
TV n = Terminal value of dividends paid after near-term in perpetuity.
c20.indd 238c20.indd 238 29-05-2013 08:21:5129-05-2013 08:21:51
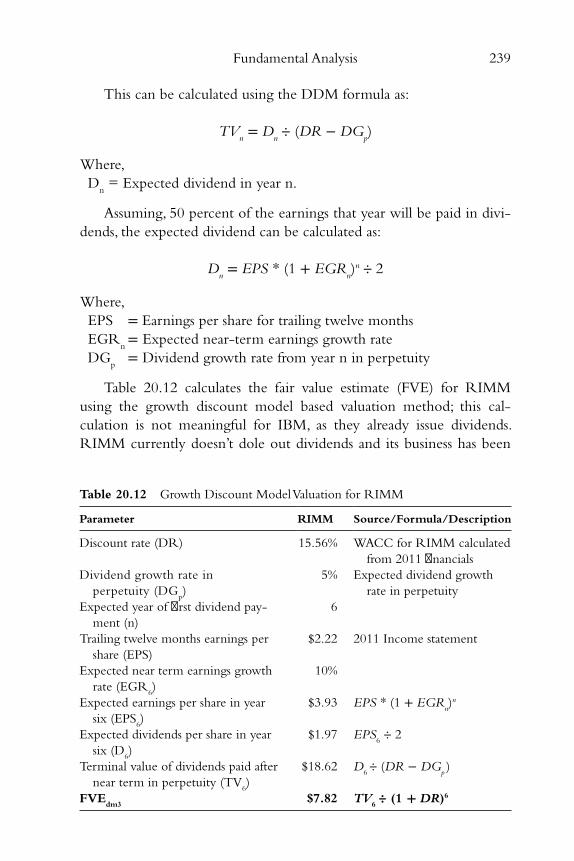
Fundamental Analysis 239
This can be calculated using the DDM formula as:
T V n = D
n ÷ ( D R − D G
p )
Where,
D n = Expected dividend in year n.
Assuming, 50 percent of the earnings that year will be paid in divi-
dends, the expected dividend can be calculated as:
D n = E P S * ( 1 + E G R
n ) n ÷ 2
Where,
EPS = Earnings per share for trailing twelve months
EGR n = Expected near-term earnings growth rate
DG p = Dividend growth rate from year n in perpetuity
Table 20.12 calculates the fair value estimate (FVE) for RIMM
using the growth discount model based valuation method; this cal-
culation is not meaningful for IBM, as they already issue dividends.
RIMM currently doesn ’t dole out dividends and its business has been
Table 20.12 Growth Discount Model Valuation for RIMM
Parameter RIMM Source/Formula/Description
Discount rate (DR) 15.56% WACC for RIMM calculated
from 2011 fi nancials
Dividend growth rate in
perpetuity (DG p )
5% Expected dividend growth
rate in perpetuity
Expected year of fi rst dividend pay-
ment (n)
6
Trailing twelve months earnings per
share (EPS)
$2.22 2011 Income statement
Expected near term earnings growth
rate (EGR 6 )
10%
Expected earnings per share in year
six (EPS 6 )
$3.93 E P S * ( 1 + E G R n ) n
Expected dividends per share in year
six (D 6 )
$1.97 E P S 6 ÷ 2
Terminal value of dividends paid after
near term in perpetuity (TV 6 )
$18.62 D 6 ÷ ( D R − D G
p )
F V E d m 3
$7.82 T V 6
÷ ( 1 + D R ) 6
c20.indd 239c20.indd 239 29-05-2013 08:21:5129-05-2013 08:21:51
240 p r o f i t i n g f r o m h e d g e f u n d s
deteriorating with earnings dwindling sharply in the last several years.
The following is assumed:
• RIMM will turn around and post earnings-per-share growth of 10
percent over the next fi ve years.
• In the sixth year, RIMM will initiate a dividend payment equal to
50 percent of that year ’s earnings per share.
• Perpetual dividend growth rate of 5 percent from the sixth year.
Under these assumptions, RIMM ’s fair value came in at $7.82. Here
again, the validity of the assumptions is critical to the accuracy of the FVE.
Summary
The chapter introduced a set of fundamental analysis (FA) techniques
that the best money managers use. The purpose of this exercise is to
determine the motives behind money manager trading activity. This is
useful for a number of reasons:
• Following a manager trade blindly is being value agnostic.
• The best managers do not always adhere to a strict bottom-up,
value-oriented investment approach. A selection might make sense
only in an overall diversifi ed portfolio context. Hence, there is no
guarantee that a particular pick is a good standalone choice.
• Some managers use positions as hedges, rendering such picks use-
less, even when they appear in bias spreadsheets or in the insider
ownership and corporate insider fi lings.
Adopting the FA techniques should enhance the investor ’s stock
selection skills. Valuing businesses using FA techniques calls for both
eff ort and practice. Performing the analysis on money manager posi-
tions is an excellent way to get ahead of the game. By analyzing a
number of such positions, eventually skills will be honed, and one will
gain confi dence in analyzing stocks, independent of whether a man-
ager has taken a position.
That way, investors can identify mispriced businesses on their own,
instead of waiting for a manager to initiate a position. In other words,
adieu to following, hello to stock picking!
c20.indd 240c20.indd 240 29-05-2013 08:21:5129-05-2013 08:21:51

Fundamental Analysis 241
Notes
1. Harry Markowitz, Merton Miller, and William Sharpe, “Pioneering Work in
the Theory of Financial Economics,” Nobel Prize, 1990.
2. Eugene Fama and Kenneth French, “Multifactor Explanations of Asset
Pricing Anomalies,” Journal of Finance 51, no. 1, March 1996.
3. Jakub Jurek and Luis Viceira, “Optimal Value and Growth Tilts in Long-
Horizon Portfolios,” Harvard Business School, 2005, www.hbs.edu/faculty/
Publication%20Files/06–012.pdf .
4. Rolf Banz, “The Relationship between Return and Market Value of
Common Stocks,” Northwestern University, 1981.
5. Gabriela Bis, “Theory and Evidence . . . Small Cap Premium: Does Liquidity
Hold Water?” Leonard N. Stern School of Business, New York University,
May 2007.
6. Benjamin Graham and David Dodd, Security Analysis (York, PA: McGraw-
Hill, 1934).
7. John Schamel “How the Pilot ’s Checklist Came About,” Mike Monroney
Aeronautical Center, Oklahoma City. www.atchistory.org/History/checklst
.htm.
8. Atul Gawande, The Checklist Manifesto: How to Get Things Right (New York:
Henry Holt and Company, 2009).
9. Mario V. Farina, A Beginner ’s Guide to Successful Investing in the Stock Market
(Palisades Park, NJ: Investors’ Press, 1969).
10. Peter Lynch and John Rothchild, One Up on Wall Street: How to Use What You
Already Know to Make Money in the Market (New York: Penguin Books, 1990).
11. Jim Slater, The Zulu Principle. Making Extraordinary Profi ts from Ordinary Shares
(London: Orion Business Books, 1994).
12. Joseph Piotroski, “Value Investing: The Use of Historical Financial Statement
Information to Separate Winners from Losers,” University of Chicago
Graduate School of Business, January 2002, www.chicagobooth.edu/~/
media/FE874EE65F624AAEBD0166B1974FD74D.pdf .
13. Mary Buff ett and David Clark, Buff ettology: The Previously Unexplained
Techniques That Have Made Warren Buff ett the World ’s Most Famous Investor
(New York: Fireside, 1999).
14. Benjamin Graham, The Intelligent Investor (New York: Harper & Brothers, 1949).
15. Benjamin Graham, “The Decade 1965–1974: Its Signifi cance for Financial
Analysts,” The Renaissance of Value, 1974.
16. Myron Gordon, “Dividends, Earnings, and Stock Prices.” Review of Economics
and Statistics 41, no. 2, Part 1, May 1959.
c20.indd 241c20.indd 241 29-05-2013 08:21:5129-05-2013 08:21:51

c20.indd 242c20.indd 242 29-05-2013 08:21:5129-05-2013 08:21:51
243
Chapter 21
Types of Positions and Sizing
Manager bias spreadsheets go a long way toward constructing
the equity portion of an overall asset allocation plan. Funda-
mental analysis techniques (introduced in the previous
chapter) provide a general appraisal of business characteristics, as well as
the market valuation of the security concerned. Assessing whether the
security fi ts neatly with the equity portion of one ’s own portfolio and,
if so, what would be an appropriate allocation size can be puzzling
questions.
The strategy of owning equities in diff erent market areas is sound,
as it reduces both security and area-specifi c risks, which is the essence
of diversifi cation. A pair of securities can move along a similar path,
go opposite ways, or be totally independent of one another. These
movements are statistically represented by the correlation coeffi cient.
Applying this observation to portfolio construction by combining neg-
atively correlated assets to reduce overall risk is called hedging.
c21.indd 243c21.indd 243 27-05-2013 11:29:3627-05-2013 11:29:36
244 p r o f i t i n g f r o m h e d g e f u n d s
In the context of the overall asset allocation plan, the details of the
diff erent types of assets used by managers are not part of their 13F fi l-
ings. However, most of their strategies can be drawn from other public
disclosures. The common thread that binds many of the best managers
is their reliance on diversifi cation and hedging techniques to optimize
portfolio risk and reward. This is the core message of modern portfolio
theory (MPT) and the capital asset pricing model (CAPM). While it
may seem as though the best money managers operate with the pur-
pose of exploiting market ineffi ciencies, the concept of risk reduction
without compromising return potential is not lost on them: They are
fully cognizant of the need to reduce risk by choosing diff erent assets
with varied risk profi les and allocating among them in an optimized
fashion. This chapter is a primer on diversifi cation and hedging, the key
attributes of risk management. It also introduces other techniques that
managers employ to reduce the total risk in the equity portion and in
asset allocation for the overall portfolio.
Diversifi cation and Hedging
The primary objective of portfolio diversifi cation is to reduce or elim-
inate diversifi able risk . It is best explained through the concept of
correlation coeffi cient between any given pair of securities. The cor-
relation coeffi cient can range from −1 to +1.
• −1 indicates perfect negative correlation: When one security goes
up, its pair always goes down and vice-versa.
• 0 implies complete disconnection: The movement of one security
has no bearing on the other.
• +1 denotes perfect positive harmony: When one security goes up,
its pair always goes up and vice-versa.
The diversifi cation objective is achieved when securities with low
positive correlation are combined in a portfolio. The returns of
random n -asset portfolios were studied to determine the optimal num-
ber of positions and the actual benefi t gained through diversifi cation. 1
Its conclusion was that the variability of returns reduced by almost
50 percent, when the portfolio held eight positions compared to the
c21.indd 244c21.indd 244 27-05-2013 11:29:3727-05-2013 11:29:37
Types of Positions and Sizing 245
variability of returns for an average single-stock portfolio. Adding fur-
ther positions had benefi ts, but there was less reduction in variability.
The variability of returns, a key representation of risk, is measured
using standard deviation (σ). Standard deviation (σ) can be presented
in terms of expected return probabilities for any given year. Assuming
normal distribution for security returns, 1σ represents variability with
68.27 percent probability, 2σ denotes variability with 95.45 percent
probability, 3σ signifi es variability with 99.73 percent probability, and
so on. For example, if portfolio ABC has a standard deviation (σ) of
20 percent, and is expected to return 10 percent, it implies:
• For seven out of ten years (1σ), returns will be in the range of
−10% to +30%. (Subtract or add 20% to the expected return
of 10% for ABC.)
• For 19 out of 22 years (2σ), returns will be in the range of –30%
to +50%. (Subtract or add 2 * 20% to the expected return of
10% for ABC.)
• For 369 out of 370 years (3σ), returns will be in the range of
−50% to +70%. (Subtract or add 3 * 20% to the expected return
of 10% for ABC.)
In terms of risk of loss, the standard deviation (σ) of 20 percent
suggests:
• The probability of a loss greater than 10 percent (1σ negative cutoff
point) as around 16 percent
• The probability of a loss greater than 30 percent (2σ negative
cutoff point) as around 2 percent
• The probability of a loss greater than 50 percent (3σ negative cutoff
point) as around 0.15 percent
Note that the odds are halved compared to the probability outside
the range of σ, as only the left half of the normal distribution (tra-
ditional bell curve) of returns needs to be considered: The probability
that returns are outside the range of 1σ is ~32% (i.e., 100% − 68.27%),
so the risk of loss greater than 10% is half that or ~16%. Similarly, the
probability that returns are outside the range of 2σ and 3σ are ~4% and
~0.3% respectively. The corresponding risk of loss greater than 30%
and 50% are ~2% and ~0.15% respectively.
c21.indd 245c21.indd 245 27-05-2013 11:29:3727-05-2013 11:29:37
246 p r o f i t i n g f r o m h e d g e f u n d s
The investment decision thus hinges on this variance in return for
any given year being acceptable for the expected return of 10 percent
in the equity portion of the overall asset allocation plan.
The expected return (ER) is a key variable and CAPM has a
means by which to measure it:
E R = R F R + β * ( E M R − R F R )
Where:
ER = Expected return
RFR = Risk free rate
EMR = Expected market return
Beta (β) = a measure of the systematic risk or market risk
β can be negative, zero, or positive, with the overall market beta of
1.0 as the base. Negative β measures movement opposite to the overall
market, zero indicates absolutely no correlation, and positive β measure
movement with the market. The β is calculated by dividing the covari-
ance in past prices of the security, compared to overall market prices by
the variance in past prices of the overall market.
The beauty of CAPM is its simplicity. The expected return is rep-
resented in terms of a single variable: the nondiversifi able risk (β).
Investing based on the principles of CAPM is very straightforward; the
steps are listed here:
1. Calculate β for the portfolio.
2. Substitute the β value, risk free rate (RFR), and expected market
return (EMR) to obtain the expected return (ER) of the portfolio
from the CAPM formula.
3. Make the decision based on the portfolio ’s expected return (ER)
and standard deviation (σ).
For example, consider portfolio ABC with a β of 1.20. The expected
market return (EMR) is 10 percent. Assuming a risk free rate (RFR)
of 4%, the expected return (ER) of the portfolio using the CAPM for-
mula can be calculated as:
E R = 4 % + 1.2 * ( 10 % − 4 % ) = 11.2 %
In the above discussion, beta (β) and standard deviation (σ) are key
variables that are calculated from historical prices and returns. While σ
c21.indd 246c21.indd 246 27-05-2013 11:29:3727-05-2013 11:29:37
Types of Positions and Sizing 247
may be viewed as representing both nondiversifi able and diversifi able
risks, β only represents nondiversifi able risk. Therefore, the CAPM for-
mula is better suited to an already diversifi ed portfolio.
Portfolio optimization maximizes expected return for a given level of
overall risk. Minimizing overall risk for a given level of expected return
is the other side of the coin. The optimization can be made both at the
portfolio level and at the overall asset allocation level.
Both diversifi cation and hedging help reduce overall risk (σ) in a
portfolio. The reduction in σ will not shrink the expected return, pro-
vided that the expected return of the new security at least equals that
of the equity portfolio. At the equity portfolio level, reduction in over-
all risk (σ) without a corresponding reduction in expected return is
accomplished by combining securities with low positive or negative
correlations. In the context of overall asset allocation, the same con-
cept applies: Combine negatively correlated asset classes with posi-
tive expected returns to reduce overall risk (σ). Once the securities
involved are identifi ed through this process, further tuning is achieved
by adjusting the weightages.
The concepts are best explained via an illustration. (Note: The
stock[s] used in the examples for this chapter are chosen randomly. As
the purpose of the examples is to comprehend risk reduction through
diversifi cation, the actual stocks used are irrelevant.)
Table 21.1 displays the key measures for Goodrich Petroleum
Corporation (GDP). The beta (β) was taken from an online source; it
could have been derived by applying the formula for β against n -years
of price and return data for Goodrich (GDP) and the overall market
(S&P 500 Index). The expected return (ER) is calculated from the
CAPM formula as 10.30 percent, and standard deviation (σ) is 81.62
percent. The σ is a direct application of the formula against ten years
(2002–2011) of yearly return data.
To demonstrate the benefi ts of diversifi cation, seven random stocks
with low positive correlation are added in equal amounts. (Note: Equal
allocation is used for ease of illustration.)
Table 21.2 indicates the key measures for each of the eight stocks
in the equity portion of the portfolio, along with the measures for the
combined equity portfolio. Beta (β) for the portfolio is the average of
the β for the individual stocks. Standard deviation (σ) of the portfolio
is obtained by applying the formula against historical yearly returns of
c21.indd 247c21.indd 247 27-05-2013 11:29:3727-05-2013 11:29:37
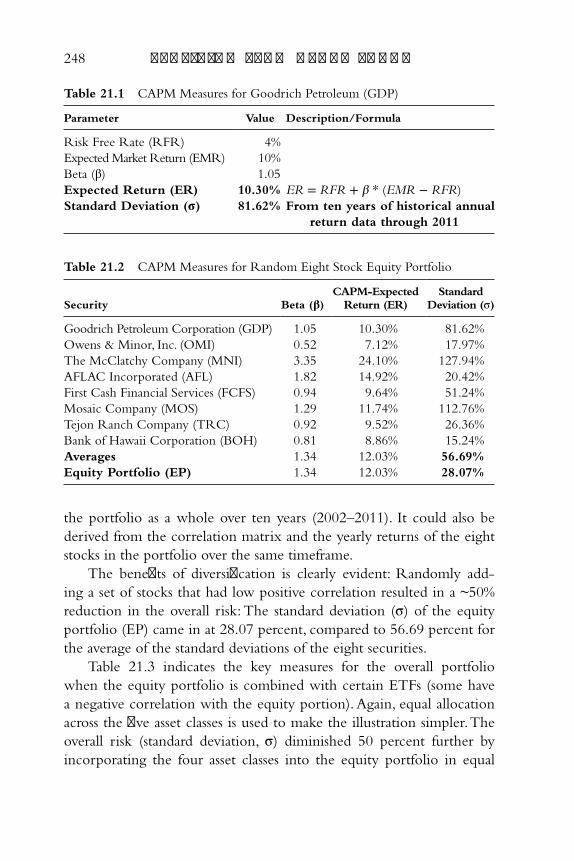
248 p r o f i t i n g f r o m h e d g e f u n d s
the portfolio as a whole over ten years (2002–2011). It could also be
derived from the correlation matrix and the yearly returns of the eight
stocks in the portfolio over the same timeframe.
The benefi ts of diversifi cation is clearly evident: Randomly add-
ing a set of stocks that had low positive correlation resulted in a ~50%
reduction in the overall risk: The standard deviation (σ) of the equity
portfolio (EP) came in at 28.07 percent, compared to 56.69 percent for
the average of the standard deviations of the eight securities.
Table 21.3 indicates the key measures for the overall portfolio
when the equity portfolio is combined with certain ETFs (some have
a negative correlation with the equity portion). Again, equal allocation
across the fi ve asset classes is used to make the illustration simpler. The
overall risk (standard deviation, σ) diminished 50 percent further by
incorporating the four asset classes into the equity portfolio in equal
Table 21.1 CAPM Measures for Goodrich Petroleum (GDP)
Parameter Value Description/Formula
Risk Free Rate (RFR) 4%
Expected Market Return (EMR) 10%
Beta (β) 1.05
Expected Return (ER) 10.30% E R = R F R + β * ( E M R − R F R )
Standard Deviation (σ) 81.62% From ten years of historical annual
return data through 2011
Table 21.2 CAPM Measures for Random Eight Stock Equity Portfolio
Security Beta (β) CAPM-Expected
Return (ER) Standard
Deviation (σ)
Goodrich Petroleum Corporation (GDP) 1.05 10.30% 81.62%
Owens & Minor, Inc. (OMI) 0.52 7.12% 17.97%
The McClatchy Company (MNI) 3.35 24.10% 127.94%
AFLAC Incorporated (AFL) 1.82 14.92% 20.42%
First Cash Financial Services (FCFS) 0.94 9.64% 51.24%
Mosaic Company (MOS) 1.29 11.74% 112.76%
Tejon Ranch Company (TRC) 0.92 9.52% 26.36%
Bank of Hawaii Corporation (BOH) 0.81 8.86% 15.24%
Averages 1.34 12.03% 56.69%
Equity Portfolio (EP) 1.34 12.03% 28.07%
c21.indd 248c21.indd 248 27-05-2013 11:29:3727-05-2013 11:29:37
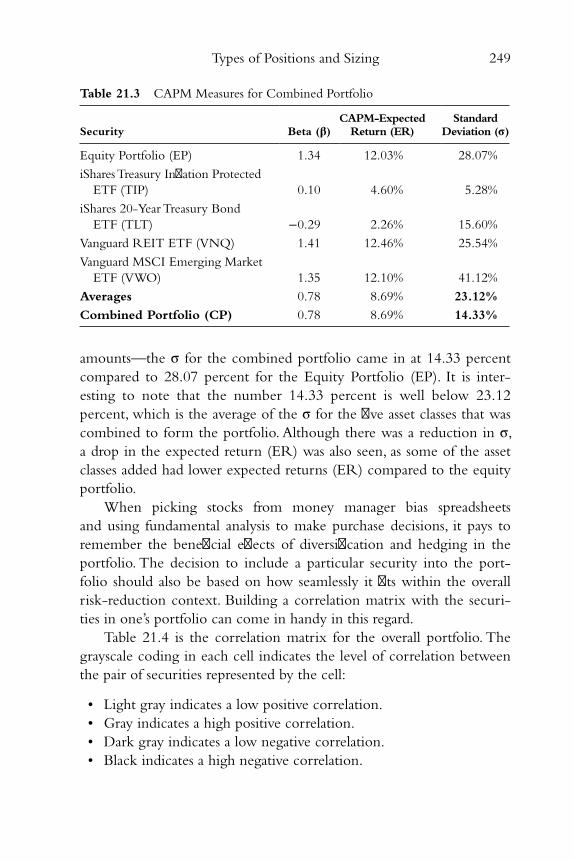
Types of Positions and Sizing 249
amounts—the σ for the combined portfolio came in at 14.33 percent
compared to 28.07 percent for the Equity Portfolio (EP). It is inter-
esting to note that the number 14.33 percent is well below 23.12
percent, which is the average of the σ for the fi ve asset classes that was
combined to form the portfolio. Although there was a reduction in σ,
a drop in the expected return (ER) was also seen, as some of the asset
classes added had lower expected returns (ER) compared to the equity
portfolio.
When picking stocks from money manager bias spreadsheets
and using fundamental analysis to make purchase decisions, it pays to
remember the benefi cial eff ects of diversifi cation and hedging in the
portfolio. The decision to include a particular security into the port-
folio should also be based on how seamlessly it fi ts within the overall
risk-reduction context. Building a correlation matrix with the securi-
ties in one ’s portfolio can come in handy in this regard.
Table 21.4 is the correlation matrix for the overall portfolio. The
grayscale coding in each cell indicates the level of correlation between
the pair of securities represented by the cell:
• Light gray indicates a low positive correlation.
• Gray indicates a high positive correlation.
• Dark gray indicates a low negative correlation.
• Black indicates a high negative correlation.
Table 21.3 CAPM Measures for Combined Portfolio
Security Beta (β) CAPM-Expected
Return (ER) Standard
Deviation (σ)
Equity Portfolio (EP) 1.34 12.03% 28.07%
iShares Treasury Infl ation Protected
ETF (TIP) 0.10 4.60% 5.28%
iShares 20-Year Treasury Bond
ETF (TLT) −0.29 2.26% 15.60%
Vanguard REIT ETF (VNQ) 1.41 12.46% 25.54%
Vanguard MSCI Emerging Market
ETF (VWO) 1.35 12.10% 41.12%
Averages 0.78 8.69% 23.12%
Combined Portfolio (CP) 0.78 8.69% 14.33%
c21.indd 249c21.indd 249 27-05-2013 11:29:3727-05-2013 11:29:37
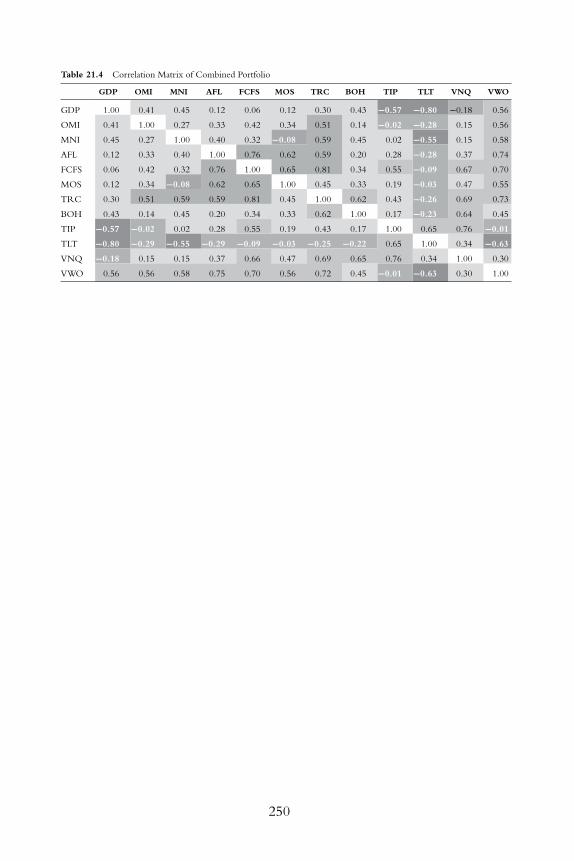
Table 21.4 Correlation Matrix of Combined Portfolio
GDP OMI MNI AFL FCFS MOS TRC BOH TIP TLT VNQ VWO
GDP 1.00 0.41 0.45 0.12 0.06 0.12 0.30 0.43 −0.57 −0.80 −0.18 0.56
OMI 0.41 1.00 0.27 0.33 0.42 0.34 0.51 0.14 −0.02 −0.28 0.15 0.56
MNI 0.45 0.27 1.00 0.40 0.32 −0.08 0.59 0.45 0.02 −0.55 0.15 0.58
AFL 0.12 0.33 0.40 1.00 0.76 0.62 0.59 0.20 0.28 −0.28 0.37 0.74
FCFS 0.06 0.42 0.32 0.76 1.00 0.65 0.81 0.34 0.55 −0.09 0.67 0.70
MOS 0.12 0.34 −0.08 0.62 0.65 1.00 0.45 0.33 0.19 −0.03 0.47 0.55
TRC 0.30 0.51 0.59 0.59 0.81 0.45 1.00 0.62 0.43 −0.26 0.69 0.73
BOH 0.43 0.14 0.45 0.20 0.34 0.33 0.62 1.00 0.17 −0.23 0.64 0.45
TIP −0.57 −0.02 0.02 0.28 0.55 0.19 0.43 0.17 1.00 0.65 0.76 −0.01
TLT −0.80 −0.29 −0.55 −0.29 −0.09 −0.03 −0.25 −0.22 0.65 1.00 0.34 −0.63
VNQ −0.18 0.15 0.15 0.37 0.66 0.47 0.69 0.65 0.76 0.34 1.00 0.30
VWO 0.56 0.56 0.58 0.75 0.70 0.56 0.72 0.45 −0.01 −0.63 0.30 1.00
250
c21.indd 250c21.indd 250 27-05-2013 11:29:3727-05-2013 11:29:37
Types of Positions and Sizing 251
The values were taken from an online source, although they could
have been derived by applying the formula for correlation coeffi cient.
The grayscale coding in the row corresponding to a security in the
correlation matrix signals whether it is a good fi t in the portfolio: For
example, in the correlation matrix (Table 21.4 ), with the equity por-
tion (fi rst eight rows and columns), the objective is diversifi cation,
as long as the individual cells within that portion are shaded some-
thing other than gray (high positive correlation), the objective is met.
Looking at the matrix, the equity portion of the portfolio is fairly
diversifi ed, although the fi t of TRC, with fi ve cells that are gray (equity
portion is columns 2 through 9), is questionable. By the same token,
the pairs shown by dark gray and black cells indicate pairs that are
hedged well (negative correlation).
Keeping Your Powder Dry
Holding cash is not easy for investors, as the whole world is only too
aware of its falling purchasing power. This begs the question: Why do
the money managers keep large amounts of cash in their overall port-
folio? Or, to put it candidly, why do money managers hold on to the
cash that investors entrusted them to put to work so that it can earn
good absolute returns?
The best explanation for super investors preferring signifi cant cash
on their side was given by Alice Schroeder, in her 2008 book, The
Snowball: Warren Buff ett and the Business of Life. 2 Essentially, cash can
be considered as a call option on every asset class, with no expiry and
no strike price. In reality, there is no such thing as an option with-
out expiry and strike price. The concept, however, allows investors to
view cash from the context of the upfront cost they might be willing
to forgo to gain the right to own a particular asset class at a price that
will provide a worthy margin of safety.
Ms. Schroeder went on to claim that, when Buff ett thinks that the
option is inexpensive compared to the margin of safety (if any) provided
by purchasing assets right now, he is more than willing to hold cash. This
appears true from empirical evidence; Buff ett held plenty of cash during
the fi nancial crisis and bought like there was no tomorrow when most
c21.indd 251c21.indd 251 27-05-2013 11:29:3727-05-2013 11:29:37
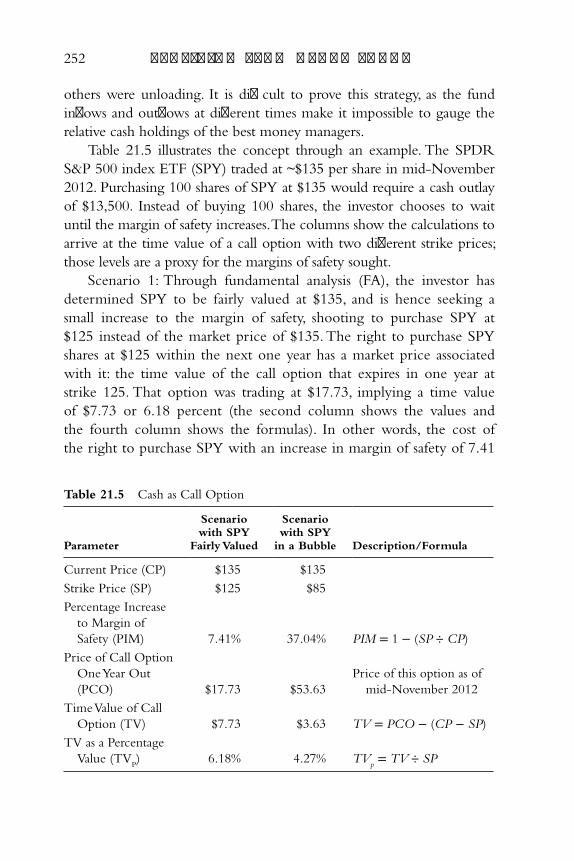
252 p r o f i t i n g f r o m h e d g e f u n d s
others were unloading. It is diffi cult to prove this strategy, as the fund
infl ows and outfl ows at diff erent times make it impossible to gauge the
relative cash holdings of the best money managers.
Table 21.5 illustrates the concept through an example. The SPDR
S&P 500 index ETF (SPY) traded at ~$135 per share in mid-November
2012. Purchasing 100 shares of SPY at $135 would require a cash outlay
of $13,500. Instead of buying 100 shares, the investor chooses to wait
until the margin of safety increases. The columns show the calculations to
arrive at the time value of a call option with two diff erent strike prices;
those levels are a proxy for the margins of safety sought.
Scenario 1: Through fundamental analysis (FA), the investor has
determined SPY to be fairly valued at $135, and is hence seeking a
small increase to the margin of safety, shooting to purchase SPY at
$125 instead of the market price of $135. The right to purchase SPY
shares at $125 within the next one year has a market price associated
with it: the time value of the call option that expires in one year at
strike 125. That option was trading at $17.73, implying a time value
of $7.73 or 6.18 percent (the second column shows the values and
the fourth column shows the formulas). In other words, the cost of
the right to purchase SPY with an increase in margin of safety of 7.41
Table 21.5 Cash as Call Option
Parameter
Scenario with SPY
Fairly Valued
Scenario with SPY
in a Bubble Description/Formula
Current Price (CP) $135 $135
Strike Price (SP) $125 $85
Percentage Increase
to Margin of
Safety (PIM) 7.41% 37.04% P I M = 1 − ( S P ÷ C P )
Price of Call Option
One Year Out
(PCO) $17.73 $53.63
Price of this option as of
mid-November 2012
Time Value of Call
Option (TV) $7.73 $3.63 T V = P C O − ( C P − S P )
TV as a Percentage
Value (TV P ) 6.18% 4.27% T V
p = T V ÷ S P
c21.indd 252c21.indd 252 27-05-2013 11:29:3727-05-2013 11:29:37
Types of Positions and Sizing 253
percent is 6.18 percent. The right is expensive; it makes better business
sense to invest in SPY at 135 rather than hold on to the cash.
Scenario 2: The investor believes SPY to be in a bubble, that is,
way too overvalued, and wants a much larger increase in the margin
of safety, and is looking to purchase SPY at $85, instead of the market
price of $135. The SPY call option at strike 85 one year out traded
at $53.63, implying a time value of $3.63 or 4.27 percent. Decoded,
the cost of the right to purchase SPY with an increase in margin of
safety of 37.04 percent is 4.27 percent. The right is very economical
and makes perfect sense to own; hold on to cash rather than invest in
SPY at $135.
Building and Sizing Positions
The sizing of positions in a portfolio is a genuine puzzle in the diver-
sifi cation process. The 13F fi lings of money managers fail to enlighten
us in this regard, as the sizing can appear very random. Many managers
adjust positions on a quarterly basis, and comparing consecutive 13Fs
will also provide a haphazard picture in terms of the adjustments made.
This unpredictability has to do with several factors.
• Fund infl ows and outfl ows, a regular portfolio feature of the best
managers, result in changes to allocation amounts as they attempt
to keep the overall ratios intact.
• Weightage adjustments (allocation) of assets in a portfolio along
with periodic rebalancing to improve risk-adjusted returns can
result in allocations to individual positions to appear unsystematic.
• Depending on market conditions and certain other parameters,
managers are known to have a strategy in place that builds positions
gradually. Therefore, quarter-to-quarter comparison of positions can
show random changes to position sizes as managers rely on mechan-
ically following the allocation mandated by the strategy.
When constructing a personal investment portfolio, infl ows and
outfl ows are not as much of a concern, but the other two factors play a
role. The portfolio optimization illustration (Tables 21.1 through 21.4 )
in “Diversifi cation and Hedging” assumed equally weighted assets.
c21.indd 253c21.indd 253 27-05-2013 11:29:3727-05-2013 11:29:37
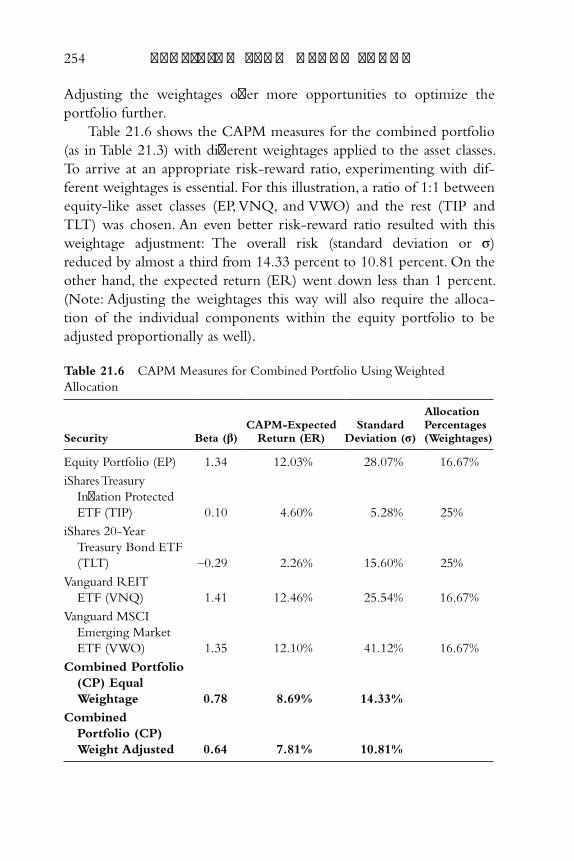
254 p r o f i t i n g f r o m h e d g e f u n d s
Adjusting the weightages off er more opportunities to optimize the
portfolio further.
Table 21.6 shows the CAPM measures for the combined portfolio
(as in Table 21.3 ) with diff erent weightages applied to the asset classes.
To arrive at an appropriate risk-reward ratio, experimenting with dif-
ferent weightages is essential. For this illustration, a ratio of 1:1 between
equity-like asset classes (EP, VNQ, and VWO) and the rest (TIP and
TLT) was chosen. An even better risk-reward ratio resulted with this
weightage adjustment: The overall risk (standard deviation or σ)
reduced by almost a third from 14.33 percent to 10.81 percent. On the
other hand, the expected return (ER) went down less than 1 percent.
(Note: Adjusting the weightages this way will also require the alloca-
tion of the individual components within the equity portfolio to be
adjusted proportionally as well).
Table 21.6 CAPM Measures for Combined Portfolio Using Weighted
Allocation
Security Beta (β) CAPM-Expected
Return (ER) Standard
Deviation (σ)
Allocation Percentages (Weightages)
Equity Portfolio (EP) 1.34 12.03% 28.07% 16.67%
iShares Treasury
Infl ation Protected
ETF (TIP) 0.10 4.60% 5.28% 25%
iShares 20-Year
Treasury Bond ETF
(TLT) –0.29 2.26% 15.60% 25%
Vanguard REIT
ETF (VNQ) 1.41 12.46% 25.54% 16.67%
Vanguard MSCI
Emerging Market
ETF (VWO) 1.35 12.10% 41.12% 16.67%
Combined Portfolio
(CP) Equal
Weightage 0.78 8.69% 14.33%
Combined
Portfolio (CP)
Weight Adjusted 0.64 7.81% 10.81%
c21.indd 254c21.indd 254 27-05-2013 11:29:3727-05-2013 11:29:37
Types of Positions and Sizing 255
Periodic rebalancing involves regular adjustments to the weightages
of the asset classes to retain the asset allocation for the target portfolio.
(Note: Here, too, adjusting the asset classes implies adjusting the weight-
ages of the individual components within the equity portfolio as well).
A study on the optimal frequency for rebalancing determined rebal-
ancing quarterly or yearly had some benefi ts in terms of risk adjusted
returns; increasing the frequency is detrimental to portfolio returns, while
decreasing it yielded marginally better returns, but with increased risk. 3
Building stock positions over a period of time as opposed to buy-
ing the targeted allocation in one shot is a strategy many money
managers use, especially with volatile securities. The logic behind this
approach is to mitigate the risk due to price volatility by spreading the
purchase over time. This can be done in diff erent ways:
• Share cost averaging (SCA) : With SCA, independent of the share
price, the same number of shares is purchased periodically. This is the
most passive method to allocate money in a security over a period
of time. Investors can purchase shares mechanically after determin-
ing the duration over which purchases should be spread out, the
frequency of periodic purchases, and the number of shares to be
purchased each time. The approach guarantees the average purchase
price to be equal to the average of the share prices of the peri-
odic purchases. The obvious disadvantage is that a ceiling cannot be
placed on the capital required to purchase shares each period.
• Dollar cost averaging (DCA) : Here, the capital allocation for
each period is determined and kept constant. Compared to SCA,
the approach achieves a lower cost basis as more shares are pur-
chased when prices are lower.
• Value averaging (VA) : 4 VA aims to increase the market value
of the shares owned at a constant rate each period. The concept
was originally introduced as a means by which to allocate a lump
sum into a portfolio in an effi cient manner over time using what
is termed a value path. Rather than determining the number of
shares to be purchased (SCA) or the amount to be allocated (DCA)
each period, VA determines the target amount to be reached
for each time interval and the entire allocation period. The
approach achieves a lower cost basis than DCA, and has the distinct
c21.indd 255c21.indd 255 27-05-2013 11:29:3727-05-2013 11:29:37
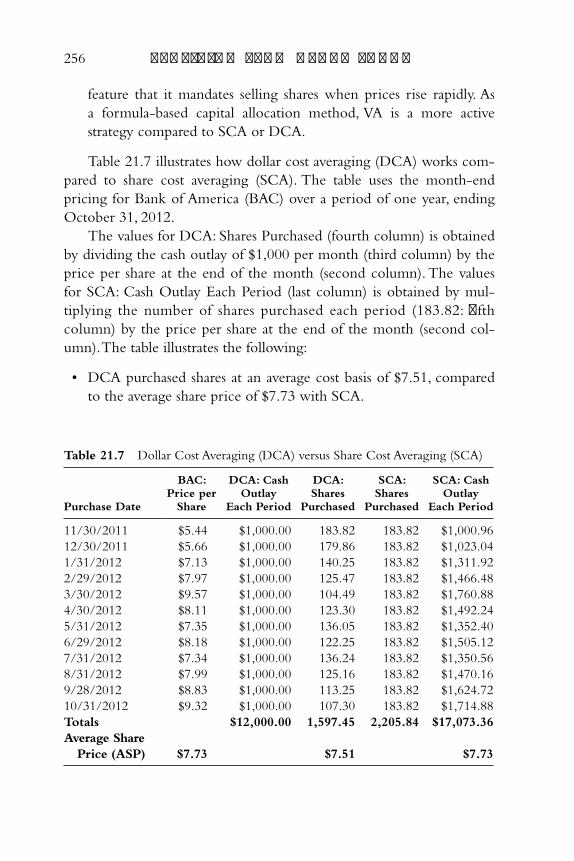
256 p r o f i t i n g f r o m h e d g e f u n d s
feature that it mandates selling shares when prices rise rapidly. As
a formula-based capital allocation method, VA is a more active
strategy compared to SCA or DCA.
Table 21.7 illustrates how dollar cost averaging (DCA) works com-
pared to share cost averaging (SCA). The table uses the month-end
pricing for Bank of America (BAC) over a period of one year, ending
October 31, 2012.
The values for DCA: Shares Purchased (fourth column) is obtained
by dividing the cash outlay of $1,000 per month (third column) by the
price per share at the end of the month (second column). The values
for SCA: Cash Outlay Each Period (last column) is obtained by mul-
tiplying the number of shares purchased each period (183.82: fi fth
column) by the price per share at the end of the month (second col-
umn). The table illustrates the following:
• DCA purchased shares at an average cost basis of $7.51, compared
to the average share price of $7.73 with SCA.
Table 21.7 Dollar Cost Averaging (DCA) versus Share Cost Averaging (SCA)
Purchase Date
BAC: Price per
Share
DCA: Cash Outlay
Each Period
DCA: Shares
Purchased
SCA: Shares
Purchased
SCA: Cash Outlay
Each Period
11/30/2011 $5.44 $1,000.00 183.82 183.82 $1,000.96
12/30/2011 $5.66 $1,000.00 179.86 183.82 $1,023.04
1/31/2012 $7.13 $1,000.00 140.25 183.82 $1,311.92
2/29/2012 $7.97 $1,000.00 125.47 183.82 $1,466.48
3/30/2012 $9.57 $1,000.00 104.49 183.82 $1,760.88
4/30/2012 $8.11 $1,000.00 123.30 183.82 $1,492.24
5/31/2012 $7.35 $1,000.00 136.05 183.82 $1,352.40
6/29/2012 $8.18 $1,000.00 122.25 183.82 $1,505.12
7/31/2012 $7.34 $1,000.00 136.24 183.82 $1,350.56
8/31/2012 $7.99 $1,000.00 125.16 183.82 $1,470.16
9/28/2012 $8.83 $1,000.00 113.25 183.82 $1,624.72
10/31/2012 $9.32 $1,000.00 107.30 183.82 $1,714.88
Totals $12,000.00 1,597.45 2,205.84 $17,073.36
Average Share
Price (ASP) $7.73 $7.51 $7.73
c21.indd 256c21.indd 256 27-05-2013 11:29:3727-05-2013 11:29:37
Types of Positions and Sizing 257
• Cash outlay with DCA is known up front: $1,000 invested in BAC
shares every month end for a total of $12,000. With SCA, the total
cash outlay over a given period is unknown. If the share price of
the security concerned is increasing through the period, the cash
outlay required will be well above $12,000; this was the scenario
with BAC, and the strategy required a cash outlay of $17,073.36.
On the other hand, if the share price had trended down over the
period, the cash outlay would have been well below $12,000.
• SCA allocates more capital when the price per share is increasing and
vice-versa. This goes against the value investing philosophy of try-
ing to purchase shares at low prices. The issue can be clearly seen by
comparing the row when the share price was highest (purchase date:
3/30/2012) with the row when the share price was lowest (purchase
date: 11/30/2011) . The capital allocated when the share price was at
the highest value of $9.57 was $1,760.88, compared to just $1,000.96
allocated when the share price was at its lowest value of $5.44.
401K and other retirement account planners tout DCA as advan-
tageous, as it fi ts in naturally with the periodic investment theme of
such plans: Employees generally opt for a percentage of their paychecks
to be taken out for investing in their retirement accounts. The same
amount is allocated each period across their set investment choices
(usually mutual funds) at a selected ratio, ensuring DCA allocation. The
passive nature of DCA and its promise of automatically buying more
shares of the assets concerned at lower prices make the strategy very
appealing. When managing an investment portfolio where periodic
cash fl ows is not a given, the strategy still has sway among value inves-
tors. This has to do with signifi cant cash allocation in their portfolios.
As previously mentioned, if asset classes are overvalued, holding cash is
a more sensible option. DCA allows passive allocation of a part of that
cash over a period of time at a low average cost. Again, the strategy is
best suited for use with volatile securities.
Although DCA has several advantages, money managers prefer
SCA to DCA when implementing a trend-following method. The
strategy allows more capital to be allocated periodically as long as an
up-trend is in place. As the trend reverses, less capital will be allocated,
although trend followers generally exit completely at that point.
c21.indd 257c21.indd 257 27-05-2013 11:29:3727-05-2013 11:29:37
258 p r o f i t i n g f r o m h e d g e f u n d s
Value averaging (VA) is based on the following formula:
T V n = I A × n × ( 1 + E R ) n
Where,
n = Number of time periods,
TV n = Target value after n periods,
IA = Initial capital allocation, and
ER = Expected return (average of the expected return of investment
per period and expected return of contribution per period).
The formula relies on the accuracy of the expected return (ER)
supplied. If that variable is assumed as zero, the formula reduces to:
T V n = I A × n
This is a simplifi ed special case of VA. It aims to increase the market
value of the shares owned at a constant amount, instead of a constant
rate with the original formula. Table 21.8 is an illustration of how dol-
lar cost averaging (DCA) compares to the simplifi ed value averaging
(VA) strategy. Like its predecessor, this table also uses the month-end
pricing for Bank of America (BAC) over a period of one year ending
October 31, 2012.
In this table, the fi rst four columns are the same as in Table 21.7 .
The fi gures in VA: Target Value (fi fth column) shows the portfo-
lio target value for the corresponding date: The value is targeted to
increase at $1,000 per month. The fi gures in VA: Portfolio Value Before
Transaction (sixth column) indicate the value of the portfolio for the
corresponding date before any new shares are purchased or sold. It is
obtained by multiplying VA: Target Value (fi fth column) for the previ-
ous month by the share price at the end of the current month and
dividing by the share price at the end of the previous month. The VA:
Diff erence in Target Value (seventh column) is obtained by subtracting
VA: Portfolio Value Before Transaction (sixth column) from VA: Target
Value (fi fth column). It indicates the value of new shares to be pur-
chased (if it is a positive value) or sold (if it is a negative value). The last
column, the number of shares to be purchased or sold, is obtained by
c21.indd 258c21.indd 258 27-05-2013 11:29:3727-05-2013 11:29:37
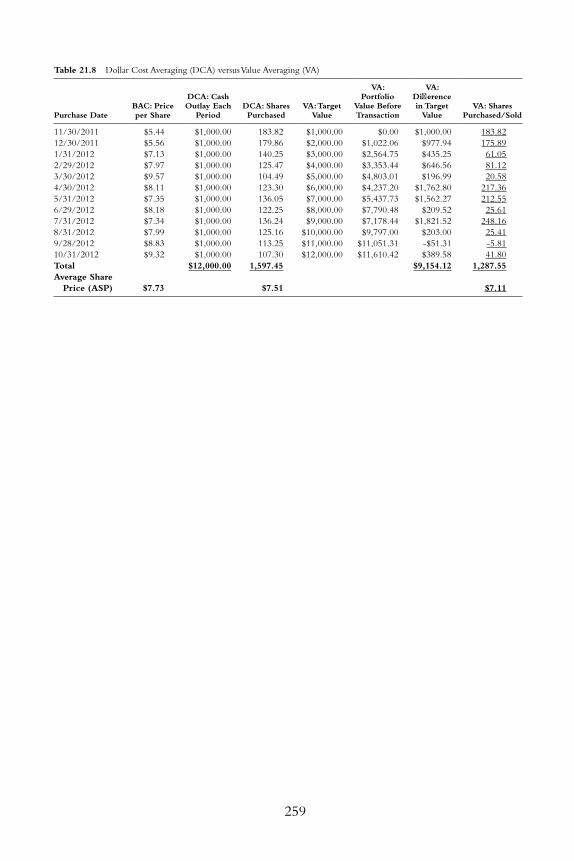
259
Table 21.8 Dollar Cost Averaging (DCA) versus Value Averaging (VA)
Purchase Date BAC: Price per Share
DCA: Cash Outlay Each
Period DCA: Shares Purchased
VA: Target Value
VA: Portfolio
Value Before Transaction
VA: Diff erence in Target
Value VA: Shares
Purchased/Sold
11/30/2011 $5.44 $1,000.00 183.82 $1,000.00 $0.00 $1,000.00 183.82
12/30/2011 $5.56 $1,000.00 179.86 $2,000.00 $1,022.06 $977.94 175.89
1/31/2012 $7.13 $1,000.00 140.25 $3,000.00 $2,564.75 $435.25 61.05
2/29/2012 $7.97 $1,000.00 125.47 $4,000.00 $3,353.44 $646.56 81.12
3/30/2012 $9.57 $1,000.00 104.49 $5,000.00 $4,803.01 $196.99 20.58
4/30/2012 $8.11 $1,000.00 123.30 $6,000.00 $4,237.20 $1,762.80 217.36
5/31/2012 $7.35 $1,000.00 136.05 $7,000.00 $5,437.73 $1,562.27 212.55
6/29/2012 $8.18 $1,000.00 122.25 $8,000.00 $7,790.48 $209.52 25.61
7/31/2012 $7.34 $1,000.00 136.24 $9,000.00 $7,178.44 $1,821.52 248.16
8/31/2012 $7.99 $1,000.00 125.16 $10,000.00 $9,797.00 $203.00 25.41
9/28/2012 $8.83 $1,000.00 113.25 $11,000.00 $11,051.31 -$51.31 -5.81
10/31/2012 $9.32 $1,000.00 107.30 $12,000.00 $11,610.42 $389.58 41.80
Total $12,000.00 1,597.45 $9,154.12 1,287.55
Average Share
Price (ASP) $7.73 $7.51 $7.11
c21.indd 259c21.indd 259 27-05-2013 11:29:3727-05-2013 11:29:37
260 p r o f i t i n g f r o m h e d g e f u n d s
dividing VA: Diff erence in Target Value by BAC: Share Price. The table
illustrates the following:
• The average purchase price with VA was $7.11 while that of DCA
was $7.51.
• Similar to SCA, the total cash outlay for VA over a given period
is unpredictable. If the share price of the security is in an increas-
ing trend through the period, the cash outlay required will be well
below $12,000; this was the scenario with BAC and the strategy
required a cash outlay of $9.154.12.
• VA allocates more capital when the share price drops from the pre-
vious period and vice-versa. This conforms to the value-investing
philosophy of trying to purchase shares at low prices. The con-
cept is illustrated in Table 21.8 : When the month-over-month
allocation size spiked the maximum (purchase date: 9/28/2012—
the allocation size increased from $10,000 to $11,051.31 dur-
ing that month—refer to the fi fth and sixth columns), the strategy
raised cash by selling some shares. On the other hand, when the
month-over-month allocation size crashed the most (purchase
date: 7/31/2012—the allocation size decreased from $8,000 to
$7,178.44 during that month—refer to the fi fth and sixth col-
umns), the strategy allocated the most capital.
Though VA comes ahead in terms of the cost basis achieved, DCA
is preferred by some investors for its more passive style. The uncertainty
of the cash requirement each period is also unpalatable for some inves-
tors. As value investors generally maintain a respectable cash buff er in
their portfolios, VA is well suited for them, since the variability in the
cash allocation requirement each period is not much of a concern.
As noted previously, cash should be considered as an inexpensive
asset class worth owning when the prices of other asset classes are high.
If prices of other asset classes continue higher to bubbly levels, cash is
elevated to be among the best asset classes to own—other assets should
be sold to raise cash. On the other hand, should asset prices head down
to rock-bottom levels, cash loses its position as an economical asset
class; at least some of that cash should be used to purchase lower priced
assets. VA provides a semi-mechanical way of implementing this con-
cept thus making it a favored strategy among value investors.
c21.indd 260c21.indd 260 27-05-2013 11:29:3727-05-2013 11:29:37
Types of Positions and Sizing 261
Low Probability Positions
Just as it sounds, low probability positions are expected to lose money
for the most part. Placing money in such ventures is akin to wild spec-
ulation; no way can this be labeled prudent money management. Then
word comes that many money managers hold what appears to be posi-
tions with very low probability of success. Are these superinvestors
oracles or is it their gambling instincts acting up?
Although the press devotes a lot of ink to it whenever a famous
money manager reveals such a position, the fact is that it is something
of a rarity. Such positions have a few common characteristics:
• The positions are such a minute percentage of the manager ’s over-
all assets that even if the position drops to zero, nary an impact is
made to the portfolio.
• The low probability events that managers choose to bet on have
such high reward potential that, in the event of success, despite the
minute position sizing, there will be signifi cant portfolio impact.
• The concerned money manager believes the market has mispriced
the security in some way. In other words, the manager strongly
believes he has an edge!
The vast majority of individual investors taking up low probability
positions trip up on the fi nal characteristic, as it is nearly impossible
for an individual investor to have an edge in this area. Even for the
best money managers, such opportunities seldom occur. Areas in which
managers have historically found such securities include distressed
bonds, businesses in bankruptcy, and certain types of options and swap
contracts. A common theme of these areas is the specialized knowledge
required to identify mispricing. Getting into these areas without doing
this groundwork is on a par with gambling. On the other hand, if mis-
pricing is identifi ed with high conviction, the strategy has the charac-
teristics of a low-risk high-reward investment:
• Low risk: Position size is so small that 100 percent loss of capital
has minimal portfolio impact.
• High reward: Best case scenario is a multifold return of investment
which will result in a signifi cant portfolio impact.
c21.indd 261c21.indd 261 27-05-2013 11:29:3727-05-2013 11:29:37
262 p r o f i t i n g f r o m h e d g e f u n d s
• Mispricing: Probability of the high-reward scenario has been vastly
underestimated by the market, resulting in a very low price com-
pared to the potential reward.
The eff ort and expertise required to identify mispriced securities in
the areas concerned are so huge that even the best money managers are
known to tread with caution; they also rely on other money managers
with specialized knowledge to successfully play the game: Even George
Soros, a trader who normally relies on his own philosophy, sought the
help of John Paulson upon hearing about the billions Paulson amassed
by betting against subprime mortgages. 5 Soros learnt about ABX (an
index that tracks subprime mortgages), the CDS insurance contract for
that index, and how they are traded from Paulson, and made billions
on his own trading them the following year. For individual investors, a
similar strategy would be one that relies on identifying such positions
from manager disclosures, then contemplating whether to clone them.
Summary
Picking stocks from manager bias spreadsheets and conducting funda-
mental analysis (FA) on them are the fi rst steps in learning from the
masters in the context of constructing the equity portion of an overall
asset allocation plan. A very critical follow-through is determining the
fi t of the pick within the existing equity and overall asset allocation.
The key concepts employed by the best money managers while
constructing their portfolios are based on the Nobel Prize winning
ideas from modern portfolio theory (MPT) and capital asset pricing
model (CAPM): diversifi cation and hedging. The section on diversifi -
cation and hedging illustrated the work in constructing a diversifi ed
portfolio while achieving the purpose of risk reduction without com-
promising expected return.
Money manager 13F fi lings can appear arbitrary in terms of both
position sizes and adjustments to the position sizes from quarter to
quarter. While this observation couldn ’t be any truer, there is a method
to the madness. One of the reasons for this random show quarter to
quarter is that managers tend to follow diff erent strategies to build and
size positions. The type of security and other parameters determine the
c21.indd 262c21.indd 262 27-05-2013 11:29:3727-05-2013 11:29:37
Types of Positions and Sizing 263
strategy adopted. The section on building and sizing positions intro-
duced techniques that money managers are known to use.
Keeping a cash hoard around is the toughest task investors face, for
it fails to provide any return whatsoever. Viewing cash as a call option
on every asset class with no strike price and no expiration allows the
investor to visualize holding cash as similar to holding an inexpensive
asset class. An illustration that demonstrated the concept using S&P 500
Index ETF (SPY) as the asset class drove home the point.
Low probability positions are expected to lose money most of the
time, making such positions appear more like gambling than invest-
ing. The best money managers seem to play in this area occasionally,
although, in reality, they are far from gambling: they are investing in posi-
tions that are mispriced—the market is pricing the security concerned
as a low probability position when in fact the money manager ’s FA has
determined it to be mispriced—as the security is discounted as the mar-
ket has underestimated the probability of success by a wide margin. For
individual investors and money managers alike, this is a diffi cult area to
play as it involves both specialized skills and resources. Money manag-
ers are known to seek out other managers with the specialized skills in
the areas concerned for help with initiating such positions. For individual
investors, the best option is to follow a similar approach of spotting such
positions from money manager disclosures and following them.
Notes
1. Edwin J. Elton and Martin J. Gruber, “Risk Reduction and Portfolio Size:
An Analytic Solution,” Journal of Business , October 1977.
2. Alice Schroeder, The Snowball: Warren Buff ett and the Business of Life (New
York: Bantam Dell, 2008).
3. William J. Bernstein, “Case Studies in Rebalancing,” Effi cient Frontier, www
.effi cientfrontier.com/ef/100/rebal100.htm.
4. Michael E. Edleson, Value Averaging: The Safe and Easy Strategy for Higher
Investment Returns (London: International Publishing Corporation, 1991).
5. Gregory Zuckerman, The Greatest Trade Ever: How John Paulson Bet Against the
Markets and Made $20 Billion (New York: Broadway Books, 2009).
c21.indd 263c21.indd 263 27-05-2013 11:29:3727-05-2013 11:29:37

c21.indd 264c21.indd 264 27-05-2013 11:29:3727-05-2013 11:29:37
265
Chapter 22
Conclusion
The book detailed several strategies for shadowing the best-
performing money managers. The details of the holdings of a
money manager are indeed a mine of information. Regulatory
requirements mandate that the U.S. long portfolio holdings of all man-
agers be disclosed through their quarterly 13F fi lings. While having an
overview of what the managers are up to via their 13Fs is an advantage,
the investor needs to be fully aware of the drawbacks.
• Time delay : There is an interval between when a manager trades
a stock and when that information becomes public. Depending on
when within the quarter the trade was made, the information can
be from 45 days to three-and-a-half months old. This risk can be
mitigated by avoiding managers who trade actively. For some of
them, many trades would not make it to the 13Fs, as the round-
trips are done within the same quarter. Employing manager bias
spreadsheets to compare the price range the manager traded at
with the price when the 13F became public can reduce this risk
c22.indd 265c22.indd 265 27-05-2013 11:53:0627-05-2013 11:53:06
266 p r o f i t i n g f r o m h e d g e f u n d s
further. Bias spreadsheets sometimes make it possible to pocket the
security at prices below the manager ’s cost basis; many value man-
agers acknowledge that they expect their picks to dip immediately
after stakes are established.
• U.S. long only : As the regulatory fi lings require only U.S. long
stock holdings to be disclosed, it does not paint a full picture of
the manager ’s activity. Positions such as shorts, derivatives, bank-
rupt businesses, international stocks, debt holdings, and so on, are
outside the canvas of such reports. To mitigate this problem, avoid
managers that are specialized in such areas of the market and those
with minimal U.S. long stock exposure.
Manager styles and philosophies vary vastly, even among the best-
performing managers. Before cloning managers based solely on their
success, it is critical to analyze their style and evaluate whether it makes
sense to follow them. Desirable traits include:
• Value-oriented bottom-up : Managers like Seth Klarman and
David Einhorn, with a value-oriented, bottom-up stock selection
philosophy, are a good fi t for all cloning strategies. The positions
are guaranteed to have passed the manager ’s stringent analysis with
fl ying colors. As the focus is on the individual merit of a particular
position, the risks associated with the macro environment and tail
risk are ignored. They need to be addressed separately, in a portfo-
lio context, for the best shot at success.
• Shareholder activist : Activist managers, whose focus is on share-
holder activism, generally build large positions and have very high
conviction about the outcome. Bill Ackman and Carl Icahn fall in
this category. A temporary spike in stock prices following the dis-
closure of activist involvement is a common phenomenon to be
aware of with these managers.
• Concentrated positions : Managers with heavily concentrated
portfolios are worthy of following, as the few positions they hold
are guaranteed to be their highest conviction opportunities. Ian
Cumming and Mohnish Pabrai belong to this group.
• Trend following : George Soros is the epitome of this style; follow-
ing him can produce good results for those who are familiar with
the strategy. Timing can be critical, and so the time delay with 13Fs
can prove a problem. Relying on the manager bias spreadsheet to
c22.indd 266c22.indd 266 27-05-2013 11:53:0727-05-2013 11:53:07
Conclusion 267
open positions only if they are trading below the manager ’s recent
stake acquisition price is a reasonable approach to soften this risk. As
trend followers generally build positions over a number of quarters,
catching them early is often necessary to get comparable returns:
analyzing the positions to identify underlying trends a manager is
following before they become very large positions is another tactic.
• Insurance fl oat: The bigwigs—Warren Buff ett, Prem Watsa, and
Ian Cumming—invest their insurance businesses’ fl oat. They are
generally value oriented and tend to hold on to their stock posi-
tions for the very long term. In terms of asset allocation, given
their need to stay very liquid, they are likely to keep lots of cash
and invest in debt and other more defensive areas. Cloning the
asset allocation is not ideal, as the objectives for investing insurance
fl oat is often way too conservative.
• University endowments: The investment objective of university
endowments generally calls for preserving capital, generating a por-
tion of the university ’s annual budget as income, and increasing the
pool while staying defensive. Unlike most individual investor port-
folios, they are unique in that the asset allocation is based around
achieving perpetual growth, that is, the time horizon is forever.
Many university endowments choose to invest a signifi cant portion
of their equity allocation with other fund managers. Although fol-
lowing individual equity allocations may not be feasible, their con-
servative stance makes it worthwhile to follow their asset allocation.
• Family offi ce: Family offi ces are set up to invest a wealthy inves-
tor ’s money. The 13Fs of George Soros, Lou Simpson, and Stanley
Druckenmiller, who have set up family offi ces recently, are good
resources. As they have already accumulated a huge amount of
wealth, they focus mostly on defensive strategies aimed at preserv-
ing capital, and generating periodic income for use in charitable
purposes and so on.
Popular cloning strategies may be classifi ed broadly into two
groups:
• Ad hoc cloning : A manager ’s holding is selected based on some
criteria and incorporated into one ’s existing equity portfolio. The
strategies are largely passive, as the stock from a manager ’s 13F fi l-
ing is bought/sold based on a set of rules.
c22.indd 267c22.indd 267 27-05-2013 11:53:0727-05-2013 11:53:07
268 p r o f i t i n g f r o m h e d g e f u n d s
• Mechanical cloning : Equity portfolios are constructed and main-
tained by applying a set of criteria to a group of money manager
13F positions. The main diff erence from the ad hoc model is that it
allows modeling an equity portfolio instead of a single position. It
is not as passive as the ad hoc model, as some trades are necessary
each quarter to maintain the portfolio.
There is also a third active approach, which is to follow and learn
from money managers, so as to implement their tactics successfully in
one ’s own portfolio. Here, the 13F holdings information serves only
as a fi ltering mechanism. A decision to buy/sell a fi ltered position is
founded on fundamental analysis and on techniques (based on diver-
sifi cation, hedging, and sizing) that money managers are known to use.
The strategies demand a fair amount of eff ort and expertise, but the
potential rewards make it worthwhile.
The various approaches discussed throughout the book demon-
strated what is involved when attempting to follow a particular strategy.
Ad Hoc Cloning Strategies
The tables in Part One , under each of the profi led managers, showing
the eff ect of cloning the top positions, is the simplest application of ad
hoc cloning. They help illustrate its strengths and weaknesses.
• Suitability : With ad hoc cloning, stocks can be selected individu-
ally, allowing investors to allocate funds into their existing equity
portfolio without evoking major changes. This approach permits
the investor to be price, value, and security agnostic. In short, it is
suited for passive investors looking to invest in individual securities
instead of index funds.
• Rules for trading : The rules for selecting a stock from a man-
ager ’s 13F fi ling play a critical role with ad hoc cloning. The rela-
tive size of the position and trades (if any) done during the quarter
work as tools for gauging the manager ’s bias which, in turn, can be
used to make a buy/sell decision.
• Portfolio fi t : The ad hoc method completely ignores the benefi ts
of portfolio diversifi cation.
c22.indd 268c22.indd 268 27-05-2013 11:53:0727-05-2013 11:53:07
Conclusion 269
Although ad hoc cloning methods have their limitations, the nature
of the approach lends itself to passive investors. Being aware of the
limitations and sidestepping them can prove valuable. Even though
the approach is useful only when selecting an individual stock, it is ben-
efi cial as long as the asset classes in the overall portfolio are diversifi ed
and hedged. Also, analyzing whether an ad hoc selection is a fi t in terms
of a diversifi ed equity portfolio is a small price to pay in the long run.
Mechanical Cloning Strategies
With mechanical cloning, rules mandate the positions to be cloned,
the asset distribution among the positions selected, and their periodic
rebalancing. In all, it allows the cloned portfolio to be constructed and
maintained in a passive, mechanical fashion without having to fret over
the fundamental characteristics of the securities involved or the overall
market.
There are numerous strategies to pursue; the key variables are
manager selection, asset allocation, and sentiment capture. The type of
money manager to use is one who adheres to the following themes:
• Individual merit : Each position in the 13F portfolio has to have
individual investment merit, rather than having merit as part of a
composite position. As the mechanical cloning models cannot dis-
tinguish off setting positions in the 13Fs, recommended positions
would ignore off setting positions in the source portfolio.
• Long-term focused : Mechanical cloning models rely on the
positions listed in the 13Fs every quarter, and the changes made
to the positions from the previous quarter. If the manager has only
short-term goals for the positions held, the rules could mandate
turning over most of them every quarter. High turnovers are detri-
mental both in terms of trading costs and tax implications.
• Concentrated positions : Cloning portfolios with hundreds of posi-
tions is impractical for individual investors. As the average size of an
individual investor portfolio is tiny compared to the average manag-
er ’s assets under management (AUM), cloning would result in very
little money being allocated to each position. Implementing a model
against multiple manager portfolios is unfeasible, as the number
c22.indd 269c22.indd 269 27-05-2013 11:53:0727-05-2013 11:53:07
270 p r o f i t i n g f r o m h e d g e f u n d s
of positions in the source portfolios increase. Trading costs and tax
implications also rise with the number of positions.
Choosing among the diff erent mechanical strategies depends on
the comfort zone of the investor, regarding the calculations necessary to
arrive at the choices and allocations recommended by the model con-
cerned. In general, rudimentary spreadsheet skills are all that is required
to implement the models. The math and trading requirements involved
should help decide the best choice for a particular situation.
• Largest positions versus largest new positions: These two
models diff er primarily in the data point(s) considered. The data
point for the largest positions models is the most recent 13F, while
that of the largest new positions model is the most recent 13F and
the previous quarter ’s 13F. The largest new positions model requires
a larger set of managers in order to have enough positions for a
portfolio. Besides, as the positions are based solely on the activity
in the latest quarter, portfolio turnover is usually much higher than
the corresponding largest positions-based model. The advantage
with the largest new positions model is its ability to capture the
latest manager sentiment.
• Equal allocation: For models based on equal allocation, assets are
equally divided among recommended positions. Trading require-
ments can be kept very low by shadowing managers whose styles
are suited for mechanical cloning. Rebalancing with a rule similar
to the one used in the sample portfolios (rebalance when the larg-
est position is 50 percent over the smallest position) ensures trades
to rebalance the portfolio are done only when there is a signifi cant
shift to the recommended allocation ratio.
• Weighted allocation versus 10-5-2 allocation versus exact
match approximation: These three models diff er in the way in
which the assets are distributed among the recommended posi-
tions. A fi xed set of positions from each manager ’s 13F are used,
and weightages are assigned to each one, based on the relative size
of the position in the source portfolio. These models involve a little
bit more calculation but, as the illustrations in Part Two showed, a
spreadsheet comes in really handy. Trading requirements are higher
c22.indd 270c22.indd 270 27-05-2013 11:53:0727-05-2013 11:53:07
Conclusion 271
than the equal allocation based portfolios as a weightage change in
the source portfolio can result in more trades. Also, frequent rebal-
ancing is required as the objective is to closely mimic the source
portfolio allocation.
• Weighted allocation : The weightages and number of positions
are fi xed, and correspond to the allocation ratios designed to
mimic the source portfolio allocations.
• 10-5-2 allocation : The weightages and positions are set so as to
conform to the 10-5-2 philosophy. This translates to a very small
number of highest conviction positions (>10 percent), an average
number of large high conviction positions (>5 percent), and the
rest in smaller positions (<2 percent).
• Exact match approximation : The weightages match the allo-
cation ratios of the signifi cantly large positions in the source port-
folios. Choosing between them boils down to using a strategy that
best conforms to the allocations in the source portfolios.
Matching the model used to the investment styles of the selected
managers is another aspect to consider. For example, the simplest model
(equal allocation largest positions) would be most suited for use with a
set of managers who hold heavily concentrated positions over the long
term. On the other hand, for managers known to target a weighted
allocation or an allocation based on percentages, one of the other
three allocation models would serve well.
Alternate mechanical models that clone the asset allocation and
the variations that incorporate market sentiment help demonstrate
how they can provide good absolute returns independent of market
conditions.
Manager bias spreadsheets combined with the information on the
price ranges managers realized allow for creating portfolios that guar-
antee better prices than the manager. A variation uses corporate insider
fi lings (Forms 3, 4, and 5) and benefi cial owner fi lings (13D and 13G)
to construct portfolios holding high- conviction manager positions at
prices comparable to that which the manager paid. The former strategy
sits well with managers who trade frequently, while the latter works
well with activist managers.
c22.indd 271c22.indd 271 27-05-2013 11:53:0727-05-2013 11:53:07
272 p r o f i t i n g f r o m h e d g e f u n d s
Implementing Manager Strategies
Selecting stocks using fundamental analysis (FA), and portfolio con-
struction and maintenance, using techniques that allow optimization
of the type of positions and their sizing are the key ingredients in the
armor of the vast majority of superinvestors. Individual investors will
need to tread carefully when attempting to implement these strategies.
Superinvestors are fortifi ed with knowledge, experience, and resources
that consistently allow them to generate good absolute returns; as
a group, individual investors are below par in all of these. A divide-
and-conquer approach, whereby the bulk of the portfolio is initially
allocated to passive mechanical strategies is a viable option. Adhering
to selections from manager bias spreadsheets and applying the tech-
niques to them is a good sandbox approach—picking stocks from bias
spreadsheets as opposed to the entire universe of stocks helps minimize
mistakes while learning the ropes. With time and eff ort, one gains con-
fi dence implementing the manager strategies. When this happens, more
of the passive money can shift into these strategies, getting you on the
road to becoming a superinvestor!
c22.indd 272c22.indd 272 27-05-2013 11:53:0727-05-2013 11:53:07
273
About the Author
John Konnayil Vincent received his BTech in Computer Science from
Kerala, India and his master ’s in Information Systems from the University
of Hawaii, Manoa. John worked with various software development
groups in the San Francisco Bay Area for almost two decades. Highlights
of that career include several inventions in the database technology fi eld
that were awarded patents, as well as performance awards. Recently, he
made a career shift into wealth management. His writings related to stock
market activity have appeared on Seeking Alpha and other websites.
babout.indd 273babout.indd 273 27-05-2013 08:25:3727-05-2013 08:25:37

babout.indd 274babout.indd 274 27-05-2013 08:25:3727-05-2013 08:25:37
275
Index
110-5-2 Allocation, 120, 128, 130, 131,
132, 163, 165, 166, 169, 170, 172,
173, 174, 175, 176, 270, 271
13D, 14, 196, 197, 198, 203, 204, 205,
206, 271
13F, 265, 266, 267, 268, 269, 270
13F, format 7, 8,
13F, confi dential treatment, 7
13F, fi ltering, 8
13F-HR, 11
13G, 196, 197, 198, 203, 205, 271
3G Capital, 22
4G (the insider trading report), 14
AAbitibibowater Inc (ABH), 105
absolute returns, 178, 185, 189, 191,
192, 211
ABX (index), 262
Acacia Research Corp (ACTG), 89
Acadia Realty Trust (AKR), 97, 98
accredited investors, xvii
Ackman Brothers & Singer, Inc., 17
Ackman, Bill, 17, 18, 19, 20, 21, 22,
23, 117, 135, 136, 137, 145, 147,
150, 151, 152, 153, 157, 159, 160,
161, 164, 165, 166, 168, 173, 174,
175, 176, 177, 179, 180, 181, 183,
191, 198, 199, 200, 201, 202, 204,
205, 266
Ackman, Bill funds
Pershing Square IV (PSIV), 18
Acme Steel, 79
activist/activist hedge fund manager 18,
23, 197, 199, 205, 206
activism theory, Icahn, 56
Ad hoc cloning, 267, 268, 269
Ad hoc cloning strategies
Portfolio fi t, 268
Rules for trading, 268
Suitability, 268
Adecoagro S A (AGRO), 88, 89, 90
Adobe Systems Inc (ADBE), 122,
124, 125, 127, 128, 129, 130,
132, 133
bindex.indd 275bindex.indd 275 27-05-2013 11:54:0527-05-2013 11:54:05
276 i n d e x
ADR, 116
AFLAC Incorporated (AFL), 248, 250
Agribrands, 50, 52
AIA Group (AIG’s Asia Group
spinoff ), 28
AIG WTS, 29
Air Lease Corporation (AL), 80, 81, 82
Alexander & Baldwin Inc (ALEX), 21,
167, 182, 204, 205
Algoma Steel , 104
Alliance One International (AOI), 67
Allied Capital, 48
Allied Nevada Gold (ANV), 67
allocation size, 243, 260
AlphaClone, 112
Alternate models, 177
alternatives to the long-only models
bond and cash, xxiii
cloning, xxiii
hedging (market sentiment), xxiii
net/neutral/short, xxiii
Altman Z-score (AZS), 222, 223, 224
Amazon.com, 96
AMC Networks (AMCX), 72
American Can, 56
American Capital Ltd (ACAS), 72
American Express Company (AXP),
36, 37, 139, 140, 153, 154, 155,
170, 171
American International Group (AIG),
29, 30, 31
American Investment Company, 41
American Railcar Industries (ARII) ,
55, 56, 58
American University, 113
AmeriCredit Corp, 28, 45, 46
AMEX, 6
Amgen, 95–96
Amylin Pharmaceutical Inc
(AMLN), 58
Anadarko Petroleum Corp (APC), 72
Analysis Group, 115
angel investment, xvi
AngloGold Ashanti Ltd (AU), 72,
73, 74
Anker Coal Group, 79
Aon Corp (AON), 122, 125, 127, 129,
130, 132
Apple (AAPL), 50, 51, 52, 53, 141, 142,
144, 145, 156, 157, 158, 159
AQR Capital Management, 5
Arch Coal, 79
Arizona State University, 115
Aspen Insurance Holdings (AHL),
51, 173
Asset Allocation, 119, 121, 122
asset allocation strategy, 113
asset classes, 93, 94, 95, 178, 179,
186, 188
assets under management (AUM), 269
Assured Guaranty Ltd (AGO) 20, 80,
81, 82
Automatic Data Processing (ADP),
137, 138, 151, 152, 166, 168, 173,
180, 181, 202
Aveo Pharmaceuticals Inc (AVEO), 67
Bbackfi ll bias, 115
Baker Scholar, 69
Baldwin-United Corporation, 43
Bank of America (BAC), 8, 9,10, 12,
29, 30–31
Bank of America Warrants, 72
Bank of England, 87, 88
Bank of Hawaii Corporation (BOH),
248, 250
Bank of Ireland (LON:BKIR),
80, 81
bankruptcies, 4, 266
bankruptcy risk, 219
BankUnited Inc (BKU), 80, 81
Baupost Group, LLC, 63
Baupost, Klarman fund, 63, 64, 65, 66,
67, 68
Baxter Intl Inc (BAX) 72
bindex.indd 276bindex.indd 276 27-05-2013 11:54:0527-05-2013 11:54:05
Index 277
Beam Inc (BEAM), 21, 22, 23, 167, 182
bear raid, 102
Bear Stearns 48, 70
benefi cial owner fi lings, 271
benefi cial ownership, xxiv
Benjamin Graham intrinsic value
formula, 231–232
Berkowitz, Bruce, 25, 26, 27, 28, 29, 30,
31, 118
Berkowitz, Bruce funds
Fairholme Allocation Fund
(FAAFX), 25, 26
Fairholme Focused Income Fund
(FOCIX), 25, 26
Fairholme Fund (FAIRX), 25, 26,
27, 28
Berkowitz, David, 17
Berkshire Hathaway (BRK.A, BRK.B),
xix,9, 10, 26, 28, 29, 30, 33, 34,
35, 36, 37, 41–42, 113, 114,
140, 220,
Best Buy (BBY), 51, 199, 200
Bethlehem Steel Corporation, 79
BFGoodrich, 56
bias spreadsheets, xxiv,211, 240
Bill & Melinda Gates Foundation
Trust, xix
Biogen Idec (BIIB), 59, 73, 74
Black Wednesday, 87
BlackBerry (BBRY), 103, 105, 106
blackmailing, 55–56
Blockbuster, 58, 59
Blue Ridge Capital, 113, 114
Boeing (BA), 28
Bogle, John, xvi
bonds, 94
Book-to-market (BTM) ratio, 210,
224, 225
boom-and-bust cycles, 85, 86, 87, 88,
90, 91
Borders, 166, 168, 180, 181
Borsheim’s Fine Jewelry, 35
Boston Chicken, 49
Boston Scientifi c (BSX), 73, 74
bottom-up, style of investing, 65, 95,
97, 116, 118, 210, 211, 240
bottom feeders, 78
BP PLC (BP), 66, 67
Brainard, William, 93
Brave Warrior Capital, 123
British pound, shorting, 87
Brookfi eld Residential Properties,
9, 10
BST Safety Textiles, 79
Boston Scientifi c Corporation (BSX),
142, 144, 156, 158, 201, 202
Buff ett, Howard, 33
Buff ett, Warren, xix,xx ,11, 12, 13,
14, 29, 33, 34, 35, 36, 37, 38, 39,
41, 48, 101, 102, 113, 117, 135,
138, 139, 140, 147, 150, 153, 154,
157, 159, 160, 161, 164, 168, 169,
170, 173, 174, 175, 176, 198, 199,
200, 201, 202, 204, 220, 225, 267
Buff ett of the North, 102
bullish/bearish bias, 198, 201
Burger King, 22
Burlington Industries, 79
Burlington Northern Santa Fe Corp
(BNI), 35–36, 139, 140, 153, 154,
170, 204
Business evaluation, 228, 229
business fundamentals, 210
business valuations, 34
BYD Company, 39
CCA Inc (CA), 51
Caesars Entmt Corp (CZR), 72
Calamos Convertible Fund, xxi
call option, 251, 252, 253, 263,
Canadian Pacifi c Railway (CP), 21, 22,
23, 137, 138, 144, 145, 167, 182,
204, 205
Canadian Warren Buff ett, 102
Capital allocation, 218
bindex.indd 277bindex.indd 277 27-05-2013 11:54:0527-05-2013 11:54:05
278 i n d e x
capital asset pricing model (CAPM), 5,
210, 211, 244, 246, 247, 248, 249,
254, 262
Capital Cities, 36
Capital gains, xx
Capital One Financial (COF), 72
capital preservation, 70
Cardinal Health (CAH), 73, 74, 141,
142, 156, 173
Carefusion Corp (CFN), 51, 141, 142,
156, 173, 199, 200
Cargill, 50
Cascade Bancorp (CACB), 80
Cash Conversion Cycle (CCC), 220,
221, 222
Casino in Biloxi, 41
CBS Corp (CBS), 51
Century Business Services, 50
CEO material, 57
Chapter 11, 57
charitable foundation, xix
Checklist 215, 216, 219
Business Sector, 216
Business Understanding, 216
Company’s Standing, 216
Emotional Stance, 218
Management Integrity and
Competency, 217
Valuation, 217
Chemdex, 50
Chevron Corp (CVX), 89
Chou, Francis, 101–102
Cigna Corp (CI), 199, 200
Cisco Systems, 95–96
CIT Group (CIT), 29, 66, 141, 142,
144, 146, 155, 156, 157, 158, 160
Citigroup (C), 8, 9,10, 12, 19, 21, 22,
23, 73, 74
cloning, eff ective, 6
CNO Finl 2016 7% DBCV, 72
CNO Finl Group Inc (CNO), 72
Coca Cola (KO), 36, 37, 38, 139, 140,
143, 144, 145, 153, 154, 155, 157,
158, 170, 171
Collery, Peter, 47
Collins & Aikman, 79
Colonial Penn, 41, 43
Columbia Business School, 230
Comcast Corp (CMCSA), 122, 125,
126, 127, 128, 129, 130, 132
Commercial databases, 115
Commercial Metals (CMC), 58
commodity trading advisors (CTAs), 4
Competitive advantages, 209, 216, 217
Competitors, 209
computer models, 117
Computer Sciences Corp (CSC), 51
Comverse Tech (CMVT), 89
concentrated portfolios, 135
concentration risk, 148
Cone Mills Corporation, 79
Confederation Life, 101
Confi dence Game, 19
confi dentiality treatment, 115
conglomerates, 87
ConocoPhillips (COP), 37, 38, 146,
160, 170, 171
convertible arbitrage, 55
Conwed Plastics, 41
cookie business, 57
Core value managers, 116
Cornell University, 47, 63
Corporate insiders, 196
corporate insider fi lings, 211, 240, 271
Corporate raider, 56
Corrections Corporation of America
(CXW), 137, 138, 166, 168,
181, 202
correlated volatility, 210
correlation coeffi cient, 243, 244, 251
Costco Wholesale Corp (COST),
170, 171
Coventry Healthcare (CVH), 199, 200
Cowen Group Inc (COWN), 44
Credit Default Swaps (CDS), 19, 20,
65, 71, 74, 104
credit funds, 70
Cresud (CRESY), 9, 10
bindex.indd 278bindex.indd 278 27-05-2013 11:54:0527-05-2013 11:54:05
Index 279
Crimson Wine Group, 41
Crum & Forster, 101
Cumming, Ian, 18, 29, 41, 42, 118, 266,
267,xix,xx
currency devaluation, 65
Current ratio (CR), 222, 223, 224, 226
CVR Energy Inc (CVI) , 58, 89
CVS Caremark Corporation
(CVS), 205
DD. E. Shaw & Company, 5
Dalal Street, 11
DaVita Healthcare (DVA), 171
dead funds, 115
debt holdings, 266
debt liabilities, 220
defense-oriented businesses, 87
defensive investors, 230, 231
defl ation, 103
delisted funds, 115
Delivering Alpha conference, 21
Dell (DELL), 51, 96, 103, 105, 106,
199, 200
Delphi Automotive PLC (DLPH), 51,
71, 72, 73
delta trading, 4, 5,6
derivatives, 266
DIRECTV (DTV), 9, 10, 37, 38, 171
dirty work, 78
discount rate (DR), 235, 236, 237, 238,
239
disequilibrium, 86
Dish Network (DISH), 89
distress zone, 224
distressed securities, 4, 6,96, 116
distressed debt, 71, 73
diversifi able risk, 210, 244, 247
diversifi cation, 210, 243, 244, 247, 248,
249, 251, 262
diversifi ed stocks, 94, 95
dividend discount model (DDM), 235,
236
Dividend income, 150, 214
Dodd, David, 34, 211, 212, 230
Dodd-Frank act, xvii,xviii,xix,86
Dollar cost averaging (DCA), 255, 256,
257, 258, 259, 260
Donaldson, Lufkin & Jenrette, 47
Domestic equity, 177, 178, 179,
191, 192
Domestic-Stock Fund Manager of the
Decade, 25
Domestic-Stock Fund Manager of the
Year, 25
Domtar Corp(UFS), 67, 68
double-barreled investing tactic, 35
Double Eagle hedge fund, 85
Douglas Emmett, Inc. (DEI), 97, 98
Dow Chemical, 36
downside protection, 219
Dreyfus & Company, 55
Druckenmiller, Stanley, 86, 87, 267
DST SYS INC (DST), 51
Eearnings-per-share (EPS), 224,
227, 228
Eastman Chemical (EMN), 45, 46
EDGAR, 7, 11, 14, 106
Edgar Public Dissemination Service
(PDS), 14
Effi cient market hypothesis
(EMH), 210
effi cient market theory, 34
effi ciently priced marketable securities,
domestic stocks, 95
foreign stocks, 95
Einhorn, David, 47, 48, 49, 50, 51, 52,
53, 118, 135, 141, 142, 143, 145,
147, 150, 155, 156, 157, 159, 160,
164, 172, 173, 174, 175, 176, 198,
199, 200, 202, 266
Einstein Noah Restaurant (BAGL),
51, 173
El Paso, 58, 59, 72
Elan, 50
Electrolux, 55
bindex.indd 279bindex.indd 279 27-05-2013 11:54:0527-05-2013 11:54:05
280 i n d e x
EMC Corporation (EMC), 137, 138,
146, 151, 152, 160, 166, 168,
173, 181
Emerging markets equity, 186
Empire Insurance Company, 43
Ensco PLC (ESV), 51, 141, 142, 144,
156, 158
Enzon Pharmaceuticals Inc
(ENZN), 67
Equal Allocation, 119, 123, 124, 128,
135, 146, 147, 270, 271
equity bias, 94
equity oriented index fund, 94
Equity Portfolio (EP), 247, 248, 249,
254, 255
Erasmus University, 112
European Exchange Rate Mechanism
(ERM), 87
event funds, 70
exact match approximation model, 178,
179, 191, 270, 271
Exchange Traded Index Funds (ETF),
97, 178
Exco Resources (XCO), 80, 81
exercise price, 213
expectation/pricing, 86
expected annual earnings growth
rate, 232
expected event, 4
expected market return (EMR),
246, 248
expected return (ER), 210, 246, 248,
249, 254, 258
FF. M. Mayer, 85
Faber, Mebane, 113
Fairfax, 101, 102, 103, 104, 105, 106
Fairfax Financial, 80
Fairfax Financial Holdings Limited,
101, 102
Fairholme Capital Management
LLC, 25
Fair Value Estimates (FVE), 209, 210,
227, 228, 229, 230, 231, 232, 233,
234, 236, 238, 239
Fama-French Three Factor Model, 210,
224
Family Dollar Stores (FDO), 21, 167,
182, 199, 200, 201, 202
family offi ce, xix,86
Fannie Mae (FNMA), 20
Farina, Mario, 224
FirstEnergy Corp. (FE), 173
Federal Deposit Insurance Corporation
(FDIC), 80
Federal Mogul Corp (FDML), 55,
58, 59
Fernandez, Charlie, 28
fi nancial statements, 209, 225
Fireman’s Fund Insurance
Company, 26
First Cash Financial Services (FCFS),
248, 150
First Eagle Funds, 85
First Union Real Estate Equity and
Mortgage Investments, 17
Fiserv Inc (FISV), 122, 123, 125, 127,
129, 130, 132
Fisher, Philip, 34, 35
fl oat, insurance, xix,34, 42, 267
Florida Power & Light (FPL), 43
Fooling Some of the People All of the
Time, 48
Ford Motor Credit Company, 64
Foreign developed equity, 186
Forest Labs (FRX), 28, 58, 59
Form 3, 196, 198, 204, 205, 271
Form 4, 196, 197, 271
Form 5, 197, 271
Fortescue Metals Group, 43, 45, 46
Fortune Brands, 23, 137, 144, 145, 166,
167, 181, 182, 203, 204, 205
Fortune Brands Home & Security
(FBHS), 21, 23, 167, 182, 199,
200, 205
bindex.indd 280bindex.indd 280 27-05-2013 11:54:0627-05-2013 11:54:06
Index 281
Freddie Mac, 36
free cash fl ows, 235
front running, 115
Frontier Communications Corp
(FRO), 105
Fund infl ows and outfl ows, 252, 253
fund managers, 111, 112, 114, 115, 117
Fund of Funds (FoFs)
Fees and performance, xxi
minimum requirement, xxi
Regulation, xxii
Fund of Funds model, 96
fundamental analysis (FA), 4, 209, 210,
211, 212, 213, 215, 241, 249, 252,
262, 263, 268, 272
future price projections, 209
GGary plate mill, 79
Geico Corporation, 35–36
General Dynamics (GD), 28
General Electric (GE) 36, 173
General Growth Properties (GGP),
20, 21, 22, 23, 28, 137, 166, 167,
181, 182
General Motors Company (GM), 51,
52, 142, 166, 173, 181
General Re Corp, 35–36
Getty Oil, 57
Gillette, 36
global equity markets, 94
Globe Specialty Metals, 125
Gold Fields Ltd (GFI), 72
gold funds, 70
gold investments, 65, 66
Gold Miners, 52, 53
Goldman Sachs (GS), 8, 9,10, 12, 36, 70
Goodrich Corp (GR), 72
Goodrich Petroleum Corporation
(GDP), 247, 248, 250
Google Inc (GOOG), 122, 123, 124,
125, 127, 128, 129, 130, 132, 133
Gordon model, the, 235
Gotham, 17, 18
government bonds, 228
Graham, Benjamin, 33, 34, 63, 101,
211, 212, 230, 231, 232, 233, 234
Graham-Newman Corporation, 34,
233
Graham Number, 230, 231
Grant’s Spring Investment Conference,
47–48
gray zone, 224
Greenberg, Glen, 122, 123, 124, 126,
128
Greenlight Capital, 47, 48, 49, 50, 51,
52, 53, 113, 114
Greenlight Capital Re (GLRE), 166,
168, 180
greenmailing, 55
growth discounting, 235, 238
growth investing, 34
growth stocks, 229, 231, 232
GW Investments, 101–102
HHain Celestial Group Inc (HAIN) 58
Hamblin Watsa Investment Council
Limited (HWIC), 101
Hard Rock Hotel, 41
Harman International Industries
(HAR), 173
Hartford Finl Svcs Grp (HIG), 72, 73
Harvard Business School, xix,17, 41,
64, 69, 77, 112
HCA Holdings (HCA), 51
Health Management Associates
(HMA), 173
HealthNet Inc. (HNT), 173
Hedge Funds, xvi,xviii,xx
Hedge Fund Activity, Window, 6
hedge fund herding, 114
hedging, 243, 244, 247, 249, 253, 262
Heine, Max, 63
Helix Energy Solutions Group
(HLX), 173
bindex.indd 281bindex.indd 281 27-05-2013 11:54:0627-05-2013 11:54:06
282 i n d e x
herd mentality, 86
Hertz Global Holdings (HTZ), 27,
30, 31
Hewlett Packard Co (HPQ), 66, 67
high conviction positions, 197, 200
High minimums, xviii,xxi
High reward, 261
Higher One Hldgs Inc (ONE), 122,
124, 125, 127, 128, 129, 130, 131,
132, 133
HomeFed Corporation (HOFD), 44,
45, 46
Hong Kong Dollar (HKD), 21, 23
Hong Kong exchange, 28
Horizon Natural Resources, 79
housing bubble, 86
Howard Hughes Corp (HHC), 21, 167,
181, 182, 204, 205
Humana (HUM), 28, 30, 31, 199, 200
Huntington Ingalls (HII), 51
Hyatt Hotels Corporation (H), 137, 138
IIcahn & Co. Inc, 55
Icahn, Carl, 55, 56, 57, 58, 59, 60,
118, 266
Icahn Enterprises, 55, 58
Icahn Enterprises LP (IEP) 55, 58
Idaho Timber, 41
Idenix Pharmaceuticals (IDIX), 67
IIT Madras, 101
illiquid securities, xx
Imclone, 59
index funds, xvi
Indian Institute of Technology, 101
indicator ratios, 219
individual investors, xv, xvi, xvii, xviii,
xix, xx, xxii,94
ineffi ciently priced securities
absolute return, 95
private equity, 95
real assets, 95
infl ows (mutual fund), 215
Initial rate of return (IRR), 224, 225, 226
Insider hints, 215
insider ownership, 211, 240
insider trading, xxiv
institutional investors, 94, 213
Intangible assets, 216, 218, 233
International Automotive Components
Group (IAC), 79
International Business Machines
(IBM), 37, 38, 139, 140, 146, 154,
160, 169, 171, 220
International Coal Group (ICG), 79,
81, 106
International Steel Group (ISG), 79
international stocks, 266
International Textile Group (ITG), 79
internet bubble/stocks era, 96
Interoil Corp (IOC), 89
INTL Fcstone Inc (INTL), 44
intrinsic value, 34, 42, 213, 215, 217,
230, 231
Invesco, 77
investment advisor, xviii
Investment Advisors Act, xviii,xix ,6
Investment Company Act, xviii,xxii
investment strategies
dedicated short, 3
global macro, 3
income focussed, 7
long/short, 3, 4,6
managed futures, 3, 4
investment style
delta neutral trading, 4
Directional, 3, 5
Event driven, 4, 6
Market neutral, 4, 6
pairs trading, 4, 6
quant, 5, 6
Risk optimized, 5, 6
Ira Sohn Investment Conference, 73
iShares 20-Year Treasury Bond (TLT),
183, 184, 186, 187, 189, 190, 249,
250, 254
bindex.indd 282bindex.indd 282 27-05-2013 11:54:0627-05-2013 11:54:06
Index 283
iShares Barclays, 183, 189
iShares FTSE/China Index Fd
(FXI), 97
iShares MSCI EAFE Index (EFA), 97
iShares Treasury Infl ation Protected
(TIP), 183, 184, 187, 189, 190,
249, 250, 254
iShares Trust MSCI EAFE (EFA), 98
iShares Trust MSCI Emerging
(EEM), 98
JJ C Penney (JCP), 21, 22, 23, 137,
138, 143, 144, 146, 152, 153,
158, 159, 160, 166, 167, 181, 182,
204, 205
Jadallah, Mazin, 112
Jeff eries Group (JEF), 41, 44, 45, 46
JetBlue Airways Corp (JBLU), 89, 90
Johnson & Johnson (JNJ), 37, 38,
63, 105, 106, 170, 171, 199, 200,
201, 202
Joint ventures, 43, 45
Jones Apparel Group, 50
JPMorgan Chase 2018 Wrnts, 72
Juniper Networks (JNPR), 96, 97, 98
Justice Holdings, 22
KKeane Federal Systems, 14
Keeping Powder Dry, 251
Kerr-McGee, 58
king of bankruptcy, the, 78
Klarman, Seth, 63, 64, 65, 66, 67, 68,
118, 266
Kraft Foods Inc (KFT), 21, 37, 38, 137,
144, 138, 152, 158, 160, 166, 167,
170, 171, 181, 182, 199, 200, 201
LLaboratory Corp Amer Hldgs (LH),
122, 124, 125, 127, 128, 129, 130,
132, 133
Landrys, 166, 168, 181
Lanxess, 50
Largest New Positions, xxiii ,120, 124,
125, 126, 128, 129, 131, 132, 135,
136, 145, 146, 147, 150, 159, 160,
161, 165, 195, 270
Largest Positions, xxiii ,120, 123, 124,
126, 127, 128, 130, 135, 136, 137,
138, 139, 140, 141, 143, 144, 145,
148, 150, 151, 152, 157, 158, 162,
165, 270, 271
lazy portfolios, 178, 191
Lear Corporation, 79
Legg Mason (LM), 51
Lehman Brothers, 47, 48, 93
Leucadia investment style, 43
Leucadia National (LUK) xix,18, 28,
30, 41, 42, 43, 44, 45
Level 3 Commn Inc (LVLT), 105
Liberty Media Capital (LMCA), 51
Liberty Mutual, 49
LIBOR, 71
Life Technologies (LIFE), 72
limited partnerships, xx
Linkedin Corp (LNKD), 97
Liquidations, 214, 232, 233
Liquidity indicators, 222, 223
London School of Economics,
85, 112
London Stock Exchange, 22
long/short, 3, 4,6, 118
Long’s Drug Stores, 204, 205
Lowe’s Companies (LOW),
167, 182
Low Probability Positions, 261, 263
Low risk, 261
LTV Steel, 79
Lubrizol Corporation, 36
Lynch, Peter, 224, 228
MM.D.C Holdings (MDC), 52, 53
macro analysis, 96, 98
bindex.indd 283bindex.indd 283 27-05-2013 11:54:0627-05-2013 11:54:06
284 i n d e x
macroeconomic developments, 5,
36, 210
Madoff , xxii
Magna, 104
Malkiel, Burton G., 115
Management Eff ectiveness, 220, 221
Manager Bias Spreadsheet, 198, 199,
200, 201, 206, 243, 262, 265,
271, 272
Manager selection, 112, 113, 114,
119, 198
manager sentiment, 270
Manager style
Concentrated positions, 266
Family offi ce, 267
Insurance fl oat, 267
Shareholder activist, 266
Trend following, 266
University endowments, 267
Value-Oriented Bottom-Up, 266
margin of safety, 34, 35, 118, 212,
213, 214, 215, 217, 227, 233, 251,
252, 253
Margin of Safety: Risk-Averse Value
Investing Strategies for the Thoughtful
Investor, 64
Markel Financial, 102, 104
market averages, xv,xvi,xxii
market ineffi ciencies, 244
market neutral trading strategies, 116
market price, 212, 214, 224, 228, 232
market returns, 210
market risk
nondiversifi able systematic, 5
market sectors
developed markets, 5
domestic, 5
emerging markets, 5
foreign, 5
growth, 5
international, 5
large cap, 5
mid cap, 5
small cap, 5
value, 5
market timing, 95, 96
Market Vectors Gold Miners ETF
(GDX), 51, 52, 53, 142, 173,
199, 200
Marquee Trades - Ackman, Bill, 19
Marquee Trades - Berkowitz,
Bruce, 27
Marquee Trades - Buff ett, Warren, 35
Marquee Trades - Cumming, Ian and
Steinberg, Joseph S., 43
Marquee Trades - Einhorn, David, 49
Marquee Trades - Icahn, Carl, 57
Marquee Trades - Klarman, Seth, 65
Marquee Trades - Paulson, John, 71
Marquee Trades - Ross, Wilbur, 78
Marquee Trades - Soros, George, 87
Marquee Trades - Swensen, David, 95
Marquee Trades - Watsa, Prem, 103
Mars/Wrigley, 36
Marshall Field, 56
Marvell Technology Group (MRVL),
51, 199, 200
Massachusetts Institute of Technology,
111
Mastercard Inc (MA), 125
MBIA (MBI), 19, 20, 29
McDonald’s Corporation (MCD), 137,
138, 151, 152, 153, 166, 168, 181
Mechanical cloning, 268, 269, 270
Mechanical Cloning Strategies
Concentrated positions, 269
Individual merit, 269
Long-term focused, 269
mechanical strategy, 113, 122
Medco Health (MHS), 72
MedImmune, 58
Medtronic Inc. (MDT), 173
MEMC Electronic Materials, Inc.
(WFR), 173
Mentor Graphics Corp (MENT), 58
merger, 4
bindex.indd 284bindex.indd 284 27-05-2013 11:54:0627-05-2013 11:54:06
Index 285
merger arbitrage, 70
Merrill Lynch, 25–26
MGM Resorts Intl (MGM), 72
MI Devs, 173
Microsoft Corp (MSFT), 51, 66, 67,
142, 173, 199, 200
mispriced distressed bonds, 65–66
mispricing of securities, 213, 261, 262
Mississippi, 41
Mittal Steel, 79
moats, 217
modern portfolio theory (MPT), 5,
210, 244, 262
momentum trade, 114
money managers
style of, 3
Montpelier Re Holdings (MRH), 81
Moody’s Corporation (MCO), 37, 38,
170, 171
Morningstar, 25
Mortgage Guarantors and Bond
Insurers, 20
mortgage trusts, 87
Mosaic Company (MOS), 248, 250
Motorola Mobility Hldgs (MMI), 58,
59, 72
Motorola Solutions Inc (MSI), 59, 89,
122, 124, 125, 126, 127, 129, 130,
131, 132
Moving Averages, 188, 190
M&T Bank Corporation (MTB),
170, 171
Mueller Industries (MLI), 41, 44,
45, 46
Munich Re, 37
mutual fund redemptions, 215
mutual funds, xv,xx,xxi ,178
Mutual Shares, 63, 64
Mylan, 59, 72, 73
NNabisco Group Holdings, 56, 57
NASDAQ, 6
Nasdaq 100 Index, 90
National Health Inv (NHI), 67
Nations Rent, 65–66
Navistar International Corp (NAV), 58
NCR Corp (NCR), 51
Nebraska Furniture Mart, 35
negative correlation, 244, 247, 248,
249, 251,
negligence lawsuits, 215
Net Asset Value (NAV), xx
net borrowing rate, 220
Net current assets (NCA), 230,
233, 234
Net current asset value (NCAV),
230, 233
net earnings, 224, 235
net investable asset, xv,xvi
net net working capital (NNWC), 230,
233, 234
Netscape Communications, 96
New York Stock Exchange (NYSE) 6,
22, 55
New York University, 69
News Corp (NWSA), 67, 106
News Corp Class B (NWS), 67
Nike Inc. (NKE), 170
Nikkei, 65, 104
Nobel-Prize, 5, 210, 262
nondiversifi able risk, 210, 211
nondiversifi able risk (β), 246, 247
Northbridge Financial, 101
Northrop Grumman (NOC), 28,
30, 31
Novagold Resources Inc (NG), 67, 72
OOdyssey Partners LP, 70
Odyssey Re, 101
Oracle Corporation (ORCL), 89,
90, 95, 122, 124, 125, 127, 129,
130, 132
Orthodontic Centers of America, 50
Oshkosh Corporation (OSK), 58
bindex.indd 285bindex.indd 285 27-05-2013 11:54:0627-05-2013 11:54:06
286 i n d e x
overall asset allocation, 243, 244, 246,
247, 262
Owens & Minor, Inc. (OMI), 248, 250
PPabrai, Mohnish 8, 9,10, 11, 266
pairs trading, 4, 6
parabolic curves, 102
passive investors, 269
Patriot Coal, 50
Patterson-UTI Energy, Inc. (PTEN),
173
Paulson & Company, 69, 70
Paulson, John, 69, 70, 71, 72, 73, 74,
118, 161, 262
Paulson, John fund
Advantage fund, 70
PC Hldgs, 173
peacemakers, 57
Pennzoil, 57
Perpetual Discounting, 234
Pershing Square, 17, 18, 21, 22
Pershing Square Capital Management,
17, 18
PetroChina (PTR), 36, 38, 39
Petroleo Brasileiro (PBR), 90
Pfi zer Inc. (PFE), 28, 30, 31, 106, 141,
142, 144, 146, 155, 156, 157, 158,
160, 172, 173
Philip Morris, 57
Phillips 66 (PSX), 171
Phillips Petroleum, 56
Philosophy and Style - Ackman,
Bill, 18
Philosophy and Style - Berkowitz,
Bruce, 26
Philosophy and Style - Buff ett,
Warren, 34
Philosophy and Style - Cumming, Ian
and Steinberg, Joseph S.,42
Philosophy and Style - Einhorn,
David, 48
Philosophy and Style - Icahn, Carl, 56
Philosophy and Style - Klarman,
Seth, 64
Philosophy and Style - Paulson,
John, 70
Philosophy and Style - Ross, Wilbur, 78
Philosophy and Style - Soros,
George, 86
Philosophy and Style - Swensen,
David, 94
Philosophy and Style - Watsa,
Prem, 102
Phl Corp, 43
Pioneering Portfolio Management:
An Unconventional Approach to
Institutional Investment (2000), 94
Piotroski F-score, 225, 226
Poison pill, 60
Political survivors, 57
Ponzi scheme, xxii
Poorvu, William, 64
portfolio allocation models,
10-5-2 Allocation, xxiii
Equal Allocation, xxiii
Weighted Allocation, xxiii
Portfolio Analysis - Ackman, Bill, 20
Portfolio Analysis - Berkowitz,
Bruce, 28
Portfolio Analysis - Buff ett, Warren, 37
Portfolio Analysis - Cumming, Ian and
Steinberg, Joseph S., 44
Portfolio Analysis - Einhorn, David, 50
Portfolio Analysis - Icahn, Carl, 58
Portfolio Analysis - Klarman, Seth, 66
Portfolio Analysis- Paulson, John, 72
Portfolio Analysis - Ross, Wilbur, 79
Portfolio Analysis - Soros, George, 88
Portfolio Analysis - Swensen, David, 96
Portfolio Analysis - Watsa, Prem, 105
Portfolio optimization, 247, 253
POSCO (PKX), 37, 38
potential credit risk, 209
PowerShares ETF Trust QQQ PUTS,
88, 89
bindex.indd 286bindex.indd 286 27-05-2013 11:54:0627-05-2013 11:54:06
Index 287
PowerShares QQQ ETFs, 91
preferred shares, 36, 37
Present discounted value, 234
Price/earnings to growth (PEG) ratio,
224, 225, 226, 228
price-neutral, 195
price-per-share (PPS), 227, 230
Price-to-book (P/B) ratio, 223, 225,
226, 230
Primerica Inc (PRI), 122, 124, 125,
127, 128, 129, 130, 132, 133
Princeton Mining, 104
Princeton University, 115
private equity (PE), 95
Private equity funds, xx
private equity partnerships, xvi
Procter & Gamble (PG), 36, 37,
146, 160, 167, 170, 171, 182,
198, 199, 200
Profi tability indicators, 219, 220
QQualcom Inc (QCOM), 89, 90
qualifi ed purchasers, xviii
Quant funds, 5, 6,117
Quantitative Measures, 219
Quantum Endowment Fund, 86
Quantum Fund, 86
Quick ratio (QR), 221, 223, 224
Quinnipiac University, 115
RRadvision Ltd (RVSN), 67
Ralston Purina, 50
Everest Re Group Ltd (RE), 173
Real estate investment trusts (REIT),
87, 183
real estate market, 70
Rebalancing, 136, 138, 140, 141, 143,
145, 146, 147, 150, 151, 153, 155,
157, 159, 164, 165, 169, 172, 174,
178, 179, 180, 183, 185, 253, 255,
269, 270, 271
recovery funds, 70
Refl exivity, 86
Regulation D, xvii
Renaissance Technologies, 5
reporting biases, 115, 120
Research in Motion (RIMM), 103,
225, 227, 234, 239, 240
Return on Assets (ROA), 219,
220, 226
Return on Capital Employed
(ROCE), 220
Return on Equity (ROE), 219, 220
Return on Retained Earnings
(RORE), 220, 221, 222
Richard, Christine, 19
Richard Ivey School of Business, 101
Richardson, Eric, 113
Right of domicile, 60
right sizing, xxv
Rights off ering, 213, 214
risk arbitrage, 4, 118, 215
Risk Free Rate (RFR), 210, 227,
246, 248
risk management, 244
Risk optimized, 5, 6,117
risk-adjusted returns, 253
risk-free asset class, 228
risk-free debt-coupon rates, 227
risk-reward, 118, 254
Ross, Wilbur, 77, 78, 79, 80, 81, 82, 118
Rothschild Inc., 77
Royal Bank, 104
Royce Premier Fund, xxi
Rubin, Robert, 70
Rule 506, xvii
Russell 2000 index, xxi
SS&P 500 Index, 91, 247, 252, 263
S&P 500 SPDR (SPY) PUTS, 88, 89
safe zone, 224
safeguarding capital, 212
Safety Components International, 79
bindex.indd 287bindex.indd 287 27-05-2013 11:54:0627-05-2013 11:54:06
288 i n d e x
Saha, Atanu, 115
Salomon Brothers, 93
Samsonite, 49
Sandridge Energy (SD), 105
Sanofi SA, 37
SC Fundamental Value Fund, 47
Schroeder, Alice, 251
Scripps Networks (SNI), 72
scuttlebutt mode, 35
Seagate Technology (STX), 51, 52, 53,
142, 146, 156, 160, 199, 200, 201,
202, 203
Sears Holdings Corp (SHLD), 29,
30, 214
Sears Hometown Outlet Stores
(SHOS), 214
Sears Hometown Outlet Stores Right
(SHOSR), 214
Section 12 - Securities Exchange Act
of 1934, 196
Section 3(c) (7), xviii
Section 4(2) of the Securities Act, xvii,
Sector Rotation, 185, 187
Securities Act of 1933, xvii,xxi
Securities Exchange Act of 1934, xviii
Securities and Exchange Commission
(SEC), xvii,xix,xx,xxiv, 6, 7,11, 14
Security Analysis, 211, 230
Security mispricing
Acquisitions, 215
businesses in distress, 215
Dividend eliminations, 214
Insider hints, 215
Liquidations, 214
Spin-off s, 213
thinly traded securities, 215
Window dressing, 214
See’s Candies, 35
Seitel, 50
senior debt holdings, 116
Sensitivity analysis, 64
sentiment capture 119, 120, 121, 122
sentiment, manager, 120, 124, 128
Separately Managed Account (SMA), xvi
Sequoia Fund, xx,xxi
Share cost averaging (SCA), 255, 256,
257, 260
shareholder activism, 4
Shearson Lehman Brothers, 26
short-term treasury bills, 94
shorts, 266
Simpson, Lou, 267
single-manager risk, 121, 147, 148
Sirrom Capital, 49
Slater, Jim, 224
Small Business Administration, 48
small-cap premium, 211
small-cap spin-off, 213
small-cap stocks, 95, 97, 211
soft cycle, 103
Soros Fund Management LLC, xix,85
Soros, George, xix,85, 86, 87, 88, 89,
90, 91, 186, 262, 266, 267
Special purpose acquisition company
(SPAC), 22
SPDR Gold Trust (GLD), 72, 73, 74
SPDR S&P 500 index ETF, 252,
253, 263
SPDR Trust Series I, 97
specialized skills, 261, 262, 263
spinoff , 4
Spirit Aerosystems (SPR), 28
Spitzer, Eliot attorney general, 17
Sprint Nextel Corp (S), 51, 73, 146
St. Joe Companies (JOE), 29, 30, 31
Staggered board, 60
Standard deviation (σ), 245, 246, 247,
248, 254
Steinberg, Joseph S, 41, 42, 118
stock market corrections, 65
stock selection strategies
buy low/sell high, xxiv
Fair Value Estimate (FVE), xxiv
margin of safety, xxiv
Q&A checklist, xxiv
Quantitative checklist, xxiv
bindex.indd 288bindex.indd 288 27-05-2013 11:54:0627-05-2013 11:54:06
Index 289
Strategic Planning Institute, 26
subprime mortgages, 71
subprime mortgage-backed
securities, 96
Summit Holdings Southeast, 49
Sun Bancorp (SNBC), 80
Sunbelt Rentals, 66
Suntrust Banks (STI), 89
super bubble, 88
ever increasing credit expansion, 88
globalization of fi nancial markets, 88
removal of fi nancial regulations, 88
super investors, 207
surges in infl ation, 65
survivorship bias, 115
Swensen, David, 93, 94, 95, 96, 97, 98,
118, 178, 179, 183, 184, 185, 186,
188, 191
Swiss RE, 36
Syneron Medical Ltd (ELOS), 67
Ttail risk, 65, 102, 103
Take-Two Interactive Software
(TTWO), 58
Talcott National, 41
Tappan, 55
Target Corporation (TGT), 18, 137,
138, 144, 151, 152, 153, 157, 158,
166, 168, 176, 181, 204, 205
Target markets, 209
technical analysis, 4
technical indicators, 188, 191
Tejon Ranch Company (TRC), 248,
250, 251
Templeton, John, 102
Teradata Corporation (TDC), 141, 142,
155, 156, 173
terminal value (TV), 236, 237, 238, 239
Tesco, 37
Texaco, 56, 57
Time Delay, 265, 266
time value of money, 234
Time Warner, 59
The Alchemy of Finance: Reading the
Mind of the Market.”, 86
The Greatest Trade
Ever: The Behind-the-Scenes Story of How
John Paulson Defi ed Wall Street and
Made Financial History, 70
The Icahn Report™, 56
The Intelligent Investor, 33, 230
The Ivy Portfolio, 113
The Man Who Broke the Bank of
England, 88
The McClatchy Company (MNI),
248, 250
The Snowball: Warren Buff ett and the
Business of Life, 251
Theravance Inc (THRX), 67
Theravance Inc Notes, 67
tobacco business, 57
Tobin, James, 93
Top-down, style of investing, 210
Top Holdings, 122
trading activity, 197, 198, 203, 206
trailing-twelve-month (TTM), 224, 225
Treasury infl ation protected securities,
183, 186
trend-following, 257
triple-B subprime securities, 71
trusts, xix
TWA, 56
Two-Step Discounting, 235
two-step dividend discount model,
236, 238
types of positions
inverse correlation, xxiv
keeping powder dry, xxv
low/high probability, xxiv
Travelers Companies (TRV), 173
UUnconventional Success: A Fundamental
Approach to Personal Investment
(2005), 94, 178
bindex.indd 289bindex.indd 289 27-05-2013 11:54:0627-05-2013 11:54:06
290 i n d e x
Union Pacifi c Corporation
(UNP), 170
Uniroyal, 56
United Health (UNH), 28, 199, 200
United Rentals (URI), 27, 28
Universitat Pompeu Fabra, 112
university endowment funds, xix
University of Alabama, 115
University of Kentucky, 115
University of Massachusetts, 25
University of Maryland, 114
University of Nevada, 113
University of Toledo, 114
URS Corporation (URS), 141, 142,
155, 156, 173
US Bancorp (USB), 37, 38, 105, 125,
170, 171
US Long Only, 266
US Securities and Exchange
Commission (SEC), 102
US Steel, 79
US Treasury Bonds, 183, 186, 189
USG Corp (USG), 105, 171
VValeant Pharmaceuticals Intl (VRX),
122, 123, 124, 125, 126, 127, 128,
129, 130, 131, 132, 133
Value averaging (VA), 255, 256, 258,
259, 260,
value investing, 34, 211, 212, 220, 230
value investors, 212, 214, 260
value- oriented managers, 118, 120, 121
Vanguard, xvi
Vanguard FTSE All-World, 183
Vanguard MSCI Emerging Market
ETF (VWO), 97, 98, 183, 189,
183, 184, 186, 187, 189, 190, 249,
250, 254
Vanguard REIT ETF (VNQ),
183, 184, 186, 187, 190, 249,
250, 254
venture capital, xvi, xx ,95, 97
Viasat Inc (VSAT), 66, 67
Visa Inc (V), 122, 125, 127, 129,
130, 132
VistaPrint Limited (VPRT), 122, 123,
124, 125, 126, 127, 128, 129, 130,
131, 132, 133
volatile securities, 255, 257
vulture capitalists, 78
Validus Holdings (VR), 173
Vanguard FTSE All-World ex US
ETF(VEU), 183, 184, 186,
187, 190
Vanguard Total Stock Market
ETF(VTI), 183, 184, 187, 190
WWachovia, 19, 23
Walmart Stores, (WMT), 37, 38, 146,
170, 171
Walt Disney Company, The, 36
Washington Mutual, 64, 66
Washington Post (WPO), 36, 38, 39,
170, 171
Watsa, Prem, 101, 102, 103, 104, 105,
106, 107, 118, 161, 225, 267
Web MD Health Corp (WBMD), 58
Weightage 151
Weightage adjustments, 247, 253, 254,
255
Weighted Allocation, 119, 124, 126,
127, 129, 133, 149, 150, 161,
270, 271
Weighted average cost of capital
(WACC), 235, 236, 238, 239
Weirton Steel, 79
Wells Fargo (WFC), 9, 10, 20, 27,
30, 37, 38, 105, 139, 140,
146, 153, 154, 155, 160, 169,
170, 171
Wellcare (WCG), 28
Wellpoint (WLP), 28, 106
bindex.indd 290bindex.indd 290 27-05-2013 11:54:0627-05-2013 11:54:06

Index 291
Wesco, 170, 171
Westport Innovations (WPRT), 88,
89,90
What-If analysis, 238
White Mountains Insurance (WTM),
45, 46, 160
WL Ross & Co. LLC, 77
Wyeth, 173
XXerox Corp (XRX), 51, 199, 200
XL Group PLC (XL), 72
YYahoo, 58, 96
Yale, xix,77, 93
Yale model, 94
Yale University’s endowment fund, 93
Yale portfolio, 185
Yale’s Investments Offi ce, 95
Yum! Brands, Inc. (YUM), 137, 166, 181
ZZenith Insurance Company, 101
zero-sum games, 95
bindex.indd 291bindex.indd 291 27-05-2013 11:54:0627-05-2013 11:54:06

bindex.indd 292bindex.indd 292 27-05-2013 11:54:0627-05-2013 11:54:06


