Embed Size (px)
Citation preview

Prognostic value of trisomy 8 as a single anomaly and theinfluence of additional cytogenetic aberrations in primarymyelodysplastic syndromes
Sılvia Saumell,1,2 Lourdes Florensa,1
Elisa Luno,3 Carmen Sanzo,3 Consuelo
Canizo,4 Jesus M. Hernandez,4 Jose
Cervera,5 Miguel A. Gallart,6 Felix
Carbonell,7 Rosa Collado,7 Leonor
Arenillas,1 Carme Pedro,1 Joan Bargay,8
Benet Nomdedeu,9 Blanca Xicoy,10
Teresa Vallespı,11 Jose M. Raya,12
Luis Belloch,5 Guillermo F. Sanz5 and
Francesc Sole1
1Laboratori de Citologia Hematologica, Labora-
tori de Citogenetica Molecular, Serveis de Patolo-
gia i d’Hematologia Clınica, Hospital del Mar,
GRETHNE, IMIM (Hospital del Mar Research
Institute), Barcelona, 2Department of Medicine,
Medicine Faculty, Universitat Autonoma de Bar-
celona, Bellaterra, 3Servicio de Hematologıa,
Hospital Universitario Central de Asturias,
Oviedo, 4Servicio de Hematologıa, Hospital Uni-
versitario de Salamanca, Salamanca, 5Servicio de
Hematologıa, Hospital Universitario La Fe,
Valencia, 6Servei d’Hematologıa, Hospital Uni-
versitari Arnau de Vilanova, Lleida, 7Servicio de
Hematologıa, Hospital General de Valencia,
Valencia, 8Servicio de Hematologıa, Hospital Son
Llatzer, Mallorca, 9Servei d’Hematologıa, Hospi-
tal Clınic Barcelona, Barcelona, 10Servei
d’Hematologıa, Hospital Universitari Germans
Trias i Pujol, Badalona, 11Servei d’Hematologıa,
Hospital Vall d’Hebron, Barcelona and 12Servicio
de Hematologıa, Hospital Universitario de Cana-
rias, La Laguna-Tenerife, Spain
Received 11 April 2012; accepted for
publication 16 July 2012
Correspondence: Francesc Sole, Laboratori de
Citogenetica Molecular, Servei de Patologıa,
Hospital del Mar, Passeig Marıtim 25-29,
08003 Barcelona, Spain.
E-mail: [email protected]
Spanish MDS Group (Grupo Espanol de Sın-
dromes Mielodisplasicos; GESMD) and Spanish
Haematological Cytogenetics Working Group
Summary
Trisomy 8 is the most common chromosomal gain in myelodysplastic syn-
dromes (MDS), however, little is known about the features of MDS with
isolated trisomy 8 and the influence of additional cytogenetic aberrations.
We determined the characteristics and prognostic factors of 72 patients
with trisomy 8 as a single anomaly and analysed also the impact of other
aberrations added to trisomy 8 in another 62 patients. According to our
study, MDS with isolated trisomy 8 was more frequent in men, with more
than one cytopenia in most patients (62%) and having about 4% bone
marrow blasts. The multivariate analysis demonstrated that platelet count
and percentage bone marrow blasts had the strongest impact on overall
survival (OS). The median OS for isolated trisomy 8, trisomy 8 plus one
aberration (tr8 + 1), plus two (tr8 + 2) and plus three or more aberrations
(tr8 + � 3) was 34�3, 40, 23�4 and 5�8 months, respectively (P < 0�001).Trisomy 8 confers a poorer prognosis than a normal karyotype in MDS
patients with � 5% bone marrow blasts. This study supports the view that
MDS with isolated trisomy 8 should be included in the intermediate cyto-
genetic risk group.
Keywords: trisomy 8, myelodysplastic syndromes, cytogenetic aberrations.
ª 2012 Blackwell Publishing Ltd, British Journal of Haematology doi:10.1111/bjh.12035
research paper

(Grupo Cooperativo Espanol de Citogenetica
Hematologica; GCECGH).
The myelodysplastic syndromes (MDS) are a heterogeneous
group of myeloid stem cell neoplasms characterized by
hypercellular bone marrow with myeloid lineage dysplasia and
ineffective haematopoiesis leading to peripheral cytopenias.
The overall survival (OS) and risk of leukaemic transforma-
tion in such patients are highly variable (Greenberg et al,
1997; Sole et al, 2005; Bernasconi et al, 2007; Malcovati et al,
2007; Brunning et al, 2008; Schanz et al, 2012). The diagno-
sis and classification of MDS are among the most difficult of
the myeloid neoplasms (Valent et al, 2007; Brunning et al,
2008; Tefferi & Vardiman, 2009). Diagnostic problems arise
when the clinical and laboratory findings suggest MDS but
the morphological features are inconclusive. Conventional
karyotyping is an essential tool in these cases because some
specific cytogenetic abnormalities are considered presumptive
evidence for MDS (Brunning et al, 2008).
Trisomy 8 (tr8 or + 8) as a single anomaly is present in
about 11% of de novo MDS with an abnormal karyotype
(Paulsson & Johansson, 2007; Mitelman et al, 2011), and
represents about 5% of all MDS. Although trisomy 8 is the
most common cytogenetic chromosomal gain in MDS, the
finding of trisomy 8 is not definitive evidence for the diagno-
sis of MDS in the absence of morphological criteria of dys-
plasia (Brunning et al, 2008).
The outcome of MDS with trisomy 8 as a sole change var-
ies greatly (Yunis et al, 1988; Nowell & Besa, 1989; Sole et al,
1992, 2000, 2005; Morel et al, 1993; Bernasconi et al, 2007;
Schanz et al, 2011); but, according to the International Prog-
nostic Scoring System (IPSS), isolated trisomy 8 is included
in the intermediate cytogenetic risk group (Greenberg et al,
1997). On the other hand, there are very few studies that
have analysed the impact of additional karyotypic abnormali-
ties (Haase et al, 2007; Paulsson & Johansson, 2007).
The present study aimed to define the biological character-
istics of de novo MDS with trisomy 8 as a sole change, to
clarify the prognostic impact of trisomy 8 as a single anom-
aly, and finally, to elucidate the importance of the addition
of other chromosomal aberrations in terms of OS and acute
myeloid leukaemia (AML) transformation, of patients that
are included on the registry of the Spanish MDS group
(Grupo Espanol de SMD; GESMD).
Materials and methods
Patients
Between 1980 and 2011, 3677 patients from 106 Spanish cen-
tres had been diagnosed with MDS and subsequently had
been recorded in the GESMD registry. A total of 257 cases
diagnosed with MDS with isolated + 8 or with trisomy 8
and other additional cytogenetic aberrations were collected
from this registry. The diagnosis of the patients were
reviewed and reclassified according to World Health Organi-
zation (WHO) classification of 2008 (Brunning et al, 2008)
as follows: Refractory cytopenia with unilineage dysplasia
(RCUD), refractory anaemia with ring sideroblasts (RARS),
refractory cytopenia with multilineage dysplasia (RCMD),
refractory anaemia with excess of blasts type 1 (RAEB-1),
refractory anaemia with excess of blasts type 2 (RAEB-2) and
myelodysplastic syndrome-unclassified (MDS-U). Hence, 107
cases without sufficient criteria for MDS as well as patients
with chronic myelomonocytic leukaemia (CMML) and cases
with more than 20% bone marrow blasts were excluded from
the study. Cytogenetic formulation was also reviewed; 16
cases with MDS and trisomy 8 had an incomplete Interna-
tional System for Human Cytogenetic Nomenclature (ISCN)
record (Shaffer et al, 2012) and were also excluded. After this
revision the data of 134 patients could be used; 72 with tri-
somy 8 as a single anomaly and 62 with trisomy 8 plus other
cytogenetic aberrations.
The thresholds used to assess the presence of cytopenias,
as recommended in the IPSS, were haemoglobin <100 g/l,
absolute neutrophil count (ANC) <1�8 9 109/l and platelet
count <100 9 109/l (Greenberg et al, 1997; Brunning et al,
2008). Patients were stratified into low, intermediate-1, inter-
mediate-2 and high-risk groups according to the IPSS criteria
(Greenberg et al, 1997). Patients were also grouped in four
categories of karyotype complexity: isolated trisomy 8 (tr8),
trisomy 8 plus one additional abnormality (tr8 + 1), trisomy
8 plus two additional abnormalities (tr8 + 2) and trisomy 8
plus three or more additional abnormalities (tr8 + � 3)
(Table I).
Eight of 134 patients with trisomy 8 received chemother-
apy treatment, however, seven of them had already trans-
formed to AML. The remaining patients received supportive
care. The study was conducted fulfilling the biomedical Hel-
sinki Declaration of research guidelines.
In addition, patients in the GESMD registry database with
de novo MDS with a normal karyotype were reviewed to
meet the WHO classification (2008) criteria (Brunning et al,
2008); 1676 of them could be used to compare with the ser-
ies of cases with isolated trisomy 8 in terms of OS and time
to AML evolution.
Cytogenetics
All the bone marrow chromosome studies were performed
following chromosome-banding procedures and at least 20
S. Saumell et al
2 ª 2012 Blackwell Publishing Ltd, British Journal of Haematology
metaphases were analysed. Abnormal clones were described
in accordance with the 2009 ISCN (Shaffer et al, 2009).
Based on these guidelines, a clone was defined by two cells
showing the same gain of chromosomal material or the same
structural aberration, or by at least three cells showing loss
of the same chromosome. Karyotypic aberrations were
counted using the consensus counting guidelines developed
by International Working Group on MDS Cytogenetics
(Chun et al, 2010). Complex karyotype was considered when
there were three or more independent alterations in at least
two cells. If two or more clones with two aberrations were
present in the same patient, it was also considered as a com-
plex karyotype. In addition, we divided cases with complex
karyotype in two subgroups: MDS with three aberrations and
MDS with more than three (Schanz et al, 2012).
Statistical analysis
Statistical analysis was carried out in the overall series of
patients and also in patients with MDS with isolated trisomy
8, to define the clinical and diagnostic characteristics of this
group. Hence, the other karyotype complexity groups were
also studied.
The following initial variables were analysed at univariate
level for their possible association with the OS or evolution
to AML: age, sex, haemoglobin level, ANC and platelet
count, number of cytopenias and percentage of bone marrow
blasts at diagnosis. The WHO 2008 classification (Brunning
et al, 2008) and IPSS (Greenberg et al, 1997) were taken as
models to establish all cut-off points. Finally, WHO 2008
classification groups and IPSS risk categories were also evalu-
ated. OS and AML transformation analysis were performed
by using the Kaplan–Meier method followed by the log-rank
test (Kaplan & Meier, 1958; Mantel, 1966; Peto et al, 1976).
OS was calculated in months from date of MDS diagnosis
until date of death or last follow-up. The time to AML trans-
formation was the number of months elapsed between MDS
diagnosis and the development of AML. All univariate tests
were two tailed and, after Bonferroni correction, P-values
< 0�001 were considered as significant. Finally, Cox propor-
tional hazards multivariate model was used to define the OS
and to assess the relevant prognostic variables (Cox, 1972).
For multivariate analysis, a P-value < 0�05 was considered
significant.
The statistical analysis was performed using the Statistical
Package for the Social Sciences (SPSS) software, version 15.0
(SPSS Inc., Chicago, IL, USA).
Results
Patient characteristics
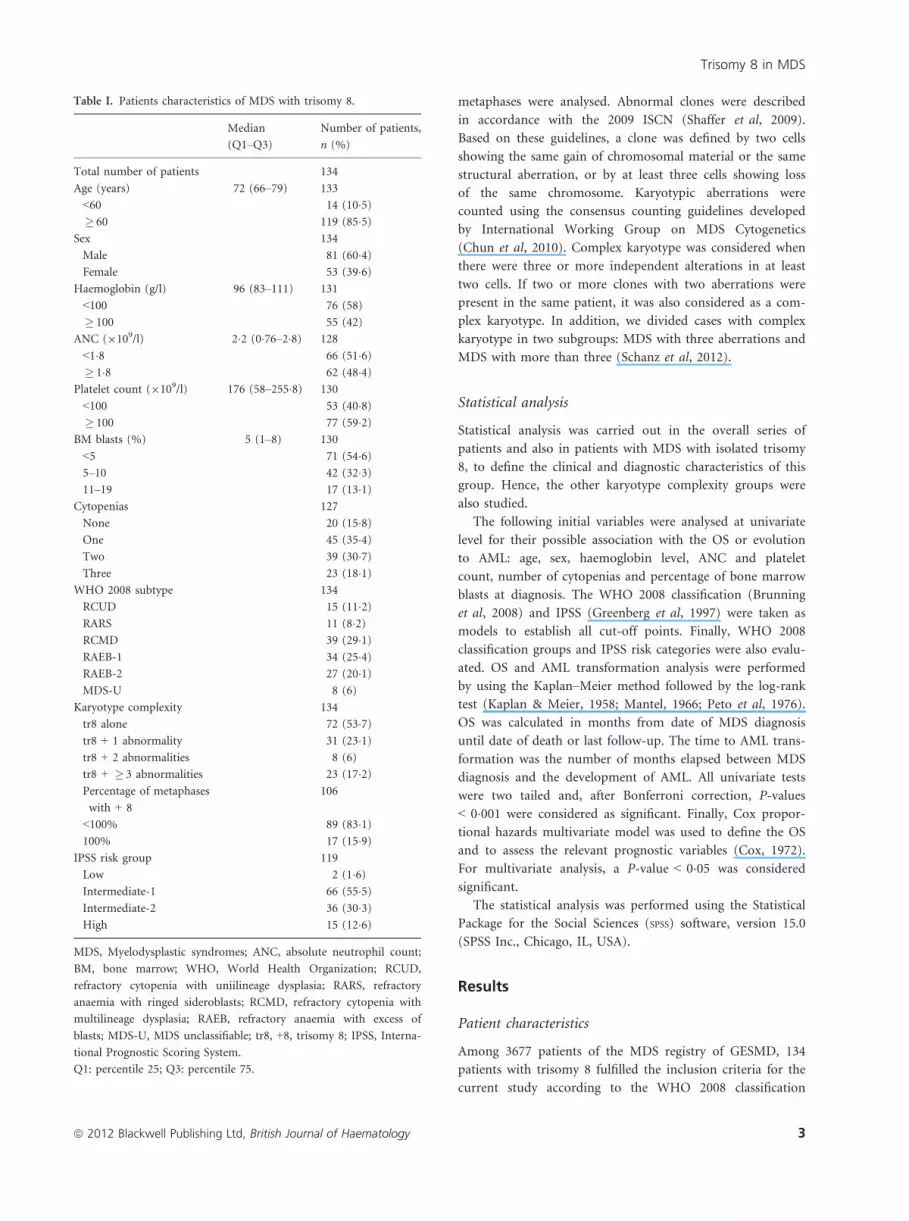
Among 3677 patients of the MDS registry of GESMD, 134
patients with trisomy 8 fulfilled the inclusion criteria for the
current study according to the WHO 2008 classification
Table I. Patients characteristics of MDS with trisomy 8.
Median
(Q1–Q3)
Number of patients,
n (%)
Total number of patients 134
Age (years) 72 (66–79) 133
<60 14 (10�5)� 60 119 (85�5)
Sex 134
Male 81 (60�4)Female 53 (39�6)
Haemoglobin (g/l) 96 (83–111) 131
<100 76 (58)
� 100 55 (42)
ANC (9109/l) 2�2 (0�76–2�8) 128
<1�8 66 (51�6)� 1�8 62 (48�4)
Platelet count (9109/l) 176 (58–255�8) 130
<100 53 (40�8)� 100 77 (59�2)
BM blasts (%) 5 (1–8) 130
<5 71 (54�6)5–10 42 (32�3)11–19 17 (13�1)
Cytopenias 127
None 20 (15�8)One 45 (35�4)Two 39 (30�7)Three 23 (18�1)
WHO 2008 subtype 134
RCUD 15 (11�2)RARS 11 (8�2)RCMD 39 (29�1)RAEB-1 34 (25�4)RAEB-2 27 (20�1)MDS-U 8 (6)
Karyotype complexity 134
tr8 alone 72 (53�7)tr8 + 1 abnormality 31 (23�1)tr8 + 2 abnormalities 8 (6)
tr8 + � 3 abnormalities 23 (17�2)Percentage of metaphases
with + 8
106
<100% 89 (83�1)100% 17 (15�9)
IPSS risk group 119
Low 2 (1�6)Intermediate-1 66 (55�5)Intermediate-2 36 (30�3)High 15 (12�6)
MDS, Myelodysplastic syndromes; ANC, absolute neutrophil count;
BM, bone marrow; WHO, World Health Organization; RCUD,
refractory cytopenia with uniilineage dysplasia; RARS, refractory
anaemia with ringed sideroblasts; RCMD, refractory cytopenia with
multilineage dysplasia; RAEB, refractory anaemia with excess of
blasts; MDS-U, MDS unclassifiable; tr8, +8, trisomy 8; IPSS, Interna-
tional Prognostic Scoring System.
Q1: percentile 25; Q3: percentile 75.
Trisomy 8 in MDS
ª 2012 Blackwell Publishing Ltd, British Journal of Haematology 3
(Brunning et al, 2008): 72 (53�7%) had trisomy 8 as a sole
abnormality, 31 (23�1%) had one additional abnormality, 8
(6%) had two additional abnormalities and 23 (17�2%) had
three or more additional abnormalities.
Trisomy 8 as a sole change
The 72 patients with trisomy 8 as a sole change were analy-
sed as a whole. Forty-eight patients were male (66�7%) and
24 were female (33�3%), with median age of 72 years (range,
27–88). The median haemoglobin level, ANC and platelet
count were 96 g/l (range, 44–149), 2�1 9 109/l (range,
0�1–13�6) and 155 9 109/l (range, 1–767), respectively. The
median bone marrow blasts was 4% (range, 0–19). Most of
the patients (80%) had one or more cytopenias: 57�7% had
haemoglobin level <100 g/l, 43�5% had ANC <1�8 9 109/l
and 36�6% had a platelet count <100 9 109/l. By WHO 2008
criteria (Brunning et al, 2008), patients were classified as fol-
lows: 9 RA (12�5%), 7 RARS (9�7%), 21 RCMD/RCMD-RS
(29�2%), 18 RAEB-1 (25%), 14 RAEB-2 (19�4%) and 3
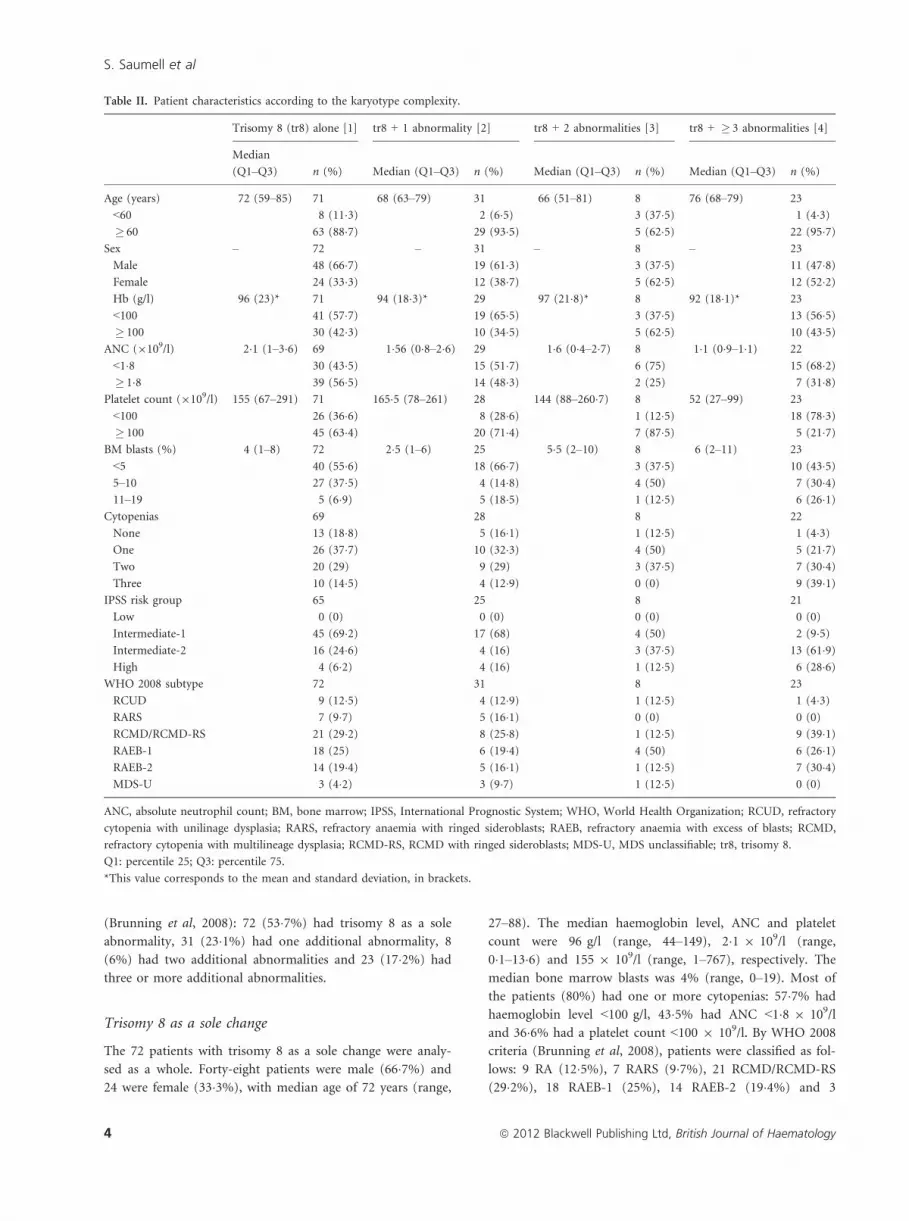
Table II. Patient characteristics according to the karyotype complexity.
Trisomy 8 (tr8) alone [1] tr8 + 1 abnormality [2] tr8 + 2 abnormalities [3] tr8 + � 3 abnormalities [4]
Median
(Q1–Q3) n (%) Median (Q1–Q3) n (%) Median (Q1–Q3) n (%) Median (Q1–Q3) n (%)
Age (years) 72 (59–85) 71 68 (63–79) 31 66 (51–81) 8 76 (68–79) 23
<60 8 (11�3) 2 (6�5) 3 (37�5) 1 (4�3)� 60 63 (88�7) 29 (93�5) 5 (62�5) 22 (95�7)
Sex – 72 – 31 – 8 – 23
Male 48 (66�7) 19 (61�3) 3 (37�5) 11 (47�8)Female 24 (33�3) 12 (38�7) 5 (62�5) 12 (52�2)Hb (g/l) 96 (23)* 71 94 (18�3)* 29 97 (21�8)* 8 92 (18�1)* 23
<100 41 (57�7) 19 (65�5) 3 (37�5) 13 (56�5)� 100 30 (42�3) 10 (34�5) 5 (62�5) 10 (43�5)
ANC (9109/l) 2�1 (1–3�6) 69 1�56 (0�8–2�6) 29 1�6 (0�4–2�7) 8 1�1 (0�9–1�1) 22
<1�8 30 (43�5) 15 (51�7) 6 (75) 15 (68�2)� 1�8 39 (56�5) 14 (48�3) 2 (25) 7 (31�8)
Platelet count (9109/l) 155 (67–291) 71 165�5 (78–261) 28 144 (88–260�7) 8 52 (27–99) 23
<100 26 (36�6) 8 (28�6) 1 (12�5) 18 (78�3)� 100 45 (63�4) 20 (71�4) 7 (87�5) 5 (21�7)
BM blasts (%) 4 (1–8) 72 2�5 (1–6) 25 5�5 (2–10) 8 6 (2–11) 23
<5 40 (55�6) 18 (66�7) 3 (37�5) 10 (43�5)5–10 27 (37�5) 4 (14�8) 4 (50) 7 (30�4)11–19 5 (6�9) 5 (18�5) 1 (12�5) 6 (26�1)
Cytopenias 69 28 8 22
None 13 (18�8) 5 (16�1) 1 (12�5) 1 (4�3)One 26 (37�7) 10 (32�3) 4 (50) 5 (21�7)Two 20 (29) 9 (29) 3 (37�5) 7 (30�4)Three 10 (14�5) 4 (12�9) 0 (0) 9 (39�1)
IPSS risk group 65 25 8 21
Low 0 (0) 0 (0) 0 (0) 0 (0)
Intermediate-1 45 (69�2) 17 (68) 4 (50) 2 (9�5)Intermediate-2 16 (24�6) 4 (16) 3 (37�5) 13 (61�9)High 4 (6�2) 4 (16) 1 (12�5) 6 (28�6)
WHO 2008 subtype 72 31 8 23
RCUD 9 (12�5) 4 (12�9) 1 (12�5) 1 (4�3)RARS 7 (9�7) 5 (16�1) 0 (0) 0 (0)
RCMD/RCMD-RS 21 (29�2) 8 (25�8) 1 (12�5) 9 (39�1)RAEB-1 18 (25) 6 (19�4) 4 (50) 6 (26�1)RAEB-2 14 (19�4) 5 (16�1) 1 (12�5) 7 (30�4)MDS-U 3 (4�2) 3 (9�7) 1 (12�5) 0 (0)
ANC, absolute neutrophil count; BM, bone marrow; IPSS, International Prognostic System; WHO, World Health Organization; RCUD, refractory
cytopenia with unilinage dysplasia; RARS, refractory anaemia with ringed sideroblasts; RAEB, refractory anaemia with excess of blasts; RCMD,
refractory cytopenia with multilineage dysplasia; RCMD-RS, RCMD with ringed sideroblasts; MDS-U, MDS unclassifiable; tr8, trisomy 8.
Q1: percentile 25; Q3: percentile 75.
*This value corresponds to the mean and standard deviation, in brackets.
S. Saumell et al
4 ª 2012 Blackwell Publishing Ltd, British Journal of Haematology

MDS-U (4�2%). According to IPSS almost all patients were
included in the intermediate-1 or intermediate-2 groups.
(Table II).
Only 11 out of 72 patients showed trisomy 8 in all meta-
phases. In terms of OS, no statistical differences were found
between patients with all metaphases bearing +8 and patients
with some normal metaphases (median OS, 64 months vs.
29 months, P = 0�62).
Trisomy 8 in overall series
The haemoglobin level, ANC, platelet count, number of
cytopenias, proportion of bone marrow blasts, WHO subtypes
and IPSS scores for the overall series were described in Table I.
Among cases with tr8 + 1, the most common abnormality
added to trisomy 8 was del(5q) (n = 9, 29%) followed by del
(11q) (n = 3, 9�6%), and only one case had an unrelated
clone. Almost all cases of trisomy 8 with other abnormalities
had also normal metaphases (83�1% of cases).
No statistical differences were found when comparing
clinical or analytic characteristics among the isolated tr8,
tr8 + 1 and tr8 + 2 groups. However, a lower ANC was
seen with the addition of cytogenetic alterations to trisomy
8. Median platelet counts between the tr8 + � 3 group and
the other groups were statistically different (P < 0�001).(Table III).
Univariate analyses
The results after performing Kaplan–Meier analysis for over-
all survival and risk of leukaemic transformation in the
whole series are shown in Table IVA. The median follow up
was 16 months (range, 1–122) and the median OS was
29�6 months. Thirty-three patients (24�6%) evolved to AML
during the follow-up.
At the beginning, the series was analysed as a whole.
Among clinical parameters, age and gender did not have any
impact on OS or on AML transformation. The ANC, platelet
count, number of cytopenias and bone marrow blast percent-
age had a clear impact on OS (P < 0�001 for all the parame-
ters) but not on AML transformation (P = 0�314, P = 0�117,P = 0�242 and P = 0�099, respectively). Platelet count
<100 9 109/l was a very unfavourable prognostic factor
(median OS, 9 months). Patients with � 5% bone marrow
blasts had worse prognosis than patients with blasts <5%(P < 0�001). Hence, the OS and risk of AML transformation
were also differentiated by the prognostic IPSS subgroups
and WHO classification.
The data of patients with normal karyotype who were
listed in the GESMD registry (n = 1676) were used to ana-
lyse the prognostic impact of bearing trisomy 8, in terms of
OS and time to AML transformation. The median survival
for the karyotype complexity groups (normal, tr8, tr8 + 1,
tr8 + 2, tr8 + � 3) was 99, 34�3, 40, 23�4 and 5�8 months
respectively; with an OS statistically worse for tr8 + � 3
patients (P < 0�001). For OS and AML transformation, no
significant differences were found between tr8 and tr8 + 1
(P = 0�34) or between tr8 + 1 and tr8 + 2 (P = 0�267).Subsequently, another two groups were analysed: tr8,
tr8 + 1 and tr8 + 2 vs. tr8 + � 3, which identified statisti-
cally significant differences in median OS (34�3 vs. 5�8,P < 0�001) (Fig 1).
Univariate analysis of prognostic factors for the 72 cases
of MDS with isolated trisomy 8 was also performed sepa-
rately. For these patients the median OS was 34�3 months
and 13 patients (18%) evolved to AML. Our data indicate
that in this subgroup, platelet count, number of cytopenias,
bone marrow blast percentage, IPSS risk groups and WHO
classifications showed a close association with OS and AML
transformation. The worse prognosis was shown for low
Table III. Univariate analysis according to karyotype complexity.
P-value
[1] vs. [2] [1] vs. [3] [1] vs. [4] [2] vs. [3] [2] vs. [4] [3] vs. [4]
Age 0�357* 0�316* 0�348* 0�457* 0�189* 0�189*Sex 0�659† 0�103† 0�072† 0�254‡ 0�238† 1‡
Haemoglobin (g/l) 0�759§ 0�602§ 0�710§ 0�452§ 0�931§ 0�421§Absolute neutrophil count (9109/l) 0�292* 0�275* 0�005* 0�610* 0�086* 0�684*Platelet count (9109/l) 0�850* 0�778* <0�001* 0�935* <0�001* <0�001*Bone marrow blasts (%)* 0�367* 0�540* 0�375* 0�270* 0�244* 0�888*Cytopenias 1‡ 0�708‡ 0�008‡ 0�718‡ 0�054‡ 0�06‡IPSS risk group 0�133‡ 0�556‡ <0�001‡ 0�421‡ <0�001‡ 0�08‡WHO 2008 subtype 0�587‡ 0�703‡ 0�487‡ 0�562‡ 0�08‡ 0�250‡
IPSS, International Prognostic System; WHO, World Health Organization.
[1] tr8; [2] tr8 + 1; [3] tr8 + 2; [4] tr8 + 3.
*Mann–Whitney U.
†Chi-square.
‡Fisher’s exact test.
§t-student.
Trisomy 8 in MDS
ª 2012 Blackwell Publishing Ltd, British Journal of Haematology 5

Table IV. Results of univariate analyses of prognostic factors for overall survival and AML transformation in the (A) overall series and (B) MDS
with trisomy 8 as a sole anomaly.
Overall survival AML transformation
n (%)
Median
survival
(months)
Patients alive
at 5 years (%) P-value n (%)
Time to 25%
probability
(months)
Cumulative probability
of AML evolution
at 2 years (%) P-value
(A)
Age 116 (86�6) 0�773 33 (24�6) 0�767<60 years 11 13�5 10 6 (18�2) 20 45�5� 60 years 105 5�4 14�3 27 (81�8) 19�6 20�9
Sex 117 (87) 0�347 33 (24�6) 0�561Male 69 (58�9) 16�5 14�5 18 (54�5) 14�8 23�2Female 48 (41�1) 39�7 14�6 15 (45�5) 34 22�9
Haemoglobin 115 (85�8) 0�034 32 (23�8) 0�595<100 g/l 67 (58�2) 13�9 11�9 18 (54�5) 16 23�8� 100 g/l 48 (41�7) 39�7 18�7 14 (31�6) 30�5 20�8
ANC 112 (83�5) <0�001 32 (23�8) 0�314<1�8 9 109/l 58 (51�8) 13�9 10�3 19 (59�3) 20 25�8� 1�8 9 109/l 54 (48�2) 50�9 22�9 13 (40�6) 19�5 20�3
Platelet count 114 (85�1) <0�001 32 (23�8) 0�117<100 9 109/l 45 (39�4) 9 4�4 16 (50) 14�8 33�3� 100 9 109/l 69 (60�63) 51�3 21�7 16 (50) 34�1 15�9
Cytopenias 111 (82) <0�001 32 (23�8) 0�242None 18 (16�2) 81�6 27�7 2 (6�25) 79�4 0�05One 39 (35�1) 50�9 23�1 13 (40�6) 23�1 25�6Two 34 (30�6) 13�9 5�8 11 (34�3) 18�9 26�5Three 20 (18�1) 6�7 5 6 (18�7) 14�8 30
BM blasts 114 (85�1) <0�001 31 (23�1) 0�099<5% 65 (57) 50�9 23�1 9 (29�1) 30�5 9�25–10% 35 (30�7) 11�5 5�7 13 (41�9) 23�1 28�611–20% 14 (12�2) 6�6 0 9 (29�1) 12�5 64�3
IPSS risk group 107 (60�4) <0�001 31 (23�1) 0�031Low 0 (0) 0 0 0 (0) 0 0
Intermediate-1 62 (57�9) 63�5 25�8 15 (32�5) 48�4 16�13Intermediate-2 33 (30�8) 9�2 3 9 (25�6) 30�5 24�2High 12 (11�2) 6�5 0 7 (14�9) 22�6 58�3
WHO 2008 subtype 117 (87) <0�001 33 (24�6) 0�186RCUD 14 (12) 34�3 23�1 3 (9�1) 40 14�13RARS 9 (7�8) 81�6 60 1 (3) 79�4 11�1RCMD/RCMD-RS 36 (30�7) 31�9 16�6 5 (15�2) 19�5 11�1RAEB-1 28 (23�9) 10�5 7�1 14 (42�4) 23�1 50
RAEB-2 23 (19�6) 9�9 0 10 (30�3) 14�8 34�17MDS-U 7 (6) 63�5 42�8 0 (0) 0 0
Karyotype complexity 117 (87) <0�001 33 (24�6) 0�407tr8 alone 63 (53�8) 34�3 20�6 13 (39�4) 18�9 17�5tr8 + 1 26 (22�2) 40 11�5 9 (27�3) 20 26�9tr8 + 2 8 (6�8) 23�4 12�5 5 (15�2) 34�1 37�5tr8 + � 3 20 (17�1) 5�8 0 6 (18�2) 12�5 30
(B)
Age 62 (86�1) 0�714 0�89<60 years 5 (8�1) 13�53 20 1 12�8 20
� 60 years 57 (91�9) 34�33 21�1 12 18�9 17�5Sex 63 (87�5) 0�122 0�311Male 42 (66�6) 29�1 19�1 9 16 19
Female 21 (33�4) 69�2 23�8 4 19 75
Haemoglobin 63 (87�5) 0�038 0�498<100 g/l 36 (57�1) 13�9 19�4 10 16 25
� 100 g/l 27 (42�9) 63�5 22�2 3 30�5 7�4
S. Saumell et al
6 ª 2012 Blackwell Publishing Ltd, British Journal of Haematology

platelet count (median survival: 9�6 months) and the med-
ian survival for none, one, two or three cytopenias was
86�4, 69�2, 11�4, 7�8 months, respectively (P < 0�001)(Table IVB).
Finally, we compared MDS with trisomy 8 as a sole
change with MDS with normal karyotype. We distinguished
two groups of patients: one with <5% bone marrow blasts
and other with � 5%. The median OS for patients with <5%bone marrow blasts was 64�2 [95% confidence interval (CI),
31�5–96�7] vs. 82�3 (CI, 69�5–95) months, for MDS with iso-
lated trisomy 8 and normal karyotype respectively
(P = 0�48), whereas for the � 5% bone marrow blasts group
it was 9�5 (CI, 22�7–34�3) vs. 28�5 (CI, 7�1–12�1) months
(P < 0�001), respectively (Fig 2).
Multivariate analyses
In patients with isolated trisomy 8 the following parameters
showed prognostic impact regarding OS (Table V): platelet
count and bone marrow blast percentage. In fact, platelet
count <100 9 109/l and bone marrow blasts � 5% were
related with a poor prognosis. The platelet count was the
variable with more extreme risk groups, with a Hazard Ratio
(HR) of 3�4 (P < 0�02) for OS.
In multivariate analysis for the overall series of patients
with trisomy 8 the variables haemoglobin level, platelet
count, bone marrow blasts and karyotype complexity had an
independent prognostic impact. In agreement with the results
of univariate analysis, the addition of more aberrations to
trisomy 8 was strongly associated with poor prognosis
(tr8 + 2 and tr8 + � 3 vs. tr8 and tr8 + 1) (HR 3�2;P < 0�001) (Table V).
Discussion
Trisomy 8 as a sole change is the most frequent numerical
chromosome aberration in MDS (Paulsson & Johansson,
2007; Mitelman et al, 2011). However, the prognosis and
Table IV. (Continued)
Overall survival AML transformation
n (%)
Median
survival
(months)
Patients alive
at 5 years (%) P-value n (%)
Time to 25%
probability
(months)
Cumulative probability
of AML evolution
at 2 years (%) P-value
ANC 61 (84�7) 0�064 0�542<1�8 9 109/l 27 (44�3) 20�6 18�5 6 19 18�5� 1�8 9 109/l 34 (55�7) 69�25 23�5 7 23 17�6
Platelet count 63 (87�5) <0�001 0�458<100 9 109/l 22 (34�9) 9�6 9 7 19 27�3� 100 9 109/l 41 (65�1) 69�25 26�8 6 21�6 12�2
Cytopenias 61 (84�7) <0�001 0�239None 12 (19�6) 86�4 25 0 – 0
One 23 (37�7) 69�25 30�4 6 23 21�7Two 17 (27�9) 11�4 11�7 4 19 17�6Three 9 (14�7) 7�8 11�1 3 12�8 33�3
BM blasts 63 (87�5) <0�001 0�394<5% 37 (58�7) 64�2 32�4 3 30�5 5�45–10% 21 (33�3) 10�5 4�8 8 16 33�311–20% 5 (7�9) 7�8 0 2 10�2 40
IPSS risk group 59 (81�9) <0�001 0�013Low 0 (0) 0 0 0 0 0
Intermediate-1 41 (69�5) 69�25 31�7 7 30�5 12�2Intermediate-2 14 (23�7) 8�2 0 5 10�2 35�7High 4 (6�8) 6�5 0 1 7�3 25
WHO 2008 subtype 63 (87�5) <0�001 0�813RCUD 9 (12�7) 34�3 22�2 1 19 11�1RARS 6 (11�1) 86 50 0 0 0
RCMD/RCMD-RS 19 (31�8) 86�4 31�2 2 30�5 5�3RAEB-1 13 (23�7) 9�5 6�6 7 23 46�15RAEB-2 13 (15�9) 9�9 0 3 16 23�1MDS-U 3 (4�8) 64�1 100 0 0 0
AML, acute myeloid leukaemia; ANC, absolute neutrophil count; BM, bone marrow; IPSS, International Prognostic Scoring SystemWHO, World
Health organization; RCUD, refractory cytopenia with unilineage dysplasia; RARS, refractory anaemia with ringed sideroblasts; RCMD, refractory
cytopenia with multilineage dysplasia; RCMD-RS, RCMD with ringed sideroblasts; RAEB, refractory anaemia with excess of blasts; MDS-U, MDS
unclassifiable; tr8, trisomy 8.
Trisomy 8 in MDS
ª 2012 Blackwell Publishing Ltd, British Journal of Haematology 7

clinical impact of this aberration remain unclear (Haase et al,
2007; Paulsson & Johansson, 2007). Our group designed this
study in a large series of patients, in order to clarify the sig-
nificance of trisomy 8 as a sole change in MDS and to
improve the knowledge of the prognostic value of additional
aberrations.
Some previous studies have already analysed the prognos-
tic impact of trisomy 8 as a sole change but all of them
reported a small cohort of MDS with trisomy 8 and inside
an overall MDS cytogenetic analysis (Morel et al, 1993;
Toyama et al, 1993; Sole et al, 2000, 2005; Bernasconi et al,
2007; Haase et al, 2007; Pozdnyakova et al, 2008; Schanz
et al, 2011, 2012). Some reports suggested that isolated
trisomy 8 in MDS had a poor prognosis (Sole et al, 2000;
Bernasconi et al, 2007) and other studies suggested an inter-
mediate prognosis (Greenberg et al, 1997; Sole et al, 2005;
Haase et al, 2007). Our study analysed the largest series of de
novo MDS with trisomy 8, and contrary to other studies, we
excluded CMML and cases in which the blasts ranged
between 20% and 30%.
The incidence of trisomy 8 among cases with abnormal
karyotype was reported to be around 16% in MDS, and
between 5% and 11% as a sole change (Greenberg et al,
1997; Sole et al, 2005; Bernasconi et al, 2007; Haase et al,
2007; Malcovati et al, 2007; Paulsson & Johansson, 2007;
Mitelman et al, 2011; Schanz et al, 2011, 2012). In the GES-
MD registry, trisomy 8 was present in 7% of the overall
series, but only 3�6% fulfilled the inclusion criteria in current
study. When only MDS with abnormal karyotype were analy-
sed, MDS with trisomy 8 represents 13% of them.
Among patients with trisomy 8 included in the present
study more than a half had this aberration as a sole change
(53�7%). Isolated trisomy 8 in MDS was more common over
60 years (88�7%) and twice as many men as women were
found (ratio 2:1) supporting previous reports (Pedersen,
1997; Sole et al, 2005). Most of patients had one or more
cytopenia (80%). Our results were in accordance with the
new proposal for cytogenetic stratification recently published
(Schanz et al, 2012). Both, degree and number of cytopenias
(A)
(B)
Fig 1. Overall survival curves according to defined cytogenetic sub-
groups (tr8, tr8 + 1, tr8 + 2 and tr8 + � 3) by Kaplan–Meier analysis.
(A)
(B)
Fig 2. Overall survival curves according to MDS with normal kar-
yoptype and MDS with trisomy 8 as a single anomaly depending of
bone marrow blasts count by Kaplan–Meier analysis.
S. Saumell et al
8 ª 2012 Blackwell Publishing Ltd, British Journal of Haematology

had impact on OS. Regarding AML risk transformation, our
series did not include enough patients to establish conclu-
sions. The worse prognosis for OS was shown for low platelet
count and higher number of cytopenias. The bad prognosis
of low platelet count had already been described (Kantarjian
et al, 2008), and a recent report indicated that MDS patients
with low or intermediate-1 IPSS risk score and severe
thrombocytopenia (<30 9 109/l) had a very poor prognosis
(Gonzalez-Porras et al, 2011). For MDS with isolated trisomy
8, in our study, there was almost the same number of cases
with <5% bone marrow blasts than with � 5%, with a
shorter survival for patients with � 5% blasts. Using the
WHO 2001 classification (Brunning et al, 2001), Haase et al
(2007) reported that in MDS with trisomy 8 as a sole
anomaly the main groups were RCMD/RCMD-RS and
RAEB-2. The use of the WHO 2008 classification (Brunning
et al, 2008) in the present study identified a similar number
of patients in the RCMD/RCMD-RS, RAEB-1 and RAEB-2
groups. By IPSS cytogenetic prognostic subgroups, MDS with
isolated trisomy 8 was categorized as expected: 69�5% in
intermediate-1, 23�7% in intermediate-2 and 6�8% in high
risk.
Significant differences were seen when the median survival
time of the 1676 MDS with normal karyotype of the GESMD
registry was compared with the 72 MDS with trisomy 8 as a
sole change, with poorest prognosis for patients with trisomy
8 as a single anomaly (88 months vs. 34�3 months;
P = 0�001). This data supports the idea of the negative
impact of trisomy 8 in MDS. Although, trisomy 8 has
been considered an alteration which confers an intermediate
prognosis to MDS (Morel et al, 1993; Greenberg et al, 1997;
Sole et al, 2005; Schanz et al, 2012), some studies have sug-
gested that trisomy 8 confers a worse outcome than other
cytogenetic alterations included in the intermediate IPSS risk
group (Bernasconi et al, 2007). These results could explain
the high incidence of trisomy 8 in cases with RAEB-1 and
RAEB-2. The median OS reported for patients of intermedi-
ate IPSS cytogenetic subgroup ranged between 23 and
32 months, and for patients with trisomy 8 as a sole change
between 11 and 25 months (Greenberg et al, 1997; Sole et al,
2005; Bernasconi et al, 2007; Haase et al, 2007; Schanz et al,
2012). Our results were not in accordance with these data; in
our study the median OS for patients with isolated trisomy 8
was 34�3 months. The worst outcome reported in the previ-
ous studies is explained by the presence of cases with more
than 20% of blasts and CMML. Pozdnyakova et al (2008)
reported an OS of 19 months for de novo MDS with isolated
trisomy 8, but in their series, most of the patients had been
treated with active experimental drugs. This difference was
also maintained for risk of AML evolution. Referring to the
previous reports, the frequency of patients who progress to
AML varied from 8% to 63% (Morel et al, 1993; Sole et al,
2000, 2005; Paulsson et al, 2001; Bernasconi et al, 2007). In
our series 18% of patients diagnosed of MDS with trisomy 8
progressed to AML, and the probability of AML transforma-
tion was 17�7% at 2 years.
The new proposals for cytogenetic categorization have
regarded isolated trisomy 8, like previous IPSS classification,
as an intermediate prognosis alteration (Schanz et al, 2012).
These proposals published a median OS for MDS with +8 of
23 months and a median time to AML transformation of
38�6 months, but they also considered CMML and cases with
more than 20% of blasts (Schanz et al, 2012).
According to our study, MDS patients with isolated tri-
somy 8 should be included in the intermediate cytogenetic
risk group. We observed that patients with <5% bone marrow
blast bearing isolated trisomy 8 had the same prognosis as
patients with <5% blasts and a normal karyotype. However,
when the bone marrow blasts count is � 5%, isolated trisomy
8 implies a worse prognosis than a normal karyotype. This
last finding is the most interesting and relevant result of our
study and should be confirmed in a larger series of patients.
Trisomy 8 in association with other abnormalities
Trisomy 8 occurs in association with other alterations in
around 5% of MDS with abnormal karyotype (Haase et al,
2007; Paulsson & Johansson, 2007; Mitelman et al, 2011).
Based on Mitelman database (Mitelman et al, 2011) the most
common alterations in association to trisomy 8 were �5/del
(5q) often in complex karyotypes, t(1;7)(q10;p10), and del
(20q) mainly in simple karyotypes. In our group of patients
with tr8 + 1, the most common abnormality added to tri-
somy 8 was del(5q) followed by del(11q). Haase et al (2007)
Table V. Results of multivariate analysis of prognostic factors for overall survival in MDS with trisomy 8 as a single anomaly and in the overall
series.
Variable Categories
MDS with + 8 Overall series
Hazard ratio (95% CI) P-value Hazard ratio (95% CI) P-value
Haemoglobin <100 g/l vs. � 100 g/l 2�2 (0�9–5�5) 0�09 1�9 (1�07–3�3) 0�027Platelet count <100 9 109/l vs. � 100 9 109/l 3�4 (1�2–9�1) 0�02 4�3 (2�3–7�9) <0�001BM blasts 5–20% vs. <5% 2�5 (1�2–5�03) 0�01 2�8 (1�5–4�9) <0�001Karyotype complexity tr8 + � 2 vs. tr8 and tr8 + 1 – – 3�2 (1�8–5�7) <0�001Sex Male vs. female 1�8 (0�8–4�5) 0�17 1�6 (0�9–2�8) 0�108Age � 60 years vs. <60 years 2�7 (0�5–15�4) 0�24 2�3 (0�94–5�9) 0�067
MDS, Myelodysplastic syndromes; CI, confidence interval; BM, bone marrow; tr8, trisomy8; +8, isolated trisomy 8.
Trisomy 8 in MDS
ª 2012 Blackwell Publishing Ltd, British Journal of Haematology 9

found a better survival for patients with an additional abnor-
mality to trisomy 8 than for patients with isolated trisomy 8
(median of: 44 months vs. 22 months) Probably, these results
are explained by the high presence of del(5q), but we should
not forget that CMML and >20% of blasts cases were
included in that study. We did not find the same result; in
fact, no difference between median OS of tr8 and tr8 + 1 was
found (P = 0�93). In the tr8 + 2 group, it is interesting that
no specific alteration added to trisomy 8 predominated and
only one patient had del(7q) cytogenetic aberration. Further-
more, the small number of patients in the tr8 + 2 group must
be considered to correctly interpret these results. That conclu-
sion was in accordance with the recently published new pro-
posals for MDS cytogenetic scoring system, which showed a
worse prognosis for MDS with more than three abnormalities
than for cases with three cytogenetic abnormalities (Schanz
et al, 2012). Interestingly, in our series, patients with tr8 + 2
should also be included in the intermediate risk category and
not in the high risk. In the multivariate analyses the prognosis
was poorer for patients with complex karyotype with HR 3�2(tr8 and tr8 + 1 vs. tr8 + 2 and tr8 + � 3). These results
must be confirmed with a larger series.
It is fair to say that most of our cases of trisomy 8 with
other abnormalities had normal metaphases (93%). In MDS
with trisomy 8, Mallo et al (2011) described the finding of
normal metaphases in a smaller series of patients, but these
authors also included cases with additional aberrations in
their analysis. They reported that the percentage of aberrant
metaphases had a clear impact on the outcome in MDS with
trisomy 8, with a shorter survival for cases with clone size of
100% (Mallo et al, 2011). In contrast, we analysed only
patients diagnosed with MDS with isolated trisomy 8, and no
impact was found between cases where all metaphases were
affected or those with some normal ones (P = 0�62).With these data the following conclusions could be estab-
lished: (i) MDS with isolated trisomy 8 is more common in
men, most patients present with one or more cytopenias and
have median bone marrow blasts of 4%, (ii) patients with
<5% bone marrow blasts and isolated trisomy 8 have the
same prognosis as those with <5% and a normal karyotype,
(iii) patients with � 5% bone marrow blast have a shorter
survival if an isolated trisomy 8 is found than if they have a
normal karyotype (iv) isolated trisomy 8 should be consid-
ered in the intermediate cytogenetic risk group, and finally
(v) patients with one or two additional aberrations presented
a similar OS than patients with isolated trisomy 8.
Acknowledgements
The authors thank the participating GESMD groups, as well
as the technicians involved in all cytogenetic laboratories.
Funding
This work was supported in part by grants from Instituto de
Salud Carlos III, Ministerio de Sanidad y Consumo, Spain
(FI07/00107, CA08/00141; PI07/1009 and PI 11/02010); Red
Tematica de Investigacion Cooperativa en Cancer (RTICC,
FEDER) (RD06/0020/0031 and RD07/0020/2004); SGR 541/
2009 (‘Agencia de Gestio d’Ajuts Universitaris i de Recerca’,
Departament d’Innovacio, Universitats i Empresa); Accion
COST BM0801: European Genetic and Epigentic Study on
AML and MDS; and Sociedad Espanola de Hematologıa y
Hemoterapia (SEHH) 2011 fellowship.
Supporting Information
Additional Supporting Information may be found in the
online version of this article:
Fig S1. The most frequent additional cytogenetic aberra-
tions added to trisomy 8 in overall series.
Please note: Wiley-Blackwell are not responsible for the
content or functionality of any supporting materials sup-
plied by the authors. Any queries (other than missing
material) should be directed to the corresponding author
for the article.
References
Bernasconi, P., Klersy, C., Boni, M., Cavigliano, P.
M., Calatroni, S., Giardini, I., Rocca, B., Zappa-
tore, R., Caresana, M., Dambruoso, I., Lazzari-
no, M. & Bernasconi, C. (2007) World Health
Organization classification in combination with
cytogenetic markers improves the prognostic
stratification of patients with de novo primary
myelodysplastic syndromes. British Journal of
Haematology, 137, 193–205.
Brunning, R.D., Bennett, J., Flandrin, G., Matutes,
E., Head, D., Vardiman, J.W. & Harris, N.L.
(2001) Myelodysplastic syndromes. In: Pathol-
ogy and Genetics. Tumours of Haematopoietic
and Lymphoid Tissues (ed. by E.S. Jaffe, N.L.
Harris, H. Stein & J.W. Vardiman.), pp. 61–73.
IARC, Lyon.
Brunning, R.D., Orazi, A., Germing, U., Le Beau,
M.M., Porwit, A. & Baumann, I. (2008) Myelo-
dysplastic syndromes. In: WHO Classification of
Tumours of Haematopoietic and Lymphoid Tis-
sues (ed. by S.H. Swerdlow, E. Campo, N. Lee
Harris, E.S. Jaffe, S.A. Pieri & H. Stein), pp.
87–107. IARC, Lyon.
Chun, K., Hagemeijer, A., Iqbal, A. & Slovak, M.L.
(2010) Implementation of standardized interna-
tional karyotype scoring practices is needed to
provide uniform and systematic evaluation for
patients with myelodysplastic syndrome using
IPSS criteria: an International Working Group
on MDS Cytogenetics Study. Leukemia Research,
34, 160–165.
Cox, D.R. (1972) Regression models and life-
tables. Journal of the Royal Statistical Society.
Series B, Statistical Methodology, 34, 187–220.
Gonzalez-Porras, J.R., Cordoba, I., Such, E., Nom-
dedeu, B., Vallespi, T., Carbonell, F., Luno, E.,
Ardanaz, M., Ramos, F., Pedro, C., Gomez, V.,
de Paz, R., Sanchez-Barba, M., Sanz, G.F. & Del
Canizo, A.C. (2011) Prognostic impact of severe
thrombocytopenia in low-risk myelodysplastic
syndrome. Cancer, 117, 5529–5537.
Greenberg, P., Cox, C., LeBeau, M.M., Fenaux, P.,
Morel, P., Sanz, G., Sanz, M., Vallespi, T., Ham-
blin, T., Oscier, D., Ohyashiki, K., Toyama, K.,
Aul, C., Mufti, G. & Bennett, J. (1997) Interna-
tional scoring system for evaluating prognosis in
myelodysplastic syndromes. Blood, 89, 2079–2088.
Haase, D., Germing, U., Schanz, J., Pfeilstocker, M.,
Nosslinger, T., Hildebrandt, B., Kundgen, A.,
Lubbert, M., Kunzmann, R., Giagounidis, A.A.,
Aul, C., Trumper, L., Krieger, O., Stauder, R.,
Muller, T.H., Wimazal, F., Valent, P., Fonatsch,
S. Saumell et al
10 ª 2012 Blackwell Publishing Ltd, British Journal of Haematology

C. & Steidl, C. (2007) New insights into the
prognostic impact of the karyotype in MDS and
correlation with subtypes: evidence from a core
dataset of 2124 patients. Blood, 110, 4385–4395.
Kantarjian, H., O’Brien, S., Ravandi, F., Cortes, J.,
Shan, J., Bennett, J.M., List, A., Fenaux, P., Sanz,
G., Issa, J.P., Freireich, E.J. & Garcia-Manero, G.
(2008) Proposal for a new risk model in myelo-
dysplastic syndrome that accounts for events
not considered in the original International
Prognostic Scoring System. Cancer, 113, 1351–
1361.
Kaplan, E. & Meier, P. (1958) Nonparametric
estimation from incomplete observations.
Journal of American Statistical Association, 53,
457–481.
Malcovati, L., Germing, U., Kuendgen, A., Della
Porta, M.G., Pascutto, C., Invernizzi, R., Giago-
unidis, A., Hildebrandt, B., Bernasconi, P.,
Knipp, S., Strupp, C., Lazzarino, M., Aul, C. &
Cazzola, M. (2007) Time-dependent prognostic
scoring system for predicting survival and leuke-
mic evolution in myelodysplastic syndromes.
Journal of Clinical Oncology, 25, 3503–3510.
Mallo, M., Luno, E., Sanzo, C., Cervera, J., Haase,
D., Schanz, J., Garcia-Manero, G., del Canizo,
C., Sanz, G.F. & Sole, F. (2011) Clinical impact
of the clone size in MDS cases with monosomy
7 or 7q deletion, trisomy 8, 20q deletion and
loss of Y chromosome. Leukemia Research, 35,
834–836.
Mantel, N. (1966) Evaluation of survival data and
two new rank order statistics arising in its con-
sideration. Cancer Chemotherapy Reports, 50,
163–170.
Mitelman, F., Johansson, B. & Mertens, F.E.
(2011) Mitelman Database of Chromosome
Aberrations and Gene Fusions in Cancer. http://
cgap.nci.nih.gov/Chromosomes/Mitelman.
Morel, P., Hebbar, M., Lai, J.L., Duhamel, A., Pre-
udhomme, C., Wattel, E., Bauters, F. & Fenaux, P.
(1993) Cytogenetic analysis has strong indepen-
dent prognostic value in de novo myelodysplastic
syndromes and can be incorporated in a new scor-
ing system: a report on 408 cases. Leukemia, 7,
1315–1323.
Nowell, P.C. & Besa, E.C. (1989) Prognostic signif-
icance of single chromosome abnormalities in
preleukemic states. Cancer Genetics and Cytoge-
netics, 42, 1–7.
Paulsson, K. & Johansson, B. (2007) Trisomy 8 as
the sole chromosomal aberration in acute mye-
loid leukemia and myelodysplastic syndromes.
Pathologie Biologie, 55, 37–48.
Paulsson, K., Sall, T., Fioretos, T., Mitelman, F. & Jo-
hansson, B. (2001) The incidence of trisomy 8 as a
sole chromosomal aberration in myeloid malig-
nancies varies in relation to gender, age, prior iat-
rogenic genotoxic exposure, and morphology.
Cancer Genetics and Cytogenetics, 130, 160–165.
Pedersen, B. (1997) MDS and AML with trisomy 8
as the sole chromosome aberration show differ-
ent sex ratios and prognostic profiles: a study of
115 published cases. American Journal of Hema-
tology, 56, 224–229.
Peto, R., Pike, M.C., Armitage, P., Breslow, N.E.,
Cox, D.R., Howard, S.V., Mantel, N., McPherson,
K., Peto, J. & Smith, P.G. (1976) Design and analy-
sis of randomized clinical trials requiring pro-
longed observation of each patient. I. Introduction
and design. British Journal of Cancer, 34, 585–612.
Pozdnyakova, O., Miron, P.M., Tang, G., Walter,
O., Raza, A., Woda, B. & Wang, S.A. (2008)
Cytogenetic abnormalities in a series of 1,029
patients with primary myelodysplastic syn-
dromes: a report from the US with a focus on
some undefined single chromosomal abnormali-
ties. Cancer, 113, 3331–3340.
Schanz, J., Steidl, C., Fonatsch, C., Pfeilstocker,
M., Nosslinger, T., Tuechler, H., Valent, P., Hil-
debrandt, B., Giagounidis, A., Aul, C., Lubbert,
M., Stauder, R., Krieger, O., Garcia-Manero, G.,
Kantarjian, H., Germing, U., Haase, D. & Estey,
E. (2011) Coalesced multicentric analysis of
2,351 patients with myelodysplastic syndromes
indicates an underestimation of poor-risk cyto-
genetics of myelodysplastic syndromes in the
international prognostic scoring system. Journal
of Clinical Oncology, 29, 1963–1970.
Schanz, J., Tuchler, H., Sole, F., Mallo, M., Luno,
E., Cervera, J., Granada, I., Hildebrandt, B., Slo-
vak, M.L., Ohyashiki, K., Steidl, C., Fonatsch,
C., Pfeilstocker, M., Nosslinger, T., Valent, P.,
Giagounidis, A., Aul, C., Lubbert, M., Stauder,
R., Krieger, O., Garcia-Manero, G., Faderl, S.,
Pierce, S., Le Beau, M.M., Bennett, J.M., Green-
berg, P., Germing, U. & Haase, D. (2012) New
comprehensive cytogenetic scoring system for
primary Myelodysplastic syndromes (MDS) and
oligoblastic acute myeloid leukemia after MDS
derived from an international database merge.
Journal of Clinical Oncology, 30, 820–829.
Shaffer, L.G., Slovak, M.L. & Campbell, L.J. (2009)
ISCN 2009: An International System for Human
Cytogenetic Nomenclature. Recommendations
of the International Standing Committee on
Human Cytogenetic Nomenclature. S. Karger
AG, Basel, Switzerland.
Sole, F., Prieto, F., Badia, L., Woessner, S., Florensa,
L., Caballin, M.R., Coll, M.D., Besses, C. & Sans-
Sabrafen, J. (1992) Cytogenetic studies in 112
cases of untreated myelodysplastic syndromes.
Cancer Genetics and Cytogenetics, 64, 12–20.
Sole, F., Espinet, B., Sanz, G.F., Cervera, J., Cala-
sanz, M.J., Luno, E., Prieto, F., Granada, I., Her-
nandez, J.M., Cigudosa, J.C., Diez, J.L., Bureo,
E., Marques, M.L., Arranz, E., Rios, R., Martinez
Climent, J.A., Vallespi, T., Florensa, L. & Woess-
ner, S. (2000) Incidence, characterization and
prognostic significance of chromosomal abnor-
malities in 640 patients with primary myelodys-
plastic syndromes. Grupo Cooperativo Espanol
de Citogenetica Hematologica. British Journal of
Haematology, 108, 346–356.
Sole, F., Luno, E., Sanzo, C., Espinet, B., Sanz, G.
F., Cervera, J., Calasanz, M.J., Cigudosa, J.C.,
Milla, F., Ribera, J.M., Bureo, E., Marquez, M.
L., Arranz, E. & Florensa, L. (2005) Identifica-
tion of novel cytogenetic markers with prognos-
tic significance in a series of 968 patients with
primary myelodysplastic syndromes. Haemato-
logica, 90, 1168–1178.
Tefferi, A. & Vardiman, J.W. (2009) Myelodysplas-
tic syndromes. New England Journal of Medicine,
361, 1872–1885.
Toyama, K., Ohyashiki, K., Yoshida, Y., Abe, T.,
Asano, S., Hirai, H., Hirashima, K., Hotta, T.,
Kuramoto, A., Kuriya, S., Miyazaki, T., Kakishita,
E., Mizoguchi, H., Okada, M., Shirakawa, S.,
Takaku, F., Tomonaga, M., Uchino, H., Yasu-
naga, K. & Nomura, T. (1993) Clinical implica-
tions of chromosomal abnormalities in 401
patients with myelodysplastic syndromes: a
multicentric study in Japan. Leukemia, 7, 499–
508.
Valent, P., Horny, H.P., Bennett, J.M., Fonatsch,
C., Germing, U., Greenberg, P., Haferlach, T.,
Haase, D., Kolb, H.J., Krieger, O., Loken, M.,
van de, L.A., Ogata, K., Orfao, A., Pfeilstocker,
M., Ruter, B., Sperr, W.R., Stauder, R. & Wells,
D.A. (2007) Definitions and standards in the
diagnosis and treatment of the myelodysplastic
syndromes: consensus statements and report
from a working conference. Leukemia Research,
31, 727–736.
Yunis, J.J., Lobell, M., Arnesen, M.A., Oken, M.M.,
Mayer, M.G., Rydell, R.E. & Brunning, R.D.
(1988) Refined chromosome study helps define
prognostic subgroups in most patients with
primary myelodysplastic syndrome and acute
myelogenous leukaemia. British Journal of Hae-
matology, 68, 189–194.
Trisomy 8 in MDS
ª 2012 Blackwell Publishing Ltd, British Journal of Haematology 11


