Embed Size (px)
Citation preview
PROGRESSIVE COLLAPSE OF RC CONTINUOUS FRAMED BEAM SYSTEMS
KEYWORDS: Continuous beam, ductility, failure, progressive collapse, reinforced concrete, strength. ABSTRACT An experimental investigation is conducted in order to study the effect of reinforcement detailing on the progressive collapse phenomenon for reinforced concrete continuous beam system. Nine specimens divided into four groups were considered. The first group represented two-equal spans beam of a weak intermediate column. The second, third, and fourth groups represented three equal spans beams with different locations of the weak column(s). All groups included the original detailing of reinforcement that designed according to gravity loads only and detailed according to the traditional method along with the suggested detailing in order to mitigate the effect of sudden progressive collapse due to failure of the supporting weak column(s) as well. All specimens were subjected to incrementally monotonic static loading which was concentrated around the mid-point of each span. All responses such as mode of failure, deflections and strains on reinforcement were measured and analyzed. The experimental results showed that the configuration of the reinforcement detailing could change the mode of failure after the occurring of the complete collapse of the weak column(s). Finally, based on the observed mode of failure, reinforcement detailing was suggested for non-seismic regions in order to mitigate the effect of progressive collapse. INTRODUCTION Progressive collapse can be defined as a chain reaction of failures that propagates throughout a portion of the structure disproportionate to the original local failure (Baldridge & Humay 2003). In other words, progressive collapse is a phenomenon in which an initial local failure spreads from element to element and eventually results in the collapse of the entire structure. The progressive collapse first drew the attention of structural engineers after the accidental collapse of the 22-story Ronan Point apartment tower in Canning Town, UK on May 16, 1968 (Griffiths et al., 1968). The cause of the collapse was a human-error gas explosion that knocked out the precast concrete panels near the corner of the 18th floor. The failure of that support caused the floors above to collapse. Since then, building codes in many countries have been updated to include additional regulations with an aim to prevent this type of progressive collapse behavior. Following nearly three decades of relatively few developments on progressive collapse issues, another case of progressive collapse failure of a structure occurred in Oklahoma City, USA on April 19, 1995. The Alfred P. Murrah Federal Building was destroyed by an explosion of a truck bomb knocking out three columns at their base level which then triggered the progressive collapse of the entire building (Otani 2007). The world was shocked once again when the World Trade Center in New York City, USA was struck by jetliners on September 11, 2001, which caused the two towers to collapse (Wibowo & Lau 2009). These three events can be considered milestones in the development of codes and standards to prevent progressive collapse of buildings. Accordingly, additional design requirements have to be incorporated without substantial increases in the cost of the structural system. The structural designers should use their creativity to find out cost-effective solutions that will make buildings more resilient to both natural and man-made hazards. That can be achieved by choosing structural systems which can address at the same time the requirements of progressive collapse,
Dr. Hamdy Mohy El-Din Afefy Tanta University
Structural Engineering Dept. Faculty of Engineering,
Egypt [email protected]
seismic and wind loads in addition to the gravity loads. Hence, the lateral load resisting system should be “double duty” simultaneously addressing both the lateral and progressive collapse requirements. The philosophy of designing the structure to withstand the progressive collapse is to limit the damage rather than eliminate it altogether which is similar to the concept adopted in modern earthquake resistant design codes (Baldridge & Humay 2003). In general, to prevent progressive collapse, structures should be designed and detailed with an adequate level of continuity, redundancy, and ductility so that alternative load paths can be developed following the loss of an individual member. These are characteristics desired in seismic design as well. In order to withstand abnormal loading that can cause progressive collapse, there are several characteristics in the structural design and layout of a structure that can have significant influence on its collapse resistance. These structural characteristics are summarized as follows (Ioani et al., 2007):
• Robustness is the structural ability to survive the event of local failure. A robust structure can withstand the loading so it will not cause any disproportionate damage.
• Integrity is the condition where the structural members remain connected together even after the presence of abnormal events.
• Continuity is the interconnection of structural elements in a structural system. In reinforced concrete building design codes and standards, continuity is also a term used to express the continuous steel reinforcement detailing.
• Ductility is the structural ability to sustain additional deformation after the yield condition. • Redundancy is the capacity of other structural members to carry extra load in case other members fail
or collapse. This implies if there is a failure in one of the elements, other elements and the remaining structural system as a whole can still withstand the load.
Youpo et al., (2009) carried out an experimental study in order to investigate the gravity load-carrying capacity of reinforced concrete frame beams when a supporting column was removed due to abnormal loading events. The tests confirmed the strength enhancement effect of compressive arch action on beam flexural capacity. More recently, Tian and Youpo (2011) investigated experimentally the dynamic response of reinforced concrete beams subjected to the instantaneous removal of a supporting column. Hence, the load-carrying capacity and dynamic impact on forces were examined. On the other hand, Kulkarni and Joshi (2011) carried out numerical linear and nonlinear numerical analysis in order to study the demand capacity ratio for progressive collapse analysis of reinforced concrete twelve storey framed structure. Comparison between linear static and nonlinear static analysis revealed that hinge formation started from the location having maximum demand capacity ratio calculated from static analysis. In the sequel, Yuan and Tan (2011) proposed a simple mechanical model in order to demonstrate qualitatively the progressive collapse of multi-storey structures based on mass-spring-damper system. Many international standards such as the National Building Code of Canada (NBCC 2005) and American Concrete Institute’s Building Code Requirements for Structural Concrete (ACI 318-11) rely on structural integrity requirements to prevent progressive collapse of structures. That is based on the assumption that improving redundancy and ductility by good detailing in reinforcements can help to localize the damage so that it will not propagate to other members. Thus, the overall stability of the structure can still be satisfied. In general, tie force, alternative load path, integrity provisions, and specific local load resistance are recommended as feasible measures for reducing the vulnerability of building structures to progressive collapse (Ellingwood and Leyendecker 1978, Abruzzo et al. 2006, Ellingwood 2006, Nair 2006, Tasi and You 2012). Detailed step-by-step analysis procedures of these methods have been issued by US General Service Administration (GSA) (2003), Progressive Collapse Analysis and Design Guidelines for New Federal Office Buildings and Major Modernization Projects, dating from June 2003, and recommended in the Unified Facilities Criteria UFC 4-023-03 by the Department of Defense (DoD) (2005, 2009). In the current research, the integrity provision is selected in order to mitigate the effect of the progressive collapse.
It is worth mentioning that the natural hazards such as earthquakes, wind gusts and floods can also trigger the progressive collapse. Earthquake loading can generate strong lateral forces and stress reversals. These load effects can overload structural members which result in the loss of one or more load-carrying members, which may then lead to failure of additional members in other parts of the system and propagate through the entire system due to the progressive collapse effect. The target of the current research work is to investigate experimentally the effect of reinforcement detailing on the performance of reinforced concrete continuous beams due to progressive collapse phenomenon. The progressive collapse of the continuous beams is triggered by the collapse of weak columns supports. Based on the observed mode of failure for such beams, reinforcements detailing are proposed in order to mitigate the effect progressive collapse, if happened for reinforced concrete structures located in non-seismic regions. EXPERIMENTAL WORK PROGRAM
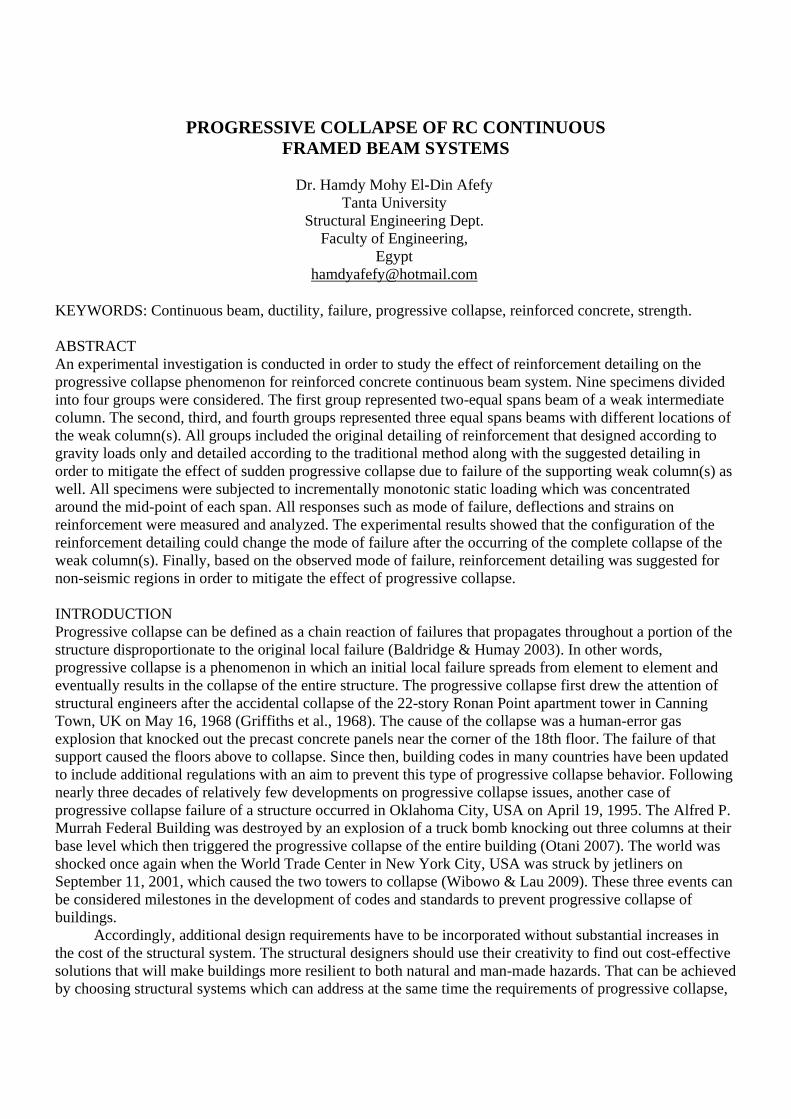
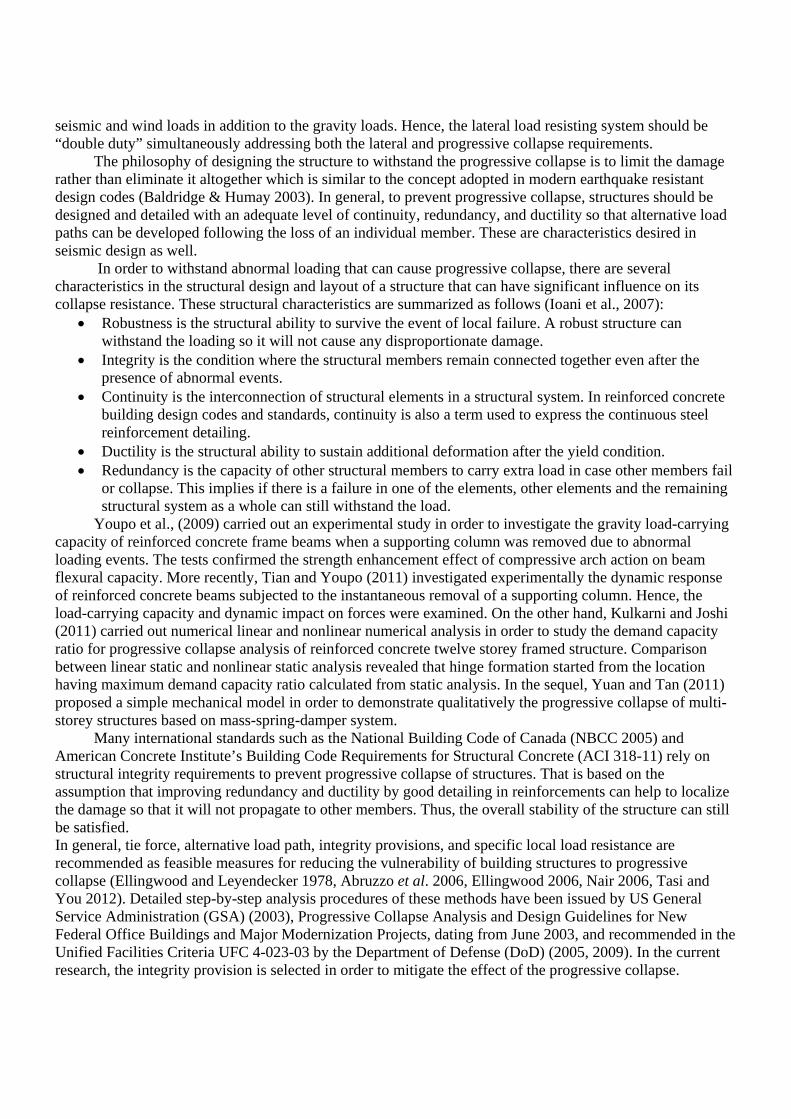
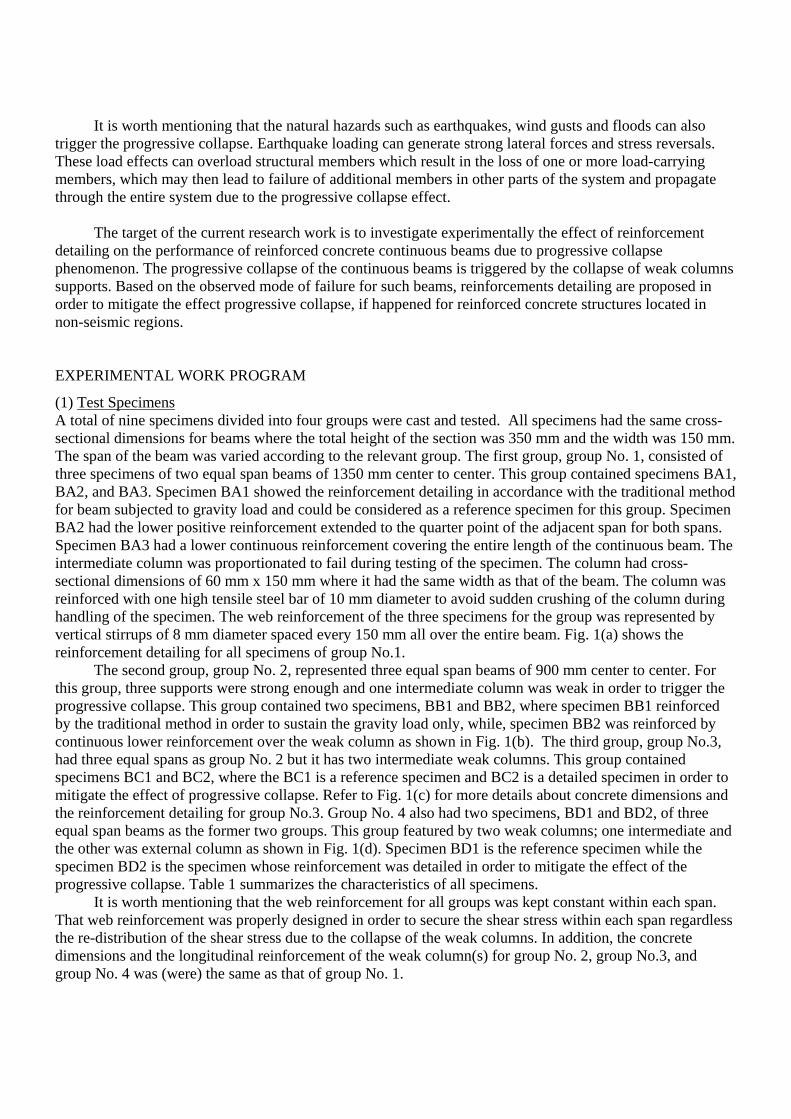
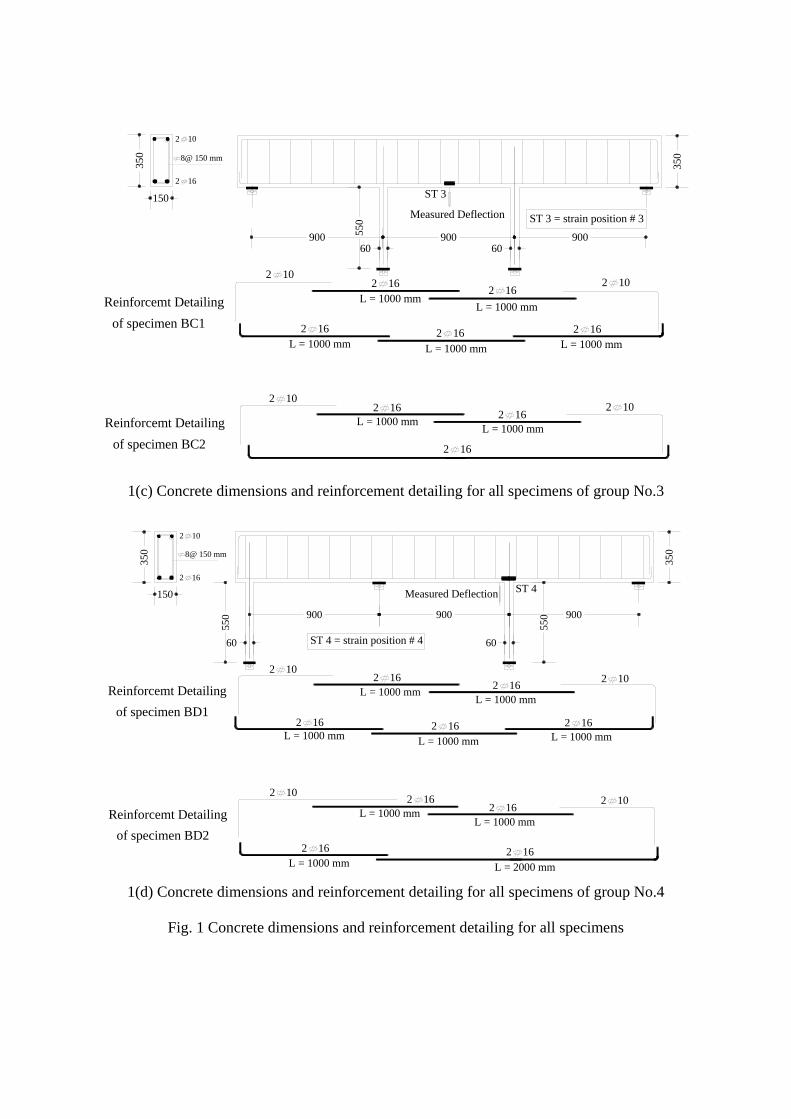
(1) Test Specimens A total of nine specimens divided into four groups were cast and tested. All specimens had the same cross-sectional dimensions for beams where the total height of the section was 350 mm and the width was 150 mm. The span of the beam was varied according to the relevant group. The first group, group No. 1, consisted of three specimens of two equal span beams of 1350 mm center to center. This group contained specimens BA1, BA2, and BA3. Specimen BA1 showed the reinforcement detailing in accordance with the traditional method for beam subjected to gravity load and could be considered as a reference specimen for this group. Specimen BA2 had the lower positive reinforcement extended to the quarter point of the adjacent span for both spans. Specimen BA3 had a lower continuous reinforcement covering the entire length of the continuous beam. The intermediate column was proportionated to fail during testing of the specimen. The column had cross-sectional dimensions of 60 mm x 150 mm where it had the same width as that of the beam. The column was reinforced with one high tensile steel bar of 10 mm diameter to avoid sudden crushing of the column during handling of the specimen. The web reinforcement of the three specimens for the group was represented by vertical stirrups of 8 mm diameter spaced every 150 mm all over the entire beam. Fig. 1(a) shows the reinforcement detailing for all specimens of group No.1. The second group, group No. 2, represented three equal span beams of 900 mm center to center. For this group, three supports were strong enough and one intermediate column was weak in order to trigger the progressive collapse. This group contained two specimens, BB1 and BB2, where specimen BB1 reinforced by the traditional method in order to sustain the gravity load only, while, specimen BB2 was reinforced by continuous lower reinforcement over the weak column as shown in Fig. 1(b). The third group, group No.3, had three equal spans as group No. 2 but it has two intermediate weak columns. This group contained specimens BC1 and BC2, where the BC1 is a reference specimen and BC2 is a detailed specimen in order to mitigate the effect of progressive collapse. Refer to Fig. 1(c) for more details about concrete dimensions and the reinforcement detailing for group No.3. Group No. 4 also had two specimens, BD1 and BD2, of three equal span beams as the former two groups. This group featured by two weak columns; one intermediate and the other was external column as shown in Fig. 1(d). Specimen BD1 is the reference specimen while the specimen BD2 is the specimen whose reinforcement was detailed in order to mitigate the effect of the progressive collapse. Table 1 summarizes the characteristics of all specimens. It is worth mentioning that the web reinforcement for all groups was kept constant within each span. That web reinforcement was properly designed in order to secure the shear stress within each span regardless the re-distribution of the shear stress due to the collapse of the weak columns. In addition, the concrete dimensions and the longitudinal reinforcement of the weak column(s) for group No. 2, group No.3, and group No. 4 was (were) the same as that of group No. 1.
15035
0
350
550
60
1450 1450
2 10
2 16
13501350
2 10 2 16
2 10
2 10
2 10
2 10
2 10
2 16 2 16
2 16 2 16
2 16
L = 1000 mm
2 16 L = 1000 mm
2 16 L = 1000 mm
L = 1500 mm L = 1500 mm
L = 2000 mm L = 2000 mm
Reinforcemt Detailingof specimen BA1
Reinforcemt Detailingof specimen BA2
Reinforcemt Detailingof specimen BA3
8@ 150 mm
ST 1
ST 1= strain position #1
Measured Deflection
1(a) Concrete dimensions and reinforcement detailing for all specimens of group No.1
350
900900900 100100
2 16 L = 1000 mm
2 16 L = 1000 mm
2 16 L = 1000 mm
2 16 L = 1000 mm
2 16 L = 1000 mm
2 16 L = 1000 mm
2 16 L = 1000 mm
2 16 L = 2000 mm
2 16 L = 1000 mm
2 10
2 10
2 10
2 10
Reinforcemt Detailingof specimen BB1
Reinforcemt Detailingof specimen BB2
150
350
2 10
2 16
8@ 150 mm
60
550
ST 2
ST 2= strain position #2 Measured Deflection
1(b) Concrete dimensions and reinforcement detailing for all specimens of group No.2
350
900900900
2 16 L = 1000 mm
2 16 L = 1000 mm
2 16 L = 1000 mm
2 16 L = 1000 mm
2 16 L = 1000 mm
2 10 2 10
2 16
2 16 L = 1000 mm
2 16 L = 1000 mm
2 10 2 10
Reinforcemt Detailingof specimen BC1
Reinforcemt Detailingof specimen BC2
150
350
2 10
2 16
8@ 150 mm
550
6060
ST 3
ST 3 = strain position # 3Measured Deflection
1(c) Concrete dimensions and reinforcement detailing for all specimens of group No.3
350
900900900
2 16 L = 1000 mm
2 16 L = 1000 mm
2 16 L = 1000 mm
2 16 L = 1000 mm
2 16 L = 1000 mm
2 10 2 10
2 16 L = 1000 mm
2 16 L = 1000 mm
2 10 2 10
2 16 L = 2000 mm
2 16 L = 1000 mm
Reinforcemt Detailingof specimen BD1
Reinforcemt Detailingof specimen BD2
150
350
2 10
2 16
8@ 150 mm 55
0
550
6060
ST 4
ST 4 = strain position # 4
Measured Deflection
1(d) Concrete dimensions and reinforcement detailing for all specimens of group No.4
Fig. 1 Concrete dimensions and reinforcement detailing for all specimens
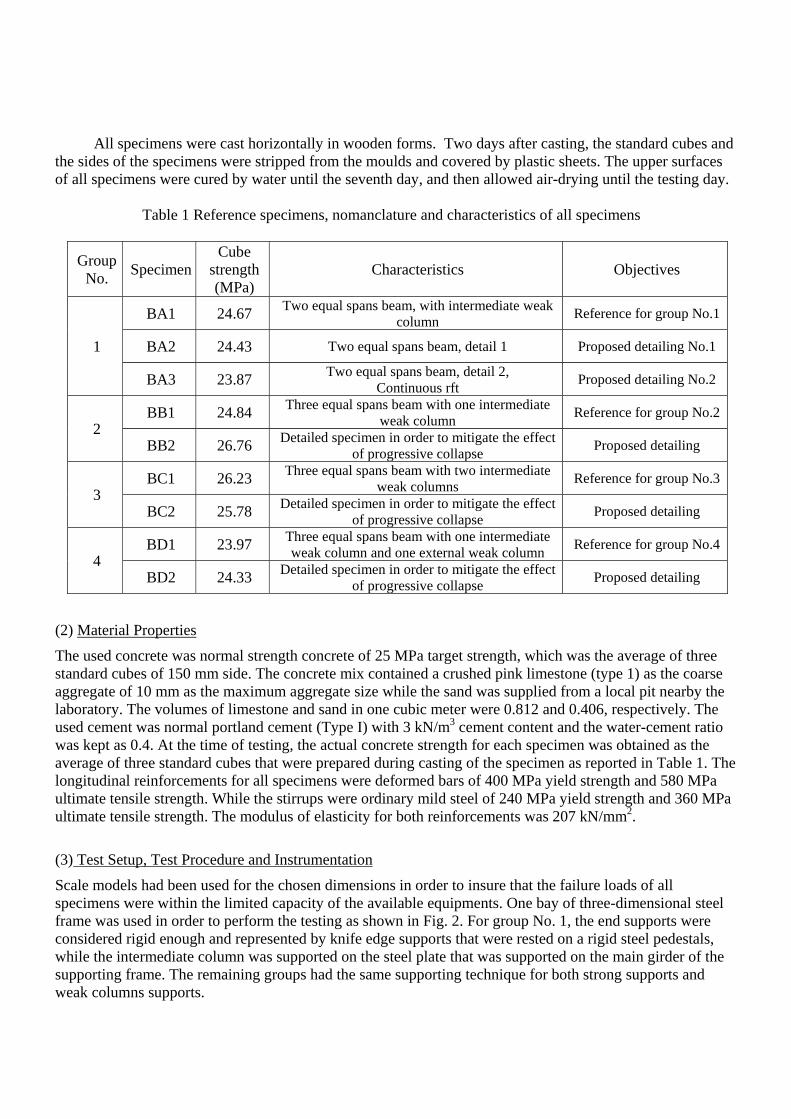
All specimens were cast horizontally in wooden forms. Two days after casting, the standard cubes and the sides of the specimens were stripped from the moulds and covered by plastic sheets. The upper surfaces of all specimens were cured by water until the seventh day, and then allowed air-drying until the testing day.
Table 1 Reference specimens, nomanclature and characteristics of all specimens
Group No. Specimen
Cube strength (MPa)
Characteristics Objectives
1
BA1 24.67 Two equal spans beam, with intermediate weak column Reference for group No.1
BA2 24.43 Two equal spans beam, detail 1 Proposed detailing No.1
BA3 23.87 Two equal spans beam, detail 2,Continuous rft Proposed detailing No.2
2 BB1 24.84 Three equal spans beam with one intermediate
weak column Reference for group No.2
BB2 26.76 Detailed specimen in order to mitigate the effect of progressive collapse Proposed detailing
3 BC1 26.23 Three equal spans beam with two intermediate
weak columns Reference for group No.3
BC2 25.78 Detailed specimen in order to mitigate the effect of progressive collapse Proposed detailing
4 BD1 23.97 Three equal spans beam with one intermediate
weak column and one external weak column Reference for group No.4
BD2 24.33 Detailed specimen in order to mitigate the effect of progressive collapse Proposed detailing
(2) Material Properties
The used concrete was normal strength concrete of 25 MPa target strength, which was the average of three standard cubes of 150 mm side. The concrete mix contained a crushed pink limestone (type 1) as the coarse aggregate of 10 mm as the maximum aggregate size while the sand was supplied from a local pit nearby the laboratory. The volumes of limestone and sand in one cubic meter were 0.812 and 0.406, respectively. The used cement was normal portland cement (Type I) with 3 kN/m3 cement content and the water-cement ratio was kept as 0.4. At the time of testing, the actual concrete strength for each specimen was obtained as the average of three standard cubes that were prepared during casting of the specimen as reported in Table 1. The longitudinal reinforcements for all specimens were deformed bars of 400 MPa yield strength and 580 MPa ultimate tensile strength. While the stirrups were ordinary mild steel of 240 MPa yield strength and 360 MPa ultimate tensile strength. The modulus of elasticity for both reinforcements was 207 kN/mm2.
(3) Test Setup, Test Procedure and Instrumentation
Scale models had been used for the chosen dimensions in order to insure that the failure loads of all specimens were within the limited capacity of the available equipments. One bay of three-dimensional steel frame was used in order to perform the testing as shown in Fig. 2. For group No. 1, the end supports were considered rigid enough and represented by knife edge supports that were rested on a rigid steel pedestals, while the intermediate column was supported on the steel plate that was supported on the main girder of the supporting frame. The remaining groups had the same supporting technique for both strong supports and weak columns supports.
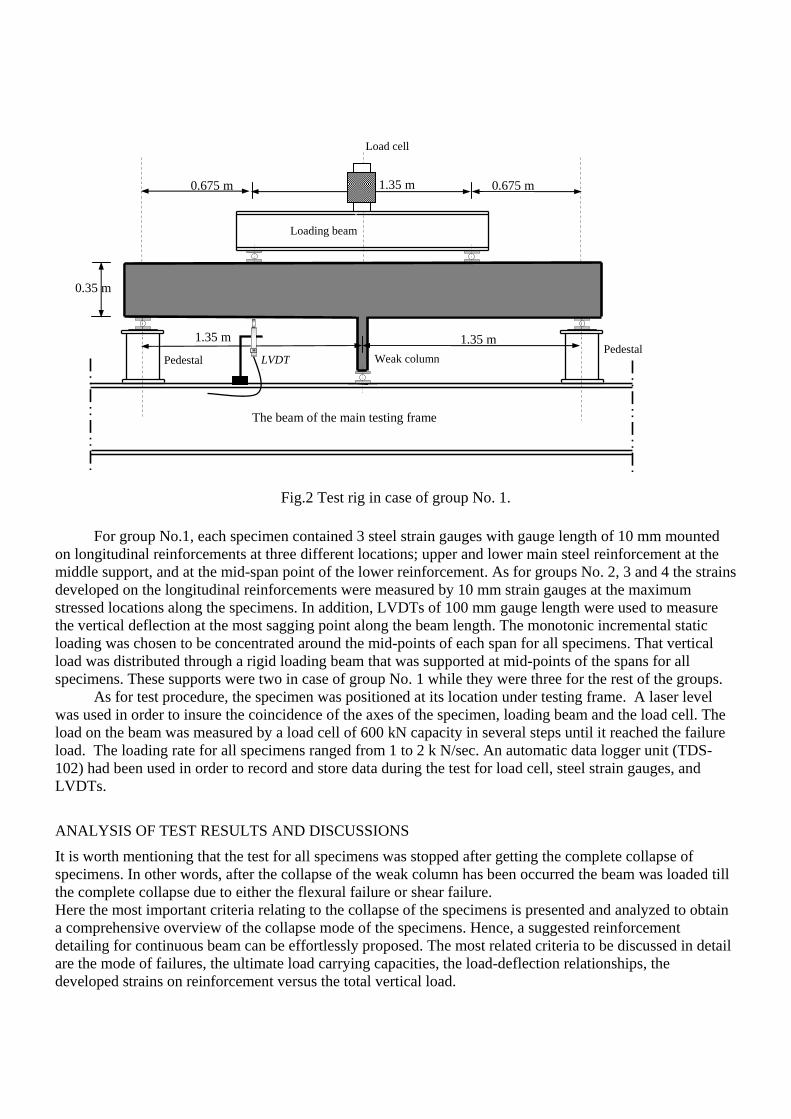
Fig.2 Test rig in case of group No. 1. For group No.1, each specimen contained 3 steel strain gauges with gauge length of 10 mm mounted on longitudinal reinforcements at three different locations; upper and lower main steel reinforcement at the middle support, and at the mid-span point of the lower reinforcement. As for groups No. 2, 3 and 4 the strains developed on the longitudinal reinforcements were measured by 10 mm strain gauges at the maximum stressed locations along the specimens. In addition, LVDTs of 100 mm gauge length were used to measure the vertical deflection at the most sagging point along the beam length. The monotonic incremental static loading was chosen to be concentrated around the mid-points of each span for all specimens. That vertical load was distributed through a rigid loading beam that was supported at mid-points of the spans for all specimens. These supports were two in case of group No. 1 while they were three for the rest of the groups. As for test procedure, the specimen was positioned at its location under testing frame. A laser level was used in order to insure the coincidence of the axes of the specimen, loading beam and the load cell. The load on the beam was measured by a load cell of 600 kN capacity in several steps until it reached the failure load. The loading rate for all specimens ranged from 1 to 2 k N/sec. An automatic data logger unit (TDS-102) had been used in order to record and store data during the test for load cell, steel strain gauges, and LVDTs.
ANALYSIS OF TEST RESULTS AND DISCUSSIONS
It is worth mentioning that the test for all specimens was stopped after getting the complete collapse of specimens. In other words, after the collapse of the weak column has been occurred the beam was loaded till the complete collapse due to either the flexural failure or shear failure. Here the most important criteria relating to the collapse of the specimens is presented and analyzed to obtain a comprehensive overview of the collapse mode of the specimens. Hence, a suggested reinforcement detailing for continuous beam can be effortlessly proposed. The most related criteria to be discussed in detail are the mode of failures, the ultimate load carrying capacities, the load-deflection relationships, the developed strains on reinforcement versus the total vertical load.
0.675 m
1.35 m 1.35 m
0.35 m
1.35 m 0.675 m
Load cell
Loading beam
PedestalPedestal Weak column
Specimen of group No. 1
LVDT b
The beam of the main testing frame
(1) Failure Modes
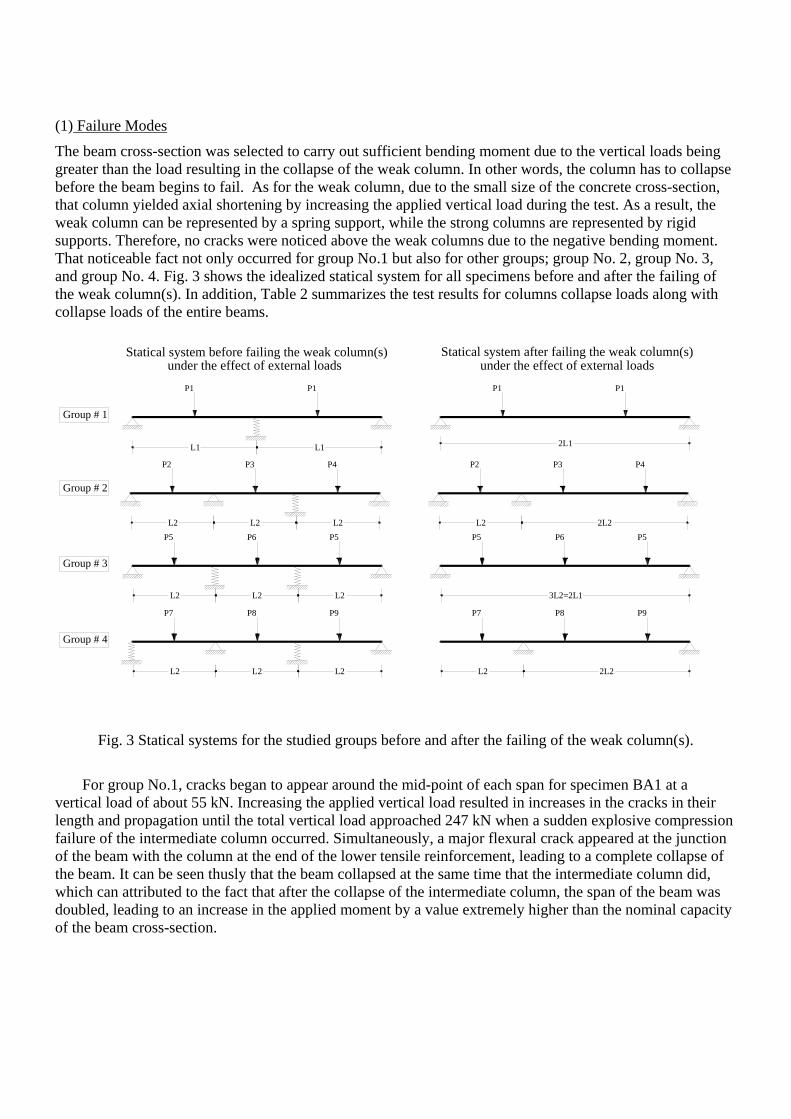
The beam cross-section was selected to carry out sufficient bending moment due to the vertical loads being greater than the load resulting in the collapse of the weak column. In other words, the column has to collapse before the beam begins to fail. As for the weak column, due to the small size of the concrete cross-section, that column yielded axial shortening by increasing the applied vertical load during the test. As a result, the weak column can be represented by a spring support, while the strong columns are represented by rigid supports. Therefore, no cracks were noticed above the weak columns due to the negative bending moment. That noticeable fact not only occurred for group No.1 but also for other groups; group No. 2, group No. 3, and group No. 4. Fig. 3 shows the idealized statical system for all specimens before and after the failing of the weak column(s). In addition, Table 2 summarizes the test results for columns collapse loads along with collapse loads of the entire beams.
L1 L1 2L1
L2 L2 L2
L2 L2 L2
L2 L2 L2
L2 2L2
3L2=2L1
L2 2L2
Group # 1
Group # 2
Group # 3
Group # 4
Statical system before failing the weak column(s) Statical system after failing the weak column(s)
P1 P1
P2 P3 P4 P2 P3 P4
P5 P6 P5 P5 P6 P5
P7 P8 P9 P7 P8 P9
P1 P1
under the effect of external loads under the effect of external loads
Fig. 3 Statical systems for the studied groups before and after the failing of the weak column(s).
For group No.1, cracks began to appear around the mid-point of each span for specimen BA1 at a vertical load of about 55 kN. Increasing the applied vertical load resulted in increases in the cracks in their length and propagation until the total vertical load approached 247 kN when a sudden explosive compression failure of the intermediate column occurred. Simultaneously, a major flexural crack appeared at the junction of the beam with the column at the end of the lower tensile reinforcement, leading to a complete collapse of the beam. It can be seen thusly that the beam collapsed at the same time that the intermediate column did, which can attributed to the fact that after the collapse of the intermediate column, the span of the beam was doubled, leading to an increase in the applied moment by a value extremely higher than the nominal capacity of the beam cross-section.
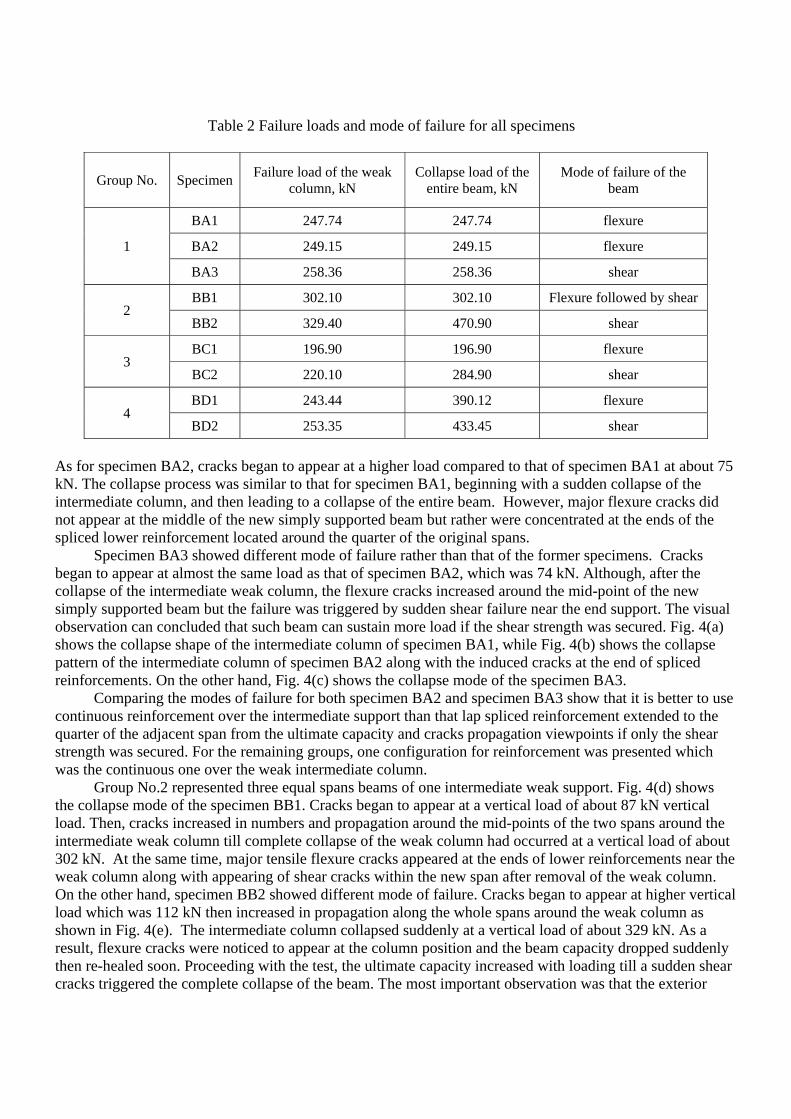
Table 2 Failure loads and mode of failure for all specimens
Group No. Specimen Failure load of the weak column, kN
Collapse load of the entire beam, kN
Mode of failure of the beam
1
BA1 247.74 247.74 flexure
BA2 249.15 249.15 flexure
BA3 258.36 258.36 shear
2 BB1 302.10 302.10 Flexure followed by shear
BB2 329.40 470.90 shear
3 BC1 196.90 196.90 flexure
BC2 220.10 284.90 shear
4 BD1 243.44 390.12 flexure
BD2 253.35 433.45 shear As for specimen BA2, cracks began to appear at a higher load compared to that of specimen BA1 at about 75 kN. The collapse process was similar to that for specimen BA1, beginning with a sudden collapse of the intermediate column, and then leading to a collapse of the entire beam. However, major flexure cracks did not appear at the middle of the new simply supported beam but rather were concentrated at the ends of the spliced lower reinforcement located around the quarter of the original spans. Specimen BA3 showed different mode of failure rather than that of the former specimens. Cracks began to appear at almost the same load as that of specimen BA2, which was 74 kN. Although, after the collapse of the intermediate weak column, the flexure cracks increased around the mid-point of the new simply supported beam but the failure was triggered by sudden shear failure near the end support. The visual observation can concluded that such beam can sustain more load if the shear strength was secured. Fig. 4(a) shows the collapse shape of the intermediate column of specimen BA1, while Fig. 4(b) shows the collapse pattern of the intermediate column of specimen BA2 along with the induced cracks at the end of spliced reinforcements. On the other hand, Fig. 4(c) shows the collapse mode of the specimen BA3. Comparing the modes of failure for both specimen BA2 and specimen BA3 show that it is better to use continuous reinforcement over the intermediate support than that lap spliced reinforcement extended to the quarter of the adjacent span from the ultimate capacity and cracks propagation viewpoints if only the shear strength was secured. For the remaining groups, one configuration for reinforcement was presented which was the continuous one over the weak intermediate column. Group No.2 represented three equal spans beams of one intermediate weak support. Fig. 4(d) shows the collapse mode of the specimen BB1. Cracks began to appear at a vertical load of about 87 kN vertical load. Then, cracks increased in numbers and propagation around the mid-points of the two spans around the intermediate weak column till complete collapse of the weak column had occurred at a vertical load of about 302 kN. At the same time, major tensile flexure cracks appeared at the ends of lower reinforcements near the weak column along with appearing of shear cracks within the new span after removal of the weak column. On the other hand, specimen BB2 showed different mode of failure. Cracks began to appear at higher vertical load which was 112 kN then increased in propagation along the whole spans around the weak column as shown in Fig. 4(e). The intermediate column collapsed suddenly at a vertical load of about 329 kN. As a result, flexure cracks were noticed to appear at the column position and the beam capacity dropped suddenly then re-healed soon. Proceeding with the test, the ultimate capacity increased with loading till a sudden shear cracks triggered the complete collapse of the beam. The most important observation was that the exterior
span between the two rigid supports for both specimens, BB1 and BB2, did not show any cracks during the course of loading. That can be attributed to the small length of such span compared to that of the new span after the collapse of the weak column. In addition, the axial deformation of the intermediate column initiated the appearance of cracks at the two spans around such column. Fig. 4(f) shows the failure mode of specimen BC1. Cracks began to appear around the mid-point of the middle span at a vertical load of about 133 kN. No other cracks were noticed except some hair cracks when approaching the failure of the right column at about a total vertical load of 180 kN. Then complete collapse of both weak columns had been occurred at a total vertical load of about 196 kN accompanying by the complete collapse of the beam due to severe flexure crack at the end of lower reinforcement near the right weak column. As for specimen BC2, Cracks began to appear at a vertical load of about 137 kN, then it propagated along the mid-points of the three spans. Both interior weak columns were noticed to begin to fail at about 220 kN total vertical load which was higher than that of the control specimen, specimen BC1. Simultaneously, shear cracks began to appear near support zones of the new simply supported beam. Increasing the applied vertical load led to increasing the crack propagation for both flexure and shear till a sudden shear failure had been occurred at a vertical load of about 285 kN. Comparing the collapse mode of specimen BC2 and that of specimen BA3 shows that both of them behaved identically after the collapse of the intermediate weak column(s). That can be attributed to the similarity of the adopted reinforcement detailing. Although, specimen BC2 showed higher total vertical load which can be attributed to the increased concrete strength of such specimen compared to that of specimen BA3 along with the dissimilarity between the loading patterns on both beams. Fig. 4(g) shows the failure mode of specimen BC2. Group No.4 represented three equal spans beams where one end support and one interior support were weak columns. As for control specimen, specimen BD1, cracks began to appear around the mid-point of the intermediate span at a vertical load of about 148 kN. Cracks increased in propagation till a total vertical load became 243 kN where both weak columns began to fail at their ends. Increasing vertical load led to the appearance of shear cracks along with flexure cracks till a complete collapse of the intermediate weak column had been occurred. In the same time, a severe flexure cracks at the end of lower reinforcement was appeared and a sudden shear cracks at a vertical load of about 390 kN was occurred as shown in Fig. 4(h). On the other hand, the failure of specimen BD2 was due to shear failure only after the occurring of the complete collapse for both weak columns at a vertical load of about 433 kN. The weak intermediate column began to fail at a vertical load of about 253 kN. Consequently, flexure cracks began to propagate all over the new span, and then shear cracks began to appear which triggered the complete collapse of the entire beam. Fig. 4(i) shows the failure mode of the specimen BD2 after the complete collapse of the entire specimen.
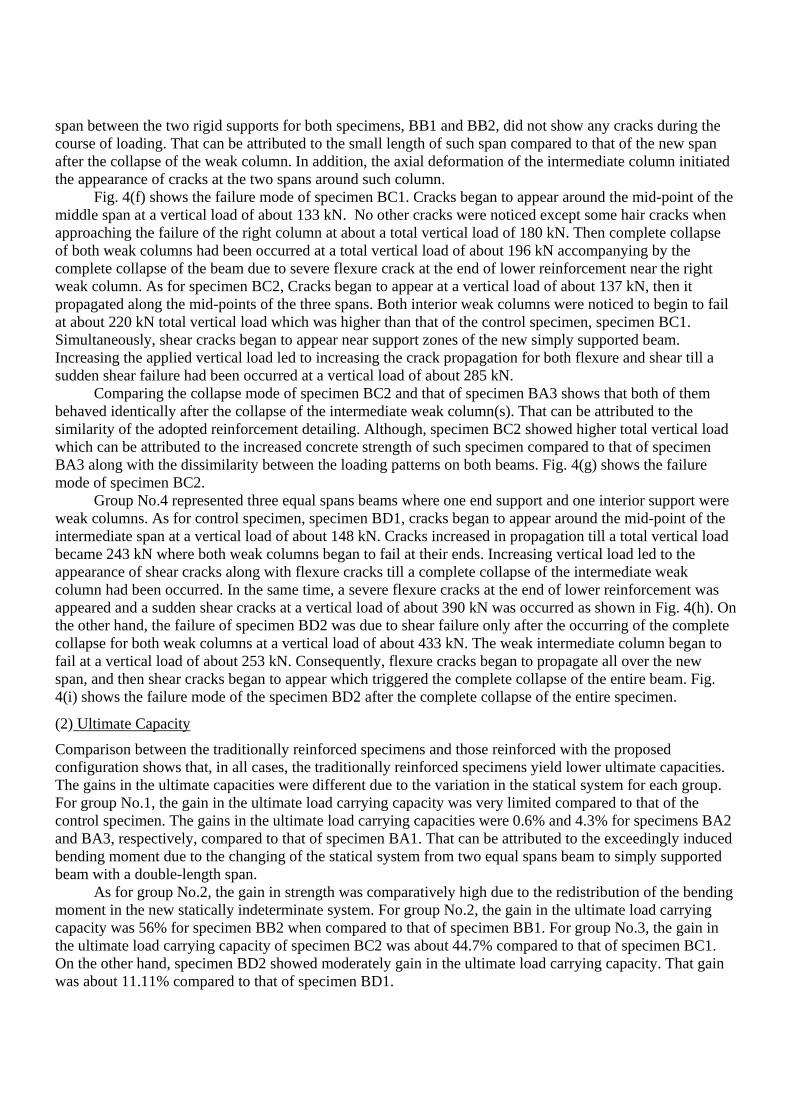
(2) Ultimate Capacity
Comparison between the traditionally reinforced specimens and those reinforced with the proposed configuration shows that, in all cases, the traditionally reinforced specimens yield lower ultimate capacities. The gains in the ultimate capacities were different due to the variation in the statical system for each group. For group No.1, the gain in the ultimate load carrying capacity was very limited compared to that of the control specimen. The gains in the ultimate load carrying capacities were 0.6% and 4.3% for specimens BA2 and BA3, respectively, compared to that of specimen BA1. That can be attributed to the exceedingly induced bending moment due to the changing of the statical system from two equal spans beam to simply supported beam with a double-length span. As for group No.2, the gain in strength was comparatively high due to the redistribution of the bending moment in the new statically indeterminate system. For group No.2, the gain in the ultimate load carrying capacity was 56% for specimen BB2 when compared to that of specimen BB1. For group No.3, the gain in the ultimate load carrying capacity of specimen BC2 was about 44.7% compared to that of specimen BC1. On the other hand, specimen BD2 showed moderately gain in the ultimate load carrying capacity. That gain was about 11.11% compared to that of specimen BD1.
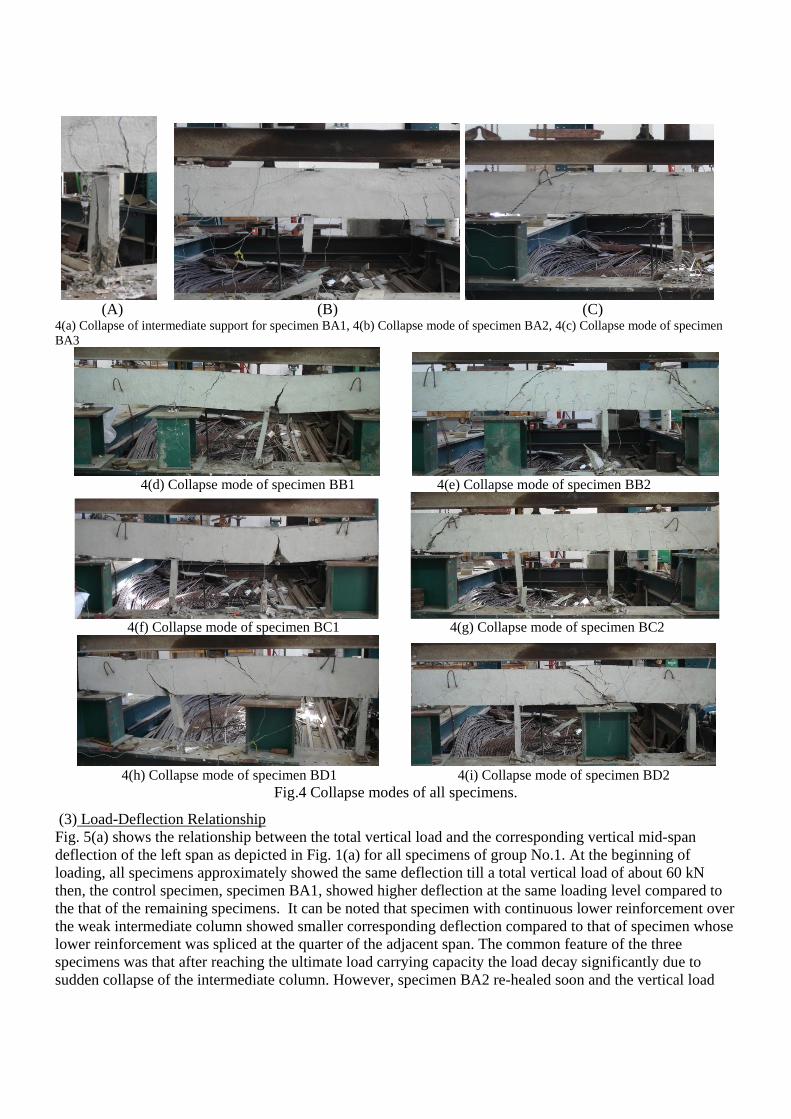
(A) (B) (C) 4(a) Collapse of intermediate support for specimen BA1, 4(b) Collapse mode of specimen BA2, 4(c) Collapse mode of specimen BA3
4(d) Collapse mode of specimen BB1 4(e) Collapse mode of specimen BB2
4(f) Collapse mode of specimen BC1 4(g) Collapse mode of specimen BC2
4(h) Collapse mode of specimen BD1 4(i) Collapse mode of specimen BD2
Fig.4 Collapse modes of all specimens.
(3) Load-Deflection Relationship Fig. 5(a) shows the relationship between the total vertical load and the corresponding vertical mid-span deflection of the left span as depicted in Fig. 1(a) for all specimens of group No.1. At the beginning of loading, all specimens approximately showed the same deflection till a total vertical load of about 60 kN then, the control specimen, specimen BA1, showed higher deflection at the same loading level compared to the that of the remaining specimens. It can be noted that specimen with continuous lower reinforcement over the weak intermediate column showed smaller corresponding deflection compared to that of specimen whose lower reinforcement was spliced at the quarter of the adjacent span. The common feature of the three specimens was that after reaching the ultimate load carrying capacity the load decay significantly due to sudden collapse of the intermediate column. However, specimen BA2 re-healed soon and the vertical load
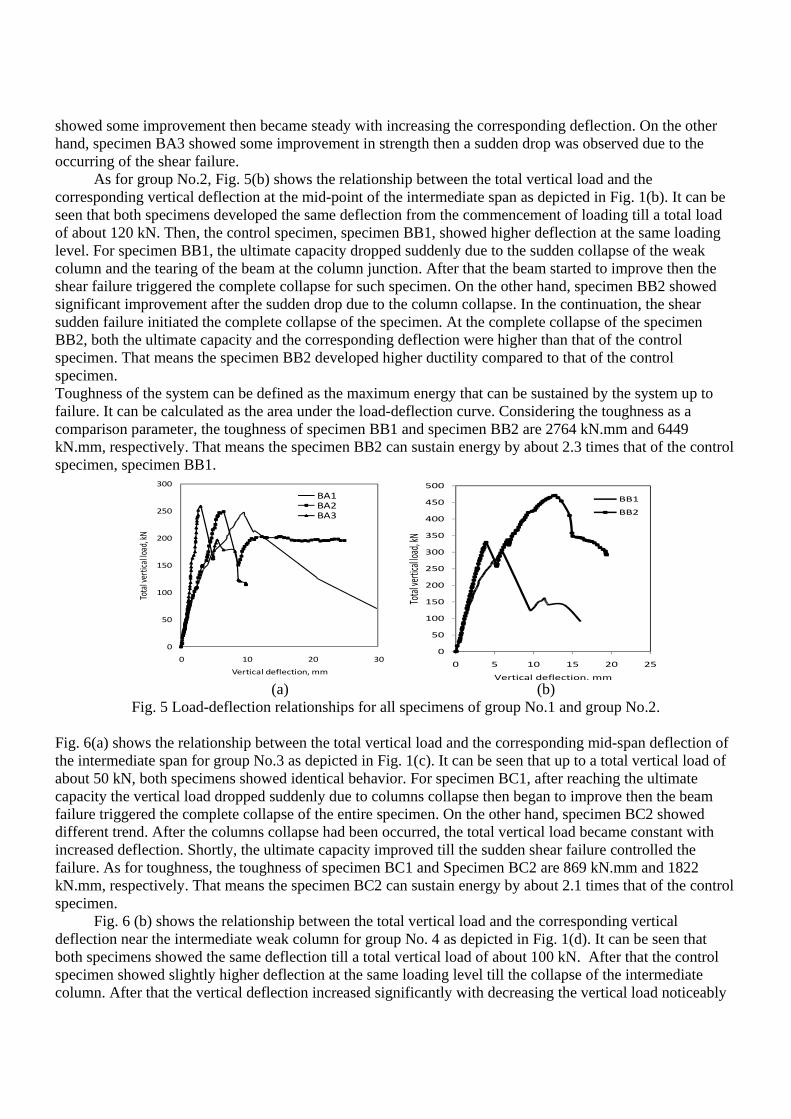
showed some improvement then became steady with increasing the corresponding deflection. On the other hand, specimen BA3 showed some improvement in strength then a sudden drop was observed due to the occurring of the shear failure. As for group No.2, Fig. 5(b) shows the relationship between the total vertical load and the corresponding vertical deflection at the mid-point of the intermediate span as depicted in Fig. 1(b). It can be seen that both specimens developed the same deflection from the commencement of loading till a total load of about 120 kN. Then, the control specimen, specimen BB1, showed higher deflection at the same loading level. For specimen BB1, the ultimate capacity dropped suddenly due to the sudden collapse of the weak column and the tearing of the beam at the column junction. After that the beam started to improve then the shear failure triggered the complete collapse for such specimen. On the other hand, specimen BB2 showed significant improvement after the sudden drop due to the column collapse. In the continuation, the shear sudden failure initiated the complete collapse of the specimen. At the complete collapse of the specimen BB2, both the ultimate capacity and the corresponding deflection were higher than that of the control specimen. That means the specimen BB2 developed higher ductility compared to that of the control specimen. Toughness of the system can be defined as the maximum energy that can be sustained by the system up to failure. It can be calculated as the area under the load-deflection curve. Considering the toughness as a comparison parameter, the toughness of specimen BB1 and specimen BB2 are 2764 kN.mm and 6449 kN.mm, respectively. That means the specimen BB2 can sustain energy by about 2.3 times that of the control specimen, specimen BB1.
0
50
100
150
200
250
300
0 10 20 30
Total vertical load, kN
Vertical deflection, mm
BA1BA2BA3
0
50
100
150
200
250
300
350
400
450
500
0 5 10 15 20 25
Total
vertical lo
ad, kN
Vertical deflection, mm
BB1
BB2
(a) (b)
Fig. 5 Load-deflection relationships for all specimens of group No.1 and group No.2. Fig. 6(a) shows the relationship between the total vertical load and the corresponding mid-span deflection of the intermediate span for group No.3 as depicted in Fig. 1(c). It can be seen that up to a total vertical load of about 50 kN, both specimens showed identical behavior. For specimen BC1, after reaching the ultimate capacity the vertical load dropped suddenly due to columns collapse then began to improve then the beam failure triggered the complete collapse of the entire specimen. On the other hand, specimen BC2 showed different trend. After the columns collapse had been occurred, the total vertical load became constant with increased deflection. Shortly, the ultimate capacity improved till the sudden shear failure controlled the failure. As for toughness, the toughness of specimen BC1 and Specimen BC2 are 869 kN.mm and 1822 kN.mm, respectively. That means the specimen BC2 can sustain energy by about 2.1 times that of the control specimen. Fig. 6 (b) shows the relationship between the total vertical load and the corresponding vertical deflection near the intermediate weak column for group No. 4 as depicted in Fig. 1(d). It can be seen that both specimens showed the same deflection till a total vertical load of about 100 kN. After that the control specimen showed slightly higher deflection at the same loading level till the collapse of the intermediate column. After that the vertical deflection increased significantly with decreasing the vertical load noticeably
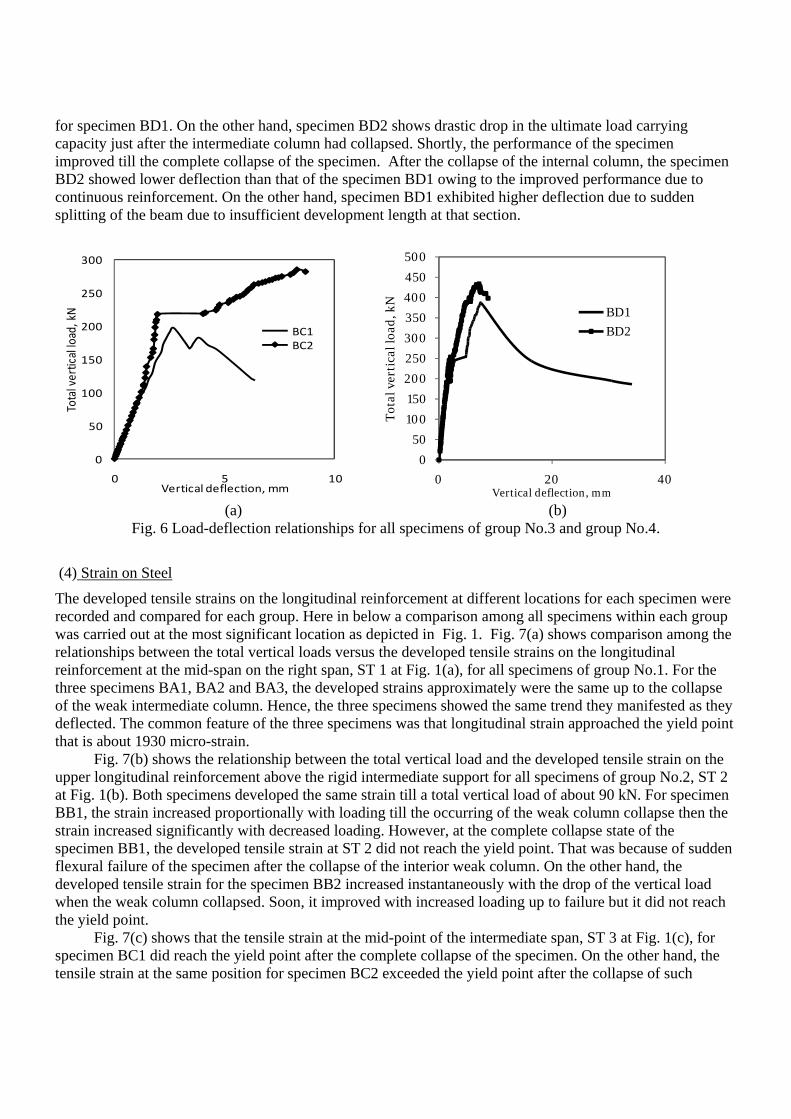
for specimen BD1. On the other hand, specimen BD2 shows drastic drop in the ultimate load carrying capacity just after the intermediate column had collapsed. Shortly, the performance of the specimen improved till the complete collapse of the specimen. After the collapse of the internal column, the specimen BD2 showed lower deflection than that of the specimen BD1 owing to the improved performance due to continuous reinforcement. On the other hand, specimen BD1 exhibited higher deflection due to sudden splitting of the beam due to insufficient development length at that section.
0
50
100
150
200
250
300
0 5 10
Total vertical load, kN
Vertical deflection, mm
BC1BC2
(a) (b)
Fig. 6 Load-deflection relationships for all specimens of group No.3 and group No.4.
(4) Strain on Steel
The developed tensile strains on the longitudinal reinforcement at different locations for each specimen were recorded and compared for each group. Here in below a comparison among all specimens within each group was carried out at the most significant location as depicted in Fig. 1. Fig. 7(a) shows comparison among the relationships between the total vertical loads versus the developed tensile strains on the longitudinal reinforcement at the mid-span on the right span, ST 1 at Fig. 1(a), for all specimens of group No.1. For the three specimens BA1, BA2 and BA3, the developed strains approximately were the same up to the collapse of the weak intermediate column. Hence, the three specimens showed the same trend they manifested as they deflected. The common feature of the three specimens was that longitudinal strain approached the yield point that is about 1930 micro-strain. Fig. 7(b) shows the relationship between the total vertical load and the developed tensile strain on the upper longitudinal reinforcement above the rigid intermediate support for all specimens of group No.2, ST 2 at Fig. 1(b). Both specimens developed the same strain till a total vertical load of about 90 kN. For specimen BB1, the strain increased proportionally with loading till the occurring of the weak column collapse then the strain increased significantly with decreased loading. However, at the complete collapse state of the specimen BB1, the developed tensile strain at ST 2 did not reach the yield point. That was because of sudden flexural failure of the specimen after the collapse of the interior weak column. On the other hand, the developed tensile strain for the specimen BB2 increased instantaneously with the drop of the vertical load when the weak column collapsed. Soon, it improved with increased loading up to failure but it did not reach the yield point. Fig. 7(c) shows that the tensile strain at the mid-point of the intermediate span, ST 3 at Fig. 1(c), for specimen BC1 did reach the yield point after the complete collapse of the specimen. On the other hand, the tensile strain at the same position for specimen BC2 exceeded the yield point after the collapse of such
0
50
100
150
200
250
300
350
400
450
500
0 20 40
Tot
al v
erti
cal l
oad
, kN
Vertical deflection, mm
BD1
BD2
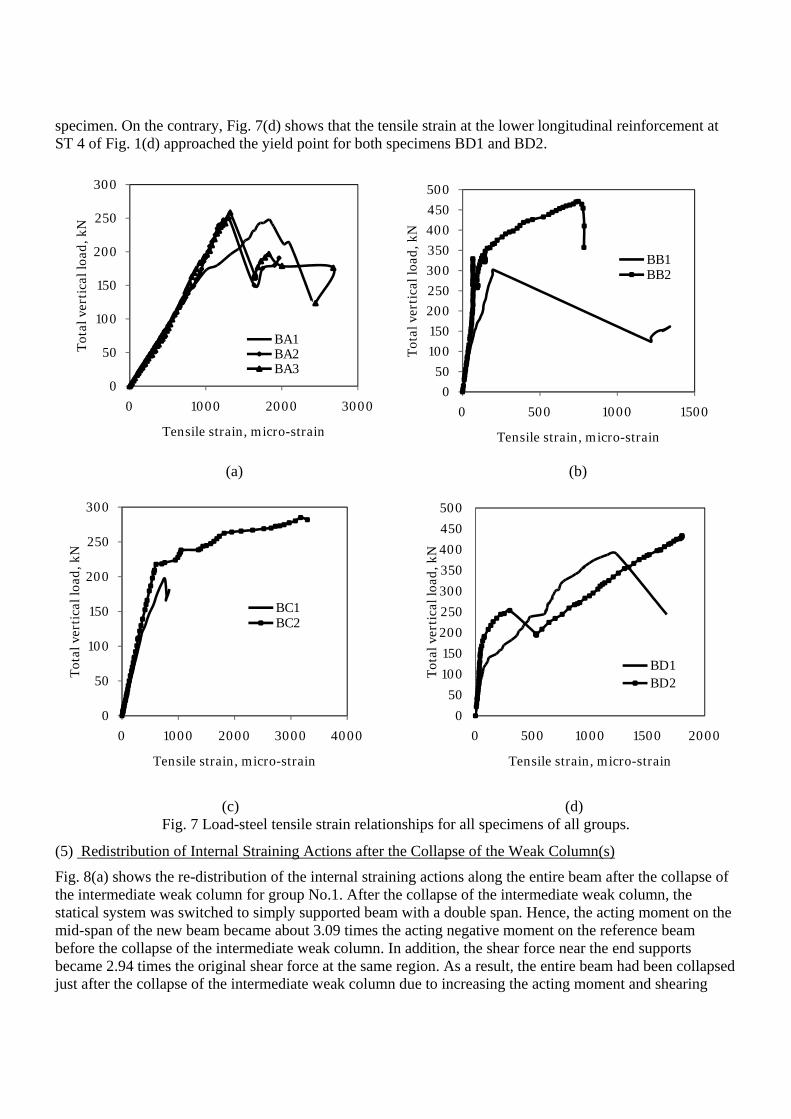
specimen. On the contrary, Fig. 7(d) shows that the tensile strain at the lower longitudinal reinforcement at ST 4 of Fig. 1(d) approached the yield point for both specimens BD1 and BD2.
(a) (b)
(c) (d)
Fig. 7 Load-steel tensile strain relationships for all specimens of all groups.
(5) Redistribution of Internal Straining Actions after the Collapse of the Weak Column(s)
Fig. 8(a) shows the re-distribution of the internal straining actions along the entire beam after the collapse of the intermediate weak column for group No.1. After the collapse of the intermediate weak column, the statical system was switched to simply supported beam with a double span. Hence, the acting moment on the mid-span of the new beam became about 3.09 times the acting negative moment on the reference beam before the collapse of the intermediate weak column. In addition, the shear force near the end supports became 2.94 times the original shear force at the same region. As a result, the entire beam had been collapsed just after the collapse of the intermediate weak column due to increasing the acting moment and shearing
0
50
100
150
200
250
300
0 1000 2000 3000
Tot
al v
erti
cal l
oad
, kN
Tensile strain, micro-strain
BA1BA2BA3
0
50
100
150
200
250
300
350
400
450
500
0 500 1000 1500T
otal
ver
tica
l loa
d, k
N
Tensile strain, micro-strain
BB1BB2
0
50
100
150
200
250
300
0 1000 2000 3000 4000
Tot
al v
erti
cal l
oad
, kN
Tensile strain, micro-strain
BC1BC2
0
50
100
150
200
250
300
350
400
450
500
0 500 1000 1500 2000
Tot
al v
erti
cal l
oad
, kN
Tensile strain, micro-strain
BD1BD2
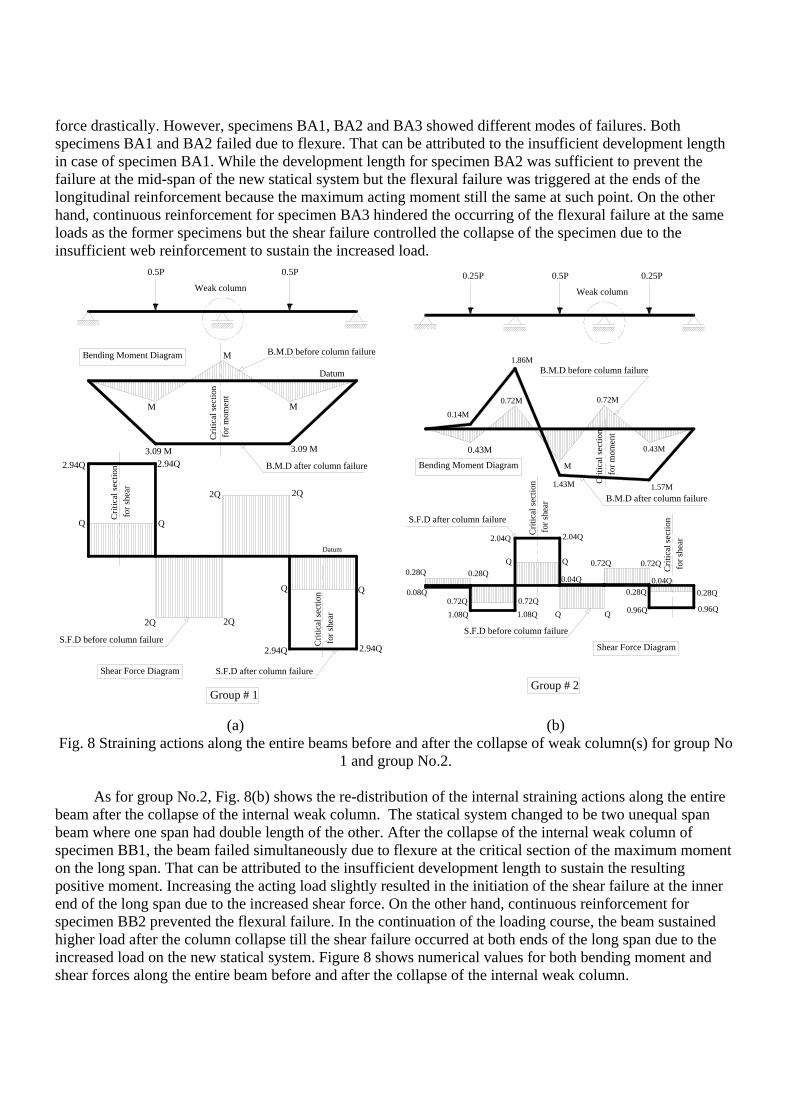
force drastically. However, specimens BA1, BA2 and BA3 showed different modes of failures. Both specimens BA1 and BA2 failed due to flexure. That can be attributed to the insufficient development length in case of specimen BA1. While the development length for specimen BA2 was sufficient to prevent the failure at the mid-span of the new statical system but the flexural failure was triggered at the ends of the longitudinal reinforcement because the maximum acting moment still the same at such point. On the other hand, continuous reinforcement for specimen BA3 hindered the occurring of the flexural failure at the same loads as the former specimens but the shear failure controlled the collapse of the specimen due to the insufficient web reinforcement to sustain the increased load.
Datum
M
MM
3.09 M 3.09 M
Bending Moment Diagram
Datum
Q Q
2.94Q 2.94Q
2Q 2Q
2Q 2Q
Q Q
2.94Q 2.94Q
Shear Force Diagram
Crit
ical
sect
ion
for m
omen
t
Crit
ical
sect
ion
for s
hear
B.M.D before column failure
B.M.D after column failure
Weak column Weak column
M
Q Q
0.43M0.43M
0.72M 0.72M
1.57M1.43M
1.86M
0.14M
Crit
ical
sect
ion
for m
omen
t
Crit
ical
sect
ion
for s
hear
Crit
ical
sect
ion
for s
hear
Crit
ical
sect
ion
for s
hear
Bending Moment Diagram
B.M.D before column failure
B.M.D after column failure
S.F.D after column failure
S.F.D before column failureS.F.D before column failure
Shear Force Diagram
S.F.D after column failure
2.04Q
0.28Q 0.28Q
0.08Q0.72Q 0.72Q1.08Q 1.08Q Q Q
0.04Q 0.04Q
0.72Q 0.72Q
0.28Q 0.28Q
0.96Q 0.96Q
2.04Q
0.5P 0.5P 0.5P 0.25P0.25P
Group # 2Group # 1
(a) (b) Fig. 8 Straining actions along the entire beams before and after the collapse of weak column(s) for group No
1 and group No.2. As for group No.2, Fig. 8(b) shows the re-distribution of the internal straining actions along the entire beam after the collapse of the internal weak column. The statical system changed to be two unequal span beam where one span had double length of the other. After the collapse of the internal weak column of specimen BB1, the beam failed simultaneously due to flexure at the critical section of the maximum moment on the long span. That can be attributed to the insufficient development length to sustain the resulting positive moment. Increasing the acting load slightly resulted in the initiation of the shear failure at the inner end of the long span due to the increased shear force. On the other hand, continuous reinforcement for specimen BB2 prevented the flexural failure. In the continuation of the loading course, the beam sustained higher load after the column collapse till the shear failure occurred at both ends of the long span due to the increased load on the new statical system. Figure 8 shows numerical values for both bending moment and shear forces along the entire beam before and after the collapse of the internal weak column.
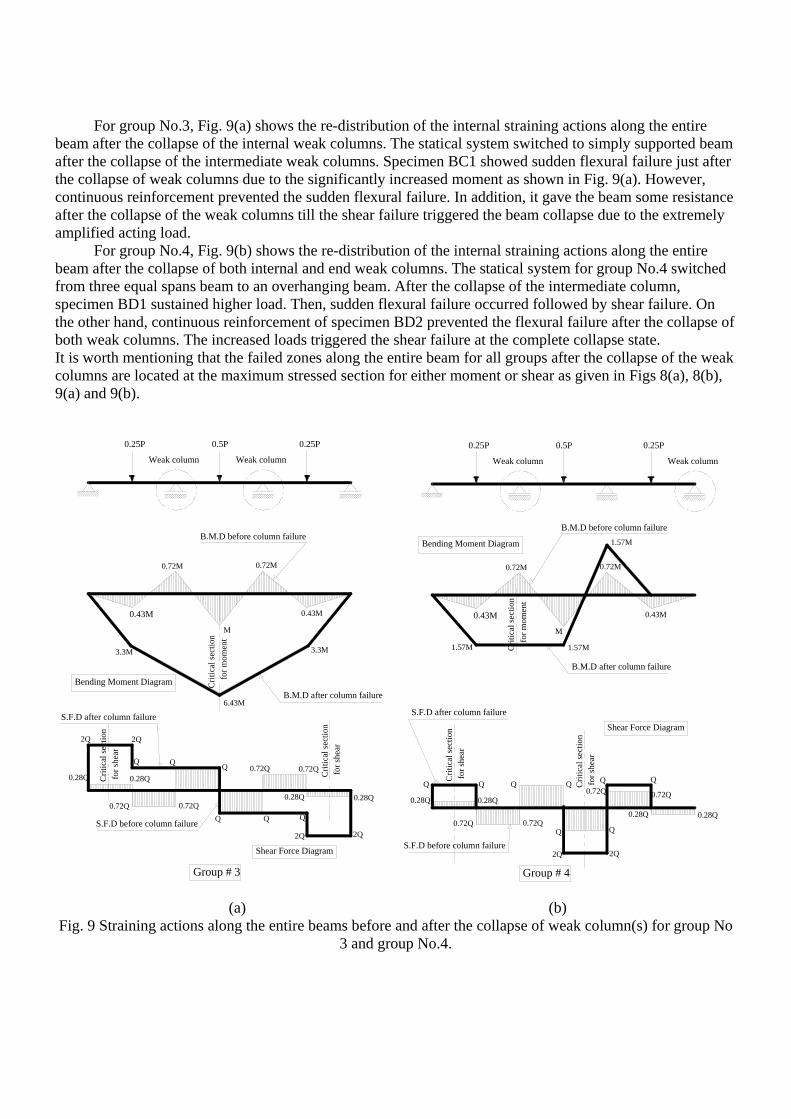
For group No.3, Fig. 9(a) shows the re-distribution of the internal straining actions along the entire beam after the collapse of the internal weak columns. The statical system switched to simply supported beam after the collapse of the intermediate weak columns. Specimen BC1 showed sudden flexural failure just after the collapse of weak columns due to the significantly increased moment as shown in Fig. 9(a). However, continuous reinforcement prevented the sudden flexural failure. In addition, it gave the beam some resistance after the collapse of the weak columns till the shear failure triggered the beam collapse due to the extremely amplified acting load. For group No.4, Fig. 9(b) shows the re-distribution of the internal straining actions along the entire beam after the collapse of both internal and end weak columns. The statical system for group No.4 switched from three equal spans beam to an overhanging beam. After the collapse of the intermediate column, specimen BD1 sustained higher load. Then, sudden flexural failure occurred followed by shear failure. On the other hand, continuous reinforcement of specimen BD2 prevented the flexural failure after the collapse of both weak columns. The increased loads triggered the shear failure at the complete collapse state. It is worth mentioning that the failed zones along the entire beam for all groups after the collapse of the weak columns are located at the maximum stressed section for either moment or shear as given in Figs 8(a), 8(b), 9(a) and 9(b).
Weak column
M
Q Q
0.43M0.43M
0.72M 0.72M
Crit
ical
sect
ion
for m
omen
t
Crit
ical
sect
ion
for s
hear
Bending Moment Diagram
B.M.D before column failure
B.M.D after column failure
S.F.D before column failure
Shear Force Diagram
S.F.D after column failure
0.28Q 0.28Q
0.72Q 0.72QQ Q
0.72Q 0.72Q
0.28Q 0.28Q
0.5P 0.25P0.25PWeak column
M
Q Q
0.43M0.43M
0.72M 0.72M
Crit
ical
sect
ion
for m
omen
t
Crit
ical
sect
ion
for s
hear
Crit
ical
sect
ion
for s
hear
Bending Moment Diagram
B.M.D before column failure
B.M.D after column failure
S.F.D before column failure
Shear Force Diagram
S.F.D after column failure
0.28Q 0.28Q
0.72Q 0.72QQ Q
0.72Q 0.72Q
0.28Q 0.28Q
0.5P 0.25P0.25P
Weak column
6.43M
3.3M3.3M
Weak column
Q
2Q 2Q
Q
2Q 2Q
1.57M
1.57M1.57M
Q Q Q Q
2Q 2Q
Crit
ical
sect
ion
for s
hear
Group # 3 Group # 4
(a) (b) Fig. 9 Straining actions along the entire beams before and after the collapse of weak column(s) for group No
3 and group No.4.
The common feature for all groups was that the collapse loads of the weak column(s) in case of continuous reinforcement were higher than that in case of spliced reinforcement as the traditional method. The percentages of increases for the columns collapse loads were 4.3%, 9%, 11.8% and 4.7% for specimens BA3, BB2, BC2 and BD2 compared to those of specimens BA1, BB1, BC1, and BD1, respectively. In addition, the collapse loads for specimens having continuous reinforcement were higher than that of the specimens having spliced reinforcement. The percentages of increases in the ultimate loads were 4.3%, 55. 9%, 44.7% and 11.1% for specimens BA3, BB2, BC2 and BD2 compared to those of specimens BA1, BB1, BC1, and BD1, respectively.
(6) Recommendations Based on Visual Observation of Collapsing Continuous Beams
For seismic region, the recommended detailing is sufficient to mitigate the effect of progressive collapse, if happened. On the other hand, for non-seismic region and for gravity load designed structures, attention should be paid to the reinforcement detailing to reduce the effect of progressive collapse, if happened. Recommendation for detailing for the former structures can be proposed as given hereinafter. For positive moment, the lower extended reinforcement which has to be more than one third of the main tension steel (ECP 203-2007 and ACI 318-11) should be extended to the quarter of the adjacent span. Hence, the lower reinforcement at intermediate support will be at least two third of the positive reinforcement. If the lower reinforcement of two adjacent spans or more is the same, it is better to use continuous reinforcement over the whole spans. For end support, the stirrup hangers for the first span should be extended over the internal support and extended to one quarter of the adjacent span. CONCLUSIONS Based on the studied configurations of the continuous beam system, loading scheme, and according to the used concrete dimensions and reinforcement detailing, the following conclusions maybe drawn:
• After the collapse of weak columns, both moment and shear increased significantly. Hence, the beam can be failed due to both flexure and shear where one failure precedes the other according to performance of the both longitudinal and web reinforcements. Continuous reinforcement can enable continuous beam to sustain more loads after the collapse of weak columns and hinders the occurring of the flexural failure. On the other hand, the shear failure controls the collapse of the beam since the shear reinforcement still the same while the acting shear force increases significantly. For traditionally reinforced continuous beams, the failure is characterized by sudden flexural failure at the junction of the collapsed column due to insufficient development length.
• Traditionally reinforced concrete continuous beams develop lower ultimate load carrying capacity and higher developed strains on the longitudinal reinforcement compared to those beams of continuous reinforcement.
• For non-seismic region, it is recommended to extend the lower reinforcement at least to one quarter of the adjacent span. But if the lower reinforcement is the same it is better to use continuous reinforcement to mitigate the effect of progressive collapse, if any.
• It is better to increase the shear capacity slightly with a safety margin which has to be verified in details to mitigate the effect of progressive collapse. In other words, the redundancy criteria have to be studied in details for the shear capacity, which is a new topic of study.
ACKNOWLEDGMENTS
The experimental work of the current research was carried out at the Reinforced Concrete and Heavy Structures Lab of Tanta University, Faculty of Engineering. This research is partially funded by the HLCP fund project no. LP3-030-TAN, given by the Egyptian government.
REFERENCES Abruzzo, J., Matta, A. & Panariello, G. (2006), "Study of mitigation strategies for progressive collapse of
a reinforced concrete commercial building," Journal of Performance of Constructed Facilities, ASCE, Vol. 20, No. 4, 384-390.
ACI 318-11 (2011), American Concrete Institute, Building Code Requirements for Structural Concrete and Commentary. Farmington Hills.
Baldridge, S. M. & Humay, F. K. (2003), "Preventing progressive collapse in concrete buildings," Concrete International, Vol. 11, 1-7.
Department of Defense (DoD), (2005), "Unified facilities criteria: design of buildings to resist progressive collapse, " UFC 4-023-03. Washington D.C., USA.
Department of Defense (DoD), (2009), "Unified facilities criteria: design of buildings to resist progressive collapse," UFC 4-023-03. Washington D.C., USA.
Ellingwood, B. & Leyendecker, E. (1978), "Approaches for design against progressive collapse," Journal of the Structural Division, ASCE, Vol. 104, No. ST3, 413–423.
Ellingwood, B. (2006), "Mitigating risk from abnormal loads and progressive collapse," Journal of Performance of Constructed Facilities, ASCE, Vol. 20, No. 4, 315–323.
ECP 203 (2007), Egyptian Code for Design and Construction of Reinforced Concrete Structures. General Service Administration (GSA), (2003), "Progressive collapse analysis and design guidelines for
new federal office buildings and major modernization projects," Washington D.C., USA. Griffiths, H., Pugsley, A. & Saunders, O. (1968), "Report of inquiry into the collapse of flats at Ronan
Point, Canning Town," London: Ministry of Housing and Local Government, Her Majesty’s Stationary Office.
Hayes, J., Woodson, S. C., Pekelnicky, R. G., Poland, C. D., Corley, W. G. & Sozen, M. (2005), "Can strengthening for earthquake improve blast and progressive collapse resistance?," Journal of Structural Engineering, ASCE, Vol. 131, No. 8, 1157-1177.
Ioani, A., Cucu, L. & Mircea, C. (2007), " Assessment of the potential for progressive collapse in RC frames," Ovidius University Annuals Series: Civil Engineering, Vol. 1, No. 5, 29-36.
Kulkarni, A. A. & Joshi, R. R. (2011), "Progressive collapse assessment of structures," International Journal of Earth Science and Engineering, Vol. 4, No. 6, 652-655.
Nair, R. (2006), " Preventing disproportionate collapse," Journal of Performance of Constructed Facilities, ASCE, Vol. 20, No. 4, 309–314.
NRCC (2005), National Research Council of Canada, National Building Code of Canada, Ottawa. Otani, S. (2007), "Vulnerability of reinforced concrete buildings," International Symposium on the
Occasion of the Twentieth Anniversary of CISMID, National University of Engineering, Lima, August 20-22.
Tian, Y. & Youpo, S. (2011), "Dynamic response of reinforced concrete beams following instantaneous removal of a bearing column," International Journal of Concrete Structures and Materials, Vol. 5, No. 1, 19-28.
Tsai, M. & You, Z. (2012), "Experimental evaluation of inelastic dynamic amplification factors for progressive collapse analysis under sudden support loss," Mechanics Research Communication, Vol. 40, 56-62.
Wibowo, H. & Lau, D. T. (2009), "Seismic progressive collapse: qualitative point of view," Civil Engineering Dimension, Vol. 11, No. 1, 8-14.
Youpo, S., Ying, T. & Xiaosheng, S. (2009), "Progressive collapse resistance of axially-restrained frame beams," ACI Structural Journal, Vol. 106, No. 5, 600-607.
Yuan, W. & Tan, K. H. (2011), "Modeling of progressive collapse of multi-storey structure using a spring-mass-damper system," Structural Engineering and Mechanics, Vol. 37, No. 1, 79-93.


