Embed Size (px)
Citation preview
Project Report - Working Capital Management
WORKING CAPITAL - Meaning of WorkingCapital
Capital required for a business can be classified undertwo main categories via,
1) Fixed Capital
2) Working Capital
Every business needs funds for two purposes forits establishment and to carry out its day- to-dayoperations. Long terms funds are required to createproduction facilities through purchase of fixed assetssuch as p&m, land, building, furniture, etc. Investmentsin these assets represent that part of firm’s capitalwhich is blocked on permanent or fixed basis and iscalled fixed capital. Funds are also needed for short-term purposes for the purchase of raw material, paymentof wages and other day – to- day expenses etc.
These funds are known as working capital. In simplewords, working capital refers to that part of the firm’scapital which is required for financing short- term orcurrent assets such as cash, marketable securities,debtors & inventories. Funds, thus, invested in currentassts keep revolving fast and are being constantlyconverted in to cash and this cash flows out again inexchange for other current assets. Hence, it is alsoknown as revolving or circulating capital or short termcapital.
CONCEPT OF WORKING CAPITAL
There are two concepts of working capital:
1. Gross working capital
2. Net working capital
The gross working capital is the capital invested inthe total current assets of the enterprises currentassets are those
Assets which can convert in to cash within a shortperiod normally one accounting year.
CONSTITUENTS OF CURRENT ASSETS
1) Cash in hand and cash at bank
2) Bills receivables
3) Sundry debtors
4) Short term loans and advances.
5) Inventories of stock as:
a. Raw material
b. Work in process
c. Stores and spares
d. Finished goods
6. Temporary investment of surplus funds.
7. Prepaid expenses
8. Accrued incomes.
9. Marketable securities.
In a narrow sense, the term working capital refersto the net working. Net working capital is theexcess of current assets over current liability, or,say:
NET WORKING CAPITAL = CURRENT ASSETS – CURRENTLIABILITIES.
Net working capital can be positive or negative.When the current assets exceeds the currentliabilities are more than the current assets.Current liabilities are those liabilities, which areintended to be paid in the ordinary course ofbusiness within a short period of normally oneaccounting year out of the current assts or theincome business.
CONSTITUENTS OF CURRENT LIABILITIES
1. Accrued or outstanding expenses.
2. Short term loans, advances and deposits.
3. Dividends payable.
4. Bank overdraft.
5. Provision for taxation , if it does not amt.to app. Of profit.
6. Bills payable.
7. Sundry creditors.
The gross working capital concept is financial or goingconcern concept whereas net working capital is anaccounting concept of working capital. Both the conceptshave their own merits.
The gross concept is sometimes preferred to the conceptof working capital for the following reasons:
1. It enables the enterprise to provide correctamount of working capital at correct time.
2. Every management is more interested in totalcurrent assets with which it has to operate thenthe source from where it is made available.
3. It take into consideration of the fact everyincrease in the funds of the enterprise wouldincrease its working capital.
4. This concept is also useful in determining therate of return on investments in working capital.The net working capital concept, however, is alsoimportant for following reasons:
It is qualitative concept, which indicatesthe firm’s ability to meet to its operatingexpenses and short-term liabilities.
IT indicates the margin of protectionavailable to the short term creditors.
It is an indicator of the financialsoundness of enterprises.

It suggests the need of financing a partof working capital requirement out of thepermanent sources of funds.
CLASSIFICATION OF WORKING CAPITAL
Working capital may be classified in to ways:
o On the basis of concept.
o On the basis of time.
On the basis of concept working capital can beclassified as gross working capital and net workingcapital. On the basis of time, working capital maybe classified as:
Permanent or fixed working capital.
Temporary or variable working capital
PERMANENT OR FIXED WORKING CAPITAL
Permanent or fixed working capital is minimum amountwhich is required to ensure effective utilization offixed facilities and for maintaining the circulation ofcurrent assets. Every firm has to maintain a minimumlevel of raw material, work- in-process, finished goodsand cash balance. This minimum level of current assts iscalled permanent or fixed working capital as this part ofworking is permanently blocked in current assets. As thebusiness grow the requirements of working capital alsoincreases due to increase in current assets.
TEMPORARY OR VARIABLE WORKING CAPITAL
Temporary or variable working capital is the amount ofworking capital which is required to meet the seasonaldemands and some special exigencies. Variable working
capital can further be classified as seasonal workingcapital and special working capital. The capital requiredto meet the seasonal need of the enterprise is calledseasonal working capital. Special working capital is thatpart of working capital which is required to meet specialexigencies such as launching of extensive marketing forconducting research, etc.
Temporary working capital differs from permanent workingcapital in the sense that is required for short periodsand cannot be permanently employed gainfully in thebusiness.
IMPORTANCE OR ADVANTAGE OF ADEQUATE WORKING CAPITAL
SOLVENCY OF THE BUSINESS: Adequate working capitalhelps in maintaining the solvency of the business byproviding uninterrupted of production.
Goodwill: Sufficient amount of working capitalenables a firm to make prompt payments and makes andmaintain the goodwill.
Easy loans: Adequate working capital leads tohigh solvency and credit standing can arrange loansfrom banks and other on easy and favorable terms.
Cash Discounts: Adequate working capital alsoenables a concern to avail cash discounts on thepurchases and hence reduces cost.
Regular Supply of Raw Material: Sufficientworking capital ensures regular supply of rawmaterial and continuous production.
Regular Payment Of Salaries, Wages And Other DayTO Day Commitments: It leads to the satisfaction of
the employees and raises the morale of its employees,increases their efficiency, reduces wastage and costsand enhances production and profits.
Exploitation Of Favorable Market Conditions: Ifa firm is having adequate working capital then it canexploit the favorable market conditions such aspurchasing its requirements in bulk when the pricesare lower and holdings its inventories for higherprices.
Ability To Face Crises: A concern can face thesituation during the depression.
Quick And Regular Return OnInvestments: Sufficient working capital enables aconcern to pay quick and regular of dividends to itsinvestors and gains confidence of the investors andcan raise more funds in future.
High Morale: Adequate working capital brings anenvironment of securities, confidence, high moralewhich results in overall efficiency in a business.
EXCESS OR INADEQUATE WORKING CAPITAL
Every business concern should have adequate amount ofworking capital to run its business operations. Itshould have neither redundant or excess working capitalnor inadequate nor shortages of working capital. Bothexcess as well as short working capital positions arebad for any business. However, it is the inadequateworking capital which is more dangerous from the pointof view of the firm.
DISADVANTAGES OF REDUNDANT OR EXCESSIVE WORKING CAPITAL
1. Excessive working capital means ideal fundswhich earn no profit for the firm and businesscannot earn the required rate of return on itsinvestments.
2. Redundant working capital leads tounnecessary purchasing and accumulation ofinventories.
3. Excessive working capital implies excessivedebtors and defective credit policy which causeshigher incidence of bad debts.
4. It may reduce the overall efficiency of thebusiness.
5. If a firm is having excessive workingcapital then the relations with banks and otherfinancial institution may not be maintained.
6. Due to lower rate of return n investments,the values of shares may also fall.
7. The redundant working capital gives rise tospeculative transactions
DISADVANTAGES OF INADEQUATE WORKING CAPITAL
Every business needs some amounts of working capital. Theneed for working capital arises due to the time gapbetween production and realization of cash from sales.There is an operating cycle involved in sales andrealization of cash. There are time gaps in purchase ofraw material and production; production and sales; andrealization of cash.
Thus working capital is needed for the followingpurposes:
For the purpose of raw material, components andspares.
To pay wages and salaries
To incur day-to-day expenses and overload costssuch as office expenses.
To meet the selling costs as packing,advertising, etc.
To provide credit facilities to the customer.
To maintain the inventories of the rawmaterial, work-in-progress, stores and spares andfinished stock.
For studying the need of working capital in a business,one has to study the business under varyingcircumstances such as a new concern requires a lot offunds to meet its initial requirements such aspromotion and formation etc. These expenses are calledpreliminary expenses and are capitalized. The amountneeded for working capital depends upon the size of thecompany and ambitions of its promoters. Greater thesize of the business unit, generally larger will be therequirements of the working capital.
The requirement of the working capital goes onincreasing with the growth and expensing of thebusiness till it gains maturity. At maturity the amountof working capital required is called normal workingcapital.
There are others factors also influence the need ofworking capital in a business.
FACTORS DETERMINING THE WORKING CAPITAL REQUIREMENTS
1. NATURE OF BUSINESS: The requirements ofworking is very limited in public utilityundertakings such as electricity, water supply andrailways because they offer cash sale only andsupply services not products, and no funds are tiedup in inventories and receivables. On the otherhand the trading and financial firms requires lessinvestment in fixed assets but have to invest largeamt. of working capital along with fixedinvestments.
2. SIZE OF THE BUSINESS: Greater the size of thebusiness, greater is the requirement of workingcapital.
3. PRODUCTION POLICY: If the policy is to keepproduction steady by accumulating inventories itwill require higher working capital.
4. LENTH OF PRDUCTION CYCLE: The longer themanufacturing time the raw material and othersupplies have to be carried for a longer in theprocess with progressive increment of labor andservice costs before the final product is obtained.So working capital is directly proportional to thelength of the manufacturing process.
5. SEASONALS VARIATIONS: Generally, during thebusy season, a firm requires larger working capitalthan in slack season.
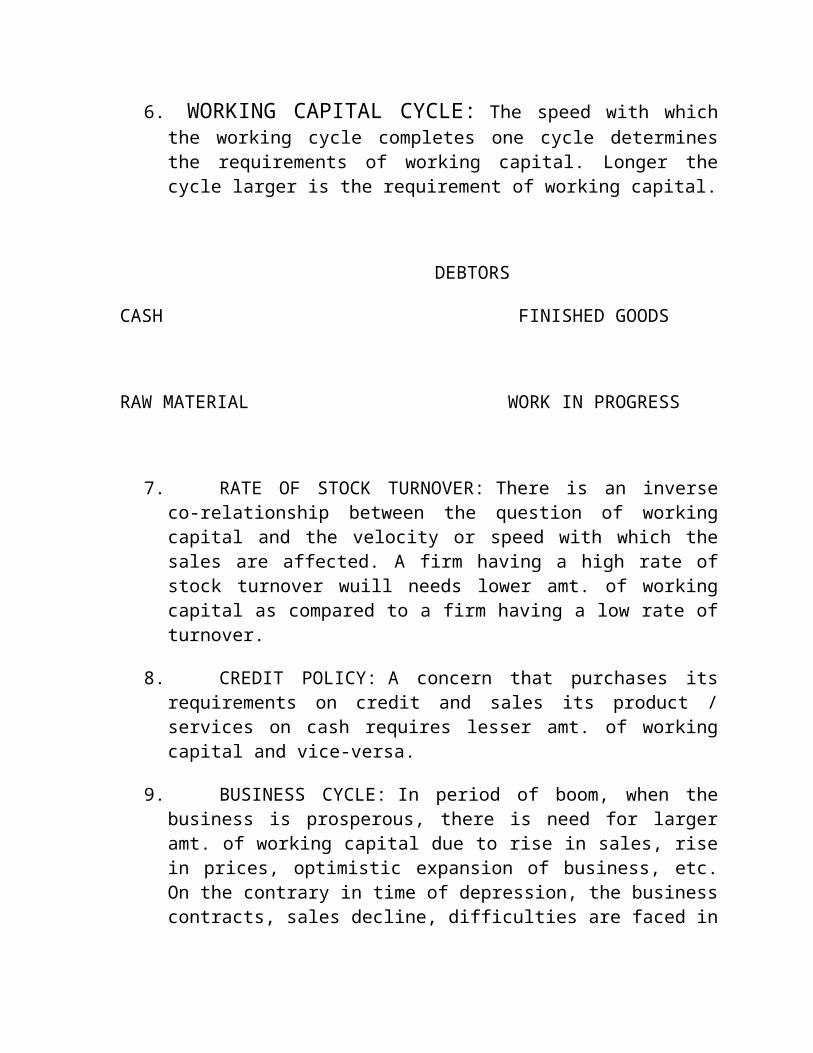
6. WORKING CAPITAL CYCLE: The speed with whichthe working cycle completes one cycle determinesthe requirements of working capital. Longer thecycle larger is the requirement of working capital.
DEBTORS
CASH FINISHED GOODS
RAW MATERIAL WORK IN PROGRESS
7. RATE OF STOCK TURNOVER: There is an inverseco-relationship between the question of workingcapital and the velocity or speed with which thesales are affected. A firm having a high rate ofstock turnover wuill needs lower amt. of workingcapital as compared to a firm having a low rate ofturnover.
8. CREDIT POLICY: A concern that purchases itsrequirements on credit and sales its product /services on cash requires lesser amt. of workingcapital and vice-versa.
9. BUSINESS CYCLE: In period of boom, when thebusiness is prosperous, there is need for largeramt. of working capital due to rise in sales, risein prices, optimistic expansion of business, etc.On the contrary in time of depression, the businesscontracts, sales decline, difficulties are faced in
collection from debtor and the firm may have alarge amt. of working capital.
10. RATE OF GROWTH OF BUSINESS: In faster growingconcern, we shall require large amt. of workingcapital.
11. EARNING CAPACITY AND DIVIDEND POLICY: Some firmshave more earning capacity than other due toquality of their products, monopoly conditions,etc. Such firms may generate cash profits fromoperations and contribute to their working capital.The dividend policy also affects the requirement ofworking capital. A firm maintaining a steady highrate of cash dividend irrespective of its profitsneeds working capital than the firm that retainslarger part of its profits and does not pay so highrate of cash dividend.
12. PRICE LEVEL CHANGES: Changes in the price levelalso affect the working capital requirements.Generally rise in prices leads to increase inworking capital.
Others FACTORS: These are:
Operating efficiency.
Management ability.
Irregularities of supply.
Import policy.
Asset structure.
Importance of labor.
Banking facilities, etc.
MANAGEMENT OF WORKING CAPITAL
Management of working capital is concerned with theproblem that arises in attempting to manage thecurrent assets, current liabilities. The basic goalof working capital management is to manage thecurrent assets and current liabilities of a firm insuch a way that a satisfactory level of workingcapital is maintained, i.e. it is neither adequatenor excessive as both the situations are bad for anyfirm. There should be no shortage of funds and alsono working capital should be ideal. WORKING CAPITALMANAGEMENT POLICES of a firm has a great on itsprobability, liquidity and structural health of theorganization. So working capital management is threedimensional in nature as
1. It concerned with the formulation ofpolicies with regard to profitability, liquidityand risk.
2. It is concerned with the decision about thecomposition and level of current assets.
3. It is concerned with the decision about thecomposition and level of current liabilities.
WORKING CAPITAL ANALYSIS
As we know working capital is the life blood and thecentre of a business. Adequate amount of working
capital is very much essential for the smooth runningof the business. And the most important part is theefficient management of working capital in righttime. The liquidity position of the firm is totallyeffected by the management of working capital. So, astudy of changes in the uses and sources of workingcapital is necessary to evaluate the efficiency withwhich the working capital is employed in a business.This involves the need of working capital analysis.
The analysis of working capital can be conductedthrough a number of devices, such as:
1. Ratio analysis.
2. Fund flow analysis.
3. Budgeting.
1. RATIO ANALYSIS
A ratio is a simple arithmetical expression onenumber to another. The technique of ratio analysiscan be employed for measuring short-term liquidity orworking capital position of a firm. The followingratios can be calculated for these purposes:
1. Current ratio.
2. Quick ratio
3. Absolute liquid ratio
4. Inventory turnover.
5. Receivables turnover.
6. Payable turnover ratio.
7. Working capital turnover ratio.
8. Working capital leverage
9. Ratio of current liabilities to tangible networth.
2. FUND FLOW ANALYSIS
Fund flow analysis is a technical device designatedto the study the source from which additional fundswere derived and the use to which these sources wereput. The fund flow analysis consists of:
a. Preparing schedule of changes of workingcapital
b. Statement of sources and application offunds.
It is an effective management tool to study thechanges in financial position (working capital)business enterprise between beginning and ending ofthe financial dates.
3. WORKING CAPITAL BUDGET
A budget is a financial and / or quantitativeexpression of business plans and polices to bepursued in the future period time. Working capitalbudget as a part of the total budge ting process of abusiness is prepared estimating future long term andshort term working capital needs and sources tofinance them, and then comparing the budgeted figureswith actual performance for calculating thevariances, if any, so that corrective actions may betaken in future. He objective working capital budgetis to ensure availability of funds as and needed, andto ensure effective utilization of these resources.The successful implementation of working capitalbudget involves the preparing of separate budget foreach element of working capital, such as, cash,inventories and receivables etc.
ANALYSIS OF SHORT – TERM FINANCIAL POSITION OR TESTOF LIQUIDITY
The short –term creditors of a company such assuppliers of goods of credit and commercial banksshort-term loans are primarily interested to knowthe ability of a firm to meet its obligations intime. The short term obligations of a firm can bemet in time only when it is having sufficient liquidassets. So to with the confidence of investors,creditors, the smooth functioning of the firm andthe efficient use of fixed assets the liquidposition of the firm must be strong. But a very highdegree of liquidity of the firm being tied – up incurrent assets. Therefore, it is important properbalance in regard to the liquidity of the firm. Two
types of ratios can be calculated for measuringshort-term financial position or short-term solvencyposition of the firm.
1. Liquidity ratios.
2. Current assets movements ‘ratios.
A) LIQUIDITY RATIOS
Liquidity refers to the ability of a firm to meetits current obligations as and when these becomedue. The short-term obligations are met by realizingamounts from current, floating or circulating assts.The current assets should either be liquid or nearabout liquidity. These should be convertible in cashfor paying obligations of short-term nature. Thesufficiency or insufficiency of current assetsshould be assessed by comparing them with short-termliabilities. If current assets can pay off thecurrent liabilities then the liquidity position issatisfactory. On the other hand, if the currentliabilities cannot be met out of the current assetsthen the liquidity position is bad. To measure theliquidity of a firm, the following ratios can becalculated:
1. CURRENT RATIO
2. QUICK RATIO
3. ABSOLUTE LIQUID RATIO
1. CURRENT RATIO
Current Ratio, also known as working capital ratiois a measure of general liquidity and its mostwidely used to make the analysis of short-termfinancial position or liquidity of a firm. It isdefined as the relation between current assets andcurrent liabilities. Thus,
CURRENT RATIO = CURRENT ASSETS
CURRENTLIABILITES
The two components of this ratio are:
1) CURRENT ASSETS
2) CURRENT LIABILITES
Current assets include cash, marketable securities,bill receivables, sundry debtors, inventories andwork-in-progresses. Current liabilities includeoutstanding expenses, bill payable, dividend payableetc.
A relatively high current ratio is an indicationthat the firm is liquid and has the ability to payits current obligations in time. On the hand a lowcurrent ratio represents that the liquidity positionof the firm is not good and the firm shall not beable to pay its current liabilities in time. A ratioequal or near to the rule of thumb of 2:1 i.e.current assets double the current liabilities isconsidered to be satisfactory.
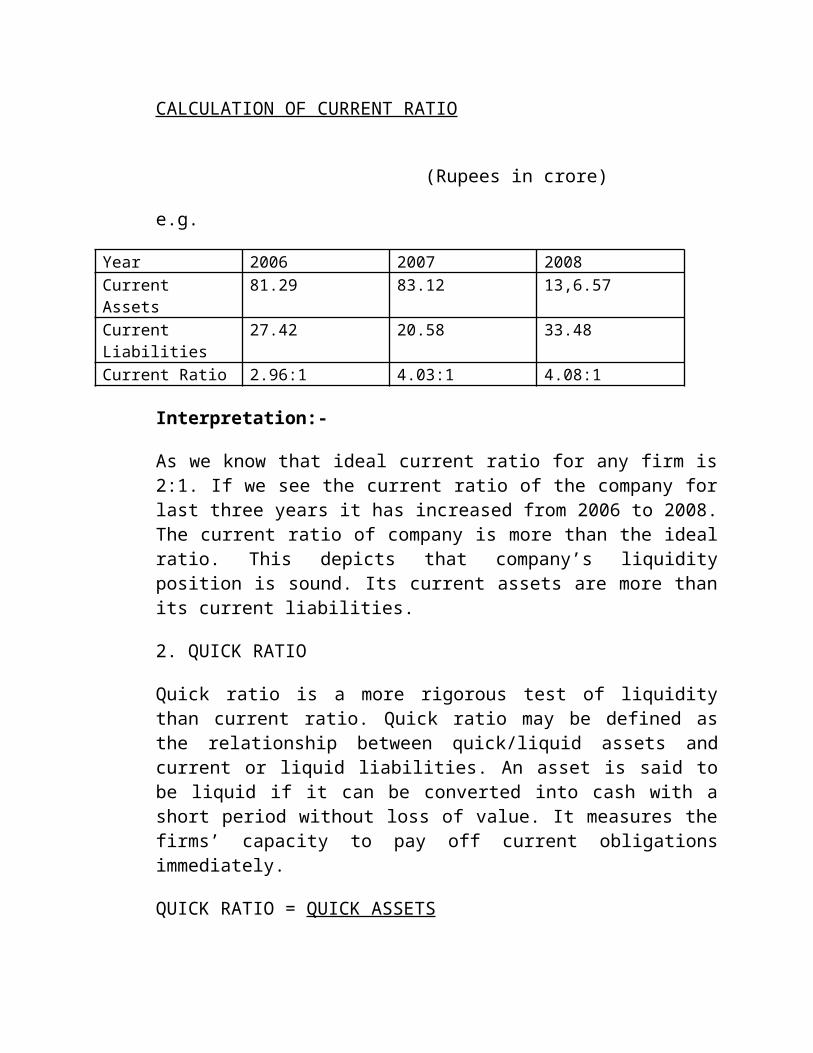
CALCULATION OF CURRENT RATIO
(Rupees in crore)
e.g.
Year 2006 2007 2008CurrentAssets
81.29 83.12 13,6.57
CurrentLiabilities
27.42 20.58 33.48
Current Ratio 2.96:1 4.03:1 4.08:1
Interpretation:-
As we know that ideal current ratio for any firm is2:1. If we see the current ratio of the company forlast three years it has increased from 2006 to 2008.The current ratio of company is more than the idealratio. This depicts that company’s liquidityposition is sound. Its current assets are more thanits current liabilities.
2. QUICK RATIO
Quick ratio is a more rigorous test of liquiditythan current ratio. Quick ratio may be defined asthe relationship between quick/liquid assets andcurrent or liquid liabilities. An asset is said tobe liquid if it can be converted into cash with ashort period without loss of value. It measures thefirms’ capacity to pay off current obligationsimmediately.
QUICK RATIO = QUICK ASSETS
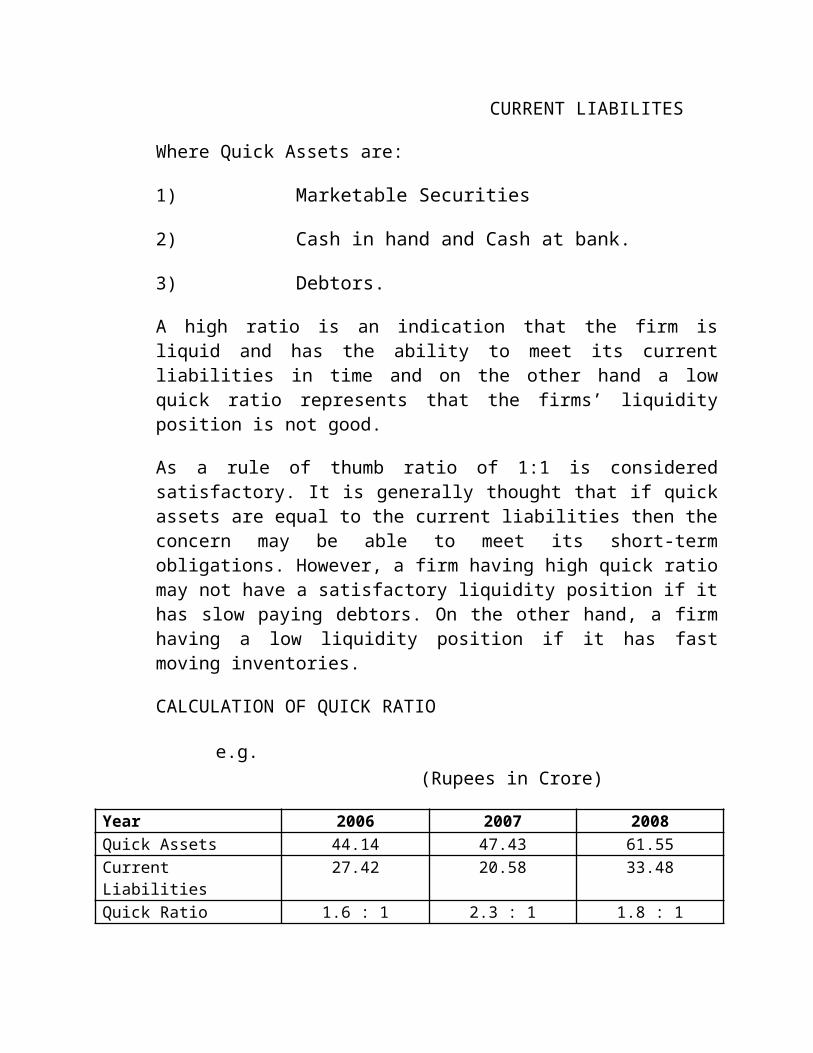
CURRENT LIABILITES
Where Quick Assets are:
1) Marketable Securities
2) Cash in hand and Cash at bank.
3) Debtors.
A high ratio is an indication that the firm isliquid and has the ability to meet its currentliabilities in time and on the other hand a lowquick ratio represents that the firms’ liquidityposition is not good.
As a rule of thumb ratio of 1:1 is consideredsatisfactory. It is generally thought that if quickassets are equal to the current liabilities then theconcern may be able to meet its short-termobligations. However, a firm having high quick ratiomay not have a satisfactory liquidity position if ithas slow paying debtors. On the other hand, a firmhaving a low liquidity position if it has fastmoving inventories.
CALCULATION OF QUICK RATIO
e.g. (Rupees in Crore)
Year 2006 2007 2008Quick Assets 44.14 47.43 61.55CurrentLiabilities
27.42 20.58 33.48
Quick Ratio 1.6 : 1 2.3 : 1 1.8 : 1
Interpretation :
A quick ratio is an indication that the firmis liquid and has the ability to meet its currentliabilities in time. The ideal quick ratio is 1:1.Company’s quick ratio is more than ideal ratio. Thisshows company has no liquidity problem.
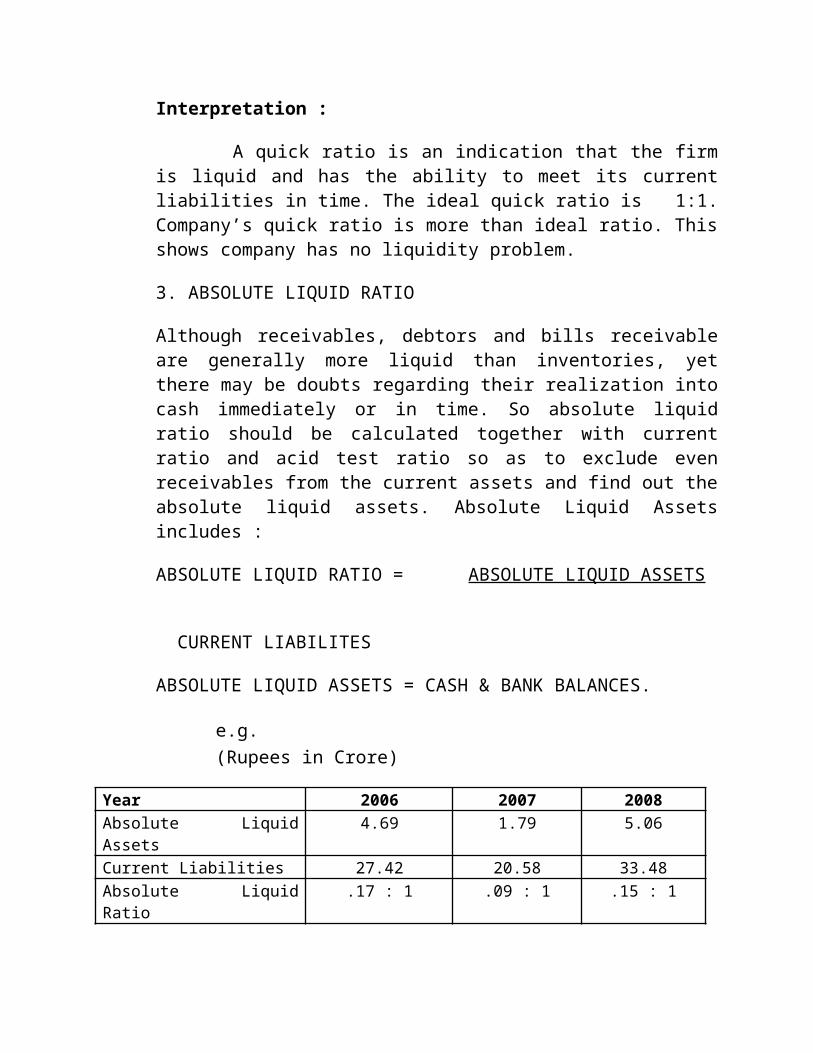
3. ABSOLUTE LIQUID RATIO
Although receivables, debtors and bills receivableare generally more liquid than inventories, yetthere may be doubts regarding their realization intocash immediately or in time. So absolute liquidratio should be calculated together with currentratio and acid test ratio so as to exclude evenreceivables from the current assets and find out theabsolute liquid assets. Absolute Liquid Assetsincludes :
ABSOLUTE LIQUID RATIO = ABSOLUTE LIQUID ASSETS
CURRENT LIABILITES
ABSOLUTE LIQUID ASSETS = CASH & BANK BALANCES.
e.g. (Rupees in Crore)
Year 2006 2007 2008Absolute LiquidAssets
4.69 1.79 5.06
Current Liabilities 27.42 20.58 33.48Absolute LiquidRatio
.17 : 1 .09 : 1 .15 : 1

Interpretation :
These ratio shows that company carries asmall amount of cash. But there is nothing to beworried about the lack of cash because company hasreserve, borrowing power & long term investment. InIndia, firms have credit limits sanctioned frombanks and can easily draw cash.
B) CURRENT ASSETS MOVEMENT RATIOS
Funds are invested in various assets in businessto make sales and earn profits. The efficiency withwhich assets are managed directly affects the volumeof sales. The better the management of assets, largeis the amount of sales and profits. Current assetsmovement ratios measure the efficiency with which afirm manages its resources. These ratios are calledturnover ratios because they indicate the speed withwhich assets are converted or turned over intosales. Depending upon the purpose, a number ofturnover ratios can be calculated. These are :
1. Inventory Turnover Ratio
2. Debtors Turnover Ratio
3. Creditors Turnover Ratio
4. Working Capital TurnoverRatio
The current ratio and quick ratio give misleadingresults if current assets include high amount ofdebtors due to slow credit collections and moreoverif the assets include high amount of slow moving
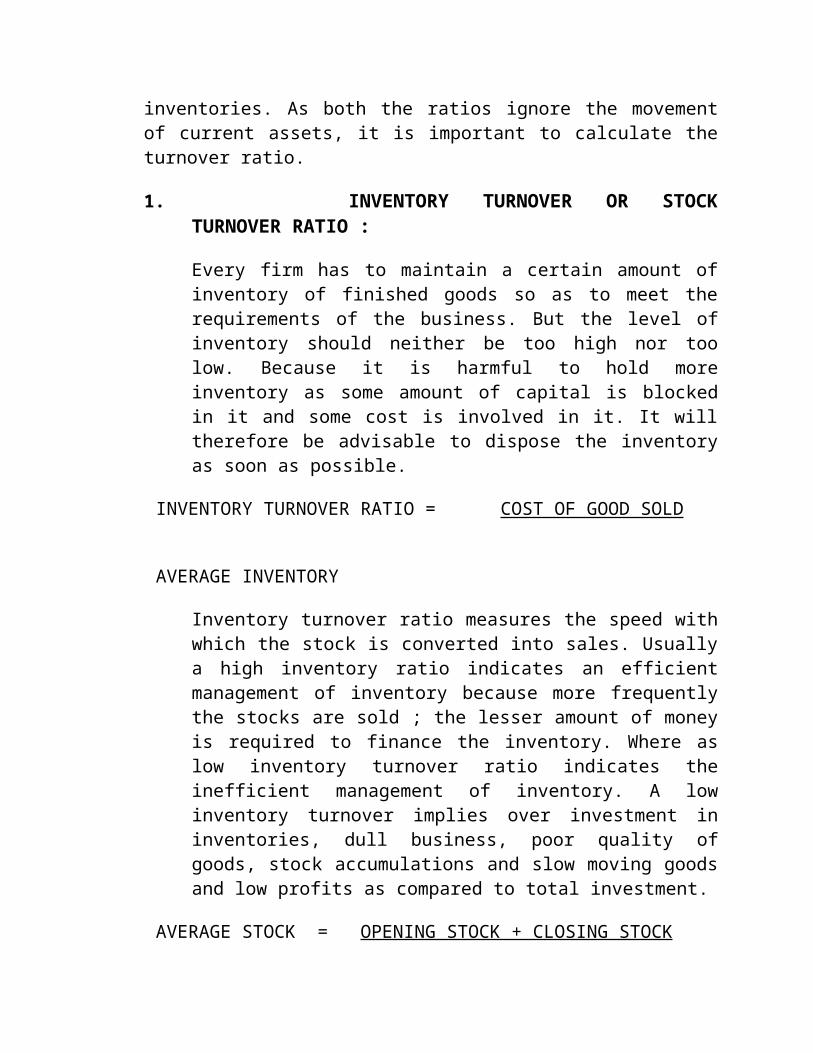
inventories. As both the ratios ignore the movementof current assets, it is important to calculate theturnover ratio.
1. INVENTORY TURNOVER OR STOCKTURNOVER RATIO :
Every firm has to maintain a certain amount ofinventory of finished goods so as to meet therequirements of the business. But the level ofinventory should neither be too high nor toolow. Because it is harmful to hold moreinventory as some amount of capital is blockedin it and some cost is involved in it. It willtherefore be advisable to dispose the inventoryas soon as possible.
INVENTORY TURNOVER RATIO = COST OF GOOD SOLD
AVERAGE INVENTORY
Inventory turnover ratio measures the speed withwhich the stock is converted into sales. Usuallya high inventory ratio indicates an efficientmanagement of inventory because more frequentlythe stocks are sold ; the lesser amount of moneyis required to finance the inventory. Where aslow inventory turnover ratio indicates theinefficient management of inventory. A lowinventory turnover implies over investment ininventories, dull business, poor quality ofgoods, stock accumulations and slow moving goodsand low profits as compared to total investment.
AVERAGE STOCK = OPENING STOCK + CLOSING STOCK
2
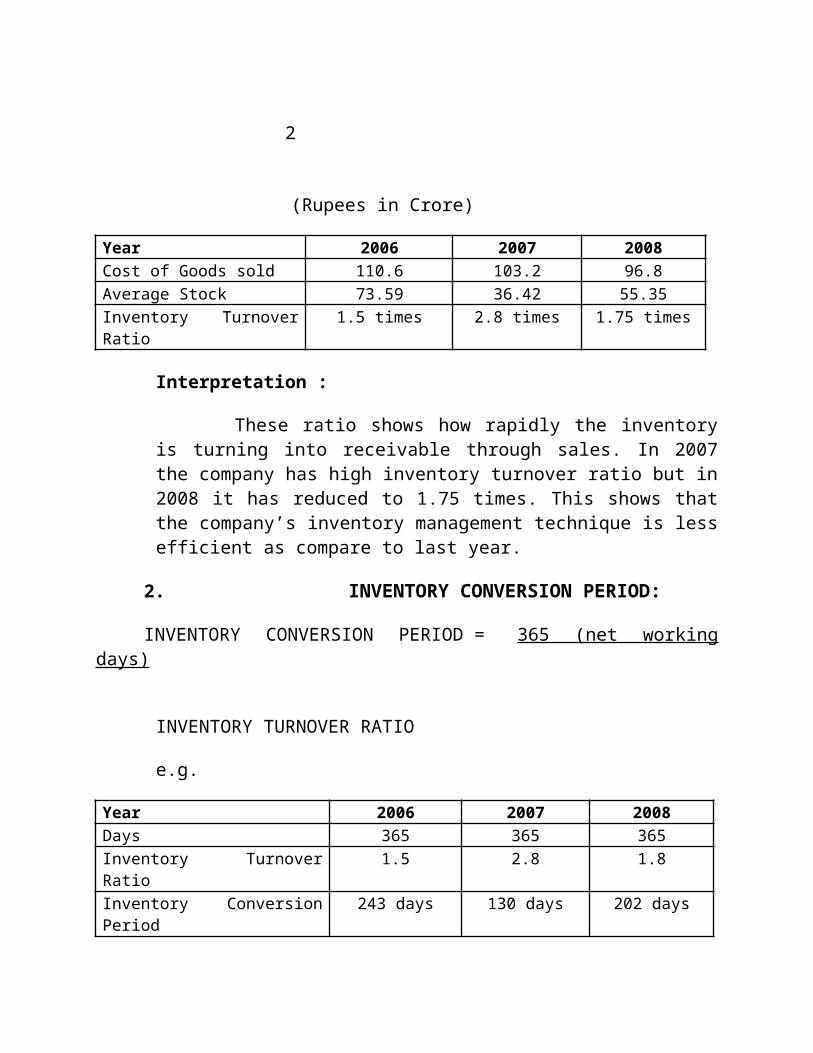
(Rupees in Crore)
Year 2006 2007 2008Cost of Goods sold 110.6 103.2 96.8Average Stock 73.59 36.42 55.35Inventory TurnoverRatio
1.5 times 2.8 times 1.75 times
Interpretation :
These ratio shows how rapidly the inventoryis turning into receivable through sales. In 2007the company has high inventory turnover ratio but in2008 it has reduced to 1.75 times. This shows thatthe company’s inventory management technique is lessefficient as compare to last year.
2. INVENTORY CONVERSION PERIOD:
INVENTORY CONVERSION PERIOD = 365 (net workingdays)
INVENTORY TURNOVER RATIO
e.g.
Year 2006 2007 2008Days 365 365 365Inventory TurnoverRatio
1.5 2.8 1.8
Inventory ConversionPeriod
243 days 130 days 202 days
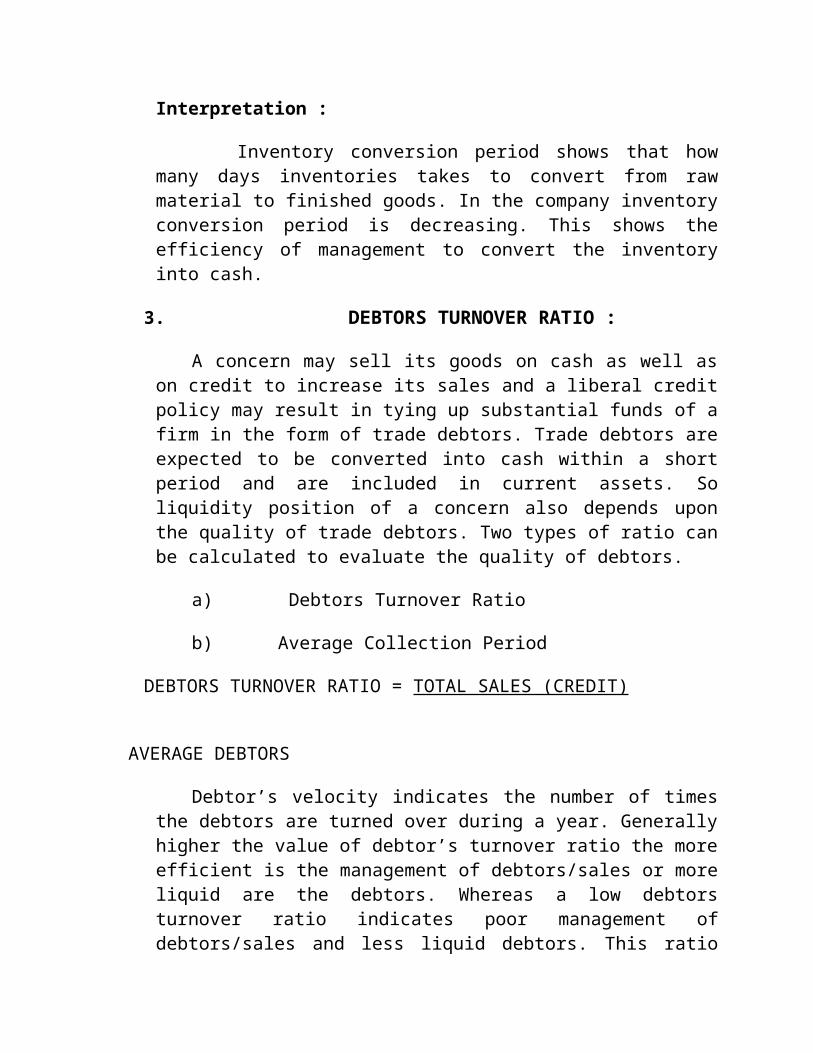
Interpretation :
Inventory conversion period shows that howmany days inventories takes to convert from rawmaterial to finished goods. In the company inventoryconversion period is decreasing. This shows theefficiency of management to convert the inventoryinto cash.
3. DEBTORS TURNOVER RATIO :
A concern may sell its goods on cash as well ason credit to increase its sales and a liberal creditpolicy may result in tying up substantial funds of afirm in the form of trade debtors. Trade debtors areexpected to be converted into cash within a shortperiod and are included in current assets. Soliquidity position of a concern also depends uponthe quality of trade debtors. Two types of ratio canbe calculated to evaluate the quality of debtors.
a) Debtors Turnover Ratio
b) Average Collection Period
DEBTORS TURNOVER RATIO = TOTAL SALES (CREDIT)
AVERAGE DEBTORS
Debtor’s velocity indicates the number of timesthe debtors are turned over during a year. Generallyhigher the value of debtor’s turnover ratio the moreefficient is the management of debtors/sales or moreliquid are the debtors. Whereas a low debtorsturnover ratio indicates poor management ofdebtors/sales and less liquid debtors. This ratio
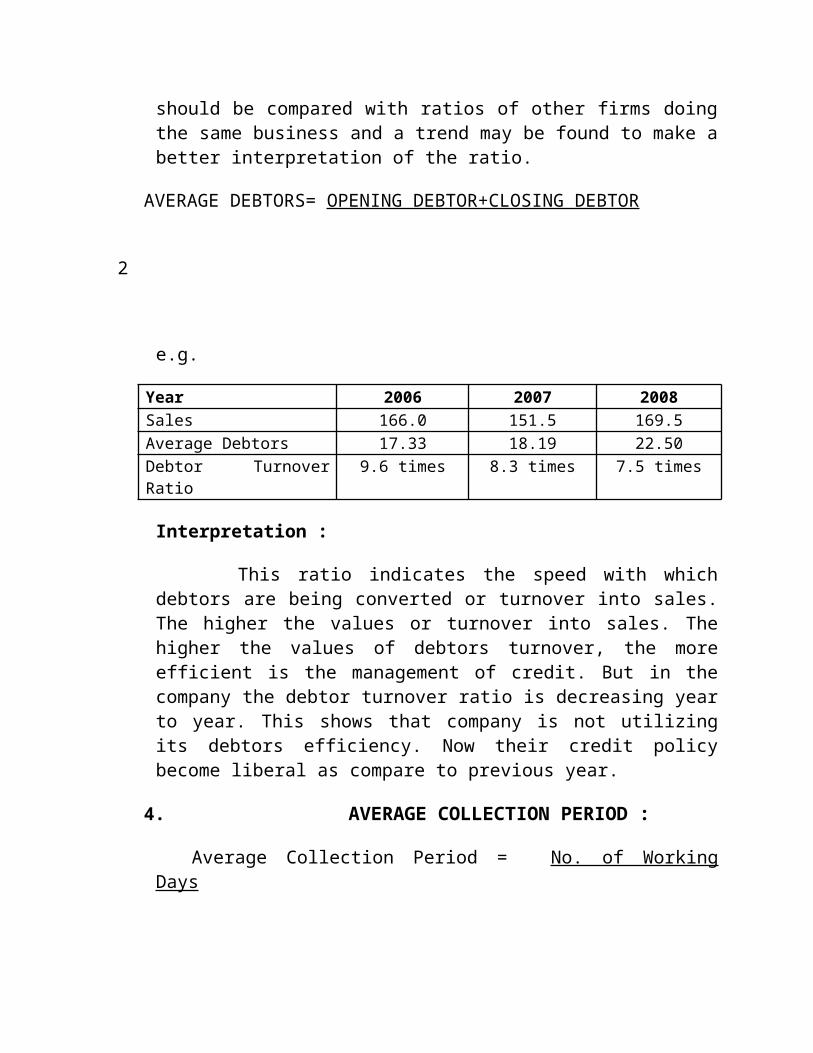
should be compared with ratios of other firms doingthe same business and a trend may be found to make abetter interpretation of the ratio.
AVERAGE DEBTORS= OPENING DEBTOR+CLOSING DEBTOR
2
e.g.
Year 2006 2007 2008Sales 166.0 151.5 169.5Average Debtors 17.33 18.19 22.50Debtor TurnoverRatio
9.6 times 8.3 times 7.5 times
Interpretation :
This ratio indicates the speed with whichdebtors are being converted or turnover into sales.The higher the values or turnover into sales. Thehigher the values of debtors turnover, the moreefficient is the management of credit. But in thecompany the debtor turnover ratio is decreasing yearto year. This shows that company is not utilizingits debtors efficiency. Now their credit policybecome liberal as compare to previous year.
4. AVERAGE COLLECTION PERIOD :
Average Collection Period = No. of WorkingDays
Debtors Turnover Ratio
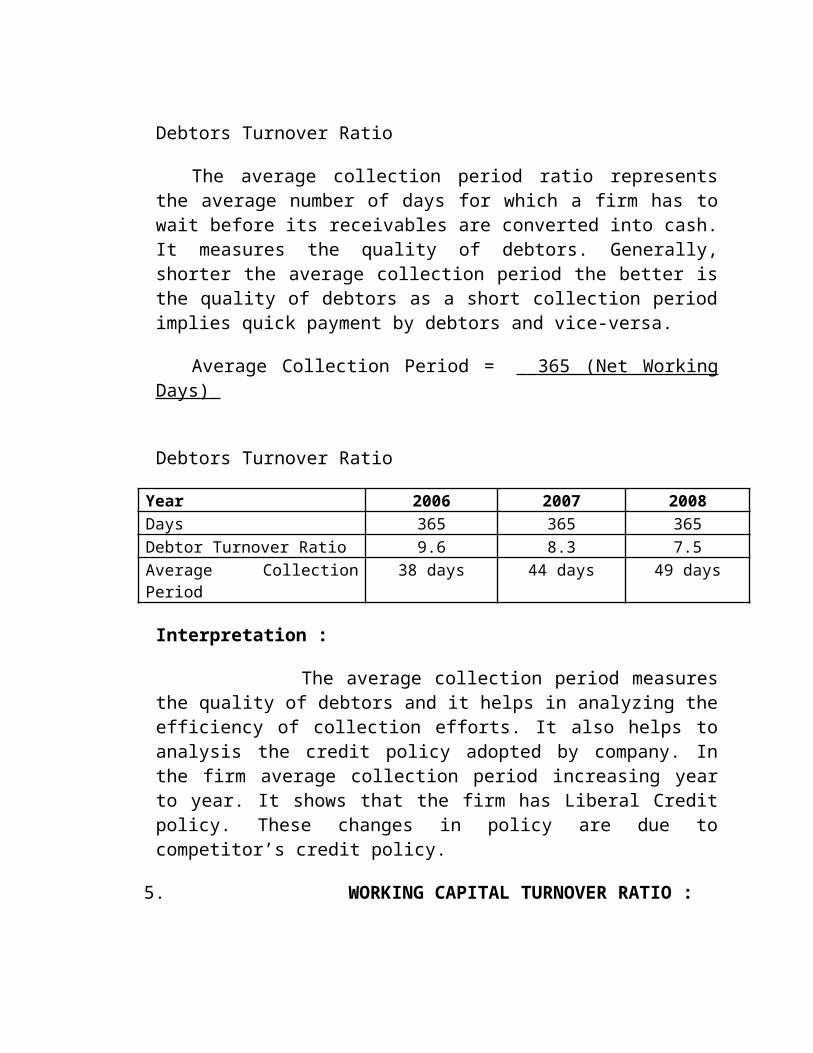
The average collection period ratio representsthe average number of days for which a firm has towait before its receivables are converted into cash.It measures the quality of debtors. Generally,shorter the average collection period the better isthe quality of debtors as a short collection periodimplies quick payment by debtors and vice-versa.
Average Collection Period = 365 (Net Working Days)
Debtors Turnover Ratio
Year 2006 2007 2008Days 365 365 365Debtor Turnover Ratio 9.6 8.3 7.5Average CollectionPeriod
38 days 44 days 49 days
Interpretation :
The average collection period measuresthe quality of debtors and it helps in analyzing theefficiency of collection efforts. It also helps toanalysis the credit policy adopted by company. Inthe firm average collection period increasing yearto year. It shows that the firm has Liberal Creditpolicy. These changes in policy are due tocompetitor’s credit policy.
5. WORKING CAPITAL TURNOVER RATIO :
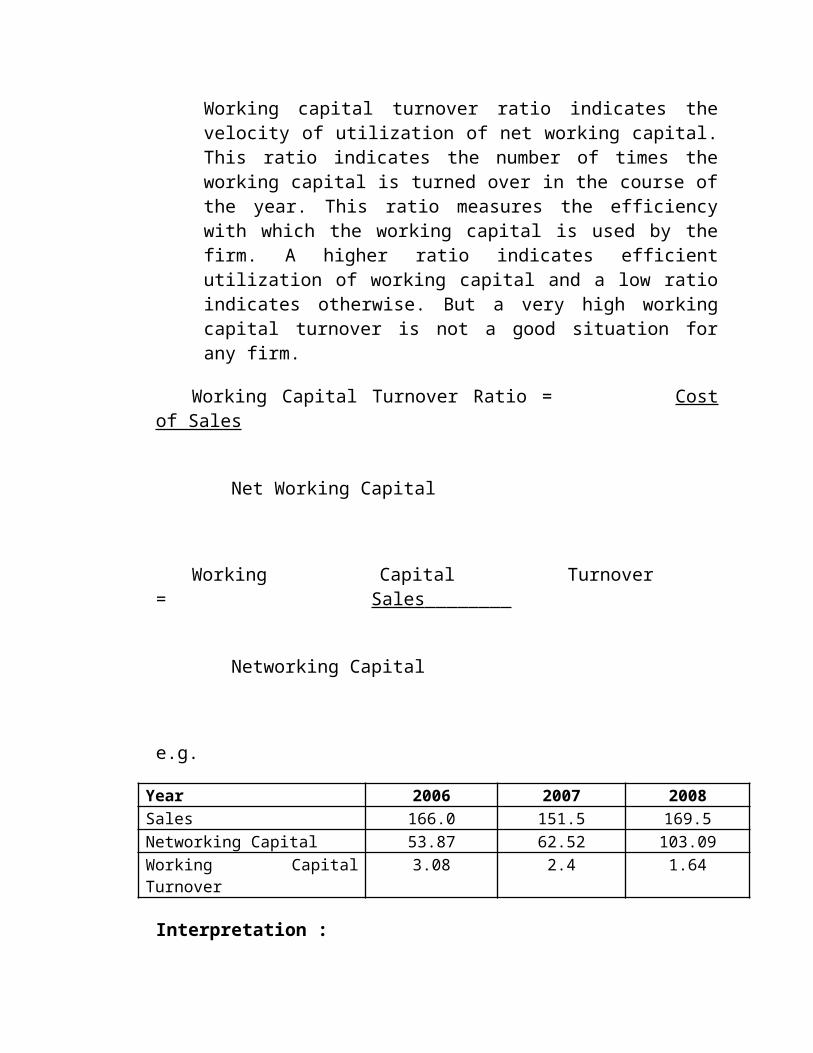
Working capital turnover ratio indicates thevelocity of utilization of net working capital.This ratio indicates the number of times theworking capital is turned over in the course ofthe year. This ratio measures the efficiencywith which the working capital is used by thefirm. A higher ratio indicates efficientutilization of working capital and a low ratioindicates otherwise. But a very high workingcapital turnover is not a good situation forany firm.
Working Capital Turnover Ratio = Costof Sales
Net Working Capital
Working Capital Turnover = Sales
Networking Capital
e.g.
Year 2006 2007 2008Sales 166.0 151.5 169.5Networking Capital 53.87 62.52 103.09Working CapitalTurnover
3.08 2.4 1.64
Interpretation :
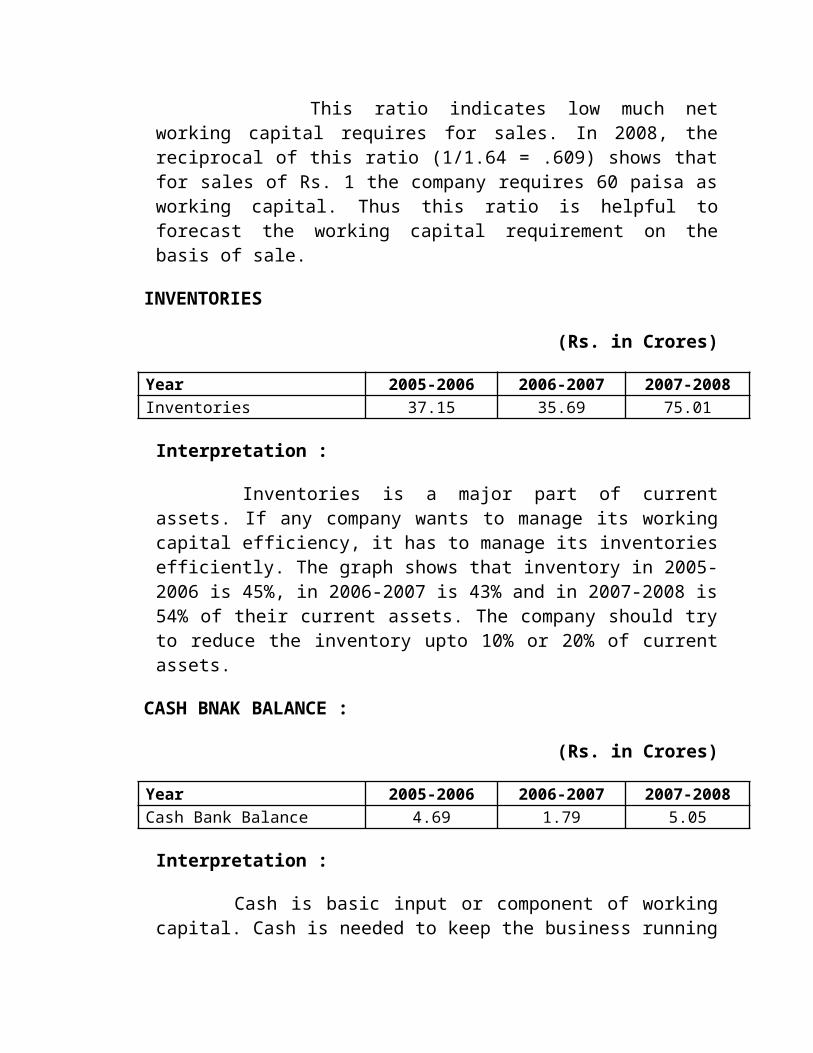
This ratio indicates low much networking capital requires for sales. In 2008, thereciprocal of this ratio (1/1.64 = .609) shows thatfor sales of Rs. 1 the company requires 60 paisa asworking capital. Thus this ratio is helpful toforecast the working capital requirement on thebasis of sale.
INVENTORIES
(Rs. in Crores)
Year 2005-2006 2006-2007 2007-2008Inventories 37.15 35.69 75.01
Interpretation :
Inventories is a major part of currentassets. If any company wants to manage its workingcapital efficiency, it has to manage its inventoriesefficiently. The graph shows that inventory in 2005-2006 is 45%, in 2006-2007 is 43% and in 2007-2008 is54% of their current assets. The company should tryto reduce the inventory upto 10% or 20% of currentassets.
CASH BNAK BALANCE :
(Rs. in Crores)
Year 2005-2006 2006-2007 2007-2008Cash Bank Balance 4.69 1.79 5.05
Interpretation :
Cash is basic input or component of workingcapital. Cash is needed to keep the business running
on a continuous basis. So the organization shouldhave sufficient cash to meet various requirements.The above graph is indicate that in 2006 the cash is4.69 crores but in 2007 it has decrease to 1.79. Theresult of that it disturb the firms manufacturingoperations. In 2008, it is increased upto approx.5.1% cash balance. So in 2008, the company has noproblem for meeting its requirement as compare to2007.
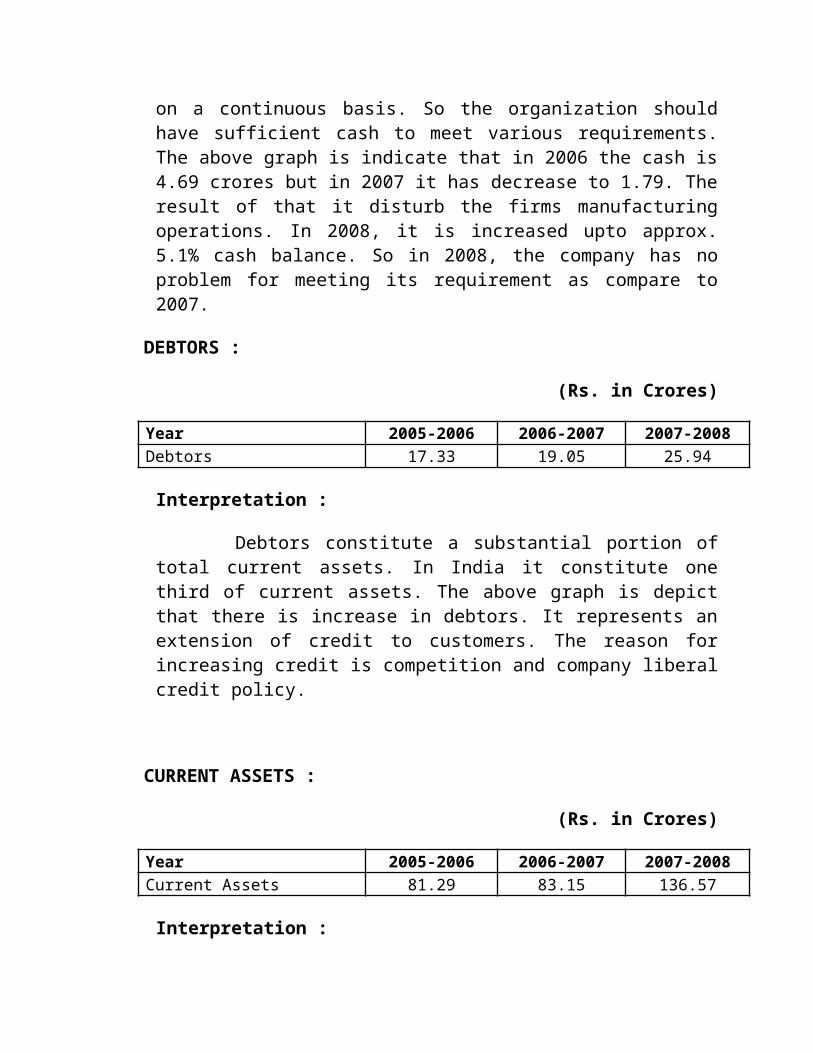
DEBTORS :
(Rs. in Crores)
Year 2005-2006 2006-2007 2007-2008Debtors 17.33 19.05 25.94
Interpretation :
Debtors constitute a substantial portion oftotal current assets. In India it constitute onethird of current assets. The above graph is depictthat there is increase in debtors. It represents anextension of credit to customers. The reason forincreasing credit is competition and company liberalcredit policy.
CURRENT ASSETS :
(Rs. in Crores)
Year 2005-2006 2006-2007 2007-2008Current Assets 81.29 83.15 136.57
Interpretation :
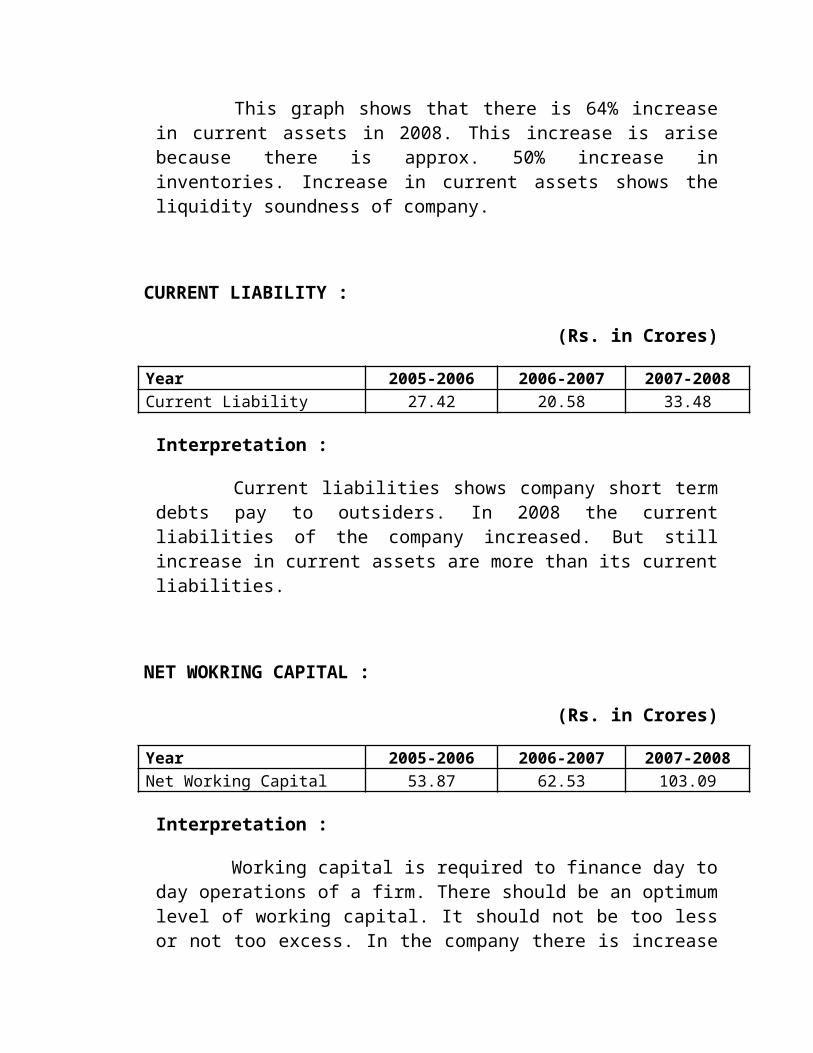
This graph shows that there is 64% increasein current assets in 2008. This increase is arisebecause there is approx. 50% increase ininventories. Increase in current assets shows theliquidity soundness of company.
CURRENT LIABILITY :
(Rs. in Crores)
Year 2005-2006 2006-2007 2007-2008Current Liability 27.42 20.58 33.48
Interpretation :
Current liabilities shows company short termdebts pay to outsiders. In 2008 the currentliabilities of the company increased. But stillincrease in current assets are more than its currentliabilities.
NET WOKRING CAPITAL :
(Rs. in Crores)
Year 2005-2006 2006-2007 2007-2008Net Working Capital 53.87 62.53 103.09
Interpretation :
Working capital is required to finance day today operations of a firm. There should be an optimumlevel of working capital. It should not be too lessor not too excess. In the company there is increase
in working capital. The increase in working capitalarises because the company has expanded itsbusiness.
RESEARCH METHODOLOGY
The methodology, I have adopted for my study is thevarious tools, which basically analyze criticallyfinancial position of to the organization:
I. COMMON-SIZE P/L A/C II. COMMON-SIZE BALANCE SHEET
III. COMPARTIVE P/L A/C
IV. COMPARTIVE BALANCE SHEET
V. TREND ANALYSIS
VI. RATIO ANALYSIS
The above parameters are used for critical analysis of financial position. With the evaluation of each component, the financial position from different angles is tried to be presented in well and systematic manner. By critical analysis with the help of different tools, itbecomes clear how the financial manager handles the finance matters in profitable manner in the critical challenging atmosphere, the recommendation are made whichwould suggest the organization in formulation of a
healthy and strong position financially with proper management system.
I sincerely hope, through the evaluation of various percentage, ratios and comparative analysis, the organization would be able to conquer its in efficienciesand makes the desired changes.
ANALYSIS OF FINANCIAL STATEMENTS
FINANCIAL STATEMENTS:
Financial statement is a collection of data organized according to logical and consistent accounting procedure to convey an under-standing of some financial aspects of a business firm. It may show position at a moment in time, as in the case of balance sheet or may reveal a series of activities over a given period of time, as in the case of an income statement. Thus, the term ‘financial statements’ generally refers to the two statements
(1) The position statement or Balance sheet.
(2) The income statement or the profit and loss Account.
OBJECTIVES OF FINANCIAL STATEMENTS:
According to accounting Principal Board of America (APB) states
The following objectives of financial statements: -
1. To provide reliable financial information about economic resources and obligation of a business firm.
2. To provide other needed information about charges in such economic resources and obligation.
3. To provide reliable information about change in net resources (recourses less obligations) missing out of business activities.
4. To provide financial information that assets in estimating the learning potential of the business.
LIMITATIONS OF FINANCIAL STATEMENTS:
Though financial statements are relevant and useful for aconcern, still they do not present a final picture a final picture of a concern. The utility of these statements is dependent upon a number of factors. The analysis and interpretation of these statements must be done carefully otherwise misleading conclusion may be drawn.
Financial statements suffer from the following limitations: -
1. Financial statements do not given a final picture of the concern. The data given in these statements is only approximate. The actual value can only be determined whenthe business is sold or liquidated.
2. Financial statements have been prepared for different accounting periods, generally one year, during the life of a concern. The costs and incomes are apportioned to different periods with a view to determine profits etc. The allocation of expenses and income depends upon the personal judgment of the accountant. The existence of
contingent assets and liabilities also make the statements imprecise. So financial statement are at the most interim reports rather than the final picture of thefirm.
3. The financial statements are expressed in monetary value, so they appear to give final and accurate position. The value of fixed assets in the balance sheet neither represent the value for which fixed assets can besold nor the amount which will be required to replace these assets. The balance sheet is prepared on the presumption of a going concern. The concern is expected to continue in future. So fixed assets are shown at cost less accumulated deprecation. Moreover, there are certainassets in the balance sheet which will realize nothing atthe time of liquidation but they are shown in the balancesheets.
4. The financial statements are prepared on the basis of historical costs Or original costs. The value of assets decreases with the passage of time current price changes are not taken into account. The statement are not prepared with the keeping in view the economic conditions. the balance sheet loses the significance of being an index of current economics realities. Similarly,the profitability shown by the income statements may be represent the earning capacity of the concern.
5. There are certain factors which have a bearing on the financial position and operating result of the business but they do not become a part of these statements becausethey cannot be measured in monetary terms. The basic limitation of the traditional financial statements comprising the balance sheet, profit & loss A/c is that they do not give all the information regarding the
financial operation of the firm. Nevertheless, they provide some extremely useful information to the extent the balance sheet mirrors the financial position on a particular data in lines of the structure of assets, liabilities etc. and the profit & loss A/c shows the result of operation during a certain period in terms revenue obtained and cost incurred during the year. Thus,the financial position and operation of the firm.
FINANCIAL STATEMENT ANALYSIS
It is the process of identifying the financial strength and weakness of a firm from the available accounting data and financial statements. The analysis is done
CALCULATIONS OF RATIOS
Ratios are relationship expressed in mathematical terms between figures, which are connected with each other in some manner.
CLASSIFICATION OF RATIOS
Ratios can be classified in to different categories depending upon the basis of classification
The traditional classification has been on the basis ofthe financial statement to which the determination ofratios belongs.
These are:-

Profit & Loss account ratios
Balance Sheet ratios
Composite ratios


