Embed Size (px)
Citation preview

Projection Patterns of CommissuralInterneurons in the Lumbar Spinal Cord
of the Neonatal Rat
MATHIS FRØSHAUG STOKKE,1 ULLA VIG NISSEN,2
JOEL C. GLOVER,2AND OLE KIEHN1*
1Department of Neuroscience, Karolinska Institutet, 171 77 Stockholm, Sweden2Department of Physiology, University of Oslo, 0317 Oslo, Norway
ABSTRACTWe have studied the axonal projection patterns of commissural interneurons (CINs) in
the neonatal rat spinal cord. Some CINs are integral components of the neuronal networks inthe vertebrate spinal cord that generate locomotor activity. By using differential retrogradelabeling protocols with fluorescent dextran amines, we show that CINs with ascending axons(ascending CINs, or aCINs) and CINs with descending axons (descending CINs, or dCINs)constitute largely different populations. We show that aCINs and dCINs occupy partiallyoverlapping domains in the transverse plane. The aCINs are located at the dorsal margin, withinthe dorsal horn, centrally within the intermediate zone, and in the medial region of the ventralhorn, whereas the dCINs are located predominantly among the ventral and central aCINs and insmaller numbers within the dorsal horn. The labeled aCINs and dCINs project for at least oneand a half segment rostrally or caudally and are present in roughly equal numbers. We alsodemonstrate the presence of a third, smaller population of CINs whose axons bifurcate to projectfor at least one and a half segment both rostrally and caudally (adCINs). The adCINs are locatedpredominantly among the central and ventral groups of aCINs and dCINs. Finally, we demon-strate the presence of CINs with axons projecting for fewer than one and a half segment in eitherdirection. These “short-range CINs” are intermingled with the aCINs, dCINs, and adCINs. Ourresults provide an anatomical framework for further electrophysiological studies aimed at iden-tifying the CINs that participate in the mammalian locomotor central pattern generator. J.Comp. Neurol. 447:349–359, 2002. © 2002 Wiley-Liss, Inc.
Indexing terms: retrograde tracing; fluorescent dextran-amines; central pattern generator;
locomotion
The lumbar region of the vertebrate spinal cord harborsa neuronal network that can generate rhythmic move-ments associated with locomotion, such as swimming andwalking. These networks are often called central patterngenerators (CPGs), because they can be stimulated in theisolated spinal cord to produce the underlying coordinatedrhythmic activity patterns (Grillner and Wallen, 1985;Rossignol, 1996; Kiehn et al., 1997). Detailed knowledge isavailable about the organization of locomotor CPGs inseveral nonmammalian species (Arshavsky et al., 1993;Grillner et al., 1995), but the anatomical and electrophys-iological characterization of the locomotor CPG in themammalian spinal cord is still limited. The object of thepresent study is to provide a detailed description of theprojection patterns of neurons whose axons cross to thecontralateral side of the spinal cord, called commissuralinterneurons (CINs). Because some CINs are necessarily
involved in the left/right coordination of muscle activityduring locomotion, such a description will assist in future
All authors participated in conducting the experiments reported herein;the last two authors contributed equally to the supervision of the work.
Grant sponsor: NIH; Grant number: 1R01NS40795-01; Grant sponsor:Karolinska Institutet; Grant sponsor: Nansen and Odd Fellow Founda-tions.
*Correspondence to: Dr. Ole Kiehn, Department of Neuroscience, Karo-linska Institutet, Retzius vag 8, 171 77 Stockholm, Sweden.E-mail: [email protected]
Received 28 June 2001; Revised 4 January 2002; Accepted 15 January2002
DOI 10.1002/cne.10211Published online the week of April 1, 2002 in Wiley InterScience (www.
interscience.wiley.com).
THE JOURNAL OF COMPARATIVE NEUROLOGY 447:349–359 (2002)
© 2002 WILEY-LISS, INC.

electrophysiological studies of this aspect of the locomotorCPG.
Based on studies of two nonmammalian vertebrate spe-cies, the Xenopus tadpole and the lamprey, the left/rightalternation during swimming is thought to be mediated bybilaterally located, caudally projecting commissural inter-neurons (Buchanan and Cohen, 1982; Arshavsky et al.,1993; Grillner et al., 1995; Buchanan, 1996, 1999a–c).These so-called CCINs inhibit interneurons and motorneurons on the contralateral side. They project over longdistances (for up to 15 segments) and have been shown tobe essential for rhythm generation in the lamprey(Buchanan, 1999a). CINs that project for shorter dis-tances of only two to five segments have also been found inthe lamprey (Ohta et al. 1991), but their function in loco-motion is not yet known.
In the neonatal rat, CINs have been found in the lumbarcord that project for up to six segments rostrally and/orcaudally (Eide et al., 1999). These are intersegmentalCINs with ascending and/or descending axons (aCINs anddCINs, respectively). The aCINs can be seen to clusterinto four groups, with locations at the dorsal margin,within the dorsal horn, centrally within the intermediatezone, and in the medial region of the ventral horn. ThedCINs have a slightly different organization, being clus-tered into two groups, one in a domain overlapping theventral and central groups of aCINs and one located in thedorsal horn. The dCINs correspond anatomically to theCCINs in the lamprey. Some dCINs have been shown to berhythmically active during fictive locomotion (Butt el al.,2001).
In the present study we investigate the organization ofCINs in the neonatal rat with the purpose of determiningwhether subgroups with different projection patterns ex-ist. In particular, we use differential retrograde labelingprotocols to assess 1) whether the aCINs and dCINs arecompletely separate populations or whether some CINsbifurcate to project both ascending and descending axonsand 2) whether there exist CINs with short-range axonswith projections restricted to one segment. As a startingpoint, we focus on one lumbar segment (L2). The reasonfor choosing the L2 segment is that the lower thoracic andupper lumbar cord (Th13–L2) has a high rhythmogenicpotential for locomotor generation compared with morecaudal regions (Cazalets et al., 1995; Kjaerulff and Kiehn,1996; Bracci et al., 1996; Cowley and Schmidt, 1997; Kre-mer and Lev-Tov, 1997; Tresch and Kiehn, 1999, 2000). Inprevious electrophysiological investigations of left/rightcoordination during fictive locomotion, we have also fo-cused on this region (Kjaerulff and Kiehn, 1997).
The distinction between aCINs and dCINs and betweenshort- and long-range CINs is important functionally be-cause such subtypes could channel information specifi-cally to distinct sets of target neurons. For example, sep-arate populations of aCINs and dCINs could selectivelyexcite and/or inhibit interneurons and motor neurons inrostral vs. caudal segments, a feature that could provide abasis for generating proper phase relationships amongflexors and extensors in opposite limbs. Short-range inhib-itory CINs, on the other hand, could be responsible forintrasegmental alternation, ensuring that the same mus-cles in opposite limbs are not coactivated. We find thatseparate populations of CINs do indeed exist, providingimportant anatomical information needed for further elec-trophysiological studies of the role of CINs in the produc-
tion of locomotion. Some of these data have been pre-sented in preliminary form (Stokke et al., 2000; Nissen etal., 2001).
MATERIALS AND METHODS
Dissection
Spinal cords were prepared from neonatal Wistar rats,aged P0–P4 (postnatal days). The rats were anesthetizedwith ether, decapitated, and eviscerated. Their spinalcords were removed by ventral laminectomy and transec-tion of the ventral and dorsal roots. The meninges wereremoved before application of tracers. During dissection,the cords were kept in ice-cold oxygenated Ringer’s solu-tion (in mM: 128 NaCl, 4.69 KCl, 25 NaHCO3, 1.18KH2PO4, 3.25 MgSO4, 0.25 CaCl2, and 22 glucose aeratedwith 5% CO2 in O2) as described previously (Kiehn et al.,1996; Eide et al., 1999). Experimental protocols were ap-proved by the local animal care committees and conformedto NIH guidelines.
Dextran-amine labeling
CINs were labeled retrogradely by applying crystals offluorescent dextran-amines [3,000 MW rhodamine dextran-amine (RDA), 3,000 MW fluorescein dextran-amine (FDA),or 10,000 MW green Alexa fluor 488 dextran (AlexaDA;Molecular Probes, Eugene, OR)] to cuts in the spinal cord,as described previously (Glover, 1995). Preparations werethen incubated in oxygenated Ringer’s solution at roomtemperature for 5–14 hours before immersion fixation (seebelow). Three differential labeling protocols were used.
The first labeling protocol was designed to assess therelative efficacies of FDA and RDA in labeling CINs fromthe ventral commissure or from the ventral funiculus. Inthis protocol, both tracers were applied to the same siteshortly after making the cut. In two preparations, tracerapplications were made at a sagittal cut through the ven-tral commissure along the entire L2 segment (Fig. 1A).Incubation was for 5 hours. The purpose of this applica-tion was to label all CINs crossing in the ventral commis-sure of L2 with both tracers. As shown in Figure 1B–D,virtually all labeled CINs were double labeled, indicatingthat FDA and RDA are equally effective in labeling CINsfrom the ventral commissure. This was evident on visualexamination of all sections from L2 in these two prepara-tions, followed by assiduous inspection of three or foursections from each preparation, where the total number ofCINs inspected was on the order of several hundred persection. In two other preparations, both tracers were ap-plied to a cut through the ventral funiculus at the level ofL1 (Fig. 1F). The purpose of this application was to com-pare the efficacies of FDA and RDA in labeling CINs overdistances longer than from the midline. As shown in Fig-ure 1G,H, labeling with each dye was strong for up to onesegment’s distance from the application site, but the in-tensity of FDA labeling became relatively weaker atgreater distances. This indicates that RDA is a more ef-fective tracer for labeling CINs from the ventral funiculusover distances of greater than one segment. Insofar as thedextran molecule is the principle object of transport ofdextran-amines, the difference in labeling by RDA andFDA presumably reflects the superior fluorescence prop-erties of rhodamine relative to fluorescein, such that RDAcan be seen at lower intracellular concentrations thanFDA.
350 M.F. STOKKE ET AL.

The second labeling protocol was designed to label dif-ferentially aCINs, dCINs, and adCINs (CINs with bothascending and descending axons; Fig. 2A). In 14 prepara-
tions, unilateral cuts were made through the ventral fu-niculus at the T13/L1 transition and at the L3/L4 transi-tion on the same side with a 15 minute interval, and
Fig. 1. Evaluation of tracer efficacies in labeling commissuralinterneurons (CINs). FDA and RDA were applied simultaneouslyeither to the ventral commissure (A) or to the ventral funiculus(F). B–E,G,H: Labeling of CINs in the L2 segment. B–D: Low-powerphotmicrographs of RDA-labeled CINs (B), FDA-labeled CINs (C),and double-labeled CINs (D) labeled from the same site in the ventralcommissure. Note that most cells are labeled with both FDA andRDA. E: Transverse view showing example of a CIN that escapedRDA labeling (circled). G,H: Low-power photomicrographs of RDA-
labeled CINs (G) and FDA-labeled CINs (H), labeled from the samesite in the ventral funiculus. Note that most cells are labeled withboth tracers but that the FDA labeling is relatively weaker in inten-sity in the dorsal horn compared with RDA labeling (encircled). A andF are ventral views of preparations. B–E and G,H are transverseviews of the hemicord contralateral to the application site, dorsalaspect at top. The midline is indicated by arrows. Scale bars � 100 �min B–D, 50 �m in E,G,H.
351PROJECTION PATTERNS OF COMMISSURAL INTERNEURONS

different dextran-amines were applied to the two cut sur-faces immediately after cutting. In half of the prepara-tions, RDA was applied at T13/L1 and FDA or AlexaDA atL3/L4, and in the other half of the preparations the tracerswere reversed. The preparations were then incubated for9–14 hours to allow retrograde labeling of the aCINs anddCINs.
The three-segment distance between application sites inthe ventral funiculus in this second labeling protocol waschosen based on two considerations. First, we wanted asmany CINs labeled in L2 as possible. Because the numberof labeled cells decreases with increasing distance fromthe application site (see Eide et al., 1999), the applicationshad to be close to L2. Second, we sought a correspondencewith the third labeling protocol (see below), in which weinvestigated whether there exist CINs projecting only in-trasegmentally, as opposed to the aCINs and dCINs thatproject for several segments longitudinally. With this inmind, we had to ensure that all cells labeled in the secondlabeling protocol projected for at least one and a halfsegment longitudinally to differentiate them from short-range CINs projecting for fewer than one and a half seg-ment (see next paragraph).
The third labeling protocol was designed to label withRDA all aCINs and dCINs in L2 whose axons project,respectively, to L1 and L3, and then to label with FDA allCINs in L2 that have axons in the ventral commissure(Fig. 3A). The aim of this labeling protocol was to identifyCINs whose axons project for under one segment eitherrostrally or caudally (“short-range CINs”). In 19 prepara-tions, cuts were made through the ventral funiculus mid-way along the rostrocaudal extent of ventral roots L1 andL3, and RDA was applied to the cut surfaces. This dis-tance was the shortest distance that allowed us to distin-guish between the application sites in the ventral funicu-lus and the ventral commissure. The preparations werethen incubated for 10–12 hours to allow retrograde label-ing of the aCINs and dCINs. Then, a sagittal cut wasmade through the ventral commissure to the depth of thecentral canal along the rostrocaudal extent of ventral rootL2, and FDA was applied to this cut. The preparationswere then incubated for another 5 hours to allow retro-grade labeling of all CINs in L2, including those alreadylabeled by RDA, that project in the ventral commissure. Ifthe labeling of CIN axons is complete at each injectionsite, then all RDA-labeled CINs would also be labeled withFDA, and any CIN labeled with FDA but not RDA wouldnecessarily have axons restricted to the region betweenthe two RDA applications. Because the FDA applicationdid not extend from the one to the other RDA applicationsite, however, CINs in L2 that have axons crossing atlevels rostral or caudal to L2 (should they exist) would belabeled with RDA alone. To test this possibility, in six ofthe 19 preparations, the midline was completely split,except at the L2 segment prior to tracer application (seeFig. 3A).
Tissue processing
After incubation, spinal cords were immersion fixed in4% paraformaldehyde in 0.1 M phosphate buffer (pH 7.4)and stored at 4°C for up to 4 months. They were thencryoprotected in 20% or 30% sucrose in phosphate bufferovernight.
Before sectioning, an approximately five-segment-longstretch of the thoracolumbar spinal cord centered on the
L2 segment was isolated, embedded in Tissue-Tek, andfrozen on dry ice or in liquid nitrogen. Transverse cryostatsections were cut at 30 �m for characterization of aCINs,dCINs, and adCINs or at 50 �m for characterization ofshort-range CINs and collected onto precoated glass slides(Superfrost; Menzel-Glaser). The sections were allowed todry briefly onto the slides before they were fixed in 4%paraformaldehyde in 0.1 M phosphate buffer for 15 min-utes. The slides were then kept in 0.1 M phosphate bufferin a refrigerator until analysis (1–12 weeks later).
Photography and analysis
Photographs were taken of selected sections using aLeica MPS 60 camera mounted on a Leica DMRXA fluo-rescence microscope with filters appropriate for RDA andFDA/AlexaDA. For final illustrations, slides (Fujichrome1600 ASA) were scanned into Adobe Photoshop 5.0 usinga Nikon LS2000 scanner.
Quantification
For quantification, labeled cells were plotted andcounted using the MicroTrace program (Leergaard andBjaalie, 1995). The FDA/AlexaDA cells were plotted first,because they had weaker labeling and because FDA fadedmore rapidly when excited to fluorescence. All double-labeled cells, based on initial plots of FDA/AlexaDA- andRDA-labeled cells, were then checked by switching man-ually among the RDA, the FDA, and a combined FDA/RDA filter, while changing the focus slightly. This wasnecessary to avoid classifying superimposed single-labeledcells as double-labeled cells. Upon confirmation of doublelabeling with this manual check, the cells were classifiedand plotted as adCINs. The remaining cells were classifiedas either aCINs or dCINs. The counts from each plot werecollected and transferred to a spreadsheet (Microsoft Ex-cel) for further analysis.
RESULTS
Distribution of aCINs, dCINs, and adCINs
In a previous study we demonstrated the presence ofpartially overlapping aCIN and dCIN populations in thelumbar cord of the neonatal rat (Eide et al., 1999). Theregion of overlap was predominantly in the central andventromedial part of the spinal cord, indicating that someof the CINs in this region could be adCINs, that is, CINswith both ascending and descending axon branches.
As described in Materials and Methods, aCINs, dCINs,and adCINs within the L2 segment were differentiallylabeled by applying different dextran-amine tracers to theventral funiculus between the T13 and the L1 segmentsand between the L3 and the L4 segments. Single labeledcells (red or green) were classified as either aCINs ordCINs, whereas double-labeled cells (yellow) were classi-fied as adCINs with bifurcating axons (Fig. 2A).
Successful labeling, defined as situations in which la-beling by each tracer was sufficiently strong and complete,was obtained in 10 of 14 preparations. In the remainingpreparations, the labeling of one or both dyes was tooweak for reliable counting. Counts and distributions ob-tained from successful labeled preparations were verysimilar despite the fact that we applied tracers to the twodifferent sites in different combinations. There was, how-ever, a trend for the counts obtained with RDA (the more
352 M.F. STOKKE ET AL.
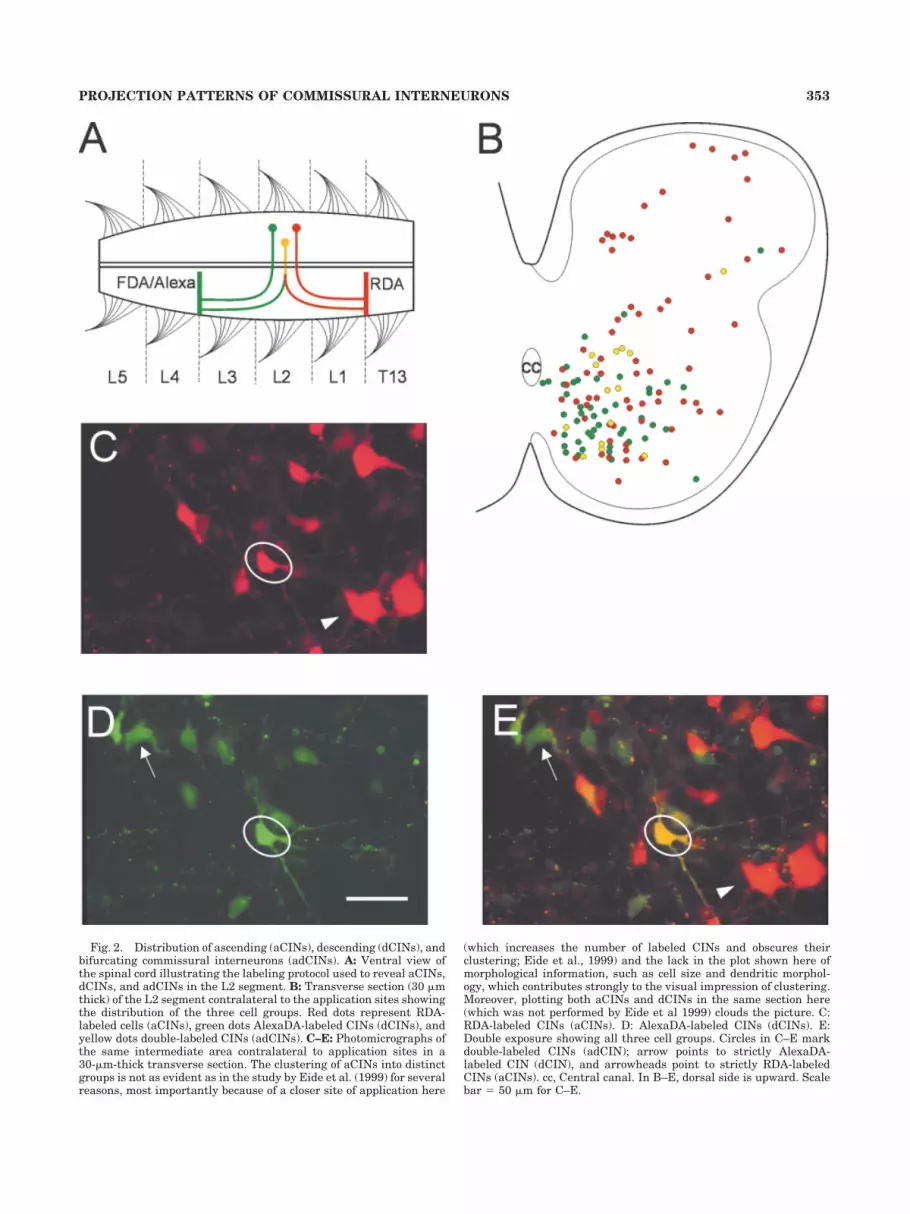
Fig. 2. Distribution of ascending (aCINs), descending (dCINs), andbifurcating commissural interneurons (adCINs). A: Ventral view ofthe spinal cord illustrating the labeling protocol used to reveal aCINs,dCINs, and adCINs in the L2 segment. B: Transverse section (30 �mthick) of the L2 segment contralateral to the application sites showingthe distribution of the three cell groups. Red dots represent RDA-labeled cells (aCINs), green dots AlexaDA-labeled CINs (dCINs), andyellow dots double-labeled CINs (adCINs). C–E: Photomicrographs ofthe same intermediate area contralateral to application sites in a30-�m-thick transverse section. The clustering of aCINs into distinctgroups is not as evident as in the study by Eide et al. (1999) for severalreasons, most importantly because of a closer site of application here
(which increases the number of labeled CINs and obscures theirclustering; Eide et al., 1999) and the lack in the plot shown here ofmorphological information, such as cell size and dendritic morphol-ogy, which contributes strongly to the visual impression of clustering.Moreover, plotting both aCINs and dCINs in the same section here(which was not performed by Eide et al 1999) clouds the picture. C:RDA-labeled CINs (aCINs). D: AlexaDA-labeled CINs (dCINs). E:Double exposure showing all three cell groups. Circles in C–E markdouble-labeled CINs (adCIN); arrow points to strictly AlexaDA-labeled CIN (dCIN), and arrowheads point to strictly RDA-labeledCINs (aCINs). cc, Central canal. In B–E, dorsal side is upward. Scalebar � 50 �m for C–E.
353PROJECTION PATTERNS OF COMMISSURAL INTERNEURONS

effective tracer; see Materials and Methods) to be skewedtoward higher values than the counts obtained with theother two dyes on comparing counts from the same appli-cation site. Figure 2B shows a typical example of thedistribution of the three CIN populations in the trans-verse plane of the L2 segment. As previously observed(Eide et al., 1999), aCINs (red) were located at the dorsalmargin, within the dorsal horn, centrally within the in-termediate area, and in the ventromedial area. The maincluster of dCINs (green) occupied a domain overlappingthe ventral and central aCINs. Smaller numbers of dCINswere present in the dorsal horn. In all preparations, theadCINs (yellow) were concentrated in the central andventral part of the cord, although occasional adCINs wereseen in the dorsal horn.
The total number of CINs labeled per section (39 sec-tions in 10 preparations) in L2 ranged from 86 to 188(mean 135). The adCINs constituted the smallest propor-tion [17.0% � 10.5% (mean � SD), n � 10], whereas theaCINs (42.0% � 15.2%) and the dCINs (41.0% � 8.0%)made up larger and approximately equal proportions, al-though there was a trend for the aCIN population topredominate over the dCIN population when RDA wasused as the rostral tracer. Statistical analysis using theMann-Whitney U-test showed significant differences inthe means of proportions for adCINs vs. aCINs (n � 10,U � 8, P � 0.001) and vs. dCINs (n � 10, U � 3.5, P �0.001), whereas there was no significant difference be-tween aCINs and dCINs (n � 10, U � 49, P � 0.08).
Short-range and long-range CINs
The procedure we used to identify short-range CINs wasto label all CINs in L2 by applying one tracer to themidline of that segment and to label differentially thesubset of these CINs that project rostrally or caudallybeyond the limits of L2 by applying a different tracer tothe ventral funiculus midway through L1 and midwaythrough L3. By elimination, those CINs that are not dou-bly labeled in this protocol are CINs with short-rangeaxons.
In designing this experiment, it was necessary to use atracer combination that gave the most complete retro-grade labeling possible from the respective applicationsites. Based on the control experiments described in Ma-terials and Methods, we found that the best labeling pro-tocol was obtained by applying RDA to the ventral funic-ulus and FDA to the midline.
If all axons were labeled at each application site by therespective tracers, then we would expect to see two popu-lations of labeled CINs, those that are double labeled(long-range, yellow CIN cell bodies in Fig. 3A) and thosethat are labeled only with FDA (short-range, green CINcell bodies in Fig. 3A). In fact, we observed three popula-tions of labeled CINs, the third being labeled only withRDA (Fig. 3B–I). These three populations were intermin-gled within the transverse plane of the cord. We quantifiedthe relative proportions of these groups in a total of 23sections from eight preparations, four with a midline splitsparing only L2. The total number of labeled CINs persection ranged from 100 to 214 (mean � 149). Double-labeled CINs represented a large proportion (39.7% �5.8%); a slightly smaller proportion (37.8% � 8.6%) waslabeled only with FDA, and the smallest proportion (22.6%� 5.9%) was labeled only with RDA (Fig. 4A).
Similar proportions of RDA labeled cells were present inthe preparations with (22.6% � 8.8; n � 4) and without(24.2% � 15.8; n � 4) a midline split sparing only L2,suggesting that the CINs labeled only with RDA probablydid not arise because their axons crossed the midlinerostral or caudal to L2. Therefore, the most straightfor-ward explanation for the unexpected population of CINslabeled only with RDA is that the dextran-amine tracersdid not label all axons from the application sites. Thiswould allow some axons of long-range CINs to escape FDAlabeling at the midline (“nonlabeling”; see Discussion).Similarly, some of the CINs labeled only with FDA couldin fact be long-range CINs that escaped RDA labelingfrom the ventral funiculus.
To assess theoretically how nonlabeling would influencethe proportions of the three labeled CIN populations, wecalculated a probability distribution that tested our as-sumption that short-range CINs actually exist. One wayto do this is to calculate the probability of obtaining single(RDA or FDA) and double (RDA-FDA) labeled CINs as-suming that RDA and FDA labeling at the applicationsites is suboptimal (varying from 10% to 90% of all axonsat the application site). Because all evidence (Glover et al.,1986) indicates that FDA and RDA are transportedequally well (although their fluorescence properties dif-fer), nonlabeling was set to covary with the same percent-age at the two application sites. In this calculation, wealso assume the worst-case scenario, namely, that noshort range CINs exist and that all single labeling is dueto suboptimal labeling at the application site. We reach,given these conditions, the probability distribution shownin Figure 4B. The numbers demonstrate that the propor-tions of neurons labeled only with FDA (open triangles) oronly with RDA (circles) do not exceed 25% of the totalnumber when nonlabeling (solid triangles) ranges from10% to 90% at the application site. Because the actualnumber of cells labeled only with FDA in our experimentswas about 40%, we conclude that the conditions of ourworst-case scenario are not met. In other words, at leastsome of the cells labeled only with FDA actually representshort-range CINs. Indeed, this calculation suggests thatat least one-third of the cells labeled only with FDA (40 —25)/40 � 37.5%) are short-range CINs with axons that donot project as far as mid-L1 or mid-L3. Figure 4B alsodemonstrates that the cells labeled only with RDA could
Fig. 3. Experimental protocol and results for short-range commis-sural interneurons. A: Ventral view of the spinal cord showing thelabeling protocol. RDA was applied at t � 0 to the ventral funiculus atthe level of ventral roots L1 and L3 and allowed 8 hours to label CINsretrogradely in the contralateral L2 segment. FDA was applied to themidline at 8.15 hours and allowed 6 hours of transport time beforefixation. Only the ventral commissure of the L2 segment is shownintact. B,C: Overview of RDA- and FDA-labeled CINs in the hemicordcontralateral to application site. Arrowheads in B and C indicate themidline. D–F: Photomicrographs of the same ventromedial area, con-tralateral to application sites, showing RDA-labeled CINs (D), FDA-labeled CINs (E), and both populations in a double exposure (F). G–I:Photomicrographs of the same intermediate area contralateral to theapplication sites, showing RDA-labeled CINs (G), FDA-labeled CINs(H), and both populations in a double-exposure (I). B–I are horizontalviews with dorsal side upward. Arrows point to strictly FDA-labeledcells (short-range CINs). Double-labeled cells (long-range CINs) areencircled. Arrowheads point to strictly RDA-labeled cell (see text).Scale bars � 100 �m in B,C, 50 �m in D–I.
354 M.F. STOKKE ET AL.

Figure 3

have resulted purely from suboptimal labeling at the ap-plication site (see Discussion).
DISCUSSION
In this study, we show that the CINs partially charac-terized in a previous study (Eide et al., 1999) constitutesubpopulations distinguishable by selective retrograde la-beling protocols: CINs with ascending axons (aCINs),CINs with descending axons (dCINs), and CINs with ax-ons that bifurcate and project for at least one and a halfsegment in each direction (adCINs). Moreover, we have
demonstrated the existence of another population of CINs,with axons projecting for fewer than one and a half seg-ment in either direction (“short-range CINs”). Eide et al.(1999) showed that the aCINs and dCINs of the lumbarspinal cord project for up to five or six segments, withincreasing numbers projecting for shorter distances. Wetherefore differentiate between long-range CINs thatproject for one and a half to six segment (aCINs, dCINs,and adCINs) and short-range CINs that project for fewerthan one and a half segment. A schematic overview ofthese different CIN groups is shown Figure 5. We notethat the sharp distinction between long-range and short-range CINs may be anatomically artificial, insofar as thelabeling protocols we have used do not discriminate be-tween a graded population of axon lengths and a stepfunction of axon lengths.
In accordance with our previous study (Eide et al.,1999), we have restricted our attention here to the upperlumbar cord (more specifically, the L2 segment). ClearlyCINs are not only localized to this segment but are dis-tributed along the entire spinal cord (see Eide et al., 1999,and Silos-Santiago and Snider, 1992, and referencestherein). However, by focusing on one segment, it has beenpossible to perform a detailed quantification of the num-ber of cells and their distributions. We have chosen L2because the lower thoracic and upper lumbar segments(Th13–L2) play a pivotal role in locomotor generation inmammals (Cazalets et al., 1995; Kjaerulff and Kiehn,1996; Cowley and Schmidt, 1997; Kremer and Lev-Tov,1997; Kiehn and Kjaerulff, 1998; Tresch and Kiehn, 1999,2000). Preliminary data from more caudal and rostrallumbar segments indicate that the organization of CINs atleast qualitatively is similar to that described for L2.
Long-range CINs
We show here that long-range CINs, some possible pro-jecting for up to six segments (although that was notshown directly in this study), can be classified into threedifferent subpopulations, based on axon projections. Most
Fig. 4. Influence of suboptimal labeling on the quantification ofpresumed short-range CINs. A: Proportions of CINs labeled only withRDA, CINs labeled only with FDA (presumed short-range CINs), anddouble-labeled CINs in the L2 segment contralateral to the applica-tion site. Data obtained from seven preparations. B: Graph showingthe theoretical distribution of the three categories of labeled CINs aswell as completely unlabeled CINs, assuming that short-range CINsdo not exist and given different efficacies of labeling (ranging from10% to 90%) at the ventral funiculus (RDA) and midline (FDA).Suboptimal labeling is set to covary with the same percentage at thetwo application sites, because RDA and FDA are taken up and trans-ported equally well. Note that the proportions of the four categories atany given labeling efficacy sum to 100%, meaning that as labelingefficacy approaches zero the proportion of of unlabeled cells ap-proaches 100%, whereas as labeling efficacy approaches 100% theproportion of double-labeled cells approaches 100%. See text for fur-ther details.
Fig. 5. Schematic summary diagram depicting the different sub-populations of CINs. The axonal morphologies represent the minimalextents of projection consistent with the retrograde labeling results.Each subpopulation may contain CINs with bifurcating axons, butany additional axon branches present cannot extend to the othertracer application sites.
356 M.F. STOKKE ET AL.

of the long-range CINs have either an axon projecting formore than one and a half segment in the caudal directionor an axon projecting for more than one and a half seg-ment in the rostral direction. Some or all of these mayhave bifurcating axons, but the two branches must in thatcase be highly asymmetrical, with one branch projectingfor fewer than one and a half segment. A minor proportionof the long-range CINs, about 17%, comprises adCINswith axons that definitely bifurcate to project for morethan one and a half segments both rostrally and caudally.The results from this study confirm the distribution in thetransverse plane of aCINs and dCINs observed in ourprevious study (Eide et al., 1999; see also legend to Fig.2b). The new observation is that adCINs indeed exist andthat they are concentrated in the intermediate and ven-tral areas, areas that contain at least some essential ele-ments of the neuronal network responsible for locomotorgeneration in the neonatal rat (Kiehn and Kjaerulff,1998). In the mammalian spinal cord, CINs with bifurcat-ing axons have been demonstrated previously only in thecat by using intraaxonal labeling (Matsuyama and Mori,1998).
CINs comparable to the long-range CINs described hereare found in lower vertebrates, such as the Xenopus tad-pole and the lamprey (Arshavsky et al., 1993; Grillner etal., 1995). In these nonmammalian species, CINs are alsofound with bifurcating axons that project one long axonbranch caudally and another short axon branch rostrally(see Buchanan, 1982, 1996; Soffe et al., 2001). In thelamprey, CINs with either descending or bifurcating ax-ons have been termed CCINs. The CCINs have large cellbodies and are part of a continuum of neurons with axonsof different lengths, including CCINs with projections forfewer than five and up to 15 segments. Such a continuumis probably also present in the mammalian spinal cord(see Eide et al., 1999). The main reason we differentiateCINs into long-range (projecting for more than one andone-half segments) and short-range (projecting for fewerthan one and one-half segments) classes is that these CINsubpopulations may have different functional roles (seebelow).
Short-range CINs
An important observation in the present study is that apopulation of short-range CINs exists. We estimate, basedon the considerations outlined below, that short-rangeCINs represent about 10–15% of the total number of CINsin the L2 segment.
An unexpected result obtained with the labeling proto-col we used to demonstrate short-range CINs was thepresence of CINs labeled only with RDA. These neuronscould have been labeled in three possible ways.
The first possibility is that some of the axons labeled atthe ventral funiculus crossed at segmental levels rostralor caudal to the segmental level of the midline FDA ap-plication. This means that the axons of these CINs wouldhave projected longitudinally and ipsilaterally for up toone segment length away from the soma before crossingthe midline. If this were the case, we should have seen asmaller proportion of CINs labeled only with RDA in thoseexperiments in which we isolated the L2 segment by split-ting the midline at more rostral and caudal levels. How-ever, the proportion of CINs labeled only with RDA wasthe same with and without the split. Thus, we concludethat, if CINs with axons crossing the midline at levels
rostral or caudal to the FDA application at L2 exist at all,they are present in numbers too low to influence ourresults significantly. We note in this regard that severalother studies have demonstrated that CINs in the embry-onic and neonatal spinal cord of birds and mammalsproject their axons across the midline at the same level astheir somata (Eide and Glover, 1996; Eide et al., 1999, andreferences therein).
The second possibility is that some of the CIN axonslabeled from the ventral funiculus crossed in the dorsalcommissure and, therefore, escaped labeling by the FDAapplied to the ventral commissure. A labeling study in theadult rat spinal cord, performed by Petko and Antal(2000), demonstrates the existence of a group of CINssituated in the lateral dorsal horn with axons that projectinto the opposite dorsal horn through the dorsal commis-sure. In preliminary experiments using retrograde label-ing with RDA, we have observed a similar group of dor-sally located dorsal CINs in 100–200-�m-thick slices fromthe lumbar spinal cord of newborn rats and mice (Lebretand Kiehn, unpublished). The presence of CINs with ax-ons crossing in the dorsal funiculus, therefore, may ac-count for some of the dorsal CINs labeled only with RDA.Ventrally located CINs with axons crossing in the dorsalcommissure have not been described to our knowledge.
The third possibility is that the labeling of axons withFDA at the ventral commissure was suboptimal. To assesswhether suboptimal labeling could influence the propor-tions of the different CIN subpopulations observed, wecompared our results with a theoretical probability distri-bution (Fig. 4B). In this distribution, the independentvariable is a presumed proportion of nonlabeled CINs, andthe dependent variables are the proportions of all labeledCINs in each of the three CIN subpopulations. As a con-dition for this distribution, we assumed that the labelingefficacy was the same for FDA and RDA. Our controllabeling experiments suggest that this is the case; FDAand RDA applications to the same site gave approximatelyequal numbers of cells labeled with the two tracers (Fig.1).
Comparison of our results with the theoretical distribu-tion shows that the proportion of cells labeled only withRDA can be explained by suboptimal FDA labeling. Moreimportantly, however, the comparison shows that the pro-portion of cells labeled only with FDA is greater thanwould be expected if these cells were the result of subop-timal RDA labeling. Theoretically, even if the efficacy oflabeling were only 50% or lower, the proportion of unla-beled axons at the midline (which would end up beinglabeled only with FDA) would not exceed 25% (Fig. 4B).Because we observed 35–40% of CINs labeled only withFDA, we conclude that about 10–15% of the total CINpopulation indeed represents a subpopulation of short-range CINs. We note that a similar proportion (about 10%)arises when we compare labeling of all CINs from themidline (average number of labeled CINs � 149 per sec-tion) with labeling of CINs only from the ventral funiculus(average number of labeled CINs � 135 per section). Thisdifference would be expected if short-range CINs werepresent.
Total number of CINs
A surprising result is that the number of CINs labeledfrom the ventral funiculus here is substantially larger (byabout sevenfold) than the number of CINs labeled from
357PROJECTION PATTERNS OF COMMISSURAL INTERNEURONS

the ventral funiculus in our previous study (Eide et al.,1999). This is clear when we compare the average numberof CINs per 30 �m section here (135) with the averagenumber of CINs labeled per 100 �m section in the previ-ous study (about 60).
There are several potential reasons for this large dis-crepancy. First, the results presented here are from the L2segment, whereas the only segment for which counts ofaCINs and dCINs can be combined in Eide et al. (1999) isL1. This is because in the previous study we labeled aCINsand dCINs not differentially in the same preparation butrather separately in different preparations, and in thesepreparations L1 is the only segment for which the distanceto the tracer application is the same as here. It is formallypossible, but in our opinion unlikely, that L1 containssubstantially fewer CINs than L2.
Second, the postnatal stages examined in the two stud-ies are not equivalent. Eide et al. (1999) examined P1–P2,whereas here we examined P0–P4. Based on the variabil-ity of the data we report here, however, it is unlikely thatan age-related increase in CIN numbers or axon lengthscan explain the discrepancy.
A more likely explanation for the discrepancy is that thetwo studies employed different tracers; dextran-amineshere and DiI in Eide et al.’s (1999) study. Apparently, DiIis substantially less effective in labeling CIN axons thandextran-amines. Given the difficulty of proving any axonallabeling method to be complete (without attempting ultra-structural confirmation), we suggest that quantitativestudies such as these must always carry the caveat ofpotential suboptimal labeling and, thereby, an underesti-mate of absolute numbers. What is clear from both studiesis that there are substantial numbers of CINs in thelumbar spinal cord of the neonatal rat and that thesediffer in their axonal projection patterns. Despite the ab-solute differences, the two studies provide similar quali-tative pictures of this organization. As techniques im-prove, we can expect to approach the true quantitativepicture more closely.
Functional considerations
Commissural interneurons constitute a large proportionof spinal interneurons and have a wide range of bothsensory and motor functions. Here we will limit our dis-cussion to CINs involved in the generation of hindlimblocomotory movements. CINs are integral parts of thelocomotor CPG; they are indispensable for coordinatingthe two hindlimbs in alternation (walking) or synchrony(hopping). Previous lesion experiments have shown thatnormal locomotion with left/right alternation persistswhen the dorsal part of the spinal cord has been removed,leaving the isolated ventral one-third of the spinal cordintact (Kjaerulff and Kiehn, 1996). The alternation be-tween the two sides of the cord disappears after cuttingthe ventral commissure. These experiments show thatventromedially located CINs with axons crossing in theventral commissure are necessary and sufficient for left/right alternation (Kjaerulff and Kiehn, 1996). From thepresent study, we now know that all four subtypes of CINsthat can be defined by axon projection [aCINs, dCINs,adCINs, and intrasegmental (short-range) CINs] arefound in the ventromedial region and have fibers crossingin the ventral commissure.
Because hindlimb flexor and extensor motor neuronshave different segmental distributions in the rat, the ac-
tivity that generates walking movements must create twoimportantly different patterns in the motor neurons: 1)alternation between flexors on opposite sides of the samesegments and between extensors on opposite sides of thesame segments and 2) synchrony in flexors and extensorson opposite sides of the cord in different segments (e.g.,right L2 and left L5; see Kiehn and Kjaerulff, 1996).Although we cannot attempt to ascribe any behavioralfunction to any of the labeled groups of CINs purely on thebasis of anatomical labeling, functional differences be-tween short- and long-range CINs in locomotor coordina-tion can be envisioned. Short-range inhibitory CINs couldbe responsible for segmental left/right alternation duringwalking, and short-range excitatory CINs could coordi-nate segmental left/right synchrony as seen during hop-ping. Long-range CINs, on the other hand, could be respon-sible for the longitudinal coordination of synergisticallyactive motor neuron pools located at different segmentallevels. The present study does not distinguish betweeninhibitory and excitatory CINs, but this is an obvious nextstep in the characterization of the various CIN subpopu-lations.
Assuming that many aspects of the organization of thelocomotor CPG in limbed vertebrates are likely to be evo-lutionary carryovers from nonlimbed vertebrates, theshort- and long-range CINs in the rat might have func-tional counterparts in the lamprey, Xenopus tadpole, andgoldfish (Dale, 1985; Fetcho, 1990; Buchanan, 1996,1999a–c; Soffe et al., 2001). In the lamprey, based onlesion studies, the CINs have been shown to be necessaryfor rhythm generation and to influence rhythmic activityfor up to about five segments in rostral and caudal direc-tions (Buchanan, 1999b,c). In addition to their rhythm-generating capability, they are believed to be responsiblefor the left/right alternation of activity in muscles on op-posite sides of the same segment. These findings indicatethat intersegmental CINs in the lamprey participate inrhythm generation but do not distinguish different rolesfor short- and long-range CINs.
The coordination of flexor and extensor muscles andtheir specific temporal activation patterns during walkingin a limbed animal is a more complex task than controllingthe undulatory swimming movements in a fish or tadpole.Furthermore, the flexibility of mammalian locomotor sys-tems is much greater than that of lower vertebrates, al-lowing for the production of many different gaits and theirfunctional adaptation across environments. Thus, despiteprobable phylogenetic similarities, the greater complexityand flexibility of mammalian locomotion suggests that theorganization of the mammalian locomotor network islikely to differ in important respects from the lamprey andtadpole swimming networks. We might expect a greaternumber of CINs to be involved as well as additional syn-aptic links between CINs and motor neurons (Kiehn andKjaerulff, 1998). The present study provides a more com-prehensive framework for further anatomical and electro-physiological study of the CINs and of their role in therhythm-generating network of the mammalian spinalcord.
ACKNOWLEDGMENTS
This work was supported by NIH grant 1R01NS40795-01 (O.K), the Karolinska Institutet (O.K), and the Nansenand Odd Fellow Foundations (J.C.G.).
358 M.F. STOKKE ET AL.

LITERATURE CITED
Arshavsky YI, Orlovsky GN, Panchin YV, Roberts A, Soffe SR. 1993.Neuronal control of swimming locomotion: analysis of the pteropodmollusc Clione and embryos of the amphibian Xenopus. Trends Neu-rosci 16:227–233.
Bracci E, Ballerini L, Nistri A. 1996. Localization of rhythmogenic net-works responsible for spontaneous bursts induced by strychnine andbicuculline in the rat isolated spinal cord. J Neurosci 16:7063–7076.
Buchanan JT. 1982. Identification of interneurons with contralateral cau-dal axons in the lamprey spinal cord: synaptic interactions and mor-phology. J Neurophysiol 47:961–975.
Buchanan JT. 1996. Lamprey spinal interneurons and their roles in swim-ming activity. Brain Behav Evol 48:287–296.
Buchanan JT. 1999a. Commissural interneurons in rhythm generationand intersegmental coupling in the lamprey spinal cord. J Neuro-physiol 81:2037–2045.
Buchanan JT. 1999b. Segmental distribution of common synaptic inputs tospinal motoneurons during fictive swimming in the lamprey. J Neuro-physiol 82:1156–1163.
Buchanan JT. 1999c. The roles of spinal interneurons and motoneurons inthe lamprey locomotor network. Progr Brain Res 123:311–321.
Buchanan JT, Cohen AH. 1982. Activities of identified interneurons, mo-toneurons, and muscle fibers during fictive swimming in the lampreyand effects of reticulospinal and dorsal cell stimulation. J Neurophysiol47:948–960.
Butt SJB, Lebret J, Kiehn O. 2001. Identification of commissural inter-neurons in the lumbar region of the neonatal rat spinal cord. SocNeurosci Abstr 31:306.10.
Cazalets JR, Borde M, Clarac F. 1995. Localization and organization of thecentral pattern generator for hindlimb locomotion in the newborn rat.J Neurosci 15:4943–4951.
Cowley KC, Schmidt BJ. 1997. Regional distribution of the locomotorpattern-generating network in the neonatal rat spinal cord. J Neuro-physiol 77:247–259.
Dale N. 1985. Reciprocal inhibitory interneurones in the Xenopus embryospinal cord. J Physiol 363:61–70.
Eide AL, Glover JC. 1996. The development of an identified interneuronpopulation in an amniote: the avian Hofmann cells. J Neurosci 16:5749–5761.
Eide AL, Glover J, Kjaerulff O, Kiehn O. 1999. Characterization of com-missural interneurons in the lumbar region of the neonatal rat spinalcord. J Comp Neurol 403:332–345.
Fetcho JR. 1990. Morphological variability, segmental relationships, andfunctional role of a class of commissural interneurons in the spinal cordof goldfish. J Comp Neurol 299:283–298.
Glover JC. 1995. Retrograde and anterograde axonal tracing with fluores-cent dextran-amines in the embryonic nervous system. Neurosci Prot30:1–13.
Glover JC, Petursdottir G, Jansen JKS. 1986. Fluorescent dextran-aminesused as axonal tracers in the nervous system of the chicken embryo.J Neurosci Methods 18:243–254.
Grillner S, Wallen P. 1985. Central pattern generators for locomotion, withspecial reference to vertebrates. Annu Rev Neurosci 8:233–261.
Grillner S, Deliagina T, Ekeberg O, El Manira A, Hill RH, Lansner A,
Orlowsky GN, Wallen P. 1995. Neural networks that co-ordinate loco-motion and body orientation in lamprey. Trends Neurosci 18:270–279.
Kiehn O, Kjaerulff O. 1996. Spatiotemporal characteristics of 5-HT anddopamine-induced rhythmic hindlimb activity in the in vitro neonatalrat. J Neurophysiol 75:1472–1482.
Kiehn O, Kjaerulff O. 1998. Distribution of central pattern generators forrhythmic motor outputs in the spinal cord of limbed vertebrates. AnnNY Acad Sci 860:110–129.
Kiehn O, Johnson BR, Raastad M. 1996. Plateau properties in mammalianspinal interneurons during transmitter-induced locomotor activity.Neuroscience 75:263–273.
Kiehn O, Hounsgaard J, Sillar KT. 1997. Basic buildings blocks of verte-brate central pattern generators. In: Stein PSG, Grillner S, Selverston,A, Stuart DG, editors. Neurons, networks and motor behavior. Cam-bridge, MA: MIT Press. p. 47–59.
Kjaerullf O, Kiehn O. 1996. Distribution of networks generating and coor-dinating locomotor activity in the neonatal rat spinal cord in vitro: alesion study. J Neurosci 16:5777–5794.
Kjaerulff O, Kiehn O. 1997. Crossed rhythmic synaptic input to motoneu-rons during selective activation of the contralateral spinal locomotornetwork. J Neurosci 17:9433–9447.
Kremer E, Lev-Tov A. 1997. Localization of the spinal network associatedwith generation of hindlimb locomotion in the neonatal rat and orga-nization of its transverse coupling system. J Neurophysiol 77:155–1170.
Leergaard TB, Bjaalie JG. 1999. Semi-sutomatic data acquisition for quan-titative neuroanatomy. MicroTrace—computer programme for record-ing of the spatial distribution of neuronal populations. Neurosci Res22:231–243.
Matsuyama K, Mori S. 1998. Lumbar interneurons involved in the gener-ation of fictive locomotion in cats. Ann NY Acad Sci 860:441–443.
Nissen UV, Jensen E, Kiehn O, Glover JC. 2001. Different projectionclasses of commissural interneurons in the developing lumbar spinalcord of rat, mouse, and chicken. Soc Neurosci Abstr 31:297.2.
Ohta Y, Dubuc R, Grillner S. 1991. A new population of neurons withcrossed axons in the lamprey spinal cord. Brain Res 564:143–148.
Petko M, Antal M. 2000. Propriospinal afferent and efferent connections ofthe lateral and medial areas of the dorsal horn (laminae I–IV) in thelumbar spinal cord. J Comp Neurol 422:312–325.
Rossignol S. 1996. Neural control of stereotypic limb movements. In: Hand-book of physiology, sect 12. Bethesda, MD: American Physiology Soci-ety. p 173–216.
Silos-Santiago I, Snider WD. 1992. Development of commissural neuronsin the embryonic rat spinal cord. J Comp Neurol 325:514–526.
Soffe SR, Zhao FY, Roberts A. 2001. Functional projection distances ofspinal interneurons mediating reciprocal inhibition during swimmingin Xenopus tadpoles. Eur J Neurosci 13:617–627.
Stokke MF, Kiehn O, Glover JC. 2000. Organization of commissural inter-neurons in the lumbar region of the spinal cord of the neonatal rat. SocNeurosci Abstr 26:1997.
Tresch MC, Kiehn O. 1999. The coding of the locomotor phase by popula-tions of interneurons in rostral and caudal segments of the neonatal ratlumbar spinal cord. J Neurophysiol 82:3563–3574.
Tresch MC, Kiehn O. 2000. Population reconstruction of the locomotorcycle from interneuron activity in the mammalian spinal cord. J Neu-rophysiol 83:1972–1978.
359PROJECTION PATTERNS OF COMMISSURAL INTERNEURONS


![[Lumbar spine pain] Болки в гърба и кръста](https://img.pdfslide.net/doc/110x75/633338d83d0bcb45f503fbf2/lumbar-spine-pain-bolki-v-grba-i-krsta.jpg)


