Embed Size (px)
Citation preview
Alexandra Valtanen
PROJECT COST ESTIMATION Promoting quality of cost estimation to reduce pro-
ject cost variance
Master of Science Thesis Faculty of Management and
Business Examiners: Prof. Teemu Laine
and Dr(Tech) Jari Paranko
February 2020
i
ABSTRACT
Alexandra Valtanen: Project Cost Estimation: promoting quality of cost estimation to reduce
project cost variance.
Master of Science Thesis, 116 pages
Tampere University
Master’s Degree Programme in Industrial Engineering and Management
Major: International Sales and Sourcing
Examiners: Professor Teemu Laine and Dr(Tech) Jari Paranko
February 2020
One of the dimensions of evaluating project success is assessing whether the project has been completed within the assigned budget. However, it is unlikely that the actual costs will be exactly as planned, and historically, industrial projects are prone to cost overruns. Careful plan-ning and a reasonable cost baseline are key to achieving project success. The cost baseline consists of the aggregated cost estimate and contingency reserve. Literature identifies various methods for increasing the reliability of the cost baseline via setting appropriate contingencies. However, there is a gap in the literature regarding the other of the two components of the project cost baseline – the cost estimate.
The objective of this thesis is to investigate and develop a method for reducing project cost variance by improving the quality of the cost estimation process in industrial project-based firms. The objective was achieved by observing the sales organization and the cost estimation proce-dure in the case company and identifying the underlying issue that results in the project cost variance. The method was developed by surveying the best available practices of cost estimation techniques and processes employed by industrial project organizations and synthesizing a holistic method for improving the quality of cost estimation and promoting knowledge management within an organization. From a practical perspective, the research offered the case company a new point of view on cost variances in terms of element-specific variances. This analysis revealed the need to update the cost estimation tools for specific elements in the company’s product portfolio. From a managerial perspective, the work emphasizes the information and procedural requirements of the cost estimation process. Furthermore, the work provides advice on employing alternative cost estimation techniques to balance resource utilization as well as making the process more lean.
A new risk category that roots from within the organization was identified and the findings of the thesis suggest that this category should not be a part of the contingency reserve. The internal foreseen risks can be managed with procedural changes. The thesis proposes a stage-gate standardized model for cost estimation, that guides the organization to select an appropriate cost estimation technique corresponding to the stage of project preparation. The findings suggest that the cost estimation process should be followed systematically, and to proceed with the process, all milestone requirements should be met. In addition, the role of the historical information data-base was deemed central to the quality of the cost estimate, making it imperative to accentuate diligent high-quality reporting and knowledge management practices.
Keywords: Cost estimation, Project cost variance, Cost overruns, Cost deviation, Reducing
cost variance, Method for cost estimation, Project management, Cost estimation accuracy, Lean The originality of this thesis has been checked using the Turnitin Originality Check service.
ii
PREFACE
Writing the Master of Science thesis truly feels like a stepping stone to professional life.
The work required every shred of knowledge I acquired as an environmental engineer
and a student in industrial engineering and management. The process of writing the the-
sis, however, revealed how much there is still to learn. As Confucius said: “I hear, and I
forget. I see and I remember. I do and I understand”. Hence, true learning is yet to begin.
I would like to express my deepest appreciation to Joni and Juhani, and the rest of the
steering team and colleagues from the case company, for their guidance and mentoring,
and the opportunity to gain invaluable first-hand experience. Special thanks to my col-
league and my friend Milena, who brightened up my days. I am also grateful to my su-
pervisors, Teemu Laine and Jari Paranko, for their guidance and feedback and for help-
ing me to see the value in this work. Finally, I thank my husband for his love, patience,
and continuous encouragement throughout my studies and the process of writing this
thesis.
Tampere, 24 February 2020
Alexandra Valtanen
iii
CONTENTS
1. INTRODUCTION .................................................................................................. 1
1.1 Theoretical background ........................................................................ 1
1.2 Objectives and scope ........................................................................... 2
1.3 Structure of the thesis .......................................................................... 3
2. RESEARCH PROCESS ........................................................................................ 5
2.1 Research process ................................................................................ 5
2.2 Research methodology and philosophy................................................ 8
2.3 Data-collection and generation methods ............................................ 11
3. PROJECT BUSINESS AND ORGANIZATION .................................................... 13
3.1 Project business and value management ........................................... 13
3.2 Project lifecycle and structure ............................................................ 16
3.3 Project risks and uncertainties ........................................................... 18
4. COST MANAGEMENT IN A PROJECT .............................................................. 22
4.1 Cost classification and cost incurrence............................................... 22
4.2 Basics of cost management ............................................................... 26
4.3 Cost estimation .................................................................................. 28
4.3.1 Cost estimation techniques ......................................................... 33 4.4 Budgeting and project control ............................................................. 37
4.4.1 Cost variance .............................................................................. 41 5. PROMOTING COST ESTIMATION QUALITY .................................................... 44
5.1 Challenges in cost estimation and budgeting ..................................... 44
5.2 Pitfalls of cost estimating and cost overruns ....................................... 47
5.2.1 Qualities of a good estimate ........................................................ 49 5.3 Estimation accuracy ........................................................................... 50
5.3.1 Importance of historical information in cost estimation ................ 54 5.4 Review of existing estimation accuracy boundaries............................ 56
5.5 Method for reducing variance through improved cost estimation
processes .......................................................................................................... 60
6. CASE COMPANY ............................................................................................... 67
6.1 Sales organization in the case company ............................................ 67
6.2 Cost estimation in the case company ................................................. 71
6.3 Cost variance analysis ....................................................................... 74
6.4 Current situation ................................................................................. 84
6.4.1 Perception of the current situation in the case company ............. 84 6.4.2 Process observations .................................................................. 86 6.4.3 Cost estimation process .............................................................. 89
6.5 Recommendations ............................................................................. 91
iv
6.6 Synthesis of the proposed process improvement ............................... 95
7. DISCUSSION AND LESSONS LEARNED ........................................................ 100
7.1 Application of the framework in the case company ........................... 100
7.2 Results of the intervention in the case company .............................. 101
7.3 Limitations of the paper and further research ................................... 103
8. CONCLUSION .................................................................................................. 106
APPENDIX A: GAO’S RECOMMENDATIONS FOR A HIGH-QUALITY COST
ESTIMATE ................................................................................................................ 117
APPENDIX B: ESTIMATION ACCURACY BOUNDARIES ................................... 118
APPENDIX C: CHALLENGES IN COST ESTIMATION QUESTIONNAIRE .......... 119
APPENDIX D: FEEDBACK COLLECTION FORM ............................................... 121
v
LIST OF FIGURES
Figure 1. Iterative research process. ..................................................................... 7 Figure 2. Thesis target goals. ................................................................................ 8 Figure 3. Research philosophies and approaches in a form of research
‘onion’ (adapted from Saunders et al., 2009). ....................................... 11 Figure 4. Contexts of managing projects (adapted from Artto and Kujala,
2008). .................................................................................................. 13 Figure 5. Project management constraints. ......................................................... 14 Figure 6. Customer perceived value and supplier’s profit (adapted from
Kotler and Keller, 2012, and Töytäri et al., 2011). ................................ 15 Figure 7. Project lifecycle. ................................................................................... 16 Figure 8. An example four-level WBS. ................................................................ 18 Figure 9. Internal foreseen risks .......................................................................... 20 Figure 10. Cost incurrence process (Tanaka et al., 1993). .................................... 23 Figure 11. Relative importance of decisions influencing costs. .............................. 24 Figure 12. Committed and actual costs throughout the project lifecycle. ............... 25 Figure 13. Project cost management. ................................................................... 26 Figure 14. Cost estimation process according to Stewart and Wyskida (1987). .... 29 Figure 15. Cost estimation process according to PMI PMBOK (2001)................... 30 Figure 16. Commonality in various cost estimation processes. ............................. 32 Figure 17. Three-point estimation. ........................................................................ 36 Figure 18. Aggregation of costs in a project (PMI PMBOK, 2017) ......................... 38 Figure 19. Setting budgetary and schedule contingency. ...................................... 39 Figure 20. EVM analysis (Taylor, 2007, p.164 and PMI PMBOK, 2017). ............... 41 Figure 21. The effect of deviations from the project plan. ...................................... 42 Figure 22. Freiman curve. ..................................................................................... 48 Figure 23. Sales funnel. ........................................................................................ 50 Figure 24. Accuracy of cost estimation versus time required for the
estimation. ........................................................................................... 52 Figure 25. Bundles of estimation techniques correlated with project’s stage. ........ 53 Figure 26. Accuracy of cost estimation at different stages of project planning. ...... 57 Figure 27. Project contingency (adapted from England and Moreci, 2012). .......... 62 Figure 28. Uncertainty model of cost estimation during project preparation. ......... 63 Figure 29. Systematic cost estimation promoting estimation quality and KM. ........ 65 Figure 30. Method for cost estimation in a project-based firm. .............................. 66 Figure 31. Project classification in the case company. .......................................... 67 Figure 32. The sales process in the case company............................................... 69 Figure 33. Division of responsibilities throughout the sales process. ..................... 70 Figure 34. Cost components in the case company. ............................................... 72 Figure 35. Results of the variance analysis. .......................................................... 77 Figure 36. Cost deviation breakdown into cost overruns and cost underruns. ....... 78 Figure 37. The magnitude of the effect of variance on the total project’s
budget cost. ......................................................................................... 79 Figure 38. Perception of the current situation: interview responses. ...................... 85 Figure 39. Recommended estimation methods for project preparation stages. ..... 92 Figure 40. Cost estimation process recommendation. ........................................... 96
vi
LIST OF TABLES
Table 1. Research timeline. .......................................................................................... 6 Table 2. Data-collection methods. .............................................................................. 11 Table 3. Example risk categories ................................................................................ 19 Table 4. Contents of the published cost estimate (Stewart and Wyskida, 1987). ........ 30 Table 5. Cost estimation process examples. .............................................................. 31 Table 6. Cost estimation techniques, literature review. ............................................... 33 Table 7. Challenges in cost estimation: summary. ...................................................... 46 Table 8. Cost estimation techniques and their accuracy boundaries........................... 63 Table 9. Scale for assessing the magnitude of the effect of variance on project’s
BC. ....................................................................................................... 80 Table 10. Elements with the highest variance and effect on the project budget. ......... 81 Table 11. Recommendations on the priority of element-specific variance
reduction. ............................................................................................. 82 Table 12. Cases where improved estimating procedures can decrease project
cost variance. ....................................................................................... 83
vii
LIST OF SYMBOLS AND ABBREVIATIONS
BAC Budget at completion BAP Best available practice BC Budget cost CBR Case-based reasoning CPV Customer perceived value CRM Continuous risk management CV Cost variance DoD Department of Defense DTC Design-to-cost EMV Expected monetary value ERP Enterprise resource planning EV Earned value (note: not to be confused with expected value) EVM Earned value management GAO US Government Accountability Office KM Knowledge Management NASA National Aeronautics and Space Administration PERT Problem evaluation and review technique RIDM Risk-informed decision-making SV Schedule variance TC Triple constraint TCM Target cost management VTC Value triple constraint WBS Work breakdown structure
1
1. INTRODUCTION
1.1 Theoretical background
The modern industrial environment is characterized by increasing product complexity
and a high degree of competitiveness (Hake, 1991). To differentiate from competitors,
industrial supplier organizations choose to focus on the customers’ needs and shift the
focus of their operations towards the customers (Gebauer et al., 2011). The customer-
oriented focus of operations entails providing innovative, tailored to the customer needs
solutions, which increases the seller’s potential to maximize delivered customer value
(Abetti, 2002). Delivery of complex customized solutions requires a wide range of internal
capabilities as well as management and inter-organizational mobility of these capabili-
ties, which is achievable through adopting a project-based organizational form (Gann
and Salter, 2000).
The project-based organizational form allows bringing together a wide variety of solutions
by combining different skills within a temporary entity of a project (Whitley, 2006). The
organizational capabilities and knowledge in project-based organizations are accumu-
lated through executed projects (Whitley, 2006), and hence it becomes imperative to
transform the gained knowledge into explicit form so that it can be transferred and ac-
cessed within the organization (Ulonska and Welo, 2014; Nonaka, 1991; Aliaga, 2000).
Effective knowledge management practices is one of the sources of organizational com-
petitive advantage (Meso and Smith, 2000). There are, however, challenges associated
with project business and achieving project success.
One of the dimensions of assessing a project’s success is completing the project within
the assigned budget (Atkinson, 1999; Kerzner and Kerzner, 2013, p.43; PMI PMBOK,
2001, p.29; Baratta, 2006; Pinto and Rouhiainen, 2001). Unfortunately, cost overruns
are a prevalent and often-times encountered issue that hinders project success (Kerzner
and Kerzner, 2013, p.778; Goh and Hall, 2011; Hicks, 1992; Shehu et al., 2014; Kwan
and Kang, 2018; Flyvbjerg et al., 2002; Bhargava et al., 2010). Kaplan (1975) states that
the actual project costs will rarely be the same as the planned budget costs. Due to
project complexity, implying numerous interactions between the elements within a pro-
ject system, it is challenging to identify the root cause leading to impaired performance
(Munier, 2014; Martinsuo, 2011). One of the oftentimes recognized major causes of cost
2
overruns is inadequate planning (Havranek, 2017; Shane et al., 2009; Venkataraman
and Pinto, 2008).
Constant cost overruns are a result of cost underestimation and are a threat to the seller’s
profitability, calling for advanced and enhanced practices of project planning (Chang,
2013; Asiedu and Gu, 1998). Deliberately increasing the cost estimate to compensate
for uncertainties is no longer acceptable in the modern customer-centric environment
with the purchasing power shifting towards the customer (Nicoletti, 2012, p.2). It is im-
perative to maximize the customer's perceived value for the customer to decide to invest
in a solution as well as the supplier’s profit for them to be incentivized to supply the
offering (Kotler and Keller, 2012). It follows that overestimating the costs is every bit as
dangerous as underestimating the costs, since overestimating may result in lost business
opportunities (Akintoye, 1998; Asiedu and Gu, 1998).
Cost variance is a concept used to describe project cost deviations between the planned
and the actual costs and describe whether the project spend exceeded the estimated
costs. Cost variance is calculated by subtracting the actual costs from the budgeted
costs, meaning that the positive cost variance implies cost savings, and negative – cost
overruns. Broyles and Lay (1982) discuss that there are favorable and unfavorable cost
variances, favorable being the cost savings and unfavorable – cost overruns. However,
the cost deviations occur as a result of inadequate planning, and a project can be com-
pleted within the assigned budget only if the cost estimate is of a high quality (Shane et
al., 2009). Coupled with the implications of the cost overestimation and underestimation,
it can be concluded that in the context of project business there are no favorable cost
variances, and to sustain the business operations, the seller must be able to produce a
high-quality precise cost estimate.
1.2 Objectives and scope
This thesis is a case study research that focuses on the challenges related to cost vari-
ances in a project-based case company. The objectives of the thesis were set based on
the goals that were set together with the senior sales & technology manager and the rest
of the project steering team in the case company, consisting of the product sales man-
ager, project manager, cost estimator, and project controller. The case company recog-
nized that there is a lot of cost variance within projects. The main areas of interest, as
well as desired outcomes of the research, consist of identifying why and where do the
cost variances occur as well as developing suggestions for the case company that would
reduce the project variance.
3
The literature on the reasons and causes for cost overruns in projects is abundant (Doloi,
2011; Torp and Klakegg, 2016; Flyvbjerg et al., 2002; Jørgensen et al., 2012; Skitmore
and Lowe, 1995). The literature also provides methods for managing the uncertainties
involved in cost estimation through risk analysis and contingency reserves (Shane et al.,
2009; Kwon and Kang, 2018). However, the literature on the topic of reducing cost vari-
ance as a result of developing internal organizational processes is limited. The focus of
the available literature is mostly on the cost overruns occurring due to external risk
events and factors. The implications of the cost deviations in general, being cost over-
runs and underruns rooted from within the organization and a method for reducing the
cost variances are not oftentimes discussed. Thus, the objective of this research is…
“…to develop a method for reducing project cost variance by improving the quality of the
cost estimation process in industrial project-based firms”.
Other areas of investigation that will support reaching the thesis objective include the
investigation of existing accepted project variance limits. Part of the research is aimed at
identifying what counts as an accurate enough estimate and what degree of cost vari-
ance is acceptable in the context of the project business. Additionally, a large part of the
research is dedicated to surveying the best available practices of cost estimation in pro-
ject-based firms. The objective of the casework consists of identifying the improvement
areas in the cost estimation as well as the root causes for project variance.
The scope of the research is limited to the product portfolio and operations of one de-
partment within the case company. The scope of the investigation is narrowed down
even further, as the case company’s goal is to investigate and improve procedures during
the sales phase of the project, implying that the research focuses on controllable cost
variances. In other words, the cost variances caused by external risks and external fac-
tors are not considered, when developing a method for reducing project variance.
1.3 Structure of the thesis
The thesis consists of eight chapters. The current chapter, being the first chapter, serves
as an introduction to the theme of the work as well as the definition of the scope and
objectives of the research. Chapter 2 concentrates on the research methods and re-
search processes employed throughout the thesis. The second chapter introduces how
a practical problem can be interpreted from a theoretical point of view, creating a general
theoretical framework solution to the type of problem through interventionist research
strategy.
4
Chapter 3 presents an insight into project business and project management as one of
the dimensions of managing project business. The chapter examines value management
in the context of project business as well as the project’s typical structure and lifecycle.
Then, challenges and uncertainties characteristic to projects are outlined to create a
common understanding of the uncertainty factors as well as define a separate new risk
category of internal foreseen risks that is relevant to this work.
Chapter 4 deals with the concept of cost management in the context of project manage-
ment. The process of cost incurrence is described alongside the basic principles and
guidelines of cost management. Thereafter, the cost estimation process and techniques
are reviewed. The chapter contains a survey of practices utilized by project-based or-
ganizations and the best available practice guidelines for cost estimation. At last, the
chapter overviews budgeting, project control, and in particular cost variance as an inte-
gral aspect of project control, since cost variance is the central theme of the case study.
Chapter 5 presents a method for promoting the quality of cost estimation in the context
of project business. The method is developed by identifying the challenges involved in
cost estimation as well as examining typical causes for cost overruns. The best available
practices and surveyed qualities of a good estimate serve as a benchmark to develop a
method that incorporates corrective and preventive actions with regard to the identified
challenges. In addition, the importance of historical information to the quality of the cost
estimate as well as the concept of accuracy boundaries are introduced.
Chapter 6 describes the case company and the challenges that the case company is
facing in the area of cost estimation and project variances. The chapter presents how
the developed suggestions for improving the quality of cost estimation can be applied to
the case company’s processes as well as the implication of process changes on the state
of the business.
Chapter 7 discusses the results of the intervention in the case company through feed-
back that was collected from the steering team of the case company. The chapter also
discusses how the research objectives were met and brings up the limitations of the
research. Additionally, further research needs are identified on a theoretical and practical
level.
Chapter 8 is a concluding chapter of the thesis presenting the summary of the theoretical
and practical problems and the essence of the improvement suggestion developed
throughout the work. The summary also includes an overview of the limitations and fur-
ther research opportunities.
5
2. RESEARCH PROCESS
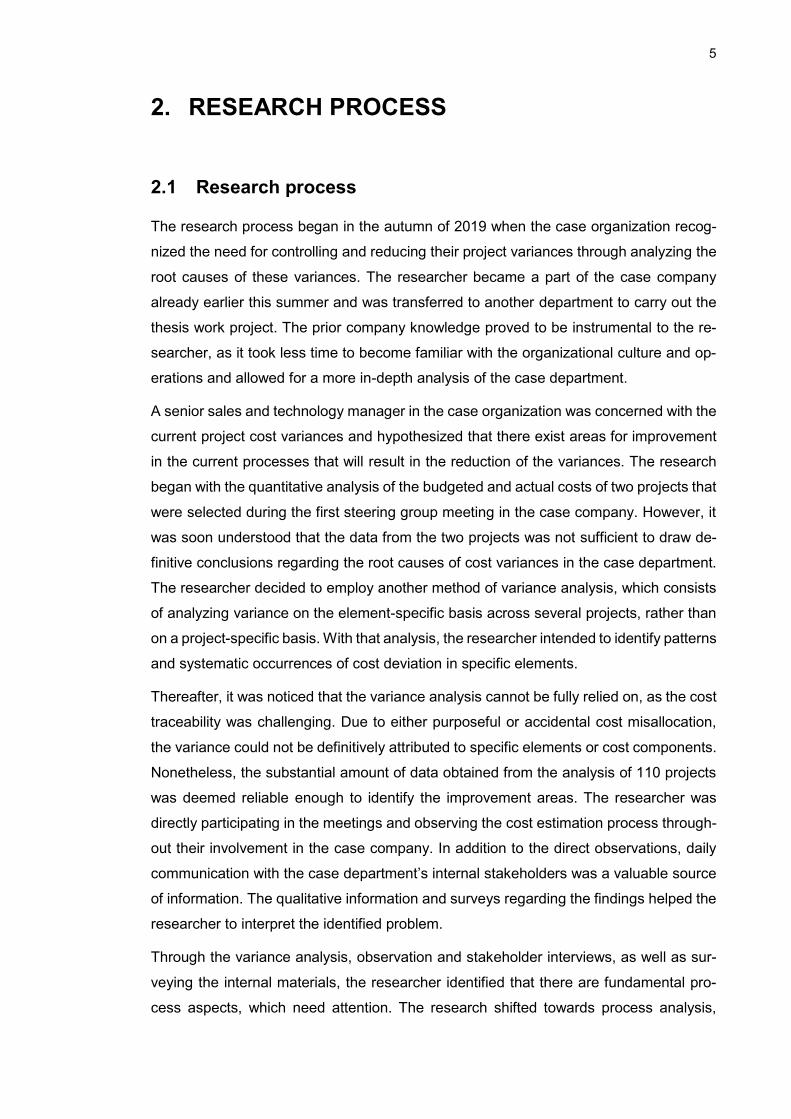
2.1 Research process
The research process began in the autumn of 2019 when the case organization recog-
nized the need for controlling and reducing their project variances through analyzing the
root causes of these variances. The researcher became a part of the case company
already earlier this summer and was transferred to another department to carry out the
thesis work project. The prior company knowledge proved to be instrumental to the re-
searcher, as it took less time to become familiar with the organizational culture and op-
erations and allowed for a more in-depth analysis of the case department.
A senior sales and technology manager in the case organization was concerned with the
current project cost variances and hypothesized that there exist areas for improvement
in the current processes that will result in the reduction of the variances. The research
began with the quantitative analysis of the budgeted and actual costs of two projects that
were selected during the first steering group meeting in the case company. However, it
was soon understood that the data from the two projects was not sufficient to draw de-
finitive conclusions regarding the root causes of cost variances in the case department.
The researcher decided to employ another method of variance analysis, which consists
of analyzing variance on the element-specific basis across several projects, rather than
on a project-specific basis. With that analysis, the researcher intended to identify patterns
and systematic occurrences of cost deviation in specific elements.
Thereafter, it was noticed that the variance analysis cannot be fully relied on, as the cost
traceability was challenging. Due to either purposeful or accidental cost misallocation,
the variance could not be definitively attributed to specific elements or cost components.
Nonetheless, the substantial amount of data obtained from the analysis of 110 projects
was deemed reliable enough to identify the improvement areas. The researcher was
directly participating in the meetings and observing the cost estimation process through-
out their involvement in the case company. In addition to the direct observations, daily
communication with the case department’s internal stakeholders was a valuable source
of information. The qualitative information and surveys regarding the findings helped the
researcher to interpret the identified problem.
Through the variance analysis, observation and stakeholder interviews, as well as sur-
veying the internal materials, the researcher identified that there are fundamental pro-
cess aspects, which need attention. The research shifted towards process analysis,
6
where the researcher investigated whether the cause of project cost variance is rooted
within the company’s daily operations and activities and whether there is potential to
improve these operations. The particular area of interest to this research became the
process of cost estimation and the interrelated activities impacting the process of cost
estimation in the case company. The process analysis was based on the researcher’s
observations, communication with the stakeholders and qualitative interviews.
When the problem was identified and interpreted, the researcher began reviewing the
literature to find the best available practices related to the main problem of the case
company. The review included literature on the processes of cost estimation employed
by other organizations, as well as the tools used to produce the estimates. The best
available practices served as a basis for creating the theoretical framework for the cost
estimation process that promotes quality and knowledge management. The general
method was later benchmarked against the case company’s processes and methods in
order to identify the improvement areas and develop a set of recommendations for the
case company.
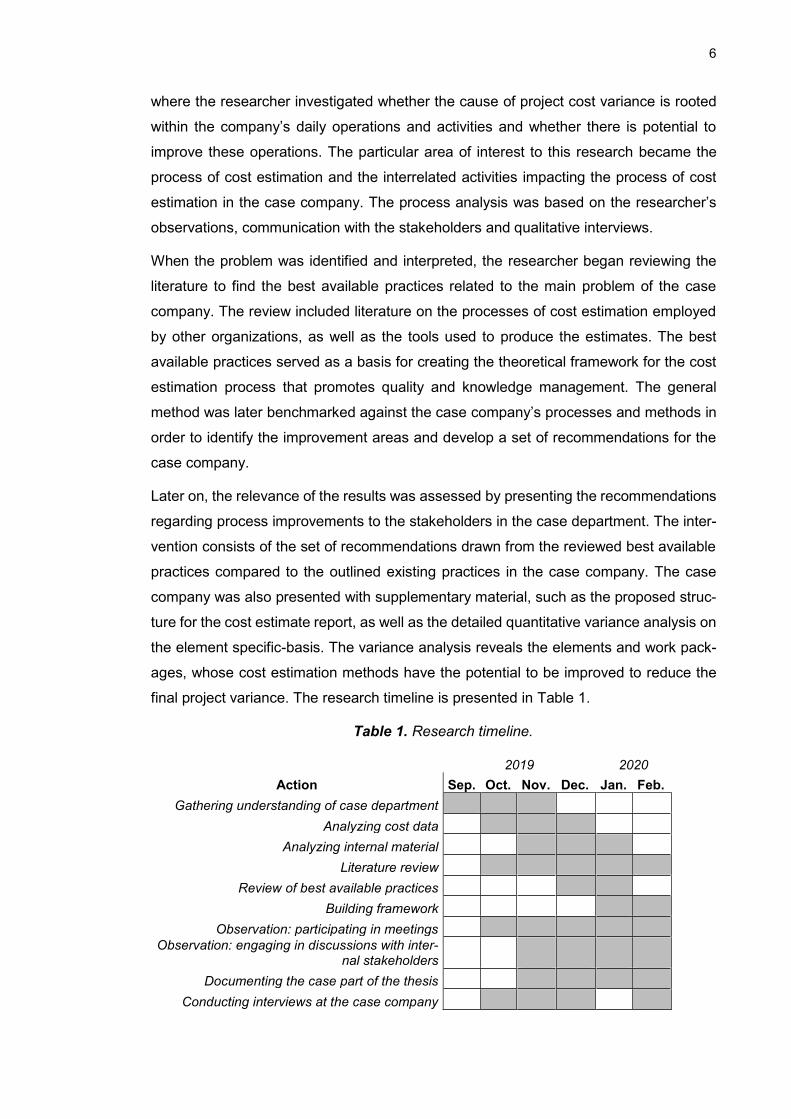
Later on, the relevance of the results was assessed by presenting the recommendations
regarding process improvements to the stakeholders in the case department. The inter-
vention consists of the set of recommendations drawn from the reviewed best available
practices compared to the outlined existing practices in the case company. The case
company was also presented with supplementary material, such as the proposed struc-
ture for the cost estimate report, as well as the detailed quantitative variance analysis on
the element specific-basis. The variance analysis reveals the elements and work pack-
ages, whose cost estimation methods have the potential to be improved to reduce the
final project variance. The research timeline is presented in Table 1.
Table 1. Research timeline.
2019 2020
Action Sep. Oct. Nov. Dec. Jan. Feb.
Gathering understanding of case department
Analyzing cost data
Analyzing internal material
Literature review
Review of best available practices
Building framework
Observation: participating in meetings Observation: engaging in discussions with inter-
nal stakeholders
Documenting the case part of the thesis
Conducting interviews at the case company
7
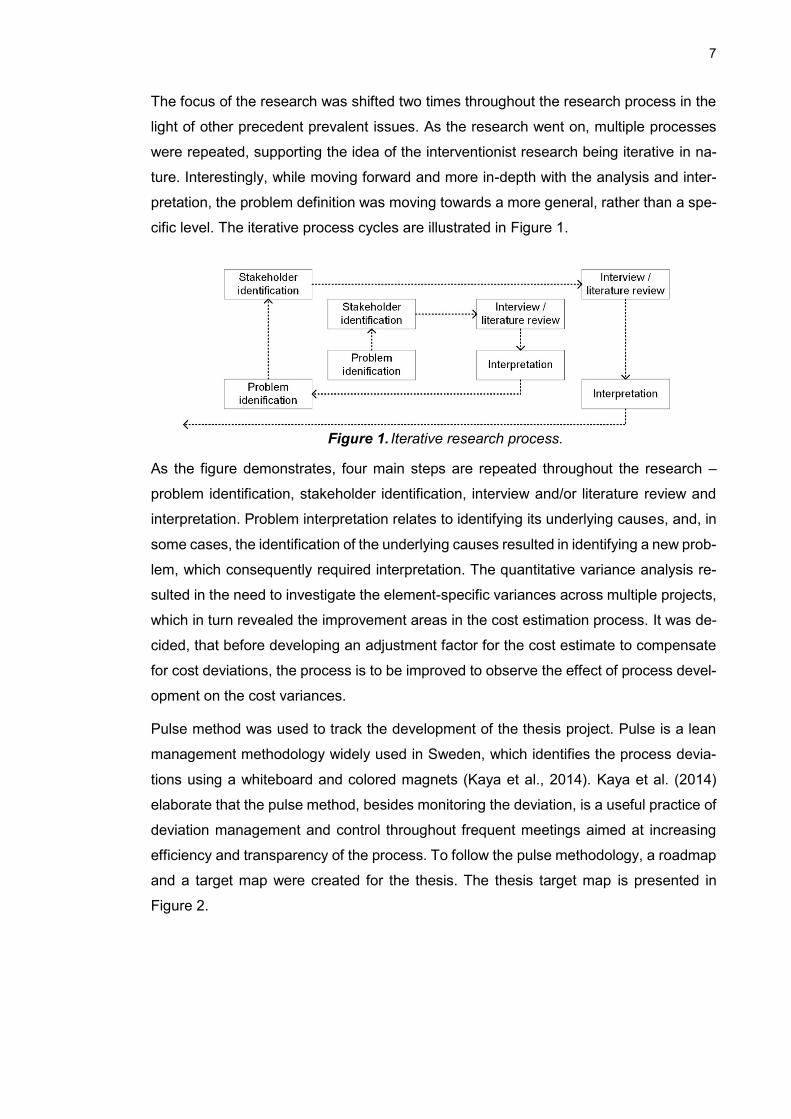
The focus of the research was shifted two times throughout the research process in the
light of other precedent prevalent issues. As the research went on, multiple processes
were repeated, supporting the idea of the interventionist research being iterative in na-
ture. Interestingly, while moving forward and more in-depth with the analysis and inter-
pretation, the problem definition was moving towards a more general, rather than a spe-
cific level. The iterative process cycles are illustrated in Figure 1.
Figure 1. Iterative research process.
As the figure demonstrates, four main steps are repeated throughout the research –
problem identification, stakeholder identification, interview and/or literature review and
interpretation. Problem interpretation relates to identifying its underlying causes, and, in
some cases, the identification of the underlying causes resulted in identifying a new prob-
lem, which consequently required interpretation. The quantitative variance analysis re-
sulted in the need to investigate the element-specific variances across multiple projects,
which in turn revealed the improvement areas in the cost estimation process. It was de-
cided, that before developing an adjustment factor for the cost estimate to compensate
for cost deviations, the process is to be improved to observe the effect of process devel-
opment on the cost variances.
Pulse method was used to track the development of the thesis project. Pulse is a lean
management methodology widely used in Sweden, which identifies the process devia-
tions using a whiteboard and colored magnets (Kaya et al., 2014). Kaya et al. (2014)
elaborate that the pulse method, besides monitoring the deviation, is a useful practice of
deviation management and control throughout frequent meetings aimed at increasing
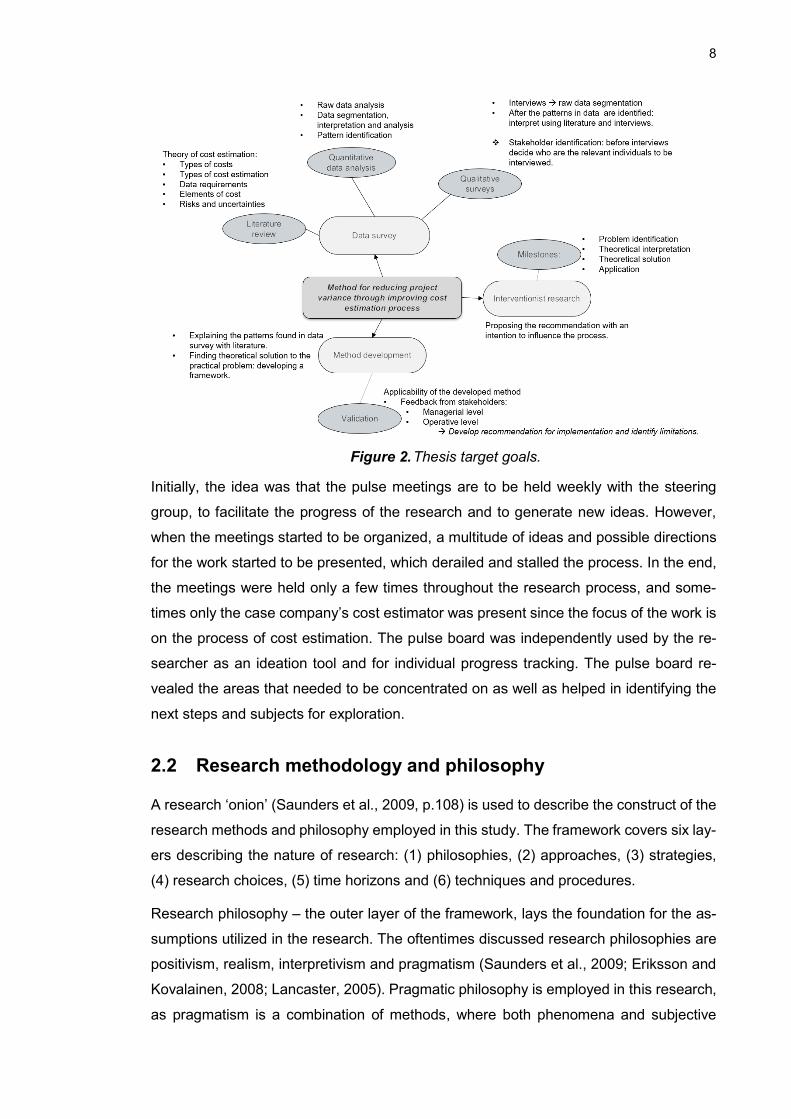
efficiency and transparency of the process. To follow the pulse methodology, a roadmap
and a target map were created for the thesis. The thesis target map is presented in
Figure 2.
8
Figure 2. Thesis target goals.
Initially, the idea was that the pulse meetings are to be held weekly with the steering
group, to facilitate the progress of the research and to generate new ideas. However,
when the meetings started to be organized, a multitude of ideas and possible directions
for the work started to be presented, which derailed and stalled the process. In the end,
the meetings were held only a few times throughout the research process, and some-
times only the case company’s cost estimator was present since the focus of the work is
on the process of cost estimation. The pulse board was independently used by the re-
searcher as an ideation tool and for individual progress tracking. The pulse board re-
vealed the areas that needed to be concentrated on as well as helped in identifying the
next steps and subjects for exploration.
2.2 Research methodology and philosophy
A research ‘onion’ (Saunders et al., 2009, p.108) is used to describe the construct of the
research methods and philosophy employed in this study. The framework covers six lay-
ers describing the nature of research: (1) philosophies, (2) approaches, (3) strategies,
(4) research choices, (5) time horizons and (6) techniques and procedures.
Research philosophy – the outer layer of the framework, lays the foundation for the as-
sumptions utilized in the research. The oftentimes discussed research philosophies are
positivism, realism, interpretivism and pragmatism (Saunders et al., 2009; Eriksson and
Kovalainen, 2008; Lancaster, 2005). Pragmatic philosophy is employed in this research,
as pragmatism is a combination of methods, where both phenomena and subjective
9
meaning are relevant to knowledge generation and the focus is on integrative perspec-
tives and data collection methods for data interpretation. In addition to the philosophical
groundwork, a scientific paradigm of hermeneutics is applicable to describe the qualita-
tive aspects of the research (Gummesson, 1993), as with the qualitative interviews, the
researcher was interpreting the quantitative findings.
When it comes to the research approach, this research is inductive rather than deductive
in nature. The hypothesis and theories in this research are developed in light of the em-
pirical evidence (Lancaster, 2005). Interestingly, the hypothesis is formed based on the
quantitative secondary data as well as past personal experiences of the researcher with
the company. The researcher was employed in another business unit of the case com-
pany prior to undertaking the thesis worker position. Some elements of the deductive
approach are present in the analysis, as the raw financial data needs to be validated and
the causal relationships explained. The research can be described as ideographic, rather
than nomothetic, as the focus of the study is to explain the empirical evidence and draw
recommendations from that evidence (Burrell and Morgan, 1979; Deetz, 1996). Nomo-
thetic research is controlled and structured, such as laboratory studies, in contrast, this
research is less structured and it is explanatory in nature (Saunders, 2009).
This study is conducted in a form of a case study, which is defined as an empirical ex-
amination of issues that are related to industrial and economic spheres of life with the
purpose of producing new knowledge concerning the case or the theoretical foundation
of it (Eriksson and Kovalainen, 2010). The case study in the management field does not
have to utilize only qualitative data gathering methods; on the contrary, it can benefit
from a combination of both – qualitative and quantitative methods (Gummesson, 1993).
To increase the credibility of the knowledge generated from the case study, triangulation
is employed for data validation purposes. Triangulation possibilities are limited, as the
data in the case company has not yet been analyzed from the same perspective, as was
chosen by the researcher. One characteristic of this case study is employing a mixture
of explanatory and theory generating case types (Gummesson, 1993), as the researcher
aims to explore the previously unexplored area, as well as conceptualize the problem
and the process. One of the objectives of this research is to generalize the findings to
create a common methodology, a multiple case approach is utilized for the purposes of
successful generalization. Additionally, the case study can be characterized as embed-
ded rather than holistic, as the study is carried out more in-depth for one department of
the case organization (Yin and Campbell, 2003).
The researcher, while conducting a case study, is in nature a consultant. Consultancy
research is described by Lancaster (2005) as the provision of external and impartial
10
knowledge, which serves as a piece of advice. Typically, the consultant possesses ad-
ditional competencies and experience to that of the firm, providing fresh insight on the
issue. Other reasons for addressing consultants, besides the need for additional exper-
tise and impartiality, include lack of time and ethical reasons. When it comes to this re-
search, lack of time and the need for a fresh perspective incurred the need for consul-
tancy research. Some limitations of consultancy research include factors such as lack of
familiarity with the organization and lack of accountability for results, which are alleviated
due to the researcher’s previous involvement with the case company as well as a desire
for future co-operation. The role of the researcher as a consultant can be described as
an intermediate between directive and non-directive, as the researcher raises questions,
finds facts and proposes alternative courses of action (Lippitt and Lippitt, 1978). The
research from the consultancy point of view is more task-oriented than process-oriented,
aiming to provide an interpretation of the problem and further development suggestions
(Margulies and Raia, 1972).
The desired outcome for the case organization is to identify the root causes of a practical
issue and adopt the methodology developed in the research to tackle the problem of
project variances. The researcher, in turn, aims to influence the case organization with
the outcome of the study. The outcome of the study is a combination of practical numer-
ical analysis as well as a theoretical method for solving the problem on a general level.
The described is in line with a strategy of interventionist research. Suomala and Lyly-
Yrjänäinen (2012) state that in interventionist research the researcher becomes actively
involved in the case organization and tries to solve the organization’s practical problems
with the help of theoretical intervention. The results of the interventionist research are
then comprised of the practical and theoretical parts, producing a concrete theoretical
contribution. As a research method, interventionist research is a variation of action re-
search and involves a combination of multiple methods, which include case study, con-
sultancy, use of existing materials and qualitative interviews. Figure 3 shows a holistic
visualization of the researcher’s interpretation of the nature of the conducted research.
11
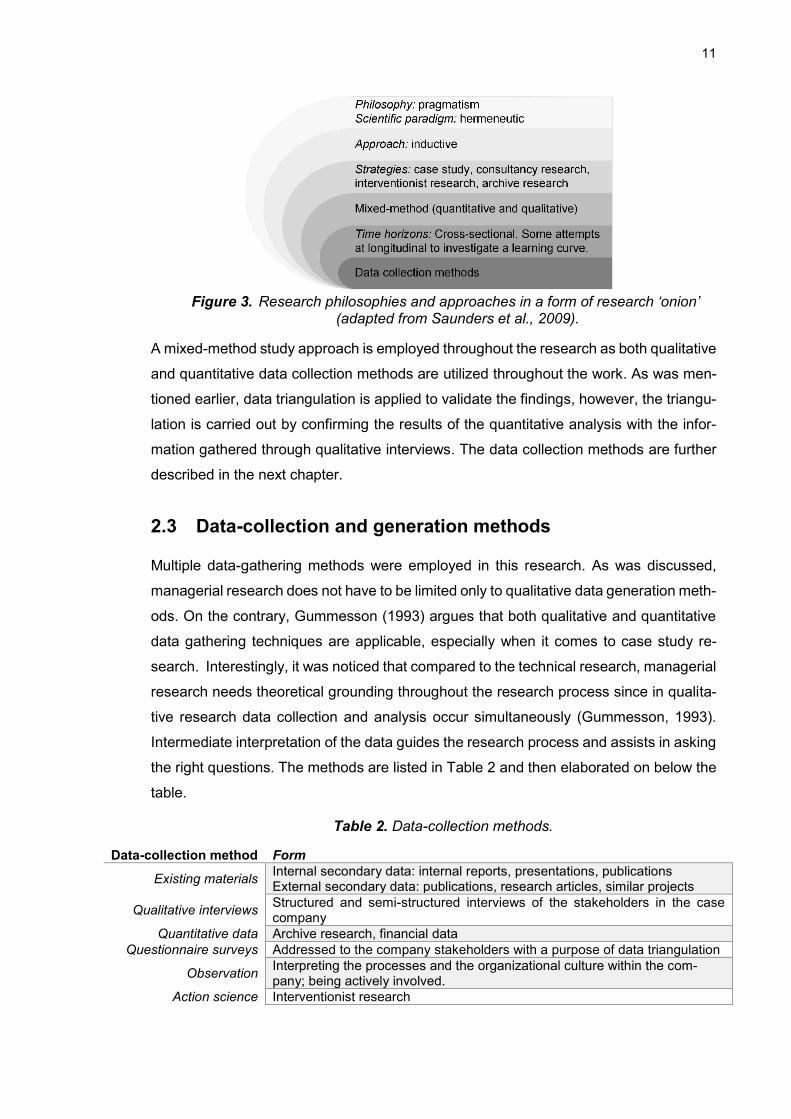
Figure 3. Research philosophies and approaches in a form of research ‘onion’ (adapted from Saunders et al., 2009).
A mixed-method study approach is employed throughout the research as both qualitative
and quantitative data collection methods are utilized throughout the work. As was men-
tioned earlier, data triangulation is applied to validate the findings, however, the triangu-
lation is carried out by confirming the results of the quantitative analysis with the infor-
mation gathered through qualitative interviews. The data collection methods are further
described in the next chapter.
2.3 Data-collection and generation methods
Multiple data-gathering methods were employed in this research. As was discussed,
managerial research does not have to be limited only to qualitative data generation meth-
ods. On the contrary, Gummesson (1993) argues that both qualitative and quantitative
data gathering techniques are applicable, especially when it comes to case study re-
search. Interestingly, it was noticed that compared to the technical research, managerial
research needs theoretical grounding throughout the research process since in qualita-
tive research data collection and analysis occur simultaneously (Gummesson, 1993).
Intermediate interpretation of the data guides the research process and assists in asking
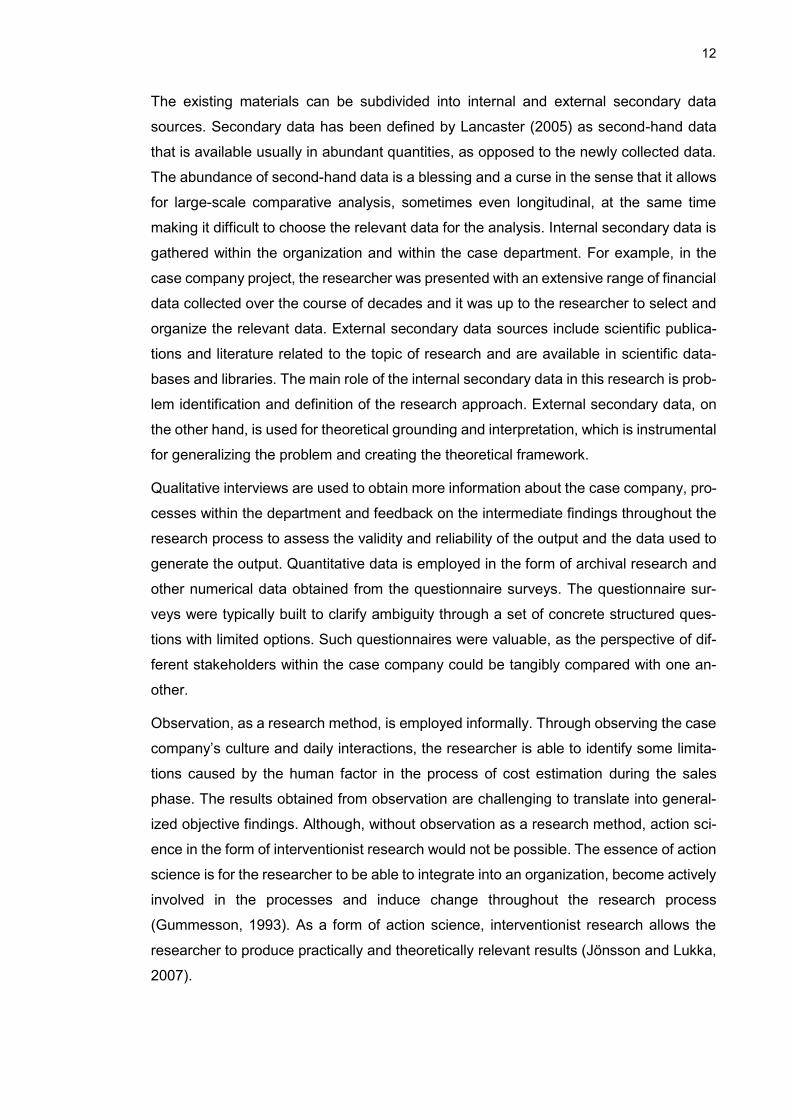
the right questions. The methods are listed in Table 2 and then elaborated on below the
table.
Table 2. Data-collection methods.
Data-collection method Form
Existing materials Internal secondary data: internal reports, presentations, publications External secondary data: publications, research articles, similar projects
Qualitative interviews Structured and semi-structured interviews of the stakeholders in the case company
Quantitative data Archive research, financial data
Questionnaire surveys Addressed to the company stakeholders with a purpose of data triangulation
Observation Interpreting the processes and the organizational culture within the com-pany; being actively involved.
Action science Interventionist research
12
The existing materials can be subdivided into internal and external secondary data
sources. Secondary data has been defined by Lancaster (2005) as second-hand data
that is available usually in abundant quantities, as opposed to the newly collected data.
The abundance of second-hand data is a blessing and a curse in the sense that it allows
for large-scale comparative analysis, sometimes even longitudinal, at the same time
making it difficult to choose the relevant data for the analysis. Internal secondary data is
gathered within the organization and within the case department. For example, in the
case company project, the researcher was presented with an extensive range of financial
data collected over the course of decades and it was up to the researcher to select and
organize the relevant data. External secondary data sources include scientific publica-
tions and literature related to the topic of research and are available in scientific data-
bases and libraries. The main role of the internal secondary data in this research is prob-
lem identification and definition of the research approach. External secondary data, on
the other hand, is used for theoretical grounding and interpretation, which is instrumental
for generalizing the problem and creating the theoretical framework.
Qualitative interviews are used to obtain more information about the case company, pro-
cesses within the department and feedback on the intermediate findings throughout the
research process to assess the validity and reliability of the output and the data used to
generate the output. Quantitative data is employed in the form of archival research and
other numerical data obtained from the questionnaire surveys. The questionnaire sur-
veys were typically built to clarify ambiguity through a set of concrete structured ques-
tions with limited options. Such questionnaires were valuable, as the perspective of dif-
ferent stakeholders within the case company could be tangibly compared with one an-
other.
Observation, as a research method, is employed informally. Through observing the case
company’s culture and daily interactions, the researcher is able to identify some limita-
tions caused by the human factor in the process of cost estimation during the sales
phase. The results obtained from observation are challenging to translate into general-
ized objective findings. Although, without observation as a research method, action sci-
ence in the form of interventionist research would not be possible. The essence of action
science is for the researcher to be able to integrate into an organization, become actively
involved in the processes and induce change throughout the research process
(Gummesson, 1993). As a form of action science, interventionist research allows the
researcher to produce practically and theoretically relevant results (Jönsson and Lukka,
2007).
13
3. PROJECT BUSINESS AND ORGANIZATION
3.1 Project business and value management
There exist various definitions of a project (PRINCE2, 2017; Artto et.al., 2011; Healy,
1998) and all of the variations emphasize that projects are temporary entities with a de-
fined beginning and end, which aim at delivering value to customers within an agreed
time frame and budget according to the quality requirements. In addition to that, projects
are unique entities and their deliverables are unique in each situation. Project business
can be described as a part of a firm’s activities that rely on projects in order to achieve
organizational objectives (Artto et al., 2011). When talking about project business and
project management, there exist different contexts worth investigating. The management
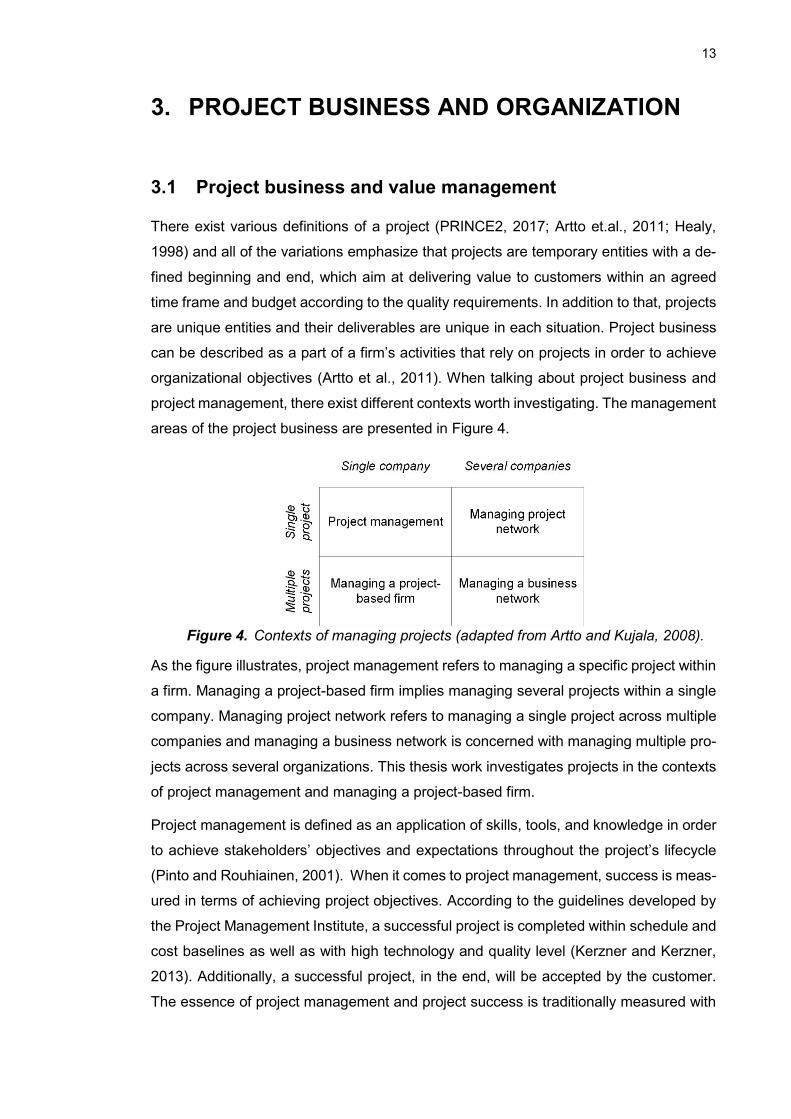
areas of the project business are presented in Figure 4.
Figure 4. Contexts of managing projects (adapted from Artto and Kujala, 2008).
As the figure illustrates, project management refers to managing a specific project within
a firm. Managing a project-based firm implies managing several projects within a single
company. Managing project network refers to managing a single project across multiple
companies and managing a business network is concerned with managing multiple pro-
jects across several organizations. This thesis work investigates projects in the contexts
of project management and managing a project-based firm.
Project management is defined as an application of skills, tools, and knowledge in order
to achieve stakeholders’ objectives and expectations throughout the project’s lifecycle
(Pinto and Rouhiainen, 2001). When it comes to project management, success is meas-
ured in terms of achieving project objectives. According to the guidelines developed by
the Project Management Institute, a successful project is completed within schedule and
cost baselines as well as with high technology and quality level (Kerzner and Kerzner,
2013). Additionally, a successful project, in the end, will be accepted by the customer.
The essence of project management and project success is traditionally measured with
14
the help of three project objectives: scope, time and cost, which are also known as the
classical triple constraint (PMI PMBOK, 2001, p. 29). Project scope refers to the deliver-
ables and the tasks associated with project execution, which are agreed upon between
the supplier and the customer. Project time refers to a schedule established for the de-
livery of the goods, services or other offerings specified in scope. Finally, cost refers to
the number of resources budgeted to create and deliver the value to customers.
However, the classical triple constraint has been criticized as a framework for evaluating
projects’ success (Baratta, 2006). Baratta (2006) proposes a concept of the value triple
constraint (VTC), where the idea is to represent value as a function of capability and
technology. The scope is a variable that remains unchanged, while time is translated into
capability and cost – into value. Capability, instead of the time or schedule as a variable
depicts a company’s value-adding processes, which can also be interpreted in terms of
efficiency and schedule management. Cost is a measure of expenditure required for pro-
ject completion, such as raw materials and labor. Value measures the benefits created
by the project for the customer and for the seller themselves. Interestingly, value and
cost management are tightly linked in the project business.
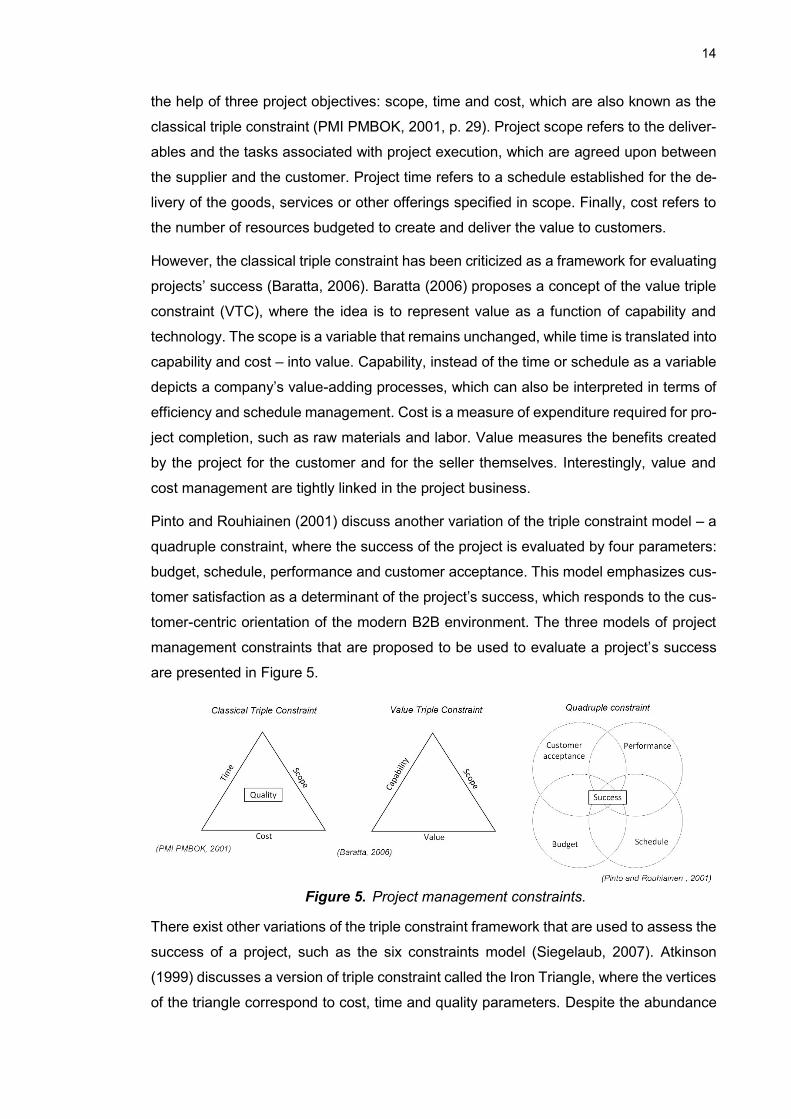
Pinto and Rouhiainen (2001) discuss another variation of the triple constraint model – a
quadruple constraint, where the success of the project is evaluated by four parameters:
budget, schedule, performance and customer acceptance. This model emphasizes cus-
tomer satisfaction as a determinant of the project’s success, which responds to the cus-
tomer-centric orientation of the modern B2B environment. The three models of project
management constraints that are proposed to be used to evaluate a project’s success
are presented in Figure 5.
Figure 5. Project management constraints.
There exist other variations of the triple constraint framework that are used to assess the
success of a project, such as the six constraints model (Siegelaub, 2007). Atkinson
(1999) discusses a version of triple constraint called the Iron Triangle, where the vertices
of the triangle correspond to cost, time and quality parameters. Despite the abundance
15
of the models, all of them emphasize, that the cost and schedule boundaries are essen-
tial in measuring project success. Additionally, in order to retain customers and achieve
customer satisfaction, organizations should emphasize cost and schedule efficiency
throughout the value delivery process.
With the shift towards the customer-centric process orientation, comes a shift in the no-
tion of value management. Nowadays, manufacturers strive to demonstrate the cus-
tomer value that their products provide instead of a conventional emphasis on function-
ality and technological attributes (Jääskeläinen and Heikkilä, 2019). Only when the of-
fering’s benefits become apparent to the customer, they will contemplate about making
the purchase. These perceived benefits are called customer perceived value (CPV) and
it is described as a difference between the total customer benefit and the total customer
cost (Kotler and Keller, 2012). The supplier’s profit is the difference between the total
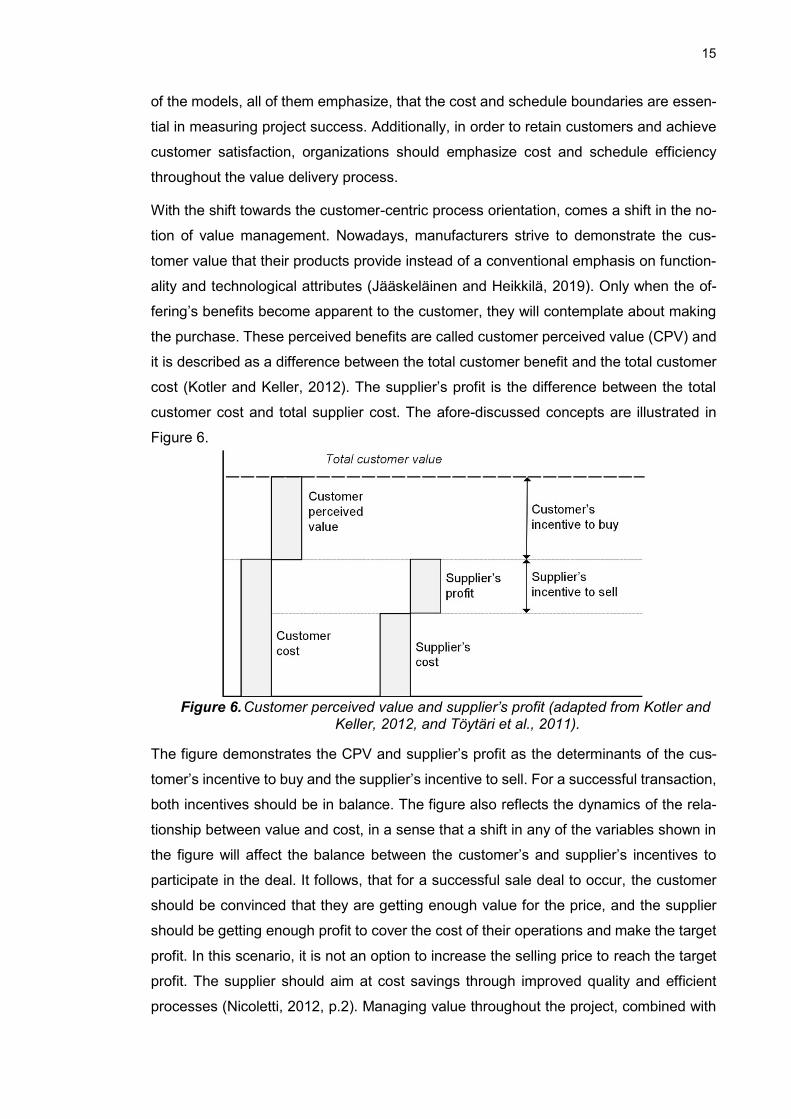
customer cost and total supplier cost. The afore-discussed concepts are illustrated in
Figure 6.
Figure 6. Customer perceived value and supplier’s profit (adapted from Kotler and Keller, 2012, and Töytäri et al., 2011).
The figure demonstrates the CPV and supplier’s profit as the determinants of the cus-
tomer’s incentive to buy and the supplier’s incentive to sell. For a successful transaction,
both incentives should be in balance. The figure also reflects the dynamics of the rela-
tionship between value and cost, in a sense that a shift in any of the variables shown in
the figure will affect the balance between the customer’s and supplier’s incentives to
participate in the deal. It follows, that for a successful sale deal to occur, the customer
should be convinced that they are getting enough value for the price, and the supplier
should be getting enough profit to cover the cost of their operations and make the target
profit. In this scenario, it is not an option to increase the selling price to reach the target
profit. The supplier should aim at cost savings through improved quality and efficient
processes (Nicoletti, 2012, p.2). Managing value throughout the project, combined with
16
managing costs establishes a fundament for successful project completion (Venkata-
raman and Pinto, 2008).
3.2 Project lifecycle and structure
A project is a temporary entity oriented at producing and delivering a unique product or
service to the customer (PMI PMBOK, 2001). Other characteristics of project business
are defined by the nature of projects – they are finite with a clearly established beginning
and end date, must be completed within the agreed time frame and within the allocated
budget (Kerzner and Kerzner, 2013; Artto et al., 2011). The project lifecycle can be
viewed from the perspectives of the supplier and of the customer. From the customer’s
point of view, projects are termed as investment projects, and from the supplier’s point
of view – delivery project. In this work, the projects are perceived rather from the sup-
plier’s point of view, although, in customer-centric organizations, the investment and de-
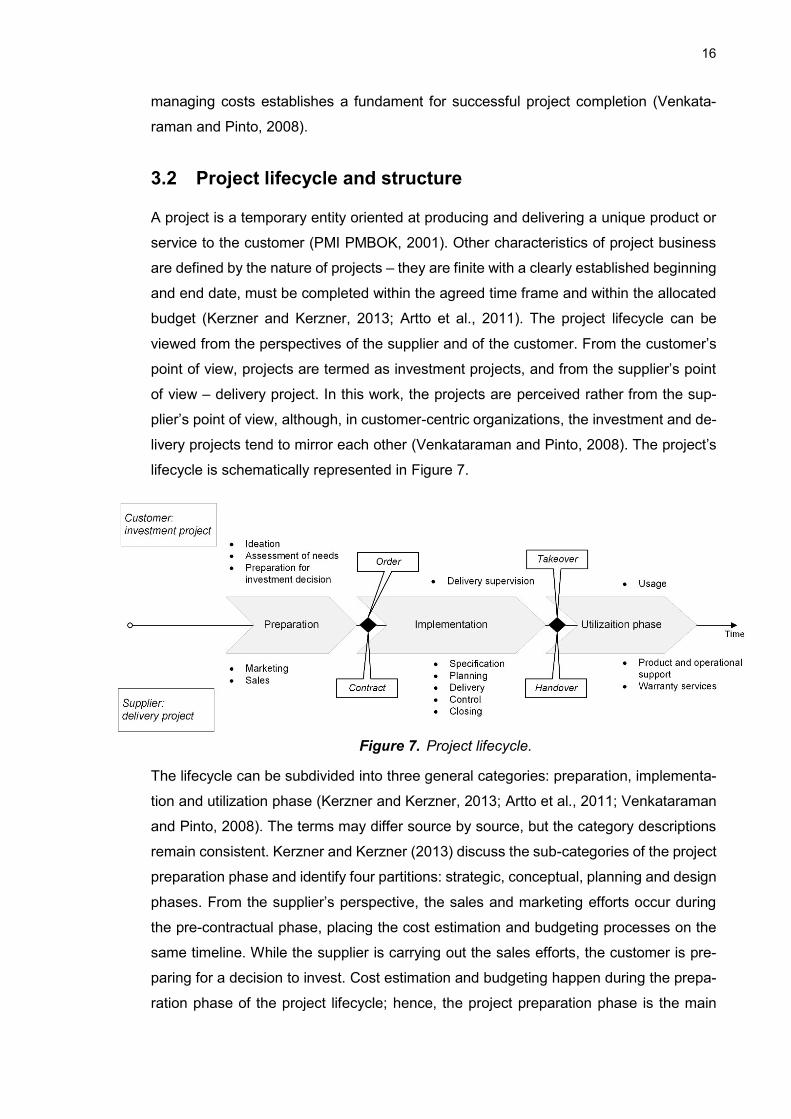
livery projects tend to mirror each other (Venkataraman and Pinto, 2008). The project’s
lifecycle is schematically represented in Figure 7.
Figure 7. Project lifecycle.
The lifecycle can be subdivided into three general categories: preparation, implementa-
tion and utilization phase (Kerzner and Kerzner, 2013; Artto et al., 2011; Venkataraman
and Pinto, 2008). The terms may differ source by source, but the category descriptions
remain consistent. Kerzner and Kerzner (2013) discuss the sub-categories of the project
preparation phase and identify four partitions: strategic, conceptual, planning and design
phases. From the supplier’s perspective, the sales and marketing efforts occur during
the pre-contractual phase, placing the cost estimation and budgeting processes on the
same timeline. While the supplier is carrying out the sales efforts, the customer is pre-
paring for a decision to invest. Cost estimation and budgeting happen during the prepa-
ration phase of the project lifecycle; hence, the project preparation phase is the main
17
focus of this thesis work. Nevertheless, a delivery project as a whole is to be considered,
since the cost and schedule variances become apparent only as the project is being
implemented, thus, the project implementation phase is of some relevance to this work.
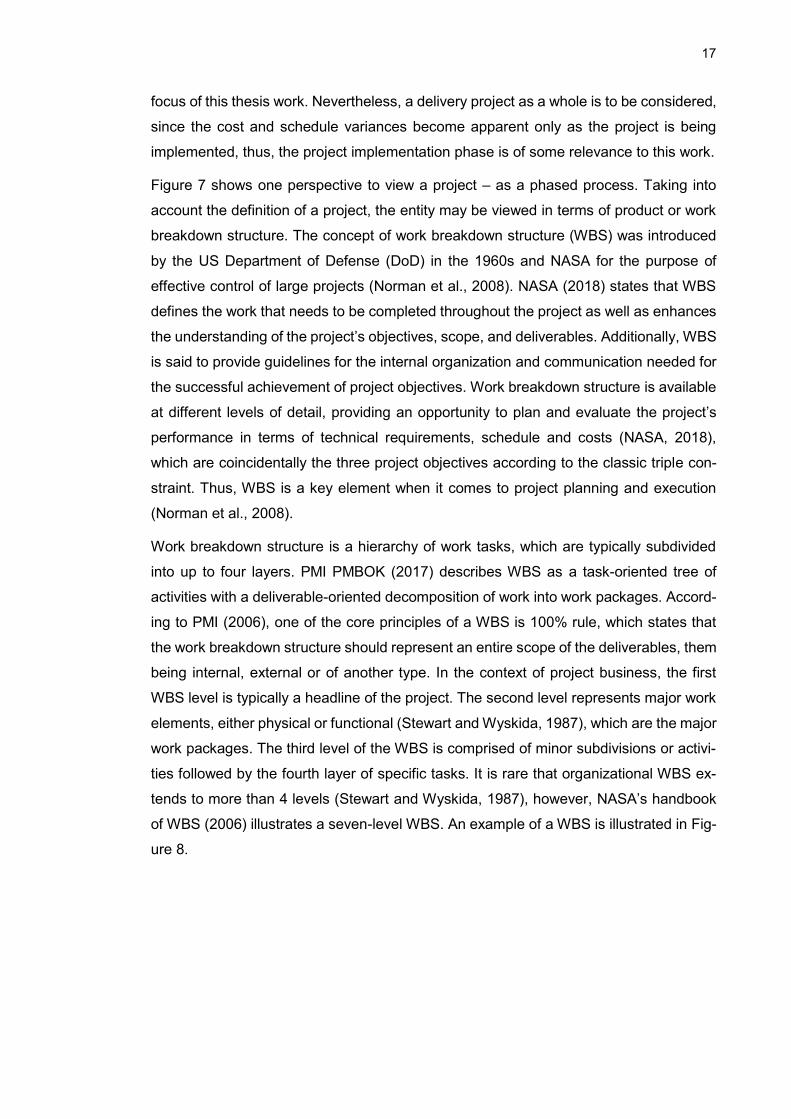
Figure 7 shows one perspective to view a project – as a phased process. Taking into
account the definition of a project, the entity may be viewed in terms of product or work
breakdown structure. The concept of work breakdown structure (WBS) was introduced
by the US Department of Defense (DoD) in the 1960s and NASA for the purpose of
effective control of large projects (Norman et al., 2008). NASA (2018) states that WBS
defines the work that needs to be completed throughout the project as well as enhances
the understanding of the project’s objectives, scope, and deliverables. Additionally, WBS
is said to provide guidelines for the internal organization and communication needed for
the successful achievement of project objectives. Work breakdown structure is available
at different levels of detail, providing an opportunity to plan and evaluate the project’s
performance in terms of technical requirements, schedule and costs (NASA, 2018),
which are coincidentally the three project objectives according to the classic triple con-
straint. Thus, WBS is a key element when it comes to project planning and execution
(Norman et al., 2008).
Work breakdown structure is a hierarchy of work tasks, which are typically subdivided
into up to four layers. PMI PMBOK (2017) describes WBS as a task-oriented tree of
activities with a deliverable-oriented decomposition of work into work packages. Accord-
ing to PMI (2006), one of the core principles of a WBS is 100% rule, which states that
the work breakdown structure should represent an entire scope of the deliverables, them
being internal, external or of another type. In the context of project business, the first
WBS level is typically a headline of the project. The second level represents major work
elements, either physical or functional (Stewart and Wyskida, 1987), which are the major
work packages. The third level of the WBS is comprised of minor subdivisions or activi-
ties followed by the fourth layer of specific tasks. It is rare that organizational WBS ex-
tends to more than 4 levels (Stewart and Wyskida, 1987), however, NASA’s handbook
of WBS (2006) illustrates a seven-level WBS. An example of a WBS is illustrated in Fig-
ure 8.
18
Figure 8. An example four-level WBS.
The figure demonstrates a visual scheme of the work packages and activities, although,
often in a project, WBS takes a form of a table or a list with multiple levels since it may
be difficult to encompass all the information into the visual scheme. Constructing a WBS
is an iterative process, as more and more details are specified throughout the project
planning stage. PMI (2006) emphasizes that for consistency within an organization, there
should exist a WBS standard or a WBS template for the business units to be followed.
The standards, however, must be adjustable to fit the scope of deliverables specific to
each unit in order to eliminate unnecessary work and to include the entire scope of de-
liverables according to the 100% rule.
As was mentioned before, WBS can be used in project control. Cost account structure
and cost itemization are the concepts used in accounting and project control. Cost ac-
counts are represented at the second level of the WBS and represent the resources
needed for executing a group of work packages. Cost items and work packages are
illustrated in the lower levels of WBS and are more detailed and specified than the cost
accounts according to the logic of hierarchy employed in WBS. Work breakdown struc-
ture’s functionality is not bound strictly to cost estimation, resource forecasting and allo-
cation, and responsibility division. If used effectively and extensively, WBS is instrumen-
tal in quality control as well as risk management and planning. A risk breakdown structure
(RBS) can be created based on the WBS to identify and manage the risks involved in
each of the work packages (Hillson, 2002). NASA (2018) confirms that WBS is instru-
mental in risk management as WBS provides a uniform consistent structure for docu-
menting, managing, tracking and communicating the project risks.
3.3 Project risks and uncertainties
Project risk is defined as an event that, if occurs, will have consequences on the project's
success in terms of achieving one or more project objectives (PMI PMBOK, 2001;
19
PRINCE2, 2017). The impact does not have to be negative – oftentimes, risks are un-
dertaken to realize opportunities, even though it is acknowledged that in the worst-case
scenario the impact on the project objectives will be of a negative nature.
The general process of risk management consists of four stages: (1) risk identification,
(2) assessment, (3) response planning and (4) implementation (PMI PMBOK, 2001; Artto
et al., 2011). However, NASA (2011) states that these steps are characteristic of risk-
informed decision making (RIDM), which is merely one of the constituents of a risk man-
agement practice. NASA (2011) identifies that an effective risk management practice
consists of RIDM as well as continuous risk management (CRM).
CRM is a cyclical process aimed at producing a comprehensive overview of the impact
of individual risk events on the entirety of the project and the project’s performance. The
steps in CRM are (1) identify, (2) analyze, (3) plan, (4) track, (5) control, and (6) com-
municate and document. The first step to risk management, whether it is RIDM or CRM,
is to identify the risks. The risks are subdivided into categories, which enables a more
systematic identification and consecutively analysis of those risks. Some of the com-
monly discussed risk categories are listed in Table 3.
Table 3. Example risk categories
Risk category Example Source
Pure risks Insurable damages, losses, etc.
Munier, 2014 Artto et al., 2011 Martinsuo, 2011
Roger and Petch,1999
Financial risks Risks associated with financial agreements, currency rates, and financial institutions.
Business risks Associated with project work – scope changes, delays, weather, lack of infor-mation, conflicts, performance issues.
Political and country risk Geographical risks, country-specific risks.
Technical, performance or quality risks
The newness of the technology, unrealistic performance goals, industry or technology standard change throughout the project.
Munier, 2014 PMI PMBOK, 2001
Roger and Petch, 1999
Project management risks Inadequate resource planning, scheduling, a poor project plan.
Organizational risks No project prioritization, conflicting project objectives, resource conflicts among pro-jects within an organization.
External risks Statutory changes, labor issues, country risk, weather, disasters.
As can be noticed from the table the two classifications cover the same aspects, even
though the names of the risk categories and the bundles of specific risks within the cat-
egories differ. As the scope of this work concentrates on suggesting improvements to
the foreseen risks that originate from within the organization itself, the unforeseen and
external risks are not considered in this work. In other words, project management risks
and organizational risks (PMI PMBOK, 2001) are further considered in this work. Addi-
tionally, the foreseen risks in the business risks category (Martinsuo, 2011; Artto et al.,
20
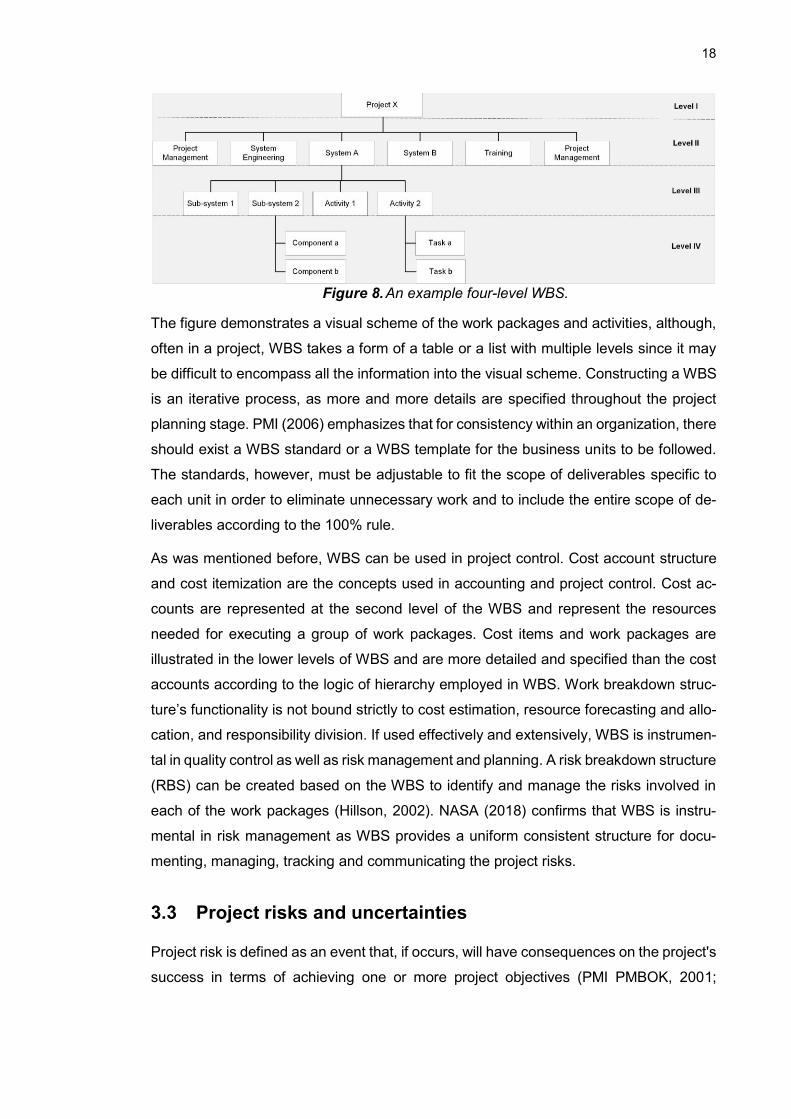
2011). The business risks originating from the organization itself are lack of information
and performance issues, and they are considered relevant to this work. The individual
risks that originate from within the organization are considered in this work and are illus-
trated in Figure 9. These risks are bundled into their own category and classified in this
research as internal foreseen risks.
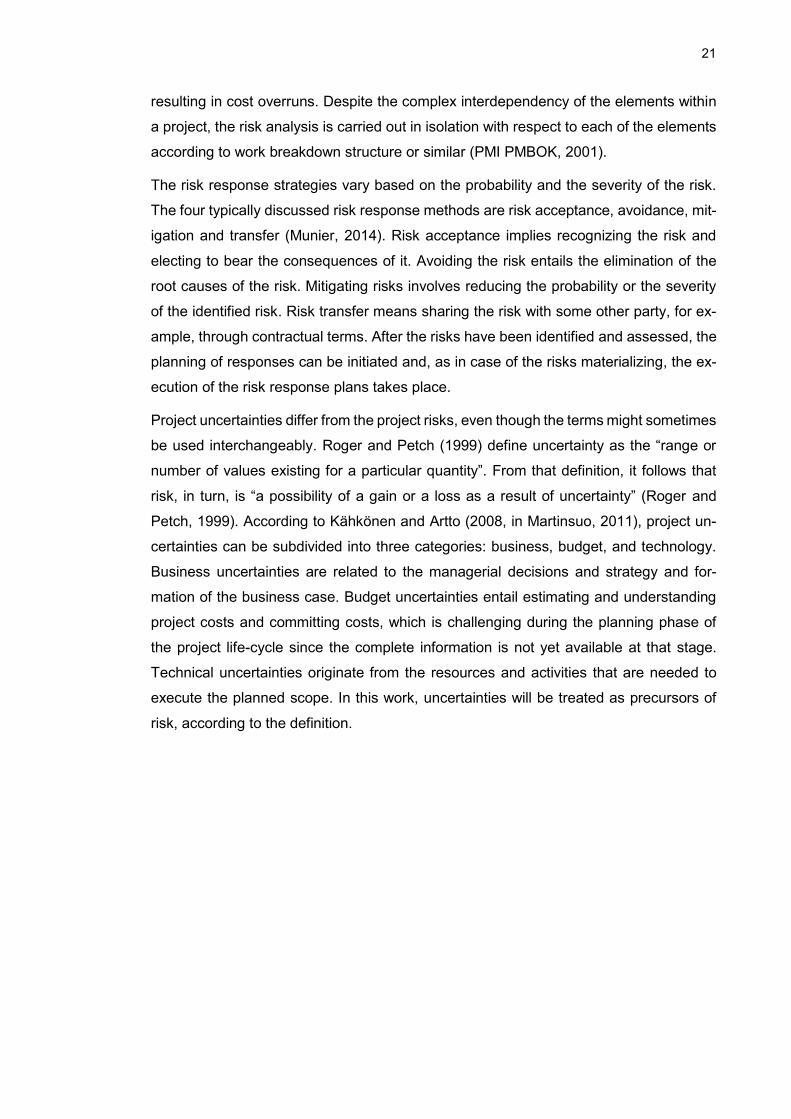
Figure 9. Internal foreseen risks
The figure shows the risks that the researcher identified as the key internal to the organ-
ization risks, which negatively affect the achievement of project objectives resulting in
cost overruns. The internal foreseen risks are controllable since they originate from within
the organization and it is within the firm’s power to avoid the risks by adjusting own op-
erations. It is noteworthy, that the risk management guidelines for the internal foreseen
risks consist of procedural improvement.
The cost overruns are a manifestation of schedule delays, compromising quality and,
naturally, exceeding the budget, hence it is safe to claim that in the context of project
business cost overruns are a manifestation of risk embodiment. Assessing and evaluat-
ing project-specific risks is not straightforward even in the case of foreseen risks due to
the lack of information, complete awareness of the project setting and project complexity.
This uncertainty in the form of a lack of information and awareness may lead to unreal-
istic planning and unrealistic expectations from the execution team (Munier, 2014, p.2).
Project complexity is defined as the multitudes of interaction between the elements of
the project, which spontaneously organize and reorganize over time, making it difficult to
predict an outcome of a single impact on the system (Dao et al., 2016; Martinsuo, 2011).
The complexity may indicate that the risks are interconnected and the realization of one
risk may trigger some of the others. This may occur, for example, if the supplier is late to
deliver a component, which results in schedule delay and idle equipment, consecutively
21
resulting in cost overruns. Despite the complex interdependency of the elements within
a project, the risk analysis is carried out in isolation with respect to each of the elements
according to work breakdown structure or similar (PMI PMBOK, 2001).
The risk response strategies vary based on the probability and the severity of the risk.
The four typically discussed risk response methods are risk acceptance, avoidance, mit-
igation and transfer (Munier, 2014). Risk acceptance implies recognizing the risk and
electing to bear the consequences of it. Avoiding the risk entails the elimination of the
root causes of the risk. Mitigating risks involves reducing the probability or the severity
of the identified risk. Risk transfer means sharing the risk with some other party, for ex-
ample, through contractual terms. After the risks have been identified and assessed, the
planning of responses can be initiated and, as in case of the risks materializing, the ex-
ecution of the risk response plans takes place.
Project uncertainties differ from the project risks, even though the terms might sometimes
be used interchangeably. Roger and Petch (1999) define uncertainty as the “range or
number of values existing for a particular quantity”. From that definition, it follows that
risk, in turn, is “a possibility of a gain or a loss as a result of uncertainty” (Roger and
Petch, 1999). According to Kähkönen and Artto (2008, in Martinsuo, 2011), project un-
certainties can be subdivided into three categories: business, budget, and technology.
Business uncertainties are related to the managerial decisions and strategy and for-
mation of the business case. Budget uncertainties entail estimating and understanding
project costs and committing costs, which is challenging during the planning phase of
the project life-cycle since the complete information is not yet available at that stage.
Technical uncertainties originate from the resources and activities that are needed to
execute the planned scope. In this work, uncertainties will be treated as precursors of
risk, according to the definition.
22
4. COST MANAGEMENT IN A PROJECT
4.1 Cost classification and cost incurrence
To understand the cost management process, types of costs, and cost incurrence and
commitment processes within an organization are to be explored. The costs within a
project can be classified into several categories, such as fixed and variable costs, direct
and indirect costs, and recurring and nonrecurring costs. First, fixed costs are the costs
that will incur over a period of time regardless of labor hours or product units manufac-
tured. Variable costs, in turn, depend on the level of activity, such as the manufactured
volume and labor intensity (Shuford in Stewart and Wyskida, 1987). The fixed cost com-
ponent includes, for example, rent of the facilities and cleaning staff wages. Variable
costs in manufacturing typically include raw materials and wages. As the production vol-
ume grows, variable costs, which are usually proportional to the increase in activity level,
are distributed over the same amount of fixed costs, resulting in a cheaper cost of goods
sold per unit – a phenomenon called economies of scale. Realistically, the variable costs
will not exactly grow proportionally, as, in the B2B sector, manufacturers are often able
to negotiate volume discounts.
While fixed and variable costs are used to analyze cost behavior, direct and indirect costs
are instrumental when it comes to cost traceability and estimation (Bhimani et al., 2019).
Direct costs are the costs that can be clearly attributed to the manufacturing cost of a
product, such as raw materials, labor, and cost of equipment. Indirect costs, on the other
hand, are the costs that cannot be directly traced and attributed as a manufacturing cost
for a specific cost object, such as administrative and managerial wages, distribution costs
and cost of indirect materials, such as lubricant for the machinery (Adithan, 2007). Re-
curring and nonrecurring costs are used to differentiate between repeatedly incurring
costs throughout the project and one-time transactions (Venkataraman and Pinto, 2008).
Recurring costs are, for example, salaries and wages and materials. Examples of non-
recurring costs include license fees and training.
The terminology of various cost types and classification is instrumental when it comes to
pricing the offering and tracking costs throughout the project. To price an offering, the
indirect costs should be allocated to the direct costs in order to cover the total cost of a
product. Besides covering the expenses, an enterprise desires to make a profit for the
goods they sell. It is important to clarify the difference between price and cost. Depending
on the costing system that the company uses, the total of an offering may be represented
23
as a sum of direct and indirect material costs, labor costs, direct and overhead expenses
(Kesavan et al., 2009). The selling price of a product is then computed by adding a profit
margin on top of the total cost of the product. This methodology is known as contribution
costing, where all the indirect expenses are allocated equally among the produced
goods. Some costing systems make use of a notion of overhead costs to allocate the
indirect fixed expenses to a product in proportion to the direct costs associated with the
specific product (Chang, 2013). Other costing systems allocate costs using cost drivers.
A cost driver is any part or factor that generates costs (Bhimani et al., 2019). Numerous
cost drivers can be defined depending on the activity of a business unit or an organiza-
tion. For example, in logistics, cost drivers may include a number of packages distributed,
a number of trucks ordered, the weight of the product distributed and so on. It is vital to
select an appropriate cost driver that reflects the business operation closely. For in-
stance, if the company’s portfolio includes products ranging by weight from 500 grams
to 200 kilograms, such as house appliance manufacturers, it may be wise to select the
weight of the product as a cost driver. On the other hand, for a clothes wholesaler, the
number of packages distributed would be a more appropriate cost driver.
Understanding various cost types is a part of project cost management alongside the
internal process of cost commitment and incurrence within an organization. Within an
organization in a B2B context, the process of cost incurrence may differ from the com-
mon understanding of the equivalent in a B2C context. In industrial B2B firms purchasing
decisions are never spontaneous and have to be approved by management. It follows,
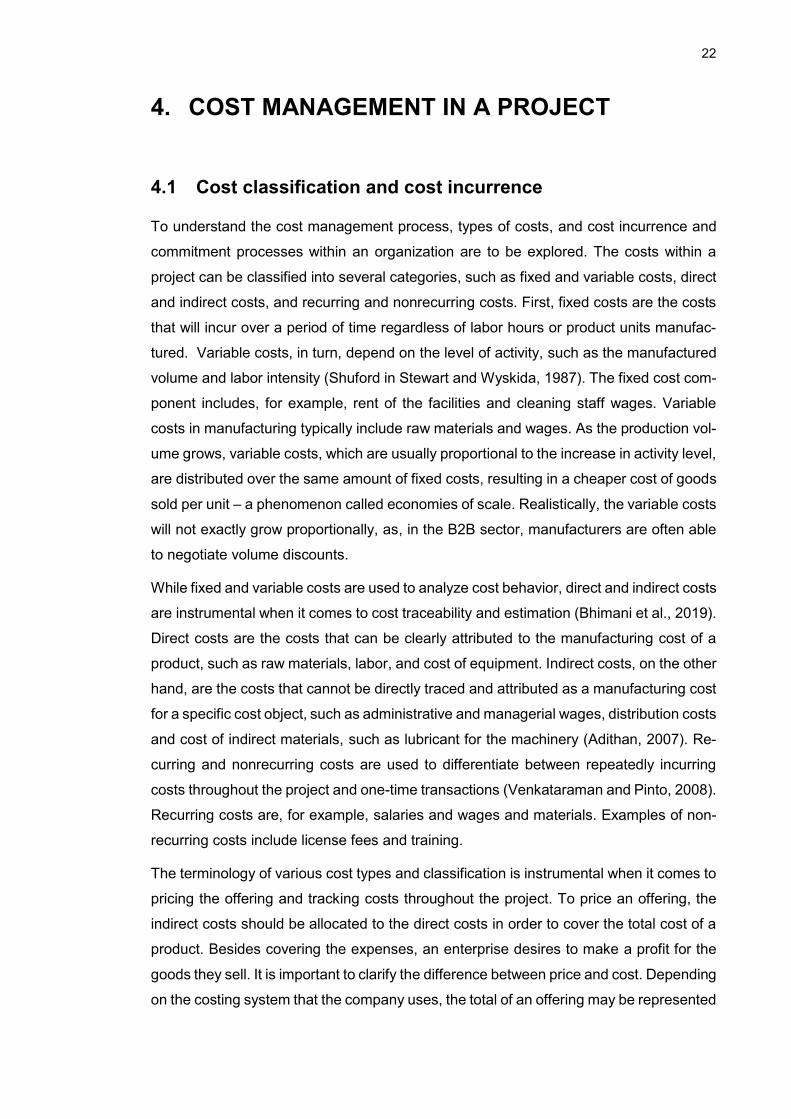
that the cost incurrence is in its nature a process rather than a singular event. An exam-
ple of cost incurrence process described by Tanaka et al. (1993) is illustrated in Figure
10.
Figure 10. Cost incurrence process (Tanaka et al., 1993).
As the figure demonstrates, organizational cost incurrence is a process with several in-
termediate steps. First, cost planning is concerned with the general development of the
cost structure of the company based on the available internal capabilities and resources.
During the cost planning stage, it is decided how the company is going to deliver value
to the customers and turn their payments into profits for the organization. Cost planning
Cost planning
Internal cost commitment
External cost commitment
Resource acquisition
Resource consumption
Payment
24
is crucial to a successful business model of the firm, as the relative importance of deci-
sions influencing costs is the highest during the cost planning phase of the cost incur-
rence process (Tanaka et al., 1993). As the project progresses, it becomes more costly
and difficult to modify the process design and the cost structure of established opera-
tions, hence proper cost planning is an essential part of the organizational activity (Ven-
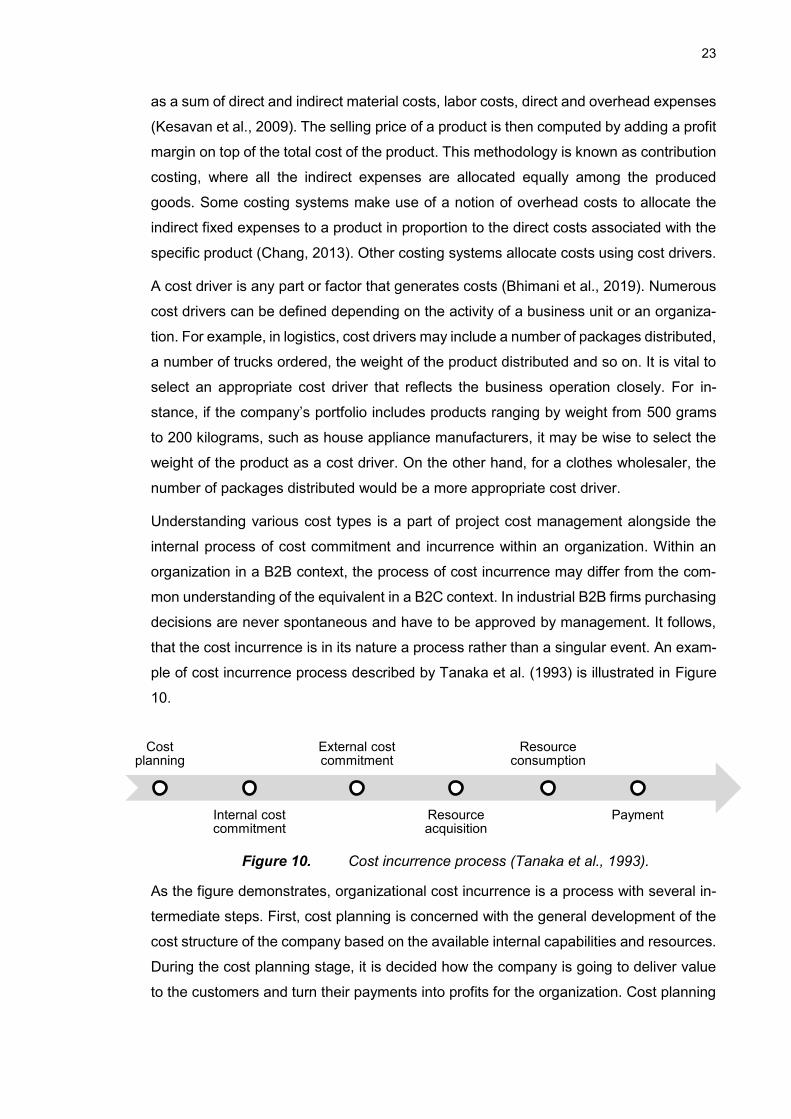
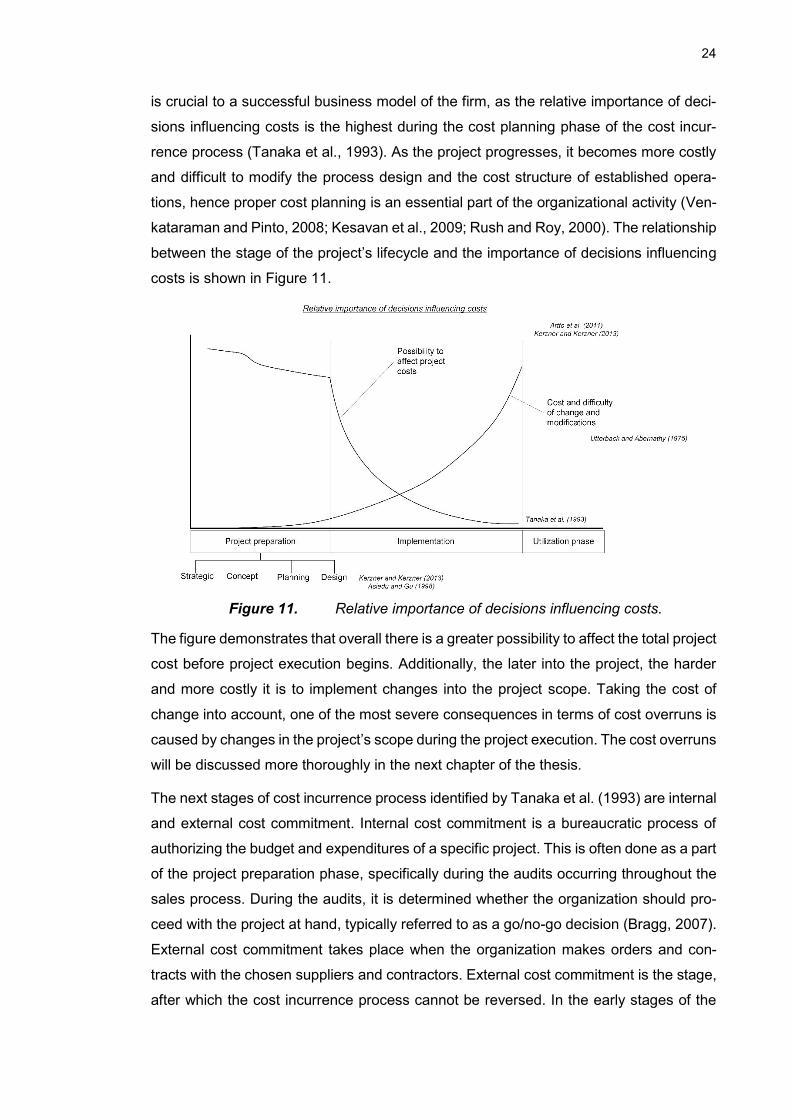
kataraman and Pinto, 2008; Kesavan et al., 2009; Rush and Roy, 2000). The relationship
between the stage of the project’s lifecycle and the importance of decisions influencing
costs is shown in Figure 11.
Figure 11. Relative importance of decisions influencing costs.
The figure demonstrates that overall there is a greater possibility to affect the total project
cost before project execution begins. Additionally, the later into the project, the harder
and more costly it is to implement changes into the project scope. Taking the cost of
change into account, one of the most severe consequences in terms of cost overruns is
caused by changes in the project’s scope during the project execution. The cost overruns
will be discussed more thoroughly in the next chapter of the thesis.
The next stages of cost incurrence process identified by Tanaka et al. (1993) are internal
and external cost commitment. Internal cost commitment is a bureaucratic process of
authorizing the budget and expenditures of a specific project. This is often done as a part
of the project preparation phase, specifically during the audits occurring throughout the
sales process. During the audits, it is determined whether the organization should pro-
ceed with the project at hand, typically referred to as a go/no-go decision (Bragg, 2007).
External cost commitment takes place when the organization makes orders and con-
tracts with the chosen suppliers and contractors. External cost commitment is the stage,
after which the cost incurrence process cannot be reversed. In the early stages of the
25
project, the largest share of the cost commitment occurs – about 70 to 80 % of the total
project costs are committed during the conceptualization and planning stages (Stewart
et al., 1986; Rush and Roy, 2000). The extensive cost commitment at the early stages
of the project lifecycle is the reason for the difficulties and high costs of change later on
in the project.
Resource acquisition is associated with the physical receipt of the resources ordered or
contracted during the external cost commitment phase. Resource consumption, subse-
quently, involves the utilization of the resources received or contracted during the re-
source acquisition phase. The resource does not have to be physical, it may also be in
a form of external expertise or capacity. The last stage of the cost incurring process is
the one carrying a concrete economic impact on the organization – physical payment.
The payment schedule and plan are specified in the contract between the supplier and
the customer. In projects, the payment plan is usually distributed over several stages,
including advance payment, milestone payments, and the final payment after the project
is accepted by the customer. The payment plans may vary based on the company policy
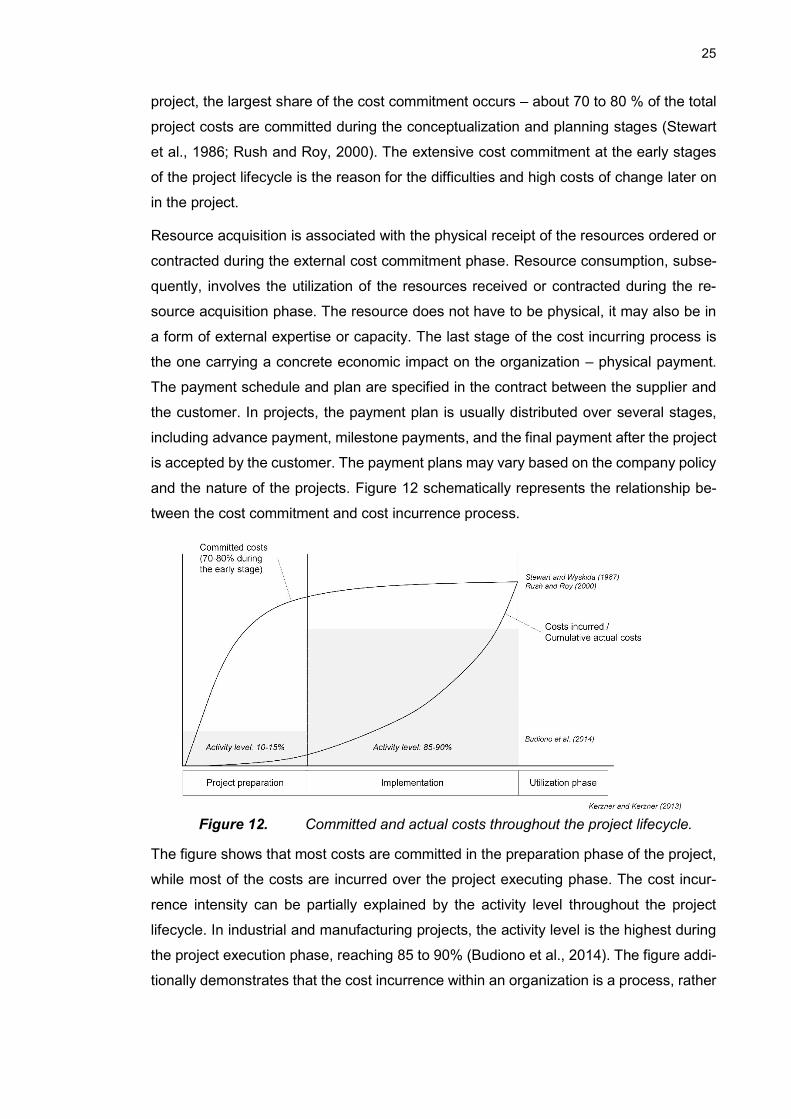
and the nature of the projects. Figure 12 schematically represents the relationship be-
tween the cost commitment and cost incurrence process.
Figure 12. Committed and actual costs throughout the project lifecycle.
The figure shows that most costs are committed in the preparation phase of the project,
while most of the costs are incurred over the project executing phase. The cost incur-
rence intensity can be partially explained by the activity level throughout the project
lifecycle. In industrial and manufacturing projects, the activity level is the highest during
the project execution phase, reaching 85 to 90% (Budiono et al., 2014). The figure addi-
tionally demonstrates that the cost incurrence within an organization is a process, rather
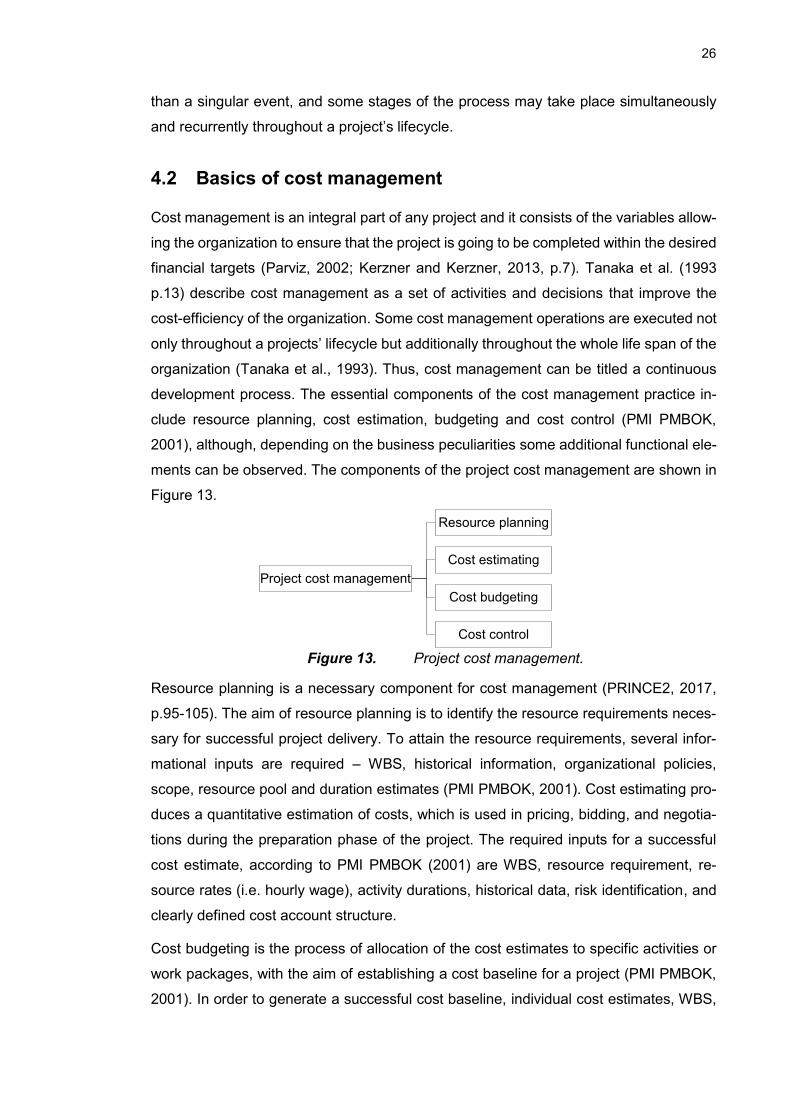
26
than a singular event, and some stages of the process may take place simultaneously
and recurrently throughout a project’s lifecycle.
4.2 Basics of cost management
Cost management is an integral part of any project and it consists of the variables allow-
ing the organization to ensure that the project is going to be completed within the desired
financial targets (Parviz, 2002; Kerzner and Kerzner, 2013, p.7). Tanaka et al. (1993
p.13) describe cost management as a set of activities and decisions that improve the
cost-efficiency of the organization. Some cost management operations are executed not
only throughout a projects’ lifecycle but additionally throughout the whole life span of the
organization (Tanaka et al., 1993). Thus, cost management can be titled a continuous
development process. The essential components of the cost management practice in-
clude resource planning, cost estimation, budgeting and cost control (PMI PMBOK,
2001), although, depending on the business peculiarities some additional functional ele-
ments can be observed. The components of the project cost management are shown in
Figure 13.
Figure 13. Project cost management.
Resource planning is a necessary component for cost management (PRINCE2, 2017,
p.95-105). The aim of resource planning is to identify the resource requirements neces-
sary for successful project delivery. To attain the resource requirements, several infor-
mational inputs are required – WBS, historical information, organizational policies,
scope, resource pool and duration estimates (PMI PMBOK, 2001). Cost estimating pro-
duces a quantitative estimation of costs, which is used in pricing, bidding, and negotia-
tions during the preparation phase of the project. The required inputs for a successful
cost estimate, according to PMI PMBOK (2001) are WBS, resource requirement, re-
source rates (i.e. hourly wage), activity durations, historical data, risk identification, and
clearly defined cost account structure.
Cost budgeting is the process of allocation of the cost estimates to specific activities or
work packages, with the aim of establishing a cost baseline for a project (PMI PMBOK,
2001). In order to generate a successful cost baseline, individual cost estimates, WBS,
Project cost management
Resource planning
Cost estimating
Cost budgeting
Cost control
27
schedule and risk management plan need to be available. Cost control is a practice of
identifying and managing changes in the identified cost baseline (Taylor, 2007). Cost
baseline, performance reports, and change reports and requests are necessary in order
to carry out the control phase successfully. The results of cost control are manifested as
revised cost estimates and budgets, lessons for future budgeting and cost estimation,
corrective actions and successful project closing in terms of required documentation and
reports. As can be noticed from the above-listed, all the elements of cost management
are interconnected.
Remarkably, throughout the cost management literature, many authors and researchers
emphasize the importance of readily-available relevant and reliable cost information for
effective cost management (Tanaka et al., 1993; Stewart and Wyskida, 1987; Parviz,
2002, Venkataraman and Pinto, 2008; Artto et al., 2011). Additionally, it is emphasized
that in order to be effective, cost management should be supported by all parts of the
organization and be treated more like a policy to achieve standardization.
The goal of cost management is to reach the project objective together with the accepta-
ble quality level within the established cost baseline. Parviz (2002) concludes that in
order for the cost management process to be effective, it needs to be formalized and
standardized as well as integrated with each function across the company. When effec-
tive, cost management enables tracing and tracking the performance of the project and
analyzing the impacts of schedule and cost deviations on the success of the project
completion. Additionally, Stewart and Wyskida (1987) emphasize the importance of cost
analysis as a part of cost management practice, as the processed information and the
lessons learned from the previous projects form a valuable fundament for future cost
estimation and budgeting in a form of historical data.
Tanaka et al. (1993) define other requirements for effective cost management, such as
timely product plans, aiming at generating profits, availability of cost to show the sources
of profit and availability of relevant cost information and capabilities at the preparation
stage. Artto et al. (2011) state that cost management practices follow the whole duration
of a project’s lifecycle to assess final profitability. Additionally, the researchers empha-
size that cost management is an integral part of project management, meaning that it is
affiliated with the other operations and processes that affect the revenue, such as re-
source and schedule management.
One example of a cost management strategy is target cost management, which is also
considered a technology or product management strategy (Tanaka et al., 1993, p.35).
Target costing originated in Japan as a measure to battle challenging market conditions
28
and fierce competition (Angéniol et al., 2005). Target cost management (TCM) is used
to attain an estimation and manage the costs over the entire product’s lifecycle, keeping
the offering competitive in the market. Target costing is a reverse costing method, which
allows eliminating non-value adding activities to reduce the production costs and allows
the product to enter the production phase only when the lifecycle cost of the product is
lower than the estimated target cost (Gonçalves et al., 2018).
Another cost management strategy that is quite often brought up in conjunction with the
target cost management is a design-to-cost (DTC) strategy. DTC is a product develop-
ment strategy that emphasizes the design’s convergence on costs, in other words, costs
are considered as a parameter in design instead of being a target to reach (Angéniol et
al., 2005). This strategy was invented by the American Department of Defense as an
attempt to alleviate the constant cost overruns. With that technique, the cost is treated
as an economic internal constraint, allowing for a more efficient cost control over the
planning and design stages of production (Tanaka et al., 1993). The difference between
the TCM and DTC is that the cost is considered from the external perspective in TCM
while acting as an internal determinant in DTC.
4.3 Cost estimation
The International Cost Estimating & Analysis Association defines cost estimation as a
process of collecting and analyzing historical data and using that data to estimate future
costs of deliverables with the help of quantitative models. Cost estimation is a forecasting
technique, in contrast to cost analysis, which is based on organizing and processing
historical data (Stewart and Wyskida, 1987, p.1). A successful cost estimate can be ef-
fectively used in bidding, negotiations, cost tracking, and cost analysis.
The information requirement of the cost estimation process can be broken down into two
categories: historical data and organizational operations. Historical data may include any
archival data in a form of previous cost estimates or statistics, as well as published re-
ports about similar work either from within the organization or external sources. Few
companies, besides public organizations, disclose their cost structure and detailed finan-
cial figures, so obtaining the information from external sources may not always be pos-
sible. As an alternative, some scientific and research publications can be followed to
trace the best available practices regarding cost estimation in a specific industry.
In a sense, without cost analysis, cost estimation would not be possible. Simply storing
the data is insufficient for the purpose of effective cost estimation. Indeed, the literature
confirms that as a best practice for cost estimation, the data should be analyzed, reported
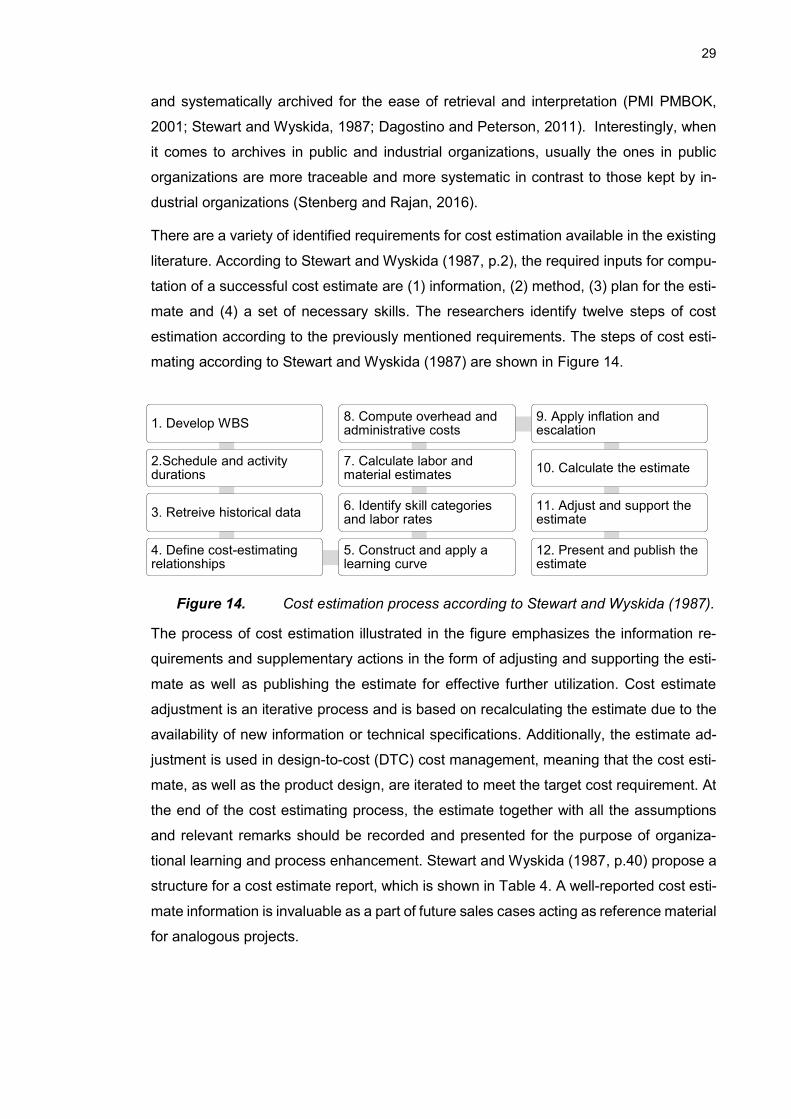
29
and systematically archived for the ease of retrieval and interpretation (PMI PMBOK,
2001; Stewart and Wyskida, 1987; Dagostino and Peterson, 2011). Interestingly, when
it comes to archives in public and industrial organizations, usually the ones in public
organizations are more traceable and more systematic in contrast to those kept by in-
dustrial organizations (Stenberg and Rajan, 2016).
There are a variety of identified requirements for cost estimation available in the existing
literature. According to Stewart and Wyskida (1987, p.2), the required inputs for compu-
tation of a successful cost estimate are (1) information, (2) method, (3) plan for the esti-
mate and (4) a set of necessary skills. The researchers identify twelve steps of cost
estimation according to the previously mentioned requirements. The steps of cost esti-
mating according to Stewart and Wyskida (1987) are shown in Figure 14.
Figure 14. Cost estimation process according to Stewart and Wyskida (1987).
The process of cost estimation illustrated in the figure emphasizes the information re-
quirements and supplementary actions in the form of adjusting and supporting the esti-
mate as well as publishing the estimate for effective further utilization. Cost estimate
adjustment is an iterative process and is based on recalculating the estimate due to the
availability of new information or technical specifications. Additionally, the estimate ad-
justment is used in design-to-cost (DTC) cost management, meaning that the cost esti-
mate, as well as the product design, are iterated to meet the target cost requirement. At
the end of the cost estimating process, the estimate together with all the assumptions
and relevant remarks should be recorded and presented for the purpose of organiza-
tional learning and process enhancement. Stewart and Wyskida (1987, p.40) propose a
structure for a cost estimate report, which is shown in Table 4. A well-reported cost esti-
mate information is invaluable as a part of future sales cases acting as reference material
for analogous projects.
1. Develop WBS
2.Schedule and activity durations
3. Retreive historical data
4. Define cost-estimating relationships
5. Construct and apply a learning curve
6. Identify skill categories and labor rates
7. Calculate labor and material estimates
8. Compute overhead and administrative costs
9. Apply inflation and escalation
10. Calculate the estimate
11. Adjust and support the estimate
12. Present and publish the estimate
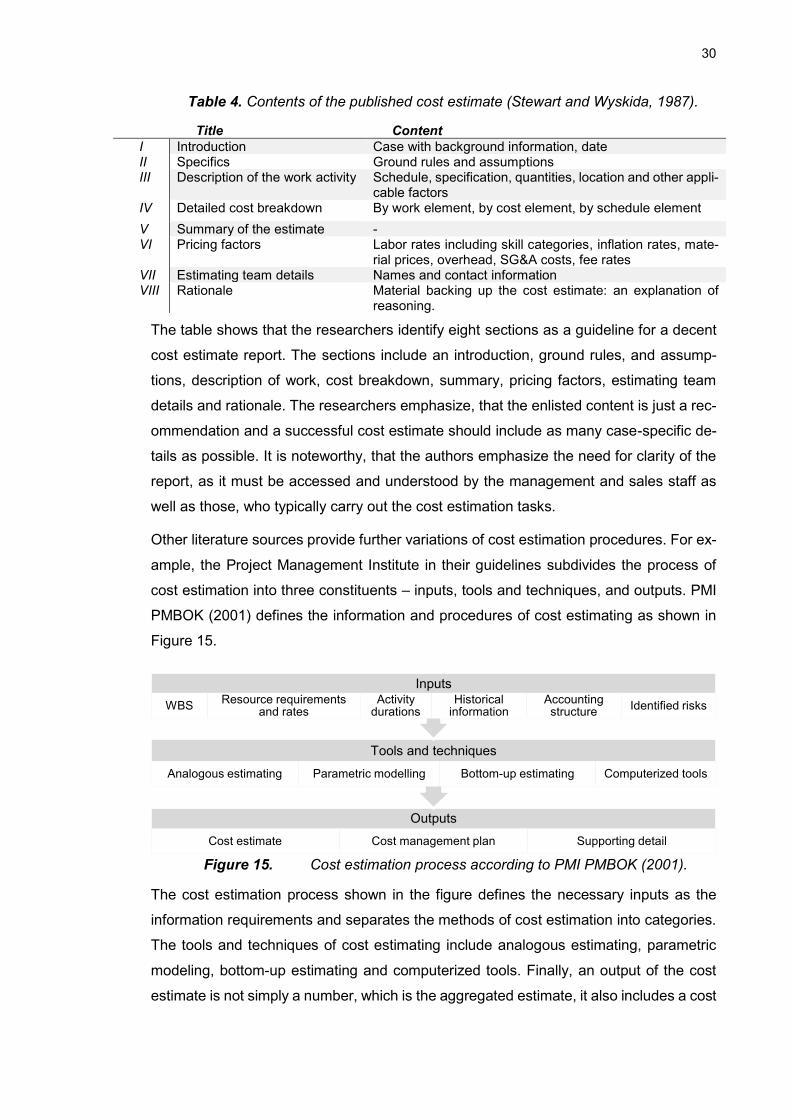
30
Table 4. Contents of the published cost estimate (Stewart and Wyskida, 1987).
Title Content
I Introduction Case with background information, date II Specifics Ground rules and assumptions III Description of the work activity Schedule, specification, quantities, location and other appli-
cable factors IV Detailed cost breakdown By work element, by cost element, by schedule element
V Summary of the estimate - VI Pricing factors Labor rates including skill categories, inflation rates, mate-
rial prices, overhead, SG&A costs, fee rates VII Estimating team details Names and contact information VIII Rationale Material backing up the cost estimate: an explanation of
reasoning.
The table shows that the researchers identify eight sections as a guideline for a decent
cost estimate report. The sections include an introduction, ground rules, and assump-
tions, description of work, cost breakdown, summary, pricing factors, estimating team
details and rationale. The researchers emphasize, that the enlisted content is just a rec-
ommendation and a successful cost estimate should include as many case-specific de-
tails as possible. It is noteworthy, that the authors emphasize the need for clarity of the
report, as it must be accessed and understood by the management and sales staff as
well as those, who typically carry out the cost estimation tasks.
Other literature sources provide further variations of cost estimation procedures. For ex-
ample, the Project Management Institute in their guidelines subdivides the process of
cost estimation into three constituents – inputs, tools and techniques, and outputs. PMI
PMBOK (2001) defines the information and procedures of cost estimating as shown in
Figure 15.
Figure 15. Cost estimation process according to PMI PMBOK (2001).
The cost estimation process shown in the figure defines the necessary inputs as the
information requirements and separates the methods of cost estimation into categories.
The tools and techniques of cost estimating include analogous estimating, parametric
modeling, bottom-up estimating and computerized tools. Finally, an output of the cost
estimate is not simply a number, which is the aggregated estimate, it also includes a cost
Outputs
Cost estimate Cost management plan Supporting detail
Tools and techniques
Analogous estimating Parametric modelling Bottom-up estimating Computerized tools
Inputs
WBSResource requirements
and ratesActivity
durationsHistorical
information Accounting structure
Identified risks
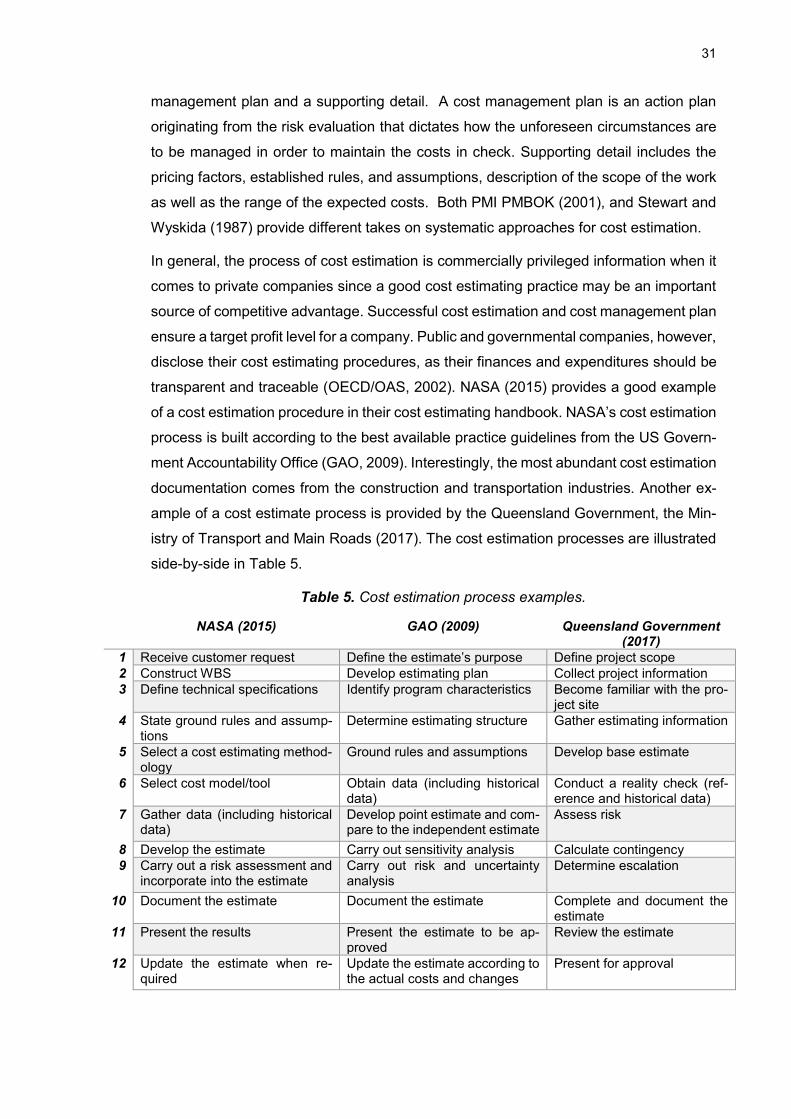
31
management plan and a supporting detail. A cost management plan is an action plan
originating from the risk evaluation that dictates how the unforeseen circumstances are
to be managed in order to maintain the costs in check. Supporting detail includes the
pricing factors, established rules, and assumptions, description of the scope of the work
as well as the range of the expected costs. Both PMI PMBOK (2001), and Stewart and
Wyskida (1987) provide different takes on systematic approaches for cost estimation.
In general, the process of cost estimation is commercially privileged information when it
comes to private companies since a good cost estimating practice may be an important
source of competitive advantage. Successful cost estimation and cost management plan
ensure a target profit level for a company. Public and governmental companies, however,
disclose their cost estimating procedures, as their finances and expenditures should be
transparent and traceable (OECD/OAS, 2002). NASA (2015) provides a good example
of a cost estimation procedure in their cost estimating handbook. NASA’s cost estimation
process is built according to the best available practice guidelines from the US Govern-
ment Accountability Office (GAO, 2009). Interestingly, the most abundant cost estimation
documentation comes from the construction and transportation industries. Another ex-
ample of a cost estimate process is provided by the Queensland Government, the Min-
istry of Transport and Main Roads (2017). The cost estimation processes are illustrated
side-by-side in Table 5.
Table 5. Cost estimation process examples.
NASA (2015) GAO (2009) Queensland Government (2017)
1 Receive customer request Define the estimate’s purpose Define project scope
2 Construct WBS Develop estimating plan Collect project information
3 Define technical specifications Identify program characteristics Become familiar with the pro-ject site
4 State ground rules and assump-tions
Determine estimating structure Gather estimating information
5 Select a cost estimating method-ology
Ground rules and assumptions Develop base estimate
6 Select cost model/tool Obtain data (including historical data)
Conduct a reality check (ref-erence and historical data)
7 Gather data (including historical data)
Develop point estimate and com-pare to the independent estimate
Assess risk
8 Develop the estimate Carry out sensitivity analysis Calculate contingency
9 Carry out a risk assessment and incorporate into the estimate
Carry out risk and uncertainty analysis
Determine escalation
10 Document the estimate Document the estimate Complete and document the estimate
11 Present the results Present the estimate to be ap-proved
Review the estimate
12 Update the estimate when re-quired
Update the estimate according to the actual costs and changes
Present for approval
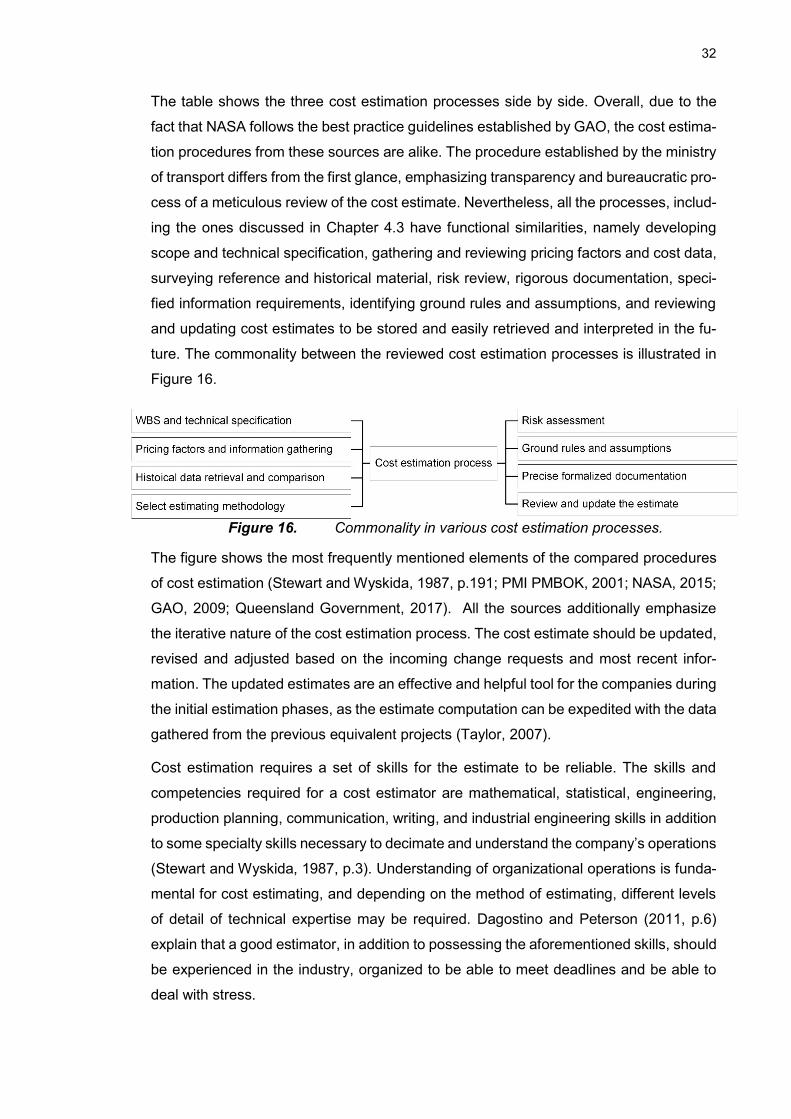
32
The table shows the three cost estimation processes side by side. Overall, due to the
fact that NASA follows the best practice guidelines established by GAO, the cost estima-
tion procedures from these sources are alike. The procedure established by the ministry
of transport differs from the first glance, emphasizing transparency and bureaucratic pro-
cess of a meticulous review of the cost estimate. Nevertheless, all the processes, includ-
ing the ones discussed in Chapter 4.3 have functional similarities, namely developing
scope and technical specification, gathering and reviewing pricing factors and cost data,
surveying reference and historical material, risk review, rigorous documentation, speci-
fied information requirements, identifying ground rules and assumptions, and reviewing
and updating cost estimates to be stored and easily retrieved and interpreted in the fu-
ture. The commonality between the reviewed cost estimation processes is illustrated in
Figure 16.
Figure 16. Commonality in various cost estimation processes.
The figure shows the most frequently mentioned elements of the compared procedures
of cost estimation (Stewart and Wyskida, 1987, p.191; PMI PMBOK, 2001; NASA, 2015;
GAO, 2009; Queensland Government, 2017). All the sources additionally emphasize
the iterative nature of the cost estimation process. The cost estimate should be updated,
revised and adjusted based on the incoming change requests and most recent infor-
mation. The updated estimates are an effective and helpful tool for the companies during
the initial estimation phases, as the estimate computation can be expedited with the data
gathered from the previous equivalent projects (Taylor, 2007).
Cost estimation requires a set of skills for the estimate to be reliable. The skills and
competencies required for a cost estimator are mathematical, statistical, engineering,
production planning, communication, writing, and industrial engineering skills in addition
to some specialty skills necessary to decimate and understand the company’s operations
(Stewart and Wyskida, 1987, p.3). Understanding of organizational operations is funda-
mental for cost estimating, and depending on the method of estimating, different levels
of detail of technical expertise may be required. Dagostino and Peterson (2011, p.6)
explain that a good estimator, in addition to possessing the aforementioned skills, should
be experienced in the industry, organized to be able to meet deadlines and be able to
deal with stress.
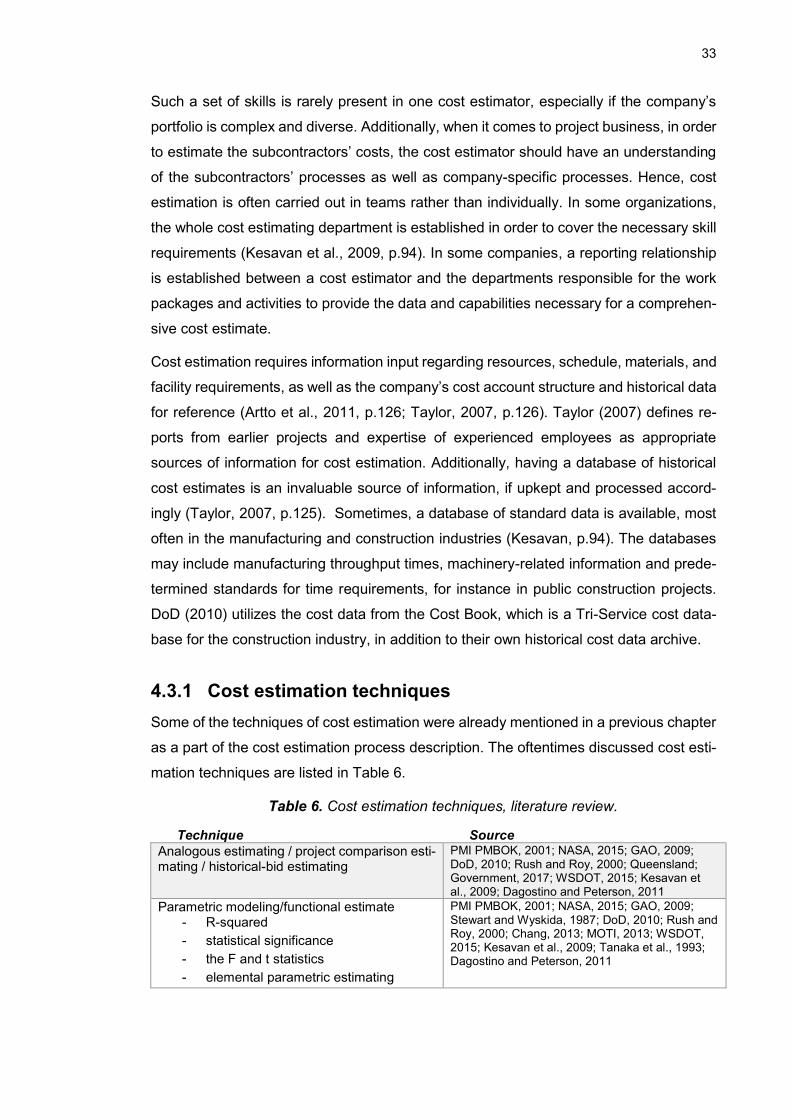
33
Such a set of skills is rarely present in one cost estimator, especially if the company’s
portfolio is complex and diverse. Additionally, when it comes to project business, in order
to estimate the subcontractors’ costs, the cost estimator should have an understanding
of the subcontractors’ processes as well as company-specific processes. Hence, cost
estimation is often carried out in teams rather than individually. In some organizations,
the whole cost estimating department is established in order to cover the necessary skill
requirements (Kesavan et al., 2009, p.94). In some companies, a reporting relationship
is established between a cost estimator and the departments responsible for the work
packages and activities to provide the data and capabilities necessary for a comprehen-
sive cost estimate.
Cost estimation requires information input regarding resources, schedule, materials, and
facility requirements, as well as the company’s cost account structure and historical data
for reference (Artto et al., 2011, p.126; Taylor, 2007, p.126). Taylor (2007) defines re-
ports from earlier projects and expertise of experienced employees as appropriate
sources of information for cost estimation. Additionally, having a database of historical
cost estimates is an invaluable source of information, if upkept and processed accord-
ingly (Taylor, 2007, p.125). Sometimes, a database of standard data is available, most
often in the manufacturing and construction industries (Kesavan, p.94). The databases
may include manufacturing throughput times, machinery-related information and prede-
termined standards for time requirements, for instance in public construction projects.
DoD (2010) utilizes the cost data from the Cost Book, which is a Tri-Service cost data-
base for the construction industry, in addition to their own historical cost data archive.
4.3.1 Cost estimation techniques
Some of the techniques of cost estimation were already mentioned in a previous chapter
as a part of the cost estimation process description. The oftentimes discussed cost esti-
mation techniques are listed in Table 6.
Table 6. Cost estimation techniques, literature review.
Technique Source
Analogous estimating / project comparison esti-mating / historical-bid estimating
PMI PMBOK, 2001; NASA, 2015; GAO, 2009; DoD, 2010; Rush and Roy, 2000; Queensland; Government, 2017; WSDOT, 2015; Kesavan et al., 2009; Dagostino and Peterson, 2011
Parametric modeling/functional estimate - R-squared
- statistical significance
- the F and t statistics
- elemental parametric estimating
PMI PMBOK, 2001; NASA, 2015; GAO, 2009; Stewart and Wyskida, 1987; DoD, 2010; Rush and Roy, 2000; Chang, 2013; MOTI, 2013; WSDOT, 2015; Kesavan et al., 2009; Tanaka et al., 1993; Dagostino and Peterson, 2011
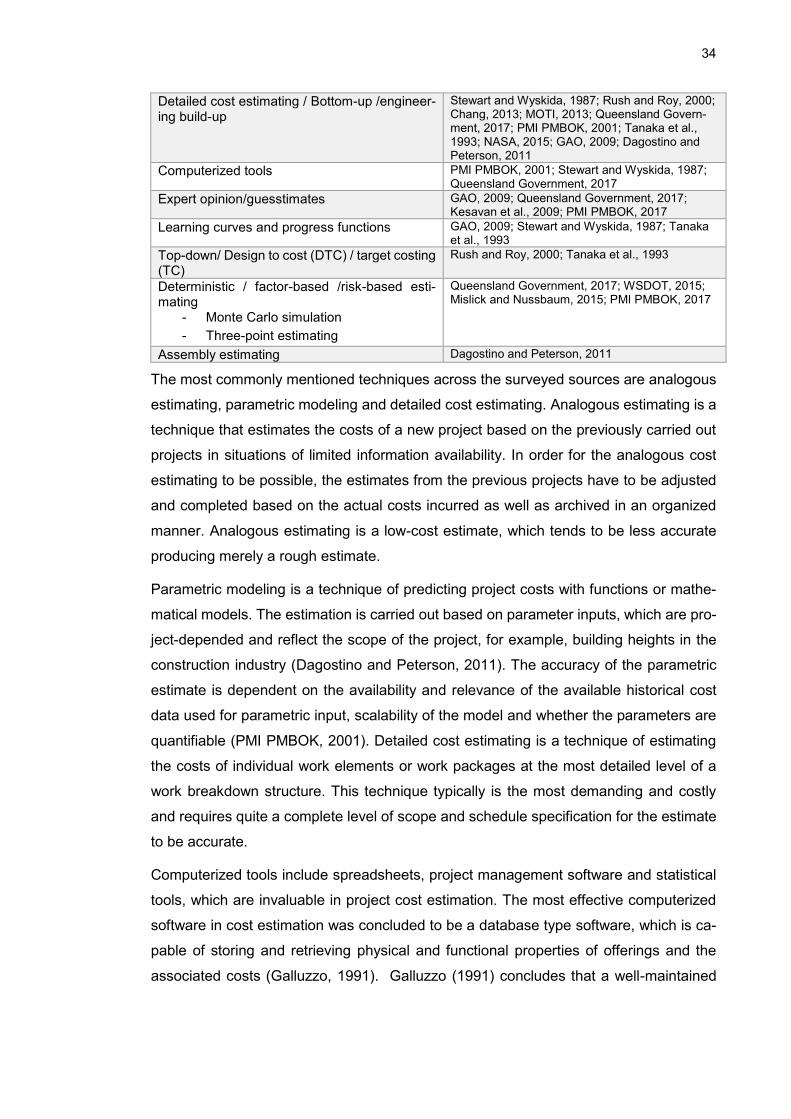
34
Detailed cost estimating / Bottom-up /engineer-ing build-up
Stewart and Wyskida, 1987; Rush and Roy, 2000; Chang, 2013; MOTI, 2013; Queensland Govern-ment, 2017; PMI PMBOK, 2001; Tanaka et al., 1993; NASA, 2015; GAO, 2009; Dagostino and Peterson, 2011
Computerized tools PMI PMBOK, 2001; Stewart and Wyskida, 1987; Queensland Government, 2017
Expert opinion/guesstimates GAO, 2009; Queensland Government, 2017; Kesavan et al., 2009; PMI PMBOK, 2017
Learning curves and progress functions GAO, 2009; Stewart and Wyskida, 1987; Tanaka et al., 1993
Top-down/ Design to cost (DTC) / target costing (TC)
Rush and Roy, 2000; Tanaka et al., 1993
Deterministic / factor-based /risk-based esti-mating
- Monte Carlo simulation
- Three-point estimating
Queensland Government, 2017; WSDOT, 2015; Mislick and Nussbaum, 2015; PMI PMBOK, 2017
Assembly estimating Dagostino and Peterson, 2011
The most commonly mentioned techniques across the surveyed sources are analogous
estimating, parametric modeling and detailed cost estimating. Analogous estimating is a
technique that estimates the costs of a new project based on the previously carried out
projects in situations of limited information availability. In order for the analogous cost
estimating to be possible, the estimates from the previous projects have to be adjusted
and completed based on the actual costs incurred as well as archived in an organized
manner. Analogous estimating is a low-cost estimate, which tends to be less accurate
producing merely a rough estimate.
Parametric modeling is a technique of predicting project costs with functions or mathe-
matical models. The estimation is carried out based on parameter inputs, which are pro-
ject-depended and reflect the scope of the project, for example, building heights in the
construction industry (Dagostino and Peterson, 2011). The accuracy of the parametric
estimate is dependent on the availability and relevance of the available historical cost
data used for parametric input, scalability of the model and whether the parameters are
quantifiable (PMI PMBOK, 2001). Detailed cost estimating is a technique of estimating
the costs of individual work elements or work packages at the most detailed level of a
work breakdown structure. This technique typically is the most demanding and costly
and requires quite a complete level of scope and schedule specification for the estimate
to be accurate.
Computerized tools include spreadsheets, project management software and statistical
tools, which are invaluable in project cost estimation. The most effective computerized
software in cost estimation was concluded to be a database type software, which is ca-
pable of storing and retrieving physical and functional properties of offerings and the
associated costs (Galluzzo, 1991). Galluzzo (1991) concludes that a well-maintained
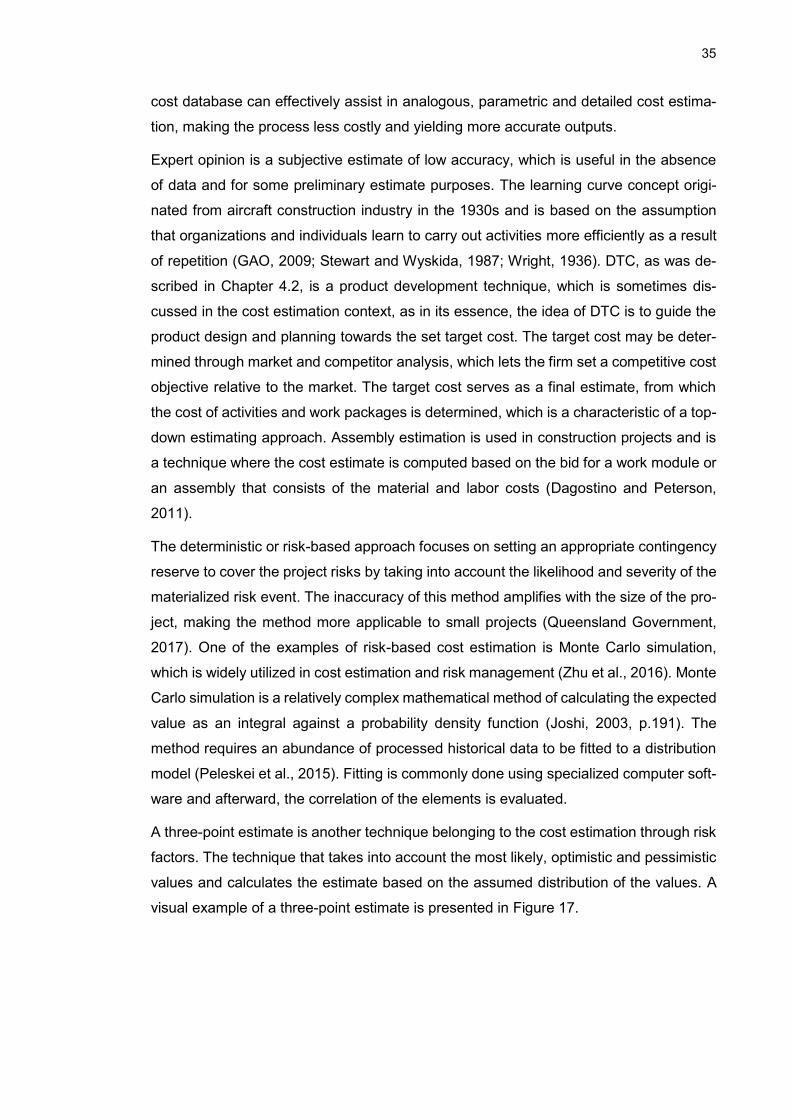
35
cost database can effectively assist in analogous, parametric and detailed cost estima-
tion, making the process less costly and yielding more accurate outputs.
Expert opinion is a subjective estimate of low accuracy, which is useful in the absence
of data and for some preliminary estimate purposes. The learning curve concept origi-
nated from aircraft construction industry in the 1930s and is based on the assumption
that organizations and individuals learn to carry out activities more efficiently as a result
of repetition (GAO, 2009; Stewart and Wyskida, 1987; Wright, 1936). DTC, as was de-
scribed in Chapter 4.2, is a product development technique, which is sometimes dis-
cussed in the cost estimation context, as in its essence, the idea of DTC is to guide the
product design and planning towards the set target cost. The target cost may be deter-
mined through market and competitor analysis, which lets the firm set a competitive cost
objective relative to the market. The target cost serves as a final estimate, from which
the cost of activities and work packages is determined, which is a characteristic of a top-
down estimating approach. Assembly estimation is used in construction projects and is
a technique where the cost estimate is computed based on the bid for a work module or
an assembly that consists of the material and labor costs (Dagostino and Peterson,
2011).
The deterministic or risk-based approach focuses on setting an appropriate contingency
reserve to cover the project risks by taking into account the likelihood and severity of the
materialized risk event. The inaccuracy of this method amplifies with the size of the pro-
ject, making the method more applicable to small projects (Queensland Government,
2017). One of the examples of risk-based cost estimation is Monte Carlo simulation,
which is widely utilized in cost estimation and risk management (Zhu et al., 2016). Monte
Carlo simulation is a relatively complex mathematical method of calculating the expected
value as an integral against a probability density function (Joshi, 2003, p.191). The
method requires an abundance of processed historical data to be fitted to a distribution
model (Peleskei et al., 2015). Fitting is commonly done using specialized computer soft-
ware and afterward, the correlation of the elements is evaluated.
A three-point estimate is another technique belonging to the cost estimation through risk
factors. The technique that takes into account the most likely, optimistic and pessimistic
values and calculates the estimate based on the assumed distribution of the values. A
visual example of a three-point estimate is presented in Figure 17.
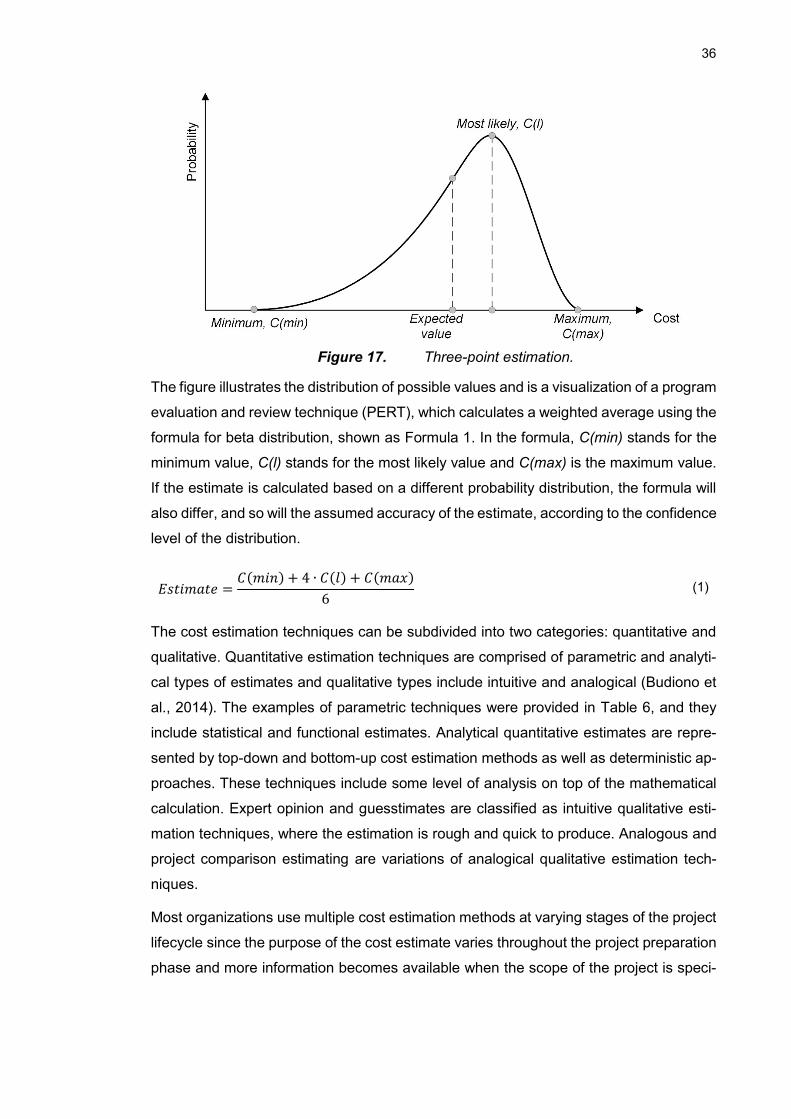
36
Figure 17. Three-point estimation.
The figure illustrates the distribution of possible values and is a visualization of a program
evaluation and review technique (PERT), which calculates a weighted average using the
formula for beta distribution, shown as Formula 1. In the formula, C(min) stands for the
minimum value, C(l) stands for the most likely value and C(max) is the maximum value.
If the estimate is calculated based on a different probability distribution, the formula will
also differ, and so will the assumed accuracy of the estimate, according to the confidence
level of the distribution.
The cost estimation techniques can be subdivided into two categories: quantitative and
qualitative. Quantitative estimation techniques are comprised of parametric and analyti-
cal types of estimates and qualitative types include intuitive and analogical (Budiono et
al., 2014). The examples of parametric techniques were provided in Table 6, and they
include statistical and functional estimates. Analytical quantitative estimates are repre-
sented by top-down and bottom-up cost estimation methods as well as deterministic ap-
proaches. These techniques include some level of analysis on top of the mathematical
calculation. Expert opinion and guesstimates are classified as intuitive qualitative esti-
mation techniques, where the estimation is rough and quick to produce. Analogous and
project comparison estimating are variations of analogical qualitative estimation tech-
niques.
Most organizations use multiple cost estimation methods at varying stages of the project
lifecycle since the purpose of the cost estimate varies throughout the project preparation
phase and more information becomes available when the scope of the project is speci-
𝐸𝑠𝑡𝑖𝑚𝑎𝑡𝑒 =𝐶(𝑚𝑖𝑛) + 4 ∙ 𝐶(𝑙) + 𝐶(𝑚𝑎𝑥)
6 (1)
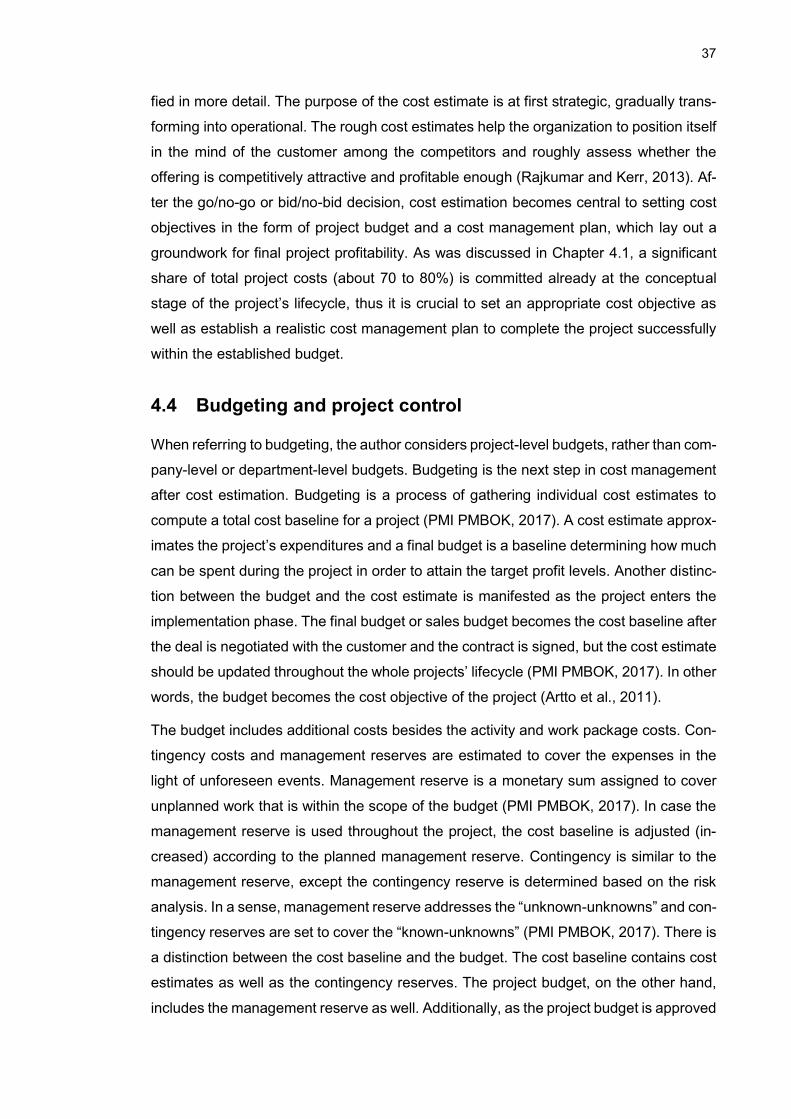
37
fied in more detail. The purpose of the cost estimate is at first strategic, gradually trans-
forming into operational. The rough cost estimates help the organization to position itself
in the mind of the customer among the competitors and roughly assess whether the
offering is competitively attractive and profitable enough (Rajkumar and Kerr, 2013). Af-
ter the go/no-go or bid/no-bid decision, cost estimation becomes central to setting cost
objectives in the form of project budget and a cost management plan, which lay out a
groundwork for final project profitability. As was discussed in Chapter 4.1, a significant
share of total project costs (about 70 to 80%) is committed already at the conceptual
stage of the project’s lifecycle, thus it is crucial to set an appropriate cost objective as
well as establish a realistic cost management plan to complete the project successfully
within the established budget.
4.4 Budgeting and project control
When referring to budgeting, the author considers project-level budgets, rather than com-
pany-level or department-level budgets. Budgeting is the next step in cost management
after cost estimation. Budgeting is a process of gathering individual cost estimates to
compute a total cost baseline for a project (PMI PMBOK, 2017). A cost estimate approx-
imates the project’s expenditures and a final budget is a baseline determining how much
can be spent during the project in order to attain the target profit levels. Another distinc-
tion between the budget and the cost estimate is manifested as the project enters the
implementation phase. The final budget or sales budget becomes the cost baseline after
the deal is negotiated with the customer and the contract is signed, but the cost estimate
should be updated throughout the whole projects’ lifecycle (PMI PMBOK, 2017). In other
words, the budget becomes the cost objective of the project (Artto et al., 2011).
The budget includes additional costs besides the activity and work package costs. Con-
tingency costs and management reserves are estimated to cover the expenses in the
light of unforeseen events. Management reserve is a monetary sum assigned to cover
unplanned work that is within the scope of the budget (PMI PMBOK, 2017). In case the
management reserve is used throughout the project, the cost baseline is adjusted (in-
creased) according to the planned management reserve. Contingency is similar to the
management reserve, except the contingency reserve is determined based on the risk
analysis. In a sense, management reserve addresses the “unknown-unknowns” and con-
tingency reserves are set to cover the “known-unknowns” (PMI PMBOK, 2017). There is
a distinction between the cost baseline and the budget. The cost baseline contains cost
estimates as well as the contingency reserves. The project budget, on the other hand,
includes the management reserve as well. Additionally, as the project budget is approved
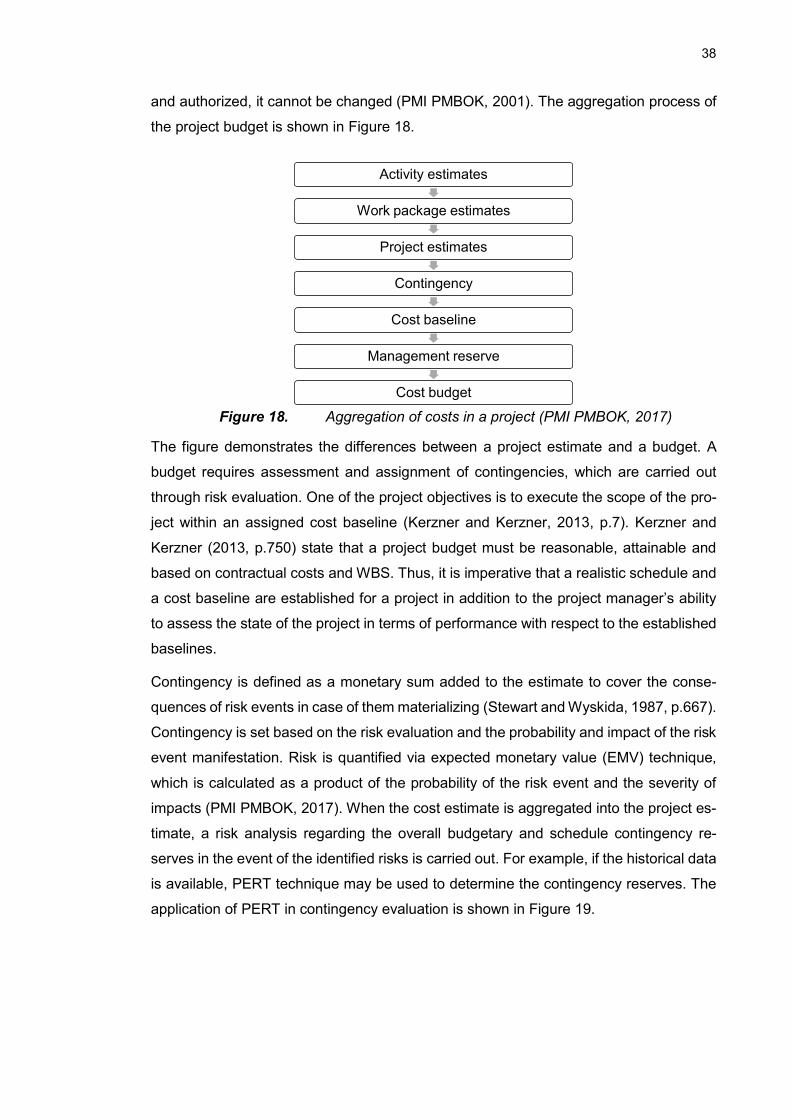
38
and authorized, it cannot be changed (PMI PMBOK, 2001). The aggregation process of
the project budget is shown in Figure 18.
Figure 18. Aggregation of costs in a project (PMI PMBOK, 2017)
The figure demonstrates the differences between a project estimate and a budget. A
budget requires assessment and assignment of contingencies, which are carried out
through risk evaluation. One of the project objectives is to execute the scope of the pro-
ject within an assigned cost baseline (Kerzner and Kerzner, 2013, p.7). Kerzner and
Kerzner (2013, p.750) state that a project budget must be reasonable, attainable and
based on contractual costs and WBS. Thus, it is imperative that a realistic schedule and
a cost baseline are established for a project in addition to the project manager’s ability
to assess the state of the project in terms of performance with respect to the established
baselines.
Contingency is defined as a monetary sum added to the estimate to cover the conse-
quences of risk events in case of them materializing (Stewart and Wyskida, 1987, p.667).
Contingency is set based on the risk evaluation and the probability and impact of the risk
event manifestation. Risk is quantified via expected monetary value (EMV) technique,
which is calculated as a product of the probability of the risk event and the severity of
impacts (PMI PMBOK, 2017). When the cost estimate is aggregated into the project es-
timate, a risk analysis regarding the overall budgetary and schedule contingency re-
serves in the event of the identified risks is carried out. For example, if the historical data
is available, PERT technique may be used to determine the contingency reserves. The
application of PERT in contingency evaluation is shown in Figure 19.
Activity estimates
Work package estimates
Project estimates
Contingency
Cost baseline
Management reserve
Cost budget
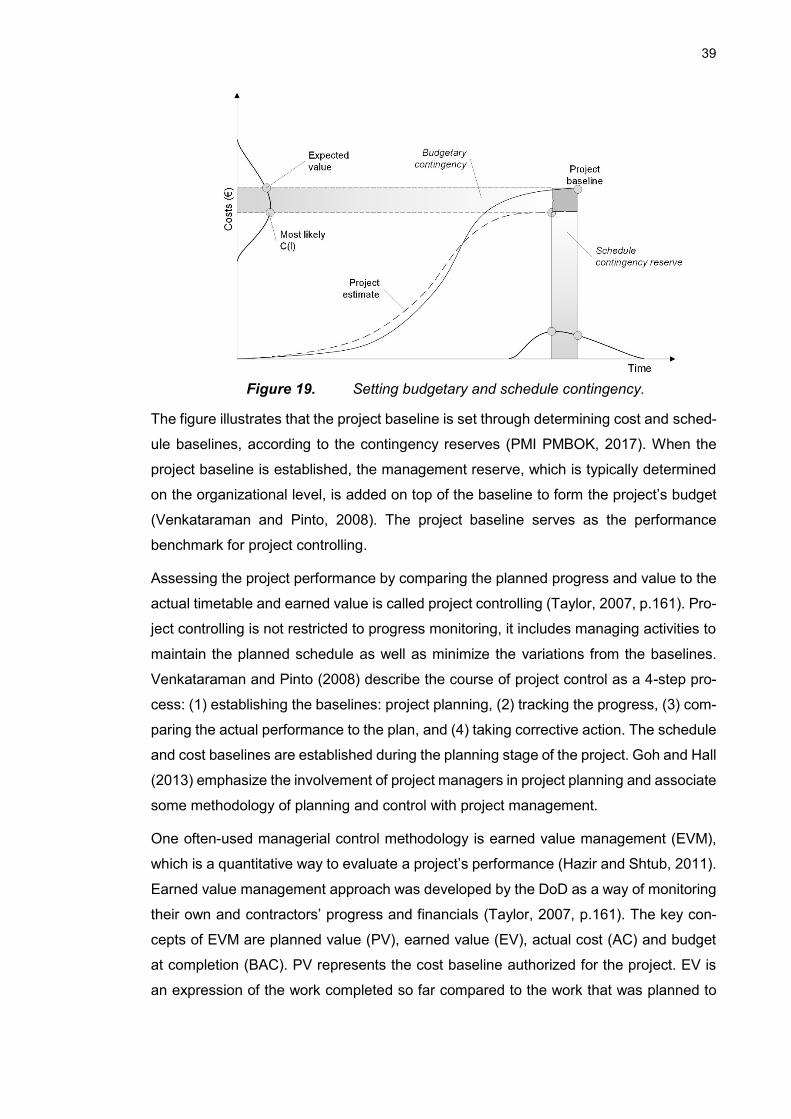
39
Figure 19. Setting budgetary and schedule contingency.
The figure illustrates that the project baseline is set through determining cost and sched-
ule baselines, according to the contingency reserves (PMI PMBOK, 2017). When the
project baseline is established, the management reserve, which is typically determined
on the organizational level, is added on top of the baseline to form the project’s budget
(Venkataraman and Pinto, 2008). The project baseline serves as the performance
benchmark for project controlling.
Assessing the project performance by comparing the planned progress and value to the
actual timetable and earned value is called project controlling (Taylor, 2007, p.161). Pro-
ject controlling is not restricted to progress monitoring, it includes managing activities to
maintain the planned schedule as well as minimize the variations from the baselines.
Venkataraman and Pinto (2008) describe the course of project control as a 4-step pro-
cess: (1) establishing the baselines: project planning, (2) tracking the progress, (3) com-
paring the actual performance to the plan, and (4) taking corrective action. The schedule
and cost baselines are established during the planning stage of the project. Goh and Hall
(2013) emphasize the involvement of project managers in project planning and associate
some methodology of planning and control with project management.
One often-used managerial control methodology is earned value management (EVM),
which is a quantitative way to evaluate a project’s performance (Hazir and Shtub, 2011).
Earned value management approach was developed by the DoD as a way of monitoring
their own and contractors’ progress and financials (Taylor, 2007, p.161). The key con-
cepts of EVM are planned value (PV), earned value (EV), actual cost (AC) and budget
at completion (BAC). PV represents the cost baseline authorized for the project. EV is
an expression of the work completed so far compared to the work that was planned to
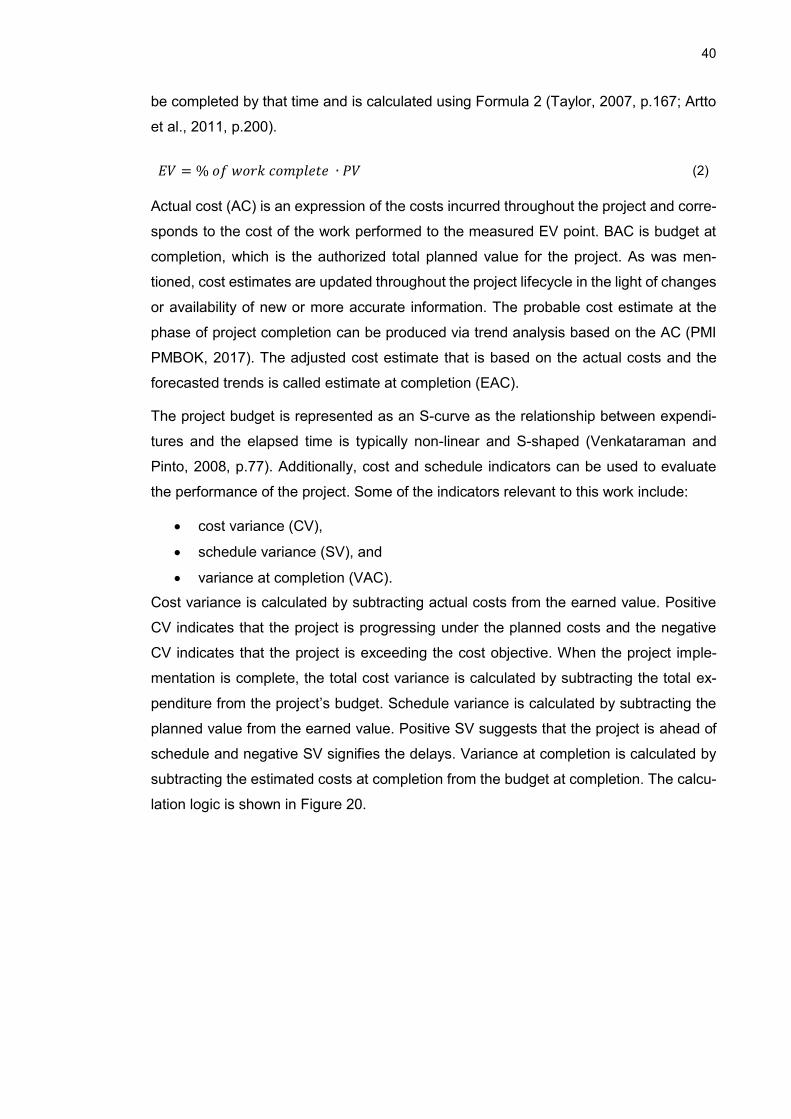
40
be completed by that time and is calculated using Formula 2 (Taylor, 2007, p.167; Artto
et al., 2011, p.200).
𝐸𝑉 = % 𝑜𝑓 𝑤𝑜𝑟𝑘 𝑐𝑜𝑚𝑝𝑙𝑒𝑡𝑒 ∙ 𝑃𝑉 (2)
Actual cost (AC) is an expression of the costs incurred throughout the project and corre-
sponds to the cost of the work performed to the measured EV point. BAC is budget at
completion, which is the authorized total planned value for the project. As was men-
tioned, cost estimates are updated throughout the project lifecycle in the light of changes
or availability of new or more accurate information. The probable cost estimate at the
phase of project completion can be produced via trend analysis based on the AC (PMI
PMBOK, 2017). The adjusted cost estimate that is based on the actual costs and the
forecasted trends is called estimate at completion (EAC).
The project budget is represented as an S-curve as the relationship between expendi-
tures and the elapsed time is typically non-linear and S-shaped (Venkataraman and
Pinto, 2008, p.77). Additionally, cost and schedule indicators can be used to evaluate
the performance of the project. Some of the indicators relevant to this work include:
• cost variance (CV),
• schedule variance (SV), and
• variance at completion (VAC).
Cost variance is calculated by subtracting actual costs from the earned value. Positive
CV indicates that the project is progressing under the planned costs and the negative
CV indicates that the project is exceeding the cost objective. When the project imple-
mentation is complete, the total cost variance is calculated by subtracting the total ex-
penditure from the project’s budget. Schedule variance is calculated by subtracting the
planned value from the earned value. Positive SV suggests that the project is ahead of
schedule and negative SV signifies the delays. Variance at completion is calculated by
subtracting the estimated costs at completion from the budget at completion. The calcu-
lation logic is shown in Figure 20.
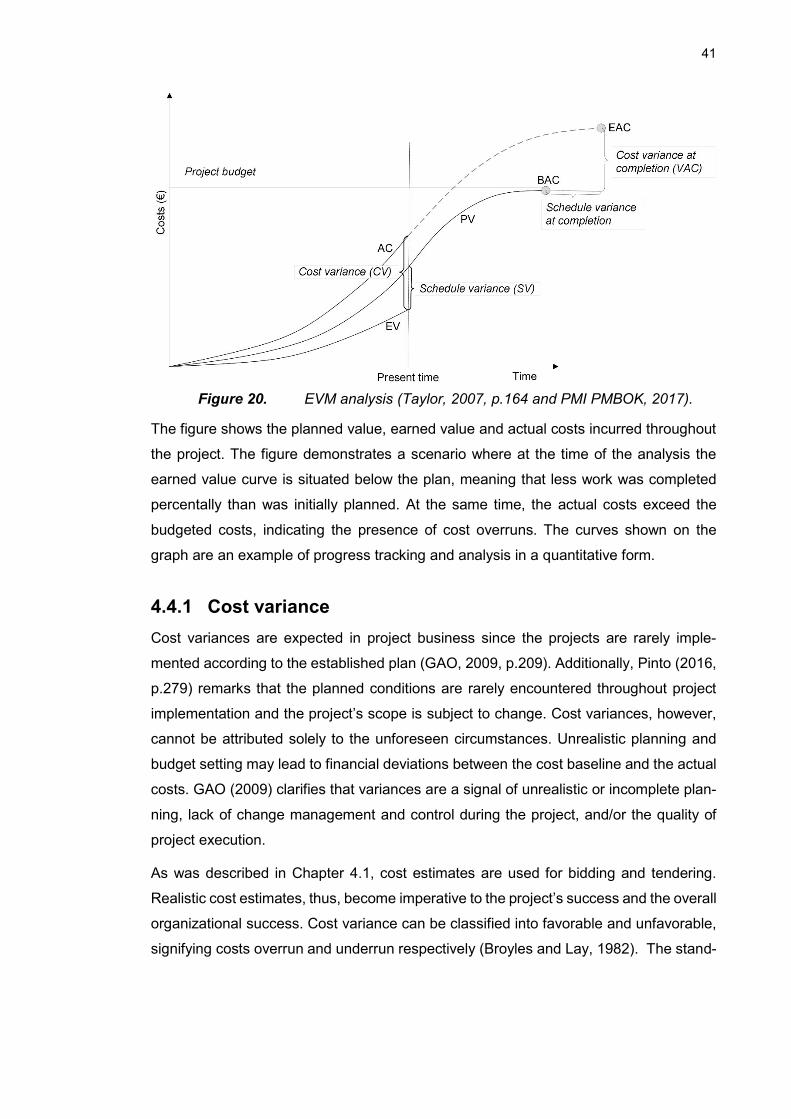
41
Figure 20. EVM analysis (Taylor, 2007, p.164 and PMI PMBOK, 2017).
The figure shows the planned value, earned value and actual costs incurred throughout
the project. The figure demonstrates a scenario where at the time of the analysis the
earned value curve is situated below the plan, meaning that less work was completed
percentally than was initially planned. At the same time, the actual costs exceed the
budgeted costs, indicating the presence of cost overruns. The curves shown on the
graph are an example of progress tracking and analysis in a quantitative form.
4.4.1 Cost variance
Cost variances are expected in project business since the projects are rarely imple-
mented according to the established plan (GAO, 2009, p.209). Additionally, Pinto (2016,
p.279) remarks that the planned conditions are rarely encountered throughout project
implementation and the project’s scope is subject to change. Cost variances, however,
cannot be attributed solely to the unforeseen circumstances. Unrealistic planning and
budget setting may lead to financial deviations between the cost baseline and the actual
costs. GAO (2009) clarifies that variances are a signal of unrealistic or incomplete plan-
ning, lack of change management and control during the project, and/or the quality of
project execution.
As was described in Chapter 4.1, cost estimates are used for bidding and tendering.
Realistic cost estimates, thus, become imperative to the project’s success and the overall
organizational success. Cost variance can be classified into favorable and unfavorable,
signifying costs overrun and underrun respectively (Broyles and Lay, 1982). The stand-
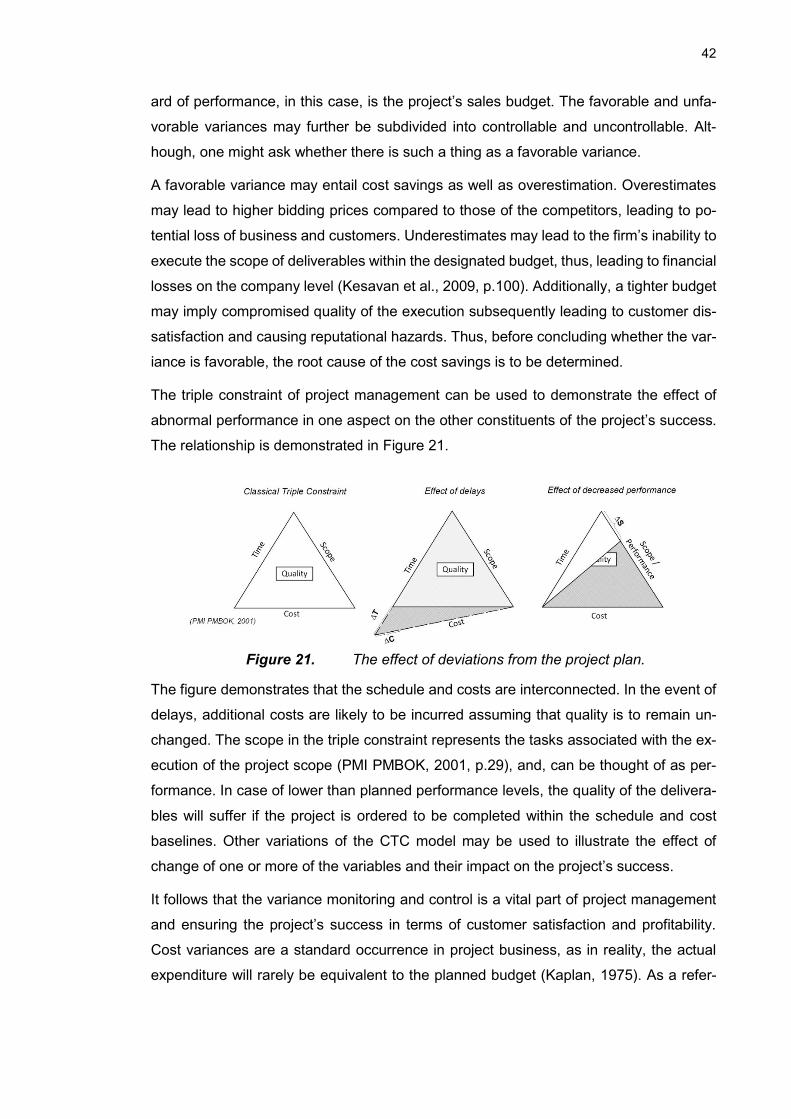
42
ard of performance, in this case, is the project’s sales budget. The favorable and unfa-
vorable variances may further be subdivided into controllable and uncontrollable. Alt-
hough, one might ask whether there is such a thing as a favorable variance.
A favorable variance may entail cost savings as well as overestimation. Overestimates
may lead to higher bidding prices compared to those of the competitors, leading to po-
tential loss of business and customers. Underestimates may lead to the firm’s inability to
execute the scope of deliverables within the designated budget, thus, leading to financial
losses on the company level (Kesavan et al., 2009, p.100). Additionally, a tighter budget
may imply compromised quality of the execution subsequently leading to customer dis-
satisfaction and causing reputational hazards. Thus, before concluding whether the var-
iance is favorable, the root cause of the cost savings is to be determined.
The triple constraint of project management can be used to demonstrate the effect of
abnormal performance in one aspect on the other constituents of the project’s success.
The relationship is demonstrated in Figure 21.
Figure 21. The effect of deviations from the project plan.
The figure demonstrates that the schedule and costs are interconnected. In the event of
delays, additional costs are likely to be incurred assuming that quality is to remain un-
changed. The scope in the triple constraint represents the tasks associated with the ex-
ecution of the project scope (PMI PMBOK, 2001, p.29), and, can be thought of as per-
formance. In case of lower than planned performance levels, the quality of the delivera-
bles will suffer if the project is ordered to be completed within the schedule and cost
baselines. Other variations of the CTC model may be used to illustrate the effect of
change of one or more of the variables and their impact on the project’s success.
It follows that the variance monitoring and control is a vital part of project management
and ensuring the project’s success in terms of customer satisfaction and profitability.
Cost variances are a standard occurrence in project business, as in reality, the actual
expenditure will rarely be equivalent to the planned budget (Kaplan, 1975). As a refer-
43
ence, about 35 per-cent of the software projects are completed within the schedule base-
line (Goh and Hall, 2011), meaning that 65% face delays. Shehu et al. (2014) find that
cost overruns are a fundamental and frequently observed problem for construction pro-
jects. Kwon and Kang (2018) in their review found that over 90 per-cent of construction
projects encounter the issue of cost overruns of between 50 and 100 percent. Flyvbjerg
et al. (2002) conducted a fundamental study of cost overruns in public projects and found
that cost overruns occur due to cost underestimation in 9 out of 10 projects. The projects
under investigation included railway, bridge and road construction. Bhargava et al.
(2010) collaborate that cost overruns are oftentimes encountered in infrastructure and
road construction projects.
Kaplan (1975) also emphasizes that variance investigation is demanding and resource-
consuming, implying that it is cost-intensive. Hence, it is important to know whether the
variance is insignificant and caused by random factors, or the root cause of the variance
lies within the organizational procedures. In general, the cost-benefit analysis may serve
as a guideline for the need to carry out variance investigation, as the investigation should
be undertaken if and only if the benefits of the investigation outweigh the costs (Kaplan,
1975). Dean (1937) further confirms that it is important for the firm to identify the control-
lable portion of the cost variances in order to make use of the costing system and “max-
imize managerial usefulness”. Variations, random or controllable, may be a cause for
project failure (Goh and Hall, 2011), hence it is of the utmost importance to identify the
root causes of and decrease controllable variances, as well as prepare for the uncontrol-
lable ones.
44
5. PROMOTING COST ESTIMATION QUALITY
5.1 Challenges in cost estimation and budgeting
Cost estimation and cost budgeting are a part of project planning, which means that both
are carried out prior to the project’s implementation and produce more of a forecast ra-
ther than a definitive output. Accurate cost estimation, based on which the sales and
implementation budgets are set, is vital for the project’s success (Love et al., 2013). An
accurate budget ensures that the company will attain target profitability as well as serves
as a performance control baseline for the project. Additionally, an accurate cost estimate
establishes a valid ground for decision-making, and cost and schedule management
within an organization (Doloi, 2013). However, project business is notorious for changes
and it is known that cost and schedule variances are inevitable. Nonetheless, identifying
and managing variance, as well as creating realistic and attainable estimates are instru-
mental in attempting to reduce the controllable variance.
Venkataraman and Pinto (2008, p.83) conclude that in project business cost estimation
is by default more difficult due to the unique nature of each project. That, coupled with
the unpredictable changes in scope and other circumstances, make variance at comple-
tion almost inevitable. As was discussed in Chapter 4.3.1, analogous estimating is a
widely-used technique in cost estimating, however, since no two projects are identical,
the estimate obtained by analogous estimating is merely a rough guideline. Venkata-
raman and Pinto (2008, p.84) and Taylor (2007, p.125) additionally emphasize that the
estimation is even more challenging in “multi-year projects”, as the scope of the project,
external and internal environment, and resource requirement and availability are subject
to change over the years. Artto et al. (2011, p.136) and PMI PMBOK (2001, p.32) bring
up a managerial technique called the rolling wave principle, which is an iterative planning
technique. The general principle of the rolling wave is to make use of the new, more
accurate information as the project progresses and conduct cost estimation at a more
detailed itemization level. The activities that are barely specified and are described on a
highly general level are estimated at the cost account level.
Other challenges in cost estimation exist when it comes to itemization and timely cost
allocation to a correct work package in the correct cost account (Venkataraman and
Pinto, 2008, p.84). Accurate cost tracking and being able to trace the costs related to a
specific cost item or work package is vital in earned value management, variance anal-
ysis at completion as well as future estimation. Taylor (2007) discusses the novelty of
45
technology and technological requirements characteristic to project business as a reason
for difficulties in cost estimation. As each project is unique in scope, the solutions pro-
vided to the customers are most likely also unique and tailored to the customer’s needs.
This makes the availability of historical data a challenge, as it is highly unlikely to find a
project with comparable parameters.
Another variable that affects cost estimation is the size of the project. Jørgensen et al.
(2012) found a correlation between the project size and the planning accuracy in pro-
jects. The researchers conclude that the larger and more complex the project is, the
more likely cost overruns are to occur. The researchers were able to definitively state
that the size affects the project no matter how rational the cost estimation procedures
are, although, the patterns of the most and least successful cost estimating techniques
were not clear. Shane et al. (2009) concur on the likelihood of cost overruns in larger
projects. The researchers additionally state that the projects can be delivered within the
assigned budget, however, that requires an extreme awareness of cost-incurring factors
as well as a good cost estimate.
Love et al. (2013) confirms that cost estimating is more challenging in larger projects due
to increased complexity and the likelihood of change orders throughout project imple-
mentation. Doloi (2010) elaborates on the particular aspects brought by increased pro-
ject complexity and modern reliance on the supply chain. One of the features of the
modern industrial environment is increased reliance on the supply chain and, hence,
increased tendency to outsource some activities (Kujala et al., 2010; Zhu et al., 2001).
Outsourcing is a strategy that companies use to differentiate their offerings in the market
place by acquiring extra capabilities or capacity without investing in their development
and differentiation. Outsourcing can be regarded as a survival tool for manufacturers in
modern competitive and developed industrial environment. The firm acquiring cost esti-
mates from the contractors relies on the estimates being accurate, however, deviations
often occur due to factors affecting contractors’ performance or inaccuracies in the initial
cost estimation on their behalf (Doloi, 2010). The researcher points out that contractors’
documentation quality and efficiency are sometimes inappropriate for setting a budgetary
baseline.
Shane et al. (2009) additionally bring up the challenge of misinterpretation and reporting,
in other words, impaired and incomplete information flow. Ferris (1976) attributes human
personality as a challenge to cost estimation processes. The researcher states that the
personality traits have a positive correlation to certain estimating tendencies, namely that
there is a positive correlation between the optimistic personality and overestimation as
well as pessimistic personality and underestimation. Challenges in cost estimation that
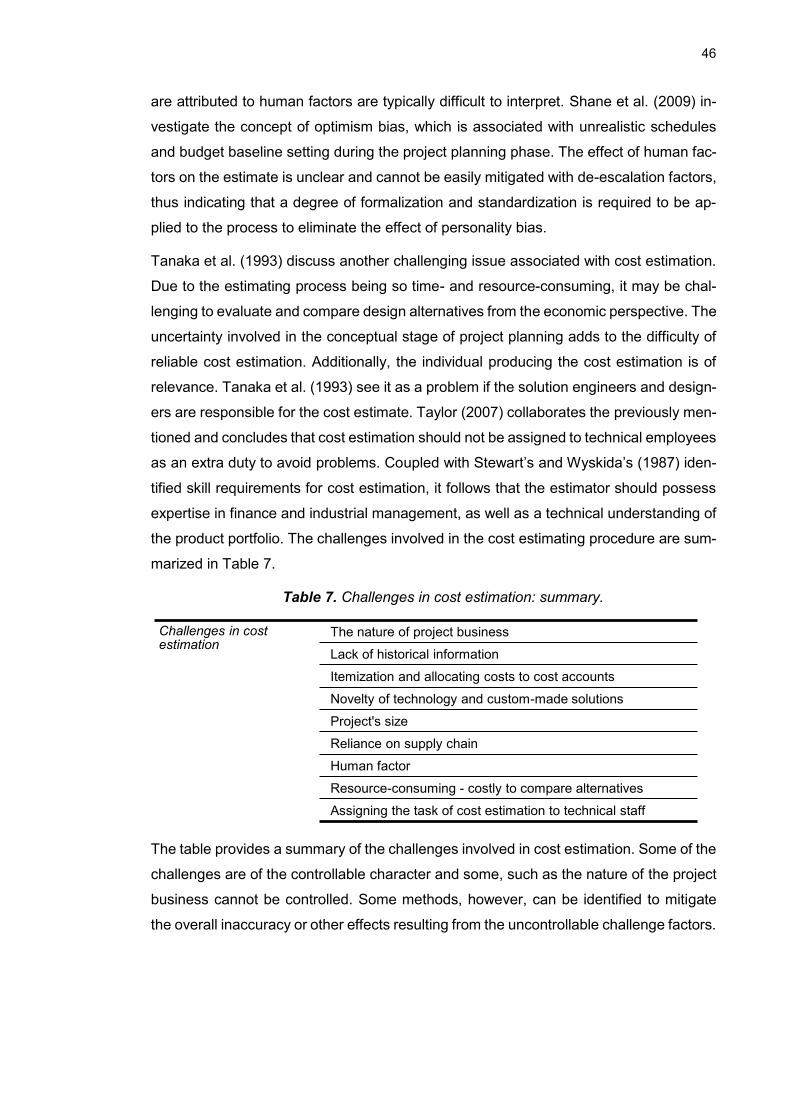
46
are attributed to human factors are typically difficult to interpret. Shane et al. (2009) in-
vestigate the concept of optimism bias, which is associated with unrealistic schedules
and budget baseline setting during the project planning phase. The effect of human fac-
tors on the estimate is unclear and cannot be easily mitigated with de-escalation factors,
thus indicating that a degree of formalization and standardization is required to be ap-
plied to the process to eliminate the effect of personality bias.
Tanaka et al. (1993) discuss another challenging issue associated with cost estimation.
Due to the estimating process being so time- and resource-consuming, it may be chal-
lenging to evaluate and compare design alternatives from the economic perspective. The
uncertainty involved in the conceptual stage of project planning adds to the difficulty of
reliable cost estimation. Additionally, the individual producing the cost estimation is of
relevance. Tanaka et al. (1993) see it as a problem if the solution engineers and design-
ers are responsible for the cost estimate. Taylor (2007) collaborates the previously men-
tioned and concludes that cost estimation should not be assigned to technical employees
as an extra duty to avoid problems. Coupled with Stewart’s and Wyskida’s (1987) iden-
tified skill requirements for cost estimation, it follows that the estimator should possess
expertise in finance and industrial management, as well as a technical understanding of
the product portfolio. The challenges involved in the cost estimating procedure are sum-
marized in Table 7.
Table 7. Challenges in cost estimation: summary.
The table provides a summary of the challenges involved in cost estimation. Some of the
challenges are of the controllable character and some, such as the nature of the project
business cannot be controlled. Some methods, however, can be identified to mitigate
the overall inaccuracy or other effects resulting from the uncontrollable challenge factors.
Challenges in cost estimation
The nature of project business
Lack of historical information
Itemization and allocating costs to cost accounts
Novelty of technology and custom-made solutions
Project's size
Reliance on supply chain
Human factor
Resource-consuming - costly to compare alternatives
Assigning the task of cost estimation to technical staff
47
5.2 Pitfalls of cost estimating and cost overruns
Project variance at completion can be attributed not only to the planning stage of the
project life-cycle but also the implementation stage. The role of the project manager is to
undertake the necessary pre-defined actions or design a new course of action that aim
at alleviating the effects of project variance. Nonetheless, no matter at what stage of the
project lifecycle, the importance of an accurate initial cost estimate cannot be overem-
phasized. Hicks (1992) portrays the role of a cost estimate as a key element ensuring
the project’s success and claims that…
“…without an accurate cost estimate nothing, short of an act of God, can be done to
prevent a loss, regardless of management competence, the financial strength of the con-
tractor, or know-how”.
Venkataraman and Pinto (2008, p.46) conclude that one of the most common reasons
for cost overruns in a project is an unrealistic, low and unattainable cost estimate. Other
causes of project variance, which are attributed to the pre-contractual stage of a project
are misunderstanding the customer, inadequate planning, incomplete WBS, skill defi-
ciency and personnel availability (Havranek, 2017). Misunderstanding the customer
leads to incorrect technical requirement interpretation and subsequently to incomplete
or faulty WBS development. Inadequate planning is a root cause of flawed schedule
development and budget setting. Shane et al. (2009) emphasize that in order to attempt
project completion within the assigned budget, project estimate, and planning should be
carried out accurately. Tanaka et al. (1993) identify that one of the fundamental pitfalls
of cost estimation is that it is carried out solely after product specification. The authors
emphasize the importance of target costing and design-to-cost approaches since in or-
der for the product to be competitively priced, the market analysis is necessary to eval-
uate the price levels of the competitors.
There are other reasons for cost deviations throughout the project lifecycle, but the ones
discussed are the most relevant to this work, as the causes are internal and controllable.
From the literature (Venkataraman and Pinto, 2008; Havranek, 2017; Shane et al., 2009;
Hicks, 1992) it is apparent that the key reasons for cost overruns are incorrectly estab-
lished cost baseline, which is a product of cost estimation. Incorrect cost estimation is,
in turn, a result of inadequate planning, misunderstanding the customer and internal
communication. The importance of the accurate cost estimate can be illustrated with a
Freiman curve (Asiedu and Gu, 1998; Chang, 2013), which demonstrates the relation-
ship between the estimated costs and the actual costs. The Freiman curve is shown in
Figure 22.
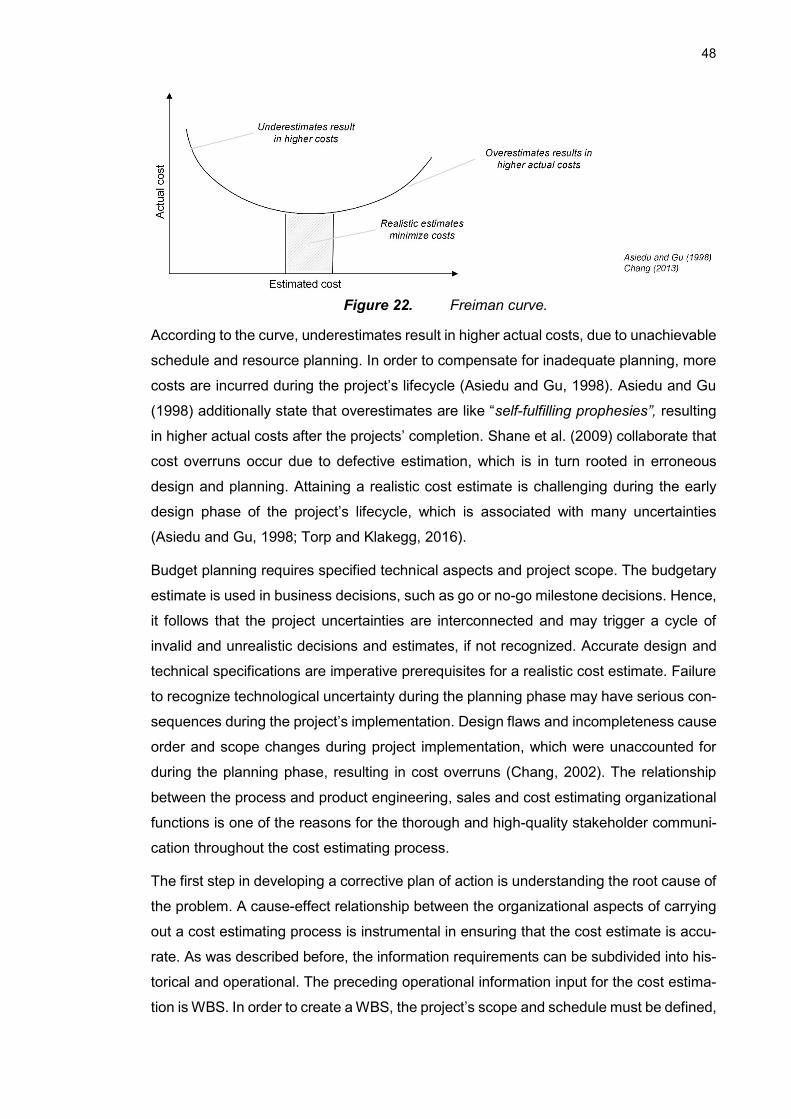
48
Figure 22. Freiman curve.
According to the curve, underestimates result in higher actual costs, due to unachievable
schedule and resource planning. In order to compensate for inadequate planning, more
costs are incurred during the project’s lifecycle (Asiedu and Gu, 1998). Asiedu and Gu
(1998) additionally state that overestimates are like “self-fulfilling prophesies”, resulting
in higher actual costs after the projects’ completion. Shane et al. (2009) collaborate that
cost overruns occur due to defective estimation, which is in turn rooted in erroneous
design and planning. Attaining a realistic cost estimate is challenging during the early
design phase of the project’s lifecycle, which is associated with many uncertainties
(Asiedu and Gu, 1998; Torp and Klakegg, 2016).
Budget planning requires specified technical aspects and project scope. The budgetary
estimate is used in business decisions, such as go or no-go milestone decisions. Hence,
it follows that the project uncertainties are interconnected and may trigger a cycle of
invalid and unrealistic decisions and estimates, if not recognized. Accurate design and
technical specifications are imperative prerequisites for a realistic cost estimate. Failure
to recognize technological uncertainty during the planning phase may have serious con-
sequences during the project’s implementation. Design flaws and incompleteness cause
order and scope changes during project implementation, which were unaccounted for
during the planning phase, resulting in cost overruns (Chang, 2002). The relationship
between the process and product engineering, sales and cost estimating organizational
functions is one of the reasons for the thorough and high-quality stakeholder communi-
cation throughout the cost estimating process.
The first step in developing a corrective plan of action is understanding the root cause of
the problem. A cause-effect relationship between the organizational aspects of carrying
out a cost estimating process is instrumental in ensuring that the cost estimate is accu-
rate. As was described before, the information requirements can be subdivided into his-
torical and operational. The preceding operational information input for the cost estima-
tion is WBS. In order to create a WBS, the project’s scope and schedule must be defined,
49
which in turn requires clear customer understanding as well as organizational under-
standing in terms of capabilities and resource availability.
Naturally, the information is specified with time throughout the project lifecycle, however,
the estimates are already required at the earliest stages of the project planning for the
milestone decisions, such as whether to proceed with the project. Cost estimate compu-
tation may be a costly process depending on the desired degree of accuracy. Some
estimating techniques are more time-consuming than others, furthermore, some estimat-
ing techniques are accepted to be more accurate. If cost estimating is treated as a con-
tinuous and iterative process, rather than a singular independent event, the accuracy
requirement may be adjusted and optimized according to the resource availability, which
is deemed necessary for attaining a cost estimate.
5.2.1 Qualities of a good estimate
Taylor (2007) discusses the successful cost estimation practices and infers on the steps
that are to be undertaken to create a quality estimate. The first steps according to the
author are to determine the purpose of the estimate and assess the available information
and resources for the estimation process. It is also emphasized that when sharing the
estimate within the organization, the accuracy and the detail level of the estimate should
be clearly stated and understood by the user of the estimate (Taylor, 2007). If the esti-
mate is rough and unprecise and it is misused in customer negotiations, the seller or-
ganization may encounter financial losses or dismantle its reputation in the eyes of the
customer by revoking the offer and altering the contract price.
Taylor (2007, p.109) proposes a set of recommendations for carrying out a successful
cost estimation. The recommendations include:
• using the most accurate method and a combination of methods if possible,
• involving internal project stakeholders and experienced employees in the esti-mating process,
• recording all assumptions,
• basing the estimates on the evaluation and assessment of previously conducted estimates,
• communicating the level of precision to the party, who is using the estimate, and
• provide estimates based on the available information and do not pad them.
GAO (2009) identifies their requirements for a credible estimate. The requirements in-
clude clear task identification, internal stakeholder involvement in the estimation process,
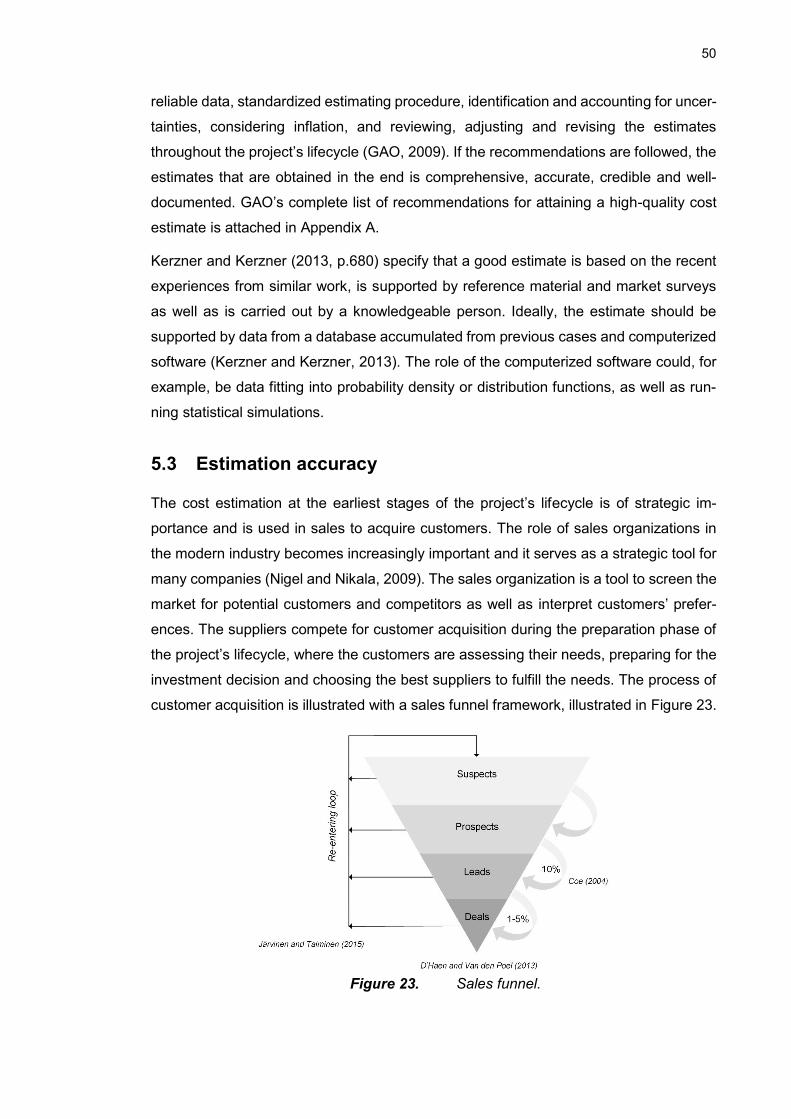
50
reliable data, standardized estimating procedure, identification and accounting for uncer-
tainties, considering inflation, and reviewing, adjusting and revising the estimates
throughout the project’s lifecycle (GAO, 2009). If the recommendations are followed, the
estimates that are obtained in the end is comprehensive, accurate, credible and well-
documented. GAO’s complete list of recommendations for attaining a high-quality cost
estimate is attached in Appendix A.
Kerzner and Kerzner (2013, p.680) specify that a good estimate is based on the recent
experiences from similar work, is supported by reference material and market surveys
as well as is carried out by a knowledgeable person. Ideally, the estimate should be
supported by data from a database accumulated from previous cases and computerized
software (Kerzner and Kerzner, 2013). The role of the computerized software could, for
example, be data fitting into probability density or distribution functions, as well as run-
ning statistical simulations.
5.3 Estimation accuracy
The cost estimation at the earliest stages of the project’s lifecycle is of strategic im-
portance and is used in sales to acquire customers. The role of sales organizations in
the modern industry becomes increasingly important and it serves as a strategic tool for
many companies (Nigel and Nikala, 2009). The sales organization is a tool to screen the
market for potential customers and competitors as well as interpret customers’ prefer-
ences. The suppliers compete for customer acquisition during the preparation phase of
the project’s lifecycle, where the customers are assessing their needs, preparing for the
investment decision and choosing the best suppliers to fulfill the needs. The process of
customer acquisition is illustrated with a sales funnel framework, illustrated in Figure 23.
Figure 23. Sales funnel.
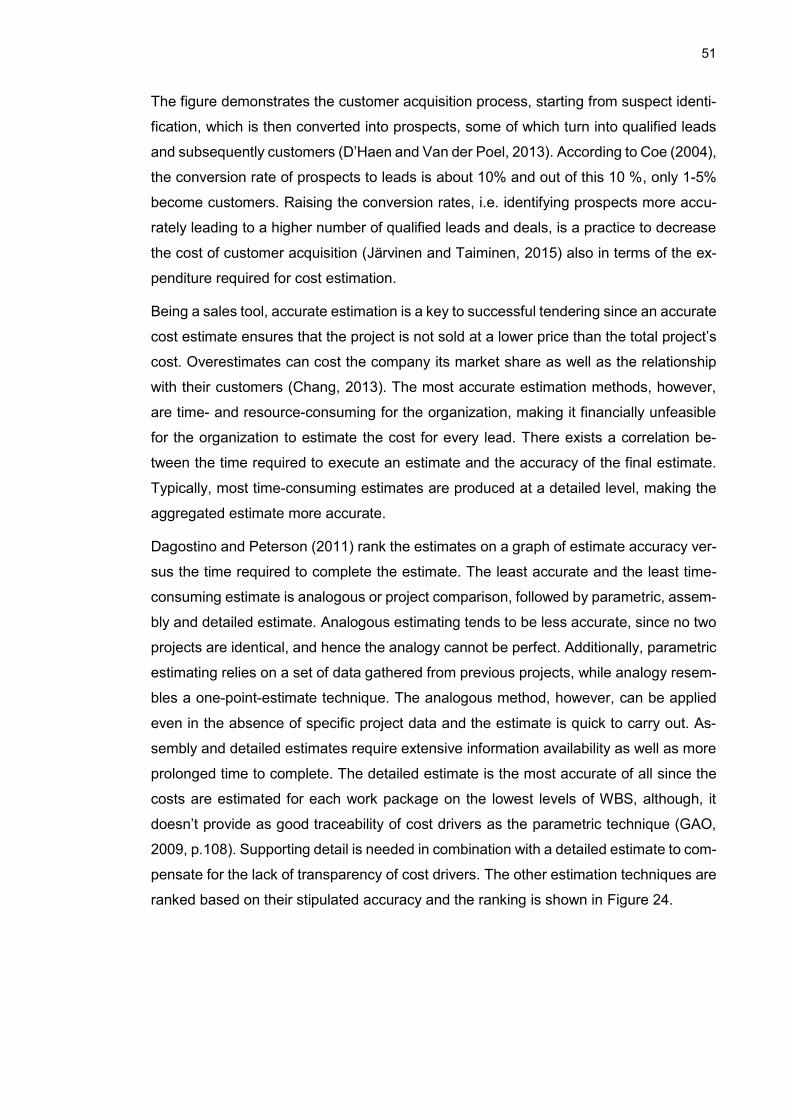
51
The figure demonstrates the customer acquisition process, starting from suspect identi-
fication, which is then converted into prospects, some of which turn into qualified leads
and subsequently customers (D’Haen and Van der Poel, 2013). According to Coe (2004),
the conversion rate of prospects to leads is about 10% and out of this 10 %, only 1-5%
become customers. Raising the conversion rates, i.e. identifying prospects more accu-
rately leading to a higher number of qualified leads and deals, is a practice to decrease
the cost of customer acquisition (Järvinen and Taiminen, 2015) also in terms of the ex-
penditure required for cost estimation.
Being a sales tool, accurate estimation is a key to successful tendering since an accurate
cost estimate ensures that the project is not sold at a lower price than the total project’s
cost. Overestimates can cost the company its market share as well as the relationship
with their customers (Chang, 2013). The most accurate estimation methods, however,
are time- and resource-consuming for the organization, making it financially unfeasible
for the organization to estimate the cost for every lead. There exists a correlation be-
tween the time required to execute an estimate and the accuracy of the final estimate.
Typically, most time-consuming estimates are produced at a detailed level, making the
aggregated estimate more accurate.
Dagostino and Peterson (2011) rank the estimates on a graph of estimate accuracy ver-
sus the time required to complete the estimate. The least accurate and the least time-
consuming estimate is analogous or project comparison, followed by parametric, assem-
bly and detailed estimate. Analogous estimating tends to be less accurate, since no two
projects are identical, and hence the analogy cannot be perfect. Additionally, parametric
estimating relies on a set of data gathered from previous projects, while analogy resem-
bles a one-point-estimate technique. The analogous method, however, can be applied
even in the absence of specific project data and the estimate is quick to carry out. As-
sembly and detailed estimates require extensive information availability as well as more
prolonged time to complete. The detailed estimate is the most accurate of all since the
costs are estimated for each work package on the lowest levels of WBS, although, it
doesn’t provide as good traceability of cost drivers as the parametric technique (GAO,
2009, p.108). Supporting detail is needed in combination with a detailed estimate to com-
pensate for the lack of transparency of cost drivers. The other estimation techniques are
ranked based on their stipulated accuracy and the ranking is shown in Figure 24.
52
Figure 24. Accuracy of cost estimation versus time required for the estimation.
The figure shows that expert opinion is stipulated to be less accurate than the analogous
estimating. Perhaps coupling expert opinion and analogous estimating would be a valid
technique for obtaining a more accurate comparative estimate with consideration of
case-specific implications, which are produced by experienced workers, who have en-
countered similar cases and can identify the uncertainties involved in the case.
Top-down estimation is ranked as the next most accurate, where the estimate is deter-
mined through the market and competitor analysis and the work package costs are as-
signed based on the total target cost. That technique guides the product development
efforts to design the solution according to the established target cost. Top-down estima-
tion may also be carried out based on the earlier sold similar products, which implies that
a large amount of information about similar products is needed. Even with the available
information, the top-down estimate is not the most accurate due to the uniqueness of
each project. Computerized tools are comparable to the parametric estimation and are
quicker and more accurate if the data archives are maintained properly. The learning
curve, assembly estimate and deterministic estimate are stipulated to take a longer time
than the parametric estimate, although resulting in a more accurate result, due to con-
sideration of risks and case-specific factors, as well as experiential factors. A detailed
estimate is considered to take the longest time to complete and the information input is
required to be quite complete and accurate, thereby ensuring that the aggregated de-
tailed estimate is indeed viable.
Using the most accurate possible estimating technique as well as using a combination
of methods were outlined as good cost estimation practices. However, the balance be-
tween the desired accuracy and resource availability should be found, as the more de-
tailed the cost estimation gets, the more costly the estimating process becomes. Accord-
ing to NASA (2015), there are two types of estimates throughout the project’s lifecycle –
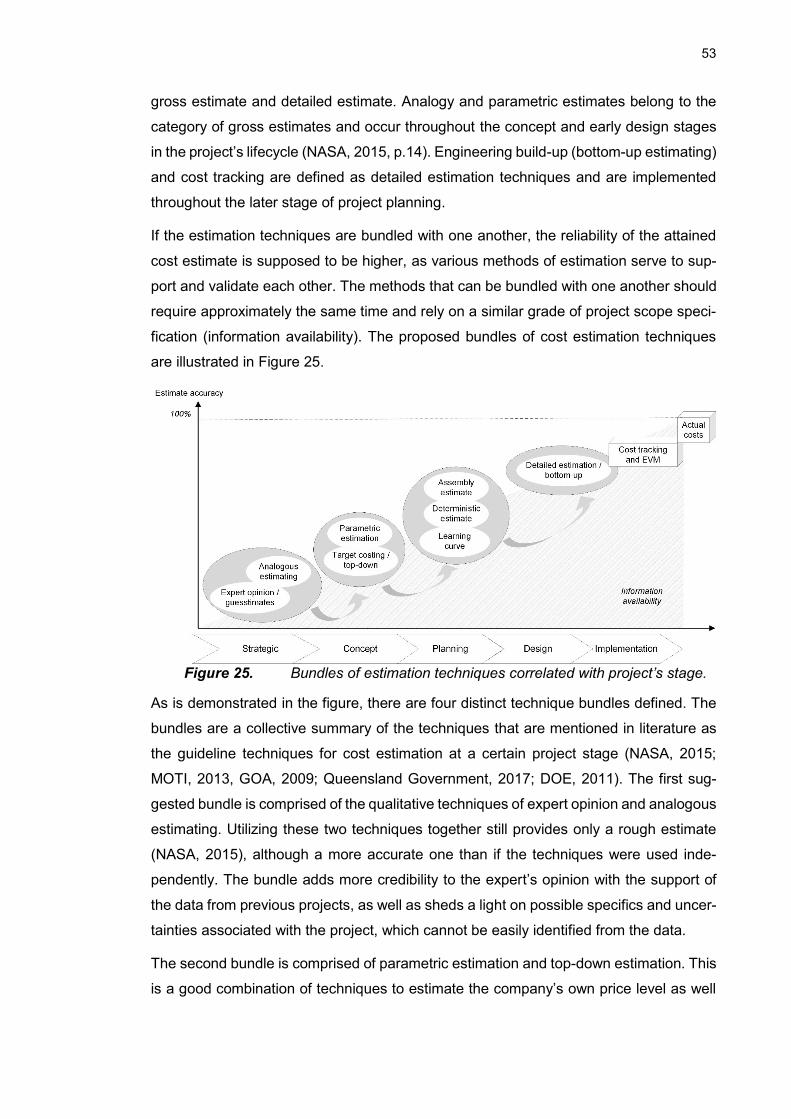
53
gross estimate and detailed estimate. Analogy and parametric estimates belong to the
category of gross estimates and occur throughout the concept and early design stages
in the project’s lifecycle (NASA, 2015, p.14). Engineering build-up (bottom-up estimating)
and cost tracking are defined as detailed estimation techniques and are implemented
throughout the later stage of project planning.
If the estimation techniques are bundled with one another, the reliability of the attained
cost estimate is supposed to be higher, as various methods of estimation serve to sup-
port and validate each other. The methods that can be bundled with one another should
require approximately the same time and rely on a similar grade of project scope speci-
fication (information availability). The proposed bundles of cost estimation techniques
are illustrated in Figure 25.
Figure 25. Bundles of estimation techniques correlated with project’s stage.
As is demonstrated in the figure, there are four distinct technique bundles defined. The
bundles are a collective summary of the techniques that are mentioned in literature as
the guideline techniques for cost estimation at a certain project stage (NASA, 2015;
MOTI, 2013, GOA, 2009; Queensland Government, 2017; DOE, 2011). The first sug-
gested bundle is comprised of the qualitative techniques of expert opinion and analogous
estimating. Utilizing these two techniques together still provides only a rough estimate
(NASA, 2015), although a more accurate one than if the techniques were used inde-
pendently. The bundle adds more credibility to the expert’s opinion with the support of
the data from previous projects, as well as sheds a light on possible specifics and uncer-
tainties associated with the project, which cannot be easily identified from the data.
The second bundle is comprised of parametric estimation and top-down estimation. This
is a good combination of techniques to estimate the company’s own price level as well
54
as evaluate whether the price is competitive in the market. Additionally, this bundle al-
lows for a comparison of alternative design and price levels, which happens to be one of
the pitfalls of cost estimating (Tanaka et al., 1993). The next bundle contains determin-
istic, learning curve and assembly estimates, which require more time to complete, alt-
hough provide a more accurate estimate since the risks and uncertainties were taken
into account. These estimation techniques do not allow for effective design comparison
since they would be too costly to carry out for multiple alternatives.
The final and the most accurate estimate level is a detailed estimation, which is carried
out for the firm proposal stage in customer negotiations. Since that technique involves
cost estimation for each of the elements and work packages in the WBS, it is the most
challenging and time-consuming estimation technique to carry out. It becomes even
more challenging in multi-divisional projects, where various business units must combine
their efforts to plan and price the deliverables. Communication and division of responsi-
bilities quite frequently become an issue in such cases (Dietrich et al., 2002). It is note-
worthy, that cost estimation is an iterative process, which means that the bundles of
techniques are not mutually exclusive, on the contrary, the information acquired through-
out the process is built up, revised and validated as the estimation process advances
(GAO, 2009).
The cost estimation bundles are followed by cost tracking and EVM, which is a project
management technique of project control. The actual costs and complete information
become available only after project completion, which is the last block shown in Figure
25. EVM and actual costs are not excluded from the cost estimating techniques, as they
become a part of cost analysis, which is then used in cost analysis to complete the cost
estimation process and evaluate the accuracy of cost estimation for future estimations
(Stewart and Wyskida, 1987; Rush and Roy, 2001; GAO, 2009).
5.3.1 Importance of historical information in cost estimation
The literature emphasizes the need for organized and retrievable historical information
for obtaining a more precise cost estimate, however, sometimes the information is not
available. The lack of information may be based on the novelty of the product or incom-
plete cost estimating procedures. As was discussed in Chapter 4.3, the cost estimate
process is completed with the supporting detail, including the cost analysis and the les-
sons learned from the estimating process. Processing and accumulating the cost esti-
mate and cost variance data at the end of the project are the necessary constituents for
the cost database, which is an invaluable tool in cost estimation (Stewart and Wyskida,
1987, p.15).
55
Without historical data, most of the estimation techniques would not be possible. Histor-
ical data is used in analogous estimating, parametric estimating, deterministic estimat-
ing, learning curve and detailed estimating (Venkataraman and Pinto, 2008, p. 52). Thus,
it follows that not a single one of the estimation bundles would be complete without the
reliance on historical data. The importance of historical data to the cost estimation pro-
cess was brought up as one of the elements of commonality in various cost estimation
processes employed across different industries (see Figure 16). The quality and reliabil-
ity of the data must be ensured in order for the historical data to be a prerequisite for
excellence. Historical data is a key component for the basis of estimate, which is an
integral step of the cost estimation process. In project business, especially, the internal
cost estimate information is crucial, since the offerings that the project-based firms pro-
vide to their customers are never unique and are most often tailored to a specific case
and customer.
Rush and Roy (2000) discuss an approach to project comparison technique solely based
on historical data – case-based reasoning (CBR). This technique is based on forming a
case and comparing and adapting the solution in accordance with observed historical
trends. The previous cases and the information obtained and processed from the previ-
ous cases serve as a knowledge database, according to which the new solution is de-
veloped. Moreover, the information stored in the knowledge database is being continu-
ously verified through application to the new cases. The researchers call this utilization
of historical data as a learning process. CBR is an approach that is related to a projection
technique widely applied in industry, called the learning curve (Stewart and Wyskida,
1987; Venkataraman and Pinto, 2008; Mislick and Nussbaum, 2015).
There are two schools of learning curve theories - a cumulative average theory and a
unit theory. A cumulative average learning curve was developed by Wright (1936) and
the incremental (unit) learning curve was developed by Crawford in 1947 (Stewart and
Wyskida, 1987; Mislick and Nussbaum, 2015). Both theories are based on the assump-
tion that the organization learns from the tasks performed and the more times a task was
performed in the past, the less time it will require in the future. The repeatedly incurred
costs in the organizational context are recurring costs, thus it can be concluded that the
learning curve concerns only the processes which incur recurring costs. Unfortunately,
learning curves are applicable only to direct labor (DOE, 2011).
For a project-based firm, the manufacturing learning curve may not be as instrumental,
based on the degree of outsourcing. However, the idea of experiential learning and
standardization may be useful in terms of evaluating the uncertainty involved in project
planning. Lowe and Skitmore (1994) investigate the effect of experience and learning on
56
the quality and effectiveness of task completion when it comes to cost estimation. The
researchers found that if the individual is reflecting on their experiences and are able to
convey their experience and identify development needs, the accuracy of their estimation
work is higher. Thus, it is imperative for the cost estimator to follow through the whole
process of cost estimation, including the estimation review and lessons learned from
estimating.
Portfolio standardization and repetition of the tasks serves also as a mechanism for de-
creasing uncertainty, caused by the novelty or custom-made nature of the offering (Lo-
renz et al., 2019). Ulonska and Welo (2014) address the same issue from a different
perspective, stating that the organizations, whose operations are based on custom-made
solutions must be able to increase their learning capabilities. In other words, it is imper-
ative for the organization to be able to convert the acquired tacit knowledge into explicit
form, which required a systematic approach to collecting, processing and archiving data.
Clear and systematic organization of product portfolio and project deliveries enables a
clear overview of variances and unifies all the experience and tacit knowledge into one
holistic database (Ulonska and Welo, 2014). It follows, that the learning curve phenom-
enon cannot be completely discarded when it comes to indirect work, although the ap-
plication of the learning curve is not as literal as outlined by Wright or Crawford. The
systemization of acquired knowledge is a pathway to deal with the uncertainties in a
project-based business, where the projects and the offerings are unique.
5.4 Review of existing estimation accuracy boundaries
The accuracy of the cost estimate was found to positively correlate with the stage of
project planning, seemingly due to more accurate scope specification and more exten-
sive data availability. Furthermore, the project organization should define the purpose of
the estimate and the resources that can be allocated for the process of cost estimation.
Considering that such a small share of “suspects” is converted to customers (Figure 20),
the firms cannot afford to produce a detailed customer solution design and detailed esti-
mate. AbouRizk et al. (2002) conducted a case study of the estimation accuracy bound-
aries at different stages of project planning in construction projects. The result of their
study is shown in Figure 26.
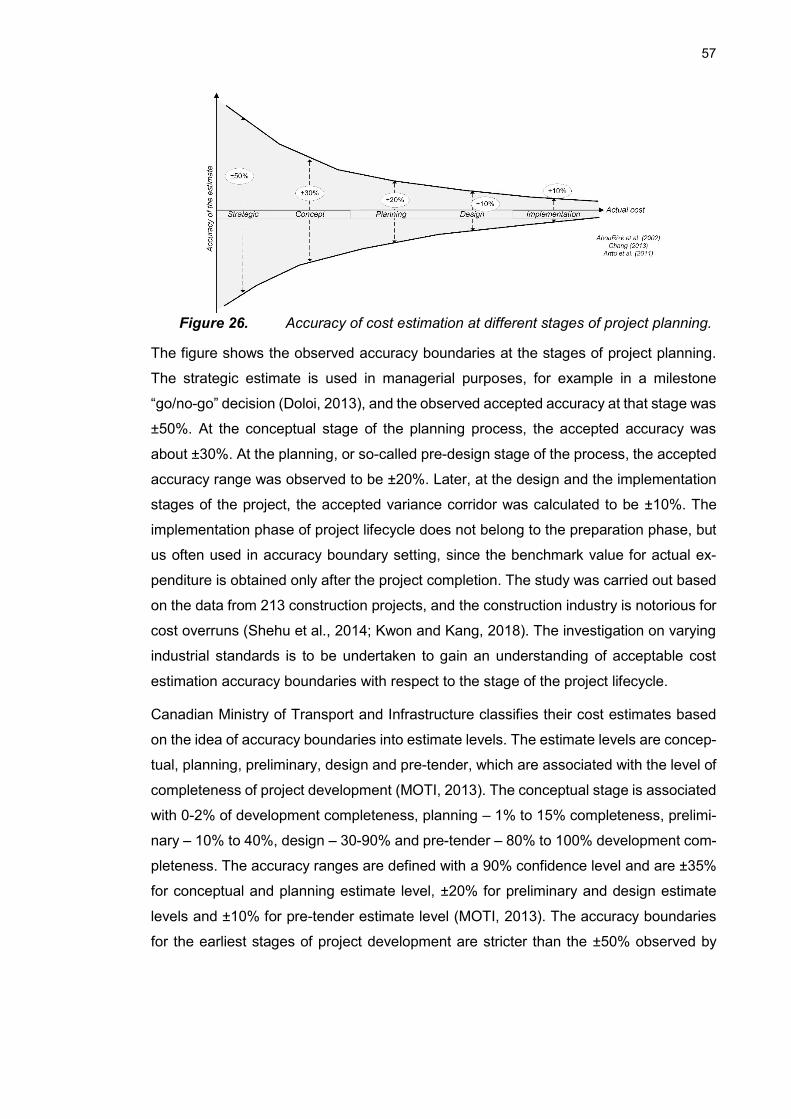
57
Figure 26. Accuracy of cost estimation at different stages of project planning.
The figure shows the observed accuracy boundaries at the stages of project planning.
The strategic estimate is used in managerial purposes, for example in a milestone
“go/no-go” decision (Doloi, 2013), and the observed accepted accuracy at that stage was
±50%. At the conceptual stage of the planning process, the accepted accuracy was
about ±30%. At the planning, or so-called pre-design stage of the process, the accepted
accuracy range was observed to be ±20%. Later, at the design and the implementation
stages of the project, the accepted variance corridor was calculated to be ±10%. The
implementation phase of project lifecycle does not belong to the preparation phase, but
us often used in accuracy boundary setting, since the benchmark value for actual ex-
penditure is obtained only after the project completion. The study was carried out based
on the data from 213 construction projects, and the construction industry is notorious for
cost overruns (Shehu et al., 2014; Kwon and Kang, 2018). The investigation on varying
industrial standards is to be undertaken to gain an understanding of acceptable cost
estimation accuracy boundaries with respect to the stage of the project lifecycle.
Canadian Ministry of Transport and Infrastructure classifies their cost estimates based
on the idea of accuracy boundaries into estimate levels. The estimate levels are concep-
tual, planning, preliminary, design and pre-tender, which are associated with the level of
completeness of project development (MOTI, 2013). The conceptual stage is associated
with 0-2% of development completeness, planning – 1% to 15% completeness, prelimi-
nary – 10% to 40%, design – 30-90% and pre-tender – 80% to 100% development com-
pleteness. The accuracy ranges are defined with a 90% confidence level and are ±35%
for conceptual and planning estimate level, ±20% for preliminary and design estimate
levels and ±10% for pre-tender estimate level (MOTI, 2013). The accuracy boundaries
for the earliest stages of project development are stricter than the ±50% observed by
58
AbouRizk et al. (2002). The two reasons for a narrower accuracy range may be the in-
dustrial differences as well as the evolution and computerization of cost estimation prac-
tices.
Taylor (2007, p.108) published the accuracy boundaries for the project data analyzed by
the Project Management Institute. The three estimate categories that the author defined
are a rough estimate, budgetary proposal, and definitive estimate. The accuracy ranges
for the three classes respectively are -25% to +75%, -15% to +25% and -5% to +10%.
The same ranges are collaborated by Kerzner and Kerzner (2013, p.681), whose guide-
lines are also based on the PMI’s data. However, Kerzner and Kerzner (2013) addition-
ally emphasize that the acceptable accuracy boundaries depend on the organization and
the industry they operate in and are to be determined case-by-case. Humphreys (2005,
p.59) carried out a review of standardized cost estimate classifications and accuracy
boundaries. The author describes that the American National Standards Institute in 1991
defined three classes of estimates – order-of-magnitude, budget estimate, and definitive
estimate. The respective accuracy boundaries of the classes are -30% to +50%, -15%
to +30% and -5% to +15%.
Washington State Department of Transport employs a different set of guidelines for their
estimation accuracy ranges. WSDOT (2015) defines five different estimate levels corre-
sponding to the stage of the design completion. Planning includes stages of completion
from 0-2% and 1-15%, scoping is a stage at 10-30% of development, design stage cor-
responds to 30-100% design completion and PS&E (plans, specs, estimate) is the last
stage of project development with 90%-100% degree of completion. The five accuracy
ranges that correspond to each stage of the project design development are:
• Planning (0-2%): -50% to +200%,
• Planning (1-15%): -40% to +100%,
• Scoping (10-30%): -30% to +50%,
• Design (30-90%): -10% to +25%,
• PS&E (90-100%): -5% to +10% (WSDOT, 2015, p.4-14).
As can be noticed, the ranges defined by WSDOT are not symmetrical, indicating that
the projects are more prone to cost overruns. Additionally, the magnitude of the range of
accuracy is substantial, compared to that defined by MOTI (2013) and AbouRizk et al.
(2002). The reason behind the larger spread is the length of forecasting. Compared to
the investigated construction projects that lasted around 3 years (AbouRizk et al., 2002),
the forecast at the planning level of estimate carried out by WSDOT is 20- and 10-year
plans respectively. It follows, that the accuracy of the estimate is dependant on the length
of the project.
59
Queensland Government (2017) sets yet again a different standard for the accuracy of
their cost estimation for transport and main roads related projects. The four levels of cost
estimate accuracy boundaries are defined at the four stages of project development:
concept, early design, design, and implementation. The concept phase has an estima-
tion accuracy boundary of -15 to +20%; the early design stage is expected to range in
accuracy from -10% to +15%. The design stage has boundaries from -5% to +10%, and
at the implementation phase, the range of estimates is set at -2.5% to +5% (Queensland
Government, 2017, p.5). The intervals set by Queensland Government are also asym-
metric, expecting more cost overruns rather than cost savings.
Department of Energy (DOE, 2011) presents another classification employed in the cost
estimate classification and accuracy range boundary setting. DOE defines five classes
of estimates corresponding to the degree of the project definition. Each of the classes is
assigned with a low and high range of expected accuracy, which is defined at a 50%
confidence level. The accuracy levels are set as follows (DOE, 2011, p.15):
• Class 5 (0-2%): Low range -20 to -50%; High range +30 to +100%,
• Class 4 (1-15%): Low range -15 to -30%; High range +20 to +50%,
• Class 3 (10-40%): Low range -10 to -20%; High range +10 to +30%,
• Class 2 (30-70%): Low range -5 to -15%; High range +5 to +20%,
• Class 1 (70-100%): Low range -3 to -10%; High range +3 to +15%.
This performance standard is generalized, thus is includes the high and low ranges of
estimation accuracy, instead of a single accuracy range. The guidelines are provided for
energy and construction projects, although, it is mentioned that the guidelines are of a
recommendatory character rather than mandatory. The ranges of estimation accuracy
were developed in 1997 by AACE International as an elaboration of the previous stand-
ard proposed by ANSI in 1991. AACE International is the Association for the Advance-
ment of Cost Engineering and has issued a series of recommended practices for cost
estimation (AACE International, 2016). The summary of all the reviewed accuracy
boundaries is presented in Appendix B.
Overall, the asymmetric range of estimation accuracy boundaries suggests that in gen-
eral, the projects tend to face uncertainties leading to cost overruns rather than cost
savings. Love et al. (2013) state that normal distribution is not applicable to model the
cost overruns since normal distribution assumes that the values are symmetrically situ-
ated around the mean. Cost overruns are somewhat random and in order to model cost
overruns, probability density functions are often used (Love et al., 2013). The probability
density function is a basis of the Monte Carlo method, which is used in cost estimation.
The deduced tendency of cost overruns being more likely than cost underruns, GAO
60
(2009, p.38) collaborates that the cost estimate tends to increase throughout the project’s
lifecycle. It is noteworthy that Taylor (2007) defines an acceptable variance corridor of
±10% deviation from the baseline. Taylor (2007) claims that if the cost variances through-
out the project exceed 10%, it typically cannot be recovered to attain the variance at
completion of less than 10%.
The accuracy boundaries are required for setting contingencies. Contingency and man-
agement reserve are used to alleviate the negative effect of anticipated project variance.
Venkataraman and Pinto (2008, p.97) express contingency as “a cushion against time
and money variances”, although, the researchers also mention that the customers often
see contingency as additional expenditure rather and may get an impression that the
seller organization is incapable of carrying out a high-quality estimation nor producing a
detailed design on time. Hence, it becomes of utmost importance for the seller organi-
zation to make sure that the contingency percentage is established correctly and corre-
spondingly to the degree of uncertainty associated with a particular stage in a project’s
lifecycle.
5.5 Method for reducing variance through improved cost esti-
mation processes
Peter Drucker in his work “The Effective Executive” (1967), describes the difference be-
tween effectiveness and efficiency in a memorable manner – “effectiveness is getting the
right things done, while efficiency is getting the things done right”. The definition of effec-
tiveness and efficiency resonate with the definitions of lean and six sigma philosophies.
Lean was developed as a quality control technique in Japan at the time of economic
recession, which concentrated on eliminating production ‘waste’ or the 3Ms (Nicoletti,
2012, pp. 1-21). The 3Ms are muda, muri, mura, which from Japanese mean waste,
unreasonable and illogical, and variation and poor management. Lean by itself is not a
holistic process quality control method. The most evolved quality control method is lean
six sigma, which integrates the essential ideas from both philosophies. Six Sigma phi-
losophy concentrates on identifying the activities that lead to defects and variation and
the root causes for these variations, subsequently adjusting and improving the process
(Bradley, 2015, pp. 25-33).
The synthesized lean six sigma philosophy is a method for continuous process improve-
ment in an organization by correcting flawed processes as well as making sure that the
processes are carried out with the optimal lead times. One of the mechanisms to ensure
that the “right things and being done right” within a project organization are to implement
61
a systematic and standardized set of procedures. The systematic approach entails that
the actions are carried out methodologically, i.e. based on pre-defined logic and logical
correlations, which makes the attained knowledge organized and contributes to the over-
all increase in knowledge (Saunders et al., 2009, p.5).
Knowledge and information management are the starting point of managing uncertainty,
as uncertainty is associated with the lack of information (Munier, 2014, p.2). Nonaka
(1991) emphasizes the importance of knowledge in the modern economy, where “the
only certainty is uncertainty” and knowledge is a source enabling organizations to sustain
competitive advantage. Nonaka (1991) discusses the concept of knowledge spiral, which
is based on the idea of organizational learning resulting from intersection and conversion
of tacit knowledge to explicit knowledge and vice-versa. Ulonska and Welo (2014) em-
phasize that systematically converting tacit knowledge into explicit knowledge is benefi-
cial for the efficiency of the organization, namely accessing the information and reducing
uncertainty.
Grant (1996) discusses the foundation of knowledge management (KM) and some of the
core principles are – transferability, the capacity of aggregation and knowledge acquisi-
tion. Transferability refers to the ability to codify tacit knowledge to the form of explicit
knowledge, so that other individuals will be able to apply that knowledge. Knowledge
aggregation potential refers to the compatibility of different forms of knowledge through
expressing that knowledge in a similar form. Although, there is a type of knowledge,
called idiosyncratic, which cannot be easily aggregated, due to its circumstantial and
highly specific nature (Grant, 1996). Knowledge acquisition is based on the idea that
human has a limit to storing and processing knowledge, hence, requiring various experts
to take care of the necessary areas of competencies within the organization. It follows,
that on the organizational scale, it is important to ensure that there is a systematic ap-
proach of data gathering, reporting and archiving. This, added to the research of Nonaka
(1991) and Ulonska and Welo (2014), emphasizes a need for an information system
architecture within an organization. Systematic knowledge sharing via reporting and ar-
chiving leads to knowledge accessibility, which is a mechanism of uncertainty reduction.
Uncertainty is one of the characteristic challenges in cost estimation. The uncertainty
can be managed with systematic knowledge management and procedures, defining a
set of requirements and procedures for the cost estimation process can potentially alle-
viate the effect of uncertainty on the quality of the cost estimate. An inadequate and
inaccurate cost estimate leads to cost overruns in projects (Shane et al., 2009; Hicks,
1992, Venkataraman and Pinto, 2008; Jørgensen et al., 2012; Flyvbjerg et al., 2002).
Although cost variance can be controlled during project preparation and implementation
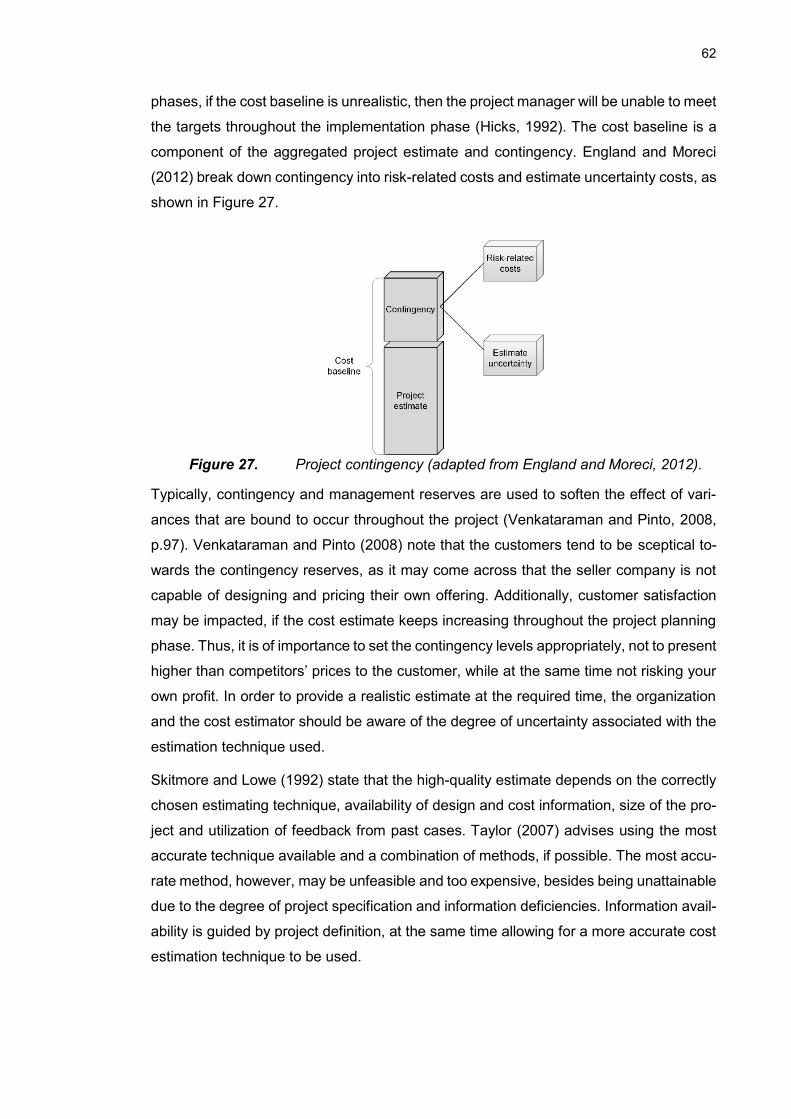
62
phases, if the cost baseline is unrealistic, then the project manager will be unable to meet
the targets throughout the implementation phase (Hicks, 1992). The cost baseline is a
component of the aggregated project estimate and contingency. England and Moreci
(2012) break down contingency into risk-related costs and estimate uncertainty costs, as
shown in Figure 27.
Figure 27. Project contingency (adapted from England and Moreci, 2012).
Typically, contingency and management reserves are used to soften the effect of vari-
ances that are bound to occur throughout the project (Venkataraman and Pinto, 2008,
p.97). Venkataraman and Pinto (2008) note that the customers tend to be sceptical to-
wards the contingency reserves, as it may come across that the seller company is not
capable of designing and pricing their own offering. Additionally, customer satisfaction
may be impacted, if the cost estimate keeps increasing throughout the project planning
phase. Thus, it is of importance to set the contingency levels appropriately, not to present
higher than competitors’ prices to the customer, while at the same time not risking your
own profit. In order to provide a realistic estimate at the required time, the organization
and the cost estimator should be aware of the degree of uncertainty associated with the
estimation technique used.
Skitmore and Lowe (1992) state that the high-quality estimate depends on the correctly
chosen estimating technique, availability of design and cost information, size of the pro-
ject and utilization of feedback from past cases. Taylor (2007) advises using the most
accurate technique available and a combination of methods, if possible. The most accu-
rate method, however, may be unfeasible and too expensive, besides being unattainable
due to the degree of project specification and information deficiencies. Information avail-
ability is guided by project definition, at the same time allowing for a more accurate cost
estimation technique to be used.
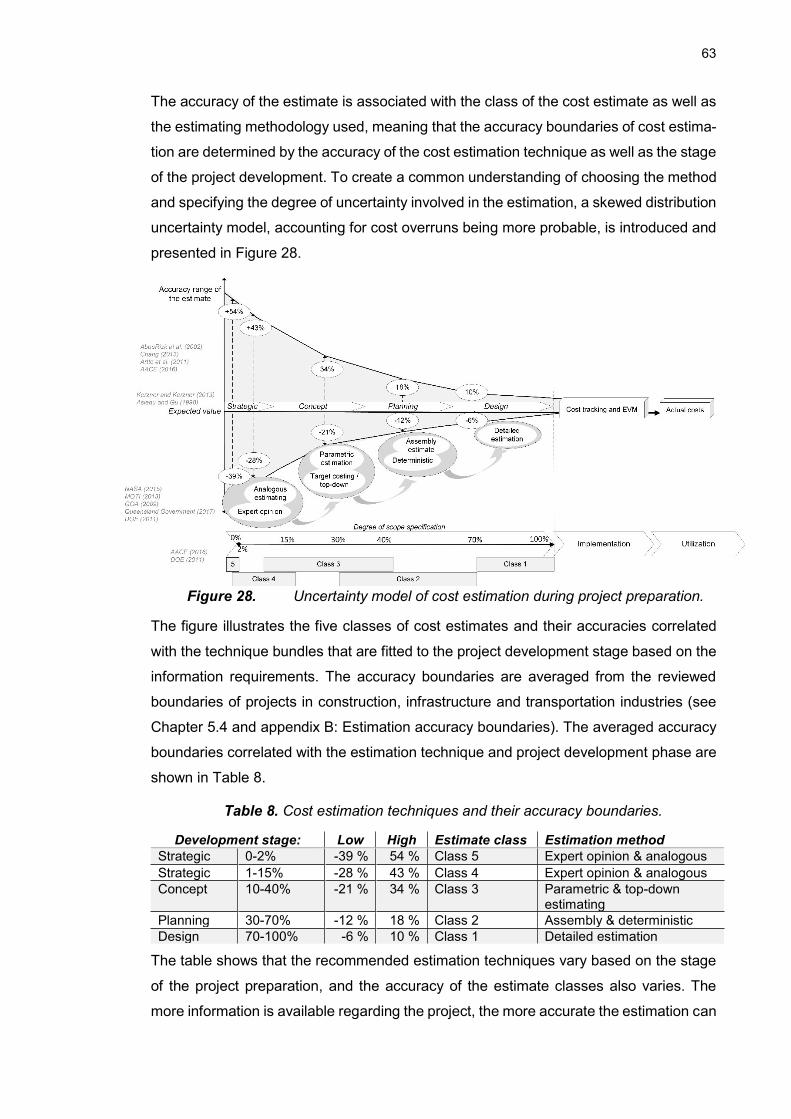
63
The accuracy of the estimate is associated with the class of the cost estimate as well as
the estimating methodology used, meaning that the accuracy boundaries of cost estima-
tion are determined by the accuracy of the cost estimation technique as well as the stage
of the project development. To create a common understanding of choosing the method
and specifying the degree of uncertainty involved in the estimation, a skewed distribution
uncertainty model, accounting for cost overruns being more probable, is introduced and
presented in Figure 28.
Figure 28. Uncertainty model of cost estimation during project preparation.
The figure illustrates the five classes of cost estimates and their accuracies correlated
with the technique bundles that are fitted to the project development stage based on the
information requirements. The accuracy boundaries are averaged from the reviewed
boundaries of projects in construction, infrastructure and transportation industries (see
Chapter 5.4 and appendix B: Estimation accuracy boundaries). The averaged accuracy
boundaries correlated with the estimation technique and project development phase are
shown in Table 8.
Table 8. Cost estimation techniques and their accuracy boundaries.
Development stage: Low High Estimate class Estimation method
Strategic 0-2% -39 % 54 % Class 5 Expert opinion & analogous
Strategic 1-15% -28 % 43 % Class 4 Expert opinion & analogous
Concept 10-40% -21 % 34 % Class 3 Parametric & top-down estimating
Planning 30-70% -12 % 18 % Class 2 Assembly & deterministic
Design 70-100% -6 % 10 % Class 1 Detailed estimation
The table shows that the recommended estimation techniques vary based on the stage
of the project preparation, and the accuracy of the estimate classes also varies. The
more information is available regarding the project, the more accurate the estimation can
64
be. The accuracy boundaries that are presented in the table are averaged across the
reviewed existing accuracy boundaries. However, Kerzner and Kerzner (2013) specify
that for each industry, the boundaries differ based on the business- and operations-re-
lated specifics.
Choosing the correct method of cost estimation is only a part of managing uncertainty
involved in the process. As was discussed in Chapter 3.3, cost overruns are the mani-
festation of risk, which in turn, is a successor of uncertainties. The scope of this work is
to evaluate the controllable factors internal to an organization involved in the process of
cost estimation, excluding uncontrollable and external influences. For this purpose, a
separate category of risks was defined as internal foreseen risks. Inadequate resource
planning and unrealistic schedule are both precursors of inadequate project baselines,
leading to cost overruns. Lack of information is a characteristic problem to cost estima-
tion. Project prioritization and conflict of resources are the risks to be mitigated at the
organizational level by coordinating the projects and departments and ensuring ade-
quate resource planning and availability. Lack of systematic procedures is an element
facilitating business operations through knowledge management, which ideally should
be homogenous on the organizational level, and without a doubt, homogenous on the
department level.
It was earlier suggested that contingency constitutes of risk-related costs and estimate
uncertainty. To avoid the interference of the two types of contingencies, the cost esti-
mates should be based on the available information and not padded (Taylor, 2007). Such
interference can cause double-counting the risks, which is a commonly occurring mal-
practice in risk management. Risk double-counting is a result of poor understanding of
complexity and interactions between the elements in the risk analysis (Roger and Petch,
1999, p.6). Separate risk evaluation and documentation for risk-related costs and cost
uncertainties is a useful tool to consider. When thinking about aggregating a cost data-
base, it would be beneficial to know the historic trends of cost overruns and whether they
were caused by insufficient contingency reserves to account for the risk factors or cost
uncertainties. Having a historical database for the cost uncertainty ranges is instrumental
in setting the estimation accuracy boundaries.
The internal foreseen risks, unlike the external, pure, technical and other typically iden-
tified risks (see Table 3) should not be mitigated via assigning contingency reserves in
order to prevent the danger of double-counting. The internal foreseen risks identified in
this work can be managed by implementing a systematic estimating procedure, which
decreases, if not eliminates, this type of risk from the organization’s operations. It is pos-
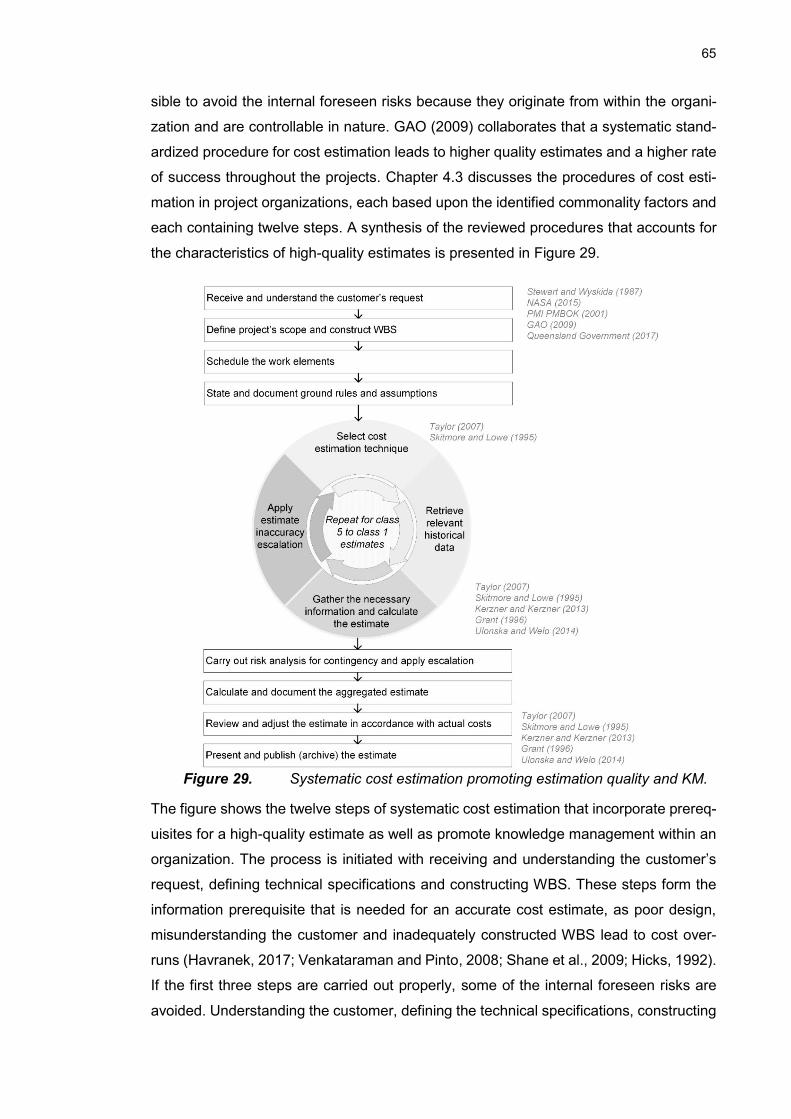
65
sible to avoid the internal foreseen risks because they originate from within the organi-
zation and are controllable in nature. GAO (2009) collaborates that a systematic stand-
ardized procedure for cost estimation leads to higher quality estimates and a higher rate
of success throughout the projects. Chapter 4.3 discusses the procedures of cost esti-
mation in project organizations, each based upon the identified commonality factors and
each containing twelve steps. A synthesis of the reviewed procedures that accounts for
the characteristics of high-quality estimates is presented in Figure 29.
Figure 29. Systematic cost estimation promoting estimation quality and KM.
The figure shows the twelve steps of systematic cost estimation that incorporate prereq-
uisites for a high-quality estimate as well as promote knowledge management within an
organization. The process is initiated with receiving and understanding the customer’s
request, defining technical specifications and constructing WBS. These steps form the
information prerequisite that is needed for an accurate cost estimate, as poor design,
misunderstanding the customer and inadequately constructed WBS lead to cost over-
runs (Havranek, 2017; Venkataraman and Pinto, 2008; Shane et al., 2009; Hicks, 1992).
If the first three steps are carried out properly, some of the internal foreseen risks are
avoided. Understanding the customer, defining the technical specifications, constructing
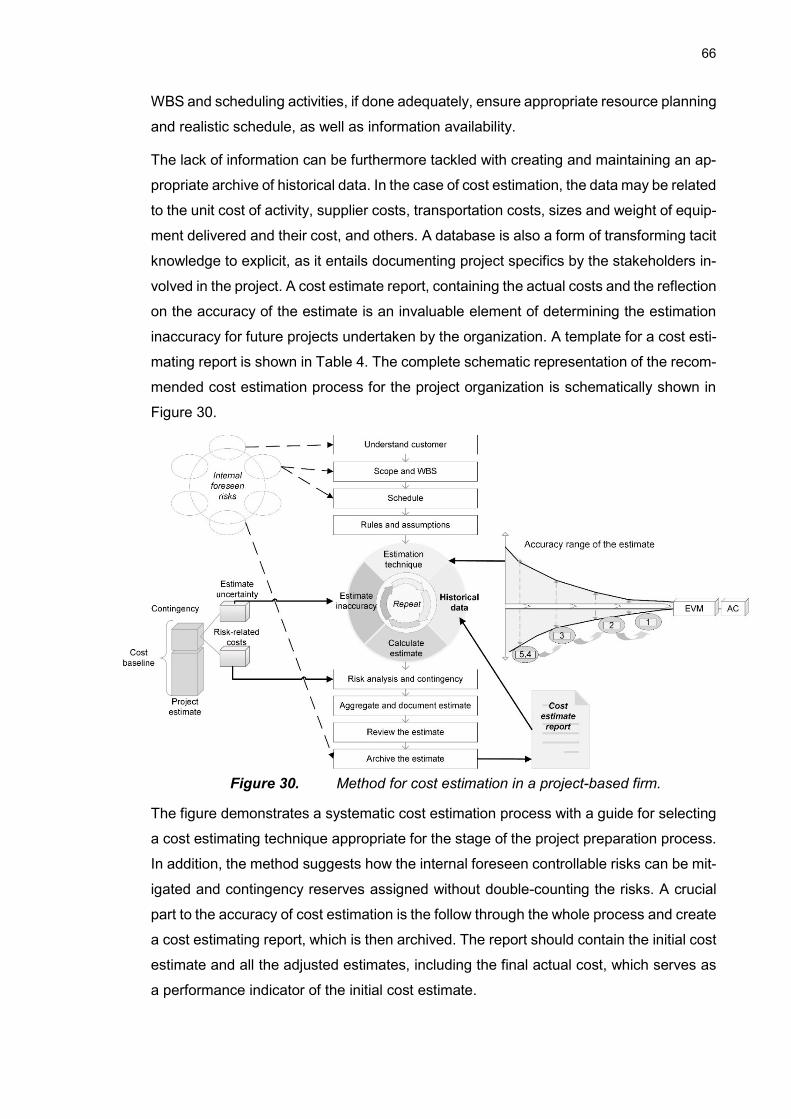
66
WBS and scheduling activities, if done adequately, ensure appropriate resource planning
and realistic schedule, as well as information availability.
The lack of information can be furthermore tackled with creating and maintaining an ap-
propriate archive of historical data. In the case of cost estimation, the data may be related
to the unit cost of activity, supplier costs, transportation costs, sizes and weight of equip-
ment delivered and their cost, and others. A database is also a form of transforming tacit
knowledge to explicit, as it entails documenting project specifics by the stakeholders in-
volved in the project. A cost estimate report, containing the actual costs and the reflection
on the accuracy of the estimate is an invaluable element of determining the estimation
inaccuracy for future projects undertaken by the organization. A template for a cost esti-
mating report is shown in Table 4. The complete schematic representation of the recom-
mended cost estimation process for the project organization is schematically shown in
Figure 30.
Figure 30. Method for cost estimation in a project-based firm.
The figure demonstrates a systematic cost estimation process with a guide for selecting
a cost estimating technique appropriate for the stage of the project preparation process.
In addition, the method suggests how the internal foreseen controllable risks can be mit-
igated and contingency reserves assigned without double-counting the risks. A crucial
part to the accuracy of cost estimation is the follow through the whole process and create
a cost estimating report, which is then archived. The report should contain the initial cost
estimate and all the adjusted estimates, including the final actual cost, which serves as
a performance indicator of the initial cost estimate.
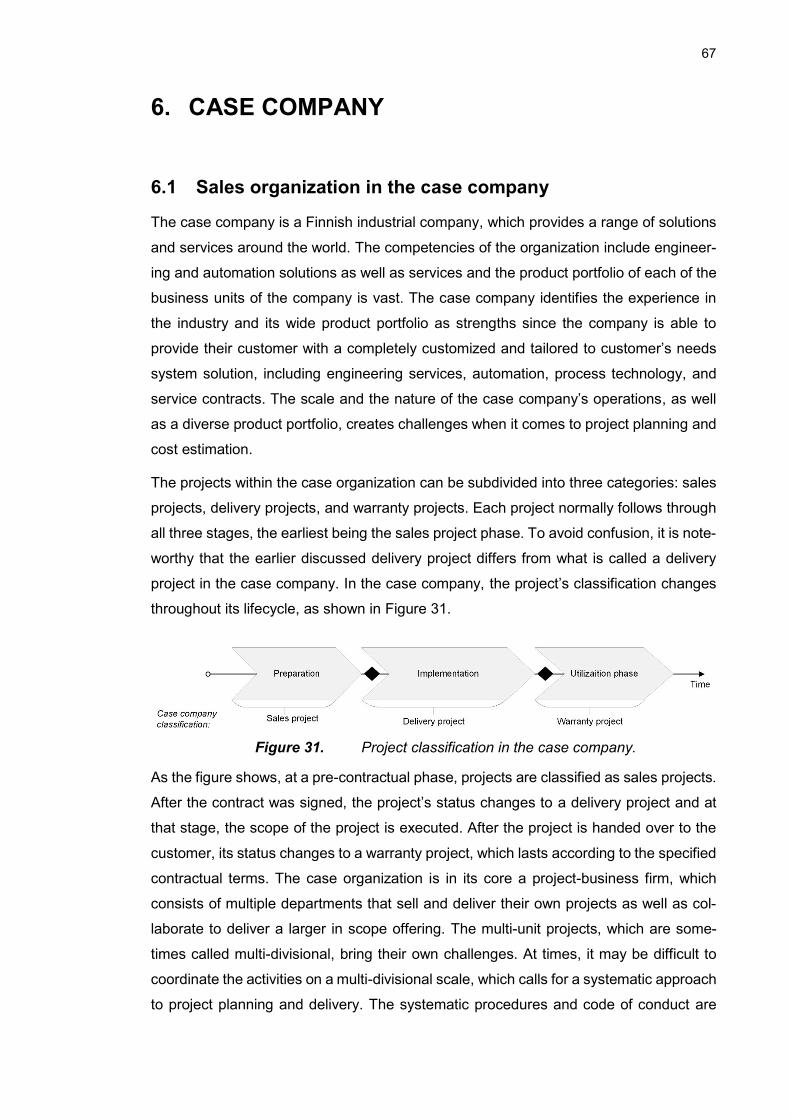
67
6. CASE COMPANY
6.1 Sales organization in the case company
The case company is a Finnish industrial company, which provides a range of solutions
and services around the world. The competencies of the organization include engineer-
ing and automation solutions as well as services and the product portfolio of each of the
business units of the company is vast. The case company identifies the experience in
the industry and its wide product portfolio as strengths since the company is able to
provide their customer with a completely customized and tailored to customer’s needs
system solution, including engineering services, automation, process technology, and
service contracts. The scale and the nature of the case company’s operations, as well
as a diverse product portfolio, creates challenges when it comes to project planning and
cost estimation.
The projects within the case organization can be subdivided into three categories: sales
projects, delivery projects, and warranty projects. Each project normally follows through
all three stages, the earliest being the sales project phase. To avoid confusion, it is note-
worthy that the earlier discussed delivery project differs from what is called a delivery
project in the case company. In the case company, the project’s classification changes
throughout its lifecycle, as shown in Figure 31.
Figure 31. Project classification in the case company.
As the figure shows, at a pre-contractual phase, projects are classified as sales projects.
After the contract was signed, the project’s status changes to a delivery project and at
that stage, the scope of the project is executed. After the project is handed over to the
customer, its status changes to a warranty project, which lasts according to the specified
contractual terms. The case organization is in its core a project-business firm, which
consists of multiple departments that sell and deliver their own projects as well as col-
laborate to deliver a larger in scope offering. The multi-unit projects, which are some-
times called multi-divisional, bring their own challenges. At times, it may be difficult to
coordinate the activities on a multi-divisional scale, which calls for a systematic approach
to project planning and delivery. The systematic procedures and code of conduct are
68
instrumental also for the situations when the departments deliver projects independently.
The process standardization is an approach of ensuring that the departments’ activities
are aligned with the organizational strategy and follow the code of conduct.
To unify and standardize the sales processes between the departments and enable more
effective collaboration, especially during the multi-divisional projects, a universal set of
sales procedures is established within the company. Sales organization in the case com-
pany is organized correspondingly to the idea of the sales funnel in B2B marketing (see
Figure 23). The details of the sales processes within the organization may differ based
on the department and the delivery scope of a business unit, but the backbone of the
process follows the same principles and the same targets. The general targets of the
sales process are to increase the sales volumes and margins, develop a common sales
methodology with a customer-centric approach, harmonized selling process between the
departments and overall to establish an effective sales organization according to the
company’s guidelines and principles.
Besides the sales funnel, the company’s sales approach is trying to mirror the customer’s
buying process. The customer’s buying process consists of three stages – solution de-
velopment, evaluation, and commitment. It is recognized that sometimes the sales efforts
begin only at the evaluation stage of the customer buying process, bypassing the oppor-
tunity identification and validation stages alongside one of the gates in the process. If
some of the stages of the sales process are skipped, there is a danger of not laying down
all the necessary groundwork for the successful project implementation. The company’s
sales formula relies on the fact the progress and data aggregation throughout the prep-
aration stage of the project’s lifecycle is cumulative, implying that the milestones through-
out the set the information requirements for the process. Furthermore, the milestones
provide process systematization, ensuring that the required activities were carried out
and the required information was gathered. Such an approach to activity management
with activity phases and intermediate milestones is called the stage-gate process.
The sales process formula is comprised of five general phases: (1) opportunity screen-
ing, (2) indicative proposal, (3) budget proposal, (4) firm proposal and (5) negotiations.
The sales process of the case company is schematically represented in Figure 32.
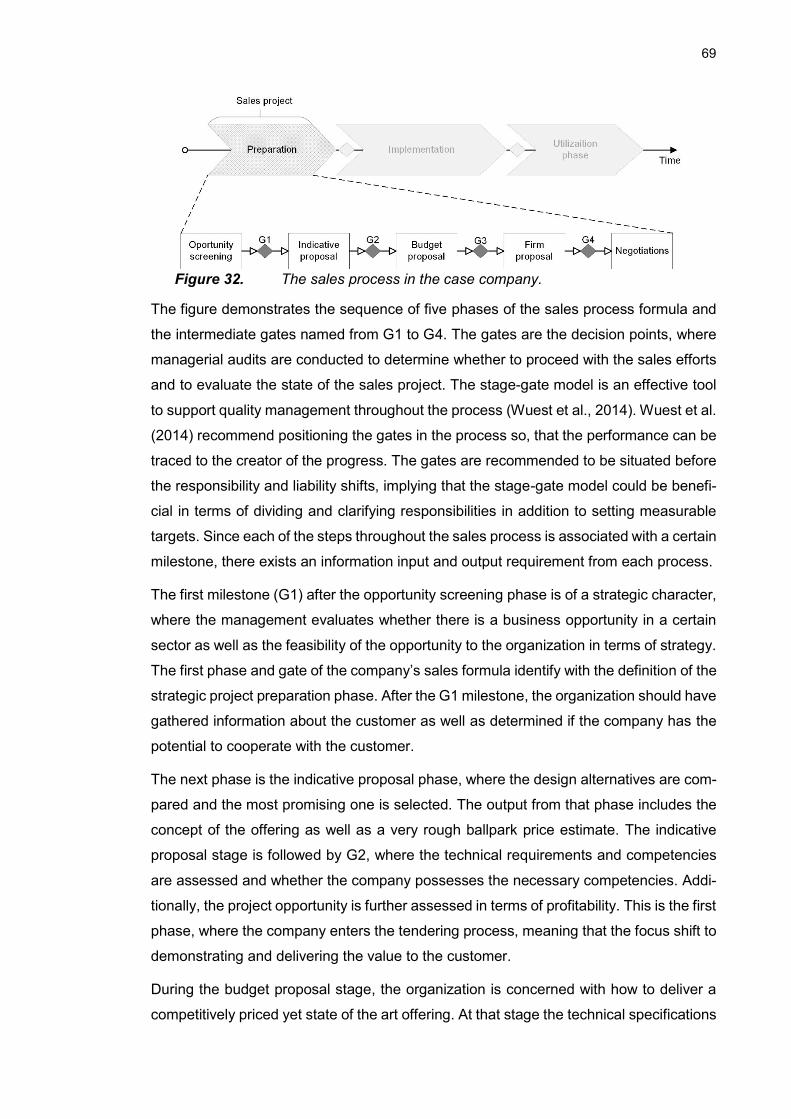
69
Figure 32. The sales process in the case company.
The figure demonstrates the sequence of five phases of the sales process formula and
the intermediate gates named from G1 to G4. The gates are the decision points, where
managerial audits are conducted to determine whether to proceed with the sales efforts
and to evaluate the state of the sales project. The stage-gate model is an effective tool
to support quality management throughout the process (Wuest et al., 2014). Wuest et al.
(2014) recommend positioning the gates in the process so, that the performance can be
traced to the creator of the progress. The gates are recommended to be situated before
the responsibility and liability shifts, implying that the stage-gate model could be benefi-
cial in terms of dividing and clarifying responsibilities in addition to setting measurable
targets. Since each of the steps throughout the sales process is associated with a certain
milestone, there exists an information input and output requirement from each process.
The first milestone (G1) after the opportunity screening phase is of a strategic character,
where the management evaluates whether there is a business opportunity in a certain
sector as well as the feasibility of the opportunity to the organization in terms of strategy.
The first phase and gate of the company’s sales formula identify with the definition of the
strategic project preparation phase. After the G1 milestone, the organization should have
gathered information about the customer as well as determined if the company has the
potential to cooperate with the customer.
The next phase is the indicative proposal phase, where the design alternatives are com-
pared and the most promising one is selected. The output from that phase includes the
concept of the offering as well as a very rough ballpark price estimate. The indicative
proposal stage is followed by G2, where the technical requirements and competencies
are assessed and whether the company possesses the necessary competencies. Addi-
tionally, the project opportunity is further assessed in terms of profitability. This is the first
phase, where the company enters the tendering process, meaning that the focus shift to
demonstrating and delivering the value to the customer.
During the budget proposal stage, the organization is concerned with how to deliver a
competitively priced yet state of the art offering. At that stage the technical specifications
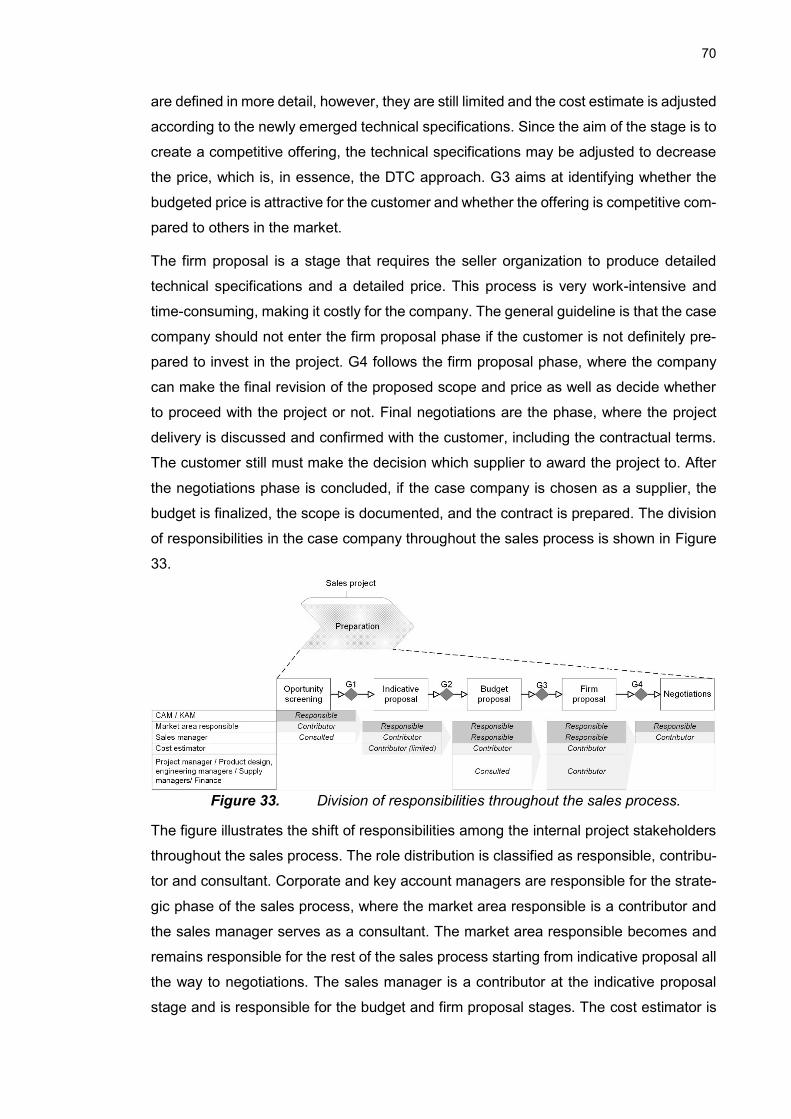
70
are defined in more detail, however, they are still limited and the cost estimate is adjusted
according to the newly emerged technical specifications. Since the aim of the stage is to
create a competitive offering, the technical specifications may be adjusted to decrease
the price, which is, in essence, the DTC approach. G3 aims at identifying whether the
budgeted price is attractive for the customer and whether the offering is competitive com-
pared to others in the market.
The firm proposal is a stage that requires the seller organization to produce detailed
technical specifications and a detailed price. This process is very work-intensive and
time-consuming, making it costly for the company. The general guideline is that the case
company should not enter the firm proposal phase if the customer is not definitely pre-
pared to invest in the project. G4 follows the firm proposal phase, where the company
can make the final revision of the proposed scope and price as well as decide whether
to proceed with the project or not. Final negotiations are the phase, where the project
delivery is discussed and confirmed with the customer, including the contractual terms.
The customer still must make the decision which supplier to award the project to. After
the negotiations phase is concluded, if the case company is chosen as a supplier, the
budget is finalized, the scope is documented, and the contract is prepared. The division
of responsibilities in the case company throughout the sales process is shown in Figure
33.
Figure 33. Division of responsibilities throughout the sales process.
The figure illustrates the shift of responsibilities among the internal project stakeholders
throughout the sales process. The role distribution is classified as responsible, contribu-
tor and consultant. Corporate and key account managers are responsible for the strate-
gic phase of the sales process, where the market area responsible is a contributor and
the sales manager serves as a consultant. The market area responsible becomes and
remains responsible for the rest of the sales process starting from indicative proposal all
the way to negotiations. The sales manager is a contributor at the indicative proposal
stage and is responsible for the budget and firm proposal stages. The cost estimator is
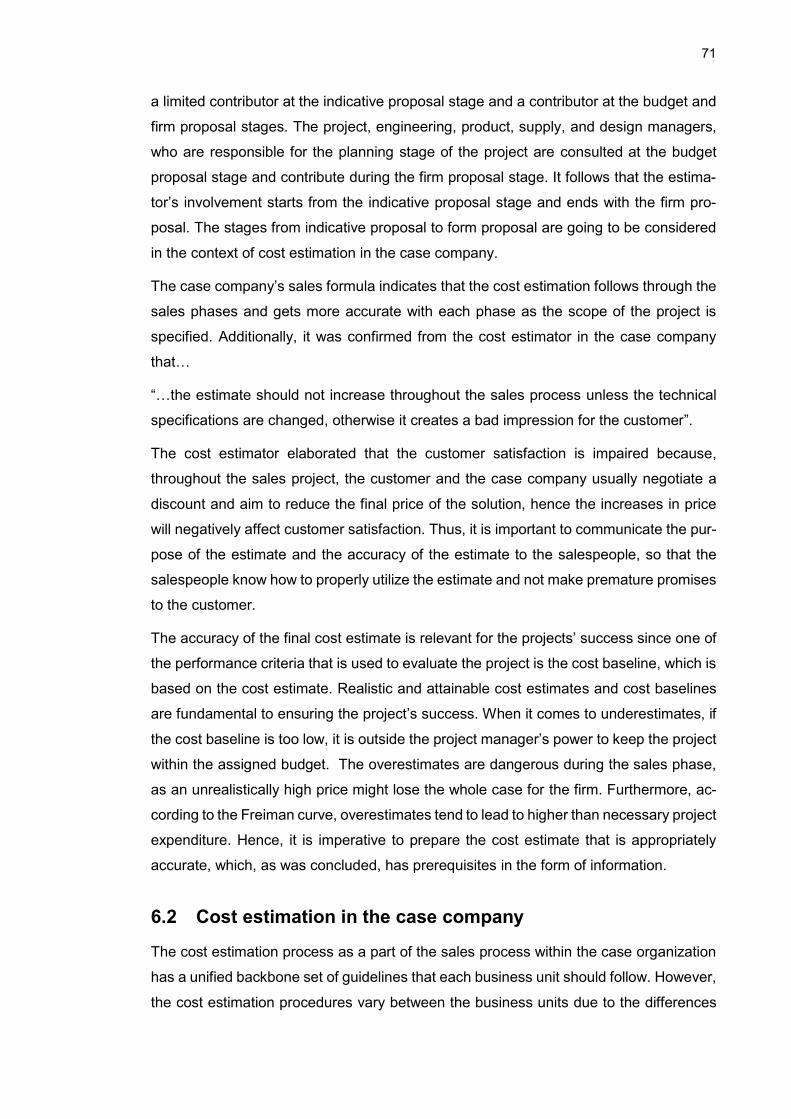
71
a limited contributor at the indicative proposal stage and a contributor at the budget and
firm proposal stages. The project, engineering, product, supply, and design managers,
who are responsible for the planning stage of the project are consulted at the budget
proposal stage and contribute during the firm proposal stage. It follows that the estima-
tor’s involvement starts from the indicative proposal stage and ends with the firm pro-
posal. The stages from indicative proposal to form proposal are going to be considered
in the context of cost estimation in the case company.
The case company’s sales formula indicates that the cost estimation follows through the
sales phases and gets more accurate with each phase as the scope of the project is
specified. Additionally, it was confirmed from the cost estimator in the case company
that…
“…the estimate should not increase throughout the sales process unless the technical
specifications are changed, otherwise it creates a bad impression for the customer”.
The cost estimator elaborated that the customer satisfaction is impaired because,
throughout the sales project, the customer and the case company usually negotiate a
discount and aim to reduce the final price of the solution, hence the increases in price
will negatively affect customer satisfaction. Thus, it is important to communicate the pur-
pose of the estimate and the accuracy of the estimate to the salespeople, so that the
salespeople know how to properly utilize the estimate and not make premature promises
to the customer.
The accuracy of the final cost estimate is relevant for the projects’ success since one of
the performance criteria that is used to evaluate the project is the cost baseline, which is
based on the cost estimate. Realistic and attainable cost estimates and cost baselines
are fundamental to ensuring the project’s success. When it comes to underestimates, if
the cost baseline is too low, it is outside the project manager’s power to keep the project
within the assigned budget. The overestimates are dangerous during the sales phase,
as an unrealistically high price might lose the whole case for the firm. Furthermore, ac-
cording to the Freiman curve, overestimates tend to lead to higher than necessary project
expenditure. Hence, it is imperative to prepare the cost estimate that is appropriately
accurate, which, as was concluded, has prerequisites in the form of information.
6.2 Cost estimation in the case company
The cost estimation process as a part of the sales process within the case organization
has a unified backbone set of guidelines that each business unit should follow. However,
the cost estimation procedures vary between the business units due to the differences
72
in pricing product offerings compared to service offerings and systems offerings. The
differences occur based on the cost-incurring processes and unit costs that are offering-
specific. For example, in some cases, the work is partially outsourced and partially com-
pleted in-house, in some cases all the work is outsourced. For some projects, only the
labor costs are estimated and for some projects, estimating labor and material costs is
necessary. The department where the researcher is involved carries out cost estimation
of own and contractor’s work and well as purchased materials and miscellaneous items.
The scope of cost estimation of the case company is illustrated in Figure 34.
Figure 34. Cost components in the case company.
The cost component classification shown in the figure includes the categories of cost
incurring objects in a typical project carried out by the case company. Different cost com-
ponents require different sources of information for successful cost estimation. The costs
of purchased engineering and materials are computed from the contractors’ quotations
based on the technical specification provided by the company. For the less accurate cost
estimating, the previous contractor price lists and quotations can be used to estimate the
cost of work and materials for a similar project. The price of work and materials can be
estimated using reference market price levels and the unit costs from previous similar
projects. To sum up, the core information sources for cost estimation include engineering
and planning documentation, reference cases, historical data, market prices, and expert
opinion.
The unit cost data may constitute, for example, the price per kilogram of material (€/kg),
a diameter of pipes, the volume of parts and similar. The estimation is then carried out
by estimating the quantity of materials and work required in the project and multiplying
with the prices according to the market price levels or the incurred costs of similar wok
in previous projects. This approach to cost estimation is called elemental parametric and
it is a commonly used method in the case company. The elemental parametric cost es-
timation can be as accurate as the available information allows, gradually turning into
the detailed estimation method (MOTI, 2013, pp.17-18). The reliability of the estimate
depends upon the accuracy of the information gathered from the previous projects as
well as the suitability of the unit costs selected for the elements. Additionally, the unit
Cost components
Design & engineering
Own engineering
Purchased engineering
Purchased work
Materials
Miscellaneous expenses
73
cost should correspond to the market price format, if possible, i.e. if the market price of
steel is given as a price per mass (€/kg), the data in the cost database should not be
accumulated as a price per length (€/m).
All the cost components, including purchased work, own work, materials, and miscella-
neous costs can be estimated through elemental parametric modeling, which requires a
systematically compiled database of historic cost-per-unit information. When the historic
and market-based information is not available, the assumptions for the parametric mod-
eling can be carried out as a one-point estimate or a three-point estimate based on the
reference projects, or expert opinion. It is crucial to document the basis of the estimates
so that the reliability of the estimate can be assessed and adjusted according to the stage
of the project lifecycle.
The cost estimator in the case company commented on the challenges of cost estimation
in the organization. The challenges they identified are the nature of project business,
large projects, reliance on supply chain and the human factor in cost estimating. These
challenges were drawn from the literature review and reported in Table 7. The unique
scope of each project and tailor-made technical solutions make the application of histor-
ical data in cost estimation challenging since there are no identical projects and the fig-
ures need adjustments. It is difficult to estimate the costs for larger projects. The larger
the project, the more prone it is to cost overruns. Modern tendency to outsource and hire
contractors to perform a share of workforces the cost estimator to rely on the contractors’
estimates, which may not be reliable. The human factor implies possible inaccuracies
caused by the individual’s personality as well as calculation or planning mistakes. The
cost estimator identified another challenge related to no means of storing historical data
in a harmonized manner and occasional ineffectiveness of the cost review process. The
researcher identifies the problem as a lack of systematic procedures.
Some of the challenges that were identified from the literature are not manifested in the
case company. For example, there is an abundance of historical data, it is just scattered
across the digital storage locations. The cost estimator did not attribute the challenges
in cost estimation to issues regarding itemization and cost allocation nor to the novelty
of the technology. The process being resource-consuming and assigning cost estimation
to technical staff were not identified as problem-causing factors in the case organization.
Two cost estimators from other departments were interviewed to get an insight into the
cost estimation challenges and whether the identified challenges are department-specific
or rather are common on the organizational scale. One of the cost estimators attributed
the difficulties in cost estimation to the custom-made solution, reliance on supply chain
74
and the human factor. The other cost estimator said that the project uniqueness, lack of
historical information, unclear cost account structure and custom-made solution are the
main aspects hindering the cost estimation. Both cost estimators added that they expe-
rience challenges with the technical specification and supply plan changes in the late
sales phase and early delivery phase. Information flow, lack of resources for design and
engineering, delays in technical specification and misinformation from the customer’s
end were additionally identified as challenges in cost estimation.
The process of cost estimation becomes more complex in multi-divisional projects, es-
pecially when it comes to the division of responsibilities – every element should be
planned and accounted for, and double-counting should be avoided. Each department
has its own cost estimator or even several, that possess the technical competencies and
understanding of their departments’ product portfolios. The division of responsibilities in
the company is pre-determined on the organizational level. Depending on the scope of
the deliverables, departments are allocated with the responsibility for the connecting
structures and supporting structures related to the elements. Cost estimation strategy
meetings are organized before the firm proposal stage to create and confirm the common
understanding of the responsibility areas of each department.
It does sometimes happen that the elements are not included in the cost estimation, due
to miscommunication, changes in project design or project scope, according to the case
department’ senior sales & technology manager as well as the cost estimator. It follows,
that in the multi-unit projects, a systematic approach to process coordination as well as
unambiguous communication is required. Timely and relevant communication helps the
cost estimators to include all the necessary changes into their calculations. There exists
a process to mediate the communication and division of responsibilities between all the
parties involved in the process of cost estimation, as well as ensure that the latest infor-
mation regarding technical specifications, design, and costs is available to everyone.
Without conducting the cost review, the proposal is not allowed to move to the negotia-
tion stage of the sales process, serving as a quality check of the cost estimate and the
proposal. The cost estimator’s feedback regarding the cost review process is lack of
effectiveness and output documentation. Upon further observation, it is concluded that
the cost review process is indeed lacking systematic structure and a considerable
amount of time is spent on contemplation and deliberation.
6.3 Cost variance analysis
The case company is a project-based firm, and unlike in standard manufacturing, project-
based firms encounter cost variance issues during and after project implementation. The
75
initial step towards problem identification was a straight-forward variance analysis based
on the data from two or three projects. After conducting the preliminary data analysis and
discussing the results with the steering group, a new course of action was elected. In-
stead of concentrating on two projects, collective data from a set of projects is to be used
in the investigation, allowing for a more holistic analysis. The element-specific cross-
project variance analysis could be beneficial for tracing the cost history for an element
and constructing the learning curves based on that data. Additionally, the element-spe-
cific analysis can reveal the commonality between projects, where cost overruns occur,
which will assist in a more appropriate contingency setting and risk management proce-
dures.
The department has access to project-specific variance data, meaning that the variance
figures presented are usually the total variance between the budgeted cost for the project
and the actual cost of project implementation. The researcher identified that it would be
beneficial for the company to analyze data on the element-specific basis across multiple
projects. Element in this context means an element of a work breakdown structure, which
is a typical way of organizing schedules and resources in project business. Such an
analysis could potentially bring out a new perspective and reveal systematic cost over-
runs in certain types of projects or systematically underprized or overprized elements.
The element-specific analysis additionally is an attempt to distinguish between system-
atic and random variances. The hypothesis is that the systematic variances indicate cost
overruns or underruns due to incorrect cost estimation and random variances indicate
that cost overruns were caused as a result of a risk event. Analyzing the cost variance
by element across multiple projects can reveal the most problematic elements causing
a variance in the projects and determine if there is a need to adjust the cost estimating
procedure and methods regarding these elements.
Project data used in variance analysis was retrieved on the 25th of July 2019 and was
used throughout the analysis. The cost data was retrieved again on the 11th of October
2019 to confirm that no significant changes happened to the expenses of the chosen
projects. The sample consisted of project budget and cost data from the case company’s
ERP system. The retrieval criteria for the data was that all the elements are budgeted
and billed under the scope of the department, which has its own corresponding value in
the ERP system. Altogether, 110 projects with 5 or more elements included were se-
lected for the analysis. The newest projects were excluded with the advice of the senior
sales manager and the cost estimator, as the implemented costs were not fully recorded,
falsely indicating the positive variance in the projects’ elements. Among the 110 projects,
there were 167 elements in the fourth level of the WBS, which contained data and could
76
be analyzed. The data analysis was carried out using MS Excel, where the variance
percentages, costs, and relative importance were analyzed and compared.
Project-scale and element-scale variance percentages were calculated by subtracting
actual costs from budgeted costs and dividing the difference by the budgeted cost, ac-
cording to Formula 3. The negative variances signified cost overruns and positive vari-
ances stood for cost savings. To avoid compensation of positive and negative values for
one another, the statistical analysis was conducted based on the absolute values of the
element-specific variances, as the main point of interest of the analysis is the cost devi-
ation itself, not only the cost overruns. To determine the elements that have the most
variance, the %-variances were averaged by using mean (µ) and median functions in
combination. Mean as a function was not suitable on its own, as the outliers skewed the
average. Median was used to mitigate the skewing. The formula for calculating the pop-
ulation mean is presented as Formula 4. Median is obtained by arranging the data sam-
ple in increasing order and choosing the middle value. If there is an even number of
values in the sample, the mean of the two middle values is taken as a median.
% 𝑉𝑎𝑟𝑖𝑎𝑛𝑐𝑒 =𝐵𝐶 − 𝐴𝐶
𝐵𝐶∙ 100%
(3)
µ =∑ 𝑥𝑖 𝑁
𝑖=1
𝑁
(4)
The percental variance analysis was conducted by keeping the data count in mind. The
element count across the projects was computed using the count function in excel, which
calculates the number of values in the selected array of cells. Low data count for an
element is a result of the infrequent implementation of that element throughout the pro-
jects. The infrequent implementation signifies that the element is either new or not fre-
quently ordered from the company’s product portfolio, implying that the case department
does not have much experience delivering the element in question. The effect of the
variance was assessed for the elements with no restrictions imposed on the data count
and with the element count of ten and over. In accordance with the principle of the learn-
ing curve, the more the activity is carried out, the better and more effective the execution
is. Based on the learning curve theory, it is hypothesized that the elements with smaller
count should have the largest percentual variances, and the elements with the higher
count should on the opposite have consistently lower variances. Figure 35 shows the
results of the element-based cross-project percental variance analysis. It is noteworthy
that the sensitive company-related information will not be presented in this report, as the
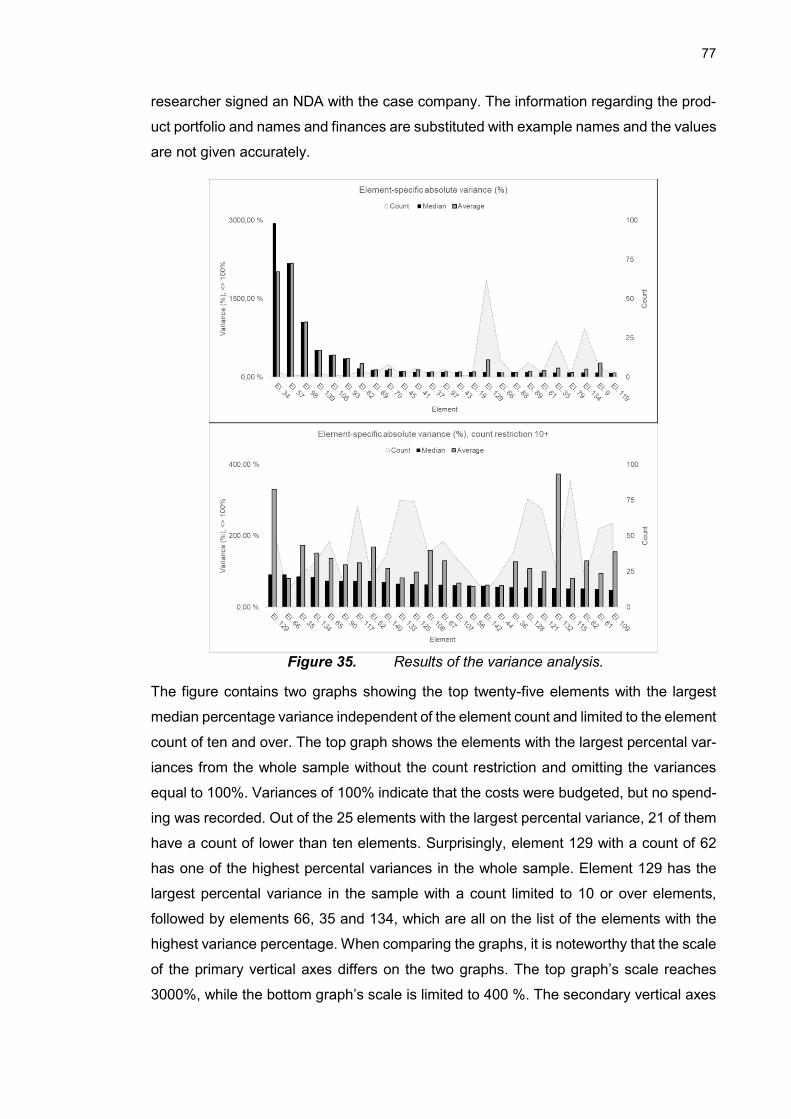
77
researcher signed an NDA with the case company. The information regarding the prod-
uct portfolio and names and finances are substituted with example names and the values
are not given accurately.
Figure 35. Results of the variance analysis.
The figure contains two graphs showing the top twenty-five elements with the largest
median percentage variance independent of the element count and limited to the element
count of ten and over. The top graph shows the elements with the largest percental var-
iances from the whole sample without the count restriction and omitting the variances
equal to 100%. Variances of 100% indicate that the costs were budgeted, but no spend-
ing was recorded. Out of the 25 elements with the largest percental variance, 21 of them
have a count of lower than ten elements. Surprisingly, element 129 with a count of 62
has one of the highest percental variances in the whole sample. Element 129 has the
largest percental variance in the sample with a count limited to 10 or over elements,
followed by elements 66, 35 and 134, which are all on the list of the elements with the
highest variance percentage. When comparing the graphs, it is noteworthy that the scale
of the primary vertical axes differs on the two graphs. The top graph’s scale reaches
3000%, while the bottom graph’s scale is limited to 400 %. The secondary vertical axes
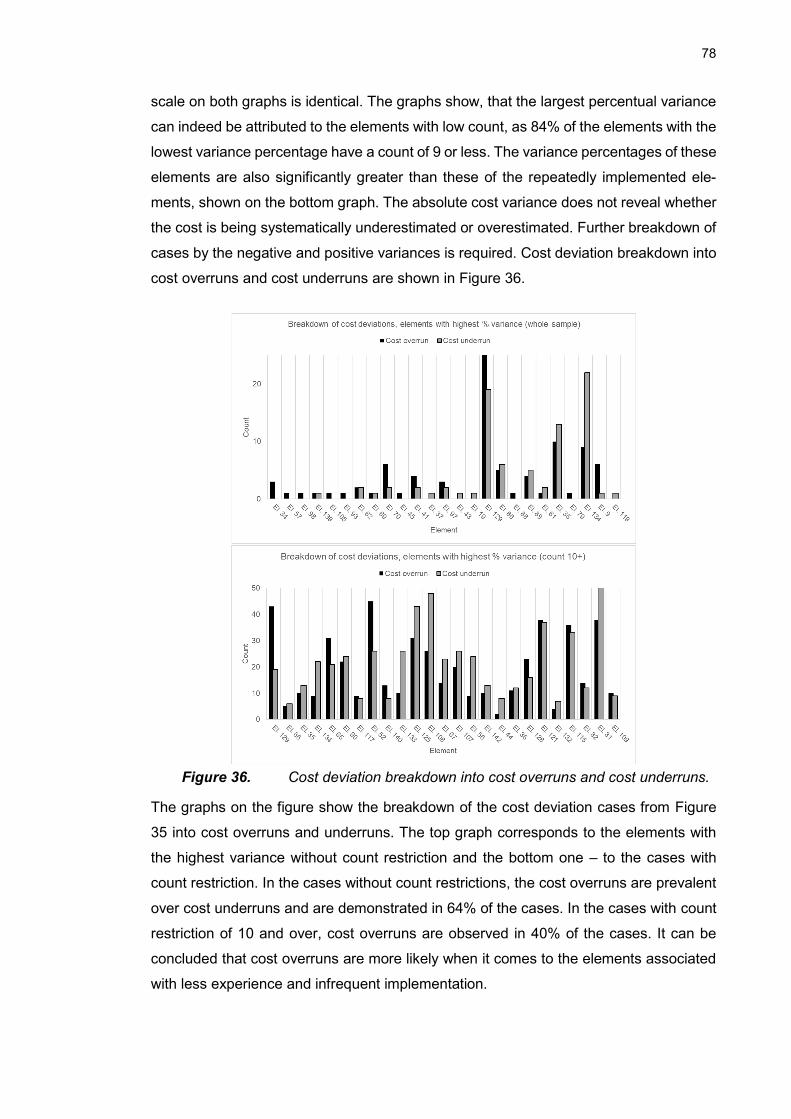
78
scale on both graphs is identical. The graphs show, that the largest percentual variance
can indeed be attributed to the elements with low count, as 84% of the elements with the
lowest variance percentage have a count of 9 or less. The variance percentages of these
elements are also significantly greater than these of the repeatedly implemented ele-
ments, shown on the bottom graph. The absolute cost variance does not reveal whether
the cost is being systematically underestimated or overestimated. Further breakdown of
cases by the negative and positive variances is required. Cost deviation breakdown into
cost overruns and cost underruns are shown in Figure 36.
Figure 36. Cost deviation breakdown into cost overruns and cost underruns.
The graphs on the figure show the breakdown of the cost deviation cases from Figure
35 into cost overruns and underruns. The top graph corresponds to the elements with
the highest variance without count restriction and the bottom one – to the cases with
count restriction. In the cases without count restrictions, the cost overruns are prevalent
over cost underruns and are demonstrated in 64% of the cases. In the cases with count
restriction of 10 and over, cost overruns are observed in 40% of the cases. It can be
concluded that cost overruns are more likely when it comes to the elements associated
with less experience and infrequent implementation.
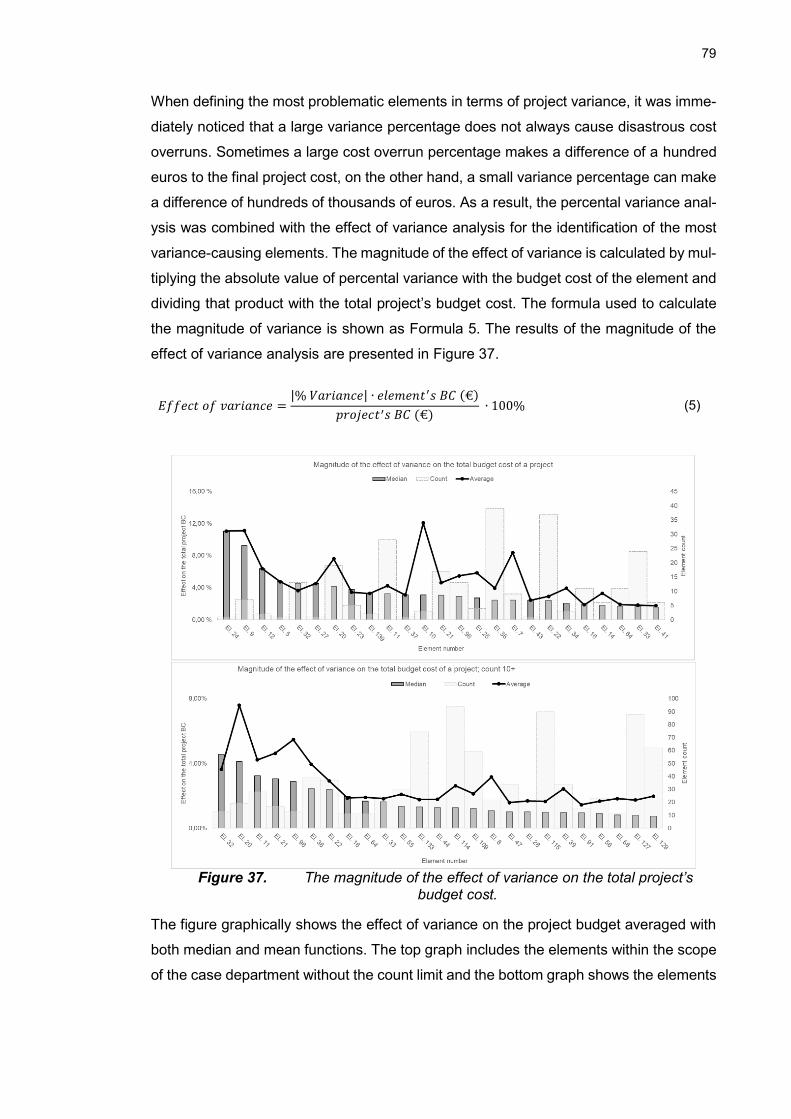
79
When defining the most problematic elements in terms of project variance, it was imme-
diately noticed that a large variance percentage does not always cause disastrous cost
overruns. Sometimes a large cost overrun percentage makes a difference of a hundred
euros to the final project cost, on the other hand, a small variance percentage can make
a difference of hundreds of thousands of euros. As a result, the percental variance anal-
ysis was combined with the effect of variance analysis for the identification of the most
variance-causing elements. The magnitude of the effect of variance is calculated by mul-
tiplying the absolute value of percental variance with the budget cost of the element and
dividing that product with the total project’s budget cost. The formula used to calculate
the magnitude of variance is shown as Formula 5. The results of the magnitude of the
effect of variance analysis are presented in Figure 37.
Figure 37. The magnitude of the effect of variance on the total project’s budget cost.
The figure graphically shows the effect of variance on the project budget averaged with
both median and mean functions. The top graph includes the elements within the scope
of the case department without the count limit and the bottom graph shows the elements
𝐸𝑓𝑓𝑒𝑐𝑡 𝑜𝑓 𝑣𝑎𝑟𝑖𝑎𝑛𝑐𝑒 =|% 𝑉𝑎𝑟𝑖𝑎𝑛𝑐𝑒| ∙ 𝑒𝑙𝑒𝑚𝑒𝑛𝑡′𝑠 𝐵𝐶 (€)
𝑝𝑟𝑜𝑗𝑒𝑐𝑡′𝑠 𝐵𝐶 (€) ∙ 100% (5)
80
limited in the count to 10 and over. The variances of 100% were excluded from the anal-
ysis. The median and average functions are represented with respect to the primary ver-
tical axis, while the element count is shown with respect to the secondary vertical axis.
The figure shows the top twenty-five elements in terms of their effect on the total project
budget. Both graphs contain the same ten elements, 11, 16, 20, 21, 22, 32, 33, 36, 64
and 96. The aforementioned elements are all with a high count, meaning that the effect
they have on the project budget is systematic and more attention needs to be paid to
cost estimation of these elements. The next step in the analysis is to identify whether
there are such elements with a high variance that have a profound effect on the total
project budget cost and classify these elements by cost components to identify potential
root causes for estimation inaccuracies.
The magnitude of the effect of variance is ranged between 0,01% and 11,05% as a result
of data analysis. A scale of values is developed by using statistical quartiles to assess
the severity of the effect of variance on the total project budget. The three quartiles split
the data set into four quarters corresponding to low, medium, high and very high classi-
fication of effect assessment. The scale for the assessment is shown in Table 9.
Table 9. Scale for assessing the magnitude of the effect of variance on project’s BC.
Percentile Assessment Data range
0-25% Low 0,01% - 0,24%
25-50% Medium 0,25% - 0,53%
50%-75% High 0,54% - 1,19%
75%-100% Very high 1,20% - 11,05%
Considering the classification presented in the table, the magnitude of the effect of vari-
ance in the earlier discussed analysis (see Figure 37) can be assessed. The median
effect of variance calculated on the element-specific cross-project basis is very high for
the data set in the scenario without count limitation. In the scenario with the count of 10
and over, 60% of the top twenty-five elements have a very high effect on the overall
project budget and 40% have a high effect. The elements with the highest variance per-
centage are assessed by the same scale of the severity of the effect on the total project
cost. Further discussion with the case company’s cost estimator revealed that the ele-
ments with the count of 10 and less, in this case, are not used in pricing from their expe-
rience and should not be emphasized. Table 10 shows the elements with the highest
percental variance that have the most profound effect on the total project cost with ele-
ment count 10 or higher.
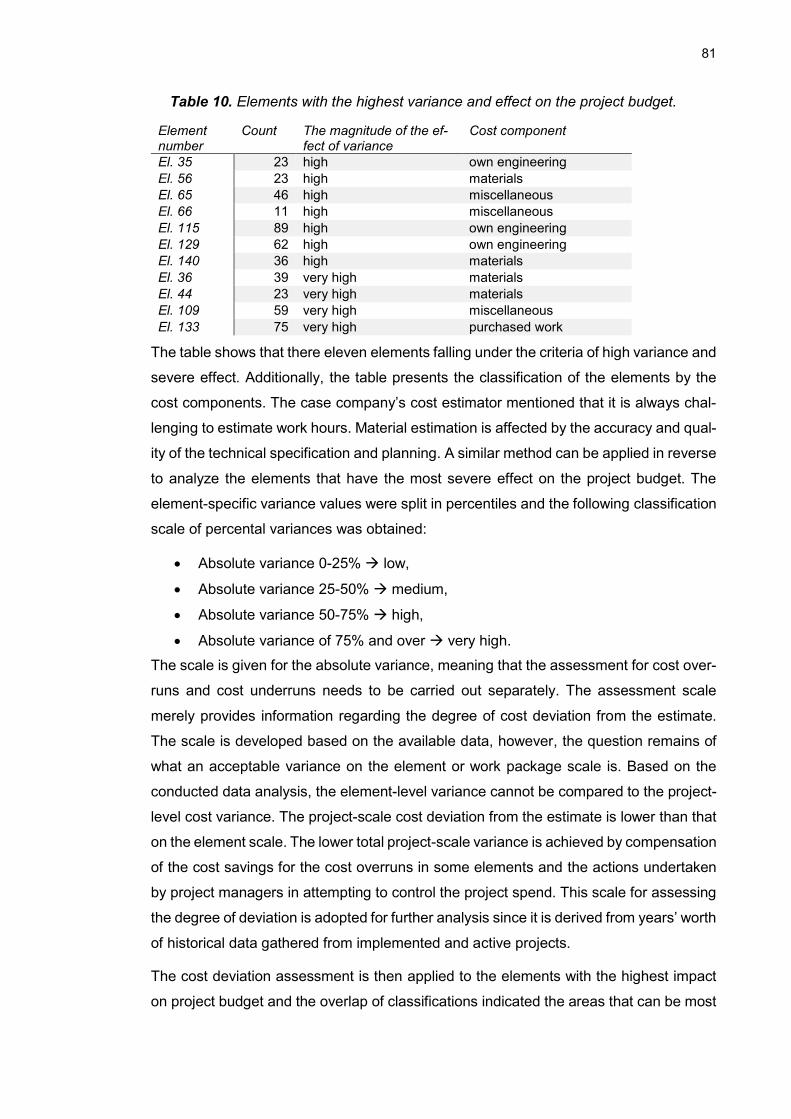
81
Table 10. Elements with the highest variance and effect on the project budget.
Element number
Count The magnitude of the ef-fect of variance
Cost component
El. 35 23 high own engineering
El. 56 23 high materials
El. 65 46 high miscellaneous
El. 66 11 high miscellaneous
El. 115 89 high own engineering
El. 129 62 high own engineering
El. 140 36 high materials
El. 36 39 very high materials
El. 44 23 very high materials
El. 109 59 very high miscellaneous
El. 133 75 very high purchased work
The table shows that there eleven elements falling under the criteria of high variance and
severe effect. Additionally, the table presents the classification of the elements by the
cost components. The case company’s cost estimator mentioned that it is always chal-
lenging to estimate work hours. Material estimation is affected by the accuracy and qual-
ity of the technical specification and planning. A similar method can be applied in reverse
to analyze the elements that have the most severe effect on the project budget. The
element-specific variance values were split in percentiles and the following classification
scale of percental variances was obtained:
• Absolute variance 0-25% → low,
• Absolute variance 25-50% → medium,
• Absolute variance 50-75% → high,
• Absolute variance of 75% and over → very high.
The scale is given for the absolute variance, meaning that the assessment for cost over-
runs and cost underruns needs to be carried out separately. The assessment scale
merely provides information regarding the degree of cost deviation from the estimate.
The scale is developed based on the available data, however, the question remains of
what an acceptable variance on the element or work package scale is. Based on the
conducted data analysis, the element-level variance cannot be compared to the project-
level cost variance. The project-scale cost deviation from the estimate is lower than that
on the element scale. The lower total project-scale variance is achieved by compensation
of the cost savings for the cost overruns in some elements and the actions undertaken
by project managers in attempting to control the project spend. This scale for assessing
the degree of deviation is adopted for further analysis since it is derived from years’ worth
of historical data gathered from implemented and active projects.
The cost deviation assessment is then applied to the elements with the highest impact
on project budget and the overlap of classifications indicated the areas that can be most
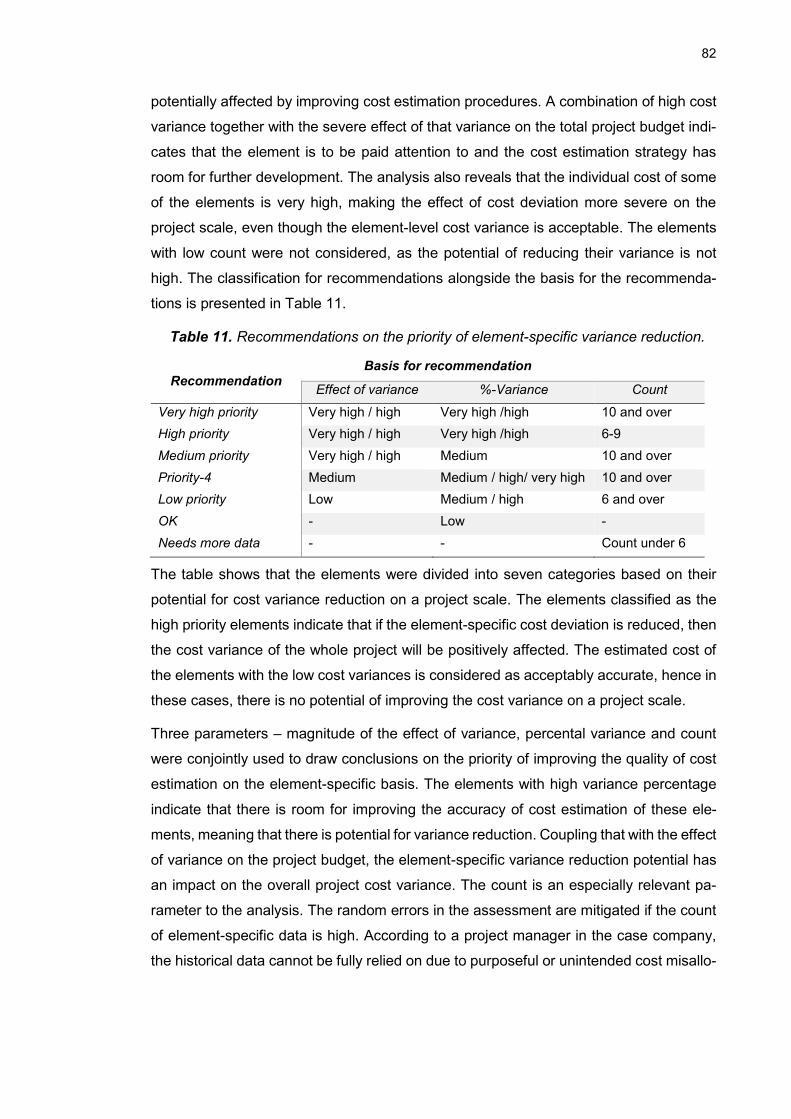
82
potentially affected by improving cost estimation procedures. A combination of high cost
variance together with the severe effect of that variance on the total project budget indi-
cates that the element is to be paid attention to and the cost estimation strategy has
room for further development. The analysis also reveals that the individual cost of some
of the elements is very high, making the effect of cost deviation more severe on the
project scale, even though the element-level cost variance is acceptable. The elements
with low count were not considered, as the potential of reducing their variance is not
high. The classification for recommendations alongside the basis for the recommenda-
tions is presented in Table 11.
Table 11. Recommendations on the priority of element-specific variance reduction.
Recommendation Basis for recommendation
Effect of variance %-Variance Count
Very high priority Very high / high Very high /high 10 and over
High priority Very high / high Very high /high 6-9
Medium priority Very high / high Medium 10 and over
Priority-4 Medium Medium / high/ very high 10 and over
Low priority Low Medium / high 6 and over
OK - Low -
Needs more data - - Count under 6
The table shows that the elements were divided into seven categories based on their
potential for cost variance reduction on a project scale. The elements classified as the
high priority elements indicate that if the element-specific cost deviation is reduced, then
the cost variance of the whole project will be positively affected. The estimated cost of
the elements with the low cost variances is considered as acceptably accurate, hence in
these cases, there is no potential of improving the cost variance on a project scale.
Three parameters – magnitude of the effect of variance, percental variance and count
were conjointly used to draw conclusions on the priority of improving the quality of cost
estimation on the element-specific basis. The elements with high variance percentage
indicate that there is room for improving the accuracy of cost estimation of these ele-
ments, meaning that there is potential for variance reduction. Coupling that with the effect
of variance on the project budget, the element-specific variance reduction potential has
an impact on the overall project cost variance. The count is an especially relevant pa-
rameter to the analysis. The random errors in the assessment are mitigated if the count
of element-specific data is high. According to a project manager in the case company,
the historical data cannot be fully relied on due to purposeful or unintended cost misallo-
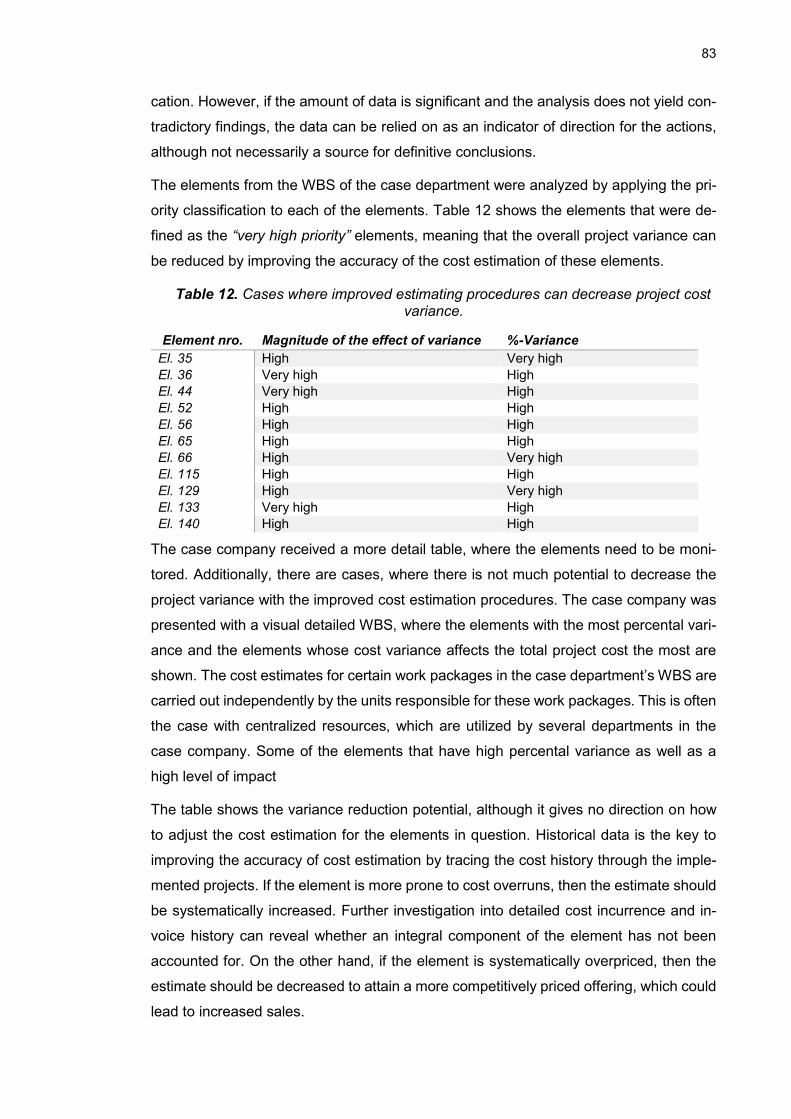
83
cation. However, if the amount of data is significant and the analysis does not yield con-
tradictory findings, the data can be relied on as an indicator of direction for the actions,
although not necessarily a source for definitive conclusions.
The elements from the WBS of the case department were analyzed by applying the pri-
ority classification to each of the elements. Table 12 shows the elements that were de-
fined as the “very high priority” elements, meaning that the overall project variance can
be reduced by improving the accuracy of the cost estimation of these elements.
Table 12. Cases where improved estimating procedures can decrease project cost variance.
Element nro. Magnitude of the effect of variance %-Variance
El. 35 High Very high
El. 36 Very high High
El. 44 Very high High
El. 52 High High
El. 56 High High
El. 65 High High
El. 66 High Very high
El. 115 High High
El. 129 High Very high
El. 133 Very high High
El. 140 High High
The case company received a more detail table, where the elements need to be moni-
tored. Additionally, there are cases, where there is not much potential to decrease the
project variance with the improved cost estimation procedures. The case company was
presented with a visual detailed WBS, where the elements with the most percental vari-
ance and the elements whose cost variance affects the total project cost the most are
shown. The cost estimates for certain work packages in the case department’s WBS are
carried out independently by the units responsible for these work packages. This is often
the case with centralized resources, which are utilized by several departments in the
case company. Some of the elements that have high percental variance as well as a
high level of impact
The table shows the variance reduction potential, although it gives no direction on how
to adjust the cost estimation for the elements in question. Historical data is the key to
improving the accuracy of cost estimation by tracing the cost history through the imple-
mented projects. If the element is more prone to cost overruns, then the estimate should
be systematically increased. Further investigation into detailed cost incurrence and in-
voice history can reveal whether an integral component of the element has not been
accounted for. On the other hand, if the element is systematically overpriced, then the
estimate should be decreased to attain a more competitively priced offering, which could
lead to increased sales.
84
The cost estimator and the senior sales manager had an observation that generally the
purchased and own work and working hours are the hardest cost components to esti-
mate, yielding the highest cost deviations. Most of the identified elements of concern are
related to work hour estimation, but some also include the material costs. Material costs
are usually exceeded due to incompetent planning and project engineering, indicating
that some of the work packages cannot be analyzed in isolation in the light of project
complexity. According to Dao et al. (2016) and Martinsuo (2011) project complexity en-
tails the ambiguous nature of the interactions between project elements, making the
identification of the root cause of cost variances less straightforward.
6.4 Current situation
6.4.1 Perception of the current situation in the case company
One of the integral steps of the situation analysis was quantifying the perception of the
current situation by the project stakeholders. Four individuals, a senior sales manager,
a product sales manager, a project manager, and a cost estimator were interviewed and
were asked to choose 5 to 10 elements that are the most problematic and cause the
most variance according to their opinion. The objective of that questionnaire was to in-
terpret and validate quantitative findings to form the basis for a process improvement
suggestion. Additionally, the perception of the problem areas could indicate the quality
of the information flow within the case department through misidentified concerns and
priority areas in different functions of the departments, through the emphasized con-
cerns.
The interviews were carried out in December 2019. The interviewees were presented
with a list of elements that was composed of the elements with the highest variance
percentage, highest impact on the total project budget in addition to the elements with
the lowest percentages and lowest impacts. Altogether, the list contained 57 elements.
The interviewees were asked to select from five to ten elements that in their personal
opinion have the largest variances in the department’s project and if there are such ele-
ments missing from the list, the participants were encouraged to add the elements. The
interview was carried out for data triangulation and revealing the causes of cost variance
in a form of element-specific cost variance. This is done by comparing the elements
revealed by the quantitative analysis as the highest priority with those that are perceived
as problematic by the case company’s stakeholders.
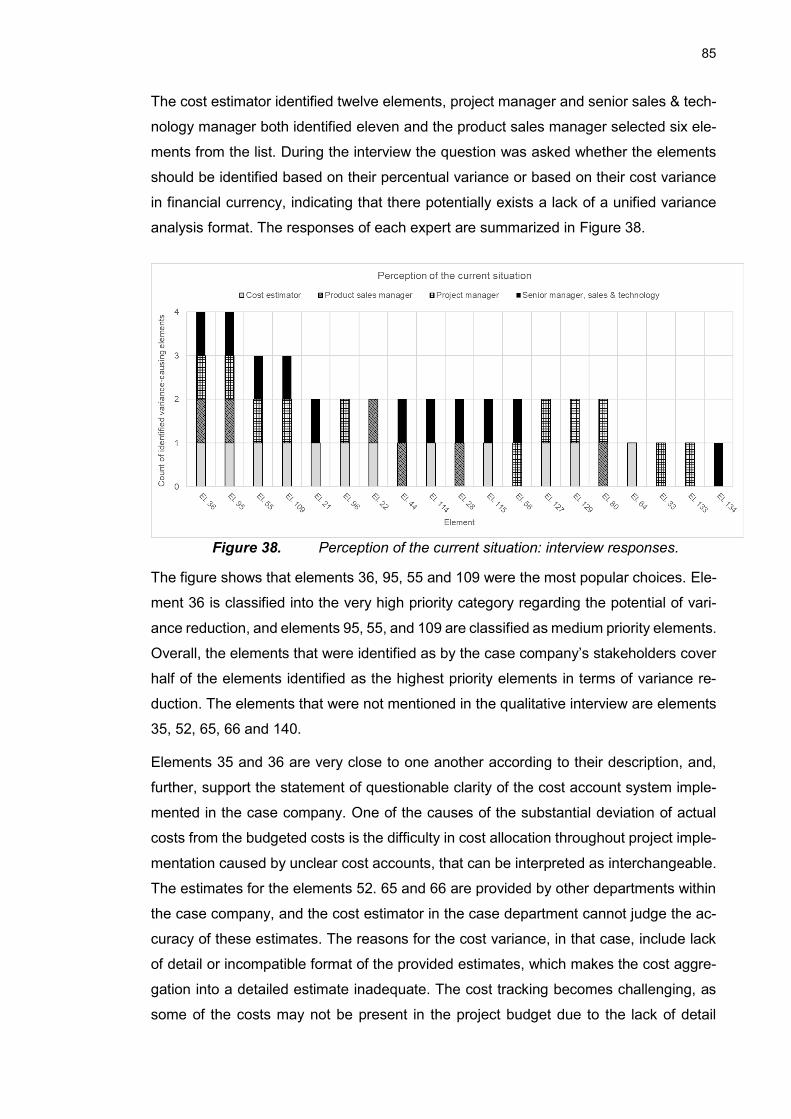
85
The cost estimator identified twelve elements, project manager and senior sales & tech-
nology manager both identified eleven and the product sales manager selected six ele-
ments from the list. During the interview the question was asked whether the elements
should be identified based on their percentual variance or based on their cost variance
in financial currency, indicating that there potentially exists a lack of a unified variance
analysis format. The responses of each expert are summarized in Figure 38.
Figure 38. Perception of the current situation: interview responses.
The figure shows that elements 36, 95, 55 and 109 were the most popular choices. Ele-
ment 36 is classified into the very high priority category regarding the potential of vari-
ance reduction, and elements 95, 55, and 109 are classified as medium priority elements.
Overall, the elements that were identified as by the case company’s stakeholders cover
half of the elements identified as the highest priority elements in terms of variance re-
duction. The elements that were not mentioned in the qualitative interview are elements
35, 52, 65, 66 and 140.
Elements 35 and 36 are very close to one another according to their description, and,
further, support the statement of questionable clarity of the cost account system imple-
mented in the case company. One of the causes of the substantial deviation of actual
costs from the budgeted costs is the difficulty in cost allocation throughout project imple-
mentation caused by unclear cost accounts, that can be interpreted as interchangeable.
The estimates for the elements 52. 65 and 66 are provided by other departments within
the case company, and the cost estimator in the case department cannot judge the ac-
curacy of these estimates. The reasons for the cost variance, in that case, include lack
of detail or incompatible format of the provided estimates, which makes the cost aggre-
gation into a detailed estimate inadequate. The cost tracking becomes challenging, as
some of the costs may not be present in the project budget due to the lack of detail
86
supplied to the cost estimator. Element 140 does not anymore belong to the scope of
the case department. The jurisdiction over the element has been transferred to another
department, who is now responsible for the cost estimation and cost tracking of that
element.
Overall, the interview is consistent with the quantitative findings of variance analysis and
the respondents are aware of the development needs when it comes to the high priority
elements, whose cost estimates are produced by the case department. Some additional
problem areas in the cost estimation were identified and brought to the case depart-
ment’s attention, such as the estimates supplied by other departments. Systematizing
the process across the organization by providing a uniform standard format for cost es-
timation and defining precise information requirements is instrumental when it comes to
reducing the overall project variance. When aggregating the estimate, if the individual
estimates are supplied in sufficient detail, the origin of the individual costs is clear to the
project manager, who is the key stakeholder in cost tracking throughout project imple-
mentation. Making the cost allocation and cost tracking more reliable provides an oppor-
tunity for evaluating the accuracy of the cost estimate and potentially implementing ad-
justment factors, based on the lessons learned from the project implementation.
6.4.2 Process observations
The case company implemented a method to deal with project complexity in terms of
specifying and reviewing the internal division of responsibilities when it comes to cost
estimation. The division is carried out in the cost estimation strategy meetings and the
review – in cost review meetings. Cost review is carried out in accordance with the cost
estimation template that is in use in the case company. The cost estimation template
contains all the elements of the WBS that belong to the scope of the case department,
and the same template is used throughout all the stages of the cost estimation process.
The cost estimator of the case company commented that the process does not seem to
be as effective as it could be and there are no tangible results obtained from the cost
review discussions. This could be tied to a lack of consistent quality documentation
(Doloi, 2010).
The contingency reserve in the case company is set through a risk analysis, where the
risk factors are identified, the risk management policies are selected for each factor.
Then the risks are quantified in terms of plausible cost overruns and cost savings regard-
ing each aspect. The researcher participated in risk review meetings and it was immedi-
ately noticed that the quality of the information presented by the responsible parties dif-
87
fered. For instance, one expert may provide information supported by the received quo-
tation from the supplier and another expert has developed a ballpark estimate. Keeping
the notion of project complexity in mind, it is a challenge to claim that all the estimates
can be of the same quality during the early stages of the project lifecycle since the esti-
mates are closely related to the specification of the project’s design. Although, the pro-
cess and the contingency estimate will be of a higher quality if the information provided
is relevant and up-to-date, which should be systematically defined across the project
organization and not subjectively interpreted by the project stakeholders.
It is hypothesized that cost overruns may depend on the competitive situation of the
company. Under the pressure from competitors, the disciplines may tend to lower the
prices too much for the final price to become more attractive to the customer. According
to the case company’s cost estimator and senior sales manager, each of the disciplines
lowers their cost estimate unrealistically much in order to reach the target cost for the
optimal price. In this case, a design-to-cost approach is advisable as instead of providing
unrealistic cost estimates, the technical specifications and supply plan are tweaked to
attain the desirable cost estimate. Additionally, having readily-available organized data
from similar projects conducted in the past could provide a benchmark for sales manag-
ers in terms of evaluating how realistic their estimates are.
The literature also brings up that individual personality factors can affect the estimates,
some may be of higher quality and some may be too optimistic (Skitmore and Lowe,
1992; Shane, 2009). As was discussed, the key to dealing with personality bias is imple-
menting systematic approaches that are clearly defined on the organizational scale and
no crucial information is left upon personal interpretation. Through participating in the
daily processes within the firm it is concluded that there is a need for process develop-
ment in terms of increasing efficiency and effectiveness.
Information availability throughout the project lifecycle was observed and identified as a
definite improvement area. The cost estimators in the case company were interviewed
with the purpose of confirming the observations and acquiring more information, and one
example questionnaire is presented in Appendix C: challenges in cost estimation ques-
tionnaire. The case company’s cost estimator stated that even if the historical information
is available, it cannot be effectively utilized due to the lack of systematic archiving and
difficulties regarding information retrievability. A newly-hired product engineer was inter-
viewed several times regarding information availability. According to them, the relevant
information is scattered across the storage databases, the format of the information is
not standardized, and, in some cases, the information is outdated or missing altogether.
The issues with systematically organized data archiving entail a high risk of knowledge
88
and expertise loss whenever an expert leaves their position. In companies comparable
in scale to the case company, employee mobility is high, making it imperative to codify
and be able to utilize employees’ tacit knowledge and expertise (Nonaka, 1991; Aliaga,
2000). The knowledge is a strategic resource that enables value creation in companies,
making good knowledge management practices essential in terms of gaining competitive
advantage (Meso and Smith, 2000).
Internal information flow is another process requiring attention and modification in the
case department. A cost estimator from another department identified that one of the
difficulties in cost estimation is insufficient information flow during the early phases of the
project lifecycle. The design of the offering is prone to changes during the early phases
and these changes need to be communicated across the project stakeholders, so that
they are accounted for in all functions relevant to project preparation, including cost es-
timation. The estimate is very likely to change with the changes in technical specifica-
tions, making the communication of change crucial to the process. The interview with the
case company’s product engineer revealed that there are flaws in the methods selected
for internal information management, as some of the data that is created by one party is
being overwritten by a new document version from another party. The information about
changes is not being sufficiently relayed resulting in occasional losses. The product en-
gineer mentioned that there are superior information management systems already in
use within the case organization and the training regarding the information management
system is organized within the case organization, though the case department is some-
what reluctant to change.
Additionally, the product engineer in the case department mentioned that there are no
standardized ways for external inquiries, making the inquiries a lengthy process. Accord-
ing to their expert opinion, the process would not take nearly as long and the information
requirements would be met more effectively if there was a collection of inquiry templates,
which could be slightly modified on a case-specific basis. In other words, the information
requirements should be made explicit to ensure timely information availability. Another
product engineer who was employed in the case department for over two years com-
mented on the overall process execution in the case organization. In their opinion, the
training information was not provided in a good format. instead of having a collection of
standard methods and procedures, it was scattered across different storage locations
and, as a result, some crucial to the job information was missed out on. In addition, both
product engineers pointed out that the division of responsibilities is not always clear
throughout the sales process in the case company. In most cases, when employees are
given a task, they complete it without consideration of whether the task is a part of their
89
responsibilities. Occasionally, the external to the job description tasks inhibit other activ-
ities belonging to the responsibilities of product engineers. Overall, the conclusion can
be made that there is room to improve the sales process in the company towards being
more effective and efficient, in other words, towards being more lean.
Throughout the quantitative analysis of cost variance, a problem in cost tracking and
recording was identified. Some of the actual costs were allocated to the wrong cost ac-
counts compared to the budgeted costs. According to the case company’s controller and
cost estimator, it can happen either purposefully or not. Intentional cost misallocation can
happen due to the attempt of project managers to keep the project costs in check, for
instance, by purchasing materials for other projects with the saved costs. Unintentional
cost misallocation arises from occasional ambiguity of itemization in cost accounts.
There are often several elements regarding a work activity, and it may not be clear to all
the project stakeholders where the cost should be allocated. Additionally, sometimes the
contractors bill the organization for several projects at once, and if the cost allocation to
different projects is not visible from the invoice, then the cost allocation is not reliable.
The indirect costs are challenging to allocate to projects. The workers are responsible
for assigning their daily working hours to specific projects, however, depending on the
job function and the regularity of reporting, the hour allocation is merely approximate.
6.4.3 Cost estimation process
Cost estimation is an integral part of the sales process. The process of cost estimation
in the case department is compiled through interviews with the cost estimator in the case
company as well as the researcher’s process observations during the time of personal
involvement in the case company. The process contains eleven steps:
1. indicative estimate,
2. project kick-off,
3. initial technical specification,
4. initial cost estimation strategy meeting,
5. limited design and specification,
6. budget estimate and cost strategy meeting,
7. detailed design, specification and project schedule,
8. detailed cost estimate for firm proposal,
9. cost review,
10. risk analysis,
11. aggregate the cost baseline and compute the project budget.
90
Indicative estimate, budget estimate and firm proposal estimate correspond to the
phases of the sales process formula utilized in the case company. The intermediate
steps are related to project planning, namely engineering, design, and scheduling. Dur-
ing the project kick-off, the internal project stakeholders are identified, and a rough de-
sign is developed based on the customer’s inquiry. That is followed by the development
of preliminary specifications and the initial cost strategy meeting, where the responsibil-
ities are divided among the departments. Based on that, the budget estimate is devel-
oped, simultaneously ensuring that the division of responsibilities has been followed thor-
oughly. Afterward, detailed design and schedule are developed, based on which the de-
tailed cost estimate is computed. The cost baseline and project budget are set after the
cost review and risk analysis was carried out.
Comparing the above-outlined process to the best available processes reviewed in
Chapter 4.3, there are clearly noticeable deviations. The cost estimation process in the
case company is treated as a sales phase and is not a continuous process throughout
the project lifecycle, as is dictated by the best available practices (see Figure 29). The
process cannot be completely adapted to that of the best available practices, due to
differences in the company’s business and operations. When it comes to the first four
steps identified as BAP, the case company conforms to the process well. The WBS ex-
ists, it needs to be limited to the defined project scope. The customer’s request is ana-
lyzed during the project kick-off and the preliminary schedule and specification are de-
veloped. The ground rules and assumptions are identified and documented.
When it comes to selecting the cost estimation technique, there is no existing distinction
between the techniques available. The indicative estimate is a combination of analogical
and expert opinion techniques. The cost estimator is not the main contributor during that
stage, they are merely consulted. From there on, the cost estimation is carried out in the
template for the detailed estimate. Elemental parametric estimation is used for certain
elements, for which the unit cost parameters are available. The detailed estimate is com-
puted based on the same principle, just in accordance with the more detailed design
specifications and schedule available. The risk analysis is carried out and the cost
bassline is developed alongside the project budget. This is where the cost estimation
process is perceived to end in the case company. The cost estimate remains in the tem-
plate, where it was created, and no separate reporting is done. The cost estimate is not
adjusted according to the actual costs, nor the cost estimation is analyzed at the end of
the project to identify the improvement areas for future cases. The ground rules and
assumptions used in the process of estimation remain in the detailed estimate template,
which is a large document, containing the whole WBS of the case department on the
91
most detailed level. The cost estimation templates are scattered across the information
management system locations, making it difficult to locate specific files and retrieve the
unit costs and parameter one-by-one from the files.
6.5 Recommendations
Based on the identified and observed challenges present in the case company and the
theory on cost estimation and the best available practices, a set of recommendations is
issued to the case department that will potentially result in project cost variance reduction
through an improved method of cost estimation. First, the cost estimation process should
be carefully documented, and the estimate should be revised either throughout, or at
least at the end of the project. Second, more attention needs to be paid to the cost esti-
mation techniques used to promote lean thinking as well as balance resource utilization.
Third, the inaccuracy involved at each stage of the cost estimate should be recognized
and communicated to the party that utilizes the cost estimate. And last, when carrying
out the risk review, the uncertainties associated with the risks and the uncertainties re-
garding the available cost data should be discussed and documented separately.
It is vital to follow through all stages of the cost estimation process to begin accumulating
historical data and promote organizational learning. At the end of each project, a project
manager holds a presentation, where the outcomes and the lessons learned from the
projects are covered. It is instrumental for the cost estimator to participate in such meet-
ings, getting feedback on the quality of the cost estimate as well as getting an overview
of the process and the big picture of the project implementation. Based on the information
presented as the analysis of the project outcomes, the cost estimator is to make the final
adjustments to the cost estimation report and archive it for future use. A cost estimation
report should be created, where the information regarding the project scope changes
and the estimate adjustments is visible. Suggested content for the cost estimation report
is shown in Table 4, and it includes the description of the case alongside the ground
rules for the estimate, technical specifications and project schedule, and additional work-
specific information. The detailed cost estimate can be referenced to as an appendix
since the template is substantial in size and would overwhelm the cost estimate report.
Pricing factors, previously referred to as unit cost are important to gather systematically
in one location since they are utilized in elemental parametric estimation in future pro-
jects. Not having the archive of the unit costs, which can be sorted by the type of the
project and other relevant factors, inhibits experiential learning.
It is advised to initiate the effort of archiving the unit costs, such as cost per hour or cost
per kilogram, which can be sorted by the project type, location, scope, cost component
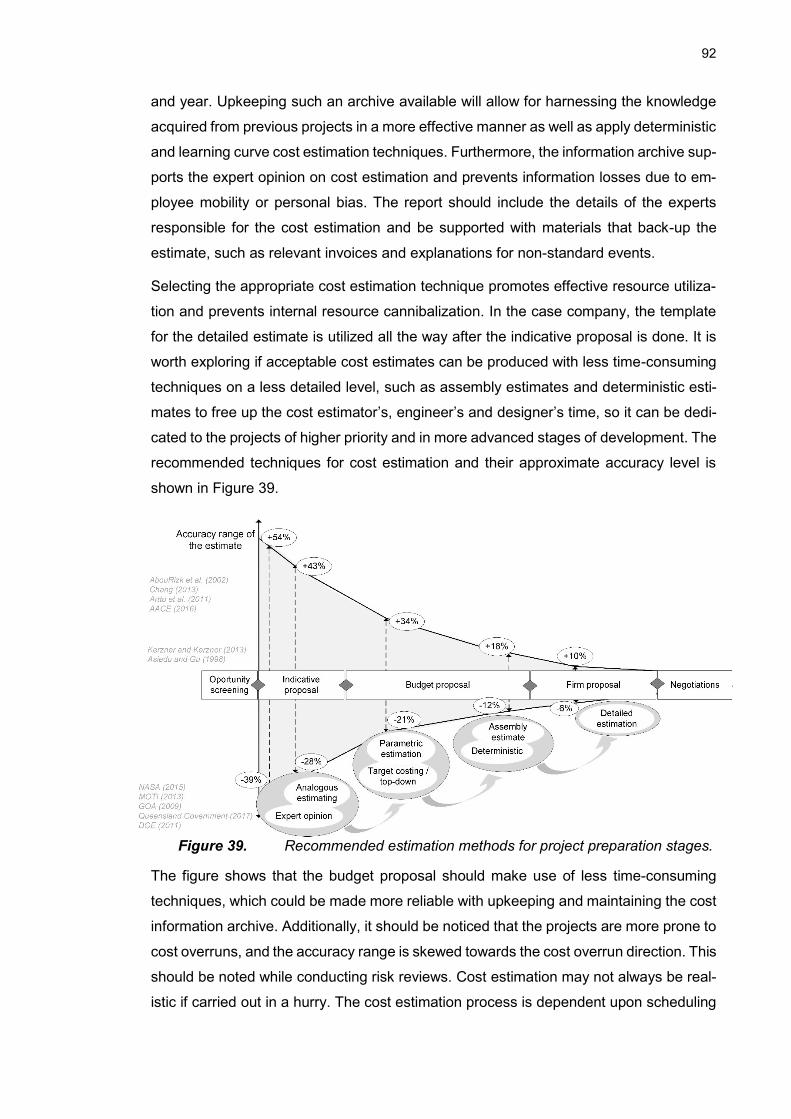
92
and year. Upkeeping such an archive available will allow for harnessing the knowledge
acquired from previous projects in a more effective manner as well as apply deterministic
and learning curve cost estimation techniques. Furthermore, the information archive sup-
ports the expert opinion on cost estimation and prevents information losses due to em-
ployee mobility or personal bias. The report should include the details of the experts
responsible for the cost estimation and be supported with materials that back-up the
estimate, such as relevant invoices and explanations for non-standard events.
Selecting the appropriate cost estimation technique promotes effective resource utiliza-
tion and prevents internal resource cannibalization. In the case company, the template
for the detailed estimate is utilized all the way after the indicative proposal is done. It is
worth exploring if acceptable cost estimates can be produced with less time-consuming
techniques on a less detailed level, such as assembly estimates and deterministic esti-
mates to free up the cost estimator’s, engineer’s and designer’s time, so it can be dedi-
cated to the projects of higher priority and in more advanced stages of development. The
recommended techniques for cost estimation and their approximate accuracy level is
shown in Figure 39.
Figure 39. Recommended estimation methods for project preparation stages.
The figure shows that the budget proposal should make use of less time-consuming
techniques, which could be made more reliable with upkeeping and maintaining the cost
information archive. Additionally, it should be noticed that the projects are more prone to
cost overruns, and the accuracy range is skewed towards the cost overrun direction. This
should be noted while conducting risk reviews. Cost estimation may not always be real-
istic if carried out in a hurry. The cost estimation process is dependent upon scheduling
93
and technical specification, meaning that it cannot be rushed out of proportion with re-
spect to the other factors. The quality of the estimate is in line with the quality of the
schedule and design. The process of cost estimation should be followed systematically,
and the unavoidable uncertainties should be recognized and accounted for instead of
being brushed off.
With appropriate cost estimation methods and good quality historical data archives, the
process could be adapted to lean principle by decreasing the time required to produce
the cost estimate without affecting the quality. The consequential additional resource
availability can be utilized to increase the quality of the detailed estimate as well as to
prevent carrying out the estimation in a hurry. Another advantage of historical information
archive is the prevention of succumbing to competitive pressure and undervaluing pro-
jects. If there are clearly defined cost levels associated with certain elements, the cost of
the element should not be estimated at a lower level than is historically observed from
similar cases. This preventive approach is an example of six sigma philosophy, where
the estimation mistakes are prevented with the relevant benchmark cost level.
It is important to communicate the inaccuracy of each of the cost estimates produced to
the party utilizing the estimate so that the cost data is not misused. If the sales manager
is hurried by the customer, they may mistakenly present a rough estimate as a reliable
price level to the customer, hindering the chances of winning the project if the costs are
overestimated, or risking company reputation and customer dissatisfaction in case the
costs are underestimated. The benefit of quantifying risks of cost deviation due to risk
events and due to uncertainty of the available cost data separately is the ability to track
and assess the appropriateness of contingency levels. The tracked cost data uncertainty
can be used to adjust the accuracy range of cost estimates, which should be done in any
case, as the ranges differ based on the organization and its operations.
To facilitate the idea of lean process development, a stage-gate information requirement
model should be incorporated into the process. There should exist a unified understand-
ing of the information needed at each stage of cost estimation and the information should
be available already at the specified point of time. A practical method to facilitate sys-
tematic information availability is to create inquiry templates for different elements in-
cluded in the project scope and to specify at what time the templates are to be used. If
the inquiry is sent to early, there is a risk of it expiring and if it is sent to late, the accurate
information is not available to the cost estimator at the right time. The inquiry template
should in itself contain the information that should be asked to eliminate the lengthy pro-
cess of additional questions and support inquiries. Designing a stage-gate model for in-
formation requirement, which is supplemented by the inquiry templates is a path to lean
94
six sigma process improvement, increasing the quality of information and decreasing the
amount of rework and waiting time.
When it comes to six sigma philosophy, there is potential for reducing defects in cost
estimation by improving cost estimation tools used for certain elements oftentimes in-
cluded in the case company’s project scope and causing high project variance. Such
elements and work packages, with high cost estimation improvement potential, were
identified in the cost variance analysis in Chapter 6.3. Some additional improvement
possibilities include implementing modularity and standardize product portfolio. Portfolio
standardization is a way to decrease variance, and if it is possible to standardize or at
least have a handful of variants that the customer can choose from, the cost variance
can be potentially reduced (Lorenz et al., 2019).
The variance reduction is based on more accurate initial planning of standardized prod-
ucts as well as the established cost database for that product. Nevertheless, projects are
associated with unique custom-made solutions, so in order to facilitate organizational
learning and prevent information and knowledge losses, the information should be effec-
tively converted from tacit to explicit form via a standardized method of codification,
meaning that the information should be available and accessible to every employee
within the organization. Emphasis on knowledge management can address improving
the quality of the historical information database and the quality of the information flow
throughout the projects’ lifecycle.
The challenge of multi-unit project planning and preparation is already being taken on in
the company. Last autumn a new method of division of responsibilities was taken into
use that tackles the division of responsibilities in a more organized manner to prevent
omission of the elements from the cost estimate, or, on the opposite, double-counting of
the elements. The tool works as a checklist for the scope of the project, supporting the
process of cost estimation. Nonetheless, if the process itself is not organized, the tool is
not going to bring the expected benefits. Similar to the sales formula, there needs to exist
a formula for the cost estimation process, as the process is multifaceted, follows through
the whole project life-cycle and involves many stakeholders. And to organize such a pro-
cess in a systematic and efficient way, a set of guidelines is required, targeted at all the
project stakeholders participating either directly or indirectly in the process of cost esti-
mation.
Currently, the cost estimation process is not established as a system of its own, it follows
the needs of the project. According to the cost estimator in the case department, there
is not always a cost estimation strategy meeting, and the division of responsibilities is
95
checked only at the cost review phase. The cost estimator earlier stated that the cost
review meetings are not as effective as they could be and there are no documented
results from that meeting. To alleviate the load of content that must be covered during
the cost review meetings, it is advised to follow through with the cost estimation strategy
meetings and document the results, so that this document could be used later in the cost
review meeting. Furthermore, for the cost estimator, it is important to document the dis-
cussion that happens during the cost review, as the cost estimator must be able to obtain
a holistic picture of the situation, possible changes in the specification or requested quo-
tations. The extent of the quality of this information affects the quality of the aggregated
cost estimate as well as the viability of the price issued to the customer.
6.6 Synthesis of the proposed process improvement
The goal of the intervention is to influence the case company’s existing process of cost
estimation and enhance common understanding on the cost estimation across the or-
ganization. Based on the comparison of the existing cost estimation practices and the
best available practices, a process recommendation is suggested to the case company
that will increase the quality of the cost estimate through promoting knowledge manage-
ment as well as standardizing the process. The process recommendation is shown in
Figure 40. The figure illustrates the systematic process of cost estimation, which corre-
sponds to the stage of the project’s lifecycle.
Additionally, the figure elaborates on the role of the cost estimator during the implemen-
tation phase of the project lifecycle. The systematic and clearly-defined process, as well
as the clear definition of the roles, is currently lacking in the case department. In addition
to that, the milestones from the sales formula of the case company are projected onto
the developed process of cost estimation, and some additional milestones are defined
based on the information requirements during the process. The information requirements
are, for example, the detail and degree of completeness of the technical specification,
the quotations received from the contractors and suppliers as well as the developed and
revised project schedule.
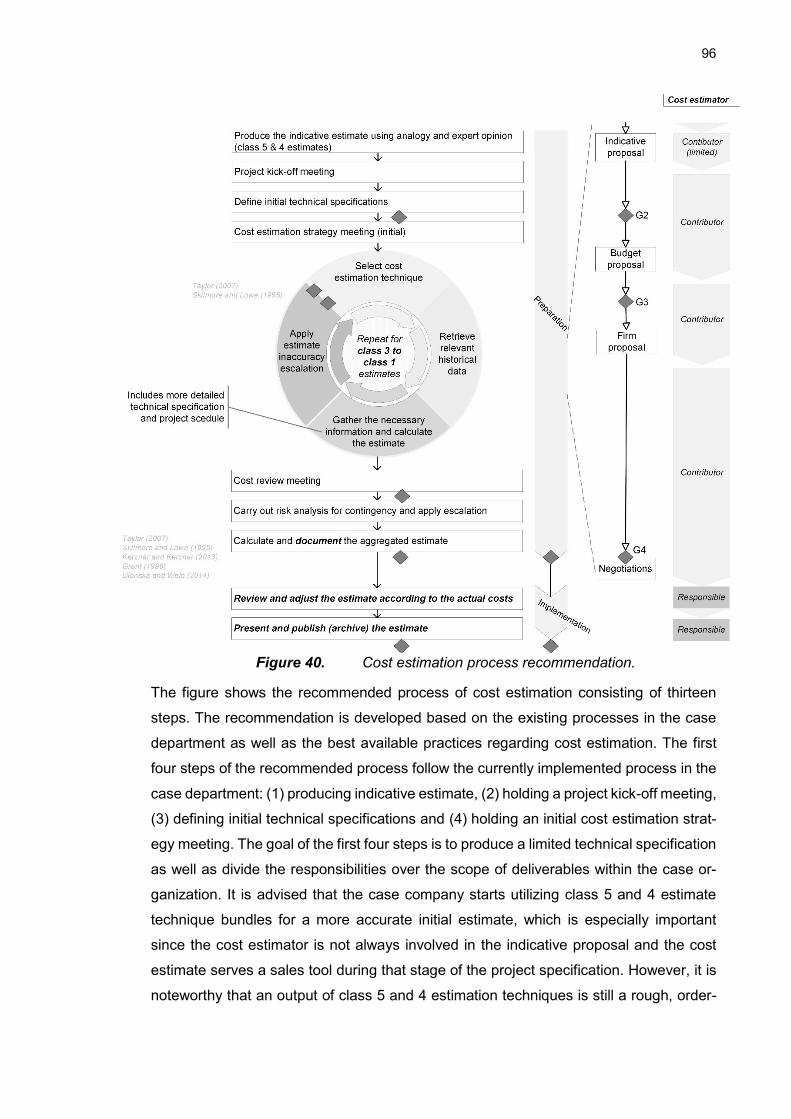
96
Figure 40. Cost estimation process recommendation.
The figure shows the recommended process of cost estimation consisting of thirteen
steps. The recommendation is developed based on the existing processes in the case
department as well as the best available practices regarding cost estimation. The first
four steps of the recommended process follow the currently implemented process in the
case department: (1) producing indicative estimate, (2) holding a project kick-off meeting,
(3) defining initial technical specifications and (4) holding an initial cost estimation strat-
egy meeting. The goal of the first four steps is to produce a limited technical specification
as well as divide the responsibilities over the scope of deliverables within the case or-
ganization. It is advised that the case company starts utilizing class 5 and 4 estimate
technique bundles for a more accurate initial estimate, which is especially important
since the cost estimator is not always involved in the indicative proposal and the cost
estimate serves a sales tool during that stage of the project specification. However, it is
noteworthy that an output of class 5 and 4 estimation techniques is still a rough, order-
97
of-magnitude estimate. Class 5 and 4 estimate technique bundle includes analogous
estimating and expert opinion, which support one another. If a good cost data archive is
available, a cost estimate from a similar in scope project can be attained and adjusted
based on the case-specific information using expert opinion.
The next stages of the cost estimate process that are not so clearly defined in the case
department include (5) selecting an appropriate cost estimate technique, (6) retrieving
historical data, (7) gathering the necessary supplementary information and (8) applying
the estimate inaccuracy escalation factor to the cost estimate. The selection of the esti-
mation method is discussed in detail in the previous chapter (see Figure 39), where dif-
ferent estimation techniques are suggested to be used by the case company. Through-
out the fifth to eighth stages of cost estimation, more precise, but at the same time, more
time- and resource-consuming techniques of cost estimation are used. The cycle is re-
peated twice, once for the class 3 estimate and once for the class 2 estimate. More
detailed technical specifications, as well as confirmation on the customer’s willingness
to invest in the project, serve as the justification for utilizing more resource-intensive es-
timation techniques. Class 3 estimates include techniques such as parametric estimation
and top-down estimation, followed by class 2 estimates, which include assembly and
deterministic estimates. Both class 3 and class 2 estimates can be used throughout the
budget proposal phase, although class 2 estimates already require rather specified pro-
ject design and schedule and take longer to compute, as both are bottom-down tech-
niques and are computed using the existing estimation template.
The next two stages (9) cost review meeting and (10) risk review and contingency anal-
ysis and (11) calculating and documenting the aggregated estimate are followed through
in the company. The recommendation regarding the cost review process is creating and
utilizing a check-list or a formal standardized procedure for reviewing the cost estimate.
Furthermore, if the cost strategy meeting is carried out and documented accordingly, the
documented division of responsibilities can be used as a template for tracking the
changes to the initial technical specification as well as checking whether each element
has been priced or whether some elements have been double-counted. Furthermore, it
is advised that the external project risks and the cost uncertainty risks are tracked sepa-
rately, allowing for future analysis of the suitability of the assigned contingency reserves
and the accuracy boundaries of the cost estimate at the firm proposal stage of the sales
project. It is strongly advised to create a standard format for a cost estimate report, which
should be used in the case department for archiving and analyzing historical data. Cur-
rently, there are no guidelines for creating a cost estimate report and all the reference
data has to be retrieved one by one from overloaded detailed estimate templates, which
98
are all dispersed across the data storage locations in the separate project folders. More-
over, there is no centralized source of reference project information, which would at least
indicate which project to search for. Creating such a database of project information,
including year, scope, status, location and budget cost (and actual cost if applicable),
would make it easier for all the cost estimators, engineers, product managers, and sales
managers to find a reference for their design and estimation work.
The concluding steps in the recommended process of cost estimation are (12) reviewing
and adjusting the estimate according to the actual costs and (13) publishing and archiv-
ing the estimate. These steps are not currently followed in the case company, meaning
that the cost estimator does not get feedback on the accuracy of their estimation, neither
they get an overview of the cost incurrence processes throughout project implementa-
tion. Furthermore, there is no final cost estimate report that includes the reference project
information, necessary unit cost data and pricing factors, case-specific assumptions,
which are invaluable sources of information for the cost data archive and future cost
estimates. The figure illustrates that according to the best available practices, the pro-
cess of cost estimation should be extended to the implementation phase of the project’s
lifecycle, alongside the responsibilities of the cost estimator. The cost estimator becomes
responsible for reviewing and adjusting the estimate according to the actual costs as well
as reporting and archiving the cost estimate. A sales manager and project manager act
as contributors during the adjustment and reporting stages of the cost estimate, as they
are able to provide deeper insights into the assumptions and ground rules used for the
estimate as well as the practicalities related to the actual costs, namely the reasons be-
hind the cost savings and overruns.
The cost estimation process includes milestones, the criteria for which should be fulfilled
before moving on to the next stage of the process. The stage-gate model, in that case,
is a method to adapt the process towards lean philosophy, preventing rework through
standardized process output requirements. The systematic standardized process re-
sponds to the challenge of information flow identified as a source of estimation inaccu-
racy by the case company’s cost estimator. The project stakeholders should also be
encouraged to obtain the highest quality information, by, for instance, introducing a set
of element-specific or work-package specific inquiry templates. Clearly defined infor-
mation requirements and milestones in the cost estimation process could assist in pre-
venting technical specification changes after the estimate’s completion. If the technical
specifications are changed, then there is a clearly defined need for reworking the esti-
mate. The changes to project scope are not avoidable, although, they can be mitigated,
99
especially at the early stages of project implementation, by specifying the link between
the design and the estimating process.
The quantitative cost variance analysis revealed the elements with the highest potential
for reducing project variance through improving the estimation procedures. Furthermore,
it became clear that it is practically impossible to trace the actual project costs from the
existing database, because of the flawed cost allocation and cost tracking. The cost es-
timate report, created at the end of project implementation would allow for easier cost
tracking, as the project manager and cost estimator collaborate to compare and analyze
the estimated and actual costs, while the project is still fresh in the memory for all the
project stakeholders. It would be beneficial for the cost estimator to participate in the final
project review, where the project manager presents the outcome of the project and the
areas, where delays and cost overruns occurred. This information is needed for the cost
estimator to get an overview of the accuracy of their estimates and for adjusting future
estimates. Additionally, the information from the project review meeting is a valuable
input into the cost estimate report.
Keeping a systematic archive of the cost estimate reports, as well as the unit cost infor-
mation, would reduce the time used to locate the information for the cost estimator, con-
tributing to making the process of cost estimation more lean. Additionally, an easily-ac-
cessible archive with processed data makes the estimate more reliable in terms of setting
the limits for risk reviews and bidding process, where the prices might be unrealistically
low due to competitive pressures. Having a historical chart of actual costs, which is
sorted by project type, scope, location and similar, could also serve as a learning curve
for the organization, resulting in the subsequent decrease of cost deviation with time.
The pricing factor archive, or unit cost archive also serves as a database to assess the
reliability of contractor pricing, which was identified as a source of inaccuracy in cost
estimating by the case company’s estimators.
100
7. DISCUSSION AND LESSONS LEARNED
7.1 Application of the framework in the case company
The framework developed throughout the survey of the best available practices and the
theory review (see Figure 30) consists of five elements that are worth considering in
isolation before overviewing the method in its entity. The five elements are (1) the pro-
cess of the cost estimation, (2) the internal foreseen risks, (3) framework for selecting a
cost estimation technique, (4) the split contingency reserve and (5) the cost estimate
report. First, the cost estimation process framework was used as a core for developing
the cost estimation method for the case company. The theoretical framework was ad-
justed with respect to the business-specific features in the case company.
Second, the category of the internal foreseen risks, which was defined in Chapter 3.3,
includes the pre-defined potential challenges relevant to the success of project execu-
tion, that are rooted within the organization. The internal foreseen risks include:
• Inadequate planning of resources,
• Unrealistic scheduling,
• Lack of information,
• Lack of systematic procedures,
• Lack of project prioritization, and
• Conflict of resources between the project within the organization.
These risks are gathered into one category from the surveyed existing and defined risk
categories (see Table 3). It is discussed that these risks are not to be mitigated with
contingency reserves, but with procedural improvements to the processes implemented
in the organization. In the case company, the most relevant risks are lack of information,
lack of systematic procedures and conflict of resources between projects. Lack of infor-
mation and systematic procedures is mitigated with the introduction of a defined cost
estimation process with milestones, that are to be completed before the next stage.
The conflict of resources is mitigated with a guideline to use an acceptable cost estima-
tion method at a corresponding stage of the process, which is the third element in the
developed framework. Utilization of less time-consuming methods at the stages, where
the accuracy demand is met, balances the resource utilization allowing the employees
to concentrate on other more pressing tasks. inadequate planning and unrealistic sched-
ule are not to be omitted, as, without quality planning, project success cannot be reached
101
in terms of meeting costs and schedule baselines. Quality planning is ensured by sys-
tematizing the process and defining the information requirements at each stage of the
process. Furthermore, systematic archives of information from previously implemented
projects, such as cost estimate reports and unit cost (or pricing factor) sheets reveal the
similarities between the projects and their scopes and support the planning efforts with
historical reference information.
Lack of information is mitigated by recognizing the importance of and implementing su-
perior knowledge management practices, in the form of documentation and archives. In
general, historical information is a prerequisite for a high-quality cost estimate, making it
imperative to ensure the availability of up-to-date and easily accessible information. The
fourth element of the framework suggests that the risk-related contingency costs should
be tracked separately from the cost uncertainty related contingency, making the accu-
racy boundaries and costs deviations due to external risk more transparent.
The major difference between the developed process and the existing process of cost
estimation in the case company is the latter steps, including adjusting and reporting the
estimate at the time of project completion. The fifth element of the developed framework
– cost estimate report, is an invaluable source of information for the cost estimator, as
they receive an overview of the project implementation process and actual costs. The
project review meetings, which are held by project managers, should include a brief anal-
ysis of the areas that were prone to cost overruns and cost savings and the reasons for
the cost deviations. Such information will assist the cost estimator in adjusting his work
and identifying focus areas during the project preparation phase.
7.2 Results of the intervention in the case company
The results were presented to the case company stakeholders to collect feedback and
opinions regarding the outcomes of the work. The feedback form is presented in Appen-
dix D: feedback collection form Altogether, six individuals provided their feedback re-
garding the procedural improvements suggested to the case company. The interviewed
individuals are the case company’s cost estimator, senior sales and technology man-
ager, project controller, engineering manager, and two product sales managers. Overall,
the suggestions were perceived as very useful in the context of the case company. It
was mentioned that some of the issues were presented in a new angle, raising thoughts.
Additionally, it was mentioned that the positive impact of the implementation of the sug-
gestions is achievable as long as the implementation is correctly enforced within the
company.
102
The suggestions are perceived as likely to be implemented, as long as there is a concrete
implementation plan as well as clearly defined responsibility for the implementation pro-
cess. Prioritizing the issues was an emphasized aspect. There are multiple suggestions
and the most fundamental ones should be defined within the company and implemented
first. The researcher is to consolidate the research into a handbook-type material and
present the findings to the whole department as well as to other departments within the
case company to obtain department-wide feedback and commit the employees to imple-
ment the process.
Some of the suggestions were identified as more important by the interviewees. The
case company’s cost estimator listed three suggestions that in their opinion should be
implemented:
1. developing and using tools that match the target of each estimation phase,
2. developing a cost estimation summary that is easy to utilize throughout the pro-ject implementation and post-implementation,
3. determining the cost uncertainty range at the firm proposal stage in the sales process of the case company.
The product sales manager emphasized the importance of the cost estimator getting
feedback and information on the accuracy of the estimates and an overview of incurred
costs throughout the project. The engineering manager emphasized the need for more
systematic pricing and the ability to trace the origin of individual costs, whether they are
estimates or figures received from the subcontractors. The project controller found inter-
esting the idea of splitting the risks into internal and project risks and tracking the contin-
gency for both separately and mentioned that this might help in cost tracking throughout
the project implementation.
Some of the areas of interest that were not included in this work were additionally iden-
tified. The concrete process formula with the guidelines was identified as one develop-
ment area. Improving the cost allocation throughout project implementation and making
historical data more reliable was another area requiring further investigation. Tools
needed to improve the effectiveness of cost estimation and aligning the cost estimation
structure with the actual cost structure are in need of further development. Overall, the
interviewed case company stakeholders found the work important and beneficial for the
case company and would like to see the development suggestions finalized and taken
into implementation.
103
7.3 Limitations of the paper and further research
Ali and Yusof (2011) examined trends and literature related to the quality of qualitative
research. The positivistic school of qualitative research assessed the research quality
across three aspects – validity, generalizability, and reliability (Ali and Yusof, 2011). Va-
lidity is concerned with selecting appropriate research questions, methods and ability to
provide a basis for the reached conclusions (Leung, 2015). Reliability stands for replica-
bility of the processes outlined in the research to reach the same conclusions and gen-
eralizability means the ability to extend the conclusions drawn from a sample to the whole
population (Ali and Yusof, 2011).
The quality assessment by the aforementioned three parameters received considerable
criticism, and another set of criteria for assessing the quality of qualitative research was
proposed to promote epistemological and ontological philosophies (Baxter and Eyles,
1997). The criteria are credibility, transferability, dependability, and confirmability. Cred-
ibility stands for unbiased, transparent and authentic representation of findings. Trans-
ferability is similar to generalizability, which stands for how well the results of the re-
search fit other cases outside the investigated sample. Dependability is similar to relia-
bility and refers to how easily the construct of the research can be applied to other cases.
Confirmability refers to the transparency of reasoning and a non-biased approach to re-
porting. Since the research philosophy employed in this study is pragmatism, which is a
combination of philosophies, the schools of assessing the quality of qualitative research
will also be combined.
To increase the overall quality of the research, the findings are reported in a transparent
manner, and the validity of qualitative data is ensured by avoiding personal interpretation
of the responses from interviewed members of the case company. The researcher em-
ploys the strategy of reflexivity by making a distinction between the personal observa-
tions and the information obtained through the interviews in order not to impact the va-
lidity of the results. Another method of ensuring data validity is through data triangulation.
Triangulation of quantitative and qualitative data is used to increase the validity, reliabil-
ity, credibility, and dependability of the research. The quantitative findings are confirmed
by the qualitative interviews and surveys conducted with the case company’s stakehold-
ers. The surveyed material is also triangulated by seeking multiple references for the
same claim. Theory triangulation was employed in this research to assess the evolution
of the concepts as well as ensure the validity of the concepts. Increasing the validity and
104
confirmability of the findings is attempted by gathering the feedback from the stakehold-
ers in the case company as well as the professors in the university and making subse-
quent necessary adjustments.
Generalizability and transferability are the limitations identified throughout this research.
The cost estimation processes, as well as the typical acceptable variance ranges, are
industry- and company-specific. It is mentioned throughout the research that the devel-
oped process recommendations are general and need to be adapted on a case-specific
basis, as was demonstrated on the example of the case company. The accuracy limits
of cost estimate are averaged across the published data from industrial project-based
firms. The limits are to be adjusted with experiential data as it becomes available. Con-
text specification is the researcher’s attempt to mitigate the generalizability and transfer-
ability limitations of this research. Additionally, the researcher provides a description of
the reasoning behind the findings, making it easier for the developed method to be
adapted to other contexts.
Another limitation of the paper relates to the nature of the information regarding cost
estimating and pricing. The publicly available information is published by governmental
organizations due to the budget and spend transparency criteria imposed upon them.
This makes the availability of industry-specific cost and estimation information limited,
thus the recommendation issued to the case company needs to be adjusted based on
the experiential data.
The data analysis conducted for the case company is based on the data retrieved from
the company’s ERP. The data validation was carried out through the selection of an
appropriate sample of project data. The projects included in the analysis had to have a
certain degree of recorded implemented costs, otherwise, the cost savings would be
falsely represented by the costs that are yet to be implemented. Excluding active projects
altogether would result in sampling bias and significantly limit data availability, as quite
a large share of relevant projects included in the analysis are still active. It follows that it
has to be ensured that the spending was recorded, and no new costs are likely to be
incurred. The quantitative analysis is validated through multiple reverse calculations as
well as the repetition of the analysis.
An additional limitation of this analysis regarding data validation lies within the cost track-
ing, as it is next to impossible to trace whether the costs were allocated to a proper cost
account or even to the correct project. Some costs may have been assigned to a wrong
element, skewing the validity of the data. Additionally, some costs may have been pur-
105
posefully distributed among the work packages or even other projects to decrease pro-
ject variance on paper. In light of the challenges with data validity, the variance analysis
is to be treated as a direction giving and not definitive. Substantial data availability in-
creases the validity of processed information in terms of compensating for and eliminat-
ing random errors, however, in case of systematic cost misallocation, the data should be
treated with a degree of skepticism. The information should be further validated from
project managers and other project stakeholders with first-hand experience and
knowledge of each project.
Due to the limitations of complete data validation in variance analysis, no definitive con-
clusions and recommendations were issued to the case company. The cost implemen-
tation data should be collected and recorded in an organized manner so that the variance
analysis by cost component and by the work package can be carried out successfully.
The variances can thereafter be classified by the type, scope or location of the project to
identify whether there are any geographic risks or technology risks that prevail in certain
areas. The organized cost data can be instrumental for creating learning curves by ele-
ment or work packages. The learning curves provide a comprehensive overview of the
cost data history as well as provide the direction for future pricing. According to the logic
of learning curves, the costs of elements should decrease with repeated implementation,
however, that is more applicable to the manufacturing industry. The validity of the learn-
ing curve method should be tested in the case company. Nonetheless, the learning curve
would represent the pricing trends, which are suitable for aiding cost estimation.
The method is based on the best available practices and was applied in one case com-
pany, making it difficult to draw conclusions about the transferability of the method. The
transferability of the method should further be tested in other project-based industrial
organizations, and whether the small adjustments in the process will be sufficient to
achieve working results. Additionally, further research regarding computer-aided cost
estimation and cost estimation software are required to ensure the timeliness of the
method developed in the paper. Literature suggested that computer software should be
actively used throughout the cost estimation process (Kesavan et al., 2009, p. 96; Hum-
phreys, 2005, p. 258; Dagostino and Peterson, 2011, p. 38; Stewart and Wyskida, 1987,
p. 489; Zhu et al., 2016; Peleskei et al., 2015; Galuzzo, 1991; Chang, 2013). However,
there is a lack of literature for such cost estimation software applicable in project busi-
ness. Due to the nature of projects and the degree of customization of the deliverables,
the suitability of existing cost estimating software for project business is to be studied
further.
106
8. CONCLUSION
Nowadays, to survive the fierce competition in the industrial B2B markets, companies
are seeking to differentiate their solutions through customizing and tailoring the offerings
to the customer needs. The customer-centric approach widens companies' product port-
folio and calls for a variety of expertise. A project is an organizational form supporting
the mobility of the expertise and competencies across the organization. Project business
is associated with challenges, namely due to the nature of projects as well as the non-
permanent structures. Each project is unique, and each project is temporary, making the
project planning challenging. For a successful sale of a project, it is imperative to max-
imize the customer's perceived value, which convinces them to invest in the supplier's
solution (Kotler and Keller, 2012). The supplier's profitability, however, cannot be forgot-
ten, as profits are essential for organizations to survive. The balance between the CPV
and the supplier’s profit is essential, and it is achievable through cost reductions in the
supplier’s operations, by ensuring the efficiency and effectiveness of the process and
quality control (Nicoletti, 2012; Bradley, 2015). The concepts of efficiency and effective-
ness lie in the heart of lean six sigma philosophy, aiming at eliminating ‘wastes’ and
defects in the business operations.
This thesis is an exploratory case study, where the researcher faces a problem related
to project cost variances. The senior sales and technology manager and the cost esti-
mator in the case organization want to ensure that the project costs are estimated cor-
rectly since cost estimation is the core of determining the project’s success as well as
the profitability of the organization. The main objective of this thesis was to develop a
method for reducing project cost variance by improving the quality of the cost estimation
process for a case company, which is an industrial project-based firm. A systematic
method, allowing for increased quality and potentially increased accuracy of the cost
estimation is a source of competitive advantage for the firm since it enables the company
to present competitively-viable prices to the customer without risking or compromising
its own profit margins.
The supporting research questions included identifying whether there exists a notion of
acceptable cost variance, investigating existing accepted project variance limits as well
as identifying concrete areas of improvement for the case company. The scope of the
case study was narrowed down to one department within the case company and to the
factors that are internal to the organization, rather than external and uncontrollable. The
research specifically concentrates on the sales phase of the project and on the process
107
of cost estimation as an area of project cost management. To reach the objectives of the
investigation, the researcher needed to submerge themselves into the daily operations
of the organization to gain a deep understanding of the current situation and processes
as well as the product portfolio.
For the purpose of meeting the objective of the thesis, a new risk category was intro-
duced. These risks are rooted within the firm and are not advised to be covered with
contingency reserve. Instead, based on the typical pitfalls and challenges of cost esti-
mation, root causes of project variance as well as the best available practices, a method
that mitigates these internal foreseen risks is developed. The main contribution of this
thesis is the proposed general method for increasing the quality of cost estimation and
subsequently reducing the project variance in the context of the project business. The
method addresses the challenges and pitfalls of the process of cost estimation described
in the literature. The reliability of the method was tested by applying the method to the
context of the case company.
The work emphasizes the importance of knowledge management for sustainable busi-
ness development as well as the role of a methodological and systematic approach
within a company. The importance of historical information in cost estimation and sales
is highlighted, and historical information was deemed especially important in the early
stages of cost estimation. With a good quality historical information archive, the initial
estimates are more accurate and lay a good fundament for subsequent estimation tech-
niques to build on. Furthermore, having the cost data archive eliminates the need to
create an estimate from the very beginning, saving cost estimator a significant amount
of time.
From a managerial perspective, this thesis sheds a light on the requirements for the cost
estimation process as an integral part of the sales process. The management is encour-
aged to promote the idea of systematic documentation, reporting and archiving, as well
as setting the information requirements for the stages of the cost estimation process
together with the cost estimator. The case company already has guidelines for the sales
and planning processes, but a comprehensive set of guidelines for the cost estimation
process is yet to be introduced. Cost estimation is a multifaceted discipline, requiring a
wide range of competencies, which in practice is achieved by gathering information from
other project members. Thus, it is recommended to demystify the importance of cost
estimation to all the internal stakeholders in the case organization in order to create an
understanding of the common practices and the standard quality of information that the
cost estimator needs. Making the process more lean requires elaborating on the infor-
mation requirements within the case organization. Additionally, it should be monitored
108
that the stages of cost estimation should be followed systematically and in order. Moving
past a milestone implies that all the previous stages have been completed.
From the theoretical point of view, this research offers an insight into project complexity
and ties together the individual elements of cost estimation methods, techniques and
processes to create a holistic framework on managing quality of cost estimation and
reducing the project variance. There is potential for further research in the areas of the
computer-aided cost estimation and its role in the context of project business. In addition,
the generalizability and transferability of the method are to be tested among other pro-
ject-based industrial firms to confirm the validity of the method. Even though the re-
searcher was able to adapt the method to the case firm, more context specification may
be required.
109
REFERENCES
AACE International. (2016). Cost Estimate Classification System – As Applied in Engineering, Procurement and Construction for the Process Industries, AACE Interna-tional Recommended Practice No. 18R-97, 15.
Abetti, P.A. (2002). From Science to Technology to Products and Profits. Super-conductivity at General Electric and Intermagnetics General (1960-1990), Journal of Business Venturing, Vol. 17(1), pp. 83-98.
Adithan, M. (2007). Process Planning and Cost Estimation, New Age International Ltd, 220 p.
Akintoye, A. (1998). Analysis of factors influencing project cost estimating practice, Construction Management and Economics (2000), Vol. 18, pp. 77-89.
Ali, A.M., Yusof, H. (2011). Quality in Qualitative Studies: The Case of Validity, Re-liability and Generalizability, Issues in Social and Environmental Accounting, Vol. 5(1/2), pp. 25-64.
Aliaga, O.A. (2000). Knowledge Management and Strategic Planning, Advances in Developing Human Resources, Vol. 2(1), pp. 91-104.
Angéniol, S., Gardoni, M., Yannou, B., Chamerois, R. (2005). Industrial Need to Improve Cost Integration in multi-criteria Decision During Design – Case Study at Air-bus and Eurocopter, International Conference on Engineering Design Iced 05 Mel-bourne, August 15-18.2005, 11 p.
Artto K., Martinsuo M., Kujala J. (2011). Project business – the project manage-ment textbook, Helsinki, Finland, available: http://pbgroup.tkk.fi/en/, (last accessed: 24.10.19).
Artto, K., Kujala, J. (2008). Project Business as a Research Field, International Journal of Managing Projects in Business, Vol. 1(4), pp. 469-497.
Asiedu, Y., Gu, P. (1998) Product life cycle cost analysis: State of the art review, International Journal of Production Research, Vol. 36(4), pp. 883-908.
Baratta, A. (2006). The triple constraint: a triple illusion. Conference paper, pre-sented at PMI® Global Congress 2006 – NA, Seattle, Washington. Project Manage-ment Institute Inc, USA.
Baxter, J., Eyles, J. (1997). Evaluating Qualitative Research in Social Geography: Establishing ‘Rigour’ in Interview Analysis, Transactions of the Institute of British Geog-raphers, Vol. 22(4), pp. 505-525.
Bhargava, A., Anastasopoulos, P.C., Labi, S., Sinha, K.C., Mannering, F.L. (2010). Three-Stage Least-Squares Analysis of Time and Cost Overruns in Construction Con-tracts, Journal of Construction Engineering and Management, Vol. 136(11), pp. 1207-1218.
Bhimani, A., Horngren, C.T., Datar, S.M., Rajan, M.V. (2019). Management & Cost Accounting, Pearson Education, 871 p.
110
Bradley, J.R. (2015). Improving Business Performance with Lean, Business Expert Press, LLC, 2nd edition, Ney York, 255 p.
Bragg, S. (2007). Management Accounting Best Practices: A Guide for the Profes-sional Accountant, John Wiley & Sons Inc., New Jersey, 283 p.
Broyles, R.W., Lay, C.M. (1982). Budgeting and Controllable Cost Variances, The case of Multiple Diagnoses, Multiple Services and Multiple Resources, Journal of Medi-cal Systems, Vol. 6(6), pp. 599-611.
Budiono, H.D.S., Kiswanto, G., Soemardi, T.P. (2014). Method and Model Devel-opment for Manufacturing Cost Estimation During the Early Design Phase Related to the Complexity of the Machining Processes, International Journal of Technology, Vol.2, pp. 183-192.
Burrell, G., Morgan, G. (1979). Sociological Paradigms and Organizational Analy-sis: Elements of the sociology of corporate life, Routledge, 2nd edition, 432 p.
Chang, A.S. (2002). Reasons for Cost and Schedule Increase for Engineering De-sign Projects, Journal of Management in Engineering, Vol. 18(1), pp. 29-36.
Chang, K. (2013). Product Manufacturing and Cost Estimating Using CAD/CAE, Chapter 6 – Product Cost Estimating, The Computer-Aided Engineering Design Series, Elsevier Inc., pp. 237-294.
Coe, J. M. (2004). The integration of direct marketing and field sales to form a new B2B sales coverage model, Journal of Interactive Marketing, 18, pp. 62–77.
D’Haen, J., Van den Poel, D. (2013). Model-supported business-to-business pro-spect prediction based on an iterative customer acquisition framework, Industrial Mar-keting Management, 42(4), pp. 544-551.
Dagostino, F.R., Peterson, S.J. (2011). Estimating in Building Construction, Pear-son Education Inc. publishing as Prentice Hall, 7th edition, New Jersey, 273 p.
Dao, B., Kermanshachi, S., Shane, J., Anderson, S., Hare, E. (2016). Identifying and measuring project complexity, International Conference on Sustainable Design, Engineering and Construction, Procedia Engineering, Vol. 145, pp. 476-482.
Dean, J. (1937). Correlation analysis of cost variation, The Accounting Review, Vol. 12(1), pp. 55-60.
Deetz, S. (1996). Describing Differences in Approaches to Organization Science: Rethinking Burrell and Morgan and Their Legacy. Organization Science, Vol. 7(2), pp. 191-207.
Dietrich, P., Järvenpää, E., Karjalainen, J., Artto, K. (2002). Successful manage-ment in multi-project environment, Helsinki University of Technology, TAI Research Centre, 11 p.
Doloi, H.K. (2010). Understanding stakeholders' perspective of cost estimation in project management, International Journal of Project Management, Vol. 29, pp. 622-636.
111
Doloi, H.K. (2013). Cost Overruns and Failure in Project Management: Under-standing the Roles of Key Stakeholders in Construction Projects, Journal of Construc-tion Engineering and Management, Vol. 139(3), pp. 267-279.
England, K., Moreci, J. (2012). Contingency—are you covered?, Paper presented at PMI® Global Congress 2012—North America, Vancouver, British Columbia, Can-ada. Newtown Square, PA: Project Management Institute.
Eriksson, P., Kovalainen, A. (2008). Qualitative Methods in Business Research, SAGE Publications Inc., 377 p.
Eriksson, P., Kovalainen, A. (2010). Case Study Research in Business and Man-agement, In Encyclopedia of Case Study Research, Sage Publications Inc., pp. 93-96.
Ferris, K.R. (1976). The Apparent Effects of Profit Forecast Disclosure on Manage-rial Behavior: An Empirical Examination, Journal of Business Finance & Accounting, Vol. 3(3), pp. 53-66.
Flyvbjerg, B., Holm, M.S., Buhl, S. (2002). Underestimating Costs in Public Works Projects – Error or Lie?, Journal of American Planning Association, Vol. 68(3), pp. 279-295.
Galluzzo, J.F. (1991). Database Development and Computerized Cost Estimating, Cost Engineering, Vol. 33(12), pp. 9-13.
Gann, D.M., Salter, A.J. (2000). Innovation in project-based, service-enhanced firms: the construction of complex products and systems, Research Policy, Vol. 29(7), pp. 955-972.
GAO. (2009). Cost Estimating and Assessment Guide – Best Practices for Devel-oping and Managing Capital Program Costs, United States Government Accountability Office, GAO-09-3SP, 420 p.
Gebauer, H., Gustafsson, A., Witell, L. (2011). Competitive advantage through ser-vice differentiation by manufacturing companies, Journal of Business Research, Vol. 64(12), pp. 1270-1280.
Goh, J., Hall, N.G. (2013). Total Cost Control in Project Management via Satisfic-ing, Management Science, Vol. 59(6), pp. 1354-1372.
Gonçalves, T., Gaio, C., Silva, M. (2018). Target costing and innovation-explora-tory configurations: A comparison of fsQCA, multivariate regression, and variable clus-ter analysis, Journal of Business Research, Vol. 89, pp. 378-384.
Grant, R.M. (1996). Toward a Knowledge-Based Theory of the Firm, Strategic Management Journal, Vol. 17 (Winter Special Issue), pp. 109-122.
Gummesson, E. (1993). Case Study Research in Management: Methods for Gen-erating Qualitative Data, Stockholm University, Department of Business Administration, 61 p.
Hake, R.B. (1991). Management of Technology, Engineering Management Jour-nal, Vol. 1(3), June 1991, pp. 109-114.
Havranek, T. (2017). Modern project management techniques for the environmen-tal remediation industry, CRC Press, 456 p.
112
Hazir, Ö., Shtub, A. (2011). Effects of the Information Presentation on Project Con-trol, The Journal of the Operational Research Society, Vol. 62(12), pp. 2157-2161.
Healy, P.L. (1998). Project Management: Getting the Job Done on Time and in Budget, Elsevier Ltd., 300p.
Hicks, J.C. (1992). Heavy Construction Estimates, With and Without Computers, Journal of Construction Engineering and Management, Vol. 118(3), pp. 545-560.
Hillson, D. (2002). Use a risk breakdown structure (RBS) to understand your risks. Paper presented at Project Management Institute Annual Seminars & Symposium, San Antonio, TX. Newtown Square, PA: Project Management Institute.
Jääskeläinen, A., Heikkilä, J. (2019). Purchasing and supply management prac-tices in customer value creation, Supply Chain Management: An International Journal, Emerald Publishing, https://doi.org/10.1108/SCM-04-2018-0173.
Järvinen, J., Taiminen, H. (2015). Harnessing marketing automation for B2B mar-keting, Industrial Marketing Management, Vol. 54, 2016, pp. 164-175.
Jönsson, S., Lukka, K. (2007). There and back again: doing interventionist re-search in management accounting, in: Handbook of management accounting research, Vol. 1, Elsevier, pp. 373-413.
Jørgensen, M., Halkjelsvik, T., Kitchenham, B. (2012). How does project size affect cost estimation error? Statistical artifacts and methodological challenges, International Journal of Project Management, Vol.30, pp. 839-849.
Joshi, M.S. (2003). The Concepts and Practice of Mathematical Finance, Cam-bridge University Press, 2nd edition, the UK, 539 p.
Kähkönen, K., Artto, K., Karjalainen, J., Martinsuo, M., Poskela, J. (2008). Man-agement of uncertainty. Course material for Management of Uncertainty course, Hel-sinki University of Technology, Department of Industrial Engineering and Management.
Kaplan, R.S. (1975). The Significance and Investigation of Cost Variances: Survey and Extensions, Journal of Accounting Research, Vol. 3(2), pp. 311-337.
Kaya, O., Catic, A., Bergsjo, D. (2014). Global Project Management Using Digital Pulse Methodology, International Association for Management of Technology IAMOT 2014 Proceedings, 11 p.
Kerzner, H., Kerzner, H.R. (2013). Project Management: A Systems Approach to Planning, Scheduling and Controlling, 11th edition, John Wiley & Sons Inc., USA, 1296 p.
Kesavan, R., Elanchezhian, C., Vijaya Ramnath, B. (2009). Process Planning and Cost Estimation, New Age International, 2nd edition, New Delhi, 229 p.
Kotler, P., Keller, K.L. (2012). A Framework for Marketing Management, 6th edi-tion, Pearson Education Ltd, 344 p.
Kujala, S., Artto, K., Aaltonen, P., Turkulainen, V. (2010). Business models in pro-ject-based firms – Towards a typology of solution-specific business models, Interna-tional Journal of Project Management, Vol. 28(2), pp. 96-106.
113
Kwon, H., Kang, C.W. (2018). Improving Project Budget Estimation Accuracy and Precision by Analysing Reserves for both Identified and Unidentified Risks, Project Management Journal, Vol. 50(1), pp. 1-15.
Lancaster, G. (2005). Research Methods in Management, Elsevier Butterworth-Heineman, 258 p.
Leung, L. (2015). Validity, reliability, and generalizability in qualitative research, Journal of family medicine and Primary care, Vol 4(3), pp. 324-327.
Lippitt, G.L., Lippitt, R. (1978). The Consulting Process in Action, San Diego, CA: University Associates, 130 p.
Lorenz, A., Raven, M., Blind, K. (2019). The role of standardization at the interface of product and process development in biotechnology, Journal of Technology Transfer, Vol. 44, pp. 1097–1133.
Love, P.E.D., Wang, X., Sing, C., Tiong, R.L.K. (2013). Determining the Probability of Project Cost Overruns, Journal of Construction Engineering and Management, Vol. 139(3), pp. 321-330.
Lowe, D., Skitmore, M.R. (1994). Experiential Learning in Cost Estimating, Con-struction Management and Economics, Vol. 12(5), pp. 423-431.
Margulies, N., Raia, A.P. (1972). Organization Development: Values, Processes and Technology, McGraw Hill, 640 p.
Martinsuo, M. (2011). Uncertainty and complexity in the management of project business, Unpublished Teaching Material for Management of Project Business Course, Tampere University of Technology, Department of Industrial Management, 160 p.
Meso, P., Smith, R. (2000). A resource-based view of organizational knowledge management systems, Journal of Knowledge Management, Vol. 4(3), pp. 224-234.
Ministry of Transportation and Infrastructure (MOTI). (2013). Project Cost Estimat-ing Guidelines, Project Management Support Services, Version 01.02, 30 September 2013, 36 p.
Mislick, G.K., Nussbaum, D.A. (2015). Cost Estimation: Methods and Tools, John Wiley & Sons Inc., New Jersey, 311 p.
Munier, N. (2014). Risk Management for Engineering Projects: Procedures, Meth-ods and Tools, Springer, 220 p.
NASA. (2011). NASA: Risk Management Handbook, NASA/SP-2011-3422, Ver-sion 1.0, November 2011, Washington D.C., 234 p.
NASA. (2015). Cost Estimating Handbook, NASA CEH, February 2015, Version 4.0, Washington DC, 52 p.
NASA. (2018). NASA Work Breakdown Structure (WBS) Handbook, National Aero-nautics and Space Administration (NASA), January 2018, Revision B, Washington D.C., 58 p.
Nicoletti, B. (2012). Lean and Digitize: An Integrated Approach to Process Im-provement, Routledge and Taylor & Francis Group, London and New York, 216 p.
114
Nigel, P., Nikala, L. (2009). Strategic Customer Management: Strategizing the Sales Organization, Oxford University Press, New York, 356 p.
Nonaka, I. (1991). The Knowledge-creating Company, Harvard Business Review, November-December 1991, pp. 96-104.
Norman, E.S., Brotherton, S.A., Fried, R.T. (2008). Work Breakdown Structures: The Foundation for Project Management Excellence, John Wiley & Sons Inc. and Pro-ject Management Institute (PMI), 286 p.
OECD/OAS (2002), Public Sector Transparency and Accountability: Making it Hap-pen, OECD Publishing, Paris, 210 p.
Parviz, R.F. (2002). Project Estimating and Cost Management, Management Con-cepts Inc., 191 p.
Peleskei, G.A., Dorca, V., Munteanu, R.A., Munteanu, R. (2015). Risk Considera-tion and Cost Estimation in Construction Projects Using Monte Carlo Simulation, Man-agement, Vol. 10(2), pp. 163-176.
Pinto, J.K. (2016). Project Management: Achieving Competitive Advantage, Pear-son Education Inc., 4th edition, 542 p.
Pinto, J.K., Rouhiainen, P. (2001). Building Customer-Based Project Organization, John Wiley & Sons Inc., 220 p.
Prince2 Guidance, (2017). Managing Successful Projects with PRINCE2®, The Stationery Office (TSO), 405 p.
Project Management Institute (PMI). (2001) A guide to the project management body of knowledge (PMBOK®), 2000 edition, Project Management Institute Inc., USA, 211 p.
Project Management Institute (PMI). (2006). Practice Standard for Work Break-down Structures, Project Management Institute Inc., 2nd edition, 111p.
Project Management Institute (PMI). (2017). A guide to the Project Management Body of Knowledge (PMBOK® Guide), 6th edition, Project Management Institute Inc., USA, 592 p.
Queensland Government. (2017). Project Cost Estimating Manual (PCEM), De-partment of Transport and Main Roads, State of Queensland, July 2017, 7th edition, 135 p.
Rajkumar, R., Kerr, C. (2013). Cost Engineering: Why, What and How?, Decision Engineering Report Series, Cranfield University, UK, 39 p.
Rodger, C., Petch, J. (1999). Uncertainty and Risk Analysis: A practical guide from Business Dynamics, Business Dynamics, PricewaterhouseCoopers, MCS, 46 p.
Rush, C., Roy, R. (2000). Analysis of cost estimating processes used within a con-current engineering environment throughout a product life cycle, 7th ISPE International Conference on Concurrent Engineering: Research and Applications, Lyon, France, July 17th - 20th, Technomic Inc., Pennsylvania USA, pp. 58-67.
115
Saunders, M., Lewis, P., Thornhill, A. (2009). Research Methods for Business Stu-dents, Prentice Hall, 5th edition, 614 p.
Shane, J.S., Molenaar, K.R., Anderson, S., Schexnayder, C. (2009). Construction Project Cost Escalation Factors, Journal of Management in Engineering, Vol. 25(4), pp. 221-229.
Shehu, Z., Endut, I.R., Akintoye, A-. Holt, G.D. (2014). Cost Overrun in The Malay-sian Construction Industry Projects: A Deeper Insight, International Journal of Project Management, Vol. 32, pp. 1471-1480.
Siegelaub, J. M. (2007). Six (yes six!) constraints: an enhanced model for project control. Paper presented at PMI® Global Congress 2007—North America, Atlanta, GA. Newtown Square, PA: Project Management Institute.
Skitmore, R.M., Lowe, D.J. (1992). Human Factors in Estimating, in Estimating Capital Costs of Projects, ed. Smith, N.J., Institute of Civil Engineers / Thomas Telford, London, pp. 91-100.
Stenberg, K., Rajan, D. (2016). Strategizing National Health in the 21st Century: a Handbook, Chapter 7, Estimating Cost Implications of a National Health Policy, Strat-egy or Plan, World Health Organization (WHO), 53 p.
Stewart, R., Wyskida, R.M. (1987). Cost Estimator’s Reference Manual, John Wiley & Sons Inc, Canada, 620 p.
Tanaka, M., Yoshikawa, T., Innes, J., Mitchell, F. (1993). Contemporary Cost Man-agement, Chapman & Hall, UK, 185 p.
Taylor, J. (2007). Project Scheduling and Cost Control: Planning, Monitoring and Controlling the Baseline, J. Ross Publishing, 313 p.
Torp, O., Klakegg, O.J. (2016). Challenges in Cost Estimation Under Uncertainty – A Case Study of the Decommissioning of Barsebäck Nuclear Power Plant, Administra-tive Sciences, Vol. 6(14), 21 p.
Töytäri, P., Brashear, A., Parvinen, P., Ollila, I., Rosendahl, N. (2011). Bridging the theory to application gap in value-based selling, Journal of International Business & In-dustrial Marketing, Vol. 26(7), pp. 493-502.
U.S. Department of Energy (DOE). (2011). Cost Estimating Guide, DOE G 413.3-21, Washington DC, 170 p.
US Department of Defence (DoD). (2010). United Facilities Criteria (UFC), Hand-book: Construction Cost Estimating, UFC 3-740-05, 8 November 2010, 103 p.
Venkataraman, R.R., Pinto, J.K. (2008). Cost and Value Management in Projects, John Wiley & Sons Inc., 289 p.
Washington State Department of Transportation (WSDOT). (2015). Cost Estimat-ing Manual for Projects, M 3034.03, Engineering and Regional Operations, April 2015, 58 p, available at: https://www.wsdot.wa.gov/publications/manuals/fulltext/M3034/Esti-matingGuidelines.pdf.
Whitley, R. (2006). Project-based firms: new organizational form or variations on a theme?, Industrial and Corporate Change, Vol. 15(1), pp. 77-99.
116
Wright, T.P. (1936). Factors Affecting the Cost of Airplanes, Journal of the Aero-nautical Sciences, Vol. 3, pp. 122-128.
Wuest, T., Liu, A., Lu, S.C.-Y., Thoben, K.-D. (2014). Application of the Stage-Gate Model in Production Supporting Quality Management, Variety Management in Manu-facturing, Procedia CIPR 14, Elsevier, pp. 32-37.
Yin, R.K., Campbell, D.T. (2003). Case study research: design and methods, Sage Publications, 3rd edition, 181 p.
Zhu, B., Yu, L., Geng, Z. (2016). Cost estimation method based on parallel Monte Carlo simulation and market investigation for engineering construction project, Cluster Computing, Vol.19, pp. 1293-1308.
Zhu, Z., Hsu, K., Lillie, J. (2001). Outsourcing – a strategic move: the process and the ingredients for success, Management Decision, Vol. 39(5), pp. 373-378.
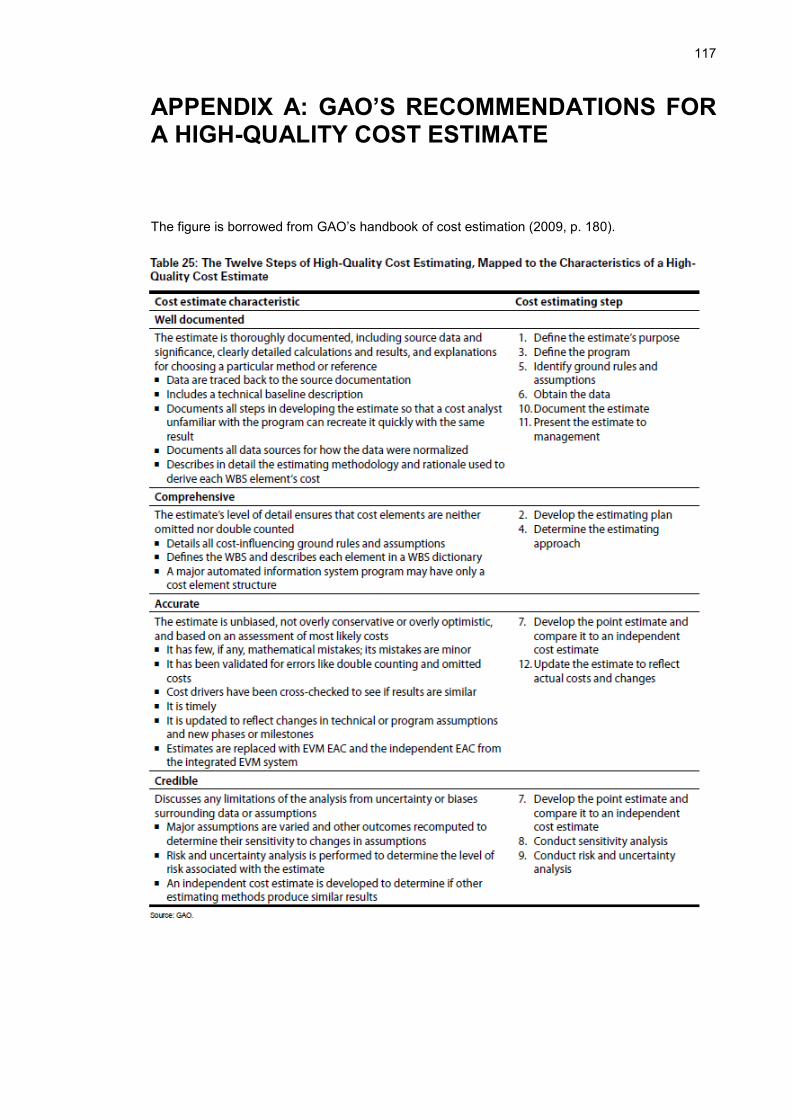
117
APPENDIX A: GAO’S RECOMMENDATIONS FOR A HIGH-QUALITY COST ESTIMATE
The figure is borrowed from GAO’s handbook of cost estimation (2009, p. 180).
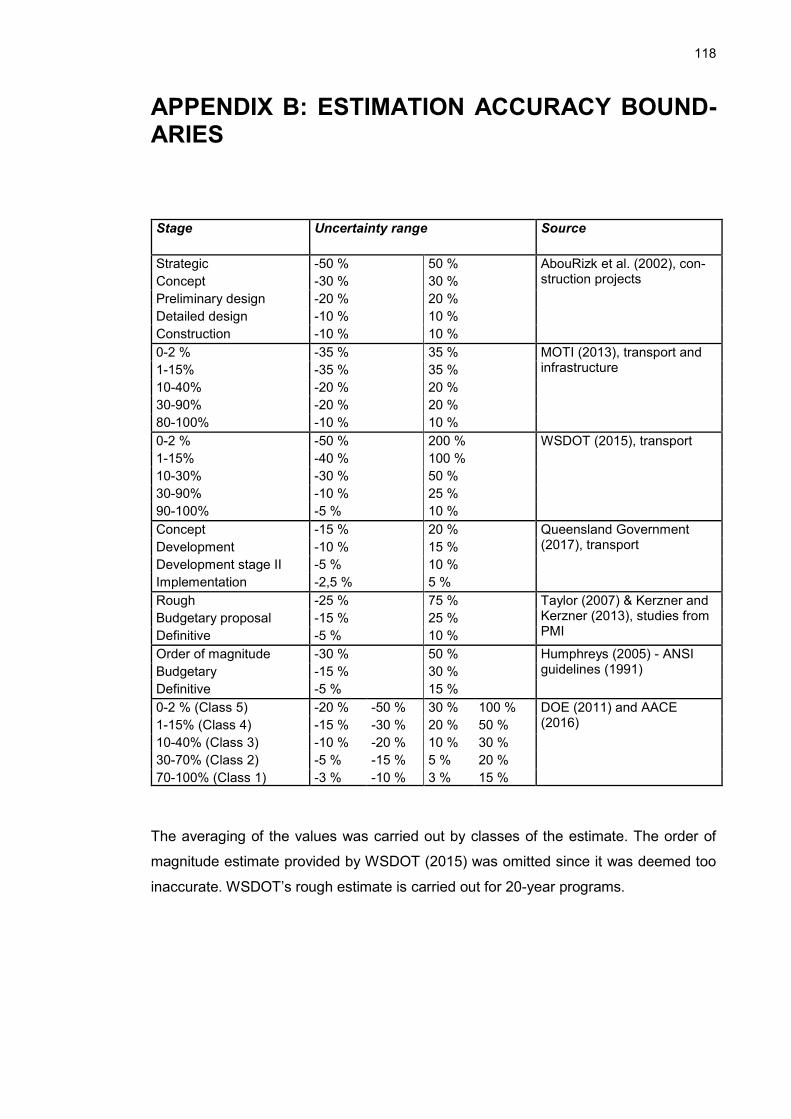
118
APPENDIX B: ESTIMATION ACCURACY BOUND-ARIES
Stage Uncertainty range Source
Strategic -50 % 50 % AbouRizk et al. (2002), con-struction projects Concept -30 % 30 %
Preliminary design -20 % 20 %
Detailed design -10 % 10 %
Construction -10 % 10 %
0-2 % -35 % 35 % MOTI (2013), transport and infrastructure 1-15% -35 % 35 %
10-40% -20 % 20 %
30-90% -20 % 20 %
80-100% -10 % 10 %
0-2 % -50 % 200 % WSDOT (2015), transport
1-15% -40 % 100 %
10-30% -30 % 50 %
30-90% -10 % 25 %
90-100% -5 % 10 %
Concept -15 % 20 % Queensland Government (2017), transport Development -10 % 15 %
Development stage II -5 % 10 %
Implementation -2,5 % 5 %
Rough -25 % 75 % Taylor (2007) & Kerzner and Kerzner (2013), studies from PMI
Budgetary proposal -15 % 25 %
Definitive -5 % 10 %
Order of magnitude -30 % 50 % Humphreys (2005) - ANSI guidelines (1991) Budgetary -15 % 30 %
Definitive -5 % 15 %
0-2 % (Class 5) -20 % -50 % 30 % 100 % DOE (2011) and AACE (2016) 1-15% (Class 4) -15 % -30 % 20 % 50 %
10-40% (Class 3) -10 % -20 % 10 % 30 %
30-70% (Class 2) -5 % -15 % 5 % 20 %
70-100% (Class 1) -3 % -10 % 3 % 15 %
The averaging of the values was carried out by classes of the estimate. The order of
magnitude estimate provided by WSDOT (2015) was omitted since it was deemed too
inaccurate. WSDOT’s rough estimate is carried out for 20-year programs.
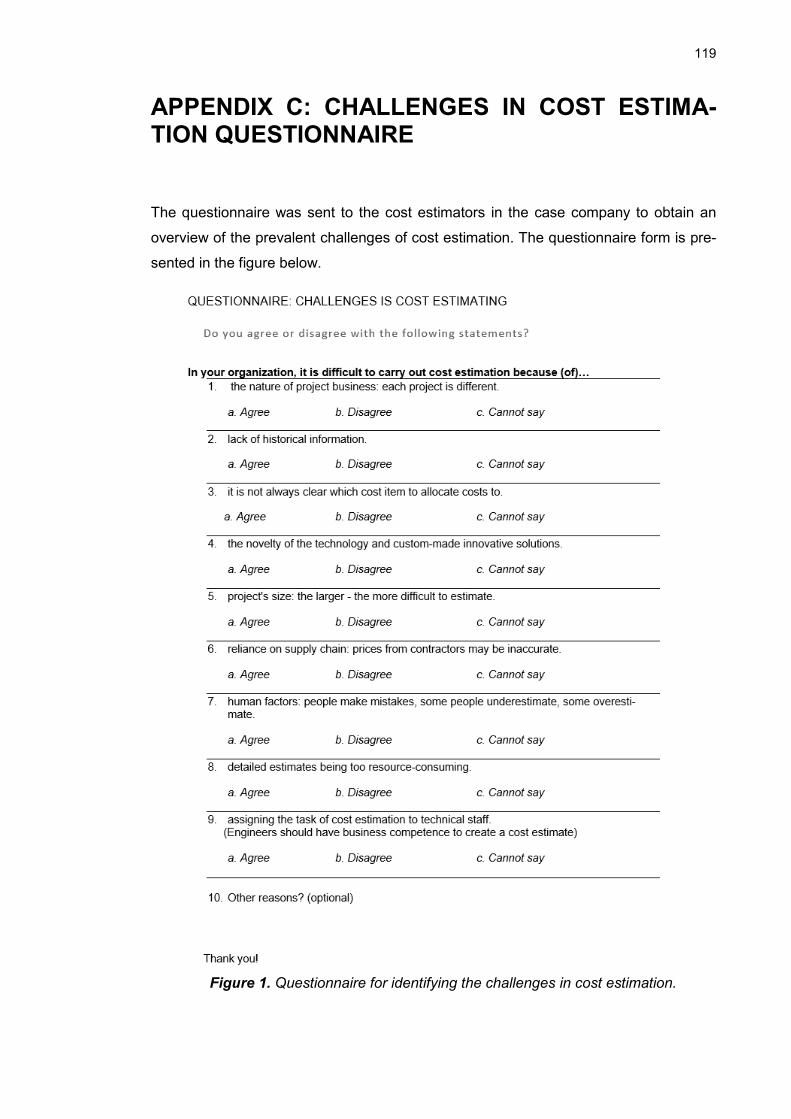
119
APPENDIX C: CHALLENGES IN COST ESTIMA-TION QUESTIONNAIRE
The questionnaire was sent to the cost estimators in the case company to obtain an
overview of the prevalent challenges of cost estimation. The questionnaire form is pre-
sented in the figure below.
Figure 1. Questionnaire for identifying the challenges in cost estimation.
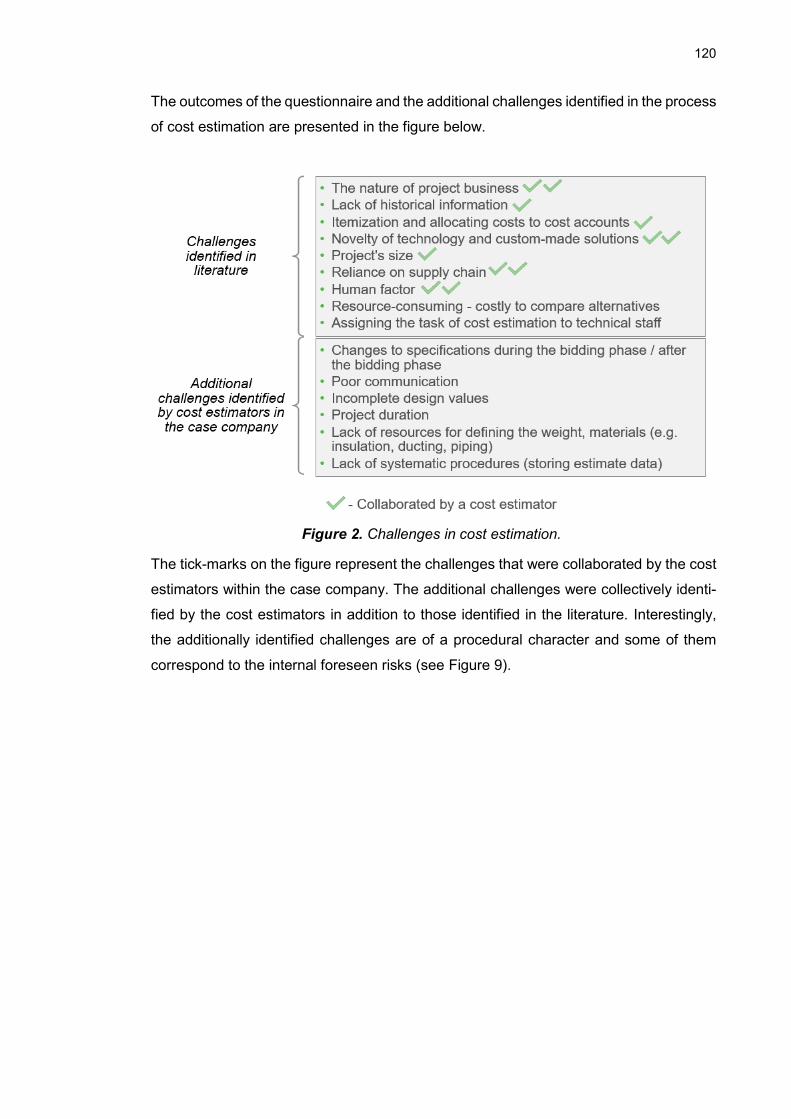
120
The outcomes of the questionnaire and the additional challenges identified in the process
of cost estimation are presented in the figure below.
The tick-marks on the figure represent the challenges that were collaborated by the cost
estimators within the case company. The additional challenges were collectively identi-
fied by the cost estimators in addition to those identified in the literature. Interestingly,
the additionally identified challenges are of a procedural character and some of them
correspond to the internal foreseen risks (see Figure 9).
Figure 2. Challenges in cost estimation.
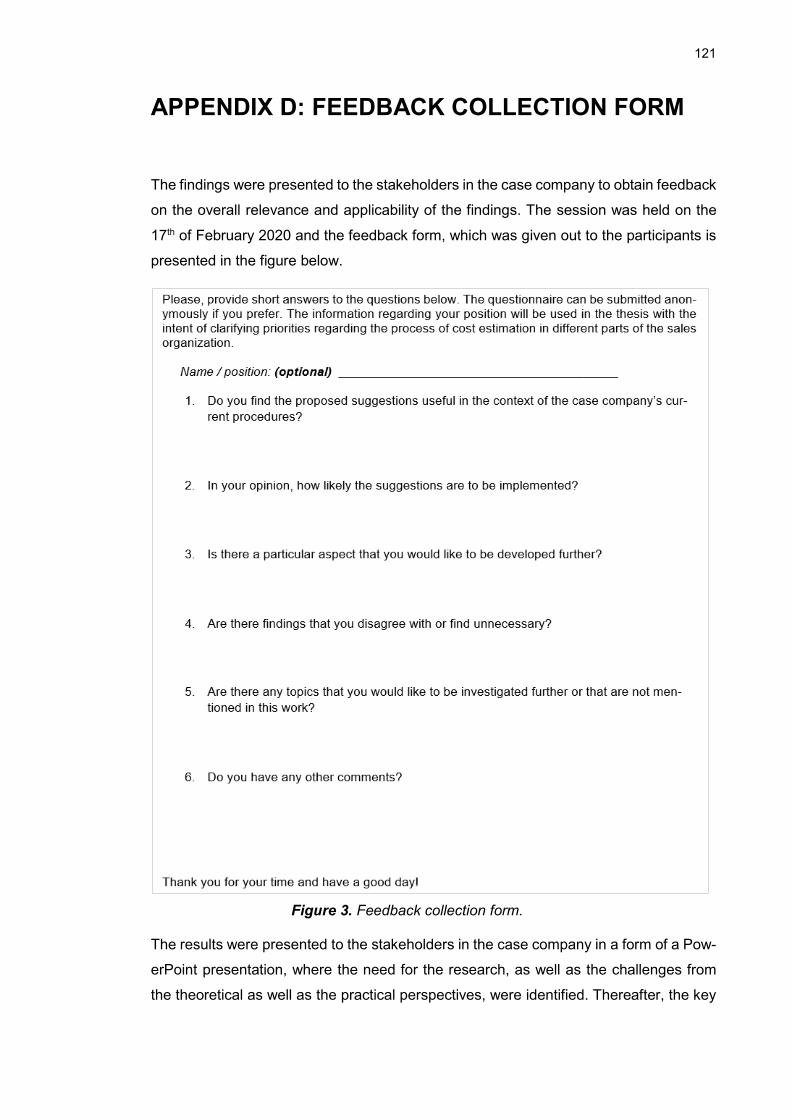
121
APPENDIX D: FEEDBACK COLLECTION FORM
The findings were presented to the stakeholders in the case company to obtain feedback
on the overall relevance and applicability of the findings. The session was held on the
17th of February 2020 and the feedback form, which was given out to the participants is
presented in the figure below.
The results were presented to the stakeholders in the case company in a form of a Pow-
erPoint presentation, where the need for the research, as well as the challenges from
the theoretical as well as the practical perspectives, were identified. Thereafter, the key
Figure 3. Feedback collection form.
122
theoretical findings were introduced, namely the accuracy boundaries of the cost esti-
mation alongside the guidelines for selecting appropriate techniques of cost estimation
as well as the process guidelines. Then, an overview of the challenges within the case
department was introduced, after which the theoretically developed procedural improve-
ment modified to the context of the case department was introduced and explained.
In addition, the methodology and the outcomes of the data analysis carried out through
the research process were presented to the case company’s stakeholders. The project
manager, among others, mentioned that the historical data cannot be relied on since the
cost tracking throughout the projects are not done in accordance with the account struc-
ture used to create the project’s budget. Although, as was discussed, the data analysis
is a direction-giving, rather than definitive as a result of analyzing a substantial amount
of data.
The feedback provided by the case company stakeholders is listed below:
1. Do you find the proposed suggestions useful in the context of the case company’s
current procedures?
- Very useful
o The three recommendations should be implemented:1) developing and
using tools that match the target of each estimation phase; 2) developing
a cost estimate summary for the ease of comparison of the budgeted and
actual costs; 3) determining the cost uncertainty range at the firm proposal
stage.
- Useful as long as the responsibility of implementing the changes and enforcing
the changes is assigned within the case department
- Interesting suggestions, some of them from a new angle. Raised thoughts.
- Definitely useful, especially the estimation process and the techniques.
2. In your opinion, how likely the suggestions are to be implemented?
- Very likely
- Should be very likely
- Very likely, another question is enforcing the changes and getting everyone to
work according to the improved procedures.
- Probably not all of them, but some.
- Should be 100%, but we should focus on priorities first.
123
3. Is there a particular aspect that you would like to be developed further?
- Cost review and follow up process, uncertainty ranges.
- The idea of splitting the risks into internal and project risks was a good idea and
might help in following up on the costs.
- Tracking the individual costs and their origin: is it an estimate or is it an exact
figure provided by a contractor.
- Feedback from project implementation to cost estimation.
- Pricing tools and ways of working. Using reference data instead of the guessti-
mates (where applicable). Focusing on the high impact and big variances – how
to improve those.
4. Are there findings that you disagree with or find unnecessary?
- No
5. Are there any topics that you would like to be investigated further or that are not
mentioned in this work?
- No, the most critical ones are presented in the work.
- Creating a process and guidelines to it, but that is another project.
- We cannot rely on historical data 100% because the cost allocation is usually not
done correctly.
- How to make ways of working more effective? Improving the tools for cost esti-
mation and the processes involved in cost estimation. Cost account structure in
budgeting and throughout project implementation.
6. Do you have any other comments?
- Excellent work.
- Very good job and professional output.
- Very important work. I’d like to see the pricing done more systematically.
- The practical part of the thesis is very well done.


