Embed Size (px)
Citation preview
Journal of Nuclear Materials 418 (2011) 261–268
Contents lists available at ScienceDirect
Journal of Nuclear Materials
journal homepage: www.elsevier .com/ locate / jnucmat
Properties of Helium bubbles in Fe and FeCr alloys
A. Caro a,⇑, J. Hetherly a, A. Stukowski b, M. Caro a, E. Martinez a, S. Srivilliputhur c, L. Zepeda-Ruiz b,M. Nastasi a
a Los Alamos National Laboratory, Los Alamos, NM 87544, United Statesb Lawrence Livermore National Laboratory, Livermore, CA 94550, United Statesc Department of MS&E, University of North Texas, Denton, TX 76203-5017, United States
a r t i c l e i n f o a b s t r a c t
Article history:Received 28 March 2011Accepted 9 July 2011Available online 23 July 2011
0022-3115/$ - see front matter � 2011 Elsevier B.V. Adoi:10.1016/j.jnucmat.2011.07.010
⇑ Corresponding author.E-mail address: [email protected] (A. Caro).
We investigate three aspects of He that are relevant for its behavior in FeCr alloys. (i) the EOS of pure He,as an auxiliary element to relate pressure and density inside a bubble; (ii) He bubbles in FeCr alloys, toexplore the influence of Cr as solute and at a0 precipitates on the He precipitation behavior; (iii) thegrowth mechanism of a He bubble in Fe and Fe 15 at% Cr under the particular conditions of a He-richand vacancy poor environment. This last case represents an extreme situation that reveals the maximumpressures that can be achieved by a bubble before the matrix yields. We observe the emission of inter-stitial dislocation loops as the mechanisms by which the bubble creates room to host the He atoms.We use molecular dynamics and Monte Carlo computer simulations based on a new ternary FeCr–Heempirical potential, which is an extension of our previous composition-dependent model for FeCr(A. Caro et al., Phys. Rev. Lett. 95 (2005) 075702).
� 2011 Elsevier B.V. All rights reserved.
1. Introduction
Iron–chromium ferritic steels are of great technological impor-tance due to their swelling, corrosion, and creep resistance [1,2].The precise origin of many of these beneficial features is the sub-ject of intense current research. Anomalously high Cr solubilityat low temperatures [3–5] was recently interpreted in terms ofthe change in sign of the heat of formation of the alloy [6,7]. ForCr compositions above �10 at%, a0 precipitates are responsible ofboth the creep resistance at high temperatures and embrittlementat low temperatures. Within the solid solution regime, a minimumin swelling as a function of Cr content around 6 at% Cr has beenreported, and an explanation in terms of defect mobilities in thealloys has been proposed [8].
To understand the complex behavior of this alloy a number offirst-principles studies [9–12] addressed the energetics of this sys-tem. These calculations revealed a change of sign in the heat of for-mation of the solution from negative to positive as Cr compositionincreases from zero to above �10 at% Cr. Detailed analysis of theorigin of this anomaly showed that, while the heat of solution ofa Cr impurity in Fe is large and negative, as Cr compositionincreases magnetic frustration leads to a strong Cr–Cr repulsion,causing the heat of formation to assume large positive values.
These advances in the understanding of the energetics of Fe–Cralloys have provided the basis for the development of interatomic
ll rights reserved.
potentials that enable large-scale simulations of the microstructuralevolution. Two approaches, known as the two band model TBM [13]and the composition dependent model CD-EAM [14], were devel-oped both addressing the complex shape of the heat of formationcurve at 0 K as determined from the aforementioned first-principlescalculations. Using the composition dependent model, we recentlystudied the implications of the change in sign of the heat of forma-tion on the thermodynamic behavior at finite temperatures andproposed a modified phase diagram for Fe–Cr in the region of lowCr content and temperatures below both the Curie temperatureand the range of existence of the r-phase [15]. In fact, comparedto the CALPHAD assessment [16], which is based on the assumptionof a subregular binary mixture, a better agreement with the experi-mental location of the solvus was obtained.
In this paper we extend the FeCr CD-EAM to include He andreport our findings on He bubble properties. We study the equationof state, EOS, of pure He and the EOS of He in both pure Fe and FeCralloys and analyze how the He–Fe interaction modifies the EOS ofpure He. We also study He bubbles at two particular densities,namely, that corresponding to substitution of Fe by He (densityaround 1 in units of He/VacancyFe), and maximum density, i.e.interstitial He precipitation without the addition of vacancies. Thislatter case tells us about the maximum pressure or density a bub-ble can develop before the surrounding matrix yields.
The study reported here is a first step towards an understandingof the heterogeneous precipitation of He into microstructural fea-tures such as dislocations, grain boundaries, and precipitates, asubject of interest in the search of adequate He management strat-egies [17].
262 A. Caro et al. / Journal of Nuclear Materials 418 (2011) 261–268
2. Development of the ternary FeCrHe potential
In a recent paper Sadigh et al. [18] proposed a simple scheme toconstruct composition dependent interatomic potentials for multi-component systems that can reproduce the heat of mixing of everybinary in a multicomponent system over the entire compositionalrange. The methodology, a formal extension of our previous com-position-dependent interatomic potentials model [14], provides asystematic approach to modeling arbitrarily complex multicompo-nent alloys.
The case of FeCrHe is a particularly simple ternary alloy becausethe addition of a closed shell element such as He to the binary FeCrcan be done with interactions based solely on pair potentials,reducing the complexity of the composition dependence to theFeCr binary alone. A ternary potential is constructed from thepotentials for the three pure element Fe, Cr, He, plus the functionsneeded for the description of the three binaries Fe–Cr, Fe–He, Cr–He.
Helium has been the subject of studies for a long time; the pres-ent state of the art for the pair potential description of its energet-ics and thermodynamics at room temperature and above is highlyaccurate, see for example [19] and references therein, indicatingthat He at room temperature and above, and at the density of inter-est for bubble studies, behaves classically, despite its light mass.We have taken the He–He potential derived by Beck [20] withthe cut off for computational efficiency and short-range behaviorfor collisions incorporated by Morishita et al. [21]. For the Fe–Heand Cr–He cross potentials we used the recent results by Juslinand Nordlund [22] and Terentyev et al. [23].
The Fe–Cr potential reported here is a new fitting, similar toboth the original CD-EAM [14] and to the point-defect-adjustedsecond version of it [24], but here we present a third version, basedon state-of-the-art Fe potential [25], which improves the screwdislocation core structure of the previous one [26], and Cr fromOlsson et al. [27]. The mixed interaction has been constructed toreproduce the mixing enthalpy curve obtained from first-princi-ples calculations by Olsson et al. [13] and the interstitial formationenergies of Dudarev et al. [28] using the so-called 1-site definitionof the density within the CD-EAM formalism, as described in [29].In short, the 1-site formulation replaces the original [14] definitionof the pair potential energy between a pair of dissimilar A and Batoms,
Vi;jðrÞ ¼ hðqijðrijÞÞmABðrijÞ ð1Þ
by
Vi;j ¼ fhðqiðri;jÞÞ þ hðqjðri;jÞÞgmABðri;jÞ ð2Þ
where Vi,j is the pair potential contribution to the total energy froman A–B pair, h(q) is the polynomial providing the compositiondependence in the CD-EAM model, mAB is the cross pair potential,and qi,j and qi are defined as,
qi;jðri;jÞ ¼12ðqiðri;jÞ þ qjðri;jÞÞ
qiðri;jÞ ¼X
j–i
/jðri;jÞÞð3Þ
where the sum in Eq. (3) extends over the neighbors of atom i, and/j is the atomic density function associated with the chemical speciessitting at site j. The computational advantage associated with usingthe 1-site formulation (Eq. (2)) instead of the original 2-sites formula-tion (Eq. (1)) is significant for Monte Carlo calculations since it de-creases the number of neighbors needed in the evaluation of theenergy changes. A detailed description of this modification to the origi-nal model, as well as efficient schemes to calculate forces and MonteCarlo moves, are given in Stukowsky et al. [29].
The routines implementing the 1-site CD-EAM for moleculardynamics simulations using this ternary FeCrHe alloy potential,together with tables for the potential, can be obtained as a userpackage from the Lammps website [30].
3. Potential validation
The original FeCr potential [14] was developed with the ther-modynamic properties of the FeCr alloy as objective, with noattempt to reproduce properties of point defects. A Version 2 ofthe potential, adjusted in particular to reproduce the ordering inthe energy sequence of the FeFe, FeCr and CrCr h1 1 0i dumbelinterstitial in Fe, was recently developed [24]. The new FeCrHe po-tential presented here has also been adjusted to reproduce pointdefect properties in FeCr, which come out similar to those reportedin [24]. A report on point defect properties in FeCr will be pub-lished elsewhere; we focus here on He properties in the alloy.The formation energies for different He configurations in pure Feand Cr are those reported in [22,23].
4. Results
4.1. He EOS
The properties of pure He are important to estimate part of theproperties of He trapped in a bubble inside a metallic matrix, sincefor bubbles sufficiently large compared to the range of the He–metal interaction, He atoms far from the bubble surface will bedescribed by the properties of pure He. The most important amongthem is the equation of state, EOS, relating pressure temperatureand density, as discussed in detail in [31]. We first analyze resultsfor pure He in the (q, T) region of interest on Fe alloys for nuclearapplications, i.e. for densities around 1 in units of He per Fevacancy ratio (we use this units hereafter), and temperatures300 < T < 800 K (in Fe, q = 1 equals 84,96 He/nm3, 0.1411 mol/cm3, 1 He/0.01177 nm3, or a specific volume of 7.087 cm3/mol.
We note that the units of density we use are linked to the vol-ume of one Fe atom in the Fe matrix for convenience, but the studyreported in this section refers to pure He; it is just a matter of con-venience to keep the same units through out the paper. The inter-est on the value q ’ 1 He/Vac is the result of the fact that He ascreated by nuclear transmutations sits initially at interstitial sitesin the Fe matrix, and converts into a substitutional impurity assoon as it encounters a vacancy which are in general more numer-ous than He atoms. This reaction is energetically very favorable. Ithas been proven that He–V complexes have a tendency to coalesceinto larger clusters that further grow by capturing/emitting addi-tional He atoms, vacancies, and interstitials, thus evolving fromq = 1 to nearby values [21,23].
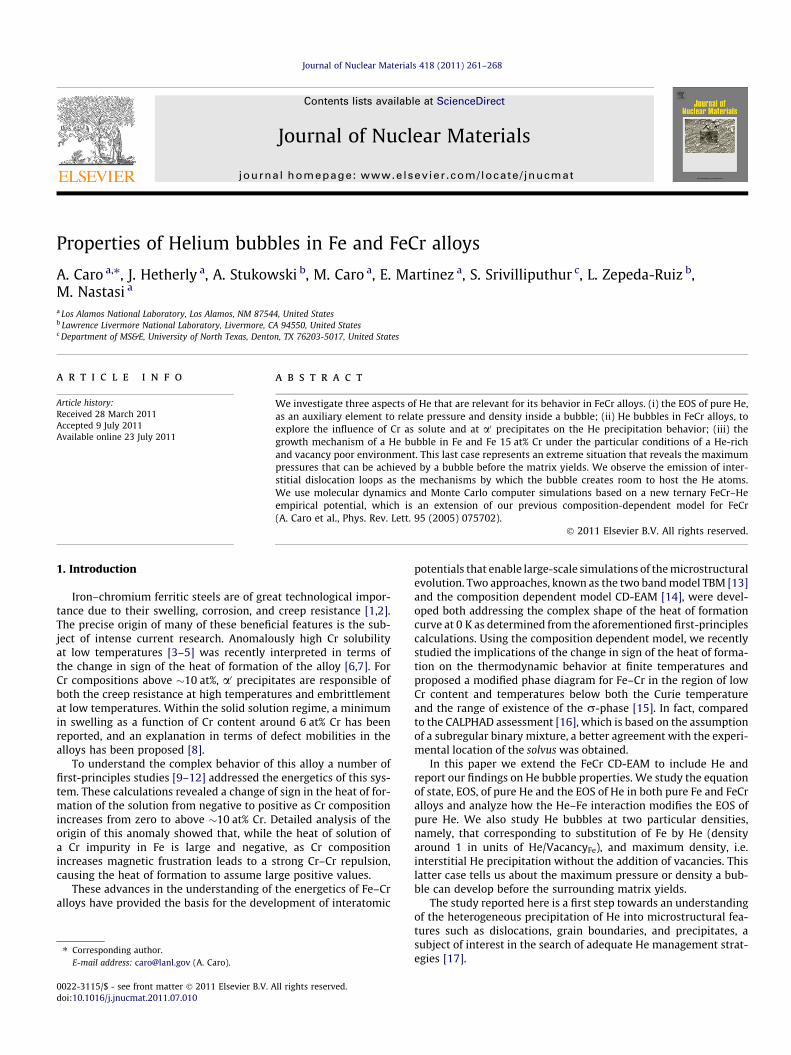
At densities and temperatures in the range of interest for bubblestudies, He has a solid–fluid phase transition; for a detailed studyof this transition, that involves a bcc phase before melting, see[35,36,31,19]. Fig. 1 shows the results of MD simulations for theP–q relation at T = 300 K as predicted by the He–He potential weuse. At densities below q � 1.7 He/Vac the agreement with exper-imental results from [32] is excellent, see inset in Fig. 1. As densityapproaches 1.7 He/Vac we observe a discrepancy between theexperimental results and the simulations. The experimental resultsshow at this density and above, a transition into a solid phase,while simulations suffer from the small sample size/short simula-tion time used (6912 atoms for �10 ps) that prevents the fluid-to-solid transition to occur; the fluid phase is retained during the timespan of the simulation. By performing complementary simulationsat constant density from high temperature and rapid quenching weget the solid squares in Fig. 1 corresponding to a highly defective
0.0 0.5 1.0 1.5 2.0 2.50
5
10
15
20
25
30
350.0 0.1 0.2 0.3
0.0 0.2 0.4 0.6 0.8 1.00.0
0.5
1.0
1.5
2.0
T = 300 K Lammps "Fluid" Fit Exp.
Pres
sure
(GPa
)
He/Vacancy Ratio
Density (mol/cm3)
T = 300 K Lammps "Fluid" Fit Exp.1 Exp.2 Exp.3 Ideal Gas Lammps "Solid"
Pres
sure
(GPa
)
He/Vacancy Ratio
Fig. 1. Pressure–density relation at 300 K as obtained by MD in the region ofinterest for nuclear materials studies. Inset shows the low density region magnified.Branching at around q = 1.7 reflects the solid–fluid transition. Red line is thepressure of an ideal gas (kinetic contribution alone), shown for reference. Lammps‘‘Fluid’’ refers to simulations done increasing pressure, where finite size effectsdelay solidification. Lammps ‘‘Solid’’ is the result of solidification via rapidquenching, which involves the presence of defects (see Fig. 2). Exp. 1 [33], Exp. 2[34], Exp. 3 [32]. (For interpretation of the references to color in this figure legend,the reader is referred to the web version of this article.)
A. Caro et al. / Journal of Nuclear Materials 418 (2011) 261–268 263
solid. The presence of these defects is at the origin of the apparentdiscrepancy between the MD simulations for the solid phase andthe experimental results. Simulations done in a perfect fcc crystal(not shown here) reproduce the P–q experimental values for thesolid with accuracy similar to those in the fluid phase. In summary,the pair potential used, which is a cut-off version of a well-testedpotential, is excellent to predict He EOS in the T–P–q region ofinterest.
For comparison purposes, the red line in Fig. 1 corresponds tothe pressure of an ideal gas at similar densities (kinetic contribu-tion alone), showing that most of the pressure in He at these den-sities comes from the finite size of the He atoms and thecorresponding He–He repulsion.
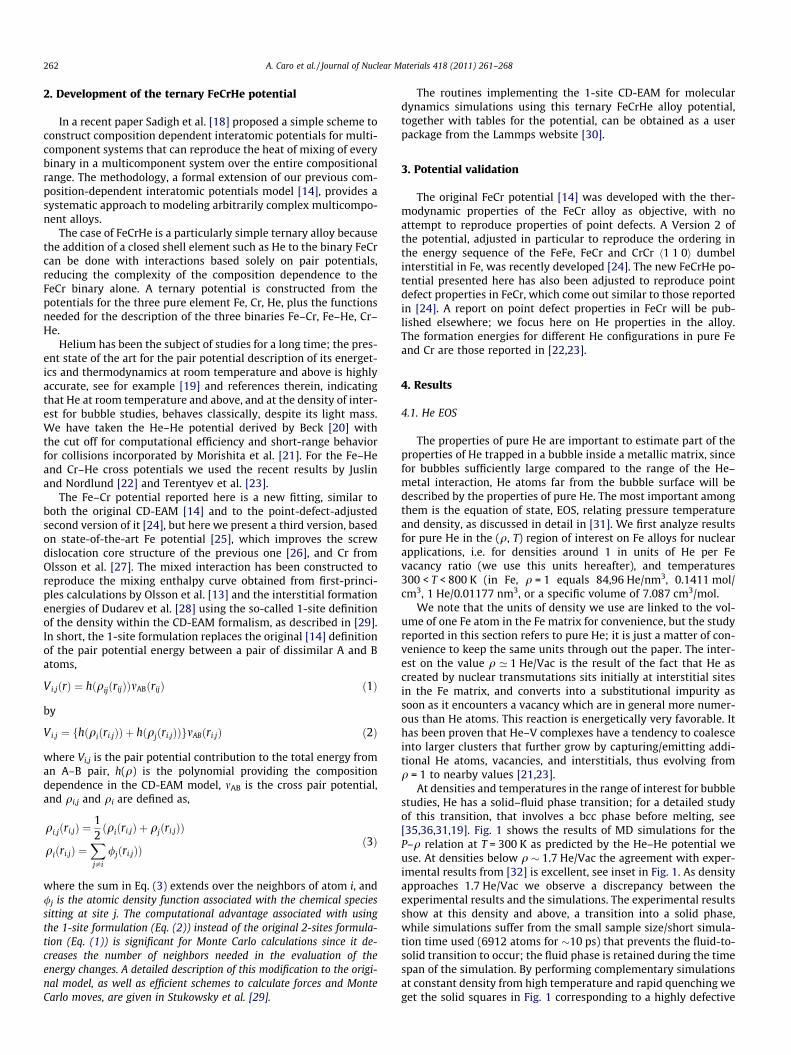
Fig. 2. Left: P–T relation at different densities for He. Curves are labeled by density, in un1000 K and then decrease T to 0 K. Branching reflects the solid–fluid transition. Significanhigh densities.
A first observation from this figure is that at densities aroundand above 1 He/Vacancy the pressures are above 1 GPa, which isthe order of magnitude of the strength of a metal, suggesting thatthese densities will probably induce plastic deformation of the ma-trix. A second observation is that at the T–q of interest, He presentsa solid–fluid phase transition.
Fig. 2 left shows the P–T relation at different densities. Simula-tions start with an fcc lattice at 0 K, increases T up to 1000 K andthen decreases T back to 0 K. As T increases, the solid–fluid transi-tion is clearly visible as a sudden increase in pressure. The temper-ature at which this transition appears on heating in Fig. 2 is not thetrue thermodynamic equilibrium transition temperature but high-er, due to finite size effects. In the run decreasing T from fluid tosolid ranges, a defective solid forms in all cases, with a fluid-to-so-lid transition that is not as clearly visible as in the heating up runsdue precisely to the presence of those defects. The tendency tocrystallize with defects is enhanced by the minute energy differ-ence between different crystalline solid phases of He. Despite theinaccuracy on the transition temperature displayed by the pressuresignature in Fig. 2, we are using this feature to illustrate about theapproximate location of the solid–fluid transition on the P–T dia-gram in connection with the q–T region of interest for He bubblesin steels. We see that He is in a fluid phase for T > room tempera-ture and densities around 1 He/Vac. For a precise location of the so-lid–fluid phase transition see [36]. At densities higher than 1 He/Vac, more than half of the pressure comes from the He–He repul-sion, P being only slightly dependent on T. Fig. 2-right shows thatregime for densities up to 6 He/Vac with pressure in the hundredsof GPa (log scale).
The EOS for the fluid phase of He for this empirical potentialobtained from a fit to the ensemble of data presented in Fig. 2 isgiven by,
Pðq; TÞ ¼ a0ðqÞ þ a1ðqÞT þ a2ðqÞT2 ð4Þ
where
a0ðqÞ ¼ �6:347 10�1q5 þ 3:446 100q4 � 1:820 10�0q3
þ 3:843 10�1q2 � 1:114 10�2q
a1ðqÞ ¼ 1:081 10�3q5 � 4:43 10�3q4 þ 4:812 10�3q3
þ 2:241 10�3q2 � 1:078 10�3q
a2ðqÞ ¼ �6:847 10�7q5 þ 2:499 10�6q4 � 2:165 10�6q3
� 9:776 10�7q2 � 1:211 10�7q
its of He/Vacancy ratio. Simulations start at 0 K with an fcc solid phase, rise T up tot hysteresis is due to finite size effects and quench-in defects. Right: P–T relation at
264 A. Caro et al. / Journal of Nuclear Materials 418 (2011) 261–268
with q in [He/VacFe] units (VVac(Fe) = 0.01177 nm3), T in Kelvin, andP in GPa. This expression will be used below to discuss the densityinside He bubbles in Fe and FeCr. An analytic expression for theexperimental EOS is given in [37]; the agreement between bothEOS’s is excellent.
While the He–He pair potential has a well-defined behavior fortemperatures down to 0 K, we should note that the predictions forthese temperatures (below room temperature) are not to be ex-pected to agree with experiments. The pair potential and the EOSgiven by the equation above are accurate for properties aboveroom temperature, where a classical description is valid.
4.2. He bubbles in Fe and FeCr at density �1 He/Vac
Having characterized pure He, we study now He bubbles in FeCralloys. Experiments show, and simulations predict, [2–7] that solidHe exists in three different stable crystallographic structures,namely hcp, fcc, and bcc, depending on temperature and pressure.The energy difference between these structures is small comparedto binding energies of metals. Therefore, when embedded in ametallic matrix, the behavior of He bubbles will reflect the influ-ence of the surroundings, most probably transforming from a fluidat low density to an amorphous solid or to a crystal with the samestructure of the matrix, as density increases.
A description of He bubbles in metals relating all the relevantbubble variables (P the pressure, q the density, R the radius ofthe bubble, T the temperature, and lHe the He chemical potential),to the relevant matrix variables, (alloy composition, radiation orannealing conditions, vacancy/interstitial bias, sink density, etc.)is a subject of intense research activity, see for example [38]. Inwhat follows we choose to explore one particular aspect of thisproblem, namely the P–q relation for bubbles embedded in Feand FeCr matrices. Stewart et al. [39] recently addressed this prob-lem at small bubble sizes (containing a few He atoms) using threedifferent Fe–He potentials. They found that small He bubbles growby precipitation of interstitial He and subsequent emission ofinterstitial Fe. We focus into larger sizes where another growthmechanism appears, namely interstitial loop emission as proposedsome time ago based on elasticity arguments [40].
We use two computational techniques for these studies. One isMetropolis Monte Carlo, MMC, in the semi grand-canonical ensam-ple, and the other is standard molecular dynamics, MD. In ourimplementation of the MMC we randomly swap the chemicalidentity of an atom between Fe, Cr, or He, while displacementcomponents of the ensemble is accomplished by MD. AlternatingMMC and MD steps, the system evolves towards equilibrium via
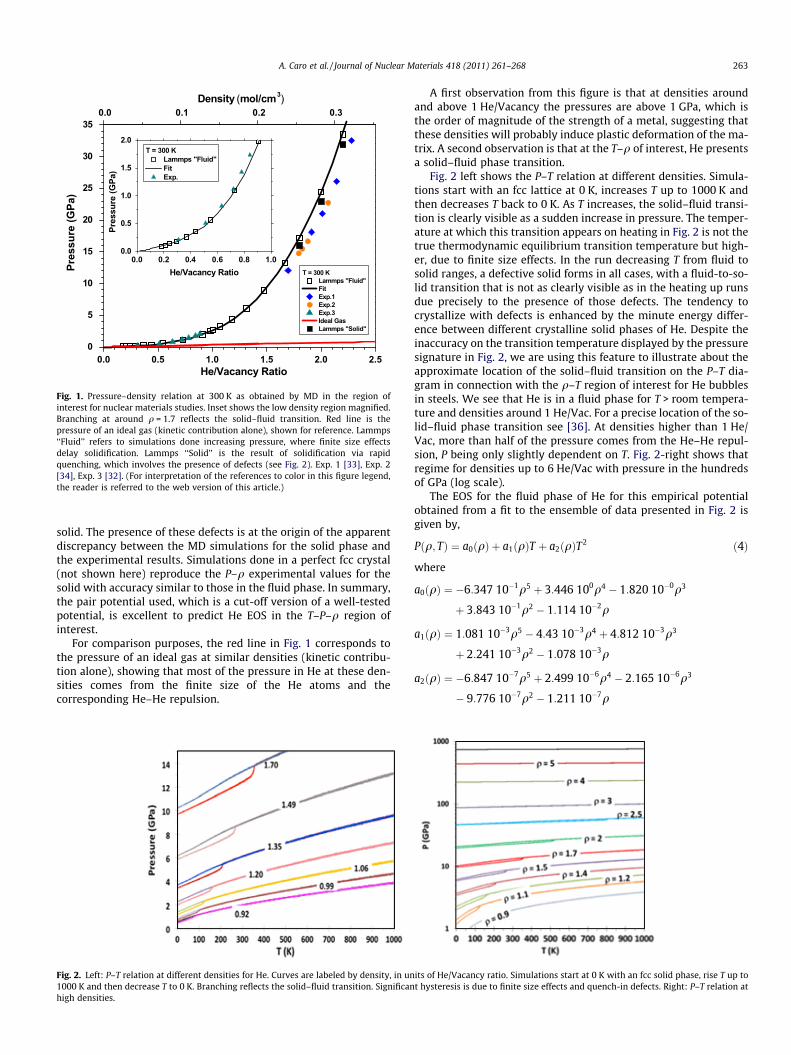
Fig. 3. Left: a He bubble in FeCr at density qunrelaxed = 1 He/Vac in Fe 15 at% Cr at 800 K. Cparticle is a a0 precipitate (Cr rich particle). He bubbles do not form within or at the intethan in Fe. Right: composition profile across the bubble–matrix interface, showing a cleathis figure legend, the reader is referred to the web version of this article.)
nucleation and growth of He bubble and eventually a0 precipitatesfor FeCr alloys with large amounts of Cr. Constraining the varianceof the composition fluctuations, using our recently developed var-iance-constrained semi-grand canonical MMC code [41], as imple-mented in Lammps [42] we control the global composition of Crand He. This methodology always creates bubbles with an unre-laxed density qunrelaxed = 1 He/Vac because it is based on a swap-ping algorithm.
We start describing a bubble created in FeCr using the Metrop-olis MC method. Fig. 3 left shows a 2-dimensional cut of a cubicsample from a MC simulation on Fe–15 at% Cr centered on a�7 nm He bubble. Colors represent chemical identity, with Fe inred, Cr in green and He in blue. At this Cr composition, an a0 pre-cipitate (Cr rich particle) appears in the lower left corner of thefigure, while the matrix still shows Cr in solid solution at a compo-sition around 10 at%, in agreement with what is known for thephase diagram of this alloy [6]. What comes clearly out from thisfigure, confirmed by several cases studied, is that He bubble pre-cipitation is not affected by the simultaneous a0 precipitationprocess, i.e. He bubbles do not form inside a0 precipitates nor atthe a–a0 interface, a fact that can be interpreted in terms of the dif-ferent energetics of He substitutional in Cr (5.01 eV) and in Fe(4.10 eV), He thus preferring the FeCr solid solution matrix. Fig. 3right shows the composition profile of the bubble. Cr is not in-volved in the formation of the bubble nor at its sharp interface withthe matrix where small Cr depletion is observed. This observationis compatible with similar simulations on FeCr alloys (with no He)that we have done, namely: in free surfaces, dislocations, and grainboundaries, Cr composition is always observed to be slightly lowerthan in the bulk [43]. We point out that these are Metropolis sim-ulations sensitive only to thermodynamic driving forces, withtransport mechanisms not included. In a real situation of precipita-tion of He by atomic transport in the matrix, composition profilesare the result of both thermodynamic and kinetic factors, and maybe different from what is reported here.
A note on pressure calculations. The pressure is one-third thetrace of the stress tensor calculated by the MD code. Lammps doesnot compute the atomic volume appearing in the expression of thestress tensor; therefore it reports atomic stress tensor times atomicvolume. We need then an estimate of the atomic volume. For thecase of spherical bubbles obtained by substitution of Fe by He,i.e. density �1 He/Vac, we assume that the atomic volume of Heand Fe is the equilibrium atomic volume of Fe; the same assump-tion is used for FeCr since both components have very similar lat-tice parameter. For the simulations on bubble growth, reported inthe next Paragraph, we determine three orthogonal diameters dx,
olor code represents chemical identity: Fe in red, Cr in green, He in blue. The greenrface of a0 particles due to the higher formation energy of a He substitutional in Crr Cr depletion close to the interface. (For interpretation of the references to color in
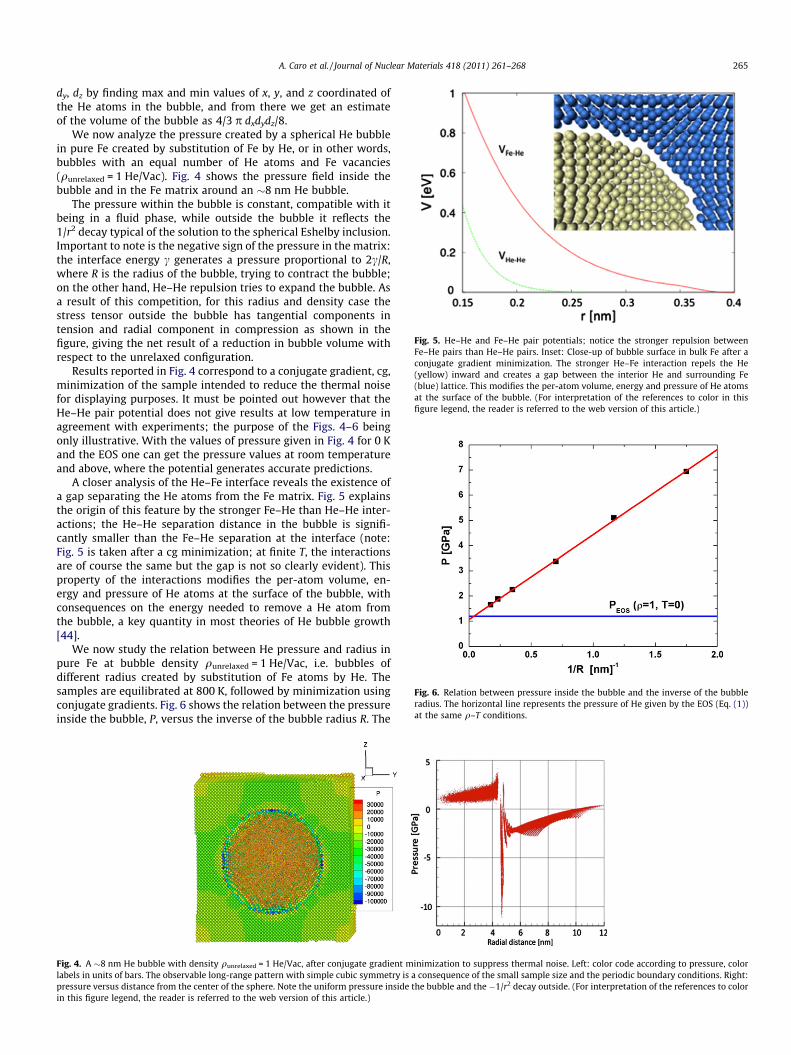
Fig. 6. Relation between pressure inside the bubble and the inverse of the bubbleradius. The horizontal line represents the pressure of He given by the EOS (Eq. (1))at the same q–T conditions.
Fig. 5. He–He and Fe–He pair potentials; notice the stronger repulsion betweenFe–He pairs than He–He pairs. Inset: Close-up of bubble surface in bulk Fe after aconjugate gradient minimization. The stronger He–Fe interaction repels the He(yellow) inward and creates a gap between the interior He and surrounding Fe(blue) lattice. This modifies the per-atom volume, energy and pressure of He atomsat the surface of the bubble. (For interpretation of the references to color in thisfigure legend, the reader is referred to the web version of this article.)
A. Caro et al. / Journal of Nuclear Materials 418 (2011) 261–268 265
dy, dz by finding max and min values of x, y, and z coordinated ofthe He atoms in the bubble, and from there we get an estimateof the volume of the bubble as 4/3 p dxdydz/8.
We now analyze the pressure created by a spherical He bubblein pure Fe created by substitution of Fe by He, or in other words,bubbles with an equal number of He atoms and Fe vacancies(qunrelaxed = 1 He/Vac). Fig. 4 shows the pressure field inside thebubble and in the Fe matrix around an �8 nm He bubble.
The pressure within the bubble is constant, compatible with itbeing in a fluid phase, while outside the bubble it reflects the1/r2 decay typical of the solution to the spherical Eshelby inclusion.Important to note is the negative sign of the pressure in the matrix:the interface energy c generates a pressure proportional to 2c/R,where R is the radius of the bubble, trying to contract the bubble;on the other hand, He–He repulsion tries to expand the bubble. Asa result of this competition, for this radius and density case thestress tensor outside the bubble has tangential components intension and radial component in compression as shown in thefigure, giving the net result of a reduction in bubble volume withrespect to the unrelaxed configuration.
Results reported in Fig. 4 correspond to a conjugate gradient, cg,minimization of the sample intended to reduce the thermal noisefor displaying purposes. It must be pointed out however that theHe–He pair potential does not give results at low temperature inagreement with experiments; the purpose of the Figs. 4–6 beingonly illustrative. With the values of pressure given in Fig. 4 for 0 Kand the EOS one can get the pressure values at room temperatureand above, where the potential generates accurate predictions.
A closer analysis of the He–Fe interface reveals the existence ofa gap separating the He atoms from the Fe matrix. Fig. 5 explainsthe origin of this feature by the stronger Fe–He than He–He inter-actions; the He–He separation distance in the bubble is signifi-cantly smaller than the Fe–He separation at the interface (note:Fig. 5 is taken after a cg minimization; at finite T, the interactionsare of course the same but the gap is not so clearly evident). Thisproperty of the interactions modifies the per-atom volume, en-ergy and pressure of He atoms at the surface of the bubble, withconsequences on the energy needed to remove a He atom fromthe bubble, a key quantity in most theories of He bubble growth[44].
We now study the relation between He pressure and radius inpure Fe at bubble density qunrelaxed = 1 He/Vac, i.e. bubbles ofdifferent radius created by substitution of Fe atoms by He. Thesamples are equilibrated at 800 K, followed by minimization usingconjugate gradients. Fig. 6 shows the relation between the pressureinside the bubble, P, versus the inverse of the bubble radius R. The
Fig. 4. A �8 nm He bubble with density qunrelaxed = 1 He/Vac, after conjugate gradient minimization to suppress thermal noise. Left: color code according to pressure, colorlabels in units of bars. The observable long-range pattern with simple cubic symmetry is a consequence of the small sample size and the periodic boundary conditions. Right:pressure versus distance from the center of the sphere. Note the uniform pressure inside the bubble and the �1/r2 decay outside. (For interpretation of the references to colorin this figure legend, the reader is referred to the web version of this article.)
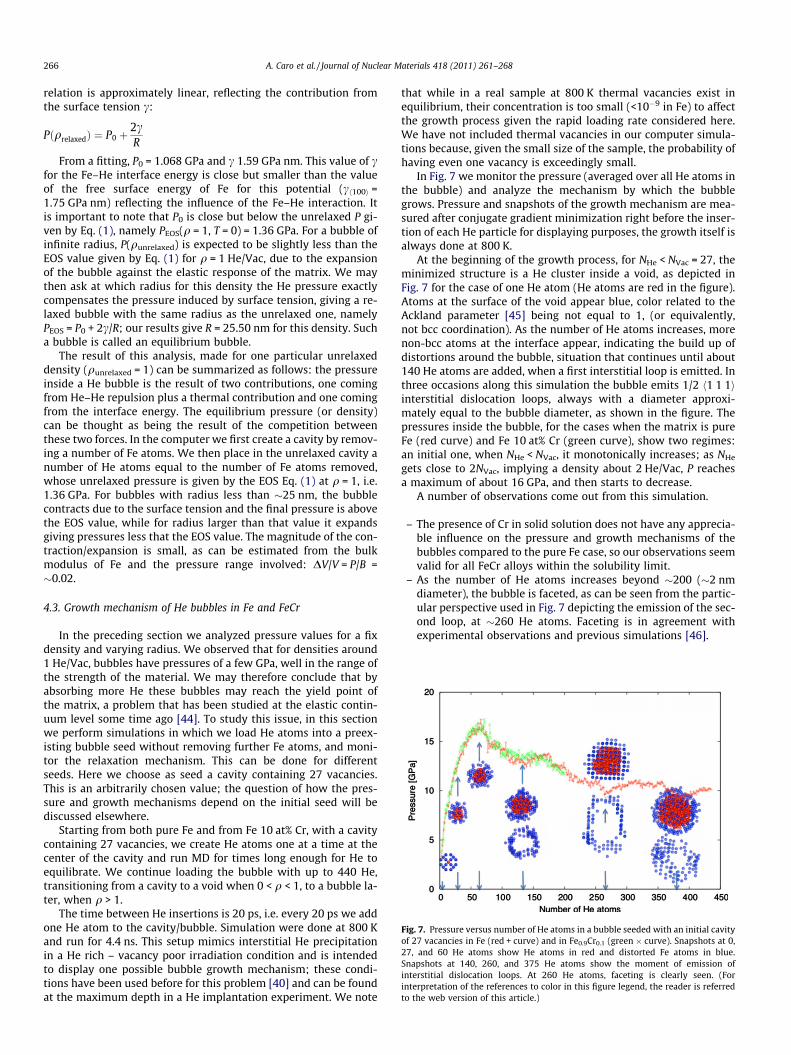
Fig. 7. Pressure versus number of He atoms in a bubble seeded with an initial cavityof 27 vacancies in Fe (red + curve) and in Fe0.9Cr0.1 (green � curve). Snapshots at 0,27, and 60 He atoms show He atoms in red and distorted Fe atoms in blue.Snapshots at 140, 260, and 375 He atoms show the moment of emission ofinterstitial dislocation loops. At 260 He atoms, faceting is clearly seen. (Forinterpretation of the references to color in this figure legend, the reader is referredto the web version of this article.)
266 A. Caro et al. / Journal of Nuclear Materials 418 (2011) 261–268
relation is approximately linear, reflecting the contribution fromthe surface tension c:
PðqrelaxedÞ ¼ P0 þ2cR
From a fitting, P0 = 1.068 GPa and c 1.59 GPa nm. This value of cfor the Fe–He interface energy is close but smaller than the valueof the free surface energy of Fe for this potential (ch100i =1.75 GPa nm) reflecting the influence of the Fe–He interaction. Itis important to note that P0 is close but below the unrelaxed P gi-ven by Eq. (1), namely PEOS(q = 1, T = 0) = 1.36 GPa. For a bubble ofinfinite radius, P(qunrelaxed) is expected to be slightly less than theEOS value given by Eq. (1) for q = 1 He/Vac, due to the expansionof the bubble against the elastic response of the matrix. We maythen ask at which radius for this density the He pressure exactlycompensates the pressure induced by surface tension, giving a re-laxed bubble with the same radius as the unrelaxed one, namelyPEOS = P0 + 2c/R; our results give R = 25.50 nm for this density. Sucha bubble is called an equilibrium bubble.
The result of this analysis, made for one particular unrelaxeddensity (qunrelaxed = 1) can be summarized as follows: the pressureinside a He bubble is the result of two contributions, one comingfrom He–He repulsion plus a thermal contribution and one comingfrom the interface energy. The equilibrium pressure (or density)can be thought as being the result of the competition betweenthese two forces. In the computer we first create a cavity by remov-ing a number of Fe atoms. We then place in the unrelaxed cavity anumber of He atoms equal to the number of Fe atoms removed,whose unrelaxed pressure is given by the EOS Eq. (1) at q = 1, i.e.1.36 GPa. For bubbles with radius less than �25 nm, the bubblecontracts due to the surface tension and the final pressure is abovethe EOS value, while for radius larger than that value it expandsgiving pressures less that the EOS value. The magnitude of the con-traction/expansion is small, as can be estimated from the bulkmodulus of Fe and the pressure range involved: DV/V = P/B =�0.02.
4.3. Growth mechanism of He bubbles in Fe and FeCr
In the preceding section we analyzed pressure values for a fixdensity and varying radius. We observed that for densities around1 He/Vac, bubbles have pressures of a few GPa, well in the range ofthe strength of the material. We may therefore conclude that byabsorbing more He these bubbles may reach the yield point ofthe matrix, a problem that has been studied at the elastic contin-uum level some time ago [44]. To study this issue, in this sectionwe perform simulations in which we load He atoms into a preex-isting bubble seed without removing further Fe atoms, and moni-tor the relaxation mechanism. This can be done for differentseeds. Here we choose as seed a cavity containing 27 vacancies.This is an arbitrarily chosen value; the question of how the pres-sure and growth mechanisms depend on the initial seed will bediscussed elsewhere.
Starting from both pure Fe and from Fe 10 at% Cr, with a cavitycontaining 27 vacancies, we create He atoms one at a time at thecenter of the cavity and run MD for times long enough for He toequilibrate. We continue loading the bubble with up to 440 He,transitioning from a cavity to a void when 0 < q < 1, to a bubble la-ter, when q > 1.
The time between He insertions is 20 ps, i.e. every 20 ps we addone He atom to the cavity/bubble. Simulation were done at 800 Kand run for 4.4 ns. This setup mimics interstitial He precipitationin a He rich – vacancy poor irradiation condition and is intendedto display one possible bubble growth mechanism; these condi-tions have been used before for this problem [40] and can be foundat the maximum depth in a He implantation experiment. We note
that while in a real sample at 800 K thermal vacancies exist inequilibrium, their concentration is too small (<10�9 in Fe) to affectthe growth process given the rapid loading rate considered here.We have not included thermal vacancies in our computer simula-tions because, given the small size of the sample, the probability ofhaving even one vacancy is exceedingly small.
In Fig. 7 we monitor the pressure (averaged over all He atoms inthe bubble) and analyze the mechanism by which the bubblegrows. Pressure and snapshots of the growth mechanism are mea-sured after conjugate gradient minimization right before the inser-tion of each He particle for displaying purposes, the growth itself isalways done at 800 K.
At the beginning of the growth process, for NHe < NVac = 27, theminimized structure is a He cluster inside a void, as depicted inFig. 7 for the case of one He atom (He atoms are red in the figure).Atoms at the surface of the void appear blue, color related to theAckland parameter [45] being not equal to 1, (or equivalently,not bcc coordination). As the number of He atoms increases, morenon-bcc atoms at the interface appear, indicating the build up ofdistortions around the bubble, situation that continues until about140 He atoms are added, when a first interstitial loop is emitted. Inthree occasions along this simulation the bubble emits 1/2 h1 1 1iinterstitial dislocation loops, always with a diameter approxi-mately equal to the bubble diameter, as shown in the figure. Thepressures inside the bubble, for the cases when the matrix is pureFe (red curve) and Fe 10 at% Cr (green curve), show two regimes:an initial one, when NHe < NVac, it monotonically increases; as NHe
gets close to 2NVac, implying a density about 2 He/Vac, P reachesa maximum of about 16 GPa, and then starts to decrease.
A number of observations come out from this simulation.
– The presence of Cr in solid solution does not have any apprecia-ble influence on the pressure and growth mechanisms of thebubbles compared to the pure Fe case, so our observations seemvalid for all FeCr alloys within the solubility limit.
– As the number of He atoms increases beyond �200 (�2 nmdiameter), the bubble is faceted, as can be seen from the partic-ular perspective used in Fig. 7 depicting the emission of the sec-ond loop, at �260 He atoms. Faceting is in agreement withexperimental observations and previous simulations [46].
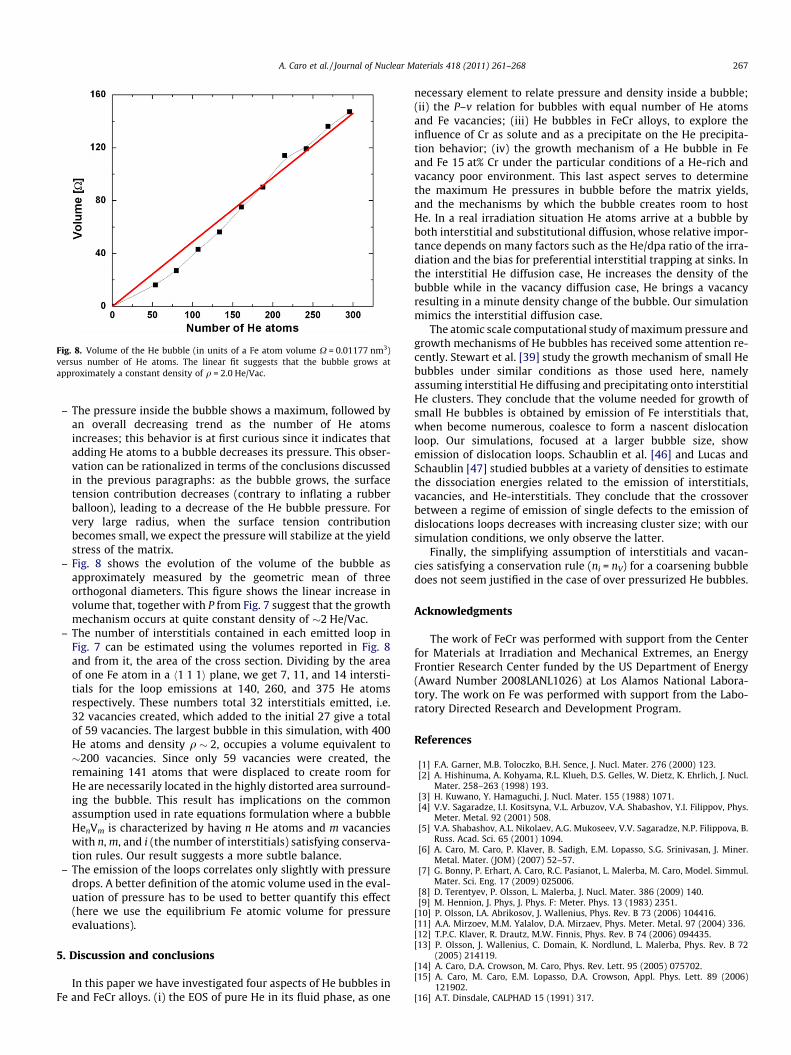
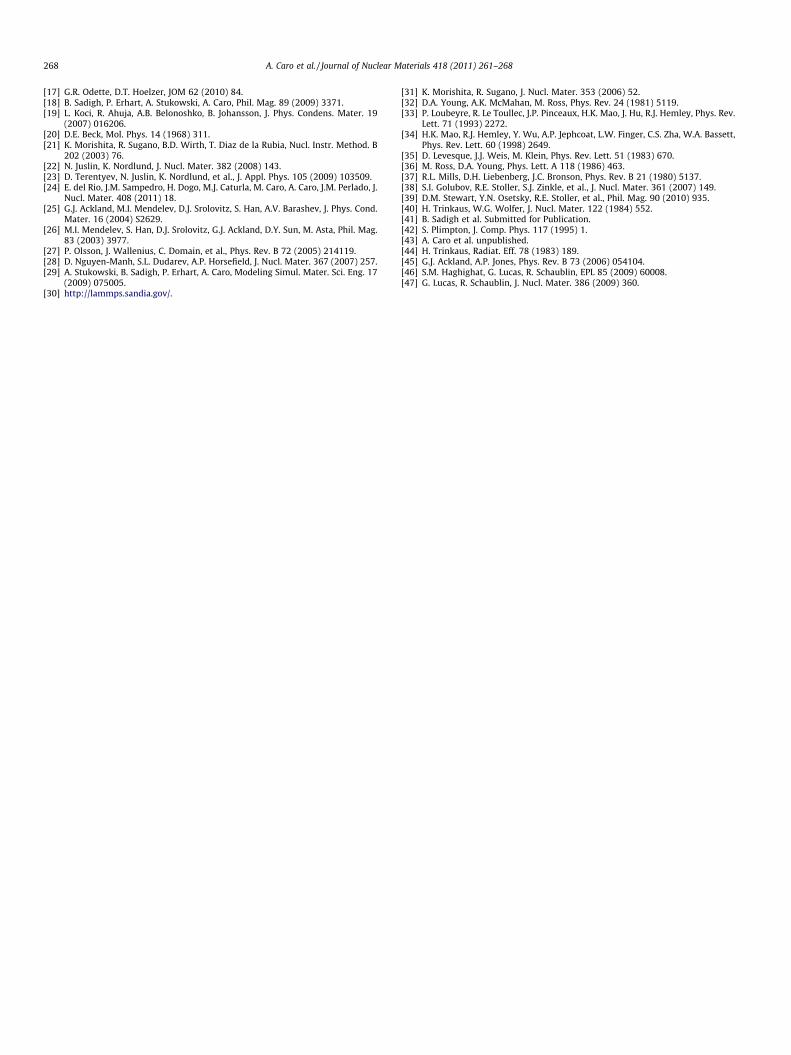
Fig. 8. Volume of the He bubble (in units of a Fe atom volume X = 0.01177 nm3)versus number of He atoms. The linear fit suggests that the bubble grows atapproximately a constant density of q = 2.0 He/Vac.
A. Caro et al. / Journal of Nuclear Materials 418 (2011) 261–268 267
– The pressure inside the bubble shows a maximum, followed byan overall decreasing trend as the number of He atomsincreases; this behavior is at first curious since it indicates thatadding He atoms to a bubble decreases its pressure. This obser-vation can be rationalized in terms of the conclusions discussedin the previous paragraphs: as the bubble grows, the surfacetension contribution decreases (contrary to inflating a rubberballoon), leading to a decrease of the He bubble pressure. Forvery large radius, when the surface tension contributionbecomes small, we expect the pressure will stabilize at the yieldstress of the matrix.
– Fig. 8 shows the evolution of the volume of the bubble asapproximately measured by the geometric mean of threeorthogonal diameters. This figure shows the linear increase involume that, together with P from Fig. 7 suggest that the growthmechanism occurs at quite constant density of �2 He/Vac.
– The number of interstitials contained in each emitted loop inFig. 7 can be estimated using the volumes reported in Fig. 8and from it, the area of the cross section. Dividing by the areaof one Fe atom in a h1 1 1i plane, we get 7, 11, and 14 intersti-tials for the loop emissions at 140, 260, and 375 He atomsrespectively. These numbers total 32 interstitials emitted, i.e.32 vacancies created, which added to the initial 27 give a totalof 59 vacancies. The largest bubble in this simulation, with 400He atoms and density q � 2, occupies a volume equivalent to�200 vacancies. Since only 59 vacancies were created, theremaining 141 atoms that were displaced to create room forHe are necessarily located in the highly distorted area surround-ing the bubble. This result has implications on the commonassumption used in rate equations formulation where a bubbleHenVm is characterized by having n He atoms and m vacancieswith n, m, and i (the number of interstitials) satisfying conserva-tion rules. Our result suggests a more subtle balance.
– The emission of the loops correlates only slightly with pressuredrops. A better definition of the atomic volume used in the eval-uation of pressure has to be used to better quantify this effect(here we use the equilibrium Fe atomic volume for pressureevaluations).
5. Discussion and conclusions
In this paper we have investigated four aspects of He bubbles inFe and FeCr alloys. (i) the EOS of pure He in its fluid phase, as one
necessary element to relate pressure and density inside a bubble;(ii) the P–v relation for bubbles with equal number of He atomsand Fe vacancies; (iii) He bubbles in FeCr alloys, to explore theinfluence of Cr as solute and as a precipitate on the He precipita-tion behavior; (iv) the growth mechanism of a He bubble in Feand Fe 15 at% Cr under the particular conditions of a He-rich andvacancy poor environment. This last aspect serves to determinethe maximum He pressures in bubble before the matrix yields,and the mechanisms by which the bubble creates room to hostHe. In a real irradiation situation He atoms arrive at a bubble byboth interstitial and substitutional diffusion, whose relative impor-tance depends on many factors such as the He/dpa ratio of the irra-diation and the bias for preferential interstitial trapping at sinks. Inthe interstitial He diffusion case, He increases the density of thebubble while in the vacancy diffusion case, He brings a vacancyresulting in a minute density change of the bubble. Our simulationmimics the interstitial diffusion case.
The atomic scale computational study of maximum pressure andgrowth mechanisms of He bubbles has received some attention re-cently. Stewart et al. [39] study the growth mechanism of small Hebubbles under similar conditions as those used here, namelyassuming interstitial He diffusing and precipitating onto interstitialHe clusters. They conclude that the volume needed for growth ofsmall He bubbles is obtained by emission of Fe interstitials that,when become numerous, coalesce to form a nascent dislocationloop. Our simulations, focused at a larger bubble size, showemission of dislocation loops. Schaublin et al. [46] and Lucas andSchaublin [47] studied bubbles at a variety of densities to estimatethe dissociation energies related to the emission of interstitials,vacancies, and He-interstitials. They conclude that the crossoverbetween a regime of emission of single defects to the emission ofdislocations loops decreases with increasing cluster size; with oursimulation conditions, we only observe the latter.
Finally, the simplifying assumption of interstitials and vacan-cies satisfying a conservation rule (ni = nV) for a coarsening bubbledoes not seem justified in the case of over pressurized He bubbles.
Acknowledgments
The work of FeCr was performed with support from the Centerfor Materials at Irradiation and Mechanical Extremes, an EnergyFrontier Research Center funded by the US Department of Energy(Award Number 2008LANL1026) at Los Alamos National Labora-tory. The work on Fe was performed with support from the Labo-ratory Directed Research and Development Program.
References
[1] F.A. Garner, M.B. Toloczko, B.H. Sence, J. Nucl. Mater. 276 (2000) 123.[2] A. Hishinuma, A. Kohyama, R.L. Klueh, D.S. Gelles, W. Dietz, K. Ehrlich, J. Nucl.
Mater. 258–263 (1998) 193.[3] H. Kuwano, Y. Hamaguchi, J. Nucl. Mater. 155 (1988) 1071.[4] V.V. Sagaradze, I.I. Kositsyna, V.L. Arbuzov, V.A. Shabashov, Y.I. Filippov, Phys.
Meter. Metal. 92 (2001) 508.[5] V.A. Shabashov, A.L. Nikolaev, A.G. Mukoseev, V.V. Sagaradze, N.P. Filippova, B.
Russ. Acad. Sci. 65 (2001) 1094.[6] A. Caro, M. Caro, P. Klaver, B. Sadigh, E.M. Lopasso, S.G. Srinivasan, J. Miner.
Metal. Mater. (JOM) (2007) 52–57.[7] G. Bonny, P. Erhart, A. Caro, R.C. Pasianot, L. Malerba, M. Caro, Model. Simmul.
Mater. Sci. Eng. 17 (2009) 025006.[8] D. Terentyev, P. Olsson, L. Malerba, J. Nucl. Mater. 386 (2009) 140.[9] M. Hennion, J. Phys, J. Phys. F: Meter. Phys. 13 (1983) 2351.
[10] P. Olsson, I.A. Abrikosov, J. Wallenius, Phys. Rev. B 73 (2006) 104416.[11] A.A. Mirzoev, M.M. Yalalov, D.A. Mirzaev, Phys. Meter. Metal. 97 (2004) 336.[12] T.P.C. Klaver, R. Drautz, M.W. Finnis, Phys. Rev. B 74 (2006) 094435.[13] P. Olsson, J. Wallenius, C. Domain, K. Nordlund, L. Malerba, Phys. Rev. B 72
(2005) 214119.[14] A. Caro, D.A. Crowson, M. Caro, Phys. Rev. Lett. 95 (2005) 075702.[15] A. Caro, M. Caro, E.M. Lopasso, D.A. Crowson, Appl. Phys. Lett. 89 (2006)
121902.[16] A.T. Dinsdale, CALPHAD 15 (1991) 317.
268 A. Caro et al. / Journal of Nuclear Materials 418 (2011) 261–268
[17] G.R. Odette, D.T. Hoelzer, JOM 62 (2010) 84.[18] B. Sadigh, P. Erhart, A. Stukowski, A. Caro, Phil. Mag. 89 (2009) 3371.[19] L. Koci, R. Ahuja, A.B. Belonoshko, B. Johansson, J. Phys. Condens. Mater. 19
(2007) 016206.[20] D.E. Beck, Mol. Phys. 14 (1968) 311.[21] K. Morishita, R. Sugano, B.D. Wirth, T. Diaz de la Rubia, Nucl. Instr. Method. B
202 (2003) 76.[22] N. Juslin, K. Nordlund, J. Nucl. Mater. 382 (2008) 143.[23] D. Terentyev, N. Juslin, K. Nordlund, et al., J. Appl. Phys. 105 (2009) 103509.[24] E. del Rio, J.M. Sampedro, H. Dogo, M.J. Caturla, M. Caro, A. Caro, J.M. Perlado, J.
Nucl. Mater. 408 (2011) 18.[25] G.J. Ackland, M.I. Mendelev, D.J. Srolovitz, S. Han, A.V. Barashev, J. Phys. Cond.
Mater. 16 (2004) S2629.[26] M.I. Mendelev, S. Han, D.J. Srolovitz, G.J. Ackland, D.Y. Sun, M. Asta, Phil. Mag.
83 (2003) 3977.[27] P. Olsson, J. Wallenius, C. Domain, et al., Phys. Rev. B 72 (2005) 214119.[28] D. Nguyen-Manh, S.L. Dudarev, A.P. Horsefield, J. Nucl. Mater. 367 (2007) 257.[29] A. Stukowski, B. Sadigh, P. Erhart, A. Caro, Modeling Simul. Mater. Sci. Eng. 17
(2009) 075005.[30] http://lammps.sandia.gov/.
[31] K. Morishita, R. Sugano, J. Nucl. Mater. 353 (2006) 52.[32] D.A. Young, A.K. McMahan, M. Ross, Phys. Rev. 24 (1981) 5119.[33] P. Loubeyre, R. Le Toullec, J.P. Pinceaux, H.K. Mao, J. Hu, R.J. Hemley, Phys. Rev.
Lett. 71 (1993) 2272.[34] H.K. Mao, R.J. Hemley, Y. Wu, A.P. Jephcoat, L.W. Finger, C.S. Zha, W.A. Bassett,
Phys. Rev. Lett. 60 (1998) 2649.[35] D. Levesque, J.J. Weis, M. Klein, Phys. Rev. Lett. 51 (1983) 670.[36] M. Ross, D.A. Young, Phys. Lett. A 118 (1986) 463.[37] R.L. Mills, D.H. Liebenberg, J.C. Bronson, Phys. Rev. B 21 (1980) 5137.[38] S.I. Golubov, R.E. Stoller, S.J. Zinkle, et al., J. Nucl. Mater. 361 (2007) 149.[39] D.M. Stewart, Y.N. Osetsky, R.E. Stoller, et al., Phil. Mag. 90 (2010) 935.[40] H. Trinkaus, W.G. Wolfer, J. Nucl. Mater. 122 (1984) 552.[41] B. Sadigh et al. Submitted for Publication.[42] S. Plimpton, J. Comp. Phys. 117 (1995) 1.[43] A. Caro et al. unpublished.[44] H. Trinkaus, Radiat. Eff. 78 (1983) 189.[45] G.J. Ackland, A.P. Jones, Phys. Rev. B 73 (2006) 054104.[46] S.M. Haghighat, G. Lucas, R. Schaublin, EPL 85 (2009) 60008.[47] G. Lucas, R. Schaublin, J. Nucl. Mater. 386 (2009) 360.


