Embed Size (px)
Citation preview
Proportional-first-past-the-post:
A Canadian model of Proportional Representation
by
Robert S. Ring
A thesis submitted to the
School of Graduate Studies
in partial fulfilment of the
requirements for the degree of
Master of Arts
Department of Political Science
Memorial University
St. John’s, Newfoundland and Labrador
May 2014
Abstract
For more than a decade a majority of Canadians have consistently supported the idea of proportional representation when asked, yet all attempts at electoral reform thus far have failed. Even though a majority of Canadians support proportional representation, a majority also report they are satisfied with the current electoral system (even indicating support for both in the same survey). The author seeks to reconcile these potentially conflicting desires by designing a uniquely Canadian electoral system that keeps the positive and familiar features of first-past-the-post while creating a proportional election result.
The author touches on the theory of representative democracy and its relationship with proportional representation before delving into the mechanics of electoral systems. He surveys some of the major electoral system proposals and options for Canada before finally presenting his made-in-Canada solution that he believes stands a better chance at gaining approval from Canadians than past proposals.
ii
Acknowledgements
First of foremost, I would like to express my sincerest gratitude to my brilliant supervisor, Dr. Amanda Bittner, whose continuous guidance, support, and advice over the past few years has
been invaluable. I am especially grateful to you for encouraging me to pursue my Master’s and write about my electoral system idea. Without you, this would not have materialized.
I would like to thank the Faculty, students, and support staff of the Political Science Department at Memorial University.
I would like to thank my family for your unconditional love and support. I would especially like to thank my parents, Elizabeth and Paul, for your unwavering belief in me in all my endeavours.
I would also like to thank my ‘second family’ and employer, 37 Combat Engineer Regiment. Chimo!
Above all, I am deeply grateful to my loving wife, Amanda. Thank you for standing by me and for your patience which has certainly been tested. I am especially thankful to you for being a
wonderful and caring mother to our son, Auron.
And to coffee growers everywhere, thanks a million!
iii
For my son, Auron James Ring
And to‘One and All’

"They've all got the vote,
so they all pretty much assume that the government they've voted in
more or less approximates to the government they want."
"You mean they actually vote for the lizards?"
"Oh yes," said Ford with a shrug, "of course."
"But," said Arthur, going for the big one again, "why?"
"Because if they didn't vote for a lizard," said Ford,
"the wrong lizard might get in. Got any gin?"
Douglas Adams, So Long, and Thanks for All the Fish (Chapter 36)
Proportional-first-past-the-post: a Canadian model of Proportional Representation
Table of Contents
Abstract..........................................................................................................................................ii
Acknowledgements.......................................................................................................................iv
List of Tables.................................................................................................................................xi
List of Figures ............................................................................................................................ xii
Chapter I: Introduction: the state of representative democracy in Canada............................1
1.1 Canada has a democratic deficit..............................................................................................1
1.2 Disproportional election results and manufactured majority governments...........................3
1.3 Canadians support proportional representation and the current electoral system................5
Chapter II: Representative Democracy.......................................................................................8
2.1 Why democracy?.......................................................................................................................8
2.2 Democracy’s uneasy relationship with representation..........................................................10
2.3 Representative democracy: What exactly should it look like?..............................................12
2.3.1 Majority rule.............................................................................................................15
2.3.2 Representation of all.................................................................................................18
2.3.3 Political equality.......................................................................................................23
2.4 Why not direct democracy?.....................................................................................................25
2.5 Why not sortition?...................................................................................................................29
2.6 Descriptive and substantive representation............................................................................32
2.7 Authorization and Accountability...........................................................................................37
2.8 Theory of proportional representation...................................................................................39
vi
Chapter III: Features of Electoral Systems...............................................................................44
3.1 Constituency structure: defining how seats are structured...................................................45
3.1.1 District magnitude....................................................................................................45
3.1.2 Complex districting: multiple ‘tiers’.........................................................................46
3.2 Ballot structure: defining how votes are cast.........................................................................47
3.2.1 Categoric versus ordinal ballot................................................................................47
3.2.2 Number of votes........................................................................................................48
3.2.3 ‘Blank’ ballots...........................................................................................................49
3.2.4 Choice of candidate (or lack thereof) within parties................................................50
3.3 Formulae: defining how votes translate into seats................................................................51
3.3.1 Plurality....................................................................................................................51
3.3.2 Majority.....................................................................................................................52
3.3.3 ‘Proportional’ formulae............................................................................................53
3.3.3.1 Largest remainder methods........................................................................54
3.3.3.2 Highest average methods...........................................................................56
3.3.3.3 Largest remainder versus highest average methods...................................58
3.3.3.4 Lists............................................................................................................59
3.3.3.4.1 Closed lists..................................................................................59
3.3.3.4.2 Fully open lists............................................................................59
3.3.3.4.3 Semi-open lists............................................................................60
3.3.3.5 Best candidates method..............................................................................60
3.3.3.6 Thresholds: limiting proportionality..........................................................61
vii
Chapter IV: First-Past-the-Post..................................................................................................64
4.1 Minimizing needless change (Criterion 1: Palatability)........................................................64
4.2 Pros of first-past-the-post........................................................................................................66
4.2.1 Simplicity (Criterion 2).............................................................................................66
4.2.2 Local geographic representation (Criterion 3).........................................................68
4.2.3 Accountable members (Criterion 4)..........................................................................69
4.2.4 Accountable government? (Criterion 5)...................................................................71
4.3 Cons of first-past-the-post.......................................................................................................74
4.3.1 Meaningless votes (Criterion 6: Meaningful votes)..................................................74
4.3.2 Can create a ‘weak’ or ‘ineffective’ opposition (Criterion 7: Effective opposition).77
4.3.3 Distorted election results (Criterion 8: Proportional representation of parties).....78
4.3.4 Exaggerates regional differences (Criterion 9: Regionally balanced
governments)..................................................................................................................................80
4.3.5 Excludes local minorities from representation (Criterion 8: Proportional
representation of parties)...............................................................................................................82
4.3.6 Does not ensure true majority rule (Criterion 8: Proportional representation of
parties)...........................................................................................................................................84
4.3.7 Ineffective representation (Criterion 8: Proportional representation of parties).....85
4.3.8 Biased against women and minorities (Criterion 10: Demographic
representation)...............................................................................................................................87
Chapter V: Other Electoral Systems..........................................................................................90
5.1 Criteria for evaluation............................................................................................................90
viii
5.2 The alternative vote (AV)........................................................................................................91
5.3 The single transferable vote (STV).........................................................................................99
5.4 List proportional representation (list-PR)............................................................................109
5.4.1 Closed-list PR.........................................................................................................110
5.4.2 Open-list PR............................................................................................................111
5.4.3 Semi-open list PR....................................................................................................112
5.4.4 List-PR with multiple tiers of seat allocation..........................................................112
5.4.5 Is list-PR a suitable option for Canada?................................................................113
Chapter VI: Mixed systems: the ‘best of both worlds’...........................................................119
6.1 Mixed-member proportional representation (MMP)...........................................................120
6.1.1 Proposal of the Ontario Citizens’ Assembly on Electoral Reform..........................120
6.1.2 The Law Commission’s proposal............................................................................121
6.1.3 Why must voters have two votes in mixed-member proportional?.........................127
6.1.4 Mixed-member proportional’s fatal design flaw.....................................................130
6.2 One-vote mixed-compensatory systems................................................................................132
6.2.1 Irvine’s proposal......................................................................................................132
6.2.2 Baden-Württemberg’s system..................................................................................134
6.3 Evaluation of existing systems summarized.........................................................................138
Chapter VII: Proportional-first-past-the-post........................................................................142
7.1 Summary of proportional-first-past-the-post (P-FPTP)......................................................143
7.2 Proportional-first-past-the-post (P-FPTP) explained..........................................................144
7.3 Atlantic region simulation....................................................................................................147
ix
7.3.1 New Brunswick Simulation.....................................................................................148
7.3.2 Prince Edward Island Simulation...........................................................................152
7.3.3 Newfoundland and Labrador Simulation...............................................................156
7.3.4 Nova Scotia Simulation...........................................................................................159
7.3.5 Pooling regional points and assigning them to provinces......................................163
7.4 Pooling points nationally......................................................................................................168
7.5 Large provinces with provincial sub-regions.......................................................................171
7.6 Alberta simulation with provincial sub-regions...................................................................173
7.7 What happens if a party wins more seats than it is ‘entitled’ to?........................................177
7.8 Comparing proportionality with other systems....................................................................179
Chapter VIII: Conclusion.........................................................................................................183
Bibliography...............................................................................................................................192
Appendix A, “Atlantic Region candidates from the three major parties”....................................208
Appendix B, Table 7-9B, “Alberta 2011 federal election P-FPTP simulation: ‘minor’ parties...210
x
List of Tables
Table 3-1, “Highest average seat allocation method with D’Hondt sequence”.............................58
Table 4-1, More Recent “Wrong Winners”....................................................................................74
Table 7-1, “New Brunswick 2011 federal election P-FPTP simulation”.....................................149
Table 7-2, “Prince Edward Island 2011 federal election P-FPTP simulation”............................154
Table 7-3, “Newfoundland and Labrador 2011 federal election P-FPTP simulation”.................158
Table 7-4, “Nova Scotia 2011 federal election P-FPTP simulation”...........................................161
Table 7-5, “Points pooled in Atlantic Region”.............................................................................165
Table 7-6, “Atlantic Region seat allocation”...............................................................................167
Table 7-7, “Points transferred to national tier from each region”................................................169
Table 7-8, “Allocation of national seats to regions”....................................................................171
Table 7-9A, “Alberta 2011 federal election P-FPTP simulation: ‘major’ parties”......................175
Table 7-9B, “Alberta 2011 federal election P-FPTP simulation: ‘minor’ parties”......................209
Table 7-10, “Nova Scotia 2011 list-PR and MMP simulation”...................................................182
Table 7-11, “Actual and simulated LSq by province”.................................................................182
Table 7-12, “Atlantic Conservative candidates”..........................................................................209
Table 7-13, “Atlantic Liberal candidates”...................................................................................209
Table 7-14, “Atlantic NDP candidates”.......................................................................................210
Table 8-1, “Summary of electoral systems evaluation 1”............................................................185
Table 8-2, “Summary of electoral systems evaluation 2”............................................................186
xi
List of Figures
Figure 7-1, “Riding 1”.................................................................................................................146
Figure 7-2, “Riding 1 with ‘post’”...............................................................................................147
Figure 7-3, “Riding 2 with ‘post’”...............................................................................................147
Figure 7-4, “NB Riding 1”...........................................................................................................151
Figure 7-5, “NB Riding 2”...........................................................................................................151
Figure 7-6, “NB Riding 3”...........................................................................................................151
Figure 7-7, “NB Riding 4”...........................................................................................................151
Figure 7-8, “NB Riding 5”...........................................................................................................152
Figure 7-9, “PEI Riding 1”..........................................................................................................156
Figure 7-10, “PEI Riding 2”........................................................................................................156
Figure 7-11, NL Riding 1”...........................................................................................................159
Figure 7-12, “NL Riding 2”.........................................................................................................159
Figure 7-13, “NL Riding 3”.........................................................................................................159
Figure 7-14, “NL Riding 4”.........................................................................................................159
Figure 7-15, “NS Riding 1”.........................................................................................................163
Figure 7-16, “NS Riding 2”.........................................................................................................163
Figure 7-17, “NS Riding 3”.........................................................................................................163
Figure 7-18, “NS Riding 4”.........................................................................................................163
Figure 7-19, “NS Riding 5”.........................................................................................................164
Figure 7-20, “NS Riding 6”.........................................................................................................164
xii
Chapter I: Introduction: the state of Canadian representative democracy
Although we like to think of ourselves as living in a mature democracy, we live, instead, in something little better than a benign dictatorship, not under a strict one-party rule, but under a one-party-plus system beset by the factionalism, regionalism and cronyism that accompany any such system. (Harper and Flanagan 1996).
1.1 Canada has a democratic deficit
Ten years before Prime Minister Stephen Harper came to power with a minority
government in 2006 he famously described Canada as a “benign dictatorship” (Harper and
Flanagan 1996). To rephrase, Stephen Harper and Tom Flanagan were implying that Canada was
(or is) somehow falling short of the democratic ideal. Can Canada, today, still be considered a
“benign dictatorship” or do we have reason to believe that this situation has improved? Has
Prime Minister Harper done anything since he came to power to transform what he called a
“benign dictatorship” into a genuine representative democracy? Some Canadians, such as
columnist Haroon Siddiqui (2009), for example, argue he is making the country even more
dictatorial. Stephen Harper, Tom Flanagan, and Haroon Saddiqui are certainly not the only
Canadians to have questioned the quality of Canadian democracy. Other Canadians have recently
made the claim that Canada is suffering from a “democratic deficit” (for example: Pilon 1999,
Rebick 2001, CRIC 2003, Lang-Dion and Wicks 2007, McDonald 2013, Canadian Index of
Wellbeing 2010).
Further, satisfaction with democracy among average Canadians has drastically declined
recently. Samara, a “non-partisan charitable organization that works to improve political
1
participation in Canada” (2013) reported in December of 2012 that 55 percent of Canadians were
satisfied with the way democracy works in Canada, down 20 percent from 2004 (Samara 2012).
Also, Samara discovered that only 36 percent of Canadians were satisfied with the way Members
of Parliament (MPs) do their job (Samara 2012).
Dennis Pilon argues, “PR [proportional representation] is definitely an answer to
Canada’s democratic deficit” (1999, 36). Pilon is one among many Canadian academics calling
for proportional representation. Recently, an alarming 132 political scientists from 36
universities have recently co-signed a statement calling for action to address Canada’s
democratic deficit. The statement identifies a proportional voting system as a key priority and is
worth quoting at length:
Time for action on Canada’s democracy deficit A call from Canadian political scientists
January 2010
Canada is now faced with a significant democracy deficit, illustrated by unstable short- sighted minority governments, superficial partisan posturing, steadily declining voter turnout and, most disturbing, an increasing majority of younger Canadians who see little value in voting or engaging in electoral politics.
As political scientists at Canadian universities and colleges across the country, we believe Canada can no longer afford to ignore the urgent need for electoral reform. We need an inclusive and functioning representative democracy based on a fair and proportional voting system.
We call on the Prime Minister and leaders of all parliamentary parties to set aside partisan interests and together support a substantive program to engage Canadians in a national discussion on: 1) fair voting principles – voter equality, proportional results and the formation of governments whose policies reflect the majority of voters, and 2) the various types of fair voting systems based on those principles.
We call on the government to engage experts, consult widely with citizens, and implement a Canadian version of a more proportional and fair voting system within the next five years (Fair Vote Canada 2010).
2
The academic consensus is that Canada is falling short of the ideal of representative democracy
and that a proportional voting system is needed to address this democratic deficit. This thesis will
explore the ideal of representative democracy and how a proportional voting system would, as
these academics imply, help achieve this ideal. The thesis then focuses on finding a suitable
model of proportional representation for Canada, or, what these academics have labelled “a
Canadian version of a more proportional and fair voting system” (Fair Vote Canada 2010).
1.2 Disproportional election results and manufactured majority governments
This call for a more proportional voting system implies that Canada’s current voting
system creates disproportional results. We only need to look at the most recent federal election
results to illustrate that this is, indeed, the case. In the 2011 federal election, after five years of
minority rule, Stephen Harper’s Conservatives were awarded a majority of seats in the House of
Commons with less than 40 percent of the valid votes (Parliament of Canada 2013). For nearly
half of Canadians who happen to believe that a government must win a majority of votes in order
to win a majority of seats (Bricker and Redfern 2001, 22), this may seem like an anomaly or
perhaps “undemocratic,” yet scenes such as these are far from uncommon in Canadian politics.
“Tories trampled in Liberal landslide,” the CBC reported after the 1993 general election (CBC
Digital Archives, Oct 26, 1993). Jean Chrétien’s Liberals were awarded 178 seats out of a total of
295—60 percent of the seats with only 41 percent of the votes (Parliament of Canada 2013). The
Progressive Conservative party was nearly wiped off the board during that election, when 16
percent of the vote gave them less than one percent of the seats—2 out of 295. Meanwhile, with
even fewer votes, 13.5 percent, the Bloc Québecois managed to secure 54 seats! Disproportional
3
results such as these, attributable to our first-past-the-post electoral system, may lead some of us
to seriously question the quality of representative democracy in Canada and whether it is time to
consider adopting a new electoral system. If one believes that Parliament should accurately
reflect the political will of Canadians it becomes difficult to justify maintaining a system that
creates such distortions. Since the first-past-the-post electoral system creates these distortions, it
is clearly an institution implicated in Canada’s democratic deficit. “How much democracy can be
going on when so many voices are distorted or absent? All evidence suggests that PR
[proportional representation] can do much better” (Pilon 1999, 20).
“Manufactured” or “false majorities,” as they can be termed, when a party wins a
majority of seats without receiving a majority of votes (like the Conservative majority during the
2011 election) are rather common in Canada. If one believes that majority rule is an essential
feature of democracy, and by extension, that the governing party or parties should represent a
majority of voters, one may take issue with such “false majorities.” Peter H. Russell (2008, 12)
shows that since 1921 there have been only three “true” majority governments, while there have
been 14 “false” majorities and 13 minority governments1. The Liberal Party, with their support
ranging from 38.5 to 41 percent, governed with a majority for over a decade before their majority
was reduced to a minority in 2004 (Library of Parliament 2011).
With highly “distorted” election results and common “false” majority governments, it is
no surprise that Canada can be said to have a democratic deficit or has been labelled a “benign
dictatorship.”
4
1 counting the 2008 and 2011 elections, which were not included in his book
1.3 Canadians support the idea of proportional representation and the current electoral system
Since the first-past-the-post electoral system causes many votes to be “ineffective” or
“wasted,” it can be argued that it leaves us with a Parliament and provincial assemblies which do
not accurately reflect the views of Canadians, undermining the quality of Canadian
representative democracy. The examples above illustrating the lack of correlation between
percentage of votes received and percentage of seats won show how this can, indeed, leave us
with a “distorted” Parliament. I will argue that in order to eliminate the democratic deficit in
Canada and transform the country into a genuine representative democracy, we must adopt a
“fair” and proportional voting system. Interestingly, a strong majority of Canadians have
consistently supported the idea of proportional representation over the past decade (Environics
2010, 2013, Forum Research 2012, CRIC 2005, LeDuc and Pammett 2003, Chénier 2002,
Bricker and Redfern 2001), yet Canadians have rejected specific models of proportional
representation in all provincial referenda to date (Barnes and Robertson 2009). I will argue that
this is in part because the models proposed were too far a departure from Canadian political
tradition and the current electoral system to have a broad appeal to Canadians. It is important to
note that even though a majority of Canadians support proportional representation in theory, a
majority of Canadians also report thats they are mostly satisfied with how the first-past-the-post
electoral system functions. A survey conducted by Decima Research found that 80.7 percent of
Canadians declared that they were either very or somewhat satisfied with the current electoral
system when a short preamble explained how it functioned: “people vote in an electoral district,
and the candidate with the most votes wins (LeDuc and Pammett 2003, 47-48).” Yet in the same
5
survey a strong majority reported that they would be very or somewhat supportive of the
introduction of proportional representation.
I will argue that since Canadians support proportional representation in theory, yet also
support their current electoral system and are hesitant or reluctant to change when confronted
with a specific model of proportional representation, a Canadian solution must be sought.
Canadians, it seems, want to keep the current first-past-the-post electoral system but they also
want proportional electoral results. These desires appear, at first glance, somewhat contradictory,
yet they are not necessarily so. I will argue that a Canadian version of proportional representation
that keeps the key features of the first-past-the-post electoral system intact could potentially gain
public support and even pass a referendum. To date, there has not been such an electoral system
proposed for Canada. I will show that this so-called “proportional” first-past-the-post system is
achievable by making adjustments to the electoral formulae and districting. I will outline this
original, made-in-Canada proportional electoral system in Chapter 7, which, if adopted, I will
argue, has the potential to transform Canada’s elected assemblies into genuinely representative
assemblies without radically changing the system.
In light of the failed attempts at electoral reform, the proposed system is designed to be a
system that minimally changes the current system while at the same time addressing its
problems. Before delving into the specifics of this system and other electoral systems, the next
chapter will explore the theory of representative democracy. Since electoral reform is aimed at
eliminating our democratic deficit and bringing us closer to the ‘ideal’ of representation
democracy, this ideal should be made clear. How would a proportional voting system bring us
closer to this ideal? Why is representative democracy desirable? These questions will be
6
discussed as well as alternate conceptions of democracy such as direct democracy and
democracy by sortition. In the next chapter I will outline the essential aspects of representative
democracy, according to various democratic theorists. By getting a picture of what representative
democracy is supposed to resemble in the ideal, we will be better able to evaluate the present
state of Canadian democracy and electoral system options. Although ideals tend to not be fully
realizable, they are benchmarks to aim for. The aim is, of course, to come as close as possible to
the ideal of representative democracy, keeping in mind Canadian political culture and tradition,
and the apparent lack of appetite for major political change among many Canadians.
Although other factors may be contributing to Canada’s democratic deficit, this thesis
focuses on the electoral system. After a discussion of the theory of representative democracy in
Chapter 2, Chapter 3 will examine key features of electoral systems such as electoral formulae,
ballot structure, and districting. By understanding these features, we will gain a better
understanding on how these features can be modified to accomplish a desired result. Chapter 4
will explore the pros and cons of the current first-past-the-post electoral system. The aim is to
identify the aspects of the system that should be maintained and those that should be discarded.
Based on this evaluation, I develop a list of criteria with which to evaluate prospective electoral
systems in Canada. Chapter 5 and 6 will examine other “major” electoral systems and evaluate
them based on this list of criteria. In Chapter 7 the proposed proportional-first-past-the-post
electoral system will be explained and evaluated.
7
Chapter II: Representative Democracy
2.1 Why democracy?
Representative democracy is, above all, a way of peacefully changing governments. The
“weapons” are ballots, not bullets; “enemies” debate with, rather than kill each other. The
winning side governs because it has superior numbers in the assembly, rather than superiority on
the battlefield. When we compare elections to alternate ways in which governments change
hands we can appreciate the beauty and genius of representative democracy. In the words of
former Prime Minister Pierre Trudeau, “Human groupings took a great step towards civilization
when they agreed to justify their actions by counting heads instead of breaking them” (Fairfield
2008, xiv). The bloody civil wars in Libya and Syria are but two recent examples of
undemocratic and violent methods of changing, or attempting to change the way one’s country is
governed. As Paul Fairfield writes:
Given the ineliminability of disagreement and conflict, one of democracy’s fundamental aims is to prevent conflict from escalating into violent confrontation or revolution. As several commentators have noted, democracy is a method of managing disagreements through peaceful means, hence of transforming enemies into opponents by means of the ballot box and other legal procedures (Fairfield 2008: xiv).
As democratic systems give citizens the opportunity to elect, re-elect (authorize), and throw out
representatives and governments (hold accountable), it makes violent overthrow of governments
or revolution unnecessary and unjustifiable. Elections permit the peaceful “overthrowing” of
governments; revolutions become irrational: why would a group try to violently overthrow a
government when they could do it peacefully and legitimately through elections? The argument
of democratic stability is certainly not new. It echoes the wisdom of some ancient political
8
thinkers such as Marcus Cicero: Cicero remarked: “‘there is no form of government less subject
to revolution or more stable’ than democracy” (Fairfield 2008: x-xi; from Cicero 1929, 136).
Karl Jaspers beautifully sums up why this is true:
in democracy, government can be, and in fact is, changed, brought down, or reconstructed by constitutional means, without recourse to violence. Under free democratic conditions, it is impossible for the same men to remain permanently and uninterruptedly in the exercise of government (1953, 161).
The paradox of democracy is that it is stable because it has institutionalized instability.
Democracy is thus a means for peacefully selecting a government and allowing change of
government while ensuring stability, and not an end in itself, yet, as Fairfield notes, “it is a
common phenomenon for human thinking to mistake a means for an end” (2008, 15).
Democracy does not prescribe what the purpose of government should be or what state policies
should be, only, rather, how it should be selected. The purpose of government and government
policies are up for debate in democracy, much like everything else.
Elections contrast with other, more dangerous ways to change governments, such as coup
d’états, revolutions, and civil wars. By understanding that the prevention of violent confrontation
is at the heart of representative democracy, this not only helps us understand the importance of
elections, but the importance that an electoral system be perceived as “fair.” As the International
Institute for Democracy and Electoral Assistance (IDEA) explains, “if an electoral system is not
considered fair and the political framework does not allow the opposition to feel that they have
the chance to win next time around, losers may feel compelled to work outside the system, using
non-democratic, confrontationalist and even violent tactics” (IDEA 2008, 6).
9
2.2 Democracy’s uneasy relationship with representation
Literally, the word democracy means “rule (kratos) by the people (demos)” (Fairfield 2008:
xv), however, as Joseph Shumpeter notes, democracy “does not mean and cannot mean that the
people actually rule in any obvious sense of the terms ‘people’ and ‘rule.’ Democracy means
only that the people have the opportunity of accepting or refusing the men [and women] who are
to rule them” (1976: 284-85). People directly ruling over themselves is simply not feasible
considering the size and population of modern countries, or as democratic theorist Robert Dahl
explains, "since all cannot, in a community exceeding a single small town, participate personally
in any but some very minor portions of the public business, it follows that the ideal type of a
perfect government must be representative" (1998, 95). Even if the logistical problems that
“pure” forms of democracy have with large or dispersed populations can be bridged with
technology, the issue of time cannot be easily solved, as will be discussed when alternate
conceptions of democracy are explored.
As Hannah Pitkin illustrates in The Concept of Representation (1967), political
representation is a very complex idea with many different conceptions of what political
representation is or ought to be. In a Hobbesian sense, all political leaders are de facto
representatives, whether selected democratically or not. The fact that “every government claims
to represent” (Pitkin 1967, 2), fails to tell us what makes one government ‘democratic’ and
another ‘undemocratic.’ To begin to understand what we can and cannot call a representative
democracy, let us consider a state in which only white, property-owning men were permitted to
vote. We would not properly label such a state a “democracy” since excluding groups from
voting is undemocratic. All the people must have equal political rights in order for a state to be
10
possibly considered democratic. Yet, is the universal or near universal franchise all that is
required for political equality, or should all votes also count equally? Do all votes currently count
equally, considering that some votes elect representatives while others do not? Representation,
although essential for modern democracy, makes it difficult to determine if and when voter
equality is achieved and who is or is not represented in legislatures. Citizens cannot be physically
present in the legislatures, but how can we determine if they are present otherwise, through their
representatives?
[R]epresentation, taken generally, means the making present in some sense of something which is nevertheless not present literally or in fact. Now, to say that something is simultaneously both present and not present is to utter a paradox, and thus a fundamental dualism is built into the meaning of representation (Pitkin 1967, 9).
Since everyone cannot directly rule in any meaningful way, we must therefore somehow make
citizens who are literally absent, somehow “present” in the legislative assemblies if our state is to
be considered democratic. Representation can serve to “make present” or “re-present” in another
form, those who are, in fact, absent. Voters can make their preferences known during elections
and contribute to the election of a representative whom they believe will represent their views in
Parliament. A voter who contributes to the election of a representative, as such, can be
considered “represented,” but what can be said about the voters who “lost”? How can it be that a
citizen is re-presented through their member, if they have no member they helped elect? Are
these citizens not, therefore, excluded from representation? As stated, democracy requires that no
group be excluded. Should it not follow that in order for a scheme of representation to be
considered democratic, that all groups must therefore be represented in the assembly, and
represented equally? Does the definition not require us to “make present” all the people, who are
11
“not present literally or in fact” rather than just some of them? If a citizen’s vote does not
contribute to the election of a representative or to the overall makeup of the assembly, is this
citizen therefore excluded? Is such a system “fair”? Supporters of proportional representation
(proportionalists) argue that such arrangements are not fair or democratic. In light of these
questions, the next section will explore what, specifically, is needed in order for a scheme of
representation to be considered democratic.
2.3 Representative democracy: what exactly should it look like?
Fairness is often cited as a one of the conditions required for democracy, but what
constitutes “fair” is ill defined. It is included in Robert Dahl’s list of requirements for large-scale
representative democracy (1998, 85):
Large-scale democracy requires1. Elected officials2. Free, fair, and frequent elections3. Freedom of expression4. Alternative sources of information5. Associational autonomy6. Inclusive citizenship
Without denying the importance of the other requirements for representative democracy, this
thesis focuses primarily on democratic requirements as they relate to the electoral system. In
particular, what does it mean for an electoral system to be “fair”? Is fairness simply the absence
of electoral fraud, or is more than this required? Excluding groups from representation, or
representing them unequally, even if it is a consequence of the electoral system, could certainly
be considered “unfair”. Would such a situation not make a country, in a literal sense, a de facto
non-democracy? Fairness is closely tied into the idea of equality, and in a representative
12
democracy, inequality means unfairness. Since equal political rights is a prerequisite for a state to
be considered a democracy; should it not follow that equal voting power and equal political
representation are also needed for a state to be considered a “fair” and “genuine” representative
democracy?
Proportionalists argue that votes which do not contribute to the election of a member or to
the overall makeup of the assembly are “ineffective” or “wasted” and therefore not equal to those
votes which are “effective” (see, for example: Gordon 2006, MacIvor 1999, Fair Vote Canada
2005, Electoral Reform Society 2014). This can be said to create unequal voting power, which
can be considered unfair. A counter-argument can be made that no votes are “wasted” since a
vote is an expression of preference. While we can recognize that philosophically all votes count
as an expression of preference2, even deliberately spoiled ballots, the fact still remains that some
votes count towards the election of representatives, while others do not. Some votes are
“effective” while others are “ineffective” or “wasted.” An election is more than an opinion poll;
elections elect Parliaments with real power. I must side with proportionalists who argue that all
votes should count not only as an expression of preference, but actually count towards the
election of a parliamentarian, and count equally. For this thesis I will use Gallagher and
Mitchell’s definition of “wasted votes”:
those votes that do not contribute towards the election of any candidate or party (for example, those cast for losing candidates or for parties that did not win a seat, and ‘surplus’ votes cast for a candidate or party over and above the number they required)” (2005, 636).
13
2 For example, Alina Abott argues “Why Green is NOT a Wasted Vote”: “Every vote cast for the Green Party sends a message that Green values and policies are important” (2007)
Proportionalists argue that voting systems that produce an excessive number of such wasted
votes are “unfair,” even “undemocratic” (For example, Fair Vote Canada 2005).
Equality and fairness are themes that keep emerging from democratic theorists:
Arend Lijphart writes of the “classic democratic value of equality” (Lijphart 1984: 2). When we
study democratic theory closely, equality is, no doubt, at the heart of democracy. Richard S. Katz
writes that, “no theory can be said to be democratic without a significant element of
equality” (1997: 100). Enns and Wlezien write that "procedural equality remains an important
standard in modern democracies" (2011: 1). Paul Fairfield further writes that “Beneath
democracy's disparate institutional forms and interpretations is a yearning for equality that is
deeper than politics and that transcends it" (2008: 80).
The academic consensus concerning democracy is that it requires political equality. Since
representation is required to make democracy possible, it follows that equal representation and
equal voting power must also be required. Proportionalists take issue with certain electoral
systems that create disproportional results which equate to unequal representation and unequal
voting power. Political equality is an essential feature in democracy. In representative democracy,
political equality implies voter equality. If some votes are effective and others are not, if some
votes elect and others do not, votes cannot be considered equal. Equal and effective votes is
therefore required in an ideal representative democracy.
Ernest Naville wrote in 1865: "In a democratic government, the right of decision belongs
to the majority, but the right of representation belongs to all" (Barber 2000: 62). This famous
remark reveals two more important features of representative democratic government: majority
rule and the representation of all. These features of representative democracy are well-founded
14
among theorists. They echo another famous theorist from the same era, John Stuart Mill, who
wrote:
In a representative body actually deliberating, the minority must of course be overruled; and in an equal democracy… the majority of the people, through their representatives, will outvote and prevail over the minority and their representatives. But does it follow that the minority should have no representatives at all? Because the majority ought to prevail over the minority, must the majority have all the votes, the minority none? Is it necessary that the minority should not even be heard? ([1861] 2010, 59).
When we compare this to Hannah Pitkin’s writings, we see that, over one-hundred years later,
supporters of proportional representation, or “proportionalists” as she terms them, essentially
hold this same view: “They often argue that, although decisions must be made by majority rule,
minorities have a right to representation" (Pitkin 1967: 64). In the next section we will discuss in
more detail these three important features of representative democracy mentioned above:
political equality, representation of all, and majority rule.
2.3.1 Majority rule
When we examine Canada’s “democracy” according to these three fundamental criteria
mentioned above, it quickly becomes evident that the majority rule criterion is not upheld
because as shown above, a government need not be supported by a majority of Canadians in
order to win a majority of seats. John Stuart Mill criticized the first-past-the-post electoral
system for failing to ensure that the powers of government are given to a majority:
Democracy, thus constituted, does not even attain its ostensible object, that of giving the powers of government in all cases to the numerical majority. It does something very different; it gives them to a majority of the majority, who may be, and often are, but a minority of the whole (Mill 1861 [2010], 60).
15
Although Mill was referring to nineteenth century Britain, this same criticism holds true for
Britain and Canada in the twenty-first century. The situation today is perhaps even worse for
majority rule than Mill describes, as he assumes that each member is elected by a majority of the
votes, as would be the case in a strict two-party system. Although members may be elected with
a majority in their riding, there is no such requirement: a relative majority or plurality is
sufficient to win a seat in any riding. Since Canada has a multi-party system, more than two
candidates usually contest ridings and so members are often elected with less than 50 percent of
the vote in their riding (Library of Parliament 2011). Some recent extreme examples of members
elected with low levels of support include: the member for Gatineau elected with only 29 percent
of the vote in 2008, and the member for Vancouver Centre elected with only 31 percent of the
vote (Library of Parliament 2011). Although MPs do not typically get elected with much less
than 30 percent of the vote in their respective ridings in Canada, it is important to note that with
more candidates and parties contesting the election, this could be even lower. One of the most
extreme cases of this happening under first-past-the-post was the 1992 election in Papua New
Guinea which saw a member get elected with only 6.3 percent of the vote in his riding (Reilly
2001: 84)!
Australia’s solution to this problem of some members getting elected with less than a
majority of votes was to modify the electoral system in 1918 so as to allow voters to rank
candidates on their ballots (Newman 1989, Scott 2006: 6, 13). This ensures that all candidates
have at least 50 percent support in their respective ridings, even though it may not be first choice
support. This is referred to as the Alternate Vote (AV), or the preferential ballot, but it still is only
a minor improvement, if at all, because it still fails to solve the problem Mill points out, that
16
governments thus elected may still fail to represent a majority of voters because a majority of a
majority may still only represent a minority. To illustrate Mill’s point, let us suppose that the
legislature has 100 seats, 51 being required for a majority. Using the Alternate Vote would
ensure that each member is elected with a ‘majority’. Suppose the winning party wins 51 percent
of the seats with 51 percent of the vote in each of those ridings; the party would then form a
majority government with the votes of 26 percent of the voters (a majority of a majority). The
popular vote for the the winning party would, of course, be higher than this, since it would have
also received votes in ridings that it lost. None of the votes in the losing ridings, however, would
have contributed to the party winning its majority.
A proportional voting system, on the other hand, would ensure “true” majority rule. Since
parties receive a percentage of seats in the legislature corresponding to their percentage of votes,
a government winning half of the seats would have received a majority of votes. If no parties
manage to secure a majority of seats alone, two or more parties representing a majority could
form the government, or, a minority government could pass legislation with support of one or
more parties who, combined, form a majority.
2.3.2 Representation of all
It may be the case that an MP in a neighbouring riding, or even across the country may
champion policies that resonate with voters who could be said to be without representation. That
MP could be said to be “virtually” representing citizens who believe in the policies the member
champions. Richard Katz is one such academic who asserts that “most voters are represented
most of the time, albeit often in the virtual sense when another district elects a representative of
17
their party” (1997: 122). There is certainly a great degree of merit in this view, as the opinions of
those voters may indeed be represented by other candidates. This view, at least, seems more
plausible than the view that a representative represents all the residents in a particular riding,
simply because he or she was elected by some of the residents in that riding.
In his classic work, Considerations on Representative Government ([1861] 2010) John
Stuart Mill criticizes the first past the post electoral system for leaving many citizens without
representation. Mill is concerned not only with the possible absence of majority rule, but also of
the lack of representation of many voters. Mill believes that those deviating from the local
majority (or plurality), since they do not elect a representative, are simply not represented. He
does not take into account “virtual” representation when he writes: “The electors who are on a
different side in party politics from the local majority [or plurality] are unrepresented” (Mill
1862 [2010], 60).
A century-and-a-half later, Mill’s criticisms of first-past-the-post are still worth
examining. As no constituency is a politically homogenous entity, to say that a representative of
a particular riding represents the entire riding would be absurd. They simply represent a majority,
or even a plurality, of citizens in their district. Allowing for “virtual” representation, some may
consider that these otherwise “unrepresented” citizens may be represented, in some sense, by
other members. There may be a degree of truth to this, as these members may be doing the
actions that constitute “representing.” One problem with this, however, is that those who can be
said to be virtually representing a group were not authorized by that group, nor are they
accountable to them. By championing certain policies, a member may substantively represent a
certain group, yet if this member is not elected by this group, nor accountable to them, can it be
18
considered a democratic form of representation? A non-governmental organization (NGO), for
example, that champions a certain cause can be said to “represent” certain groups of people, but
if members of this organization are not elected by those they are said to represent, it is not a
democratic form of representation, even though it may be a substantive and beneficial form of
representation.
On a similar but different note, let us consider a dictator who rules in the interest of his
subjects, or, a ‘benevolent dictator’. If this ruler substantively represents his subjects, would we
consider his rule “democratic”? Democratic representation is more than simply ruling in the
interests of the people. Electoral democracy and democratic representation necessitates that
representatives be selected by and accountable to, the people. This is essentially what
differentiates a dictatorship, which may or may not be benevolent or substantively represent its
subjects, from a democratic government (which likewise may or may not be benevolent). In a
dictatorship, the people lack power over their governments, whereas in an electoral democracy,
the people can change their governments simply by voting during elections.
It could be said that those living in a benevolent dictatorship are virtually represented,
much the same way it can be said that those who cast ineffective votes in imperfect democracies
may be virtually represented. If one’s interests are represented in the legislature and through
policy, one can be considered to be “virtually”, and even substantively represented, regardless of
the nature of one’s political system. We may concede that the concept of virtual representation
shows that voters with ineffective votes may be represented in the legislature, in some way, but
does this justify these ineffective or wasted votes? If a necessary aspect of electoral democracy is
to have the legislature selected by the people, should we find it acceptable when a large portion
19
of votes are ineffective or “wasted”? Is a large number of ineffective votes a “necessary evil” of
electoral democracy? Must a large percentage of voters elect no one, or should we try to
minimize these ineffective votes? Is lacking an effective vote much different than lacking the
franchise? Is claiming that ineffective votes are acceptable because these voters are “virtually”
represented through effective voters, akin to claiming that without the franchise, tenants are
represented through their landlords, or that women are represented through their husbands? If
virtual representation is satisfactory for a large portion of the population that lacks direct
representation, should we not also be contented with only men of property having the franchise,
since one could argue that the rest of us would be virtually represented through them? Some
beings, of necessity, can only be virtually and not directly represented, pets and animals, for
example, and children (although until what age is up for debate). There seems to be no
satisfactory reason, however, to withhold effective voting and direct representation from adult
citizens.
Virtual representation may exist in an imperfect electoral democracy, as citizens whose
votes had no bearing on the election results may end up somehow being substantively
represented by other members, just as in former times some women, as well as some landless
men may have been substantively represented by the representatives of the land-owners; such
virtual representation, however, does not equate to democratic representation. Therefore, the
representation of all criterion cannot be said to be fulfilled in a democratic sense by virtual
representation. For citizens with ineffective or “wasted” votes, much like if they had no right to
vote, the government would not have been authorized by, nor would it be accountable to them.
20
We are forced to recognize different types of political representation and to recognize that
the key to democratic representation is the ability of people to select their own representatives.
This differs from substantive representation, whereby governments represent the interests of the
people, but are not necessarily (but may be) selected by them. If we claim that these citizens are
democratically represented because their interests are represented, we must also accept the
argument that dictatorships are also democratic governments as long as they govern in the
interests of their subjects. “[E]very government claims to represent” (Pitkin 1967, 2), but unless
the people selected the government, and can hold the government accountable in the next
election, we cannot consider it to be democratic. Elections are a part of what is required for
democratic representation, but as Wessels explains, "The implementation of elections alone is not
a sufficient condition for democratic representation—even though it is a necessary
condition” (Wessels 2011, 99). Who then, after election, can be said to be democratically
represented, and who can be said to be without democratic representation? Logic dictates that
those citizens whose votes were ineffective or “wasted” did not select their representatives, and
are thus not directly represented. These are the “losers” of the election; those that despite trying,
are left without democratic representation. They may find themselves “virtually” or substantively
represented, but is this sufficient for democracy? The question at this point, as it concerns
electoral democracy, becomes: should all citizens have the power to choose their representatives,
or must there necessarily be a significant number of “losers” with ineffective votes and without
direct democratic representation?
Under our current voting system, every riding elects one member. This does not mean
that everyone in a riding is represented by its member. It is inconceivable for one person to
21
satisfactorily represent a multitude of contradictory views that are present in any constituency.
Some will argue that the many voters who cast “wasted” votes are left unrepresented. In their
opinion, a vote that does not contribute to the election of a member, is a wasted or ineffective
vote. Likewise, some may even consider surplus votes to be “ineffective”, because they were in
excess of what was needed to get that member elected, although they would not be “wasted,” in
the sense of failing to receive representation. As we can see, there are different ideas about what
constitutes an ineffective or wasted vote. To say that a voter who cast an ineffective vote is still
represented, but in the virtual sense, over-simplifies the matter of democratic representation.
Even to say that a voter with an “effective” vote is substantively represented is somewhat of a
simplification. As the views of voters may not completely match with any particular party or
candidate, they may, in reality, be represented by multiple parties and candidates. If, as Richard
Katz claims, “most voters are represented most of the time” (1997: 122), does this sufficiently
address the claims of proportionalists who argue that many voters are left unrepresented or
represented unequally because of disproportional election results?
Even if we share the opinion that those not locally represented are, somehow, “virtually”
represented by members of their preferred party in other constituencies, or at least most of them,
most of the time (Katz 1997, 122), we must concede, nonetheless, that they are certainly not
equally represented. Some take issue with this unequal, “unfair” representation. Proportionalists
take issue with this, among other things. It may be impossible to judge the number of citizens
who are substantively or virtually represented in the legislatures; but at the very least, we can
compare the percentage of voters who cast effective votes with those who cast ineffective votes.
We shall consider the representation of all criterion to be fulfilled when all voters have cast
22
effective votes, or are directly as opposed to virtually represented. Whether or not this direct
representation is accompanied by substantive representation cannot be measured as it is a matter
of personal opinion; if voters feel they are not substantively represented by the member they
voted for, they may change their vote in the next election.
2.3.3 Political equality
Having established earlier that political equality is a necessary requirement for
democracy, we must now consider what is required for citizens to be considered political equals
in a representative democracy. Voting equality is, of course, a requirement of political equality.
Robert Dahl asks us to "consider what the criterion of voting equality requires: citizens must
have a right to vote and to have their votes counted fairly" (1998: 49). As demonstrated earlier
by examples of election results, voting equality is not the reality in Canada, even though
Canadians share this value. Many Canadians ignore the fact that their political values may not
match the reality. As Richard Katz notes, there has been “little attention devoted to the possibility
that some democratic values may be better achieved, or more seriously undermined, by one
variety of electoral system rather than another” (Katz 1997: 1). Groups such as Fair Vote Canada,
and other opponents of the first-past-the-post electoral system, appear to have good reason to be
critical of it. If the electoral system is undermining this fundamental democratic value of political
equality, as a glance at any election result suggests, then critics of the system may be justified in
calling the system “undemocratic.” How can voter equality be achieved if some votes are
effective, and others are not? If Canadians value democracy, then as certain groups argue,
Canadians may need to consider replacing the first-past-the-post electoral system with a
23
proportional system, as was done in New Zealand (Commonwealth Law Bulletin 1993, Mcleay
and Vowles 2007, Lundberg 2007, Wilson 2011).
Throughout his book, On Democracy, Robert Dahl stresses the importance of political
equality (1967). Dahl contends that "intrinsic equality" is a "principle of government that is
justified on grounds of morality, prudence, and acceptability" (1967: 68). He further writes: "a
process that guarantees equal consideration for all, you may reasonably conclude, is more likely
to secure the assent of all the others whose cooperation you need to achieve your ends" (Dahl
1998: 67). Applying the equality principle to the democratic institutions entails that all men and
women should be treated as political equals, not only having the right to vote, but to have their
votes count equally. As Robert Dahl states, "if we accept the desirability of political equality,
then every citizen must have an equal opportunity to vote, and all votes must be counted as
equal" (1998: 95). Dahl explains why those lacking an equal voice have reason to be concerned:
[I]f you are deprived of an equal voice in the government of a state, the chances are quite high that your interests will not be given the same attention as the interests of those who do have a voice. If you have no voice, who will speak up for you? Who will defend your interests if you cannot? And not just your interests as an individual. If you happen to be a member of an entire group excluded from participation, how will the fundamental interests of that group be protected (1998: 77)?
We have reason to believe that under the current arrangement in Canada, certain groups
may be excluded or represented unequally, since equal representation would require proportional
representation. Further, a system of representation that only allows for geographic constituencies
to be represented, like Canada uses, may ignore issues unrelated to geographic location. Laura
Montanaro summarizes the issue with exclusive geographic representation:
When the affected do not form a geographically bound electoral constituency, or a people bound by shared citizenship, the assumption that electoral membership
24
ensures inclusion of the relevant constituency may result in marginalizing or excluding many who are affected—sometimes the most affected—by collective decisions (2012, 1098).
“Surrogate” representation (as Montanaro refers to it) or “virtual” representation, when another
representative effectively acts as a representative for citizens outside of her constituency, can
help overcome some of the limitations of a system based solely on territorial representation, yet
such representation is free of electoral authorization and electoral accountability (at least from
those outside the member’s constituency).
Voter inequality, as some would argue exists, does not mean citizens who feel alienated
will necessarily rebel against the system, try to induce a revolution or coup d'état, or even
vandalize public and private property, but those who feel alienated from the system might
(wrongly) feel that such action is justified. Elections are, in theory, the avenue where citizens
may express their political grievances and try to advance their political agenda, however, if
citizens feel that their votes are "wasted" or do not count, why should they accept the authority of
the elected assemblies? I am certainly not suggesting that we denounce the authority of our
assemblies, because, at the very least, they have legitimacy stemming from tradition and
convention, but insofar as democratic legitimacy goes, ineffective or wasted votes and voter
inequality serve to undermine this democratic legitimacy.
2.4 Why not direct democracy?
For some, as shown above, representation is what makes democracy feasible and
possible, yet not all make this same conclusion. Although proportionalists find flaw with
legislatures that misrepresent, others take issue with the idea of representation itself. Some
25
consider representative democracy to be deficient because it is, admittedly, an indirect form of
democracy. They may consider that a more direct, participatory form of democracy desirable,
and may even consider representative democracy to be a “sham” compared to a “genuine”
democracy. In his famous “Green Book,” Libya’s former leader Muammar Gathafi writes: “True
democracy exists only through the direct participation of the people, and not through the activity
of their representatives” (Gathafi 1976, 2). Giovanni Sartori, on the other hand, defends
representative democracy against those who trivialize it. He writes: “against the contrary claims
of perfectionists, participationists and populists... representative democracy is not a sham” (1987:
170). More moderate supporters of direct and participatory democracy do not advocate the
replacement of representative democracy with another form, but to supplement it with direct
democracy, through more frequent referenda and increased participation of citizens. As noted
earlier, it is difficult, if not impossible, to make direct, participatory democracy meaningful in
today’s mass societies. Representation is the method used for overcoming the logistical problems
of making “rule by the people” meaningful and manageable. In short, representation makes
democracy possible. Public participation and referenda are useful tools that can certainly
compliment representative democracy by adding an element of direct democracy, but they
cannot, however, be reasonably offered as alternatives to it.
Further, many argue that too much direct democracy is undesirable and can have negative
consequences (Economist 2011, Epstein 2011, Kampen and Snijkes 2003, Cooter and Gilbert
2010). Referenda can add an element of direct democracy within a system of representative
democracy, yet Kampen and Snijkers write that “the amount of time citizens are prepared to
spend on referenda is limited. When the frequency of the referenda increases, there is a severe
26
risk that the motivation of the citizens to participate in the decision-making process
decreases” (2003, 494). Another shortcoming of expanding direct democracy is that it becomes
difficult for dispersed people to deliberate and negotiate. “Along with its strengths, direct
democracy has a weakness. Unlike legislators, citizens cannot compromise with one another.
They are too numerous and geographically dispersed, and they lack a bargaining forum in which
to negotiate” (Cooter and Gilbert 2010: 726). There is certainly a limit on how much direct
democracy is desirable and realistically achievable. Time is perhaps the biggest obstacle to direct
democracy: citizens have jobs, families, and social lives and the amount of time they are willing
to spend on referenda or in participatory assemblies may be very limited.
As mentioned, referenda or plebiscites is one method of adding an element of direct
democracy, and participatory assemblies where citizens participate directly, is another. The
“Brazilian model” of participatory democracy, or “Participatory Budgeting” (Orçamento
Participativo) has enjoyed a great deal of success, although it is not without problems. Enriqueta
Aragonès and Sánches-Pagès define participatory democracy as “a process of collective decision
making that combines elements from both direct and representative democracy (2008. 1). They
explain that this model, used in “nearly 200 Brazilian municipalities where direct democracy, in
the form of popular assemblies, coexists with formal political parties and local elections: Citizens
have to make a budget proposal but they also have to elect the city executive and legislative
bodies” (2008, 1-2). The Brazilian model has shown that participatory democracy need not
necessarily be a replacement for representative democracy, as more radical proposals might
suggest, but that it can be used as to complement representative democracy. Under this model
the elected representatives still make the ultimate decisions and are accountable to the electorate
27
during election. By maintaining a system of representative democracy alongside participatory
democracy, some of the major hurdles of participatory democracy, perhaps the most important
hurdles, can be overcome.
An obvious problem with participatory assemblies is that the vast majority of citizens do
not participate in these assemblies. Aragonès and Sánches-Pagès focus on the city of Porto
Alegre where this system has been in operation since 1989. They note that although attendance
has steadily increased, no more than 5 percent of citizens participate (2008, 3). Were these
assemblies not complemented by representative assemblies, one would imagine that a regime
based on popular assemblies alone, in which only 5 percent of the population participated, would
face serious legitimacy issues. The authors’ concluding remarks about participatory democracy
are worth quoting at length:
The reader may find the main institutional features of participatory democracy striking at first glance: Only the opinions of those who participate at the meetings are taken into account. On the contrary, in a representative democracy everybody’s opinion can be heard through the simple act of voting (surely, casting a vote is cheaper than attending an assembly). This comparison is misleading for two reasons. First, as mentioned before, many of the participants in the assemblies are representing families or communit[y] associations so it is not correct to think that only a few thousand opinions are heard. Another reason is that, as the low level of turnout in Western democracies indicates, this alleged advantage of representative democracy is doubtful: It is well known that the fraction of population systematically disenfranchised from the representative processes are the less educated and wealthy, precisely those segments overwhelmingly represented at the popular assemblies in Porto Alegre (Arragès and Sánches-Pagès 2008, 13).
The authors admit that participatory models of democracy indeed have some “striking” features,
but they downplay their significance. Combining participatory assemblies with elected,
representative assemblies appears to overcome this problem as citizens who do not (or can not)
attend assemblies still hold political power during elections. Another interesting aspect that
28
Aragonès and Sánches-Pagès bring to light is that even within a system of participatory
democracy, representation still exists. Individuals may, in fact, be speaking on behalf of groups
of people or associations. Indeed, they are most certainly speaking on behalf of other members in
the assembly as well: since time would not allow every person in attendance to speak on every
issue, and since many do not wish to speak, it may suffice for the competing viewpoints to be
heard. Those who do speak are therefore, in a way, “representing” those not speaking who share
their viewpoints. Representation, it seems, is unavoidable even in participatory assemblies.
Further, these assemblies, scattered about Porto Alegre, elect members to the Council of
the Orçamento Participativo whose “role is to design and submit to the city government a
detailed budget proposal based on the priorities determined in the regional assemblies, and to
monitor the execution of the approved public works” (2008: 2). What initially started out as
participatory assemblies, contrasted with elected, representative assemblies, transforms, out of
necessity, into an assembly of elected representatives. The experience of Brazil’s model of
“Participatory Budgeting” shows that participatory democracy can indeed complement
representative democracy, but it also highlights the inescapable need for representation. Perhaps
the need for representation comes down to the fact that "[w]ithout the instrument of
representation, the political subject would be fragmented and scattered" (Seitz 1995, 99).
2.5 Why not sortition?
While acknowledging that representation is necessary and unavoidable, we must admit
that representation, even full proportional representation, is not a panacea for all political ills. To
better realize the limitations of electoral representation we must briefly explore an alternate
29
means of selecting representatives associated with democracy. There are some, who, in the name
of democracy, would like to get rid of elections altogether and replace them with a more
“genuine” rule by the people, possibly with the use of sortition. Such an arrangement is, perhaps,
the only way to get a genuinely descriptively representative assembly. Their arguments are often
based on a differing conception of democracy and elections, similar to that of the ancient Greeks
who believed that elections were aristocratic or elitist (Carson and Martin 1999, 32; Zakaras
2010, 455; Laycock 2004, x). “To the Athenians the lot was democratic; elections were
considered aristocratic or oligarchical. Only with the lot was there genuine rule by the
people” (Carson and Martin 1999, 32). The ancient Greeks were justified to believe in the
aristocratic nature of elections as even in today’s societies it has become apparent that those who
tend to get elected are far from “representative” of the population, that is, they do not resemble
“ordinary” people. According to the ancient Greeks, and modern experience, elections do,
indeed, favour the “elite.” As Aristotle (2000 [1885 trans.],165) wrote: “the appointment of
magistrates by lot is democratical, and the election of them oligarchical.”
Drawing on the wisdom of the ancient Greeks, as well as many other theorists from
various centuries, Carson and Martin, somewhat radically, argue the case for bringing the lot, or
sortition, back into politics, which they say can be justified with the four following reasons: “(1)
promotion of equality, (2) representativeness, (3) efficiency, and (4) protection against conflict
and domination” (1999, 34). The authors note that a number of different sortition-based systems
are possible for the replacement of representative democracy, including ancient Athenian style of
democracy, randomly selected citizen legislatures, assemblies, and bureaucracies, and a very
radical system conceptualized by John Burnheim which he termed “demarchy” (Carson and
30
Martin 1999:,102-116). In Burnheim’s “demarchy”, policy is decided by randomly selected
“functional groups,” however, there is no government, as such, and no bureaucracy to enforce
the decisions made by the functional groups, no military, no courts, and perhaps not even a
police force (Carson and Martin 1999, 102-116). The idea of randomly selected functional
groups studying certain issues and making decisions in demarchy has its merits, and many of us
might be prepared to embrace it as a compliment to our current system, however, the other parts
of “demarchy” such as the removal of government as we know it without any mechanisms for
enforcing decisions or settling disputes, seems rather idealistic and unworkable.
The “representativeness” of randomly selected assemblies or functional groups would,
evidently, be a stark contrast to the aristocratic nature of the current system that creates an
assembly whose members do not resemble the everyday people they represent. Even parties said
to represent the working class appear to have a disproportionate number of non-working class
members in their ranks, yet, must this necessarily compromise their ability to represent working
class citizens? Are citizens who do not resemble their representative, necessarily not
represented? If a voter chooses a representative who has a different level of income or education,
is this voter left unrepresented because of this? Should we not leave it up to the voter to decide
by whom she wishes to be politically represented? Are voters not in a better position to
determine who would best substantively represent them?
Hannah Pitkin observes that "voters often prefer to elect men [and women] who are not
representative (typical) of the district, and that may be a good thing" (1967, 90). Further, De
Grazia explains that “so-called democracies have been known to select representatives by reason
of their superior class position rather than to reject them because of it” (1951, 5-6). This is where
31
the aristocratic nature of elections becomes evident. The word ‘aristocracy,’ from the Greek
words aristos, meaning “best” and kratia, meaning “power,” “rule” (Hoad 1986, 22), literally
means ‘rule by the best.’ Since it is our aim during elections to elect the “best” citizens to
represent us, and since by definition aristocracy means “rule by the best,” it appears that it is
technically an aristocracy that we are hoping to achieve through elections, or, perhaps, a
democratically elected aristocracy.
There is certainly a trade-off between election and sortition: one gives descriptively
representative assemblies, the other the ability to authorize and hold accountable. For those who
would prefer an assembly to represent the nation as an exact miniature or to hear views of
“ordinary” citizens, sortition would be preferable. For those, on the other hand, who would like
the ability to choose or authorize our representatives and to hold them accountable, election is
preferable. Which feature is more important? I believe this comes down to the main function of
representative democracy discussed at the beginning of the chapter, namely, to allow for the
peaceful changing of governments. Elections allow citizens to exercise real power collectively
through voting rather than by force. This is not to say that sortition cannot or should not be used
at all in a political system. It could possibly be deemed appropriate in other places, such as for
the selection of juries, committees, or members of an upper house, for example.
2.6 Descriptive and substantive representation
After noting the various conceptions of what democracy is or ought to be (representative,
direct, participatory, or through sortition), we must now explore what the act of representing is or
ought to be. How should representatives “make present” citizens who are literally absent? Should
32
the legislature be an exact microcosm of the entire country, reflecting, in miniature, all the
characteristics of the country at large? Would such a microcosmic representation ensure that the
interests of all citizens and the nation as a whole would be taken into account? Would such an
assembly ensure that the political opinions of citizens and their visions for the nation would be
represented, that is, would it substantively represent the nation? Should we place primary
importance on the empirical characteristics of representatives such as age, sex, level of income,
or education? What about their province or country of origin? What about other physical
characteristics such as height, weight, eye colour, and hair colour? What about physical or
mental disabilities? In other words, how much importance should be placed on descriptively
representing citizens? Should candidates’ physical and empirical characteristics trump their
political beliefs and stances on policy and how well they are perceived to represent their
constituents?
The reality is that if primary importance is placed on such an accurate descriptive
representation, then elections should not be the method used for selecting representatives
because elections tend to favour the elite (the wealthy, the well-educated, the well-spoken, the
charismatic, and so forth). As noted in the previous section, elections are “intrinsically
aristocratic” (Manin 1997) because citizens aim to elect not ordinary folk, but choose whom they
believe will be their “best” representative.
For an assembly that descriptively represents the nation, selecting members at random
would do a better job than election at selecting average, “everyday” people. Admitting what
some may perceive as a shortcoming of election, that is, its intrinsically aristocratic character, is
not to suggest that we should not attempt to create more diversity in our legislatures, including
33
equal numbers of men and women and more minority representation, which we, of course,
should do. Succeeding in this may, however, only give us an illusion of diversity. Those elected,
although they may look more diverse, would likely still come mainly from society’s “elite”: more
educated, wealthier, and better spoken than “ordinary folk.” In other words, by electing more
women and minorities, we might simply elect more “elite” women and minorities. Even still,
when it comes to evaluating electoral systems, as we will do more in depth later, we should
prefer those that help parties offer slates of candidates with greater diversity and gender parity, to
those that do not.
A descriptively representative assembly would not necessarily ensure that citizens would
be substantively represented. That is, citizens’ views and opinions would not necessarily be
accurately represented simply because the legislature empirically resembles an average group of
citizens? Political opinions are not determined by one’s physical and empirical characteristics.
Hannah Pitkin writes: "No institutional system can guarantee the essence, the substance of
representation" (1967: 239). Pitkin admits here that no matter what type of system used, or the
scheme of representation, that it will be no guarantee that those elected will “represent” well
those whom they are said to represent. Physical characteristics cannot determine how well a
member will represent his or her constituents, that is, how well the member will perform as a
political representative.
Looking at physical characteristics alone tells us very little about how well citizens are
represented. Rather than looking at the characteristics of citizens and deciding how well they are
represented, should we not let citizens decide themselves by whom they wish to be represented?
Parties can and should be encouraged to present a more balanced slate of candidates, including
34
an equal number of male and female candidates and more minority candidates. An assembly of
half men and women and more minority representation, for example, would be of great symbolic
importance, but it would not necessarily proportionally reflect the views of citizens if certain
factions or parties remained overrepresented while others underrepresented.
Having acknowledged that elections are essentially undemocratic in the ancient sense of
the word because they favour the elite and fail to produce legislatures that are “typical,”
contrasted with the lot, we must stress the importance of elections for stability by empowering
citizens at the ballot box. While it is true that elections fail to produce descriptively
representative legislatures, descriptively representative legislatures, accomplishable by using
sortition, would not necessarily be any better than elected legislatures at substantively
representing citizens. As Hannah Pitkin argues, an accurate descriptive representative fails to
guarantee substantive representation:
The fact that a man or an assembly is a very good descriptive representation does not automatically guarantee that they will be good representatives in the sense of acting for, that their activity will really be representing. In the realm of action, the representative's characteristics are relevant only insofar as they affect what he [or she] does (1967, 142).
Representing in the political sense, is more than simply resembling one’s constituents. It appears
that what representatives do, and how well they represent their constituents’ interests, or
“substantively” represent them, also needs to be taken into account. Yet, how to best “represent”,
and who or what, exactly, one must represent, is a matter of debate and opinion. On the question
of who members ought to represent, A. H. Birch summarizes this debate:
Innumerable writers and speakers have maintained that elected representatives have a duty to act as agents for their constituents… On the other hand, the most influential theorists in the Western world have stressed the need for elected representatives to do whatever they think best for the nation as a whole while
35
other writers again have insisted that the first duty of an elected person is to support his party (1971, 20).
Even when we detach importance from descriptive representation and stress substantive
representation, the problem of who one is supposed to represent is still not addressed. Does a
representative represent her constituency, her country, or her party? Suppose she represents only
her constituency, how can she possibly effectively represent a constituency with divergent
political opinions? Likewise, how could she effectively represent a nation that, like all nations,
has divergent political opinions? Representatives can certainly act on behalf of their nations and
constituencies, but this does not necessarily mean that they are substantively representing the
entire nation or even constituency. Given the fact that no constituency or nation is a politically
homogenous unit (that is, not everyone shares the same political opinions), we must ask whether
it is even possible for a single person to substantively represent a entire constituency.
I must argue that, considering all constituencies no doubt hold divergent political
opinions, we cannot claim that any representative, no matter how “good,” can effectively
represent all her constituents. Doing so would require the representative, for example, to be in
favour of a certain policy to please some constituents, while opposing it to please the other
constituents. This adds yet another layer of complexity on the puzzle of representation.
Considering the dilemma of constituency, nation, party, and the reality that one simply cannot
substantively represent an entire constituency or nation because these are not homogenous
entities, the reality is that representatives must attempt to balance all of these aspects of
representation. This is, no doubt, not an easy task. There may be no simple answer to the "the
question of whether the need is to represent opinions or interests, individuals or groups, localities
or the whole nation" (Birch 1971: 109). Further, we can ask if representation means to look like,
36
act like, or act for. The beauty of elections is that on election day, it is up to the voters to evaluate
their representatives and decide whether or not to keep them in office or to throw them out. If
representatives fail to play this delicate balancing game well, they may find themselves out of
office.
2.7 Authorization and Accountability
Carson and Martin write, “sortition does not lead to overrepresentation of male, middle-
aged lawyers” (1999, 34). Although, as just discussed, selecting members of assemblies
randomly would have some benefits, in particular, it would increase the “representativeness” of
assemblies, it would have serious flaws since representatives would not be “authorized” by the
people nor “accountable” to them. The power that citizens hold collectively during elections
would be lost if elections were replaced by lot, participatory assemblies, or some other method of
political selection. Without the power to collectively change governments during elections could
be potentially dangerous, as it turned out to be in Libya where its regime of supposed “direct
democracy,” or “jamahiriya” (“state of the masses”) was ultimately overthrown in a brutal civil
war (National Post 20 October 2011, The Times 22 October 2011). Authorization and
accountability are an important aspect of electoral representative democracy that would be lost if
elections were eliminated in favour of a more classical interpretation of democracy, using
sortition, for example, or direct, participatory assemblies such as in Gathafi’s “jamahiriya.”
Electoral representative democracy ideally gives all citizens the opportunity every few
years to authorize their representatives and governments to act on their behalf and allows citizens
to hold them to account. Other interpretations of democracy mentioned above lack these key
37
stabilizing factors, which is the main reason why they should only be considered as a
compliment to electoral representative democracy, rather than as a replacement. It is also why
change should be considered if the electoral system fails to create assemblies authorized by all
voters. Since Canada’s first-past-the-post electoral system is not a proportional system, it, by
definition, does not create an assembly based on all votes counted equally. In other words, the
assembly is only authorized by a portion of voters. If, for example, a member is elected with half
the votes in her district, the member may be considered to be authorized by half the voters in her
riding3. Proportionalists set the bar for democracy substantially higher by aiming for an assembly
not simply authorized by some voters, but authorized by all voters.
Hannah Pitkin (1967) explores these two conceptions, authorization and accountability,
one based on the representative being elected, hence “authorized” to act on behalf of
constituents, the other based on the representative being accountable to constituents during
elections. Yet, neither of these views prescribes what a representative ought to do, or what the act
of representing actually entails. These concepts, nonetheless, add something to the concept of
representation that is lacking by the descriptive theory. Replacing elections with sortition would
no doubt result in better descriptive representation, but it would take the power to choose away
from citizens and it may still not lead to citizens being substantively represented. We would end
up with legislatures that empirically “resembled” the nation, but we would also have legislatures
that were not elected by the people, hence “authorized” to act, nor would the politicians be
accountable to the public during elections. The importance of letting citizens decide themselves
by whom they wish to be represented cannot be overstated. Without the ability to elect and throw
38
3 That is, unless one argues that by participating in an election, one authorizes the results. If this is the case, low voter turnout may be real cause for alarm.
out representatives, the collective power of the people at the ballot box would be lost. Even
though electoral representation may have an aristocratic character, as the electorate tends to
favour the “elite” over average citizens, this does not mean that we should do away with
electoral representation in favour of sortition or a direct form of democracy.
Ultimately, in every society there needs to be a way to hold governments accountable, not
in a revolution, at the guillotine or the gallows, the chopping block or the firing squad, but by the
ballot box, and for this reason, electoral democracy must be maintained. If citizens feel that their
electoral system is not sufficiently democratic because of ineffective or unequal votes, then it
may be time to consider changing the electoral system. If Canadians believe, as they have
indicated in a number of polls over the past decade, that seats should be awarded proportionally
(Environics 2010, 2013, Forum Research 2012, CRIC 2005, LeDuc and Pammett 2003, Chénier
2002, Bricker and Redfern 2001), then this certainly merits an in-depth examination of our
electoral system options.
2.8 Theory of proportional representation
Should the Chamber of Representatives represent the electorate? That is the whole question. If such is the case, every opinion, however absurd, even monstrous it may appear, must have its representatives in proportion to its strength in the electorate (Victor Considérant (1842) from Hermens 1984, 15).
Proportional representation supporters (proportionalists) believe that all voters should be
represented in the legislative assembly, and represented equally (For example, see Mill 2010
[1861]). They oppose “false” majority rule, but not majority rule per se; they propose
proportional representation as a solution to the problems of “manufactured majorities” and
39
unequal representation. Themes of fairness and political equality, in particular, equal
representation, echo through the theories of proportional representation.
I have argued that representation is, indeed, necessary for making “rule by the people” or
democracy feasible in mass society (Laycock, x), and that it is essential for ensuring stability by
giving citizens a way to peacefully hold governments accountable. I have identified key features
of an ‘ideal’ representative democracy, namely majority rule, representation of all, and political
equality. I have argued that Canada’s electoral system fails on all three of these key dimensions
because a significant portion of the population’s votes are ‘wasted.' Proportionalists argue that
seats should be awarded to parties based on the proportion of vote parties receive. Proportional
representation would be a sort of “magic bullet” for representative democracy, if achieved, as it
would satisfy the key democratic criteria just mentioned. Proportional representation, however, is
just an ideal; where this ideal meets reality, that is, where it meets electoral systems, it gets
messy. Some electoral systems were created with proportionality as an objective, others, such as
the first-past-the-post system, were not. Disproportionality is simply an unintended consequence
of the first-past-the-post system.
Since different electoral systems fail to serve democratic ideals equally or the needs of a
given country, it is evident that electoral systems need to be evaluated within the context of a
specific country. For our purposes, we are interested in the Canadian context. Electoral systems
differ greatly in aspects such as ballot structure, districting, and formulas; systems appropriate
for some countries may not be politically acceptable in another. No democracy or electoral
system will be perfect in form and “it should not be forgotten that, even when ‘improved’,
democracy is still bound to be a messy business” (Somerville 2011, 432). There is a significant
40
tension that exists between the ideal of democracy and what is achievable or acceptable in
practice. In order to evaluate whether or not elected assemblies are, or a potential electoral
system would be sufficiently democratic, we must, as Giovanni Sartori explains, compare the
ideal to the real.
we may find sufficient resemblances between the ideal and the real, and in such case we shall say: This is a democracy. Democracies are declared as such, then, by comparing their ideals to their practice, and on the basis of whether the prescription does translate itself in some conforming manner into the reality (Sartori 1987, 478).
I have established that elections are an essential component of a modern democratic
system, yet, as discussed, some election rules may be more democratic than others.
Proportionalists argue that certain electoral systems cause some citizens or groups of citizens to
be unrepresented or underrepresented. As mentioned earlier, there are critics of the way in which
Canada elects its politicians. Many academics contend that Canada’s first past the post electoral
system needs to be changed, most notably, the 132 political scientists who co-signed a statement
calling on government to “implement a Canadian version of a more proportional and fair voting
system within the next five years” (Fair Vote Canada 2010). It seems that an in-depth
examination of our current electoral system and the options for replacement is needed. Would a
different electoral system improve democratic representation in Canada?
The theory of proportional representation promises not only to ensure “true” majority
rule, but also to ensure political equality and the representation of all voters, thus meeting these
three critical criteria and bringing the reality of representative democracy closer to its ideal. It is
important to note, however, that proportional representation is only a theory about what electoral
representation should look like, and as will be seen, implementation is messier than the theory.
41
Changes in the electoral system would be needed in order to achieve proportionality, but such
changes are not necessarily without side effects, one of the most serious being public opposition
to change. Achieving perfect proportionality is impossible, yet some systems achieve it better
than others. Along with proportionality, other factors must be considered, in particular, what is
politically feasible considering a country’s political traditions and expectations.
Other electoral systems, discussed in Chapter 5 and 6, come with different problems and
many of them may not be politically feasible in Canada. The biggest obstacle to achieving
proportional representation in Canada appears not to be a hostility to the theory,4 but to issues
with the various electoral systems proposed that aimed to achieve it, as suggested by the failure
of all referenda and reform initiatives in Canadian provinces to date (Barnes and Robertson
2009). Various electoral systems and their issues will be discussed, as well as a system that may
be thought of as an “ideal” solution that balances proportionality with Canadian political
tradition. Given the difficultly of electoral reform in Canada, this thesis aims to deliver what
academics called for in their co-statement to government: “a Canadian version of a more
proportional and fair voting system.5”
As noted, electoral reform attempts thus far in Canada have been unsuccessful. The
challenge of reform is indeed a great one. Citizens and government alike can resist electoral
reform. Without the political will among politicians, however, electoral reform cannot move
forward. Stephen Harper and Tom Flanagan beautifully sum up why it is difficult to get
governments to support electoral reform: “it is seldom in the short-term interest of the party in
42
4 A majority of Canadians are consistently favourable to the idea of proportional representation (Environics 2010, 2013, Forum Research 2012, CRIC 2005, LeDuc and Pammett 2003, Chénier 2002, Bricker and Redfern 2001).
5 From statement by 132 political scientists from 36 universities (Fair Vote Canada 2010).

power to carry out electoral reform; by definition, the system worked admirably for those now in
power and changing the system might benefit the opponents next time” (Harper and Flanagan
1996).
43
Chapter III: Features of Electoral Systems
Before analyzing Canada’s first-past-the-post system and major existing alternatives, it
helps to get a broader understanding of the mechanics of electoral systems. This chapter looks at
the features of electoral systems and how they can vary, including the constituency structure, the
ballot structure, and formulae.
The electoral system is the set of rules that determine how voters vote, and how their
votes translate into representatives. It stipulates how many votes each citizen may cast, how
voters must cast their ballots: whether or not voters may rank their votes, must mark an ‘X’ or
write in a candidate’s name or identification number, vote for an individual candidate or
candidates, or for a party list. It determines how many members will be elected in each
constituency (one, a few, many, or a combination), and the number and size of constituencies..
The threshold for victory is also determined by the electoral system; in other words, whether an
absolute majority of votes in a riding is required, or if a relative majority is sufficient (plurality),
or if a certain quota or other formula is applied to elect candidates or to determine the makeup of
the legislature or of a geographic area. It also determines if there is a mechanism which adjusts
for the “wasted,” “disregarded,” or “surplus” votes in order to get a more proportional result.
Before moving on to the evaluation of electoral systems, it helps to get an understanding
of their key variables. In his pioneering study, Douglas Rae identified the key variables of
electoral systems as districting, ballot structure, and formulae (1967, 16). By tinkering with these
three variables, we can create countless possibilities of electoral systems. André Blais elaborated
by defining the functions of the three main variables that were identified:
44
(1) those that define how votes are cast, i.e., the ballot structure: (2) those that define how seats are structured, what I call the constituency structure; and (3) those that define how votes are translated into seats, i.e., the formula (1988, 103).
In order to determine which electoral systems might be appropriate, it helps to understand the
general tendencies associated with different rules.
3.1 Constituency structure: defining how seats are structured
3.1.1 District magnitude
The district magnitude determines how many candidates are elected per riding. At one
extreme, it can be as low as “one,” that is, the country (or province, state, city) is divided into
separate ridings, each electing only one member, as is the case currently in Canada. At the other
extreme, the district magnitude can be equal to the number of members in the assembly when all
members are elected in a single, nation-wide riding, as is the case in the Netherlands (Gallagher
and Mitchell 2005, 5). In the middle of these two extremes there can be many different riding
sizes or combinations. The well-known effect district magnitude has on proportionality was put
succinctly by Douglas Rae: “as district magnitudes increase, disproportionality decreases at a
decreasing rate” (1967, 139). Whether a country elects members from one-member, five-
member, ten-member, or one-hundred-member constituencies, or some other combination (say,
for example, 1-3 members in rural ridings, with 5 - 10 members in urban ridings), it will have an
effect on proportionality. Districts electing a greater number of representatives will have a
greater level of proportionality than those electing a few members. This relationship may sound
like bad news for those desiring both local representation and high proportionality. This
45
relationship is particularly troubling for electoral reform in Canada since Canadians have shown
to be favourable to the idea of proportional representation, yet have a tradition of and a liking for
single-member ridings. At first glance this relationship would suggests that in order to achieve a
high degree or proportionality, Canadians must sacrifice local representation or single-member
ridings, however, as will be seen next, there is a simple way to solve this dilemma without
making major “trade-offs,” by creating multiple levels or ‘tiers’ of representation.
3.1.2 Complex districting: multiple ‘tiers’
The tendency noted above, “the smaller the average district magnitude, the greater the
disproportionality” (Gallagher and Mitchell 2005, 12) suggests that a high level of
proportionality and local representation are polar opposites. With just one level or ‘tier’ in which
members are elected, an unfortunate trade-off must, indeed, be made between local
representation and the level of proportionality (Gallagher and Mitchell 2005, 12). “Mixed”
systems, where members are elected from overlapping tiers, may be the ‘best of both
worlds’ (Shugart and Wattenberg 2001) because they can get around this dilemma and offer both
a high level of proportionality and local representation (Gallagher and Mitchell 2005, 12).
Disproportionality in lower-level tiers (single-member districts, for example), can be corrected
for in higher-level tiers (larger, multi-member districts), as is the case in Germany and New
Zealand under mixed-member proportional where the district magnitude of the first or nominal
tier is ‘one.’ The first tier need not necessarily be single-member districts, and may be multi-
member districts as is the case in Belgium and Denmark (Taagepera and Shugart 1989, 127-128).
If the number of compensatory seats is not sufficient to make the overall result proportional, the
46
system may permit extra or “overhang” seats as is the case in Germany and New Zealand. This
feature essentially allows the House to expand in size in order to allow all parties to receive their
proportional entitlements. Another option, contrasting with an expanding House as required, is to
have the number of seats fixed in advance with no overhang seats, as is the case in Venezuela and
Bolivia. The overhang-seat procedure, however, “in systems in which proportionality is
calculated at the level of regional rather than nationwide multi-seat districts, it has the
disadvantage of increasing a region’s share of legislative seats beyond its fixed quota” (Shugart
and Wattenberg 2001, 23-24). Needless to say, in Canada, giving provinces or regions extra seats
would likely be contentious.
To summarize the important findings on districting, low district magnitude decreases
proportionality, creating an uneasy trade-off between local representation and proportionality,
however, creating multiple tiers of seat allocation can solve this dilemma and compensate for
disproportionality in lower-level tiers. As Gallagher and Mitchell explain, “Having more than
one level means that we might be able to have our cake and eat it” (Gallagher and Mitchell 2005,
12).
3.2 Ballot structure: defining how votes are cast
3.2.1 Categoric ballots versus ordinal ballots
A ballot that allows the voter to simply vote for a candidate or party is considered a
categoric ballot, while a ballot that allows the voter to rank candidates or parties is considered an
ordinal ballot (Rae 1967, Taagepera and Shugart 1989, 12), more commonly known outside of
47
academia as a ranked or preferential ballot. Canada uses a categoric ballot which instructs voters
to mark an ‘X’ next to the candidate of their choice, while Australia uses an ordinal ballot that
instructs voters to rank their preferences. Even though ordinal ballots may better determine
voters’ preferences, categoric ballots are simpler and more widely used (Taagepera and Shugart
1989, 12). An ordinal ballot is generally used to ensure that winners reach a pre-determined
threshold for victory (a majority or a quota).
3.2.2 Number of votes
The electoral system will stipulate if voters have one or many votes. Taagepera and
Shugart note that some ballots are sometimes not quite ordinal or categoric when the voter has
more than one vote (1989, 13). In the case of Germany and New Zealand under the mixed-
member proportional system (MMP), they are, in reality, two separate, but linked, categoric
votes rather than an ordinal-categoric hybrid ballot. Such systems with two votes are interesting
because “the logic of the system does not require that there be separate votes. There may be only
one vote” (Taagepera and Shugart 1989, 35). When the voter has two votes they need not
necessarily be linked as they are in Germany and New Zealand. They may be ‘parallel’ or
counted separately, without the allocation of seats from one vote affecting the other, as is the case
in Japan (Reed 2005, 281-282). Other systems may give multiple votes when electing members
to multi-member districts, for example, or when more than one round of voting is required.
48
3.2.3 ‘Blank’ ballots
A ballot need not necessarily contain any names or parties. Japan’s ballot is particularly
interesting in this regard, consisting of two blank ballots on which voters write a candidate’s
name for the single-member district on one ballot, and another to write the name of a party for
the proportional seats. Write-in ballots may be useful for their simplicity and can be particularly
beneficial when there is an excessively large number of candidates running for election in order
to avoid a large, cumbersome ballot, such as the recent ballot paper for the district of
Digamadulla, Sri Lanka: over one-metre long with 660 candidates contesting seven seats
(Samath 2010).
An obvious downside to write-in ballots, however, could be that they might be more
prone to unintentional spoilage. Canadians recently saw how easily a voter can make an error in
write-in ballots: the Premier of British Columbia first wrote her own name, but since she did not
reside in the riding in which she ran, she could not vote for herself and so also wrote the name of
her party’s candidate running in her electoral district6 (CBC News 8 May 2013).
Another blank ballot method of voting is employed in Finland where voters write the
identification number of the candidate on the ballot (Raunio 2005, 480; Ministry of Justice
Finland 2011, 14). Writing a candidate’s identification number is, undoubtably, easier than
writing a candidate’s name, particularly if the candidate’s name is long. In Finland, the master
list of candidates with their identification numbers is posted in the polling stations as well as
polling booths (Ministry of Justice Finland 2011, 14).
49
6 Even though a mistake was made, I suspect this ballot still counted. The communications manager of Elections BC explained, “The intent of the voter must be clear,” (CBC News 8 May 2013) and in this case, the intent to vote Liberal was indeed clear.
3.2.4 Choice of candidate (or lack thereof) within parties
The ballot structure will indicate whether or not voters will have a choice of candidates
within their preferred parties (Gallagher and Mitchell 2005, 10). If a party presents more than
one candidate, voters can indicate their preference, or they may be able to rank them or mark a
number of preferences. Evidently, if parties only present one candidate per riding or if there is a
closed list, voters are not able to choose their preferred candidates within their preferred party.
When proportional formulae are used, a party presenting a list of candidates would not be
splitting its vote since votes are aggregated at the party level and then seats won are allocated to
candidates. Likewise, a similar arrangement can even work in single-member districts: parties
could present more than one candidate or a list of candidates, voters indicate their preferred
candidate(s), and party votes would be aggregated: the seat would go to the most popular
candidate within the most popular party (Shugart 2005, 39-40). Matthew Shugart explains such a
rare case:
For many years, Uruguay was the one national level example of the use of PL [Preferential list] system in a single-seat district. Presidential elections were conducted by competing party slates, which usually contained more than one candidate. Voters voted for a candidate, but the winner was defined as the candidate with the most votes within the party with the most votes. In this way, uniquely among single-seat district systems, a party could present multiple candidates without fear of dividing its vote and throwing the seat to another party” (Shugart 2005, 39-40).
Although the situation he describes is a presidential7 contest, it shows that it is possible for
parties to offer more than one candidate in single-seat districts without splitting the party’s vote,
as long as votes are pooled at the party level. The party winning a plurality would win the seat;
the candidate of that party with a plurality of votes would occupy the party’s seat (Shugart 2005,
50
7 The presidential contest can be considered a competition for a single seat in a single-member district (the nation).
40). This way it is possible for parties to offer a choice of candidates in single-seat districts, even
though such a practice is effectively non-existent at present.
3.3 Electoral formulae: defining how votes translate into seats
The electoral formulae set the thresholds for winning a seat in Parliament, a legislative
assembly, a municipal council, and so on. The three main types of electoral formulae that will be
touched on below are: (1) plurality: gaining a seat by a relative majority, (2) majoritarian:
gaining a seat by an absolute majority, and (3) proportional: gaining a seat from a formula
designed to increase proportionality.
3.3.1 Plurality
Plurality, also referred to as relative majority (Taagepera and Shugart 1989, 21), is
perhaps the simplest electoral formula: the most votes win. The word ‘plurality’ is defined by
Gallager and Mitchell as “the largest number or share of a given quantity, though not necessarily
a majority” (2005, 634). The plurality formula applied to single-member districts is known as
‘first-past-the-post’ or ‘single-member plurality’. This formula can also be applied to multi-
member ridings. If applied to a 5-member riding, for example, the 5 candidates with the most
votes would each win a seat. In multi-member ridings when voters have more than one vote, but
less votes than there are seats, it is referred to as the ‘limited vote’; if voters have only one vote it
is the ‘single-non-transferable vote’ (SNTV8) (Lijphart 1984, 208).
51
8 “The single nontransferable vote (SNTV) is a special case of the limited vote in which each voter has only one vote in a district electing two or more representatives” (Lijphart 1984, 208).
The plurality formula described above is when it is applied to candidates, however, the
formula can also apply to parties in single-member ridings. The plurality rule applied to parties
would stipulate that the party with the most votes would win the seat (rather the candidate with
the most votes). Applying the plurality rule to parties rather than candidates would prevent the
splitting of votes between candidates of the same party. This cannot be done however, in multi-
member ridings9. Ways of allocating seats to parties in multi-member districts will be discussed
in the proportional formulae section in this chapter10. Once seats are allocated to parties, the
plurality formula can then be used to determine which candidates from that party would fill the
seats awarded11.
3.3.2 Majority
A majoritarian formula, as the name suggests, aims to ensure that winners have the
support of at least a majority of voters. There are two principal ways in which this is achieved:
through an ordinal or preferential ballot or by having more than one round of election. For
example, the alternative vote (AV) is when a majoritarian formula is applied to single-member
districts, necessitating the ranking of candidates (ordinal ballot). If no candidate receives a
majority of first-choice ballots, since a majority is required for winning, voters who voted for the
candidate receiving the fewest first-choice votes will have their second-choice votes redistributed
among the remaining candidates (Taagepera and Shugart 1989, 22). The process continues until
52
9 Imagine a 5-member riding in which parties A, B, C, and D had votes shares of 40, 30, 25, and 5 percent, respectively. The plurality winner would be Party A with 40 percent, but how many of the 5 seats would it then be entitled to?
10 section 3.3.3
11 That is, if voters can indicate a choice between candidates from the same party, such as when an ‘open list’ is used, discussed in section 3.3.3.4.
there is a clear winner with over fifty percent of the votes, but not necessarily first-choice votes.
A second round of voting or “runoff” election is also designed to be majoritarian. It
generally functions as two separate plurality elections, with a set period of time in between, with
the aim of achieving a majoritarian outcome (Taagepera and Shugart 1989, 21; Farrell 1997, 41).
In order to ensure a majoritarian outcome, only two candidates can compete in the final round,
however, the rules of the system will dictate which candidates can continue to round two; if more
than two, the final result may not be strictly majoritarian.
3.3.3 ‘Proportional’ formulae
The basic aim behind a proportional formula is to make parties’ share of seats correspond
to their share of votes. As noted earlier, however, this is also highly dependent on other factors
such as district magnitude and the existence or not of higher tiers. Since a single seat cannot be
divided among candidates or parties, proportionality necessitates multiple seats. The general
consensus, as discussed earlier, is: the more seats in a district (the higher the district magnitude),
or if higher tiers are employed, the higher the level of proportionality that can be attained
(Gallagher and Mitchell 2005, 12).
Although some formulas are designed with proportionality in mind, the formula itself is
not as important a factor in determining proportionality as district magnitude. Gallagher writes
that “There is strong evidence, indeed, that district magnitude affects proportionality more than
electoral formula does (1991, 44). Indeed, Taagepera and Grofman write that “pluralist elections
can be thought of as a special case of list PR, with M = 1 [district magnitude = 1]” (1985, 344).
There is, in reality, no such thing as a “proportional” formula. Formulas can be designed with
53
proportionality in mind, but other factors can heavily influence proportionality, effective district
magnitude perhaps being the greatest factor. Applying what could be considered a proportional
formula to low-district-magnitude ridings with no higher tiers of seat allocation will not deliver a
proportional result.
There has been some debate as to the best way to measure (dis)proportionality. Michael
Gallagher outlined this debate and the various existing indices with which to measure
proportionality and proposed the “least squares index” (LSq) (1991). “A least squares index
would entail squaring the vote-seat difference for each party; adding these values; dividing the
sum by 2; and taking its square root” (Gallagher 1991, 40). This method deliberately treats a few
large vote-seat differences as more severe than it would many small vote-seat differences.
Intuitively, one party gaining five percent more or less seats than “deserved” is less fair than five
parties each with one percent more or less seats, and the index reflects this. Lijphart used this
index in his 1994 study, writing that it is “the most sensitive and faithful reflection of the
disproportionality of election results” (1994, 62). Since Gallagher devised this index, it “appears
to have emerged as the most widely employed measure” for measuring disproportionality
(Gallagher and Mitchell 2005, 602). As such, it is the measure of proportionality that I will use to
gauge the proportionality of various electoral systems.
3.3.3.1 Largest remainder methods
These methods employ a quota and then allocate remaining seats according to the largest
remainders. The most basic method employs the Hare quota or simple quota: the total number of
valid votes divided by the number of seats in the district (valid votes/seats) (Taagepera and
54
Shugart 1989, 30). This quota reveals the number of seats a party would be entitled to receive if
strict proportionality were observed. If there were 10,000 votes in total in a 10 seat district, for
example, the quota would be 1000 votes (1000/10 = 100). If a party received 2340 votes, it
would have two full quotas and therefore receive two seats, with 340 votes leftover. The obvious
problem with this method is that all parties’ votes will virtually never divide evenly by the quota
and the remaining seats must be given out on partial quotas (largest remainders). Another way of
conceptualizing proportional seat “entitlement” is by percentages. In the example above, 2340 is
23.4 percent of 10,000, therefore, the party would be entitled to 23.4 percent of the seats. 23.4
percent of 10 seats is 2.34 seats. The issue, evidently, is that awarding seats to parties with partial
quotas will somewhat skew proportionality. Needless to say, it is not possible (or at least
feasible) to occupy portions of seats.12
Again, the higher the district magnitude, the less this is a problem as it increases the
number of seats allocated by full quotas and lessens the number allocated by partial quotas.
Other quotas can be used, such as votes divided by seats plus 1 (total votes/seats + 1), which
would reduce the number of seats given by partial quotas, but it might, however, make parties
“entitled” to more seats than there are to allocate (Taagepera and Shugart 1989, 30).
To avoid the rare circumstances of creating more seat entitlements than exist, the Droop or
Hagenbach-Bischoff quotas were divised (Taagepera and Shugart 1989, 30). Although
commonly mistaken as different formulae, they are, in fact, the same formula, but worded
differently (Dancisin 2013, Taagepera and Shugart 1989, 30). The formula reveals the minimum
number of votes needed for parties to win a seat while making it mathematically impossible for
55
12 It would be theoretically possible to award portions of seats by giving certain party members a weighted vote in Parliament, however, such an arrangement would be impractical.
more seats to be awarded than exist. The Droop (or Hangenbach-Bischoff) quota can be
mathematically written in various ways, but simply put, it is: the number of valid votes divided
by the number seats plus one, rounded to the next integer [(Votes/Seats+1)+1, rounded down]
(or, alternatively, the number of valid votes divided by the number of seats plus one, rounded up)
(Votes/Seats+1), rounded up (Dancisin 2013, 76). In a riding with 10,000 votes and 10 seats, the
quota to receive a seat would therefore be [(10,000/10+1) + 1] = 910 votes.
Quotas can also be used with an ordinal ballot. Voters rank candidates or parties in multi-
member ridings. The quota determines how many votes are needed for a candidate or party to
win a seat, such as the Hare or Droop quotas, described above. Under such a method, when there
are incomplete quotas and seats still remaining, these seats would not be allocated by largest
remainder, as described above, but by taking subsequent voter choices into account. The single-
transferable vote (STV) is a system that uses this method, which will be discussed in more detail
in Chapter 5.
3.3.3.2 Highest average methods
Another way of allocating seats to parties is by divisors or using the “highest average”
method. Vote totals by party are divided by a pre-determined sequence of divisors such as 1, 2, 3,
4, 5, and so on (D’Hont sequence). Each seat is awarded sequentially to
the party that presents the highest ‘average’—the ‘average’ denoting the number of votes it won divided by a number of seats it has already been awarded. Thus, while the first seat obviously goes to the largest party, its average is reduced because of this when it comes to competing for the second seat (Gallagher and Mitchell 2005, 284-285).
56
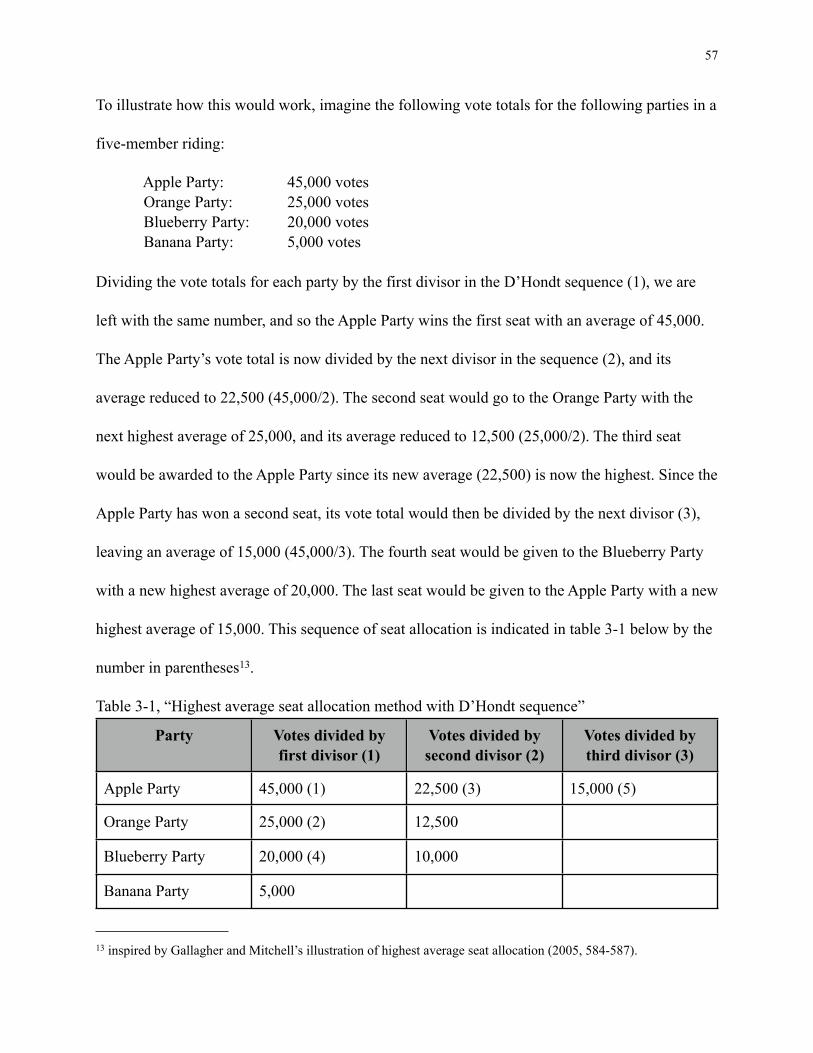
To illustrate how this would work, imagine the following vote totals for the following parties in a
five-member riding:
Apple Party: 45,000 votes Orange Party: 25,000 votes Blueberry Party: 20,000 votes Banana Party: 5,000 votes
Dividing the vote totals for each party by the first divisor in the D’Hondt sequence (1), we are
left with the same number, and so the Apple Party wins the first seat with an average of 45,000.
The Apple Party’s vote total is now divided by the next divisor in the sequence (2), and its
average reduced to 22,500 (45,000/2). The second seat would go to the Orange Party with the
next highest average of 25,000, and its average reduced to 12,500 (25,000/2). The third seat
would be awarded to the Apple Party since its new average (22,500) is now the highest. Since the
Apple Party has won a second seat, its vote total would then be divided by the next divisor (3),
leaving an average of 15,000 (45,000/3). The fourth seat would be given to the Blueberry Party
with a new highest average of 20,000. The last seat would be given to the Apple Party with a new
highest average of 15,000. This sequence of seat allocation is indicated in table 3-1 below by the
number in parentheses13.
Table 3-1, “Highest average seat allocation method with D’Hondt sequence”
Party Votes divided by first divisor (1)
Votes divided by second divisor (2)
Votes divided by third divisor (3)
Apple Party 45,000 (1) 22,500 (3) 15,000 (5)
Orange Party 25,000 (2) 12,500
Blueberry Party 20,000 (4) 10,000
Banana Party 5,000
57
13 inspired by Gallagher and Mitchell’s illustration of highest average seat allocation (2005, 584-587).
The D’Hondt sequence, shown above (1, 2, 3, 4, 5, and so on) is the most common
sequence (Gallagher and Mitchell 2005, 585). Another “main” but uncommon variant is the
‘Sainte-Laguë’ sequence (1, 3, 5, 7, 9, and so on) (Gallagher and Mitchell 2005, 585). More
common than Sainte-Laguë is the ‘modified Sainte-Laguë’ sequence: (1.4, 3, 5, 7, 9, and so on).
Theoretically, any sequence is possible, but only a few used in practice (Gallagher and Mitchell
2005, 585).
3.3.3.3 Largest remainder versus highest average methods
Certain divisor sequences or quota formulae are said to benefit larger or smaller parties
(Taagepera and Shugart 1989, 29-35). Arend Lijphart writes, “the largest remainder method
[Hare quota] treats large and small parties equally. The initial allocation of seats is exactly
proportional, and small and large parties compete for the remaining seats on an equal
basis” (Lijphart 1986, 173). The Hare or simple quota (total valid votes/seats), besides being
perhaps fair to parties of all sizes, is also the easiest to understand since it reveals the number of
seats a party would be entitled to according to the definition of proportional representation. The
Sainte-Laguë formula, along with the Hare quota, treat large and small parties unbiasedly and
typically produce the same outcome, while the Droop quota and D’Hondt formula tend to
produce the same result and give an advantage to larger parties (Gallagher and Mitchell 2005,
588-589).
Neither method can create a fully proportional result. The good news, as noted earlier in
the chapter, is that there is an easy way to correct for disproportionality. Employing higher-level,
over-lapping tiers can correct for disproportionality in lower tiers. The number of compensatory
58
seats required in higher level tiers to correct for disproportionality depends on the degree of
disproportionality in lower tiers. If the lower tier is comprised of single-member districts, a high
number of seats may need to be set aside to make the overall result proportional. If, on the other
hand, the nominal tier consists of multi-member districts, proportionality may be already high
and so a small number of seats may be sufficient to make the overall result proportional.
Germany sets aside 50 percent of its seats as compensatory, Denmark: 23 percent, Iceland: 18
percent, Sweden: 11 percent, and Norway: 5 percent (Gallagher and Mitchell 2005, 131; Farrell
1997, 70).
3.3.3.4 Lists
The obvious issue that arises from proportional formulae that determine the number of
seats a party should receive is to then determine which candidates in those parties will receive
those seats. A variety of lists can be employed to determine this, which may or may not give
voters a chance to influence which candidates get elected, as discussed below.
3.3.3.4.1 Closed lists. A closed list is controlled fully by the party. When the number of seats the
party has won is determined in a multi-member district, a number of candidates from the list get
elected to those seats, starting from the top of the list. If the party wins, say, 5 seats in the district,
candidates 1 through 5 would fill those seats.
3.3.3.4.2 Fully open lists. A fully open list is a list in which voters’ preference votes solely
determine which candidates get elected from the list (Gallagher and Mitchell 2005, 10-11,
59
Shugart 2005, 42). Simply put: party votes for individual candidates are pooled and determine
how many seats each party will receive, the candidates with the most votes within those parties
fill the seats the party has won. Depending on the rules of the system used, the voters may have
been given one or many preference votes to distribute within a party or even between parties. In
this case, the plurality rule would determine which candidates win. Likewise, the candidates
might be asked to rank votes within a party, and a similar process like that under the single-
transferable vote would occur until the seats the party has won are filled.
3.3.3.4.3 Semi-open lists. A semi-open or “flexible” list is one that is not fully closed or open. In
such a list, voters can express their preferred candidate(s), but “the party’s initial ordering of the
candidates determines the outcome unless sufficient numbers of voters combine to overturn
this” (Gallagher and Mitchell 2005, 10).
3.3.4 Best candidates method
In mixed systems lists are common, but not required for the system to function. The votes
in the first tier can serve to nominate candidates for seats in higher tiers: “As with the nominating
districts used in some list PR systems (such as Slovenia), seats are allocated to parties across a
multi-seat district, but are allocated to candidates within parties according to their success at
garnering votes in the nominating districts” (Shugart and Wattenberg 2001, 13). When the
number of higher-tier seats each party is entitled to is determined, candidates with the most
votes, who do not already occupy a constituency seat, would fill those seats. As such, there need
not be a predetermined list, per se: the “best” candidates, as determined by voters, would fill
60
party seats. Such a system would have some benefits over other systems, such as providing
“candidates with the incentive to be popular within their districts—even in districts that are
“hopeless” for their party to win in the nominal tier” (Shugart and Wattenberg 2001, 12-13). It
would also, needless to say, increase member accountability.
3.3.5 Thresholds: limiting proportionality
Proportionalists view high proportionality as ‘good’ or ‘fair’ or more democratic. Yet, as
Gallagher and Mitchell explain, most electoral systems, even proportional ones, have a way of
limiting the level of proportionality: “Proportionality is generally regarded as a ‘good thing’—in
moderation. Few electoral systems go for broke on the proportionality dimension; most have, in
practice, some way of limiting it” (2005, 13). Taagepera and Shugart write that “The threshold
can be incorporated into systems of PR to counteract the most often mentioned defect of PR: the
lack of any disincentive to the splintering of parties” (1989, 36-37). If absolute proportionality is
not desirable, electoral reformers should consider how and if it should be limited. Should a
threshold be met before being awarding list seats, such 5 percent like Germany, Czech Republic,
Latvia, Poland, Slovakia (Gallagher and Mitchell 2005, 13) and New Zealand (Vowles 2005,
297)?
If absolute proportionality is not desired, should an alternative, less arbitrary method be
used instead of a threshold? One such way of limiting proportionality without thresholds is by
the use of a formula said to slightly favour larger parties. Another way would be to deliberately
create small (low-magnitude) districts without higher-tier seat allocation. Carey and Hix, for
example, argue that low-magnitude proportional systems are the “electoral sweet spot” (2009). In
61
mixed systems, proportionality could be limited by not allowing “overhang” seats: any party that
receives more single-member district seats than its ‘entitlement’ would keep these seats at the
expense of smaller parties which may not receive their full proportional ‘entitlement’. The
degree of proportionality that is desired needs to be taken into account, and whether or not
measures should be in place to limit it in order to discourage party splintering, and the potential
consequences of adopting such measures.
Now that we have briefly identified the general ways in which electoral systems vary,
namely, the ballot structure, the constituency structure, and the formulae, we can better identify
features of electoral systems that can be tweaked to suit our purposes. As mentioned in the
introduction, the challenge of electoral reformers in Canada is to find a system suitable for
Canadians. To satisfy the ideal of representative democracy, it should give a proportional
outcome, yet there are a number of other, practical considerations that need to be taken into
account. It has been shown in a number of surveys over the past decade that Canadians
consistently support the idea of proportional representation (Environics 2010, 2013, Forum
Research 2012, CRIC 2005, LeDuc and Pammett 2003, Chénier 2002, Bricker and Redfern
2001). Canadians ‘ought’ to, based on this reality, accept a proportional electoral system, yet all
referenda to date have failed. This suggests that not any proportional system will do; Canadians
value their current electoral system. Perhaps the most telling survey on the subject was one that
discovered the vast majority of Canadians (80.7 percent) declared they were satisfied with the
current electoral system, yet in the same survey, a majority indicated they were supportive of
proportional representation (LeDuc and Pammett 2003, 47-48).
62
This needs to be kept in mind when evaluating the appropriateness or palatability of
potential electoral systems. The premise of this thesis is that a feasible system for Canada, as
mentioned, would maintain the best aspects of the first-past-the-post system, changing it as little
as possible, while achieving overall proportionality. This thesis seeks to deliver the type of
electoral system that Canadians desire: one that is like first-past-the-post, but delivers fair and
proportional election results. What, specifically, are the “good” aspects about first-past-the-post
that should be maintained? What should be changed in order to give the first-past-the-post
system a proportional outcome consistent with the ideal of representative democracy?
In the following chapter I will evaluate the pros and cons of the first-past-the-post
electoral system in Canada. This way, I will highlight the aspects that should be kept, and the
aspects that should be changed. I am arguing that since Canadians are hesitant about electoral
reform, less change is better and so should be minimized. But, I am also arguing that change is
needed and another electoral system should live up to the ideal of representative democracy. A
solution that minimizes change yet fixes the major problems of the current system evidently must
be sought. Based primarily on the pros and cons of the first-past-the-post system, I will develop a
list of criteria for evaluating potential electoral systems for Canada.
63
Chapter IV: First-Past-the-Post
4.1 Minimizing needless change (Criterion 1: Palatability)
Despite its shortcomings, most notably, the distortions it produces between parties’ vote
shares and seat shares, the first-past-the-post electoral system (FPTP), also known as single-
member-plurality (SMP) has numerous benefits. Supporters of first past the post claim that it is
simple, produces stable governments, and allows constituency representation (Farrell 1997, 13).
Similarly, Lijphart and Grofman note two important considerations for plurality supporters: “the
close and clear contact that is established between the representative and his or her
geographically defined constituency, and the unsurpassed simplicity of the voting
method” (1984, 7).
Proponents of change may sometimes focus so heavily on the flaws of first-past-the-post,
that they forget to recognize its strengths. It is the system that has been in place since the
beginning of confederation, so one could argue that it cannot be functioning as badly as some
proportionalists might argue; Canada is, after all, a “successful,” developed nation. Before the
universal franchise was granted, it could be similarly argued, according to this flawed type of
logic, that those not owning property, women, and minorities should not be given the right (or
privilege as it was) to vote, since the country was arguably being governed quite well without
them. It is here that the matter switches to one of democratic principle. Making votes equal and
effective, like the extension of the franchise, is about the principles of representative democracy
and political equality, and not simply a question of whether or not the country is being well or
poorly governed without equal and effective votes for all. Proportionalists argue that proportional
64
representation is needed in order to make a state fully democratic. The ideal of representative
democracy, as outlined earlier, requires majority rule, representation of all, and voter equality;
proportional representation promises to make this ideal of representative democracy a reality by
making all votes equal and effective.
The theory of proportional representation, however, encounters a number of problems as
it enters reality: in particular, since changes to the electoral system and perhaps even political
traditions are needed to accomplish proportionality, a great number of citizens will evidently
resistant change, as has been the case in Canada. The fact that citizens resist change, much like
the fact that many citizens resisted the expansion of the franchise beyond white, male, property
owners, is not, however, a legitimate reason to keep the status quo. It is, nonetheless, a reason to
seek change that is palatable, especially given the reality that Canadians have rejected all
proposed changed to the electoral system to date (Barnes and Robertson 2009). On that note, the
first criterion I list for any prospective system is palatability. This criterion is inspired by
Schwartz and Rettie’s “Ease of transition” criterion:
The government must be able to smoothly oversee the transition from an existing system to any new electoral model. The more foreign the system the more unpalatable change will be. Markedly different systems will not be seen as a viable alternative to the existing system (2002, 14).
First and foremost, we must ask if the system is palatable; if it is considered unpalatable, it
should not be considered as a viable option.
With the premise that minimizing change would make a potential voting system more
acceptable and palatable to citizens, this chapter examines the pros and cons of the first-past-the-
post electoral system to develop the remainder of the list of criteria. Identifying what is “good”
and “bad” about our current system will help us discover which changes we should consider and
65
which ones we should try to avoid. The first criterion, palatability, will, of course, overlap with
many of the other criteria, and there will be an inevitable high degree of overlap between other
criteria as well. As IDEA writes, “The quest for the most appropriate electoral system thus
involves assessing the available choices against the chosen criteria (always with history, time and
political realities in mind) in order to identify one or more options which will suit the needs of
the country concerned” (IDEA 2008, 5).
4.2 Pros of first-past-the-post
4.2.1.Simplicity (Criterion 2)
The first-past-the-post system uses a categoric ballot with the plurality formula in single-
member ridings. It has an undeniably simple method of voting: voters mark an ‘X’ next to their
preferred candidate, and the candidate with the most votes wins the riding. This method contrasts
with other voting methods, such as when voters are asked to vote two or more times or asked to
ranks candidates or parties in order of preference. There are no complicated formulas with first-
past-the-post, nor are there complicated methods for counting the votes. The simplicity of first-
past-the-post considered one of the system’s strengths and is applauded by its supporters (Farrell
1997, 13; Lijphart and Grofman 1984, 7). Dennis Pilon writes, however, that “the idea that
complexity is a problem must be argued for, not merely asserted. Democratic procedures do not
necessarily require simplicity but transparency in their workings” (1999, 33). Ideally, simplicity
would be maintained in a prospective voting system, but we are forced to acknowledge that no
proportional voting system is likely to be quite as simple as first-past-the-post. We should be
66
prepared to accept an increased degree of complexity when compared to first-past-the-post in
order to achieve proportionality, but at the same time we should also try to avoid needless
complications.
First-past-the-post’s simple, categoric ballot and simple plurality formula make the
system transparent and comprehensible at the riding level. If a simple, categoric ballot, could be
made effective, that is, if virtually all votes could count towards the election of a representation,
adopting a more complex ballot structure would therefore be a needless complication. A ranked
ballot would only be necessary if voters’ first choice votes would likely not count; similarly,
giving voters more than one vote would only be necessary if voters first vote may likely be
ineffective. If, on the other hand, a system could make voters’ one and only vote effective, there
would be no need for further rankings or for more votes.
Further, if a system were chosen that would likely make voters’ first-choice votes
ineffective, would it not conflict with principles of representative democracy noted earlier,
namely, that all votes should count, and count equally. If some voters cast effective first-choice
votes while others cast only effective second, third, or fourth-choice votes, is voter equality
really achieved? I would contend that those proposing systems in which many voters’ first-choice
votes will likely not be effective, should justify such a proposal. Multiple votes, the ranking of
candidates, or multiple rounds of voting are examples of methods that attempt to compensate for
a lack of effective first-choice vote by many voters. I would argue that on the principle of
democratic equality that it is preferable for a system to give all voters an equal and effective first-
choice vote. Further, if this is possible to achieve, complications such as multiple votes, ranked
ballots, or multiple rounds of voting would not be necessary.
67
Another aspect of first-past-the-post’s simplicity is that it is transparent and
comprehensible at the riding level. Citizens can see or hear the results of an election in a riding
and understand how the result came about: the candidate with the most votes won. Citizens can
put the result into perspective by observing the margin of victory by number of votes or by
percent of the vote. Citizens can also see if the winner won by an absolute majority or a relative
majority (plurality). Understanding the result at the riding level is simple and transparent,
however, when it comes to understanding the overall election result, first-past-the-post is not so
simple or transparent. Understanding how a party might, for example, under first-past-the-post,
win a majority of seats with 40 percent of the vote, or how a party might come second in number
of votes but third in number of seats, is more complex. As such, would it not also be best for
simplicity and transparency if an electoral system were comprehensible at the riding level (like
first-past-the-post), but also simple and transparent overall (unlike first-past-the-post)?
4.2.2 Local geographic representation (Criterion 3)
"Early parliament drew representatives from local communities because that is where and
how people defined themselves" (Rehfeld 2005, 71). In Andrew Rehfeld's The Concept of
Constituency, he traces the origins of constituencies to political life in England in 1295 (2005,
70). He notes that when the King expanded his council, "people were drawn from separate local
communities within England due to the essentially local life of people in thirteenth century
England" (Rehfeld 2005, 70). The idea of local, geographic representation has been ingrained in
British political culture for hundreds of years, and it consequently became embedded in
Canadian political culture as well. Elections Canada notes that geographic representation is an
68
underlying principle of Canada’s system of parliamentary representation “meaning that each
elector is represented in the House of Commons on the basis of a geographical division, called
the electoral district or constituency or riding” (2004, 3). Even though local communities are not
homogenous units, they still form part of the identities of Canadians and it is difficult to imagine
a Canadian Parliament without such local, geographic representation. Supporters of first-past-
the-post argue, quite rightly, that single-member districts create a strong and identifiable link
between representatives and their constituencies, which is seen as desirable (Farrell 1997, 13;
Lijphart and Grofman 1984: 7). Kenneth Carty writes that “in Canada, there is an interest in
trying to find systems that include the old values, reflecting the imperative of local
representation, the power of geography” and a desire “to find some way to combine those old
principles with new ones” (2005, 14). Although a firm majority of Canadians believe that parties
should receive a proportional number of seats, it is difficult to envision a Canada without local
representation or even without single-member districts. Indeed, a viable system for Canada
would reconcile these “old values” with the “new ones.”
4.2.3 Accountable members (Criterion 4)
With first-past-the-post, voters are able to vote not only for political parties, but for
individual candidates. This contrasts with closed list-proportional representation (PR) methods
where voters vote for a party and not a candidate, or for the list vote in mixed-member-
proportional (MMP) system that employs closed lists. Open-list systems avoid this pitfall.
Currently, unpopular candidates can be thrown out of office in elections, including party leaders,
because voters vote directly for every candidate. In systems with closed party lists, leaders and
69
those at the top of the list would essentially become immune or “unaccountable.” As Richard
Kelly writes in defence of first-past-the-post in the United Kingdom: “More than ever, it seems,
voters require an electoral system that allows them to ‘individualise’ their support” (2010, 44).
Accustomed to using the same voting system and voting directly for candidates, any
feasible or palatable alternative must allow voters to continue to vote for candidates and not just
parties. Henry Milner wrote, after Ontario rejected a model of mixed-member proportional in a
referendum in 2007, that it was “doomed” from the start in part because it proposed a model
employing province-wide closed lists. As he explained, opponents “hammered away on the claim
that there would be 39 MPPs beholden to party headquarters instead of voters... this image of
unrepresentative party hacks from Toronto getting in through the back door was fatal” (2007).
Having some party members accountable only to party headquarters and not directly to voters is,
undoubtably, a difficult sell in Canada. As such, systems employing closed lists should not be
considered as a viable option in Canada if the system is to be approved by citizens.
The ability for voters to “individualize” their vote under first-past-the-post may, however,
be over-stated. Under the current arrangement parties only present one candidate per riding, so
the “choice” this gives voters is questionable, since party loyalists or those strongly favouring
certain parties have no choice within their preferred party. We might even consider the one
candidate offered per party per riding to be a list of only one candidate. Voters can choose to
endorse the party “list” by voting for the candidate, or vote for another candidate and party. One
might be tempted to think that under first-past-the-post it would be impossible for parties to offer
more than one candidate per riding since doing so would split that party’s vote. As was noted
earlier, although uncommon, if the rules were such that party votes were pooled at the
70
constituency level, each party could offer more than one candidate per riding without the risk of
splitting their party’s vote. In light of this, plurality systems, even in single-member districts,
need not necessarily limit the number of candidates per riding, per party, to one. A minor change
such as this would give voters more choice and make members more accountable; it could also
have other benefits such as increasing the number of women and minorities in legislatures, as
will be discussed later in this chapter. For this reason, and to increase member accountability and
voter choice, voters should not only have the opportunity to endorse or reject candidates between
parties, but also given a choice of candidate within the party.
4.2.4 Accountable government? (Criterion 5)
The performance of first-past-the-post for this criterion is not so straight-forward when it
comes to government accountability. The party (or parties) with the most seats is identified as
“the government” and its leader, the Prime Minister. Under single-party majority rule it is clear
who is in charge and on whom the credit or blame should fall. Yet, even though first-past-the-
post often “manufactures” majority governments, it also fairly often produces a Parliament in
which no single party has a majority. Whether a majority or minority governments are more
accountable is a subject of debate. Some argue that governments may even be more accountable
in minority rather than majority situations (Thomas 2006). Paul Thomas, a Parliamentary intern
who studied the 38th Parliament (minority) writes “the events of the 38th Parliament would
suggests that Canada’s democracy could be improved through the adoption of an electoral
system that increased the frequency of minority governments” (2006, 23). Peter Russell, in Two
Cheers for Minority Government, argues the merits of minority and coalition government.
71
My appeal is to those who have such a deep preference for majority government is to give parliamentary government—as opposed to prime-ministerial government—a chance, and to appreciate how minority government gives us the best opportunity to enjoy the virtues of parliamentary government (Russell 2008,158).
When, however, a majority of voters vote “against” the government, yet the government
is rewarded with a majority, it brings the ability of voters to hold governments accountable
seriously into question. Winning a majority government by receiving a majority of votes is one
matter, but we must ask ourselves: does exaggerating the number of seats won by the strongest
party so that it wins a majority of seats with much less than a majority of votes, make the
government more accountable, or does it perhaps make it less accountable?
We can also wonder if governments can be considered accountable when the “wrong”
party wins, that is, when another party receives more votes yet less seats. Kenneth Carty
examines this issue both federally and provincially. He explains: “we have an electoral system
that has a curious dynamic—one that can reward ‘losers’. We have not had many Prime
Ministers in our history, but four of them came to office when the majority of the population
apparently preferred somebody else” (Carty 2005, 4). The table 4-1 below illustrates how
common this “wrong winner” phenomenon has been provincially in recent years.
72
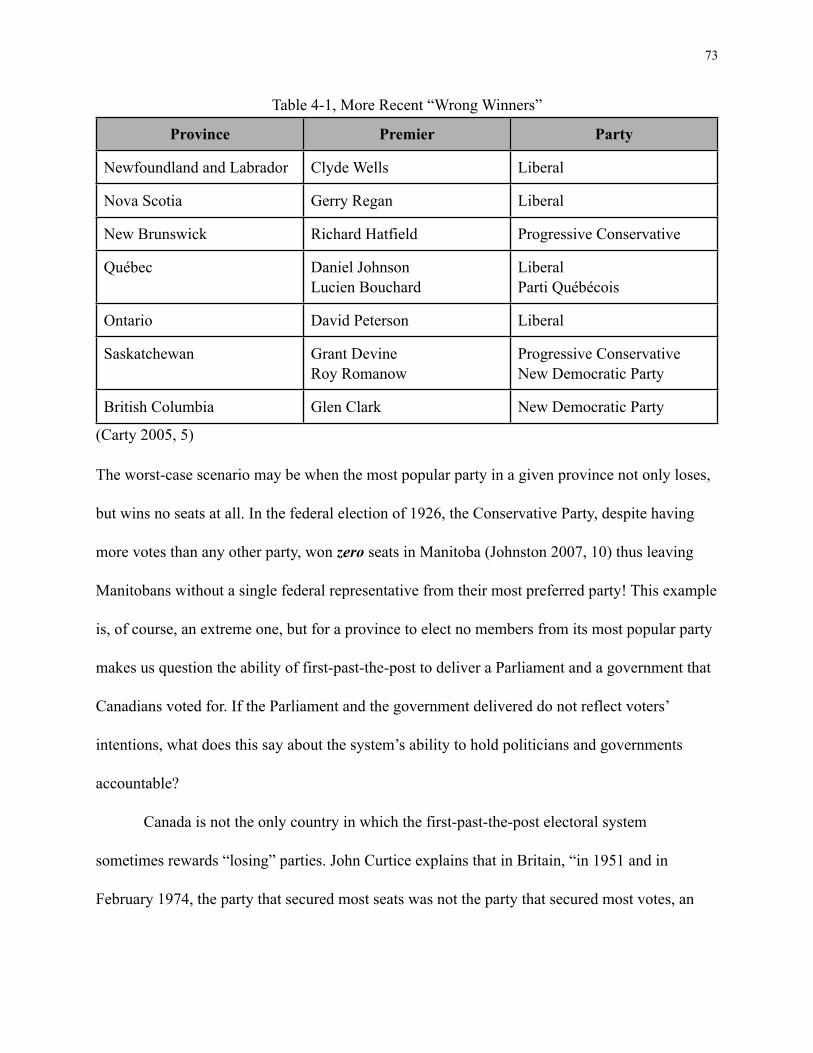
Table 4-1, More Recent “Wrong Winners”
Province Premier Party
Newfoundland and Labrador Clyde Wells Liberal
Nova Scotia Gerry Regan Liberal
New Brunswick Richard Hatfield Progressive Conservative
Québec Daniel JohnsonLucien Bouchard
LiberalParti Québécois
Ontario David Peterson Liberal
Saskatchewan Grant DevineRoy Romanow
Progressive ConservativeNew Democratic Party
British Columbia Glen Clark New Democratic Party
(Carty 2005, 5)
The worst-case scenario may be when the most popular party in a given province not only loses,
but wins no seats at all. In the federal election of 1926, the Conservative Party, despite having
more votes than any other party, won zero seats in Manitoba (Johnston 2007, 10) thus leaving
Manitobans without a single federal representative from their most preferred party! This example
is, of course, an extreme one, but for a province to elect no members from its most popular party
makes us question the ability of first-past-the-post to deliver a Parliament and a government that
Canadians voted for. If the Parliament and the government delivered do not reflect voters’
intentions, what does this say about the system’s ability to hold politicians and governments
accountable?
Canada is not the only country in which the first-past-the-post electoral system
sometimes rewards “losing” parties. John Curtice explains that in Britain, “in 1951 and in
February 1974, the party that secured most seats was not the party that secured most votes, an
73
outcome that would appear to compromise claims that single member plurality ensures that
voters have the power to make and unmake governments” (2009, 29).
The arguments presented here show that as far as government accountability is
concerned, the performance of first-past-the-post is troublesome. Although it may be commonly
thought that majority government means accountable government, “accountable government” is,
perhaps, inappropriately listed here as a “pro” of first-past-the-post. Its performance in this
regard is questionable at best. Minority governments, it seems, actually increase government
accountability by making governments more accountable to parliament and so an electoral
system that increased the frequency of minority government could actually be a “good” thing.
Further, a system which removed the seat “bonus” the winning party receives would mean that
the government’s seat share (and other parties’ seat shares) would correspond to their share of
votes—hence the legislature would be fully accountable to voters.
4.3 Cons of first-past-the-post
4.3.1 Meaningless votes (Criterion 6: Meaningful votes)
If one’s preferred candidate is almost guaranteed to win or to lose in a voter’s
constituency, voters may feel that their vote is “meaningless”:
In any single-member constituency electoral system where support for the various political parties is spatially polarised, there is likely to be a large number of seats that one of them regularly wins by a substantial margin, and which are therefore not likely to change hands at subsequent general elections (Hix et al 2010, 43).
We must also ask ourselves if this sense of votes being meaningless among some is suppressing
voter turnout to an extent. Larry Johnston notes the disincentives to vote in countries using first-
74
past-the-post:
There are many reasons to vote, including the satisfaction of fulfilling one’s civic duty and of having registered one’s preference, but these are personal reasons and do not change the fact that wasted votes and surplus votes (i.e. votes a candidate receives beyond the total necessary to win a seat) have no direct role in the outcome (2007,15).
There appears to be little incentive to vote if one’s constituency is a “safe seat” for a given party,
whether a voter supports the winning party, or another. Unless a voter’s preferred candidate wins
by one vote, a voter’s individual vote will not impact on the election results. We would expect,
for this reason, to see turnout lower in “safe” ridings than in competitive or marginal ones.
In many constituencies, electors may find that voting for their preferred party is of little value—because it is either bound to win there or almost certain to lose.They may therefore either consider their vote of little value and abstain (which is why turnout tends to be higher in marginal constituencies) or vote for a candidate/party who is not their first choice” (Hix et al 2010, 45).
Collectively, a certain amount of votes for the winning candidate do count, and a voter who votes
for the winning candidate may feel that she has contributed to the candidate’s election. Further,
there may be philosophical reasons for voting, such as a feeling of “duty” as Johnston notes, or
of “registering one’s preference.” Voters who vote for losing candidates have registered their
preferences and fulfilled what some voters may see as a civic duty, but above and beyond these
personal or philosophical reasons, their votes are meaningless since “wasted votes and surplus
votes... have no direct role in the outcome” (Johnston 2007, 15). Ideally, all voters should be able
to cast votes that directly affect the election results. These “wasted” and “surplus” votes would
ideally be taken into account so that all voters could feel that their votes are meaningful on a real,
not just philosophical level.
If one’s vote were likely to have an impact on the election results, one might assume that
75
voter turnout would generally be higher. Voting is likely to have an impact on the voting result
when a proportional voting system is used, contrary to the reality when first-past-the-post is
used. Blais, Massicotte, and Dobrzynska write, “a proportional voting system is considered fairer
by most citizens and generally tends to induce more electors to exercise their right to
vote” (2003, 15). Admittedly, there are many other factors influencing voter turnout unrelated to
the voting system. Blais, Massicotte, and Dobrzynska observe, however, that “turnout is 5 to 6
points higher in countries where the electoral system is proportional or mixed
compensatory” (2003, 1).
Under first-past-the-post voters can ask “Whether to abstain because their preferred
candidate/party is either: (a) so unlikely to win in the constituency that a vote for them would be
wasted; or (b) so sure to win that a further vote would be unnecessary” (Hix et al 2010: 48).
When one’s vote is unlikely to have an impact, turnout is expected to be lower. Since federal
elections in Alberta are remarkably uncompetitive, this province offers a unique Canadian
opportunity to begin to test this hypothesis. Almost every federal Alberta seat has been won by
the Conservative Party since the Party’s merger (Heard 2013a)14, meaning that almost the entire
province consists of “safe” seats for the party. We should expect, therefore, that voter turnout
would be lower in Alberta compared to other provinces. Andrew Heard (2013a) breaks down
voter turnout by province and territory, revealing that voter turnout is indeed lower in Alberta
than in most other provinces, with turnout lower only in Newfoundland and Labrador, Nunavut,
and the Northwest Territories.
In order to satisfy the democratic criterion of representation of all voting should be more
76
14 27 of 28 seats in 2011 and 2008, 28 of 28 seats in 2006, and 26 of 28 seats in 2004
than simply “registering one’s preference” or carrying out one’s “civic duty” (for those who
consider it as such). Regardless of the constituency they are cast in, votes should contribute to
the election of a representative: “surplus” and otherwise “wasted” votes should also count.
Ideally, all voters would cast meaningful votes on more than a philosophical level: their votes
should actually help determine the makeup of the assembly, regardless of which constituency
they are cast in.
4.3.2 Can create a “weak” or “ineffective” opposition (Criterion 7: Effective Opposition)
There are many examples where the first past the post electoral system has caused a weak
opposition in Canada’s provincial legislatures. Kenneth Carty notes that “British Columbia in
2001, the Liberals won 77 out of 79 seats while the outgoing NDP government retained only
two. In Prince Edward Island in 2000, the Conservatives won all but one seat leaving the
Liberals with a one-seat opposition” (2005, 8). In the 2007 Newfoundland and Labrador
provincial election, the governing PCs received 92 percent of the seats with 70 percent of the
vote, leaving only 4 out of 48 opposition members in the House of Assembly (Elections
Newfoundland and Labrador 2007). An even more extreme Canadian example is New
Brunswick’s provincial election of 1987 when the Liberal Party won all the seats in the
legislature with 60 percent of the vote (Johnston 2007, 10). Although a “clean sweep” is not
common, the frequency that an “ineffective” or “weak” opposition has been created as a direct
consequence of the electoral system, particularly in the provinces, is certainly cause for concern.
Although it is difficult to put a number or percentage on the seats that must be held by the
opposition in order for it to be considered “effective,” Alan Cairns defines it as at least one-third
77
(1968). Since the current electoral system frequently exaggerates the number of seats a winning
party receives so greatly that it creates a weak or ineffective opposition, especially provincially,
this should be avoided in a prospective system. A prospective electoral system should create a
strong or effective opposition. A system that does not exaggerate the number of seats the winning
party receives should be sufficient to create an “effective” or reasonable-sized opposition—or at
least an opposition size that relates to its level of popular support.
4.3.3 Distorted election results (Criterion 8: Proportional representation of parties)
Canada’s current, first-past-the-post electoral system produces distorted election results
and causes many votes to be “wasted” or “ineffective.” “[E]lection after election, we use a
system in which there is no logical or direct connection between the share of a party’s votes and
its share of seats” (Carty 2005, 6). This tendency can be seen in just about any federal or
provincial election, including the recent Newfoundland and Labrador provincial election in
October 2011: The Progressive Conservatives returned with a majority, receiving 56.1 percent of
the vote, yet won 77.1 percent of the seats (37/48). The Liberals received 19.1 percent of the
vote, and won 12.5 percent of the seats (6/48), forming the official opposition. The NDP received
24.6 percent of the vote (more than the Liberals), and won 10.4 percent of the seats (5/48) (CBC
11 October 2011).
Other countries using the first-past-the-post system have distorted election results similar
to those that have occur in Canada. John Curtice argues that the first-past-the-post system is
“indefensible” because it makes Britain’s government neither representative nor accountable:
“while the system still clearly fails to produce anything like a representative legislature, it also
78
cannot be relied upon to help make governments accountable to their voters. A system that fails
to fulfill either of the major functions of democratic elections would seem difficult to defend
indeed” (2009, 44). It is clear that an accurate reflection of voters’ preferences goes hand in hand
with accountability, since ineffective votes and distorted election results make it difficult to hold
governments accountable.
Distorted election results can be said to leave many Canadians “unrepresented” in the
House of Commons or in provincial legislatures, and governments can be effectively shut out of
certain provinces or regions despite having significant support. Distorted election results creates
a disconnect between the percentage of votes a party receives and the percentage of seats the
party is awarded. How the results are distorted also creates a distorted view of the country in
terms of party support. “In Alberta, for example, the federal Liberal party has on occasion won as
much as 25 percent of the vote and not been rewarded with a single seat” (Blais and Gidengil
1991, 53-54).
The level of distortion can be shown by Gallagher’s least square index (LSq). The value
of the index in the most recent federal election (2011) is 12.42, indicating a high level of
disproportionality. Some of the most recent values of the index are shown below:
1984: 20.91 1988: 11.33 1993: 17.67 1997: 13.26 2000: 13.56 2004: 9.81 2006: 8.61 2008: 10.09 2011: 12.42 (Gallagher 2013a)
79
A prospective system should not distort election results. The percentage of seats a party is
awarded should reflect the percentage of votes that party received. In other words, there should
be a proportional representation of parties in the legislatures. This is, of course, highly
intertwined with many of the other issues given that the distorted election results are a source of
many ills. As will be seen in the next section, another issue is that the results can be distorted in
such as way that may contribute to regional alienation could be said to be detrimental to national
unity.
4.3.4 Exaggerates regional differences (Criterion 9: Regionally balanced governments)
Jansen and Siaroff note that “the closest thing to a consensus in the literature on the
Canadian electoral system is that the SMP system contributes to the regionalization of Canada’s
party system” (2004, 43).
In one of the foundational essays regarding the effects of the electoral system in Canada,
Alan Cairns explains how the first past the post electoral system exaggerates regional cleavages
and is detrimental to national unity, and is worth quoting at length:
The following basic effects of the electoral system have been noted. The electoral system has not been impartial in its translation of votes into seats. Its benefits have been disproportionately given to the strongest major party and a weak sectional party. The electoral system has made a major contribution to theidentification of particular sections/provinces with particular parties. It has undervalued the partisan diversity within each section/province. By so doing it has rendered the parliamentary composition of each party less representative of the sectional interests in the political system than is the party electorate fromwhich that representation is derived. The electoral system favours minor parties with concentrated sectional support, and discourages those with diffuse national support. The electoral system has consistently exaggerated the significance of cleavages demarcated by sectional/provincial boundaries and has thus tended to transform contests between parties into contests between sections/provinces (1968, 62).
80
Regional exaggerations caused by the electoral system are particularly worrisome with respect to
Québec and the French-English divide in Canada. “Given the recurrent problems concerning the
status of Quebec in Canadian federalism and the consistent tension in French-English relations it
is self-evident that the effects of the electoral system noted above can be appropriately described
as divisive and detrimental to national unity” (Cairns 1968, 60).
Trevor Knight also argues that regional exaggerations caused by the FPTP electoral
system are ‘unhealthy’ for Canada. He writes:
The SMP electoral system causes regionalism to be accentuated by over-representing parties that make a regional appeal, while under-representing parties that have diffuse national support. In addition, the SMP system skews regional representation within the caucuses of national parties. This latter result causes parties to be less sensitive and responsive to certain regional interests. It also increases regional divisions by exaggerating the political differences between regions and by identifying certain regions with certain parties (Knight 1999).
The consensus in the Canadian literature is that first past the post exaggerates regionalism
in Canada. The Law Commission of Canada confirmed this consensus by contending that “the
first-past-the-post voting system undeniably plays a role in exacerbating regional
differences” (2002, 16). With such a consensus, it could be argued that Canada’s longterm
survival as a country in its current form can only be aided by the adoption of an electoral system
that facilitates regionally balanced governments.
Some authors question if territorially-based elections under first-past-the-post have a
negative effect on government legitimacy in areas where the governing party is weak. Reeve and
Ware explore this topic:
Does the emergence of strong regional patterns of voter support under a system of territorially-based elections reduce the legitimacy of a governing party in an area where it has little support? This was the problem which increasingly faced Liberal
81
governments in Canada, especially after the 1980 election. In 1980 the Liberals won a Parliamentary majority but obtained only two of the seventy-seven seats in the four western provinces. This increased western alienation from Ottawa (1992, 136).
The same question can be raised about the legitimacy of federal Liberal or Conservative
governments in Québec when Québec was dominated by the Bloc Québecois, and of the current
federal Conservative government now that Québec is dominated by the NDP. The legitimacy of
federal Conservative government could also be called into questioned in Newfoundland and
Labrador after the 2008 election when the party won no seats in the province (Elections Canada
2009). With 16.65 percent of the vote, the Conservatives would have had enough support for one
of the province’s seven seats if a proportional voting system were used (1.17 Hare quotas). This
would have given the province a government representative, and no doubt, a cabinet minister
from the province. The current system often makes it difficult for governments to be regionally
balanced because it exaggerates regional differences. A prospective electoral system would
ideally not exaggerate these regional differences and should therefore help create more
regionally balanced governments.
4.3.5 Excludes local minorities from representation (Criterion 8: Proportional representation of
parties)
Because unanimous consent is impractical, if not impossible, it is commonly thought that
in a democracy, the majority should govern. It does not follow, however, that the minority should
be disqualified from representation. John Stuart Mill argued that the first-past-the-post system
denies representation to many voters. “The electors who are on a different side in party politics
from the local majority [or plurality] are unrepresented” (Mill 1862 [2010], 60). If a certain
82
number of voters are excluded from representation, the implication for democracy is that the
‘representation of all’ criterion is not fulfilled.
Mill’s reasoning implies that since the minority does not elect anyone, they are not
represented. This is one way of framing the issue—one that does not consider “virtual”
representation, discussed in Chapter 2. Ideally, all voters would be represented actually, not
virtually, by having their votes contribute to makeup of the assembly. Mill’s line of reasoning
remains valid because the crux of representative democracy is the ability to choose one’s own
representatives. Representative democracy it is more than simply government taking care of the
interests of its subjects, or “virtually” representing them or their interests, which, of course, can
also happen in forms of government that do not employ competitive elections.
The exclusion of local minorities from representation may, in fact, be worse today than as
Mill describes. Under a two-party system, each local candidate would necessarily be elected by a
local majority, but this would still leave a minority unrepresented. In Canada’s multi-party
system, each representative does not even need to secure a local majority; representatives are
only required to receive one more vote than the nearest opponent, in other words, a “plurality”.
As it stands today in Canada, a minority, at least, is always left unrepresented in each riding, but
it is frequently more than just a minority; because votes are split between multiple parties, a local
majority is often left unrepresented. Although Mill was referring to 19th century Britain, this
same criticism holds true for Britain and for Canada today. Members can, and sometimes are,
elected with a majority in their riding, but there is no such requirement. Some recent extreme
examples of members getting elected with low levels of support include the member for
Gatineau getting elected with only 29 percent of the vote in 2008, and the member for Vancouver
83
Centre getting elected with only 31 percent of the vote (Parliament of Canada). The exclusion of
local minorities from representation (their votes not being effective) can be considered “unfair”
and is certainly at odds with the ‘representation of all’ criterion of representative democracy.
4.3.6 Does not ensure true majority rule (Criterion 8: Proportional representation of parties)
By excluding every local minority (or majority) from representation, Mill explains that
government can be formed from a minority. “Democracy, thus constituted, does not even attain
its ostensible object, that of giving the powers of government in all cases to the numerical
majority. It does something very different; it gives them to a majority of the majority, who may
be, and often are, but a minority of the whole” (Mill 1861 [2010], 60). The situation Mill
describes is if every member were to be elected by a bare majority under the first past the post
electoral system as would be the case in a strict two-party system. As Canada has a multi-party
system and there is no such requirement for each member to receive a local majority, the
government thus selected may, in fact, be worse than a majority of the majority; it may even be a
majority of a minority. The latest majority government, elected in 2011, received 39.6 percent of
the vote, clearly not a majority of votes (Library of Parliament 2013). Some of these voters, of
course, would have cast ineffective votes, which begs the the question: what percent of total
voters actually elected this majority government? It has been calculated that in the 2011 federal
election, 1,455,077 votes cast for Conservative Party were “wasted” (wastedvotes.ca 2013). By
subtracting this number from the total number of votes cast for this party, 5,835,270 (Library of
Parliament 2013), we are left with 4,380,193 effective votes cast for the Conservative Party
(votes that elected a Conservative member), or 29.75 percent of the total valid vote. Therefore, it
84
could be said that recent majority government was elected with only 29.75 percent of the total
valid vote. Whether we consider that 29.75 of the valid vote elected the government, or that the
government conceivably represents 39.6 percent of Canadians, majority rule is not attained.
Majority rule can be attained through a proportional representation of parties. With parties
represented proportionally, a majority government would represent a majority of voters, or a
minority government could pass legislation with the help of other parties, together representing a
majority of voters.
4.3.7 Ineffective representation (Criterion 8: Proportional representation of parties)
Elections Canada (2004, 3) notes that the principle of “one elector—one vote” embodies
the democratic goal of the electoral system which is set out in the Canada Elections Act.
Elections Canada explains that “[t]he application of this principle was clarified in a 1991
decision of the Supreme Court of Canada, which held that the true meaning of the right to vote is
not absolute equality of voting power but a right of effective representation”(2004, 3). If
effective representation rather than absolute equality of voting power is the aim, the question
then becomes, do Canadians in fact have effective representation under the current electoral
system? Each constituency elects one member by plurality; all those who voted for this member
are awarded representation in the assembly, while the rest of the voters can be considered to be
left “unrepresented”. Can this form of selecting representatives, whereby only a portion of voters
get representation be truly considered “effective representation”? Can an elected member
truthfully claim to represent 100 percent of the residents in her riding if she only received 40
percent of the vote? If the remaining 60 percent of the voting population preferred another
85
candidate or party, is this population’s “right of effective representation” being respected? Even
if a member is elected with a large majority of, say, 70 percent, is the remaining 30 percent who
preferred another candidate and party “effectively represented”?
A riding representative is, of course, the technical representative for all people in that
riding, but given that viewpoints in no riding will be homogenous, how can a member, by
supporting or opposing a certain policy, be said to be representing all people in that riding? When
the official representative of a given riding supports or opposes a policy or expresses a
viewpoint, some people in that riding will no doubt side with the position of the representative,
but can this be considered “effective” representation for those who disagree? Logically it seems
that unless multiple representatives are permitted, multiple viewpoints cannot be effectively
represented. Although the Supreme Court of Canada declared that Canadians have a “right of
effective representation,” this right does not appear to be well served by the first past the post
electoral system. A system that enabled a proportional representation of parties would
conceivably give Canadians effective representation because their vote would influence the
makeup of the assemblies, regardless of where they reside. Multiple representatives or perhaps
overlapping levels of representation would be needed, to some extent, to represent conflicting
viewpoints. The idea that one single representative can effectively represent all people and
viewpoints in a given geographic area defies logic. Local geographic representation is no doubt
important and a good representative may, indeed, represent a majority opinion in the riding most
of the time, but for one representative to have a monopoly on political representation for all
people residing in any geographic area denies the heterogenous character of political reality.
86
4.2.8 Biased against women and minorities (Criterion 10: Demographic representation)
“Countries that rely exclusively on the “first-past-the-post” electoral system, as does
Canada, consistently have lower levels of representation of women” (Cool 2010, 5). Since riding
associations only nominate one candidate per riding, the result tends to be a bias towards men,
with fewer women chosen as candidates. One of the biggest problems, it seems, is that fewer
women than men put their names forward as candidates (Cool 2010, 3), naturally leading to
fewer women elected in legislatures. Julie Cool makes the basic observation that, “When more
women candidates run for office, more women are elected to office. Parties that have a greater
proportion of women candidates tend to have a higher proportion of women in their
caucuses” (Cool 2010: 5). The simple solution to this problem would be for parties to run an
equal number of men and women candidates. The difficulty in reaching gender parity in
candidate nominations, however, becomes evident when we look at process at the constituency
level. Only one candidate can be chosen per riding per party: it can be a male or a female.
Gender parity, for obvious reasons, cannot be created at the riding level if only one candidate is
chosen per riding. Some ridings may choose a male candidate, while others may choose a female
candidate; the problem is that consistently more men are chosen as candidates because, as
mentioned above, more male candidates put their names forward. Because of this reality, “if
parties adopt gender-neutral nominating rules the consequence would be a pool of candidates
skewed towards men” (Matland 2005, 97).
In order to achieve gender parity in candidate nominations, must the party dictate to
riding associations which half must nominate women, and which half must nominate men? There
is another, simpler solution that could fix this dilemma. If an even number of candidates are
87
nominated per riding, creating an equal number of male and female candidates would become
easy: simply make it a policy to nominate an equal number of men and women from each riding
or on each list. Some political parties under first-past-the-post system have attempted to create
gender parity or to increase the number of female candidates, but this policy is difficult to
enforce under such a system. “Although political parties have occasionally set voluntary quotas
for nominations for women candidates, local riding associations maintain a level of autonomy in
the nomination process that makes it difficult for political parties to impose and meet these
targets” (Cool 2010, 4). After all, on the micro level where riding associations nominate
candidates, there is no problem in nominating a male or a female, but when we look at the
aggregate results, we see that the number of male candidates far exceeds that of female
candidates.
Allowing parties to nominate more than one candidate per riding could also help elect
more minorities to Parliament. Parties would have an incentive to diversify their slate of
candidates in order to appeal to a wider group of voters. Further, with parties permitted to
nominate more than one candidate per riding, they would not need to “put all their eggs in one
basket.” Parties might therefore be more inclined to nominate more candidates from minority
races, religions, or ethnicities without fearing that some voters might not find a candidate
appealing, or without fearing prejudice on the part of some voters.
Therefore, for creating gender parity and increasing minority representation, we should
prefer a system that allows parties to nominate more than one candidate per riding—at least two,
and ideally an even number, and policy should be that parties nominate an equal number of men
and women. A prospective electoral system would ideally help improve demographic
88

representation and help create more diverse legislatures by removing the bias against women and
minorities.
89
Chapter V: Other Electoral Systems
Since the possibilities for electoral systems are virtually limitless by tweaking the
different combinations of the key variables (ballot structure, electoral formula, and district
magnitude), not all possibilities can be discussed. Some of the “major” electoral system
proposals and possibilities for Canada will be evaluated and discussed in this chapter.
5.1 Criteria for evaluation
The list of criteria for evaluating these systems, developed by studying the pros and cons
of our first-past-the-post electoral system is listed below:
1. Palatability2. Simplicity3. Local geographic representation4. Accountable members5. Accountable government6. Meaningful votes7. Effective opposition8. Proportional representation of parties9. Regionally balanced governments10. Demographic representation
This list takes into account change that is necessary in order to fulfil the ideal of democratic
representation, as well as important practical considerations in Canada. It is a list tailored to
Canada and based on the idea of adapting the first-past-the-post electoral system to overcome its
shortcomings, and so it may not be universally applicable. Given that Canadians have shown to
be hesitant to reform their electoral reform, a system with minimal change should be sought.
Even though there is a great deal of overlap between the criteria, they should be examined
separately. Above all, any prospective electoral system should be “palatable” or suitable for
Canadians.
90
5.2 The alternative vote (AV)
Since the alternative vote (AV), also known as instant runoff voting (IRV) or the “ranked”
or “preferential” ballot, is the most similar system to the current first-past-the-post system, it will
be examined first. If the alternative vote were to be adopted, the electoral system would
essentially stay the same except for the ballot structure. Constituencies would remain single-
member districts and voters would be asked to rank candidates in order of their preference. If no
candidate received more than 50 percent of first-choice votes, the second choices of the
candidate who received the lowest number of votes would be divvied out to the remaining
candidates. This process would continue until a candidate receives over 50 percent of the vote.
The rules of a particular system may stipulate whether or not all candidates on the ballot must be
ranked in order for the ballot to be considered valid. This curious, perhaps needless rule is
applied to elections in the Australian House of Representatives (Hix et al 2010, 51). A rule such
as this would force voters to rank even disliked candidates or parties and could lead to an
unnecessary number of spoiled ballots.
Since “splitting” the vote in the riding level would be prevented, the system could
arguably be an improvement over first-past-the-post. The illustrate the idea of vote splitting,
imagine the vote distributions below.
Candidate A: 350 votes (second choice: Candidate B; third choice: Candidate C)Candidate B: 50 votes (second choice: Candidate A; third choice: Candidate C)Candidate C: 290 votes (second choice: Candidate D; third choice: Candidate B)Candidate D: 310 (second choice: Candidate C; third choice: Candidate A)Total valid votes: 1000
This is, of course, a simplified example since it would be unlikely that supporters of a given
candidate would all choose the same candidate as their second choice. Under first-past-the-post,
91
Candidate A would win the riding seat with 350 votes (35 percent). Under the alternative vote
(AV), the lowest number of votes would be redistributed, in this case, votes for Candidate B (50)
would be transferred to Candidate A, increasing the number of votes for Candidate A to 400 (40
percent). As this is not yet a majority, the votes for the candidate with the next lowest number of
votes is then redistributed, in this case, Candidate C with 290 votes. Candidate C voters’ second
choice is Candidate D, leaving this candidate with 600 votes (a majority). Candidate D would
therefore win this riding under the alternative vote, whereas Candidate A would win under first-
past-the-post. Supporters of Candidates C and D are sympathetic to the other party and represent
60 percent of voters. The vote-splitting issue present under first-past-the-post appears to be
resolved under the alternative vote; in this example, 60 percent of voters would be represented by
either their first or second choice candidate.
A change such as this would not seem so great as to be considered a difficult transition or
unpalatable for Canada. Would such a change improve democratic representation? In the
example above, with Candidate D elected, 31 percent of voters would be represented by their
first choice and 29 percent by their second choice. At first glance, one might therefore be
tempted to see majority support in the alternative vote scenario but not in the first-past-the-post
scenario. Interestingly, when comparing the AV scenario with the first-past-the-post scenario
using the standard of AV (considering later preferences), however, reveals that Candidate A is
also supported by a “majority”. If Candidate A were elected, 35 percent would be represented by
their first-choice candidate, 5 percent by their second choice, and 31 percent by their third
choice15 (although these later preferences would not have been expressed). In this example, by
92
15 When second and third-choice votes are counted, Candidate A (the winner under first-past-the-post) turns out to be supported by 71 percent of voters.
considering later preferences, both systems, electing different candidates, would have elected a
candidate supported by a “majority.” If we are to judge the alternative vote’s ability to create
majority winners by taking into consideration later choices, we must also judge first-past-the-
post on the same measure, taking voters unexpressed later preferences into consideration.
By taking into consideration later preferences (at least the amount necessary to cross the
majority threshold), it appears that vote effectiveness would increase under the alternative vote,
even if only marginally. A website dedicated to track ineffective votes in Canadian elections
(styled “orphaned votes” in the site) reports that if the alternative vote were used in the last
federal election, based on survey results from EKOS where second-choice votes were reported,
the number of ineffective votes would have fallen from 49.6 percent, to an estimated 45.4
percent (Orphaned Voter 2013a). An increase in vote effectiveness of less than 5 percent, would
not, needless to say, come near achieving the goal of full vote effectiveness. It is not surprising
that vote effectiveness crossed the 50 percent threshold since the system, by design, must take
into consideration at least half of the votes cast in every riding. I pointed out that considering
later preferences in the example above would have meant that the plurality winner would also
have conceivably represented a majority of voters. Later preferences are not, as we know, taken
into account under first-past-the-post, so these votes cannot be considered “effective” even if
these voters are sympathetic to the winning candidate.
Since the alternative vote system has been used in Australia for nearly a hundred years
(since 1918: Farrell 1997, 45), we can get a idea how proportional election results would be
under this system by examining the least squares indices (LSq) from Australian elections. With a
least squares index of 11.29 in 2010 and 10.27 in 2007, disproportionality in Australian elections
93
is high and is comparable to current Canadian levels. With such a high level of
disproportionality, the ideal of representative democracy, including voter equality, majority rule,
and the representation of all, cannot be said to be achieved in Australia. If Canada adopted
Australia’s alternative vote system, Canada would still fall short of achieving the ideal of
representative democracy since the system would still give highly disproportional results.
It is important to note that a number of Canadians have come out in support of this
system, including Liberal leader Justin Trudeau (Trudeau 2013), former Liberal leadership
candidate Marc Garneau (Wherry 2013), as well as Stephen Harper’s former political advisor
Tom Flanagan (Flanagan 2001). Tom Flanagan writes:“The objection that AV does not yield
proportionality between percentage of popular votes and percentage of seats is certainly true. Its
operation in this respect is closer to FPP [first-past-the-post] than to PR [proportional
representation]. Those to whom proportionality is the highest political value should choose one
of the many varieties of PR rather than AV” (2001).
The pros and cons of the alternative vote would be, for the most part, the same as under
first-past-the-post. It would be simple, provide local geographic representation and accountable
members. The changes under the system would not be so great as to make it a difficult transition
or “unpalatable,” however, those wanting proportional election results may find the proposal
difficult to support. Votes would arguably be slightly more meaningful, since when a voter’s first
choice vote is ineffective (fails to help elect a member), the voter’s second or third choice votes
may (or may not) be effective. The system would not likely produce a significantly more
proportional election result, improve government accountability, help ensure an effective
opposition or regionally balanced governments, or help improve demographic representation. It
94
would arguably be a slight improvement from the current situation, since slightly more votes
could be considered effective and it would eliminate vote-splitting on the riding level, but with
most of the “cons” still largely intact, it would not significantly improve democratic
representation in Canada or bring us near the ideal of representative democracy.
The alternative vote system shares a peculiar characteristic with other systems that
employ preferential ballots or multiple rounds of election: it does not guarantee monotonicity
(Gallagher 2013b; Tidemand and Richardson 2000). Monotonicity is defined by Gallagher as
“the property that additional support cannot be damaging to a candidate” (2013b). At first a
statement such as this may sound bizarre, and how this may occur is better understood with an
example. I will use the numbers from Gallagher’s example (2013b, 4-5) because his use of 100
votes makes it relatable to percentages, but with a modified scenario. Suppose that a three-way
race unfolds as follows:
Candidate A: 39 votesCandidate B: 30 votesCandidate C: 31 votes
Candidate B is eliminated because she has the lowest number of votes, and voters’ second
preferences are redistributed. It turns out Candidate B supporters second-choices are evenly split,
with 15 second-choice votes going each to Candidates A and C. The final tally gives A a victory
with 54 votes total, and Candidate C, 46. It is noticed during the final count, however, that two
two votes had been mistakenly placed in Candidate C’s pile and had marked Candidate A as their
first preference, not Candidate C, further strengthening Candidate A’s majority to 56 votes.
Candidate A insisted a recount was not necessary because she had won with a clear majority, but
95
Candidate B demanded that one be conducted because it meant that she was no longer the first
candidate eliminated. The corrected first choice votes are as follows:
Candidate A: 41 votesCandidate B: 30 votesCandidate C: 29 votes
The increase in support for Candidate A meant that Candidate C, and not B, was now the first
candidate eliminated. Candidate C voters, it turns out, dislike Candidate A very much, and all of
Candidate C’s second choice votes go to Candidate B, electing Candidate B with a majority of 59
votes. Two mistaken ballots changed the election results from a “majority” for Candidate A (54
votes), to a “majority” for Candidate B (59 votes), because an increase in votes for Candidate A
changed which candidate got eliminated first (numbers for scenario from Gallagher 2013b, 4-5).
So is the alternative vote better than first-past-the-post? This question is debatable. The
alternative vote ensures that candidates elected have the support of at least a majority of voters—
but not necessarily with first-choice preferences. In the scenario above, both Candidates A and B
could be said to be supported by a majority if one also includes second-choice preferences, but it
can be argued that this “majority” is not a genuine one. First-past-the-post cannot guarantee that
a candidate will be elected with a majority of first choice votes, but for that matter, neither can
the alternative vote. The scenario above, if conducted using first-past-the-post’s plurality rule,
Candidate A would win with 41 votes (not a majority). We would normally have no way of
knowing if enough voters who did not prefer Candidate A as a first choice, preferred her as a
second or later choice—enough to be supported, to some extent, by a majority of voters. It is
statistically likely that any candidate elected would be a later-choice candidate for many voters.
In this scenario we know that 15 Candidate B supporters feel that Candidate A is second
96
best (but on a first-past-the-post ballot they cannot express it). To fairly compare first-past-the-
post with the alternative vote in this scenario, we must compare them with the same measure.
Neither system ensures the winning candidate will receive a majority of first-choice votes. If
there is no majority winner in first-past-the-post, there is simply a plurality winner. When there is
no majority winner under the alternative vote, the system creates one (artificially) by taking
second and later preferences from eliminated candidates. But does considering second and later
preferences actually create a majority winner where one does not exist? “The alternative vote
does ensure that the winner will get majority backing, but it does so in a way that may seem
artificial, by taking the first preferences for the winner and adding post facto secondary
preferences from voters whose first preferences went to eliminated candidates” (Massicotte
2004, 123). First-past-the-post, of course, does not consider second and later preferences, but
unless a majority of voters felt that the plurality winner is the last choice or most disliked
candidate, then the plurality winner would also have “majority” support by the same standard
under which majorities are created with the alternative vote.
Overall, it is a system that could conceivably be used in Canada since it is only
marginally different than the current system. It may be difficult, however, to convince Canadians
to support such a trivial reform that fails to address the other major issues with the electoral
system such as disproportionality. It would, like any proposed change, encounter some resistance
among those who want no change, but also among those who would prefer a more proportional
system. This was certainly the case in the the United Kingdom leading up to the referendum on
the alternative vote in May 2011. The alternative vote was defeated by 67.9 percent of the vote,
with only 32.1 percent voting in favour of it (BBC May 6, 2011). Before the referendum, Vernon
97
Bogdanor wrote: “AV is a paltry alternative for reformers: Advocates of change want a
proportional voting system, but the 5 May referendum offers no such option” (The Guardian
February 22, 2011). John Curtice explained that even many of those campaigning for ‘yes,’ did
not really want AV. “In truth, most of those leading and backing the campaign, including not least
the Electoral Reform Society, really wanted proportional representation and they struggled to
come up with arguments in favour of a system that for them was very much a second
best” (2011, 16). Clearly, many reformers felt that the alternative vote was not the type of reform
needed for Britain. A campaign emerged called “No to AV, Yes to PR” encouraging voters to vote
against AV, arguing that it is no better than, perhaps even “worse” than first-past-the-post. Lord
David Owen wrote:
I have been a long-standing supporter of proportional representation and joined the Electoral Reform Society in 1985, determinedly campaigning for proportional representation for more than two decades. This referendum will not set Britain down the path of real electoral reform; it will replace a bad system with a worse one, and risks putting off the prospect of real reform for generations (The Independent 13 March 2011).
By speaking of “real” electoral reform, the implication is that the alternative vote would be a
“phoney” or “fake” reform, not improving the situation or bringing proportional representation
any closer.
Another group, ‘AV2011’, with a site entitled “For An Informed Referendum Decision,”
campaigned against the alternative vote for the same reasons, writing: “for the most part AV is no
better than our current voting system. Its few advantages are outweighed by its disadvantages.
And it's no more a step towards proportional representation than our current system” (AV2011
2011). The site unabashedly takes a stance against the alternative vote, writing, “AV appears to
98
be the worst of all worlds: it won’t satisfy reformers, it is rejected by traditionalists and it will
create more problems than it solves for our democracy” (AV2011).
For groups such as ‘AV2011’ or ‘No to Av, Yes to PR’ , voting ‘no’ did not signal their
support for first-past-the-post, but a refusal to accept a system they did not consider fairer, and
one that would not make elections more proportional. With so many negative campaigns against
the alternative vote, it is not surprising that the referendum result was a decisive ‘no.’ Many
Canadians could possibly likewise reject the alternative vote for similar reasons, if asked. Some
would, of course, resist change, while others would feel that such a change would not go far
enough. Fair Vote Canada, for example, says that adopting AV would be a “phoney reform.”
They argue: “Most Canadians are already “represented” by their second or third choice—that’s
the problem, not the solution” (2013). Indeed, those who would like to see the alternative vote
implemented would be fighting an uphill battle against both ‘reformers’ and ‘traditionalists.’ To
echo the words of the Law Commission of Canada, “the alternative vote system is not
sufficiently proportional to constitute a viable alternative to the first-past-the-post system” (2004,
80).
5.3 The single transferable vote (STV)
The single transferable vote (STV) is a system that is frequently suggested by electoral
reformers in Canada. It has the same ordinal ballot structure as the alternative vote, whereby
voters rank candidates in order of preference in single-member districts. This system differs from
the alternative vote in that it elects members from multi-member districts. The quota for winning
99
a seat is determined beforehand, typically the Droop quota16 Taagepera and Shugart (1989, 594).
The single transferable vote is considered a “proportional” voting system, is popular among
proportional representation (PR) advocates, and is used in the Australian Senate, Ireland, and
Malta (Farrell 1996, Hix et al 2010, 69). Although considered a proportional system, it is
important to acknowledge that a small district magnitude would decrease proportionality
significantly. A district magnitude of 5 for all constituencies in Malta (ACE Electoral Knowledge
Network 2013), produces a high level of proportionality (LSq: 2013: 1.75, 2008: 1.44, 2003:
1.81) (Gallagher 2013a). Ireland, with district magnitudes ranging from 3 to 5, typically
produces a moderate degree of proportionality (LSq: 1997: 6.55, 2002: 6.62, 2007: 5.85)
(Gallagher 2013a), however, the 2011 election produced a relatively low degree of
proportionality (LSq: 8.69) (Gallagher 2013a).
In STV, candidates reaching the quota would be elected, with the second choices of
surplus votes redistributed. Then, if no further quotas are met, the lowest-ranking candidate is
eliminated and her votes redistributed to voters’ next-choice candidates. The process repeats until
all seats are filled. When a candidate’s surplus votes are to be transferred, it must be determined
to which candidates. This is determined by dividing the number of surplus votes by the number
of votes for the candidate, then multiplying it by the number of next choice votes for each
candidate (Farrell 1997, 121). To illustrate this, imagine that the quota is 950 and a candidate has
a surplus of 50 (1000 votes in total). To calculate how many of the the 50 surplus votes would be
transferred to each candidate, the next-choice votes for each candidate is multiplied by 0.05
(number of votes to be transferred/total votes for candidate: 50/1000 = 0.05). In this case, a
100
16 (votes/seats +1) + 1, rounded down
candidate receiving 200 second-choice votes would transfer 10 of the 50 surplus votes (200 x
0.05 = 10). Again, which ballots will transfer becomes an issue. Ireland and Australia (Senate)
handle this issue differently: “In Ireland the returning officer simply picks the top ballot papers
from each of the piles; in Australia the ballot papers are sorted according to all the remaining
preferences and so the transfer (using fractions) takes adequate account of future vote
transfers” (Farrell 1997, 123). The Irish method is simpler, but the Australian method is no doubt
fairer. To illustrate this point, imagine that 10 surplus votes are to be transferred from a pile of
1000. If left to chance, 10 could possibly be selected with candidate C ranked next, or 10 could
be selected with candidate D ranked next. Which specific ballots are picked could mean the
difference between a candidate being eliminated or elected. This also opens up the possibility
that someone may deliberately try to advantage certain candidates by deliberately selecting
transfer ballots that will help these candidates. To maximize fairness in the transfer of ballots, all
rankings need to be taken into account, with the correct proportion transferred each time, as is
done in the Australian Senate.
A frequent argument against STV is that it is “complicated” or “confusing” (Pilon 2010,
77, NO-STV 2009). The discussion about quotas and fractional surplus transfers illustrate this
point. The Independent Commission on the Voting System in the United Kingdom (the Jenkins
Commission) wrote famously wrote: “The counting is incontestably opaque, although this is of
course different from saying that it is haphazard or unfair” (Jenkins Commission 1998, paragraph
98). The Jenkins Commission admitted, however, that the casting of a ballot under STV is not
complex, but it is rather the counting. The commission writes: “This complexity (and consequent
slowness) of counting should not be elevated into a fatal bar to STV, but nor can it be counted as
101
an advantage” (Jenkins Commission 1998, paragraph 97). The complexity of the counting makes
STV vulnerable to attack, yet does not seem to hinder its performance in places where it is used
such as Ireland or the Australian Senate.
Yet, the complicated nature of STV does not stop at the descriptions above. The single-
transferable vote fails to eliminate the issue of non-monotonicity it shares with the alternative
vote (an increase in support can harm a candidate, while a decrease in support can help a
candidate). While the example in the alternative vote section illustrates how it is possible for one
candidate to lose because of an increase in support, under the single-transferable vote, it is
possible that this can further affect which other candidates will also be elected, leading some to
refer to this phenomenon as the “butterfly effect” (Miller 2007). Michael Cross, professor of
theoretical physics, writes: “The ‘Butteryfly Effect,’ or more technically the ‘sensitive
dependence on initial conditions,’ is the essence of chaos” (2013). Michael Dummett famously
described the single-transferable vote as “the second worst electoral system ever devised” (1992,
111), describing its seat allocation process as follows:
The assessment process of STV may, however, be said to be quasi-chaotic, in that small changes at the initial stage may be magnified into huge changes at later stages, because they cause different candidates to be eliminated, and that in turn may result in a big variation in the allocation of votes at subsequent stages, owing to the differing redistributions of votes from one candidate and from another. (Dummett 1997, 142).
Miller demonstrated the sensitivity of the single-transferable vote to the initial conditions with a
striking example (see Miller 2007). To summarize, his example consisted of seven candidates (A,
B, C, D, E, F, and G) competing for three seats. He constructed a ballot profile of voters’
intentions before going to the polls, the end result electing Candidates C, F, and G. He
constructed another ballot profile identical to the first, except that in this profile two voters
102
changed their minds and decided to support Candidate B instead of A (both losing candidates in
the first ballot profile). The result of these two switched votes not only caused the candidate
whose support dropped (A) to be elected, but changed the entire election result: Candidates A, D,
and E now elected instead of Candidates C, F, and G (Miller 2007). Miller concludes that STV is
“highly susceptible to strategic voting” (2006, 505), which must be conceded. Miller also admits
that it is difficult for voters to predict and carry out “because the highly beneficial effect of such
a strategic ballot is essentially impossible for the voters to foresee and, in any event, is highly
dependent on the exact ballot profile they confront ... That is, the quasi-chaotic and non-
transparent character of STV may render it effectively strategy-proof” (2007, 505).
Michael Gallagher (2013b) tackled the non-monotonicity issue inherent in STV and the
many negative opinions regarding this possibility. He noted that “voters might still be disturbed
by the impact of non-monotonicity even if they cannot take advantage of it through strategic
voting” (2013b, 8). Gallagher contends that when it comes to assessing the significance of non-
monotonic outcomes, “the frequency with which [they] are likely to occur should enter the
equation” (2013b, 8). The problem with determining its frequency however, is that it is difficult
to detect: “non-monotonicity does not, so to speak, leap out of an election result waving a flag
and shouting for attention” (Gallagher 2013b, 9). After examining the record of elections in
Ireland between 1922 and 2011, Gallagher concludes that “non-monotonicity has arisen in
around 1.5 per cent of all cases” (2013, 16). As to how serious this figure is, he leaves it up to the
reader to decide.
Non-monotonicity can certainly be considered a problem with STV, but so can the fact
that dominant candidates can be eliminated early. Tideman and Richardson write: “The problem
103
with sequential exclusions is that an excluded candidate may be someone who is the next choice
of many voters whose current choices will be excluded later” (2000, 28). Tideman and
Richardson explore a plethora of methods for electing candidates in STV and develop a method
that does not involve sequential exclusions. Their method would instead compare all the pairs of
outcomes (CPO-STV) (2000). The justification for such a method is the consensus that ideally,
the candidate who would win in all paired comparisons (if one exists), should be the winner
(Tideman and Richardson 2000, 28). To illustrate this with an extreme example, imagine a five-
member riding with 20 candidates. If the candidate receiving the fewest first-choice votes is the
second choice of the rest of voters, this candidate would be the most preferred candidate overall,
but would be eliminated before these second preferences would come into consideration, and so
would not win any of the 5 seats. Tideman and Richardson admit, however, that comparing pairs
of outcomes is something that can present some significant challenges. The authors write that
there is a “refinement-manageability trade-off in the single transferable vote... every refinement
comes at a cost of increased difficulty of understanding the vote-counting algorithm and
increased cost of undertaking the count” (2000, 13). Although such a refinement could make the
STV system fairer, the increased cost and complexity could be contentious. To get an idea of the
breadth of computations that might be needed to calculate election results under this method, the
authors write:
If there are 20 candidates for ten positions, then there are 184,756 different combinations of candidates who could be the winners, and therefore slightly more than 17 billion pairs of outcomes that might be compared, with each comparison requiring a separate analysis of each vote cast” (Tideman and Richardson 2000, 30).
104
If STV were to be adopted in Canada, the myriad of different counting methods should be
considered, and whether or not it would be desirable to use technology to arrive at a fairer result.
Encouraging such a discussion, however, would likely lead even more people to conclude that
STV is ‘too complicated’.
Most notably in Canada, an STV model was proposed by the British Columbia Citizens’
Assembly on Electoral Reform, “an independent, non-partisan assembly of citizens composed of
161 members—one man and one woman randomly selected from each of the 79 electoral
districts, plus two First Nations members and a chair” (Elections BC 2005, 1). A referendum was
held in May 2005, coinciding with the provincial general election, which asked voters: “Should
British Columbia change to the BC-STV electoral system as recommended by the Citizens’
Assembly on Electoral Reform?” (Elections BC 2005, 2). The proposal was supported by a
majority of voters, however, the Electoral Reform Referendum Act stipulated that at least 60
percent of the valid popular vote would be required in order for the result to be binding, with
greater than 50 percent support in at least 48 of 78 ridings. The proposal was supported by a
majority of voters in 77 of 79 ridings, but fell short of reaching the 60 percent threshold with
57.69 percent in favour (Elections BC 2005, 9). Another referendum was held in May 2009, with
support for STV dropping to 39.09 percent of voters. Further, in this referendum, in only eight of
the 85 electoral districts, voters supported STV by more than 50 percent (Elections BC 2010,
17). Why support for STV dropped by nearly 19 percent between the two referenda is not exactly
clear. Dennis Pilon studied this question in depth (2010). Interestingly, Pilon explained that
Academic survey work suggests that public attitudes around reform remained remarkably constant between the two votes: in both cases an overwhelming majority of British Columbians supported the general notion of proportionality in
105
election results and had very little knowledge of electoral rules, simple of otherwise (2010, 85).
He discussed possible reasons for the drop in support for STV and argued that two important
factors were “elite manipulation of the process and partisan insecurity about their competitive
position electorally” (Pilon 2010, 86). To understand partisan insecurity, it is important to
understand the backdrop of the two referenda. In 1996 the NDP were re-elected with a majority
despite having 3 percent fewer votes than the Liberals (Elections BC 1997, 10; Pilon 2010, 75),
and in 2001 the Liberals won 77 of 79 seats with 57 percent of the popular vote (Pilon 2010, 75;
Elections BC 2001, 11). These two extreme election results showed that the electoral system
could be unfair to both Liberal and NDP supporters alike (as well as small party supporters).
Leading into the second referendum in 2009, the party system had “normalized” with the
Liberals gaining 46 seats and the NDP 33, with 45.8 and 42.52 percent of the popular vote
respectively (Elections BC 2005, 13). “For Liberals and the NDP, the 2005 election results
signaled everything was back to normal for the province’s left/right competition” (Pilon 2010,
83). Suddenly, a system that had seemed patently unfair and unacceptable in two previous
elections, produced an election result that made the system seem once again satisfactory.
“NO-STV” campaigned against BC-STV and summarized their complaints against the
system as follows:
STV is complicated, confusing, prone to errors and delay, it reduces local accountability, increases the size of ridings, allows MLAs to avoid direct accountability for their decisions, increases party control and allows special interests to dominate party nominations... It also hasn't been proven to do many of the things its proponents claim—like increase the ability of third parties and independents to get elected, and it is not truly proportional in guaranteeing that each party will get the number of seats in the Legislature equivalent to the percentage of votes they received (NO-STV 2009).
106
If proposed in the future in Canada, arguments against the system such as these would be
expected to re-emerge. Many of these claims, however, are questionable. Under STV, voters
would vote directly for all MLAs (or MPs, MPPs, MHAs, or city councillors), making all
members directly accountable to voters, contrary to what NO-STV claimed. This argument can
be more legitimately be made against closed lists, since party elites rather than voters would
determine the order of the list. Under STV, on the other hand, voters’ ranking of candidates
determines which candidates would get elected, making the claim that members would not be
directly accountable, simply false. Further, with a choice of candidates within each party,
member accountability could actually increase under STV when compared to first-past-the-post.
How it would increase party control, as NO-STV claims, also seems baseless
since there would be a degree competition between members who are competing within a
district, contrasted with only one candidate per riding under the current system. NO-STV’s claim
that STV will not guarantee a proportional result, however, has some degree of merit. The district
magnitude under the BC-STV model would have had 20 electoral districts with a district
magnitude ranging from two to seven (Elections BC 2008, 130-136). The low district magnitude
of two or three in four ridings would decrease proportionality in these ridings and overall
proportionality. The district magnitude of four in eight ridings would give moderate
proportionality, but no where near perfect. The remaining districts with five to seven members
would be expected to deliver a fairly high degree of proportionality. Perfect or near-perfect
proportionality would certainly not be achieved under the BC-STV model. It would, however,
certainly deliver a more proportional result than under the first-past-the-post model.
107
Another noteworthy benefit of STV is that its ordinal ballot would permit otherwise
wasted and surplus votes to be transferred to the remaining candidates; most voters could expect
to have at least one representative for whom they voted. For this reason, voting could be
perceived as more meaningful, since voters would likely be represented by at least one of their
choices. Under the proposal, local geographic representation would still be maintained, but in the
sparsely populated areas of the province, this would come at the cost of proportionality due to a
low district magnitude. The boundaries commission wrote: “in sparsely populated areas of the
province, the desire for proportionality must be balanced against the need to create BC-STV
districts that reflect local community and regional interests, and that are serviceable” (Elections
BC 2008, 321). With this in mind, a high district magnitude in these areas would not be practical.
Demographic representation could also be improved under STV, since parties are
permitted to run multiple candidates. Since the party vote is not pooled, however, parties have an
incentive to not run a “full” slate of candidates: doing so may split their party’s vote too much.
Nonetheless, when parties do run multiple candidates, the incentive to diversity their pool of
candidates and include more female and minority candidates will be present.
Overall, there are many benefits of the single transferable vote when compared to first-
past-the-post. Perhaps STV’s biggest negative aspect, its complex counting method, appears
more of a problem when it comes to gaining support from the citizenry more than it is a real
detriment to the working of the system. If put in use, a number of different counting methods
should be evaluated to determine which one would be most appropriate. It would be a significant
improvement over first-past-the-post since it would give a more proportional result, helping
create more regionally balanced governments and a more effective opposition, maintain local
108
geographic representation, it would make voting more meaningful, could help increase
demographic representation and could create more accountable members. The system would
likely be more palatable municipally than provincially, and provincially than federally, since
riding sizes increase in that order. Arguably, its greatest strength is that since it takes into account
only candidates, and not parties, it is particularly well suited for application in municipal
councils where no parties exist. When parties do exist, however, the system seems to make
matters needlessly complicated, since votes could simply be pooled by party and allocated
proportionally like under list proportional representation (list-PR), discussed next.
5.4 List Proportional Representation (list-PR)
There are a wide variety of forms of list proportional representation that can be created by
employing different combinations of electoral system features, as discussed in Chapter 3, such as
varying the district magnitudes, formulae, types of lists, and number of tiers. To reiterate an
important point from Chapter 3, the higher the district magnitude, the higher the level of
proportionality that is possible. In list proportional representation, a formula determines the
allotment of seats each party receives, such as a quota-largest remainder or highest average
formula, discussed earlier. The obvious issue becomes: which party candidates will fill the seats
won? To determine this, an ‘open,’ ‘closed,’ or ‘semi-open’ list can be used. In closed-list PR,
parties submit a ranked list of candidates before the election; seats parties win go to their
candidates by list ranking. Contrasted with closed lists are fully open lists. With open lists,
voters’ preferences alone, and not party ranking, determine which candidates receive party seats.
Between a fully open and fully closed list, is an in-between type of list with which voter
109
preference and party ranking are both considered. This type of list can be referred to can be
referred to as a semi-open, semi-closed, preferential, or “flexible.” The degree of flexibility can
vary with such a list, depending on the specific rules. Some examples of list proportional
representation and their feasibility in Canada will be discussed below.
5.4.1 Closed-list PR
In closed-list proportional representation, voters vote for their party of choice, but they
have no influence over which candidates from that party get elected: this is determined by the
ranking on the party list created before the election. Israel, for example, uses closed lists in a
single, nation-wide constituency with 120 seats (Rahat and Hazan 2005, 333-335) (LSq: 2013:
3.09, 2009: 1.61, 2006: 2.49) (Gallagher 2013a), while Spain uses closed lists in multi-member
constituencies with district magnitudes ranging from one to thirty-five (Hopkin 2005, 387-379)
(LSq: 2011: 6.93, 2008: 4.49, 2004: 4.25) (Gallagher 2013a). A closed-list system could improve
demographic representation if the party elite were committed to offering a balanced list of
candidates. Women in Parliament does not appear to be a priority in Israel, as they make up only
21.7 percent of the legislature, whereas in Spain they make up 36 percent, and in South Africa
which also employs closed-list PR (Gouws and Mitchell 2005, 358), 42.3 percent (Inter-
Parliamentary Union 2013). Closed lists, however, are not a necessary prerequisite for women’s
representation: it can be achieved with fully open lists as has been shown in Finland, with 42.5
percent women in Parliament (Inter-Parliamentary Union 2013).
110
5.4.2 Open-list PR
Taagepera and Shugart explain that Finland uses a form of open-list proportional
representation (PR), that might be better described as “quasi-list” PR (1989, 25). Under this
system, voters have complete control over which candidates from the party will fill the party’s
seats. A voter votes for her preferred candidate by writing the identification number of the
candidate on her ballot (Raunio 2005, 480). Since parties are permitted to nominate up to
fourteen candidates per riding (Raunio 2005, 477), this number-write-in system no doubt
simplifies the ballot a great deal and prevents it from being an unmanageable size. The number
of votes a party receives determines the number of seats the party will receive, which will then
be awarded to the candidates in that party who received the most votes. Voting in Finland is
“very candidate-centred as preference votes alone determine the success of candidates within
parties” (Raunio 2005, 481). This contrasts with closed-list PR where voters may only vote for a
party and have no influence over which candidates get elected to fill seats awarded to parties. A
vote cast in Finland is a vote for both for a candidate as well as a party, not unlike Canada. The
major difference, of course, is that the number of votes a party receives in Canada is not directly
linked to the number of seats that party will receive.
Finland is divided into fifteen constituencies: fourteen multi-member constituencies and
one single-member district (Raunio 2005, 476; Ministry of Justice Finland 2010, 11), based
primarily on traditional administrative provinces (Raunio 2005, 476). The district magnitude of
the fourteen multi-member ridings currently ranges from six to thirty-five (Finlex 2010) and
changes based on census data (Raunio 2005, 477). The d’Hondt system, which favours larger
parties, is used to calculate the allocation of seats to parties (Raunio 2005, 482). For this reason
111
the three largest parties tend to receive a slightly higher proportion of seats than votes (roughly
two percent more), while the smaller parties receive a slightly lower proportion of seats than
votes (Raunio 2005, 482; Ministry of Justice Finland 2007, 2011). Proportionality is nonetheless
high, with the noted slight advantage for the largest parties (LSq: 2011, 2.95, 2007: 3.20)
(Gallagher 2013a). Tapio Raunio explains that the larger parties favour the current d’Hondt
formula of allocating seats, while smaller parties have argued for the use of the Sainte-Laguë
formula or the use of nation-wide adjustment seats (2005, 487).
5.4.3 Semi-open list PR
With a semi-open or flexible list, candidates are ranked, but voters may express a
preference vote. The impact of expressing a preference in such a system will vary depending on
the rules of the system. In Belgium, for example, voters can either endorse the party list or vote
for a specific candidate. Candidates with low list-rankings in Belgium, however, have very little
chance of getting elected (Farrell 1997, 73-77). Flexible lists are also used in Austria, the
Netherlands, Norway, and Sweden (Farrell 1997, 73). The Law Commission of Canada in its
proposal recommended that “flexible” (semi-open) lists be used for determining the list seats in
its MMP proposal, “provid[ing] voters with the option of either endorsing the party “slate” or
“ticket,” or of indicating a preference for a candidate within the list” (2004, 175).
5.4.4 List-PR with multiple tiers of seat allocation
The district magnitude-proportionality trade-off is well known, but as discussed, one way
to increase proportionality without creating excessively large constituencies is to employ
112
multiple tiers. “The basic idea is that any votes which have been ‘wasted’ at the first-tier—all
remaining votes which have not been used to fill seats—are pooled and the distribution of the
remaining seats is determined in the second-tier” (Farrell 1997, 69-70). If proportionality is
already quite high in the first tier, fewer seats are required in higher-level tiers to correct for
proportionality. Norway allots only about 5 percent of its seat to its second-tier, Sweden, 11
percent, Denmark and Iceland, 20 percent (Farrell 1997, 70).
5.4.5 Is list-PR a suitable option for Canada?
The Finnish model is a list-PR system that could plausibly work in Canada. It divides the
country into its traditional administrative provinces: in Canada, multi-member constituencies
could be made from Canadian provinces; large provinces could be further divided into provincial
sub-regions. A degree of geographic representation would remain under the system, although,
admittedly, it would not be as local as Canadians are accustomed to. If broken down into small
regions, it would certainly come at the cost of a degree of proportionality. The Finnish system,
nevertheless, makes an exception for Aland, which elects only one member, despite the
remainder of the country being broken into multi-member constituencies (Ministry of Justice
Finland 2010, 11). This principle could be applied to the sparsely populated territories. In such
cases with a district magnitude of ‘1’, list-PR becomes a familiar single-member plurality
election. The downsides of first-past-the-post would be present, but its effects would not be as
severe since most ridings would be multi-member. There seems to be a very high probability that
if a list-PR system were to be designed for Canada, district magnitude would be relatively low
given Canada’s tradition of single-member districts, decreasing the level of proportionality.
113
Some voters in the inevitable single-member ridings remaining may feel that is it unfair to be
unable to cast an effective vote while voters in multi-member ridings cast effective votes. It
would be no less fair for voters in those ridings, however, than the current situation in those
ridings under first-past-the-post, so overall the system would be a net improvement. A notable
downside to list-PR, of course, is that an inevitable trade-offs must be made between local
geographic representation and high proportionality.
Models of list-PR that would seem unsuitable or unpalatable for Canada are those of the
Netherlands and Israel. Both of these countries employ nation-wide seat allocation—something
which most would likely agree is unimaginable in Canada. Further, the Netherlands and Israel
both used closed lists. Canadians are accustomed to being able to vote for individual candidates
contesting local ridings, so the inability to vote for a specific candidate could further be
contentious. It does not seem that this combination of list PR—closed lists in a nation-wide
district—is a viable option for Canada. If closed lists were employed we would expect to hear
similar complaints as were raised in the United Kingdom during European elections: “During the
2009 European elections, there were numerous complaints that the ‘closed list’ system of PR did
not allow voters to endorse (or reject) specific individuals” (Kelly 2010, 43). The inability to
endorse specific candidates would make high-ranking party members essentially unaccountable
to the public, failing another one of the listed criterion.
Demographic representation could be expected to improve under list-PR since, as is the
case in Finland, “parties try to ensure that the lists are as representative of the electorate or their
potential voters as possible” (Raunio 2005, 485). The last parliamentary election in the
Netherlands saw women fill 39.6 percent of the seats (2013), in Israel, 22.5 percent, in Finland,
114
42.5 percent (Inter-Parliamentary Union 2013), all using list-PR with one tier. We can compare
this to Canada, with 24.7 percent, the United Kingdom, 22.5 percent, and 17.9 percent in the
United States (Inter-Parliamentary Union 2013), all using first-past-the-post. As the case of Israel
further indicates, lists alone, will not automatically increase the proportion of women in
Parliament (but more women on those lists, of course, would). The case of Finland shows that
open-list PR does not necessarily perform worse than closed-list PR in terms of women’s
representation. If Canada were to use a model of list proportional representation, parties would
be pressured to present a balanced and more diverse slate of candidates. Further, it would be
strategically beneficial for parties to do so in order to try to appeal to wider groups of voters. For
these reasons, it would be reasonable to expect the number of women and minorities in
Parliament to increase under list-PR.
More proportional election results under list-PR could result in higher government
accountability since the parliament elected would largely reflect the political preferences of the
country. Majority rule would be achieved since a majority government would require support
from a majority of voters (or at least very close to it). A largely proportional outcome would help
ensure that an opposition exists in size that is close to its level of support. It would also help
governments be more regionally balanced and thus make it easier to create more regionally
balanced cabinets.
Votes would be more meaningful as the vast majority would contribute to the election of
a representative. Some voters in the few inevitably remaining single-member districts or low-
magnitude constituencies might, however, continue to perceive their votes as largely meaningless
if they fail to help elect a member from their preferred party. In order to make all votes
115
meaningful in such a case, the system could have an overlapping tier which would adjust for
otherwise ineffective votes.
When compared with the single-transferable, list-PR systems are rather ‘simple’.
Counting methods under STV, as noted, can be unwieldy and obscure, especially when one tries
to optimize fairness and minimize anomalies that can arise. The candidate-centred nature of
STV makes it a popular choice among some electoral reformers. List-PR can be party-centred
(closed lists PR) or candidate-centred (open-list PR), or somewhere in between (semi-open or
flexible-list PR). If one is desirous of a candidate-centred proportional voting system, either
open-list-PR or STV would be good choices, however, if simplicity is also desired, as I would
argue it is, open-list-PR would be preferable. In open-list-PR, the ballot could be such that a
voter would mark an ‘x’ next to her preferred candidate, as is the case currently under first-past-
the-post (but with a choice of candidates within parties). Alternatively, a voter might be given a
‘blank’ ballot on which to write the name or identification number of her most preferred
candidate. A single vote would be meaningful on two dimensions: votes would count towards
determining the seat allocation by party, and also towards determining which candidates would
fill party seats won.
Potentially the most contentious issue would be the lack of very local geographic
representation. Some voters may find this “unpalatable,” while others may see the benefits of the
system compared to the current one. The absence of single-member districts could potentially
make it a difficult sell to Canadians, despite its many positive points. In the words of the Law
Commission of Canada, “Although it provides a significant element of proportionality, a list-PR
system represents a significant departure from our Parliamentary tradition” (2004, 82). If
116
adopted, district magnitude could plausibly be significantly smaller than the Finnish model,
greatly affecting proportionality.
Adding a higher-level, compensatory tier would negate the effect a small district
magnitude would have on proportionality. Indeed, the district magnitude of the first-tier could be
reduced to one. In that case, of course, the system would cease to be classified as “list-PR,” and
would be a “mixed-compensatory” system, examples of which will be discussed in the next
chapter.
Complex districting is another area where list-PR has another significant advantage over
STV. Adding another, overlapping tier to a list-PR system is simple, allocating higher-tier seats in
a compensatory manner so as to correct for disproportionality in the nominal tier. Although
complex districting would be theoretically possible using a preferential ballot in the nominal tier,
such as in STV, it seems impractical and needlessly complicated. If all voters’ first-choice votes
could count, what would be the purpose of subsequent rankings? In this case, subsequent
preferences would seem superfluous since virtually all voters first-choice votes would contribute
to the election of a representative. This is the line of reasoning of van der Hout, de Swart, and ter
Veer when noting the appropriateness of the plurality rule in list-PR:
when allocating seats in a legislature, it is possible in principle for virtually everybody to be represented by the party he or she prefers most. In fact, under pure list PR, everybody does get a representative of the party he or she chooses, and thus everybody actually gets his first choice (2006, 465).
List proportional representation would fix many of the flaws of the current system and improve
the quality of democracy in Canada. Adding multiple (or at least two) tiers of allocation would
allow us to maintain local geographic representation through low district magnitude in the
nominal tier, while achieve high proportionality. When district magnitude is minimized in the
117
nominal tier (1), the system would then classified as a ‘mixed’ system because of its resemblance
both to list-PR and single-member plurality systems.
118
Chapter VI: Mixed systems: the ‘best of both worlds’
A ‘mixed’ electoral system refers to one that has at least two tiers of seat allocation, with
the nominal tier consisting of single-member districts. Some leading electoral systems experts
have referred to mixed systems as the “best of both worlds” (Shugart and Wattenberg 2003, 595).
The dilemma we face in designing a list-PR system is that high proportionality comes at the
expense of local geographic representation, and local geographic representation comes at the
expense of high proportionality. A logical solution to this trade-off is to have multiple (at least
two) tiers of seat allocation to correct for disproportionality in lower tiers. Using this method, we
can even reduce district magnitude to familiar single-member districts, giving each constituency
its local member. Higher tiers need not necessarily be compensatory or linked to the nominal tier;
they can be independent or ‘parallel,’ as is the case in Japan (Reed 2005, 283; Gallagher and
Mitchell 2005, 13) and formerly in Russia (Golosov 2012).
Gallagher and Mitchell write that “Having more than one level means that we might be
able to have our cake and eat it” (Gallagher and Mitchell 2005, 12). They explain that
“archetypal mixed systems,” such as MMP in Germany, allocate half the seats to single-member
ridings and the other half to list seats (Gallagher and Mitchell 2005, 12). The ability to maintain
local geographic representation in line with Canadian tradition, with added benefit of
proportionality, makes mixed systems particularly attractive for Canadian electoral reformers.
Some of the mixed-compensatory variants and proposals will be discussed in this chapter.
119
6.1 Mixed-member proportional representation (MMP)
Mixed-member proportional (MMP) is a variety of mixed-compensatory system in which
voters express two votes: one for a candidate and one for a party. The party vote determines the
overall number of seats to be awarded to each party, and the number of single-member districts
already won is subtracted from this total. Some of the Canadian MMP proposals will be
discussed below.
6.1.1 Proposal of the Ontario Citizens’ Assembly on Electoral Reform
The Ontario Citizens’ Assembly on Electoral Reform proposed a mixed-member
proportional representation (MMP) model that was ultimately rejected in a referendum with only
37 percent support (LeDuc 2009, 47). This model would have had 90 local members elected
from single-member districts, with 39 list members: a 70-30 split (Ontario Citizens’ Assembly on
Electoral Reform 2007, 10). The list members would have been chosen from province-wide
closed lists (2007, 8), a feature that, according to Henry Milner, “doomed” the system from the
start (2007). Milner explained that it was a “built-in weakness that could be easily exploited by
opponents of reform” (2007). Milner admits that the system would have been a “clear
improvement on the status quo” but remarks that an alternate MMP model with list seats filled
regionally would have been less vulnerable to such attacks and more acceptable to voters (2007).
The other significant argument against MMP was its “39 MPPs beholden to party headquarters
instead of voters” (Milner 2007). This would still be the case if the model employed regional
closed lists, and so open lists would be needed in order to prevent this other vulnerability. A
system with open rather than closed lists, or at least semi-open lists, would have, no doubt, made
120
the system much more palatable for Ontarians. The model proposed by the Ontario Citizens’
Assembly on Electoral Reform was flawed on two important dimensions: its lists would have
been closed and province-wide. An improved version would still likely struggle to meet the
supermajority threshold that was set at 60 percent of the vote and a majority in at least 60 percent
of the electoral districts (Ontario Citizens’ Assembly on Electoral Reform 2007, 15). A more
appropriate model with a reasonable threshold for victory such as a majority of votes in a
majority of ridings, would make such a proposal much more likely to succeed, whereas this
version of MMP was indeed, “doomed from the start” (Milner 2007).
6.1.2 The Law Commission’s proposal
The Law Commission of Canada, after conducting extensive research and public
consultation, recommended a model of mixed-member proportional representation for Canada.
They proposed that one-third of the seats be filled by list PR and the remaining two-thirds be
filled by the current first past the post method (2004, 175). This is somewhat different from the
German model of MMP where one-half of seats are filled through list PR (2004, 90). Under the
Scottish model of MMP, 57 percent of the seats would be elected from single member districts,
while the remaining 43 percent from party lists. New Zealand has a similar division of seats, with
58 percent of the seats in single member constituencies and 42 percent in list seats. The Law
Commission’s proposed proportion of list to constituency seats is less ambitious, and would
perhaps not include enough second-tier seats to achieve near full proportionality. The purpose of
the Law Commissions proposed model was not to accomplish perfect proportionality, but rather
121
to add an “element of proportionality” (2004, 175), which it certainly would accomplish if
adopted.
The Law Commission’s proposal recommended filling the party’s list seats from a
‘flexible’ list (‘semi-open’), whereby voters could either endorse the party’s slate, or indicate a
preferred candidate (2004, 175). The commission further recommended that parties develop
initiatives to create gender parity and minority representation on lists (2004, 176-177). Howard
Cody examined the effects of MMP on New Zealand and concluded that “it undeniably has
enhanced the parliamentary representation of Maori, women and some minorities in New
Zealand (2003, 41). The percentage of women in Parliament is an easily measurable and
comparable figure since women (should) comprise roughly half of society. New Zealand saw its
proportion of female MPs rise from a “relatively high 21% just before MMP” to 31 percent, most
of which were elected from party lists (Cody 2003, 41). Currently, New Zealand’s proportion of
female MPs stands at 32.2 percent (Inter-Parliamentary Union 2013). Interestingly, this is very
close to the percentage of women elected in the German Bundestag, which hovered around 32
percent for four elections, before reaching its record level of 36.5 percent this year (Inter-
Parliamentary Union 2013). By comparison, women comprise 24.7 percent of Canada’s House of
Commons, and in the United Kingdom, 22.5 percent. The United States’ House of
Representatives, also elected under first-past-the-post, is composed of 17.7 percent women.
Countries with pure list-PR systems tend to have a significantly higher number of women elected
to their assemblies: as of July 2013 there were 44.7 percent in Sweden, 42.5 percent in Finland,
42.3 percent in South Africa, 39.7 percent in Iceland, 39.6 percent in Norway, 39.1 percent in
Denmark, 38.7 percent in the Netherlands, 38 percent in Belgium, and 36 percent in Spain (Inter-
122
Parliamentary Union 2013). The obvious trend here is that first-past-the-post elects very few
female representatives compared with list proportional representation. Since representatives
under mixed-member proportional are elected according to both these methods, lists and single-
member-plurality, we would expect the proportion of women elected under this system to be
somewhere in between: Germany and New Zealand illustrate that this is indeed the case. Mixed-
member proportional would very likely improve representation of women and minorities but it
would not, admittedly, be likely to perform as well in this regard as list proportional
representation. Further, since the Law Commission’s proposal of one-third list seats is
significantly lower than Germany’s 50 percent and New Zealand’s 42 percent, the proposal
would be expected to bear a closer resemblance to first-past-the-post in terms of demographic
representation than to list proportional representation.
One potential issue with flexible lists used in the list tier would be the logistical problem
of the size of the ballot. A proposed region in Québec for the purpose of list seats, “North and
East Quebec” would have 27 single-member ridings with 13 additional list seats (2004,
181-182). If the list comprised the candidates from all the single-member ridings from the five
main parties in Québec, the Liberal Party, the Conservative Party, the New Democratic Party, the
Bloc Québecois, and the Green Party, the ballot could be quite burdensome with the names of
135 candidates! In addition to the main parties, there would also be small parties contesting
constituencies and lists. There may need to be a limit placed on the number of candidates each
party could place on the list in order to make the list more manageable. An easy way logistically
to deal with a potentially large number of candidates and avoid an overly large ballot would be
have voters, as in Finland, write the identification number of their preferred candidate on the
123
ballot. This method could also easily accommodate a fully-open list. Although a flexible list
would be more favourable than a closed list, a fully open list for the list tier would give voters
full control and would be preferable.
Alternatively, the ‘list’ seats could be filled by the most successful party candidates by
percentage of votes in their local riding, who have not won a constituency seat. This would have
the additional benefit of making the candidate vote more meaningful: votes that fail to elect a
riding candidate may help this candidate win a ‘list’ seat. Would Canadians prefer that a vote cast
for their most preferred candidate be automatically wasted if this candidate does not belong to
the most popular party in their riding, or might Canadians prefer that this vote increase the
chances of electing this candidate in another tier? It seems that for maximizing the
meaningfulness of votes, the latter would be preferable. Both of these last options for
determining which candidates are to fill second-tier seats, the Finnish candidate-number model,
or the “best local candidates” option would prevent large, burdensome ballots that might
otherwise exist in open-list systems.
The Law Commission further recommended that there be no restrictions on “double
inclusion,” that is, candidates would be permitted to run in a single-member district and for a list
seat (2004, 125). Any system with two or more tiers of seat allocation that permits double
inclusion opens itself up to the complaint that “losing” or “zombie” candidates could fill the
second tier. Since the Law Commission’s proposal would use a flexible list, list winners would
win because they were specifically endorsed by voters at this level, either by preference votes, or
by the endorsement of the party slate by the voter. As the Law Commission writes, “The flexible
party list as proposed in this Report ought to minimize any potential voter unhappiness with
124
some candidates trying to maximize their chances for election by running at both levels” (2004,
125). This argument against double inclusion is most persuasive when the list is closed because it
would mean that no matter how poorly a candidate performs in the single-member district, he
could still be elected by virtue of a high list ranking. These last two options would minimize such
claims because all candidates would gain their seats based on support from voters, and not
through the “back door” by a pre-determined list created by party elites. Double inclusion is the
norm among countries using multiple tiers of allocation, with only Thailand outright banning it
(Law Commission of Canada 2004, 125). The “best candidates” method would be the simplest
and perhaps most viable option for the second tier in Canada since the Finnish candidate-number
model would be unfamiliar to Canadians, as would be choosing a candidate from an excessively
large list. The ‘best candidates’ method, however, has some potential drawbacks that should be
resolved before this option is considered.
As shown earlier, women are more successful on lists than in single-member districts.
Party gender quotas and goals are easier to accomplish on lists than in single-member districts.
The reason for this is simple: if parties desire gender parity, they can balance their lists of
candidates. Constituency associations obviously cannot balance a list of one candidate—offer in
each riding half a man and half a women. It seems then, if second-tier seats were to be allocated
based on the “best candidates” within the single-member districts, that the proportion of women
in Parliament would not be any better than under first-past-the-post. Another concern with such a
set up would be the potential for a party to run out of candidates to fill its seat entitlement in
Parliament. With a 50-50 seat distribution between single-member districts and second-tier seats,
a party with only one candidate contesting each riding that wins a majority of seats would not
125
have enough candidates to fill those seats! There is, fortunately, a simple solution to this
dilemma: allow parties to run two candidates per riding. Party votes would, of course, need to be
pooled at the constituency level so as to prevent members of the same party splitting their vote17.
Not only would this mean that parties would have enough candidates available should a majority
government be won, but this arrangement would increase voter choice and member
accountability: voters would have a choice of candidate within their preferred parties. Also, very
importantly, it would give parties an incentive to offer a more diverse slate of candidates and it
would facilitate in achieving gender parity: accomplishing this would be as simple as offering
one male and one female per riding. With pressure put on parties to achieve gender parity, it
could develop into a norm and expectation, easily visible by all if violated. Under such a system
as the incumbency advantage would wear off over time in a Parliament with a current gender
ratio of three males per female (Inter-Parliamentary Union 2010), this ratio should be expected to
approach one to one.
List proportional representation performs better than first-past-the-post in terms of
women’s representation. Because Mixed-member proportional elects candidates both by first-
past-the-post and lists, its performance in this regard is, not surprisingly, in between that of these
two systems. A no-list version of MMP would be expected to perform better than existing MMP
systems in this regard—perhaps even approach and eventually reach a 1:1 ratio—if parties were
permitted to run two candidates per riding thereby making it possible and easy for party riding
associations to nominate an equal number of men and women candidates in every riding. Party
votes would would need to be pooled at the riding level in order to make this possible. If we
126
17 In other words, apply the plurality formula to parties rather than to candidates.
desire an equitable number of seats be filled by women, should we not be aiming for half, rather
than one-third? There is, yet another potential defect with the ‘best candidates’ or ‘no-list’
method evident by its use in the German Länder of Baden-Württemberg. First, the issue of two
votes must be addressed.
6.1.3 Why must voters have two votes in mixed-member proportional?
This section will touch on a question that can be asked about mixed-member proportional
representation: why must voters have two votes? The simple answer to this question is that a
second vote is not necessary; the system can function with just one vote. But as Michael
Gallagher and Paul Mitchell explain,
In most mixed systems the voter casts two voters. Characteristically, the voter is faced with two ballot papers, or with one ballot paper with two columns: one on which they can indicate their choice of a candidate to represent the single-member constituency, and another on which they cast a vote for a party list (2005, 591).
Perhaps the reason behind the choice of two votes is because the “archetypal” MMP system in
Germany (Gallagher and Mitchell 2005, 12) employs two votes. Other examples of places that
have adopted a two-vote model of MMP are New Zealand, Wales, and Scotland. The Law
Commission recommended recommended a two vote model (2004, 101), and so did Ontario’s
citizens’ assembly (2007, 20). The Law Commission did not explain its choice of two votes
beyond “In [mixed] systems, voters usually have two votes, one for a given candidate in a riding,
and another for a party list” (2004, 83), and that two-vote systems are used in Germany, New
Zealand, Scotland, and Wales (2001, 101). Is there a better explanation for proposing a two-vote
system, other than “everybody’s doing it”? The Ontario Citizens’ Assembly on Electoral Reform
attempts to tackled the question directly in their “general questions section”:
127
Why do I get two votes?The first vote on the ballot allows you to choose a party. This vote determines the total share of seats each party gets in the legislature. The second vote allows you to choose an individual member to represent your local district. Together, the two votes give you strong local representation and produce fairer election results (Ontario Citizens’ Assembly on Electoral Reform 2007, 20).
Interestingly, they tell us the function of the separate votes: to determine the seat share and elect
a local representative, and what the system aims to accomplish, yet they fail to tell us why there
are two votes since it seems obvious that a single vote could accomplish this. Given that the
second vote can be considered an unnecessary complication and a departure from Canadian
voting tradition, it seems rather curious that they would not give a justification for choosing to do
with two votes something that could be done with one. Is there a reason why a vote for a
candidate cannot and should not also be counted as a vote for the candidate’s party? Massicotte
writes: “The introduction of compensatory seats will in itself greatly upset people’s habits, but
we believe that such innovation is worth the trouble. Can the same be said for the double ballot
or the alternative vote?” (2004, 122).
Perhaps it was New Zealand’s Royal Commission on the Electoral System that set the
trend for two votes when it recommended a German-style two-vote system. In addition to
criticizing the commission for inventing the term “mixed-member proportional” (MMP)
(Lijphart 1987, 100), Arend Lijphart criticized the commission for recommending the use of two
votes:
it is surprising that the Commission decided in favor of having two separate votes since this feature has not worked well in Germany. Even after several decades, the German voters still do not understand the significance of the two votes. Moreover, the two-vote ballot is inherently misleading because the list vote is not just more important than the district vote but of almost exclusive importance; voters who
128
‘split’ their vote are in fact doing nothing of the kind—their list vote is the one that really counts. (Lijphart 1987, 101)
Currently, when a voter votes for a candidate, it is well understood that the voter, by helping this
candidate get elected, is also helping the party. The only exception to this would be if the voter
votes for an independent candidate. Except for when a candidate has no party affiliation, why
should a vote for a candidate not also be considered as a vote for the candidate’s party? If the
vote for a candidate were to also be considered as a vote for the candidate’s party, and second-
tier seats allocated accordingly, would a second vote not be superfluous? Aside from there
appearing to lack a justification for a two vote system, there are reasons why a one-vote system
may be preferable.
Perhaps the biggest reason to caution against MMP is because of the system’s easily
exploitable loophole which permits parties to “achieve over-representation by encouraging voters
to split their votes” and “outsmart the compensatory mechanism designed to lead to proportional
results” (Bochsler 2012, 401). This loophole does not exist under one-vote systems since voters
cannot ‘split’ their votes. It is generally assumed, however, that under mixed-member
proportional representation (MMP) the voter gets two votes. In light of this I shall not refer to
similar systems in which voters cast only one vote as “MMP.” Similar systems with one vote
would still be considered as “mixed-compensatory” systems, but I shall refrain from labelling
them “mixed-member proportional representation” or MMP. I believe a distinction needs to be
made between two-vote and one-vote systems and so for clarity I will restrict the use of the term
MMP to mixed-compensatory systems with two votes. This loophole, or fatal design flaw with
MMP, will be discussed in more detail in the next section, followed by potential one-vote mixed-
compensatory systems.
129
6.1.4 Mixed-member proportional’s fatal design flaw
Justification for two votes rather than one is lacking. Louis Massicotte writes that “the
existence of a second vote is associated with higher levels of rejected ballots” (2004, 49). Yet,
this is only a minor point compared to a potentially more serious issue: “the existence of a
second vote may profoundly disturb the normal operation of a compensatory
system” (Massicotte 2004, 51). Electoral system experts have been aware of the potential for
manipulation in mixed-member proportional electoral systems for quite some time, but with very
few countries using the system and few examples of large-scale manipulation until recently, the
problem has not been given much attention in the past. As Rein Taagepera and Matthew Soberg
Shugart have explained: “When the voter has two votes, the potential for manipulation exists. To
some critics, the ability of voters to split their votes could provide incentives for parties working
in collusion to gain more seats than could a single party with the same number of votes
(Taagepera and Shugart 1989, 36). The seriousness of this problem has recently been brought to
light by the ingenuity on the part of parties and voters in some countries that have adopted the
system. Daniel Bochsler observed that “Under widespread split voting, mixed compensatory
electoral systems do not lead to quasi-proportional results any more, but, instead, work similarly
to mixed non-compensatory systems” (Bochsler 2012, 402).
Although MMP has appeared to function quite well in Germany for more than half a
century, the revelation of this fatal design flaw which permits parties and voters to deliberately
conspire to gain an unfair advantage may cause electoral reformers to rethink its utility as a
system. Bochsler explains that “over-representation can be achieved if parties winning single-
seat district seats encourage their voters to cast their party list vote for an allied electoral list. If a
130
sufficient number of voters adhere to these instructions, it leads to the over-representation of
those parties that act strategically in this way and to the under-representation of
others” (Bochsler 2012, 402). Manipulation may be deliberate and strategic (Bochsler 2012,
401), as noted, but even in the absence of such a deliberate strategy from parties, strategic voting
on the part of rational voters can cause certain parties to be over-represented. If a voter realizes
that her preferred party has little chance of gaining list seats because it will likely surpass its seat
“entitlement” in the single-member districts, it makes sense to vote for a small, allied party in the
list tier so that her list vote will not be wasted. With widespread vote-splitting, it is likely that
certain parties will be over-represented in the single-member districts. Whether split-voting is a
deliberate strategy by party leadership to gain extra seats or a strategic calculation on the part of
voters, there appears to be little that can be done to fix this weakness inherent in two-vote
versions of MMP.
Bochsler describes different strategies that have been used to gain over-representation in
MMP. In Lesotho and Venezuela, “large” parties split their lists, using different party labels for
the district and list seats. This way, the seats won in the single-member districts would not be
subtracted from its proportional “entitlement” (2012, 405-406, 414). Bochsler explains that with
modifications to electoral rules, cases like this can be prevented, but that the strategy employed
by parties in the 2005 Albanian election are not easily preventable:
In the 2005 Albanian parliamentary elections, the major political parties encouraged supporters to cast their district ballots for candidates of the respective major parties and their PR ballots for small allied parties. The highly effective implementation of this strategy (with 79 percent of the large parties’ voters following it) substantially affected seat allocation in the Albanian elections, and enabled a Democratic Party-based coalition to win an artificial majority of seats in parliament. This deprived the small parties of 60 percent of their seats, and of their role as pivotal voters in parliament. If all major parties’ voters split their vote
131
in a similarly effective manner, then the outcome of the electoral system would be basically indistinguishable from a mixed non-compensatory system (Bochsler 2012, 413).
Outsmarting the compensatory mechanism in mixed-member proportional representation is
facilitated by the design of the system which gives each voter two votes which can be “split.” If
the voter possessed only one vote, collective vote-splitting strategies among allied parties or by
the use of “twin” or “decoy” lists would not be possible.
Massicotte perhaps went against the trend of electoral reforms when he advised against
the use of two votes in 2004. Since then, more examples of the deliberate manipulation of MMP
systems have come to light: Venezuela (2005), Albania (2005), Lesotho (2007) (Bochsler 2012).
I must side with Massicotte in advising that a mixed-compensatory system should employ one
vote rather than two.
[T]hree considerations argue for one vote. It is the simplest option from the voter’s standpoint and the one that least upsets acquired habits. It produces fewer rejected ballots. The great majority of voters will certainly understand the respective importance of the two votes available to them, but Germany’s experience and New Zealand’s clearly suggest the existence, even after 50 years in the first case, of a fringe of voters who understand less well. Finally, and above all, Italy’s experience shows that the second vote opens the way to a manœuvre that would destroy the very essence of the compensatory system and turn it into a superimposed or parallel system no longer having much to do with PR (Massicotte 2004, 125).
6.2 One-Vote mixed-compensatory systems
6.2.1 Irvine’s proposal
Considering the serious flaw with mixed-compensatory systems employing two votes
(MMP), William P. Irvine’s 1979 proposal for a one-vote mixed-compensatory system of
132
proportional representation deserves renewed attention. He defends maintaining single-member
districts by writing that “Any system which preserves territorial constituencies represented by a
single parliamentarian has the advantage both of conforming more closely to Canadian traditions
as well as preserving the attractive functional features of such systems” (Irvine 1979, 52). Not
only would preserving single-member districts conform to Canadian tradition, but compared to
MMP proposals, the ballot structure of his model would fit bitter with Canadian tradition as well.
Irvine recognizes the existence of similar, two-vote models, but argues that a one-vote model is
preferable for Canada:
Where voters cast only a single ballot, parties will have an incentive to nominate strong candidates and mount vigorous campaigns in each constituency. With a two-ballot system in Canada, one might expect parties naming token local candidates and putting a disproportionate amount of campaign resources in province-wide media campaigns. Even the Canadian provinces are not homogeneous. If the object is to reduce alienation by motivating parties to develop roots throughout provinces, a single ballot system seems indicated (Irvine 1979, 59).
His model would see 53 percent of MPs elected directly in single-member and the remaining 47
percent by provincial lists. To accomplish this, the House of Commons would be increased in
size by one-quarter and the number of single-member districts reduced by one-third, with
average constituency size increasing by one-half (Irvine 1979, 53). There might not be appetite
for increasing the size of the House of Commons, but the idea of a one-vote mixed system is
certainly worthy of consideration. “The proposed system,” Irvine writes, “with voters casting but
a single vote, was quite deliberately designed to make party success dependent on the ability to
run strong local campaigns” (1979, 57-58). Unlike in mixed-member proportional representation
systems, parties would not be able to gain votes in any riding without running candidates in that
riding. For those who fear that proportional representation might cause the number of parties to
133
increase significantly by making it too easy for small parties to win seats, a one-vote system such
as this would dampen any such possible effect. Parties could not simply put a list of candidates
forward with a very few or no local candidates and hope for the best, as would be possible under
a two-vote system.
A downside to Irvine’s system, in terms of its palatability for Canadians, is that it would
employ closed lists for the list tiers. Parties would present 11 lists: 10 provincial lists and one
northern list for the territories. When a party’s list-seat “entitlement” is determined for a party,
candidates would be elected starting from the top of the list, skipping those already elected in
single-member districts (Irvine 1979, 54). This would mean that high-ranking party members
could be considered less accountable than other members. Like any system that employs a closed
list, it has a vulnerable point that could be easily exploited by critics, potentially making the
system a difficult sell to the public.
6.2.2 Baden-Württemberg’s system
Although the electoral system used in the German province of Baden-Württemberg is
similar to the MMP system used in Germany federally, it has two significant differences. It uses
only one vote and does not use lists to fill second-tier seats. The system’s single vote and lack of
lists make it one that would conform more closely to Canadian political tradition. Matthias Trefs
compares the German MMP system to the one used in Baden-Württemberg and praises its one-
vote ballot structure for its “comprehensibility” and “simplicity” (2003, 85). He further writes:
It is obvious that the often admired German model is not in trouble but may need some overhaul in regard to its clarity, seen from the position of the voter. Parts of the electorate simply do not understand the implications of the two votes or do not use them in the way conceived by the creators of the system. Hence, the idea of
134
reducing the number of votes to one seems justified. Not least, it would put an end to the obvious misuse of the vote-splitting option (Trefs 2003, 102).
The Baden-Württemberg system is no doubt simpler for voters than its two-vote cousin, not to
mention the serious problem that two-vote versions can be easily manipulated to distort
proportionality, as explained earlier.
It can be argued that voting is more meaningful in no-list, one-vote mixed systems such
as the one in Baden-Württemberg. In two-vote systems, “the nominal vote is lost if it is cast for a
candidate other than the one receiving the most votes” (Trefs 2003, 89). As such, in typical
MMP systems, some voters cast two effective votes, while others cast one effective and one
ineffective vote. This contrasts with Baden-Württemberg’s system, where a vote is not
automatically “wasted” if it fails to elect a local candidate:
In Baden-Würrttemberg elections [...] there are two reasons why the vote is not wasted. First, it is not wasted because it also counts towards the overall allocation of seats. Second, it is also not wasted because it directly contributes to the respective loser’s chances of receiving a seat of his party’s share in the governmental district (Trefs 2003, 89).
Like Irvine’s proposal, the vote helps determine the allocation of seats to each party.
Unlike Irvine’s proposal, candidate votes help determine which members fill seats in the second
tier. Filling the second-tier seats with popular candidates from the nominal tier would make all
representatives fully accountable to voters. Further, it would make the system more palatable for
Canadians than it would be if second-tier seats were filled from closed lists. Doing this also adds
meaning to the one vote: even one’s preferred candidate is unlikely to win her district seat,
voting for this candidate will increase her chances of winning a second seat. The one-vote option
and allocation of second seats based on the level of support received in the nominal tier greatly
simplifies a mixed system, making it a more viable option than a two-vote system. As Trefs
135
writes, “comprehensibility and simplicity cannot be neglected” (2003, 85). This is especially true
when it comes to reform in Canada, given that proportional electoral systems are often attacked
based on their complexity.
The system in Baden-Württemberg is not, however, without issue. It would not, in its
current state, improve women’s representation: “experience confirms that recycling of the “best”
defeated constituency candidates is less favourable to women. In the only State that uses this
approach, women account for only 22% of the total” (Massicotte 2004, 80). Interestingly, the
performance of this system in this respect is in line with first-past-the-post. The underlying
reason for this is that in both systems parties put forward one candidate per riding. Even well-
intentioned parties have difficulty reaching gender parity in such a situation. More men tend to
put their names forward than women, as noted earlier. This leads to more men than women being
endorsed by parties, in turn leading to more men than women elected to Parliament. It is
impossible to balance gender at the riding level when parties can only put forward one candidate
per riding. Lists will not automatically increase the proportion of women elected, as the case of
Israel shows, but lists make it simple for parties to present balanced lists of candidates. Allowing
parties to nominate two candidates per riding, needless to say, would make it easy for parties to
balance gender at the riding level. This way, second-tier seats could be filled by ‘best candidates’
without sacrificing women’s representation. Women’s representation in Parliament under such a
model would likely even be higher than in typical MMP models, and could eventually reach a
ratio of 1:1.
Another serious problem with the Baden-Württemberg system is that the chances of
winning a second-tier seat partly depends on the size of the ridings and voter turnout in those
136
ridings. Such an arrangement seems patently unfair to voters and candidates alike. Trefs argues
that in order for the system to serve as a viable model for others, this flaw should be fixed. One
way he suggests to correct this flaw is to make the sizes of constituencies equal. Another way he
suggests to correct this is by using the “relative share of votes” a candidate receives as the basis
of winning a second seat, instead of absolute number of votes (Trefs 2003, 101-102). Ideally, all
constituencies would be an equal size, however, since the population distribution changes
constantly, it is simply not possible to achieve or maintain. Even if accomplished, differences in
voter turnout would cause the same effect.
In Canada, it not be realistically possible to make all constituencies perfectly equal, so
reasonable deviations must be permitted, as they are currently. Irvine recommended for his
system: “The constituencies are to be as equal in population as is consistent with recognizing
established communities, natural boundaries and with preserving manageable size” (Irvine 1979,
52). The Electoral Boundaries Readjustment Act (1985) reaffirms the representation by
population principle, but permits some deviations. The Act stipulates that the boundaries
commission may depart from this rule in certain cases:
(a) in order to respect the community of interest or community of identity in or the historical pattern of an electoral district in the province, or(b) in order to maintain a manageable geographic size for districts in sparsely populated, rural or northern regions of the province
Obvious places that are currently exempted from strict representation by population guidelines
include the Northwest Territories, Yukon, Nunavut, and Labrador. The recent Federal Electoral
Boundaries Commission for the Province of Newfoundland and Labrador decided to keep
Labrador as a separate electoral district, despite a low population of 26, 728 reported in the 2011
137
census. In comparison, the population of the constituency of St. John’s East in the commission’s
final report is estimated at 81, 936 (2012, 33). The commission wrote:
Having regard to its history, geography, community of interest and the strength of its distinct Aboriginal communities, the Commission views the circumstances of the Labrador portion of the Province as being extraordinary and as warranting the continuance of a separate electoral district (2012, 7).
A system like Baden-Württemberg’s would give candidates from the island portion of the
province of Newfoundland and Labrador an advantage over Labrador candidates when it comes
to winning provincial second-tier seats since the population in Labrador is significantly lower
than electoral districts in Newfoundland. Allocating second seats to candidates according to
“relative share of votes” rather than by absolute number of votes, as recommended by Trefs,
would be a more realistic way to apply a one-vote, best-candidates model in Canada. This way it
would be considered fair to candidates and citizens in all ridings, regardless of population size or
voter turnout. Currently, the first-past-the-post system treats all ridings equally and so treating
them equally for the purpose of second tier seat allocation would be in line with Canadian
political tradition.
6.3 Evaluation of existing systems summarized
None of the existing systems seem to fully satisfy all ten of the listed criteria, listed again
below.
1. Palatability2. Simplicity3. Local geographic representation4. Accountable members5. Accountable government6. Meaningful votes7. Effective opposition
138
8. Proportional representation of parties9. Regionally balanced governments10. Demographic representation
Proportional representation is essential in any prospective system. If voters are not proportionally
represented, the system would fail to deliver a genuine representative democracy: it would not
give representation to all voters, ensure majority rule, or political equality. The first-past-the-post
and alternative vote systems provide the strongest local geographic representation through
single-member districts, but deliver highly disproportional election results.
List proportional representation would provide the best opportunity to enhance
demographic representation by allowing parties to create gender-balanced lists and increase
diversity. High proportionality would mean that governments would be accountable, votes would
be meaningful, governments would be more regionally balanced, and oppositions would be
effective. Closed-list PR would be simple, but the inability for voters to hold individual members
accountable would make this form of list-PR unpalatable. Open list-PR would be a more
acceptable option for Canada as it would allow voters to hold individual members accountable.
Increased proportionality under such systems, however, would come at a cost to local,
geographic representation. Creating large districts may not be palatable for Canadians, however,
given their familiarity with single-member districts. When districts are too small, a high degree
of proportionality cannot be achieved. Fortunately, creating higher tier seats can correct for
disproportionality in lower tiers caused by low district magnitudes. Using this method we can
even minimize the size of the first tier seats, making them single-member districts. This method
would deliver strong local geographic representation and be more palatable for Canadians who
139
are accustomed to single-member districts. The system would then, of course, be classified as a
“mixed” system.
Mixed systems do not, however, perform as well as list-PR systems in terms of
demographic representation because of the male bias in the single member districts. As with list-
PR, closed lists should be avoided; open-list mixed systems would be a better option. Choosing
the list-tier members from among the best candidates in the single-member district seats seems to
be an even better option. Problems with this method can be avoided by allowing each party to
nominate two candidates per riding. A very successful party would not run out of candidates to
fill seats and all members would be accountable to voters. Further, gender balance and better
diversity among candidates could be achieved. To be fair to voters and candidates from all
ridings using this method, second-tier seats should be awarded by relative success in one’s riding
rather than by absolute number of votes received.
There appears to be no real justification for employing two votes. A second vote is
therefore a needless complication, ruling out MMP18 as a serious option. A similar mixed system
that maintains simplicity by employing one vote would fit better with Canadian tradition. On the
same note, a ranked ballot is also a needless complication. It is possible in proportional voting
systems to make virtually all first-choice votes count, making subsequent rankings superfluous.
Although the single-transferable vote is a good option where votes cannot easily be pooled, that
is, where parties do not exist19, it is not ideal for Canada provincially or federally. Further, STV
does not lend well to the creation of higher tiers which allow us to minimize the size of the
140
18 two-vote versions
19 Such as some municipalities or for the election of boards in civil society.
nominal tier and escape the trade-off between local geographic representation and
proportionality.
A one-vote mixed system in which parties run two candidates per riding appears to be the
only option discussed so far that would fit all ten criteria. For this reason, I believe that such a
system would be one of the best systems possible for Canada federally and provincially. I
believe, however, than an even better system is possible. The system I propose in the next
chapter fits all ten of the listed criteria, is simpler, and would create more proportional results
than those already discussed, making it, in my opinion, the ideal system for Canada.
141
Chapter VII: Proportional-first-past-the-post
The name “proportional-first-past-the-post” may seem paradoxical at first, yet such a
system can be created. The apparent paradox lies in the fact that first-past-the-post elects
representatives from single-member districts using a plurality formula, which leads to
disproportional results. Multi-member districts, to some extent, are needed to create proportional
election results. The previous chapters examined other pre-existing electoral systems and
evaluated them according to the list of criteria and their feasibility for Canada. In designing this
system I have taken a different approach: keep the essence of first-past-the-post system, while
making the overall result proportional. Many of the existing systems would be an improvement
in terms of democracy and representation, but none seem “ideal” in the Canadian context. Mixed
systems attempt to achieve the “best of both worlds” (Shugart and Wattenberg 2001), but an ideal
system for a particular country should be tailored to its specific needs and political traditions.
Election by plurality in single-member districts is ingrained in Canadian political tradition, and
despite its weaknesses, first-past-the-post is familiar and is said to give recognizable, local
representation, and is easy to understand on the riding level. An electoral system that fixes the
deficiencies of first-past-the-post but maintains the positive and familiar features appears to be
what Canada needs.
The old saying asks: “Why fix it if it’s not broken?” The first-past-the-post electoral
system, given its poor evaluation and inability to translate voters’ intentions into a House that
reflects those intentions, is by many accounts, indeed broken. Does this justify completely
abandoning a system that has, according to some, served Canadians well in the past and one that
forms part of our political norms and traditions? I argue that what this broken first-past-the-post
142
system demands is not a replacement, but an overhaul. Like an old, run down, once-magnificent
building that needs major renovations to make it suitable for present-day use, so does our
electoral system need some changes to make it suitable for Canadians today. The ideal thing to
do in such a case is not demolition, but renovation. In short, proportional-first-past-the-post takes
a new approach to electoral system design: one that attempts to fix this old system rather than
simply replace it. The proposed system aims to keep the good features of first-past-the-post,
while fixing its deficiencies. I will first give a brief summary of the system, then explain it in
detail.
7.1 Summary of proportional-first-past-the-post
Proportional-first-past-the-post is a mixed electoral system with multiple, overlapping
levels of representation. Half of the members would be elected to represent single-member
ridings in which parties would be permitted to run two candidates. The other half of seats would
be filled in higher-level tiers (provincial sub-region, province, region, nation). The allocation of
these remaining seats would be based on the “points” pooled based on the percentage of votes
received in each riding. Parties would elect a representative for every 50 points pooled, the
equivalent of half of one riding. The basic idea of the overlapping tiers is to elect representatives
to the lowest tier possible (50 points), with leftover points transferred to the next tier. Each
province, territory, and provincial sub-region would have a seat quota which they would not be
permitted to surpass. This quota would be twice the number of single-member districts in that
province (or territory). Seats would be awarded to parties in order of points until the party or tier
quota (provincial or provincial sub-region quota) has been filled. When a party receives a seat at
143
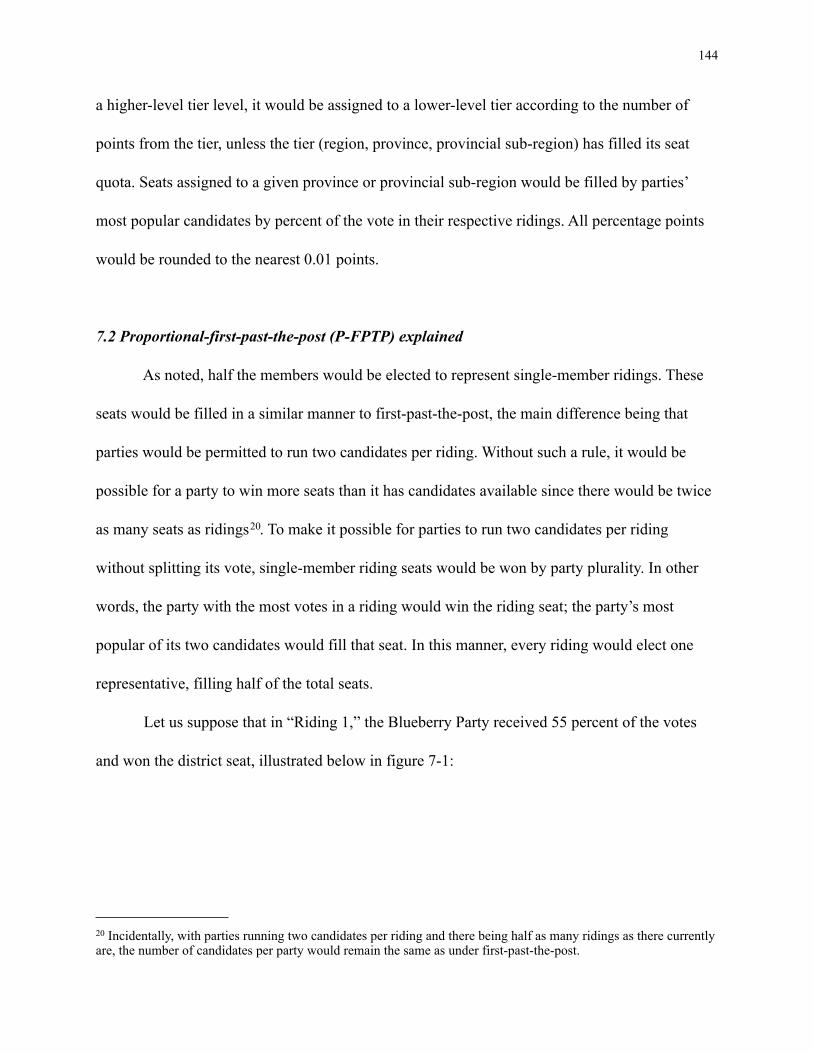
a higher-level tier level, it would be assigned to a lower-level tier according to the number of
points from the tier, unless the tier (region, province, provincial sub-region) has filled its seat
quota. Seats assigned to a given province or provincial sub-region would be filled by parties’
most popular candidates by percent of the vote in their respective ridings. All percentage points
would be rounded to the nearest 0.01 points.
7.2 Proportional-first-past-the-post (P-FPTP) explained
As noted, half the members would be elected to represent single-member ridings. These
seats would be filled in a similar manner to first-past-the-post, the main difference being that
parties would be permitted to run two candidates per riding. Without such a rule, it would be
possible for a party to win more seats than it has candidates available since there would be twice
as many seats as ridings20. To make it possible for parties to run two candidates per riding
without splitting its vote, single-member riding seats would be won by party plurality. In other
words, the party with the most votes in a riding would win the riding seat; the party’s most
popular of its two candidates would fill that seat. In this manner, every riding would elect one
representative, filling half of the total seats.
Let us suppose that in “Riding 1,” the Blueberry Party received 55 percent of the votes
and won the district seat, illustrated below in figure 7-1:
144
20 Incidentally, with parties running two candidates per riding and there being half as many ridings as there currently are, the number of candidates per party would remain the same as under first-past-the-post.
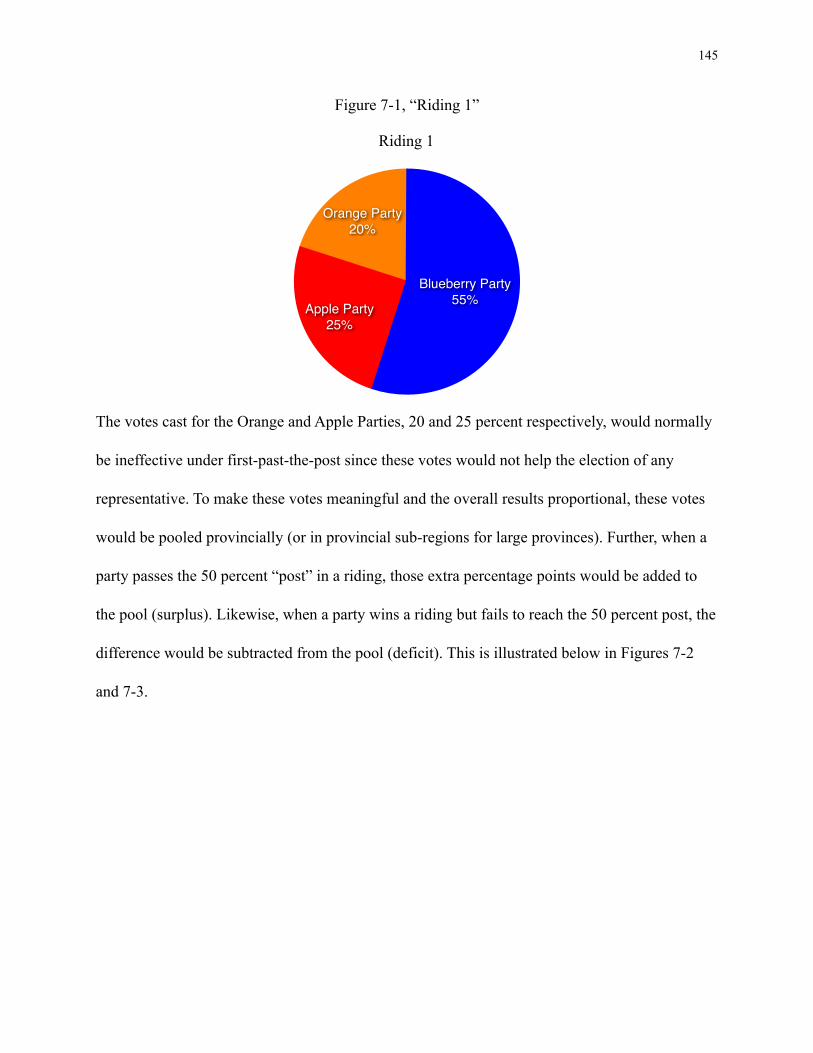
Figure 7-1, “Riding 1”
The votes cast for the Orange and Apple Parties, 20 and 25 percent respectively, would normally
be ineffective under first-past-the-post since these votes would not help the election of any
representative. To make these votes meaningful and the overall results proportional, these votes
would be pooled provincially (or in provincial sub-regions for large provinces). Further, when a
party passes the 50 percent “post” in a riding, those extra percentage points would be added to
the pool (surplus). Likewise, when a party wins a riding but fails to reach the 50 percent post, the
difference would be subtracted from the pool (deficit). This is illustrated below in Figures 7-2
and 7-3.
Orange Party20%
Apple Party25%
Blueberry Party55%
Riding 1
145
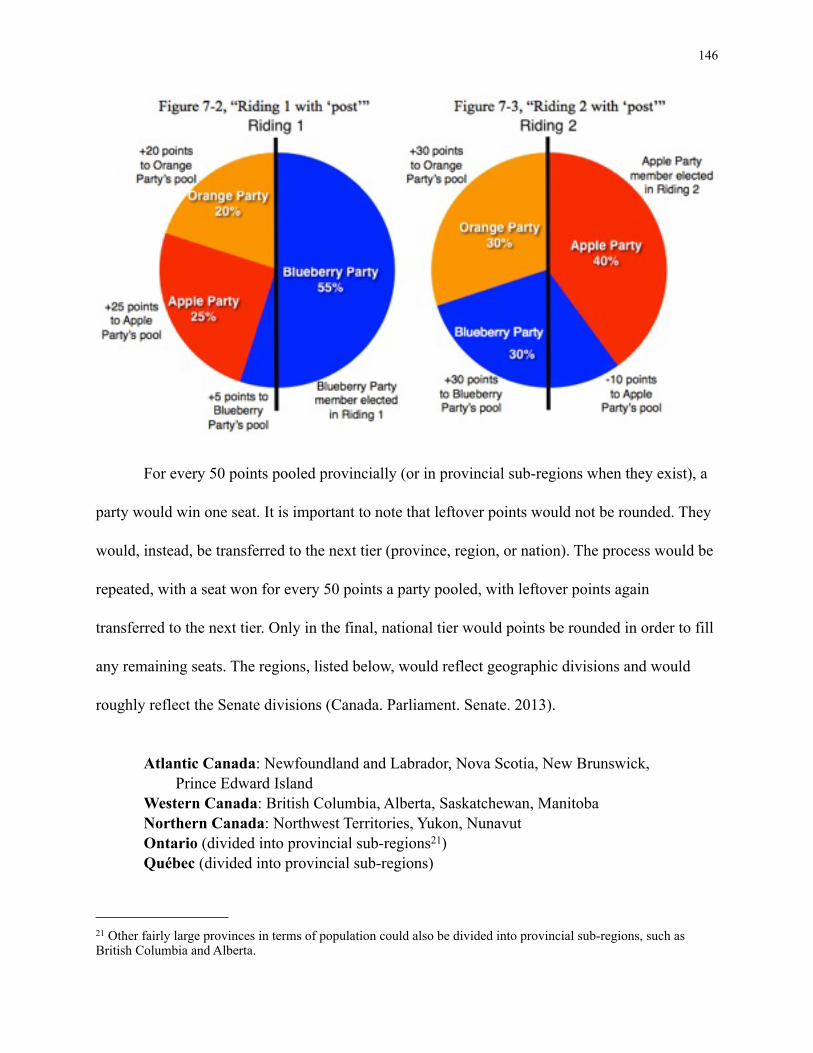
For every 50 points pooled provincially (or in provincial sub-regions when they exist), a
party would win one seat. It is important to note that leftover points would not be rounded. They
would, instead, be transferred to the next tier (province, region, or nation). The process would be
repeated, with a seat won for every 50 points a party pooled, with leftover points again
transferred to the next tier. Only in the final, national tier would points be rounded in order to fill
any remaining seats. The regions, listed below, would reflect geographic divisions and would
roughly reflect the Senate divisions (Canada. Parliament. Senate. 2013).
Atlantic Canada: Newfoundland and Labrador, Nova Scotia, New Brunswick, Prince Edward IslandWestern Canada: British Columbia, Alberta, Saskatchewan, ManitobaNorthern Canada: Northwest Territories, Yukon, NunavutOntario (divided into provincial sub-regions21)Québec (divided into provincial sub-regions)
146
21 Other fairly large provinces in terms of population could also be divided into provincial sub-regions, such as British Columbia and Alberta.
7.3 Atlantic region simulation
To illustrate how the system might work in Canada, we can simulate the results under
proportional-first-past-the-post using past election results. I will do a full simulation for the
Atlantic provinces and calculate Gallagher’s least squares index (LSq) to measure proportionality
in each province under the proposed system and the current one. Typically, this index would be
calculated at the national level, but since regional balance is a major concern in Canada, I have
decided to calculate it for each of the Atlantic provinces in the simulation22. This will give us an
indication of the level of distortion at the provincial level and what would be expected under
proportional-first-past-the-post23.
Since the proposed system would halve the number of single-member ridings with two
candidates per party per riding, we can use past election results to make a simulation. Of course,
any simulation of an alternate system is inherently flawed given that voters may have voted
differently knowing that their votes would have counted in different ways. The simulation will,
however, give a sufficient illustration of how the system would work in practice and the level of
proportionality expected to be achieved if voters voted in a similar way. I have used the most
recent federal election (2011) and grouped two neighbouring single-member ridings together in
order to simulate an election in which parties ran two candidates in ridings with roughly twice
147
22 Lijphart (1994, 61) and Gallagher (2005, 604) explain that lumping “others” (very small parties) together would distort the value of the index. Lijphart disregards parties considered as “others” in his study (1994, 61). Gallagher writes that “simply disregarding Others will usually produce a result very close to the correct one,” so this is the approach I will use for independent candidates, since they are essentially the smallest party possible: a party with only one candidate.
23 The national figure, currently at 12.42 (Gallagher 2013a, 9; and calculated from Library of Parliament data) is very high, but does not reveal the exaggerations that occur on the provincial or regional level. These exaggerations at the regional and provincial level have significant implications for regionally balanced governments (or lack thereof). In the 1980 election, for example, the Liberals came to power with a majority despite winning only two seats in Western Canada, both in Manitoba (Harrison 1995, 3). The least squares index of 8.72 for the 1980 election (Gallagher 2013a) does not reveal details such as this. The least squares index (LSq) calculated provincially for the current system and simulated for other systems will give a better understanding of the levels of proportionality at the provincial level.
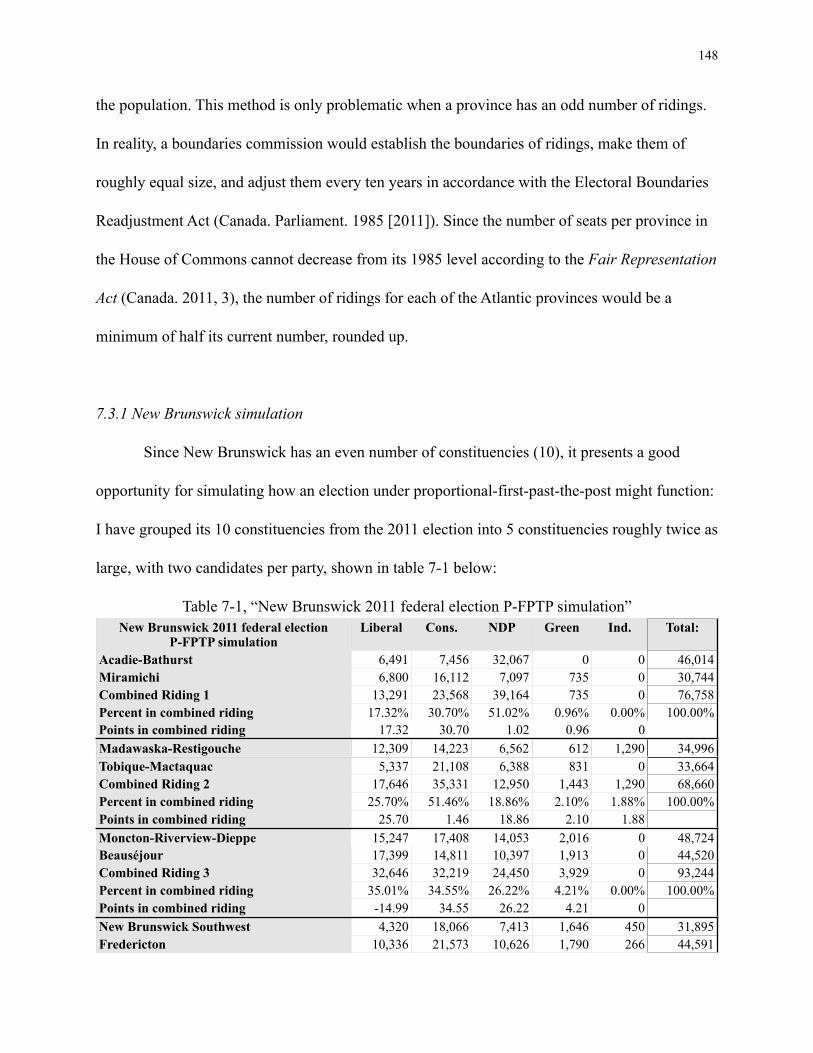
the population. This method is only problematic when a province has an odd number of ridings.
In reality, a boundaries commission would establish the boundaries of ridings, make them of
roughly equal size, and adjust them every ten years in accordance with the Electoral Boundaries
Readjustment Act (Canada. Parliament. 1985 [2011]). Since the number of seats per province in
the House of Commons cannot decrease from its 1985 level according to the Fair Representation
Act (Canada. 2011, 3), the number of ridings for each of the Atlantic provinces would be a
minimum of half its current number, rounded up.
7.3.1 New Brunswick simulation
Since New Brunswick has an even number of constituencies (10), it presents a good
opportunity for simulating how an election under proportional-first-past-the-post might function:
I have grouped its 10 constituencies from the 2011 election into 5 constituencies roughly twice as
large, with two candidates per party, shown in table 7-1 below:
Table 7-1, “New Brunswick 2011 federal election P-FPTP simulation”New Brunswick 2011 federal election
P-FPTP simulationLiberal Cons. NDP Green Ind. Total:
Acadie-BathurstMiramichiCombined Riding 1Percent in combined ridingPoints in combined ridingMadawaska-RestigoucheTobique-MactaquacCombined Riding 2Percent in combined ridingPoints in combined ridingMoncton-Riverview-DieppeBeauséjourCombined Riding 3Percent in combined ridingPoints in combined ridingNew Brunswick SouthwestFredericton
6,491 7,456 32,067 0 0 46,0146,800 16,112 7,097 735 0 30,744
13,291 23,568 39,164 735 0 76,75817.32% 30.70% 51.02% 0.96% 0.00% 100.00%
17.32 30.70 1.02 0.96 012,309 14,223 6,562 612 1,290 34,996
5,337 21,108 6,388 831 0 33,66417,646 35,331 12,950 1,443 1,290 68,660
25.70% 51.46% 18.86% 2.10% 1.88% 100.00%25.70 1.46 18.86 2.10 1.88
15,247 17,408 14,053 2,016 0 48,72417,399 14,811 10,397 1,913 0 44,52032,646 32,219 24,450 3,929 0 93,244
35.01% 34.55% 26.22% 4.21% 0.00% 100.00%-14.99 34.55 26.22 4.21 04,320 18,066 7,413 1,646 450 31,895
10,336 21,573 10,626 1,790 266 44,591
148
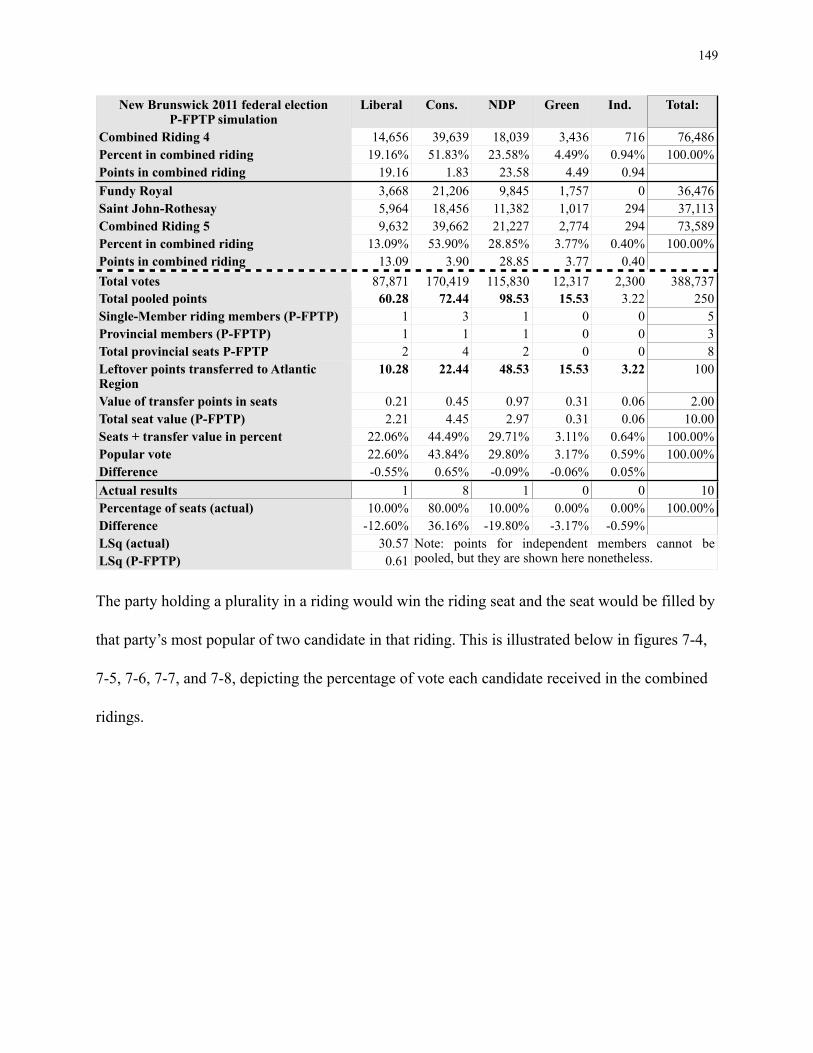
New Brunswick 2011 federal election P-FPTP simulation
Liberal Cons. NDP Green Ind. Total:
Combined Riding 4Percent in combined ridingPoints in combined ridingFundy RoyalSaint John-RothesayCombined Riding 5Percent in combined ridingPoints in combined ridingTotal votesTotal pooled pointsSingle-Member riding members (P-FPTP)Provincial members (P-FPTP)Total provincial seats P-FPTPLeftover points transferred to Atlantic RegionValue of transfer points in seatsTotal seat value (P-FPTP)Seats + transfer value in percentPopular voteDifferenceActual resultsPercentage of seats (actual)DifferenceLSq (actual)LSq (P-FPTP)
14,656 39,639 18,039 3,436 716 76,48619.16% 51.83% 23.58% 4.49% 0.94% 100.00%
19.16 1.83 23.58 4.49 0.943,668 21,206 9,845 1,757 0 36,4765,964 18,456 11,382 1,017 294 37,1139,632 39,662 21,227 2,774 294 73,589
13.09% 53.90% 28.85% 3.77% 0.40% 100.00%13.09 3.90 28.85 3.77 0.40
87,871 170,419 115,830 12,317 2,300 388,73760.28 72.44 98.53 15.53 3.22 250
1 3 1 0 0 51 1 1 0 0 32 4 2 0 0 8
10.28 22.44 48.53 15.53 3.22 100
0.21 0.45 0.97 0.31 0.06 2.002.21 4.45 2.97 0.31 0.06 10.00
22.06% 44.49% 29.71% 3.11% 0.64% 100.00%22.60% 43.84% 29.80% 3.17% 0.59% 100.00%-0.55% 0.65% -0.09% -0.06% 0.05%
1 8 1 0 0 1010.00% 80.00% 10.00% 0.00% 0.00% 100.00%
-12.60% 36.16% -19.80% -3.17% -0.59%30.57 Note: points for independent members cannot be
pooled, but they are shown here nonetheless. Note: points for independent members cannot be pooled, but they are shown here nonetheless. Note: points for independent members cannot be pooled, but they are shown here nonetheless. Note: points for independent members cannot be pooled, but they are shown here nonetheless. Note: points for independent members cannot be pooled, but they are shown here nonetheless. 0.61Note: points for independent members cannot be pooled, but they are shown here nonetheless. Note: points for independent members cannot be pooled, but they are shown here nonetheless. Note: points for independent members cannot be pooled, but they are shown here nonetheless. Note: points for independent members cannot be pooled, but they are shown here nonetheless. Note: points for independent members cannot be pooled, but they are shown here nonetheless.
The party holding a plurality in a riding would win the riding seat and the seat would be filled by
that party’s most popular of two candidate in that riding. This is illustrated below in figures 7-4,
7-5, 7-6, 7-7, and 7-8, depicting the percentage of vote each candidate received in the combined
ridings.
149
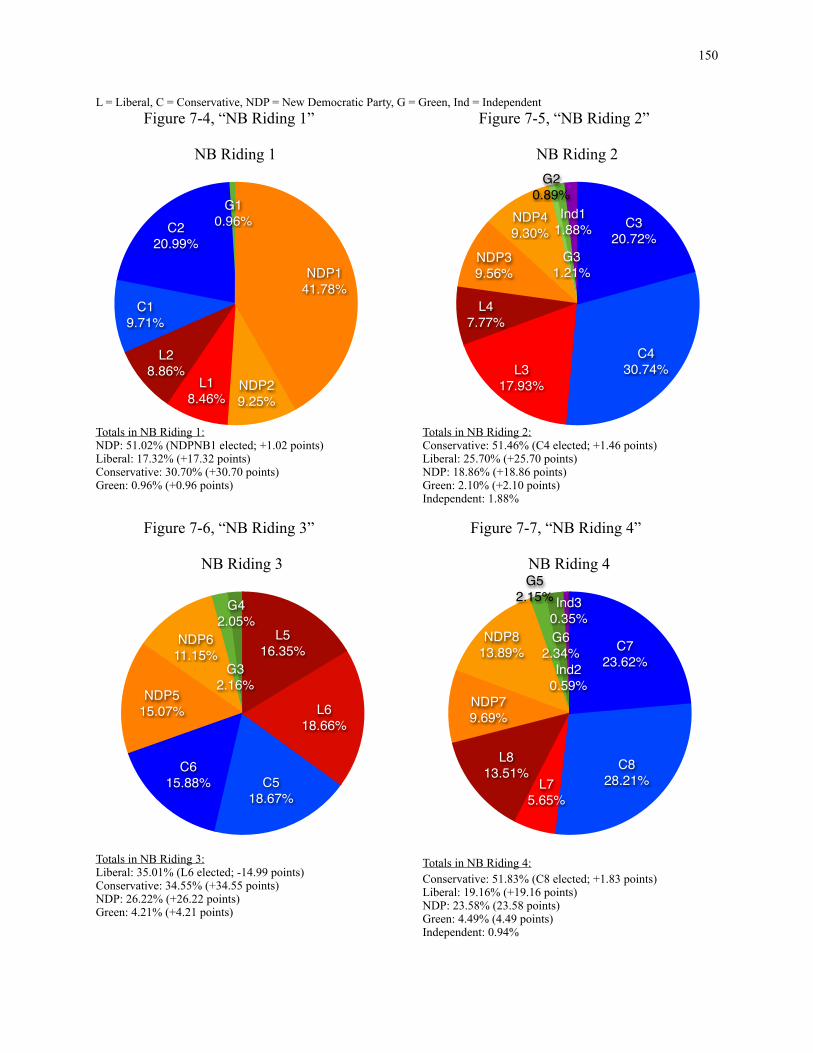
L = Liberal, C = Conservative, NDP = New Democratic Party, G = Green, Ind = Independent Figure 7-4, “NB Riding 1” Figure 7-5, “NB Riding 2”
G10.96%C2
20.99%
C19.71%
L28.86%
L18.46%
NDP29.25%
NDP141.78%
NB Riding 1
Ind11.88%
G31.21%
G20.89%
NDP49.30%
NDP39.56%
L47.77%
L317.93%
C430.74%
C320.72%
NB Riding 2
Totals in NB Riding 1:NDP: 51.02% (NDPNB1 elected; +1.02 points)Liberal: 17.32% (+17.32 points)Conservative: 30.70% (+30.70 points)Green: 0.96% (+0.96 points)
Figure 7-6, “NB Riding 3”
Totals in NB Riding 3:Liberal: 35.01% (L6 elected; -14.99 points)Conservative: 34.55% (+34.55 points)NDP: 26.22% (+26.22 points)Green: 4.21% (+4.21 points)
G42.05%
G32.16%
NDP611.15%
NDP515.07%
C615.88% C5
18.67%
L618.66%
L516.35%
NB Riding 3
Totals in NB Riding 2:Conservative: 51.46% (C4 elected; +1.46 points)Liberal: 25.70% (+25.70 points)NDP: 18.86% (+18.86 points)Green: 2.10% (+2.10 points)Independent: 1.88%
Figure 7-7, “NB Riding 4”
Totals in NB Riding 4:Conservative: 51.83% (C8 elected; +1.83 points)Liberal: 19.16% (+19.16 points)NDP: 23.58% (23.58 points)Green: 4.49% (4.49 points)Independent: 0.94%
Ind30.35%
Ind20.59%
G62.34%
G52.15%
NDP813.89%
NDP79.69%
L813.51%
L75.65%
C828.21%
C723.62%
NB Riding 4
150
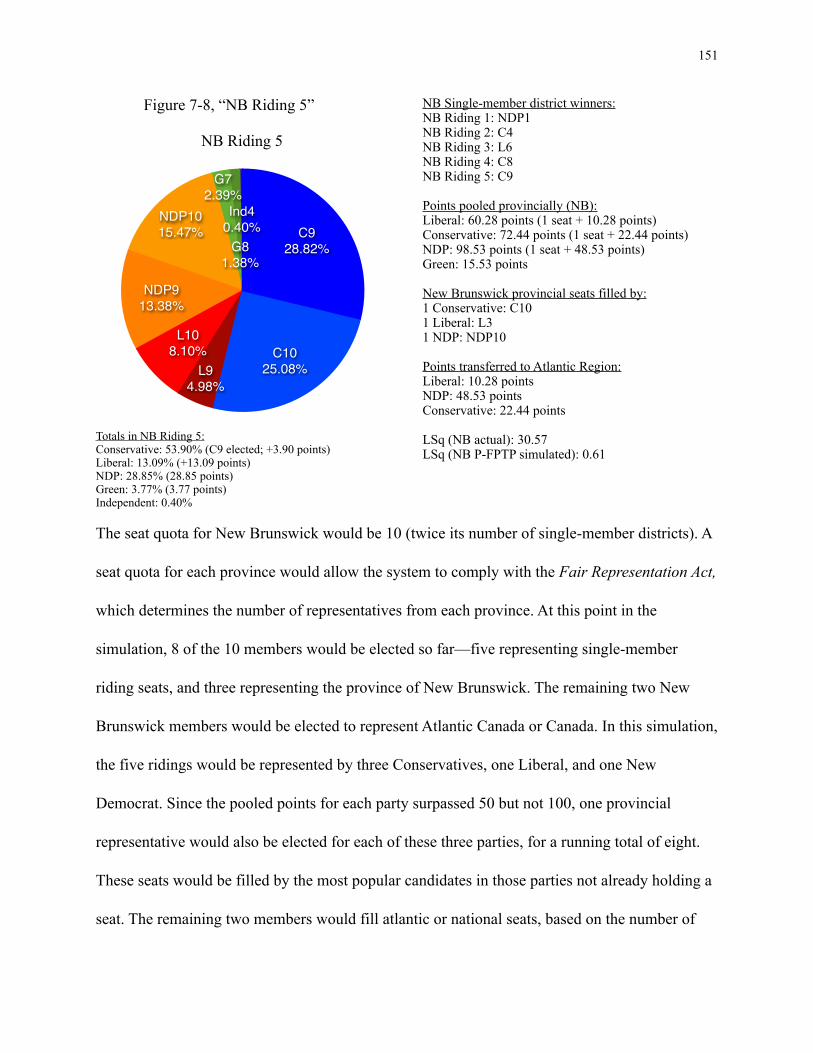
Figure 7-8, “NB Riding 5”
Totals in NB Riding 5:Conservative: 53.90% (C9 elected; +3.90 points)Liberal: 13.09% (+13.09 points)NDP: 28.85% (28.85 points)Green: 3.77% (3.77 points)Independent: 0.40%
Ind40.40%
G81.38%
G72.39%
NDP1015.47%
NDP913.38%
L108.10%
L94.98%
C1025.08%
C928.82%
NB Riding 5
NB Single-member district winners:NB Riding 1: NDP1NB Riding 2: C4NB Riding 3: L6NB Riding 4: C8NB Riding 5: C9
Points pooled provincially (NB):Liberal: 60.28 points (1 seat + 10.28 points)Conservative: 72.44 points (1 seat + 22.44 points)NDP: 98.53 points (1 seat + 48.53 points)Green: 15.53 points
New Brunswick provincial seats filled by:1 Conservative: C101 Liberal: L31 NDP: NDP10
Points transferred to Atlantic Region:Liberal: 10.28 pointsNDP: 48.53 pointsConservative: 22.44 points
LSq (NB actual): 30.57LSq (NB P-FPTP simulated): 0.61
The seat quota for New Brunswick would be 10 (twice its number of single-member districts). A
seat quota for each province would allow the system to comply with the Fair Representation Act,
which determines the number of representatives from each province. At this point in the
simulation, 8 of the 10 members would be elected so far—five representing single-member
riding seats, and three representing the province of New Brunswick. The remaining two New
Brunswick members would be elected to represent Atlantic Canada or Canada. In this simulation,
the five ridings would be represented by three Conservatives, one Liberal, and one New
Democrat. Since the pooled points for each party surpassed 50 but not 100, one provincial
representative would also be elected for each of these three parties, for a running total of eight.
These seats would be filled by the most popular candidates in those parties not already holding a
seat. The remaining two members would fill atlantic or national seats, based on the number of
151
points transferred from each province, as will be seen in detail when the Atlantic Region seats
are determined. The least squares index (LSq) of 0.61 indicates an extremely proportional result,
which contrasts sharply with the actual, extremely disproportional result under first-past-the-post
(LSq = 30.57).
7.3.2 Prince Edward Island Simulation
The four Prince Edward Island ridings can also be neatly paired to create two larger
ridings. This voting results in the combined ridings are shown in table 7-2 below:
152
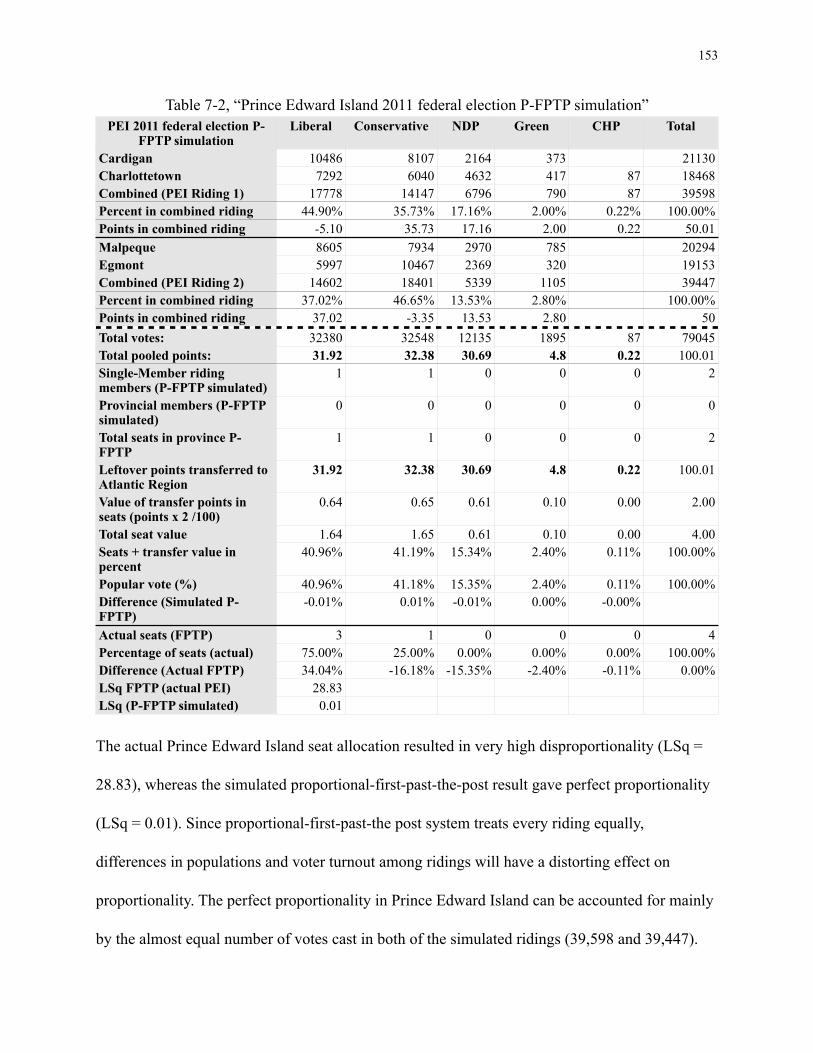
Table 7-2, “Prince Edward Island 2011 federal election P-FPTP simulation”PEI 2011 federal election P-
FPTP simulationLiberal Conservative NDP Green CHP Total
CardiganCharlottetownCombined (PEI Riding 1)Percent in combined ridingPoints in combined ridingMalpequeEgmontCombined (PEI Riding 2)Percent in combined ridingPoints in combined ridingTotal votes:Total pooled points:Single-Member riding members (P-FPTP simulated)Provincial members (P-FPTP simulated)Total seats in province P-FPTPLeftover points transferred to Atlantic RegionValue of transfer points in seats (points x 2 /100)Total seat valueSeats + transfer value in percentPopular vote (%)Difference (Simulated P-FPTP)Actual seats (FPTP)Percentage of seats (actual)Difference (Actual FPTP)LSq FPTP (actual PEI)LSq (P-FPTP simulated)
10486 8107 2164 373 211307292 6040 4632 417 87 18468
17778 14147 6796 790 87 3959844.90% 35.73% 17.16% 2.00% 0.22% 100.00%
-5.10 35.73 17.16 2.00 0.22 50.018605 7934 2970 785 202945997 10467 2369 320 19153
14602 18401 5339 1105 3944737.02% 46.65% 13.53% 2.80% 100.00%
37.02 -3.35 13.53 2.80 5032380 32548 12135 1895 87 7904531.92 32.38 30.69 4.8 0.22 100.01
1 1 0 0 0 2
0 0 0 0 0 0
1 1 0 0 0 2
31.92 32.38 30.69 4.8 0.22 100.01
0.64 0.65 0.61 0.10 0.00 2.00
1.64 1.65 0.61 0.10 0.00 4.0040.96% 41.19% 15.34% 2.40% 0.11% 100.00%
40.96% 41.18% 15.35% 2.40% 0.11% 100.00%-0.01% 0.01% -0.01% 0.00% -0.00%
3 1 0 0 0 475.00% 25.00% 0.00% 0.00% 0.00% 100.00%34.04% -16.18% -15.35% -2.40% -0.11% 0.00%
28.830.01
The actual Prince Edward Island seat allocation resulted in very high disproportionality (LSq =
28.83), whereas the simulated proportional-first-past-the-post result gave perfect proportionality
(LSq = 0.01). Since proportional-first-past-the post system treats every riding equally,
differences in populations and voter turnout among ridings will have a distorting effect on
proportionality. The perfect proportionality in Prince Edward Island can be accounted for mainly
by the almost equal number of votes cast in both of the simulated ridings (39,598 and 39,447).
153
Further, in Prince Edward Island in 2011, no independent candidates contested any riding which
would otherwise slightly skew proportionality since independent votes cannot be pooled but are
nonetheless included in the vote total. These Prince Edward Island results are illustrated in
figures 7-9 and 7-10 below.
154
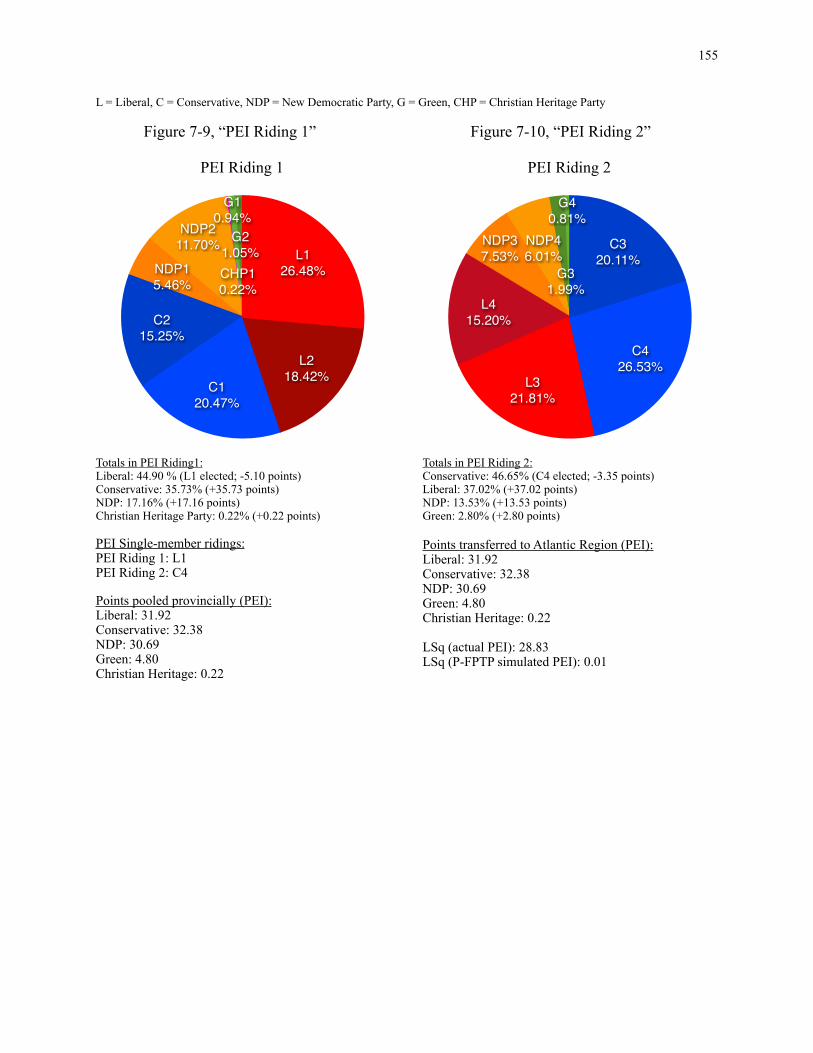
L = Liberal, C = Conservative, NDP = New Democratic Party, G = Green, CHP = Christian Heritage Party
Figure 7-9, “PEI Riding 1”
Totals in PEI Riding1:Liberal: 44.90 % (L1 elected; -5.10 points)Conservative: 35.73% (+35.73 points)NDP: 17.16% (+17.16 points)Christian Heritage Party: 0.22% (+0.22 points)
PEI Single-member ridings:PEI Riding 1: L1PEI Riding 2: C4
Points pooled provincially (PEI):Liberal: 31.92Conservative: 32.38NDP: 30.69Green: 4.80Christian Heritage: 0.22
G21.05%
G10.94%
CHP10.22%
NDP211.70%
NDP15.46%
C215.25%
C120.47%
L218.42%
L126.48%
PEI Riding 1
Figure 7-10, “PEI Riding 2”
Totals in PEI Riding 2:Conservative: 46.65% (C4 elected; -3.35 points)Liberal: 37.02% (+37.02 points)NDP: 13.53% (+13.53 points)Green: 2.80% (+2.80 points)
Points transferred to Atlantic Region (PEI):Liberal: 31.92Conservative: 32.38NDP: 30.69Green: 4.80Christian Heritage: 0.22
LSq (actual PEI): 28.83LSq (P-FPTP simulated PEI): 0.01
G40.81%
G31.99%
NDP46.01%
NDP37.53%
L415.20%
L321.81%
C426.53%
C320.11%
PEI Riding 2
155
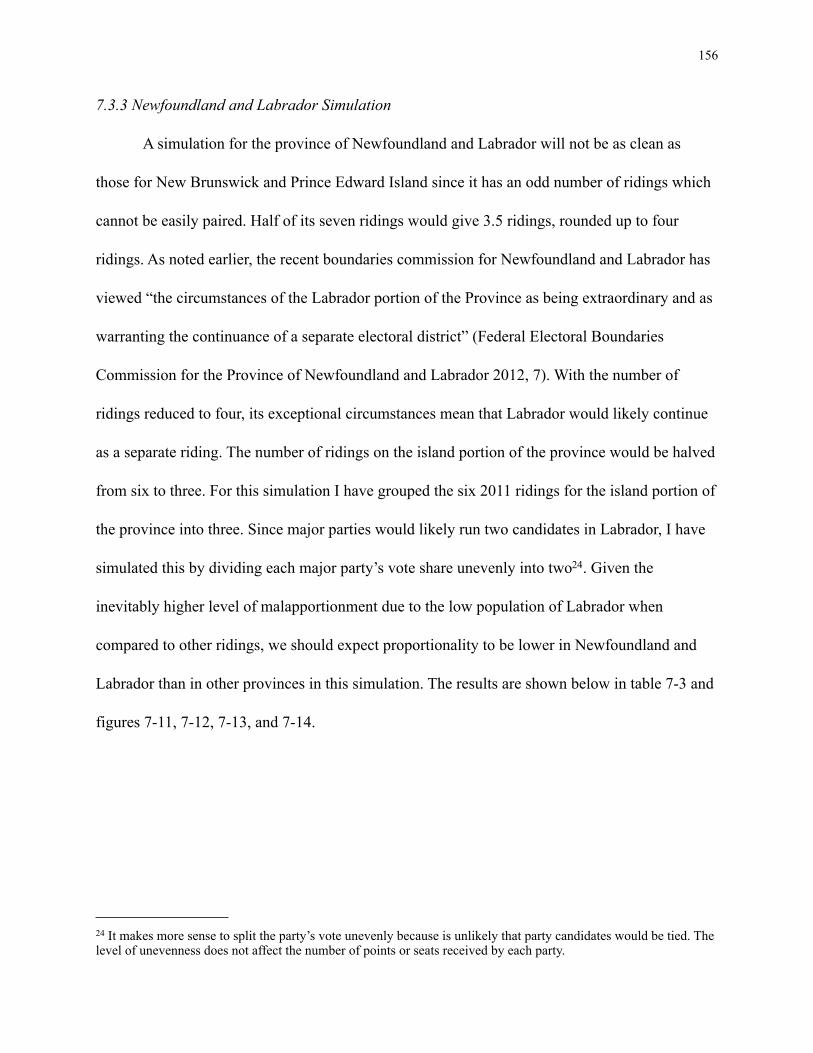
7.3.3 Newfoundland and Labrador Simulation
A simulation for the province of Newfoundland and Labrador will not be as clean as
those for New Brunswick and Prince Edward Island since it has an odd number of ridings which
cannot be easily paired. Half of its seven ridings would give 3.5 ridings, rounded up to four
ridings. As noted earlier, the recent boundaries commission for Newfoundland and Labrador has
viewed “the circumstances of the Labrador portion of the Province as being extraordinary and as
warranting the continuance of a separate electoral district” (Federal Electoral Boundaries
Commission for the Province of Newfoundland and Labrador 2012, 7). With the number of
ridings reduced to four, its exceptional circumstances mean that Labrador would likely continue
as a separate riding. The number of ridings on the island portion of the province would be halved
from six to three. For this simulation I have grouped the six 2011 ridings for the island portion of
the province into three. Since major parties would likely run two candidates in Labrador, I have
simulated this by dividing each major party’s vote share unevenly into two24. Given the
inevitably higher level of malapportionment due to the low population of Labrador when
compared to other ridings, we should expect proportionality to be lower in Newfoundland and
Labrador than in other provinces in this simulation. The results are shown below in table 7-3 and
figures 7-11, 7-12, 7-13, and 7-14.
156
24 It makes more sense to split the party’s vote unevenly because is unlikely that party candidates would be tied. The level of unevenness does not affect the number of points or seats received by each party.
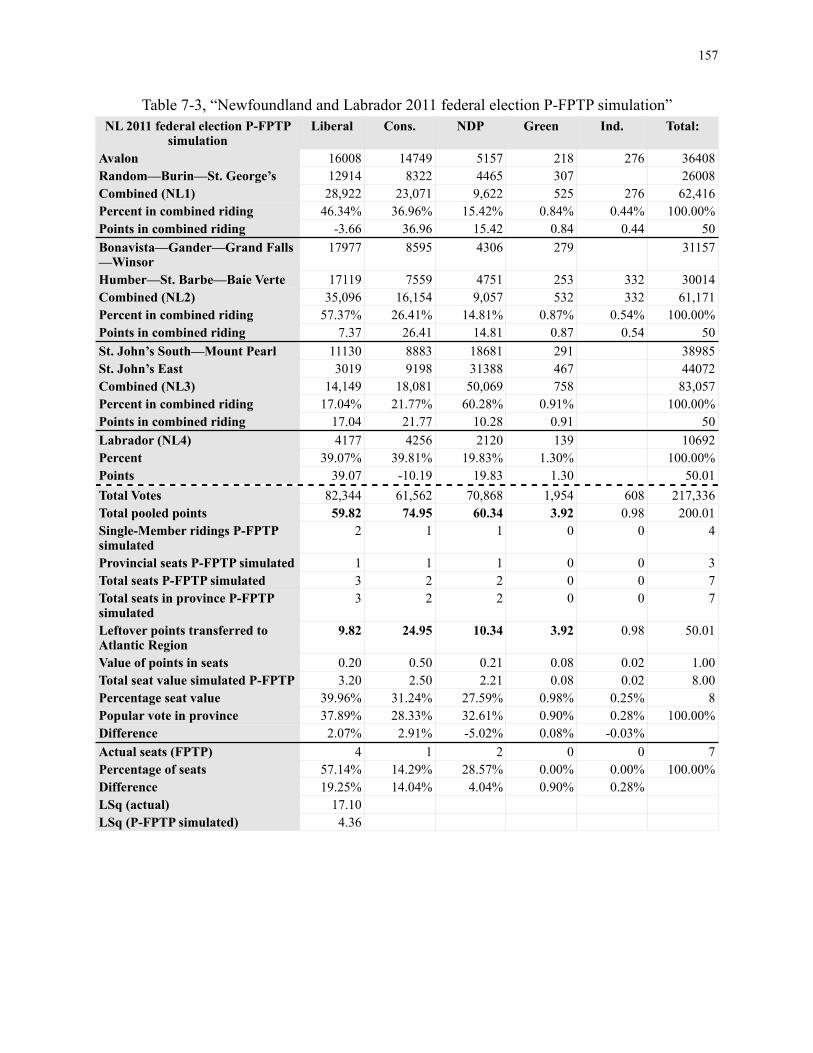
Table 7-3, “Newfoundland and Labrador 2011 federal election P-FPTP simulation”NL 2011 federal election P-FPTP
simulationLiberal Cons. NDP Green Ind. Total:
AvalonRandom—Burin—St. George’sCombined (NL1)Percent in combined ridingPoints in combined ridingBonavista—Gander—Grand Falls—WinsorHumber—St. Barbe—Baie VerteCombined (NL2)Percent in combined ridingPoints in combined ridingSt. John’s South—Mount PearlSt. John’s EastCombined (NL3)Percent in combined ridingPoints in combined ridingLabrador (NL4)PercentPointsTotal VotesTotal pooled pointsSingle-Member ridings P-FPTP simulatedProvincial seats P-FPTP simulatedTotal seats P-FPTP simulatedTotal seats in province P-FPTP simulatedLeftover points transferred to Atlantic RegionValue of points in seatsTotal seat value simulated P-FPTPPercentage seat valuePopular vote in provinceDifferenceActual seats (FPTP)Percentage of seatsDifferenceLSq (actual)LSq (P-FPTP simulated)
16008 14749 5157 218 276 3640812914 8322 4465 307 2600828,922 23,071 9,622 525 276 62,416
46.34% 36.96% 15.42% 0.84% 0.44% 100.00%-3.66 36.96 15.42 0.84 0.44 50
17977 8595 4306 279 31157
17119 7559 4751 253 332 3001435,096 16,154 9,057 532 332 61,171
57.37% 26.41% 14.81% 0.87% 0.54% 100.00%7.37 26.41 14.81 0.87 0.54 50
11130 8883 18681 291 389853019 9198 31388 467 44072
14,149 18,081 50,069 758 83,05717.04% 21.77% 60.28% 0.91% 100.00%
17.04 21.77 10.28 0.91 504177 4256 2120 139 10692
39.07% 39.81% 19.83% 1.30% 100.00%39.07 -10.19 19.83 1.30 50.01
82,344 61,562 70,868 1,954 608 217,33659.82 74.95 60.34 3.92 0.98 200.01
2 1 1 0 0 4
1 1 1 0 0 33 2 2 0 0 73 2 2 0 0 7
9.82 24.95 10.34 3.92 0.98 50.01
0.20 0.50 0.21 0.08 0.02 1.003.20 2.50 2.21 0.08 0.02 8.00
39.96% 31.24% 27.59% 0.98% 0.25% 837.89% 28.33% 32.61% 0.90% 0.28% 100.00%2.07% 2.91% -5.02% 0.08% -0.03%
4 1 2 0 0 757.14% 14.29% 28.57% 0.00% 0.00% 100.00%19.25% 14.04% 4.04% 0.90% 0.28%
17.104.36
157
L = Liberal, C = Conservative, NDP = New Democratic Party, G = Green, Ind = Independent Figure 7-11, “NL Riding 1” Figure 7-12, “NL Riding 2”
Totals:Liberal: 46.34% (L1 elected; -3.66 points)Conservative: 36.96% (+36.96 points)NDP: 15.42% (+15.42 points)Green: 0.84% (+0.84 points)Independent: 0.28%
Figure 7-13, “NL Riding 3”
Totals:NDP: 60.28% (NDP6 elected; +10.28 points)Liberal: 17.04% (+17.04 points)Conservative: 21.77% (21.77 points)Green: 0.91% (+0.91 points)
Ind10.44%
G20.49%
G10.35%
NDP27.15%
NDP18.26%
C313.33%
C123.63%
L220.69%
L125.65%
NL Riding 1
G60.56%
G50.35%
C611.07%
C510.70%L6
3.63%
L513.40%
NDP637.79%
NDP522.49%
NL Riding 3
Totals:Liberal: 57.37% (L3 elected; +7.37 points)Conservative: 26.41% (+26.41 points)NDP: 14.81% (+14.81 points)Green: 0.87% (+0.87 points)Independent: 0.54%
Figure 7-14, “NL Riding 4”
Totals:Conservative: 39.81% (C7 elected; -10.19 points)Liberal: 39.07% (+39.07 points)NDP: 19.83% (+19.83 points)Green: 1.30% (+1.30 points)
Ind20.54%
G40.41%
G30.46%
NDP47.77%
NDP37.04%
C412.36%
C314.05% L4
27.99%
L329.39%
NL Riding 2
G80.47%
G70.83%
NDP88.22%
NDP711.61%
L820.59%
L718.48%
C811.78%
C728.03%
NL Riding 4 (Labrador)
158
NL single-member riding seats:NL1: L1NL2: L3NL3: NDP6NL4: C7
Points pooled provincially (NL):Liberal: 59.82 points (1 seat + 9.82 points)Conservative: 74.95 points (1 seat + 24.95 points)NDP: 60.24 points (1 seat + 10.24 points)Green: 3.92 points
Points transferred to Atlantic Region (NL):Liberal: 9.82 pointsConservative: 22.44 pointsNDP: 10.24 pointsGreen: 3.92 point
LSq (actual NL): 17.10LSq (P-FPTP simulated NL): 4.36
The proportionality of proportional-first-past-the-post in Newfoundland and Labrador is
expected to be lower than in other provinces because of the inevitable malapportionment due to
the small population of Labrador, but with a simulated least squares index of 4.37 it is
comparable to some other countries with proportional voting systems, including Germany: (3.40:
2009, 2.16: 2005, 4.61: 2002), Belgium: (3.77: 2010, 3.37: 2007, 5.16: 2003), Finland (2.95:
2011, 2007: 3.20, 3.16: 2003), Spain (6.93: 2011, 4.49: 2008, 4.25: 2004), New Zealand (2.38:
2011, 3.84: 2008) (Gallagher 2013a).
7.3.4 Nova Scotia Simulation
When simulating the results under proportional-first-past-the-post in Nova Scotia, we
again run into the problem of there being an odd number of ridings: 11. When pairing ridings
there will be one riding left unpaired. I paired neighbouring ridings to create 5 ridings roughly
twice as large, while leaving one riding unpaired. This is less than ideal, but it created 6 ridings
in total with which to do the simulation. Having one riding with half the population of the others
somewhat skewed proportionality in the simulation, but still gave a very high degree of
proportionality with a least squares index of 1.77. The combined ridings and result is shown in
the table below:
159
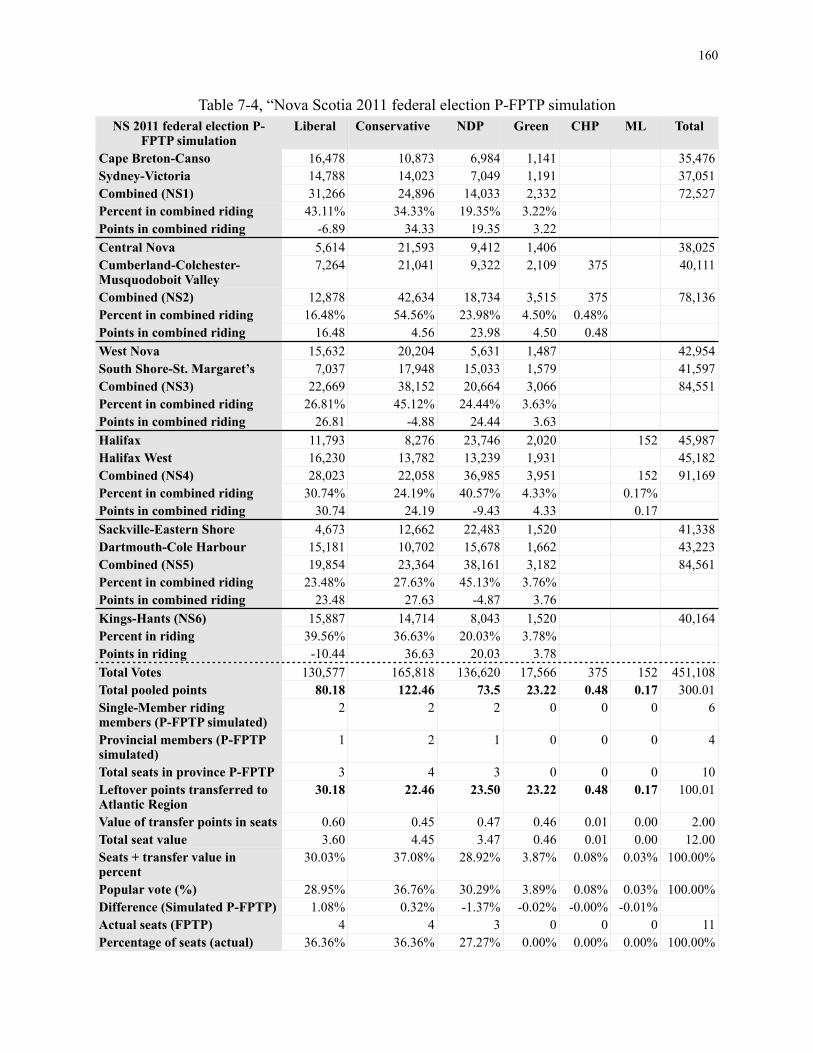
Table 7-4, “Nova Scotia 2011 federal election P-FPTP simulationNS 2011 federal election P-
FPTP simulationLiberal Conservative NDP Green CHP ML Total
Cape Breton-CansoSydney-VictoriaCombined (NS1)Percent in combined ridingPoints in combined ridingCentral NovaCumberland-Colchester-Musquodoboit ValleyCombined (NS2)Percent in combined ridingPoints in combined ridingWest NovaSouth Shore-St. Margaret’sCombined (NS3)Percent in combined ridingPoints in combined ridingHalifaxHalifax WestCombined (NS4)Percent in combined ridingPoints in combined ridingSackville-Eastern ShoreDartmouth-Cole HarbourCombined (NS5)Percent in combined ridingPoints in combined ridingKings-Hants (NS6)Percent in ridingPoints in ridingTotal VotesTotal pooled pointsSingle-Member riding members (P-FPTP simulated)Provincial members (P-FPTP simulated)Total seats in province P-FPTPLeftover points transferred to Atlantic RegionValue of transfer points in seatsTotal seat valueSeats + transfer value in percentPopular vote (%)Difference (Simulated P-FPTP)Actual seats (FPTP)Percentage of seats (actual)
16,478 10,873 6,984 1,141 35,47614,788 14,023 7,049 1,191 37,05131,266 24,896 14,033 2,332 72,527
43.11% 34.33% 19.35% 3.22%-6.89 34.33 19.35 3.225,614 21,593 9,412 1,406 38,0257,264 21,041 9,322 2,109 375 40,111
12,878 42,634 18,734 3,515 375 78,13616.48% 54.56% 23.98% 4.50% 0.48%
16.48 4.56 23.98 4.50 0.4815,632 20,204 5,631 1,487 42,9547,037 17,948 15,033 1,579 41,597
22,669 38,152 20,664 3,066 84,55126.81% 45.12% 24.44% 3.63%
26.81 -4.88 24.44 3.6311,793 8,276 23,746 2,020 152 45,98716,230 13,782 13,239 1,931 45,18228,023 22,058 36,985 3,951 152 91,169
30.74% 24.19% 40.57% 4.33% 0.17%30.74 24.19 -9.43 4.33 0.174,673 12,662 22,483 1,520 41,338
15,181 10,702 15,678 1,662 43,22319,854 23,364 38,161 3,182 84,561
23.48% 27.63% 45.13% 3.76%23.48 27.63 -4.87 3.76
15,887 14,714 8,043 1,520 40,16439.56% 36.63% 20.03% 3.78%-10.44 36.63 20.03 3.78
130,577 165,818 136,620 17,566 375 152 451,10880.18 122.46 73.5 23.22 0.48 0.17 300.01
2 2 2 0 0 0 6
1 2 1 0 0 0 4
3 4 3 0 0 0 1030.18 22.46 23.50 23.22 0.48 0.17 100.01
0.60 0.45 0.47 0.46 0.01 0.00 2.003.60 4.45 3.47 0.46 0.01 0.00 12.00
30.03% 37.08% 28.92% 3.87% 0.08% 0.03% 100.00%
28.95% 36.76% 30.29% 3.89% 0.08% 0.03% 100.00%1.08% 0.32% -1.37% -0.02% -0.00% -0.01%
4 4 3 0 0 0 1136.36% 36.36% 27.27% 0.00% 0.00% 0.00% 100.00%
160
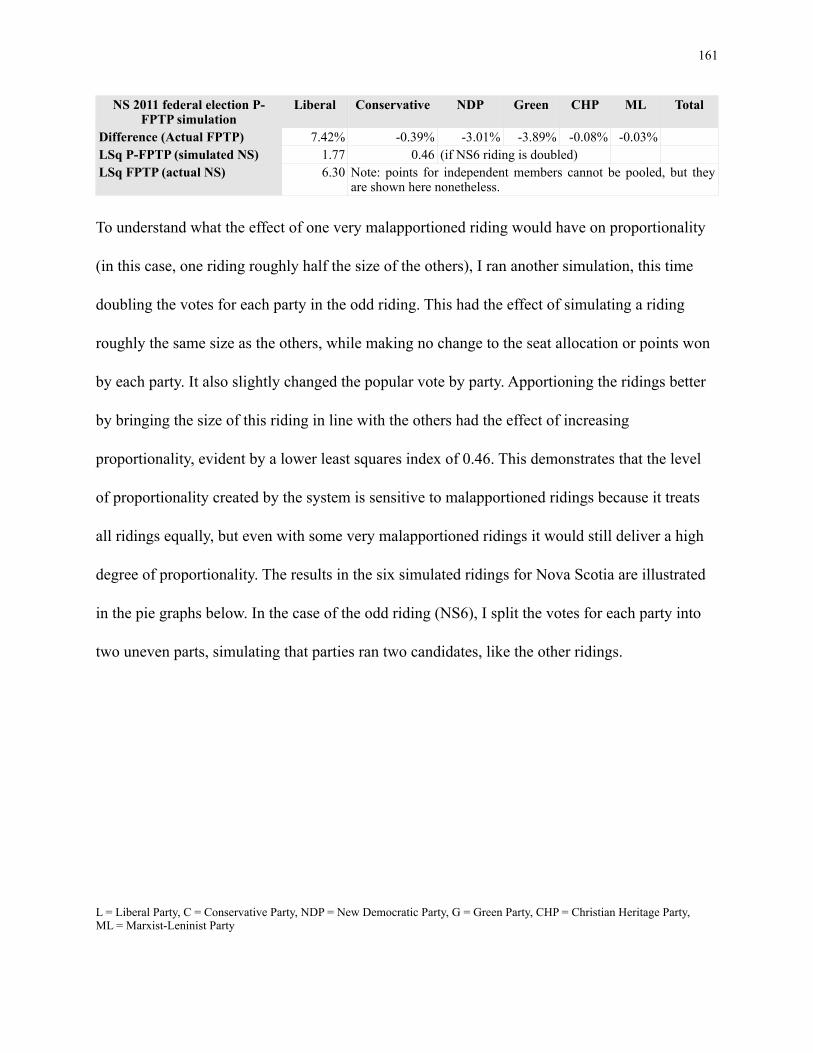
NS 2011 federal election P-FPTP simulation
Liberal Conservative NDP Green CHP ML Total
Difference (Actual FPTP)LSq P-FPTP (simulated NS)LSq FPTP (actual NS)
7.42% -0.39% -3.01% -3.89% -0.08% -0.03%1.77 0.46 (if NS6 riding is doubled)(if NS6 riding is doubled)(if NS6 riding is doubled)6.30 Note: points for independent members cannot be pooled, but they
are shown here nonetheless. Note: points for independent members cannot be pooled, but they are shown here nonetheless. Note: points for independent members cannot be pooled, but they are shown here nonetheless. Note: points for independent members cannot be pooled, but they are shown here nonetheless. Note: points for independent members cannot be pooled, but they are shown here nonetheless. Note: points for independent members cannot be pooled, but they are shown here nonetheless.
To understand what the effect of one very malapportioned riding would have on proportionality
(in this case, one riding roughly half the size of the others), I ran another simulation, this time
doubling the votes for each party in the odd riding. This had the effect of simulating a riding
roughly the same size as the others, while making no change to the seat allocation or points won
by each party. It also slightly changed the popular vote by party. Apportioning the ridings better
by bringing the size of this riding in line with the others had the effect of increasing
proportionality, evident by a lower least squares index of 0.46. This demonstrates that the level
of proportionality created by the system is sensitive to malapportioned ridings because it treats
all ridings equally, but even with some very malapportioned ridings it would still deliver a high
degree of proportionality. The results in the six simulated ridings for Nova Scotia are illustrated
in the pie graphs below. In the case of the odd riding (NS6), I split the votes for each party into
two uneven parts, simulating that parties ran two candidates, like the other ridings.
L = Liberal Party, C = Conservative Party, NDP = New Democratic Party, G = Green Party, CHP = Christian Heritage Party, ML = Marxist-Leninist Party
161
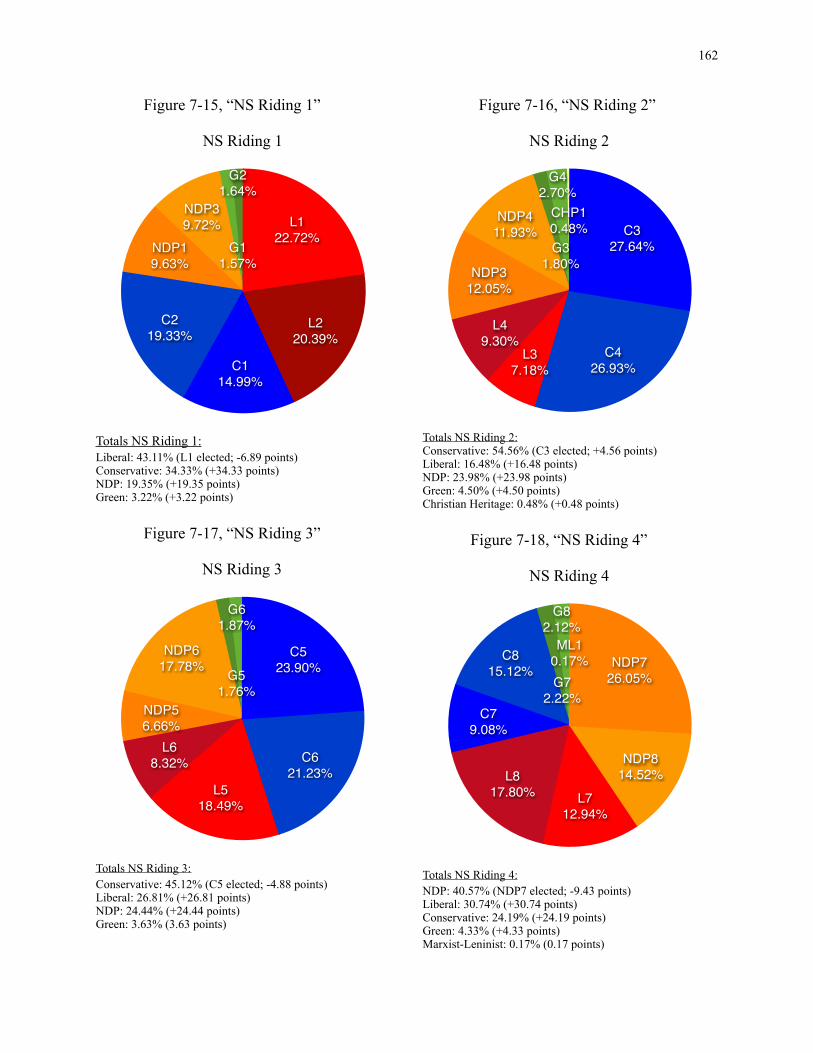
Figure 7-15, “NS Riding 1” Figure 7-16, “NS Riding 2”
Totals NS Riding 1:Liberal: 43.11% (L1 elected; -6.89 points)Conservative: 34.33% (+34.33 points)NDP: 19.35% (+19.35 points)Green: 3.22% (+3.22 points)
Figure 7-17, “NS Riding 3”
Totals NS Riding 3:Conservative: 45.12% (C5 elected; -4.88 points)Liberal: 26.81% (+26.81 points)NDP: 24.44% (+24.44 points)Green: 3.63% (3.63 points)
G21.64%
G11.57%
NDP39.72%
NDP19.63%
C219.33%
C114.99%
L220.39%
L122.72%
NS Riding 1
G61.87%
G51.76%
NDP617.78%
NDP56.66%
L68.32%
L518.49%
C621.23%
C523.90%
NS Riding 3
Totals NS Riding 2:Conservative: 54.56% (C3 elected; +4.56 points)Liberal: 16.48% (+16.48 points)NDP: 23.98% (+23.98 points)Green: 4.50% (+4.50 points)Christian Heritage: 0.48% (+0.48 points)
Figure 7-18, “NS Riding 4”
Totals NS Riding 4:NDP: 40.57% (NDP7 elected; -9.43 points)Liberal: 30.74% (+30.74 points)Conservative: 24.19% (+24.19 points)Green: 4.33% (+4.33 points) Marxist-Leninist: 0.17% (0.17 points)
CHP10.48%
G42.70%
G31.80%
NDP411.93%
NDP312.05%
L49.30%
L37.18%
C426.93%
C327.64%
NS Riding 2
ML10.17%
G82.12%
G72.22%
C815.12%
C79.08%
L817.80% L7
12.94%
NDP814.52%
NDP726.05%
NS Riding 4
162
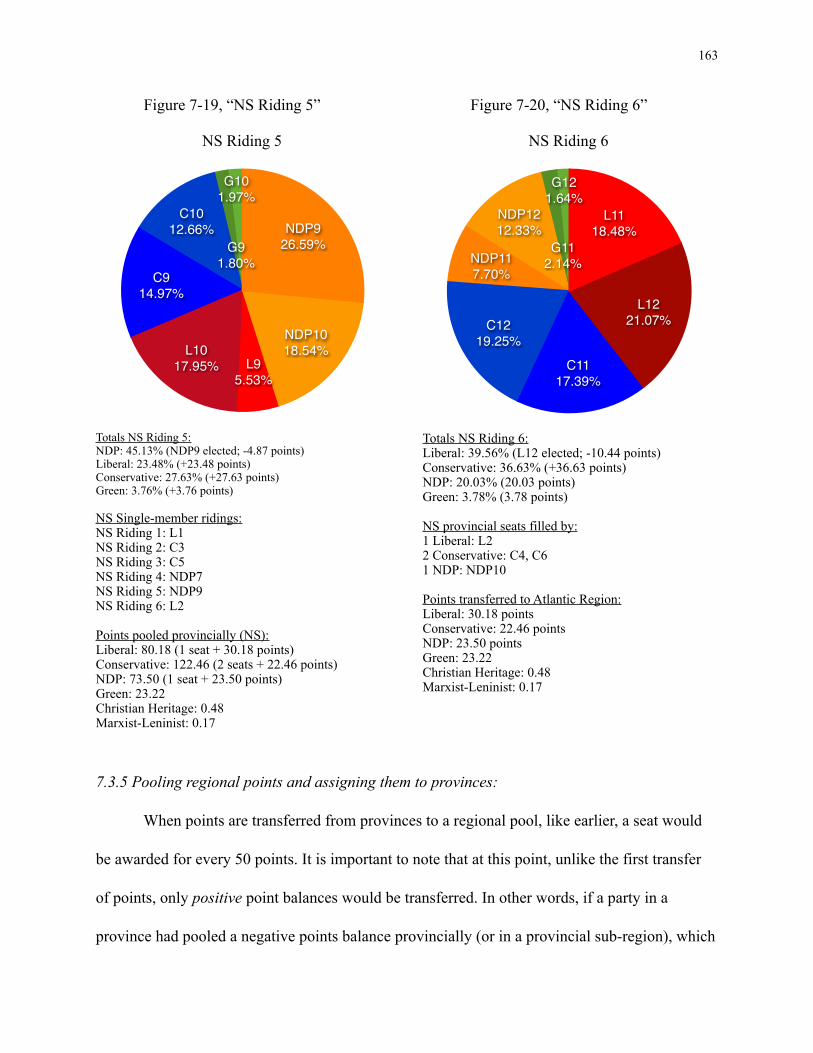
Figure 7-19, “NS Riding 5”
Totals NS Riding 5:NDP: 45.13% (NDP9 elected; -4.87 points)Liberal: 23.48% (+23.48 points)Conservative: 27.63% (+27.63 points)Green: 3.76% (+3.76 points)
NS Single-member ridings:NS Riding 1: L1NS Riding 2: C3NS Riding 3: C5NS Riding 4: NDP7NS Riding 5: NDP9NS Riding 6: L2
Points pooled provincially (NS):Liberal: 80.18 (1 seat + 30.18 points)Conservative: 122.46 (2 seats + 22.46 points)NDP: 73.50 (1 seat + 23.50 points)Green: 23.22Christian Heritage: 0.48Marxist-Leninist: 0.17
G101.97%
G91.80%
C1012.66%
C914.97%
L1017.95% L9
5.53%
NDP1018.54%
NDP926.59%
NS Riding 5
Figure 7-20, “NS Riding 6”
Totals NS Riding 6:Liberal: 39.56% (L12 elected; -10.44 points)Conservative: 36.63% (+36.63 points)NDP: 20.03% (20.03 points)Green: 3.78% (3.78 points)
NS provincial seats filled by:1 Liberal: L22 Conservative: C4, C61 NDP: NDP10
Points transferred to Atlantic Region:Liberal: 30.18 pointsConservative: 22.46 pointsNDP: 23.50 pointsGreen: 23.22Christian Heritage: 0.48Marxist-Leninist: 0.17
G121.64%
G112.14%
NDP1212.33%
NDP117.70%
C1219.25%
C1117.39%
L1221.07%
L1118.48%
NS Riding 6
7.3.5 Pooling regional points and assigning them to provinces:
When points are transferred from provinces to a regional pool, like earlier, a seat would
be awarded for every 50 points. It is important to note that at this point, unlike the first transfer
of points, only positive point balances would be transferred. In other words, if a party in a
province had pooled a negative points balance provincially (or in a provincial sub-region), which
163
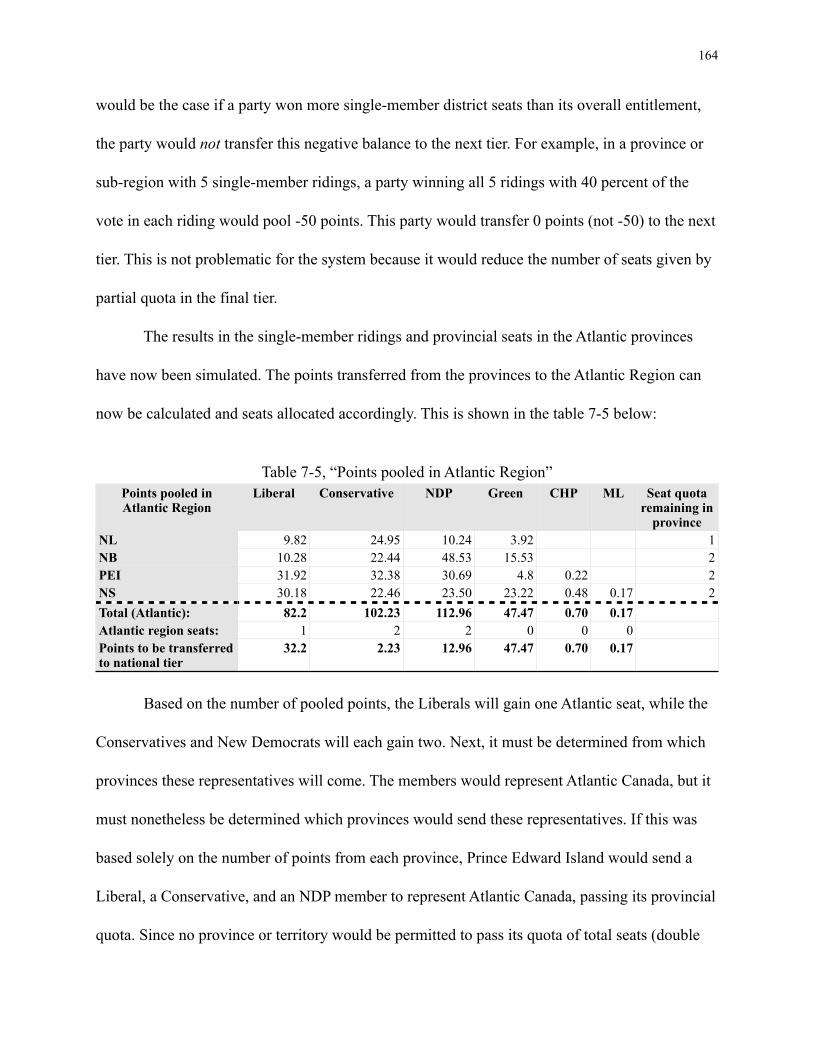
would be the case if a party won more single-member district seats than its overall entitlement,
the party would not transfer this negative balance to the next tier. For example, in a province or
sub-region with 5 single-member ridings, a party winning all 5 ridings with 40 percent of the
vote in each riding would pool -50 points. This party would transfer 0 points (not -50) to the next
tier. This is not problematic for the system because it would reduce the number of seats given by
partial quota in the final tier.
The results in the single-member ridings and provincial seats in the Atlantic provinces
have now been simulated. The points transferred from the provinces to the Atlantic Region can
now be calculated and seats allocated accordingly. This is shown in the table 7-5 below:
Table 7-5, “Points pooled in Atlantic Region”Points pooled in Atlantic Region
Liberal Conservative NDP Green CHP ML Seat quota remaining in
provinceNLNBPEINSTotal (Atlantic):Atlantic region seats:Points to be transferred to national tier
9.82 24.95 10.24 3.92 110.28 22.44 48.53 15.53 231.92 32.38 30.69 4.8 0.22 230.18 22.46 23.50 23.22 0.48 0.17 282.2 102.23 112.96 47.47 0.70 0.17
1 2 2 0 0 032.2 2.23 12.96 47.47 0.70 0.17
Based on the number of pooled points, the Liberals will gain one Atlantic seat, while the
Conservatives and New Democrats will each gain two. Next, it must be determined from which
provinces these representatives will come. The members would represent Atlantic Canada, but it
must nonetheless be determined which provinces would send these representatives. If this was
based solely on the number of points from each province, Prince Edward Island would send a
Liberal, a Conservative, and an NDP member to represent Atlantic Canada, passing its provincial
quota. Since no province or territory would be permitted to pass its quota of total seats (double
164
its number of single-member ridings), we must devise a way to determine the order in which the
seats should be allocated. Without such a quota of the total number of members that can be
elected from a province, PEI in this case, would gain an extra seat at the expense of another
province. This would not only be contentious, but it could be considered as a violation of the
Fair Representation Act (Canada 2011, 3) which determines the number of representatives per
province.
To prevent a province from surpassing its seat quota, a fair way to allocate seats without
disrupting the total number of seats for each province would be to allocate them in order, starting
with the highest number of points by party in the region. When a seat is allocated, it would be
given to the province with the highest number of points from that party. We would then subtract
50 points from that party for the seat, and the process would be repeated until all the regional
seats are allocated. In the simulation above, the New Democratic Party has the highest number of
points at 112.96 and so would be given the first Atlantic seat. New Brunswick contributed 48.53
of those points, more than any other province, so a member from this province would fill this
seat: it would be filled by the most popular party member by percent support in her respective
riding who does not already hold a seat (NDP10). The NDP would now have 62.96 points
remaining (112.96 - 50 = 62.96). The Conservative Party would then have the highest number of
points at 102.23 and so would get the second Atlantic seat. It would go to a Conservative
member from Prince Edward Island since this province would have contributed more
Conservative points than the others. The Liberals would get the next seat, which would also be
filled by a Prince Edward Island member. This province would now have filled its quota for seats
(4), and so the fourth Atlantic seat (NDP) which would otherwise also go to PEI, is given instead
165
to Nova Scotia. The last Atlantic seat would be filled by a Conservative Party member from
Newfoundland and Labrador. This province would now have also met its seat quota and like PEI,
would not receive any more seats. This seat allocation process is demonstrated in table 7-6
below:
166
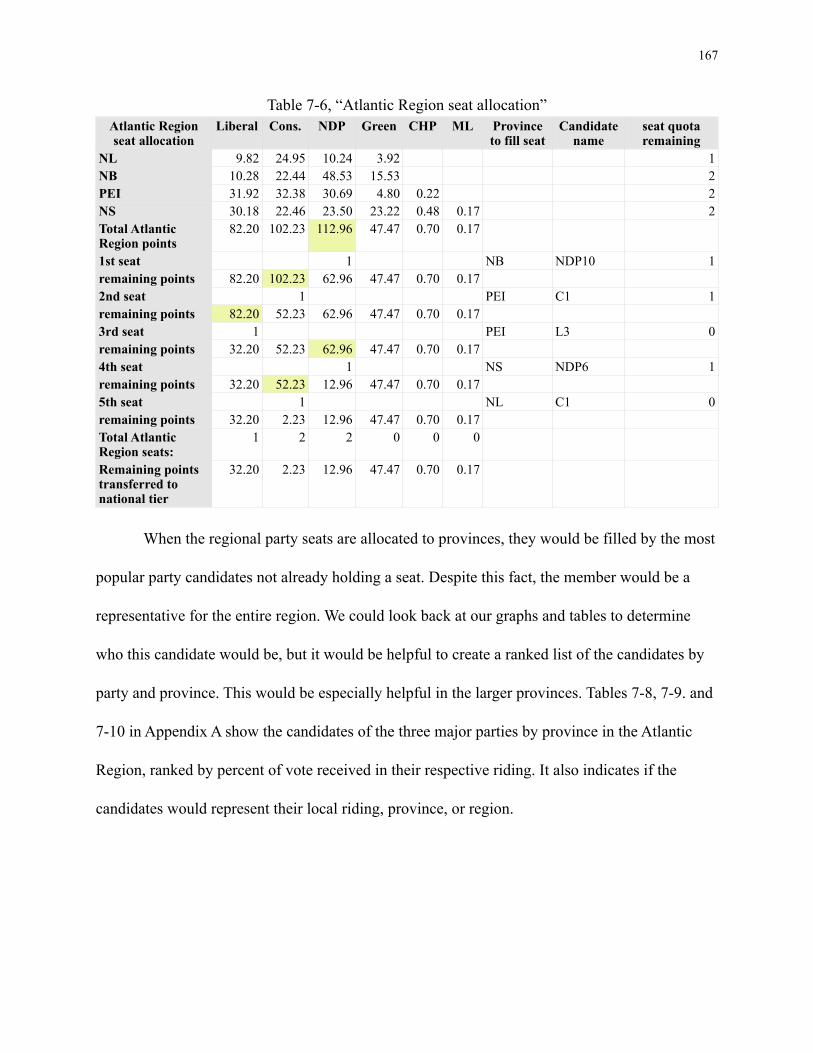
Table 7-6, “Atlantic Region seat allocation”Atlantic Region seat allocation
Liberal Cons. NDP Green CHP ML Province to fill seat
Candidate name
seat quota remaining
NLNBPEINSTotal Atlantic Region points1st seatremaining points2nd seatremaining points3rd seatremaining points4th seatremaining points5th seatremaining pointsTotal Atlantic Region seats:Remaining points transferred to national tier
9.82 24.95 10.24 3.92 110.28 22.44 48.53 15.53 231.92 32.38 30.69 4.80 0.22 230.18 22.46 23.50 23.22 0.48 0.17 282.20 102.23 112.96 47.47 0.70 0.17
1 NB NDP10 182.20 102.23 62.96 47.47 0.70 0.17
1 PEI C1 182.20 52.23 62.96 47.47 0.70 0.17
1 PEI L3 032.20 52.23 62.96 47.47 0.70 0.17
1 NS NDP6 132.20 52.23 12.96 47.47 0.70 0.17
1 NL C1 032.20 2.23 12.96 47.47 0.70 0.17
1 2 2 0 0 0
32.20 2.23 12.96 47.47 0.70 0.17
When the regional party seats are allocated to provinces, they would be filled by the most
popular party candidates not already holding a seat. Despite this fact, the member would be a
representative for the entire region. We could look back at our graphs and tables to determine
who this candidate would be, but it would be helpful to create a ranked list of the candidates by
party and province. This would be especially helpful in the larger provinces. Tables 7-8, 7-9. and
7-10 in Appendix A show the candidates of the three major parties by province in the Atlantic
Region, ranked by percent of vote received in their respective riding. It also indicates if the
candidates would represent their local riding, province, or region.
167
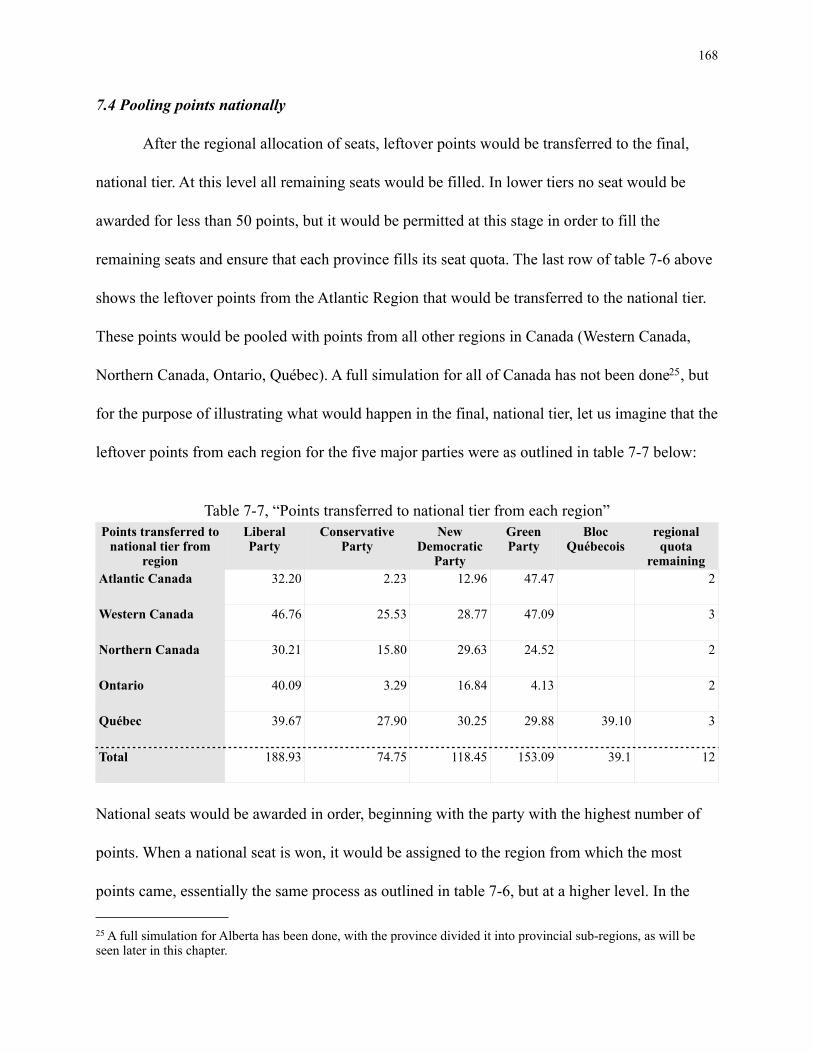
7.4 Pooling points nationally
After the regional allocation of seats, leftover points would be transferred to the final,
national tier. At this level all remaining seats would be filled. In lower tiers no seat would be
awarded for less than 50 points, but it would be permitted at this stage in order to fill the
remaining seats and ensure that each province fills its seat quota. The last row of table 7-6 above
shows the leftover points from the Atlantic Region that would be transferred to the national tier.
These points would be pooled with points from all other regions in Canada (Western Canada,
Northern Canada, Ontario, Québec). A full simulation for all of Canada has not been done25, but
for the purpose of illustrating what would happen in the final, national tier, let us imagine that the
leftover points from each region for the five major parties were as outlined in table 7-7 below:
Table 7-7, “Points transferred to national tier from each region”Points transferred to
national tier from region
Liberal Party
Conservative Party
New Democratic
Party
Green Party
Bloc Québecois
regional quota
remainingAtlantic Canada
Western Canada
Northern Canada
Ontario
Québec
Total
32.20 2.23 12.96 47.47 2
46.76 25.53 28.77 47.09 3
30.21 15.80 29.63 24.52 2
40.09 3.29 16.84 4.13 2
39.67 27.90 30.25 29.88 39.10 3
188.93 74.75 118.45 153.09 39.1 12
National seats would be awarded in order, beginning with the party with the highest number of
points. When a national seat is won, it would be assigned to the region from which the most
points came, essentially the same process as outlined in table 7-6, but at a higher level. In the
168
25 A full simulation for Alberta has been done, with the province divided it into provincial sub-regions, as will be seen later in this chapter.
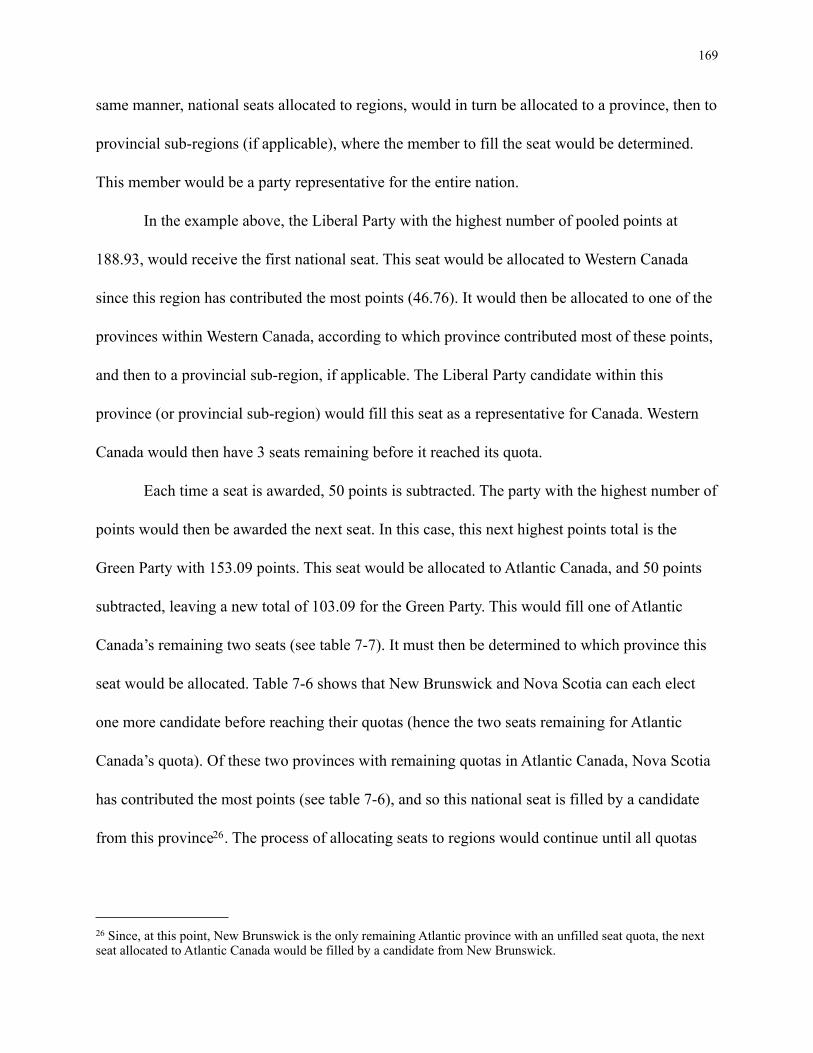
same manner, national seats allocated to regions, would in turn be allocated to a province, then to
provincial sub-regions (if applicable), where the member to fill the seat would be determined.
This member would be a party representative for the entire nation.
In the example above, the Liberal Party with the highest number of pooled points at
188.93, would receive the first national seat. This seat would be allocated to Western Canada
since this region has contributed the most points (46.76). It would then be allocated to one of the
provinces within Western Canada, according to which province contributed most of these points,
and then to a provincial sub-region, if applicable. The Liberal Party candidate within this
province (or provincial sub-region) would fill this seat as a representative for Canada. Western
Canada would then have 3 seats remaining before it reached its quota.
Each time a seat is awarded, 50 points is subtracted. The party with the highest number of
points would then be awarded the next seat. In this case, this next highest points total is the
Green Party with 153.09 points. This seat would be allocated to Atlantic Canada, and 50 points
subtracted, leaving a new total of 103.09 for the Green Party. This would fill one of Atlantic
Canada’s remaining two seats (see table 7-7). It must then be determined to which province this
seat would be allocated. Table 7-6 shows that New Brunswick and Nova Scotia can each elect
one more candidate before reaching their quotas (hence the two seats remaining for Atlantic
Canada’s quota). Of these two provinces with remaining quotas in Atlantic Canada, Nova Scotia
has contributed the most points (see table 7-6), and so this national seat is filled by a candidate
from this province26. The process of allocating seats to regions would continue until all quotas
169
26 Since, at this point, New Brunswick is the only remaining Atlantic province with an unfilled seat quota, the next seat allocated to Atlantic Canada would be filled by a candidate from New Brunswick.
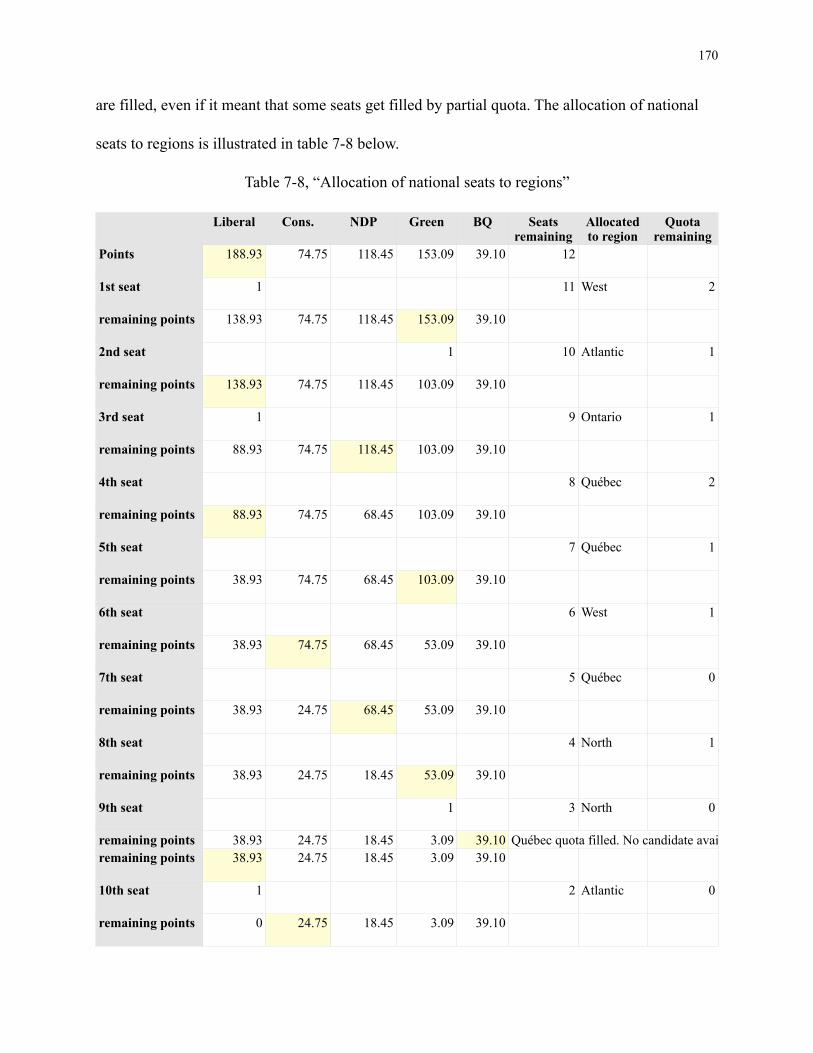
are filled, even if it meant that some seats get filled by partial quota. The allocation of national
seats to regions is illustrated in table 7-8 below.
Table 7-8, “Allocation of national seats to regions”
Liberal Cons. NDP Green BQ Seats remaining
Allocated to region
Quota remaining
Points
1st seat
remaining points
2nd seat
remaining points
3rd seat
remaining points
4th seat
remaining points
5th seat
remaining points
6th seat
remaining points
7th seat
remaining points
8th seat
remaining points
9th seat
remaining pointsremaining points
10th seat
remaining points
188.93 74.75 118.45 153.09 39.10 12
1 11 West 2
138.93 74.75 118.45 153.09 39.10
1 10 Atlantic 1
138.93 74.75 118.45 103.09 39.10
1 9 Ontario 1
88.93 74.75 118.45 103.09 39.10
8 Québec 2
88.93 74.75 68.45 103.09 39.10
7 Québec 1
38.93 74.75 68.45 103.09 39.10
6 West 1
38.93 74.75 68.45 53.09 39.10
5 Québec 0
38.93 24.75 68.45 53.09 39.10
4 North 1
38.93 24.75 18.45 53.09 39.10
1 3 North 0
38.93 24.75 18.45 3.09 39.10 Québec quota filled. No candidate available to fill seat from another province.Québec quota filled. No candidate available to fill seat from another province.Québec quota filled. No candidate available to fill seat from another province.38.93 24.75 18.45 3.09 39.10
1 2 Atlantic 0
0 24.75 18.45 3.09 39.10
170
Liberal Cons. NDP Green BQ Seats remaining
Allocated to region
Quota remaining
11th
remaining points
12th seat
remaining points
1 West 0
0 0 18.45 3.09 39.10
1 0 Ontario 0
0 0 0 3.09 39.10 All quotas filledAll quotas filled
7.5 Large provinces with provincial sub-regions
Provincial sub-regions should be assigned to Ontario and Québec because of their large
populations and high number of ridings (106 and 75 respectively, soon to be 121 and 78)
(Canada 2012). Provincial sub-regions would not be needed in the small provinces, as the
Atlantic Canada simulation has shown. Provincial sub-regions could be created in British
Columbia, set to have 42 seats (21 ridings under P-FPTP), and Alberta, set to have 34 seats (17
ridings under P-FPTP). Provincial sub-regions would not be feasible for the other provinces at
the moment, Saskatchewan and Manitoba being the next largest, currently with 14 seats each (7
ridings under P-FPTP) (Canada 2012).
Dividing larger provinces into sub-regions would make representation much more “local”
than would be if they did not exist. The Law Commission of Canada in its 2004 MMP model
proposed three regions for Ontario and two regions for Québec. Ontario’s proposed regions were:
“North and East Ontario,” “South and West Ontario,” “Toronto and Vicinity” (Law Commission
of Canada 2004, 184-187). Québec’s proposed regions were: “North and East Quebec, outside
Montreal,” and “Montreal and Immediate Vicinity” (2004, 182-184). Provincial regions similar
to these could be used or different ones could be created. The regions should be large enough so
that regional seats could reasonably be won (parties pool more than 50 points), yet because of the
171
existence of higher tiers, they would not need to be as large as in the Law Commission’s
proposal in order to make the results proportional. They should generally be comprised of at least
five single-member ridings, but a bare minimum of four ridings could be acceptable in certain
circumstances. Provincial sub-regions consisting of more than five ridings would have a better
chance at gaining more sub-regional seats and having multiple parties represent the region. In a
five-riding provincial sub-region, the number of seats that would be filled by members of that
region (quota) would be ten (double the number of single-member districts). Five (half) of those
seats would be filled by members representing the single-member ridings, while 2-3 provincial
sub-region seats could reasonably be won. Any remaining seat quota would be won in higher-
level tiers (provincial, regional, national).
If provincial sub-regions were created in a given province, the sub-region seat quota
would work the same way as the provincial seat quota: provincial regions would elect a number
of members in total that is equal to double its number of single-member ridings. Half would
come from the single-member ridings, while the rest from higher-tiers (provincial sub-region,
province, region, nation). The concept of the multiple tiers is simple: percentage points would be
pooled, a member would be elected for every 50 points a party pools, and the remainder would
be transferred to the next higher tier where the process would be repeated. No seats would be
allocated by partial quotas (less than 50 points) until the final, national tier.
172
I would recommend generally aiming for provincial regions consisting of 5-8 ridings,
with a bare minimum of 4 ridings per sub-region. Halving the number of ridings per province
according to the recent federal districts readjustment (2012) and rounding up, would give Ontario
61 ridings under proportional-first-past-the-post which could facilitate 7-12 provincial regions.
As such, this would make the provincial regions under this system much smaller than those
proposed by the Law Commission, making representation under this proposal significantly more
“local.” Québec would have 39 single-member ridings which could facilitate 4-8 provincial sub-
regions. British Columbia would have 21 single-member ridings, facilitating 2-5 provincial sub-
regions, while Alberta would have 17 single-member ridings and could facilitate 2-4 provincial
ridings. Details such as the number of provincial sub-regions and their boundaries would be
decided by a boundaries commission with input from the public, much the same way riding
boundaries are now determined.
7.6 Alberta simulation with provincial sub-regions
To demonstrate how provincial sub-regions would work under proportional-first-past-the-
post, I have simulated the results of the 2011 federal election in Alberta. I have paired
neighbouring ridings to create 14 single-member ridings and calculated the results in those
ridings. I then grouped the ridings to create two provincial regions consisting of seven ridings
each (Alberta North and Alberta South). Table 7-9A below shows the results for the four ‘major’
parties and independent members. Appendix B contains table 7-9B with the results for the eight
‘minor‘ parties27.
173
27 The results for all parties were not able to fit in a single table.
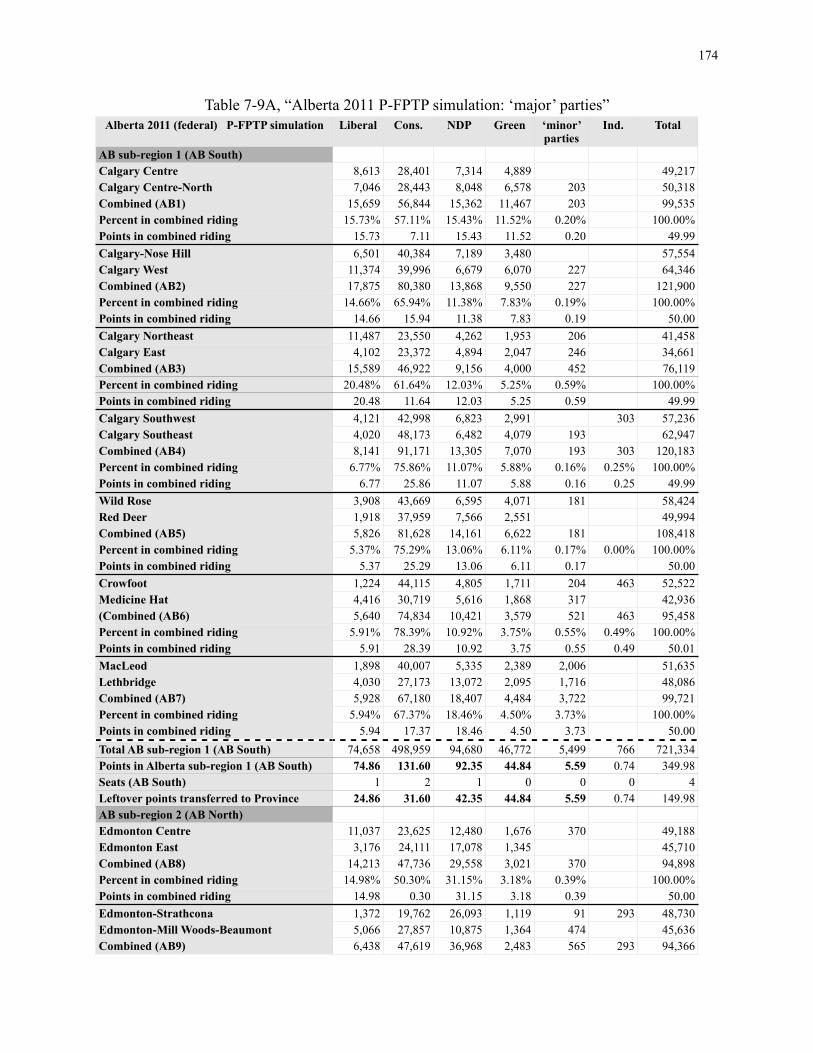
Table 7-9A, “Alberta 2011 P-FPTP simulation: ‘major’ parties”Alberta 2011 (federal) P-FPTP simulation Liberal Cons. NDP Green ‘minor’
partiesInd. Total
AB sub-region 1 (AB South)Calgary CentreCalgary Centre-NorthCombined (AB1)Percent in combined ridingPoints in combined ridingCalgary-Nose HillCalgary WestCombined (AB2)Percent in combined ridingPoints in combined ridingCalgary NortheastCalgary EastCombined (AB3)Percent in combined ridingPoints in combined ridingCalgary SouthwestCalgary SoutheastCombined (AB4)Percent in combined ridingPoints in combined ridingWild RoseRed DeerCombined (AB5)Percent in combined ridingPoints in combined ridingCrowfootMedicine Hat(Combined (AB6)Percent in combined ridingPoints in combined ridingMacLeodLethbridgeCombined (AB7)Percent in combined ridingPoints in combined ridingTotal AB sub-region 1 (AB South)Points in Alberta sub-region 1 (AB South)Seats (AB South)Leftover points transferred to ProvinceAB sub-region 2 (AB North)Edmonton CentreEdmonton EastCombined (AB8)Percent in combined ridingPoints in combined ridingEdmonton-StrathconaEdmonton-Mill Woods-BeaumontCombined (AB9)
8,613 28,401 7,314 4,889 49,2177,046 28,443 8,048 6,578 203 50,318
15,659 56,844 15,362 11,467 203 99,53515.73% 57.11% 15.43% 11.52% 0.20% 100.00%
15.73 7.11 15.43 11.52 0.20 49.996,501 40,384 7,189 3,480 57,554
11,374 39,996 6,679 6,070 227 64,34617,875 80,380 13,868 9,550 227 121,900
14.66% 65.94% 11.38% 7.83% 0.19% 100.00%14.66 15.94 11.38 7.83 0.19 50.00
11,487 23,550 4,262 1,953 206 41,4584,102 23,372 4,894 2,047 246 34,661
15,589 46,922 9,156 4,000 452 76,11920.48% 61.64% 12.03% 5.25% 0.59% 100.00%
20.48 11.64 12.03 5.25 0.59 49.994,121 42,998 6,823 2,991 303 57,2364,020 48,173 6,482 4,079 193 62,9478,141 91,171 13,305 7,070 193 303 120,183
6.77% 75.86% 11.07% 5.88% 0.16% 0.25% 100.00%6.77 25.86 11.07 5.88 0.16 0.25 49.99
3,908 43,669 6,595 4,071 181 58,4241,918 37,959 7,566 2,551 49,9945,826 81,628 14,161 6,622 181 108,418
5.37% 75.29% 13.06% 6.11% 0.17% 0.00% 100.00%5.37 25.29 13.06 6.11 0.17 50.00
1,224 44,115 4,805 1,711 204 463 52,5224,416 30,719 5,616 1,868 317 42,9365,640 74,834 10,421 3,579 521 463 95,458
5.91% 78.39% 10.92% 3.75% 0.55% 0.49% 100.00%5.91 28.39 10.92 3.75 0.55 0.49 50.01
1,898 40,007 5,335 2,389 2,006 51,6354,030 27,173 13,072 2,095 1,716 48,0865,928 67,180 18,407 4,484 3,722 99,721
5.94% 67.37% 18.46% 4.50% 3.73% 100.00%5.94 17.37 18.46 4.50 3.73 50.00
74,658 498,959 94,680 46,772 5,499 766 721,33474.86 131.60 92.35 44.84 5.59 0.74 349.98
1 2 1 0 0 0 424.86 31.60 42.35 44.84 5.59 0.74 149.98
11,037 23,625 12,480 1,676 370 49,1883,176 24,111 17,078 1,345 45,710
14,213 47,736 29,558 3,021 370 94,89814.98% 50.30% 31.15% 3.18% 0.39% 100.00%
14.98 0.30 31.15 3.18 0.39 50.001,372 19,762 26,093 1,119 91 293 48,7305,066 27,857 10,875 1,364 474 45,6366,438 47,619 36,968 2,483 565 293 94,366
174
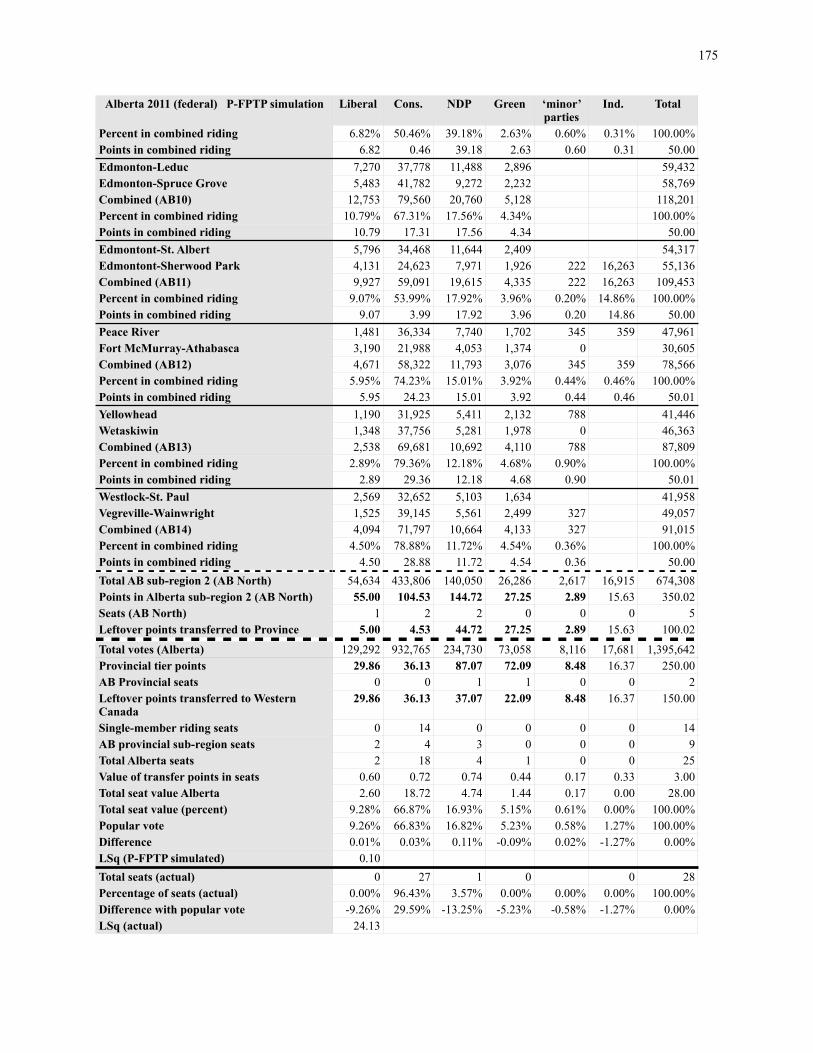
Alberta 2011 (federal) P-FPTP simulation Liberal Cons. NDP Green ‘minor’ parties
Ind. Total
Percent in combined ridingPoints in combined ridingEdmonton-LeducEdmonton-Spruce GroveCombined (AB10)Percent in combined ridingPoints in combined ridingEdmontont-St. AlbertEdmontont-Sherwood ParkCombined (AB11)Percent in combined ridingPoints in combined ridingPeace RiverFort McMurray-AthabascaCombined (AB12)Percent in combined ridingPoints in combined ridingYellowheadWetaskiwinCombined (AB13)Percent in combined ridingPoints in combined ridingWestlock-St. PaulVegreville-WainwrightCombined (AB14)Percent in combined ridingPoints in combined ridingTotal AB sub-region 2 (AB North)Points in Alberta sub-region 2 (AB North)Seats (AB North)Leftover points transferred to Province
Total votes (Alberta)Provincial tier pointsAB Provincial seatsLeftover points transferred to Western CanadaSingle-member riding seats AB provincial sub-region seatsTotal Alberta seatsValue of transfer points in seatsTotal seat value AlbertaTotal seat value (percent)Popular voteDifferenceLSq (P-FPTP simulated)Total seats (actual)Percentage of seats (actual)Difference with popular voteLSq (actual)
6.82% 50.46% 39.18% 2.63% 0.60% 0.31% 100.00%6.82 0.46 39.18 2.63 0.60 0.31 50.00
7,270 37,778 11,488 2,896 59,4325,483 41,782 9,272 2,232 58,769
12,753 79,560 20,760 5,128 118,20110.79% 67.31% 17.56% 4.34% 100.00%
10.79 17.31 17.56 4.34 50.005,796 34,468 11,644 2,409 54,3174,131 24,623 7,971 1,926 222 16,263 55,1369,927 59,091 19,615 4,335 222 16,263 109,453
9.07% 53.99% 17.92% 3.96% 0.20% 14.86% 100.00%9.07 3.99 17.92 3.96 0.20 14.86 50.00
1,481 36,334 7,740 1,702 345 359 47,9613,190 21,988 4,053 1,374 0 30,6054,671 58,322 11,793 3,076 345 359 78,566
5.95% 74.23% 15.01% 3.92% 0.44% 0.46% 100.00%5.95 24.23 15.01 3.92 0.44 0.46 50.01
1,190 31,925 5,411 2,132 788 41,4461,348 37,756 5,281 1,978 0 46,3632,538 69,681 10,692 4,110 788 87,809
2.89% 79.36% 12.18% 4.68% 0.90% 100.00%2.89 29.36 12.18 4.68 0.90 50.01
2,569 32,652 5,103 1,634 41,9581,525 39,145 5,561 2,499 327 49,0574,094 71,797 10,664 4,133 327 91,015
4.50% 78.88% 11.72% 4.54% 0.36% 100.00%4.50 28.88 11.72 4.54 0.36 50.00
54,634 433,806 140,050 26,286 2,617 16,915 674,30855.00 104.53 144.72 27.25 2.89 15.63 350.02
1 2 2 0 0 0 55.00 4.53 44.72 27.25 2.89 15.63 100.02
129,292 932,765 234,730 73,058 8,116 17,681 1,395,64229.86 36.13 87.07 72.09 8.48 16.37 250.00
0 0 1 1 0 0 229.86 36.13 37.07 22.09 8.48 16.37 150.00
0 14 0 0 0 0 142 4 3 0 0 0 92 18 4 1 0 0 25
0.60 0.72 0.74 0.44 0.17 0.33 3.002.60 18.72 4.74 1.44 0.17 0.00 28.00
9.28% 66.87% 16.93% 5.15% 0.61% 0.00% 100.00%9.26% 66.83% 16.82% 5.23% 0.58% 1.27% 100.00%0.01% 0.03% 0.11% -0.09% 0.02% -1.27% 0.00%
0.100 27 1 0 0 28
0.00% 96.43% 3.57% 0.00% 0.00% 0.00% 100.00%-9.26% 29.59% -13.25% -5.23% -0.58% -1.27% 0.00%
24.13
175
‘Minor’ parties: Christian Heritage Party, Marxist-Leninist Party, Communist Party, Western Block Party, Pirate Party, Progressive Canadian Party, Canadian Action Party, Parti Rhinocéros
In the simulation, all 14 single-member ridings would elect a Conservative member.
Points would be pooled within each provincial region. Alberta Region 1 (AB South) would elect
one Liberal representative, two Conservative representatives, and one NDP representative.
Alberta Region 2 (AB North) would elect one Liberal representative, two Conservative
representatives, and two NDP representatives. These seats would be filled by the most popular
party candidates from those provincial sub-regions (by percent vote in their respective ridings)
who do not already hold a seat. The leftover positive points balances from each party from the
provincial regions would be transferred to the next tier, the provincial pool. Negative points
balances, if any existed (none exist in this simulation), would not be transferred from provincial
regions to the provincial pool. Provincial seats would then be allocated for every 50 points
pooled at the provincial level.
In this simulation, the NDP and the Green party, with 87.07 and 72.09 points in the
provincial pool, respectively, would elect one provincial representative each. Neither provincial
sub-region has yet filled its seat quota (14 seats each), with 11 of 14 members elected so far from
Region 1 (Alberta South) and 12 of 14 elected so far from Region 2 (Alberta North). Provincial
seats would be allocated to the provincial regions in order of highest points balance (in this case,
however, order of seat allocation would not make a difference). Since the NDP has the highest
points balance in the provincial pool, (more than the Green Party, the only other party eligible for
a provincial seat), it would receive the first provincial seat. This seat would be filled by an NDP
candidate from Alberta South because this region would have contributed more points to the
provincial pool than the only other provincial region (42.35 to 37.07). Fifty points would be
176
subtracted for every seat allocated. At this point, neither provincial region’s quota would be
filled, so the next seat could be filled by a member from either region. The Green Party, the only
remaining party with 50 or more points, would receive the next, and final provincial seat. A
candidate from Alberta North (the most popular candidate by percent vote in their respective
ridings) would fill this provincial seat, since this region would have contributed more points than
Alberta South (44.84 points compared to 27.25).
In this simulation, Alberta would have elected 14 representatives for single-member
ridings, 9 provincial sub-region representatives, and 2 provincial representatives. With 25
members so far elected, 3 more members from Alberta would be elected to fill the provinces
quota—two from Alberta North, and one from Alberta South. These three members would be
elected to higher tiers to represent either Western Canada or Canada.
7.7 What happens when a party wins more seats than it is ‘entitled’?
In any mixed system it is possible that a party might win more nominal tier seats (single-
member riding seats) than its overall proportional ‘entitlement’ and this system would be the
same in this regard. A party that wins all single-member district seats in a given province or
provincial sub-region with only a minority of votes would be somewhat ‘overrepresented.’ To
illustrate, let us imagine a province or provincial sub-region consisting of 5 single-member
ridings. A party that wins all 5 of these ridings with a minority of the vote would pool a negative
point balance. If the party won all 5 seats with 40 percent of the vote in each riding, the party
would pool -50 points. Under proportional-first-past-the-post a party would keep all of its single-
member riding seats already won, even if it meant the party would be somewhat
177
‘overrepresented.’ Further, this negative points balance would not be transferred to the next tier
—the party would instead transfer zero points. This would effectively give the party a one-seat
bonus, but it would not be problematic for the system because it would reduce the number of
seats in the final tier awarded by partial quota.
As explained in section 7-4, all remaining seats would be filled in the final, national tier.
These seats would be awarded in order of highest number of points and then allocated to region,
then province, and finally to provincial sub-region (if applicable). Without any parties pooling a
negative point balances at the provincial or provincial sub-region level, some seats will
inevitably be awarded in the final tier without a full (50 points) quota. If, on the other hand,
parties pooling negative points balances is a common occurrence, it is possible that some parties
could have 50 or more points leftover in the national tier after all provincial seat quotas have
been filled. One way to deal with such an event would be to expand the size of the House.
Another way would be to keep the size of the House steady by maintaining the provincial (and
sub-regional) seat quota (double its number of single-member ridings). I view the latter as
preferable for a few reasons.
Firstly, expanding the size of the House would mean that some provinces would surpass
their seat quotas. I believe that a province electing extra members in excess of its normal
entitlement could be contentious and should, for this reason alone, be avoided. Secondly,
expansion of the House could be considered a violation of the Fair Representation Act since it
would alter (potentially significantly) the number of MPs per province. Lastly, maintaining a
House that is fixed in size even if it meant some parties might occasionally miss out on seats
otherwise earned, could act as a ‘natural’ threshold, eliminating the perceived need to add an
178
arbitrary threshold to the system. Gallagher and Mitchell write: “Proportionality is generally
regarded as a ‘good thing’—in moderation. Few electoral systems go for broke on the
proportionality dimension; most have, in practice, some way of limiting it” (2005, 13). Likewise,
proportional first-past-the-post would not ‘go for broke’ on the proportionality dimension as
there is a built-in, natural threshold when the House is not permitted to expand. An arbitrary
threshold, such as a total percent of the vote required before a party receives its first seat, would
not be necessary under this system.
Not transferring negative points balances from the provincial tier to the regional tier (or
from the provincial sub-regional tier to the provincial tier) would increase the total number of
points pooled, but with a quota set on the number of members that can be elected from each
province, this is not problematic. With some points spread across tiny parties without enough
support to gain a seat and among independent candidates whose points cannot pool (independent
candidates are essentially a party with only one member), not transferring negative point
balances would reduce the number of seats in the final tier allocated by partial quota (less than
50 points) and would arguably improve the functioning of the system.
7.8 Comparing proportionality with other systems
Based on the simulations, proportional-first-past-the-post would deliver high
proportionality as shown by a low least squares index (LSq). How would this level of
proportionality compare to other forms of proportional representation? Would the overlapping
tiers create more proportional outcomes than other proportional voting systems? The data used in
the simulations above can be easily used to create simulations for certain voting systems. I have
179
used the results I tabled from the Atlantic provinces and from Alberta in the 2011 election to
simulate the results under list-PR and one-vote MMP. Two-vote MMP would be a more difficult
simulation since we do not have data regarding if and how voters would have cast two votes. A
simulation for STV is also not feasible since we do not know how voters would have ranked
candidates.
For list-PR, I have chosen to simulate the results using two largest remainder (LR)
methods of seat allocation (LR-Hare28 and LR-Droop 29) because of their ease of calculation
when compared to highest-average methods. Gallagher and Mitchell write that LR-Hare is
unbiased in terms of size of party and typically produces the same results as the Sainte-Laguë
highest average method, while LR-Droop is biased towards larger parties and typically produces
the same result as the D’Hondt highest average method (2005, 588).
For the MMP simulation, I have used the riding results from the P-FPTP simulation. I
calculated the results using a 50-50 seat distribution for MMP (half the seats as single-member
ridings and half as provincial seats). I then used the results of the LR-Hare and LR-Droop
simulations to calculate the overall seat ‘entitlement’ for each province. Subtracting the single-
member districts won from the total seat entitlement gives the number of provincial
compensatory seats by party. In the simulations for these five provinces the overall results for
list-PR and MMP were the same. This is due to the fact that in both cases no party would have
received more single-member riding seats than its proportional ‘entitlement’. It is important to
note that if voters cast two votes, however, the likelihood of a party’s single-member district
seats exceeding its proportionality entitlement would increase.
180
28 Hare quota = votes/seats
29 Droop quota = (votes/seats+1)+1
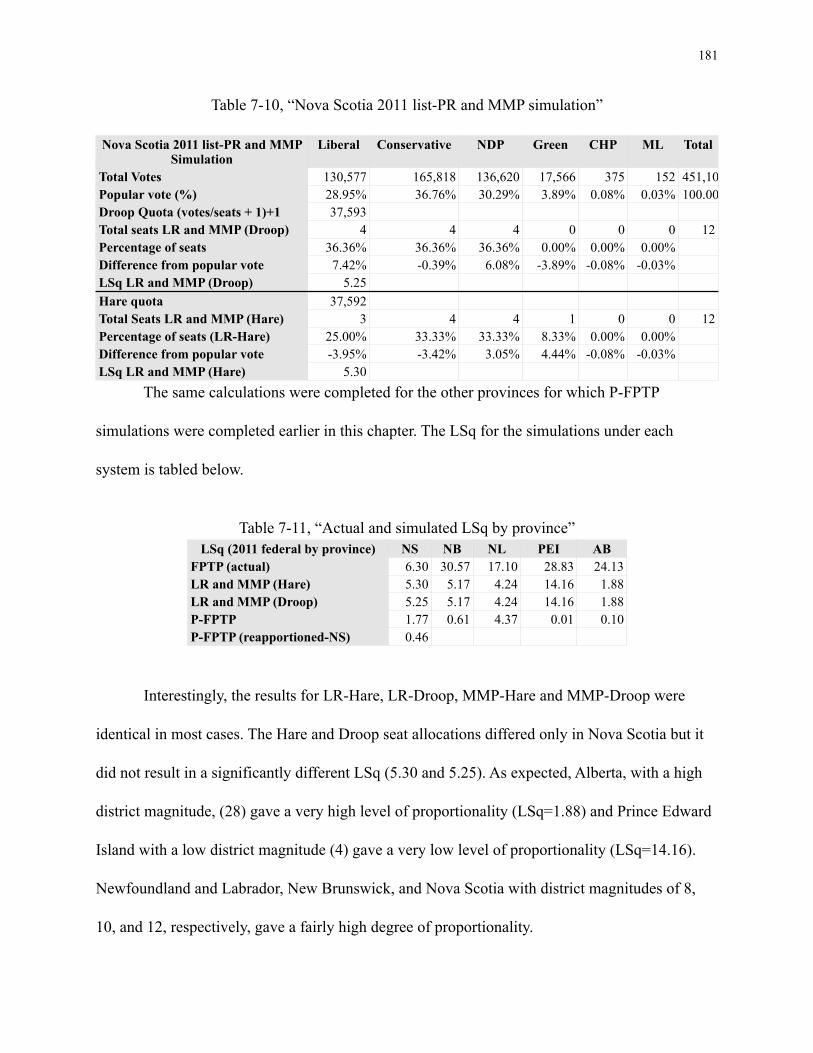
Table 7-10, “Nova Scotia 2011 list-PR and MMP simulation”
Nova Scotia 2011 list-PR and MMP Simulation
Liberal Conservative NDP Green CHP ML Total
Total VotesPopular vote (%)Droop Quota (votes/seats + 1)+1Total seats LR and MMP (Droop)Percentage of seatsDifference from popular voteLSq LR and MMP (Droop)Hare quotaTotal Seats LR and MMP (Hare)Percentage of seats (LR-Hare)Difference from popular voteLSq LR and MMP (Hare)
130,577 165,818 136,620 17,566 375 152 451,10828.95% 36.76% 30.29% 3.89% 0.08% 0.03% 100.00%37,593
4 4 4 0 0 0 1236.36% 36.36% 36.36% 0.00% 0.00% 0.00%7.42% -0.39% 6.08% -3.89% -0.08% -0.03%
5.2537,592
3 4 4 1 0 0 1225.00% 33.33% 33.33% 8.33% 0.00% 0.00%-3.95% -3.42% 3.05% 4.44% -0.08% -0.03%
5.30 The same calculations were completed for the other provinces for which P-FPTP
simulations were completed earlier in this chapter. The LSq for the simulations under each
system is tabled below.
Table 7-11, “Actual and simulated LSq by province”LSq (2011 federal by province) NS NB NL PEI AB
FPTP (actual)LR and MMP (Hare)LR and MMP (Droop)P-FPTPP-FPTP (reapportioned-NS)
6.30 30.57 17.10 28.83 24.135.30 5.17 4.24 14.16 1.885.25 5.17 4.24 14.16 1.881.77 0.61 4.37 0.01 0.100.46
Interestingly, the results for LR-Hare, LR-Droop, MMP-Hare and MMP-Droop were
identical in most cases. The Hare and Droop seat allocations differed only in Nova Scotia but it
did not result in a significantly different LSq (5.30 and 5.25). As expected, Alberta, with a high
district magnitude, (28) gave a very high level of proportionality (LSq=1.88) and Prince Edward
Island with a low district magnitude (4) gave a very low level of proportionality (LSq=14.16).
Newfoundland and Labrador, New Brunswick, and Nova Scotia with district magnitudes of 8,
10, and 12, respectively, gave a fairly high degree of proportionality.
181
Overall, these simulations show that list-PR and MMP would give a higher degree of
proportionality than first-past-the-post, and that proportional-first-past-the-post would give a
higher degree of proportionality than list-PR and MMP. The reason for this, of course, is because
seat allocation at the provincial level under P-FPTP is not final. The P-FPTP calculations take
into account the seat values that are transferred to higher tiers.
These simulations also show that better apportioned the ridings produce more
proportional results under proportional-first-past-the-post. The only case where the level of
proportionality of MMP and list-PR were effectively equal to proportional-first-past-the-post was
in Newfoundland and Labrador. This is not surprising, however, considering that the riding of
Labrador is inevitably very malapportioned30. The sensitivity to malapportioned ridings was
further shown when two different least squares indices were calculated for Nova Scotia: one with
a very malapportioned riding (half the population of the others), and one with the riding size
comparable to the others (by doubling the votes received for each party in the riding). By better
apportioning the riding, the LSq dropped from 1.77 to 0.46. Since all ridings are treated equally
under proportional-first-past-the-post, it is no surprise to confirm that malapportioned ridings
have a negative effect on the level of proportionality under the system.
182
30 Labrador represents one-quarter of the province’s ridings under P-FPTP but only 5.2 percent of the population (Federal Boundaries Commission for the Province of Newfoundland and Labrador 2012, 33).
Chapter VIII: Conclusion
The first-past-the-post electoral system fails to meet the basic criteria for representative
democracy: it does not give representation to all voters, does not treat voters equally, and does
not ensure political equality. A proportional voting system would meet these basic democratic
requirements, however, proportional representation is simply a theory of what ought to be and
achieving it in reality is not so cut-and-dry. Various electoral systems come with their own set of
issues, as such, no system can be considered ideal in all situations. Canadians have shown a
favourable opinion of the idea of proportional representation, yet seem hesitant when faced with
systems designed to improve proportionality. Since Canadians have also expressed satisfaction
with the current, first-past-the-post system, I argue that Canadians would be more likely to
accept a proportional electoral system if it were not too different than the current one. A system
that changes as little as possible while fixing the current system’s main problems, I believe,
would be more palatable for Canadians than some of the main alternatives. With this in mind, I
evaluated the first-past-the-post electoral system, identifying its main pros and cons. Based on
these pros and cons I developed a list of criteria for a prospective electoral system:
1. Palatability 2. Simplicity 3. Local geographic representation 4. Accountable members 5. Accountable government 6. Meaningful votes 7. Effective opposition 8. Proportional representation of parties 9. Regionally balanced governments 10. Demographic representation
I then discussed some of the major electoral systems proposals or prospective systems for
Canada and considered their application. Finding none of these systems ‘ideal’, I proposed a
183
unique, made-in-Canada electoral system, keeping with the idea that less change is better. The
system is a proportional electoral system that I believe would be ideal for Canada and its
provinces. The design of the system takes the first-past-the-post electoral system as a starting
point, modifying it so that the positive aspects are maintained while the negative aspects are
eliminated. Because the system is, at its core, the first-past-the-post system, modified to achieve
a proportional result, I have called it ‘proportional-first-past-the-post’. Tables 8-1 and 8-2 below
summarize the evaluation of the various electoral systems discussed in this thesis, according to
the list of criteria that was created:
184
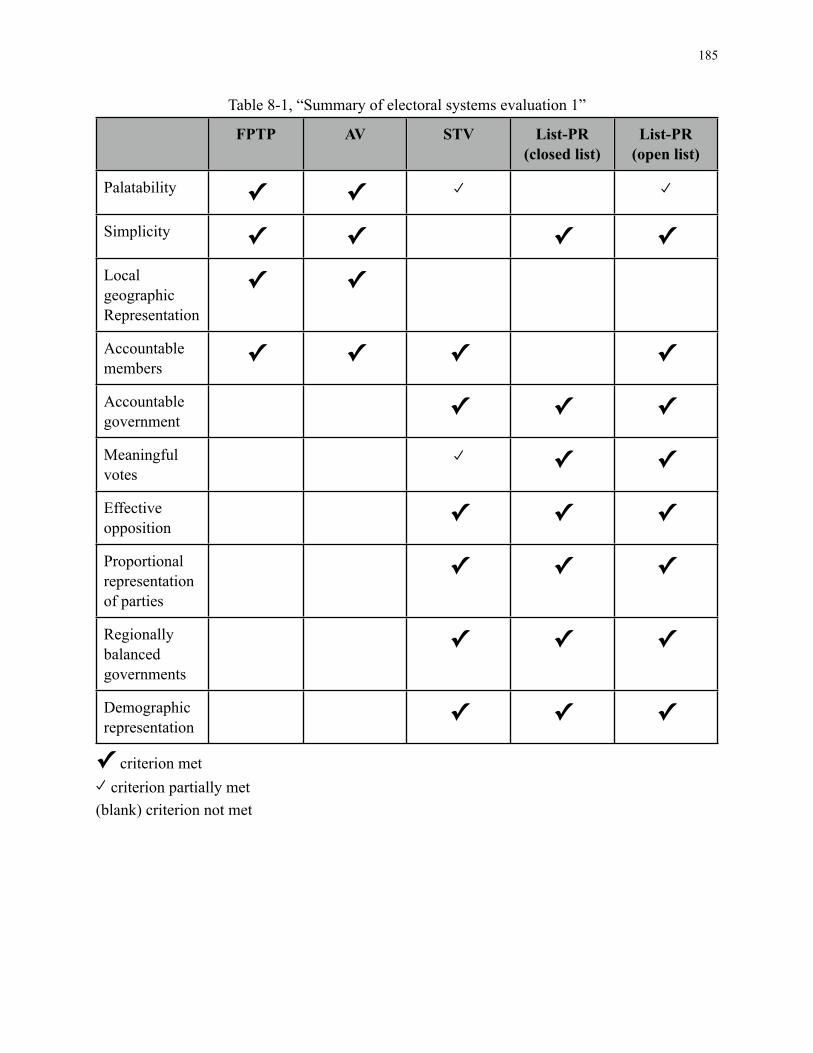
Table 8-1, “Summary of electoral systems evaluation 1”
FPTP AV STV List-PR (closed list)
List-PR (open list)
Palatability ✓ ✓Simplicity ✓ ✓ ✓ ✓Local geographic Representation
✓ ✓
Accountable members
✓ ✓ ✓ ✓
Accountable government
✓ ✓ ✓
Meaningful votes
✓ ✓
Effective opposition
✓ ✓ ✓
Proportional representation of parties
✓ ✓ ✓
Regionally balanced governments
✓ ✓ ✓
Demographic representation
✓ ✓ ✓
✓ criterion met criterion partially met
(blank) criterion not met
185
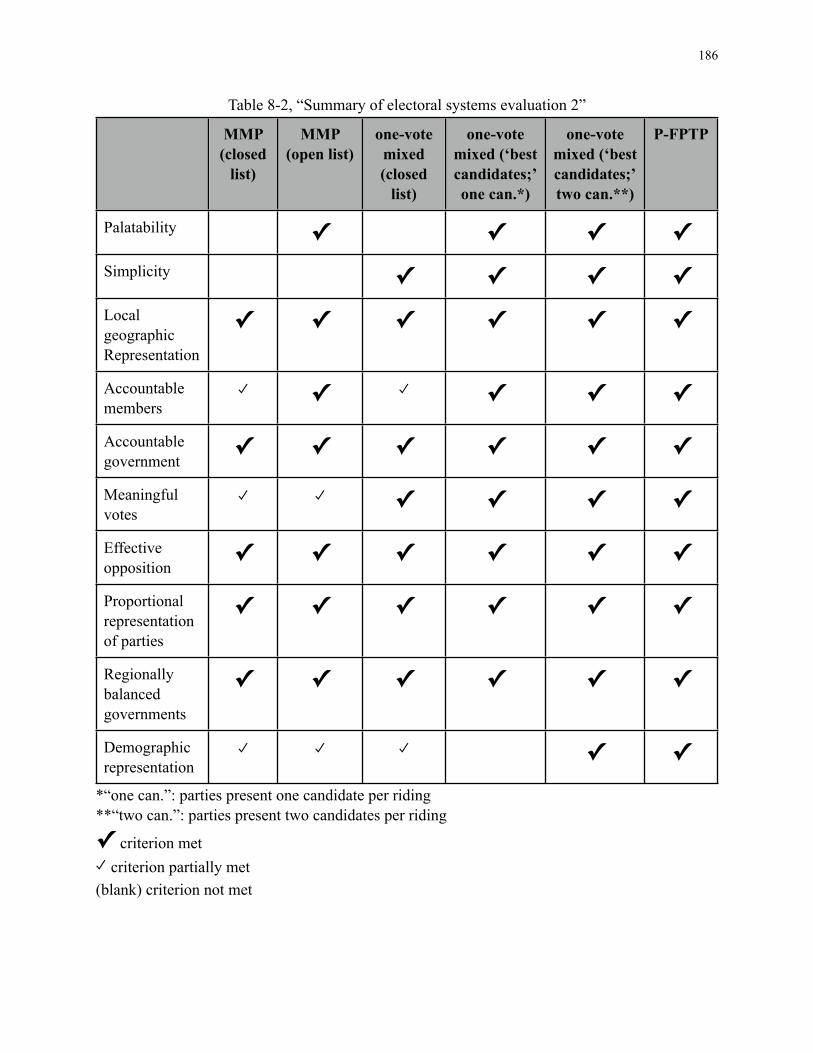
Table 8-2, “Summary of electoral systems evaluation 2”
MMP (closed
list)
MMP (open list)
one-vote mixed (closed
list)
one-vote mixed (‘best candidates;’one can.*)
one-vote mixed (‘best candidates;’ two can.**)
P-FPTP
Palatability ✓ ✓ ✓ ✓Simplicity ✓ ✓ ✓ ✓Local geographic Representation
✓ ✓ ✓ ✓ ✓ ✓
Accountable members
✓ ✓ ✓ ✓
Accountable government
✓ ✓ ✓ ✓ ✓ ✓
Meaningful votes
✓ ✓ ✓ ✓
Effective opposition
✓ ✓ ✓ ✓ ✓ ✓
Proportional representation of parties
✓ ✓ ✓ ✓ ✓ ✓
Regionally balanced governments
✓ ✓ ✓ ✓ ✓ ✓
Demographic representation
✓ ✓*“one can.”: parties present one candidate per riding**“two can.”: parties present two candidates per riding
✓ criterion met criterion partially met
(blank) criterion not met
186
Proportional-first-past-the-post bears some resemblance to other mixed-compensatory
systems, but I would argue, is simpler and better adapted to Canadian political tradition. Its
unique formula based on percent vote won in each riding conforms to the tradition of treating all
ridings equally and makes the formula easy to understand on the riding level. Canadians
frequently deal with and have a firm grasp of the concept of percentages31 and so the workings of
the system would be transparent and easy to understand—even for Canadians weak at
mathematics. The same cannot be said about systems based on quotas and largest remainders or
highest averages. The basic concept of the system is that otherwise wasted and surplus
percentage points pool and for every 50 points, a new candidate is elected. Since a seat would
only be awarded for a full 50 points until the final stage, rounding is kept to a minimum,
representation kept as local as possible, while keeping proportionality high.
Under first-past-the-post a voter’s single vote may be considered “ineffective” if it fails to
elect anyone. Some models attempt to compensate for an ineffective first-choice vote by
allowing the voter to rank her votes. In AV or STV, in the event that a first-choice vote is
“ineffective,” a subsequent vote may become “effective.” Other models give the voter a second
vote, as in MMP, so that even if one’s candidate vote is ineffective, at least one’s party vote will
be effective. In proportional voting systems, as van der Hout, de Swart, and ter Veer correctly
point out, it is possible for virtually all first-choice votes to be effective (2006, 465). This being
the case, I would argue that a system should aim to come as close as possible to full first-choice
vote effectiveness. If this can be achieved, as in the proportional-first-past-the-post system,
subsequent rankings or multiple votes become needless complications. This is one of the reasons
187
31 Canadians know, for example, that 13% HST on a $10 item will be $1.30 or $13 on a $100 item. They also understand that a $1000 item would be better purchased in Alberta (if possible), since a GST rate of 5% would result in $50 of taxes rather than $130—a savings of $70.
that make the alternative vote, the single-transferable vote, and two-vote mixed systems less than
ideal. Giving voters two votes or employing a ranked ballot would also be a significant departure
from the current voting method, and one that lacks justification.
In terms of demographic representation, and in the easily measurable indicator of
women’s representation, list-PR tends to perform well, first-past-the-post, poorly, and mixed-
compensatory systems employing lists somewhere in the middle of these two extremes. One of
the major downfalls of list proportional representation is that it lacks strong local representation.
The type of strong local geographic representation that single-member districts offer would
simply not be possible under a list-PR system. For this reason, and since it represents perhaps a
too great a departure from current political tradition, although an improvement in many respects,
I do not consider it a viable option for Canada. A typical mixed-compensatory system, it seems,
would improve women’s representation somewhat, but would not approach parity. A mixed-
compensatory system employing a ‘best candidates’ method would facilitate achieving gender
parity if, and only if parties were permitted to run two candidates per riding, as would be the case
under the proposed system. I believe proportional-first-past-the-post therefore represents the only
serious Canadian proposal that would facility achieving gender parity in legislative bodies.
Any voting systems that delivers highly proportional election results can be considered as
able to hold governments accountable. Voting systems that permit voters to at least endorse
specific candidates would make members accountable. Systems that give voters a choice of
candidates within parties would maximize member accountability. Systems employing closed
lists, however, perform weakly in this regard since the power of voters to eliminate high-ranking
party candidates is absent. The ability to hold individual members accountable, including party
188
leaders, is a positive feature of first-past-the-post that I would argue, is an essential feature in any
prospective voting system that is to gain widespread support from Canadians. I believe that the
idea of even some candidates being ‘unaccountable’ to the public due to their high party ranking
would be enough to cause a prospective electoral system to be rejected by Canadians. The use of
closed lists to fill all or some seats, such as for the list tier in a mixed-compensatory system,
should be therefore, in my opinion, ruled out.
Most proportional systems would, of course, satisfy the criterion of proportional
representation, with some systems performing better than others, depending on the design.
Proportionality would also help deliver an effective opposition, accountable government, and
more regionally balanced governments. Systems maintaining single-member districts would
deliver strong local representation. Systems allowing members to endorse candidates would
satisfy the accountable members criterion, with those allowing choice within parties excelling.
A proportional voting system would make voting more meaningful than the current system since
one’s vote would “count” even when one does not support the most locally popular party or
candidate. The systems performing the best in this regard would be one-vote models that allow
virtually all voters’ first-choice votes to be meaningful in two ways: influencing the number of
seats awarded to each party and in determining which candidates fill those seats. Demographic
representation would be expected to improve in systems that allow parties to present multiple
candidates per riding. When parties present an even number of candidates, it makes achieving
gender balance possible at the riding level; unbalanced slates of candidates would be visible by
all. Every electoral system is, to some degree, more complicated than the first-past-the-post
system. Some voting systems are, however, needlessly complicated including those that ask
189
voters to rank their ballots or cast two ballots since, ideally, every voter’s first and only choice
would be effective. Typical proportional formulae are more complicated than the plurality
formula, but not excessively so.
Two voting systems, in my opinion, fully satisfy the list of criteria I have created: 1) a
one-vote, no-list (best candidates model), mixed system that allows parties to run two candidates
per riding, and 2) the proportional-first-past-the-post system (P-FPTP). The proportional-first-
past-the-post system would offer a simpler, percentage-based formula, higher proportionality,
and would be slightly more “local” as it could facilitate smaller second tier districts (provincial
sub-regions) without sacrificing proportionality. Further, in addition to being a more proportional
and local system, the ability of votes to combine across provinces and regions to elect candidates
would have an extra benefit: nationally-oriented parties would no longer be disadvantaged when
compared to regionally or provincially-oriented parties. The proportional-first-past-the-post
system is therefore an ideal electoral system for Canada that could be used both federally and
provincially. I believe it is significantly different from other models to merit its own name, and
that the name I have given it is appropriate. It offers a proportional election result, is based on the
first-past-the-post system, and the counting of percentage points within each district involves a
metaphorical ‘post’ placed at 50 percent.
An essential part of solving Canada’s democratic deficit is the adoption of a proportional
voting system. For more than a decade, a solid majority of Canadians have consistently
supported the idea of proportional representation (Environics 2010, 2013, Forum Research 2012,
CRIC 2005, LeDuc and Pammett 2003, Chénier 2002, Bricker and Redfern 2001). Despite this
reality, all provincial referenda to date have failed (Barnes and Robertson 2009). When searching
190
for an appropriate system it cannot be ignored that the vast majority of Canadians also support
the current first-past-the-post voting system (LeDuc and Pammett 2003, 47-48). I have argued
that because of these two potentially conflicting desires, a unique, Canadian solution should be
sought. With this in mind I have succeeded in developing a proportional voting system that is
essentially a modified first-past-the-post system. It is far too easy for reformers to focus on the
negative aspects of first-past-the-post, ignoring or downplaying the system’s positive features. It
is my belief that the proposed system, because it maintains the positive and familiar features of
first-past-the-post, will be more acceptable to Canadians than other electoral system options.
This is, of course, a hypothesis, testable only by putting the system forward to Canadians. The
system would achieve proportionality while maintaining the essence of first-past-the-post. A
truly Canadian model of proportional representation has finally arrived: proportional-first-past-
the-post.
191
Bibliography
Abott, Alina. 31 March 2007. “Why Green is NOT a Wasted Vote.” http://www.greenparty.ca/node/1099
ACE, the Electoral Knowledge Network. 2013. “District Magnitude.” http://aceproject.org/ace-en/topics/bd/bda/bda02/bda02a/onePage
Aragonès, E. and S. Sánches-Pagès. 2008. “A theory of participatory democracy based on the real case of Porto Alegre.” European Economic Review, doi:10.1016/j.euroecorev.2008.09.006
Aristotle; Benjamin Jowett (trans) [c. 350 B.C., 1885 (trans.)] 2000. The Politics. Mineola and New York: Dover Publications, Inc.
AV2011. 2011“For an Informed Referendum Decision.” http://www.av2011.co.uk
Barnes, Andre and James R. Robertson. 2009. Electoral Reform Initiatives in Canadian Provinces. Ottawa: Parliamentary Information and Research Service. http://www.parl.gc.ca/Content/LOP/researchpublications/prb0417-e.pdf
BBC News. 6 May 2011. “Vote 2011: UK rejects alternative vote” http://www.bbc.co.uk/news/uk-politics-13297573
Birch, A. H. 1971. Representation. London: Pall Mall Press Limited.
Blais, André. 1988. “The classification of electoral systems,” European Journal of Political Research 16: 99-110.
Blais, André; Massicotte, Louis; Dobrzynska, Agnieszka. 2003. Why is Turnout Higher in Some Countries than in Others? Ottawa: Elections Canada.
Blais, André; Dobrzynska, Agnieska; and Indridason, Indridi H. 2005. “To Adopt of Not to Adopt Proportional Representation: The Politics of Institutional Choice.” British Journal of Political Science, 35, 1: 182-190.
Blais, André (ed.). 2008. To Keep or Change First Past the Post? Oxford and New York: Oxford University Press.
Blais, André. “Criteria for Assessing Electoral Systems.” Electoral Insight June 1999. http://www.elections.ca/res/eim/article_search/article.asp?id=113&lang=e&frmPageSize=
192
Blais, André and Elisabeth Gidengil. 1991. Making Representative Democracy Work: The Views of Canadians. Volume 17 of the Research Studies, Royal Commission on Electoral Reform and Party Financing. Toronto and Oxford: Dundurn Press.
Bochsler, Daniel. 2012. “A quasi-proportional electoral system ‘only for honest men’? The hidden potential for manipulating mixed compensatory electoral systems.” International Political Science Review 33: 401-420. DOI: 10.1177/0192512111420770.
Bogdanor, Vernon. 22 February 2011. “AV is a paltry alternative for reformers: Advocates of change want a proportional voting system, but the 5 May referendum offers no such option.” The Guardian. http://www.theguardian.com/commentisfree/2011/feb/22/alternative-vote-proportional-representation-referendum
Bricker, Darrell and Martin Redfern. 2001. “Canadian Perspectives on the Voting System.” Policy Options, July-August 2001. http://www.irpp.org/po/archive/jul01/bricker.pdf
Cairns, Alan C. 1968. “The Electoral System and the Party System in Canada, 1921-1965,” in Canadian Journal of Political Science 1 (1): 55-80.
Canada. Parliament. 1985 (2011, 2013). Electoral Boundaries Readjustment Act. http://laws-lois.justice.gc.ca/PDF/E-3.pdf
Canada. Justice. 2011. Fair Representation Act. http://laws-lois.justice.gc.ca/eng/annualstatutes/2011_26/page-1.html
Canada. Parliament. Senate. 2013. “The Senate Today: Representing Canadians’ Interests” http://www.parl.gc.ca/About/Senate/Today/interests-e.html
Canada. 2012. Redistribution Federal Electoral Districts. “Canada’s Electoral Map is Changing: Redistribution at a Glance.” http://www.redecoupage-federal-redistribution.ca/info/glance/EC90318_e.pdf
Canadian Index of Wellbeing. 2010. “Democratic Engagement: A Report of the Canadian Index of Wellbeing (CIW).” Prairie Wild Consulting Co. https://uwaterloo.ca/canadian-index-wellbeing/sites/ca.canadian-index-wellbeing/files/uploads/files/DemocraticEngagement_DomainReport.pdf
Carson, Lyn, and Brian Martin. 1999. Random Selection in Politics. Westport: Praeger.
Carty, R. Kenneth. 2005. Doing democracy differently: is it time for electoral reform in Canada? Memorial University of Newfoundland, Leslie Harris Centre of Regional Policy and Development.
193
CBC Digital Archives. 26 October 1993. “Tories trampled in Liberal landslide: On this day, Oct. 25, 1993.” http://archives.cbc.ca/on_this_day/10/25/
CBC Digital Archives, Oct. 14, 1987. “1987 New Brunswick Election.” http://archives.cbc.ca/politics/provincial_territorial_politics/clips/13860/
CBC. 15 October 2008. “Goose egg: Conservative vote collapses in N.L.”http://www.cbc.ca/news/canada/newfoundland-labrador/story/2008/10/14/nfld-tory-collapse.html
CBC. 2 May 2011. “Prominent candidates: Duceppe, Ignatieff, Cannon defeated”http://www.cbc.ca/news/politics/canadavotes2011/story/2011/05/02/cv-election-prominents.html
CBC. 11 October 2011. “Dunderdale leads NL Tories to majority http://www.cbc.ca/news/canada/newfoundland-labrador/story/2011/10/11/nlvotes-main-results.html
CBC. 11 October 2011. “Newfoundland and Labrador Votes 2011” http://www.cbc.ca/news/canada/nlvotes2011/
CBC. 3 December 2012. “Canadians less content with way democracy works, poll says: Samara research compares poll from 2012 with 2004 and finds satisfaction in decline.” http://www.cbc.ca/m/rich/news/politics/story/2012/12/02/pol-samara-poll-democratic-satisfaction.html
CBC. 8 October 2013. “Christy Clark’s advance ballot in B.C. election sparks confusion: B.C. Liberal Leader put 2 names on ballot.” http://www.cbc.ca/news/canada/british-columbia/story/2013/05/08/bc-christy-clark-vote.html
CBC Digital Archives, Oct. 14, 1987. “Clean sweep! The 1987 New Brunswick Election.” http://www.cbc.ca/archives/categories/politics/provincial-territorial-politics/nb-elections-colourful-characters-pivotal-points/clean-sweep.html
CBS News. 14 October 2012. “Inside Syria’s civil war.” http://www.cbsnews.com/8301-18560_162-57531939/inside-syrias-civil-war
Centre for Research and Information on Canada (CRIC). 2004. “Portraits of Canada 2003.” http://www.library.carleton.ca/sites/default/files/find/data/surveys/pdf_files/cric-poc-03-not1_000.pdf
Centre for Research and Information on Canada (CRIC). 2005. “Portraits of Canada 2004.” http://www.library.carleton.ca/sites/default/files/find/data/surveys/pdf_files/cric-paper_16-2004.pdf
194
Chénier, Marc. “Choice of an Electoral System: Recent developments and increasing dialogue in Canada.” Electoral Insight May 2002. http://www.elections.ca/res/eim/article_search/article.asp?id=78&lang=e&frmPageSize=10f
Cool, Julie. 2011. Women in Parliament. Ottawa: Library of Parliament. http://www.parl.gc.ca/content/lop/researchpublications/prb0562-e.pdf
Cicero, Marcus Tullius; George Sabine and Stanley Smith (translators). 1929. On the Commonwealth. New York: Bobbs-Merrill.
Cicero, Marcus Tullius. 2003. “On the Laws” in Maryann Zihala Democracy. Lanhan: University Press of America, Inc. 94-100.
Cody, Howard. 2003. “Early lessons from mixed-member proportionality in New Zealand’s Westminster Politics.” The New England Journal of Political Science 1, 1: 34-51.
Commission on Legislative Democracy. 2004. Final Report and Recommendations. Fredericton, New Brunswick.
Commonwealth Law Bulletin. 1993. “New Zealand opts for electoral reform.” 19:2, 777-781. http://dx.doi.org/10.1080/03050718.1993.9986287
Cooter, Robert D. and Michael D. Gilbert. 2010. “A Theory of Direct Democracy and the Single Subject Rule.” Columbia Law Review 110: 3.
Cross, Micahel. 2013. “The Butterfly Effect.” California Institute of Technology. http://www.cmp.caltech.edu/~mcc/chaos_new/Lorenz.html
Curtice, John. 2009. “Neither Representative nor accountable: First-Past-the-Post in Britain” in Bernard Grofman, André Blais, and Shaun Bowler, Duverger's Law of Plurality Voting: The Logic of Party Competition in Canada, India, the United Kingdom and the United States, 27-45 . New York: Springer.
Curtice, John. 2011. “The Death of a Miserable Little Compromise: The Alternative Vote Referendum.” Political Insight 2, 2: 14-17.
Dancisin, Vladimir. 2013. “Misinterpretation of the Hagenbach-Bischoff Quota.” Annales Scientia Politica 2, 1: 75-78.
De Grazia. 1951. Public and Republic. New York: Alfred A. Knopf, Inc.
Department of Justice, Canada. S.C. 2000, c. 9. “Canada Elections Act.” http://laws.justice.gc.ca/PDF/E-2.01.pdf
195
Dummett, Michael. 1992. “Towards a More Representative Voting System: The Plant Report”, New Left Review 194: 98-113.
Dummett, Michael.1997. Principles of Electoral Reform. New York: Oxford University Press.
Economist. 23 April 2011. “The perils of extreme democracy.” 398, 8730: 11.
Elections BC. 1997. “Statement of Votes: 36th Provincial General Election: May 28, 1996.” http://www.elections.bc.ca/docs/rpt/1996-SOVGeneralElection.pdf
Elections BC. 2001. “Statement of Votes: 37th Provincial General Election: May 16, 2001.” http://www.elections.bc.ca/docs/rpt/2001GEResults/2001-SOVGeneralElection.pdf
Elections Canada. 2004. “Representation in the House of Commons of Canada”. http://www.elections.ca/scripts/fedrep/federal_e/pdf/rep2004_e.pdf
Elections BC. 2005. “Statement of Votes: Referendum on Electoral Reform: May 17, 2005.” http://www.elections.bc.ca/docs/rpt/SOV-2005-ReferendumOnElectoralReform.pdf
Elections Canada. “Why Should I Vote?” http://www.elections.ca/content.aspx?section=vot&dir=yth/bas/why&document=index&lang=e
Elections NB. 2006. Thirty-Sixth General Election: Report of the Chief Electoral Officer. http://www.gnb.ca/elections/pdf/2006ProvRpt.pdf
Elections Newfoundland and Labrador, Office of the Chief Electoral Officer. 2012. “October 9, 2007, Provincial General Election Report.” http://www.elections.gov.nl.ca/elections/ElectionReports/PDF/General.Elections/2011.GE.Report.WEB.VERSION.pdf
Elections New Zealand. “General elections 1853-2005 - dates & turnout” http://www.elections.org.nz/elections/resultsdata/elections-dates-turnout.html
Elections New Zealand. “General elections 1890-1993 - seats won by party” http://www.elections.org.nz/elections/resultsdata/fpp-seats-won.html
Enns, Peter K. and Christopher Wlezien. 2011. “Group Opinion and the Study of Represenation” in Enns and Wlezien (eds.) Who Gets Represented? 1-25. New York: Russell Sage Foundation.
Environics Institute 2010. “Focus Canada 2010: Public opinion research on the record Serving the public interest.” http://www.environicsinstitute.org/uploads/institute-projects/pdf-focuscanada2010.pdf
196
Environics Institute 2013. “Poll Results: Electoral Reform & Political Cooperation.” http://www.fairvote.ca/sites/fairvote.ca/files/Environics-Cooperation-Poll-2013-04-04-Details.pdf
Elections BC. 1997. “Statement of Votes: 36th Provincial General Election, May 28, 1996.” http://www.elections.bc.ca/docs/rpt/1996-SOVGeneralElection.pdf
Elections BC. 2001. “Statement of Votes: 37th Provincial General Election, May 16, 2001.” http://www.elections.bc.ca/docs/rpt/2001GEResults/2001-SOVGeneralElection.pdf
Elections BC. 2005. “Statement of Votes: Referendum on Electoral Reform: May 17, 2005.” http://www.elections.bc.ca/docs/rpt/SOV-2005-ReferendumOnElectoralReform.pdf
Elections BC. 2008. “Amendments to the Preliminary Report, February 14, 2008, British Columbia Boundaries Commission.” http://www.elections.bc.ca/docs/rpt/BCEBC-Amendments/Part_4-6.pdf Elections BC. 2010. “Statement of Votes: Referendum on Electoral Reform: May 12, 2009.” http://www.elections.bc.ca/docs/rpt/2009Ref/2009-Ref-SOV.pdf
Elections Canada."Electoral Boundaries Readjustment Act," http://laws-lois.justice.gc.ca/PDF/E-3.pdf
Elections Canada. "Electoral Results by Party," <http://www2.parl.gc.ca/Parlinfo/Compilations/ElectionsAndRidings/ResultsParty.aspx>
Elections Canada. "History of Federal Ridings since 1867," <http://www.parl.gc.ca/information/about/process/house/hfer/hfer.asp?Language=E>
Elections Canada. 2009. Report on the Evaluation of the 40th General Election of October 14, 2008. Ottawa: Elections Canada.
Elections Newfoundland and Labrador, Office of the Chief Electoral Officer. “October 9, 2007 Provincial General Election Report.” <http://www.elections.gov.nl.ca/elections/PDF/2007/GeneralElection-October09-Report.pdf>
Electoral Reform Society. 2014. “Wasted votes.” http://www.electoral-reform.org.uk/wasted-votes/
Epstein, Richard A. 2011. “Direct Democracy: Government of the People, by the People, and for the People”. Harvard Journal of Law & Public Policy. Vol. 34: 3, 819-826.
Fairfield, Paul. 2008. Why Democracy? Albany: State University of New York Press.
197
Fair Vote Canada. 2005, “This is Democracy” http://www.fairvote.ca/wp-content/uploads/2013/06/This-is-Democracy.pdf
Fair Vote Canada. January 2010. “Time for action on Canada’s democracy deficit: A call from Canadian political scientists”. http://www.yorku.ca/splekhan/docs/1000C-2410C/political%20scientists%20statement%20and%20signers.pdf
Fair Vote Canada. 2013. “This is Democracy?” http://www.fairvote.ca/wp-content/uploads/2013/06/FVC-Tabloid.pdf
Farrell, David M. 1997. Comparing Electoral Systems. Great Britain; Prentice Hall/Harvester Wheatsheaf.
Federal Boundaries Commission for the Province of Alberta. 2012. Report of the Federal Electoral Boundaries Commission for the Province of Alberta. http://www.redecoupage-federal-redistribution.ca/ab/now/reports/ab_report_e.pdf
Federal Boundaries Commission for the Province of Newfoundland and Labrador. 2012. Report of the Federal Boundaries Commission for the Province of Newfoundland and Labrador. http://www.redecoupage-federal-redistribution.ca/nfld/now/proposals/proposal_e.pdf
Federal Boundaries Commission for the Province of Ontario. 2012. Report of the Federal Boundaries Commission for the Province of Ontario. http://www.redecoupage-federal-redistribution.ca/on/now/reports/on_report_e.pdf
Finlex (Finnish Ministry of Justice). 2010. “Valtioneuvoston asetus kansanedustajien paikkojen jaosta vaalipiirien kesken.” http://www.finlex.fi/fi/laki/alkup/2010/20100958
Flanagan, Tom. 2001. “The Alternative Vote” in Policy Options July 2001, 37-40. Ottawa: Institute for Research on Public Policy. http://www.irpp.org/po/archive/jul01/flanagan.pdf
Forum Research Inc. 29 October 2012. “Health of Democracy” http://www.forumresearch.com/forms/News%20Archives/News%20Releases/69825_Canada-wide_-_Health_of_Democracy_%28Forum_Research%29_%2820121029%29.pdf
Gathafi (Gaddafi), Muammar. 1976. The Green Book: The Solution of the Problem of Democracy: The Authority of the People (vol 1). Libya: People’s Committee.
Gallagher, Michael. 1991. “Proportionality, Disproportionality and Electoral Systems” Electoral Studies 10: 1, 33-51. http://www.tcd.ie/Political_Science/staff/michael_gallagher/ElectoralStudies1991.pdf
198
Gallagher, Michael. 1992. “Comparing Proportional Representation Electoral Systems: Quotas, Thresholds, Paradoxes and Majorities.” British Journal of Political Science 22, 469-496. http:// www.tcd.ie/Political_Science/staff/michael_gallagher/BJPS1992.pdf
Gallagher, Michael. 2013a. Election Indices dataset. http://www.tcd.ie/Political_Science/staff/michael_gallagher/ElSystems/Docts/ElectionIndices.pdf
Gallagher, Michael. 2013b. “Monotonicity and non-monotonicity at PR-STV elections” http://www.lancaster.ac.uk/fass/events/epop2013/docs/MGallagherMonotonicityEPOP13.pdf
Gallagher, Michael and Paul Mitchell (eds.). 2005. The Politics of Electoral Systems. Oxford and New York: Oxford University Press.
Golosov, Grigorii V. 2012. “Problems of the Russian Electoral System.” Russian Politics and Law 50, 3: 18-39.
Gordon, Larry. 2006. “Dubious Democracy: Report on Federal Elections in Canada from 1980-2004.” Toronto: Fair Vote Canada. http://www.fairvote.ca/wp-content/uploads/2013/06/Dubious-Democracy-Federal.pdf
Gouws, Amanda and Paul Mitchell. 2005. “South Africa: One Party Dominance Despite Perfect Proportionality” in Micahel Gallagher and Paul Mitchell (eds.) The Politics of Electoral Systems. Oxford and New York: 352-373.
Grofman, Bernard and Lijphart, Arend. 1984. Choosing an Electoral System: Issues and Alternatives. Westport and London: Praeger.
Grofman, Bernard and Lijphart, Arend. 1986. Electoral Laws and their Political Consequences. New York: Agathon Press, Inc.
Harper, Stephen and Flanagan, Tom. 1996. “Our Benign Dictatorship: Canada’s system of one-party plus rule has stunted democracy: two prominent Conservatives present ways for more representative government.”
Harrison, Trevor. 1995. Of Passionate Intensity: Right-Wing Populism and the Reform Party of Canada. Toronto: University of Toronto Press.
Heard, Andrew. 2013a. “Historical Voter Turnout in Canadian Federal Elections & Referenda,” Simon Fraser University. http://www.sfu.ca/~aheard/elections/historical-turnout.html
Heard, Andrew. 2013b. “2008 Election results by province,” Simon Fraser University. http://www.sfu.ca/~aheard/elections/2008-results.html
199
Heard, Andrew. 2013c. “2011 Canadian Election Results,” Simon Fraser University. http://www.sfu.ca/~aheard/elections/results.html
Hix, Simon, Ron Johnston, and Iain McLean. 2010. Choosing and Electoral System. The British Academy. http://www.britac.ac.uk/policy/choosing-electoral-system.cfm
Hoad, T. F. (ed.). 1986. The Concise Oxford Dictionary of English Etymology. Oxford: Clarendon Press.
Hobbes, Thomas. 2005 [1651]. Martinich, A. P. (ed.). Leviathan: Parts I and II. Peterborough: Broadview Press.
Hopkin, Jonathan. 2005. “Spain: Proportional Representation with Majoritarian Outcomes” in Micahel Gallagher and Paul Mitchell (eds.) The Politics of Electoral Systems, 375-394. Oxford and New York: Oxford University Press.
House of Commons Library (UK). 2008. Election Statistics: UK 1918-2007. http://www.parliament.uk/documents/commons/lib/research/rp2008/rp08-012.pdf
Ipsos Reid. 15 December 2008. “In Wake of Constitutional Crisis, New Survey Demonstrates that Canadians Lack Basic Understanding of our Country’s Parliamentary System: Half of Canadians (51%) Believe the Prime Minsiter is Directly Elected by Voters and Three in Four (75%) Don’t Know Who Canada’s Head of State Is.” http://www.dominion.ca/DominionInstituteDecember15Factum.pdf
International Institute for Democracy and Electoral Assistance (IDEA). 2008. Electoral System Design: The New International IDEA Handbook.
Inter-Parliamentary Union. 2013. “Women in national parliaments.” http://www.ipu.org/wmn-e/classif.htm
Irvine, William P. 1979. Does Canada Need A New Electoral System? Kingston: Institute of Intergovernmental Relations.
Jansen, Harold J. and Siaroff, Alan. 2004. "Regionalism and Party Systems: Evaluating Proposals to Reform Canada's Electoral System," In Henry Milner (ed.), Steps Toward Making Every Vote Count: Electoral System Reform in Canada and its Provinces. Peterborough: Broadview Press Ltd. 43-64.
Jansen, Harold J. 2004. “The Political Consequences of the Alternative Vote: Lessons from Western Canada” Canadian Journal of Political Science 37 (3) 647-669.
200
Jaspers, Karl. 1953. Michael Bullock (translator). The Origin and Goal of History. New Haven: Yale University Press.
Johnston, Larry. 2007. From Votes to Seats: Four Families of Electoral Systems. Toronto: Citizens' Assembly on Electoral Reform.
Kampen, Jarl K and Snijkers, Kris. 2003. “E-Democracy: A Critical Evaluation of the Ultimate E-Dream.” Social Science Computer Review 21: 491-496.
Katz, Richard S. 1997. Democracy and Elections. New York and Oxford: Oxford University Press.
Kelly, Richard. 2010. “Nowhere to Run, Nowhere to Hide? The 2010 General Election and the Defence of First-past-the-post.” The Political Quarterly, 82, 1.
Knight, Trevor. “Unconstitutional Democracy? A Charter Challenge to Canada’s Electoral System.” University of Toronto Faculty of Law Review 57, no. 1, Winter 1999: 1-42.
Lang-Dion, Raylene and Ann Wicks. “Equal Voice: Electing More Women in Canada.” Canadian Parliamentary Review, Spring 2007, 36-39. http://www.revparl.ca/30/1/30n1_07e_Wicks-Lang-Dion.pdf Law Commission of Canada. 2004. Voting Counts: Electoral Reform for Canada.
Law Commission of Canada. 2002. Renewing Democracy: Debating Electoral Reform in Canada.
Laycock, David (ed.). 2004. Representation and Democratic Theory. UBC Press, 2004.
Le Directeur Général des Élections du Québec. 2007a. “Les modalités d’un mode de scrutin mixte compensatoire: L’avis du Directeur général des élections” http://www.electionsquebec.qc.ca/documents/pdf/DGE-6360.pdf
Le Directeur Général des Élections du Québec. 2007b. “Les modalités d’un mode de scrutin mixte compensatoire: Le rapport du Directeur général des élections, Résume. http://www.electionsquebec.qc.ca/documents/pdf/Resume.pdf
Le Directeur Général des Élections du Québec. “Résultats officiels par parti politique pour l'ensemble des circonscriptions.” http://dgeq.qc.ca/francais/provincial/resultats-electoraux/elections-generales.php?e=18&s=2#s
Leduc, Lawrence. 2009. “The Failure of Electoral Reform Proposals in Canada” Political Science 61: 21.
201
LeDuc, Lawrence and Jon H. Pammett. 2003. “Explaining the Turnout Decline in Canadian Federal Elections: A New Survey of Non-voters.” Elections Canada. http://www.elections.ca/res/rec/part/tud/TurnoutDecline.pdf
Library of Parliament. 2011. “Parliaments” http://www.parl.gc.ca/parlinfo/Lists/Parliament.aspx
Lijphart, Arend. 1984. Democracies: Patterns of Majoritarian and Consensus Governments in Twenty One Countries. New Haven: Yale University Press.
Lijphart, Arend. 1984. “Trying to Have the Best of Both Worlds: Semi-Proportional and Mixed Systems” in Lijphart and Grofman (eds.) Choosing an Electoral System: Issues and Alternatives. New York: Praeger Publishers, 207-213.
Lijphart, Arend. 1986. “Degrees of Proportionality of Proportional Representation Formulas,” in Bernard Grofman and Arend Lijphart, eds., Electoral Laws and Their Political Consequences. New York: Agathon Press,
Lijphart, Arend. 1987. “The Demise of the Last Westminster System? Comments on the Report of New Zealand’s Royal Commission on the Electoral System,” Electoral Studies 6:2, 97-103.
Lijphart, Arend. 1994. Electoral Systems and Party Systems: A Study of Twenty-Seven Democracies 1945-1990. Oxford, New York, Toronto: Oxford University Press.
Lundberg, Thomas Carl. 2007. “Electoral System Reviews in New Zealand, Britain and Canada: A Critical Comparison.” Government and Opposition 42, 4, :471–490.
MacIvor, Heather. “Proportional and Semi-proportional Electoral Systems: Their Potential Effects on Canadian Politics” Electoral Insight, June 1999. http://www.elections.ca/res/eim/article_search/article.asp?id=115&lang=e&frmPageSize=
Manin, Bernard. 1997. Principles of Representative Government. Cambridge: Cambridge University Press.
Massicotte, Louis. 2004. “In search of a compensatory mixed electoral system for Québec.” Gouvernement du Québec. http://www.institutions-democratiques.gouv.qc.ca/publications/mode_scrutin_bref_en.pdf
Matland, Richard E. 2005. “Enhancing Women’s Political Participation: Legislative Recruitment and Electoral Systems.” in Women in Parliament: Beyond Numbers, revised ed. Stockholm: IDEA, 93-111. http://www.idea.int/publications/wip2/upload3._Enhancing_Women's_Political_Participation.pdf
202
McDonald, Lynn. 2013. “Proportional Representation and the Democratic Deficit in Canada.” http://electoralalliance.ca/proportional-representation-and-democratic-deficit-canada
Mcleay, Elizabeth and Jack Vowles. 2007. “Redefining Constituency Representation: the Roles of New Zealand MPs Under MMP.” Regional and Federal Studies 17, 1: 71–95.
Mill, John Stuart. [1861] 2010. Considerations on Representative Government. Memphis: General Books.
Miller, Nicholas R. 2007. “The butterfly effect under STV.” Electoral Studies 26: 503-506. doi: 10.1016/j.electstud.2006.10.016
Milner, Henry (ed.). 1999. Making Every Vote Count: Reassessing Canada's Electoral System, Peterborough: Broadview Press, Ltd. Milner, Henry. 2004. Steps Toward Making Every Vote Count: Electoral System Reform in Canada and its Provinces, Peterborough: Broadview Press, Ltd.
Milner, Henry. 12 October 2007. “MMP doomed from start: Wary voters opt to keep status quo,” The Star. http://www.thestar.com/opinion/2007/10/12/mmp_doomed_from_start.html
Ministry of Justice Finland 2007. “Parliamentary Elections 18.3.2007.” http://192.49.229.35/E2007/e/tulos/tulos_kokomaa.html
Ministry of Justice Finland 2010. “Finnish Electoral System.” http://oikeusministerio.fi/material/attachments/om/julkaisut/6Fioq3rxv OMTH_72_2010_Finnish_Election_System__Overview_32_s.pdf
Ministry of Justice Finland. 2011. “Parliamentary Elections 17.4.2011.” http://192.49.229.35/E2011/e/tulos/tulos_kokomaa.html
Montanaro, Laura. 2012. “The Democratic Legitimacy of Self-Appointed Representatives.” The Journal of Politics, 74, 4: 1094-1107.
National Post. 20 October 2011. “Muammar Gaddafi killed as Libyan forces seize Sirte.” http://news.nationalpost.com/2011/10/20/muammar-gaddafi-killed-as-libyan-forces-seize-sirte/
Newman, Gerard. 1989. Bennett, Scott. 2006(revised). “Electoral Systems.” Parliament of Australia. http://www.aec.gov.au/Voting/files/electoral_voting_systems_research.pdf
NO-STV. 2009. “Questions and Answers.” http://www.nostv.org/faq.html
203
Ontario Citizens’ Assembly on Electoral Reform. 2007. “One Ballot, Two Votes: A new way to vote in Ontario: Recommendation of the Ontario Citizens’ Assembly on Electoral Reform, May 15, 2007.”
Orphaned Voter. 2013a. “What if we had the Alternative Vote in the last election?” http://www.orphanedvoter.ca/2011/05/06/what-if-we-had-the-alternative-vote-in-the-last-election/
Orphaned Voter 2013b. “Interactive Tool.” http://www.orphanedvoter.ca/interactive-tool/
Parliament of Canada. 2013. “Electoral Results by Party.” <http://www2.parl.gc.ca/Parlinfo/Compilations/ElectionsAndRidings/ResultsParty.aspx>
Pilon, Dennis. 1999. “Canada’s Democratic Deficit: Is Proportional Representation the Answer?” The CSJ Foundation for Research and Education. http://www.socialjustice.org/uploads/pubs/CanadasDemocraticDeficit.pdf
Pilon, Dennis. 2010. “The 2005 and 2009 Referenda on Voting System Change in British Columbia.” Canadian Political Science Review 4 (2-3): 73-89. http://ojs.unbc.ca/index.php/cpsr/article/view/251/301
Pitkin, Hannah. 1972. The Concept of Representation. Berkeley: University of California Press.
Rae, Douglas. 1967. The Political Consequences of Electoral Laws. New Haven and London: Yale University Press.
Rahat, Gideon and Reuven Y. Hazan. 2005. “Israel: The Politics of an Extreme Electoral System” in Michael Gallagher and Paul Mitchell (eds.) The Politics of Electoral Systems. Oxford and New York: Oxford University Press, 333-351.
Raunio, Tapio. 2005. “Finland: One Hundred Years of Quietude” in Micahel Gallagher and Paul Mitchell (eds.) The Politics of Electoral Systems. Oxford and New York: 473-489.
Rebick, Judy. “PR can help solve Canada’s Democracy Deficit.” Policy Options, July-August 2001, 15-16. http://www.irpp.org/po/archive/jul01/rebick.pdf
Rehfeld, Andrew. 2005. The Concept of Constituency: Political Representation, Democratic Legitimacy, and Institutional Design. Cambridge and New York: Cambridge University Press.
Reilly, Benjamin. 2001. Democracy in Divided Societies: Electoral Engineering for Conflict Management, Cambridge: Cambridge University Press.
204
Reilly, Benjamin. 2002. “Back to the Future? The Political Consequences of Electoral Reform in Papua New Guinea.” The Journal of Pacific History, 37, 2: 239-253.
Reed, Steven R. 2005. “Japan: Haltingly Toward a Two-Party System.” in The Politics of Electoral Systems, Michael Gallagher and Paul Mitchell (eds.), 277-294. Oxford and New York: Oxford University Press.
Reeve, Andrew and Ware, Alan. 1992. Electoral Systems: A Comparative and Theoretical Introduction. London and New York: Routledge.
Rettie, Darla and Schwartz, Bryan. 2002. “Valuing Canadians: the options for voting system reform in Canada.” http://dsp-psd.pwgsc.gc.ca/collection_2007/lcc-cdc/JL2-36-2002E.pdf
Rousseau, Jean-Jacques. 1987 [1762]. Cress, Donald A. (translator). “On the Social Contract,” in Jean-Jacques Rousseau: The Basic Political Writings, 141-227. Indianapolis: Hackett Publishing Company, Inc.
Royal Commission on Systems of Election. 1910. Report of the Royal Commission appointed to enquire into Electoral Systems, Presented to Parliament by Command of His Majesty. London: Eyre and Spottiswoode, Ltd., Printers to the King’s Most Excellent Majesty.
Russell, Peter H. 2008. Two Cheers for Minority Government: The Evolution of Canadian Parliamentary Democracy. Toronto: Edmond Montgomery Publications Limited.
Samara. 2012. Samara Democracy Report #4: “Who’s the Boss?: Canadians’ Views on their Democracy.” http://www.samaracanada.com/docs/default-document-library/sam_whostheboss.pdf
Samara. 2013. “About Us.” http://www.samaracanada.com/about-us/about-us
Samath, Feizal. 4 March 2010. “Sri Lanka’s elections likely to produce just one winner.” The National [UAE]. http://www.thenational.ae/news/world/asia-pacific/sri-lankas-elections-likely-to-produce-just-one-winner
Sartori, Giovanni. 1987. The Theory of Democracy Revisited. New Jersey: Chatham House Publishers, Inc.
Seitz, Brian. 1995. The Trace of Political Representation. Albany: State University of New York Press.
Siddiqui, Haroon. 20 December 2009. “Siddiqui: Harper acting like an elected dictator: Stephen Harper is defying Parliament and centralizing power in the PMO on an unprecedented
205
scale.” http://www.thestar.com/opinion/2009/12/20 siddiqui_harper_acting_like_an_elected_dictator.html
Shugart, Matthew Søberg. 2005. “Comparative Electoral Systems Research: The Maturation of a Field and New Challenges Ahead” in Gallagher and Mitchell (eds.) The Politics of Electoral Systems, 25-55. Oxford and New York: Oxford University Press.
Shugart, Matthew Søberg and Martin P. Wattenberg (eds.). 2003. Mixed-Member Electoral Systems: The Best of Both Worlds? New York: Oxford University Press.
Shugart, Matthew Søberg and Rein Taagepera. 1989. Seats and Votes: The Effects and Determinants of Electoral Systems. New Haven and London: Yale University Press.
Shumpeter, Joseph. 1976. Capitalism, Socialism and Democracy. London: Allen and Unwin.
Somerville, Peter. 2011. “Democracy and Participation”. The Policy Press 39: 3, 417-37.
Taagepera, Rein and Grofman, Bernard. 1985. “Rethinking Duverger’s Law: Predicting the Effective Number of Parties in Plurality and PR Systems —Parties Minus Issues Equals One,” European Journal of Political Research 13: 341-352.
The Independent. 13 March 2011. “David Owen: I support a PR system, but I will be voting ‘no’ in the AV referendum.” http://www.independent.co.uk/voices/commentators/david-owen-i-support-a-pr-system-but-i-will-be-voting-lsquonorsquo-in-the-av-referendum-2240525.html
The Jenkins Commission (The Independent Commission on the Voting System). 1998. “The report of the Independent Commission on the Voting System.” The Stationary Office. http://www.archive.official-documents.co.uk/document/cm40/4090/chap-6.htm
The Telegraph. 17 February 2012. “Syrians brave backlash to rally against Assad.” http://www.telegraph.co.uk/news/worldnews/middleeast/syria/9089124/Syrians-brave-backlash-to-rally-against-Assad.html
The Times. 22 October 2011. “Gaddafi ‘shot with his own golden pistol.” http://www.thetimes.co.uk/tto/news/world/middleeast/article3203048.eceThomas, Paul. 2006. A Working Minority? What the minority government of the 38th Parliament can teach about proposals for electoral reform. Ottawa: Institute on Governance.
Tideman, Nicolaus and Daniel Richardson. 2000. “Better Voting Methods through Technology: The Refinement-Manageability Trade-Off in the Single-Transferable Vote.” Public Choice 103, 1: 13-34.
206
Trefs, Matthias. 2003. “Voter Confusion in German Federal Elections: The Baden-Württemberg Electoral System as a Possible Alternative.” German Politics 12, 3: 82-106. DOI:10.1080/0964400032000242707
Trudeau, Justin. February 2, 2013. “Democratic Reform: Trusting Canadians.” https://justin.ca/democratic-reform-trusting-canadians/
Van der Hout, Eliora, Harrie de Swart, and Annemarie ter Veer. “Characteristic properties of list proportional representation systems.” Social Choice Welfare 27: 459-475. DOI 10.1007/s00355-006-0103-5
Vowles, Jack. 1995. “The Politics of Electoral Reform in New Zealand.” International Political Science Review 16, 1: 95-115. http://www.jstor.org/stable/1601171 .
Vowles, Jack. 2005. New Zealand: The Consolidation of Reform?” in Gallagher and Mitchell, The Politics of Electoral Systems, 295-312. Oxford and New York: Oxford University Press.
Wessels, Bernhard. 2011. “Performance and deficits of present-day representation.” in Sonia Alonso, John Keane, and Wolfgang Merkel (eds.), The Future of Representative Democracy: 96-123. New York: Cambridge University Press.
Wilson, Margaret. 2011. “Electoral Reform in the United Kingdom: Lessons from New Zealand.” The Round Table 100: 416, 509-517. http://dx.doi.org/10.1080/00358533.2011.609691
Wherry, Aaron. “Garneau endorses a ranked ballot.” Maclean’s: January 17, 2013. http://www2.macleans.ca/2013/01/17/garneau-endorses-a-ranked-ballot/
Zakaras, Alex. 2010. “Lot and Democratic Representation: A Modest Proposal.” Constellations 17, 3: 455-471.
207
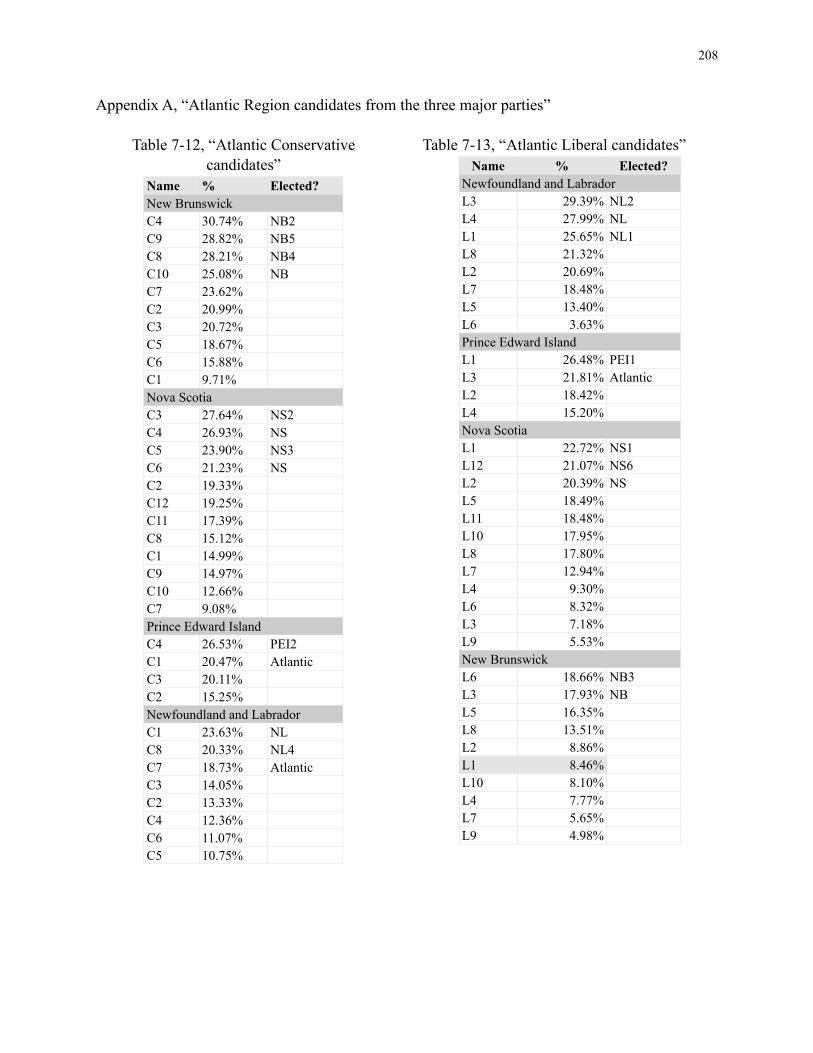
Appendix A, “Atlantic Region candidates from the three major parties”
Table 7-12, “Atlantic Conservative candidates”
Name % Elected?New BrunswickNew BrunswickNew BrunswickC4 30.74% NB2C9 28.82% NB5C8 28.21% NB4C10 25.08% NB C7 23.62%C2 20.99%C3 20.72%C5 18.67%C6 15.88%C1 9.71%Nova ScotiaNova ScotiaNova ScotiaC3 27.64% NS2C4 26.93% NSC5 23.90% NS3C6 21.23% NSC2 19.33%C12 19.25%C11 17.39%C8 15.12%C1 14.99%C9 14.97%C10 12.66%C7 9.08%Prince Edward IslandPrince Edward IslandPrince Edward IslandC4 26.53% PEI2C1 20.47% AtlanticC3 20.11%C2 15.25%Newfoundland and LabradorNewfoundland and LabradorNewfoundland and LabradorC1 23.63% NLC8 20.33% NL4C7 18.73% AtlanticC3 14.05%C2 13.33%C4 12.36%C6 11.07%C5 10.75%
Table 7-13, “Atlantic Liberal candidates”Name % Elected?
Newfoundland and LabradorNewfoundland and LabradorNewfoundland and LabradorL3 29.39% NL2L4 27.99% NLL1 25.65% NL1L8 21.32%L2 20.69%L7 18.48%L5 13.40%L6 3.63%Prince Edward IslandPrince Edward IslandPrince Edward IslandL1 26.48% PEI1L3 21.81% AtlanticL2 18.42%L4 15.20%Nova ScotiaNova ScotiaNova ScotiaL1 22.72% NS1L12 21.07% NS6L2 20.39% NSL5 18.49%L11 18.48%L10 17.95%L8 17.80%L7 12.94%L4 9.30%L6 8.32%L3 7.18%L9 5.53%New BrunswickNew BrunswickNew BrunswickL6 18.66% NB3L3 17.93% NBL5 16.35%L8 13.51%L2 8.86%L1 8.46%L10 8.10%L4 7.77%L7 5.65%L9 4.98%
208
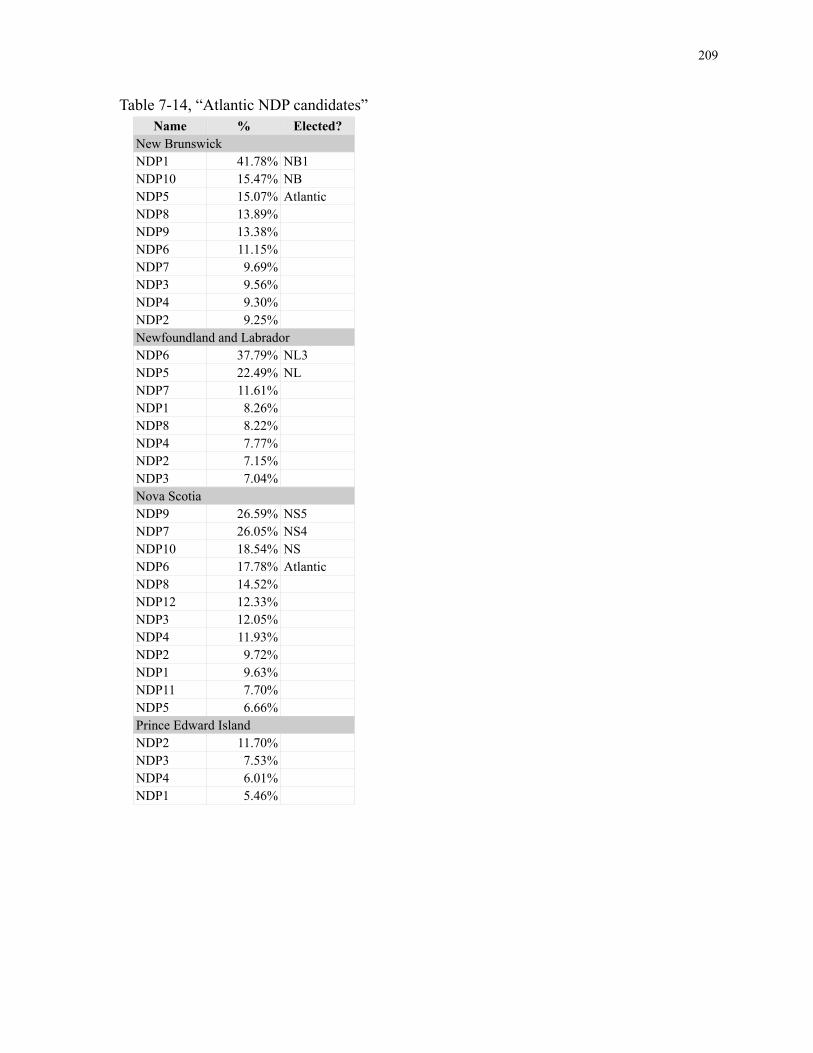
Table 7-14, “Atlantic NDP candidates”Name % Elected?
New BrunswickNew BrunswickNew BrunswickNDP1 41.78% NB1NDP10 15.47% NBNDP5 15.07% AtlanticNDP8 13.89%NDP9 13.38%NDP6 11.15%NDP7 9.69%NDP3 9.56%NDP4 9.30%NDP2 9.25%Newfoundland and LabradorNewfoundland and LabradorNewfoundland and LabradorNDP6 37.79% NL3NDP5 22.49% NLNDP7 11.61%NDP1 8.26%NDP8 8.22%NDP4 7.77%NDP2 7.15%NDP3 7.04%Nova ScotiaNova ScotiaNova ScotiaNDP9 26.59% NS5NDP7 26.05% NS4NDP10 18.54% NSNDP6 17.78% AtlanticNDP8 14.52%NDP12 12.33%NDP3 12.05%NDP4 11.93%NDP2 9.72%NDP1 9.63%NDP11 7.70%NDP5 6.66%Prince Edward IslandPrince Edward IslandPrince Edward IslandNDP2 11.70%NDP3 7.53%NDP4 6.01%NDP1 5.46%
209
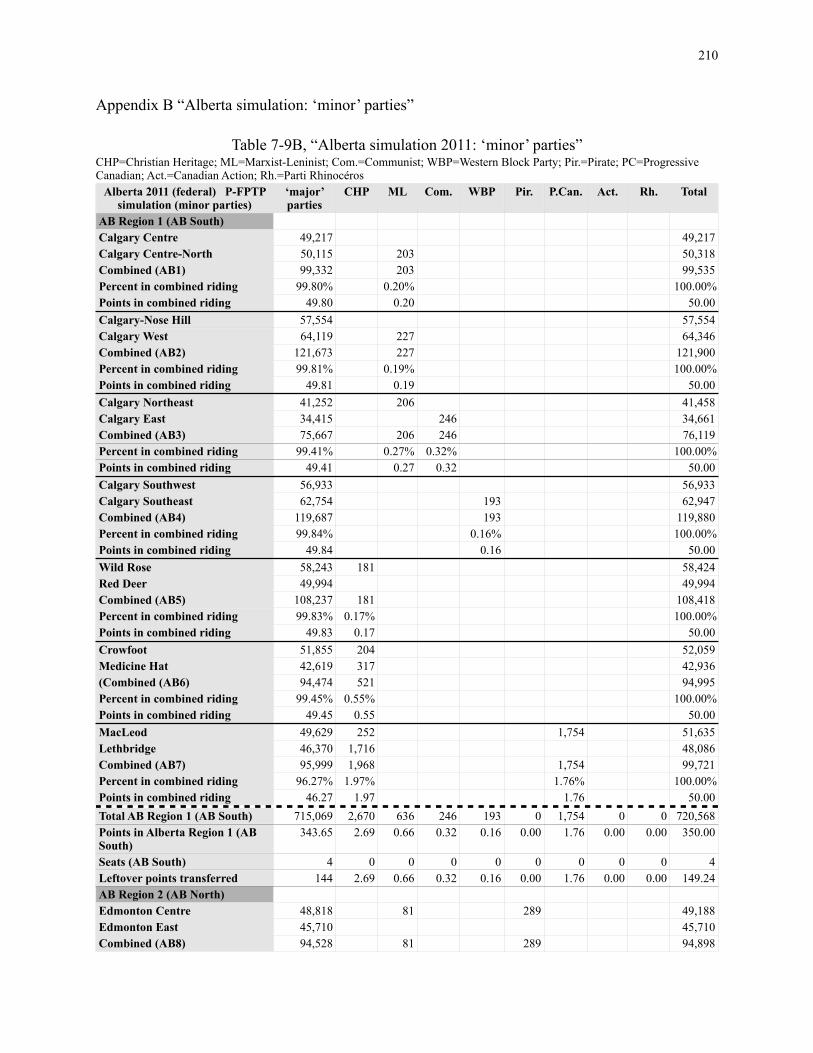
Appendix B “Alberta simulation: ‘minor’ parties”
Table 7-9B, “Alberta simulation 2011: ‘minor’ parties”CHP=Christian Heritage; ML=Marxist-Leninist; Com.=Communist; WBP=Western Block Party; Pir.=Pirate; PC=Progressive Canadian; Act.=Canadian Action; Rh.=Parti Rhinocéros
Alberta 2011 (federal) P-FPTP simulation (minor parties)
‘major’ parties
CHP ML Com. WBP Pir. P.Can. Act. Rh. Total
AB Region 1 (AB South)Calgary CentreCalgary Centre-NorthCombined (AB1)Percent in combined ridingPoints in combined ridingCalgary-Nose HillCalgary WestCombined (AB2)Percent in combined ridingPoints in combined ridingCalgary NortheastCalgary EastCombined (AB3)Percent in combined ridingPoints in combined ridingCalgary SouthwestCalgary SoutheastCombined (AB4)Percent in combined ridingPoints in combined ridingWild RoseRed DeerCombined (AB5)Percent in combined ridingPoints in combined ridingCrowfootMedicine Hat(Combined (AB6)Percent in combined ridingPoints in combined ridingMacLeodLethbridgeCombined (AB7)Percent in combined ridingPoints in combined ridingTotal AB Region 1 (AB South)Points in Alberta Region 1 (AB South)Seats (AB South)Leftover points transferredAB Region 2 (AB North)Edmonton CentreEdmonton EastCombined (AB8)
49,217 49,21750,115 203 50,31899,332 203 99,535
99.80% 0.20% 100.00%49.80 0.20 50.00
57,554 57,55464,119 227 64,346
121,673 227 121,90099.81% 0.19% 100.00%
49.81 0.19 50.0041,252 206 41,45834,415 246 34,66175,667 206 246 76,119
99.41% 0.27% 0.32% 100.00%49.41 0.27 0.32 50.00
56,933 56,93362,754 193 62,947
119,687 193 119,88099.84% 0.16% 100.00%
49.84 0.16 50.0058,243 181 58,42449,994 49,994
108,237 181 108,41899.83% 0.17% 100.00%
49.83 0.17 50.0051,855 204 52,05942,619 317 42,93694,474 521 94,995
99.45% 0.55% 100.00%49.45 0.55 50.00
49,629 252 1,754 51,63546,370 1,716 48,08695,999 1,968 1,754 99,721
96.27% 1.97% 1.76% 100.00%46.27 1.97 1.76 50.00
715,069 2,670 636 246 193 0 1,754 0 0 720,568343.65 2.69 0.66 0.32 0.16 0.00 1.76 0.00 0.00 350.00
4 0 0 0 0 0 0 0 0 4144 2.69 0.66 0.32 0.16 0.00 1.76 0.00 0.00 149.24
48,818 81 289 49,18845,710 45,71094,528 81 289 94,898
210
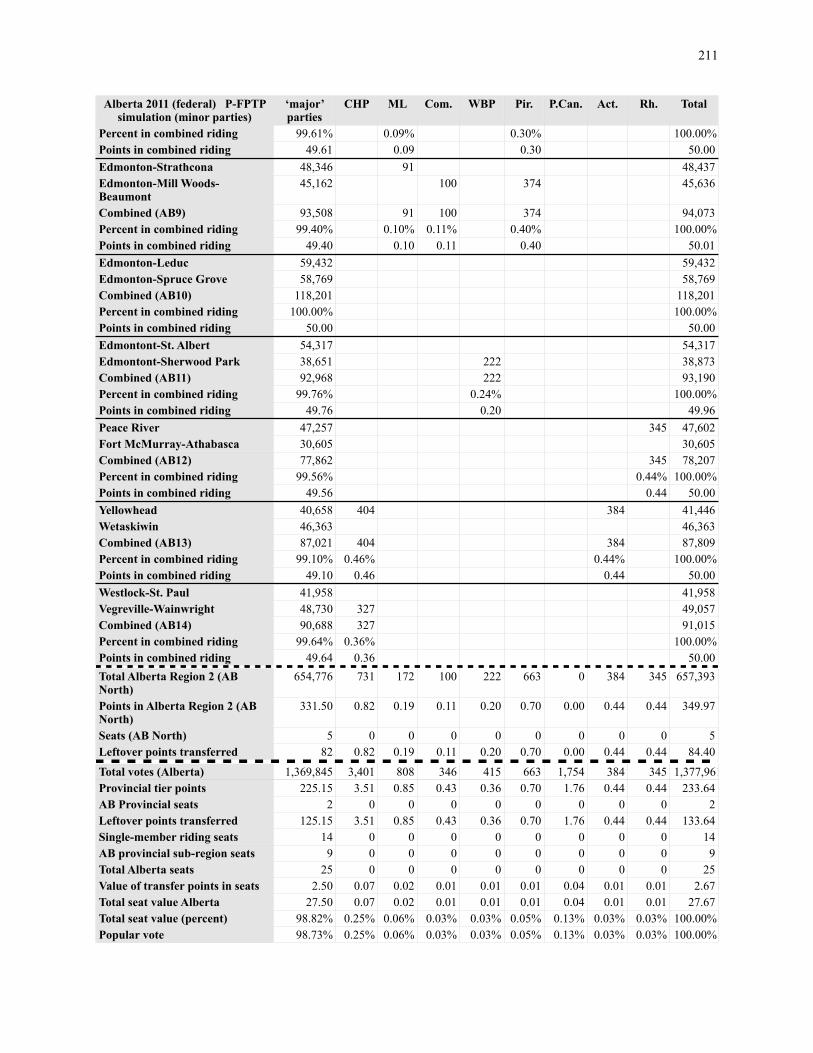
Alberta 2011 (federal) P-FPTP simulation (minor parties)
‘major’ parties
CHP ML Com. WBP Pir. P.Can. Act. Rh. Total
Percent in combined ridingPoints in combined ridingEdmonton-StrathconaEdmonton-Mill Woods-BeaumontCombined (AB9)Percent in combined ridingPoints in combined ridingEdmonton-LeducEdmonton-Spruce GroveCombined (AB10)Percent in combined ridingPoints in combined ridingEdmontont-St. AlbertEdmontont-Sherwood ParkCombined (AB11)Percent in combined ridingPoints in combined ridingPeace RiverFort McMurray-AthabascaCombined (AB12)Percent in combined ridingPoints in combined ridingYellowheadWetaskiwinCombined (AB13)Percent in combined ridingPoints in combined ridingWestlock-St. PaulVegreville-WainwrightCombined (AB14)Percent in combined ridingPoints in combined ridingTotal Alberta Region 2 (AB North)Points in Alberta Region 2 (AB North)Seats (AB North)Leftover points transferred
Total votes (Alberta)Provincial tier pointsAB Provincial seatsLeftover points transferredSingle-member riding seats AB provincial sub-region seatsTotal Alberta seatsValue of transfer points in seatsTotal seat value AlbertaTotal seat value (percent)Popular vote
99.61% 0.09% 0.30% 100.00%49.61 0.09 0.30 50.00
48,346 91 48,43745,162 100 374 45,636
93,508 91 100 374 94,07399.40% 0.10% 0.11% 0.40% 100.00%
49.40 0.10 0.11 0.40 50.0159,432 59,43258,769 58,769
118,201 118,201100.00% 100.00%
50.00 50.0054,317 54,31738,651 222 38,87392,968 222 93,190
99.76% 0.24% 100.00%49.76 0.20 49.96
47,257 345 47,60230,605 30,60577,862 345 78,207
99.56% 0.44% 100.00%49.56 0.44 50.00
40,658 404 384 41,44646,363 46,36387,021 404 384 87,809
99.10% 0.46% 0.44% 100.00%49.10 0.46 0.44 50.00
41,958 41,95848,730 327 49,05790,688 327 91,015
99.64% 0.36% 100.00%49.64 0.36 50.00
654,776 731 172 100 222 663 0 384 345 657,393
331.50 0.82 0.19 0.11 0.20 0.70 0.00 0.44 0.44 349.97
5 0 0 0 0 0 0 0 0 582 0.82 0.19 0.11 0.20 0.70 0.00 0.44 0.44 84.40
1,369,845 3,401 808 346 415 663 1,754 384 345 1,377,961225.15 3.51 0.85 0.43 0.36 0.70 1.76 0.44 0.44 233.64
2 0 0 0 0 0 0 0 0 2125.15 3.51 0.85 0.43 0.36 0.70 1.76 0.44 0.44 133.64
14 0 0 0 0 0 0 0 0 149 0 0 0 0 0 0 0 0 9
25 0 0 0 0 0 0 0 0 252.50 0.07 0.02 0.01 0.01 0.01 0.04 0.01 0.01 2.67
27.50 0.07 0.02 0.01 0.01 0.01 0.04 0.01 0.01 27.6798.82% 0.25% 0.06% 0.03% 0.03% 0.05% 0.13% 0.03% 0.03% 100.00%98.73% 0.25% 0.06% 0.03% 0.03% 0.05% 0.13% 0.03% 0.03% 100.00%
211
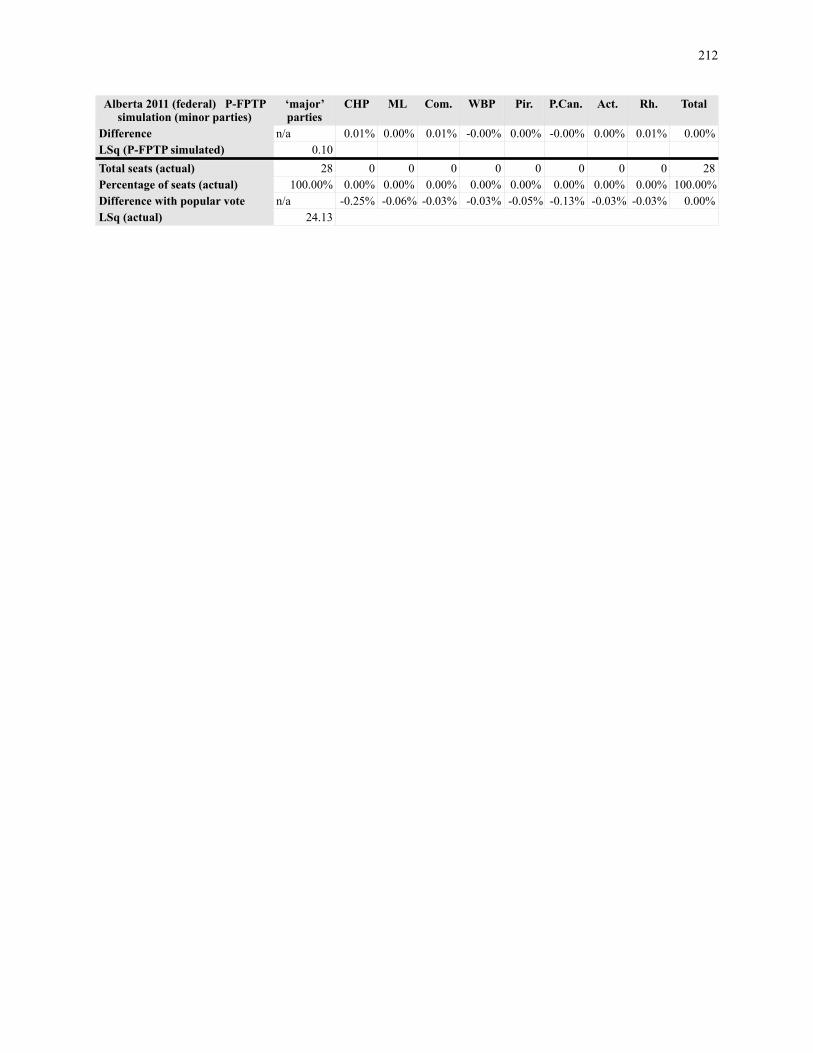
Alberta 2011 (federal) P-FPTP simulation (minor parties)
‘major’ parties
CHP ML Com. WBP Pir. P.Can. Act. Rh. Total
DifferenceLSq (P-FPTP simulated)Total seats (actual)Percentage of seats (actual)Difference with popular voteLSq (actual)
n/a 0.01% 0.00% 0.01% -0.00% 0.00% -0.00% 0.00% 0.01% 0.00%0.10
28 0 0 0 0 0 0 0 0 28100.00% 0.00% 0.00% 0.00% 0.00% 0.00% 0.00% 0.00% 0.00% 100.00%
n/a -0.25% -0.06% -0.03% -0.03% -0.05% -0.13% -0.03% -0.03% 0.00%24.13
212


