Embed Size (px)
Citation preview

Pulmonary involvement in ankylosing spondylitis assessed by multidetector computed tomographyRuken Yuksekkaya1
ABCDEFG, Ferdag Almus1ABCDEF, Fatih Celıkyay1
ABF, Serhat Celıkel2BDE, Ahmet Inanır1,3
BE, Eda Almus1BF, Zafer Ozmen1
F
1 Department of Radiology, Gaziosmanpasa University School of Medicine, Tokat, Turkey2 Department of Chest Disease, Gaziosmanpasa University School of Medicine, Tokat, Turkey3 Department of Physical Medicine and Rehabilitation, Gaziosmanpasa University School of Medicine, Tokat, Turkey
Author’s address: Ruken Yuksekkaya, Department of Radiology, Gaziosmanpasa University School of Medicine, Tokat, Turkey, e-mail: [email protected]
Summary Background: Ankylosing spondylitis (AS) may present with extra-articular involvement in the lungs. We aimed
to evaluate the abnormal pulmonary multidetector computed tomography findings of patients with AS and compare them with the clinical symptoms, duration of illness, laboratory results and pulmonary function tests (PFT).
Material/Methods: We evaluated the chest multidetector computed tomography (MDCT) findings of 41 patients with ankylosing spondylitis (AS) and compared them with pulmonary function test (PFT) results, demographic characteristics, duration of illness and laboratory findings that we were able to obtain.
Results: The most common abnormalities were nodules, peribronchial thickening, pleural thickening and bronchiectasis. Abnormalities occurred in 96.87% of patients in the early AS group and 77.8% of patients in the late AS group. Patients with early AS included asymptomatic individuals with normal PFT results and abnormal MDCT findings.
Conclusions: The use of MDCT in AS patients may be beneficial for the evaluation of pulmonary disease, even in asymptomatic patients without any PFT abnormalities and those in the early stages of the disease.
Keywords: Ankylosing Spondylitis • Pulmonary • Multidetector Computed Tomography
PDF fi le: http://www.polradiol.com/download/index/idArt/889850
Received: 2013.10.01 Accepted: 2013.12.06 Published: 2014.06.23
Background
Ankylosing spondylitis (AS) is a chronic inflammatory dis-ease characterized by entheseal involvement. The disease mainly affects the axial skeleton, with the most common location being the sacroiliac joints; however, sometimes peripheral joints are also involved. It may also present with extra-articular involvement in the lungs, kidneys, eyes, aorta and heart [1]. Ankylosing spondylitis can affect tra-cheobronchial tree, pulmonary parenchyma, and pleura; however its thoracic manifestations are usually asymp-tomatic [2]. The most common abnormal thoracic radio-logical findings of AS include apical fibrosis, emphysema, pleural involvement, nonspecific linear parenchymal opaci-ties, lymphadenopathy, bronchiectasis, bronchial wall
thickening, tracheal dilatation, mosaic patterns, subpleural nodules and interstitial lung disease [3–6].
The purpose of this study was to evaluate the abnormal pulmonary multidetector computed tomography (MDCT) findings in patients with AS and compare them with the clinical symptoms, duration of illness, laboratory results and pulmonary function tests (PFTs).
Material and Methods
Study population
We retrospectively reviewed the chest MDCT scans of 41 consecutive patients with AS, between 2004 and
Authors’ Contribution: A Study Design B Data Collection C Statistical Analysis D Data Interpretation E Manuscript Preparation F Literature Search G Funds Collection
O R I G I N A L A R T I C L E
Signature: © Pol J Radiol, 2014; 79: 156-163DOI: 10.12659/PJR.889850
156

2012, who were monitored at the Physical Medicine and Rehabilitation and Radiology departments of our facility. These patients had fulfilled the modified New York criteria [7] and had undergone chest MDCT scans before the medi-cal treatment or due to their pulmonary symptoms and abnormal chest radiograms. The local ethics committee approved this retrospective review of patient records and MDCT scans.
The clinical data obtained from the hospital information system included the following items: age at AS onset, dura-tion of disease, exposure to asbestos, history of smoking, respiratory symptoms (dyspnea, cough, wheezing, sputum, fever and hemoptysis) and medical treatment (if any) at the time of examination. Furthermore, the results of labora-tory tests performed within 2 months or at the time of CT examination were obtained. They included erythrocyte sed-imentation rate (ESR) (mm/h) and C-reactive protein (CRP) levels (mg/L). The reference range at our laboratory was 0–5 mm/hr for ESR and 5.6–18.6 mg/L for CRP.
MDCT scanning
Multidetector CT protocols were applied with the patients in the dorsal decubitus position, during maximum inspira-tion, by using an 8-channel MDCT system (GE Healthcare, Milwaukee, WI, USA). Patients had either a chest CT (n=27), a high-resolution chest CT (HRCT) (n=8), or both (n=6). Contiguous axial slices of contrast-enhanced chest CT scans were obtained at 5 mm intervals, with 5 mm colimation, 120 Kvp, and an automatic tube modulation at 120 to 225 mA. The HRCT was at 10 mm intervals, with 1mm colima-tion, 120 Kvp, and an automatic tube modulation of 400 mA. All images were obtained at window levels appropriate for lung parenchyma (window width 1,500–1,700 HU; win-dow level –600 or –700 HU) and the mediastinum (window width 250–400 HU; window level 40–50 HU). The images were reconstructed using a high-resolution algorithm.
Radiological assessment
Data retrieval and analysis were performed using a patient archive and the GE Centricity™ Picture Archiving and Communication System (PACS) RA 1000 Workstation (GE Healthcare, Milwaukee, WI, USA). All examinations were assessed with the simultaneous consensus of a radiologist experienced in thoracic radiology and a radiology resident with 3 years of experience, both of whom were blinded in terms of the patients’ clinical information and PFT results. However, they were informed about the presence of AS.
Each examination result was scored based on the presence or absence of thoracic cage asymmetry, kyphosis, empye-ma, pneumothorax, pleural effusion and pleural thickening. In addition, the presence and extent of air space consoli-dation, ground glass opacity, apical fibrosis, peribronchial thickening, honeycombing, nodules, reticulation (inter-lobular and intralobular septal thickening), emphysema, bullae, bronchiectasis and/or bronchiolectasis, crazy-pav-ing appearance (ground glass opacity with reticulations), tree-in-bud appearance, air trapping, architectural distor-tion, and parenchymal bands were recorded. These find-ings were graded using the following 3-point scale within
the entire lung: grade 1 – localized involvement affecting one bronchopulmonary lobe; grade 2 – extensive involve-ment affecting more than one bronchopulmonary lobe in one lung; and grade 3 – involvement of both lungs. Various types of bronchiectasis, such as cylindrical, cystic and trac-tional were also noted. The nodules were separated into 3 groups according to their size: micronodules (<3 mm in diameter), small nodules (3–10 mm in diameter) and large nodules (>10 mm in diameter). Their distribution was recorded as either centrilobular or another type. The pres-ence of esophageal dilatation and mediastinal lymphade-nopathy was also documented. A lymph node was consid-ered enlarged when its short axis was ≥10 mm [8]. Enlarged lymph nodes were distributed within one (group 1) or mul-tiple (group 2) locations, and the diameter of the largest lymph node was noted. Additionally, the widest diameter of the pulmonary trunk perpendicular to the long axis was measured, with the upper limit accepted as 30 mm. A CT examination was regarded as abnormal if there was pres-ence of at least one of the criteria mentioned above.
A comparison was also made between patients with dis-ease duration of ≤10 years (early) and patients with disease duration of ≥10 years (late) based on CT findings.
Pulmonary function tests
Pulmonary function was assessed by spirometry within 2 weeks of their CT examinations. The observed values and percentages of forced vital capacity (FVC), forced expira-tory volume in 1 second (FEV1) and FEV1/FVC ratio were then determined.
The PFT results were categorized as follows:(a) normal = FEV1/FVC >70% and FVC >80%;(b) restrictive pattern = FEV1/FVC >70% and FVC <80%;(c) obstructive pattern = FEV1/FVC <70% and FVC >80%;(d) mixed pattern = FEV1/FVC <70% and FVC <80%.
Statistical analysis
Continuous data was expressed as mean ± standard devia-tion (SD) and categorical data as numbers with related per-centages (n, %). Differences in continuous data were ana-lyzed using Student’s test and categorical data was com-pared using chi-square test. A two-tailed p value of <0.05 was considered to be statistically significant. The correlation between abnormal CT findings, their grade and age, along with clinical findings, results of the PFTs, ESR and CRP were analyzed with a nonparametric test (Spearman’s rank cor-relation coefficient). A correlation was considered to be pre-sent when the p value for the difference was <0.05. All sta-tistical analyses were performed using the SPSS version 15.0 for Windows software package (SPSS Inc., Chicago, IL, USA).
Results
Demographic characteristics of patients
The study group consisted of 30 men (73.2%) rang-ing from 29 to 74 years of age (mean 45.67±12.073) and 11 women (26.8%) between the ages of 28 and 67 (mean 44.82±11.746). The mean age of the entire study group was
© Pol J Radiol, 2014; 79: 156-163 Yuksekkaya R. et la. – Pulmonary involvement in ankylosing spondylitis…
157

AS (N=41) (%)
Gender (males/females) 30/11 (73.2–26.8%)
Age (years) (mean ±SD) 45.44 ±11.84
Tobacco use, n (%) 19 (46.3%)
Asbestos exposure, n (%) 1 (2.4%)
Mean age at diagnosis (years) 40.56±13.20
The patients with ≤10 years of disease duration 32 (78.04%)
Table 1. Demographic and baseline characteristics of the study group.
AS – ankylosing spondylitis.
AS (N=41)
Cough, n (%) 11 (26.8%)
Dyspnea, n (%) 11 (26.8%)
Sputum, n (%) 10 (24.4%)
Wheezing, n (%) 1 (2.4%)
Fever, n (%) 4 (9.8%)
Hemoptysis, n (%) 0 (0.0%)
Drug use, n (%) 34 (82.9%)
Table 2. Clinical characteristics and previous medical history of the study group.
AS – ankylosing spondylitis.
CT findings N (%) Extent of CT findings (grade) (%)
Consolidation, n (%) 1 (2.4%) 3 (100%)
Ground glass opacity, n (%) 5 (12.2%) 1 (60%), 2 (40%)
Apikal fibrozis, n (%) 17 (41.5%) 2 (11.8%), 15 (88.2%)
Thoracic cage asymetry, n (%) 3 (7.3%) 3 (100%)
Peribronchial thickening, n (%) 29 (70.7%) 3 (3.4%), 3 (96.6%)
Honeycombing, n (%) 1 (2.4%) 3 (100%)
Nodule, n (%) 34 (82.9%) 1 (5.9%), 3 (94.1)
Reticulation, n (%) 4 (9.8%) 2 (25%), 3 (75%)
Emphysema, n (%) 9 (22.0%) 3 (100%)
Bullae, n (%) 7 (17.1%) 1 (28.6%), 2 (14.3%), 3 (57.1%)
Bronchiectasis, n (%) 21 (51.2%) 2 (4.8%), 3 (95.2%)
Air trapping, n (%) 6 (14.6%) 2 (33.3%), 3 (66.7%)
Architectural distorsion, n (%) 5 (12.2%) 2 (20%), 3 (80%)
Parenchymal bands, n (%) 4 (9.8%) 1 (50%), 2 (25%), 3 (25%)
Pleural effusion, n (%) 2 (4.9%)
Pleural thickening, n (%) 24 (58.5%)
Perikardial thickening, n (%) 4 (9.8%)
Emphyema, n (%) 0 (0.0%)
Pneumothorax, n (%) 0 (0.0%)
Crazy-paving appereance, n (%) 0 (0.0%)
Esophageal dilatation, n (%) 0 (0.0%)
Enlargement of pulmonary artery, n (%) (mm) 1 (2.4%) (36)
Kyphosis, n (%) 10 (24.4%)
CT – computed tomography. Extent of CT findings was scored as follows: grade 1 – localised involvement that affects one bronchopulmonary lobe; grade 2 – extensive involvement that affects more than one bronchopulmonary lobe in one lung; grade 3 – both lungs were affected.
Table 3. CT findings in AS patients.
Original Article © Pol J Radiol, 2014; 79: 156-163
158

45.44±11.84 years. Nineteen (46.34%) patients were former or current smokers at the time of CT examination and the remaining 22 (53.66%) were lifelong nonsmokers. Only 1 patient (2.4%) had been exposed to asbestos (Table 1).
Data related to the frequency of respiratory symptoms retrieved from the medical records of 41 patients was as follows: cough (n=11; 26.8%), dyspnea (n=11; 26.8%), sputum (n=10; 24.4%), wheezing (n=1; 2.4%), fever (n=4; 9.8%). Twenty patients (48.8%) had no respiratory symp-toms. Serum CRP (mean ±SD: 27.53±39.171; range: 1–161 mg/L) and ESR (mean ±SD: 30.66±27.253; range: 1–100 mm/hr) levels of all patients were also recorded. In
addition, 34 patients (82.9%) were undergoing medical ther-apy at the time of examination (Table 2) and 32 patients (78.04%) were at the early stage of the disease.
CT findings
The frequency of CT findings is summarized in Table 3. The most common abnormalities were nodules (n=34; 82.9%) (Figures 1 and 2), peribronchial thickening (n=29; 70.7%), pleural thickening (n=24; 58.5%) and bronchiectasis (n=21; 51.2%) (Figures 3–5). There were no patients with emphye-ma, pneumothorax, crazy-paving appearance or esophageal dilatation (Table 3), and 2 patients (4.9%) had no abnormal
Figure 1. Transverse MDCT scan obtained at the level of the right middle lobe in a 74-year-old man showing a nodule (arrow).
Figure 2. Transverse MDCT scan obtained at the level of the inferior pulmonary vein in a 50-year-old man showing a nodule in the subpleural region (arrow).
Figure 3. Transverse MDCT scan obtained at the level of the lower lobes of a 58-year-old woman showing bronchiectasis (thick arrow) and peribronchial thickening (thin arrow).
Figure 4. Transverse HRCT scan obtained at the level of the lower lobes of a 53-year-old woman showing bronchiectasis and peribronchial thickening (arrow).
© Pol J Radiol, 2014; 79: 156-163 Yuksekkaya R. et la. – Pulmonary involvement in ankylosing spondylitis…
159

CT findings N, (%)
Nodule Size Micronodules (<3 mm) Small nodules (3–10 mm) Large nodules (>10 mm) Location Centrilobular Peribronchial Random
26 (76.5%)8 (23.5%)
0 (0%)
22 (64.7%)1 (2.9%)
11 (32.4%)
Bronchiectasis Types Cylindrical Cystic Tractional Cylindrical-tractional
17 (81%)0 (0%)0 (0%)
4 (19%)
Table 4. Size and location of nodules, and types of bronchiectasis.
CT – computed tomography.
findings. Nodule sizes and locations along with the types of bronchiectasis are shown in Table 4.
Pulmonary function test results
Twenty (48.8%) of our 41 patients with AS had PFT results. Obstructive disorder was reported in 25% (5/20) and restrictive disorder in 30% (6/20). In addition, PFT results of 45% (9/20) of patients were normal. The mean values of PFT results calculated as percentages of the predictive value were as follows: FVC=76.34±18.52% (range: 31.5–104%), FEV1=74.90±22.77% (31.9–117%) and FEV1/FVC=80.67±13.03% (51–105%).
Assessment of patient characteristics, clinical status and PFT results with respect to CT findings
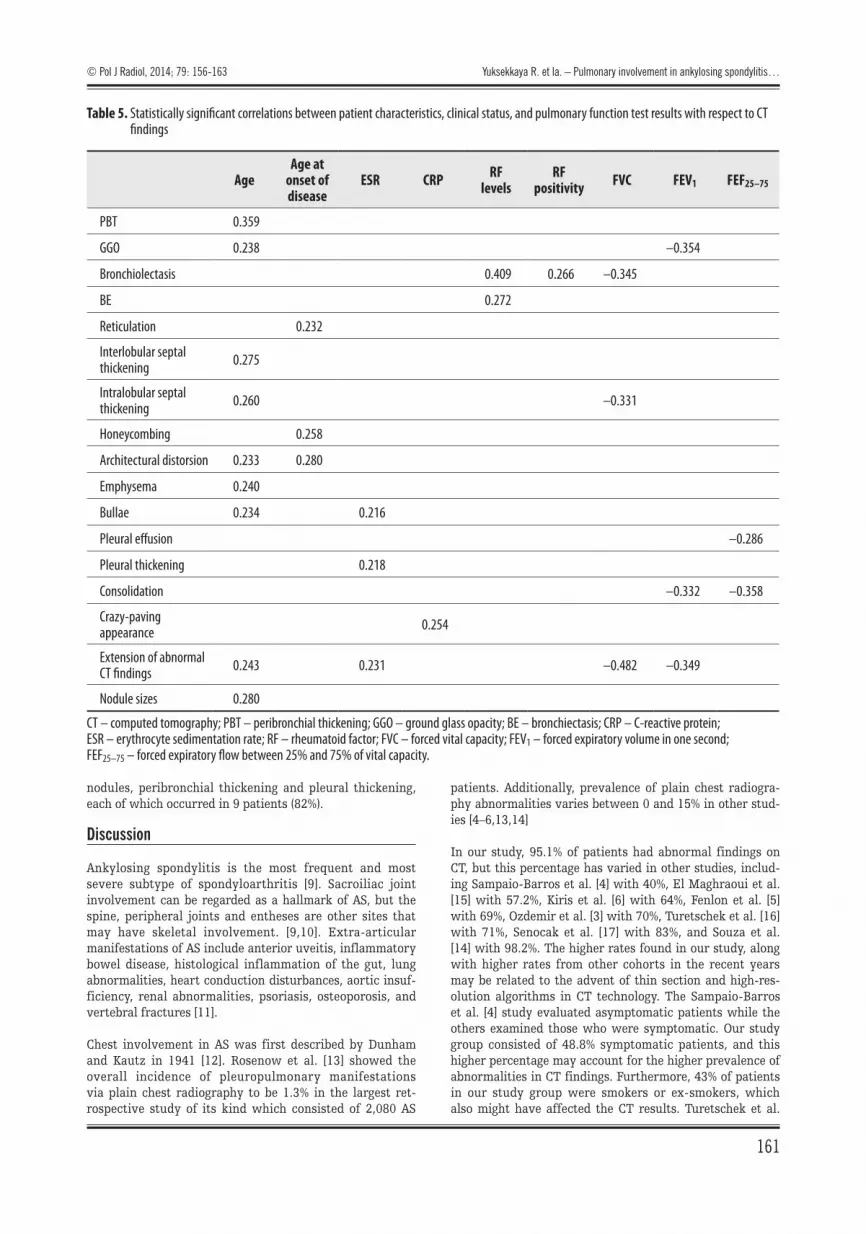
Regarding the correlations between CT findings and age, along with laboratory and PFT results, significant positive correlations were observed between the following pairs of parameters: (a) age and ground glass opacity together with kyphosis; (b) ESR and apical fibrosis, kyphosis, reticulation and pleural thickening; and (c) disease duration and archi-tectural distortion along with parenchymal bands (Table 5).
However, statistically significant negative correlations were found between the following matched parameters: (a) FVC and apical fibrosis, thoracic cage asymmetry, kyphosis, reticulation, emphysema, architectural distortion, paren-chymal bands and pleural thickening, as well as (b) FEV1 and apical fibrosis, thoracic cage asymmetry, reticulation, emphysema, architectural distortion, parenchymal bands and pleural thickening (Table 5).
Thirty-one patients (96.87%) with early AS and 7 patients (77.8%) with ≥10 years disease duration had abnormal MDCT examinations. Five patients (15.62%) in the early stage and 5 patients (55.55%) with late AS had kypho-sis with a statistically significant intergroup difference (p=0.025). However, there were no statistically significant
Figure 5. Transverse MDCT scan obtained at the level of the thoracic inlet in a 37-year-old man via mediastinal window (A) showing kyphosis and parenchymal window along with (B) peribronchial thickening (arrow).
A B
differences regarding other CT abnormalities between the 2 patient groups. Additionally, 17 of the 32 early AS patients (53.1%) were symptomatic, and 7 of the 15 patients with available PFT results (46.6%) had abnormal results.
When we compared CT findings with smoking status among the patients with AS, bullae and pleural thickening were frequently observed in the smokers, and there was a statistically significant intergroup difference between them and the nonsmokers (31.5%; p=0.036 and 78.9%; p=0.032, respectively).
Unfortunately, there were not enough PFT results to ana-lyze the statistical differences with respect to CT findings. All 11 patients with abnormal PFT results also had abnor-mal CT examination results. Of the 9 patients with nor-mal PFT results, 8 had abnormal CT examination results. The most common abnormalities in these patients were
Original Article © Pol J Radiol, 2014; 79: 156-163
160
nodules, peribronchial thickening and pleural thickening, each of which occurred in 9 patients (82%).
Discussion
Ankylosing spondylitis is the most frequent and most severe subtype of spondyloarthritis [9]. Sacroiliac joint involvement can be regarded as a hallmark of AS, but the spine, peripheral joints and entheses are other sites that may have skeletal involvement. [9,10]. Extra-articular manifestations of AS include anterior uveitis, inflammatory bowel disease, histological inflammation of the gut, lung abnormalities, heart conduction disturbances, aortic insuf-ficiency, renal abnormalities, psoriasis, osteoporosis, and vertebral fractures [11].
Chest involvement in AS was first described by Dunham and Kautz in 1941 [12]. Rosenow et al. [13] showed the overall incidence of pleuropulmonary manifestations via plain chest radiography to be 1.3% in the largest ret-rospective study of its kind which consisted of 2,080 AS
patients. Additionally, prevalence of plain chest radiogra-phy abnormalities varies between 0 and 15% in other stud-ies [4–6,13,14]
In our study, 95.1% of patients had abnormal findings on CT, but this percentage has varied in other studies, includ-ing Sampaio-Barros et al. [4] with 40%, El Maghraoui et al. [15] with 57.2%, Kiris et al. [6] with 64%, Fenlon et al. [5] with 69%, Ozdemir et al. [3] with 70%, Turetschek et al. [16] with 71%, Senocak et al. [17] with 83%, and Souza et al. [14] with 98.2%. The higher rates found in our study, along with higher rates from other cohorts in the recent years may be related to the advent of thin section and high-res-olution algorithms in CT technology. The Sampaio-Barros et al. [4] study evaluated asymptomatic patients while the others examined those who were symptomatic. Our study group consisted of 48.8% symptomatic patients, and this higher percentage may account for the higher prevalence of abnormalities in CT findings. Furthermore, 43% of patients in our study group were smokers or ex-smokers, which also might have affected the CT results. Turetschek et al.
Age Age at
onset of disease
ESR CRP RF levels
RF positivity FVC FEV1 FEF25–75
PBT 0.359
GGO 0.238 –0.354
Bronchiolectasis 0.409 0.266 –0.345
BE 0.272
Reticulation 0.232
Interlobular septal thickening 0.275
Intralobular septal thickening 0.260 –0.331
Honeycombing 0.258
Architectural distorsion 0.233 0.280
Emphysema 0.240
Bullae 0.234 0.216
Pleural effusion –0.286
Pleural thickening 0.218
Consolidation –0.332 –0.358
Crazy-paving appearance 0.254
Extension of abnormal CT findings 0.243 0.231 –0.482 –0.349
Nodule sizes 0.280
Table 5. Statistically significant correlations between patient characteristics, clinical status, and pulmonary function test results with respect to CT findings
CT – computed tomography; PBT – peribronchial thickening; GGO – ground glass opacity; BE – bronchiectasis; CRP – C-reactive protein; ESR – erythrocyte sedimentation rate; RF – rheumatoid factor; FVC – forced vital capacity; FEV1 – forced expiratory volume in one second; FEF25–75 – forced expiratory flow between 25% and 75% of vital capacity.
© Pol J Radiol, 2014; 79: 156-163 Yuksekkaya R. et la. – Pulmonary involvement in ankylosing spondylitis…
161
[16] used nonsmoking patients in their study, whereas Kiris et al. [6] (61%) and Sampaio-Barras et al. [4] (63%) utilized mostly nonsmokers. The other studies mentioned earlier also had patients with higher smoking history rates than ours (50–89.5%).
Nodules (82.9%) were the most common abnormality in our study, followed by peribronchial thickening (70.7%), pleu-ral thickening (58.5%), bronchiectasis (51.2%) and apical fibrosis (41.5%). Our results varied greatly from the previ-ously mentioned studies as the patients in the Ozdemir et al. [3] study had a 40% rate of apical fibrosis and Sampaio-Barros et al. [4] had a 19% rate of nonspecific linear paren-chymal opacities. Furthermore, bronchiectasis occurred in 15.4% of the subjects in the study by Fenlon et al. [5], and mosaic perfusion was found in 64.3% of Kiris et al. study participants. [6]. In addition, 41% of the patients had peri-bronchial thickening in the Souza et al. [14] study, 29% had thickening of the interlobular septa in the Turetschek et al. [16] study and 41.2% had nonspecific interstitial change in the El Maghraouri et al. [18] study. Senocak et al. [17] found that 45% of the participants in their study suffered from pleural thickening, as well as thickening of the interlobular septa and emphysema, respectively. Finally, in the series of Kiris et al. [6], micronodules were reported at a frequency of 25%. The reason for the higher frequency of nodules in our study may be related to the fact that our study group was evaluated using thin-section MDCT, whereas most of the other studies used HRCT, except for Fenlon et al. [5] who used helical CT with 10 mm slice thickness and Turetschek et al. [16] who employed thin-section helical CT with 1.5 mm slice thickness. It is known that HRCT detects parenchymal abnormalities with higher slice thick-ness; therefore, it is not as useful as thin-section MDCT for the detection of nodules [19]. The sizes of nodules in our study group were smaller than 10 mm in diameter, with the majority being <3 mm (76.5%).
In addition, most of the nodules detected in our study group were located in the centrilobular region (64.7%), which is a sign of small airway disease [15. However, the other features of airway disease, such as bronchiectasis, peribronchial thickening and air trapping that are fre-quently seen on CT, were also present. These results par-allel those of Souza et al. [14], Fenlon et al. [5], Kiris et al. [6] and Turetschek et al. [16] in which airway disease was a common finding in patients with AS. Our study also revealed a high percentage of pleural thickening (58.5%). While none of the other series had rates this high, El Maghraoui et al. [18] (23.6%) and Senocak et al. [17] (40%) did report relatively high percentages in their subjects.
Nodules, peribronchial thickening, pleural thickening, bronchiectasis, apical fibrosis, and emphysema were the most frequent abnormalities found on a CT in our study. However, when the percentages were evaluated accord-ing to the smoking status, the frequencies were different. Bullae and pleural thickening were the most frequent find-ings in those who smoked and there was a statistically significant intergroup difference, whereas no statistically significant difference was found between smokers and life-long nonsmokers in terms of emphysema and bronchiec-tasis. Therefore, the higher frequencies of bronchiectasis,
peribronchial thickening and emphysema could not be attributed to the smoking status, leading to the conclusion that AS might be responsible. The presence of emphysema in nonsmokers with AS was also revealed by Senocak et al. [14] and Souza et al. [17].
To our knowledge, our series is the largest one involving AS patients that has used thin-section MDCT. Until now, the largest reported series was a study by El Maghraoui et al. [18] with 55 patients analyzed by HRCT.
In our group, the extent of abnormal CT findings was most-ly distributed in the both lungs (Table 3); thus, we can say that AS has a widespread effect in these organs.
Most of our patients with available PFT results (55%) had some abnormalities. The most common pulmonary disor-ders were those with restrictive pattern (30%). Other studies found similar results. Ozdemir et al. [3] reported abnormal PFT results in 40% of their study group and the restrictive form was the most commonly seen pattern. Fenlon et al. [5] reported abnormal PFT results in 42% of their study group, with restrictive disorders also being the most common. Kiris et al. [6] found that 42.85% of their patients had abnormal PFT results, with restrictive pattern and Turetscek et al. [16] reported abnormal PFT results in 57% of their study group, with the same restrictive pattern. Additionally, El Maghraoui et al. [18] observed abnormal PFT results in 38% of their patients with the restrictive form being seen most often, and Berdal et al. [20] examined the PFT results of 147 AS patients and 121 controls and determined that AS patients had statistically significantly frequent restrictive patterns (18%) when compared with the control group (0%).
We found intercorrelations between some parameters (Table 5). Negative correlations between abnormalities in CT find-ings and PFT results along with the presence of patients with normal PFT results in conjunction with abnormal CT findings in our study, indicate that CT scanning reveals pul-monary involvement at an earlier stage, before significant loss of lung volumes. Furthermore, disease duration was positively correlated with some of the abnormalities that could be accepted as predictors of fibrosis (architectural dis-tortion and parenchymal bands) and kyphosis which was more frequently detected in patients with ≥10 years of dis-ease duration. This increase in the rate of fibrotic changes and kyphosis paralleling disease duration demonstrates the chronic and fibrotic nature of AS. Nevertheless, the higher prevalence of abnormal CT examinations along with the lower prevalence of symptomatic patients and abnormal PFT results in patients at the early stage in our study group suggests that CT is an important instrument for evaluating lung involvement, especially early on and in asymptomatic AS patients. These results may necessitate a long-term fol-low-up of patients with AS, especially the use of MDCT.
Similarly to our results, Ozdemir et al. [3] showed that HRCT abnormalities could be sensitively detected in patients with normal lung functions in the early and late stages of AS and Senocak et al. [17] suggested that the parenchymal changes seen on HRCT begin in the early stages and increase in conjunction with disease duration [17]. Kiris et al. [6] also found that 28.6% of their patients
Original Article © Pol J Radiol, 2014; 79: 156-163
162
1. Quismorio FP Jr: Pulmonary involvement in ankylosing spondylitis. Curr Opin Pulm Med, 2006; 12: 342–45
2. Lee-Chiong TL: Pulmonary manifestations of ankylosing spondylitis and relapsing polycondritis. Clin Chest Med, 1998; 19: 747–57
3. Ozdemir O, Akpinar MG, Inanici F et al: Pulmonary abnormalities on high-resolution computedtomography in ankylosing spondylitis: relationship to disease duration and pulmonary function testing. Rheumatol Int, 2012; 32: 2031–36
4. Sampaio-Barros PD, Cerqueira EM, Rezende SM et al: Pulmonary involvement in ankylosing spondylitis. Clin Rheumatol, 2007; 26: 225–30
5. Fenlon HM, Casserly I, Sant SM et al: Plain radiographs and thoracic high-resolution CT in patients with ankylosing spondylitis. Am J Roentgenol, 1997; 168: 1067–72
6. Kiris A, Ozgocmen S, Kocakoc E et al: Lung findings on high resolution CT in early ankylosing spondylitis. Eur J Radiol, 2003; 47: 71–76
7. Van der Linden S, Valkenburg HA, Cats A: Evaluation ofdiagnostic criteria for ankylosing spondylitis. A proposal for modification of the New York criteria. Arthritis Rheum, 1984; 27: 361–81
8. Glazer GM, Gross BH, Quint LE et al: Normal mediastinal lymph nodes: number and size according to American Thoracic Society mapping. Am J Roentgenol, 1985; 144: 261–65
9. Sieper J, Braun J, Rudwaleit M et al: Ankylosing spondylitis: an overview. Ann Rheum Dis, 2002; 61: iii8–iii18
10. El Maghraoui A: Ankylosing spondylitis. Presse Med, 2004; 33: 1459–64
References:
11. El Maghraoui A: Extra-articular manifestations of ankylosing spondylitis: Prevalence, characteristics and therapeutic implications. Eur J Int Med, 2011; 22: 554–60
12. Dunham CL, Kautz FG: Spondylarthritis ankylopoietica: a review and report of twenty cases. Am J Med Sci, 1941; 201: 232–50
13. Rosenow EC, Strimlan CV, Muhm JR et al: Pleuropulmonary manifestations of ankylosing spondylitis. Mayo Clin Proc, 1977; 52: 641–49
14. Souza AS Jr, Müller NL, Marchiori E et al: Pulmonary abnormalities in ankylosing spondylitis: inspiratory and expiratory high-resolution CT findings in 17 patients. J Thorac Imaging, 2004; 19: 259–63
15. Pipavath SJ, Lynch DA, Cool C et al: Radiologic and pathologic features of bronchiolitis. AJR Am J Roentgenol, 2005; 185: 354–63
16. Turetschek K, Ebner W, Fleischmann D et al: Early pulmonary involvement in ankylosing spondylitis: assessment with thin-section CT. Clin Radiol, 2000; 55: 632–36
17.SenocakO,ManisalıM,OzaksoyDetal:Lungparenchymachangesin ankylosing spondylitis: demonstrationwith high resolution CT and correlation with disease duration. Eur J Radiol, 2003; 45: 117–22
18. Pipavath SJ, Lynch DA, Cool C et al: Radiologic and pathologic features of bronchiolitis. AJR Am J Roentgenol, 2005; 185: 354–63
19. MacMahon H, Austin JHM, Gamsu G et al: Guidelines for management of small pulmonary nodules detected on CT scans: A statement from the Fleischner Society1 Radiology, 2005; 237: 395–400
20. Berdal G, Halvorsen S, van der Heijde D et al: Restrictive pulmonary function is more prevalent in patients with ankylosing spondylitis than in matched population controls and is associated with impaired spinal mobility: a comparative study. Arthritis Res Ther, 2012; 14: R19
with early AS had normal PFT results, but abnormal HRCT examinations. Conversly, Sampaio-Barros et al. [4] revealed that 40% of patients in their study had parenchymal HRCT abnormalities, whereas 65% had PFT abnormalities.
In our study, there was a statistically significant positive correlation between age, ground glass opacity and kypho-sis, with ground glass opacity reflecting active alveolitis on CT. We suggest that as patients get older, the amount of inflammation in the lungs increases. Moreover, ESR levels correlated with apical fibrosis, kyphosis, reticulations and pleural thickening. Thus, it seems that inflammatory pro-cess plays a role in the pulmonary involvement of AS.
We found that MDCT had several advantages with regard to the thoracic evaluation of AS patients in our study, as it allowed us to examine the asymmetry of the thoracic cage, kyphosis, pericardial thickening, enlargement of the pulmo-nary artery and esophageal dilatation.
Our study had several limitations. For example, it only included 41 patients. However, since AS is an uncommon disease, what seemed like a small-scale study was actually one of the largest ever conducted on patients with this dis-ease. In addition, histopathological confirmation was not available for all patients; therefore, it was not possible to clinically establish the diagnosis in all patients by means
of a histopathological examination of surgical biopsy speci-mens. To counteract this limitation, we used MDCT since it offers a noninvasive approach for the detection of lung abnormalities in AS patients. Furthermore, due to the ret-rospective nature of our study, some data concerning the patients (especially PFT results) could not be obtained. As a result of these technical limitations, diffusion capaci-ties and lung capacities could not be evaluated using PFT results. Additionally, it is known that expiratory scans are helpful in the detection of subtle areas of air trapping, but these were also not available for all of our patients.
Conclusions
The most common abnormalities detected by a CT in our study were nodules, peribronchial thickening, pleu-ral thickening, bronchiectasis and apical fibrosis. Even patients with no respiratory symptoms and normal PFT results had some abnormal findings. Therefore, we believe that using MDCT for AS patients may be beneficial for the evaluation of pulmonary disease, even for asymptomatic patients without any PFT abnormalities and those in the early stages of the disease.
Conflicts of interest
The authors declare that there are no conflicts of interest.
© Pol J Radiol, 2014; 79: 156-163 Yuksekkaya R. et la. – Pulmonary involvement in ankylosing spondylitis…
163


