Embed Size (px)
Citation preview

This content has been downloaded from IOPscience. Please scroll down to see the full text.
Download details:
IP Address: 218.18.133.242
This content was downloaded on 19/10/2013 at 12:34
Please note that terms and conditions apply.
Pulsatile and steady-state hemodynamics of the human patella bone by diffuse optical
spectroscopy
View the table of contents for this issue, or go to the journal homepage for more
2013 Physiol. Meas. 34 839
(http://iopscience.iop.org/0967-3334/34/8/839)
Home Search Collections Journals About Contact us My IOPscience
IOP PUBLISHING PHYSIOLOGICAL MEASUREMENT
Physiol. Meas. 34 (2013) 839–857 doi:10.1088/0967-3334/34/8/839
Pulsatile and steady-state hemodynamics of thehuman patella bone by diffuse optical spectroscopy
Parisa Farzam1, Peyman Zirak1, Tiziano Binzoni2,3
and Turgut Durduran1
1 ICFO—Institut de Ciencies Fotoniques, Mediterranean Technology Park, 08860, Castelldefels(Barcelona), Spain2 Departement de Neurosciences Fondamentales, University of Geneva, Geneva, Switzerland3 Departement de l’Imagerie et des Sciences de l’Information Medicale, University Hospital,Geneva, Switzerland
E-mail: [email protected]
Received 20 March 2013, accepted for publication 11 June 2013Published 17 July 2013Online at stacks.iop.org/PM/34/839
AbstractThe cardiac cycle related pulsatile behavior of the absorption and scatteringcoefficients of diffuse light and the corresponding alterations in hemoglobinconcentrations in the human patella was studied. The pulsations in scatteringis considerably smaller than absorption. The difference in amplitude ofabsorption coefficient pulsations for different wavelengths was translated topulsations in oxygenated and deoxygenated hemoglobin, which leads to strongpulsations in the total hemoglobin concentration and oxygen saturation. Thephysiological origin of the observed signals was confirmed by applying a thigh-cuff. Moreover, we have investigated the optical and physiological propertiesof the patella bone and their changes in response to arterial cuff occlusion.
Keywords: bone characterization, photoplethysmography, near-infraredspectroscopy (NIRS), hemodynamics
(Some figures may appear in colour only in the online journal)
1. Introduction
Tissue vascularization and local micro-vascular hemodynamics play a vital role in the healthof the skeletal system. Noninvasive, quantitative and practical measurements of hemoglobinconcentration, blood oxygenation, blood flow and metabolism in the bones could improveour fundamental understanding of bone function with potential applications in diagnosis andtreatment of bone diseases (Klose et al 1998, Naslund et al 2007, Prapavat et al 1997).However, due to the nature of the bone itself, which is hard and covered by other tissues, it is
0967-3334/13/080839+19$33.00 © 2013 Institute of Physics and Engineering in Medicine Printed in the UK & the USA 839
840 P Farzam et al
difficult to investigate its circulation continuously, noninvasively and over long periods of time(Brookes and Revell 1998, McCarthy 2006). Several groups have investigated the possibilityof using near-infrared spectroscopy as a noninvasive technique to monitor hemodynamics ofhuman bone (Aziz et al 2010, Bashkatov 2006, Binzoni et al 2002, 2011, Binzoni and Van DeVille 2011, Firbank et al 1993, Mateus and Hargens 2012, Naslund et al 2006, 2007, 2011,Pifferi et al 2004, Prapavat et al 1997, Ugryumova et al 2004, Xu et al 2001, Zhang and Jiang2005).
Mechanical plethysmography is a technique based on measurement of volume changes;applying venous occlusion to the arm causes arterial blood to enter the forearm and accumulatethere. It leads to a linear increase in the forearm volume over time. Based on a model, onecan calculate the arterial flow by measuring the increased volume in a certain time interval(Wilkinson and Webb 2001). It is a useful technique to study the bulk blood flow into anextremity.
Most of the studies that are mentioned above using near-infrared light utilized a similartechnique, photoplethysmography (PPG), to study the physiology and hemodynamics of bone.PPG is based on a simple, noninvasive device that can measure blood volume changes in thevasculature. It consists of light emitting diodes as source, and photodiodes as detector bothworking in the red or near-infrared regime (Allen 2007). The emitted light interacts with tissueexperiencing reflection, absorption, many scattering events and even fluorescence (Yodh andChance 1995). The main absorbers are the hemoglobin species, making the technique sensitiveto the blood volume. The scattering of light, on the other hand, in tissue occurs at the cellmembranes, vessel walls and at the boundaries of media with different refractive indices(Mourant et al 1998). Therefore, blood volume and vessel wall movements, by changingabsorption and scattering of the underlying tissue, can alter the detected intensity in thedetectors (Allen 2007, Challoner and Ramsay 1974). In fact, the measured PPG signal has bothfluctuating (‘ac’) and static (‘dc’) components. Ac is the pulsatile component and its frequencydepends on the subject’s heart-rate. In each cardiac cycle, the heart pumps blood into the arterieswhich causes increased blood volume and vessel wall movements in arterial and venous bloodvessels. These changes originate the ‘ac’ component of the PPG signal. The amplitude ofthe ‘ac’ component depends on the vascular distensibility (Shelley 2007). Furthermore, sinceoxygenated hemoglobin has a different absorption spectrum from deoxygenated hemoglobin,changes in blood saturation cause unequal alterations in different wavelengths. This enablesPPG to follow changes in the arterial, pulsatile, blood oxygen saturation.
The dc component varies slowly due to slow changes in scattering and absorption of tissueinduced by respiration, metabolism, blood pressure or any other vasomotor activities (Allen2007). Since specific diseases change the shape of the PPG signal, PPG can be applied todiagnose vascular diseases (Murray and Foster 1996). The potential of PPG as a diagnosis toolwas noticed decades ago where measured blood volume changes by PPG were validated withsimultaneous mechanical plethysmography measurement (Hertzman and Dillon 1940).
Recently some studies (Naslund et al 2006, 2007, 2011) have assumed another possiblesource for the pulsatile PPG signal from bones; the changes in the orientation of the lightscatterers, in this case the red blood cells (RBCs). They have reached this conclusion byassuming that the blood vessels in bones do not have the possibility to change in size as bonesare rigid structures. Therefore, they have suggested that the observed pulsations in the recordedlight intensity from the bone measurements are due to the changes in the RBC orientationscaused by blood flow changes over each cardiac cycle. Based on these results, they haveapplied PPG to measure blood flow changes in rigid structures such as bones (Naslund et al2006, 2007, 2011). Further experiments have confirmed this hypothesis for different humanbones (Binzoni et al 2013) where it was shown that the RBC count that was estimated by
Pulsatile and steady-state hemodynamics of the human patella 841
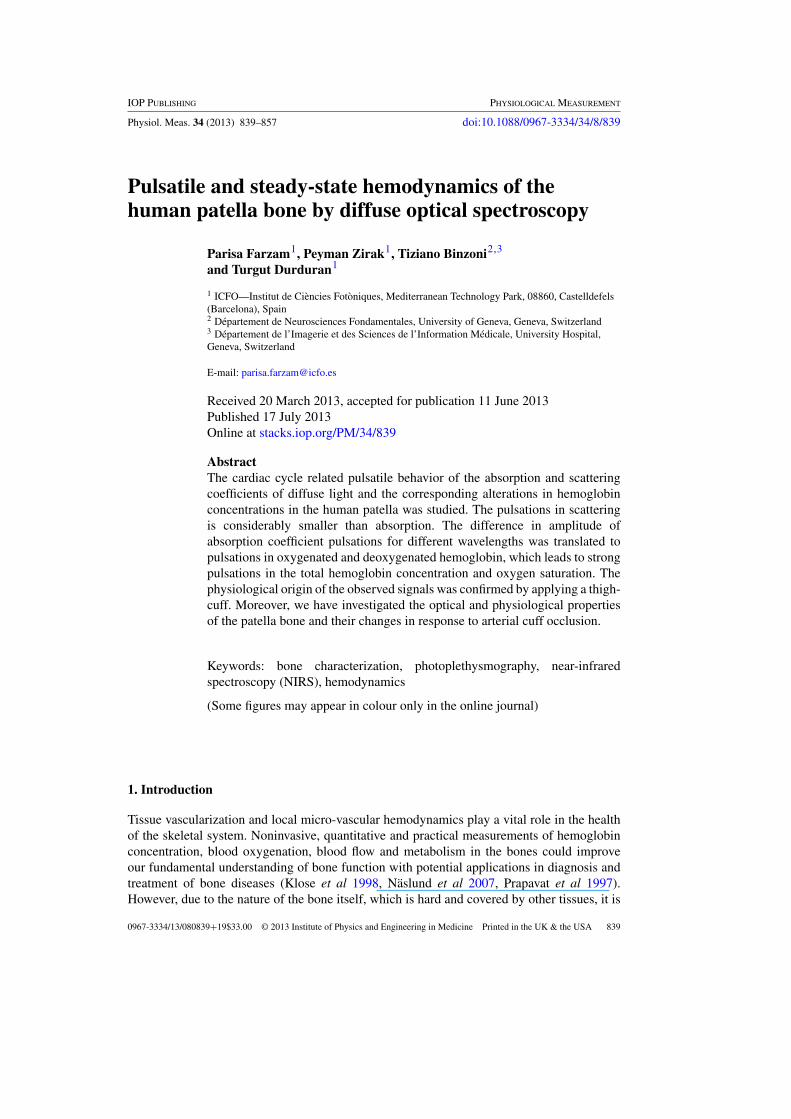
Figure 1. The placement of the probe on the knee and schematic of the self-calibrating probe withtwo detectors (D1, D2) and five sources (S1, S2, . . ., S5). The source–detector separations are from1 to 3 cm in steps of 0.5 cm.
large source–detector separation laser Doppler flowmetry (LDF) does not change during heartpulsations while blood speed is altered.
In this work, we investigate this hypothesis using a state-of-the-art frequency domainnear-infrared spectrometer (FD-NIRS) (Chance et al 1998, Feddersen et al 1989) which canseparate the absorption (μa) and scattering (μ′
s) coefficients on the human patella. The patellais the most superficial part of the knee and since it does not have any muscle or other tissue(except skin) on top, the optical signal is dominated by the signals from this bone. In orderto further confirm that the changes are due to arterial pulsations, we apply an arterial cuffocclusion to the ipsilateral thigh. We also take advantage of the multi-wavelength systemto quantify the changes in oxy- and deoxy-hemoglobin, and oxygen saturation during eachcardiac cycle as well as the slower changes due to the cuff occlusion. We compare our findingsto those from the literature on leg muscles. The ultimate goal is to explore the possibility ofusing FD-NIRS to monitor bone hemodynamics noninvasively.
2. Methods and materials
2.1. Device and probe
We have used a customized, commercial frequency domain spectrometer (Imagent, ISS, USA,www.iss.com). The unit was customized to have 15 laser sources at 3 wavelengths, i.e. groupsof 5 lasers at ∼690, ∼785 and ∼830 nm that are intensity modulated at 110 MHz. Two photomultipliers are used to collect the light in the reflection geometry. For a review of the analysismethods for the frequency domain measurements that we utilize, see Durduran et al (2010).A self-calibrating probe (figure 1) was utilized to obtain absolute values of the absorption
842 P Farzam et al
30 min 2 min 5 min 5 min
rest rest(baseline)
cuff
. . .1 2 8
delay
time1
time2
. . .
R
trigger
1 2 8. . .
R
ertrigggegeg
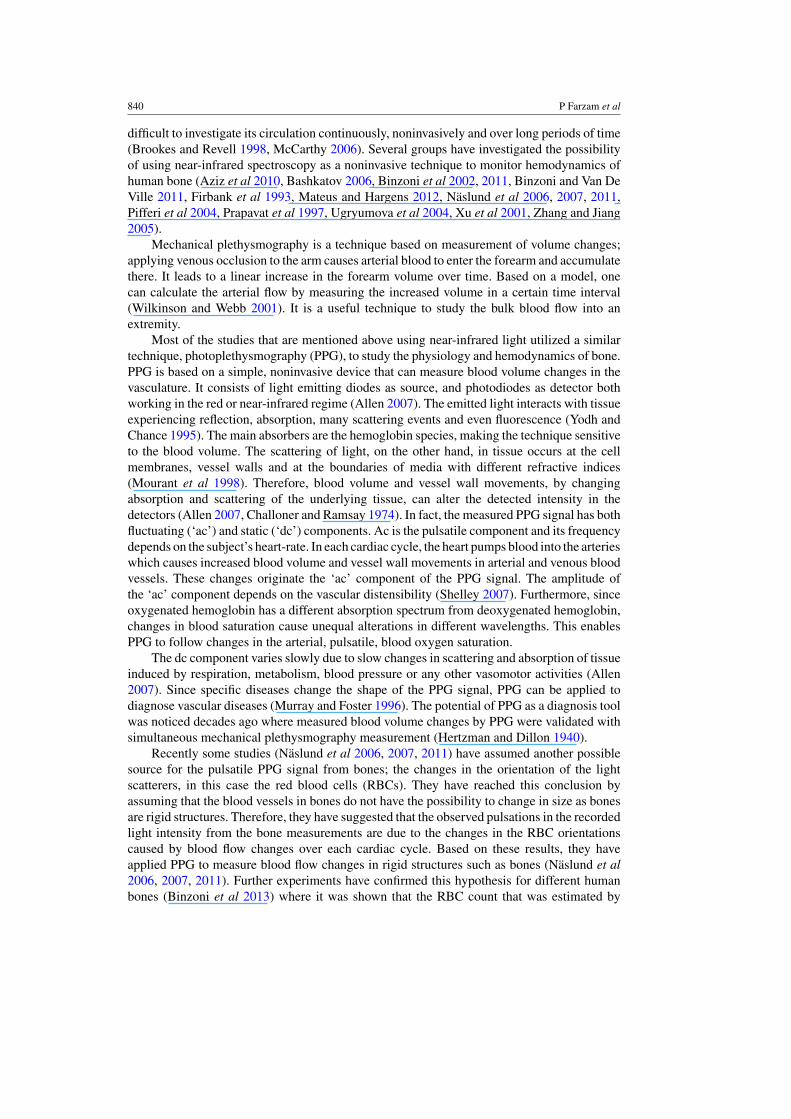
Figure 2. Measurement protocol: (1) 30 min measurement of rest (no occlusion), (2) couple ofminutes relaxing time for subject to adjust their leg, (3) 5 min measurements of rest as baseline(no occlusion), (4) 5 min cuff occlusion. The inset shows the triggering of the instrument by the‘R-peak’ and the eight measurements during each cardiac cycle.
and scattering coefficients at each wavelength (Yu et al 2005). All sources (S1, S2, . . ., 5) arelocated on the circumference of a circle with a radius of 1 cm. Detector D2 is at the center of thecircle so it is at the same distance from all sources and, in ideal conditions, the intensity and thephase delay detected by D2 from all sources should be the same. Since the laser power, fibertransmissions, skin color and other factors are not the same in different source positions, thedetected intensity and the phase delay would be different. By considering one of the sources asthe reference and assuming that the tissue is homogeneous, we can find calibration (‘couplingcoefficients’) factors for all the other sources. Then these calibration factors are applied to themeasured intensity and the phase delay by the main detector (D1) which is then utilized in amulti-distance fit as described below.
As shown in figure 2, in order to synchronize the data acquisition with the heartbeat,the device was gated by the R-peak of the cardiac cycle from an electrocardiograph. At eachtrigger 8 measurements, each an average of 14 acquisitions, were recorded during the cardiaccycle. This allowed us to average the pulsations from multiple cardiac cycles (up to 2000)without being dependent on the heart-rate being constant.
2.2. Measurement protocol
The measurements were performed on eight healthy male subjects (age 34.4 ± 9.6 years, bodyweight 77.6 ± 6.9 kg, and height 1.79 ± 0.07 m). Subjects were asked to lay supine and theoptical probe was centered over the right patella and attached to the skin with medical tape.The knee was bent 20◦ by means of an anatomical support placed under the popliteal fossa.A pressure cuff was placed around the right thigh. The subject’s leg was then covered witha black blanket to avoid external light and to maintain a comfortable temperature. The threeelectrodes of the electrocardiograph (CardioLab4, Francesco Marazza, Hardware & software,Italy) were placed on the subject’s chest.
The subject was asked to rest in this position for a minimum of 15 min before themeasurements started. The pulsatile component was studied during 30 min of additional restafter which the subject was allowed minimal motion for comfort. This 30 min period is furtherutilized to estimate the average optical properties of the healthy patella. The second set ofmeasurements were performed 5 min at rest and then 5 min of arterial occlusion with the cuffpressure set at 260 mmHg to ensure adequate blockage (Tuncali et al 2006).
Pulsatile and steady-state hemodynamics of the human patella 843
2.3. Fitting method
2.3.1. Theory and calculations. We have utilized the frequency domain solutions of thephoton diffusion equation in the semi-infinite geometry to obtain the wavelength (λ) and time(t) dependent optical properties of the tissue (Durduran et al 2010). To calculate μa(λ, t) andμ′
s(λ, t) of the probed tissue volume, we fit this theory to the measured (and calibrated, seebelow) intensity and phase for each of the three wavelengths (690, 785, 830 nm) using a multi-distance approach. The measured absorption coefficients (μa(λ, t)) are related to the differenttissue chromophores as μa(λ.t) = ∑nc
i εi(λ)ci(t). The sum is over the different tissue chro-mophores, here we have assumed only water, oxy- and deoxy-hemoglobin, and nc is the numberof chromophores assumed. εi(λ) is the wavelength-dependent extinction coefficient of the ithchromophore obtained from the literature (Prahl not dated), and ci(t) is the concentration ofthe ith chromophore. The water concentration in the bone was assumed to be 15% (Pifferi et al2004, White et al 1987, 1991) and oxy- and deoxy-hemoglobin concentrations were measuredover time (cHbO2 (t) and cHb(t)). The total hemoglobin concentration (THC) was assumed tobe the sum of oxygenated and deoxygenated hemoglobin, i.e. THC(t) = cHbO2 (t) + cHb(t),and blood oxygen saturation (SO2(t) = cHbO2 (t)
cHbO2 (t)+cHb(t)× 100) was also calculated and reported.
Even though the frequency domain method is a well-validated and utilized method,we have tested our specific approach for self-calibration and our optimization codes usingsimulated data. We have simulated a medium with similar physiological properties to whatwe have measured on the knee-cap: THC = 20 μM, SO2 = 65% and water concentration =15% (Pifferi et al 2004, White et al 1987, 1991). This results in μa = 0.042, 0.041 and0.043 (cm−1) respectively for 690, 785 and 830 nm. We also assumed that the simulatedmedium has similar scattering properties to our values from knee measurements: μ′
s = 7.0,5.0 and 4.0 (cm−1) respectively for 690, 785 and 830 nm. The assumed probe geometry inthis simulation is the geometry of the utilized probe in the measurement of the knee, which isdescribed in figure 1. Noise and random calibration coefficients were introduced to create arealistic numerical data-set.
In order to test the self-calibration probe, a non-zero random number between zero andone was assigned for each source and each detector as a multiplicative amplitude calibrationfactor. Similarly, for phase, a random, additive calibration factor up to 1 rad was assumed. Thesimulated data for each of the source–detector pairs received these multiplicative and additivecalibration factors.
Then, we have introduced random noise to the calculated in-phase and quadraturecomponents of the simulated data. In order to estimate the required noise level for thesimulation, we have studied a liquid phantom measurement with more than 2000 acquisitions.The measured noise in amplitude and phase are respectively 0.05% and 4.4 × 10⁻⁴ rad for anacquisition time of 10 ms/channel. The amplitude noise is in good agreement with the companyspecified value. Noise in-phase is proportional to the square root of acquisition time. In thisstudy the acquisition time was 3.2 ms/channel. A simple calculation, gives the expected phasenoise to be ≈7.7×10⁻⁴. We have introduced 1% noise to in-phase and quadrature componentsof the simulated data, which produces a phase noise of ≈7.7 × 10⁻³ and an amplitude noiseof ≈1.7%. Therefore, the simulated noise in both phase and amplitude is greater than theexpected values from the in vivo experiment. A thousand data-sets were generated accordingto this algorithm, and we have fitted the theory to each of them separately.
The first step in the analysis was to apply the above-mentioned self-calibration method forthe sources that are equidistant from one of the detectors. This allowed us to recover the relativevalues of all the source-calibration coefficients and introduce them to the measurements fromthe other detector.
844 P Farzam et al
1 1.5 2 2.5 3 0.0
+1.0
+2.0
+3.0
+4.0Before calibration
Nor
mal
ized
inte
nsity
1 1.5 2 2.5 3 0.0
+1.0
+2.0
+3.0
+4.0After calibration
1 1.5 2 2.5 30
1
2
3
4Fitting example
Simulated amplitude Fitted curve
1 1.5 2 2.5 3 −0.3
−0.2
−0.1
0.0
+0.1
+0.2
+0.3
Nor
mal
ized
pha
se
Separation (cm)1 1.5 2 2.5 3
−0.3
−0.2
−0.1
0.0
+0.1
+0.2
+0.3
Separation (cm)1 1.5 2 2.5 3
−0.3
−0.2
−0.1
0.0
+0.1
+0.2
+0.3
Separation (cm)
Simulated phase Fitted curve
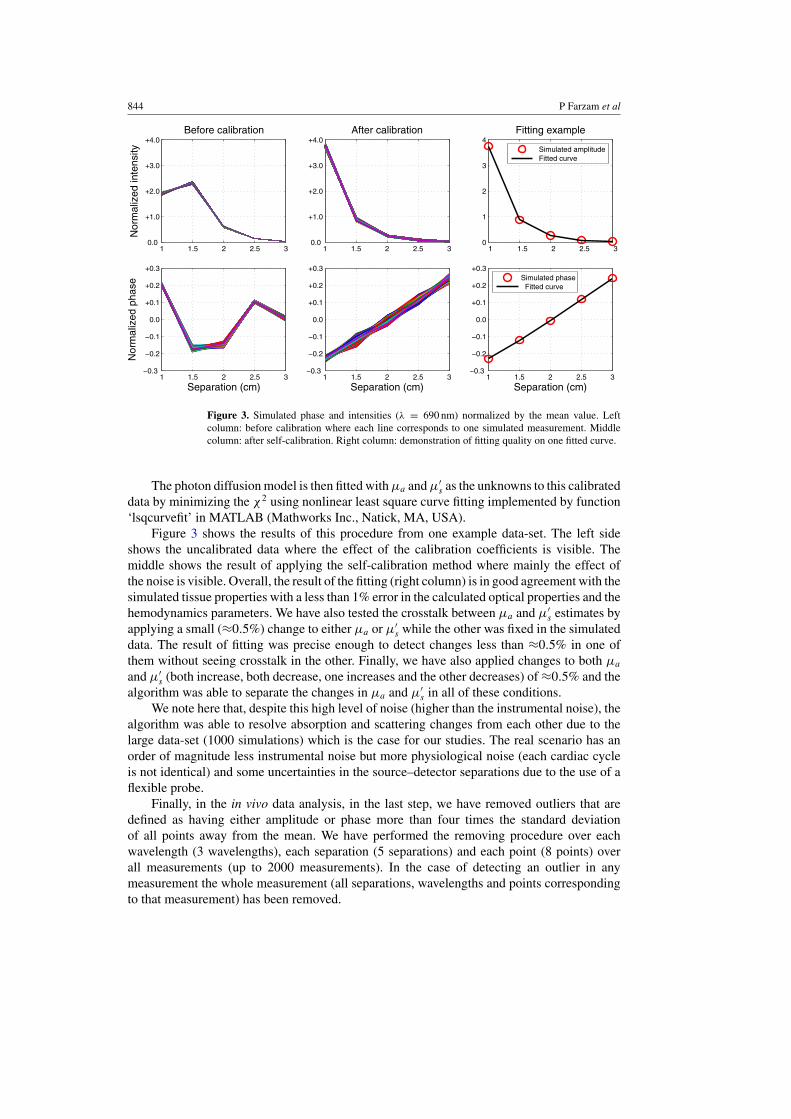
Figure 3. Simulated phase and intensities (λ = 690 nm) normalized by the mean value. Leftcolumn: before calibration where each line corresponds to one simulated measurement. Middlecolumn: after self-calibration. Right column: demonstration of fitting quality on one fitted curve.
The photon diffusion model is then fitted with μa and μ′s as the unknowns to this calibrated
data by minimizing the χ2 using nonlinear least square curve fitting implemented by function‘lsqcurvefit’ in MATLAB (Mathworks Inc., Natick, MA, USA).
Figure 3 shows the results of this procedure from one example data-set. The left sideshows the uncalibrated data where the effect of the calibration coefficients is visible. Themiddle shows the result of applying the self-calibration method where mainly the effect ofthe noise is visible. Overall, the result of the fitting (right column) is in good agreement with thesimulated tissue properties with a less than 1% error in the calculated optical properties and thehemodynamics parameters. We have also tested the crosstalk between μa and μ′
s estimates byapplying a small (≈0.5%) change to either μa or μ′
s while the other was fixed in the simulateddata. The result of fitting was precise enough to detect changes less than ≈0.5% in one ofthem without seeing crosstalk in the other. Finally, we have also applied changes to both μa
and μ′s (both increase, both decrease, one increases and the other decreases) of ≈0.5% and the
algorithm was able to separate the changes in μa and μ′s in all of these conditions.
We note here that, despite this high level of noise (higher than the instrumental noise), thealgorithm was able to resolve absorption and scattering changes from each other due to thelarge data-set (1000 simulations) which is the case for our studies. The real scenario has anorder of magnitude less instrumental noise but more physiological noise (each cardiac cycleis not identical) and some uncertainties in the source–detector separations due to the use of aflexible probe.
Finally, in the in vivo data analysis, in the last step, we have removed outliers that aredefined as having either amplitude or phase more than four times the standard deviationof all points away from the mean. We have performed the removing procedure over eachwavelength (3 wavelengths), each separation (5 separations) and each point (8 points) overall measurements (up to 2000 measurements). In the case of detecting an outlier in anymeasurement the whole measurement (all separations, wavelengths and points correspondingto that measurement) has been removed.
Pulsatile and steady-state hemodynamics of the human patella 845
2.4. Time-scale equalization
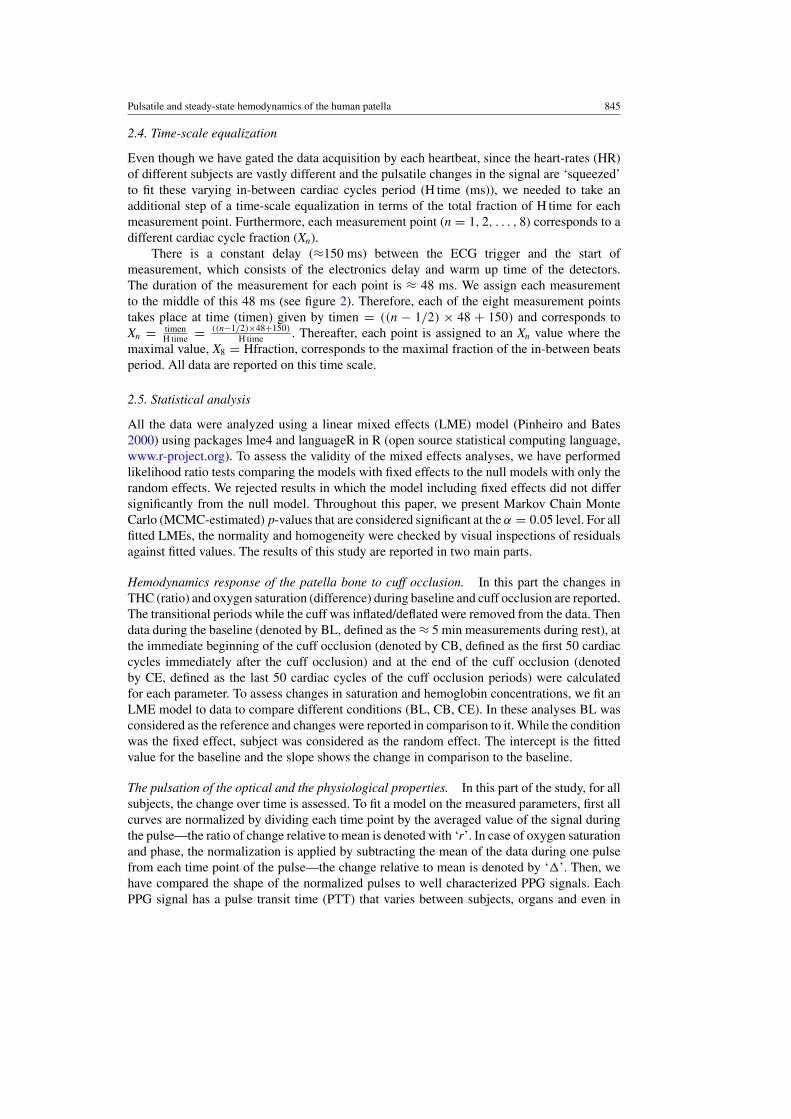
Even though we have gated the data acquisition by each heartbeat, since the heart-rates (HR)of different subjects are vastly different and the pulsatile changes in the signal are ‘squeezed’to fit these varying in-between cardiac cycles period (H time (ms)), we needed to take anadditional step of a time-scale equalization in terms of the total fraction of H time for eachmeasurement point. Furthermore, each measurement point (n = 1, 2, . . . , 8) corresponds to adifferent cardiac cycle fraction (Xn).
There is a constant delay (≈150 ms) between the ECG trigger and the start ofmeasurement, which consists of the electronics delay and warm up time of the detectors.The duration of the measurement for each point is ≈ 48 ms. We assign each measurementto the middle of this 48 ms (see figure 2). Therefore, each of the eight measurement pointstakes place at time (timen) given by timen = ((n − 1/2) × 48 + 150) and corresponds toXn = timen
H time = ((n−1/2)×48+150)
H time . Thereafter, each point is assigned to an Xn value where themaximal value, X8 = Hfraction, corresponds to the maximal fraction of the in-between beatsperiod. All data are reported on this time scale.
2.5. Statistical analysis
All the data were analyzed using a linear mixed effects (LME) model (Pinheiro and Bates2000) using packages lme4 and languageR in R (open source statistical computing language,www.r-project.org). To assess the validity of the mixed effects analyses, we have performedlikelihood ratio tests comparing the models with fixed effects to the null models with only therandom effects. We rejected results in which the model including fixed effects did not differsignificantly from the null model. Throughout this paper, we present Markov Chain MonteCarlo (MCMC-estimated) p-values that are considered significant at the α = 0.05 level. For allfitted LMEs, the normality and homogeneity were checked by visual inspections of residualsagainst fitted values. The results of this study are reported in two main parts.
Hemodynamics response of the patella bone to cuff occlusion. In this part the changes inTHC (ratio) and oxygen saturation (difference) during baseline and cuff occlusion are reported.The transitional periods while the cuff was inflated/deflated were removed from the data. Thendata during the baseline (denoted by BL, defined as the ≈ 5 min measurements during rest), atthe immediate beginning of the cuff occlusion (denoted by CB, defined as the first 50 cardiaccycles immediately after the cuff occlusion) and at the end of the cuff occlusion (denotedby CE, defined as the last 50 cardiac cycles of the cuff occlusion periods) were calculatedfor each parameter. To assess changes in saturation and hemoglobin concentrations, we fit anLME model to data to compare different conditions (BL, CB, CE). In these analyses BL wasconsidered as the reference and changes were reported in comparison to it. While the conditionwas the fixed effect, subject was considered as the random effect. The intercept is the fittedvalue for the baseline and the slope shows the change in comparison to the baseline.
The pulsation of the optical and the physiological properties. In this part of the study, for allsubjects, the change over time is assessed. To fit a model on the measured parameters, first allcurves are normalized by dividing each time point by the averaged value of the signal duringthe pulse—the ratio of change relative to mean is denoted with ‘r’. In case of oxygen saturationand phase, the normalization is applied by subtracting the mean of the data during one pulsefrom each time point of the pulse—the change relative to mean is denoted by ‘�’. Then, wehave compared the shape of the normalized pulses to well characterized PPG signals. EachPPG signal has a pulse transit time (PTT) that varies between subjects, organs and even in
846 P Farzam et al
different postures (Allen 2007, Allen and Murray 2003). After PTT, pulse rises to a peak (insome cases there is a dual-peak), and after the peak it falls again. Since there is a time delaybetween the start of a cardiac cycle and the start of our measurement (≈ the first 20% of wholecycle is missed), we do not observe PTT in our pulses. The pulse we measure starts fromrising mode, meets one peak and falls. After visual inspection of pulses and fitting differentfunctions to them, we conclude that a sinusoidal function is sufficient to describe our signals.For each parameter we have defined a sinusoidal function to be fitted to the data from allsubjects. We have applied a two step fitting. First, a sinusoidal function was fitted to data of allsubjects (for each subject we averaged all pulses). We recorded the obtained phase (�0). In thesecond step, we have defined a sinusoidal function with this known phase (A sin(�0) + B) tobe used by LME. Since we are not interested in the specific shape of the cardiac cycle drivenpulsations but rather their existence or absence, a sinusoidal function with two free parametersof amplitude (A) and intercept (B) is a reasonable approximation. We are most interested inwhether the amplitude, A, is significantly different from zero. While the cardiac cycle fraction(time from start of a cardiac cycle) was the fixed effect, subjects were used as a random effect.We have confirmed the absence of a trend during cuff occlusion by fitting the same sinusoidalfunction and obtaining non-significant fits (p > 0.05). For each parameter we report themeasured change during one cardiac cycle by calculating the difference between maximumand minimum of fitted curve. Depending on subject heart-rate the measurement has started atdifferent times of cardiac cycle. We have measured each subject from 150 ms after the start ofa cardiac cycle until 534 ms after the start of a cardiac cycle (figure 2). We know that differentsubjects have different heart-rates. For example, if a subject has 80 beat min−1, then for himeach cardiac cycle will take, on average, 750 ms. This implies that the moment we have startedour measurement, it has been 150
750 → 20% of a cardiac cycle. We will continue until 534 msafter the start of a cardiac cycle which means 534
600 → ∼70% of cardiac cycle. Therefore, forthis subject our measurement covers 20–70% of his cardiac cycle. In different subjects, basedon their heart-rate the measured range of their cardiac cycle is different. The conversion ofeach point to the corresponding cardiac cycle percentage is explained in section 2.4. Differentcardiac cycle fractions in the start point of different subjects makes it non-trivial to define thebeginning of the fitted line. We averaged the start points of all subjects and the fitting hasstarted from the average value.
3. Results
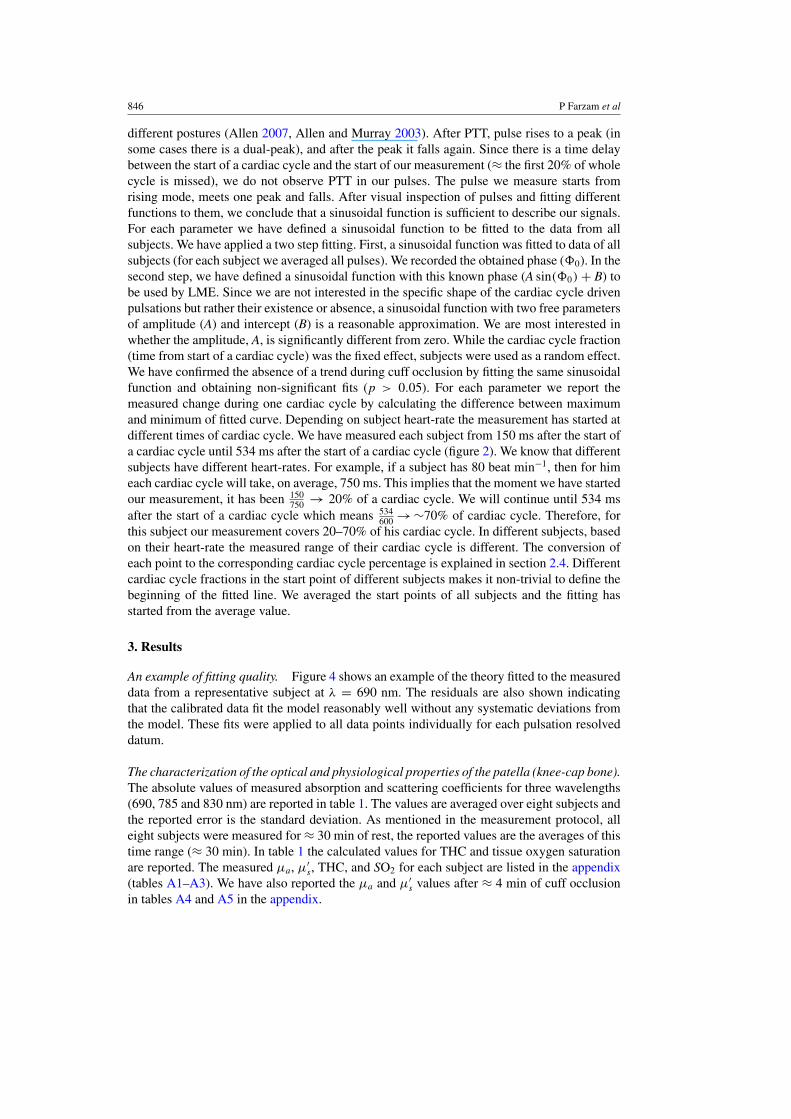
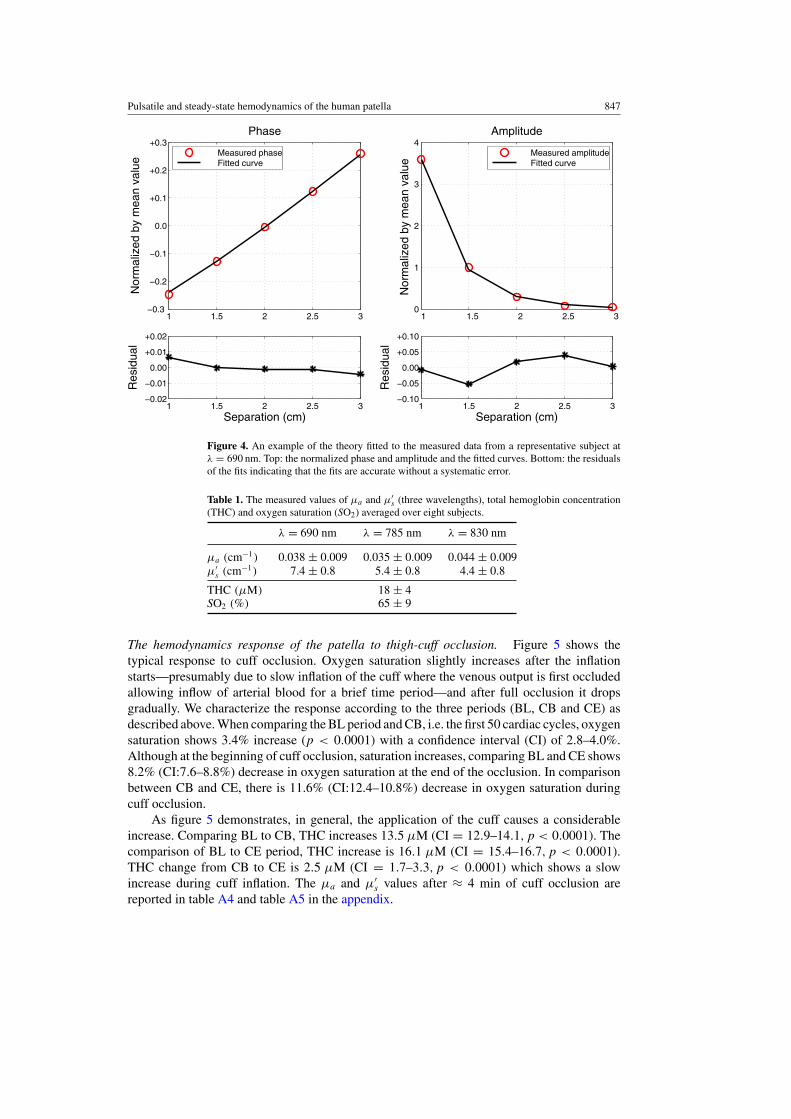
An example of fitting quality. Figure 4 shows an example of the theory fitted to the measureddata from a representative subject at λ = 690 nm. The residuals are also shown indicatingthat the calibrated data fit the model reasonably well without any systematic deviations fromthe model. These fits were applied to all data points individually for each pulsation resolveddatum.
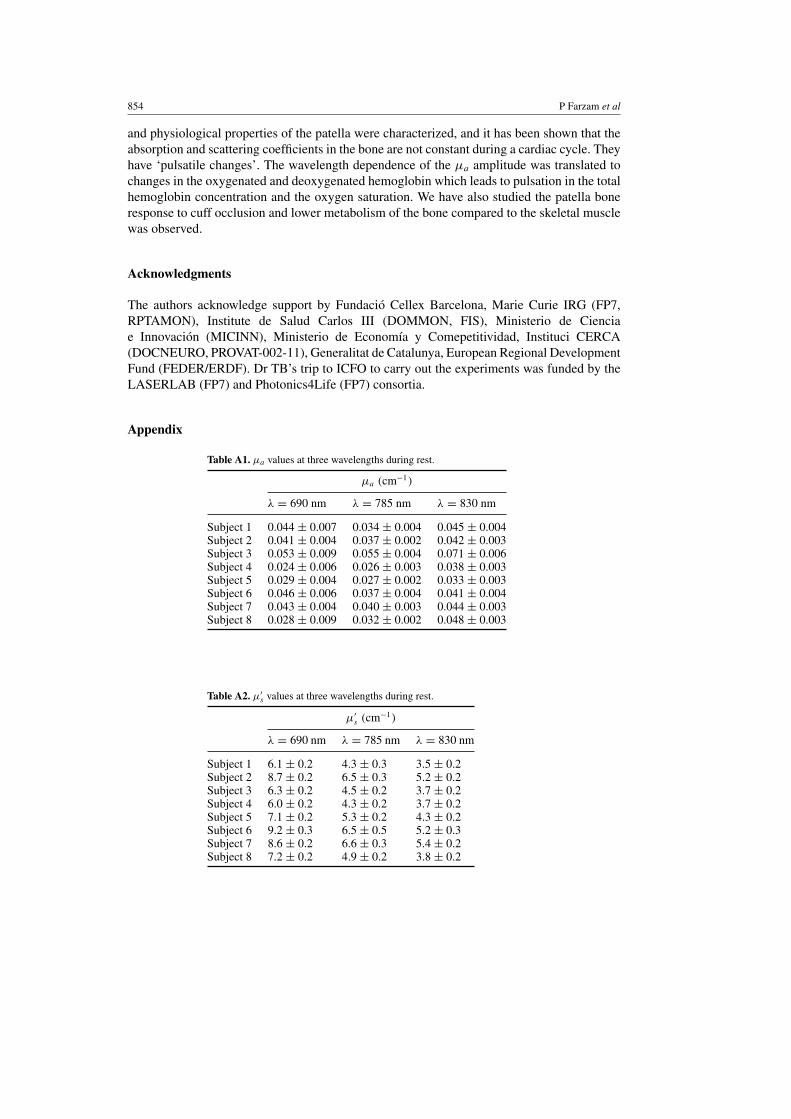
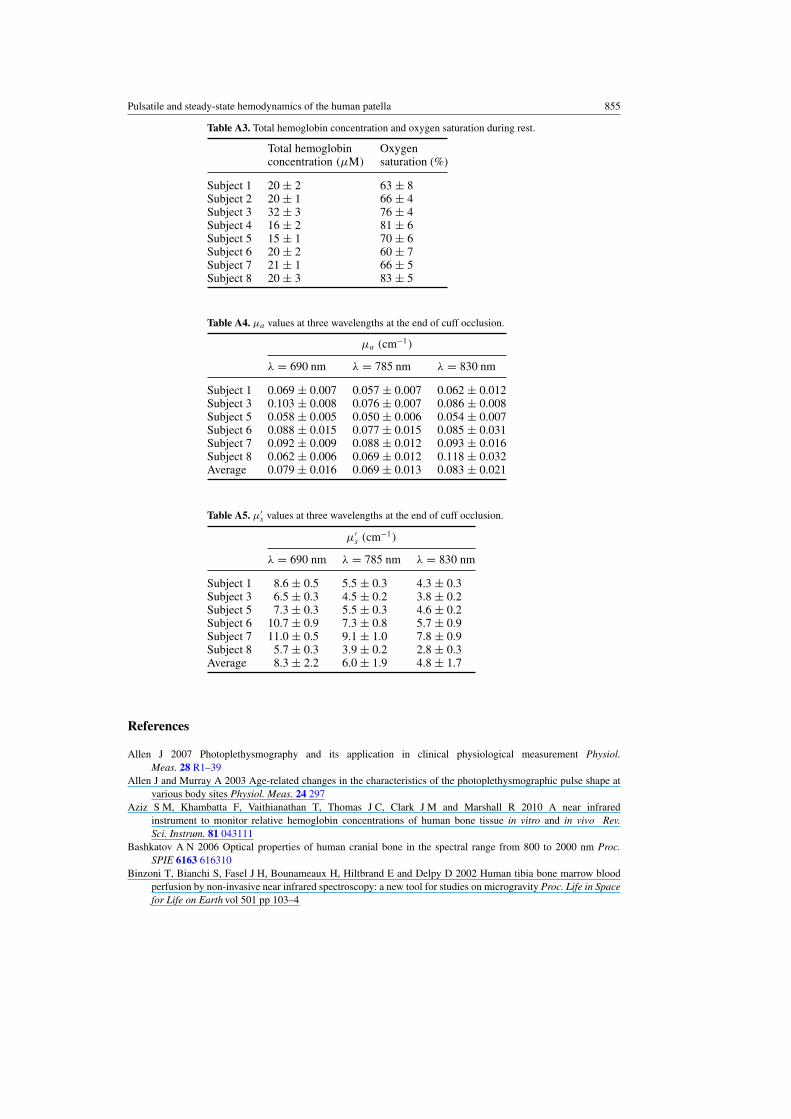
The characterization of the optical and physiological properties of the patella (knee-cap bone).The absolute values of measured absorption and scattering coefficients for three wavelengths(690, 785 and 830 nm) are reported in table 1. The values are averaged over eight subjects andthe reported error is the standard deviation. As mentioned in the measurement protocol, alleight subjects were measured for ≈ 30 min of rest, the reported values are the averages of thistime range (≈ 30 min). In table 1 the calculated values for THC and tissue oxygen saturationare reported. The measured μa, μ′
s, THC, and SO2 for each subject are listed in the appendix(tables A1–A3). We have also reported the μa and μ′
s values after ≈ 4 min of cuff occlusionin tables A4 and A5 in the appendix.
Pulsatile and steady-state hemodynamics of the human patella 847
1 1.5 2 2.5 30
1
2
3
4Amplitude
Nor
mal
ized
by
mea
n va
lue
Measured amplitude Fitted curve
1 1.5 2 2.5 3 −0.10
−0.05
0.00
+0.05
+0.10
Separation (cm)
Res
idua
l
1 1.5 2 2.5 3 −0.3
−0.2
−0.1
0.0
+0.1
+0.2
+0.3N
orm
aliz
ed b
y m
ean
valu
ePhase
Measured phase Fitted curve
1 1.5 2 2.5 3 −0.02
−0.01
0.00
+0.01
+0.02
Separation (cm)
Res
idua
l
Figure 4. An example of the theory fitted to the measured data from a representative subject atλ = 690 nm. Top: the normalized phase and amplitude and the fitted curves. Bottom: the residualsof the fits indicating that the fits are accurate without a systematic error.
Table 1. The measured values of μa and μ′s (three wavelengths), total hemoglobin concentration
(THC) and oxygen saturation (SO2) averaged over eight subjects.
λ = 690 nm λ = 785 nm λ = 830 nm
μa (cm−1) 0.038 ± 0.009 0.035 ± 0.009 0.044 ± 0.009μ′
s (cm−1) 7.4 ± 0.8 5.4 ± 0.8 4.4 ± 0.8
THC (μM) 18 ± 4SO2 (%) 65 ± 9
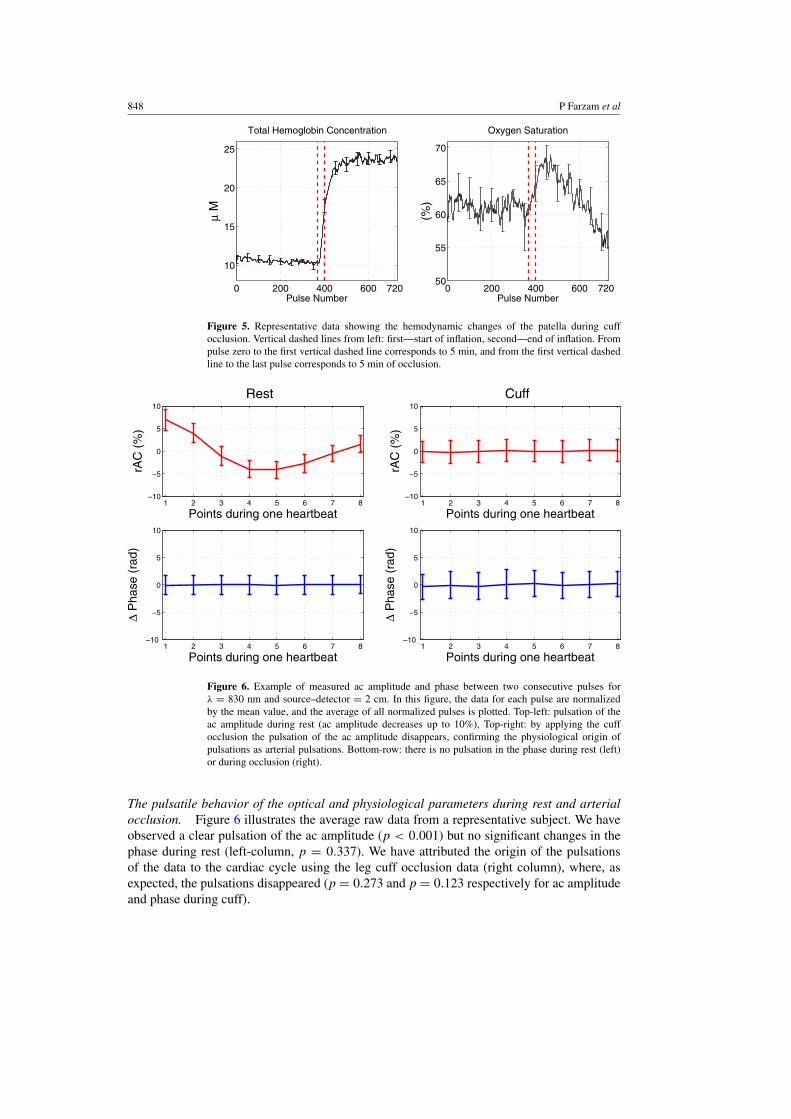
The hemodynamics response of the patella to thigh-cuff occlusion. Figure 5 shows thetypical response to cuff occlusion. Oxygen saturation slightly increases after the inflationstarts—presumably due to slow inflation of the cuff where the venous output is first occludedallowing inflow of arterial blood for a brief time period—and after full occlusion it dropsgradually. We characterize the response according to the three periods (BL, CB and CE) asdescribed above. When comparing the BL period and CB, i.e. the first 50 cardiac cycles, oxygensaturation shows 3.4% increase (p < 0.0001) with a confidence interval (CI) of 2.8–4.0%.Although at the beginning of cuff occlusion, saturation increases, comparing BL and CE shows8.2% (CI:7.6–8.8%) decrease in oxygen saturation at the end of the occlusion. In comparisonbetween CB and CE, there is 11.6% (CI:12.4–10.8%) decrease in oxygen saturation duringcuff occlusion.
As figure 5 demonstrates, in general, the application of the cuff causes a considerableincrease. Comparing BL to CB, THC increases 13.5 μM (CI = 12.9–14.1, p < 0.0001). Thecomparison of BL to CE period, THC increase is 16.1 μM (CI = 15.4–16.7, p < 0.0001).THC change from CB to CE is 2.5 μM (CI = 1.7–3.3, p < 0.0001) which shows a slowincrease during cuff inflation. The μa and μ′
s values after ≈ 4 min of cuff occlusion arereported in table A4 and table A5 in the appendix.
848 P Farzam et al
0 200 400 600 720
10
15
20
25
Total Hemoglobin Concentration
Pulse Number
μ M
0 200 400 600 72050
55
60
65
70
Oxygen Saturation
Pulse Number
(%)
Figure 5. Representative data showing the hemodynamic changes of the patella during cuffocclusion. Vertical dashed lines from left: first—start of inflation, second—end of inflation. Frompulse zero to the first vertical dashed line corresponds to 5 min, and from the first vertical dashedline to the last pulse corresponds to 5 min of occlusion.
1 2 3 4 5 6 7 8−10
−5
0
5
10
Points during one heartbeat
Rest
rAC
(%
)
1 2 3 4 5 6 7 8−10
−5
0
5
10
Points during one heartbeat
rAC
(%
)Cuff
1 2 3 4 5 6 7 8 −10
−5
0
5
10
Points during one heartbeat
Δ P
hase
(ra
d)
1 2 3 4 5 6 7 8 −10
−5
0
5
10
Points during one heartbeat
Δ P
hase
(ra
d)
Figure 6. Example of measured ac amplitude and phase between two consecutive pulses forλ = 830 nm and source–detector = 2 cm. In this figure, the data for each pulse are normalizedby the mean value, and the average of all normalized pulses is plotted. Top-left: pulsation of theac amplitude during rest (ac amplitude decreases up to 10%), Top-right: by applying the cuffocclusion the pulsation of the ac amplitude disappears, confirming the physiological origin ofpulsations as arterial pulsations. Bottom-row: there is no pulsation in the phase during rest (left)or during occlusion (right).
The pulsatile behavior of the optical and physiological parameters during rest and arterialocclusion. Figure 6 illustrates the average raw data from a representative subject. We haveobserved a clear pulsation of the ac amplitude (p < 0.001) but no significant changes in thephase during rest (left-column, p = 0.337). We have attributed the origin of the pulsationsof the data to the cardiac cycle using the leg cuff occlusion data (right column), where, asexpected, the pulsations disappeared (p = 0.273 and p = 0.123 respectively for ac amplitudeand phase during cuff).
Pulsatile and steady-state hemodynamics of the human patella 849
20 25 30 35 40 45 50 55 60−2.0
−1.5
−1.0
−0.5
0.0
0.5
1.0
1.5
Heartbeat fraction (%)
P < 0.0001
rμ a (
%)
20 25 30 35 40 45 50 55 60−2.0
−1.5
−1.0
−0.5
0.0
0.5
1.0
1.5
Heartbeat fraction (%)
P < 0.0001
rμ s′ (
%)
20 25 30 35 40 45 50 55 60−2.0
−1.5
−1.0
−0.5
0.0
0.5
1.0
1.5P = 0.57
Heartbeat fraction (%)
rμ a (
%)
20 25 30 35 40 45 50 55 60−2.0
−1.5
−1.0
−0.5
0.0
0.5
1.0
1.5P = 0.52
Heartbeat fraction (%)
rμ s′ (
%)
Rest
n = 6n = 8
n = 6n = 8
Cuff
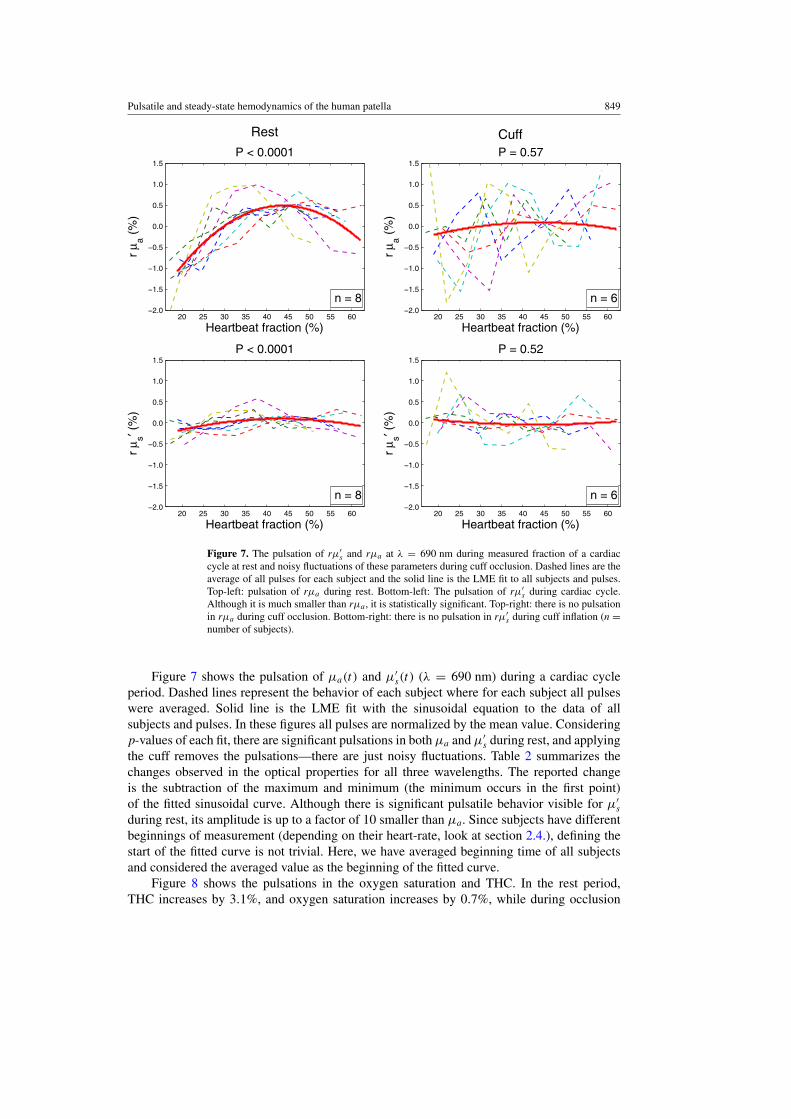
Figure 7. The pulsation of rμ′s and rμa at λ = 690 nm during measured fraction of a cardiac
cycle at rest and noisy fluctuations of these parameters during cuff occlusion. Dashed lines are theaverage of all pulses for each subject and the solid line is the LME fit to all subjects and pulses.Top-left: pulsation of rμa during rest. Bottom-left: The pulsation of rμ′
s during cardiac cycle.Although it is much smaller than rμa, it is statistically significant. Top-right: there is no pulsationin rμa during cuff occlusion. Bottom-right: there is no pulsation in rμ′
s during cuff inflation (n =number of subjects).
Figure 7 shows the pulsation of μa(t) and μ′s(t) (λ = 690 nm) during a cardiac cycle
period. Dashed lines represent the behavior of each subject where for each subject all pulseswere averaged. Solid line is the LME fit with the sinusoidal equation to the data of allsubjects and pulses. In these figures all pulses are normalized by the mean value. Consideringp-values of each fit, there are significant pulsations in both μa and μ′
s during rest, and applyingthe cuff removes the pulsations—there are just noisy fluctuations. Table 2 summarizes thechanges observed in the optical properties for all three wavelengths. The reported changeis the subtraction of the maximum and minimum (the minimum occurs in the first point)of the fitted sinusoidal curve. Although there is significant pulsatile behavior visible for μ′
sduring rest, its amplitude is up to a factor of 10 smaller than μa. Since subjects have differentbeginnings of measurement (depending on their heart-rate, look at section 2.4.), defining thestart of the fitted curve is not trivial. Here, we have averaged beginning time of all subjectsand considered the averaged value as the beginning of the fitted curve.
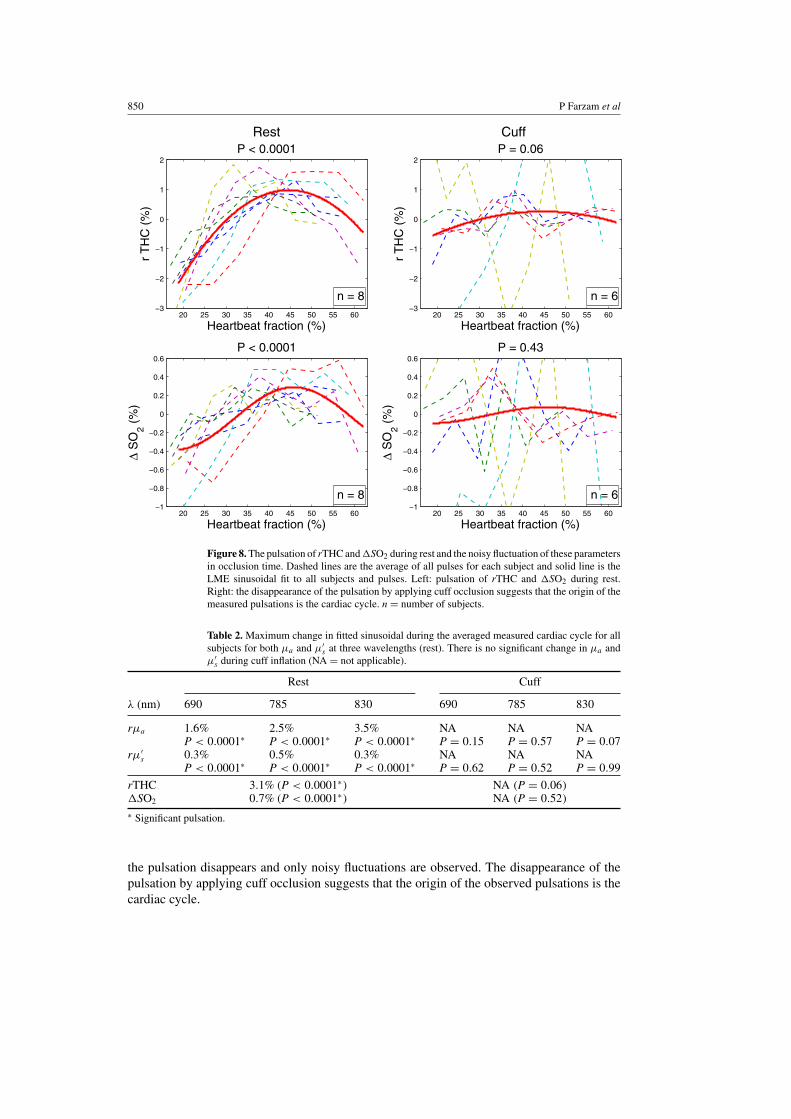
Figure 8 shows the pulsations in the oxygen saturation and THC. In the rest period,THC increases by 3.1%, and oxygen saturation increases by 0.7%, while during occlusion
850 P Farzam et al
20 25 30 35 40 45 50 55 60−3
−2
−1
0
1
2
Heartbeat fraction (%)
r T
HC
(%
)P < 0.0001
20 25 30 35 40 45 50 55 60−1
−0.8
−0.6
−0.4
−0.2
0
0.2
0.4
0.6
Heartbeat fraction (%)
Δ S
O2 (
%)
P < 0.0001
20 25 30 35 40 45 50 55 60−3
−2
−1
0
1
2P = 0.06
Heartbeat fraction (%)
r T
HC
(%
)
20 25 30 35 40 45 50 55 60−1
−0.8
−0.6
−0.4
−0.2
0
0.2
0.4
0.6P = 0.43
Heartbeat fraction (%)
Δ S
O2 (
%)
Rest
n = 6n = 8
n = 6n = 8
Cuff
Figure 8. The pulsation of rTHC and �SO2 during rest and the noisy fluctuation of these parametersin occlusion time. Dashed lines are the average of all pulses for each subject and solid line is theLME sinusoidal fit to all subjects and pulses. Left: pulsation of rTHC and �SO2 during rest.Right: the disappearance of the pulsation by applying cuff occlusion suggests that the origin of themeasured pulsations is the cardiac cycle. n = number of subjects.
Table 2. Maximum change in fitted sinusoidal during the averaged measured cardiac cycle for allsubjects for both μa and μ′
s at three wavelengths (rest). There is no significant change in μa andμ′
s during cuff inflation (NA = not applicable).
Rest Cuff
λ (nm) 690 785 830 690 785 830
rμa 1.6% 2.5% 3.5% NA NA NAP < 0.0001∗ P < 0.0001∗ P < 0.0001∗ P = 0.15 P = 0.57 P = 0.07
rμ′s 0.3% 0.5% 0.3% NA NA NA
P < 0.0001∗ P < 0.0001∗ P < 0.0001∗ P = 0.62 P = 0.52 P = 0.99
rTHC 3.1% (P < 0.0001∗) NA (P = 0.06)�SO2 0.7% (P < 0.0001∗) NA (P = 0.52)
∗ Significant pulsation.
the pulsation disappears and only noisy fluctuations are observed. The disappearance of thepulsation by applying cuff occlusion suggests that the origin of the observed pulsations is thecardiac cycle.
Pulsatile and steady-state hemodynamics of the human patella 851
4. Discussion
In this work, we study the optical and physiological properties of the healthy patella bone,their pulsatile behavior in response to the cardiac cycle and their response to full arterial cuffocclusion. We now compare our study to previous reports. A few groups have measured invivo human bone tissue to investigate absolute values of μa and μ′
s (Xu et al 2001, Pifferiet al 2004). The first study has investigated the calcaneus (μa ≈ 0.07 and μ′
s ≈ 14 (1 cm−1)for λ = 785 nm), and the second one has measured the finger bone (μa ≈ 0.20–0.25 andμ′
s ≈ 20–25 (1 cm−1) for λ = 785 nm). The reported μa, μ′s in these studies are higher than
what we have observed (μa ≈ 0.035 and μ′s ≈ 5.4 (1 cm−1) for λ = 785 nm). This may be
due to differences in the tissue and bone structure in different sites. The subject numbers arequite limited in all studies (including ours) and the methods are different. We stress that ourfindings are in the general ranges observed in healthy tissues and bones.
One of the main challenges in this study is to prove that the signals are indeed originatingmainly from the bone and not the skin or other superficial tissues below the probe. Thishypothesis has been studied by Naslund et al (2006) on the patella bone and it has beenshown that if the source–detector separation is large enough (in their study it is 2.5 cm) andthe wavelength belongs to the near-infrared regime (in this regime photons will experiencemany scattering events and the penetration depth is higher), the signal is not sensitive to thesuperficial tissue —the harmonic dc change due to autoregulatory activity disappears (Naslundet al 2006).
In our case, the source–detector separations varied between 10–30 mm and an averagepatella is 45 × 34 mm2 with ≈22.5 mm thickness (Iranpour et al 2008). Therefore, it is areasonable assumption to consider patella bone as the dominant contributor to our signals.Roughly, the depth of optical penetration with our probe is greater than the thickness of theskin and less than the combined thickness of the skin and the patella, i.e. we are probing atissue volume which does not extend below the patella. In the analysis we use all source–detector separations to fit the theory to the measured amplitude and phase (look at figure 4).Therefore we cannot compare the results of small and large separations, and only raw datacomparison is possible. The qualitative analysis of the raw amplitude data from the shortestand longest source–detector separations did not reveal any difference beyond those expectedby the physics of the photon diffusion model. Detailed analysis of this is beyond the scope ofthis paper.
We have reported our findings in two main parts, the pulsatile behavior of the patella andits response to the cuff occlusion. We now discuss the result of each part separately.
Pulsatile behavior of the optical and physiological parameters. Our focus was to investigatewhether there were any changes in the absorption and the reduced scattering coefficientsat all wavelengths that were suggestive of being related to the cardiac cycle. We have alsoinvestigated the resulting changes (or lack thereof) in blood oxygen saturation and hemoglobinconcentration.
In normal conditions, i.e. during non-occluded resting periods, pulsatile behavior wasdetected in the ac amplitude. The pulsatile behavior of measured ac amplitude disappearedby applying cuff occlusion. When the cuff pressure is much higher than the arterial pressure,the arterial blood does not enter the tissue below the occluded part; then we can hypothesizethat there should not be any pulsations in the signals that are related to the cardiac cycle.We have applied a cuff pressure of 260 mmHg. Since the pressure that tourniquet applies tothe tissue is higher than systolic pressure, it will block the blood flow and is equivalent tofull occlusion (Tuncali et al 2006). In our measurements, the pulsation of the ac amplitude
852 P Farzam et al
disappeared during occlusion and the cardiac cycle origin of the observed pulsatile behaviorhas been confirmed. The phase did not show any pulsation during rest or cuff.
The photon diffusion model tells us that the phase delay has a direct relation with μ′s
increase and a reverse relation with μa increase. From the flat detected phase we can assumethat both μa and μ′
s have changed in the same direction, and the phase increase caused by oneof them has compensated the effect of the other. Since the ac amplitude decreases during thecardiac cycle, we can predict μa increases and therefore, μ′
s also increases. This was confirmedby the fitted results shown in figure 7. As expected, both μa and μ′
s have pulsatile behaviorduring each cardiac cycle, but the change in μa is up to one order of magnitude bigger thanμ′
s. These changes also disappear during cuff occlusion.Table 2 demonstrates that different wavelengths have different amplitude in the pulsation
and the changes are wavelength-dependent. It implies a physiological origin for the pulsation.we translate the change in μa at different wavelengths to physiological parameters (hemoglobinconcentration and oxygen saturation). In figure 8, we observe that both hemoglobinconcentration and oxygen saturation show pulsatile behavior during a cardiac cycle. Asexpected these pulsations disappeared by applying the cuff occlusion. The pulsation of theTHC suggests that although the patella is a rigid bone, the vasculature in this bone can dilateand the THC can increase.
This result is in contradiction with the assumption of previous works (Naslund et al 2006,2007, 2011) where they have assumed that the THC in the bone is constant and the pulsation inthe bone is an indicator of the changes in blood flow. This hypothesis was further evaluated, byapplying LDF to measure changes in RBC count and velocity in rigid bones during a cardiaccycle (Binzoni et al 2013). It has been shown that the RBC concentration is constant and thisstudy has not detected any physiological origin for pulsations but blood velocity.
In another study it has been shown that the physiological parameters (hemoglobinconcentration and oxygen saturation) can change in the rigid bone (Binzoni et al 2006), theconstant RBC count in latter work (Binzoni et al 2013) has been explained by differentiatingfast and slow changes. In slow changes, like response to cuff inflation, that we have observedin this study or in response to changes in the bed angle, reported by Binzoni et al (2006), theinterstitial fluid had some extra time to diffuse away from the bone. In this way, this volume canbe replaced by blood (dilating vessels) and an increase in THC occurs. Due to time constraints,we did not record the recovery from the deflation of the cuff in all subjects. It was, however,recorded in two subjects out of the eight, which has revealed a rapid recovery to the baselineupon deflation.
In fast events such as changes during a single cardiac cycle, the pulsation may be toofast for the interstitial fluid to diffuse, and thus the number of RBC counts remains constant.However, the absence of an observed physiological change in the number of RBCs during acardiac cycle in the large-source–detector separation (interoptode) LDF measurement (Binzoniet al 2013), can also be caused by the non-sensitivity of LDF to small changes. It is due tothe fact that LDF at large interoptode spacing is more sensitive to velocity changes than tothe changes in the RBC number. Small changes in μa and μ′
s (in our case of 2.5% and 0.5%,respectively) imply an estimated (Kienle 2001, Binzoni and Van De Ville 2011) increase in theprobability to detect a moving RBC (this parameter is linked to the RBC count) of 2.2 × 10⁻⁴.This increase is probably too small to be detected by the LDF method.
Further studies utilizing other optical techniques, for example using diffuse correlationspectroscopy (DCS) (Durduran et al 2010, Yu et al 2005, 2007), that measures the blood flowin the same type of vasculature could help us to understand the details of this physiology. Infact, PPG-like measurements with DCS were utilized in forearm and wrist muscle (Li et al2006) in the past to show phase differences between blood flow and blood volume.
Pulsatile and steady-state hemodynamics of the human patella 853
We note that in this study the pulsatile behavior of THC is demonstrated but due to the factthat we have measured just a fraction of the cardiac cycle (between 20% and 50%), we cannotobserve the whole cycle of physiological change in a complete cardiac cycle. In principle, theinstrument could be adapted to measure the whole cardiac cycle by utilizing a more complextriggering algorithm or by taking data continuously at a higher rate and carrying out a Fourieranalysis to filter out the pulsatile component.
The patella bone during the rest and cuff occlusion. We have characterized the opticaland physiological properties of patella in the baseline. The absolute values of the measuredabsorption and scattering coefficients for three wavelengths (690, 785 and 830 nm) arecalculated by averaging over eight subjects. We translate the difference between differentwavelengths to physiological properties (hemoglobin concentration and oxygen saturation).The measured oxygen saturation in baseline is 65% which is in the range of healthy humantissue and bones (Yu et al 2005, Quaresima et al 2004, Pifferi et al 2004). The measured THCis less than skeletal muscle, ≈40 μM (Yu et al 2005), and calcaneus bone, ≈25 μM (Pifferiet al 2004) which may still be in the range of the physiological variations between subjectssince both of the earlier studies used a relatively small number of subjects.
We have also studied the physiological changes in response to arterial cuff occlusion andduring occlusion. In this bone measurement THC increases during the occlusion. This is inaccordance with the increase in Hb and HbO2 previously observed in human tibia duringarterial occlusion (Binzoni et al 2003). It can be explained as follows; since the femoralartery is coming from the thigh muscle to the knee, cuff pressure squeezes the underlyingmuscle and the blood in the femoral artery is pushed to the non-squeezed bones.
Oxygen saturation slightly increases after starting the cuff inflation, and by completionof the inflation, it drops gradually. Because of relatively slow inflation, there was a time delaybetween the venous and arterial occlusion, which causes initial increase of oxygen saturation.This initial increase was also caused by squeezed blood from the femoral artery enteringthe knee. After completing the cuff inflation the amount of oxygen in the tissue is constantand since bone is a live tissue, it consumes part of the oxygen in the blood. Therefore weobserve a gradual decrease of oxygen saturation. Our result of measurement on occludedbone is in agreement with previous works (Binzoni et al 2003, Klasing and Zange 2003).Oxygen saturation decreases slowly during cuff inflation. In 5 min of occlusion, the oxygensaturation has decreased 11.3%, while in leg muscle in 3 min it has decreased 17.1% (Yuet al 2005). Therefore, the data suggest that the consumption of oxygen in bone is slower thanin muscle, which implies a lower metabolism in bone compared to the skeletal muscle. PPGstudies also demonstrate the difference between bone signal and other tissue, e.g. in occlusionmeasurement, there is a significant difference between bone and skin reaction to cuff deflation.While the ac component of the skin returns to baseline value, the bone shows an increase inac component compared to the baseline (Naslund et al 2006).
An obvious shortcoming of this study is the limited number of subjects which makes thestatistical statements unsubstantial. However, since the method is noninvasive and relativelystraightforward to apply, this could be remedied in future studies.
5. Conclusion
We have demonstrated that frequency domain near-infrared spectrometer is a promisingtechnique to study the pulsations and the physical properties of bones and normal tissue.In the future, therefore, it may be applied to study vascular and skeletal diseases. The optical
854 P Farzam et al
and physiological properties of the patella were characterized, and it has been shown that theabsorption and scattering coefficients in the bone are not constant during a cardiac cycle. Theyhave ‘pulsatile changes’. The wavelength dependence of the μa amplitude was translated tochanges in the oxygenated and deoxygenated hemoglobin which leads to pulsation in the totalhemoglobin concentration and the oxygen saturation. We have also studied the patella boneresponse to cuff occlusion and lower metabolism of the bone compared to the skeletal musclewas observed.
Acknowledgments
The authors acknowledge support by Fundacio Cellex Barcelona, Marie Curie IRG (FP7,RPTAMON), Institute de Salud Carlos III (DOMMON, FIS), Ministerio de Cienciae Innovacion (MICINN), Ministerio de Economıa y Comepetitividad, Instituci CERCA(DOCNEURO, PROVAT-002-11), Generalitat de Catalunya, European Regional DevelopmentFund (FEDER/ERDF). Dr TB’s trip to ICFO to carry out the experiments was funded by theLASERLAB (FP7) and Photonics4Life (FP7) consortia.
Appendix
Table A1. μa values at three wavelengths during rest.
μa (cm−1)
λ = 690 nm λ = 785 nm λ = 830 nm
Subject 1 0.044 ± 0.007 0.034 ± 0.004 0.045 ± 0.004Subject 2 0.041 ± 0.004 0.037 ± 0.002 0.042 ± 0.003Subject 3 0.053 ± 0.009 0.055 ± 0.004 0.071 ± 0.006Subject 4 0.024 ± 0.006 0.026 ± 0.003 0.038 ± 0.003Subject 5 0.029 ± 0.004 0.027 ± 0.002 0.033 ± 0.003Subject 6 0.046 ± 0.006 0.037 ± 0.004 0.041 ± 0.004Subject 7 0.043 ± 0.004 0.040 ± 0.003 0.044 ± 0.003Subject 8 0.028 ± 0.009 0.032 ± 0.002 0.048 ± 0.003
Table A2. μ′s values at three wavelengths during rest.
μ′s (cm−1)
λ = 690 nm λ = 785 nm λ = 830 nm
Subject 1 6.1 ± 0.2 4.3 ± 0.3 3.5 ± 0.2Subject 2 8.7 ± 0.2 6.5 ± 0.3 5.2 ± 0.2Subject 3 6.3 ± 0.2 4.5 ± 0.2 3.7 ± 0.2Subject 4 6.0 ± 0.2 4.3 ± 0.2 3.7 ± 0.2Subject 5 7.1 ± 0.2 5.3 ± 0.2 4.3 ± 0.2Subject 6 9.2 ± 0.3 6.5 ± 0.5 5.2 ± 0.3Subject 7 8.6 ± 0.2 6.6 ± 0.3 5.4 ± 0.2Subject 8 7.2 ± 0.2 4.9 ± 0.2 3.8 ± 0.2
Pulsatile and steady-state hemodynamics of the human patella 855
Table A3. Total hemoglobin concentration and oxygen saturation during rest.
Total hemoglobin Oxygenconcentration (μM) saturation (%)
Subject 1 20 ± 2 63 ± 8Subject 2 20 ± 1 66 ± 4Subject 3 32 ± 3 76 ± 4Subject 4 16 ± 2 81 ± 6Subject 5 15 ± 1 70 ± 6Subject 6 20 ± 2 60 ± 7Subject 7 21 ± 1 66 ± 5Subject 8 20 ± 3 83 ± 5
Table A4. μa values at three wavelengths at the end of cuff occlusion.
μa (cm−1)
λ = 690 nm λ = 785 nm λ = 830 nm
Subject 1 0.069 ± 0.007 0.057 ± 0.007 0.062 ± 0.012Subject 3 0.103 ± 0.008 0.076 ± 0.007 0.086 ± 0.008Subject 5 0.058 ± 0.005 0.050 ± 0.006 0.054 ± 0.007Subject 6 0.088 ± 0.015 0.077 ± 0.015 0.085 ± 0.031Subject 7 0.092 ± 0.009 0.088 ± 0.012 0.093 ± 0.016Subject 8 0.062 ± 0.006 0.069 ± 0.012 0.118 ± 0.032Average 0.079 ± 0.016 0.069 ± 0.013 0.083 ± 0.021
Table A5. μ′s values at three wavelengths at the end of cuff occlusion.
μ′s (cm−1)
λ = 690 nm λ = 785 nm λ = 830 nm
Subject 1 8.6 ± 0.5 5.5 ± 0.3 4.3 ± 0.3Subject 3 6.5 ± 0.3 4.5 ± 0.2 3.8 ± 0.2Subject 5 7.3 ± 0.3 5.5 ± 0.3 4.6 ± 0.2Subject 6 10.7 ± 0.9 7.3 ± 0.8 5.7 ± 0.9Subject 7 11.0 ± 0.5 9.1 ± 1.0 7.8 ± 0.9Subject 8 5.7 ± 0.3 3.9 ± 0.2 2.8 ± 0.3Average 8.3 ± 2.2 6.0 ± 1.9 4.8 ± 1.7
References
Allen J 2007 Photoplethysmography and its application in clinical physiological measurement Physiol.Meas. 28 R1–39
Allen J and Murray A 2003 Age-related changes in the characteristics of the photoplethysmographic pulse shape atvarious body sites Physiol. Meas. 24 297
Aziz S M, Khambatta F, Vaithianathan T, Thomas J C, Clark J M and Marshall R 2010 A near infraredinstrument to monitor relative hemoglobin concentrations of human bone tissue in vitro and in vivo Rev.Sci. Instrum. 81 043111
Bashkatov A N 2006 Optical properties of human cranial bone in the spectral range from 800 to 2000 nm Proc.SPIE 6163 616310
Binzoni T, Bianchi S, Fasel J H, Bounameaux H, Hiltbrand E and Delpy D 2002 Human tibia bone marrow bloodperfusion by non-invasive near infrared spectroscopy: a new tool for studies on microgravity Proc. Life in Spacefor Life on Earth vol 501 pp 103–4

856 P Farzam et al
Binzoni T, Boggett D and Van De Ville D 2011 Laser-Doppler flowmetry at large interoptode spacing in human tibiadiaphysis: Monte Carlo simulations and preliminary experimental results Physiol. Meas. 32 N33
Binzoni T, Leung T, Hollis V, Bianchi S, Fasel J H D, Bounameaux H, Hiltbrand E and Delpy D 2003 Humantibia bone marrow: defining a model for the study of haemodynamics as a function of age by near infraredspectroscopy J. Physiol. Anthropol. Appl. Human Sci. 22 211–8
Binzoni T, Leung T S, Courvoisier C, Giust R, Tribillon G, Gharbi T and Delpy D T 2006 Blood volumeand haemoglobin oxygen content changes in human bone marrow during orthostatic stress J. Physiol.Anthropol. 25 1–6
Binzoni T, Tchernin D, Hyacinthe J N, Van De Ville D and Richiardi J 2013 Pulsatile blood flow in humanbone assessed by laser-Doppler flowmetry and the interpretation of photoplethysmographic signals Physiol.Meas. 34 N25
Binzoni T and Van De Ville D 2011 Noninvasive probing of the neurovascular system in human bone/bone marrowusing near-infrared light J. Innovative Opt. Health Sci. 04 183
Brookes M and Revell W J 1998 Blood Supply of Bone: Scientific Aspects (London: Springer)Challoner A V J and Ramsay C A 1974 A photoelectric plethysmography for the measurement of cutaneous blood
flow Phys. Med. Biol. 19 317–28Chance B, Cope M, Gratton E, Ramanujam N and Tromberg B 1998 Phase measurement of light absorption and
scatter in human tissue Rev. Sci. Instrum. 69 3457Durduran T, Choe R, Baker W B and Yodh A G 2010 Diffuse optics for tissue monitoring and tomography Rep. Prog.
Phys. 73 076701Feddersen B A, Piston D W and Gratton E 1989 Digital parallel acquisition in frequency domain fluorimetry Rev. Sci.
Instrum. 60 2929Firbank M, Hiraoka M, Essenpreis M and Delpy D T 1993 In the wavelength range 650–950 nm Phys. Med.
Biol. 38 503Hertzman A B and Dillon J B 1940 Applications of photoelectric plethysmography in peripheral vascular disease Am.
Heart J. 20 750–61Iranpour F, Merican A M, Amis A A and Cobb J P 2008 The width:thickness ratio of the patella: an aid in knee
arthroplasty Clin. Orthop. Rel. Res. 466 1198–203Kienle A 2001 Non-invasive determination of muscle blood flow in the extremities from laser Doppler spectra Phys.
Med. Biol. 46 1231Klasing M and Zange J 2003 In vivo quantitative near-infrared spectroscopy in skeletal muscle and bone during rest
and isometric exercise European Conf. on Biomedical Optics vol 5138 pp 318–22Klose A, Hielscher A H, Hanson K M and Beuthan J 1998 Two- and three-dimensional optical tomography of finger
joints for diagnostics of rheumatoid arthritis Proc. SPIE 3566 151–60Li J, Jaillon F, Dietsche G, Maret G and Gisler T 2006 Pulsation-resolved deep tissue dynamics measured with
diffusing-wave spectroscopy Opt. Express 14 7841–51Mateus J and Hargens A R 2012 Photoplethysmography for non-invasive in vivo measurement of bone hemodynamics
Physiol. Meas. 33 1027McCarthy I 2006 The physiology of bone blood flow: a review J. Bone Joint Surg. Am. 88 4–9Mourant J R, Freyer J P, Hielscher A H, Eick A A, Shen D and Johnson T M 1998 Mechanisms of light scattering
from biological cells relevant to noninvasive optical-tissue diagnostics Appl. Opt. 37 3586–93Murray W B and Foster P A 1996 The peripheral pulse wave: information overlooked J. Clin. Monit. 12 365–77Naslund J, Pettersson J, Lundeberg T, Linnarsson D and Lindberg L G 2006 Non-invasive continuous estimation of
blood flow changes in human patellar bone Med. Biol. Eng. Comput. 44 501–9Naslund J, Walden M and Lindberg L G 2007 Decreased pulsatile blood flow in the patella in patellofemoral pain
syndrome Am. J. Sports Med. 35 1668–73Naslund J E, Naslund S, Lundeberg E, Lindberg L G and Lund I 2011 Bone blood flow is influenced by muscle
contractions J. Biomed. Sci. Eng. 04 490–6Pifferi A, Torricelli A, Taroni P, Bassi A, Chikoidze E, Giambattistelli E and Cubeddu R 2004 Optical biopsy of bone
tissue: a step toward the diagnosis of bone pathologies J. Biomed. Opt. 9 474–80Pinheiro J C and Bates D M 2000 Mixed-effects models in S and S-PLUS (New York: Springer)Prahl S Optical absorption of hemoglobin http://omlc.ogi.edu/spectraPrapavat V, Runge W, Mans J, Krause A, Beuthan J and Muller G 1997 The development of a finger joint phantom
for the optical simulation of early inflammatory rheumatic changes Biomed. Tech. 42 319Quaresima V, Ferrari M, Franceschini M A, Hoimes M L and Fantini S 2004 Spatial distribution of vastus
lateralis blood flow and oxyhemoglobin saturation measured at the end of isometric quadriceps contractionby multichannel near-infrared spectroscopy J. Biomed. Opt. 9 413–20
Shelley K H 2007 Photoplethysmography: beyond the calculation of arterial oxygen saturation and heart rate Anesth.Analg. 105 S31–6

Pulsatile and steady-state hemodynamics of the human patella 857
Tuncali B, Karci A, Tuncali B E, Mavioglu O, Ozkan M, Bacakoglu A K, Baydur H, Ekin A and Elar Z 2006 A newmethod for estimating arterial occlusion pressure in optimizing pneumatic tourniquet inflation pressure Anesth.Analg. 102 1752–7
Ugryumova N, Matcher S J and Attenburrow D P 2004 Measurement of bone mineral density via light scatteringPhys. Med. Biol. 49 469
White D R, Widdowson E M, Woodard H Q and Dickerson J W T 1991 The composition of body tissues: II. Fetus toyoung adult Br. J. Radiol. 64 149–59
White D R, Woodard H Q and Hammond S M 1987 Average soft-tissue and bone models for use in radiation dosimetryBr. J. Radiol. 60 907–13
Wilkinson I B and Webb D J 2001 Venous occlusion plethysmography in cardiovascular research: methodology andclinical applications Br. J. Clin. Pharmacol. 52 631–46
Xu Y, Iftimia N, Jiang H, Key L and Bolster M 2001 Imaging of in vitro and in vivo bones and joints with continuous-wave diffuse optical tomography Opt. express 8 447–51
Yodh A and Chance B 1995 Spectroscopy and imaging with diffusing light Phys. Today 48 34–40Yu G, Durduran T, Lech G, Zhou C, Chance B, Mohler E R and Yodh A G 2005 Time-dependent blood flow and
oxygenation in human skeletal muscles measured with noninvasive near-infrared diffuse optical spectroscopiesJ. Biomed. Opt. 10 24027
Yu G, Floyd T F, Durduran T, Zhou C, Wang J, Detre J A and Yodh A G 2007 Validation of diffuse correlationspectroscopy for muscle blood flow with concurrent arterial spin labeled perfusion MRI Opt. Express 15 1064–75
Zhang Q and Jiang H 2005 Three-dimensional diffuse optical imaging of hand joints: system description and phantomstudies Opt. Lasers Eng. 43 1237–51


