Embed Size (px)
Citation preview

Available online at www.sciencedirect.com
www.elsevier.com/locate/jfoodeng
Journal of Food Engineering 86 (2008) 349–357
Puncture and stress relaxation behaviour of taro paste as affectedby moisture content and puncture rate and depth
Y. Nicolas Njintang a,*, Regis Kesteloot b, Guillaume Blancher b, Aboubakar c,Joel Scher d, Carl M.F. Mbofung c
a Department of Biological Sciences, Faculty of Sciences, University of Ngaoundere, P.O. Box 454, Adamaoua, Cameroonb Laboratoire de Qualite des Aliments, Institut Superieur d’Agriculture de Lille, 41 Rue du Port, 59046 Lille Cedex, France
c Department of Food Sciences and Nutrition, National School of Agro-industrial Sciences, University of Ngaoundere, Cameroond Laboratoire de Sciences et Genie Alimentaires, ENSAIA-INPL, 2, Avenue de la Foret de Haye, BP 172-F-54505 Vandoeuvre les Nancy, France
Received 3 May 2007; received in revised form 11 October 2007; accepted 15 October 2007Available online 23 October 2007
Abstract
The effect of puncture rate (10, 100 and 250 mm min�1) and depth (5, 10 and 20 mm) on the stress relaxation of taro pastes of mois-ture content 55% and 66% was studied. The analysed parameters were hardness (HAR), fracturability (FRA), force of adhesion (FOA),force of relaxation (FOR), ratio of fracture and relaxation time (ROT), rate of relaxation (ROR), visco-elasticity index (VEI) and theunrelaxed stress (SRU). The results showed that HAR, FOR, FRA and FOA were linearly correlated to each other and increased sig-nificantly with decrease in moisture content. In addition a general reduction of SRU was observed with increase in water. VEI, ROR andSRU were significantly linearly correlated to puncture rate while ROT was linearly correlated to puncture depth. The principal compo-nent analysis revealed that the first principal component (PC1) which represented 52% of the total variance was correlated to HAR,FOA, FRA and FOR. The second principal (PC2) component correlated to VEI, ROR and SRU and represented 31% of the variancewhereas the third principal component (PC3) correlated to ROT and represented 15% of the variance. It was shown that the Euclidiandistance between achu of moisture content 55% and 66% increased with increase in puncture rate and depth.� 2007 Elsevier Ltd. All rights reserved.
Keywords: Taro paste; Water content; Puncture; Relaxation; Texture profile analysis
1. Introduction
Taro (Colocasia esculenta) corms and cormels areimportant sources of carbohydrates and minerals for manypopulations of the tropical areas. In Central Africa postharvest technology of taro is largely limited thereby affect-ing its production (Njintang, 2003). Recently a number ofstudies were initiated to produce taro flour which can servein the preparation of achu, a paste obtained by cooking,peeling and pounding the corms or cormels to a smoothedand homogeneous texture (Njintang and Mbofung,
0260-8774/$ - see front matter � 2007 Elsevier Ltd. All rights reserved.
doi:10.1016/j.jfoodeng.2007.10.011
* Corresponding author. Tel.: +237 987 09 79.E-mail address: [email protected] (Y.N. Njintang).
2003a,b, 2006; Njintang et al., 2006, 2007a,b). It has beenshown that a process of cooking the tuber whole, followedby peeling, slicing and freeze-drying produced slices which,after addition of boiling water and mixing give a paste withcharacteristics close to that traditionally made (Njintanget al., 2006).
The acceptability of achu has been shown to be relatedto three principal attributes: colour, texture and flavour,of which texture was the most determinant parameter(Njintang et al., 2000). Achu texture is characterised byits elastic behaviour and average hardness (Njintang,2003). There are limited, if any, studies on the instrumentalcharacterisation of achu texture (texture profile analysis).To approach such a study requires the definition of toolsfor analysis and operating conditions. According to

Time (s)
-20 0 20 40 60 80 100 120 140
Fo
rce
(N)
-1.0
-0.5
0.0
0.5
1.0
1.5
2.0
(I) (II)
(III)
(IV)
Time (s)
-20 0 20 40 60 80 100 120 140
Fo
rce
(N)
-0.4
-0.2
0.0
0.2
0.4
0.6
(I)
(II)
(III)
(IV)
A
B
Fig. 1. Typical texture profile analysis curves of taro pastes followingpuncture–relaxation. A (achu moisture content 55%, puncture depths10 mm, puncture rate 100 mm min�1); B (achu moisture content 66.4%,puncture depth 10 mm, puncture rate 100 mm min�1).
350 Y.N. Njintang et al. / Journal of Food Engineering 86 (2008) 349–357
Bourne (2002), puncture study is a test frequently used tomeasure the texture of foods, particularly pastes. Its popu-larity resulted from many advantages which are the ease ofmanufacturing and using of the equipment, the speed andthe reliability of the analyses made on it, and its applicationto all categories of foods. Taking this into consideration,the texture profile characteristics of a paste depend onthe conditions of use of the instrument which are the punc-ture rate and depth. The puncture rate is a very significantfactor when visco-elastic foods are tested, because they arestress-rate dependent (Bourne, 2002). In addition it hasbeen shown that the puncture depth has an influence onthe texture profile of some but not all foods (Bourne, 2002).
The present study aimed at determining the effect ofpuncture depth and rate on the texture profile of achu attwo moisture levels using the puncture stress relaxationtechnique on an Instron machine. The final objective wasthe determination of the more appropriate puncture depthand rate to differentiate between the two achu samples.
2. Material and methods
2.1. Biological material
The young tubers (cormels) of the red variety of tarocalled Ibo coco used in the present study were harvestedat 9 months of maturity from an experimental farm nearthe University of Ngaoundere. The cormels were taken tothe laboratory, cleaned and washed with tap water, andkept to dry on cement ground for 24 h. The next day, thesamples were sealed in polyethylene bag and air fret toFrance for the analysis.
2.2. Dough preparation
The cormels were cooked in a pressure cooker (SEB,France) for 30 min, cooled for 10 min at ambient tempera-ture and pounded (100 g during 15 min) in a porcelainmortar to a smooth and homogeneous paste. Half of theresulting paste, moisture content 55%, was diluted with dis-tilled water up to a moisture content of 66%. The moisturecontent was verified by differential weighing before andafter drying of a paste sample of 0.5 g at 110 �C in an infra-red dessicator balance (Sartorius, France).
2.3. Puncture relaxation analysis
The measuring instrument was the Instron universal4031, equipped with a sensor 100 N (UKAS Calibration).Measurement was applied on achu samples held in a100 ml volumetric plastic container (mean diameter6.1 cm, depth 3 cm) according to the following procedure:a cylinder probe was set to penetrate the paste at varyingpuncture rate (10, 100 and 250 mm min�1) and depth (5,10 and 20 mm), and to withdraw after a period of 120 sduring which the relaxation of the paste was monitored.The probe used had a circular end of diameter 0.78 mm
and a surface contact of 47.8 mm2. Considering the quan-tities of raw material available, the analyses were done intriplicate for each condition. Texture profile analysis(TPA) parameters were obtained by analysing the forcevs. time curve (Bourne, 2002). From TPA curve (Fig. 1),Fracturability, FRA (point I) was taken as the force (N)necessary to fracture the paste during the puncture; Hard-ness, HAR (point II), was the resistant force (N) of thepaste at the end of the puncture; The force of relaxation,FOR (point III), indicated the force which was exertedon the probe at the end of the 120 s of relaxation whilethe force of adhesion, FOA (point IV) was the maximumand negative force during the removal of the probe.
We defined and calculated ROT as being the ratio inpercentage of time of fracture to that of puncture. The por-tion of curve under the points III and IV represents therelaxation of taro paste. According to Peleg (1980), thisportion of curve can be summarised mathematically asfollowed:

Y.N. Njintang et al. / Journal of Food Engineering 86 (2008) 349–357 351
Y ¼ HAR� tHAR � F ðtÞ
¼ RORþ SRU� t
where HAR is the hardness, F(t) is the force at time t (s) ofrelaxation; SRU (dimensionless) is the quantity of stress re-mained unrelaxed and ROR (s) is the reverse of the rate ofrelaxation.
Then 1/ROR (s�1) is the initial decay rate and 1/SRUdenotes the asymptotic value of the relaxed portion ofthe stress. A plot of Y against relaxation time (t) in SigmaPlot graph package yielded straight lines with the slopeequivalent to SRU and the intercept on Y axis equivalentto ROR.
Finally the visco-elasticity index, VEI, was calculatedaccording to the relation:
VEI ¼ HAR � FOR
HAR
2.4. Experimental design and processing of data
The experimental design was factorial 2 � 3 � 3 with thevariable moisture content at two levels (55% and 66%), andthe variables puncture depth (5, 10 and 20 mm) and speed(10, 10 and 250 mm min�1) at three levels each. The multi-ple analysis of variance on Statgraphic (1997) software wasdone to determine the influence of the independent vari-ables on the measured parameters. The Pearson correlationand principal components (PCA) analyses were carried outon Statbox 6.4 software. The Euclidian distance betweenachu sample at 66% moisture content and 55% moisturecontent for each couple of puncture rate/depth was deter-mined using the hierarchical ascendant classification analy-sis on Statbox 6.4 software. The two- and three-dimensional graphs were plotted using the SigmaPlot andStatistica softwares, respectively.
Fig. 2. Effect of rate and depth of puncture on the hardness of taro pasteat water content 55.0%.
3. Results and discussion
Fig. 1 represents the typical shape of the curves recordedduring the texture profile analysis of taro paste. In this fig-ure, the curve type A was obtained for the paste of mois-ture content 55% at puncture depths 10 and 20 mm whilethe curve type B was obtained for the paste of moisturecontent 66.4%, and for the measurements taken on thepaste of moisture content 55% at puncture depth 5 mm.The difference between the curve types A and B was atthe rupture point I. This rupture is completed for the typeA curve with a change of direction while for the type B lit-tle change is observed in the slope. In some of the curvestype A, the change of direction was significant in such away that HAR was lower than FRA. For each of the curveobtained, all the defined characteristics of the paste wereextracted and subjected to analysis. In this respect, thePeleg (1980) relation was successfully shown to follow therelaxation of taro paste. In fact, the determination coeffi-cient, r2 was shown to be equal or higher than 0.99 in all
cases. The analysis of variance and correlation showed ingeneral that FOA, HAR, SRU, ROT and VEI were signif-icantly (p < 0.05) influenced by the moisture content of thepaste, the puncture depth and rate. On the other hand, thepuncture rate did not have significant influence on FORwhile the puncture depth and the moisture content didnot have significant effect on FRA and ROR, respectively.
3.1. Variables of force
The variation of hardness of taro dough of 55% mois-ture content as a function of puncture rate and depth isshown in Fig. 2. The hardness (HAR) of the dough werein the range of 0.2–2.25 N what ever the conditions andthe sample, values in which fall those (0.23–0.37 N)recently reported on taro dough made from flours of differ-ent particle size and variety (Njintang et al., 2007c). Ascompared to other foodstuffs, hardness of taro doughwas significantly lower than that (3–40 N) reported byBhattacharya et al. (2006) on maize dough. The relativelylower hardness of our paste could be mostly attributed tothe cooking process, used in the present study, which gela-tinised the starch as opposed to the ungelatinised pastestudied by Bhattacharya et al. (2006). HAR of taro pastewas shown to linearly decrease (r = �0.86; p < 0.01) withincrease in moisture content. This was expected since hard-ness is a direct measure of the resistance of the dough tostress. This effect of moisture on hardness has already beenreported on previous studies by Bhattacharya et al. (2006),Tabil et al. (2002) and Jonsson et al. (2001) working oncorn dough, alfalfa cubes and Salmon, respectively. Inaddition increase in puncture rate and depth induced a sig-nificant (P < 0.05) increase in HAR suggesting a depth and

Table 1Pearson correlation matrix of the dependent and independent variables
HAR FOA FOR FRA SRU ROR ROT VEI
FOA 0.87 (0.00) 1FOR 0.88 (0.00) 0.78 (0.00) 1FRA 0.98 (0.00) 0.78 (0.00) 0.82 (0.00) 1SRU �0.11 (0.52) �0.22 (0.204) 0.31 (0.07) �0.14 (0.42) 1ROR �0.30 (0.08) �0.26 (0.13) 0.07 (0.70) �0.34 (0.05) 0.66 (0.00) 1ROT 0.15 (0.38) �0.13 (0.45) 0.06 (0.74) 0.26 (0.12) �0.14 (0.41) �0.38 (0.02) 1VEI 0.19 (0.28) 0.29 (0.09) �0.23 (0.17) 0.21 (0.22) �0.94 (0.00) �0.81 (0.00) 0.23 (0.18) 1Puncture depth 0.31 (0.07) 0.57 (0.00) 0.31 (0.07) 0.16 (0.35) �0.07 (0.69) 0.24 (0.16) �0.76 (0.00) �0.01 (0.94)Water content �0.83 (0.00) �0.61 (0.00) �0.93 (0.00) �0.82 (0.00) �0.31 (0.06) 0.03 (0.85) �0.37 (0.03) 0.21 (0.21)Puncture rate 0.37 (0.03) 0.38 (0.02) �0.05 (0.80) 0.40 (0.01) �0.78 (0.00) �0.72 (0.00) 0.23 (0.17) 0.87 (0.00)
n = 36; values within parentheses are the levels of significance.
352 Y.N. Njintang et al. / Journal of Food Engineering 86 (2008) 349–357
rate dependence of the hardness generally evaluated onfood products.
In conformity with our recent study (Njintang et al.,2007c), all the variables of force were significantly corre-lated with each other and in this respect significant correla-tions (r > 0.78; p < 0.01) were observed between HAR andFRA, HAR and FOA, HAR and FOR, suggesting similarbehaviour (Table 1). In this respect, the increase in mois-ture content was shown to induce a decrease in FOA,FOR and FRA. However puncture depth had no signifi-cant effect on FRA while puncture rate had no significanteffect on FOA.
3.2. Relaxation parameters SRU, ROR and the visco-
elasticity index (VEI)
The effects of puncture depth and rate on SRU andROR are shown in Figs. 3 and 4, respectively. SRU varied
Fig. 3. Effect of puncture rate and depth on the stress remained unrelaxed(SRU) of taro paste.
Fig. 4. Effect of puncture rate and depth on the reverse of the rate ofrelaxation stress (ROR) of taro paste of water content 55.0%.
between 1.80 and 77.69, values in which fall the ranges3.21-5.29 N and 25.2–38.6 reported for taro (Njintanget al., 2007c) and corn dough (Bhattacharya et al., 2006),respectively. SRU was observed to decrease with puncturerate and moisture content as confirmed by the correlationanalysis summarised in Table 1. Similar effect of moisturecontent on SRU of maize dough had been reported (Bhat-tacharya et al., 2006). A study by Mammarella et al. (2002)on the compression of a gel mixture of alginate and K car-rageenan showed that SRU increased with the increase inK carrageenan. The increase in carrageenan can beregarded as a decrease in moisture content and in thisregard our findings are in concordance with those reportedby Mammarella et al. (2002). In an earlier study, Bhattach-arya and Narasimha (1997) associated lower magnitude ofSRU to visco-elastic liquid, suggesting that taro paste withlower SRU value is more viscous. In this respect decreasein puncture rate significantly increased the elastic behav-iour of taro paste. This was evident for puncture rates

Y.N. Njintang et al. / Journal of Food Engineering 86 (2008) 349–357 353
lower than 10 mm min�1 while no consistent effect wasobserved above this value.
For ROR which indicates the reverse of the initial decayrate, it was generally observed that it decreased withincrease in puncture rate as well as with decrease in punc-ture depth. From all the variables analysed in the presentstudy, only ROR was sample independent. This was notthe case with findings by Bhattacharya et al. (2006) whoreported higher values of ROR for lower moisture corndough samples. It is however important to point out thatROR was positively linearly correlated to SRU suggestinga similar behaviour. ROR of taro paste varied between 1.17and 1.82 s, which falls in the ranges 1.5–1.9 s, and 1.27–1.42 s reported for corn and taro dough, respectively(Bhattacharya et al., 2006; Njintang et al., 2007c), but sys-tematically lower than the range (10–18 s) reported forBlack gram dough (Bhattacharya and Narasimha, 1997).These differences could be due to water content whichwas higher for corn 42–62% and taro dough (55–75%) com-pared to 32–40% for Black gram. According to Bhattach-arya et al. (2006), a high ROR value indicates doughwith pronounced elastic behaviour suggesting that lowerpuncture rate, <10 mm min�1, had strong positive effecton the elastic behaviour of taro paste.
VEI is indicative of the visco-elasticity of a product. Inthis study the VEI of taro was highly correlated withSRU (r = �0.94; p < 0.01) and ROR (r = �0.81;p < 0.01). High values of both SRU and ROR indicate amore elastic, ‘solidlike’ product, as 1/SRU is related tothe asymptotic level of stress not relaxed at long times,and since 1/ROR is related to the initial stress decay rate(Gamero et al., 1993; Bhattacharya et al., 2006). In this
Fig. 5. Effect of puncture rate and depth on the visco-elasticity index oftaro paste of water content 55.0%.
respect negative correlation of VEI with ROR means thathigh values of VEI are related to lower values of ROR, sug-gesting less elastic samples. Inversely low values of VEIindicated high elastic samples. The variation in VEI(0.51–0.85) as a function of puncture rate and depth is pre-sented in Fig. 5. In our recent study on the relaxation of tarodough as affected by particle size and drying temperature,we reported very close range values of 0.67–0.78 (Njintanget al., 2007c). The present study further revealed that VEIsignificantly linearly (P < 0.01) increased with increase inpuncture rate while no consistent effect of moisture contentand puncture depth was observed. This showed that theflow behaviour of taro paste is rate dependent with highpuncture rate rendering the sample more viscous. Bhattach-arya et al. (2006) reported a decrease in elasticity followingan increase in moisture content of corn dough.
3.3. Variation of ROT
The variation in ROT (range 6–45%) of taro paste at55% moisture content with puncture rate and depth canbe visualised in Fig. 6. In general a significant decrease inROT occurred as the moisture content (r = �0.37;p = 0.03) and the puncture depth (r = �0.79; p < 0.01)increased. Meanwhile no consistent variation was observedwith puncture rate. Since the time of puncture is not sampledependant, the variation in ROT will mostly be attributedto the time of fracture which varied not only with the mois-ture content of taro paste, but also with the puncture rateand depth. In this respect high values of ROT indicatedeasier fracture sample which was evident in the case oflow moisture sample.
Fig. 6. Effect of puncture rate and depth on the ratio of time of fractureand time of puncture of taro paste of water content 55.0%.

354 Y.N. Njintang et al. / Journal of Food Engineering 86 (2008) 349–357
3.4. Correlation analysis and principal component analysis
The texture profile characteristics of taro paste can beorganised into three groups according to their correlationwith the independent variables namely moisture content,puncture rate and depth (Table 1). The first group con-tained the variables HAR, FRA, FOR and FOA whichshowed a coefficient of correlation (between �0.6 and�1.0) with moisture content. This suggests that an increase
ROT
VEI
ROR
FOA
FOR
FRAHAR
-1.5
-1
-0.5
0
0.5
1
1.5
-1.5 -1 -0.5 0 0.5 1 1.5
PC 1 (52 %)
PC
2 (
31 %
)
ROT
VEIROR
FOA
FORFRAHAR
-1.5
-1
-0.5
0
0.5
1
1.5
-1.5 -1 -0.5 0 0.5 1 1.5
PC 1 (52 %)
PC
3 (
15 %
)
Fig. 7. Correlation circle of the texture variables and the principalcomponents of taro paste. HAR (hardness), FRA (fracturability), FOR(force of relaxation), FOA (force of adhesion), ROR (rate of relaxation)and VEI (visco-elasticity index), ROT (ratio of penetration and fractur-ation times).
in the moisture content induced a significant (P < 0.05) andlinear decrease in these variables. The principal componentanalysis (PCA) showed that this group is correlated to thefirst principal component (PC1) which accounted for 52%of variance observed between samples. In a recent studywhere taro pastes were prepared from flours not only differ-ent with their particle size, but also with the drying temper-ature and variety, we found a PC1 axis with 48%contribution of the total variance (Njintang et al., 2007c).It was equally found in that study that PC1 was relatedto FOR (34% contribution), HAR (33% contribution)
55CZ
55CY
55CX
55BZ
55BY
55BX
55AZ
55AY
55AX
66CZ
66CY
66CX
66BZ
66BY
66BX
66AZ
66AY
66AX HA RFRA
FOR
FOA
ROR
VEI
ROTwater
depht
rate
PC 1 (52 %)
PC
2 (
31 %
)
55CZ55CY55CX
55BZ55BY
55BX
55AZ
55AY
55AX
66CZ
66CY66CX
66BZ66BY
66BX
66AZ66AY
66AX
HA RFRA
FOR
FOA
ROR
VEI
ROT
water
depht
rate
-1 -0.5 0 0.5 1 1.5
PC 1 (52 %)
PC
3 (
15 %
)
-1.5
-1
-0.5
0
0.5
1
1.5
-1.5
-1
-0.5
0
0.5
1
1.5
-1 -0.5 0 0.5 1 1.5
Fig. 8. Two-dimensional space diagram of taro paste from principalcomponent analysis. Different fonts indicate different samples. From eachfont, the first two numbers indicates the moisture content, followed with afirst letter (A, B or C) indicating the puncture depth (respectively, 5, 10and 20 mm), and the second letter (X, Y, Z) indicating the puncture rate(respectively, 10, 100 and 250 mm/min).
Y.N. Njintang et al. / Journal of Food Engineering 86 (2008) 349–357 355
and FOA (30% contribution). Similarly we observed in thepresent study that the variables HAR, FRA, FOR andFOA expressed each one in PC1 a variance of 27%, 25%,24% and 22%, respectively (Fig. 7). This clearly demon-strated that the textures of achu samples are different basedat least at 50% on the variables of force. The distribution ofthe achu shown in Fig. 8 revealed that PC1 clearly sepa-rated the pastes of moisture content 55% from those ofmoisture content 66%. In this respect the achu with mois-ture content 55% presented the characteristic of highforces, whereas those of moisture content 66% possessedcharacteristics of weak forces. Fig. 8 also showed a gooddiscrimination of achu along the PC1 axis according tothe puncture rate and depth, with low puncture depthand rate samples aligned at the right of the map whilelow puncture depth and rate samples are aligned left.
The second group of variables made up of ROR andVEI showed a good linear correlation with the puncturerate. ROR increased with puncture rate whereas VEIdecreased. PCA revealed that ROR and VEI with respec-tive contributions of 43.3% and 42.6% represented the vari-ables of the second principal component (PC2), whichaccounted for 31% of the original variance. Our recentwork reported on taro revealed similar proportions andcharacteristics of PC2 (Njintang et al., 2007c). PC2 axisseparated the products basically according to their punc-ture rate. It can then be seen on the distribution of theproducts (Fig. 8) a categorisation of achu along the PC2axis, with high speed achu samples having high values ofVEI and low speed samples characterised by high valuesof ROR. Generally variables SRU, ROR and VEI charac-terise the relaxation phenomenon of the paste. The valuesof SRU and ROR obtained permitted to locate taro pastein the category of visco-elastic solid products. VEI variedbetween 0.5 and 0.83 from more elastic to more viscous.The high values of SRU showed that when taro pastewas subjected to a constraint, there was always a residual
Penetratio
Pen
etra
tio
n r
ate
(mm
/min
)
50
100
150
200
250
5 10
19.5
1
17.9
7
Fig. 9. Effect of puncture rate and depth on the Euclidian dista
stress. The visco-elastic property of taro paste had alsobeen shown in earlier studies (Njintang et al., 2006,2007b) on a cone-plate stress controlled rheometer in creepmode.
The third group of variables contained only ROT, whichcorrelated to the puncture depth. ROT (accounting for84.5% in PC3 axis), was the principal variable associatedwith the third principal component (PC3) which accountedfor 15% of the original variance. The achu samples on thisaxis are firstly separated according to their puncture depth.Generally achu samples analysed at low puncture depthpossessed high values of ROT while achu samples withhigh puncture depth possessed low values of ROT.
This study clearly show that the parameters that mostcharacterised taro paste are HAR, FRA, FOA and FOR.These variables of force accounted for more than 50% ofthe total variance among taro paste. As shown in Fig. 7the proximity of HAR and FRA, suggesting that onlyone of these two variables could be used to characterisethe paste. In accordance with our present and earlier study(Njintang et al., 2007c), Tabil et al. (2002) reported onalfalfa cubes a linear relationship between the variablesmaximum force, fracturability, module of hardness andthe hardness number of Meyer. According to theseauthors, all these parameters are usually used to character-ise the hardness.
Generally, although the difference between achu ofmoisture content 55% and that of 66% were primarilyfound in the first principal component, other equallyimportant contributing factors were observed to exist inPC2 and PC3 component. In fact the PC2 and PC3 coordi-nates of achu samples moisture content 55% were system-atically higher than those of achu samples moisturecontent 66%. It is worth mentioning that among the fourvariables of forces (FOA, FRA, HAR and FOR), FORhad 10.3% contribution on the PC2 axis. This suggestedthat FOR could be responsible for the correlation of PC2
n depth (mm)
15 20
16.4
4
14.9
1
13.3
8
11.8
5
10.3
2
nce between taro pastes of 66% and 55% moisture content.

356 Y.N. Njintang et al. / Journal of Food Engineering 86 (2008) 349–357
with moisture content, and thus the separation of achusamples with different moisture content on the PC2 axis.In the same light FOA had 10.24% contribution on thePC3 axis, which could be responsible for the separationof achu of different moisture content along the PC3 axis.
3.5. Hierarchical ascendant classification
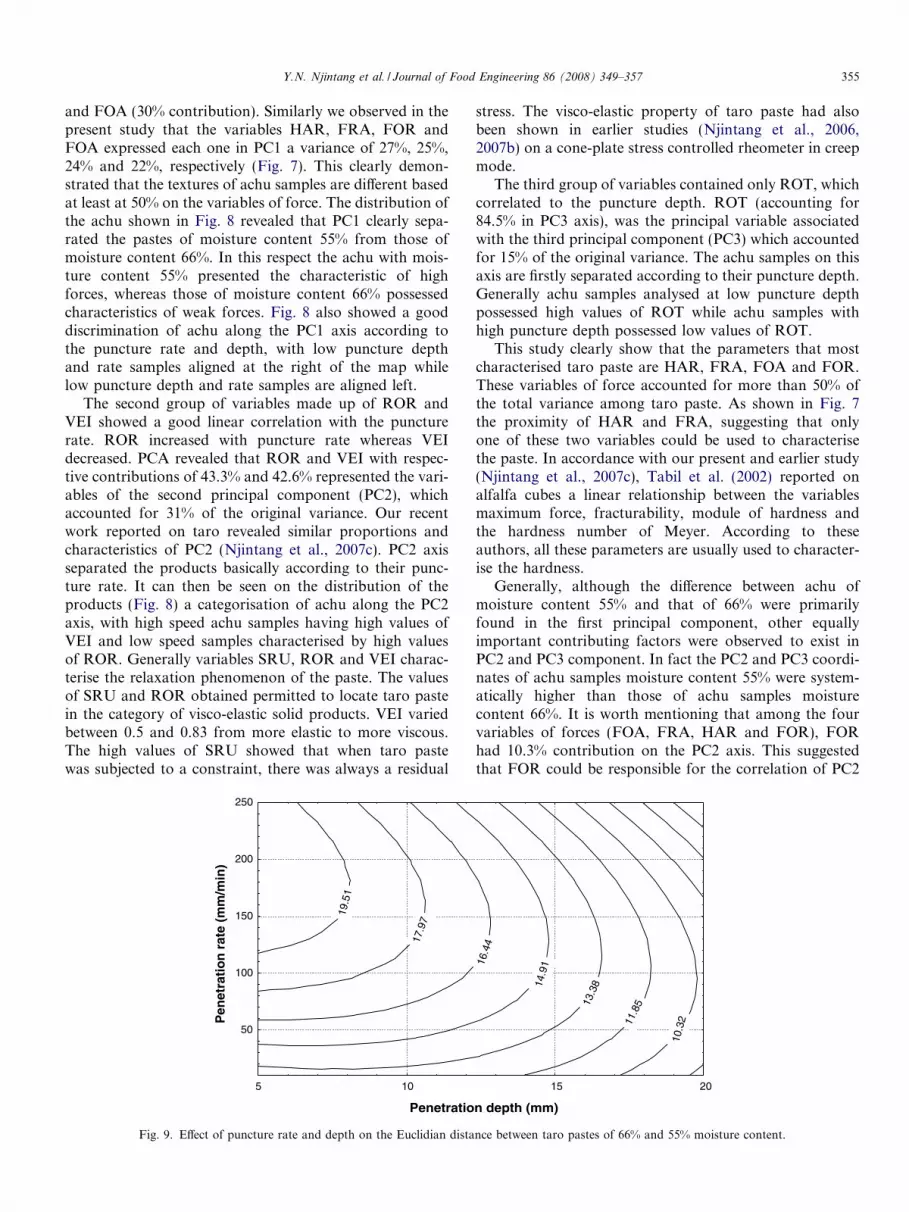
The general objective of this study was to determine theappropriate instrumental conditions for differentiatingbetween achu of moisture content of 55% and that of mois-ture content of 66%. In this respect we calculated for eachcouple rate/depth of puncture the Euclidian distancebetween achu moisture content 55% and that of moisturecontent 66%. The variation of the distance with puncturerate and depth is shown in Fig. 9. It was observed thatthe puncture rate and depth had significant (P < 0.01) effecton the Euclidian distance, suggesting that all the couplesrate/depth of puncture could be used to differentiate thepastes. In general, the distance increased with increase inthe puncture rate, and a decrease in the puncture depth.However the contour plot showed a high distance in therange of puncture rate 100–250 mm min�1 and puncturedepth 5–10 mm. At puncture rate lower than 100 mmmm�1, and puncture depth range 5–10 mm, no significantvariation was observed on the distance. Since the surfaceof the product hardened during sample preparation, itwould be advisable to go deeper but not exceeding a punc-ture depth 10 mm, due to the probable effect of the bottomof the container on the texture profile.
4. Conclusion
It can be concluded from this study that taro pasteexhibits visco-elastic behaviour, varying from more elasticto more viscous with increase in puncture rate. In theexception of the reverse of rate of relaxation, all the vari-ables used to characterise the texture profile of achu aremoisture/sample dependant. From the sample-dependantvariables, hardness, fracturability, force of adhesion andforce of relaxation are interrelated and highly differentiatesbetween the two achu samples; while the unrelaxed stress,the visco-elasticity index and the ratio of fracture andpuncture time are mostly instrument conditions dependent.In addition the Euclidian distance between texture charac-teristics of the two achu samples increases with increase inpuncture rate and decrease in puncture depth. It is appar-ent that puncture depth 10 mm and puncture rate100 mm min�1 are good operational conditions of theinstrument that can be used to discriminate between thetexture profile of achu samples.
Acknowledgement
The authors are grateful for the financial assistance fromInternational Foundation for Science (IFS, Stockholm,
Sweden) and COMSTECH. We also thank the AgenceUniversitaire de la Francophonie (AUF) which, throughthe post doctorate scholarship award to Njintang, facili-tated the carrying out of the study in the Laboratoire qua-lite des aliments of the Institut Superieur d’Agriculture(ISA), Lille, France.
References
Bhattacharya, S., Narasimha, H.V., 1997. Puncture and stress relaxationbehaviour of Black gram (Phaseolus mungo) flour-based papad dough.Journal of Food Process Engineering 20, 301–316.
Bhattacharya, S., Narasimha, H.V., Bhattacharya, S., 2006. Rheology ofcorn dough with gum arabic: stress relaxation and two-cycle com-pression testing and their relationship with sensory attributes. Journalof Food Engineering 74, 89–95.
Bourne, M., 2002. Food Texture and Viscosity: Concept and Measure-ment, second ed. Academic Press, Elsevier, London, UK.
Gamero, M., Fiszman, S.M., Duran, L., 1993. Stress relaxation of fruitgels. Evaluation of models and effects of concentration. Journal ofFood Science 58, 1125–1128, 1134.
Jonsson, A., Sigurgisladottir, S., Hafsteinsson, H., Kristbergsson, K.,2001. Textural properties of raw Atlantic salmon (Salmo salar) filletsmeasured by different methods in comparison to expressible moisture.Aquaculture Nutrition 7, 81–89.
Mammarella, E.J., De Piante Vicın, D.A., Rubiolo, A.C., 2002. Evalu-ation of stress–strain for characterization of the rheological behaviorof alginate and carrageenan gels. Brazilian Journal of ChemicalEngineering 19, 403–409.
Njintang, Y.N., 2003. Studies on the production of taro (Colocasia
esculenta) flour for use in the preparation of achu – a taro base food.Doctorate/Ph.D thesis, University of Ngaoundere, Cameroon.
Njintang, Y.N., Mbofung, C.M.F., 2003a. Kinetics of starch gelatinisa-tion and mass transfer during cooking of taro (Colocasia esculenta L.Schott) slices. Starch/Starke 55, 170–176.
Njintang, Y.N., Mbofung, C.M.F., 2003b. Development of taro (Coloc-
asia esculenta (L) Schott) flour as an ingredient in food processing:effect of gelatinisation and drying temperature on the dehydrationkinetics and colour of flour. Journal of Food Engineering 58, 259–265.
Njintang, Y.N., Mbofung, C.M.F., 2006. Effect of precooking time anddrying temperature on the physico-chemical characteristics and in-vitro carbohydrate digestibility of taro flour. Lebensmittel-Wissens-chaft und-Technologie 39, 684–691.
Njintang, Y.N., Soudy, I.D., Kengni, N.C., Fombang, E., Facho, B.,Mbofung, C.M.F., 2000. Utilisation and post harvest technologies oftaro (Colocasia esculenta) in Chad and Cameroon. Cameroon Journalof Biological and Biochemical Science 10, 23–30.
Njintang, Y.N., Parker, M.L., Moates, G.K., Mbofung, C.M.F., Smith,A.C., Waldron, K.W., 2006. Rheology and microstructure of achu, afood based on taro (Colocasia esculenta L. Schott), as affected bymethod of preparation. Journal of the Science of Food and Agriculture86, 902–907.
Njintang, Y.N., Abdou Bouba, A., Mbofung, C.M.F., Aboubakar,Bennett, R.N., Parker, M.L., Faulds, C.M., Smith, A.C., Waldron,K.W., 2007a. Biochemical characteristics of taro (Colocasia esculenta
L. Schoot) as determinant factors of the extent of browning duringachu preparation. American Journal of Food Technology 2, 60–70.
Njintang, Y.N., Mbofung, C.M.F., Moates, G.K., Parker, M.L., Faulk,C., Smith, A.C., Waldron, W.K., 2007b. Functional properties of taroflour, and relationship to Creep-recovery and sensory characteristics ofachu (a taro based paste). Journal of Food Engineering 82, 114–120.
Njintang, Y.N., Mbofung, C.M.F., Kesteloot, R., 2007c. Multivariateanalysis of the effect of drying method and particle size of flour on theinstrumental texture characteristics of paste made from two varieties oftaro (Colocasia esculenta L. Schott) flour. Journal of Food Engineering81, 250–256.

Y.N. Njintang et al. / Journal of Food Engineering 86 (2008) 349–357 357
Peleg, M., 1980. Linearization of relaxation and creep curves of solidbiological materials. Journal of Rheology 24, 451.
Statgraphics, 1997. Statgraphics Plus for Windows 3.0. Manugistics Inc.,Rockville, MD.
Tabil, J.L.G., Sokhansanj, S., Crerar, W.J., Patil, R.T., Khoshtaghaza,M.H., Opoku, A., 2002. Physical characterization of alfalfa cubes: I.Hardness. Canadian Biosystems Engineering 44, 355–363.


![THE NAME OF ALLAH SWT ON TARO [ARBI] VEGETABLE](https://img.pdfslide.net/doc/110x75/634eef2dca6e77396f0c624f/the-name-of-allah-swt-on-taro-arbi-vegetable.jpg)

