Embed Size (px)
Citation preview

Regional Municipality of WaterlooPlanning and Works CommitteeAddendum Agenda
Tuesday, April 12, 2022, 9:00 a.m.150 Frederick Street, Kitchener, Ontario
Should you require an alternative format please contact the Regional Clerk at Tel.: 519-575-4400,TTY: 519-575-4605, or [email protected]
Pages
1. Call to Order
2. Land Acknowledgement
3. Declarations of Pecuniary Interest under the “Municipal Conflict of Interest Act”
4. Delegations
4.1. Dr. Mike Moffatt, Bob Schickedanz and Larry Kotseff, Smart ProsperityInstitutere: Housing Demand and Family Formation
*4.2. Shoaib Ahmed, CEO, SCOOTY (Scooty Mobility Inc.)re: E-scooter Traffic and Parking By-law Updates (TES-TRS-22-06) andShared Micromobility Program Implementation Plan (TES-TRS-22-07)
*4.3. Chris Schafer, Vice President, Government Affairs, Bird Canadare: Shared Micromobility Program Implementation Plan (TES-TRS-22-07)
*4.4. Ashley Brown, Head of Government Partnerships, Spin Mobilityre: TES-TRS-22-07, Micromobility – Shared Program ImplementationPlan
*4.5. Isaac Ransom, Head of Government Relations and Ankush Karwal,Regional Manager Canada, Neuron Mobility Canadare: Shared Micromobility Program Implementation Plan
*4.6. Michael Eccles, Cambridgere: Franklin Blvd/McQueen Shaver Blvd. Road Expansion And NoiseWall (video)
*4.7. Susan Shackleton, Cambridgere: McQueen Shaver Boulevard
*4.8. Dan Bacon, Cambridgere: McQueen Shaver Boulevard
*4.9. Sajad Shiravi, Cambridgere: New Dundee and Robert Ferrie roundabout
*4.10. Werner Weinhardt, Kitchener
4000403

re: New Dundee Road
5. Consent Agenda ItemsItems on the Consent Agenda can be approved in one motion of Committee tosave time. Prior to the motion being voted on, any member of Committee mayrequest that one or more of the items be removed from the Consent Agenda andvoted on separately.
6. Request to Remove Items from Consent Agenda
7. Motion to Approve Items or Receive for InformationRecommended Motion:That the Consent Agenda items be received for information and approved.
7.1. Strategic Focus - Thriving Economy
7.1.1. 7TES-DCS-22-11, 2022 Construction Activity in Waterloo Region For information.
7.1.2. 20PDL-CPL-22-07, Building Permit Activity 2021 For Information.
7.1.3. 41PDL-CPL-22-09, 2021 Labour Force Activity For Information.
7.2. Strategic Focus - Environmental and Climate Action
7.2.1. TES-WMS-22-01, Comments on Environment and ClimateChange Canada Documents Related to Landfill Gas Emissions
74
Recommended Motion:That the Regional Municipality of Waterloo provide thecomments identified in Attachment A to Environment andClimate Change Canada in response to their recent discussionpaper titled “Reducing Methane Emissions from Canada’sMunicipal Solid Waste Landfills”, as outlined in Report TES-WMS-22-01, dated April 12, 2022.
7.2.2. TES-WMS-22-03, Curbside Collection Contract (T2015-217)Considerations
81
Recommended Motion:That the Regional Municipality of Waterloo extend ContractT2015-217, Collection of Garbage, Organics, Bulky and LargeMetal Items, Recycling, Yard Waste and Christmas Trees withinthe Region of Waterloo for up to two (2) one-year periods, fromMarch 2, 2024 to March 2, 2026, under the same terms andconditions as described in Report TES-WMS-16-01, datedJanuary 12, 2016.
7.2.3. PDL-CPL-22-06, 2022 Community Environmental Fund Grants 85Recommended Motion:That the Regional Municipality of Waterloo approve fundingallocations totaling up to $99,964 from the Community
Page 2 of 198
Environmental Fund to support 15 stewardship andsustainability projects as described in Report PDL-CPL-22-06,dated April 12, 2022.
7.2.4. PDL-CPL-22-08, 2020 Annual Corporate Greenhouse GasEmissions Update
95
For Information.
8. Regular Agenda Items
8.1. Strategic Focus - Thriving Economy
8.1.1. PDL-CPL-22-10/COR-CFN-22-08, Brownfield FinancialIncentive Program – Tax Increment Grant Application (TIG) – 60Charles Street West, Kitchener
100
Recommended Motion:That the Regional Municipality of Waterloo take the followingactions regarding the property municipally known as 60 CharlesStreet West in the City of Kitchener, as described in ReportPDL-CPL-22-10/ COR-CFN-22-08 dated April 12, 2022:
Approve a joint Tax Increment Grant, subject to theterms of an associated Tax Increment Grant agreementwith the registered owner of the subject lands, with theRegional amount not to exceed $3,773,539 net of anyother future brownfield assistance, to be financed fromthe incremental tax revenue for the property followingremediation, redevelopment and reassessment; and
a.
Authorize the Region’s Commissioner of Planning,Development and Legislative Services andCommissioner, Corporate Services / Chief FinancialOfficer to execute any associated agreements,assignments, amendments or other related documentswith the registered owner of 60 Charles Street West inthe City of Kitchener, with the form and content of suchTax Increment Grant agreement(s), any subsequentassignments of the agreement, or other relateddocuments to be satisfactory to the Regional Solicitors.
b.
8.1.2. PDL-CPL-22-11, Regional Official Plan Review - Draft RegionalLand Needs Assessment (Staff Presentation)
107
For Information.
8.2. Strategic Focus - Sustainable Transportation
8.2.1. TES-DCS-22-09, Project Approval Report for a Roundabout atNew Dundee Road (Regional Road No. 12) and Robert FerrieDrive
118
Recommended Motion:
Page 3 of 198

That the Regional Municipality of Waterloo approve therecommended design alternative for a proposed double laneroundabout at New Dundee Road (Regional Road No. 12) andRobert Ferrie Drive in the City of Kitchener, as described inReport TES-DCS-22-09, dated April 12, 2022.
Upon completion of construction, that The Regional Municipalityof Waterloo amend Traffic and Parking By-law 16-023, asamended to:
Remove from Schedule 17, Rates of Speed, 80 km/hon New Dundee Road (Regional Road 12) from 500 meast of Fischer-Hallman Road (Regional Road 58) to550 m west of Homer Watson Boulevard (RegionalRoad 28);
a.
Add to Schedule 17, Rates of Speed, 80 km/h on NewDundee Road (Regional Road 12) from 500 m east ofFischer-Hallman Road (Regional Road 58) to 400 mwest of Robert Ferrie Drive;
b.
Add to Schedule 17, Rates of Speed, 60 km/h on NewDundee Road (Regional Road 12) from 400 m west ofRobert Ferrie Drive to 550 m west of Homer WatsonBoulevard (Regional Road 28);
c.
Add to Schedule 15, Lane Designation, on NewDundee Road (Regional Road 12) southbound atRobert Ferrie Drive, Left and Right;
d.
Add to Schedule 15, Lane Designation, on NewDundee Road (Regional Road 12) eastbound at RobertFerrie Drive, Through/Left and Through;
e.
Add to Schedule 15, Lane Designation, on NewDundee Road (Regional Road 12) westbound at RobertFerrie Drive, Through/Right and Through;
f.
Add to Schedule 10, Level 2 Pedestrian Crossover, onNew Dundee Road (Regional Road 12) at RobertFerrie Drive, On All Entry and Exits.
g.
8.2.2. TES-TRS-22-06, Micromobility – E-scooter Traffic and ParkingBy-law Updates
123
Recommended Motion:That the Regional Municipality of Waterloo amend Traffic andParking By-law 16-023, as amended, to add the definition and
Page 4 of 198

provisions for the use of electric kick-scooters (“e-scooters”) asdescribed in Appendix A of Report TES-TRS-22-06, dated April12, 2022, with an effective date of July 1, 2022.
8.2.3. TES-TRS-22-07, Micromobility – Shared ProgramImplementation Plan
152
Recommended Motion:That the Regional Municipality of Waterloo;
Approves the Shared Micromobility ImplementationPlan in principle;
a.
Authorize staff to issue a request for proposals, incoordination with the Cities of Cambridge, Kitchener,and Waterloo, for a shared micromobility operator; and
b.
Authorize the Commissioner of TES to execute amemorandum of agreement with the Cities ofCambridge, Kitchener, and Waterloo, in a formsatisfactory to the Region Solicitor; to formalize theirrespective roles and other agreements in relation to theShared Micromobility Program;
c.
Pursuant to Report TES-TRS-22-07, dated April 12, 2022.
8.2.4. TES-TRP-22-02, Frederick Street /Benton Street (CourtlandAvenue East to Lancaster Street) Cycling Facility Plan
162
For information.
8.2.5. TES-TRP-22-03, Review of Iron Horse Trail Crossings ofRegional Roads, in the City of Kitchener
170
Recommended Motion:That the Regional Municipality of Waterloo approve theinstallation of a Level 2 Pedestrian Crossover – Type C, onBorden Avenue (Regional Road 66) at the Iron Horse TrailCrossing, in the City of Kitchener, by amending the Region’sTraffic and Parking By-law 16-023, as amended, to add toSchedule 10, Level 2 Pedestrian Crossover, as outlined inReport TES-TRP-22-03, dated April 12, 2022.
8.3. Strategic Focus - Environmental and Climate Action
8.3.1. TES-WMS-22-02, Reduction in the Garbage Limit for Single-Family Homes
176
Recommended Motion:That the Regional Municipality of Waterloo reduce theresidential bi-weekly garbage limit from four to threebags/containers starting October 17, 2022, which coincides withWaste Reduction Week, as outlined in Report: TES-WMS-22-02dated April 12, 2022.
Page 5 of 198
8.4. Strategic Focus – Responsive and Engaging Public Service
8.4.1. TES-DCS-22-10, Project Update (Noise) – McQueen ShaverBoulevard, Franklin Boulevard Extension, Cambridge andHighland Road, Kitchener (Staff Presentation)
180
Recommended Motion:That the Regional Municipality of Waterloo install noise walls onthe west side of Franklin Boulevard from Bloomington Road toCarpenter Road and on both sides of Franklin Boulevard fromCarpenter Road to the southern City boundary limit, asdescribed in report TES-DCS-22-10 dated April 12, 2022.
9. Information/Correspondence
10. Other Business
11. Next Meeting - May 10, 2022
12. Adjourn
Page 6 of 198

Report: TES-DCS-22-11
3990883 Page 1 of 4
Region of Waterloo
Transportation and Environmental Services
Design and Construction
To: Chair Tom Galloway and Members of the Planning and Works Committee
Meeting Date: April 12, 2022
Report Title: 2022 Construction Activity in Waterloo Region
1. Recommendation:
For information.
2. Purpose / Issue:
Each year staff produces a report for information purposes to provide details on the major road construction activity in the Region of Waterloo in the current year.
3. Strategic Plan:
The contracts described in this report meet one or more of the Strategic Objectives under the Region’s Corporate Strategic Plan Focus Areas “Thriving Economy”, “Sustainable Transportation” and “Environment and Climate Action”.
4. Key Considerations:
A list of the major road construction activity for 2022 is contained in Appendix A. The list identifies Regional construction contracts that are greater than one month in duration.
In December 2021, a Committee of the Whole report provided an update on over 50 major construction contracts that were underway at that time in the Region of Waterloo (TES-DCS-21-29, December 7, 2021). A few of those contracts will continue, or now start, in to 2022 due to unexpected delays, as outlined in the fall report. Some will continue in 2022, on schedule, as they were planned as phased, multi-year contracts.
Appendix B includes a list of some of the major non-road Region of Waterloo construction contracts that are underway or planned to be underway in 2022. The ongoing major non-road projects are generally on schedule as planned and as previously reported in the fall 2021 Construction Update (TES-DCS-21-29, December 7, 2021).
Page 7 of 198

April 12, 2022 Report: TES-DCS-21-11
3990883 Page 2 of 4
5. Background:
Tables are appended to this report that provide information on significant projects (greater than one month in duration) that will be undertaken in 2022 on Regional roads. In addition, for general information, the tables also list other on-going and planned Region of Waterloo non-road construction work in 2022 on Water, Wastewater, Waste Management and Transit projects.
The time required to complete work in previous years is tracked and this information is used in an effort to ensure the planned construction schedules are as realistic as possible and to provide appropriate allowances for unforeseen and/or unexpected work that could arise after construction starts.
Annual road construction is necessary to upgrade and expand infrastructure to meet community needs and to maintain Regional infrastructure in a state of good repair. It is acknowledged that any road construction on an existing road will involve lane restrictions or road closures/detours and a certain amount of disruption to traffic. In order to manage the disruption while efficiently completing the required work, a number of basic traffic management principles are applied in the design of each individual construction project. All designs take into account the following traffic management principles:
• Accommodating emergency services.
• Maintaining of safe passage for all users through the construction zone.
• Ensuring the safety of construction staff.
• Maintaining two-way traffic where practical.
• Minimizing disruption (motorists, pedestrians, cyclists, transit).
• Maintaining accesses to residences and businesses.
• Minimizing lane restrictions.
• Providing for waste/recycling collection.
• Minimizing overall construction duration.
Each year, some shorter-duration work on the busiest streets and through the busiest intersections is done at night and/or on weekends to reduce traffic impacts. Although nighttime and weekend work can reduce traffic impacts, it is disruptive to nearby residents. Examples of night or weekend work includes asphalt resurfacing, surface asphalt and utility crossings through intersections.
In 2020, the COVID-19 pandemic introduced new challenges in planning construction
Page 8 of 198

April 12, 2022 Report: TES-DCS-21-11
3990883 Page 3 of 4
projects. However, even as the initial COVID-19 restrictions were implemented, the Province of Ontario outlined that construction of roads, watermains, sewers and other municipal services is essential to ensure that these services continue to work properly and continue to meet our community’s needs.
To date, these projects have continued to be deemed essential, even as restrictions imposed have varied, and it is presently anticipated that this will continue to be the case heading in to the 2022 construction season, whether restrictions continue to ease or whether they need to be re-introduced.
Construction work will be carried out with the health and well-being of the public, construction workers, consultants, and staff as a priority. As we move forward with construction projects, all parties involved will continue to adhere to Public Health protocols and make adjustments should those protocols change through the course of construction.
6. Area Municipality Communication and Public/Stakeholder Engagement:
Region staff consults annually with representatives of the Area Municipalities and the Ministry of Transportation of Ontario (MTO) to plan and coordinate the collective road construction programs in the coming years. At these meetings staff:
• Confirm respective priorities and needs.
• Consider combining construction contracts to reduce costs and minimize publicinconvenience.
• Coordinate the proposed work to optimize the number of key major roads thatare open and available to traffic.
• Organize the sequence of construction and detours to manage public disruption.
• Coordinate public notifications.
Members of the public may obtain up-to-date information about active, ongoing construction contracts affecting Regional roads on the Region’s website and on the Ping Street mobile application, which is available for free. The Region’s website provides a map and an alphabetical listing of Regional roads that are subject to active lane closures or road closures, together with links to local municipal road information. The Ping Street mobile application illustrates similar information about Regional and local municipal lane and road closures on a map of the Region.
On individual projects, residents and business owners most directly affected by planned construction activities or traffic restrictions are typically notified via letters distributed by Region staff in advance of construction and during construction. Appropriate contact information is provided for follow-up communication. News releases and social media posts will also notify residents and visitors of major road construction work.
Page 9 of 198

April 12, 2022 Report: TES-DCS-21-11
3990883 Page 4 of 4
7. Financial Implications:
The Region’s 2022 costs on all of the projects listed in this report were approved as part of the 2022 Regional budget.
8. Conclusion / Next Steps:
The list of major road construction activity planned in the Region of Waterloo in the current year is provided for general information purposes. As individual projects are heading to construction, additional information regarding project details, traffic impacts and financial considerations will be provided in the tender reports.
9. Attachments / Links:
Appendix A – 2022 Major Construction on Regional Roads (Docs# 3990942)
Appendix B - Non-Road Major Construction Activity in 2022 (Docs# 3990945)
Prepared By: Frank Kosa, Head, Engineering, Design and Construction
Reviewed By: Phil Bauer, Director, Design and Construction
Approved By: Thomas Schmidt, Commissioner, Transportation and Environmental Services
Page 10 of 198

TES-DCS-22-11
Document Number: 3990942 Page 1 of 7
Appendix A-1
2022 Major Construction on Regional Roads – Kitchener
Project Limits Traffic Restrictions Timing Regional Budget
Courtland Avenue Reconstruction
Hayward Ave to Highway 7/8 Eastbound Ramp
• Lane closures
• Night time fullclosure for surfaceasphalt paving
Summer to Fall 2022
$1,575,000
Fischer-Hallman Road Reconstruction, Culverts and Archaeological Assessment
Bleams Road to Strasburg Creek
• Lane closures Spring 2020 to Summer 2024
$20,159,000
Fischer-Hallman Road Roundabouts
At Rosenberg Way and At Wallaceton Way
• Lane closures• Short term full
closures may berequired for pavingand islandconstruction
Spring 2022 to Fall 2023
$9,900,000
Highland Road Reconstruction and Widening
Westforest Trail to Ira Needles Boulevard
• Two way traffic to bemaintained withoccasional flagging
• Night time fullclosure for surfaceasphalt paving
Summer 2020 to Summer 2022
$6,895,000
Highland Road Reconstruction and Widening
Fischer-Hallman Road to Westforest Trail
• Two way traffic to bemaintained withoccasional flagging
• Night time fullclosure for surfaceasphalt paving
Spring 2021 to Fall 2022
$7,083,000
Page 11 of 198

April 12, 2022 TES-DCS-22-11
3990942 Page 2 of 7
Project Limits Traffic Restrictions Timing Regional Budget
Highway 7/8 Pedestrian Bridge
Chandler Drive to Avalon Place
• Two way traffic to bemaintained withoccasional flaggingon local roads
• Full short termclosure on Hwy 7/8for final bridgeassembly
Fall 2022 to Fall 2023
$6,388,000
Ottawa Street Reconstruction
Nottingham Avenue to Nyberg Street
• Northbound traffic tobe maintained(southbound trafficdetoured)
• King Streetintersection will befully closed duringphase 2 this year
Spring 2021 to Fall 2022
$7,117,000
Ottawa Street Reconstruction
International Place to Fischer-Hallman Road
• Lane closures Spring 2021 to Summer 2022
$3,005,000
Ottawa Street Reconstruction – Phase 1
Alpine Road to Howland Drive
• Lane closures Summer 2021 to Summer 2022
$7,870,000
River Road Construction Phase 1A, Bridge Only
At Schneiders Creek
• New road – no trafficrestrictions
Summer 2020 to Fall 2022
$66,930,000
Page 12 of 198

April 12, 2022 TES-DCS-22-11
3990942 Page 3 of 7
Project Limits Traffic Restrictions Timing Regional Budget
River Road Construction Phase 1B, New Road Construction
East of Wilson Ave. to Wabanaki Drive
• Two way traffic to bemaintained withintermittent flaggingon Goodrich Drive
• Short closuresrequired onWabanaki Dr. andHidden Valley Rd. inlate 2022 and 2023.
Fall 2022 to Fall 2023
$66,930,000
Note: Other work managed by City staff is occurring on local City streets at various locations and may include full or partial closures.
Page 13 of 198

April 12, 2022 TES-DCS-22-11
3990942 Page 4 of 7
Appendix A-2
2022 Major Construction on Regional Roads – Waterloo
Project Limits Traffic Restrictions Timing Regional Budget
King Street Reconstruction
Central Street to University Avenue
• Full Closure(Staged)
Spring 2021 to Fall 2022
$6,860,000
Weber Street Reconstruction Phase 2
Blythwood Road to Dutton Drive and Parkside Drive to Northfield Drive
• Full closure atCedar CreekCulvert (nearAlbert) for approx. 5weeks
• Weber Streetreduced to singlelane in thesouthbounddirection (closed tonorthbound traffic)
Spring 2022 to Summer 2023
$8,160,000
Northfield Drive Widening
University Avenue to Bridge Street
• Two way trafficmaintained
Spring 2022 to Fall 2022
$4,330,000
Note: Other work managed by City staff is occurring on local City streets at various locations and may include full or partial closures.
Page 14 of 198

April 12, 2022 TES-DCS-22-11
3990942 Page 5 of 7
Appendix A-3
2022 Major Construction on Regional Roads – Cambridge
Project Limits Traffic Restrictions Timing Regional Budget
Avenue Road Watermain
Hespeler Road to Franklin Boulevard
• One way trafficmaintained
Spring 2022 to Winter 2022
$3,174,000
Dundas Street Reconstruction
Shade Street to Hespeler Road
• Phase 1: intersectionof Dundas St andBeverly St fully closed
• Phase 2: Open to onelane in each direction
Spring 2022 to Fall 2023
$14,290,000
Note: Other work managed by City staff is occurring on local City streets at various locations and may include full or partial closures.
Page 15 of 198

April 12, 2022 TES-DCS-22-11
3990942 Page 6 of 7
Appendix A-4
2022 Major Construction on Regional Roads – Townships
Project Limits Traffic Restrictions Timing Regional Budget
Arthur Street Resurfacing
Sandy Hills Drive to Waterloo / Wellington Boundary
• Temporary laneclosures
• Full closure forsurface asphaltpaving
Summer 2021 to Spring 2022
$3,115,000
Bridge Rehabilitations
Herrgott Road at Conestogo River and Ament Line at Boomer Creek
• Reduced to one lanewith portable trafficsignals
Spring 2022 to Fall 2022
$4,428,000
Church Street East Reconstruction Phase 1
Arthur Street to Duke Street
• Full closure Spring to Fall 2022
$3,000,000
Kressler Road Watermain and Resurfacing
Lobsinger Line to Arthur Road
• Full closure forsurface paving
Summer 2021 to Spring 2022
$1,075,000
Line 86, Wallenstein
Herrgott Road to Listowel Road
• Lane closures Spring 2022 to Fall 2022
$1,455,000
Notre Dame Drive Reconstruction
St. Ann Avenue to 1746 Notre Dame Dr
• Lane closures Spring 2021 to Spring 2022
$2,620,000
Sawmill Road Reconstruction
St. Charles Street to Snyders Flats Road
• Full closure Summer 2022 to Summer 2023
$2,555,000
Page 16 of 198

April 12, 2022 TES-DCS-22-11
3990942 Page 7 of 7
Project Limits Traffic Restrictions Timing Regional Budget
Snyder’s Road Foundry Street to Gingerich Road
• Full Closure(Staged)
Spring 2021 to Fall 2022
$9,495,000
Note: Other work managed by Township staff is occurring on local Township streets at various locations and may include full or partial closures.
Page 17 of 198

TES-DCS-22-11
Document Number: 3990945 Page 1 of 2
Appendix B-1
Non-Road Major Construction Activity in 2022 – On-going work tendered prior to 2022
Water and Wastewater Projects Estimated Substantial
Performance Budget
PRV Chamber - Zone 2/4 Watermain April 2022 $600,000
Laurel Water Treatment Plant November 2022 $11,000,000
Manitou Hauled Waste Receiving Station September 2022 $3,200,000
K26 Well Pumphouse Upgrades September 2022 $2,000,000
K21/K21 Well Pumphouse Upgrades August 2022 $2,000,000
Kitchener WWTP Primary Clarifier December 2023 $18,000,000
Hespeler WWTP Upgrades – Contract 2 May 2022 $17,950,000
Municipal Supply Well Construction and Testing, LTWS ASR Stage 1B, Mannheim WTP May 2022 $3,500,000
Mannheim WTP Ozone System Rehabilitation December 2022 $1,400,000
Engineering, Integration and Implementation Services for the SCADA Upgrade Program January 2025 $20,600,000
Galt WWTP Contract 1 (Headworks/Tertiary Treatment/Disinfection) August 2022 $22,600,000
CAM 1W Booster Pumping and Chloramination Station May 2022 $6,000,000
RMP Sludge Forcemain February 2022 $2,700,000
Transit Projects Estimated Substantial
Performance Budget
Farmer’s Market Trail May 2022 $2,180,000
Transit Hub Trail – Phase 2 Fall 2022 $952,000
Page 18 of 198

April 12, 2022 TES-DCS-22-11
3990945 Page 2 of 2
Appendix B-2
Non-Road Major Construction Activity in 2022 – Work to be Tendered in 2022
Water and Wastewater Projects Expected Tender Date
Construction Duration (months)
Budget
PRV Chamber - Franklin Blvd (3) Q2 2022 6 $1,800,000
Biosolids Storage Facilities (Interim) Waterloo WWTP
Q2 2022 12 $12,500,000
Elmira WWTP MABR Q2 2022 12 $4,000,000
Baden-New Hamburg WM-Hamilton to Jacob (Nith River Crossing) Q2 2022 8 $2,500,000
Kitchener WWTP - Demolition & Site Works (Old Plant Digester / Chlorine Contact Tank) & Plant 1 Pre-demolition
Q3 2022 9 $5,500,000
Kitchener WWTP Turbo Blower Replacement Q2 2022 6 $2,200,000
Hespeler WWTP MABR Disinfection Upgrade
Q2 12 $1,800,000
Waste Management Projects Expected Tender Date
Construction Duration (months)
Budget
Kitchener LF Perched Groundwater Extraction System and Forcemain Q2 2022 8 $6,000,000
Waterloo LF New Gas Blower Q3 2022 6 $600,000
Cambridge Waste Management Facility Containment Well Infrastructure Upgrades
Q1 2022 6 $1,400,000
Waterloo Landfill Site EW433-21 Infrastructure
Q1 2022 6 $800,000
Waterloo Landfill Site Cell SE-5A/B Base Pre-Excavation and East Haul Road Extension
Q1 2022 24 $11,400,000
Page 19 of 198

Report: PDL-CPL-22-07
Document Number: 3980342 Page 1 of 4
Region of Waterloo
Planning, Development and Legislative Services
Community Planning
To: Chair Tom Galloway and Members of the Planning and Works Committee
Meeting Date: April 12, 2022
Report Title: Building Permit Activity 2021
1. Recommendation:
For information.
2. Purpose / Issue:
The purpose of this briefing note is to provide information to Council on building permit activity in 2021. New building construction, as measured by building permits issued, is an indicator of the continued strength of the local economy after two years of COVID-19 restrictions. Building permit data are also used in population and employment growth monitoring, development charge estimations, development tracking, budgets and forecasts.
3. Strategic Plan:
Tracking and reporting building permit activity provides information to support the strategic focus areas of Thriving Economy and Environment and Climate Action.
4. Key Considerations:
Almost $1.7 billion in new building permits were issued in Waterloo Region between January and December 2021. The total value of new construction activity increased by three per cent ($46.1 million) over 2020, was 34 per cent higher than the ten-year average of $1.3 billion, and was exceeded only by 2019’s record total.
New construction activity was driven by the residential sector ($1.4 billion), comprising 82 per cent of total value. For both units and value, 2021 was one of the two strongest growth years of the past decade. Non-residential construction activity was below average, although the industrial sector rebounded after a quiet 2020.
Page 20 of 198

April 12, 2022 Report: PDL-CPL-22-07
3980342 Page 2 of 4
Total Value of New Building Permits, 2012-2021
The comprehensive year-end Building Permit Activity and Growth Monitoring bulletin is attached to this report. Of note:
• Total value of industrial, commercial and institutional building permits issued in2021 was $303.2 million. This represents an eight per cent decrease from 2020and is slightly below the ten-year average of $329.6 million.
• New non-residential floor space totalled 1.6 million square feet, a 44 per centincrease over 2020 but still ten per cent below the ten-year average.
• The industrial sector rebounded, with above-average growth in both value andfloor space. Commercial and institutional investment decreased compared to2020.
• With $1.4 billion in permits issued for new residential construction, 2021 was thestrongest year on record and 49 per cent higher than the ten-year average of$924.6 million.
• 6,009 new residential units were added in 2021, a 16 per cent increase over2020. Moreover, 2021 saw the second highest yearly new unit growth on record,greatly outpacing the ten-year average of 4,208 units
• Growth has been particularly robust for townhouse units, with a 96 per centincrease relative to 2020.
• The mix of new units added in 2021 was predominantly apartments (57 per cent)and townhouses (24 per cent). Apartments include accessory units added toexisting dwellings (e.g., basement suites or duplex conversions) as well asdetached secondary dwellings (e.g., garden suites).
$0
$400
$800
$1,200
$1,600
$2,000
2012 2013 2014 2015 2016 2017 2018 2019 2020 2021
Mill
ions
Residential Non-Residential 10-year Average
Page 21 of 198

April 12, 2022 Report: PDL-CPL-22-07
3980342 Page 3 of 4
• Over the past decade, there has been rapid growth in accessory apartmentsadded to existing dwelling units, such as basement suites or duplex conversions.In 2012, only 67 permits were issued for these units across the Region. By 2020,the number reached 398, and increased by a further 37 per cent to 546 units in2021 – that is, nine per cent of total residential units. This number also includesdetached additional dwelling units such as garden suites or laneway homes.
Mix of New Residential Units, 2021 New Accessory Dwelling Units, 2012-2021
• In 2021, 68 per cent of new residential units were located within the Built UpArea. This exceeds the Region of Waterloo Official Plan’s intensification target of45 per cent.
• The mix of new units built in the Designated Greenfield Area has becomegradually more dense over the past decade, with low-density housing (single andsemi-detached dwellings) now comprising a smaller share of the unit mix (53 percent in 2021, down from 69 per cent in 2012).
• 39 per cent of new dwelling units in 2021 were located in the Central TransitCorridor.
5. Background:
Building Permit Activity reports are prepared for Council semi-annually.
6. Area Municipality Communication and Public/Stakeholder Engagement:
Building permit data are collected by Area Municipal staff and compiled by Regional staff. Area Municipal staff are consulted on interpretation.
7. Financial Implications:
Nil
Single detached18%
Semi-detached1%
Townhouse24%
Apartment57%
3% 3%2%
3%2%
3%
5%4%
8%9%
0100200300400500600
Accessory dwelling unit
% of total units
Page 22 of 198
April 12, 2022 Report: PDL-CPL-22-07
3980342 Page 4 of 4
8. Conclusion / Next Steps:
Nil
9. Attachments / Links:
Appendix A: 2021 Building Permit Activity and Growth Monitoring (DOCS 3978310)
Prepared By: Derrick Hambly, Planning Data Analyst
Brenna MacKinnon, Manager, Development Planning
Reviewed By: Danielle De Fields, Director, Community Planning
Approved By: Rod Regier, Commissioner, Planning, Development and Legislative Services
Page 23 of 198

Document Number: 3965996 Page 1 of 17
Planning Information Bulletin
Date: April 12, 2022
Subject: 2021 Building Permit Activity and Growth Monitoring
This bulletin presents building permit activity in Waterloo Region, updated for year-end 2021. New non-residential and residential construction is summarized relative to ten-year trends for 2012-2021, with additional year-over-year comparisons to 2020.
Building permit data is collected by the Area Municipalities – who issue the permits – and provided to the Region, where it is consolidated and forms the basis of reports and analysis. Building permit activity is one indicator of the strength of the local economy, as well as a predictor of population and employment growth. Intensification rates are also monitored using building permit data.
Summary
The total value of building permits issued for new construction across Waterloo Region in 2021 was $1.7 billion (Figure 1). Specifically:
• The value of non-residential permits was $303.2 million.• Permits were issued for 1.6 million square feet of non-residential floor space.• The value of residential permits was $1.4 billion.• Residential permits were issued for 6,009 units.
Figure 1. Summary of Building Permit Activity, 2020 and 2021
Page 24 of 198

3978310 Page 2 of 17
Total Value of New Building Permit Activity
Almost $1.7 billion in new building permits were issued in Waterloo Region between January and December 2021 (Figure 2). New construction activity was driven by the residential sector ($1.4 billion), comprising 82 per cent of total value. Overall, the value of new building permits issued in 2021 increased by three per cent ($46.1 million) over 2020, was 34 per cent higher than the ten-year average of $1.3 billion, and was exceeded only by 2019’s record total.
Figure 2. Total Value of New Building Permits, 2012-2021
New Building Permit Activity in the Non-Residential Sector
Non-Residential Value The total value of industrial, commercial and institutional (ICI) building permits issued in 2021 was $303.2 million (Figure 3). This represents an eight per cent decrease from 2020 and is slightly below the ten-year average of $329.6 million.
New construction activity in the industrial sector increased year-over-year by 235 per cent (from $41.9 to $140.2 million), while decreases in value were observed for commercial (down 46 per cent, from $194.6 to $104.6 million) and institutional (down 37 per cent, from $92.9 to $58.4 million) permits.
Figure 3. New Non-Residential Building Permit Value, by Sector, 2012-2021
$0
$400
$800
$1,200
$1,600
$2,000
2012 2013 2014 2015 2016 2017 2018 2019 2020 2021
Mill
ions
Residential Non-Residential 10-year Average
$0
$100
$200
$300
$400
$500
2012 2013 2014 2015 2016 2017 2018 2019 2020 2021
Mill
ions
Total Industrial Commercial Institutional 10-year Average
Page 25 of 198

3978310 Page 3 of 17
Attachment 1 lists the top 25 ICI permits by construction value. The highest-value non-residential permits issued in 2021, by sector, were:
• Industrial: $20 million for a 2,100 square foot addition to the KitchenerWastewater Treatment Plant at 368 Mill Park Drive, Kitchener.
• Commercial: $13.5 million for a new 14,300 square foot commercial building(shell only) at 1655 Bishop Street North in Cambridge.
• Institutional: $41.3 million for a 2,100 square foot addition and interior/exterioralterations to the future Waterloo Regional Police Service Central Divisionheadquarters at 200 Frederick Street in Downtown Kitchener.
At an area municipal scale, year-over-year trends in non-residential building activity varied. The three cities – responsible for 89 per cent of the Region’s total non-residential activity – saw a combined 15 per cent decrease in ICI building permit values, from $316.4 million in 2020 to $269.4 million in 2021 (Figure 4); this was driven by decreases in Kitchener and Waterloo. Conversely, Cambridge experienced strong growth in non-residential activity, with a $62.5 million (146 per cent) increase over 2020.
Figure 4. New Non-Residential Building Permit Value, by City, 2020 and 2021
Figure 5. New Non-Residential Building Permit Value, by Township, 2020 and 2021
Three of the four townships saw positive growth in non-residential activity from 2020 to 2021 (Figure 5), for a combined township-wide increase of $20.9 million (162 per cent). ICI permit value in Woolwich increased by $23.3 million, or 418 per cent, from the previous year.
Non-Residential Floor Space New non-residential floor space totalled 1.6 million square feet, a 44 per cent increase over 2020 but still ten per cent below average (Figure 6). The industrial and commercial sectors both contributed to this trend, with respective 207 per cent and 24 per cent increases. New institutional square footage, on the other hand, fell sharply from the previous year.
$0
$40
$80
$120
$160
$200
$240
Cambridge Kitchener Waterloo
Mill
ions
2020 2021
$0$5
$10$15$20$25$30
NorthDumfries
Wellesley Wilmot Woolwich
Mill
ions
2020 2021
Page 26 of 198

3978310 Page 4 of 17
Figure 6. New Non-Residential Floor Space, by Sector, 2012-2021
Four ICI permits larger than 100,000 square feet were issued in 2021; only one permit of this size was issued in 2020.
• A new 251,000 square foot assembly and warehousing facility (Toyota) at 770Boxwood Drive in Cambridge, valued at $19.6 million.
• A new 209,000 square foot open-air parking garage (Google) at 2 Stewart Streetin Kitchener, valued at $13 million.
• A 130,000 square foot addition to an existing commercial building at 388 PhillipStreet in Waterloo, valued at $5.3 million.
• A new 127,000 square foot industrial mall (shell only) at 45 Tyler Street inCambridge, valued at $7.3 million.
The Region’s three cities accounted for 89 per cent of total new ICI floor space in 2021 (Figure 7). Cambridge had the largest year-over-year increase (up 205 per cent, or 474,455 square feet), followed by Waterloo (15 per cent increase, up 25,593 square feet from 2020). Kitchener saw a year-over-year decrease in new non-residential space (down 15 per cent, or 101,503 square feet).
Figure 7. New Non-Residential Floor Space, by City, 2020 and 2021
Figure 8. New Non-Residential Floor Space, by Township, 2020 and 2021
The four townships combined for a 130 per cent increase in new non-residential floor space, from 80,567 square feet in 2020 to 185,566 square feet (Figure 8). Woolwich and Wellesley saw gains of 500 per cent (127,724 square feet) and 67 per cent (10,492
0
400
800
1,200
1,600
2,000
2,400
2012 2013 2014 2015 2016 2017 2018 2019 2020 2021
Thou
sand
s
Total Industrial Commercial Institutional 10-year Average
0
200
400
600
800
Cambridge Kitchener Waterloo
Thou
sand
s
2020 2021
0
50
100
150
200
NorthDumfries
Wellesley Wilmot Woolwich
Thou
sand
s
2020 2021
Page 27 of 198

3978310 Page 5 of 17
square feet), respectively, while Wilmot (down 81 per cent, or 25,988 square feet) added less ICI space than the previous year and North Dumfries added none.
Attachment 2 provides a detailed year-over-year comparison of new non-residential activity by sector and municipality for 2020 and 2021.
New Building Permit Activity in the Residential Sector
Residential Value With $1.4 billion in permits issued for new residential construction, 2021 was the strongest year on record and 49 per cent higher than the ten-year average of $924.6 million. Despite the ongoing COVID-19 pandemic and its widespread impacts on the economy, new residential building activity in Waterloo Region continued at a rapid pace, with a six per cent increase in total value over 2020 (Figure 9).
Figure 9. New Residential Building Permit Value, by Unit Type, 2012-2021
New apartment construction ($534.8 million) was the primary contributor to residential value in 2021, with 39 per cent of the total. Overall, the value of new apartment units fell 22 per cent ($150.5 million) year-over-year, as accessory apartments and duplexes comprised a greater proportion of the total. However, the decrease in apartment value was more than offset by strong gains in townhouse and single detached permits, which increased by $135.6 million (88 per cent) and $114 million (28 per cent), respectively.
The proportion of new residential value associated with townhouse units increased from 12 per cent last year to 21 per cent in 2021, while the proportion of single detached units increased from 32 per cent to 38 per cent. Semi-detached dwellings comprise the balance of residential construction; these saw a 53 per cent decrease ($27 million).
Figure 10 illustrates the value of new residential permits by city; the total value and overall proportion of residential investment in the three cities has remained fairly consistent since last year, at $1.2 billion and 88 per cent, respectively. Growth in residential permit values in Cambridge (110 per cent) offset decreases in Kitchener (11 per cent) and Waterloo (five per cent).
The Region’s townships collectively contributed one-tenth ($165.5 million) of new permit value (Figure 11). North Dumfries experienced 291 per cent residential growth in 2021,
$0
$300
$600
$900
$1,200
$1,500
2012 2013 2014 2015 2016 2017 2018 2019 2020 2021
Mill
ions
Total Single detached Semi-detached
Townhouse Apartment 10-year Average
Page 28 of 198

3978310 Page 6 of 17
while Wellesley, Wilmot and Woolwich saw decreases of 14 per cent, 14 per cent and one per cent, respectively.
Figure 10. New Residential Building Permit Value, by City, 2020 and 2021
Figure 11. New Residential Building Permit Value, by Township, 2020 and 2021
Residential Units A total of 6,009 new residential units were added in 2021 – a 16 per cent increase over 2020 (Figure 12). Moreover, 2021 saw the second highest yearly new unit growth on record, greatly outpacing the ten-year average of 4,208 units.
Figure 12. New Residential Units, by Type, 2012-2021
Growth has been particularly robust for townhouse units, with a 96 per cent increase relative to 2020 (from 729 to 1,432 units). More than 3,400 new apartment units were added in 2021 – a three per cent year-over-year increase – while the combined number of single and semi-detached units remained stable at 1,167 compared to 1,156 in 2020. These numbers reflect a trend seen in recent years where residential development is occurring in more dense forms. Figure 13 illustrates that new units added in 2021 were predominantly apartments (57 per cent) and townhouses (24 per cent). Apartments include accessory units added to existing dwellings (e.g., basement suites or duplex conversions) as well as detached secondary dwellings, or garden suites.
$0
$200
$400
$600
$800
Cambridge Kitchener Waterloo
Mill
ions
2020 2021
$0
$20
$40
$60
$80
$100
NorthDumfries
Wellesley Wilmot Woolwich
Mill
ions
2020 2021
01,0002,0003,0004,0005,0006,0007,000
2012 2013 2014 2015 2016 2017 2018 2019 2020 2021
Total Single detached Semi-detached
Townhouse Apartment 10-year Average
Page 29 of 198

3978310 Page 7 of 17
Figure 13. Mix of New Residential Units, 2021
Figure 14. New Accessory Dwelling Units, 2012-2021
The top five residential permits issued in 2021 were apartments:
• Two residential towers (20 and 15 storeys) with 435 units at 145 Columbia StreetWest, Waterloo, valued at $57 million.
• A 25-storey, 340-unit mixed-use residential building at 308 King Street North,Waterloo, valued at $79 million.
• Two eight-storey residential towers with 284 units at 140 Hollywood Court,Cambridge, valued at $50 million.
• An 18-storey, 228-unit condominium apartment building with ground floor retail at741 King Street West, Kitchener, valued at $38 million.
• A 15-storey, 177-unit residential condominium building at 1333 Weber StreetEast, Kitchener, valued at $44 million.
Another trend of note is the rapidly growing number of accessory apartments added to existing dwelling units, such as basement suites or duplex conversions. In 2012, only 67 permits were issued for accessory dwelling units across the Region (Figure 14). By 2020, the number reached 398, and increased by a further 37 per cent to 546 units in 2021 – comprising nine per cent of total new residential units. This number also includes detached additional dwelling units such as garden suites or laneway homes.
Waterloo Region’s three cities – home to 92 per cent of new units – experienced a collective 15 per cent year-over-year increase in new residential dwellings (Figure 15). Cambridge and Waterloo saw more units in residential permits relative to 2020, with respective increases of 165 per cent (739 units) and eight per cent (101 units), while new units in Kitchener were down slightly, with 119 fewer units added (a four per cent decrease).
Single detached18%
Semi-detached1%
Townhouse24%
Apartment57%
3% 3%2%
3%2%
3%
5%4%
8%9%
0100200300400500600
Accessory dwelling unit
% of total units
Page 30 of 198

3978310 Page 8 of 17
Figure 15. New Residential Units, by City, 2020 and 2021
Figure 16. New Residential Units, by Township, 2020 and 2021
Residential growth in the townships was also positive (Figure 16), as 93 more units were built than in 2020 – an increase of 25 per cent. The largest increase occurred in North Dumfries, where 2021 permits contained 85 more units than the year prior (a 207 per cent increase). The three remaining townships saw a combined net increase of eight units relative to 2020.
Attachment 3 provides a detailed year-over-year comparison of new residential activity by unit type and municipality for 2020 and 2021. Attachment 4 lists the top 25 residential permits by number of units, while the location of all new residential building permits issued in 2021 is shown in Map 1 (Attachment 5). The map shows that the ION corridor continues to attract large infill developments with high unit counts. Additionally, new permits were clustered in greenfield areas of Southwest Kitchener. Also of note is that the majority of single-unit permits within the built up area were accessory units added to existing single or semi-detached dwellings.
Long-Term Trends in Residential Building Permit Activity
The number of new residential units increased by 16 per cent from 2020 to 2021; with 6,009 units, 2021 residential growth was substantially higher than the ten-year and 30-year averages of 4,208 and 3,454 units, respectively (Figure 17). The cyclical nature of residential building activity over the past four-and-a-half decades reflects many social and economic factors including demographic change, demand, housing prices and mortgage rates.
0500
1,0001,5002,0002,5003,0003,500
Cambridge Kitchener Waterloo
2020 2021
050
100150200250300
NorthDumfries
Wellesley Wilmot Woolwich
2020 2021
Page 31 of 198

3978310 Page 9 of 17
Figure 17. Historical Residential Building Activity, 1976-2021
Students and Seniors
Residential building permit value for the student-oriented market in 2021 was 38 per cent lower than the previous year. The combined value of these permits was $84.3 million, compared to $136.4 million in 2020. Building permits were issued for three student-oriented projects in 2021 (and four in 2020):
• A 25-storey, $79 million mixed-use residential tower with 340 units (340bedrooms) located at 308 King Street North, Waterloo.
• LivSmart Condos, a six-storey, $5.3 million residential condo building with 39units (39 bedrooms) located at 269 Sunview Street, Waterloo.
• Conversion of a former daycare to a triplex (eight bedrooms), valued at $100,000and located at 330 King Street North, Waterloo.
No senior-oriented building permits were issued in 2021; two were issued in 2020.
While some student- and senior-oriented projects are identified as such on the permit itself, Regional staff identify additional permits by their location and marketing.
Monitoring Growth with Building Permits
The Region of Waterloo Official Plan’s (ROP) intensification target is that 45 per cent of all new residential development on an annual basis should occur within the Built Up Area (BUA) – that is, the area that was considered developed prior to 2006. In 2021, 4,069 new residential units were built in the BUA, representing 68 per cent of total units across the Region (Figure 18). This is on par with the 67 per cent intensification rate (3,465 out of 5,195 units) achieved in 2020. For twelve consecutive years, residential growth in Waterloo Region has exceeded the Regional Official Plan intensification target (Figure 19); although the target was intended to be achieved by 2015, it has been exceeded each year since 2010.
4,2083,454
01,0002,0003,0004,0005,0006,0007,000
1976
1978
1980
1982
1984
1986
1988
1990
1992
1994
1996
1998
2000
2002
2004
2006
2008
2010
2012
2014
2016
2018
2020
Total Units 10-Year Average 30-Year Average
Page 32 of 198

3978310 Page 10 of 17
Figure 18. New Residential Units in the Built Up Area, 2006-2021
Figure 19. Percentage of New Residential Units in the Built Up Area, 2006-2021
While there is no policy target for the amount of non-residential activity in the BUA, Figure 20 shows industrial, commercial and institutional building permit activity both inside the BUA and for the Region as a whole, measured in floor area of new construction. In 2021, 70 per cent of new non-residential floor space was added inside the BUA, similar to the 60 per cent achieved in 2020.
0%
20%
40%
60%
80%
2006
*
2007
2008
2009
2010
2011
2012
2013
2014
2015
2016
2017
2018
2019
2020
2021
% of Units in BUA ROP Target (45%)
Page 33 of 198
3978310 Page 11 of 17
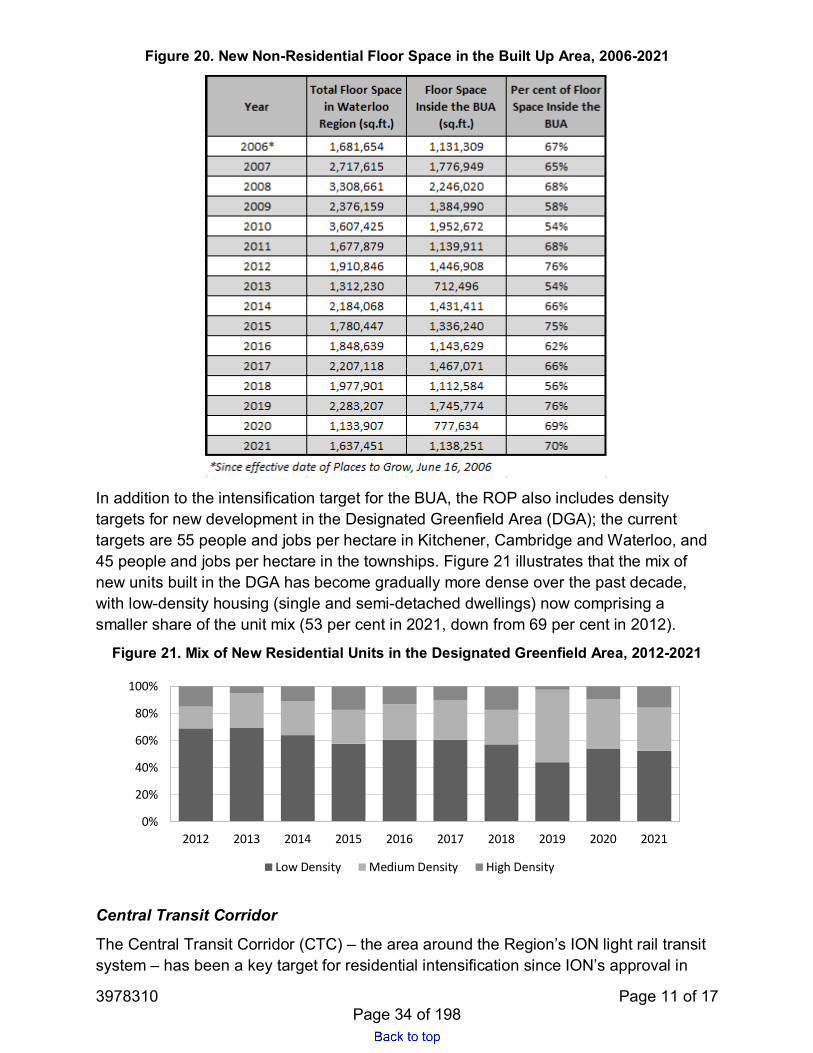
Figure 20. New Non-Residential Floor Space in the Built Up Area, 2006-2021
In addition to the intensification target for the BUA, the ROP also includes density targets for new development in the Designated Greenfield Area (DGA); the current targets are 55 people and jobs per hectare in Kitchener, Cambridge and Waterloo, and 45 people and jobs per hectare in the townships. Figure 21 illustrates that the mix of new units built in the DGA has become gradually more dense over the past decade, with low-density housing (single and semi-detached dwellings) now comprising a smaller share of the unit mix (53 per cent in 2021, down from 69 per cent in 2012).
Figure 21. Mix of New Residential Units in the Designated Greenfield Area, 2012-2021
Central Transit Corridor
The Central Transit Corridor (CTC) – the area around the Region’s ION light rail transit system – has been a key target for residential intensification since ION’s approval in
0%
20%
40%
60%
80%
100%
2012 2013 2014 2015 2016 2017 2018 2019 2020 2021
Low Density Medium Density High Density
Page 34 of 198

3978310 Page 12 of 17
2011. In 2021, 2,369 new residential units were built in the CTC, comprising 39 per cent of units added throughout the Region (Figure 22). Similarly, 2,350 units were built in the CTC in 2020, although this represented a higher proportion (45 per cent) of the total.
Figure 22. New Residential Units in the Central Transit Corridor, 2011-2021
Attachments
Attachment 1 – Top 25 Non-Residential Building Permits by Construction Value, 2021
Attachment 2 – Summary of Non-Residential Building Permit Activity, 2020 and 2021
Attachment 3 – Summary of Residential Building Permit Activity, 2020 and 2021
Attachment 4 – Top 25 Residential Building Permits by Number of Units, 2021
Attachment 5 – Map 1 – 2021 Residential Building Permit Activity
For further information, please refer to Report PDL-CPL-22-07 “Building Permit Activity 2021” at www.regionofwaterloo.ca or contact us at:
Brenna MacKinnon Manager, Development Planning Community Planning Phone: 519-575-4060 Email: [email protected]
Derrick Hambly Planning Data Analyst Community Planning Phone: 519-575-4400 Ext 3449 Email: [email protected]
Page 35 of 198

3978310 Page 13 of 17
Attachment 1 – Top 25 Non-Residential Building Permits by Construction Value, 2021 Address Municipality Structure
Type Floor Area
Construction Value
Project Name Comment Addition
200 Frederick St Kitchener Institutional 2,083 $41,342,600 WRPS - Central Division Headquarters
Main floor addition (sally port), exterior facade alterations and interior alterations for Waterloo Regional Police Service offices and cell block.
Addition
368 Mill Park Dr Kitchener Industrial 2,131 $20,000,000 Region of Waterloo - Kitchener WWTP
Two-storey addition to the existing primary clarifier building to house electrical equipment.
Addition
770 Boxwood Dr Cambridge Industrial 250,518 $19,600,000 Toyota New assembly and warehousing facility. New Construction 115 Goddard Cres Cambridge Industrial 60,752 $15,000,000 New pet food manufacturing facility. New Construction 1655 Bishop St N Cambridge Commercial 14,280 $13,500,000 Crossroads Business Centre New commercial retail building (shell only). New Construction 2 Stewart St Kitchener Commercial 209,164 $13,000,000 Google New open-air parking garage. New Construction 160 Boychuk Dr Cambridge Industrial 56,414 $11,500,000 New two-storey office and manufacturing facility. New Construction 30 Fairway Rd S Kitchener Commercial 49,466 $11,000,000 DoubleTree by Hilton Kitchener Third-storey addition to an existing hotel, including interior and exterior
alterations to the ground floor and second floor. Addition
4881 Fountain St N Woolwich Institutional 31,498 $10,000,000 Region of Waterloo - Waterloo International Airport
New modular structures for domestic arrivals and passenger terminal buildings.
Addition
5179 Fountain St N Woolwich Industrial 40,783 $9,725,000 New industrial building. New Construction 350 Conservation Dr Waterloo Industrial 4,155 $8,300,000 Region of Waterloo - Laurel
WTP One-storey addition to an existing water treatment plant and minor work in an existing building on site.
Addition
45 Tyler St Cambridge Industrial 126,917 $7,300,000 New industrial mall (shell only). New Construction 254 Neilson Ave Waterloo Institutional 23,638 $6,650,000 WCDSB - St. Agnes Catholic
Elementary School Addition and renovation to an existing school building. Addition
1001 Bishop St N Cambridge Industrial 28,528 $6,333,000 PepsiCo Canada Extension of an existing Geographic Enterprise Solution facility. Addition 388 Phillip St Waterloo Commercial 129,615 $5,250,000 Addition to an existing commercial building to create additional floor area
(shell only). Addition
1314 Fischer-Hallman Rd Kitchener Commercial 33,949 $5,000,000 Food Basics New building for a grocery store. New Construction 1055 Fountain St N Cambridge Industrial 16,146 $5,000,000 Toyota Expansion of an existing welding facility. Addition 740 Saginaw Pky Cambridge Commercial 9,924 $5,000,000 WRDSB - Saginaw Public School Addition for a new childcare facility in an existing school building. Addition 150 Bullock St Kitchener Industrial 55,587 $4,500,000 New one-storey industrial manufacturing facility. New Construction 460 Hespeler Rd Cambridge Commercial 26,576 $4,000,000 New two-storey medical building (shell only). New Construction 1557 Highland Rd W Kitchener Commercial 19,676 $3,900,700 New two-storey commercial plaza including a daycare. New Construction 308 King St N Waterloo Commercial 11,021 $3,291,016 New commercial space in a 25-storey mixed-use residential building. New Construction 140 Goddard Cres Cambridge Industrial 33,808 $3,000,000 New industrial mall (shell only). New Construction 125 Goddard Cres Cambridge Industrial 30,857 $2,800,000 New industrial mall (shell only). New Construction 500 Thompson Dr Cambridge Industrial 20,344 $2,787,000 Scot Industries Pipe storage system expansion in an existing warehouse facility. Addition
Page 36 of 198

3978310 Page 14 of 17
Attachment 2 – Summary of Non-Residential Building Permit Activity, 2020 and 2021
New Non-Residential Building Permit Value, by Sector and Municipality, 2020 and 2021
New Non-Residential Floor Space, by Sector and Municipality, 2020 and 2021
Page 37 of 198

3978310 Page 15 of 17
Attachment 3 – Summary of Residential Building Permit Activity, 2020 and 2021
New Residential Building Permit Value, by Unit Type and Municipality, 2020 and 2021
New Residential Units, by Type and Municipality, 2020 and 2021
Page 38 of 198

3978310 Page 16 of 17
Attachment 4 – Top 25 Residential Building Permits by Number of Units, 2021 Address Municipality Structure Type Storeys Units Construction Value Project Name Comment 145 Columbia St W Waterloo Apartment 20 435 $56,690,453 Society 145 Two residential towers (20 and 15 storeys) with a shared six-storey podium and
one level of underground parking. 308 King St N Waterloo Apartment 25 340 $78,984,384 25-storey mixed used residential building.140 Hollywood Crt. Cambridge Apartment 8 284 $50,000,000 Two eight-storey residential towers with a shared amenity link. 741 King St W Kitchener Apartment 18 228 $37,777,778 The Bright Building 18-storey condominium apartment building with ground floor retail and two
levels of underground parking.1333 Weber St E Kitchener Apartment 15 177 $43,500,000 Elevate Condos 15-storey residential condominium with an amenity terrace and two levels of
underground parking.169 Borden Ave N Kitchener Apartment 6 166 $24,462,370 169 Borden Six-storey apartment building with one level of underground parking. 611 Davenport Rd Waterloo Apartment 9 161 $37,000,000 611 Davenport Rd. Nine-storey apartment building. 528 Lancaster St W Kitchener Apartment 10 127 $15,417,923 528 Lancaster Ten-storey residential apartment building. 595 Strasburg Rd Kitchener Apartment 9 107 $21,500,000 Bloomingdale Mews Nine-storey rental apartment building with two levels of underground parking. 225 Victoria St N Kitchener Apartment 6 94 $14,000,000 225 Victoria Six-storey apartment building with an underground parking garage. 103 Roger St Waterloo Apartment 6 90 $19,000,000 Spur Line Common Six-storey residential building with one level of underground parking. 270 Spadina Rd E Kitchener Apartment 6 90 $1,000,000 Woodside Terraces Six-storey addition to an existing apartment building, including expansion of the
underground parking garage. 1101 Lackner Pl Kitchener Apartment 4 61 $13,700,000 Lackner Ridge Condos Four-storey condominium apartment building. 50 Eighth Ave Kitchener Apartment 6 60 $5,000,000 Six-storey multi-use building with two future offices on the ground floor. 195 Hespeler Rd Cambridge Apartment 6 55 $12,750,000 195 Hespeler Road Six-storey apartment building with 33 affordable units and 22 market-rate units. 1201 Lackner Pl Kitchener Apartment 4 54 $12,200,000 Lackner Ridge Condos Four-storey condominium apartment building. 39 Sheldon Ave N Kitchener Apartment 0 44 $6,000,000 Oneroof Supportive housing development for Oneroof Youth Services. 825 King St W Kitchener Apartment 3 43 $9,600,000 Indwell St. Mark's Place Conversion of an existing church into affordable rental apartments, including a
third floor addition. 1470 Block Line Rd Kitchener Apartment 4 41 $6,000,000 YW Kitchener-Waterloo Blockline Four-storey apartment building with affordable housing units. 269 Sunview St Waterloo Apartment 6 39 $5,250,000 LivSmart Condos Six-storey residential condo building. 624 King St W Kitchener Apartment 4 34 $5,000,000 Two apartment buildings (4 and 3 storeys) with one level of underground parking. 600 Victoria St S Kitchener Townhouse 3 24 $3,500,000 6VIC Condos Three-storey stacked townhouse building. 80 Sydney St N Kitchener Townhouse 3 24 $2,800,000 Three-storey stacked townhouse building. 1365 Countrystone Dr
Kitchener Townhouse 3 24 $2,400,000 Commons At The Boardwalk Three-storey stacked townhouse building.
721 Franklin Blvd Cambridge Townhouse 3 20 $3,000,000 Franklin Square Three-storey stacked townhouse building.
Page 39 of 198

3978310 Page 17 of 17
Attachment 5 – Map 1 – 2021 Residential Building Permit Activity
Page 40 of 198

Report: PDL-CPL-22-09
Document Number: 3974505 Page 1 of 3
Region of Waterloo
Planning, Development, And Legislative Services
Community Planning
To: Chair Tom Galloway and Members of the Planning and Works Committee
Meeting Date: April 12, 2022
Report Title: 2021 Labour Force Activity
1. Recommendation:
For information.
2. Purpose / Issue:
Labour force information is important for understanding the local economy, and is specifically used for:
• Employment and income support program planning, and the Ontario WorksService Plan,
• Employment monitoring and forecasting to support the Regional Official Plan,• Development Charges By-Law, and master plans,• Economic development and business recovery supports, and• Strategic and financial planning in support of the Region’s credit rating reviews.
3. Strategic Plan:
Tracking and reporting labour force activity contributes to Strategic Focus Area 1: Thriving Economy.
4. Key Considerations:
The 2021 Waterloo Region Labour Force Report (attached) is a comprehensive report on the labour force in the Kitchener-Cambridge-Waterloo Census Metropolitan Area (KCW CMA), and describes trends in local employment, including the size of the total labour force, the number of people employed and unemployed, rates (employment, unemployment, participation), and employment by sector and occupation.
Page 41 of 198

April 12, 2022 Report: PDL-CPL-22-09
3974505 Page 2 of 3
Despite another year of widespread measures taken to contain the spread of COVID-19, the KCW CMA labour market saw a rebound from 2020.
• KCW CMA added 15,200 jobs in 2021 bringing total employment to 321,400;• Employment rate was 64.2 per cent, approximately 4.5 and 4 per cent higher
than Ontario and Canada, respectively;• Majority of the job growth occurred for full-time workers (+14,200 jobs);• The unemployment rate in the KCW CMA declined from 9.6 per cent in 2020 to
6.5 per cent in 2021, bringing the unemployment rate into alignment with thehistoric average since 2006. The KCW CMA had the second lowestunemployment rate in Ontario and was the ninth lowest in among all CMAsacross Canada;
• KCW CMA had the second lowest unemployment rate in Ontario in 2021 at 6.5per cent, representing a decline from 9.6 per cent in 2020. The unemploymentrate remains lower than Ontario (8.0 per cent) and Canada (7.5 per cent);
• Participation and employment rates continued to be higher than provincial andnational rates;
• Of the 14 industry sectors, more than half have met or surpassed their pre-COVID employment numbers;
• The ‘finance, insurance, real estate, rental and leasing’ sector saw the highestemployment gain in 2021, adding 3,800 jobs;
• The greatest loss in employment occurred in the ‘manufacturing’ sector.However, ‘manufacturing’ still employs more in 2021 than it did in 2019 andcontinues to be the largest sector in terms of employment in the KCW CMA;
• The ‘accommodation and food services’ sector added 1,000 jobs when comparedto 2020, however, there are still 3,600 fewer people employed in the sector whencompared to 2019, prior to COVID-19.
5. Background:
To monitor the local Waterloo Region economy through the COVID-19 pandemic, staff produced monthly labour force reports that show how the labour market has adjusted. The monthly labour force reports are circulated to various planning and economic development staff, the corporate leadership team, and Regional Councillors. They described the sectors most affected by the restrictions and economic effects of COVID through an index of recovery rates, and they provided the monthly local rates of employment, unemployment and participation. Annualized labour force data is now available, providing the average for the full year. The attached report uses monthly and annualized data to compare to previous years. Data in this report is acquired from Statistics Canada’s Labour Force Survey (LFS).
Page 42 of 198

April 12, 2022 Report: PDL-CPL-22-09
3974505 Page 3 of 3
The KCW CMA includes Kitchener, Cambridge, Waterloo, Wilmot, Woolwich and North Dumfries. The 2021 labour force data is based on 2016 Census boundaries therefore Wellesley Township is not included.
6. Area Municipality Communication and Public/Stakeholder Engagement:
The 2021 Labour Force Report will be posted on the Region of Waterloo website.
7. Financial Implications:
Nil.
8. Conclusion / Next Steps:
Staff will continue to produce monthly monitoring bulletins of the labour force.
9. Attachments / Links:
Appendix A: 2021 Labour Force Report (Docs# 3960554)
Prepared By: Bobby Soosaar, Planning Data Analyst
Reviewed By: Brenna MacKinnon, Manager, Development Planning
Danielle De Fields, Director, Community Planning
Approved By: Rod Regier, Commissioner, Planning Development and Legislative Services
Page 43 of 198

PDL-CPL-22-09
Document Number: 3960554 Page 1 of 30
Appendix A: 2021 Labour Force Report
PLANNING INFORMATION BULLETIN DATE: APRIL 12, 2022 SUBJECT: 2021 Labour Force Activity
This bulletin describes the labour market for the Kitchener-Cambridge-Waterloo Census Metropolitan Area (KCW CMA) and provides some benchmarks to identify how the labour market has evolved from last year through another year of COVID-19 pandemic related restrictions. The KCW CMA includes Kitchener, Cambridge, Waterloo, Woolwich, North Dumfries, and Wilmot1.
The analysis is informed by the 2021 Labour Force Survey (LFS) published by Statistics Canada. Unless otherwise specified, data shown is based on annualized numbers, which is an average number calculated over the period from January to December 2021.
Labour Market Rebounds through Second Year of COVID-19 Pandemic Despite another year of widespread measures taken to contain the spread of COVID-19, the KCW CMA labour market saw a rebound from 2020. Some key highlights of the 2021 Labour Force Survey are listed below:
• After seeing a 5.1 per cent decline in jobs in 2020, the KCW CMA’s employmentrebounded in 2021, increasing by 5 per cent or 15,200 jobs.
• The majority of the job growth occurred for full-time workers (+14,200 jobs)• The unemployment rate in the KCW CMA declined from 9.6 per cent in 2020 to
6.5 per cent in 2021, bringing the unemployment rate into alignment with thehistoric average since 2006. The KCW CMA had the second lowestunemployment rate in Ontario and was the ninth lowest in among all CMAsacross Canada.
• Participation and employment rates continued to be higher than provincial andnational rates.
1 The 2021 Labour Force data is still based on the 2016 Census geography of the KCW CMA which included the three cities of Kitchener, Cambridge and Waterloo and the townships of Woolwich, North Dumfries, and Wilmot. Wellesley is not currently included in the CMA.
Page 44 of 198

PDL-CPL-22-09
3960554 Page 2 of 30
• Of the 14 industry sectors, more than half have met or surpassed their pre-COVID employment numbers.
• The ‘Finance, insurance, real estate, rental and leasing’ sector saw the highestemployment gain in 2021, adding 3,800 jobs.
• The greatest loss in employment occurred in the ‘Manufacturing’ sector.However, ‘Manufacturing’ still employs more in 2021 than it did in 2019 andcontinues to be the largest sector in terms of employment in the KCW CMA.
• The ‘accommodation and food services’ sector added 1,000 jobs when comparedto 2020, however, there are still 3,600 fewer people employed in the sector whencompared to 2019, prior to COVID-19.
Annualized Employment Data
The working age population (those aged 15 years and over) of the KCW CMA was estimated to be 500,400 in 2021. Of this total, 68.7 per cent or 343,700 people were considered to be participating in the labour force (see Figure 1). These are people who were either working or indicated they were looking for work. Within the labour force, 321,400 people were employed, translating to an employment rate of 64.2 per cent. Of employed individuals, 83.5 per cent were working full-time, a proportion that is similar to Ontario where 82.4 per cent and Canada where 81.6 per cent of people were employed full-time. The other 22,200 people in the labour force were unemployed, which translates to an annualized unemployment rate of 6.5 per cent.
The rest of the working age population, an estimated 156,800 people, were not in the labour force, typically because they were students, retired, or not seeking employment. Those not seeking employment may have been on an unpaid leave of absence, permanently unable to work, or had not looked for work in at least four weeks (see Appendix B for a glossary of Labour Force Survey terms used in this report). This represents an increase of 2,600 people who were not in the labour force compared to 2020.
Page 45 of 198

PDL-CPL-22-09
3960554 Page 3 of 30
Figure 1: The working age population in 2021
KCW CMA unemployment rate comes in lower compared to Ontario and Canada, employment and labour force participation remain higher in the KCW CMA.
The KCW CMA has strong participation and employment rates when compared to Ontario and Canada. As shown in Table 1, both the participation rate and employment rate were higher than the provincial and national averages. The area’s unemployment rate was lower than the provincial and national unemployment rates. Compared to other CMAs2 across the country, KCW had the fourth highest employment rate and had the ninth lowest unemployment rate. However, when only looking at Ontario CMA’s, KCW had the second lowest unemployment rate.
Table 1: Labour force rates (per cent), 2021
Measure Kitchener-
Cambridge-Waterloo CMA
Ontario Canada
Participation rate 68.7 64.9 65.1 Employment rate 64.2 59.7 60.2 Unemployment rate 6.5 8.0 7.5
2 There are 35 Census Metropolitan Areas (CMAs) in Canada.
Page 46 of 198

PDL-CPL-22-09
3960554 Page 4 of 30
Figure 2: Labour force participation and employment rates for Ontario CMAs, 2021
Figure 2 compares the participation rates and employment rates for CMAs in Ontario. The KCW CMA has both a higher participation rate and employment rate than most Ontario CMAs, indicating a strong labour market.
Monthly labour force rates improve by the end of 2021 for many subsectors Monthly employment numbers were affected by another year of public health measures taken to curb the spread of COVID-19. There were a small subset of sectors that were most impacted by public health restrictions. The following is a timeline COVID-19 safety measures in 2021:
• April - Province wide lockdown• June - August - Gradual re-opening• September-November – Roll out of the vaccine certificate program and gradual
lifting of capacity limits• Mid December – Re-entering of a modified step 3
The monthly fluctuation in the 2021 labour market has resulted in an average annual employment number of 321,400 employees, as referenced elsewhere in this annual report. Because of this, there may contrasting information when comparing monthly data to annual data in this report. A table showing monthly employment numbers for all industries is located in Appendix E to better understand how the monthly employment numbers have affected the annual average. The following section uses monthly data, which showcases the variation of employment figures throughout the year.
Both participation and employment rates followed similar monthly trends from January to December of 2021. Between January and March rates declined slightly before slowly
Ottawa-Gatineau
KingstonPeterborough
Toronto
Oshawa
Kitchener-Cambridge-Waterloo
Brantford
Guelph
LondonWindsor
Barrie
Greater SudburyThunder Bay
50
55
60
65
70
75
54 56 58 60 62 64 66 68
Part
icip
atio
n Ra
te (%
)
Employment Rate (%)
Hamilton
Page 47 of 198

PDL-CPL-22-09
3960554 Page 5 of 30
increasing during the third and fourth quarter of the year (see Figure 3).3 The employment rate saw the largest gains in the fourth quarter of the year, when COVID-19 related restrictions were minimal. The participation rate ended the year at 69.6 per cent which was above where it began in 2021. Similarly, the employment rate ended the year 2.5 per cent above the January 2021 rate at 65.8 per cent.
Figure 3: Monthly employment and participation rates, 2021
*Note: Verical axis begins at 58 per cent
Monthly unemployment rates declined by 1.9 per cent from January to April. In May, rates then began to rise slightly throughout the spring and summer before declining again in October. The unemployment rate in the KCW CMA ended the year at 5.5 per cent, 1 per cent lower than the provincial rate (Figure 4).
Employment in the KCW CMA started 2021 at 314,300, which represented 94 per cent of pre-COVID levels (February 2020 employment). Strong employment growth in the fall of 2021 resulted in 331,200 employed by December, a gain of nearly 17,000 jobs over the year (Figure 5). As of December 2021, employment levels in the KCW CMA were at 99.6 per cent of pre-COVID employment levels.
3 The monthly rates in this report are seasonally adjusted using a 3-month moving average, meaning that fluctuations related to changes due to holidays, climate, and seasonal retail cycles are removed.
68.9 68.567.8 67.8
68.4 68.2 68.3 68.5 68.869.4 69.6 69.6
63.3 63.2 63.1 63.6 63.7 63.8 63.6 63.7 63.964.7
65.6 65.8
58
60
62
64
66
68
70
72
Jan Feb Mar Apr May Jun Jul Aug Sep Oct Nov Dec
Rate
%
Participation rate Employment rate
Page 48 of 198

PDL-CPL-22-09
3960554 Page 6 of 30
Figure 4: Monthly unemployment rates in KCW and Ontario, 2021
Figure 5: Monthly total employment in KCW, 2021
Figure 6 represents how much each industry has recovered from the COVID-19 related job losses. Although ‘accommodation and food services’ saw gains in employment when compared to 2020, it is still the furthest behind in terms of job recovery, sitting at 69 per cent of its pre-COVID-19 workforce. In contrast, several industries have fully recovered and even exceeded pre-COVID-19 employment numbers. Of the 14 industries, 8 have met or surpassed their pre-COVID employment numbers. Recognizing that it’s important to use caution in interpreting monthly LFS results due to sample size and volatility, the following trends were noticed.
• Accommodation and food services was one of the most variable sectors in termsof employment in 2021. The sector started the year at 45 per cent of its pre-COVID workforce. Throughout the spring and summer ‘accommodation and food
9.7 9.78.9 8.6 8.6 8.9 8.6
8 7.6 7.3 6.9 6.58.37.8
76.2
6.7 6.57 7 7.2
6.75.7 5.5
0
2
4
6
8
10
12
Jan Feb Mar Apr May Jun Jul Aug Sep Oct Nov Dec
Rate
%
Ontario KCW
305000
310000
315000
320000
325000
330000
335000
Empl
oym
ent
Monthly Employment Annual Average Employment
Page 49 of 198

PDL-CPL-22-09
3960554 Page 7 of 30
services’ gained 9,600 jobs, fully recovering from its COVID employment losses. However, numbers began to decline again in mid to late fall, where employment in the sector ended the year at 69 per cent of its pre-COVID number (Appendix E).
• The ‘transportation and warehousing’ sector started year off at 127 per cent of itspre-COVID employment, however, throughout the year the sector lost 5,400 jobs.As of December 2021 the sector sits at 89 per cent of its pre-COVIDemployment.
• The ‘finance, insurance, real estate, rental and leasing’ sector had the strongestyear, adding 3,800 jobs, representing 118 per cent of its pre-COVID workforce
Figure 6: Job recovery percentage as of December 2021, by industry
* Employment recovery is measured as the ratio (shown as percentage) of December 2021 employment to pre-COVID (February 2020) employment levels**Figures 2, 3, 4 and 5 reflect Labour Force Survey 2021 3-month moving average estimates, seasonally adjusted.
0% 20% 40% 60% 80% 100% 120% 140% 160% 180%
Accommodation and food services
Other services (except public administration)
Educational services
Transportation and warehousing
Information, culture and recreation
Manufacturing
Wholesale and retail trade
Services-producing sector
Total employed, all industries
Goods-producing sector
Health care and social assistance
Construction
Business, building and other support services
Finance, insurance, real estate, rental and leasing
Professional, scientific and technical services
Public administration
Agriculture
Page 50 of 198

PDL-CPL-22-09
3960554 Page 8 of 30
*** Although ‘Agriculture’ shows +170 per cent pre-COVID employment, the sector only accounts for 1 per cent of the employed labour force in the KCW CMA
Employment gains in 2021 were primarily in full-time jobs
The KCW CMA added 15,200 jobs in 2021, nearly making up for the 16,500 jobs that were lost in 2020 due to COVID related lockdowns. Full-time employment accounted for 93 per cent (14,200) of the added jobs in 2021. Resultantly, the 1,100 part-time jobs gained accounted for 7 per cent of total employment gain in 2021 (Figure 7).
Figure 7: Full-time and part-time employment, 2006-2021
In 2021, there were greater employment gains for females than males. Females added 9,100 jobs, whereas males added 6,100 (Figure 8). Although females added more jobs in 2021, it is important to note that females were more impacted by job losses in 2020 than males. Historically, females comprise 46.8 per cent of those employed in the KCW CMA4. The employment gains for females in 2021 bring the per cent of those who are employed to 46.2 per cent, up from 45.6 per cent in 2020, which is closer to the historical average of 46.8 per cent.
4 Between 2006 and 2021, on average, females comprised 46.8 per cent of the employed labour force in the KCW CMA.
- 50,000
100,000 150,000 200,000 250,000 300,000
2006 2007 2008 2009 2010 2011 2012 2013 2014 2015 2016 2017 2018 2019 2020 2021
Num
ber o
f peo
ple
Full-time employment Part-time employment
Page 51 of 198

PDL-CPL-22-09
3960554 Page 9 of 30
Figure 8: Employment for males and females, 2006-2021
The KCW CMA continues to have a strong labour force among comparator CMAs in Ontario
The KCW CMA was strong in 2021 compared to other CMA labour forces. The KCW CMA had the second largest labour force and employed population next to the Hamilton CMA, as shown in Figure 9 (see Appendix B for information on CMA geographies). The KCW CMA is most comparable to London’s by size of the working age population, but has a larger labour force and a higher proportion of employed people. Figure 9: Labour Force for comparator CMAs in Ontario, 2021
- 20,000 40,000 60,000 80,000
100,000 120,000 140,000 160,000 180,000 200,000
2006 2007 2008 2009 2010 2011 2012 2013 2014 2015 2016 2017 2018 2019 2020 2021
Num
ber o
f peo
ple
Males Females
0 100000 200000 300000 400000 500000 600000 700000 800000
Windsor
St. Catherines-Niagara
London
Hamilton
Guelph
Brantford
Barrie
Kitchener-Cambridge-Waterloo
Employment Labour force Population 15+
Page 52 of 198

PDL-CPL-22-09
3960554 Page 10 of 30
The KCW CMA ranks high in participation and employment rates among comparator Ontario CMAs. As shown in Table 2, the KCW CMA was second in participation and employment rates. In 2021, the KCW CMA had the lowest unemployment rate among the comparator municipalities, representing a strong improvement from 2020, where it had the highest unemployment rate.
Table 2: Labour force rates for comparator CMAs in Ontario, 2021
Measure Kitchener-
Cambridge-Waterloo
Barrie Guelph Hamilton London St.
Catharines-Niagara
Participation rate 68.7 68.4 70.5 65.6 65.3 59.0 Employment rate 64.2 63.1 65.6 61.2 60.4 53.2 Unemployment rate 6.5 7.7 7.1 6.8 7.6 9.8
As shown in Table 3, the KCW CMA has the 10th largest labour force in Canada. Table 3: Top 10 CMAs in Canada by size of labour force, 2021 Rank CMA Labour Force
1 Toronto, Ontario 3,730,200
2 Montréal, Quebec 2,435,600
3 Vancouver, British Columbia 1,612,700
4 Calgary, Alberta 895,800
5 Edmonton, Alberta 847,300
6 Ottawa-Gatineau, Ontario/Quebec 813,200
7 Winnipeg, Manitoba 476,500
8 Québec, Quebec 451,600
9 Hamilton, Ontario 437,800
10 Kitchener-Cambridge-Waterloo, Ontario 343,700
The following section highlights the changes and diversity of the KCW CMA labour
Page 53 of 198

PDL-CPL-22-09
3960554 Page 11 of 30
market across industrial sectors in 2021.
Goods producing sector declines while services producing sector increases past 2019 employment levels
The services producing sector gained 16,300 jobs in 2021, which wipes out all of the 2020 employment losses in the sector. Employment in the services producing sector is 4,600 higher in 2021 than it was in 2019, prior to COVID. Employment in goods producing industries decreased, finishing 2021 with a loss of 1,100 jobs from 2020 (Figure 10).
Figure 10: Goods-producing and Services-producing sector employment, 2006 - 2021
The majority of employment loss in the goods producing sector came from the manufacturing industry which lost 2,300 jobs in 2021. However, it is important to note that manufacturing was one of the best preforming sectors in 2020, the employment losses in 2021 still put the manufacturing sector above 2019 employment numbers for the sector. The services producing sector contains the four best preforming sectors of 2021 which contributed to the 16,300 jobs gained in 2021. The four sectors that saw the most growth were ‘finance, insurance, real estate and leasing’ (+3,800), ‘professional, scientific and technical services’ (+3,600), ‘educational services’ (+3,100), and ‘public administration’ (+3,100). The ‘other services’ sector, which is comprised of repair and maintenance services, personal and laundry services as well as religious, grant, civic, and professional organizations, was the second worst preforming sector behind manufacturing. Other services lost 2,000 jobs in 2021.
0
50,000
100,000
150,000
200,000
250,000
300,000
2006 2007 2008 2009 2010 2011 2012 2013 2014 2015 2016 2017 2018 2019 2020 2021
Num
ber o
f peo
ple
empl
oyed
Goods-producing sector Services-producing sector
Page 54 of 198

PDL-CPL-22-09
3960554 Page 12 of 30
Figure 11: Employment gains and losses by industry, 2021
The service-producing sector made up more than three quarters of employment or approximately 241,800 jobs in 2021. The sector consists of 11 industries, the largest of which is ‘wholesale and retail trade’. Of all service sector industries, five employed 20,000 or more people (see Table 4) in 2021, indicating a diverse economy. Four industries made up over half of all employment in the KCW CMA labour force in 2021. These four industries were ‘manufacturing’, ‘wholesale and retail trade’, ‘healthcare and social assistance’, and ‘education’. Illustrating the diversity of the economy, seven industries employed over 75 per cent of local workers including ‘professional, scientific and technical services’, ‘finance, insurance, real estate, rental and leasing’, and ‘construction’. The remaining 24 per cent of jobs were spread across seven industries.
-3000 -2000 -1000 0 1000 2000 3000 4000 5000
Agriculture
Forestry, fishing, mining, quarrying, oil and gas
Construction
Manufacturing
Wholesale and retail trade
Transportation and warehousing
Finance, insurance, real estate, rental and…
Professional, scientific and technical services
Business, building and other support services
Educational services
Health care and social assistance
Information, culture and recreation
Accommodation and food services
Other services (except public administration)
Public administration
Page 55 of 198

PDL-CPL-22-09
3960554 Page 13 of 30
Table 4: Employment and Percentage Share by Industry, 2021
Industry 2021 Share
Goods-producing sector 79,600 24.8% Agriculture 3,100 1.0% Construction 20,400 6.3% Manufacturing 54,700 17.0% Services-producing sector 241,800 75.2% Wholesale and retail trade 46,000 14.3% Transportation and warehousing 12,900 4.0% Finance, insurance, real estate, rental and leasing 26,300 8.2% Professional, scientific and technical services 31,900 9.9% Business, building and other support services 10,600 3.3% Educational services 32,200 10.0% Health care and social assistance 34,200 10.6% Information, culture and recreation 11,400 3.5% Accommodation and food services 13,900 4.3% Other services (except public administration) 9,000 2.8% Public administration 13,400 4.2% Total Jobs 321,400 100%
*Due to rounding methods individual industries may not sum up to sector totals
Manufacturing decreases but remains top industry for employment in 2021
The manufacturing sector saw a 4 per cent decline in employment in 2021, however, employment in the sector remains slightly above 2019 levels (Figure 12). In 2021, there were 54,700 people employed in manufacturing, which equates to 17 per cent of the employed labour force and is the highest among all sectors (Table 4). Figure 12: Manufacturing industry employment over time, 2006-2021
0
10,000
20,000
30,000
40,000
50,000
60,000
70,000
2006 2007 2008 2009 2010 2011 2012 2013 2014 2015 2016 2017 2018 2019 2020 2021
Empl
oym
ent
Page 56 of 198

PDL-CPL-22-09
3960554 Page 14 of 30
KCW CMA remains strong among Canadian CMAs for manufacturing industry employment in terms of per cent of workforce, and total size The KCW CMA remains one of the top manufacturing labour markets in Canada. The Region’s labour force is currently the fourth largest in the country by percentage of employees in manufacturing, with approximately 17 per cent of the employed labour force working in this sector (see Table 5). This is a slightly smaller percentage than Brantford, but represents almost four times as many workers. The total number of residents working in manufacturing was estimated at 54,700 people in 2021 which is down from 57,000 in 2020. In terms of the total size of the manufacturing workforce, the KCW CMA is the fourth largest in Canada, behind Toronto, Montréal, and Vancouver (Table 6).
Table 5: Top 10 Canadian CMAs by proportion of manufacturing employment, 2021
CMA Total employment
Manufacturing employment
% Share
Windsor, Ontario 168,500 34,100 20.2% Guelph, Ontario 92,300 18,600 20.2% Brantford, Ontario 74,100 13,200 17.8% Kitchener-Cambridge-Waterloo, Ontario
321,400 54,700 17.0%
Belleville, Ontario 50,000 7,100 14.2% Sherbrooke, Quebec 111,000 15,000 13.5% St. Catharines-Niagara, Ontario 198,700 26,000 13.1% Barrie, Ontario 114,500 14,400 12.6% London, Ontario 282,700 33,900 12.0% Abbotsford-Mission, British Columbia 107,600 12,700 11.8%
Page 57 of 198

PDL-CPL-22-09
3960554 Page 15 of 30
Table 6: Top 10 Canadian CMAs by total manufacturing employment, 2021
CMA Manufacturing employment
Toronto, Ontario 338,100 Montréal, Quebec 228,900 Vancouver, British Columbia 99,300 Kitchener-Cambridge-Waterloo, Ontario 54,700 Hamilton, Ontario 43,200 Calgary, Alberta 41,400 Winnipeg, Manitoba 40,200 Edmonton, Alberta 37,900 Québec, Quebec 34,900 Windsor, Ontario 34,100
Greatest increases in employment over time had been service related industries
Total employment growth over time (2006 to 2021) has increased significantly for many industries. The greatest growth has occurred in the professional, scientific and technical services industry which has increased by 17,600 jobs since 2006, representing a 123 per cent change. Educational services has seen the second highest growth since 2006 adding 13,800 new jobs (+ 75 per cent change). Health care and social assistance has added 11,300 jobs since 2006, representing a 49 per cent change (Figure 13). Figure 13: Industries that have had the greatest employment gains since 2006
0
5,000
10,000
15,000
20,000
25,000
30,000
35,000
40,000
2006 2007 2008 2009 2010 2011 2012 2013 2014 2015 2016 2017 2018 2019 2020 2021
Num
ber o
f peo
ple
empl
oyed
Professional, scientific and technical services Educational services
Health care and social assistance Public administration
Page 58 of 198

PDL-CPL-22-09
3960554 Page 16 of 30
Some industry groupings such as the creative or high tech sectors often fall within a variety of classifications and cannot be measured with labour force data. For example, high tech employees may work in a variety of sub-sectors in manufacturing, information and cultural industries, or professional, scientific, and technical services.
Sales and Services make up the greatest share of employment by occupation
Occupations, which represent type of work done rather than the industry in which the job falls, are split into ten broad classes. In 2021, ‘sales and services occupations’ were the largest class in the KCW CMA with 20 per cent of employment, as shown in Table 7. This occupation class, combined with ‘business and finance and administrative occupations’ and ‘trades, transport and equipment operators and related occupations’, represent one half of employment.
Table 7: Employment by occupation, 20215
Occupation Class* 2021 % Share Sales and service occupations 65,200 20% Business, finance and administrative occupations 50,400 16% Trades, transport and equipment operators and related occupations
44,900 14%
Occupations in education, law and social, community and government services
39,400 12%
Natural and applied sciences and related occupations 34,900 11%
Management occupations 27,700 9% Occupations in manufacturing and utilities 26,800 8% Health occupations 20,800 6% Occupations in art, culture, recreation and sport 7,500 2% Natural resources, agriculture and related production occupations
3,800 1%
In 2021 ‘business, finance and administrative occupations’ and ‘occupations in education, law and social, community and government services’ both grew by 4,800 or 10.5 per cent and 13.9 percent, respectively. This was followed by ‘sales and service occupations’ which grew by 3,600 (5.8 per cent). Between 2006 and 2021, occupations in education, law and social, community and government services’ followed by ‘natural and applied sciences and related occupations experienced the greatest growth in terms
5 *Based on 2016 National Occupation Classification – Statistics (NOC) **Note: Data for ‘Natural resources, agriculture and related production occupations’ in this report is subject to high fluctuation in employment numbers and periodic suppression
Page 59 of 198

PDL-CPL-22-09
3960554 Page 17 of 30
of number of people employed. Over this period of time, these two occupation categories increased by 15,600 and 13,800 employees respectively (Table 8). Table 8: Change in Employment by Occupation Category 2020 to 2021 and 2006 to 2021
Occupation
Change 2020 to
2021
% Change 2020 to
2021
Change 2006 to
2021
% Change 2006 to
2021 Management occupations 2,800 11.2% 2,700 10.8% Business, finance and administrative occupations
4,800 10.5% 7,700 18.0%
Natural and applied sciences and related occupations
-2,100 -5.7% 13,800 65.4%
Health occupations 900 4.5% 8,900 74.8% Occupations in education, law and social, community and government services
4,800 13.9% 15,600 65.5%
Occupations in art, culture, recreation and sport
700 10.3% 2,200 41.5%
Sales and service occupations 3,600 5.8% 4,900 8.1% Trades, transport and equipment operators and related occupations
2,100 4.9% 4,600 11.4%
Natural resources, agriculture and related production occupations
800 26.7% 1,600 72.7%
Occupations in manufacturing and utilities
-3,400 -11.3% -5,600 -17.3%
People employed in health occupations continues to increase in 2021 Health occupations continue to employ a relatively small percentage of the work force compared to other occupations but it remains one of the occupations with the greatest percentage growth. Health occupations have increased by 75 per cent since 2006 starting at an employment of 11,900 in 2006 and finishing 2021 with 20,800 employees (Figure 14).
Page 60 of 198

PDL-CPL-22-09
3960554 Page 18 of 30
Figure 14: Employment in Health Occupations, 2006-2021
Manufacturing and utilities occupations decline in 2021 After seeing a rise in jobs in 2020, occupations in manufacturing and utilities declined by 3,400 jobs or -11.3 per cent in 2021. This brings the employment in this occupation group back to what it was in 2019. This is consistent with the longer term trend of employment in manufacturing and utilities, which has lost 5,600 job (-17.3 per cent) since 2006. That being said, there has been a modest increase in manufacturing and utilities employment from 2016 onward with 2,100 jobs added since 2016 (Figure 15). Figure 15: Employment in Manufacturing and Utilities Occupations, 2006-2021
Long-term trends The following section highlights labour and demographic trends over the period of 2006 to 2021 that are continually monitored in this report.
Working age population continues to increase faster than labour force
Since 2006, the population aged 15 years and over has grown at a faster rate than the labour force. During this period, the number of people aged 15 years and over increased from 392,000 to 500,400, an average of almost 7,000 people per year. Over the same period, the number of people in the labour force, either working or looking for work, has only grown by an average of just over 4,000 people per year to its current level of 343,700 (Figure 16). More recently, in the last 5 years, the working age
0
5,000
10,000
15,000
20,000
25,000
2006 2007 2008 2009 2010 2011 2012 2013 2014 2015 2016 2017 2018 2019 2020 2021
Empl
oym
ent
Health occupations
0
10,000
20,000
30,000
40,000
2006 2007 2008 2009 2010 2011 2012 2013 2014 2015 2016 2017 2018 2019 2020 2021
Empl
oym
ent
Occupations in manufacturing and utilities
Page 61 of 198

PDL-CPL-22-09
3960554 Page 19 of 30
population grew by 47,100 people (between 2017 and 2021 inclusive), while the labour force grew by 25,600 people. Refer to appendix D for the working age population, labour force and employment chart for Ontario.
Figure 16: The working age population, labour force and employment, in KCW 2006-2021
There are several factors that contribute to a working age population increasing faster than the labour force including; an ageing workforce, increasing numbers of students who are furthering their education and postponing their entry into the workforce; and caregivers choosing not to enter the workforce.
The labour force is aging The high proportion of baby boomers retiring and leaving the workforce is expected to continue until 2030 when the youngest baby boomers reach age 65. Additionally, disability or health-related issues can impact participation in the labour force for older adults. Figure 17 shows that adults ages 65 and over make up the largest proportion of those ‘not in the labour force’, which increased significantly by 8,500 people in 2021.
-
100,000
200,000
300,000
400,000
500,000
600,000
2006 2007 2008 2009 2010 2011 2012 2013 2014 2015 2016 2017 2018 2019 2020 2021
Num
ber o
f peo
ple
Population Labour force Employment
Page 62 of 198

PDL-CPL-22-09
3960554 Page 20 of 30
Figure 17: Not in labour force population, by age group 2006-2021
The increase in students and their trend of undertaking further education and thereby postponing their entry into the labour force also contributes to the ‘not in labour force’ population. Figure 18 shows for Ontario, the increase in students since 2006 and the corresponding ‘not in labour force’ student population. The number of students in Ontario has grown by 91,600 people from 2006 to 2021. Meanwhile the ‘not in the labour force’ population has been growing at a faster rate with an increase of 114,800 since 2006.
While the data is not available for the KCW CMA specifically, enrollment at the two universities and college in the Region has grown significantly, particularly in recent years, and it is expected that the ‘not in the labour force’ student population in the Region would behave similar to the provincial trend.
Figure 18: ‘Total Students’ and ‘Not in Labour force’ student population, age 15-24 years old (Ontario), 2006-2021
0
10,000
20,000
30,000
40,000
50,000
60,000
70,000
80,000
2006 2007 2008 2009 2010 2011 2012 2013 2014 2015 2016 2017 2018 2019 2020 2021Not
in la
bour
forc
e po
pula
tion
15 to 24 years 25 to 54 years55 to 64 years 65+
0
200,000
400,000
600,000
800,000
1,000,000
1,200,000
1,400,000
2006 2007 2008 2009 2010 2011 2012 2013 2014 2015 2016 2017 2018 2019 2020 2021
Num
ber o
f stu
dent
s
Students Not in Labour Force Students
Page 63 of 198

PDL-CPL-22-09
3960554 Page 21 of 30
Although the population is aging, and more young people are pursuing further education, the working age population in KCW is still younger than the provincial average. As shown in Table 9, in KCW, those aged 15-54 years make up 66 per cent of the working age population. In Ontario as a whole, those aged 15-54 only make up 63 per cent of the working age population.
Table 9: Proportion of working age population based on age category in KCW and Ontario, 2021
Age Category Kitchener-
Cambridge-Waterloo CMA
Ontario
15 to 24 years 16% 15% 25 to 54 years 50% 48% 55 to 64 years 16% 16% 65 years and over 18% 21%
Labour force rates show signs of improvement in 2021
Due to the COVID-19 pandemic, 2020 saw declining labour force rates. However, 2021 showed some improvements, particularly when it comes to the employment rate, which increased from 62.1 per cent in 2020 to 64.2 per cent in 2021. The participation rate remained the same at 68.7 per cent.
Figure 19: Labour force rates, 2006-2021
* Axis starts at 56 per cent
71.370.2 70.4 71 70.8
72.171
71.9 7270.5 69.8 70.2 69.9
70.8
68.7 68.7
67.666.2 66.2
64.165.1
67.366.3 66.9 67.4
66.5 65.9 66.5 66.367.1
62.1
64.2
56
58
60
62
64
66
68
70
72
74
2006 2007 2008 2009 2010 2011 2012 2013 2014 2015 2016 2017 2018 2019 2020 2021
Rate
(%)
Participation rate Employment rate
Page 64 of 198
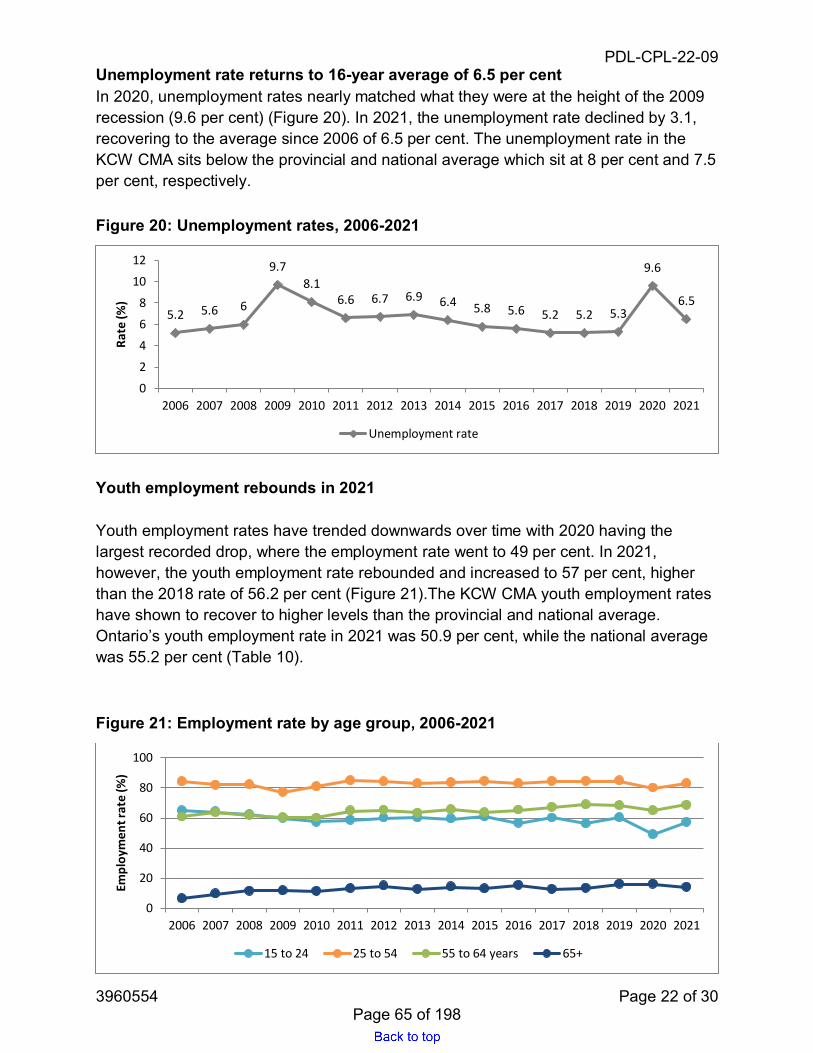
PDL-CPL-22-09
3960554 Page 22 of 30
Unemployment rate returns to 16-year average of 6.5 per cent In 2020, unemployment rates nearly matched what they were at the height of the 2009 recession (9.6 per cent) (Figure 20). In 2021, the unemployment rate declined by 3.1, recovering to the average since 2006 of 6.5 per cent. The unemployment rate in the KCW CMA sits below the provincial and national average which sit at 8 per cent and 7.5 per cent, respectively.
Figure 20: Unemployment rates, 2006-2021
Youth employment rebounds in 2021 Youth employment rates have trended downwards over time with 2020 having the largest recorded drop, where the employment rate went to 49 per cent. In 2021, however, the youth employment rate rebounded and increased to 57 per cent, higher than the 2018 rate of 56.2 per cent (Figure 21).The KCW CMA youth employment rates have shown to recover to higher levels than the provincial and national average. Ontario’s youth employment rate in 2021 was 50.9 per cent, while the national average was 55.2 per cent (Table 10).
Figure 21: Employment rate by age group, 2006-2021
5.2 5.6 6
9.78.1
6.6 6.7 6.9 6.4 5.8 5.6 5.2 5.2 5.3
9.6
6.5
0
2
4
6
8
10
12
2006 2007 2008 2009 2010 2011 2012 2013 2014 2015 2016 2017 2018 2019 2020 2021
Rate
(%)
Unemployment rate
0
20
40
60
80
100
2006 2007 2008 2009 2010 2011 2012 2013 2014 2015 2016 2017 2018 2019 2020 2021
Empl
oym
ent r
ate
(%)
15 to 24 25 to 54 55 to 64 years 65+
Page 65 of 198
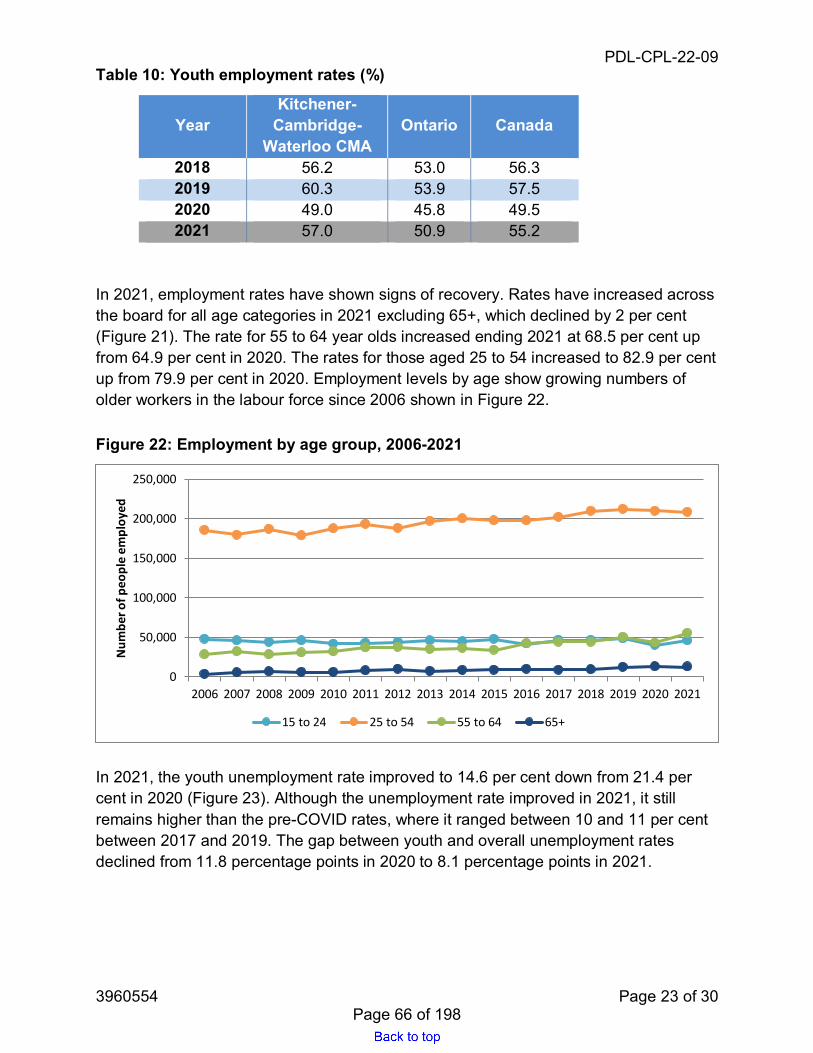
PDL-CPL-22-09
3960554 Page 23 of 30
Table 10: Youth employment rates (%)
Year Kitchener-
Cambridge-Waterloo CMA
Ontario Canada
2018 56.2 53.0 56.3 2019 60.3 53.9 57.5 2020 49.0 45.8 49.5 2021 57.0 50.9 55.2
In 2021, employment rates have shown signs of recovery. Rates have increased across the board for all age categories in 2021 excluding 65+, which declined by 2 per cent (Figure 21). The rate for 55 to 64 year olds increased ending 2021 at 68.5 per cent up from 64.9 per cent in 2020. The rates for those aged 25 to 54 increased to 82.9 per cent up from 79.9 per cent in 2020. Employment levels by age show growing numbers of older workers in the labour force since 2006 shown in Figure 22.
Figure 22: Employment by age group, 2006-2021
In 2021, the youth unemployment rate improved to 14.6 per cent down from 21.4 per cent in 2020 (Figure 23). Although the unemployment rate improved in 2021, it still remains higher than the pre-COVID rates, where it ranged between 10 and 11 per cent between 2017 and 2019. The gap between youth and overall unemployment rates declined from 11.8 percentage points in 2020 to 8.1 percentage points in 2021.
0
50,000
100,000
150,000
200,000
250,000
2006 2007 2008 2009 2010 2011 2012 2013 2014 2015 2016 2017 2018 2019 2020 2021
Num
ber o
f peo
ple
empl
oyed
15 to 24 25 to 54 55 to 64 65+
Page 66 of 198
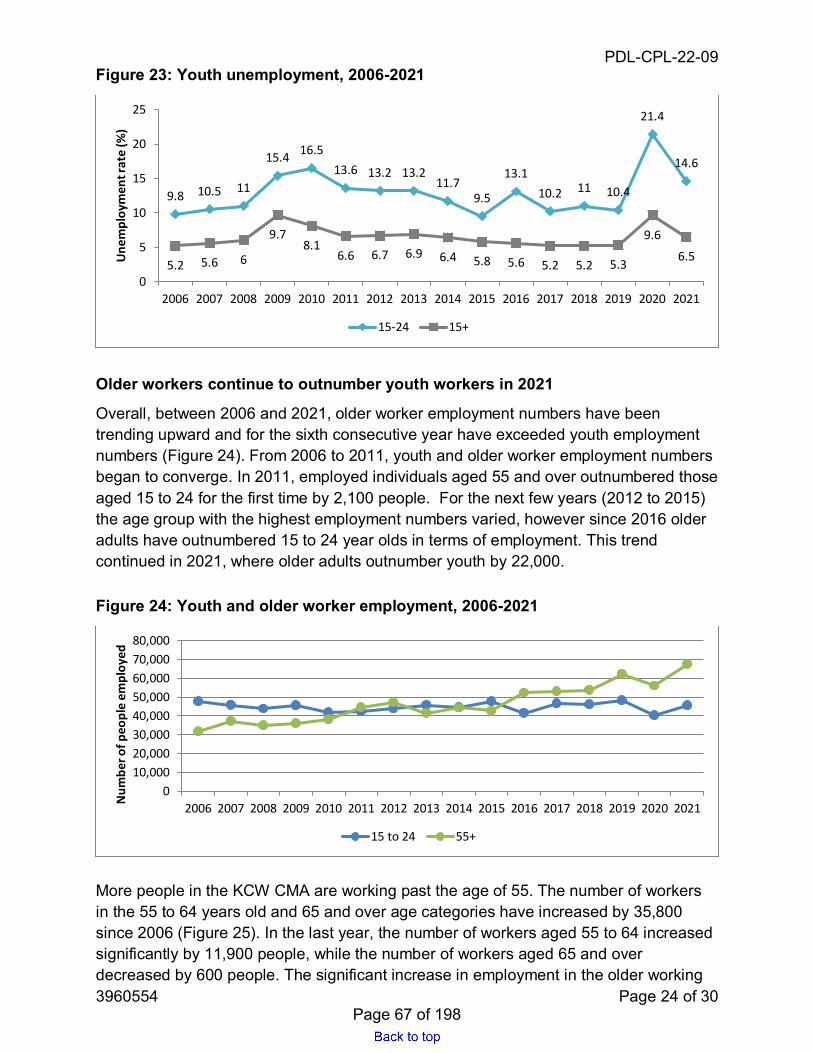
PDL-CPL-22-09
3960554 Page 24 of 30
Figure 23: Youth unemployment, 2006-2021
Older workers continue to outnumber youth workers in 2021
Overall, between 2006 and 2021, older worker employment numbers have been trending upward and for the sixth consecutive year have exceeded youth employment numbers (Figure 24). From 2006 to 2011, youth and older worker employment numbers began to converge. In 2011, employed individuals aged 55 and over outnumbered those aged 15 to 24 for the first time by 2,100 people. For the next few years (2012 to 2015) the age group with the highest employment numbers varied, however since 2016 older adults have outnumbered 15 to 24 year olds in terms of employment. This trend continued in 2021, where older adults outnumber youth by 22,000.
Figure 24: Youth and older worker employment, 2006-2021
More people in the KCW CMA are working past the age of 55. The number of workers in the 55 to 64 years old and 65 and over age categories have increased by 35,800 since 2006 (Figure 25). In the last year, the number of workers aged 55 to 64 increased significantly by 11,900 people, while the number of workers aged 65 and over decreased by 600 people. The significant increase in employment in the older working
9.8 10.5 11
15.4 16.513.6 13.2 13.2
11.79.5
13.110.2 11 10.4
21.4
14.6
5.2 5.6 6
9.78.1
6.6 6.7 6.9 6.4 5.8 5.6 5.2 5.2 5.3
9.6
6.5
0
5
10
15
20
25
2006 2007 2008 2009 2010 2011 2012 2013 2014 2015 2016 2017 2018 2019 2020 2021
Une
mpl
oym
ent r
ate
(%)
15-24 15+
010,00020,00030,00040,00050,00060,00070,00080,000
2006 2007 2008 2009 2010 2011 2012 2013 2014 2015 2016 2017 2018 2019 2020 2021Num
ber o
f peo
ple
empl
oyed
15 to 24 55+
Page 67 of 198

PDL-CPL-22-09
3960554 Page 25 of 30
employment category further demonstrates the overarching trend from 2006 to 2021, which continues to indicate a local labour force with growing numbers of older workers. As these workers retire they will move into the “not in the labour force” segment of the working age population. Figure 25: Employment for those 55 and older, 2006-2021
0
10,000
20,000
30,000
40,000
50,000
60,000
2006 2007 2008 2009 2010 2011 2012 2013 2014 2015 2016 2017 2018 2019 2020 2021Num
ber o
f peo
ple
empl
oyed
55 to 64 years 65 years and over
Page 68 of 198

PDL-CPL-22-09
3960554 Page 26 of 30
APPENDIX A
About the Labour Force Survey
Sources – Statistics Canada 2021, Labour Force Survey by Census Metropolitan Area (Annualized); Labour Force Survey by Census Metropolitan Area (Monthly), unadjusted for seasonality. Sample Size - The Statistics Canada Labour Force Survey (LFS) is a nation-wide employment survey producing data on employment, industry and occupation characteristics of the population. The survey uses a sample size of approximately 56,000 private households, or 100,000 people across Canada. Geography - Data from the Labour Force Survey is available at the provincial and Census Metropolitan Area (CMA) geography levels according to 2016 census boundaries. The 2016 Kitchener-Cambridge-Waterloo CMA consists of the cities of Kitchener, Cambridge and Waterloo, as well as the townships of Wilmot, North Dumfries and Woolwich. Population - Labour force estimates presented in this report are for the working age population 15 years and over. At year-end 2021, the LFS estimated population for those aged 15 and over in the KCW CMA was 500,400 Time Period - Data presented in this report is annualized, based on unadjusted monthly totals averaged over 12 months. Data in this report may be discussed in single years or blocks of time dating back to 2006. Quality – Data presented in this report is based on annual averages of labour force estimates, and employment by industry and occupation. Response to the LFS is mandatory however Statistics Canada estimates non-response to average 10 per cent of eligible households. Significance – Statistical significance of the annualized estimates presented in this report can be calculated using standard errors (SE) derived from published Statistics Canada Coefficients of Variation for Canadian provinces. For estimates (i.e. employment, unemployment, not in the labour force) to be statistically significant at a 95 per cent confidence level the growth or decline from the previous year must be twice the calculated SE. Note that all year to year change reported in this document is not considered to be statistically significant and these results should not be interpreted with concern. More meaningful change is that which occurs over a longer period of time.
Page 69 of 198

PDL-CPL-22-09
3960554 Page 27 of 30
APPENDIX B
Glossary Terms
Average Annual Growth – refers to annual growth rates averaged over the 15 year period from 2006 to 2021. Census Metropolitan Area—“is formed by one or more adjacent municipalities centred on a population centre (known as the core).” While the Kitchener-Cambridge-Waterloo Census Metropolitan Area (CMA) excludes Wellesley Township, other CMAs include additional cities, townships, and towns. For example, the Hamilton CMA also includes the City of Burlington and the Town of Grimsby. Employment rate – “the number of persons employed expressed as a percentage of the population 15 years of age and over.” Industry (based on the 2017 North American Industry Classification System) – “refers to the general nature of the business carried out by the employer for whom the respondent works (main job only).” Not in Labour Force - “the number of persons who, during the reference week, were unwilling or unable to offer or supply labour services under conditions existing in their labour markets (this includes persons who were full-time students currently attending school). Occupation (based on 2016 National Occupation Classification – Statistics) – “refers to the kind of work persons 15 years of age and over were doing during the reference week, as determined by the kind of work reported and the description of the most important duties of the job.” Participation rate – “the number of labour force participants [comprised of those who are employed or unemployed] expressed as a percentage of the population 15 years of age and over.” Unemployment rate – “the number of unemployed persons expressed as a percentage of the labour force.”
Page 70 of 198

PDL-CPL-22-09
3960554 Page 28 of 30
APPENDIX C
Revisions to the Labour Force Survey
To ensure that the Labour Force Survey (LFS) reflects current labour market conditions as accurately as possible, data are revised following each census to reflect the most recently available population estimates, geographic boundaries, and industry and occupation classifications. This standard revision process results in minor changes to recent and historical LFS data and has little impact on trends in key labour market indicators, such as employment, unemployment, and labour force participation rates. More details on these revisions are available in the article "The 2021 Revisions of the Labour Force Survey (LFS)," as part of the Improvements to the Labour Force Survey (LFS) (Catalogue number71F0031X) series. Specifically the Kitchener-Cambridge-Waterloo Census Metropolitan Area (KCW CMA), which historically includes Kitchener, Cambridge, Waterloo, Woolwich, and North Dumfries, has been updated to include Wilmot. Revisions were made to the 2020 Labour Force Report to include the added geography of Wilmot going back to 2006. In Ontario, there are only two known Labour Force CMA adjustments – the KCW CMA and the Belleville CMA.
Page 71 of 198

PDL-CPL-22-09
3960554 Page 29 of 30
APPENDIX D
Ontario population, labour force, and employment, 2006 - 2021
0
2000000
4000000
6000000
8000000
10000000
12000000
14000000
2006 2007 2008 2009 2010 2011 2012 2013 2014 2015 2016 2017 2018 2019 2020 2021
Num
ber o
f peo
ple
Population Labour force Employment
Page 72 of 198

PDL-CPL-22-09
3960554 Page 30 of 30
APPENDIX E
Monthly Employment Figures by Industry, 2021
Industry Jan Feb Mar Apr May Jun Jul Aug Sep Oct Nov Dec Employment Recovery %
Goods-producing sector
78,400 76,800 77,400 80,400 80,600 80,400 77,400 77,400 76,800 78,700 81,000 83,900 102%
Agriculture 2,800 2,900 2,900 2,600 2,300 2,100 2,000 2,800 3,200 3,900 3,900 4,200 168% Construction 20,800 18,800 18,600 18,200 18,600 19,300 19,700 19,900 19,700 21,000 23,600 24,000 113% Manufacturing 53,400 53,700 54,300 57,900 58,100 57,400 54,400 53,400 53,000 52,800 52,400 53,900 96% Services-producing sector
232,900
233,600
232,700
234,500
235,500
238,700
241,400
243,500
245,300
249,000
252,600
250,400
102%
Wholesale and retail trade
47,300 48,400 49,800 49,400 48,400 45,400 41,900 40,200 40,600 43,300 46,300 48,200 99%
Transportation and warehousing
18,000 18,200 16,500 14,600 12,400 11,300 11,400 11,400 11,300 11,500 12,600 12,600 89%
Finance, insurance, real estate, rental and leasing
21,100 22,000 22,600 23,400 24,800 25,000 26,300 26,900 28,700 29,600 30,500 28,900 118%
Professional, scientific and technical services
31,000 30,300 29,500 29,000 29,700 31,100 33,300 34,500 34,500 32,900 33,200 32,600 125%
Business, building and other support services
9,300 8,100 6,800 6,600 7,400 9,400 11,200 12,500 13,100 13,700 13,700 13,200 117%
Educational services
29,400 31,900 33,300 34,900 33,900 34,100 32,200 30,600 29,800 30,700 31,100 31,500 85%
Health care and social assistance
32,900 33,100 34,000 35,800 36,700 38,200 38,100 35,900 33,200 31,700 31,500 31,300 110%
Information, culture and recreation
9,400 9,600 10,200 11,000 11,200 10,800 10,600 11,300 12,200 12,600 12,600 12,400 91%
Accommodation and food services
8,000 8,200 9,900 12,400 14,700 15,500 15,500 17,400 17,600 17,000 13,800 12,400 69%
Other services 12,700 10,800 8,200 6,800 5,800 6,800 8,700 10,000 10,400 10,800 11,000 10,400 83% Public administration
13,700 12,900 12,000 10,600 10,500 10,900 12,200 12,800 14,000 15,000 16,300 16,900 147%
Page 73 of 198

Report: TES-WMS-22-01
Document Number: 3955379 Page 1 of 7
Region of Waterloo
Transportation & Environmental Services
Waste Management
To: Chair Tom Galloway and Members of the Planning and Works Committee
Date: April 12, 2022
Report Title: Comments on Environment and Climate Change Canada Documents Related to Landfill Gas Emissions
1. Recommendation:
That the Regional Municipality of Waterloo provide the comments identified in Attachment A to Environment and Climate Change Canada in response to their recent discussion paper titled “Reducing Methane Emissions from Canada’s Municipal Solid Waste Landfills”, as outlined in Report TES-WMS-22-01, dated April 12, 2022.
2. Purpose / Issue:
This report is to inform the Planning & Works Committee about potential impacts from the proposed Federal Government Greenhouse Gas Offset System and the Region’s response to an Environment and Climate Change Canada (ECCC) discussion paper on reducing methane from Canada’s municipal solid waste landfills.
3. Strategic Plan
The work described in this report supports the Corporate Strategic Plan objectives Environment and Climate Action Focus Area 3.1 “reduce greenhouse gas emissions”.
4. Key Considerations:
ECCC has requested public comments on the following documents:
a) Landfill Methane Recovery and Destruction, Federal Offset Protocol. PublicConsultation Draft, January 2022. Environment and Climate Change Canada
b) Reducing Methane Emissions from Canada’s Municipal Solid Waste Landfills.Discussion Paper 2022. Environment and Climate Change Canada
Landfill gas (LFG) is made up of approximately 50% methane, a greenhouse gas that contributes significantly to climate change and has the potential to impact local residents and the population at large. Since the early 1990’s, the Region has installed significant LFG collection/utilization infrastructure and continues to develop active LFG
Page 74 of 198

April 12, 2022 Report: TES-WMS-22-01
3955379 Page 2 of 7
collection systems at the Waterloo and Cambridge waste management sites.
At Waterloo, LFG is collected and used to generate electricity while at the closed Cambridge Landfill, LFG is used to augment natural gas requirements for the production of steel products at a facility adjacent to the landfill. At both the Waterloo and Cambridge sites, flares are used to destroy methane when energy production is not possible during maintenance periods. An active collection system is also in operation at the former Kitchener Landfill, however, the methane volume and concentrations are significantly lower, eliminating utilization opportunities.
Considering the Region is very successful in collection, utilization, and destruction of LFG, and continues to make improvements on these environmental systems, it is the Region’s overall position that the focus of any new legislation should be on upstream solutions to further divert or ban biodegradable waste from landfills.
Related to document (a) Federal Offset Protocol:
ECCC is in the process of developing regulations, a tracking system, and protocols for the Federal Greenhouse Gas (GHG) Offset System. Qualifying participants can generate credits to offset costs associated with activities that reduce GHG emissions. However, the Region does not meet the baseline scenario condition as proposed by ECCC that must apply for the project to be eligible under the Offset Protocol. To qualify, landfill gas (LFG) must not already be actively recovered from within the project site. As noted above, the Region already collects methane through extensive collection systems and utilizes the available LFG to generate electricity at the Waterloo site and augment natural gas requirements for the production of steel products at a facility adjacent to the closed Cambridge landfill. As we do not qualify for this offset opportunity, the Region will not be providing a submission.
Related to document (b) Reducing Methane Emissions from Landfills:
Region staff have coordinated with the Solid Waste Association of North America (SWANA) Canadian Chapters to respond to comments presented in the Discussion paper. Region specific responses are presented in Attachment A and it is recommended these be provided as a response to ECCC. The Region’s comments will also be incorporated as part of SWANAs overall consolidated response.
5. Background:
The Region operates one active landfill and owns five closed landfills. These sites have the potential to affect our residents; however, our sound environmental approach and operating practices help minimize the effects of GHG within our community.
Municipal solid waste landfills are responsible for about 23% of Canada’s methane
Page 75 of 198

April 12, 2022 Report: TES-WMS-22-01
3955379 Page 3 of 7
emissions1. However, despite current reduction efforts, total emissions have not decreased for over a decade. The Federal Greenhouse Gas (GHG) Offset System is under development and ECCC is seeking public consultation on the Landfill Methane Recovery and Destruction Protocol. The Federal GHG Offset system will consist of:
• Regulations to implement the operational aspects of the system;• a tracking system to register offset projects, issue and track offset credits, and
share key information through a public registry; and• federal offset protocols that establish the approach for quantifying the GHG
emissions reductions for a given project type.
The ultimate goal is to encourage cost-effective domestic GHG emission reductions from activities that are not covered by carbon pollution pricing and that go beyond legal requirements.
Furthermore, ECCC is seeking comments on a discussion paper entitled “Reducing methane emissions from Canada’s municipal solid waste landfills” that will help inform the development of the proposed regulations.
6. Public/Stakeholder Engagement:
The Region’s Waste Management staff work closely with the Waterloo Landfill Liaison Committee to communicate and seek input on operational and environmental challenges. In addition, the Waste Management Division completes an Annual Report that highlights the efforts to reduce landfill gas. This report is available on the Region’s website. To reduce the potential for methane gas generation from decomposing organic waste, the Region has green bin organics and yard waste collection programs in place. The Waste Management Division has successful promotion and education activities and in 2020, diversion rates for yard waste and green bin were at historical highs.
The Annual Report communicates to residents that the LFG collection systems operated at the Region’s Waterloo Landfill, Cambridge Waste Management Facility and former Kitchener landfill provide an effective way to reduce greenhouse gases from being released into the air. LFG generated at the Waterloo and closed Cambridge landfills use the gas to generate renewable energy. The LFG collected is used to help power a neighbouring steel plant in Cambridge, and is turned into electricity in Waterloo – enough to power between 4,000 and 6,000 homes.
7. Financial Implications: Nil.
8. Conclusion / Next Steps:
Staff will provide the comments outlined in Attachment A of this report to ECCC in
1 ECCC, National Inventory Report (NIR): Greenhouse Gas Sources and Sinks in Canada: executive summary, 2021
Page 76 of 198

April 12, 2022 Report: TES-WMS-22-01
3955379 Page 4 of 7
accordance with their Discussion Paper.
9. Attachments / Links:
Appendix A: Region’s comments submitted to ECCC related to Discussion Paper on Reducing Methane Emissions from Canada’s Municipal Solid Waste Landfills
Prepared By: Rachel Vaillancourt, Senior Environmental Engineer
Reviewed By: Jon Arsenault, Director, Waste Management Services
Approved By: Thomas Schmidt, Commissioner, Transportation and Environmental Services
Page 77 of 198

Report: TES-WMS-22-01
Document Number: 3955379 Page 5 of 7
Appendix A Region of Waterloo comments related to the ECCC Discussion Paper on Reducing
Methane Emissions from Canada’s Municipal Solid Waste Landfills
Objective 1 – Increase the number of landfills that take action to reduce methane emissions. A key consideration is how to require as many landfills as possible to reduce emissions.
Discussion Question: Current Canadian provincial landfill methane regulations do not apply to closed landfills. What are the options for reducing methane emissions at closed landfills in Canada, where methane levels may be significant, but declining?
Investment in research and technology to reduce methane emissions is essential. Consideration should be given to passive methane oxidation biosystems (PMOB). PMOB may be used to mitigate methane emissions not captured by an active collection system. It is a way of providing an optimal environment to promote the growth of methane consuming bacteria, that already exist in soil, to mitigate emissions. If closed landfills were to be regulated, this could impact the Region of Waterloo as we own five closed landfills. The Cambridge Landfill, that closed in 2003, continues to generate enough LFG to augment natural gas requirements for the neighbouring steel production plant and the former Kitchener landfill continues to produce a steady flow of low quality LFG 50 years after closure. The remaining closed landfill sites are small with little landfill gas being produced so to collect any gas at these sites would have a low cost benefit ratio. The Region is proactively participating in research of PMOB. We have a pilot PMOB to mitigate fugitive methane emissions at the former Kitchener landfill and a similar pilot system will be tested at the Waterloo Landfill in summer 2022.
Another option that may be considered is the use of hybrid thermal oxidizer flares where methane levels may be significant but declining. These flares are designed to combust LFG with lower methane concentrations (<25% methane). This is an option for the Waterloo landfill as there is the ability to separate good and poor quality LFG. However, at this time the landfill is producing good quality gas that is used to generate electricity so it may be a consideration in the future as LFG quality declines.
Objective 2 – Ensure that landfills maximize methane recovery. This could include a requirement for installing and expanding infrastructure within a specific timeframe following waste disposal.
Discussion Question - what are the key technical challenges and limitations to implementing these approaches?
Timelines would have to be site-specific, realistic and flexible. Gas generation rates will vary by site so timelines must take into account the type and amount of waste accepted, operational practices and site configuration.
Meeting a regulated timeframe could be difficult. The time it takes to design, approve, construct new, or to expand existing infrastructure can often be longer than anticipated. In addition, there is a limited selection of LFG experts (consultants and contractors) in some geographical areas to design, construct and oversee the installation of systems
Page 78 of 198

April 12, 2022 Report: TES-WMS-22-01
3955379 Page 6 of 7
making set timelines difficult to achieve.
A limitation that needs to be considered is that timeframes are twofold; infrastructure may be installed within a certain timeframe, however, there may be delays in commissioning or when infrastructure can be operated. Collection infrastructure installed with landfill progression can only become active once appropriate gas quality is achieved and landfilling has progressed well above the installed infrastructure. For example, LFG horizontal collection piping may be installed at the earliest opportunity but cannot be used until there is sufficient waste placed above. Operating new horizontals too soon may be detrimental to LFG quality if oxygen is drawn into the system.
A technical challenge is how to accurately measure collection efficiency to meet target thresholds. Modeling to determine collection efficiencies can produce widely varied results depending on model inputs. Models used for different purposes such as estimating emissions vs estimating gas production may be very sensitive to inputs.
Discussion Question - In Canada and the United States, some landfill methane regulations include requirements that maximize methane recovery by mandating installation of landfill gas recovery infrastructure within certain timeframes following waste disposal and for maintaining negative pressure in extraction wells. Other regulatory provisions set maximum allowable concentration thresholds for methane measured on the surface of the landfill. Should federal regulations include similar requirements to ensure methane recovery is optimized?
Measurements at the surface of the landfill do not quantify the amount of methane generation; however, this type of data can identify potential areas where methane is escaping from the landfill. There is considerable variability in the operating conditions at a landfill site which affect the methane that could potentially be released from a landfill – i.e. landfill settlement, atmospheric pressure, etc. As such, these factors are outside the immediate control of landfill gas system operators. Conducting surface measurements can provide good qualitative information about where methane could be escaping from a landfill site. This may be considered a best management practice and, as such, the Region has been voluntarily monitoring surface emissions.
Objective 3 – Achieve long-term emissions reductions through diversion of biodegradable waste
Discussion Question - Taking action to reduce methane emissions from landfills is essential to reducing emissions by 2030. Should federal regulations require landfill owners to reduce landfilling of biodegradable waste?
The Region of Waterloo agrees in principle that biodegradable waste should not be landfilled. Federal regulations should focus on upstream targets such as IC&I organic waste diversion. As of 2015, only about 25% of food and organic waste generated from the IC&I sector was diverted compared to approximately 50% of residential food and organic waste diverted (Reports on Organic Waste Management in Ontario, prepared for the Ontario Ministry of the Environment and Climate Change, 2015). Currently, the region diverts 34% of residential waste with the green bins and yard waste collection programs.
Page 79 of 198

April 12, 2022 Report: TES-WMS-22-01
3955379 Page 7 of 7
Discussion Question - What opportunities exist to incorporate biodegradable waste diversion into a landfill methane emission reduction plan?
We reiterate that in the Region of Waterloo, residential waste is being collected and diverted successfully and the focus should be on the IC&I sector.
Objective 4 - Increase utilization of landfill methane to create low-carbon energy and fuels
Discussion Question - How will a regulatory approach on landfill methane affect policy and other goals to increase the production of renewable natural gas?
A regulatory approach may have a significant negative financial impact on municipalities due to the high cost of treatment to remove contaminants and high cost to connect landfill infrastructure to the local utility grid. Government incentives programs designed to encourage Renewable Natural Gas (RNG) projects in Canada would potentially make this a more feasible option. However, as indicated previously any financial incentive program would have to be streamlined and simplified to encourage maximum uptake.
Page 80 of 198
Report: TES-WMS-22-03
Document Number: 3957738 Page 1 of 4
Region of Waterloo
Transportation and Environmental Services
Waste Management Division
To: Chair Tom Galloway and Members of the Planning and Works Committee
Date: April 12, 2022
Report Title: Curbside Collection Contract (T2015-217) Considerations
1. Recommendation:
That the Regional Municipality of Waterloo extend Contract T2015-217, Collection of Garbage, Organics, Bulky and Large Metal Items, Recycling, Yard Waste and Christmas Trees within the Region of Waterloo for up to two (2) one-year periods, from March 2, 2024 to March 2, 2026, under the same terms and conditions as described in Report TES-WMS-16-01, dated January 12, 2016.
2. Purpose / Issue:
The purpose of this report is to inform Planning and Works Committee of the considerations related to extending the curbside collection contract for the Region of Waterloo.
3. Strategic Plan:
The work described in this report supports the Corporate Strategic Plan objectives Environment and Climate Action Focus Area 3.3: Direct more waste away from the landfill, improve recycling and better manage organic waste.
4. Key Considerations:
By granting the extension for Contract T2015-217, this will:
• Allow sufficient time to understand the potential implications of the blue box transitionon the collection of the remaining waste streams that are municipal responsibility (i.e.garbage, green bin, etc.). As reported previously in TES-WMS-21-05, the Region’sblue box program will transition to full producer responsibility in March 2024 at whichtime, producers of paper products and packaging will become responsible foroperational and financial aspects of recycling. More clarity as to the details of thetransition were anticipated by now but given the scale, complexity and still many
Page 81 of 198

April 12, 2022 TES-WMS-22-03
3957738 Page 2 of 4
unknowns related to the transition, further dialogue with producers is ongoing to understand what terms and conditions would be required should the Region consider administering blue box/cart collection contracts on behalf of producers. The Region is required to submit the strategy for transition to the Resource Productivity and Recovery Authority (RPRA) by August 31, 2022.
• Provide time for request for proposal development, assessment and award of a newcollection contract and preparation/purchasing timelines needed by the successfulbidder(s) for a long-term waste collection contract. Historically this requires a minimumof 15 to 18 months, however, timelines have been further complicated by the impactsof the pending blue box transition (as noted above) and the ongoing pandemic. It isnoted that lead times of up to two years are now required to obtain new collectionvehicles and therefore, it is necessary to factor in potential delays with supply chainsand resources
• Allow staff to conduct research and explore opportunities for future collectionmethodology and service levels by:
o Exploring industry best management practices for resourcing, technology andfleets such as automated cart collection, alternative fuel powered vehicles, on-board cameras, etc. These opportunities and changes can improve health andsafety of workers, customer service, operational efficiencies and supportenvironmental initiatives such as reduction of greenhouse gases due to fleetoperations
o Conducting a waste composition study to determine what is currently being setcurbside in all waste streams (i.e. garbage, blue boxes and green bin). This willassist in our understanding of how waste generation may have changed due toCOVID-19 and lifestyle influences (e.g. residents working from home, changesin packaging, online shopping, upcycling within communities, etc.)
o Reviewing and determining service eligibility (e.g. multi-residential, BusinessImprovement Areas (BIA), etc.)
o Conducting public and stakeholder engagement to gather direct feedback fromhouseholds receiving services
• Ensure reliable, continuous curbside collection services for households in the Regionof Waterloo
Background
The Region of Waterloo provides curbside collection service (blue box, green bin, garbage, bulky item, and seasonal yard waste and Christmas trees) to:
Page 82 of 198

April 12, 2022 TES-WMS-22-03
3957738 Page 3 of 4
• 161,000 single-family homes, duplexes, and 3 to 6 unit buildings• 8,500 multi-family units and townhouse complexes that meet truck-access criteria• 41,000 multi-family units receive recycling services only, using larger capacity (360
litre) carts
1,400 businesses within the Business Improvement Areas (BIA) also are eligible for garbage and blue box collections.
In 2017, the Region of Waterloo’s waste collection service and contract went through a major program change, including:
• Establishment of standardized bags limits and collection services Region-wide• Transition from weekly residential garbage collection to bi-weekly residential
garbage collection in Waterloo Region• Transition to bi-weekly bulky and large metal item collection in the tri-cities and
townships and change to the allowable limits each bi-weekly collection period• Transition of bi-weekly blue box recycling collection to weekly blue box recycling
collection in some rural areas of the townships• Addition of green bin collection in some rural areas of the townships• Addition of seasonal yard waste collection in some rural areas of the townships• Addition of natural Christmas tree collection in some rural areas of the townships
As approved in Report TES-WMS-16-01, dated January 12, 2016, Miller Waste Systems Inc. was awarded Bid Option 2A, collecting waste within the cities of Cambridge, Kitchener and Waterloo, effective March 6, 2017 for a period of eighty-four (84) months plus the option of two one-year extensions, at an annual cost of $14,376,668.16 plus applicable taxes.
Halton Recycling Ltd. (Emterra Environmental) was awarded Bid Option 2B, collecting waste within the townships of North Dumfries, Wellesley, Wilmot and Woolwich, effective March 6, 2017 for a period of eighty-four (84) months plus the option of two one-year extensions, at an annual cost of $4,168,308.04 plus applicable taxes.
The contract ends on March 2, 2024, with an option to renew for up to two (2) one-year periods.
5. Area Municipality Communication and Public/Stakeholder Engagement:
On February 8, 2022, a Waste Management Working Group, comprised of staff and Councillors, was formed to provide input and feedback in regards to the upcoming collection
Page 83 of 198

April 12, 2022 TES-WMS-22-03
3957738 Page 4 of 4
contract and blue box transition. Terms of Reference and meetings will commence in Q2 of 2022.
The following five regional Councillors are on the Committee:
• Cambridge – Councillor Jowett• Kitchener – Councillor Harris and Councillor Galloway• Waterloo – Councillor Erb• Townships – Councillor Nowak
Public and stakeholder engagement will be undertaken during the contract extension to gather feedback to help inform the scope and level of service for the next collection contract.
6. Financial Implications:
The existing Waste Management Division operating budget has provisions for the current level of services provided under T2015-217. However, no additional funding is currently available for any additional costs that would be incurred by a major service level change at the curb within the existing contract.
Under the Purchasing By-law, the Chief Purchasing Officer may acquire any goods or service through negotiation where the extension of an existing or previous contract would prove more cost effective or beneficial for the Region.
7. Conclusion / Next Steps:
There will be no interruption to services if Contract T2015-217, Collection of Garbage, Organics, Bulky and Large Metal Items, Recycling, Yard Waste and Christmas Trees within the Region of Waterloo is extended for up to two (2) one-year periods, from March 2, 2024 to March 2, 2026.
During this time, Region of Waterloo staff will conduct research and explore opportunities for future collections and service levels, and continue to prepare for the transition of the blue box program. Staff will report back on progress and updates as needed.
Attachments / Links: Nil
Prepared By: Olivia Kwok, Supervisor, Contracts & Service (Waste Management)
Reviewed By: Jon Arsenault, Director, Waste Management Services
Approved By: Thomas Schmidt, Commissioner, Transportation and Environmental Services
Page 84 of 198

Report: PDL-CPL-22-06
Document Number: 3977325 Page 1 of 5
Region of Waterloo
Planning, Development and Legislative Services
Community Planning
To: Chair Tom Galloway and Members of the Planning and Works Committee
Meeting Date: April 12, 2022
Report Title: 2022 Community Environmental Fund Grants
1. Recommendation:
That the Regional Municipality of Waterloo approve funding allocations totalling up to $99,964 from the Community Environmental Fund to support 15 stewardship and sustainability projects as described in Report PDL-CPL-22-06, dated April 12, 2022.
2. Purpose / Issue:
To seek Council approval of the projects to be funded in 2022 by the Community Environmental Fund.
3. Strategic Plan:
This report addresses the Region’s Corporate Strategic Plan 2019-2023, Focus Area 3: Environment and Climate Action, Strategic Objectives 3.1 Reduce greenhouse gas emissions, 3.2 Improve resilience to climate change and/or severe weather, 3.3 Direct more waste away from the landfill, improve recycling and better manage organic waste, and 3.5 Promote the efficient use of urban land, and protect and enhance agricultural and natural areas.
4. Key Considerations:
• The Community Environmental Fund (CEF) was established by Regional Councilin October 2011 (Report CR-FM-11-022/P-11-085). Since its inception, theCommunity Environmental Fund has granted approximately $1.9 million to over235 projects.
• Stewardship and sustainability projects funded by the CEF provide a positive andlasting environmental return; engage citizens and encourage collaboration; seekinnovative solutions and/or increase knowledge; and produce measurable andachievable outcomes.
• Nineteen applications were received in 2022 and included projects to: manage a
Page 85 of 198

April 12, 2022 Report: PDL-CPL-22-06
3977325 Page 2 of 5
community forest, monitor water quality in a lake, teach families about Regional cycling infrastructure and car-free transportation, reduce GHGs and utility costs by installing heat pumps, restore cold-water streams in Kitchener, naturalize landscapes and enhance greenspaces through native plantings and removal of invasive species.
• In recent years Community Environmental Fund grants have been balancedbetween stewardship and sustainability projects. Due to COVID-19, certainsustainability projects (i.e. that rely on indoor in person activities or “business asusual”) have been deferred . This has resulted in recommended funding that is60% stewardship and 40% sustainability in 2022. It is expected that the balancewill be restored through future funding cycles.
• Staff are recommending that $99,964 be allocated to the 15 projects listed asfollows:
Project Title Full Cost of Project
Recommended Funding
Reducing GHGs and utility costs by installing heat pumps (Union Coop/UW) $32,950 $16,950 SWR Sustainability Ambassador Program $10,246 $9,246 Parent/Child Program Launch (Cycling into the Future) $5,320 $5,320
Recycling and Composting (St. John’s Kilmarnock) $10,295 $1,000 Forest Management in the Branchton Village Land Trust $4,075 $3,975.00
Wilmot Township Tree Canopy Study / Policy $50,000 $10,000 Pollinators for Idea Exchange Preston Seed Library $278 $278
Trees for Woolwich: Building Roadside Tree Planting Capacity. $25,912 $10,000
Water Quality Monitoring and Shoreline Improvements at Paradise Lake $19,054 $10,000 Restoring Coldwater Streams in Kitchener (Trout Unlimited Canada) $21,170 $8,000 Salinity and cold temperature tolerance in Stormwater Management Pond Vegetation (Biology Dept, - WLU)
$6,250 $6,250
Doon Campus Wellness & Reflection Garden (Conestoga College) $75,000 $6,500 Elmira Parterre (Elmira BIA) $71,500 $5,000 KW Habilitation's - Our Farm Trail $15,720 $5,000 Preston High School Pollinator Garden Project $3,244 $2,444
TOTAL $351,015 $99,964
• Recommended funding amounts were determined in consultation with applicants
Page 86 of 198

April 12, 2022 Report: PDL-CPL-22-06
3977325 Page 3 of 5
and were based on: the alignment of the project with the purpose of the fund; the level of public impact and access; and specific funding needs based on project design and the availability of in-kind and other funding supports.
• Based on the project applications, the recommended Regional grants wouldleverage an additional estimated $3.51 in cash and/or in-kind contributions fromthe applicants and/or other sources of funding for each dollar spent by the CEF
• The recommended projects are located across the Region including several inrural communities and settlement areas.
• Several applications for which grants are not being recommended at this timewere either deemed premature or fell outside the scope of eligible funding. Staffplan to offer assistance to community members who submitted applications thatwere not funded who may wish to re-apply in the future.
• The collective impact of CEF projects has contributed significantly to theadvancement of the Region’s environmental priorities over the last decade.
• As we plan for transformational change in the community to address the ClimateEmergency, the importance of the fund is expected to grow, particularly withrespect to reducing energy use and greenhouse gas emissions, and ensuring thehealth of ecosystem- and neighbourhood-level natural systems.
5. Background:
The Community Environmental Fund was advertised in the winter of 2022 to attract proposal submissions. The application was available as an on-line form on the Region’s website. A total of nineteen proposals were received from a wide variety of local applicants for a total request of nearly $250,000.
To be eligible for consideration, a project proposal to the Community Environmental Fund, must: be implemented within the Waterloo Region; fall within at least one of the eight Project Categories; and satisfy at least two of both the project (category) specific criteria and the General Criteria. Requests for funding typically range from $1,000 to $25,000 per project.
Grant applications are accepted from: charitable or non-profit organizations (clubs, associations, land trusts); neighbourhood associations and other unincorporated community-based groups; co-operative corporations; public institutions; and individuals/students with a documented collaborative agreement with an eligible applicant. Stewardship applications are also accepted from private landowners and Area Municipalities, the Grand River Conservation Authority or Regional departments.
Staff reviewed applications to ensure that they conform to the funding guidelines, evaluated the proposals based on the program funding criteria, and where necessary,
Page 87 of 198

April 12, 2022 Report: PDL-CPL-22-06
3977325 Page 4 of 5
followed up with applicants to further clarify details of their proposals and refine specific funding needs
6. Area Municipality Communication and Public/Stakeholder Engagement:
The application guideline makes Area Municipalities eligible recipients for project funding.
7. Financial Implications:
The Region’s approved 2022 budget for Planning, Development and Legislative Services included $100,000 for the Community Environmental Fund funded from the property tax levy. Staff are recommending that the Region approve funding of $99,964 for 15 projects.
8. Conclusion / Next Steps:
Following Council’s consideration of this report, Community Environmental Fund applicants will receive official notice of their funding allocation, as well as further information on the process to receive the funds, including administrative and reporting requirements.
During the 2022 budget cycle discussions on grants to community organizations, staff committed to revisiting the process used to administer the CEF with the intent to:
• Explore options to work with the broader community to solidify and expandlocal funding opportunities for community environmental projects
• Provide opportunity for Regional Council to continue to play a role in guidingand supporting the success of the program
• Maintain or enhance the funding program’s focus and priorities• Maintain Regional financial support (reduced in 2022 to $100,000 per year
(previously $150,000 per year) and potentially seek community matchingfunds; and
• Find further efficiencies in terms of staff time and administration of the fund
Staff will be undertaking this work over the next calendar year and will involve Regional Council at the appropriate stages as the work progresses.
9. Attachments / Links:
Apendix A: Project descriptions of CEF Projects recommended for funding in 2022 (Docs#3977671)
Page 88 of 198

April 12, 2022 Report: PDL-CPL-22-06
3977325 Page 5 of 5
Prepared By: Albert Hovingh, Principal Planner
Kate Hagerman, Manager, Environmental Planning and Sustainability
Reviewed By: Danielle De Fields, Director, Community Planning
Approved By: Rod Regier, Commissioner, Planning, Development and Legislative Services
Page 89 of 198

Document Number: 3977671 1
Appendix A:
PROJECT DESCRIPTIONS OF CEF PROJECTS RECOMMENDED FOR FUNDING IN 2022
Reducing GHGs and utility costs by installing heat pumps in affordable housing properties (Union: Sustainable Development Co-Operative). Electric heat pumps are very efficient and can significantly reduce GHG emissions and energy costs, which is particularly important for low-income residents. This project is a feasibility study and financing strategy, which will be designed to be replicated across affordable housing providers across Waterloo Region, and will be completed under researchers at the University of Waterloo Facility of Environment. Region funding is expected to leverage funding from MITACS to complete the project. This project supports TransformWR Strategy 3.1 (decarbonize building heating) and Strategy 6.1 (prioritize increasing equity through GHG reduction planning).
Total project cost: $32,950 Recommended funding: $16,950
SWR Sustainability Ambassador Program (Sustainable Waterloo Region). This project will create a network of change agents from organizations who are not ready to commit to a full sustainability program like SWR’s existing Regional Sustainability Initiative. Members of this network will receive information and support from SWR and peer-to-peer learning opportunities to enact change at work. This proposal is seeking funding for the inaugural year of an ongoing program that SWR would like to provide in perpetuity, which will enable program design, implementation, execution, and evaluation phases. A membership fee will be charged to the Ambassadors to generate revenue for the program for SWR in all subsequent years. This project supports TransformWR Strategy 6.4 (support GHG reduction transition planning in all organizations).
Total project cost: $10,246 Recommended funding: $9,246
Parent/Child Program Launch (Cycling into the Future). To respond to the need for cycling education and skills building outside of their school-based program, particularly in light of recent COVID closures, Cycling into the Future has developed a 3-session family cycling education program to reach the community outside of schools. This project will launch the program to teach families about KW’s cycling infrastructure and car-free transportation goals, and rules and riding in participants’ local community. Region funding for the first year of this initiative will allow the program to provide the program in low-income neighbourhoods that can particularly benefit from affordable increased mobility through cycling, and wave fees for participants. Participants can also receive assistance in securing bicycles to be able to participate, if needed. This project supports TransformWR Strategy 6.1 (prioritize increasing equity through GHG reduction planning) and Strategy 1.3 (support people to walk, cycle, or roll).
Page 90 of 198

Document Number: 3977671 2
Total project cost: $5,320 Recommended funding: $5,320
Recycling and Composting (St. John’s-Kilmarnock School). This project will support student engagement and participation in waste sorting and composting. Food waste diverted will be turned into rich black loam, which will support a vegetable or flower garden, which will have both environmental and wellbeing benefits for the students working on it. Funding provided by the Region will support the purchase of composting units to enable the project. This project supports TransformWR Strategy 4.1 (optimize waste management by expanding diversion programs) and Strategy 4.2 (use less and use it again).
Total project cost: $10,295 Recommended funding: $1,000
Forest Management in the Branchton Village Land Trust Forest (Paul Eagles). The Branchton Forest is part of the much larger Branchton Forest and Swamp Environmentally Sensitive Policy Area in North Dumfries Township. As in previous years, there are two aspects of the forest management work proposed in 2022. The first is cutting down a number of dead trees which pose hazards to neighbouring residential properties as well as users of the forest property. The second is the removal of the invasive garlic mustard plants which are detrimental to native herbaceous plants and tree seedlings. The Branchton Village Land Trust has benefited by receiving funding from the CEF in previous years for similar management activities in the Branchton Forest. This project supports Regional Strategic Objective 3.5 (protect and enhance natural areas).
Total project cost: $4,075 Recommended $3,975
Wilmot Township Tree Canopy Study / Policy (Harold O’Kraka, Wilmot Township/Wilmot Horticultural Society) The Wilmot Tree Canopy project is to develop a comprehensive Tree Canopy Policy for Wilmot Township. The Tree Canopy Policy will enable the development of a comprehensive management plan to protect and enhance the Township’s tree canopy and natural vegetation. The benefit of the project will be community engagement and education on the existing tree canopy and the development of a plan to 'grow' the public and private canopy. This project supports the Region’s Community Climate Adaptation Plan Objective 8 (expand the use of natural features and green infrastructure to better manage storm water runoff and decrease flood risk).
Total project cost: $50,000 Recommended $10,000
Pollinators for Idea Exchange Preston Seed Library (Emma Campbell) As a member of Bee City Canada and Waterloo Bee Region, the Idea Exchange’s goals is to increase
Page 91 of 198

Document Number: 3977671 3
the native wildflower stock in the Seed Library and to promote local pollinators to local residents. This project will make native pollinator seeds readily available for the public to take, share, and plant. Individuals will benefit, as well as the community and the local ecosystem by supporting more propagation of native pollinators. This project supports the Region’s Community Climate Adaptation Plan Objective 10 (monitor, coordinate, plan for and mitigate the spread of invasive species in the natural environment).
Total project cost: $278 Recommended $278
Trees for Woolwich: Building Roadside Tree Planting Capacity. (Ann Roberts) Trees For Woolwich (T4W) and Township of Woolwich Environmental Enhancement Committee (TWEEC) have been active with a Woolwich Greening Initiative endorsed by Woolwich council in 2018. This project will continue the goal of increasing the canopy cover in Woolwich township. Two roadside plantings to replace roadside trees originally planted in the late 1860s are planned for fall 2022. This project supports the Region’s Community Climate Adaptation Plan Objective11 (monitor, maintain and improve the diversity and resiliency of urban trees and forests).
Total project cost: $25,912 Recommended $10,000
Water Quality Monitoring and Shoreline Improvements at Paradise Lake (Paradise Lake Property Owners Association; Paul Jessop, Chair, Environmental Committee). The Paradise Lake Association has a history of intermittent water quality monitoring and encouragement of environmentally responsible practices. An earlier CEF grant began a water monitoring program that will be continued with this year’s grant. This project is also intended to begin a series of shoreline improvement measures that will continue into the future. This project supports Regional Strategic Objective 3.4 (protect our water resources).
Total project cost: $19,054 Recommended $10,000
Restoring Coldwater Streams in Kitchener (Trout Unlimited Canada). This project deals with the restoration of several cold-water streams in Kitchener. With the help of the City of Kitchener, Trout Unlimited Canada has identified three project sites to complete restoration activities: Kolb Creek, Strasburg Creek, and Idlewood Creek. These restoration projects will involve the local community as well as undergraduates from UW in a number of workdays to remove litter, plant trees, and build in-stream structures to help improve stream form and function. This project supports Regional Strategic Objective 3.4 (protect our water resources).
Total project cost: $21,170 Recommended $8,000
Page 92 of 198
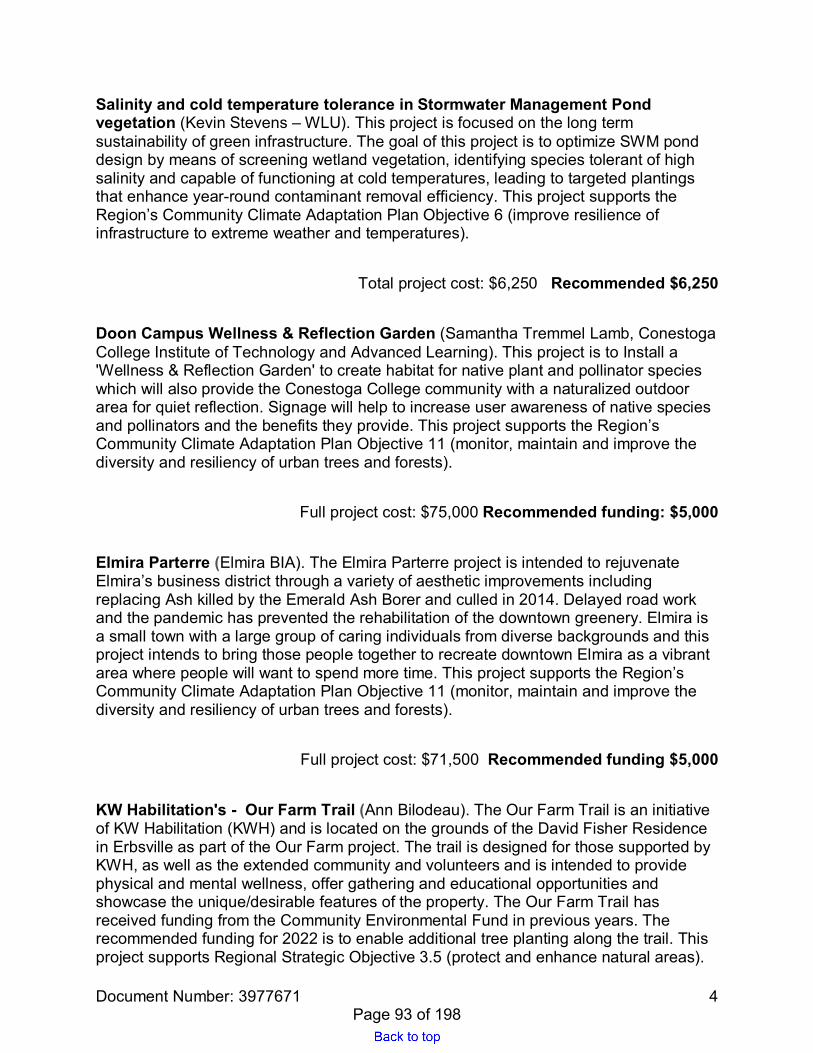
Document Number: 3977671 4
Salinity and cold temperature tolerance in Stormwater Management Pond vegetation (Kevin Stevens – WLU). This project is focused on the long term sustainability of green infrastructure. The goal of this project is to optimize SWM pond design by means of screening wetland vegetation, identifying species tolerant of high salinity and capable of functioning at cold temperatures, leading to targeted plantings that enhance year-round contaminant removal efficiency. This project supports the Region’s Community Climate Adaptation Plan Objective 6 (improve resilience of infrastructure to extreme weather and temperatures).
Total project cost: $6,250 Recommended $6,250
Doon Campus Wellness & Reflection Garden (Samantha Tremmel Lamb, Conestoga College Institute of Technology and Advanced Learning). This project is to Install a 'Wellness & Reflection Garden' to create habitat for native plant and pollinator species which will also provide the Conestoga College community with a naturalized outdoor area for quiet reflection. Signage will help to increase user awareness of native species and pollinators and the benefits they provide. This project supports the Region’s Community Climate Adaptation Plan Objective 11 (monitor, maintain and improve the diversity and resiliency of urban trees and forests).
Full project cost: $75,000 Recommended funding: $5,000
Elmira Parterre (Elmira BIA). The Elmira Parterre project is intended to rejuvenate Elmira’s business district through a variety of aesthetic improvements including replacing Ash killed by the Emerald Ash Borer and culled in 2014. Delayed road work and the pandemic has prevented the rehabilitation of the downtown greenery. Elmira is a small town with a large group of caring individuals from diverse backgrounds and this project intends to bring those people together to recreate downtown Elmira as a vibrant area where people will want to spend more time. This project supports the Region’s Community Climate Adaptation Plan Objective 11 (monitor, maintain and improve the diversity and resiliency of urban trees and forests).
Full project cost: $71,500 Recommended funding $5,000
KW Habilitation's - Our Farm Trail (Ann Bilodeau). The Our Farm Trail is an initiative of KW Habilitation (KWH) and is located on the grounds of the David Fisher Residence in Erbsville as part of the Our Farm project. The trail is designed for those supported by KWH, as well as the extended community and volunteers and is intended to provide physical and mental wellness, offer gathering and educational opportunities and showcase the unique/desirable features of the property. The Our Farm Trail has received funding from the Community Environmental Fund in previous years. The recommended funding for 2022 is to enable additional tree planting along the trail. This project supports Regional Strategic Objective 3.5 (protect and enhance natural areas).
Page 93 of 198
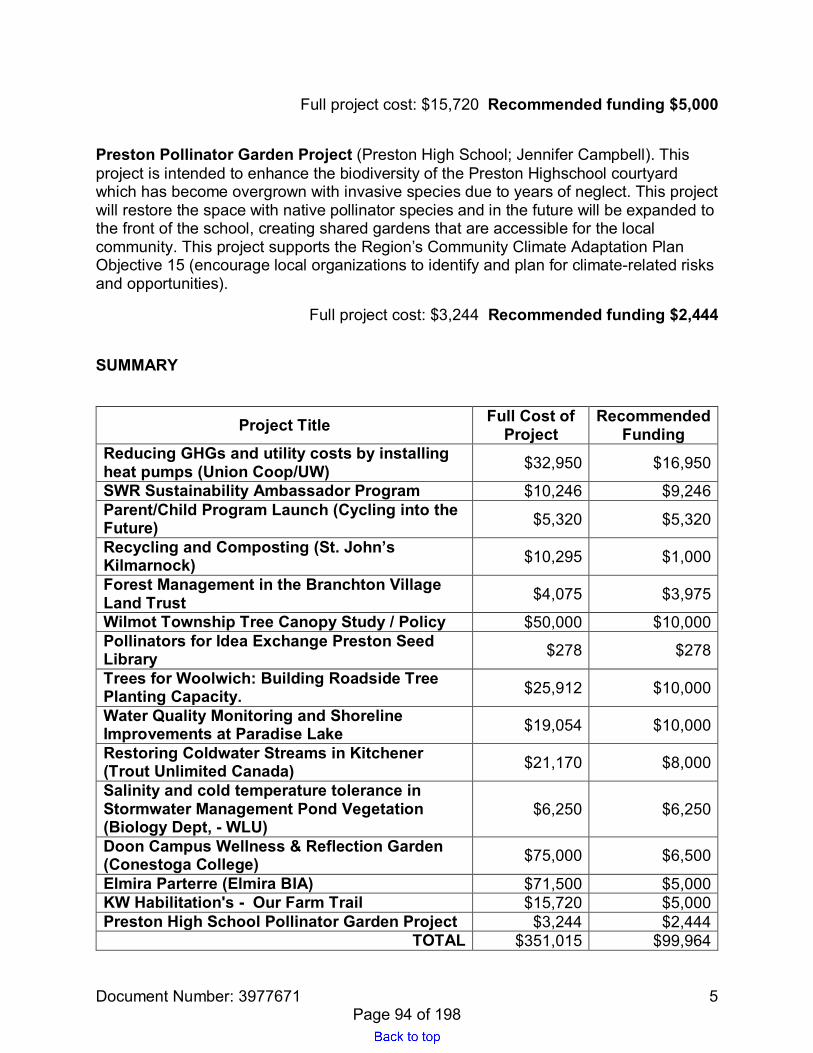
Document Number: 3977671 5
Full project cost: $15,720 Recommended funding $5,000
Preston Pollinator Garden Project (Preston High School; Jennifer Campbell). This project is intended to enhance the biodiversity of the Preston Highschool courtyard which has become overgrown with invasive species due to years of neglect. This project will restore the space with native pollinator species and in the future will be expanded to the front of the school, creating shared gardens that are accessible for the local community. This project supports the Region’s Community Climate Adaptation Plan Objective 15 (encourage local organizations to identify and plan for climate-related risks and opportunities).
Full project cost: $3,244 Recommended funding $2,444
SUMMARY
Project Title Full Cost of Project
Recommended Funding
Reducing GHGs and utility costs by installing heat pumps (Union Coop/UW) $32,950 $16,950 SWR Sustainability Ambassador Program $10,246 $9,246 Parent/Child Program Launch (Cycling into the Future) $5,320 $5,320
Recycling and Composting (St. John’s Kilmarnock) $10,295 $1,000 Forest Management in the Branchton Village Land Trust $4,075 $3,975
Wilmot Township Tree Canopy Study / Policy $50,000 $10,000 Pollinators for Idea Exchange Preston Seed Library $278 $278
Trees for Woolwich: Building Roadside Tree Planting Capacity. $25,912 $10,000
Water Quality Monitoring and Shoreline Improvements at Paradise Lake $19,054 $10,000 Restoring Coldwater Streams in Kitchener (Trout Unlimited Canada) $21,170 $8,000 Salinity and cold temperature tolerance in Stormwater Management Pond Vegetation (Biology Dept, - WLU)
$6,250 $6,250
Doon Campus Wellness & Reflection Garden (Conestoga College) $75,000 $6,500 Elmira Parterre (Elmira BIA) $71,500 $5,000 KW Habilitation's - Our Farm Trail $15,720 $5,000 Preston High School Pollinator Garden Project $3,244 $2,444
TOTAL $351,015 $99,964
Page 94 of 198

Report: PDL-CPL-22-08
Document Number: 3954195 Page 1 of 5
Region of Waterloo
Department of Planning, Development and Legislative Services
Community Planning Division
To: Chair Tom Galloway and Members of the Planning and Works Committee
Meeting Date: April 12, 2022
Report Title: 2020 Annual Corporate Greenhouse Gas Emissions Update
1. Recommendation:
For information.
2. Purpose / Issue:
To update Council on the greenhouse gas (GHG) emissions produced by our corporate operations in 2020, and since 2009. The Region reports corporate emissions annually, with a 1-year delay due to data constraints, as a member of SustainableWR’s Regional Sustainability Initiative (RSI).
3. Strategic Plan:
Reducing corporate GHG emissions is a key component of the Region’s Strategic Imperative of Climate Action, and is directly addressed by Strategic Objective 3.1: Reduce greenhouse gas emissions.
4. Key Considerations:
a) The Region is a leader and key capacity-holder in transformational climateaction, and has committed to a science-based approach to the transition offfossil fuels, including reducing community emissions by 50% by the year 2030.
b) This approach recognizes that there is a finite amount of GHG emissions thatcan be emitted globally in order to stay below a 1.5-degree global averagetemperature increase. In keeping with the Region’s commitment to equity andaddressing the climate emergency, the Region’s remaining cumulativeemissions are finite, and limited to its small portion of remaining global GHGemissions.
c) The Region of Waterloo’s corporate GHG emissions in 2020 were 102,299tonnes CO2E, which is 33% lower than they were in the 2009 baseline year,and substantially lower than they were in recent years that had showed a
Page 95 of 198

April 12, 2022 Report: PDL-CPL-22-08
3954195 Page 2 of 5
reductions plateau.
d) Lower 2020 emissions were partially due to COVID-19, as there was areduction in the distance travelled by Grand River Transit buses and by staff.However, most of the emissions reductions were not related to COVID-19, butwere the result of landfilling not being needed for biosolids disposal, andwarmer weather that meant less natural gas was used for space heating.Because none of these emissions reductions resulted from structural changesto the corporation’s emissions profile, they should not be expected to continuein future inventory years.
e) The Region has been tracking annual corporate emissions since 2009.Cumulatively over 11 years, since the corporate GHG inventory began, theRegion has emitted approximately 1.5 million tonnes of greenhouse gases, orthe equivalent of emissions from using about 3.4 million barrels of oil.
f) Over the next year, Regional staff will be developing a corporate carbonbudget, in which cumulative carbon emissions will be treated as a finiteresource, that will help guide our energy transition off of fossil fuels. This willinclude identifying the total amount of remaining global carbon emissions thatthe Region can spend through our corporate carbon budget as we completeour energy transition off of fossil fuels. Staff from divisions across theorganization are evaluating current and potential GHG quantification andemissions monitoring and modelling opportunities and needs associated withthis work
5. Background:
Climate change is a global problem with local causes and local solutions. As a key capacity holder in the community’s energy transition, the Region is leading on climate change by committing to bold and immediate action to address it (PDL-CPL-21-30). Work is ramping up across divisions and departments to build a corporate climate transformation and energy transition strategy (PDL-CPL-21-31), in order to implement the Region’s contributions to the TransformWR community climate action strategy (PDL-CPL-21-30, Appendix D).
While organizations have traditionally measured emissions using an annual inventory in order to monitor progress and trajectories on emissions reductions, approaches have been expanding in light of the need for transformational climate action and science-based approaches to the climate emergency. From a climate science perspective, what matters the most is the total amount of emissions over time, as cumulative emissions in the atmosphere are what is driving catastrophic changes in the climate. This science-based approach is the basis for the Region’s commitment to develop a corporate carbon budget (PDL-CPL-21-31).
Page 96 of 198

April 12, 2022 Report: PDL-CPL-22-08
3954195 Page 3 of 5
Cumulatively, the Region of Waterloo as a corporate entity has emitted approximately 1.5 million tonnes of recorded GHGs directly from its operations from 2009 to 2020, or the equivalent of emissions from using about 3.4 million barrels of oil. Total emissions continue to grow each year, further depleting the fixed amount of remaining global emissions that the Region is entitled to use to complete the rest of its transition off fossil fuels. As a result, total emissions are a critical metric in the corporate carbon budget that will be developed over the next year.
With respect to annual emissions, the most up-to-date inventory for the Region of Waterloo is included in Appendix A. During each year’s reporting cycle, historical emissions numbers are reviewed to identify adjustments or updates related to the availability of more refined data and/or calculation corrections. No changes to historical emissions have been made during this inventory cycle.
Figure 1
Emissions were substantially lower in 2020 than they were in 2019, for four primary reasons. Due to the pandemic, there was a reduction in the distance travelled by Grand River Transit buses, meaning less than typical diesel usage, which resulted in GRT bus fleet emissions that were 4,129 tonnes lower than in 2019. Though it is a much smaller portion of corporate emissions, staff travel was also reduced, bringing emissions down by 210 tonnes.
0
20000
40000
60000
80000
100000
120000
140000
160000
2009 2010 2011 2012 2013 2014 2015 2016 2017 2018 2019 2020
Region of Waterloo Corporate Emissions 2009-2020
Electricity Natural Gas Solid Waste (Waterloo/Cambridge landfills) Fleet Staff Travel Biosolids
Page 97 of 198

April 12, 2022 Report: PDL-CPL-22-08
3954195 Page 4 of 5
However, the largest reductions in 2020 compared to 2019 were not due to COVID-19. Most significantly, biosolids emissions were 8,086 tonnes (or 85%) lower in 2020 than in 2019, because landfilling was largely not used for biosolids disposal in 2020. Emissions from natural gas usage were 1,301 tonnes lower, largely because warmer weather resulted in an unusually low number of heating degree days, and therefore the amount of space heating required of natural gas systems was reduced.
It is important to note that reduced emissions in 2020 in these four areas do not result from structural changes to the corporation’s emissions profile.
6. Area Municipality Communication and Public/Stakeholder Engagement:
These emissions results have been reported to Sustainable Waterloo Region as part of the Region’s membership in the Regional Sustainability Initiative. The Region collaborates with Area Municipalities, local utilities, and the public on transformational climate action and energy transition initiatives through the ClimateActionWR collaborative and WR Community Energy, which the Region funds jointly with Area Municipal and utility capacity-holders.
7. Financial Implications:
Nil
8. Conclusion / Next Steps:
Since the 2022 budget approval, staff across departments have been building internal capacity to develop the Region’s corporate climate transformation and energy transition strategy, as well as a carbon budget that will be integrated with the financial budget process. In the near term, staff are working on a briefing note expected in late spring, which will outline what is currently known about the needs, opportunities, constraints, and challenges of each division’s energy transition off fossil fuels. This report is intended to further inform critical decisions for advancing the Region’s climate and energy transition in the 2023 budget, and to provide the foundation for the ongoing transition and carbon budgeting work.
9. Attachments / Links:
Appendix A: Corporate GHG emissions inventory for the Region of Waterloo in tonnes CO2E, revised 2020.
Prepared By: Kate Daley, Environmental Sustainability Specialist
Reviewed By: Kate Hagerman, Manager of Environmental Planning and Sustainability
Danielle De Fields, Director, Community Planning
Approved By: Rod Regier, Commissioner, Planning, Development and Legislative Services
Page 98 of 198

April 12, 2022 Report: PDL-CPL-22-08
3954195 Page 5 of 5
Appendix A: Corporate GHG emissions inventory for the Region of Waterloo in tonnes CO2E, revised 2020.
*comparing 2009 baseline level in all years
Source 2009 2010 2011 2012 2013 2014 2015 2016 2017 2018 2019 2020
Total emissions 2009-2020
Electricity 17,345 19,953 14,288 15,712 11,886 7,601 6,339 5,915 2,923 4,359 4,510 4,578 115,409 Natural Gas 14,821 13,154 14,268 12,662 14,598 17,050 15,708 14,813 15,909 17,264 17,336 16,035 183,617 Solid Waste 53,668 45,774 42,743 42,148 48,841 48,742 49,884 51,566 47,443 46,535 46,219 46,047 569,610 Fleet 35,654 36,695 38,891 39,146 37,904 38,512 38,906 37,630 38,725 38,778 38,801 34,079 453,720 Staff Travel 507 523 480 472 451 443 515 474 485 422 391 181 5,344 Biosolids 30,821 30,871 47,916 33,208 13,319 22,605 11,345 1,655 9,115 9,962 9,465 1,379 221,661 TOTAL 152,816 146,970 158,586 143,347 126,999 134,952 122,698 112,052 114,600 117,320 116,721 102,299 1,549,361 Annual reduced* Baseline 4% -4% 6% 17% 12% 20% 27% 25% 23% 24% 33%
Page 99 of 198

Report: PDL-CPL-22-10 / COR-CFN-22-08
Document Number: 3943351 Page 1 of 7
Region of Waterloo
Planning, Development and Legislative Services
Community Planning
Corporate Services
Corporate Finance
To: Chair Tom Galloway and Members of the Planning and Works Committee
Meeting Date: April 12, 2022
Report Title: Brownfield Financial Incentive Program – Tax Increment Grant Application (TIG) – 60 Charles Street West, Kitchener
1. Recommendation:
That the Regional Municipality of Waterloo take the following actions regarding the property municipally known as 60 Charles Street West in the City of Kitchener, as described in Report PDL-CPL-22-10/ COR-CFN-22-08 dated April 12, 2022:
a) Approve a joint Tax Increment Grant, subject to the terms of an associated TaxIncrement Grant agreement with the registered owner of the subject lands, withthe Regional amount not to exceed $3,773,539 net of any other future brownfieldassistance, to be financed from the incremental tax revenue for the propertyfollowing remediation, redevelopment and reassessment; and
b) Authorize the Region’s Commissioner of Planning, Development and LegislativeServices and Commissioner, Corporate Services / Chief Financial Officer toexecute any associated agreements, assignments, amendments or other relateddocuments with the registered owner of 60 Charles Street West in the City ofKitchener, with the form and content of such Tax Increment Grant agreement(s),any subsequent assignments of the agreement, or other related documents to besatisfactory to the Regional Solicitors.
2. Purpose / Issue:
For Regional Council to consider approval of a brownfield joint Tax Increment Grant (TIG) application as detailed within this report.
3. Strategic Plan:
The report addresses the Region’s Corporate Strategic Plan 2019-2023 including
Page 100 of 198

April 12, 2022 Report: PDL-CPL-22-10 / COR-CFN-22-08
3943351 Page 2 of 7
Thriving Economy and Environment and Climate Action. Specific actions addressed by this report, among others, include:
1. Create a competitive business-supportive community to help attract, retain andgrow employers, talent and investments in Waterloo Region (Strategic Objective1.1); and
2. Promote the efficient use of urban land, and protect and enhance agricultural andnatural areas (Strategic Objective 3.5).
4. Key Considerations:
a) The subject property was deemed an eligible Brownfield in accordance with theRegion’s Brownfield Financial Incentive Program. The property most recentlycontained an automobile service garage and gas bar and was historically usedfor a variety of commercial uses including a welding operation, signmanufacturer, lumber yard, and dry cleaning operation dating back to 1894.
b) The 0.22 hectare property is being redeveloped into a 305 unit residentialcondominium with 564 square metres of commercial space on the main floor andtwo levels of underground parking. The redevelopment represents a significantincrease in assessed value and tax assessment with an estimated total currentvalue assessment increase of $80,360,511.
c) The applicant has applied for a joint TIG application and has submitted anestimated environmental remediation cost for the subject property of $5,432,364plus a 10% allowance for indirect costs of $543,236 (which are eligible as theapplication was received on February 13, 2019, prior to Council amendingeligibility for indirect costs). This applicant has submitted all of the requiredsupporting information and materials, including documentation of a MinistryAcknowledged Record of Site Condition (RSC) to the satisfaction of Regionalstaff.
d) If approved, the maximum eligible joint TIG of $5,975,600 would be cost-sharedbetween the Region and the City of Kitchener in the form of a rebate, for a periodnot to exceed 10 years. City of Kitchener Council approved the City’s portion ofthe TIG on February 4, 2022. The Regional share is not to exceed $3,773,539.
e) The infusion of private investment in the redevelopment of brownfield propertiesis helping to ensure the efficient use of existing infrastructure, as well as helpingto achieve the Region’s broader economic development, transit supportive, andland use planning objectives.
Page 101 of 198
April 12, 2022 Report: PDL-CPL-22-10 / COR-CFN-22-08
3943351 Page 3 of 7
5. Background:
The Brownfield Financial Incentive Program (BFIP) contains the joint TIG and Regional Development Charge (RDC) exemption that assist with the cost of remediating brownfield sites. On June 26, 2019 Regional Council approved refinements to this award-winning program. The joint TIG is offered in Area Municipalities where Community Improvement Plans (CIP) have been approved for the purposes of encouraging brownfield remediation and redevelopment (currently in the Cities of Cambridge, Kitchener, and Waterloo and in the Township of Wellesley). The RDC exemption for eligible brownfield sites is available region wide through RDC By-law 19-037. Applicants must satisfy a number of criteria to receive these incentives.
An approved TIG is not paid until after remediation, redevelopment and reassessment of the property. The applicant submitted a complete joint TIG application to City and Region Staff prior to September 1, 2019, therefore the applicant is grandfathered under the previous TIG program and is eligible for an additional 10% allowance for indirect costs, as per the TIG terms and conditions prior to September 1, 2019.
If approved, this TIG would represent the eleventh successful joint TIG application in the City of Kitchener.
Summary of TIG Application and Environmental Status
On February 13, 2019, the City of Kitchener and Region of Waterloo received a joint Tax Increment Grant application from 24 Gaukel GP Inc. relating to the remediation and redevelopment of the property municipally known as 60 Charles Street West (Locational Map attached). The 0.22 ha (0.54 acre) property is located at the intersection of Gaukel Street and Charles Street West in Kitchener’s downtown core. The property most recently contained an automobile service garage and gas bar and was historically used for a variety of commercial uses including a welding operation, sign manufacturer, lumber yard, and dry cleaning operation since it was first developed in 1894.
MTE Consultants Inc. were retained and completed a Remediation Work Plan dated February 12, 2019 as well as a Phase One and Phase Two Environmental Site Assessments (ESA). Within the scope of the Phase Two ESA, MTE completed a soil and groundwater investigation which identified multiple Contaminants of Concern in the soil and groundwater in concentrations that exceeded the applicable Ministry of the Environment, Conservation and Parks (MECP) Site Condition Standards, including the following: Metals; Petroleum Hydrocarbons; Polycyclic Aromatic Hydrocarbons (PAHs); Volatile Organic Compounds (VOCs); and Sodium Chloride. Site remediation activities included a combination of Risk Assessment and remediation approaches including soil excavation and disposal, soil embankment and capping, and groundwater treatment techniques.
Page 102 of 198

April 12, 2022 Report: PDL-CPL-22-10 / COR-CFN-22-08
3943351 Page 4 of 7
Environmental remediation costs for the subject property were estimated to be $5,432,364 plus a 10% allowance for indirect costs. As a condition of final approval of eligible costs, invoices must be submitted by the applicant and must be approved for eligibility by City of Kitchener and Region of Waterloo staff.
6. Area Municipality Communication and Public/Stakeholder Engagement:
Regional staff have worked closely with City of Kitchener staff on reviewing this TIG application and concur with the recommendations. City of Kitchener Council considered this TIG application on January 10, 2022 and approved the TIG by Council resolution dated February 4, 2022.
7. Public/Stakeholder Engagement: This report has been posted to the Region’swebsite with the agenda in advance of the Council / Committee meeting.
8. Financial Implications:
If approved, the Region’s maximum calculated share of the joint TIG for the 60 Charles Street West redevelopment project is capped at $3,773,539 which is approximately 63.1% (based on the Region’s portion of property taxes on the site) of the total maximum eligible remediation costs of $5,975,600. The subject lands are not eligible to receive a brownfield RDC exemption, as they qualified for a core area exemption.
The final TIG amounts will be reduced by any other brownfield financial assistance received by the Applicant for eligible remediation costs. The first payment could start as early as 2023, depending on the timing of completed construction and occupancy. The final TIG payment schedule will be determined when the redevelopment is completed and has been reassessed by MPAC. It is estimated that the Region’s share of the joint TIG will be paid back in eight years.
Under the funding model for joint TIGs adopted by Regional Council in 2013, the annual TIG payments would be funded from the increased tax revenue on the property occurring in the same year. In other words, the tax revenue resulting from the increased assessment following the redevelopment of a brownfield property is used to fund the annual TIG payment.
9. Conclusion / Next Steps:
If approved, a tri-party Tax Increment Grant Agreement shall be executed between the applicant (24 Gaukel GP Inc), the City of Kitchener, and the Region of Waterloo to implement the provisions of the Brownfield Financial Incentive Program prior to any TIG payments.
10. Attachments / Links:
Page 103 of 198

April 12, 2022 Report: PDL-CPL-22-10 / COR-CFN-22-08
3943351 Page 5 of 7
Attachment A: Location Map
Attachment B: Development Rendering
Prepared By: Peter Ellis, Principal Planner
Amanda Kutler, Manager, Development Planning
Reviewed By: Danielle De Fields, Director, Community Planning
Cheryl Braan, Director, Corporate Finance
Approved By: Rod Regier, Commissioner of Planning, Development and Legislative Services
Craig Dyer, Commissioner, Corporate Services / Chief Financial Officer
Page 104 of 198

April 12, 2022 Report: PDL-CPL-22-10 / COR-CFN-22-08
3943351 Page 6 of 7
Attachment A: Location Map
Page 105 of 198

April 12, 2022 Report: PDL-CPL-22-10 / COR-CFN-22-08
3943351 Page 7 of 7
Attachment B: Development Rendering
Page 106 of 198

Report: PDL-CPL-22-11
Document Number: 3970879 Page 1 of 8
Region of Waterloo
Planning, Development and Legislative Services
Community Planning
To: Chair Tom Galloway and Members of the Planning and Works Committee
Meeting Date: April 12, 2022
Report Title: Regional Official Plan Review Draft Regional Land Needs Assessment
1. Recommendation:
For information
2. Regional Official Plan Background
The Regional Official Plan (ROP) is a powerful planning tool that shapes and defines our community for future generations. It has guided decision making for profound transformation of this region including the addition of the ION light rail, protection of agricultural lands and the natural environment, and a high quality of life for residents.
This community is set to grow to 923,000 people and 470,000 jobs by 2051, representing about a 50% increase in population and 60% increase in jobs from 2021. As a result, we are working to update the plan to accommodate this projected growth.
3. Purpose / Issue:
This report presents the preliminary results of the draft Regional Land Needs Assessment (LNA), which determines the amount of urban land the Region requires to accommodate the Region’s forecasted population and employment growth to 2051. This report also identifies the public and stakeholder engagement that will occur on the draft LNA.
Strategic Plan:
This report relates to several strategic focus areas, including: Thriving Economy; Sustainable Transportation; Environment and Climate Action; and Health, Safe and Inclusive Communities. It also relates to Objective 4.2, “Make affordable housing more available to individuals and families” and Action 3.5.1, “Promote efficient urban land use
Page 107 of 198

April 12, 2022 Report: CPL-PDL-22-11
3970879 Page 2 of 8
through greenfield and intensification policies while conserving natural heritage and agricultural areas.”
4. Key Considerations:
a) The ROP establishes a vision for how we live, work and play and helps usprepare for future challenges and opportunities.
The ROP’s vision is:
“Waterloo Region will be an inclusive, thriving, and sustainable region of connected urban and rural communities with global reach, fostering opportunities for current and future generations.”
The current ROP Review focusses on providing a thoughtful and realistic approach to land use planning and growth management to ensure that Waterloo Region continues to be a world-class community.
b) The Region has completed a draft land needs assessment in accordance withthe Provincial Land Needs Assessment methodology to ensure it has enoughland to accommodate its forecasted growth to 2051, including the need forany urban boundary expansions.
In the fall of 2021, Regional Council provided a motion to staff with respect to the LNA as follows:
• That staff ensure the Land Needs Assessment be completed in accordance withprovincial requirements providing different growth options for consideration.
• That thorough engagement take place between regional staff, communitystakeholders, and area municipalities after the LNA is complete and made availableto the public for consultation, prior to a staff recommendation of a Preferred GrowthOption.
Staff have been in regular contact with Provincial staff throughout the ROP Review process. Provincial staff have raised no concerns and are supportive of the Region’s approach to the LNA.
d) The LNA includes land use options with varying levels of intensificationand designated greenfield area density targets.
The Provincial LNA methodology provides municipalities the flexibility to assess different assumptions within the LNA. The Region’s draft LNA includes three Community Area growth options and two Employment Area growth options, which is similar to the approach followed by the City of Hamilton, Halton Region, City of Guelph, Peel Region and Durham Region.
Page 108 of 198

April 12, 2022 Report: CPL-PDL-22-11
3970879 Page 3 of 8
The Provincial LNA methodology also provides flexibility to change the order of the steps as long as all the required steps are completed. In addition, the Provincial LNA methodology provides for the consideration of higher intensification and designated greenfield density targets and reiterates that decision-makers should consider an intensification first approach when assessing future land needs. Such an approach to city building optimizes the existing urban land supply and makes better use of existing infrastructure and public service facilities.
e) Under all Options, all Area Municipalities would be allocated populationgrowth to 2051.
The LNA is prepared following a series of steps outlined by the Province related to two types of places:
Community Areas – Where most housing, commercial, retail and institutional growth will be located.
Employment Areas – Where most industrial land, like manufacturing, logistics and warehouses, will be located.
The applicable minimum Provincial intensification target for the Region of Waterloo is 50% of all residential development occurring annually will be within the Built Up Area (BUA).
The minimum Provincial density target applicable to the Designated Greenfield Area (DGA) for the Region of Waterloo is to achieve, by 2051, 50 people and jobs per hectare (pj/ha).
The housing mix forecasts used in the draft LNA are forward-looking and based on anticipated future conditions and shifting demographics. All Options provide a greater mix of medium and high-density housing options relative to the current trends, however, Options 2 and 3 provide a greater shift of housing from low-density housing to medium and high-density housing forms.
Some area municipalities would not be allocated any new community area over and above what exists as designated greenfield area, although all municipalities would see population growth to 2051.
Three Community Area growth options and two Employment Area options are provided in the draft LNA. Additional information on the Area Municipal allocation for each growth option are included in Appendix A.
Page 109 of 198

April 12, 2022 Report: CPL-PDL-22-11
3970879 Page 4 of 8
Community Area Land Needs
Community Area Option 1 (Provincial Growth Plan minimums of 50% intensification and 50 people and jobs per hectare) – Key Considerations
• Between 2009 and 2013, the Region achieved a 51% intensification in the Built-UpArea (BUA). The target established under the current ROP, adopted in 2009, is 45%.Between 2014-2019, the Region achieved 57% intensification. Under Option 1; theintensification rate of 50% is lower than recent trends.
• Option 1 would generate the maximum amount of future low-density housing usingthe minimum targets in the Growth Plan. As a result, Option 1 would yield the largesturban area expansion of the three options, beyond the existing Countryside Linewhen combined with the Employment Area Options.
• To achieve a density of 50 people and jobs per hectare (pj/ha), the Region wouldrequire a density of 49 pj/ha on an incremental basis to 2051, lower than the 54 pj/hain the DGA being achieved as of 2019.
Community Area Option 2 (60% intensification and 60 pj/ha) – Key Considerations
• Option 2 would generate a denser housing mix than Option 1 because of the higherintensification target (60%) and the corresponding decrease in the number of low-density units in new designated greenfield areas.
• To achieve a density of 60 people and jobs per hectare (pj/ha), the Region wouldrequire a density of 63 pj/ha on an incremental basis to 2051. The density in thecities under this option would average 69 pj/ha.
• Option 2 would result in a smaller urban area expansion than Option 1 and canaccommodated within the existing Countryside Line.
Community Area Option 3 (More compact development, no urban expansion of Community Areas) – Key Considerations
• This Option would generate the most dense housing mix because it has the highestdesignated greenfield area density target (66 pj/ha). As a result, implementingOption 3 could be accommodated within the existing urban area boundary and doesnot require an urban area boundary expansion for new community area anywhere inthe region.
• The number of people that could be accommodated in new units would decreasewith Option 3 as there is a greater proportion of high density units which typicallyhave lower people per units than other building forms. As a consequence, therewould be greater pressure on existing neighbourhoods in designated greenfield
Page 110 of 198

April 12, 2022 Report: CPL-PDL-22-11
3970879 Page 5 of 8
areas to accommodate more population growth.
• To achieve a density of 66 people and jobs per hectare (pj/ha), the Region wouldrequire a density of 73 pj/ha on an incremental basis to 2051. The density in thecities under this option would average about 76 pj/ha.
Staff have also considered two additional growth options that assumed even higher intensification rates and DGA density targets (i.e., 65% and 70% intensification rates, and 65pj/ha and 70pj/ha DGA density targets). Those options would generate an excess amount of DGA lands currently designated in the region of 610ha and 1,044ha respectively. Applying those targets would require the Region to prohibit development on either 610ha or 1044ha of lands already committed for development, until the year 2051. As a result, staff provided an update to Regional Council in December 2021 on the implications of excess lands and did not pursue a full assessment of these options.
Employment Area Land Needs
Several macro-economic trends are influencing average density levels on employment lands. In general, average density levels on employment lands are declining in the manufacturing sector, as domestic manufacturers focus efforts on increased efficiency and competitiveness through automation. This trend is coupled with increasing demand for large, land-extensive warehousing and logistics facilities to support distribution and transportation of goods throughout the expanding urban population base.
The draft LNA considered the following two growth options for the region’s Employment Areas:
Option Option 1 Option 2
Intensification Rate in Existing Employment Areas
15% 25%
Density Target (jobs per hectare) 35 35
Total Employment Area Land Need (hectares)
659 456
Employment Area Option 1 (15% Employment Area land intensification) – Key Considerations
• This option would assume a moderate intensification rate of 15% within existingemployment areas, similar to existing trends observed in the region.
• It would also assume a density target of 35 jobs per hectare, allowing for diverse
Page 111 of 198

April 12, 2022 Report: CPL-PDL-22-11
3970879 Page 6 of 8
mix of employment areas which can accommodate a wide range warehousing, office and manufacturing uses.
Employment Area Option 2 (25% Employment Area land intensification) – Key Considerations
• This option would assume a higher intensification rate of 25% within existingemployment areas, requiring a greater proportion of under-utilized land (e.g.large parking lots) to be developed for new or expanded employment uses.
• This option would also assume a density target of 35 jobs per hectare the sameas Option 1.
f) Release of the draft LNA marks the beginning of a public engagement periodbetween April 12, 2022 and May 27, 2022.
The results of the LNA engagement process will be summarized in a response report that will accompany the June recommendation report on the preferred growth option. Following the draft LNA engagement process, staff will evaluate each of the growth options based on the feedback received from the community, stakeholders and area municipalities and against a series of detailed evaluated criteria covering six broad themes viewed through a climate change lens (see Appendix B).
A recommendation report on the preferred growth option is anticipated in June 2022 along with the release of a draft Regional Official Plan Amendment with accompanying information report.
5. Background:
In 2018, the Region initiated a review of the ROP to plan for forecasted growth to 2041. On August 28, 2020, the Province approved Amendment 1 to the Growth Plan which included changes to the Growth Plan’s Schedule 3 population and employment forecasts, and extended the planning horizon to 2051. A Provincial LNA methodology was also established that all Upper and single-tier municipalities are required to use in combination with the policies of the Growth Plan to assess the quantity of land required to accommodate forecasted growth. The LNA is one study that must be completed as part of the ROP Review.
This update to the ROP is important because it helps guide decisions about regional services, including transportation and public transit, water supply and wastewater treatment systems; public health; economic development; affordable housing, and many others.
The foundational themes and priorities include:
• Building equitable, thriving, transit-supportive complete communities;
Page 112 of 198
April 12, 2022 Report: CPL-PDL-22-11
3970879 Page 7 of 8
• Continuing with an intensification-first approach to growth management;
• Realizing transformational climate action;
• Advancing Indigenous relationships and reconciliation; and
• Continuing to protect water, agricultural, and natural systems.
A significant amount of work has been completed on the Region’s population, housing and employment trends to support the draft LNA. Technical briefs prepared by the consultant team supporting the draft LNA include:
• Region-Wide Long-Term Population and Housing Growth Analysis Technical Brief(December 2020);
• Employment Strategy Technical Brief (August 2021);
• Intensification Strategy Technical Brief (August 2021).
6. Area Municipality Communication:
Consultation and engagement with the various Project Committees, including the Steering Committee, Stakeholder Committee, Technical Team and Area Municipal Working Group, as well as Indigenous engagement and public consultation is continuous throughout the ROP Review project. Collaboration and discussion is iterative and ongoing on a regular basis.
7. Financial Implications:
The Region’s approved 2022 - 2031 Community Planning Capital Program includes a budget of $756,000 in 2022 and $3,250,000 in 2023-2031 for the Regional Official Plan Review (project 22007). The costs are to be funded from Development Charges (90%, $3,605,000) and the Community Planning Capital Reserve (10%, $401,000).
8. Conclusion / Next Steps:
April 12- May 27, 2022: Public engagement on the draft LNA
April 22, 2022 and April 25, 2022: Virtual and interactive public engagement sessions
Mid-May 2022 – Special Regional Planning and Works public input meeting
May 27 – Deadline for public feedback on the draft LNA
Following the draft LNA public engagement process, the growth options will be evaluated against a series of criteria (Appendix B). The evaluation criteria also incorporate a “climate change lens” to identify growth options that help reduce
Page 113 of 198

April 12, 2022 Report: CPL-PDL-22-11
3970879 Page 8 of 8
greenhouse gas emissions, and support stronger and more resilient communities.
Mid June 2022 – Recommendation report on preferred growth option and release of draft Regional Official Plan Amendment (Growth Components) with accompanying information report
July 2022 - ROP amendment open house
Late July 2022 - ROP amendment Statutory Public Meeting
August 2022 - Recommendation report to Council on adoption of ROP amendment.
Non-growth related components for the second ROPA will be developed in Fall 2022 and Winter 2023 and include: natural heritage system mapping and policies; water resources system mapping and policies; a review of the ROP’s mineral aggregate policies; updated source water protection mapping and policies; a review of the ROP’s agricultural policies and a review of the ROP’s infrastructure polices and needs including the transportation system, water and wastewater systems, waste management and the provision of utility services.
9. Attachments / Links:
Attachment A: Draft Land NeedsLand Needs Assessment (DOCS 3999710)
Attachment B: Evaluation Criteria for Growth Options (DOCS 3999789)
Prepared By: Ryan Pogrzeba, Planning Information Specialist Brenna MacKinnon, Manager, Development Planning Reviewed By: Danielle De Fields, Director, Community Planning
Approved By: Rod Regier, Commissioner, Planning, Development and Legislative Services
Page 114 of 198

PDL-CPL-22-11
Document Number: 3989613 Page 1 of 3
Appendix B
Evaluation Criteria for Growth Options
Theme Objective Evaluation Criteria
Gro
wth
Man
agem
ent
Support Planned Regional Structure
• Does the concept allocate growth in a way thatsupports the long-term viability of the PlannedRegional Structure?
• How well does the concept support intensificationwithin existing or planned new Strategic GrowthAreas?
Foster development of complete and compact communities
• How well does the concept support completecommunities within the built-up area and indesignated greenfield areas?
• How well does the concept promote a more compactbuilt urban form?
• How well does the concept help to reduce the growthof greenhouse gas emissions through intensification,and support for a wider variety of built forms and landuses?
Build a sustainable and active transportation system
• How well does the concept support multi-modalaccess to the GRT transit network, and facilitateother sustainable and active modes of travel, such aswalking, cycling and travel with the use of mobilityaids, including motorized wheelchairs?
• How well does the concept support minimizingvehicle miles traveled and the growth of greenhousegas emissions?
• How well does the concept support a low emissionstransportation system?
• How well does the concept support the existing andfuture expansion of the ION rapid transit network?
Provide flexibility
• How well can the concept adapt tounknowns/uncertainties such as shifts indemographics, economic conditions, extremeweather events and advances in technology (e.g.transportation technology, work from hometechnology)?
Page 115 of 198

PDL-CPL-22-11
3989613 Page 2 of 3
Tran
spor
tatio
n, In
fras
truc
ture
and
Fin
anci
ng
Optimize use of existing or planned infrastructure and public service facilities
• Is there sufficient capacity in existing or plannedmunicipal infrastructure (e.g., roads, transit, water,wastewater, stormwater management) and publicservice facilities (e.g., hospitals, long-term carefacilities, libraries and schools) to support the growthconcept?
• How well does the concept optimize the use ofexisting infrastructure and public service facilities?
Ensure cost effective/ financially viability
• How well does the concept ensure that growth isfinancially viable over the long term throughoptimization of existing regional and area municipalinfrastructure and public service facilities, andminimization of long-term operations andmaintenance costs?
Facilitate green infrastructure and reduce risks
• How well does the concept enable opportunities forenergy, resource and water conservation, andpromotion of green infrastructure to support climatechange mitigation and adaptation?
Agr
icul
tura
l and
Min
eral
Agg
rega
te R
esou
rces
Protect prime agricultural land
• Does the concept minimize the need for conversionof prime agricultural land and provide for continuedinvestment in the agricultural food network?
• How well does the concept help the agriculturalsystem become more resilient to outside shocks,such as extreme weather events destroying cropselsewhere in the world?
• How well does the concept support local foodproduction, processing and distribution to decreaseenergy use and emissions by reducing the length oftrips between farms, processing facilities, andgrocery stores, or selling directly to homes andbusinesses?
Protect mineral aggregate resources and existing aggregate operations
• Does the proposed expansion area contain anydeposits of mineral aggregate resources?
• Would development within the proposed expansionarea preclude or hinder the expansion or continueduse of any existing mineral aggregate operations?
Page 116 of 198
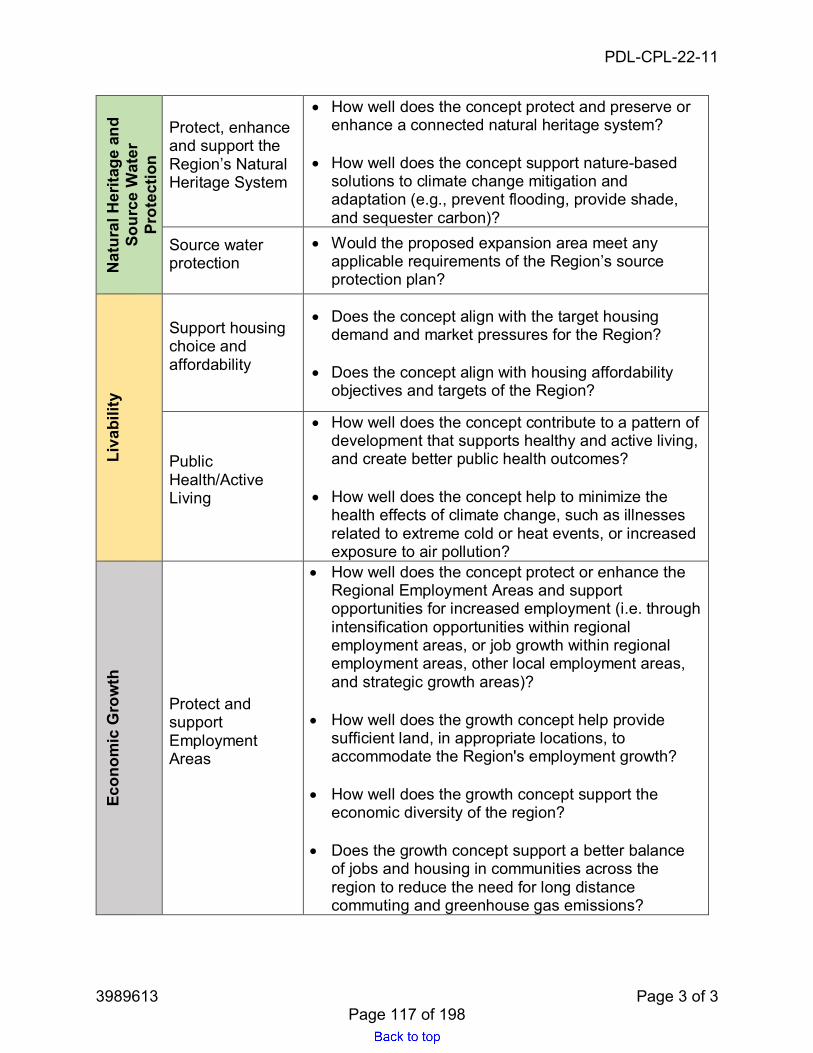
PDL-CPL-22-11
3989613 Page 3 of 3
Nat
ural
Her
itage
and
So
urce
Wat
er
Prot
ectio
n Protect, enhance and support the Region’s Natural Heritage System
• How well does the concept protect and preserve or enhance a connected natural heritage system?
• How well does the concept support nature-based solutions to climate change mitigation and adaptation (e.g., prevent flooding, provide shade, and sequester carbon)?
Source water protection
• Would the proposed expansion area meet any applicable requirements of the Region’s source protection plan?
Liva
bilit
y
Support housing choice and affordability
• Does the concept align with the target housing demand and market pressures for the Region?
• Does the concept align with housing affordability
objectives and targets of the Region?
Public Health/Active Living
• How well does the concept contribute to a pattern of development that supports healthy and active living, and create better public health outcomes?
• How well does the concept help to minimize the health effects of climate change, such as illnesses related to extreme cold or heat events, or increased exposure to air pollution?
Econ
omic
Gro
wth
Protect and support Employment Areas
• How well does the concept protect or enhance the Regional Employment Areas and support opportunities for increased employment (i.e. through intensification opportunities within regional employment areas, or job growth within regional employment areas, other local employment areas, and strategic growth areas)?
• How well does the growth concept help provide sufficient land, in appropriate locations, to accommodate the Region's employment growth?
• How well does the growth concept support the
economic diversity of the region?
• Does the growth concept support a better balance of jobs and housing in communities across the region to reduce the need for long distance commuting and greenhouse gas emissions?
Page 117 of 198

Report: TES-DCS-22-09
3869167 Page 1 of 5
Region of Waterloo
Transportation and Environmental Services
Design and Construction
To: Chair Tom Galloway and Members of the Planning and Works Committee
Meeting Date: April 12, 2022
Report Title: Project Approval Report for a Roundabout at New Dundee Road (Regional Road No. 12) and Robert Ferrie Drive.
1. Recommendation:
That the Regional Municipality of Waterloo approve the recommended design alternative for a proposed double lane roundabout at New Dundee Road (Regional Road No. 12) and Robert Ferrie Drive in the City of Kitchener, as described in Report TES-DCS-22-09, dated April 12, 2022.
Upon completion of construction, that The Regional Municipality of Waterloo amend Traffic and Parking By-law 16-023, as amended to:
a) Remove from Schedule 17, Rates of Speed, 80 km/h on New Dundee Road (RegionalRoad 12) from 500 m east of Fischer-Hallman Road (Regional Road 58) to 550 m westof Homer Watson Boulevard (Regional Road 28);
b) Add to Schedule 17, Rates of Speed, 80 km/h on New Dundee Road (Regional Road12) from 500 m east of Fischer-Hallman Road (Regional Road 58) to 400 m west ofRobert Ferrie Drive;
c) Add to Schedule 17, Rates of Speed, 60 km/h on New Dundee Road (Regional Road12) from 400 m west of Robert Ferrie Drive to 550 m west of Homer Watson Boulevard(Regional Road 28);
d) Add to Schedule 15, Lane Designation, on New Dundee Road (Regional Road 12)southbound at Robert Ferrie Drive, Left and Right;
e) Add to Schedule 15, Lane Designation, on New Dundee Road (Regional Road 12)eastbound at Robert Ferrie Drive, Through/Left and Through;
f) Add to Schedule 15, Lane Designation, on New Dundee Road (Regional Road 12)westbound at Robert Ferrie Drive, Through/Right and Through;
g) Add to Schedule 10, Level 2 Pedestrian Crossover, on New Dundee Road (RegionalRoad 12) at Robert Ferrie Drive, On All Entry and Exits
Page 118 of 198

April 12, 2022 Report: TES-DCS-22-09
3869167 Page 2 of 5
2. Purpose / Issue:
A double lane roundabout is recommended at New Dundee Road and Robert Ferrie Drive to address safety concerns and reduce delays to motorists.
3. Strategic Plan:
Approval of the Recommended Design Alternative meets the 2019-2023 Corporate Strategic Plan objectives under Strategic Focus Area 2, Sustainable Transportation to improve road safety for all users – drivers, cyclists, pedestrians, horse and buggies and to increase participation in active forms of transportation (cycling and walking).
4. Key Considerations:
The recommended roundabout would replace temporary traffic signals that were installed as an interim measure in 2019.
The main issues raised by the residents, tenants and property owners have been summarized into the following themes: high operating speeds on New Dundee Road; volume of commercial truck traffic; cost and impacts of roundabout construction; illumination and education for roundabout users.
The roundabout will factor into providing reduced speeds, as pending Council approval, the posted speed along New Dundee Road will be reduced from 80km/h to 60km/hr between Executive Place and Reichert Drive. The proposed double lane roundabout, including the entrance and exit to the roundabout would be designed geometrically to adequately accommodate all types of large commercial vehicles. The proposed roundabout would have a lower life-cycle costs, and reduce idling times, resulting in fuel savings and reduced vehicle emissions. It also provides a gateway feature and traffic calming into the Doon South community.
5. Background:
The original T-intersection included stop control on Robert Ferrie Drive and through traffic on New Dundee Road. Temporary traffic signals were subsequently installed as an interim measure in 2019. The intersection has experienced 7 collisions, 1 resulting in injury and 6 resulting in property damage between 2014 and 2018. Based on consideration of safety performance, traffic capacity and total life-cycle costing, staff are recommending the implementation of a double-lane roundabout. A roundabout would result in fewer injury collisions and reduced delays to motorists than the existing traffic signals.
6. Area Municipality Communication and Public/Stakeholder Engagement:
Area Municipality Communication: A copy of the Engage survey notification letter was mailed to Christine Michaud, Kitchener Ward 4 Councillor and staff at the City of Kitchener were informed of the proposed scope and timing of the project.
Page 119 of 198

April 12, 2022 Report: TES-DCS-22-09
3869167 Page 3 of 5
Public/Stakeholder Engagement: Engage survey notification letters were mailed to residents, tenants and business owners within the immediate vicinity of the intersection. Signs within the project limits were installed to direct the public to the Region of Waterloo’s EngageWR website. The EngageWR website recorded that a total of 97 users participated in the survey and provided input.
Further information regarding the EngageWR survey public consultation and responses is provided in Attachment C.
7. Financial Implications:
The Region’s approved 2022-2031 Transportation Capital Program includes a budget of $2,945,000 in 2022-2025 for New Dundee Road at Robert Ferrie Drive Roundabout (project #07284) to be funded from the Regional Roads Development Charges Reserve Fund.
8. Conclusion / Next Steps:
Subject to Council approval, Regional staff would initiate the property acquisition process, finalize detailed design and coordinate required utility relocations, with construction planned for 2024
Attachments / Links:
Attachment A - Key Plan
Attachment B - Preliminary Design Drawing
Attachment C - Engage Survey Public Consultation and Responses (Docs # 3983038)
Prepared By: Saman Ajamzadeh, Engineering Intern, Design and Construction
Marcos Kroker, Head, Design and Construction
Reviewed By: Phil Bauer, Director, Design and Construction
Approved By: Thomas Schmidt, Commissioner, Transportation and Environmental Services
Page 120 of 198

April 12, 2022 Report: TES-DCS-22-09
3869167 Page 4 of 5
Attachment - A Key Plan
Page 121 of 198

April 12, 2022 Report: TES-DCS-22-09
3869167 Page 5 of 5
Attachment B - Preliminary Design Drawing
Page 122 of 198

Report: TES-TRS-22-06
Document Number: 3730856 Page 1 of 6
Region of Waterloo
Transportation and Environmental Services
Transit Services / Transportation
To: Chair Tom Galloway and Members of the Planning and Works Committee
Meeting Date: April 12, 2022
Report Title: Micromobility – E-scooter Traffic and Parking By-law Updates
1. Recommendation:
That the Regional Municipality of Waterloo amend Traffic and Parking By-law 16-023, as amended, to add the definition and provisions for the use of electric kick-scooters (“e-scooters”) as described in Appendix A of Report TES-TRS-22-06, dated April 12, 2022, with an effective date of July 1, 2022.
2. Purpose / Issue:
This report recommends amendments to the Region’s Traffic and Parking By-law to permit e-scooters on all Regional Roads 50 km/h or less, and all Regional Roads with boulevard multi-use paths and/or reserved bike lanes in response to the Ministry of Transportation’s e-scooter pilot program. Helmets are proposed to be mandatory for all riders, regardless of age.
This is a companion report to Report TES-TRS-22-07 that outlines the implementation plan for launching a shared micromobility system (e.g., bike share, e-scooter share). Subject to approval of these reports, e-scooters will be permitted locally and considered eligible fleet vehicles that can be part of a commercial shared system alongside bike share.
3. Strategic Plan:
Supporting the introduction of low energy micromobility options and programs that can be integrated with the Region’s transit network aligns with Focus Area 2 (Sustainable Transportation) of the Region’s 2019-2023 Strategic Plan. This work is also a Strategic Action of the TransformWR plan (Action 1.3.1: Launch Micromobility Systems), and supports Strategy 5 of the Region’s Transportation Master Plan (Position the Region for New Mobility).
4. Key Considerations:
a) Micromobility Feasibility Study recommendations and Ontario e-scooter pilot
In May 2020, the micromobility project team consisting of staff from the Region and Cities of Cambridge, Kitchener, and Waterloo received a feasibility study with recommendations for
Page 123 of 198

April 12, 2022 Report: TES-TRS-22-06
3730856 Page 2 of 6
implementing a shared micromobility system for bikes, e-bikes, and e-scooters in Waterloo Region (TES-TRS-20-14).
An initial step of the implementation plan required the Region and Cities to determine if and where people are permitted to ride e-scooters. This is in response to Ontario’s 5-year e-scooter pilot program. Effective January 2020, the pilot program set out vehicle and rider requirements and allows municipalities to choose to permit e-scooters locally.
b) E-scooter public engagement program and survey results
The project team prepared a Preliminary Preferred Option (permit e-scooters on recreational multi-use trails and boulevard multi-use paths, all roads with reserved bike lanes, and any road 50 km/h or less) after consulting with municipal partners and other stakeholders on the Region’s Traffic Coordinating Committee (TCC), Inter-Municipal Partnership on Active Transportation (IMPAcT), and Active Transportation Advisory Committee (ATAC). Staff also prepared four alternative e-scooter permission options that were presented alongside the preferred option for public review (Appendix B).
A joint public consultation program launched in early 2021 through the Region and Cities’ “Engage” websites (TES-TRS-21-01). The public consultation program on Engage Waterloo Region received considerable media attention and was highlighted in radio programs and local news in all three cities.
The online survey was available from January 13 to February 1, 2021, and resulted in 1,439 survey participants. A summary report exported from the EngageWR platform is provided in Appendix C, and key findings from the project team’s analysis are below:
• Approximately 54% of the 1,439 respondents supported the Preliminary PreferredOption, and 42% did not.
o However, when asked to rank the five options presented, not permitting (i.e.,banning) e-scooters was scored as the least favourite option overall (thePreliminary Preferred Option scored as the most favourite option).
• Top themes from open-ended responses among those who supported the PreliminaryPreferred Option were as follows: “provides complete network” (145 mentions); “treatse-scooters similar to bikes” (81); and “provides a convenient alternative to car traveland/or car parking” (72).
• There was a general concern about safety and improper use (118 mentions) amongthose who did not support the Preliminary Preferred Option, but no clear preferredalternative for if/where to permit e-scooters.
o For example, open-ended response analysis found some respondents preferred“no/limited on-road use” (159), whereas others preferred “no trails/multi-usepaths” (73), and others wanted e-scooters "treated exactly the same as bikes”(63).
• Approximately 46% of all respondents reported that they had previously ridden an e-
Page 124 of 198

April 12, 2022 Report: TES-TRS-22-06
3730856 Page 3 of 6
scooter. o Respondents who had previously ridden an e-scooter were more likely to
support the Preliminary Preferred Option.• Respondents’ primary mode(s) of travel did not appear to be a decision factor.
o For example, respondents that could be considered a cyclist, motorist, etc. wereno more or less likely to support or oppose to the Preferred Option.
• Past e-scooter experience appears to be the most influential factor for support of thePreliminary Preferred Option.
• Approximately 67% of all respondents think the Region and Cities should permitcommercial e-scooter rentals (e-scooter share) in Waterloo Region.
c) Traffic and Parking By-law recommendations for e-scooters
Based on the results of the public consultation program, staff, in concurrence with the project team and inter-municipal Traffic Coordinating Committee, recommend proceeding with the Preliminary Preferred Option and amending the Region’s Traffic and Parking By-law accordingly.
Recommended updates are provided in Appendix A and include a new definition and section for e-scooters. This section includes provisions to permit e-scooters on all Regional Roads 50 km/h or less, and all Regional Roads with reserved bike lanes and/or boulevard multi-use paths (defined as multi-use trails in the by-law).
Specific e-scooter provisions (e.g., no sidewalk riding, speed etiquette for multi-use trails and paths, parking restrictions, etc.) are also detailed in this proposed section of the by-law. Police Services representatives informed the project team that they have limited capacity to routinely enforce activities on the active transportation network. However, the intent of these by-law provisions are to provide officers with appropriate direction and authority when they must respond to a specific issue. Similarly, the proposed by-law updates are intended to provide a framework for enforcing compliance among users of any commercial shared micromobility system. With most e-scooter activity anticipated to be related to the launch of a commercial shared system, the proposed by-law provisions will be translated into contract requirements for the successful operator. It is anticipated that this will encourage greater commitment from the commercial operator to manage rider behaviours and provide rider education, skill-building, and etiquette initiatives. A recent Ryerson University research paper on emerging best practices for e-scooter policy in North America found that it is increasingly common for municipalities to apply penalties to system operators for non-compliance or poor response times related to the key issues described below and in the proposed by-law provisions.
Helmets are proposed to be mandatory for all e-scooter riders, regardless of age, based on emerging e-scooter injury literature compiled by Public Health Ontario. Commercial shared micromobility system operators approach helmet access differently, but publicly available information suggests they have been able to deliver innovative solutions to serve markets with similar mandatory helmet requirements.
Page 125 of 198

April 12, 2022 Report: TES-TRS-22-06
3730856 Page 4 of 6
Staff are of the opinion that the Preliminary Preferred Option and proposed conditions like mandatory helmet use provide an “introductory” approach to permitting e-scooters in Waterloo Region in response to the MTO pilot. This approach capitalizes on the active transportation investments made by the Region and Cities, and discourages use of e-scooters on higher speed corridors without active transportation facilities (e-scooters’ maximum speed are 24 km/h under Ontario Regulation 389/19). This option provides an optimal network for the current duration of the MTO pilot, the type and location of most anticipated trips, and the identified service areas for a commercial shared system. In many areas, riders will have the opportunity to choose alternative route options based on their level of comfort and skill with this new type of vehicle.
As described in the Shared Micromobility Implementation Plan report (TES-TRS-22-07), staff plan to monitor travel patterns, parking behaviours, and critical incidents (e.g., collisions, injuries, etc.) through shared system reports and trip data, and ongoing collaboration with TCC, Police Services, and Public Health and Emergency Services. This information will help staff determine the scope of any necessary modifications to existing transportation operations and maintenance programs to better support micromobility vehicles, which could lead to future revisions to e-scooter permissions and/or posting e-scooter restrictions on specific corridors based on their condition.
d) Power-assisted bicycles (e-bikes)
This report does not recommend any amendments to e-bike permissions at this time.
The provincial government recently announced a redefinition of e-bikes into three classes (bicycle-style, moped, and motorcycle-style) as part of the 2021 Moving Ontarians More Safely (MOMS) Act. However, the MTO has advised staff that technical and regulatory elements of this redefinition are under review and that the changes outlined as part of the MOMS Act will not be implemented until a future announcement is made.
Currently, no type of e-bike is permitted on multi-use trails under the Traffic and Parking By-Law, but the province permits all e-bikes under 120 kg on roadways (to a maximum speed of 32 km/h). Staff anticipate that, in order to integrate certain types of e-bikes and cargo e-bikes into a shared micromobility system, a separate public consultation program will be required to prepare Traffic and Parking By-law recommendations following Ontario’s e-bike reclassification.
5. Background:
This report builds upon the previous micromobility program updates submitted to Regional Council, which include the 2018/2019 bike share pilot with Drop Mobility (TES-TRS-18-11), 2019/2020 Micromobility Feasibility Study with Alta Planning + Design (TES-TRS-20-14), and 2021 e-scooter public consultation plan (TES-TRS-21-01).
6. Area Municipality Communication and Public/Stakeholder Engagement:
Page 126 of 198

April 12, 2022 Report: TES-TRS-22-06
3730856 Page 5 of 6
Transportation staff from the Region of Waterloo and Cities of Cambridge, Kitchener, and Waterloo comprise the core project team that coordinated the Drop Mobility bike share pilot, the development of the micromobility feasibility study, the e-scooter public consultation, and the recommended Traffic and Parking By-law amendments. Township staff (consulted through TCC) report that they do not anticipate demand for e-scooters in their communities initially, but will continue to monitor the project team’s progress and will respond with local updates and participate in the planned shared system as needed.
Regional and Area Municipal staff have been regularly updated and provide input on the micromobility program through TCC, IMPAcT, and leadership updates. The TCC consists of transportation staff from the Region, Police Services, and the seven Area Municipalities. IMPAcT consists of staff from the Region, Public Health, Police Services, Cities, post-secondary institutions, Student Transportation Services, CAA, and MTO.
ATAC, the Grand River Accessibility Advisory Committee (GRAAC), Cambridge Accessibility Advisory Committee, and each City’s respective active transportation advisory committee have been informed of the e-scooter public consultation program, survey findings, and the project team’s intention to proceed with the Preliminary Preferred Option. ATAC and GRAAC did not table a motion to endorse the Preliminary Preferred Option, and support varied among members of ATAC and City committees. A full summary of feedback and concerns received from the advisory committees is presented in Appendix D with staff responses.
Major themes raised by advisory committees include concern over fast e-scooter riders mixing with other multi-use trail users, sidewalk riding, and improper vehicle parking. The proposed amendments to the Traffic and Parking By-law help address many of these concerns, and these will be priority items that any system operator must be equipped to manage (since the project team anticipates most e-scooter activity will be related to the launch of a shared system). Staff have procured a tool to assist with system development and performance monitoring. This tool allows the project team to digitally upload “low speed”, “no-ride”, and “no park” zones at any time, which can be monitored and used to penalize system operators for non-compliance if required.
The project team also held a series of workshops with advisory committee members, industry representatives, and Region/City staff in September 2021 to prepare expected system features and requirements for shared systems to mitigate concerns, and develop a strategy to enforce compliance among commercial shared system operator(s). Details are presented in the Shared Micromobility Implementation Plan companion report (TES-TRS-22-07).
7. Financial Implications:
The Region’s Approved 2022 Grand River Transit Operating Budget includes a provision of $85,000 for the launch of a shared micromobility system (as described in TES-TRS-22-07), offset by an estimated $85,000 in fees to be collected from the operator resulting in a net zero impact to the GRT budget. Staff plan to monitor and report on any financial impacts associated with the operation and maintenance of roads, active transportation facilities, or the shared
Page 127 of 198

April 12, 2022 Report: TES-TRS-22-06
3730856 Page 6 of 6
micromobility system through future micromobility program update reports to Regional Council.
8. Conclusion / Next Steps:
If approved, Traffic and Parking By-law updates described in this report would come into effect July 1, 2022, and staff plan to apply to the Ontario Court of Justice for set fine approval for the amendments to the Traffic and Parking Bylaw. The City representatives on the project team will prepare similar bylaw update recommendations for area municipal highways and park trails to permit e-scooters based on the Preliminary Preferred Option. Local municipalities may choose to restrict e-scooters on certain trails, parks, and/or other public spaces based on their condition.
Subject to approval of this report, e-scooters will be considered eligible fleet vehicles that can be part of a commercial shared system as described in the Shared Micromobility Implementation Plan (TES-TRS-22-07).
Attachments / Links:
Appendix A. Recommended Amendments to Traffic and Parking By-law 16-023 (3996237)
Appendix B: E-scooter Permission Options (EngageWR Public Consultation) (3996252)
Appendix C: E-scooter Public Consultation Survey Report (EngageWR Export) (3996255)
Appendix D: Summary of Advisory Committee Meetings and Staff Responses (3996259)
Prepared By: Kevan Marshall, Principal Planner, Transportation Demand Management
John Cicuttin, Manager, Transit Development
Bob Henderson, Manager, Transportation Engineering
Reviewed By: Neil Malcolm, Acting Director, Transit Services
Steve van De Keere, Director, Transportation
Approved By: Thomas Schmidt, Commissioner, Transportation and Environmental Services
Page 128 of 198

TES-TRS-22-06
Document Number: 3996239 Page 1 of 3
Appendix A: Recommended Amendments to Traffic and Parking By-law 16-023
By-Law Number 22-XXX
of
The Regional Municipality of Waterloo
A By-law to Amend by-law 16-023, as Amended, being a By-law to Regulate Traffic and Parking on Highways Under the Jurisdiction of the Regional Municipality of Waterloo (to
Permit Electric Kick-Scooters on Certain Highways)
Whereas Ontario Regulation 389/19 of Highway Traffic Act, R.S.O. 1990, c. H.8, as amended, provides that no person shall operate an electric kick-scooter on a highway, sidewalk, trail, path or walkway or in a public park or exhibition ground under the jurisdiction of a municipality unless such operation is permitted by and in accordance with a municipal by-law;
And Whereas it is the desire of The Regional Municipality of Waterloo to permit persons to operate an electric kick-scooter on certain portions of highways that are under the jurisdiction of The Regional Municipality of Waterloo;
Now therefore, the Council of the Regional Municipality of Waterloo enacts as follows:
1) The Traffic and Parking By-law is amended by adding section 11.1 to Part II, Definitions,as follows:
“11.1 “e-scooter” has the same meaning as an “electric kick-scooter” in OntarioRegulation 389/19 of the Highway Traffic Act;”
2) The Traffic and Parking By-law is amended by adding a new Part XIX.2 – E-Scooters, asfollows:
“Part XIX.2 – E-Scooters
1. a) Subject to subsection b) of this section, a person is permitted to operate an e-scooter on the following portions of a highway:
i) A multi-use trail;ii) A cycling lane;iii) A reserved lane;iv) The shoulder of a highway with a posted rate of speed of 50 kilometers
per hour or less if the highway has no cycling lane or reserved lane; and
Page 129 of 198

April 12, 2022 TES-TRS-22-06
3996239 Page 2 of 3
v) The roadway of a highway with a posted rate of speed of 50 kilometers per hours or less if the highway has no cycling lane, reserved lane or shoulder.
b) Subsection a) of this section shall not apply if an authorized sign is posted on a multi-use trail, cycling lane, reserved lane, shoulder or roadway that e-scooters are not permitted.
2. Where cycling lanes and reserved lanes are not provided on a highway with a posted rate of speed of 50 kilometers per hours or less, the operator of an e-scooter shall,
a) if there is a shoulder on the highway, stay on the shoulder as close to the right edge of the shoulder as possible; and
b) if there is no shoulder on the highway, stay on the right side of the roadway as close to the edge of the roadway as possible.
3. No person shall: a) operate an e-scooter on a highway except in compliance with section 1 of
this Part; b) operate an e-scooter on a highway without wearing a helmet and chin strap; c) operate an e-scooter on a sidewalk except to cross; d) operate an e-scooter on a multi-use trail at a speed that is markedly greater
than the speed of the pedestrians who are proximate to the e-scooter; e) operate an e-scooter at a bus stop, transit station or light rail transit platform
that is on or adjacent to a highway; f) operate, stop or leave an e-scooter on any railway track, light rail transit
track or other area designated with an authorized sign or marking for light rail transit vehicles;
g) leave an e-scooter in a location on a highway, including a sidewalk, that is intended for the passage of vehicles or pedestrians;
h) operate an e-scooter on any section of a multi-use trail, cycling lane, reserved lane, or roadway that is unpaved and/or closed for maintenance, construction, or emergency reasons; or
i) use an e-scooter for commercial use unless authorized by the Commissioner.
4. The operator of an e-scooter shall:
a) keep a safe distance from pedestrians and other users of the highway where the e-scooter is permitted pursuant to section 1 of this Part at all times; and
Page 130 of 198

April 12, 2022 TES-TRS-22-06
3996239 Page 3 of 3
b) give way to a pedestrian or bicycle by slowing or stopping, as necessary,where there is insufficient space for the pedestrian or bicycle and the e-scooter to pass.”
3) This By-law shall come into effect on July 1, 2022.
By-law read a first, second and third time and finally passed in the Council Chambers in the Regional Municipality of Waterloo this day of , A.D., 2022.
_______________________ _______________________ Regional Clerk Regional Chair
Page 131 of 198

TES-TRS-22-06
Document Number: 3996252 Page 1 of 1
Appendix B: E-scooter Permission Options (EngageWR Public Consultation)
Option # Description
1 • Do not permit e-scooters in Waterloo Region• Current condition (e-scooters are only permitted on privately-owned lands)
2 • Permit e-scooters on:o Trails and multi-use paths
3 • Permit e-scooters on:o Trails and multi-use paths; ando All roads with reserved bike lanes
4 Preliminary Preferred Option
• Permit e-scooters on:o Trails and multi-use paths;o All roads with reserved bike lanes; ando Any road 50km/hr or less
5 • Permit e-scooters anywhere a bike can go:o Trails and multi-use paths;o All roads with reserved bike lanes; ando Any other road (except controlled-access highways)
Page 132 of 198

TES-TRS-22-06
Document Number: 3996255 Page 1 of 10
Appendix C: E-scooter Public Consultation Survey Report (EngageWR Export)
Note: this report includes charts generated by Engage Waterloo Region (EngageWR)’s “Bang the Table” public engagement platform. These charts show summarized survey results and are presented as images in this report. Staff have prepared the text descriptions of the results above each image for improved accessibility.
Survey Response Report:
12 January 2021 - 02 February 2021
Project Name:
Public Consultation Survey: Where should people be allowed to ride e-scooters in Waterloo Region?
Question 1: Do you support staff's preliminary preferred option for where e-scooters should be allowed to ride in Waterloo Region?
Preliminary Preferred Option (Option 4).
Permit e-scooters on:
• Trails and multi-use paths;
• All roads with reserved bike lanes; and
• Any road 50km/hr or less
Results: Yes (54.1%); No (41.6%); Unsure (4.3%)
Page 133 of 198

April 12, 2022 TES-TRS-22-06
3996255 Page 2 of 10
Question 2: Please rank all options for permitting e-scooters in Waterloo Region. (1=most favourite option, 5= least favourite option)
Options Average Rank Results
Permit e-scooters trails and multi-use paths, all roads with reserved bike lanes, and any road 50km/hr or less
2.31
Permit e-scooters on trails and multi-use paths, and all roads with reserved bike lanes
2.46
Permit e-scooters anywhere a bike can go (i.e., bike lanes, trails, and multi-use paths, all roads except controlled-access highways)
3.00
Permit e-scooters on trails and multi-use paths 3.07
Do not permit e-scooters in Waterloo Region 3.93
Question 3: Do you think the Region and Cities should permit e-scooter rental companies (scooter share) to operate in Waterloo Region?
Results: Yes (67.1%); No (21.8%); Unsure (11.1%)
Page 134 of 198

April 12, 2022 TES-TRS-22-06
3996255 Page 3 of 10
Page 135 of 198

April 12, 2022 TES-TRS-22-06
3996255 Page 4 of 10
Question 4: How do you typically travel around Waterloo Region? Please select the mode(s) of transportation that you use regularly (i.e., almost daily) for most of your trips.
Note: If the COVID-19 pandemic has temporarily impacted your transportation choices and how you travel, please select the mode(s) of transportation you plan to use most over the next 1-2 years.
Results:
• Walk/Run/Assisted-Mobility Device: 765 • Bike: 562 • Transit (GRT buses and ION light rail): 344 • Carpool (driver or passenger): 334 • Drive alone (including motorcycle): 1070 • Taxi / rideshare (e.g., Uber, Lyft, etc.): 135 • Other: 52
Page 136 of 198

April 12, 2022 TES-TRS-22-06
3996255 Page 5 of 10
Question 5: Have you ever ridden an e-scooter before?
Results: Yes (45.7%); No (54.3%)
Question 6: Do you own (or plan to purchase) an e-scooter for personal use?
Results: Yes (17.9%); No (82.1%)
Page 137 of 198

April 12, 2022 TES-TRS-22-06
3996255 Page 6 of 10
Question 7: What type of trips do you think you would take on an e-scooter? Select all that apply if you plan to own or rent an e-scooter.
Results:
• I will not take a trip on an e-scooter: 559 • Trips to/from transit stops and stations: 367 • Trips to/from work: 381 • Trips to/from school: 157 • Trips to/from grocery store or other businesses for shopping/errands: 472 • Trips for fun / recreation / exploration: 765 • Other: 48
Page 138 of 198

April 12, 2022 TES-TRS-22-06
3996255 Page 7 of 10
Question 8: If you were to use an e-scooter, what mode of transportation would it likely replace? Select all that apply if you plan to own or rent an e-scooter.
Results:
• I will not take a trip on an e-scooter: 505 • Replace some trips I would usually make by walking/running/using an assisted-
mobility device: 445 • Replace some trips I would usually make by bike: 372 • Replace some trips I would usually make by taking transit (GRT buses / ION light
rail): 252 • Replace some trips I would usually make by carpooling (driver or passenger):
142 • Replace some trips I would usually make by driving alone (including motorcycle):
503 • Replace some trips I would usually make by taking a taxi / rideshare (e.g., Uber,
Lyft, etc.): 207 • Other (please specify): 58
Page 139 of 198

April 12, 2022 TES-TRS-22-06
3996255 Page 8 of 10
Question 9: If the Region and Cities permitted e-scooter rental companies to operate locally, how likely are you to "rent" an e-scooter at least once?
Results:
• I will not rent an e-scooter (36.5%) • I am unsure if I will rent an e-scooter (15.1%) • I will rent an e-scooter at least once (44.9%) • Other (3.5%)
Page 140 of 198

April 12, 2022 TES-TRS-22-06
3996255 Page 9 of 10
Question 10: How likely are you to "rent" an e-scooter regularly (e.g., 2 or more times per week)?
Note: Question asked to those who reported that they would try an e-scooter at least once (Question 9).
Results:
• I will not rent an e-scooter regularly (I just want to try it once) (11.6%) • I am unsure if I will rent an e-scooter regularly (50.2%) • I will rent an e-scooter regularly (33.8%) • Other (4.5%)
Page 141 of 198

April 12, 2022 TES-TRS-22-06
3996255 Page 10 of 10
Question 11: Where do you live?
Results:
• City of Cambridge (13.2%) • City of Kitchener (44.1%) • City of Waterloo (37.2%) • Township of North Dumfries (0.5%) • Township of Wellesley (0.6%) • Township of Wilmot (0.8%) • Township of Woolwich (1.8%) • Other (1.7%)
Page 142 of 198

TES-TRS-22-06
Document Number: 3996259 Page 1 of 9
Appendix D: Summary of Advisory Committee Meetings and Staff Responses
Advisory Committee and Meeting Date(s)
Decision(s) in Meeting Minutes
Summary of Comments and Feedback Received in Meeting Re: E-scooter Permissions
Staff Responses
Region of Waterloo Active Transportation Advisory Committee
(November 17, 2020, January 19, April 20, and June 15, 2021)
No Motion. 1. Maximum speed of e-scooters?
2. How will Cities’ Traffic andParking By-law updatesdiffer?
3. How will injuries/collisions betracked?
4. Concern with e-scooters onmulti-use trails and risk ofcollision with pedestrians.
5. Request for clarity on liability ife-scooter gets in a collisionwith pedestrian and/ormotorist.
6. Request the project team“move faster” on implementinge-scooter permissions and ashared system.
1. Under the provincial pilot, e-scooters’maximum speed is 24 km/h, but can befurther reduced by municipalitiesthrough rental company requirementsand/or through future by-law updates.
2. The City representatives on the projectteam intend to coordinate by-lawupdates to match the Preferred Optionin consideration of any decisions fromRegional Council. The goal isconsistency for riders wherever they arein the community. Local municipalitieswill have the ability to restrict use of e-scooters in certain areas at theirdiscretion through their respective parksand traffic by-laws. The City-Regionproject team is procuring a systemdevelopment and performancemonitoring tool that will allow staff todigitally upload “low speed”, “no-ride”,and/or “no park” zones, that can bemonitored and used to penalize systemoperators for non-compliance if required.
3. Public Health is aware of the project(representative on IMPAcT). Due tocapacity issues caused by the
Page 143 of 198

April 12, 2022 TES-TRS-22-06
3996259 Page 2 of 9
Advisory Committee and Meeting Date(s)
Decision(s) in Meeting Minutes
Summary of Comments and Feedback Received in Meeting Re: E-scooter Permissions
Staff Responses
pandemic, the project team has primarily consulted with the Southwest Ontario Injury Prevention group, which provided direction as to how healthcare providers can code e-scooter injuries that could be tracked in collaboration with Public Health. Rental companies will be required to share any incidents that occur through their operations.
4. Proposed etiquette provisions for managing speed on multi-use trails is intended to avoid high-speed collisions between riders and pedestrians. The ability to implement further vehicle speed reductions will be a requirement of any shared system and can be programmed into the vehicles.
5. The project team will work with Legal Services and Risk Management teams to ensure any system operators are providing the necessary coverage to protect the riders, the public, and the municipalities.
6. Feedback received.
Page 144 of 198

April 12, 2022 TES-TRS-22-06
3996259 Page 3 of 9
Advisory Committee and Meeting Date(s)
Decision(s) in Meeting Minutes
Summary of Comments and Feedback Received in Meeting Re: E-scooter Permissions
Staff Responses
Grand River Accessibility Advisory Committee
(April 22 and June 24, 2021)
No Motion. 1. Question what was learned from City of Waterloo pilot?
2. Members generally do not want e-scooters on shared paths with pedestrians, especially boulevard multi-use trails.
3. Question why the project team is recommending e-scooters if City of Toronto banned them?
4. What will the project team do if e-scooters are permitted and major issues are reported?
1. Policies such as “low speed” and “no ride” zones need to be considered. Better utilization of geofencing and performance monitoring are critical (project team procuring a performance monitoring tool to monitor and penalize system operators if required).
2. Feedback received. Proposed etiquette provisions for managing speed on multi-use trails is intended to avoid high-speed collisions between riders and pedestrians. The ability to implement further vehicle speed reductions and/or restrict use on certain corridors will be a requirement of any shared system, and can be programmed into the vehicles
3. Sidewalk riding, speed, improper vehicle parking obstructing accessible paths of travel, insufficient infrastructure, and insurance/liability were among the issues raised in Toronto. Sidewalk riding, speed management, and vehicle parking are critical priorities for the shared system (which is anticipated to generate most e-scooter trips). Any potential system operator must demonstrate to the project team that they are equipped to manage and
Page 145 of 198

April 12, 2022 TES-TRS-22-06
3996259 Page 4 of 9
Advisory Committee and Meeting Date(s)
Decision(s) in Meeting Minutes
Summary of Comments and Feedback Received in Meeting Re: E-scooter Permissions
Staff Responses
enforce these issues. The project team will prepare a plan to enforce by-law compliance among shared system operator(s) and apply penalties if needed. Similarly, the project team will work with Legal Services and Risk Management teams to ensure any system operators are providing adequate coverage to protect the riders, the public, and the municipalities.
The Region and Cities have made significant investments in dedicated active transportation infrastructure in our core areas, and the Preliminary Preferred Option provides various route choices to discourage sidewalk riding. However the project team remains committed to monitoring sidewalk riding issues/ complaints. The City-Region project team is procuring a system development and performance monitoring tool that will allow staff to digitally upload “low speed”, “no-ride”, and/or “no park” zones (e.g., sidewalks), that can be monitored and used to penalize system operators for non-compliance if required.
4. Staff will continue to consult with
Page 146 of 198

April 12, 2022 TES-TRS-22-06
3996259 Page 5 of 9
Advisory Committee and Meeting Date(s)
Decision(s) in Meeting Minutes
Summary of Comments and Feedback Received in Meeting Re: E-scooter Permissions
Staff Responses
GRAAC. The project team could recommend discontinuing the shared rental program and/or revising by-laws to further restrict / ban e-scooters if major issues are consistently encountered and cannot be resolved.
Cambridge Cycling and Trails Advisory Committee
(May 13, 2021)
No Motion. 1. Do not see many e-scooters in community, but Preferred Option “lands in the right place”
2. Request firm approach to managing rental companies, even though popularity unknown.
3. Concern re: liability for municipalities because of the design of the vehicle (i.e., if it falls on a stone dust trail).
1. Feedback received.
2. Staff intend to manage companies through contract with clear requirements for managing fleets. Staff plan to monitor performance of operators (and potentially penalize) through third-party performance monitoring application.
3. Local municipalities may choose to restrict e-scooters on certain trails, parks, and/or other public spaces based on their condition. The project team will work with Legal Services and Risk Management teams to ensure any system operators are providing the necessary coverage to protect the riders, the public, and the municipalities.
Kitchener Cycling and Trails Advisory Committee
“Support in principle Option 5 that would permit e-scooters anywhere a bike
1. Preferred Option hard to explain because it is different than where bikes can go and could restrict access to some
1. Staff are of the opinion that the Preferred Option provides an optimal “introductory” network for the type and location of most anticipated trips, and permissions could be expanded in the
Page 147 of 198

April 12, 2022 TES-TRS-22-06
3996259 Page 6 of 9
Advisory Committee and Meeting Date(s)
Decision(s) in Meeting Minutes
Summary of Comments and Feedback Received in Meeting Re: E-scooter Permissions
Staff Responses
(May 11 and June 8, 2021)
can go.”
(June 8, 2021)
destinations.
2. What if Ontario adjusts the pilot program window?
3. What if someone is on a street over 50 km/h without bike lanes or MUTs?
4. Concern re: project team is not embracing new technology and restricting e-scooters reduces pressure for municipalities to build proper infrastructure on higher speed roads.
5. How will enforcement be managed?
6. How will education/training for multi-use trails be approached?
future if the demand for e-scooters is strong and shared system ridership data suggests network gaps, and any safety issues are manageable.
2. There has not been any indication from the province, but staff intend to align the local program to the province.
3. The rider would expected to dismount and walk the vehicle.
4. The Preferred Option optimizes use of recent investments in active transportation infrastructure immediately. This project/Preferred Option will not impact the municipalities’ commitment to active transportation infrastructure investments. However, capital infrastructure projects along entire corridors can take many years to fully complete.
5. Police Services is tasked with responding, but capacity is limited. Intent is that the by-law provisions will allow staff to regulate and enforce companies as much as possible to ease enforcement pressures (shared system is anticipated to generate most e-scooter trips). The City-Region project
Page 148 of 198

April 12, 2022 TES-TRS-22-06
3996259 Page 7 of 9
Advisory Committee and Meeting Date(s)
Decision(s) in Meeting Minutes
Summary of Comments and Feedback Received in Meeting Re: E-scooter Permissions
Staff Responses
team is procuring a system development and performance monitoring tool that will allow staff to digitally upload “low speed”, “no-ride”, and/or “no park” zones (e.g., sidewalks), that can be monitored and used to penalize system operators for non-compliance if required.
6. For personally-owned e-scooters this will be addressed through any existing/planned trail etiquette initiatives by the Cities and Region. Companies will be required to provide training to riders and must be able to program reduced vehicle speeds on trails as required by the project team.
Waterloo Advisory Committee on Active Transportation
(May 11 and June 8, 2021)
“Support Option 4 (Preferred Option) for the permission of e-scooters.”
(June 8, 2021)
1. Concern re: that during past City of Waterloo e-scooter pilot, boundaries were never adhered to by riders using rental company e-scooters.
2. What if there are bike lanes and multi-use trail(s) in the same roadway?
3. Are e-scooters allowed on transit vehicles?
4. Concern re: speed differential
1. The by-law provisions will speak to general permitted infrastructure a rider may use, but the intent of the project team is to include supportive by-law provisions that will help staff further regulate rental companies’ service area boundaries. Staff plan to monitor performance of operators (and potentially penalize) through third-party performance monitoring application.
2. The e-scooter rider would be able to choose the infrastructure they are most
Page 149 of 198
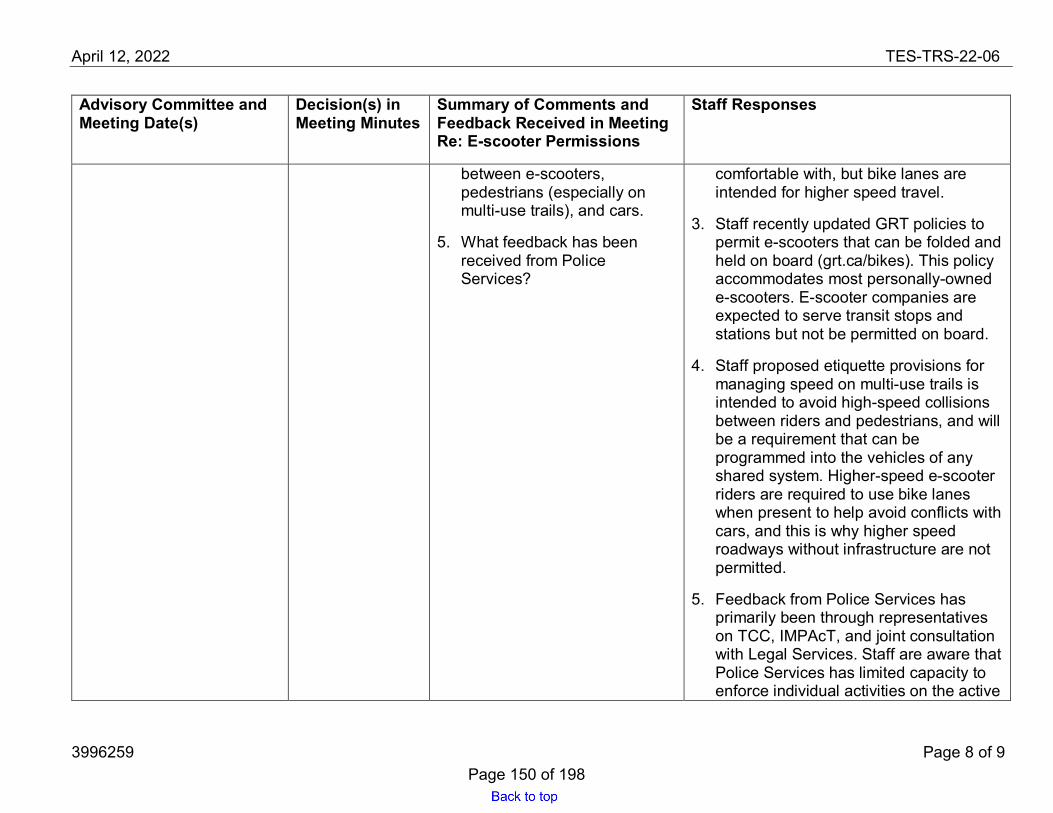
April 12, 2022 TES-TRS-22-06
3996259 Page 8 of 9
Advisory Committee and Meeting Date(s)
Decision(s) in Meeting Minutes
Summary of Comments and Feedback Received in Meeting Re: E-scooter Permissions
Staff Responses
between e-scooters, pedestrians (especially on multi-use trails), and cars.
5. What feedback has been received from Police Services?
comfortable with, but bike lanes are intended for higher speed travel.
3. Staff recently updated GRT policies to permit e-scooters that can be folded and held on board (grt.ca/bikes). This policy accommodates most personally-owned e-scooters. E-scooter companies are expected to serve transit stops and stations but not be permitted on board.
4. Staff proposed etiquette provisions for managing speed on multi-use trails is intended to avoid high-speed collisions between riders and pedestrians, and will be a requirement that can be programmed into the vehicles of any shared system. Higher-speed e-scooter riders are required to use bike lanes when present to help avoid conflicts with cars, and this is why higher speed roadways without infrastructure are not permitted.
5. Feedback from Police Services has primarily been through representatives on TCC, IMPAcT, and joint consultation with Legal Services. Staff are aware that Police Services has limited capacity to enforce individual activities on the active
Page 150 of 198

April 12, 2022 TES-TRS-22-06
3996259 Page 9 of 9
Advisory Committee and Meeting Date(s)
Decision(s) in Meeting Minutes
Summary of Comments and Feedback Received in Meeting Re: E-scooter Permissions
Staff Responses
transportation network. Police Services representatives expressed support for staff’s plan to regulate rental companies any way they can to help manage rider behaviours.
Workshops with representatives from GRAAC and Cambridge Accessibility Advisory Committee, ATAC and Cities’ active transportation advisory committees
(September 8 and 9, 2021)
Information gathering.
1. No additional comments / feedback re: permissions. Workshops focused on recommendations for shared system operator requirements.
1. Recommendations for e-scooter share will inform the plan for system launch and requirements for private operators (Micromobility Shared Program Implementation Plan report - TES-TRS-22-07).
Page 151 of 198

TES-TRS-22-07
Document Number: 3846870 Page 1 of 5
Region of Waterloo
Transportation and Environmental Services
Transit Services
To: Chair Tom Galloway and Members of the Planning and Works Committee
Meeting Date: April 12, 2022
Report Title: Micromobility – Shared Program Implementation Plan
1. Recommendation:
That the Regional Municipality of Waterloo;
a) Approves the Shared Micromobility Implementation Plan in principle;b) Authorize staff to issue a request for proposals, in coordination with the Cities
of Cambridge, Kitchener, and Waterloo, for a shared micromobility operator;and
c) Authorize the Commissioner of TES to execute a memorandum of agreementwith the Cities of Cambridge, Kitchener, and Waterloo, in a form satisfactory tothe Region Solicitor; to formalize their respective roles and other agreements inrelation to the Shared Micromobility Program;
Pursuant to Report TES-TRS-22-07, dated April 12, 2022.
2. Purpose / Issue:
This report informs the Planning and Works Committee of the implementation planning for the establishment of commercial bike share and e-scooter share operations. It is a companion to Report TES-TRS-22-06 that recommends amendments to the Region’s Traffic and Parking By-law to permit e-scooters as part of the Ministry of Transportation’s e-scooter pilot program.
Subject to the approval of this report, the Project Team (comprised of Region and City staff) will finalize the required Procurement documents, inform municipal Councils, then initiate a joint Request for Proposals to select a commercial shared micromobility operator in relation to the Regional and municipal lands in the Cities of Cambridge, Kitchener, and Waterloo.
3. Strategic Plan:
Supporting the introduction of low energy micromobility options and programs that can be integrated with the Region’s transit network aligns with Focus Area 2 (Sustainable
Page 152 of 198

April 12, 2022 TES-TRS-22-07
3846870 Page 2 of 5
Transportation) of the Region’s 2019-2023 Strategic Plan. This work is also a Strategic Action of the TransformWR plan (Action 1.3.1: Launch Micromobility Systems), and supports Strategy 5 of the Region’s 2018 Transportation Master Plan (Position the Region for New Mobility).
4. Key Considerations:
On May 5, 2020, Transportation Demand Management staff presented a micromobility update report to Regional Council (TES-TRS-20-14). The report provided an overview of recommended actions received from Alta Planning + Design for implementing shared micromobility solutions throughout the Region.
Since the spring of 2020, TDM staff have continued their work with the Shared Micromobility Project Team (comprising of transportation staff representatives from the Cities of Cambridge, Kitchener, and Waterloo) to develop a shared micromobility implementation plan based on the study’s recommendations for bike share and e-scooter providers. Staff also retained the consulting services of Alta Planning + Design on a follow-up assignment to support the development of the micromobility program implementation plan based on their work for the 2020 Shared Micromobility Feasibility Study.
This report outlines the implementation plan for the program, specifically the initiation of the Procurement process for the establishment of commercial bike and e-scooter operations. Staff plan to lead a joint Request for Proposal (RFP) competitive process with municipal partners to allow commercial shared micromobility operators to submit their business plans and compete to be the single provider in the Cities of Cambridge, Kitchener, and Waterloo.
A) Pre-Launch Considerations
With support from the Project Team, consultants from Alta Planning have finalized an RFP Framework document that will be included in the Region’s Procurement package. It will outline the operating requirements and expected system features (see Appendix A for a summary of the key RFP Framework attributes).
The RFP evaluation team will include the members of the Project Team, as well as a consultant from Alta Planning + Design. The RFP Framework will be evaluated using an RFP scorecard, developed by Alta Planning. The Project Team intends to invite up to three respondents to demonstrate their vehicles and technology to the evaluation team.
In the event that the evaluation team determines no proposals meet the requirements outlined in the RFP Framework, staff will report back to Council to discuss alternative approaches to implementing a shared micromobility system.
Once the preferred provider is selected, it is expected to take two months of planning until a system would be ready to launch. This estimate is based on feedback received
Page 153 of 198

April 12, 2022 TES-TRS-22-07
3846870 Page 3 of 5
during an industry workshop hosted by consultants from Alta Planning this fall. Based on these estimates, a 2022 launch is achievable.
However, there are factors that could delay the launch timeline. For instance, there is potential for decreased availability of vehicles due to ongoing supply chain issues, and that global shortages of both electronics and bicycles could continue to pose challenges for the sourcing of shared micromobility vehicles. There may also be delays in the finalization of the agreements as both Regional and municipal partners will be part of the review process.
Staff will prioritize working with their preferred operator and deploying vehicles equipped with leading monitoring technologies, as well as ensuring the required pre-launch planning and coordination has occurred, over ensuring a system launch for 2022. The Project Team believes that allowing sufficient time for the pre-launch planning process is critical to the success of the program.
If the program launch is delayed into late summer, the Project Team will discuss postponing the launch to 2023 with the operator. Staff would provide an update to Regional Council at this time. Otherwise, there will be public communication about the service launch, including information on how to use the system.
With the intention of expediting the negotiation process and system launch, a draft of the operator licence agreement will be included in the RFP package. The Project Team has also been working with both Region and municipal groups to develop the Procurement and legal documents for the program to identify any discrepancies before the review process.
B) Post-Launch Considerations
Staff will report to Regional Council after the first riding season on the operator’s performance and progress towards the overall program goals. This report will also include any recommendations to improve the program in subsequent years.
The approved 2022 Regional budget includes funding under the TransformWR Climate Action Plan for one additional staff position to support the shared micromobility program. This new position will work closely with the shared micromobility system operator and Project Team to support the accelerated delivery of enhancements to the shared micromobility program as well as day-to-day operation of the program and several other low energy transportation initiatives from the TransformWR Climate Action Plan. The Project Team will continue to provide support with strategic planning and coordination with staff groups from their respective organizations.
5. Background:
This report builds upon the previous micromobility program updates submitted to Regional Council, which include the 2018/2019 bike share pilot with Drop Mobility (TES-
Page 154 of 198

April 12, 2022 TES-TRS-22-07
3846870 Page 4 of 5
TRS-18-11), 2019/2020 Micromobility Feasibility Study with Alta Planning + Design (TES-TRS-20-14), and 2021 e-scooter public consultation plan (TES-TRS-21-01).
6. Area Municipality Communication and Public/Stakeholder Engagement:
Transportation staff from the Region of Waterloo and Cities of Cambridge, Kitchener, and Waterloo comprise the core Project Team that coordinated the Drop Mobility bike share pilot, development of the micromobility feasibility study, e-scooter public consultation, and the recommended Traffic and Parking By-law amendments described in Report TES-TRS-22-06.
The Project Team has formed an expanded Region and Municipal Staff Shared Micromobility Working Group to address pre and post launch issues that will touch various staff groups. Through the Working Group, staff have been working collaboratively to plan for the launch of a shared micromobility program, and will continue to support the program’s ongoing activities. The Working Group is comprised of various sub-groups, which currently include Communications, Data, Enforcement and Safety, Contract Management, Member Services, Station Siting and Operations.
City staff representatives on the Project Team will be providing a similar update to their Councils over the spring.
Regional and Area Municipal staff have been regularly updated on the micromobility program through the Traffic Coordinating Committee, Intermunicipal Partnership for Active Transportation, and leadership updates.
7. Financial Implications:
The Region’s Approved 2022 Grand River Transit Operating Budget includes a provision of $85,000 for Micromobility Integration. The budget also includes a provision of $85,000 for fees collected by the Region from the operator. Staff plan to monitor the budget for any variance from the zero net impact, as well as any financial impacts associated with the operation, and maintenance of roads, active transportation facilities, or the shared micromobility system through future micromobility program update reports to Regional Council.
8. Conclusions / Next Steps:
If approved, staff will initiate a Request for Proposals to select a commercial shared micromobility operator. Once the preferred provider is selected, staff would seek to enter into a licence agreement with the operator, in addition to a Memorandum of Agreement with municipal partners to formalize the Region and Cities’ respective roles and other agreements in relation to the Shared Micromobility Program, both to the satisfaction of the Region Solicitor.
Public and media releases will occur at key milestones towards launch. Staff will report
Page 155 of 198

April 12, 2022 TES-TRS-22-07
3846870 Page 5 of 5
to Regional Council after the first riding season on the operator’s performance and progress towards achieving the overall program goals. However, if there are no successful candidates identified through the RFP process, staff will report back to Council to discuss alternatives approaches to implementing a shared micromobility system.
9. Attachments / Links:
Appendix A: RFP Framework Summary (3996122)
Appendix B: Map of Proposed Service Areas from 2020 Shared Micromobility Feasibility Study (3996122)
Prepared By: Julie Belanger, Principal Planner, Transit
John Cicuttin, Manager, Transit Development
Reviewed By: Neil Malcolm, Acting Director, Transit Services
Approved By: Thomas Schmidt, Commissioner, Transportation and Engineering Services
Page 156 of 198

TES-TRS-22-07
Document Number: 3996122 Page 1 of 6
Appendix A: RFP Framework Summary
The key attributes of the RFP Framework include:
• Single Operator. Region is seeking a single operator in relation to Regional andmunicipal lands in the Cities of Cambridge, Kitchener, and Waterloo.
o Based on the costs and benefits prepared by Alta Planning, exclusivity would beconsidered more attractive to operators. Single operator systems were alsoidentified as requiring less Regional/municipal staff time to manage, andconsidered to lend themselves more to multi-year partnerships.
• Service Areas in Cambridge, Kitchener, and Waterloo. Service areas define wherethere will be docking stations, and where both bikes and e-scooter users are permittedto start/end trips, on Regional and municipal lands. Bikes and e-scooters can still beridden outside of the service area.
o Recommended service areas were identified for the three urban municipalitiesin the 2020 Feasibility Study (see Appendix B), however the services areas willbe finalized with the selected operator.
o The Feasibility Study also recommended the operator provide 200 program-specific parking corrals, and that the Region and Cities add an additional 200general use parking corrals.
• Number of Vehicles. For the initial proposed service area, 850 bicycles and 425 e-scooters were identified as an appropriate number of vehicles to meet guidancerequirements for the service area size and population.
o Final vehicle counts to be determined with selected operator.o The Project Team will consider allowing the operator to include electric-assist
vehicles (e-bikes) as part of the bicycle fleet once direction is received from theMinistry of Ontario regarding e-bike reclassification. The provincial government announced a redefinition of e-bikes into three
classes (bicycle-style, moped, and motorcycle-style) under the 2021Moving Ontarians More Safely Act. Staff anticipate that a separate publicconsultation program will be required to prepare Traffic and Parking By-law recommendations to integrate certain types of e-bikes and cargo e-bikes into a shared micromobility system.
• Vehicle Requirements.o Bicycles will be required to meet Provincial safety requirements, and come
equipped with adjustable seat posts/handlebar heights, front and rear automaticlights, a bell, all-weather tires, and front/rear fenders.
o As per the Province’s E-Scooter pilot framework, e-scooters (if permitted) will berequired to have a horn or bell, front and rear lights, two wheels and two breaks,and no seat or pedals.
• Hybrid Lock-To System. Vehicles can be parked at a station or not (the system doesnot require that every trip start/end at a docking station). The “lock-to” element wouldmean that a locking mechanism on the vehicle allows it to be locked to a bike rack
Page 157 of 198

April 12, 2022 TES-TRS-22-07
3993122 Page 2 of 5
(rather than simply self-locking). o In the 2020 Feasibility Study, it is recommended that the operator provide 200
parking corrals and that the Region and municipalities should also add another200 general use bike parking corrals in the first year of the program.
• Prioritize Bikes. To align with the goals set in the Feasibility Study and Region/CityStrategic and Active Transportation Plans (e.g. positively impacts public health, isenvironmentally friendly…), the RFP documents will be structured to incentivize theprovision of bikes over e-scooters.
• Revenue Neutral. The system will be run by a private operator. Fees will be collectedfrom the operator by the Region to offset costs incurred by the Region and Cities. Anyremaining funds will be used to make improvements to the program and/or addressunforeseen financial impacts to operations and maintenance procedures.
• Length of Agreement. The Region is interested in signing a one-year contract withthe successful operator, with opportunity for a direct renewal for subsequent years.This approach will allow the Project Team to assess the operator’s performance andmake changes to the agreement, if required, but also supports a longer-termarrangement with the operator.
o The first year of the program will be seasonal. Staff will consider winter servicein later years of the program.
• Insurance/Liability. The operator will maintain general liability insurance. Coverageshall consist of a comprehensive policy of public liability and property damageinsurance. The Region and Cities are indemnified against all claims, demands, loss,costs, damages, actions, suits, adjusters fees, or other proceedings.
• Helmet Use. The minimum age to use the service will be determined by the selectedoperator. In compliance with Provincial regulations, cyclists under the age of 18 yearsof age will be required to wear a helmet while riding, with all e-scooter users requiredto wear a helmet as per the recommended Traffic and Parking By-law amendment inReport TES-TRS-22-06.
o As part of their proposals, applicants will be required to describe how they willencourage helmet use.
• Transit Integration. Proponents will be asked about how they will integrate their sharedmicromobility system with Grand River Transit (GRT) service, including the ION LRT.
• Compatible with Mobility Manager Dashboard. Staff have purchased a subscriptionto Populus, a mobility manager service. The online dashboard brings together datasetsfrom disparate sources together into a unified view, and will enable themanagement/administration and monitoring of operator data by multiple partners. Priorto the development of this type of service, the Region and Cities used operatordashboards to monitor performance. The Populus service has additional features thatare not included in most private operator dashboards. The selected operator will berequired to be compatible and share data with Populus. Key Populus features include:
o Mobility operator data validation, anonymization, and secure storageo Live map for real-time vehicle monitoring
Page 158 of 198

April 12, 2022 TES-TRS-22-07
3993122 Page 3 of 5
o Creation and digital communication of new policies to mobility operatorso Monitoring of preferred/restricted parking areas, equity zones, and vehicle capso Route (GPS trip trace) analysis for planning
• Controls through Geofencing. Staff can set vehicle restrictions using virtualperimeters through Populus (see above). Region and City staff are finalizing the slow,no ride, and no parking zones, based on recommended best practices and feedbackfrom Region and municipal advisory committees (Report TES-TRS 22-06 Appendix D).The geofenced zones can be adjusted throughout the program. Due to the GPSaccuracy in most shared micromobility vehicles, geofences are more effective insetting vehicle restrictions in larger areas such as shared use paths or parks thansmaller footprints such as sidewalks. As a result, how the proponents plan onpreventing sidewalk riding as described in their Safety Plan will be an importantconsideration of the RFP evaluation team.
o Slow zones will be used to moderate e-scooter speed within areas permittedwithin the Traffic and Parking Bylaw update. An example of a slow zoneincludes multi-use trails with high pedestrian volume, such as the Iron Horseand Spur Line trails. This is intended to prevent high-speed collisions betweenriders and pedestrians, a concern identified through consultation with Regionand municipal advisory committees.
o No ride zones could be applied to both bikes and e-scooters. An example of ano ride zones includes the ION corridor. Further discussion with the selectedoperator is required to determine how both bikes and e-scooters can safelytransition from regular speed to stopping.
• Operator Performance Monitoring. Staff worked with the consultants to prepare amonitoring plan that will verify whether the operator is meeting the performancerequirements set in the RFP. Key areas of focus of the monitoring plan will includecustomer service and communications, safety and compliance, maintenance andrepair, fleet rebalancing, etc…
o The RFP Framework will include detailed data requirements for the operatorbased on the monitoring plan. The operator will also be asked to describe thedata procedures and confirm their alignment with the requirements.
o In order to incentivize compliance, the operator will be charged a refundabledeposit. Liquidated damages will be withdrawn from the deposit. For example, the operator will be charged a flat rate any time City or
Region staff are dispatched to remove an improperly parked vehicle.Where relocated vehicles will be parked by Region/City staff will bedetermined with the selected operator.
o Staff will have the capacity to set-up policy compliance notifications throughPopulus, which will facilitate monitoring and prompt withdrawals from theoperator’s refundable deposit, as appropriate. Staff will follow-up with the operator if key indicators are not meeting the
performance targets. Broader changes to the program would also be
Page 159 of 198
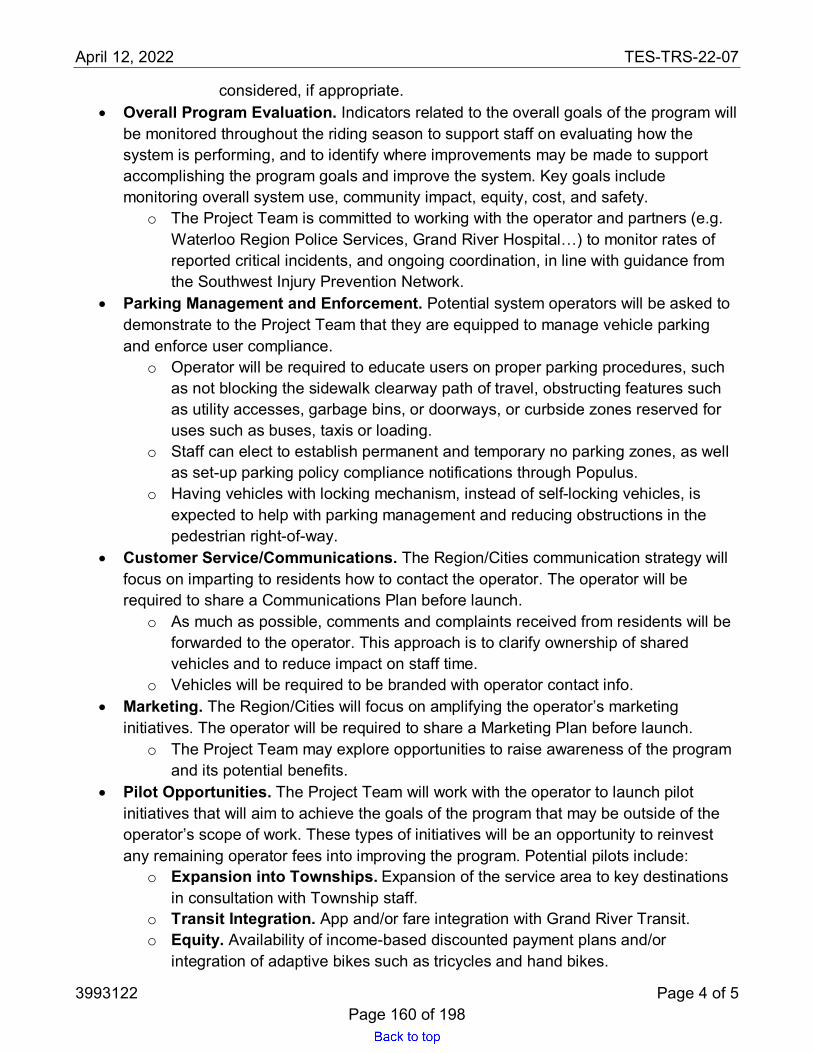
April 12, 2022 TES-TRS-22-07
3993122 Page 4 of 5
considered, if appropriate. • Overall Program Evaluation. Indicators related to the overall goals of the program will
be monitored throughout the riding season to support staff on evaluating how thesystem is performing, and to identify where improvements may be made to supportaccomplishing the program goals and improve the system. Key goals includemonitoring overall system use, community impact, equity, cost, and safety.
o The Project Team is committed to working with the operator and partners (e.g.Waterloo Region Police Services, Grand River Hospital…) to monitor rates ofreported critical incidents, and ongoing coordination, in line with guidance fromthe Southwest Injury Prevention Network.
• Parking Management and Enforcement. Potential system operators will be asked todemonstrate to the Project Team that they are equipped to manage vehicle parkingand enforce user compliance.
o Operator will be required to educate users on proper parking procedures, suchas not blocking the sidewalk clearway path of travel, obstructing features suchas utility accesses, garbage bins, or doorways, or curbside zones reserved foruses such as buses, taxis or loading.
o Staff can elect to establish permanent and temporary no parking zones, as wellas set-up parking policy compliance notifications through Populus.
o Having vehicles with locking mechanism, instead of self-locking vehicles, isexpected to help with parking management and reducing obstructions in thepedestrian right-of-way.
• Customer Service/Communications. The Region/Cities communication strategy willfocus on imparting to residents how to contact the operator. The operator will berequired to share a Communications Plan before launch.
o As much as possible, comments and complaints received from residents will beforwarded to the operator. This approach is to clarify ownership of sharedvehicles and to reduce impact on staff time.
o Vehicles will be required to be branded with operator contact info.• Marketing. The Region/Cities will focus on amplifying the operator’s marketing
initiatives. The operator will be required to share a Marketing Plan before launch.o The Project Team may explore opportunities to raise awareness of the program
and its potential benefits.• Pilot Opportunities. The Project Team will work with the operator to launch pilot
initiatives that will aim to achieve the goals of the program that may be outside of theoperator’s scope of work. These types of initiatives will be an opportunity to reinvestany remaining operator fees into improving the program. Potential pilots include:
o Expansion into Townships. Expansion of the service area to key destinations in consultation with Township staff.
o Transit Integration. App and/or fare integration with Grand River Transit.o Equity. Availability of income-based discounted payment plans and/or
integration of adaptive bikes such as tricycles and hand bikes.
Page 160 of 198

April 12, 2022 TES-TRS-22-07
3993122 Page 5 of 5
Appendix B. Map of Proposed Service Areas from 2020 Shared Micromobility Feasibility Study
Page 161 of 198

Report: TES-TRP-22-02
Document Number: 3930774 Page 1 of 5
Region of Waterloo
Transportation and Environmental Services
Transportation
To: Chair Tom Galloway and Members of the Planning and Works Committee
Meeting Date: April 12, 2022
Report Title: Frederick Street / Benton Street (Courtland Avenue East to Lancaster Street) Cycling Facility Plan
1. Recommendation:
For information.
2. Purpose / Issue:
At the November 17, 2021 Council Meeting, staff was directed to examine the feasibility of a concept of improved cycling facilities along the Frederick Street / Benton Street corridor from Courtland Avenue East to Lancaster Street (https://betterbenton.netlify.app/), submitted by a member of the public. Staff examined the concept as submitted, as well as other potential concepts for this corridor, and conducted preliminary assessments of the feasibility of each concept. This Report provides a summary of this work to date and discusses how these concepts will be further reviewed as part of upcoming capital work along this corridor.
3. Strategic Plan:
Improvements to active transportation along the Frederick Street / Benton Street corridor are supported by the following Sustainable Transportation Strategic objectives:
Objective 2.1: Enhance the transit system to increase ridership and ensure it is accessible and appealing to the public.
Objective 2.3: Increase participation in active forms of transportation (cycling and walking).
Objective 2.4: Improve road safety for all users - drivers, cyclists, pedestrians, horse and buggies.
Objective 3.1: Reduce greenhouse gas emissions.
Page 162 of 198

April 12, 2022 Report: TES-TRP-22-02
3930774 Page 2 of 5
4. Key Considerations:
a) General
Within the entire corridor on Frederick Street / Benton Street from Courtland Avenue to Lancaster Street, the current Transportation Capital Program includes full reconstruction of Benton Street, from Courtland Avenue to Charles Street and Frederick Street, from Duke Street to Lancaster Street. Both of these capital projects are scheduled for reconstruction in 2026 with planning and design commencing in 2023. The middle section, on Frederick Street between Charles Street and Duke Street, is currently not included in the current Transportation Capital Program because it was recently fully reconstructed as part of the ION project. For planning purposes, staff see the incorporation of all three sections into one larger project as a great opportunity to explore the goal of providing a high-quality All Ages and Abilities (AAA) cycling facility along this entire corridor.
Within the entire corridor, the most critical section is between Charles Street and Duke Street as it is constrained by the location of the existing ION station (platform and tracks) and other critical infrastructure such as the existing pedestrian overpass, Speakers Corner and the Cenotaph. The design of the corridor outside of the critical section would be influenced by the design of this critical section, but would be less challenging. Staff reviewed and assessed the concept provided by the resident as well as two other concepts, with a view to how they could be implemented on a permanent basis as part of the upcoming reconstructions. At a very preliminary level, staff also assessed the potential to implement either option on a low-cost temporary interim basis in order to get this cycling facility “online” earlier.
In terms of design, staff considered fully raised cycling facilities for the entire corridor, from Courtland Ave East to Lancaster Street East, including the critical section, as part of any permanent implementation. This design would require moving the curbs and the associated underground utilities, including the catch basins. Depending on the selected concept, there could be a need for changes to turning restrictions, transit stops and routes, location and operation of traffic signals, and some impacts of the LRT infrastructure.
b) Key Concepts Reviewed by Staff
The key concepts reviewed by staff, illustrated in Appendix A, are:
Alternative A1, as submitted by a member of the public, has a two-directional separated cycling facility on the north (downtown) side of the corridor, between the existing sidewalk and the light rail transit (LRT) tracks. The two-directional vehicular traffic would be accommodated on the other side of the LRT tracks, by converting one of the two eastbound traffic lanes to a westbound traffic lane.
Page 163 of 198

April 12, 2022 Report: TES-TRP-22-02
3930774 Page 3 of 5
Alternative A2 has a two-directional separated cycling facility on the south (Hans Haus) side of the corridor, between the existing sidewalk and the light rail transit (LRT) tracks. The two-directional vehicular traffic would be accommodated on the other side of the LRT tracks, the downtown side, by converting one of the two westbound traffic lanes to an eastbound lane.
Alternative B has single-directional separated cycling facilities on each side of the corridor. Sidewalks would be retained on both sides of the street, and there are no significant changes to existing traffic operations other than the reduction of the number of traffic lanes along Frederick Street and Benton Street from two to one in both directions.
c) Preliminary Assessments of Concepts
Alternative A1 (two-way cycling facility on north side) requires significant changes to the operation of bus transit, the LRT, and general traffic. Depending on the design, either turning movements from the Frederick Street / Benton Street corridor would have to be restricted for vehicles, including buses, or significant changes to the current operation of signals would have to be made. Traffic signals from Charles Street East to Duke Street are currently providing a high level of signal priority to minimize intersection delay and travel time variability for LRT vehicles. It is paramount that this level of transit signal priority is maintained, but this would be very challenging under the geometry modifications proposed in Alternative A1 with all the existing turning movements.
Alternative A1 requires construction at every signalised intersection for both the interim and permanent designs. The median islands and signal infrastructure would have to be moved at Courtland Avenue East, Charles Street East, King Street, Duke Street and Weber Street. The LRT catenary infrastructure would also be impacted by these changes. New bus platforms would have to be installed at every bus stop in the westbound direction and the curbs would need to be adjusted at a number of locations to accommodate the permitted turning movements. New curbs would need to be installed from Courtland Ave East to Charles Street East and from Duke Street to Weber Street. A critical constraint for this alternative is the position of the existing ION platform with respect to the existing piers for the pedestrian overpass, which leaves insufficient space for two opposing vehicle lanes (one in each direction) on the south side of the platform.
Alternative A2 (two-way cycling facility on south side), has very similar challenges as Alternative A1. In addition, a short section just west of King Street, has currently only one lane, thus encroaching into the current pedestrian space, specifically the Speakers Corner area, would be required.
Alternative B (one-way cycling facilities on each side), could be implemented with significantly less impacts on the overall operation within the corridor. Most or all turning
Page 164 of 198

April 12, 2022 Report: TES-TRP-22-02
3930774 Page 4 of 5
movements could be maintained and there would be no need for a complete change in the set-up of traffic signals. Alternative B would still require construction along the entire corridor.
All three alternatives reduce the vehicle-carrying capacity of the roadway, but they increase the person-carrying capacity of the corridor as cycling lanes can carry more people than vehicular lanes. While the provision of vehicle-carrying capacity along this corridor is not the top priority, the ability for Grand River Transit (GRT) buses and ION to circulate reliably is a top priority. The section between Charles Street East and Duke Street is an important GRT corridor and Alternative B would have less impact on the operation of current GRT bus routes.
The implementation of either alternative would have a significant capital cost. Many of the required changes would apply for both the interim and the permanent designs. The above assessment was based on a preliminary analysis of only three alternatives and the focus has been on the most constrained section between Charles Street East and Duke Street. The list of technical and operational challenges is not comprehensive, but it is sufficient to conclude that Alternatives A1 and A2 are likely not the best choices and the selection of the most appropriate concept and design within the critical section will require more detailed analysis and design work.
5. Background:
The need for separated cycling facilities in the Frederick Street / Benton Street corridor from Courtland Avenue East to beyond Lancaster Street was identified in the 2018 Regional Transportation Master Plan (RTMP) as follows:
• Courtland Avenue East to Charles Street East – trail (boulevard or off-road facility);• Duke Street to Lancaster Street East– trail (boulevard or off-road facility);• East Avenue to Ann Street – separated bike lane; and• Ann Street to River Road East – bike lane with potential upgrade to protected
facility.
The 2018 RTMP did not identify the section between Charles Street East and Duke Street for cycling improvements, because of the need to accommodate the LRT tracks and station, pedestrians, vehicles, and bus transit circulation in this relatively narrow cross section.
The current ten year Capital Infrastructure Program includes two sections in this corridor to be rebuilt:
• Benton Street from Courtland Avenue East to Charles Street East: Design –2024; Implementation – 2026; and
• Frederick Street from Duke Street to Lancaster Street: Design – 2023;Implementation – 2026.
Page 165 of 198
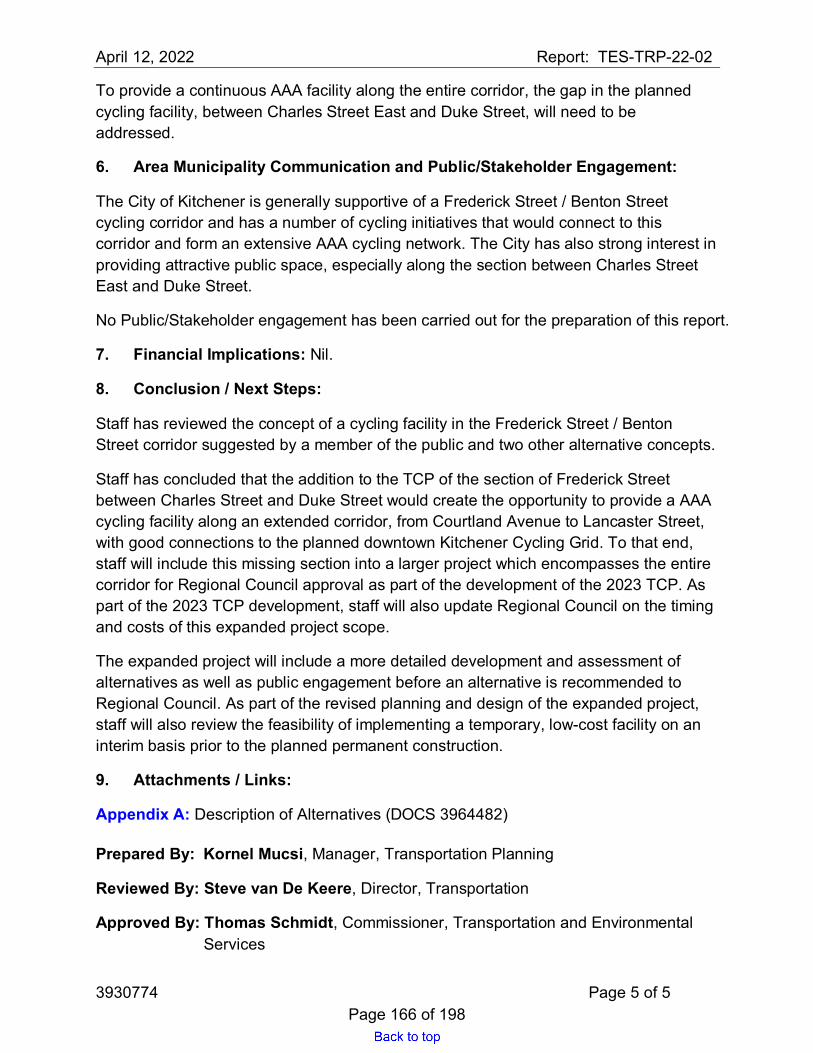
April 12, 2022 Report: TES-TRP-22-02
3930774 Page 5 of 5
To provide a continuous AAA facility along the entire corridor, the gap in the planned cycling facility, between Charles Street East and Duke Street, will need to be addressed.
6. Area Municipality Communication and Public/Stakeholder Engagement:
The City of Kitchener is generally supportive of a Frederick Street / Benton Street cycling corridor and has a number of cycling initiatives that would connect to this corridor and form an extensive AAA cycling network. The City has also strong interest in providing attractive public space, especially along the section between Charles Street East and Duke Street.
No Public/Stakeholder engagement has been carried out for the preparation of this report.
7. Financial Implications: Nil.
8. Conclusion / Next Steps:
Staff has reviewed the concept of a cycling facility in the Frederick Street / Benton Street corridor suggested by a member of the public and two other alternative concepts.
Staff has concluded that the addition to the TCP of the section of Frederick Street between Charles Street and Duke Street would create the opportunity to provide a AAA cycling facility along an extended corridor, from Courtland Avenue to Lancaster Street, with good connections to the planned downtown Kitchener Cycling Grid. To that end, staff will include this missing section into a larger project which encompasses the entire corridor for Regional Council approval as part of the development of the 2023 TCP. As part of the 2023 TCP development, staff will also update Regional Council on the timing and costs of this expanded project scope.
The expanded project will include a more detailed development and assessment of alternatives as well as public engagement before an alternative is recommended to Regional Council. As part of the revised planning and design of the expanded project, staff will also review the feasibility of implementing a temporary, low-cost facility on an interim basis prior to the planned permanent construction.
9. Attachments / Links:
Appendix A: Description of Alternatives (DOCS 3964482)
Prepared By: Kornel Mucsi, Manager, Transportation Planning
Reviewed By: Steve van De Keere, Director, Transportation
Approved By: Thomas Schmidt, Commissioner, Transportation and Environmental Services
Page 166 of 198
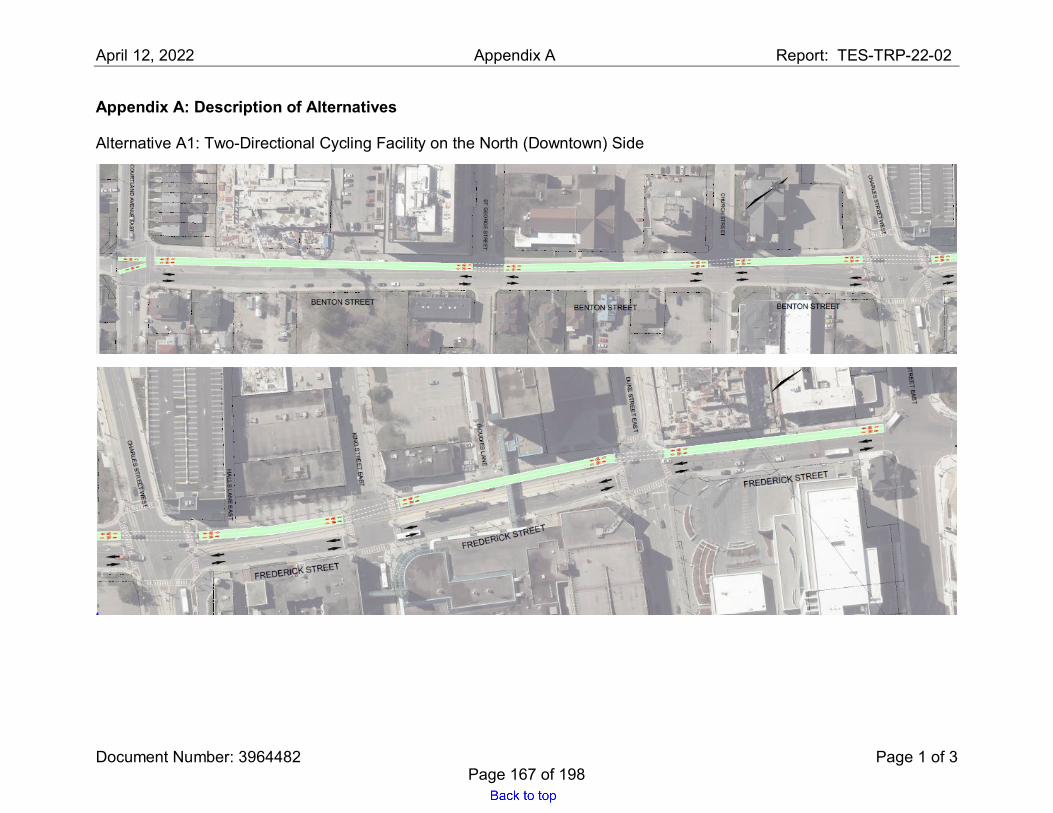
April 12, 2022 Appendix A Report: TES-TRP-22-02
Document Number: 3964482 Page 1 of 3
Appendix A: Description of Alternatives
Alternative A1: Two-Directional Cycling Facility on the North (Downtown) Side
Page 167 of 198

April 12, 2022 A-2 Report: TES-TRP-22-02
Document Number: 3964482 Page 2 of 3
Alternative A2: Two-Directional Cycling Facility on the South Side
Page 168 of 198
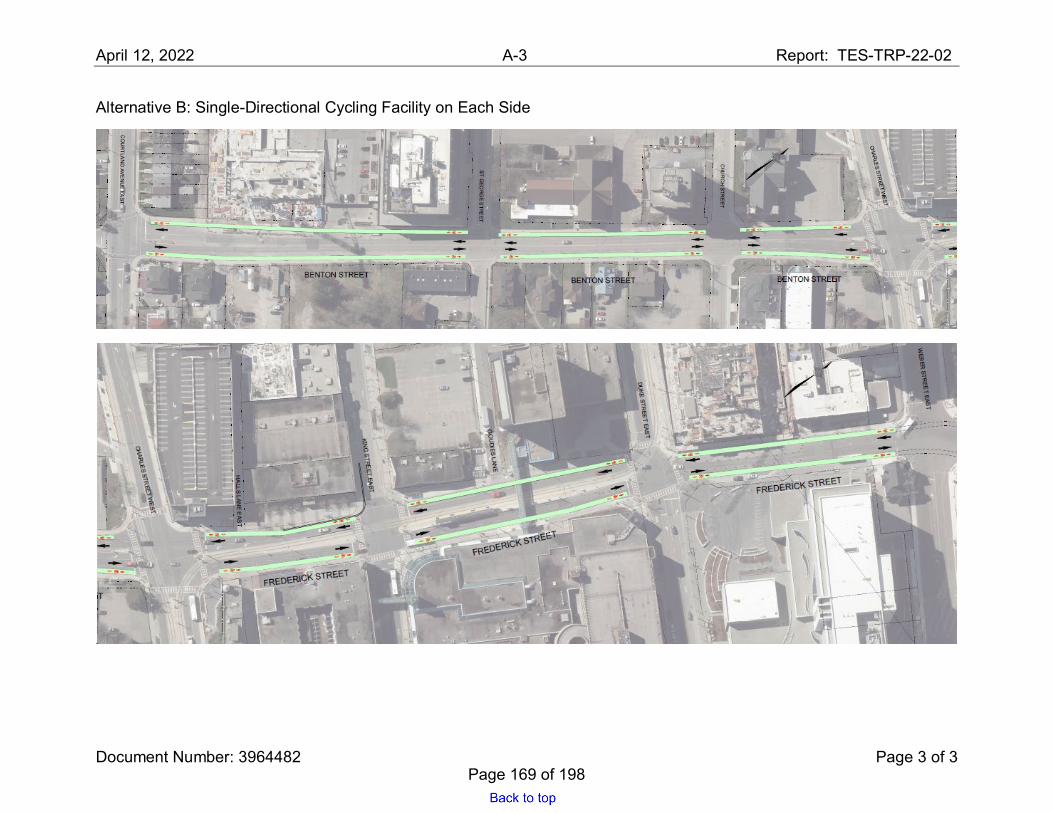
April 12, 2022 A-3 Report: TES-TRP-22-02
Document Number: 3964482 Page 3 of 3
Alternative B: Single-Directional Cycling Facility on Each Side
Page 169 of 198
Report: TES-TRP-22-03
Document Number: 3968189 Page 1 of 4
Region of Waterloo
Transportation and Environmental Services
Transportation
To: Chair Tom Galloway and Members of the Planning and Works Committee
Meeting Date: April 12, 2022
Report Title: Review of Iron Horse Trail Crossings of Regional Roads, in the City of Kitchener
1. Recommendation:
That the Regional Municipality of Waterloo approve the installation of a Level 2 Pedestrian Crossover – Type C, on Borden Avenue (Regional Road 66) at the Iron Horse Trail Crossing, in the City of Kitchener, by amending the Region’s Traffic and Parking By-law 16-023, as amended, to add to Schedule 10, Level 2 Pedestrian Crossover, as outlined in Report TES-TRP-22-03, dated April 12, 2022.
2. Purpose / Issue:
In collaboration with the City of Kitchener’s Active Transportation Planning team, with a goal to enhance service for users of the Iron Horse Trail, Regional staff reviewed the addition of traffic control at five crossing locations:
• Victoria Street;• Queen Street;• Courtland/Stirling Avenues intersection;• Borden Avenue; and• Ottawa Street.
This report serves to provide a summary of these traffic-control assessments and staff’s recommendations and planned actions.
3. Strategic Plan:
The report supports Strategic Objective: 2.3, Increase participation in active forms of transportation (cycling and walking).
The installation of a Level 2 PXO on Borden Avenue and the installation of a Pedestrian / Cyclist Traffic Signal on Queen Street supports the Strategic Imperative of Climate Action.
Page 170 of 198

April 12, 2022 Report: TES-TRP-22-03
3968189 Page 2 of 4
4. Key Considerations:
a) General
The Iron Horse Trail provides a scenic and historic route linking the cities of Kitchener and Waterloo. A part of the Trans Canada Trail, the Iron Horse Trail is 5.5 kilometres in length, connecting Waterloo Park to Victoria Park and uptown Waterloo to downtown Kitchener. The Iron Horse Trail crosses many Regional roads along its path from Ottawa Street in Kitchener to William Street in Waterloo, including Borden Avenue, Queen Street, Courtland Avenue and Victoria Street.
Criteria used to establish the need for additional control for trail users includes a review of pedestrian volume, delay to those pedestrians crossing, vehicular traffic volume and a detailed assessment of the roadway characteristics. In general, to consider additional pedestrian control, a minimum of 100 pedestrians crossing the roadway must be observed during the highest 8-hour period.
b) Ottawa Street Crossing
Observations on August 26, 2021 show that there were 16 pedestrian/cyclists crossing Ottawa Street at the Iron Horse Trail crossing over an 8 hour period. As such, no additional control is warranted at this time. Regional staff have scheduled an additional study to be completed in 2022 to reassess the merits of either a Level 2 Pedestrian Crossover or a pedestrian/cyclist traffic signal at this location.
c) Borden Avenue Crossing
Staff surveyed pedestrian and vehicular volumes on Borden Avenue at the Iron Horse Trail crossing; the survey observed that 66 pedestrians and 94 cyclists crossed Borden Avenue during an 8-hour period. Applying the pedestrian volumes to the Region’s warrant for a Level 2 PXO, confirms that pedestrians crossing Borden Avenue at the Iron Horse Trail crossing warrants a Level 2 PXO, Type C.
A Level 2 PXO, Type C consists of signs, pavement marking and rapid rectangular flashing beacons. Pedestrians may activate the beacons to alert motorists when they intend to cross Borden Avenue. Appendix A includes a location diagram and Appendix B includes a graphical depiction of a Level 2 PXO, Type C.
d) Courtland/Stirling Intersection and Victoria Street Crossings
Regional staff does not recommend a separate Level 2 Pedestrian Crossover nor a separate Pedestrian/Cyclist Traffic Signal at the Courtland/Stirling intersection, nor on Victoria Street just west of Strange Street / West Avenue, because adjacent traffic control signals are situated less than 100m away from these crossings. Provincial guidelines recommend that Level 2 Crossings or Pedestrian Traffic Signals not be installed when an adjacent traffic signal or controlled crossing is less than 200m away to
Page 171 of 198

April 12, 2022 Report: TES-TRP-22-03
3968189 Page 3 of 4
avoid potential operational and safety concerns. Given this constraint, Regional staff are in the process of redesigning the connection between the trail and the existing signalized intersection at Courtland Avenue and Stirling to include a new multi-use trail connection and cyclist crossrides. It is anticipated that construction will begin in July 2022. Regional staff will initiate a review of Victoria Street at Strange Street / West Avenue for similar enhancements / opportunities.
e) Queen Street Crossing
A review of the Queen Street/Iron Horse Trail crossing shows that there was a combined total of 880 pedestrians and cyclists crossing Queen Street at the Iron Horse Trail, with 316 of those users delayed greater than 10 seconds. Combining these active modes of travel with vehicular volume shows that a pedestrian / cyclist traffic control signal is warranted. Staff are working with the Railway Authority to implement a signals interconnect system with the nearby railway signal located west of the Iron Horse Trail crossing.
5. Background:
As per current practice, where new traffic control signals meet warrants as per Regional policy, staff generally proceed to implementation without Council approval. For other types of traffic-control changes, such as those requiring amendments to the Region’s Traffic and Parking By-Law (example: Level 2 Pedestrian Crossover), staff are required by policy to undertake public consultation and provide a recommendation to Regional Council for approval.
6. Area Municipality Communication and Public/Stakeholder Engagement:
City of Kitchener staff are in full support of additional control on both Borden Avenue and Queen Street where they meet the Iron Horse Trail. Regional staff initiated a public survey on February 14, 2022 for a period of 2 weeks to receive feedback on the potential installation of a Level 2 PXO on Borden Avenue. Regional staff received a total of 11 survey responses. Of the 11 responses received, nine are in support of the Level 2 Pedestrian Crossover, one was neutral, and one was opposed.
7. Financial Implications:
The estimated costs for the Level 2 Pedestrian Crossover on Borden Avenue and the pedestrian/cyclist traffic signals on Queen Street are $17,000 and $135,000, respectively. The Region’s Approved 2022-2031 Transportation Capital Program includes a budget of $1,225,000 in 2022 for New Traffic Control Installation (Project # 07478) to be funded from the Roads Regional Development Reserve Fund. The costs for both installations are accommodated in this project budget.
Page 172 of 198

April 12, 2022 Report: TES-TRP-22-03
3968189 Page 4 of 4
8. Conclusion / Next Steps:
Based on staff’s review, a Level 2 PXO, Type C, is warranted and recommended on Borden Avenue at the Iron Horse Trail crossing. Additionally, a pedestrian/cyclist traffic control signal will be implemented on Queen Street at the Iron Horse Trail crossing. Both installations are planned to be implemented in 2022. The installation of these new traffic control facilities would benefit the community in the following ways:
• Provide pedestrians and cyclists with a designated crossing;• Serve to enhance pedestrian and cyclist mobility;• Encourage active forms of transportation;• Enhance connectivity;• Encourage pedestrians and cyclists to cross where they could best be seen; and• Remind motorists to share the road with pedestrians and cyclists and that
pedestrians should be expected.
Staff, as part of further work on some of the other crossing locations, will do the following:
• Undertake a new study in 2022 to reassess the merits of either a Level 2Pedestrian Crossover or a pedestrian/cyclist traffic signal at the Ottawa Streetcrossing;
• Continue with a re-design and planned implementation of changes to theCourtland / Stirling crossing location to incorporate crossrides at the existingtraffic signals; and
• Undertake a similar review of the signalized intersection at Victoria / StrangeStreets to asses the ability to incorporate crossrides at that location, in lieu ofadditional traffic control at the existing pedestrian refuge island.
9. Attachments / Links:
Iron Horse Trail with Crossing Locations (DOCS 3968768) Appendix A:
Appendix B: Signs and Pavement Markings for the Proposed Level 2 Pedestrian Crossover – Type C at the Iron Horse Trail on Borden Avenue (DOCS 3968768)
Prepared By: Satinderjit Bahia, Engineering Technologist (Traffic)
Bob Henderson, Manager, Transportation Engineering
Reviewed By: Steve van De Keere, Director, Transportation
Approved By: Thomas Schmidt, Commissioner, Transportation and Environmental Services
Page 173 of 198
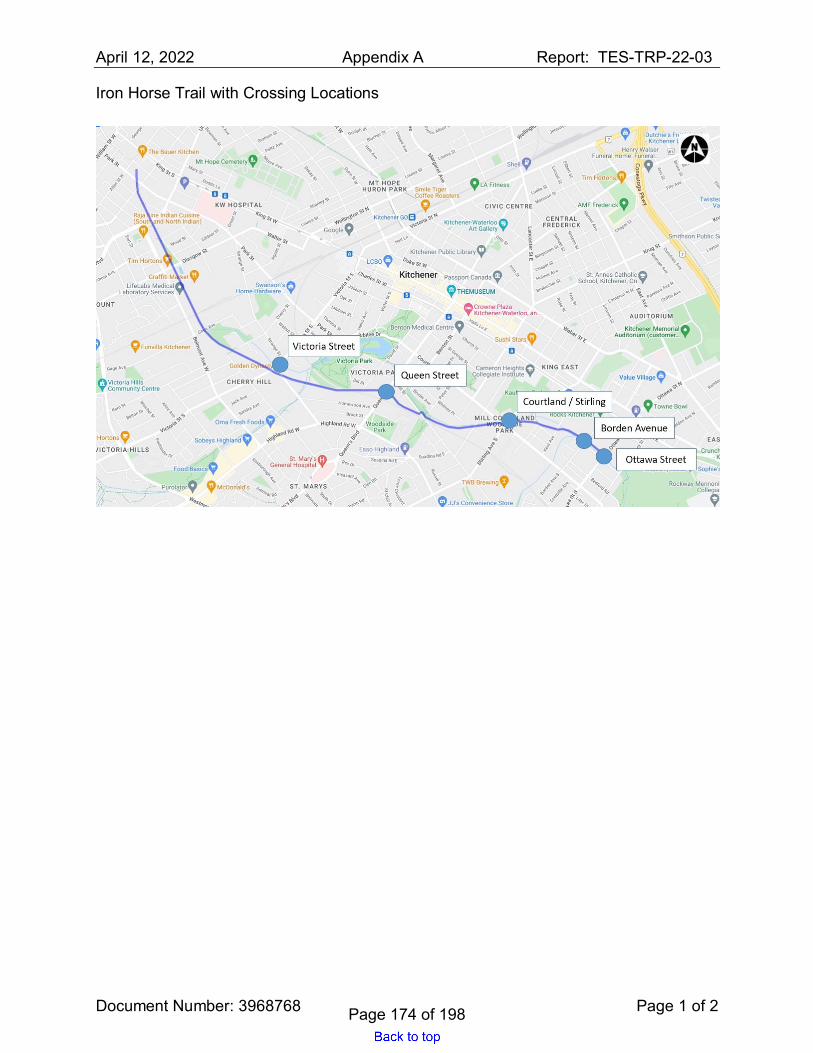
April 12, 2022 Appendix A Report: TES-TRP-22-03
Document Number: 3968768 Page 1 of 2
Iron Horse Trail with Crossing Locations
Page 174 of 198

April 12, 2022 Appendix B Report: TES-TRP-22-03
Document Number: 3968768 Page 2 of 2
Signs and Pavement Markings for the Proposed Level 2 Pedestrian Crossover – Type C at the Iron Horse Trail on Borden Avenue
Page 175 of 198

Report: TES-WMS-22-02
Document Number: 3977941 Page 1 of 4
Region of Waterloo
Transportation and Environmental Services
Waste Management Division
To: Chair Tom Galloway and Members of the Planning and Works Committee
Date: April 12, 2022
Report Title: Reduction in the Garbage Limit for Single-Family Homes
1. Recommendations:
That the Regional Municipality of Waterloo reduce the residential bi-weekly garbage limit from four to three bags/containers starting October 17, 2022, which coincides with Waste Reduction Week, as outlined in Report: TES-WMS-22-02 dated April 12, 2022.
2. Purpose / Issue:
The purpose of this report is to present a new waste collection policy initiative, intended to increase waste diversion from the Regional landfill.
3. Strategic Plan:
This supports the Corporate Strategic Plan’s Environment and Climate Action Focus Area Strategic Objective 3.3: Direct more waste away from landfill, improve recycling and better manage organic waste. This also aligns with the Strategic Imperative of Climate Action.
4. Key Considerations:
In March 2017, the Region implemented a new standard level of waste collection service across all seven-area municipalities, which included the collection of garbage limited to four bags/containers bi-weekly for single residential homes. The community has supported this change with green bin organics diversion rising by 170 per cent, blue box diversion up five per cent and yard waste diversion increased by 36 per cent, while at the same time, garbage tonnage has reduced by 26 per cent.
At the time of award of the collection contract, Council endorsed a reduction in the bi-weekly garbage bag/container limit to three bags within the first two years of the new waste contract, to further enhance waste diversion. A 2019 waste audit reported that residential garbage contains, on average, 13 per cent blue box materials and 46 per cent green bin organics, which further confirmed the opportunity to divert even more waste from landfill.
Page 176 of 198

April 12, 2022 TES-WMS-22-02
3977941 Page 2 of 4
As such, the Region’s 2019 to 2023 Strategic Plan, approved in November 2019, included an objective to reduce the curbside garbage limit from the current four to three bags/cans bi-weekly, in accordance with the Environment and Climate Action focus area. Due to various resourcing issues and more recently implications due to the Covid-19 pandemic, we delayed the implementation of the bag/container reduction. The Province is also implementing significant policy changes related to Extended Producer Responsibility (EPR) programs such as the forthcoming transitioning of the Blue Box program to full producer responsibility as well as looking at additional wide ranging policy changes to encourage a hierarchy that prioritizes the prevention/reduction of food waste and could include landfill disposal bans.
These ongoing and proposed provincial initiatives together with curbside waste audit data, identify that a measured approach of reducing the current bag/container limit would continue to improve waste diversion and assist in creating a circular economy. Given the above, staff is of the opinion that the current bi-weekly four bag/container limit be reduced to three, commencing the week of October 17th, 2022, to coincide with waste reduction week and allow sufficient time to promote and assist residents with the change.
The change in garbage limit will impact single family households, including duplexes and townhouse complexes receiving Regional curbside collection services. The majority of these households already set out less than four bags/containers bi-weekly as according to the most recent audits conducted by staff in 15 collection areas, 88 per cent of households place three garbage bags/cans or less at the curb, which is consistent with historical audits conducted prior to awarding the existing collection contract.
Most other Ontario municipalities with garbage bag/can collection and every-other-week collection have lower limits (limits of two in Niagara Region and Barrie, three for Halton Region). Durham Region has a four-bag limit, but has more expensive garbage tags, and like many other municipalities mandates lighter per bag/container weight limits (e.g. 20 kilograms). Some municipalities also limit the number of tagged garbage bags.
5. Background
The Waste Management Master Plan, Waste Reduction and Diversion Study (WRDS) (E13-127 approved by Council in November 20, 2013) was based on extensive research of other municipal programs and best practices, and in consultation with the public. Among its recommendations was to standardize collection programs and limits in all seven-area municipalities, which the Region launched in March 2017. To help residents prepare for and adjust to the standardized waste collection services, the Region distributed over 60,000 Containers Only blue boxes and over 30,000 green bins (2016 to 2017). An enhanced public education campaign introduced educational materials for each household, and increased customer service support including on-
Page 177 of 198

April 12, 2022 TES-WMS-22-02
3977941 Page 3 of 4
street waste collection monitoring and follow-up.
A garbage tag program was also approved (April 12, 2016, TES-WMS-16-03) to increase waste diversion and allow residents who generate more waste to still have a convenient, curbside collection option rather than driving to a waste disposal site. In addition, four times each year the Region offers Double Garbage Days to assist households that may generate extra garbage during holidays and other events, like spring cleaning. During Double Garbage Days residents can set out untagged garbage at twice the limit on their regular garbage collection day after New Year’s, Easter, Thanksgiving, and Christmas.
Approximately: • 8,000 sheets of garbage tags were sold in 2021 (over 40 per cent online, the
remaining through almost 50 Regional and municipal vendors).• 500 residents have been helped through the Medical Exemptions program since it
launched in 2017. Residents with medical conditions which generate unavoidablegarbage receive tags once their applications are approved. Since 2018, on average35 new and 72 renewed applications are approved each year.
• 40 metric tonnes are dropped off each year through the free diaper/incontinenceproducts program.
• The Region offers extensive waste reduction, reuse, and recycling informationand tips on its website, and through social media channels and electronicnewsletters. As well, the Region supports on-site management of waste throughthe Backyard Composting program.
6. Area Municipality Communication and Public/Stakeholder Engagement:
We are developing a comprehensive communications and engagement plan to inform residents and our municipal partners and will include, at a minimum:
• Mail-out to each household affected by this change.• Online information, promotion and educational materials and opportunities including
social media, videos, webinars and presentations.• Notification to all garbage tag vendors, with resources and copies of the updated by-
law.• Establishing two-way communication avenues for residents.
7. Financial Implications:
Given that the majority of households already meet the reduced garbage limit, it is expected that this policy change can be implemented within the existing 2022 Waste Management Division budget. However, additional financial impacts commencing in 2023 related to the need for additional blue boxes/green bins as well as curbside staff/assistance may be
Page 178 of 198
April 12, 2022 TES-WMS-22-02
3977941 Page 4 of 4
necessary. It is envisioned that details on any potential additional costs to support success of the change would be included as part of the 2023 budget process.
8. Conclusion / Next Steps:
Reducing the household garbage limit,
• Advances the Region’s diversion from landfill goal.• Prepares our community for upcoming Provincial waste management initiatives.• Better positions the Region for the next collection contract.
Staff will prepare and launch a phased implementation program:
Phase 1: April to September, 2022: A comprehensive promotion and education campaign will launch that focuses on ways residents can prevent, reuse, and recycle more waste. Each eligible household will receive direct mail postcard. Ads will be put in local newspapers and our ongoing communication channels (website, social media, electronic newsletter, etc.) will be used to increase awareness and engage the community. Staff will maximize opportunities to post videos and conduct/record webinars and other presentations so resources are available on demand. By-law 17-007 will be updated and bag tag vendors will be notified.
Phase 2: October to December, 2022: During Waste Reduction Week (October 17 to 23) the new limit will begin. Staff and collection contractors will monitor set-out and provide educational materials to households over the limit. Radio spots across several stations and television ads will remind residents about the change. Residents will receive a new collection calendar for 2023 in December reinforcing the changed garbage limit. A new four-season waste audit will launch to gather detailed data, which will also be beneficial information for the eventual transition to full producer responsibility of the blue box program.
Phase 3: January, 2023: Starting January 1, 2023, the limit will be enforced. Collection staff will place “Oops” stickers on untagged garbage set out over the limit. Communication will focus on how to be successful in waste reduction, and what to do with uncollected items. Staff will report with updates on the garbage limit and waste audit results.
Attachments / Links: Nil
Prepared By: Kim A. Kidd Kitagawa, Coordinator, Waste Management
Reviewed By: Jon Arsenault, Director, Waste Management Services
Approved By: Thomas Schmidt, Commissioner, Transportation and Environmental Services
Page 179 of 198

Report: TES-DCS-22-10
Document Number: 3965996 Page 1 of 8
Region of Waterloo
Transportation and Environmental Services
Design and Construction
To: Chair Tom Galloway and Members of the Planning and Works Committee
Meeting Date: April 12, 2022
Report Title: Project Update (Noise) – McQueen Shaver Boulevard, Franklin Boulevard Extension, Cambridge and Highland Road, Kitchener
1. Recommendation:
That the Regional Municipality of Waterloo install noise walls on the west side of Franklin Boulevard from Bloomington Road to Carpenter Road and on both sides of Franklin Boulevard from Carpenter Road to the southern City boundary limit, as described in report TES-DCS-22-10, dated April 12, 2022.
2. Purpose / Issue:
Inform Council of updated noise modeling results and recommend installation of noise walls on Franklin Boulevard, and inform Council about the noise modeling on Highland Road.
3. Strategic Plan:
This update supports Strategic Focus Area 5 (Responsive and Engaging Public Service), specifically 5.2 to provide excellent citizen centered services that enhance service satisfaction.
4. Key Considerations:
a) McQueen Shaver Boulevard and Franklin Boulevard Extension
McQueen Shaver Boulevard and the Franklin Boulevard Extension are new roads that were opened at the end of October 2021. Residents in the area contacted the Region with a variety of concerns, particularly outdoor noise levels from traffic. Concerns about traffic noise were also expressed by delegations at a November 9 Committee of the Whole meeting (Report TES-DCS-21-27). Committee directed staff to respond to these concerns at a future meeting.
Public concerns regarding the original noise assessment and staff responses are summarized as follows:
Page 180 of 198
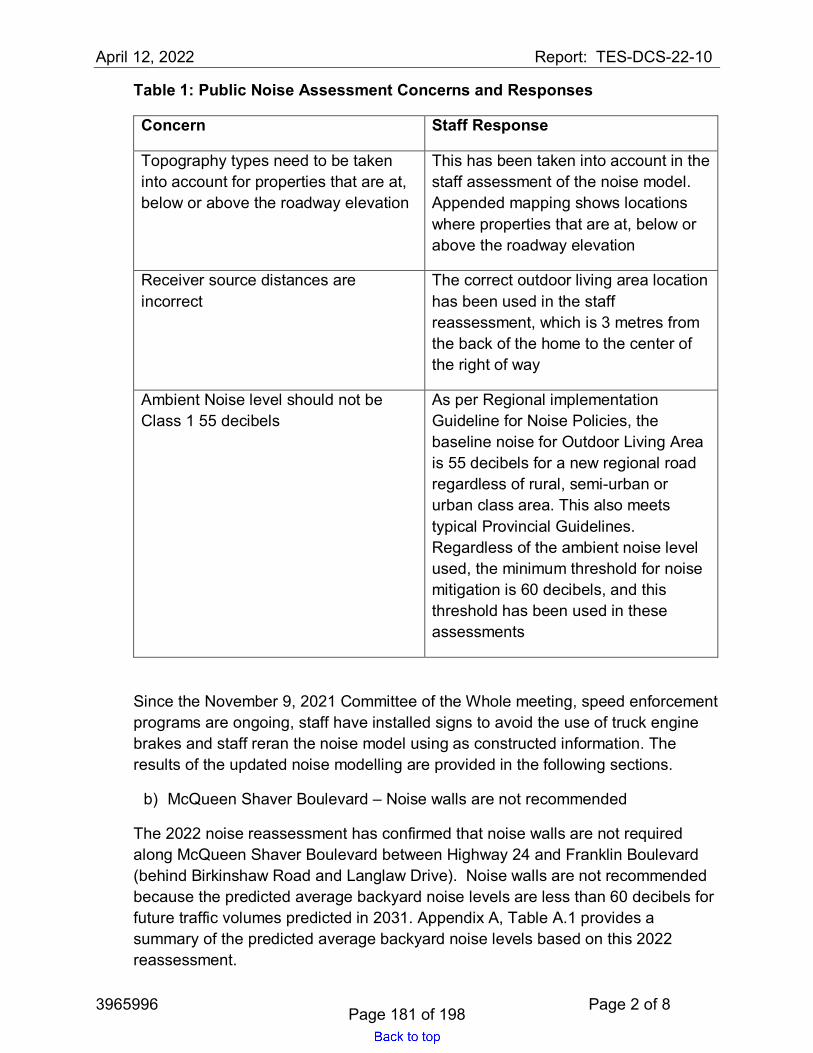
April 12, 2022 Report: TES-DCS-22-10
3965996 Page 2 of 8
Table 1: Public Noise Assessment Concerns and Responses
Concern Staff Response
Topography types need to be taken into account for properties that are at, below or above the roadway elevation
This has been taken into account in the staff assessment of the noise model. Appended mapping shows locations where properties that are at, below or above the roadway elevation
Receiver source distances are incorrect
The correct outdoor living area location has been used in the staff reassessment, which is 3 metres from the back of the home to the center of the right of way
Ambient Noise level should not be Class 1 55 decibels
As per Regional implementation Guideline for Noise Policies, the baseline noise for Outdoor Living Area is 55 decibels for a new regional road regardless of rural, semi-urban or urban class area. This also meets typical Provincial Guidelines. Regardless of the ambient noise level used, the minimum threshold for noise mitigation is 60 decibels, and this threshold has been used in these assessments
Since the November 9, 2021 Committee of the Whole meeting, speed enforcement programs are ongoing, staff have installed signs to avoid the use of truck engine brakes and staff reran the noise model using as constructed information. The results of the updated noise modelling are provided in the following sections.
b) McQueen Shaver Boulevard – Noise walls are not recommended
The 2022 noise reassessment has confirmed that noise walls are not required along McQueen Shaver Boulevard between Highway 24 and Franklin Boulevard (behind Birkinshaw Road and Langlaw Drive). Noise walls are not recommended because the predicted average backyard noise levels are less than 60 decibels for future traffic volumes predicted in 2031. Appendix A, Table A.1 provides a summary of the predicted average backyard noise levels based on this 2022 reassessment.
Page 181 of 198

April 12, 2022 Report: TES-DCS-22-10
3965996 Page 3 of 8
c) Franklin Boulevard Extension – Noise walls are recommended
The 2022 noise reassessment has concluded that noise walls are recommended on both sides of Franklin Boulevard Extension from Carpenter Road southerly to the City boundary limit and on the west side of Franklin Boulevard Extension from Carpenter Road north to Bloomington Drive. Noise walls are recommended because predicted average backyard noise levels exceed 60 decibels for future traffic volumes predicted in 2031. Appendix A, Table A.1 provides a summary of the predicted average backyard noise levels based on this 2022 reassessment.
Noise studies were previously conducted for Franklin Boulevard between Bloomington Drive and the southerly City boundary limit by the developer in 2007 and for the environmental assessment in 2011. Both of these previous noise studies concluded that noise walls were not required along Franklin Boulevard. The 2007 developer noise assessment used projected traffic volumes that were significantly lower than the projected traffic volumes used in the 2011 Environmental Study Report.
In reassessing the 2011 noise study in the 2011 Environmental Study Report, staff identified that the actual distances from the outdoor living areas to the road were less than the distances used in the 2011 Environmental Study Report. Staff also identified that the 2031 average annual daily traffic volume was not correctly input into the noise model in the in the 2011 Environmental Study Report.
Appendix A, Table A.2 includes a summary of the differences from the 2007 Developer’s Noise Assessment, the 2011 Environmental Study Report and the 2022 Regional staff reassessment.
Appendix B includes illustrations to summarize the results of the noise reassessment.
Appendix C describes the development approval process regarding potential noise impacts.
d) Truck Diversion Study
Regional staff are currently undertaking a proposed truck diversion study, at the request of the City of Cambridge. This study will include updated traffic volume forecasts and noise assessments to determine if noise walls would be required along McQueen Shaver Boulevard with a truck diversion in place.
Tree planting and landscaping along McQueen Shaver Boulevard was originally planned for 2022 but will be deferred to 2023 to allow completion of the truck diversion noise assessment.
Page 182 of 198

April 12, 2022 Report: TES-DCS-22-10
3965996 Page 4 of 8
e) Highland Road Noise Modelling - Fischer-Hallman Road to Ira NeedlesBoulevard
At the November 9, 2021 Committee meeting, a resident on Highland Road attended as a delegation and expressed concerns about traffic noise. A specific concern regarding reflection of traffic noise from a building across Highland Road from the resident was expressed. Committee directed staff to respond to this concern at a future meeting.
Previous noise modelling conducted for that section of Highland Road concluded that noise walls were not required in accordance with the Region’s noise policy. Table 1 provides a summary of the predicted average backyard noise levels for preconstruction (2019) and predicted 2032 traffic volumes.
Table 1 - Backyard noise levels on Highland Road
Traffic Volume (AADT)
Predicted Daytime Average Backyard Noise
Level (decibels)
Pre-construction (2019 Actual traffic volume)
13,700 56.8
Noise Wall Trigger (pre-construction plus 5 decibels)
61.8
Predicted for 2032 17,700 58.5
Staff have previously discussed the noise modeling with the resident in 2021 and explained why a noise wall is not required along Highland Road. Staff responded to questions and concerns regarding the forecast traffic volumes used in the noise modelling, as well as concerns about noise reflecting from a building across Highland Road from the resident.
The Stamson modeling software used by the Region only considers the direct impact of traffic noise. Reflected noise from adjacent buildings is not calculated or included in the model or the Region’s noise policy. However, these impacts can be calculated by assuming a direct reflection of noise off the building surface. For this example on Highland Road, the calculated directly reflected noise adds 0.6 decibels to the overall noise level at the designated outdoor living area and still does not meet the requirement for a noise wall. This calculation (0.6 decibels) over-estimates the additional noise because traffic noise does not actually reflect directly off of a building as shown in Figure 1.
Page 183 of 198

April 12, 2022 Report: TES-DCS-22-10
3965996 Page 5 of 8
Figure 1 – Simplified (over-estimated) calculation of reflected noise
5. Background:
a) McQueen Shaver Boulevard and Franklin Boulevard Extension
South Cambridge has experienced rapid residential growth since the early 2000s. As a result, the transportation network required upgrades to meet current demands and accommodate future growth as identified in many studies and policies. For example, the 1994 Cambridge Area Transportation Study and the 1999 Regional Transportation Master Plan both identified the need for an East-West arterial road in the south of Cambridge, connecting to Franklin Boulevard.
The Region of Waterloo commenced an Environmental Assessment for this project in 2007 and completed the study with the filing of the Environmental Study Report in 2011. Following review of a Part II order request, the Ministry of Environment, Conservation and Parks approved the environmental assessment in 2012.
More recently, the City of Cambridge requested that the Region investigate the possibility of implementing a truck diversion in the downtown Galt core.
b) Highland Road from Fischer-Hallman Road to Ira Needles Boulevard
The Environmental Assessment for the widening of Highland Road from Fischer-Hallman Road to Ira Needles Boulevard was approved in 2018. Construction started in 2020 and is planned to be completed in 2022.
6. Area Municipality Communication and Public/Stakeholder Engagement:
a) McQueen Shaver Boulevard and Franklin Boulevard Extension
Page 184 of 198

April 12, 2022 Report: TES-DCS-22-10
3965996 Page 6 of 8
Public engagement was conducted over the course of the Environmental Assessment phase of this project, including:
• Notice of Study Commencement – April 2007• Public Consultation Centre #1 – April 2007• Planning and Works Committee Meeting #1 – June 2007• Public Consultation Centre #2 – June 2008• Affected Property Owner’s Meeting – June 2008• Public Input Meeting #1 – February 2009• Planning and Works Committee Meeting #2 – March 2009• Public Consultation Centre #3 – March 2010• Public Input Meeting #2 – May 2010• Planning and Works Committee Meeting #3 – November 2010• Planning and Works Committee Meeting #4 – February 2011• Planning and Works Committee Meeting #5 – June 2011• Notice of Study Completion – November 2011• Notice to residents for Franklin Boulevard Extension construction – Spring 2017• Notice to residents for McQueen Shaver Blvd construction – Spring 2019• July 2021 to December 2021: Region staff have been communicating with
residents adjacent to this new roadway regarding their noise concerns
A notice has been sent to area residents advising of this report and the recommendation to install noise walls along Franklin Boulevard.
b) Highland Road from Fischer-Hallman Road to Ira Needles Boulevard
Public engagement was conducted over the course of the Environmental Assessment phase of this project between 2015 and 2018.
7. Financial Implications:
A preliminary budget to construct the recommended noise walls along Franklin Boulevard is approximately $2,000,000, subject to engineering design and construction procurement. The 2022-2031 Transportation Capital Plan has a budget of $250,000 in 2022 for South Boundary Rd, Water St to Franklin Blvd (project #07192) funded from Regional Development Charges. This funding should be sufficient to retain a consultant to design the noise walls. The project budget will be updated for final design and construction of noise walls along Franklin Boulevard as part of the 2023 capital budget process.
8. Conclusion / Next Steps:
If approved by Regional Council, staff will retain a consultant to complete the design of the noise walls along Franklin Boulevard this year. Construction of the noise walls along
Page 185 of 198

April 12, 2022 Report: TES-DCS-22-10
3965996 Page 7 of 8
Franklin Boulevard would be planned 2023.
Staff will undertake public consultation about a possible truck diversion in 2022 and provide an update to Council regarding the truck diversion study after completing the public consultation.
9. Attachments / Links:
Appendix A – Noise Reassessment Results
Appendix B - McQueen Shaver Boulevard and Franklin Boulevard Plan and Section Views (Docs # 3986242)
Appendix C - Development approval process regarding potential noise impacts (Docs #3876103)
Appendix D – McQueen Shaver Boulevard and Franklin Boulevard Extension Subdivision Plans (Docs #3994286)
Prepared By: Andrew Doman, Senior Engineer, Design and Construction
Marcos Kroker, Head, Design and Construction
Reviewed By: Phil Bauer, Director, Design and Construction
Approved By: Thomas Schmidt, Commissioner, Transportation and Environmental Services
Page 186 of 198

April 12, 2022 Report: TES-DCS-22-10
3965996 Page 8 of 8
Appendix A – Noise Reassessment Results
Table A.1 – Noise Reassessment Results for 2031 Traffic Volume (AADT)
Location Address 2031 Traffic Volume (AADT)
Noise Wall
Trigger (decibels)
Predicted Daytime Average
Backyard Noise Level (decibels)
Outdoor Backyard
Living Area Distance
from Road (metres)
McQueen Shaver Boulevard A 151 Birkinshaw Road 13,000 60 57.88 42 B 129 Langlaw Drive 13,000 60 59.31 47 C 173 Langlaw Drive 13,000 60 57.67 52 D 257 Langlaw Drive 13,000 60 57.74 47 E 345 Langlaw Drive 13,000 60 57.61 49 F 439 Langlaw Drive 13,000 60 57.61 50 Franklin Boulevard Extension G 7 Draper Court 10,000 60 61.18 23 H 187 Bailey Drive 10,000 60 61.55 22 I 72 Yeaman Driver 10,000 60 61.14 22
Table A.2 – Franklin Boulevard Extension – Bloomington to Southern City Boundary Noise Study Traffic Volumes (AADT) and Outdoor Living Area (OLA) Parameters
Noise Report Year 2031 Traffic Volume (AADT)
Outdoor Backyard
Living Area Distance from Road (metres)
Developer 2007 4,600 21 Environmental Study
Report 2011 8,500 29
Staff Reassessment 2022 10,000 22 to 23
Staff noted that the 2007 developer noise assessment used projected traffic volumes (4,600) that were significantly lower than the projections from the 2011 Environmental Study Report. Staff also determined that, although the 2011 consultant’s noise assessment report correctly stated that the 2031 projected traffic volume was 10,000, the 2021 projected traffic volume of 8,500 was incorrectly input into the noise calculations. Staff also determined that the actual outdoor living area distance from the road (22 to 23 metres) was less than the distance used in the 2011 Environmental Study Report (29 metres).
Page 187 of 198

TES-DCS-22-10
Document Number: 3986242 Page 1 of 4
Appendix B - McQueen Shaver Plan and Section Views
Page 188 of 198

April 12, 2022 TES-DCS-22-10
3986242 Page 2 of 4
Page 189 of 198

April 12, 2022 TES-DCS-22-10
3986242 Page 3 of 4
Page 190 of 198

April 12, 2022 TES-DCS-22-10
3986242 Page 4 of 4
Page 191 of 198

TES-DCS-22-10
Document Number: 3876103 Page 1 of 6
Appendix C - Development approval process regarding potential noise impacts
Background Information on Subdivisions Adjacent to Regional Road 81 (McQueen Shaver Boulevard) and Regional Road 36 (Franklin Boulevard extension)
Request: Provide an overview of the development approval process regarding dealing with noise impacts on new development.
Response:
Process from 1993 until Today for residential Plan of Subdivision:
1. Developer submits a pre-submission consultation request to planning approvalauthority (Region of Waterloo in this case).
2. Region of Waterloo staff provides comments based on the submission andidentify if an Environmental Noise Study is required based on MECP NPC-300noise guideline, Implementation Guideline for Noise Policies and the RegionalOfficial Plan.
3. If required, an Environmental Noise Study is completed using the Implementationguideline by a Regionally pre-approved Noise Consultant on behalf of thedeveloper for the proposed development based on a 10-year traffic projection.Passive noise control measures such as building layout or setbacks arepreferred means of noise mitigation over use of noise walls.
4. The Environmental Noise Study is then submitted to Region of Waterloo staff insupport of a Complete Application for the Plan of Subdivision.
5. The Environmental Noise Study is circulated to the necessary Region ofWaterloo staff for review and comments.Region of Waterloo staff work with the developer and the Noise Consultant towork out any big issues (if any) related to the Environmental Noise Study. Wherebuilding envelopes are not known, the Study is completed at time of Site Planapplication.
6. The recommendations of the Environmental Noise Study are implementedthrough Regional Conditions of Draft Approval for the Plan of Subdivision.
7. Where necessary, the Regional Conditions are secured in a registereddevelopment Agreement between the Region of Waterloo and the Developer andcan include:
a. Noise Warning Clauses for specific properties.b. Physical outdoor mitigation measures such as noise walls, indoor
ventilation requirements, and special building components such aswindow glazing and exterior wall requirements.
Page 192 of 198

April 12, 2022 TES-DCS-22-10
3876103 Page 2 of 6
Process 1985-1993 for residential Plans of Subdivision:
1. Prior to 1993, preliminary noise assessments were undertaken in-house by Transportation Planning staff using the Regional Implementation Guideline.
2. Where it was determined outdoor physical noise mitigation was not required (i.e., where predicted noise levels do not exceed 60 dBA), a noise study was not required. Rather, passive noise control measures were imposed as conditions of draft approval for the subdivision.
Where a preliminary noise assessment determined the predicted noise levels exceed 60 dBA, a noise study must be completed by the applicant using the Implementation Guideline, and approved by the Region.
3. Implementation of the approved noise study is similar to above requirements.
Page 193 of 198

April 12, 2022 TES-DCS-22-10
3876103 Page 3 of 6
Inventory of Development Approval Conditions for Subdivisions and Confirmed Actions for Subdivisions along McQueen Shaver Boulevard and Franklin Boulevard. Subdivisions are listed out going from West to East.
A. 30T-05102 (Plan 58M-593) – Chrisview Custom Homes Ltd.
• Noise related development approval condition can be found in Subdivision Agreement between the City of Cambridge and Chrisview Custom Homes Ltd. Specifically Schedule “F”. Subdivision Agreement can be found in DOCs #3880441 and the Legal Plan 58M-593 showing the lots can be found in DOCs #3880600.
o Lots 11 to 24 be constructed with a forced air-ducted heating system suitably sized and designed to permit the future installation of a central air conditioning system by the residents.
o For Lots 21 to 24 Noise Warning Clause Type C related to Highway 24 (Water Street), with an additional sentence stating that “and the lands have been developed such that noise attenuation features have been included.”
o For Lot 18 Noise Warning Clause Type C related to Highway 24 (Water Street) and the future South Boundary Road, with an additional sentence stating that “and the lands have been developed such that noise attenuation features have been included on a portion of the lands.”
o For Lots 19 to 20 Noise Warning Clause Type C related to Highway 24 (Water Street) and future South Boundary Road, with an additional sentence stating that “and the lands have been developed such that noise attenuation features have been included.”
o For lots 11 to 17 Noise Warning Clause Type C related to future South Boundary Road.
o For Lots 18 to 24 Noise Setback Clause stating that a minimum setback of 13m is required from the westerly facing and south-westerly facing rear dwelling foundation wall to the rear property line as per the noise study. Increasing the setbacks was done to eliminate the need for a noise wall.
o For Lots 11 to 17 Noise Setback Clause stating that a minimum setback of 9m is required from the southerly facing rear dwelling foundation wall to the rear property line as per the noise study. Increasing the setbacks was done to eliminate the need for a noise wall.
B. 30T-89029 Phase 6 (Plan 58M-255) – Cambridge Taylor Holdings Inc.
• Noise related development approval conditions can be found in Legal Agreement (LT0096214) between the Region of Waterloo and Cambridge-Taylor Holdings Inc. The Legal Agreement can be found in DOCs #3878830 and the Legal Plan showing the lots can be found in DOCs #3878833.
Page 194 of 198

April 12, 2022 TES-DCS-22-10
3876103 Page 4 of 6
o Noise Warning Clause Type A related to Highway 8 By-pass was registered on Title for Lots 1 to 14.
• Original subdivision design used 45.72m (150ft) lots backing onto Highway 8 By-pass to allow for noise attenuation.
C. 30T-89029 Phase 4 (Plan 58M-176) – Cambridge Taylor Holdings Inc.
• Noise related development approval condition can be found in Subdivision Agreement (Instrument No. LT0055205) between the Region of Waterloo and Cambridge-Taylor Holdings Inc. The Legal Agreement can be found in DOCs #3878957 and the Legal Plan showing the lots can be found in DOCs #3878984.
o Noise Warning Clause Type A related to Highway 8 By-pass was registered on Title for Lots 42 to 48 and Block 49.
• Original subdivision design used 45.72m (150ft) lots backing onto Highway 8 By-pass to allow for noise attenuation.
D. 30T-89029 Phase 3 (Plan 58M-120) – Cambridge Taylor Holdings Inc.
• Noise related development approval condition can be found in Subdivision Agreement (Instrument No. 749935) between the Region of Waterloo and Cambridge-Taylor Holdings Inc. The Legal Agreement can be found in DOCs #3878910.
o Noise Warning Clause Type A related to Highway 8 By-pass was registered on Title for all Lots.
• Original subdivision design used 45.72m (150ft) lots backing onto Highway 8 By-pass to allow for noise attenuation.
E. 30T-89042 (1524S) – Cambridge Taylor Holdings Inc.
• Noise related development approval condition can be found in Subdivision Agreement (Instrument No. 749935) between the Region of Waterloo and Cambridge-Taylor Holdings Inc. The Legal Agreement can be found in DOCs #3878910.
o Noise Warning Clause Type A related to Highway 8 By-pass was registered on Title for all Lots.
• Original subdivision design used 45.72m (150ft) lots backing onto Highway 8 By-pass to allow for noise attenuation.
F. 30T-89029 Phase 5 (Plan 58M-198)
• Noise related development approval condition was relied upon by existing Legal Agreement (LT0055205) between the Region of Waterloo and Cambridge-Taylor Holdings Inc. That Legal Agreement can be found in DOCs #3878957.
• Original subdivision design used 45.72m (150ft) lots backing onto Highway 8 By-pass to allow for noise attenuation.
Page 195 of 198

April 12, 2022 TES-DCS-22-10
3876103 Page 5 of 6
G. 30T-92006 (Plan 58M-243)
• Noise related development approval condition was relied upon by existing Legal Agreement (LT89061), unable to track down the file related to this subdivision.
• Original subdivision design used 45.72m (150ft) lots backing onto Highway 8 By-pass to allow for noise attenuation.
H. 30T-08101 (Plan 58M-539) – Sunvest Development Corporation
• Noise related development approval conditions can be found in Legal Agreement (WR662770) between the Region of Waterloo and Sunvest Development Corporation. The Legal Agreement can be found in DOCs #3889243.
I. 30T-89035 (Plan 58M-363)
• Nothing in the file related to noise. This is the subdivision furthest away from McQueen Shaver Boulevard, with the closest house approximately 150m away from McQueen Shaver Boulevard.
J. 30T-06106 (Plan 58M-457) – Empire Communities along Franklin Boulevard Extension
• Noise related development approval conditions can be found in Legal Agreement (WR380368) between The Region of Waterloo and Empire Communities. Legal Agreement can be found in DOCs #3878789 the Legal Plan showing the lots can be found in DOCs #3878790. Noise related requirements included:
o Construction of retaining wall adjacent to the Franklin Boulevard right of way, at the rear of Lots 7 to 13, 23 to 26, 30, 31 and Blocks 98 and 99. Retaining wall must be designed to accommodate the future extension of the wall for noise attenuation.
o Easement in favour of the Region for the long term maintenance of the retaining wall and chain link fence.
o Letter of Credit for the retaining wall - $337,500 o Certified funds for long term maintenance of wall - $185,625 (55% of initial
cost as per Regional Policy) o Construction of a 1.83m high noise attenuation wall along Franklin
Boulevard adjacent to Lots 7 to 13, 16 to 31, 82 to 92, Blocks 93 to 94 and Block 99. ADDITIONAL NOTE – further clause in agreement stating that developer is not required to construct and/or fund construction of noise attenuation wall upon the developer re-zoning the rear yard setbacks for the affected lots in accordance with the recommended setbacks for set out in the developer’s noise study.
o Construction of a 1.83m high noise attenuation wall along Franklin Boulevard adjacent to Block 95.
Page 196 of 198

April 12, 2022 TES-DCS-22-10
3876103 Page 6 of 6
o A 2.85m high noise attenuation wall along the Future South Boundary Road adjacent/contiguous to Lot 1. ADDITIONAL NOTE – further clause in agreement stating that developer is not required to construct or fund construction of noise attenuation wall if it is determined through the Region’s South Boundary Road/Franklin Boulevard extension Class EA that physical outdoor attenuation for Lot 1 is not required as a result of the preferred alternative endorsed by Regional Council, and the approval of the Class EA Report by the Ministry of the Environment, and that the resulting setback is consistent with the recommended setback set out in the developer’s noise study.
o Letter of Credit for the noise attenuation walls totalling $392,396.24. o Letter of Credit for the long term maintenance of the 1.83m high noise
attenuation wall along Franklin Boulevard adjacent to Lots 7 to 13, 16 to 31, 82 to 92, Blocks 93 to 94 and Block 99 - $207,900.00 – ADDITIONAL NOTE – further clause in agreement stating that funds will be available for release upon the completion of construction, or if the noise attenuation walls are not required as noted in the two above Additional Notes.
o Certified funds for long term maintenance of noise attenuation wall along Franklin Boulevard adjacent to Block 95 and South Boundary Road adjacent/contiguous to Lot 1 - $7,917.93
o All residential units constructed on Lots 1, 7 to 13, 16 to 40, 82 to 92, Blocks 93 to 95 and Blocks 99 to 101 must be constructed with forced air-ducted heating system suitably sized to permit for future installation of air conditioning by occupant.
o Noise Warning Clause Type C related to Franklin Boulevard on title for Lots 7 to 13, 16 to 31, 82 to 92 and Blocks 93, 94 and 99.
o Noise Warning Clause Type A related to Franklin Boulevard on title for Block 95.
Page 197 of 198
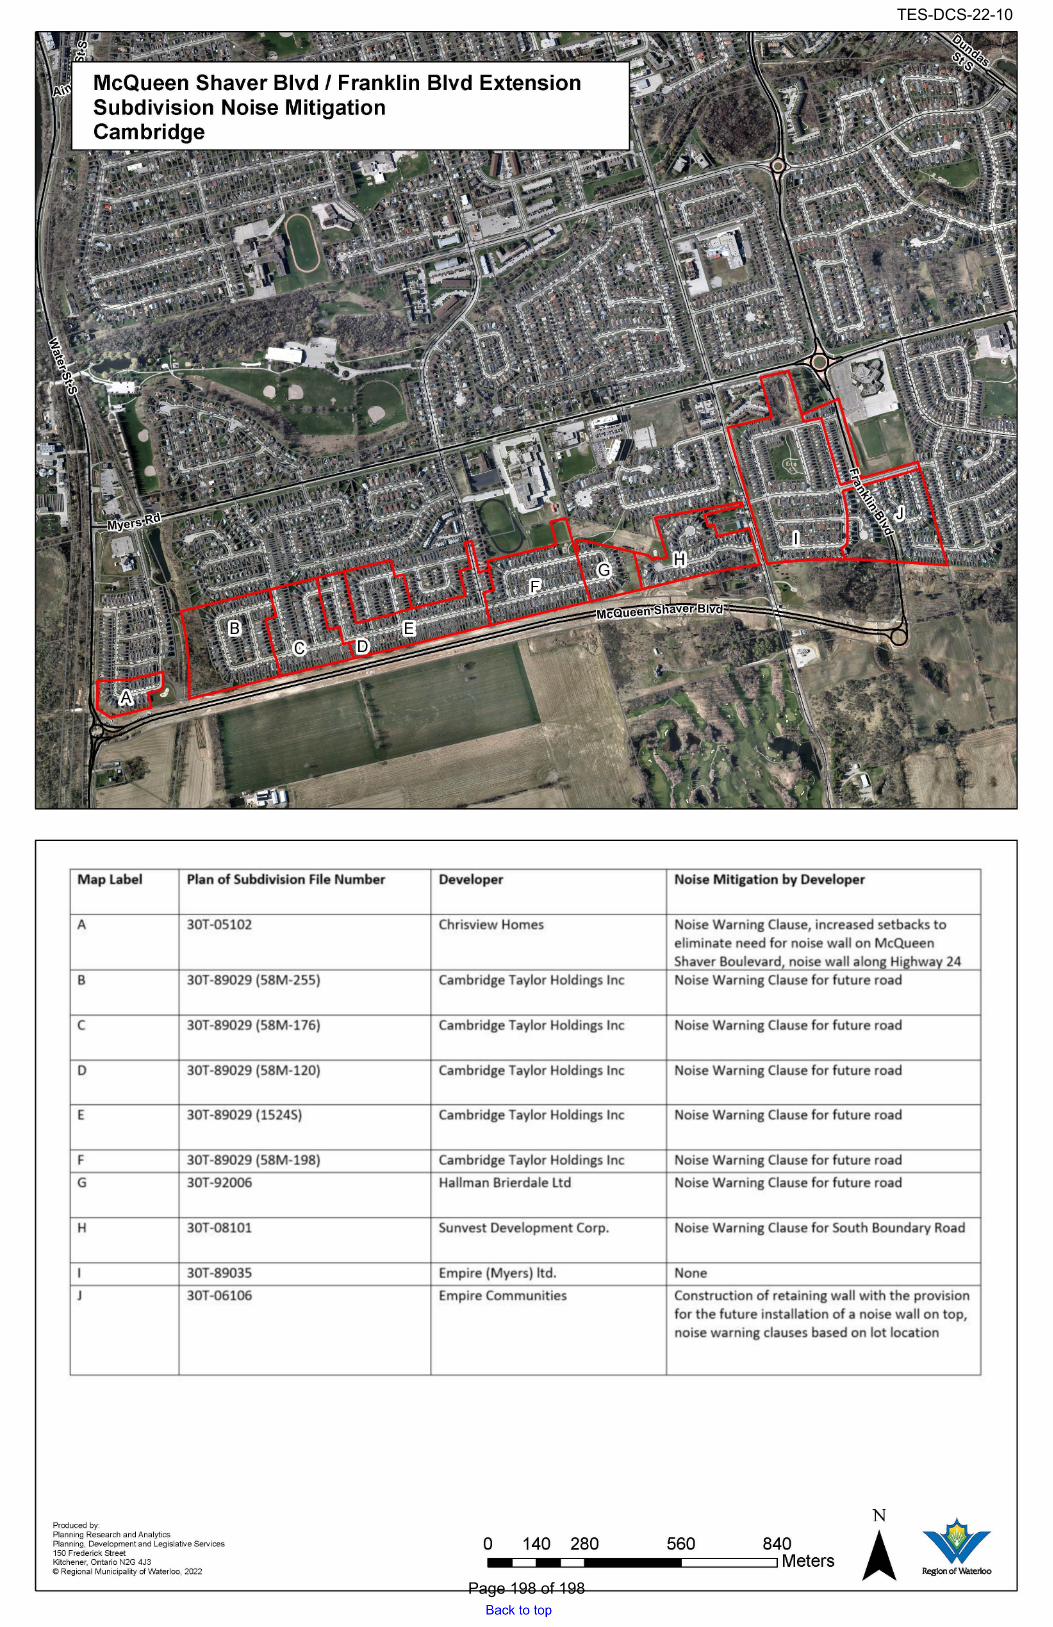
McQueen Shaver Blvd / Franklin Blvd Extension Subdivision Noise Mitigation Cambridge
Map Label Plan of Subdivision File Number
A 30T-05102
B 30T-89029 (SSM-255)
C 30T-89029 (SSM-176)
D 30T-89029 (SSM-120)
E 30T-89029 (1524S)
F 30T-89029 (SSM-198)
G 30T-92006
H 30T-08101
I 30T-89035
J 30T-06106
Produced by: Planning Research and Analytics Planning, Development and Legislative Services 150 Frederick Street Kitchener, Ontario N2G 4J3 © Regional Municipality of Waterloo, 2022
Developer Noise Mitigation by Developer
Chrisview Homes Noise Warning Clause, increased setbacks to eliminate need for noise wall on McQueen Shaver Boulevard, noise wall along Highway 24
Cambridge Taylor Holdings Inc Noise Warning Clause for future road
Cambridge Taylor Holdings Inc Noise Warning Clause for future road
Cambridge Taylor Holdings Inc Noise Warning Clause for future road
Cambridge Taylor Holdings Inc Noise Warning Clause for future road
Cambridge Taylor Holdings Inc Noise Warning Clause for future road
Ha llman Brierdale Ltd Noise Warning Clause for future road
Sunvest Development Corp. Noise Warning Clause for South Boundary Road
Empire (Myers) ltd . None
Empire Communities Construction of retaining wall with the provision for the future installation of a noise wall on top, noise warning clauses based on lot location
0 840 -r::::::=--===-----======::::::1 Meters
140 280 560
TES-DCS-22-10
Page 198 of 198

April 12, 2022 Report: TES-DCS-22-09
3983038 Page 1 of 3
Attachment C – Engage Survey Public Consultation and Responses
As part of the preliminary design process for this project, staff sought public input on the roundabout. Letters were mailed to residents, tenants and business owners within the immediate vicinity of the intersection, dated January 7, 2022.
Email correspondence, face-to-face meetings and phone discussions were held with the impacted property owners as follows:
• Highview Residences (20 Reichert Dr) – February 23, 2022,
• northwest quadrant vacant land and 628 New Dundee Road – February 25, 2022
Project notification signboards were placed at all three legs of the existing intersection from January 12th to February 11th, 2022.
Project information is available on the Region’s Engage website, including contacts for appropriate Region of Waterloo staff, and the opportunity to subscribe for project updates. The Engage website provided the opportunity to participate in a public survey regarding the project from January 12th to February 11th, 2022.
Ongoing discussions have taken place with City of Kitchener Engineering/ Transportation and Parks Staff, regarding project scope and property impacts on northeast quadrant of the intersection (storm pond). The Region will be relocating “Topper Woods” subdivision sign in coordination with City Parks Staff outside of the construction limits.
Main Issues Raised by the Public and Adjacent Property Owners
The Engage website recorded that a total of 97 users participated in the survey. From the Engage website there were 47 survey responds in favour of implementing a roundabout at this location, 42 that were not in favour, and 8 that were neutral or did not provide a response, when asked, “What do you like about a proposed roundabout at this location?” 72 survey responders live in the Doon South Neighbourhood, 81 drive through the intersection and 46 either walk or cycle through the intersection. The main issues raised by the public and adjacent property owners have been summarized into the following themes:
a) High Operating Speeds on New Dundee Road
One of the advantages of a roundabout is the lower speeds of all vehicles using theroundabout. The operating speed of the roundabout would be designed in the range of30km/hr to 49 km/hr. The Region’s current practice is to lower posted speeds on RegionalRoads to 60km/hr in each direction, within 400m of approach to a roundabout. The Regionwill make a recommendation to Council that the posted speed on New Dundee Road, fromExecutive Place to Reichert Drive be lowered from the existing 80km/hr to 60km/hr.

April 12, 2022 Report: TES-DCS-22-09
3983038 Page 2 of 3
b) Volume of Commercial Truck Traffic It is typical for commercial truck traffic to make use of roundabout intersections throughout the Region of Waterloo. The proposed double lane roundabout, including the entrance and exit to the roundabout would be designed geometrically to adequately accommodate all types of large commercial vehicles. Roundabout design will include a turning apron with a mountable curb on the central island to compensate for a larger vehicle's off-tracking and reduce the points of conflict in the roundabout.
c) Cost and impacts of Roundabout Construction
Regional staff acknowledge there is an immediate cost for roundabout construction at this location. The proposed roundabout would reduce injury collisions, reduce delays, have lower life-cycle costs, and reduce idling times resulting in fuel savings and reduced vehicle emissions.
Traffic that uses this intersection will be impacted during roundabout construction. Upon completion of detailed design, construction staging and appropriate detours will be established based on a detailed assessment of construction scope and traffic management options. Regional staff will work with the City of Kitchener staff and emergency services personnel to develop staging and detour plans and will effectively communicate these plans to the public well in advance of construction.
d) Illumination As part of the detail design, the Regional Illumination Policy will be reviewed and applied to ensure the roundabout is illuminated appropriately. Typically roundabouts have higher illumination levels than signalized intersections.
e) Education for Roundabout Users Prior to completion of the roundabout construction, the Region will mail educational pamphlets to area residents, tenants and business owners promoting roundabout safety. Signs will be posted in advance of construction, informing motorists, cyclists and pedestrians of the upcoming roundabout and instructions on where to obtain educational online tools on the Safe Roads Waterloo Region website.
f) Provisions for Active Transportation The roundabout design includes a 3.0m wide paved shared multi-use path facilities on the north and south sides of New Dundee Road. Per the Region’s 2018 Transportation Master Plan, the Region plans to widen the road platform to include 1.5m paved shoulders on both sides of New Dundee Road, extending from the east limit of the roundabout to

April 12, 2022 Report: TES-DCS-22-09
3983038 Page 3 of 3
Executive Place. This will provide the missing link of paved shoulders on New Dundee Road between Fischer-Hallman Road and Homer Watson Boulevard.
g) Impact to Heritage Lands
Regional staff met with the property owners at 628 New Dundee Road to discuss thisproject. They expressed concern as to how their home would be impacted duringconstruction. The Region acknowledges their home is a Municipally Registered propertyunder the Ontario Heritage Act. The historic yellow brick dwelling is listed on the City ofKitchener register. Regional work will not impact the property at 628 New Dundee Road,as the scope of work is contained to the existing right-of-way. Regional Cultural HeritageStaff will be kept informed as this project progresses, to ensure the site is properlyprotected. This will include a preconstruction survey of the home and property, along withany additional mitigation requirements, as outlined by Cultural Heritage Staff. TheRegion’s scope will require land acquisition from the vacant land at the northwest quadrantof the intersection of New Dundee Road and Robert Ferrie Drive (directly east of 628 NewDundee Road).