Embed Size (px)
Citation preview
Natural Hazards 33: 209–221, 2004.© 2004 Kluwer Academic Publishers. Printed in the Netherlands.
209
Pyroclastic Flow Hazard at Volcán CitlaltépetlGIS Model for Volcanic Hazard Assessment: Pyroclastic Flows at VolcánCitlaltépetl, México
MICHAEL F. SHERIDAN1, BERNARD HUBBARD1�, GERARDOCARRASCO-NÚÑEZ2 and CLAUS SIEBE3
1Department of Geology, 876 Natural Science Complex, SUNY at Buffalo, Buffalo, NY 14260, USA(Now at the US Geological Survey, Reston, Virginia); 2Centro de Geociencias, Campus Juriquilla,UNAM, Querétaro, Qro.76001, México; 3Instituto de Geofísica, UNAM, Ciudad Universitária, CP.04510, Coyoacán, México, D.F., México
(Received: 16 December 2002; accepted: 28 October 2003)
Abstract. Volcán Citlaltépetl (Pico de Orizaba) with an elevation of 5,675 m is the highest volcano inNorth America. Its most recent catastrophic events involved the production of pyroclastic flows thaterupted approximately 4,000, 8,500, and 13,000 years ago. The distribution of mapped deposits fromthese eruptions gives an approximate guide to the extent of products from potential future eruptions.Because the topography of this volcano is constantly changing computer simulations were made onthe present topography using three computer algorithms: energy cone, FLOW2D, and FLOW3D.The Heim Coefficient (µ), used as a code parameter for frictional sliding in all our algorithms, is theratio of the assumed drop in elevation (H) divided by the lateral extent of the mapped deposits (L).The viscosity parameter for the FLOW2D and FLOW3D codes was adjusted so that the paths of theflows mimicked those inferred from the mapped deposits. We modeled two categories of pyroclasticflows modeled for the level I and level II events. Level I pyroclastic flows correspond to small butmore frequent block-and-ash flows that remain on the main cone. Level II flows correspond to morewidespread flows from catastrophic eruptions with an approximate 4,000-year repose period. Wedeveloped hazard maps from simulations based on a National Imagery and Mapping Agency (NIMA)DTED-1 DEM with a 90 m grid and a vertical accuracy of ±30 m. Because realistic visualizationis an important aid to understanding the risks related to volcanic hazards we present the DEM asmodeled by FLOW3D. The model shows that the pyroclastic flows extend for much greater distancesto the east of the volcano summit where the topographic relief is nearly 4,300 m. This study was usedto plot hazard zones for pyroclastic flows in the official hazard map that was published recently.
Key words: Citlaltépetl, computer simulations, DEM, hazard zones, interactive viewing, México,Pico de Orizaba, pyroclastic flows, volcano
1. Introduction
Pyroclastic flows are incandescent mixtures of volcanic particles and gas that des-cend from collapsing eruption columns and volcanic domes at speeds that canexceed 100 m/s (Sheridan, 1979). The societal risk related to pyroclastic flowsis a problem that public safety authorities around the world must face several times
� Author for correspondence. E-mail: [email protected]
210 MICHAEL F. SHERIDAN ET AL.
a year (Tilling, 1989). We have developed a methodology to evaluate the dangerfrom these incandescent avalanches and clouds by using computer models of theirflow paths to map hazard zones. This technique requires an accurate digital elev-ation model of the surface and reliable data on the flowing materials to constrainparameters for the computer simulations. Some recent pyroclastic flows that wereused to constrain the effects of terrain on our model parameters are: Mount St.Helens (1980), Unzen (1991), and Colima (1991, 1994). In this paper we evaluatethe results from three different, but related, flow models: energy cone, FLOW2D,and FLOW3D. Our procedure greatly extends the forecasting capability at poorlystudied volcanoes by providing a rapid and easily interpreted product that is basedprincipally on topography and flow parameters from observed eruptions.
2. Problem Statement
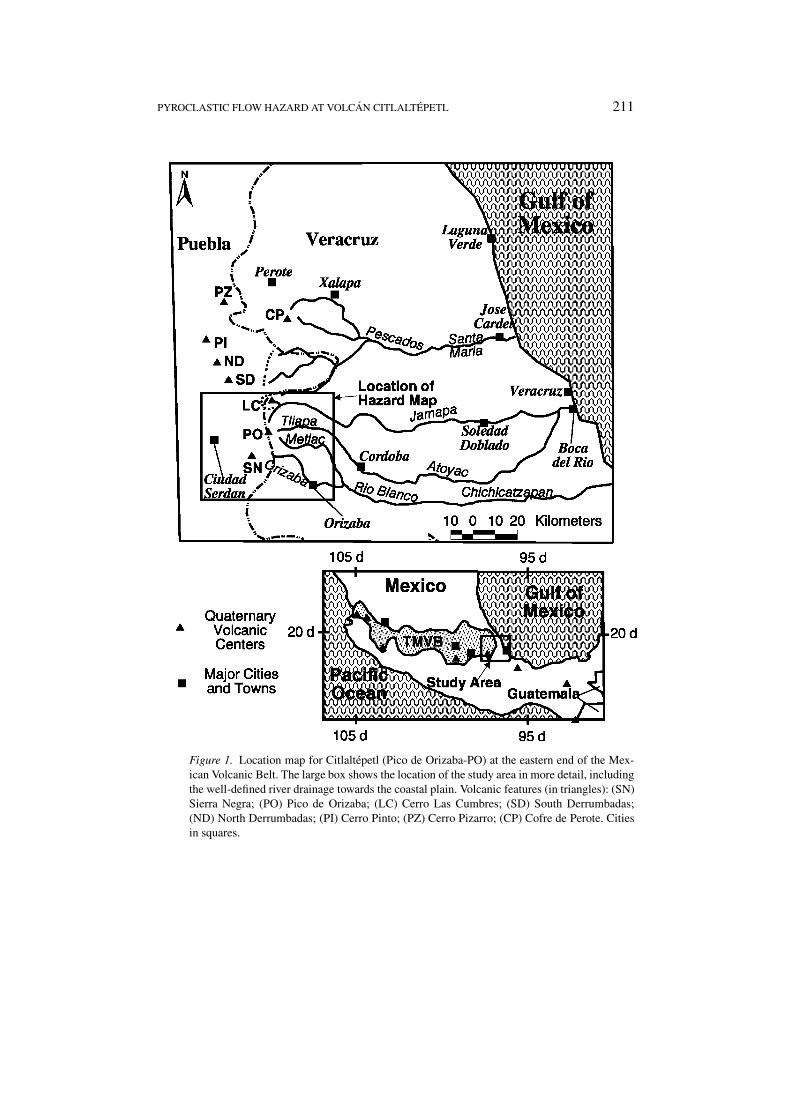
Volcán Citlaltépetl (Pico de Orizaba) is located in the State of Veracruz at theeastern end of the Trans-Mexican Volcanic Belt (Figure 1). Its elevation of 5,675 mcreates considerable hazard for gravity-driven materials like avalanches, mudflows,and pyroclastic flows. Although this volcano has been relatively quiet since theSpanish conquest, there have been three well-documented catastrophic events thatinvolved the production of pyroclastic flows at approximately 4,000, 8,500, and13,000 years ago (Siebe et al., 1993; Carrasco-Núñez and Rose, 1995; Carrasco-Núñez, 1999). The approximate repose period of 4,000 years for catastrophicevents justifies preparation for future activity of this type. Höskuldsson and Can-tagrel (1994) map several zones with populations between 10,000 and 300,000around the volcano. In Figure 1 we show the main population centers in the statesof Veracruz and Puebla, Mexico. The results presented in this paper were used tocreate a hazard map of Volcán Citlaltépetl (Sheridan et al., 2002a) that is compar-able to maps of other active volcanoes in Mexico such as Popocatépetl (Macías etal., 1995) and Colima (Martin del Pozzo et al., 1995).
3. Methods
3.1. MODELS
Although the three models used in this paper calculate several aspects of pyro-clastic flows, the main characteristics of pyroclastic flows that concern hazardassessment are runout distance and flow coverage. Because pyroclastic flows des-troy all life in their path, the simulated surface covered by the maximum expectedpyroclastic flow defines the hazard zone. All three models in our study depend onan accurate DEM of current topography for flow calculation and visualization offlow distribution. Estimated values and limits for the models parameters are basedon the known distribution of eruptive products from Citlaltépetl and experiencewith hazard assessments at other volcanoes. These parameters were determinedempirically using simulations of flows that better fit observed flows of two distinct
PYROCLASTIC FLOW HAZARD AT VOLCAN CITLALTEPETL 211
Figure 1. Location map for Citlaltepetl (Pico de Orizaba-PO) at the eastern end of the Mex-ican Volcanic Belt. The large box shows the location of the study area in more detail, includingthe well-defined river drainage towards the coastal plain. Volcanic features (in triangles): (SN)Sierra Negra; (PO) Pico de Orizaba; (LC) Cerro Las Cumbres; (SD) South Derrumbadas;(ND) North Derrumbadas; (PI) Cerro Pinto; (PZ) Cerro Pizarro; (CP) Cofre de Perote. Citiesin squares.
212 MICHAEL F. SHERIDAN ET AL.
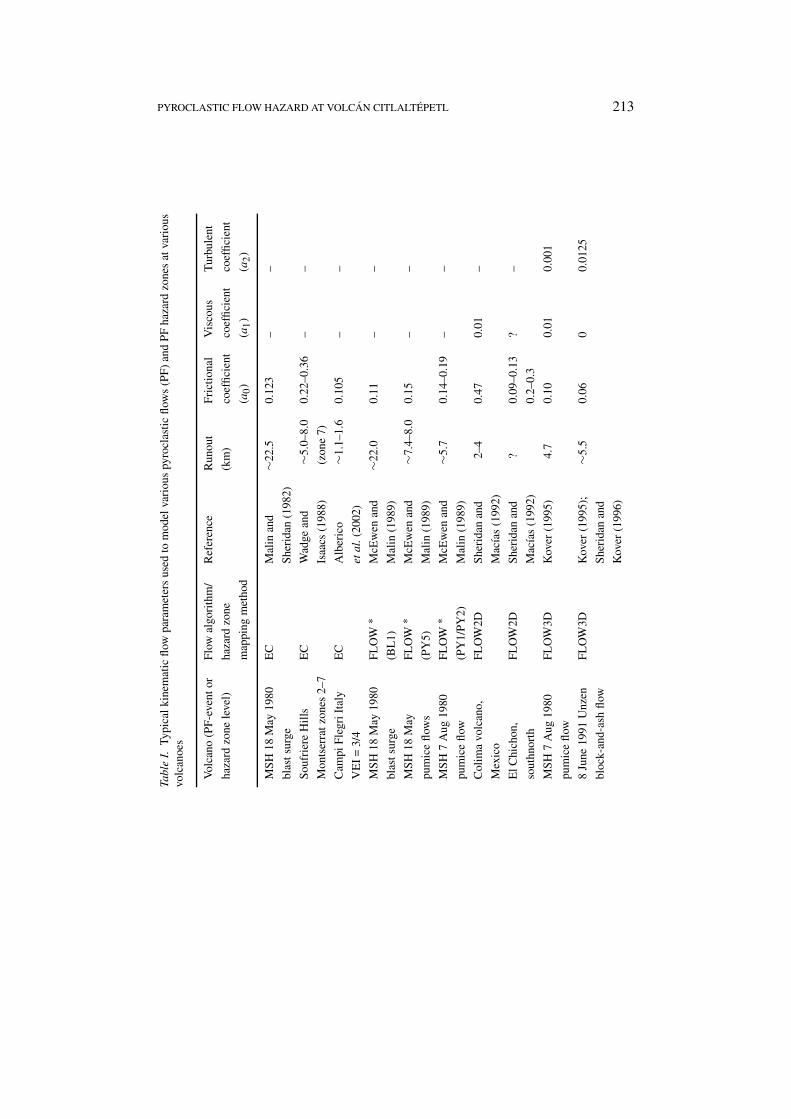
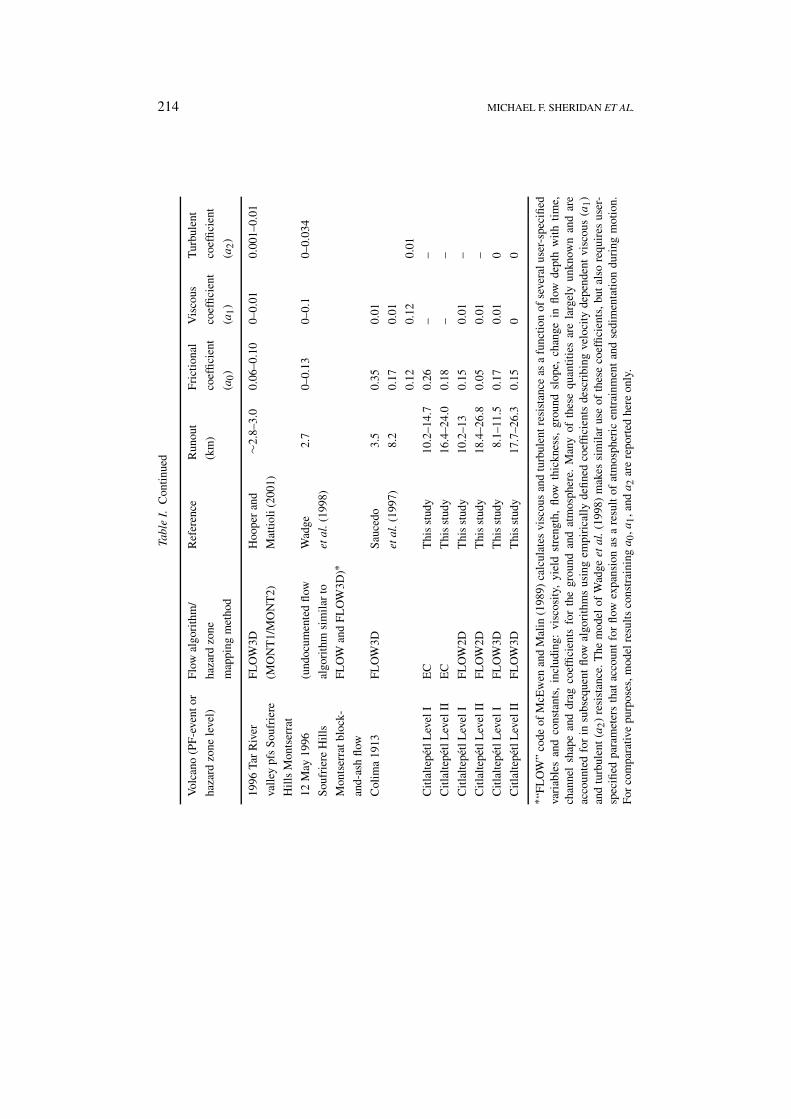
eruptive magnitudes. Low magnitude pyroclastic-flow eruptions (corresponding tolevel I) reached distances of about 10–13 km from vent and occurred approxim-ately every 2,000 years. In the case of pyroclastic-flows of intermediate magnitude(Level II), they reach about 18–27 km with a recurrence period of about 4,000years. Table I summarizes the input parameters used for each model as discussed intext, and compares them with those used in hazard assessments at other volcanoes.Further discussion of the relationship between our model results and the knowndistribution of pyroclastic flow deposits from prior eruptive episodes is providedlater. Here we provide a brief description of each model and describe the designedoutput display format of both models and maps to facilitate interpretation by publicsafety officials as well as scientists. A detailed summary of the development of allthree models is given in Hooper and Mattioli (2001).
3.1.1. Energy cone
Malin and Sheridan (1982) proposed the energy cone model to mimic the 1980blast eruption of Mount St. Helens. Höskuldsson and Cantagrel (1994) used avariation of this concept to develop a hazard map of Pico de Orizaba for pyroclasticand debris gravity currents. Our methods differ from theirs in that we use GIS todevelop and compare a variety of techniques which model pyroclastic flows.
The principle of the energy cone (and energy line) is that the height of thestarting point of the flow (H ) ratios to the length of the runout (L) acts as a type offriction parameter termed the Heim coefficient (µ) after Albert Heim, the originatorof the energy line concept (Heim, 1932). The inclination of the energy cone is anangle defined by arctan (H/L). The intersection of the energy cone, originating atthe eruptive source, with the ground surface defines the distal limits of the flow.The vertical distance (h) between the ground surface and the energy cone providesa means to estimate the flow velocity in this model.
v2 = 0.5 gh, (1)
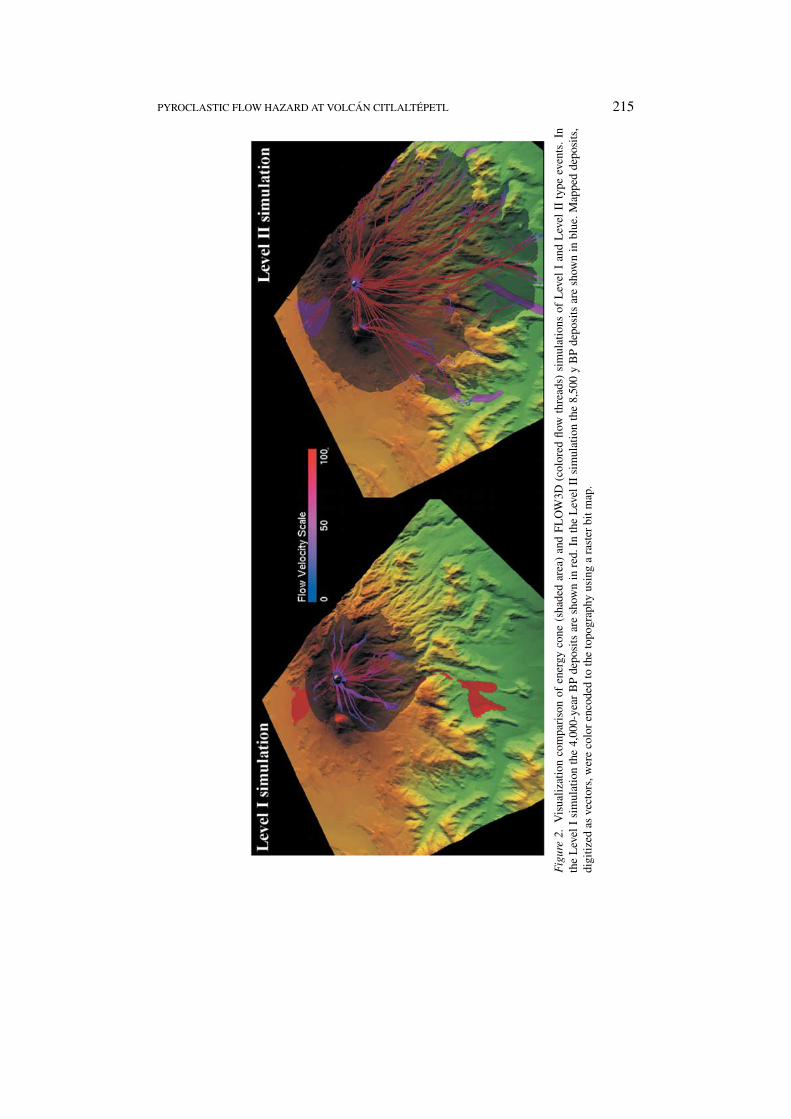
where v is flow velocity and g is gravitational acceleration. For our level I sim-ulation we used a Heim coefficient of 0.26 and for the level II hazard we used avalue of 0.18. The model results are shown projected on the topography in Figure2 and mapped in Figure 3. The energy cone has been applied to the assessmentof hazard at Vulcano, Lipari, and Vesuvius (Sheridan and Malin 1983); SoufriereHills Montserrat (Wadge and Isaacs, 1988) prior to it’s recent eruptive episodes;and most recently at Campi Flegrei Italy (Alberico et al., 2002).
3.1.2. FLOW2D
A weakness of the energy line models is that it assumes straight-line flow trajector-ies that pass through topographic obstacles. To resolve this problem in their studyof Colima and El Chichón volcanoes Sheridan and Macías (1992) developed theFLOW2D code for use in small computers. This code assumes that shear resistance
PYROCLASTIC FLOW HAZARD AT VOLCAN CITLALTEPETL 213
Tabl
eI.
Typi
calk
inem
atic
flow
para
met
ers
used
tom
odel
vari
ous
pyro
clas
tic
flow
s(P
F)
and
PF
haza
rdzo
nes
atva
riou
svo
lcan
oes
Vol
cano
(PF
-eve
ntor
Flo
wal
gori
thm
/R
efer
ence
Run
out
Fri
ctio
nal
Vis
cous
Tur
bule
nt
haza
rdzo
nele
vel)
haza
rdzo
ne(k
m)
coef
fici
ent
coef
fici
ent
coef
fici
ent
map
ping
met
hod
(a0)
(a1)
(a2)
MS
H18
May
1980
EC
Mal
inan
d∼2
2.5
0.12
3–
–
blas
tsur
geS
heri
dan
(198
2)
Sou
frie
reH
ills
EC
Wad
gean
d∼5
.0–8
.00.
22–0
.36
––
Mon
tser
ratz
ones
2–7
Isaa
cs(1
988)
(zon
e7)
Cam
piF
legr
iIta
lyE
CA
lber
ico
∼1.1
–1.6
0.10
5–
–
VE
I=
3/4
etal
.(20
02)
MS
H18
May
1980
FL
OW
∗M
cEw
enan
d∼2
2.0
0.11
––
blas
tsur
ge(B
L1)
Mal
in(1
989)
MS
H18
May
FL
OW
∗M
cEw
enan
d∼7
.4–8
.00.
15–
–
pum
ice
flow
s(P
Y5)
Mal
in(1
989)
MS
H7
Aug
1980
FL
OW
∗M
cEw
enan
d∼5
.70.
14–0
.19
––
pum
ice
flow
(PY
1/P
Y2)
Mal
in(1
989)
Col
ima
volc
ano,
FL
OW
2DS
heri
dan
and
2–4
0.47
0.01
–
Mex
ico
Mac
ıas
(199
2)
ElC
hich
on,
FL
OW
2DS
heri
dan
and
?0.
09–0
.13
?–
sout
hnor
thM
acıa
s(1
992)
0.2–
0.3
MS
H7
Aug
1980
FL
OW
3DK
over
(199
5)4.
70.
100.
010.
001
pum
ice
flow
8Ju
ne19
91U
nzen
FL
OW
3DK
over
(199
5);
∼5.5
0.06
00.
0125
bloc
k-an
d-as
hfl
owS
heri
dan
and
Kov
er(1
996)
214 MICHAEL F. SHERIDAN ET AL.
Tabl
eI.
Con
tinu
ed
Vol
cano
(PF
-eve
ntor
Flo
wal
gori
thm
/R
efer
ence
Run
out
Fri
ctio
nal
Vis
cous
Tur
bule
nt
haza
rdzo
nele
vel)
haza
rdzo
ne(k
m)
coef
fici
ent
coef
fici
ent
coef
fici
ent
map
ping
met
hod
(a0)
(a1)
(a2)
1996
Tar
Riv
erF
LO
W3D
Hoo
per
and
∼2.8
–3.0
0.06
–0.1
00–
0.01
0.00
1–0.
01
valle
ypf
sS
oufr
iere
(MO
NT
1/M
ON
T2)
Mat
tioli
(200
1)
Hil
lsM
onts
erra
t
12M
ay19
96(u
ndoc
umen
ted
flow
Wad
ge2.
70–
0.13
0–0.
10–
0.03
4
Sou
frie
reH
ills
algo
rith
msi
mil
arto
etal
.(19
98)
Mon
tser
ratb
lock
-F
LO
Wan
dF
LO
W3D
)∗an
d-as
hfl
ow
Col
ima
1913
FL
OW
3DS
auce
do3.
50.
350.
01
etal
.(19
97)
8.2
0.17
0.01
0.12
0.12
0.01
Cit
lalt
epet
lLev
elI
EC
Thi
sst
udy
10.2
–14.
70.
26–
–
Cit
lalt
epet
lLev
elII
EC
Thi
sst
udy
16.4
–24.
00.
18–
–
Cit
lalt
epet
lLev
elI
FL
OW
2DT
his
stud
y10
.2–1
30.
150.
01–
Cit
lalt
epet
lLev
elII
FL
OW
2DT
his
stud
y18
.4–2
6.8
0.05
0.01
–
Cit
lalt
epet
lLev
elI
FL
OW
3DT
his
stud
y8.
1–11
.50.
170.
010
Cit
lalt
epet
lLev
elII
FL
OW
3DT
his
stud
y17
.7–2
6.3
0.15
00
∗ “F
LO
W”
code
ofM
cEw
enan
dM
alin
(198
9)ca
lcul
ates
visc
ous
and
turb
ulen
tres
ista
nce
asa
func
tion
ofse
vera
luse
r-sp
ecifi
edva
riab
les
and
cons
tant
s,in
clud
ing:
visc
osit
y,yi
eld
stre
ngth
,fl
owth
ickn
ess,
grou
ndsl
ope,
chan
gein
flow
dept
hw
ith
tim
e,ch
anne
lsh
ape
and
drag
coef
fici
ents
for
the
grou
ndan
dat
mos
pher
e.M
any
ofth
ese
quan
titie
sar
ela
rgel
yun
know
nan
dar
eac
coun
ted
for
insu
bseq
uent
flow
algo
rith
ms
usin
gem
piri
call
yde
fine
dco
effi
cien
tsde
scri
bing
velo
city
depe
nden
tvi
scou
s(a
1)an
dtu
rbul
ent
(a2)
resi
stan
ce.T
hem
odel
ofW
adge
etal
.(19
98)
mak
essi
mil
arus
eof
thes
eco
effi
cien
ts,b
utal
sore
quir
esus
er-
spec
ified
para
met
ers
that
acco
unt
for
flow
expa
nsio
nas
are
sult
ofat
mos
pher
icen
trai
nmen
tan
dse
dim
enta
tion
duri
ngm
otio
n.Fo
rco
mpa
rativ
epu
rpos
es,m
odel
resu
lts
cons
trai
ning
a0,a
1,a
nda
2ar
ere
port
edhe
reon
ly.
PYROCLASTIC FLOW HAZARD AT VOLCAN CITLALTEPETL 215
Fig
ure
2.V
isua
liza
tion
com
pari
son
ofen
ergy
cone
(sha
ded
area
)an
dF
LO
W3D
(col
ored
flow
thre
ads)
sim
ulat
ions
ofL
evel
Ian
dL
evel
IIty
peev
ents
.In
the
Lev
elI
sim
ulat
ion
the
4,00
0-ye
arB
Pde
posi
tsar
esh
own
inre
d.In
the
Lev
elII
sim
ulat
ion
the
8,50
0y
BP
depo
sits
are
show
nin
blue
.Map
ped
depo
sits
,di
giti
zed
asve
ctor
s,w
ere
colo
ren
code
dto
the
topo
grap
hyus
ing
ara
ster
bitm
ap.
216 MICHAEL F. SHERIDAN ET AL.
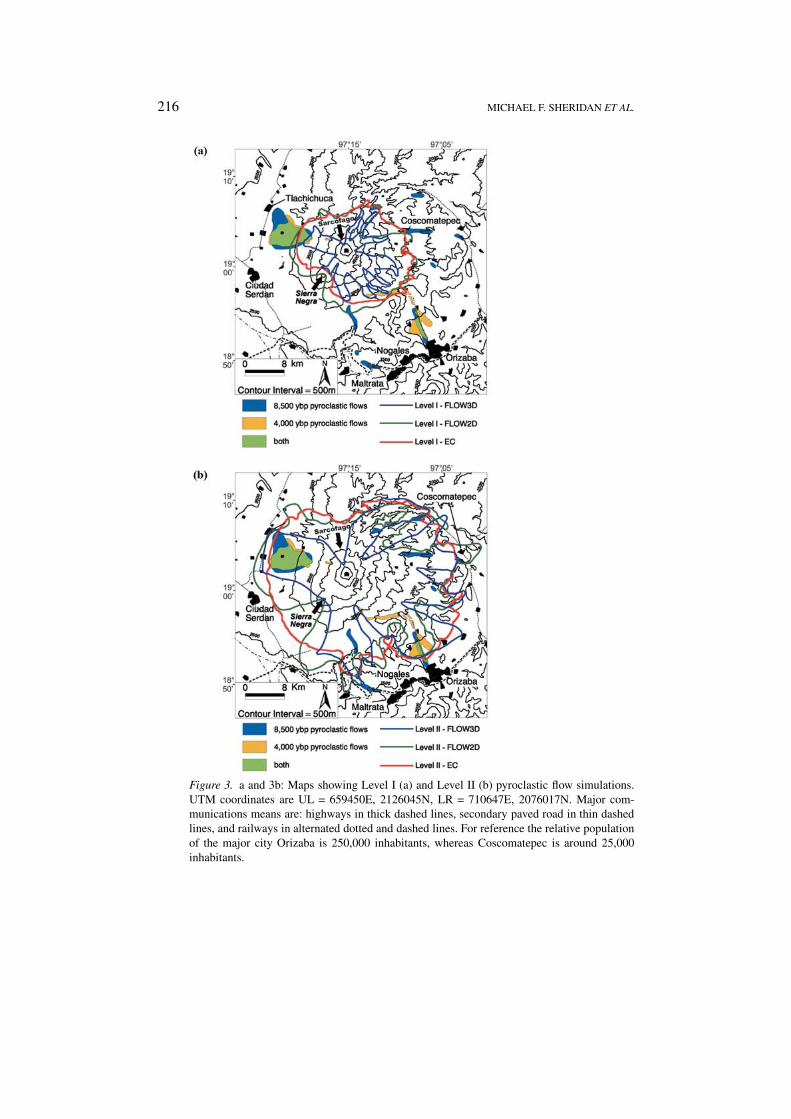
Figure 3. a and 3b: Maps showing Level I (a) and Level II (b) pyroclastic flow simulations.UTM coordinates are UL = 659450E, 2126045N, LR = 710647E, 2076017N. Major com-munications means are: highways in thick dashed lines, secondary paved road in thin dashedlines, and railways in alternated dotted and dashed lines. For reference the relative populationof the major city Orizaba is 250,000 inhabitants, whereas Coscomatepec is around 25,000inhabitants.
PYROCLASTIC FLOW HAZARD AT VOLCAN CITLALTEPETL 217
(τ ) depends on both basal friction (a0) and viscosity parameters (a1) [c.f. Mellor,1978; Pariseau and Voight, 1979; McEwen and Malin, 1989].
τ = a0 + v∗a1 (2)
FLOW2D code mimics actual flow velocity better than does the energy line andit shows the runback of flows off large topographic barriers. It is also easily usedin 2D on personal computers. However this code is limited by the need to tabulatetopographic profiles along each flow path. Another disadvantage is that FLOW2Ddoes not consider lateral movement of the pyroclastic flows. For our FLOW2Dsimulations of the level I pyroclastic flows we used an average value of 0.15 fora0 and 0.01 for a1. For the level II flows we used an average value of 0.05 for a0
and 0.01 for a1. These are empirical values that fit with the maximum extensionsfor pyroclastic flow eruptions of short and intermediate magnitude, respectively,as mentioned earlier. The results of the FLOW2D calculations are shown in thehazard maps of Figure 3. Development of FLOW2D has since been superseded byFLOW3D, which is further described in the following section.
3.1.3. FLOW3D
The FLOW3D code is based on the generation of a digital elevation model (DEM)representing the topographic surface along which the gravity flows move on aTriangulated Irregular Network (TIN) of elevations. This kinematic model is easyto construct from various types of data sets and a variety of geometric configur-ations (point source, radial distribution, linear or random) can be used to modelflow initiation. The triangles are contiguous at their boundaries so that there areno discontinuities such as those that exist with raster data. The TIN also servesas the basis for the computations where gravitational acceleration is assigned toeach triangular element of the network. The flow algorithm considers previousflow models for gravity slides and assumes a constant mass, thickness, and densityof the flows. Within each specified triangle a single vector represents the drivingacceleration due to gravity.
The FLOW3D code (Kover, 1995; Sheridan and Kover, 1996) provides velocityhistories of particle streams along flow paths in three dimensions. It is similar tothe “FLOW” model of McEwen and Malin (1989) in its calculation of frictionalresistance, acceleration along the path of steepest descent for each terrain ele-ment, and the assumption that the center of mass is focused at the ground surface.However, FLOW3D calculates viscous and turbulent resistances by multiplyingthe user-defined coefficients of energy dissipation by the flow velocity, which isdetermined incrementally. Multiple flow paths are incremented every 0.1 secondsacross triangular elements using as many as three parameters to calculate shearresistance (τ ): basal friction (a0), viscosity (a1) and turbulence (a2) (cf. Mellor,1978; Pariseau and Voight, 1979; McEwen and Malin, 1989).
τ = a0 + v∗a1 + v2∗a2 (3)
218 MICHAEL F. SHERIDAN ET AL.
FLOW3D simulations have been verified by laboratory tests and field studies atthe 1991 Unzen eruption (Kover and Sheridan, 1993; Kover, 1995) and the 1980Mount St. Helens pyroclastic flows (Kover, 1995). It has been applied to riskassessment at several other volcanoes including the creation of hazard maps atPopocatépetl (Macías et al., 1995) and Volcán Colima (Martin del Pozzo et al.,1995) and risk probability at Volcán Colima (Sheridan and Macías, 1995, Saucedoet al., 1997). Most recently, FLOW3D was used to simulate the velocity historyand runout of block-and-ash flows from “Merapi type” dome collapses at SoufriereHills Montserrat (Hooper and Mattioli, 2001).
For the level I pyroclastic flows we used a0 as 0.17 and a1 as 0.01. For the laterlevel II flows we used a0 as 0.15 with no viscous effects. Again, these parametersare determined empirically fitting to the spatial distribution of an observed flow.The runout distance for level I was 8–11 km and 18–26 km for level II. Theappropriate flow kinematics is achieved by trial and error. Bit-mapped and colorcoded overlays of multiple themes were used to produce realistic images and maps.The interactive platform of FLOW3D allows the observer to adjust the perspectiveand distance for the desired view. The life-like appearance of scene facilitates theinterpretation by non-professional observers. The use of cities and towns as a layerin the model allows the estimation of potential loss of life and property in the modelsimulations. These results are compared with those of the energy cone in Figures 2and 3. The FLOW3D code is further documented in Kover (1995).
3.2. GIS PROCEDURES
FLOW3D and Energy Cone models were simulated on a topographic model con-structed from a National Imagery and Mapping Agency (NIMA) DTED-1 DEMwith a 90 m grid spacing and vertical accuracy of approximately ±30 m. Thedigital topography takes the form of a Dense Triangular Network (DTN) that, likea Triangular Irregular Network, conforms well to the morphology of topographicbarriers and best resolves the path of deepest descent. But in contrast it resolveswatersheds and drainage networks like grid-based DEMs (Jenson and Domingue,1988; Jones et al., 1990; Band, 1993).
The final energy cone model was vectorized and filtered to eliminate pixel out-liers and small “islands” within hazardous areas. FLOW2D results were digitizedusing the 1:50,000 scale INEGI maps as a base and major cities and towns asgeographic control points. FLOW3D results were vectorized directly from a geo-coded, raster output of the program, taking into account shadow zones created bythe multiple flow traces. All of the above themes were assembled as vector overlaysin ARCVIEW with other themes such as population centers and 500 m contoursderived from the DEM.
PYROCLASTIC FLOW HAZARD AT VOLCAN CITLALTEPETL 219
3.2.1. Hazard map construction
Siebe et al. (1993) mapped the distribution of young pyroclastic flows on the westof Pico de Orizaba. Carrasco-Núñez and Rose (1995) and Carrasco-Núñez (1999)expanded the mapped flows to include those to the east and showed that the reposeperiod between this type of event is about 4,000 years. These mapped depositsprovide an outer limit for products of catastrophic eruptions, here called level IIhazards (Figure 3b). Smaller and more frequent pyroclastic flow eruptions thathave a more limited extent (Höskuldsson and Robin, 1993) are here termed level Ihazards (Figure 3a) and have a recurrence time of about 2,000 years (Sheridan etal., 2002a). The parameters for the three models in the level I and II simulations(Table I) are set to mimic the distribution of these deposits and are comparable tothe values used for hazard assessments at other volcanoes.
4. Discussion
There is a general agreement between the hazard maps that the three modelsproduced. The energy cone map is easy to produce and it generates the mostconservative map. Shadow zones behind topographically high area are weak inthis model and the perimeter is relatively regular. In contrast, the FLOW3D mapsshow a much stronger conformation of flow boundaries with present topographyand shadow zones are pronounced. The weakness of this model is that it has astrong dependence on weakly constrained parameters. FLOW2D map boundariesgenerally fall between those of the other two models.
These maps are very useful for forecasting future pyroclastic flow hazards atPico de Orizaba. A convenient combination of the three models provides a gooddelimitation of hazard zones. The maps have been used as the principal instrumentto produce the first hazard map for the Citlaltépetl Volcano (Sheridan et al., 2002a),which is being used to help authorities in Mexico to design their mitigation plansfor specific dangerous areas and to discuss the options with the general population.The question that arises in the use of models, is how much faith can be placedon any particular model? A conservative approach would be to draw boundariesin a regular fashion to include all towns that lie close to a border and to ignorethe shadow zones forecast by the models that are more strongly influenced bytopography. This would favor the energy cone simulations. However, if the shadowzones really are protected areas, there would be a considerable saving of resourcesduring an emergency if these areas were treated as an asset rather than a liability.
5. Recommendations for Future Research
It is obvious that the effect of topography on the distribution of pyroclastic flowsmust be assessed in regard to development of hazard maps. Existing and new mod-els of pyroclastic flows should be constructed for volcanoes with a high probability
220 MICHAEL F. SHERIDAN ET AL.
of future pyroclastic flow eruption. The best models for hazard application can thenbe chosen based on actual prediction performance.
The next step in the GIS assessment of pyroclastic hazards at Pico de Orizabais to estimate potential loss of life and property using polygon data, and inclusionof other important themes such as water supply, power lines and other vital infra-structure. Local authorities, which have detailed cadastral data, can incorporate thatinformation into the hazard maps to assess the risk of a particular area. A logicalextension beyond this would be to develop an interactive system for computationvisualization and communication on high-performance computers (Sheridan et al.,2002b). Such a system would allow scientists, civil protection officials and thegeneral public to have real-time access to potential hazards with realistic visualiz-ation of various scenarios at various scales. The hardware and interfaces for such asystem currently exist at several research facilities in the USA.
Acknowledgments
The authors thank Michael Abrams of JPL for supplying the DEM and other digitaldata used in this study. Civil protection authorities in the city of Xalapa and the stateof Veracruz provided valuable field assistance, vehicles, and aircraft for the fieldstage of this study. Special thanks goes to Jose Luis Murrieta and Sergio RodríguezElizarrarás of the Universidad Veracruzana in Xalapa for providing hospitality andlogistics throughout the study. This work was conducted with financial aid fromNASA grant NAG57579 and CONACYT Grant No. 27554.-T.
References
Alberico, I., Lirer, L., Petrosino, P., and Scandone, R.: 2002, A methodology for the evaluation oflong-term volcanic risk from pyroclastic flows in Campi Flegri (Italy), J. Volcanol. Geotherm.Res. 116, 63–78.
Band, L. E.: 1993, Extraction of channel networks and topographic parameters from digital elevationdata, in K. Beven et al. (eds.), Channel Network Hydrology, John Wiley & Sons, New York, pp.13–42.
Carrasco-Núñez G. and Rose, W. I.: 1995, Eruption of a major Holocene pyroclastic flow atCitlaltépetl volcano (Pico de Orizaba), Mexico, 8.5–9.0 ka, J. Volcanol. Geotherm. Res. 69,197–215.
Carrasco-Núñez, G.: 1999, Holocene block-and-ash flows from summit dome activity of Citlaltépetlvolcano, eastern Mexico, J. Volcanol. Geotherm. Res. 88, 47–66.
Heim, A.: 1932, Der Bergstruz von Elm, Deutch. Geol. Gesell. Zeitschr. 34, 74–115.Hooper, D. M. and Mattioli, G. S.: 2001, Kinematic modeling of pyroclastic flows produced by
gravitational dome collapse at Soufriere Hills volcano, Montserrat, Natural Hazards 23, 65–86.Höskuldsson, A. and Robin, C.: 1993, Late Pleistocene to Holocene eruptive activity of Pico de
Orizaba, eastern Mexico, Bull. Volcanol. 55, 571–587.Höskuldsson, A. and Cantagrel, J. M.: 1994, Volcanic hazards in the surroundings of Pico de Orizaba,
eastern Mexico, Natural Hazards 10, 197–219.Jenson, S. K. and Domingue, J. O.: 1988, Extracting topographic structure from digital elevation data
for geographic information system analysis, Photogram. Eng. Remote Sens. 54(11), 1593–1600.
PYROCLASTIC FLOW HAZARD AT VOLCAN CITLALTEPETL 221
Jones, N. L., Wright, S. G., and Maldment, D. R.:1990, Watershed delineation with triangle-basedterrain models, J. Hydraulic Eng. 116(10), 1232–1251.
Kover, T. P.: 1995, Application of a digital terrain model for the modeling of volcanic flows: a toolfor volcanic hazard determination, MSc Thesis, State University of New York at Buffalo, 62 pp.
Kover, T. P. and Sheridan, M. F.: 1993, Numerical Models for pyroclastic flows of Mt. Unzen, Japan,Geol. Soc. Amer. Abstracts with Programs 25, 268.
Macías, J. L., Carrasco-Núñez, G., Delgado, H., Martin del Pozzo, A. L., Siebe, C., Hoblitt, R. P.,Sheridan, M. F., and Tilling, R. I.: 1995, Mapa de Peligros del Volcán Popocatépetl, InformeFinal, Instituto de Geofisica, UNAM, México, 12 pp. & map.
Malin, M. C. and Sheridan, M. F.: 1982, Computer-assisted mapping of pyroclastic surges, Science217, 637–639.
Martin del Pozzo, A. L., Sheridan, M. F., Barrera, D., Hubp, J. L., and Selem, L. V.: 1995, Mapa dePeligros Volcán de Colima, Instituto de Geofisica, UNAM, México.
McEwen, A. S. and Malin, M. C., 1989, Dynamics of Mount St. Helens’ 1980 pyroclastic flows,rockslide-avalanche, lahars, and blast, J. Volcanol. Geotherm. Res. 37, 205–231.
Mellor, M.: 1978, Dynamics of snow avalanches, in B. Voight (ed.), Rockslides and Avalanches, 1,Natural Phenomena, Elsevier Science, Amsterdam, pp. 753–792.
Pariseau, W. G. and Voight, B.: 1979, Rockslides and avalanches - basic principles and perspect-ives in realm of civil and mining operations, in B. Voight (ed.), Rockslides and Avalanches, 2,Engineering Sites, Elsevier Science, Amsterdam, pp. 1–92.
Saucedo, R., Komorowski, J-C., Macías, J. L., and Sheridan, M. F.: 1997, Modeling of pyro-clastic flows generated during the 1913 eruption of Colima Volcano, México, EOS, Trans. Amer.Geophys. Union 78, F823.
Sheridan, M. F.: 1979, Emplacement of pyroclastic flows – A review, in C. E. Chapin et al. (eds.),Ash Flow Tuffs, Geol. Soc. Amer. Special Paper 180 pp. 125–136.
Sheridan, M. F. and Kover, T.: 1996, FLOW3D: A computer code for simulating rapid, open-channelvolcanic flows, in Proc. UJST workshop on the Technology of Disaster Prevention against LocalSevere Storms, Norman OK, pp. 155–163.
Sheridan, M. F. and Macías, J. L.: 1992, PC software for 2-dimensional gravity-driven flows: Ap-plication to Colima and El Chichón Volcanoes, México, Proc. Second International Meeting onVolcanology, Colima, México, 5.
Sheridan, M. F. and Malin, M. C.: 1983, Application of computer-assisted mapping to volcanichazard evaluation of surge eruption: Vulcano, Lipari, Vesuvius, in M. F. Sheridan et al. (eds.),Explosive Volcanism, J. Volcanol. Geotherm. Res. 17, 187–202.
Sheridan, M., Carrasco-Núñez, G., Hubbard, B., Siebe, C., and Rodríguez, S., 2002a. Mapa de Pelig-ros del Volcán Citlaltépetl (Pico de Orizaba). Institutes of Geology, Geophysics and Geographyof UNAM, and Governments of Veracruz and Puebla States.
Sheridan, M. F., Bloebaum, C. L., Kesavadas, T., Patra, A. K., and Winer, E.: 2002b, Visualizationand Communication in Risk Management of Landslides, in C. A. Brebbia (ed.), Risk AnalysisIII, WIT Press, Southampton, pp. 691–701.
Siebe, C., Abrams, M. and Sheridan, M. F.: 1993, Major Holocene block-and-ash fan at the west-ern slope of ice-capped Pico de Orizaba volcano, México: Implications for future hazards, J.Volcanol. Geotherm. Res. 59, 1–33.
Tilling, R. I.: 1989, Volcanic hazards and their mitigation: Progress and problems, Reviews ofGeophysics 27, 237–269.
Wadge, G. and Isaacs, M. C.: 1988, Mapping the volcanic hazards from Soufriere Hills volcano,Montserrat, West Indies using an image processor, J. Geol. Soc. London 145, 541–551.
Wadge, G., Jackson, P., Bower, S. M., Woods, A. W., and Calder, E.: 1998, Computer simulations ofpyroclastic flows from dome collapse, Geophys. Res. Lett. 25, 3677–3680.


