Embed Size (px)
Citation preview

The Mechanical Behaviour of a Pyroclastic Rock:Yield Strength and ``Destructuration'' Effects
By
S. Aversa and A. Evangelista
Department of Geotechnical Engineering, University of Naples, Naples, Italy
Summary
A research programme on the mechanical behaviour of a homogenous volcanic tuff found in thecentre of the city of Naples (Italy) was carried out at the University of Naples a few years ago.Isotropic and drained triaxial tests were performed in a very wide range of con®ning pressures (upto 60 MPa). After presenting the stress-strain curve pattern and the mean stress in¯uence on theshear behaviour, the paper focuses on the de®nition of a strength criterion and of the yield surfacefor this material. Some tuff samples were subjected to isotropic compression tests up to acon®ning pressure approximately twice as high as the isotropic yield stress; they were sub-sequently unloaded and subjected to drained triaxial tests. Partial loosening of the interparticlebonds (``destructuration'') was observed. The paper also compares the mechanical behaviour ofintact and ``destructured'' samples, emphasising the effects of the structure on strength and yield.
1. Introduction
The hills which form the skyline of the city of Naples are made up mainly of pyroclastic
rocks originating in volcanic eruptions in the Phlegrean Fields, an active volcanic area a
few kilometres to the west of the city centre. Among these rocks, the Neapolitan Yellow
Tuff (NYT), which has been studied extensively at the University of Naples (Pelle-
grino, 1970 and 1974; Evangelista, 1980), is the most common in the ®rst hundred
metres below the ground level. A comprehensive report on the NYT physical and
mechanical properties was published by Evangelista and Pellegrino (1990) and by
Evangelista and Aversa (1994). The main physical and mechanical properties were
determined on the basis of huge number of tests, but the experimental results were
scattered over wide ranges; it was not possible to give a more detailed interpretation.
A more homogenous tuff, called Fine-Grained Tuff (FGT), is present in very
limited zones of the city's subsoil. This material is older than the NYT and it owes its
name to the ®ne grain size of its constituent particles and to the lack of pumiceous
inclusions which are very common in other types of Neapolitan tuff.
The research programme described in the present paper was carried out on FGT.
Because of the limited diffusion of this tuff, the engineering purpose of the research
Rock Mech. Rock Engng. (1998) 31 (1), 25±42Rock Mechanics
and Rock Engineering
q Springer-Verlag 1998
Printed in Austria
m

was not to determine the values of the mechanical properties, but mainly to de®ne the
behaviour pattern so that the ®ndings could be extended to the most common NYT and,
in general, to other pyroclastic rocks. The material samples were subjected to
oedometer, isotropic and triaxial tests; the latter were carried out both in drained and
undrained conditions. The experimental programme was started in 1990 and pre-
liminary test results were published by Aversa et al. (1991). This paper deals essentially
with the results of isotropic and drained triaxial tests; furthermore, it proposes a
strength criterion and de®nes the shape of the yield surface. The test results clearly
showed the in¯uence of the ``structure'', as de®ned by Leroueil and Vaughan (1990),
on the mechanical behaviour of the material. Stiff behaviour was observed before a
well-de®ned yield stress, which corresponds with the beginning of the so-called
``destructuration''.
Some special drained triaxial tests were performed in order to investigate the effect
of ``destructuration'' on the mechanical behaviour of the material. In these tests the
samples were ®rst isotropically compressed to an effective stress which was approxi-
mately twice as high as the isotropic yield stress and subsequently unloaded to a lower
value. Standard triaxial tests were then carried out. The effect of the structure was
assessed by comparing the test results with those obtained on intact samples.
This study can be regarded as part of a wider research programme aiming at
bringing together in a single framework the behaviour of different materials char-
acterised by the presence of interparticle bonds (Aversa et al., 1993). The experimental
programme was carried out on saturated samples in order to determine volumetric
strains on the basis of the expelled water volume. Evangelista and Pellegrino (1990)
regarded the effective stress principle as valid for tuff. In agreement with the Cambridge
convention, the mean effective stress p0 and the deviatoric stress q for axial ±
symmetric state of stress are expressed in the following as:
p0�
j01 � 2´j0
3
3
q � j1 ÿ j3 �1�
Compressive stresses and contractive strains are assumed to be positive.
2. Materials and Methods
The FGT is a homogenous pyroclastic rock, approximately 15,000 years old, that
resulted from deposition and diagenesis of hot pyroclastic products erupted from the
Phlegrean Fields. Its main physical and mechanical properties are summarised in
Table 1. Porosity n ranges between 0.45 and 0.50, which is typical of pyroclastic rocks.
The speci®c gravity gs is equal to 24.3 kN/m3. The mean dry unit weight is 12.8 kN/m3.
The pore size is very small in comparison with other tuffs. A Mercury Porosimeter was
used to evaluate the pore size statistical distribution. It was found (Aversa et al., 1991)
that the radius of pores is smaller than 0.1 mm in almost 25% of the volume of pores and
it ranges between 0.1 mm and 1 mm in 50%. For this reason the material permeability is
very low as compared with other Neapolitan tuffs (Aurisicchio et al., 1982), being on
S. Aversa and A. Evangelista26
m

average 1:6´10ÿ9 m/s. The mean uniaxial compressive strength determined on saturated
samples is 8.0 MPa. The material was picked up in irregular blocks while excavation
were being carried out. Triaxial test samples (5.0 cm in diameter and 10.0 cm in height)
were cored in the laboratory using a rotatory drilling core and then cut by means of a
rock saw. A lathe was used to smooth the bases and make them parallel to each other.
The samples were saturated under vacuum as follows. Each sample at room water
content was placed in a container and kept under vacuum for some hours; then the
container was ®lled very slowly with de-aerated water. Once the sample was sub-
merged, the vacuum was maintained for almost 36 h. The saturated sample was
mounted onto a triaxial cell and maintained under back-pressure (300 kPa) for some
days. A special B-test was performed to evaluate the effectiveness of the procedure:
under undrained conditions the cell pressure j3 was increased in steps and the pore
pressure u was measured at each step. The sample was deemed saturated if the value of
B remained the same whenever the cell pressure was stepped up. The typical mean
value of B for saturated FGT samples was 0.9. Two triaxial cells were used: a
commercial W&F cell that can work under a cell pressure of 14 MPa and a very
stiff cell ± originally designed at the University of Naples and built by Costruzioni
Meccaniche Baratto (Naples) ± with which cell pressures up to 70 MPa can be applied.
Three different systems were used to generate and control the cell pressure:
ordinary mercury pots for low cell pressures (up to 2 MPa) and two alternative systems
for higher cell pressures, namely a commercial pressure generator produced by W&F
(with maximum pressure of 70 MPa) and a system assembled at the University of
Naples. The latter was actually a booster amplifying the air pressure generated by
means of a regular compressor by 50 times.
The back-pressure was generated by means of mercury pots. A very stiff mechani-
cal loading frame which could supply a maximum load of 500 kN was used to apply the
axial stress under strain control (v � 0:004ÿ0:015 mm/min). Within this range of
velocity pore pressure measurements taken on one of the bases of the sample suggested
that no excess pore pressure had been generated in the sample under test.
Axial load and displacement were measured outside the triaxial cell; volumetric
strains were determined by measuring the volume of water entering or leaving the
sample. Thirty-four samples were tested; the initial void ratio and test conditions for
each sample are shown in Table 2.
3. Isotropic Compression Tests
Isotropic compression tests on saturated samples were performed using the 70 MPa
The Mechanical Behaviour of a Pyroclastic Rock 27
Table 1. Basic average properties of FineGrained Tuff
Dry unit weight 12.8 kN/m3
Porosity 47.3%Compressive strength 8.0 MPaPermeability 1:6 ´ 10ÿ9 m/s
m

triaxial cell. The cell pressure was applied in steps and volumetric strains were
determined during each step.
The experimental volumetric strain-time relation demonstrated on sample 44 in
each step of the test is shown in Fig. 1. When the cell pressure is lower than a threshold
value (yield stress in isotropic compression), the volumetric strains are very small
and practically time-independent. Primary consolidation occurs very quickly (almost
instantaneously); no signi®cant creep volumetric strains are observed. For con®ning
pressures higher than the threshold value, the volumetric strains are signi®cantly higher
than before. A well-de®ned consolidation curve is observed; creep is slightly more
pronounced. Similar results were obtained on other samples.
The results of the isotropic compression tests performed on sample TR13 are shown
in a conventional semi-logarithmic void ratio e vs. isotropic effective stress p0 diagram
(Fig. 2a) and in a bulk modulus K vs. isotropic effective stress p0 diagram (Fig. 2b). In
the ®rst part of the stress-strain curve the bulk modulus is very high and almost
S. Aversa and A. Evangelista28
Table 2. Initial void ratios and test conditions of the samples
Sample Test Void ratio Effective con®ningpressure (MPa)
TR1 CID 0.908 0.90TR2 CID 0.953 2.40TR3 CID 0.883 7.70TR4 CID 0.905 11.50TR5 CID 0.773 4.70TR6 IC 0.900 ±TR7 CID 0.876 0.10TR9 CID 0.887 9.40TR10 IC 0.870TR12 CID 0.873 4.80TR13 IC 0.988TR14 CID 0.901 3.70TR17 CID 0.855 13.70TR18 CID 0.916 3.301 CID 0.927 29.143 CID 0.830 1.676 CID 0.950 0.29
21 CID 0.910 0.9022 CID 0.950 1.1824 CID 0.950 0.0525 CID 0.870 1.5728 CID 0.850 0.5930 CID 0.840 0.2036 CID (destr.) 0.944 11.5044 IC 0.814 ±46 CID 0.839 1.7648 CID (destr.) 0.830 1.5752 CID 0.909 19.3254 CID (destr.) 0.876 0.9857 CID (destr.) 0.918 29.3264 CID (destr.) 0.809 0.4966 CID (destr.) 0.842 19.32A EXT.B EXT.
m

constant. The yield stress is about 18 MPa. At higher stresses, a dramatic decrease in
stiffness, connected with the ``destructuration'' phase, can be observed in Fig. 2b. Then
stiffness gradually increases, as in ``non-structured'' soils. Unloading and reloading
cycles demonstrate the non-reversible nature of the strains and the stiff behaviour of the
material during these cycles.
Similar results were obtained on other samples (see Fig. 3). The experimental
results are scattered, but the dependence of the yield stress on void ratio is evident: the
higher the initial void ratio, the lower the yield stress. The average yield stress is
20 MPa. After yield the e-log(p0) curves are parallel to each other. A normal
compression line (NCL) similar to that obtained for soils, has been drawn in Fig. 3.
The slope of this line is 0.389. The unloading and reloading lines are rather ¯at.
Despite the presence of signi®cant interparticle bonding, the e-log(p0) curves are
similar to the curve obtained for reconstituted and overconsolidated clays. The presence
of a ``structure'' does not produce the typical shape with a point of in¯ection that
has been demonstrated in several structured soils (Leroueil and Vaughan, 1990). A
comparison between the behaviour of different structured materials has already been
presented by Aversa (1991) and Aversa et al. (1993).
4. Drained Triaxial Tests
The mechanical behaviour of the Fine-Grained Tuff along stress-paths approaching
failure is in¯uenced by the value of the mean effective stress.
Some drained triaxial test results are shown in Figs. 4a and 5a. Volumetric strains
vs. axial strain curves are reproduced in Figs. 4b and 5b.
When the effective con®ning pressure is low, the behaviour is approximately linear
up to failure, which occurs at low values of axial strains (about 0.5%). In this range the
stress-strain relation is really linear-elastic, as con®rmed by Tatsuoka (1995) who
performed some drained and undrained triaxial tests on Fine Grained Tuff measuring
The Mechanical Behaviour of a Pyroclastic Rock 29
Fig. 1. Isotropic compression test on sample 44: volumetric strains vs. time for different load steps
m

S. Aversa and A. Evangelista30
Fig. 2. Isotropic compression test on sample T13: a void ratio vs. mean effective stress; b bulk modulus vs.mean effective stress
Fig. 3. Isotropic compression tests: void ratio vs. mean effective stress
m

locally axial strains by means of special internal devices. After peak, suddenly the
strength decreases signi®cantly (brittle behaviour). The strength reduction is less
evident as the con®ning effective stress increases; that is, brittleness decreases as the
effective con®ning pressure rises. The stress-strain curves approach a constant strength
value. At higher values of the effective con®ning pressure, the behaviour is signi®-
cantly different. The material shows a linear-elastic behaviour only in the ®rst part of
the stress-strain curve, which then turns into a strain hardening elasto-plastic behaviour.
Failure is reached after large axial strains (up to 20%). Before yield, the uniaxial mod-
ulus of deformability of the materials is practically independent of both deviatoric and
mean effective stresses. Tuff dilates only at very low effective con®ning pressures (below
1 MPa). The maximum rate of dilatancy occurs only after peak, as usual for soft rocks
and many ``structured'' soils (Aversa, 1991). Similar results were obtained by Lagioia
(1994) who observed on a soft calcarenite that dilatancy occurred only after peak.
In an intermediate range of con®ning pressure the experimental data show a
The Mechanical Behaviour of a Pyroclastic Rock 31
Fig. 4. Drained triaxial tests at low mean effective stresses: a deviatoric stress vs. axial strain; b volumetricstrain vs. axial strain
m

contractant behaviour associated with a well-de®ned brittle behaviour. In other soft
rocks such as the calcarenite tested by Elliot and Brown (1985), the transition from
dilatant to contractant behaviour coincides with the change from strain softening to
strain hardening behaviour.
In general, in the case of large strains, when the deviatoric stress reaches a constant
value, the volumetric strains are not yet stabilised. For this reason, this state can be
de®ned as ultimate and not as critical.
The material was subjected also to some uniaxial compressive and uniaxial ten-
sile tests. The uniaxial tensile strength was on average 10% of the mean uniaxial
compressive strength.
5. Strength Criterion
As shown in the previous paragraph, when the con®ning pressure is low, a peak and an
ultimate strength value can be measured, but when it is high only an ultimate value can
be recorded.
S. Aversa and A. Evangelista32
Fig. 5. Drained triaxial tests at high mean effective stresses: a deviatoric stress vs. axial strain; b volumetricstrain vs. axial strain
m

Both ultimate and peak strength points are reported in Fig. 6. The ultimate strength
points are well interpolated by means of a linear relation (Mohr-Coulomb criterion)
passing through the origin of the axis. The slope M of this line is 1.28, that corresponds
to an angle of shear resistance J0� 358220.
Looking at the enlargement of the ®gure at low mean stresses (see Fig. 7) it is
evident that the ultimate strength points are located above the ultimate strength
envelope. Within this stress range, a power function (the chain dotted line in Fig. 7)
®ts the experimental data much better. This feature has also been noticed by Lefebvre
(1970) with reference to sensitive clays. According to Aversa et al. (1993) this feature
was due to dilatancy in correspondence to the ultimate state condition.
The Mechanical Behaviour of a Pyroclastic Rock 33
Fig. 6. Proposed strength criterion
Fig. 7. Enlargement of Fig. 6 at low stresses
m
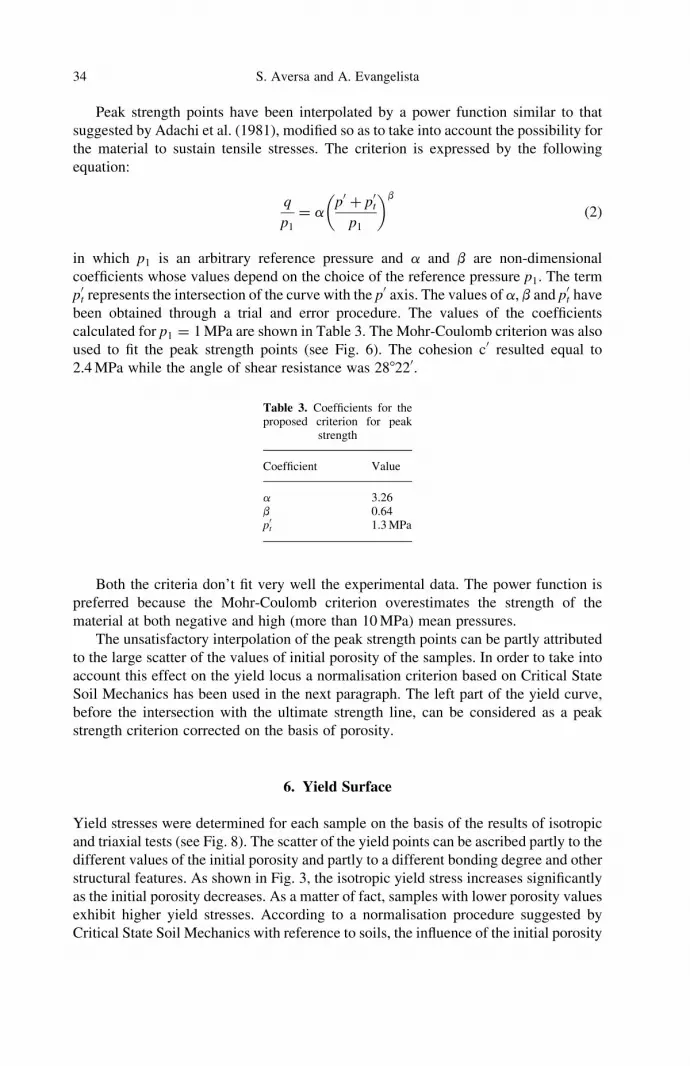
Peak strength points have been interpolated by a power function similar to that
suggested by Adachi et al. (1981), modi®ed so as to take into account the possibility for
the material to sustain tensile stresses. The criterion is expressed by the following
equation:
q
p1
� ap0� p0
t
p1
� �b
�2�
in which p1 is an arbitrary reference pressure and a and b are non-dimensional
coef®cients whose values depend on the choice of the reference pressure p1. The term
p0t represents the intersection of the curve with the p0 axis. The values of a, b and p0
t have
been obtained through a trial and error procedure. The values of the coef®cients
calculated for p1 � 1 MPa are shown in Table 3. The Mohr-Coulomb criterion was also
used to ®t the peak strength points (see Fig. 6). The cohesion c0 resulted equal to
2.4 MPa while the angle of shear resistance was 288220.
Both the criteria don't ®t very well the experimental data. The power function is
preferred because the Mohr-Coulomb criterion overestimates the strength of the
material at both negative and high (more than 10 MPa) mean pressures.
The unsatisfactory interpolation of the peak strength points can be partly attributed
to the large scatter of the values of initial porosity of the samples. In order to take into
account this effect on the yield locus a normalisation criterion based on Critical State
Soil Mechanics has been used in the next paragraph. The left part of the yield curve,
before the intersection with the ultimate strength line, can be considered as a peak
strength criterion corrected on the basis of porosity.
6. Yield Surface
Yield stresses were determined for each sample on the basis of the results of isotropic
and triaxial tests (see Fig. 8). The scatter of the yield points can be ascribed partly to the
different values of the initial porosity and partly to a different bonding degree and other
structural features. As shown in Fig. 3, the isotropic yield stress increases signi®cantly
as the initial porosity decreases. As a matter of fact, samples with lower porosity values
exhibit higher yield stresses. According to a normalisation procedure suggested by
Critical State Soil Mechanics with reference to soils, the in¯uence of the initial porosity
S. Aversa and A. Evangelista34
Table 3. Coef®cients for theproposed criterion for peak
strength
Coef®cient Value
a 3.26b 0.64p0
t 1.3 MPa
m

can be eliminated by dividing the yield stress by a reference pressure p00. This pressure
is the mean effective stress corresponding to the intersection of the recompression line,
relative to the initial porosity of the sample, with the isotropic compression line. This
kind of normalisation (see Fig. 9) actually reduces the scatter of the data signi®cantly,
but it cannot prevent it as normally happens when the tuff mechanical parameters are
correlated with porosity. According to Evangelista and Aversa (1994), other structural
features of tuff (e.g. degree of interparticle bonding) in¯uences the mechanical
behaviour of the material. The normalised yield points can be interpolated by means
of a yield curve derived from the Modi®ed Cam-Clay, developed at the end of `60 for
describing the behaviour of clays (Roscoe and Burland, 1968), revised in order to make
The Mechanical Behaviour of a Pyroclastic Rock 35
Fig. 8. Yield stresses in the q ÿ p0 plane
Fig. 9. Yield stresses in the normalized plane q=p00 ÿ p=p0
0 and representation of the proposed yield curve
m

allowances for the uniaxial tensile strength of the tuff:
q
p00
� �2
� R2 p0
p00
�p0
tr
p00
� �1 �
p0tr
p00
� �ÿ
p0
p00
�p0
tr
p00
� �2" #
�3�
in which p0tr=p
00 is the absolute value of the negative intersections of the yield curve with
the p0=p00 axis; R is the ratio between the vertical and horizontal axes of the ellipse. The
parameter R does not necessarily coincide with the slope M of the ultimate strength
line, as in Critical State Soil Mechanics. The values of the parameters R and p0tr=p
00 were
obtained with a trial and error procedure, ®xing p0tr=p
00 and computing R by means of a
least square technique. The ®nal values of the parameters, shown in Table 4, are that
which maximised the coef®cient of correlation.
7. Behaviour of Destructured Samples
Seven tuff samples were subjected to isotropic compression tests with a maximum
effective mean stress p0� 40 MPa. After unloading, the samples were subjected to
standard drained triaxial stress-paths within a wide range of effective con®ning
pressures (j03 � 0:1 4 30 MPa).
The stress-strain behaviour exhibited by one of these tests during the isotropic
compression phase is sketched on a diagram e-log(p0) (see Fig. 10).
S. Aversa and A. Evangelista36
Table 4. Coef®cients for theproposed yield criterion
Coef®cient Value
R 1.24P0
tr=p00 0.01
mean p00 20 MPa
mean p0tr 200 kPa
Fig. 10. ``Destructuration'' phase: void ratio vs. mean effective stress
m

The yield stresses measured along this stress path are approximately equal to
20 MPa. After yield, the samples experienced volumetric strains which varied from
case to case, and averaging 10%. In this phase partial ``destructuration'' took place
which was accompanied by a strain-hardening effect with an increase of isotropic yield
stress. In Fig. 11 the stress-strain behaviour obtained from a drained triaxial test on a
previously destructured sample and the behaviour of an intact sample subjected to the
same con®ning stress (j03 � 0:1 MPa) are compared. The comparison between devia-
toric stress-axial strain curves (see Fig. 11a) clearly shows that ``destructuration''
brings about a signi®cant reduction in peak strength and stiffness, but it has no
signi®cant in¯uence on the ultimate strength.
The stress-strain curve of the destructured sample still shows a brittle behaviour.
The decrease in strength after peak is still signi®cant, as typically occurs when a shear
surface develops in a structured material. This observation may prove that the
``destructuration'' induced during isotropic compression is not complete. Larger
The Mechanical Behaviour of a Pyroclastic Rock 37
Fig. 11. Comparison between intact and destructured samples in drained triaxial tests at low mean effectivestresses: a deviatoric stress vs. axial strain; b volumetric strain vs. axial strain
m

volumetric strains (i.e. larger isotropic stresses) are probably required in order to
completely destroy the structure of this tuff.
The comparison between volumetric strain-axial strain curves (see Fig. 11b) shows
that ``destructuration'' decreases dilatancy, which is probably due to reduced rough-
ness of the failure surface. Similar results were obtained on other destructured samples
tested at small effective con®ning pressures.
At high effective con®ning pressures, the combination of ``destructuration'' and
porosity reduction (i.e. isotropic yield stress increase) has different effects. The stress-
strain behaviour determined by a drained triaxial test performed at high effective
con®ning stresses (j03 � 11:7 MPa) on a previously destructured sample is compared
with the behaviour of an intact sample tested at the same effective con®ning pressure
(see Fig. 12). The comparison between deviatoric stress-axial strain curves (see
Fig. 12a) clearly shows that the yield stress is higher in the partially destructured
sample than in the intact one. In this stress range the effect of porosity reduction
prevails on partial ``destructuration''.
S. Aversa and A. Evangelista38
Fig. 12. Comparison between intact and destructured samples in drained triaxial tests at high mean effectivestresses: a deviatoric stress vs. axial strain; b volumetric strain vs. axial strain
m

The ultimate strength does not seem to be signi®cantly in¯uenced by ``destructura-
tion''. Unfortunately, the test on the intact sample did not show a full development of
the ultimate strength. The comparison between volumetric strain-axial strain curves
(see Fig. 12b) shows that lower volume changes occur during tests performed on the
destructured samples which had already experienced signi®cant volumetric strains in
isotropic compression. Similar results were obtained on other destructured samples
tested at high values of effective con®ning pressure.
The peak and ultimate strength points derived from tests carried out on destructured
tuff samples were compared with the failure envelope obtained on intact tuff (see
Fig. 13). Peak strength points lie signi®cantly below the peak strength curve obtained
on intact tuff, whereas the ultimate strength points lie very close to the corresponding
curve obtained on intact material, as already mentioned. For purpose of comparison, the
curved envelope of Fig. 7 is also drawn in Fig. 13.
In order to point out the in¯uence of ``destructuration'' on the yield surface, the
yield points obtained on the destructured samples are compared with the intact tuff
yield curve in the dimensionless plane q=p00 ÿ p0=p0
0 (see Fig. 14). With this diagram the
``destructuration'' effect can be represented and the effect of the porosity reduction can
be hidden, since it is automatically taken into account when the normalisation
procedure is applied. The yield points of the destructured samples lie deeply inside
the yield curve for the intact material. The intact and destructured material yield curves
are represented in the natural plane q ÿ p0 (Fig. 15) so that the combined effect of
``destructuration'' and porosity reduction can be shown. This effect consists in an
increase of the maximum diameter of the ellipse and a reduction of the ratio between
the minimum and the maximum diameters. A translation of the intercept with the
negative p0 axis is also observed. The ellipse indicated with the solid line is an
homotetic enlargement of the yield surface of intact material: it represents the
The Mechanical Behaviour of a Pyroclastic Rock 39
Fig. 13. Peak and ultimate strength of destructured samples compared with the strength criterion of intactsamples
m

theoretical yield surface of a material that does not experience ``destructuration'' when
the isotropic yield stress increases from 20 MPa to 40 MPa.
8. Conclusions
An extensive research programme was carried out on a volcanic tuff known as Fine-
Grained Tuff after the ®ne and homogenous grain size of its constituent particles.
Oedometric test results have already been published by Aversa et al. (1991). This paper
reports exclusively on the results of isotropic and drained triaxial test. The most
S. Aversa and A. Evangelista40
Fig. 14. Yield stresses of destructured samples compared with the yield curve of intact samples in thenormalized plane
Fig. 15. Evolution of yield curve during isotropic compression
m

important ®ndings can be brie¯y summarised as follows:
a) The isotropic compression test results are very similar to the data obtained on
reconstituted and overconsolidated clays, with a very well-de®ned yield stress. The
yield stress depends on the value of the initial void ratio of the sample. A normal
compression line can be de®ned for this material.
b) The mechanical behaviour during the triaxial tests is in¯uenced by the value of the
con®ning pressure. The stress-strain relation is linear-elastic before a very well-
de®ned yield stress. The after-peak decrease in strength, if any, is very abrupt.
c) A strength criterion has been proposed. A power function interpolates the peak
strength points; a linear function is used for the ultimate strength points.
d) The yield stress values depend on the initial porosity of the material, in both
isotropic and triaxial tests. A normalisation procedure based on Critical State Soil
Mechanics has been adopted successfully to reduce the scatter of the data, although
this is not eliminated. Yield points lie very close to the proposed yield surface,
which is derived from the Modi®ed Cam-Clay yield surface.
e) Triaxial tests on previously destructured samples have shown a reduction in stiffness
and peak strength. The ultimate strength does not seem to be affected by
``destructuration''. Even yield stresses are in¯uenced by ``destructuration''; the
yield surface is modi®ed in size and shape.
Acknowledgements
This research was carried out with the ®nancial support of the Ministerio dell'UniversitaÁ e dellaRicerca Scienti®ca e Tecnologica (MURST) and of the Consiglio Nazionale delle Ricerche(CNR).
The experimental work which this paper is based on was performed by three undergraduatestudents (Rosaria Pilegi, Bianca Travi and Antonella Feola) as their Bachelor Theses. The authorswish to thank them for the enthusiasm they showed in working at the Laboratory.
References
Adachi, T., Ogawa, T., Nishi, K. (1981): Mechanical properties of soft rocks and rock masses.Proc., 10th ICSMFE, Stockholm, 1, 527±530.
Aurisicchio, S., Evangelista, A., Masi, P. (1982): Il Tufo Giallo Napoletano: permeabilitaÁ edimpregnabilitaÁ con monomeri acrilici. Riv. Ital. Geotecnica 16 (1), 22±27.
Aversa, S. (1991): Mechanical behaviour of soft rocks: some remarks. Proc., Workshop onExperimental characterization and modelling of soils and soft rocks, Napoli, 191±223.
Aversa, S., Evangelista, A., Ramondini, M. (1991): Snervamento e resistenza a rottura di untufo a grana ®ne. Atti del II Convegno dei Ricercatori del G.N.C.S.I.G. del C.N.R., Ravello,3±22.
Aversa, S., Evangelista, A., Leroueil, S., Picarelli, L. (1993): Some aspects of the mechanicalbehaviour of ``structured'' soils and soft rocks. Proc., Int. Symp. on Geotechnical Engineer-ing of Hard Soils and Soft Rocks, Athens, 1, 359±366.
Elliot, G. M., Brown, E. T. (1985): Yield of a soft, high porosity rock. GeÂotechnique 35 (4), 413±423.
The Mechanical Behaviour of a Pyroclastic Rock 41
m

Evangelista, A. (1980): In¯uenza del contenuto d'acqua sul comportamento del Tufo GialloNapoletano. Atti del XIV Convegno Nazionale di Geotecnica, Firenze, 2, 63±68.
Evangelista, A., Aversa, S., (1994): Experimental evidence of non-linear and creep behaviour ofpyroclastic rocks. Proc., Course on Visco-plastic Behaviour of Geomaterials. Cristescu, N. D.,Gioda, G. (eds.), CISM Courses and Lectures No. 350, Springer Wien New York, 55±102.
Evangelista, A., Pellegrino, A. (1990): Caratteristiche Geotecniche di alcune rocce tenereitaliane. Terzo Ciclo di Conferenze di Meccanica e Ingegneria delle Rocce (MIR), Torino,2, 1±32.
Lagioia, R. (1994): Comportamento meccanico dei terreni cementati naturali: indagine speri-mentale ed interpretazioni teoriche. Ph.D. Thesis, Technical University of Milano.
Lefebvre, G. (1970): Contribution aÁ l'etude de stabilite des pentes dans les argiles cimenteÂes.Ph.D. Thesis, Laval University, Quebec.
Leroueil, S., Vaughan, P. R. (1990): The general and congruent effects of the structure in naturalsoils and weak rocks. GeÂotechnique 40 (3), 467±488.
Pellegrino, A. (1970): Mechanical behaviour of soft rocks. Proc., Second Congress of the Int.Soc. for rock Mech., Belgrade, 3±25.
Pellegrino, A. (1974): Surface footing on soft rocks. Proc., Third Congress of the Int. Soc. forRock Mech., Denver, 2, 733±738.
Roscoe, K. H., Burland, J. B. (1968): On the generalized stress-strain behaviour of `wet' clay. In:Heyman, J., Leckie, F. A. (eds.), Engineering plasticity, Cambridge University Press, 535±609.
Tatsuoka, F. (1995): Private communication.
Authors' address: Dr. Stefano Aversa, UniversitaÁ degli Studi di Napoli Federico II, FacoltaÁdi Ingegneria, Dipartimento di Ingegneria Geotecnica, Via Claudio 21, I-80125 Napoli, Italy.
S. Aversa and A. Evangelista: The Mechanical Behaviour of a Pyroclastic Rock42
m


