Embed Size (px)
Citation preview


PRESENTERS
Michael HolmbergCEO
Andreas KovacsCFO

TABLE OFCONTENT
Who we are and what we do
Key highlights during Q4
Financials Q4 2018
Strategic update
Summary
Q&A
WORKING TOGETHER TO SHAPETHE FUTURE OF AFFILIATION
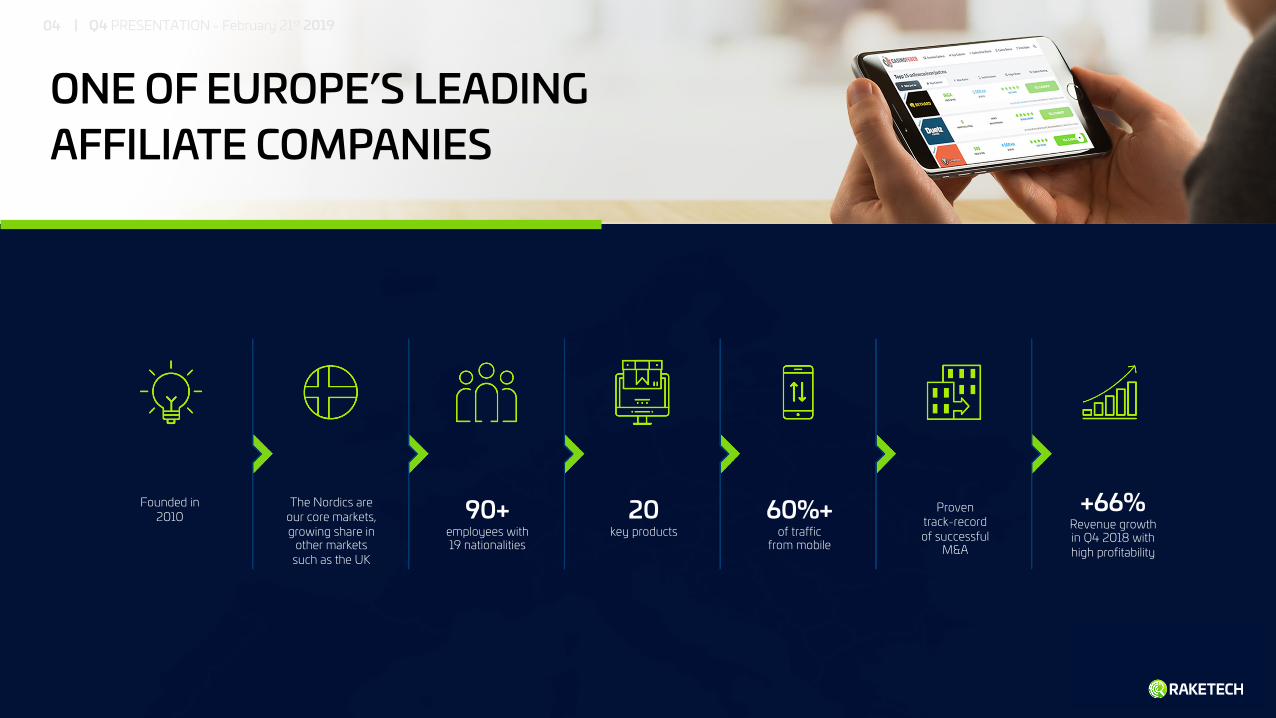
ONE OF EUROPE’S LEADING AFFILIATE COMPANIES
| Q4 PRESENTATION - February 21st 201904
Founded in 2010
The Nordics are our core markets, growing share in
other markets such as the UK
90+employees with19 nationalities
20key products
60%+of traffic
from mobile
Proventrack-recordof successful
M&A
+66%Revenue growth in Q4 2018 with high profitability

WHAT WE DO| Q4 PRESENTATION - February 21st 201905
”We match the right player with theright gaming company”

QUARTERLY FINANCIAL HIGHLIGHTS| Q4 PRESENTATION - February 21st 201906
REVENUES
EUR 7.6mQoQ growth: 8.6%YoY: 65.6%Organic growth: 50.2%
EBITDA (ADJ.)
EUR 4.5mQoQ growth: 12.2%
YoY: 136.5%EBITDA-margin: 59.3%
NDCs
35 948 NDCsQoQ growth: 14.0%
YoY: 141.4%
“Continued strong organic growth”

QUARTERLY STRATEGIC HIGHLIGHTS| Q4 PRESENTATION - February 21st 201907
§ CORE• Continued ranking improvement
§ LAB• Launch of the global products
• Esportsguide.com• Cryptimi.com
• In-banner Pay N Play capability• Rapidi.com – a new Pay N Play casino brand
§ M&A• Acquisition of Norwegian consumer finance
affiliate assets
§ Compliance• Fully implemented compliance policy across our
product portfolio ahead of the Swedish regulation
§ Financing• Optimised capital structure – new revolving credit
facility of EUR 10m
| Q4 PRESENTATION - February 21st 201908
§ New innovative project from Raketech’s LAB
§ Developed through white label partnership
§ Focus markets: Sweden and Finland
§ Gather user data to help us optimise our product portfolio
§ To be launched before the end of Q1
RAPIDI.COM – Introducing a new Pay N Play casino brand

DRIVING A RESPONSIBLE AND COMPLIANTAFFILIATION BUSINESS IN SWEDEN
| Q4 PRESENTATION - February 21st 201909
SW EDEN STATUS
§ High demand for affiliate services
§ W orking only with licensed operators, including old monopoly companies
§ Raketech first affiliate member of Sper (Swedish gambling association)
OPPORTUNITIES
§ Business as usual in January, in line with our financial targets
§ Know-how from Denmark and UK
§ W ell prepared for PPC
§ Significant room for further underlying market growth

SWEDEN UPDATE| Q4 PRESENTATION - February 21st 201910
Revenue Jan19 vs Jan18
January performance in line with our financial targets in terms of YoY revenue growth
LTV Jan19 vs Dec18
January performance reflects on average 10% lower LTV than in December 2018
+30%
-10%

FINANCIALS Q4 2018

HISTORICAL REVENUE DEVELOPMENT
CAGR last 2 years 51 %
Revenue growth of 9 % between Q3 and Q4 2018 driven by strong underlying growth, especially
within the sport segment in Finland and Sweden
| Q4 PRESENTATION - February 21st 201912
Revenue (EUR 000)
”Significant QoQ revenue growth”
2,235 2,473 2,5883,141 3,356
4,2634,925 4,601
4,901
6,027
7,0097,620
0
1,000
2,000
3,000
4,000
5,000
6,000
7,000
8,000
Q1-16 Q2-16 Q3-16 Q4-16 Q1-17 Q2-17 Q3-17 Q4-17 Q1-18 Q2-18 Q3-18 Q4-18
+ 10.6 % + 4.7 %+ 21.4 % + 6.8 %
+ 27.0 %+ 15.5 % - 6.6 % + 6.5 %
+ 16.4 %
+ 23.0 %
+ 8.7 %

REVENUE SPLIT
• Significant revenue growth by 66% compared to last year
• Strong quarter for our sports assets driven by the strong growth of TVmatchen and our Finnish sports assets
• Flat fee revenue increased by 1.9 pp compared to Q3
70.7%
25.8%
3.5%
CASINO SPORTSBOOK OTHER
45.2%
41.2%
13.6%
REVENUE SHARE UPFRONT PAYMENT FLAT FEE
Organic growth
50.2%
Acquired growth
15.4%
Revenue growth
65.6%
| Q4 PRESENTATION - February 21st 201913
REVENUE SPLIT BY VERTICAL REVENUE STREAMS
”Increased the share of sportsbook revenue by 9 pp compared to Q3”

0.00%
10.00%
20.00%
30.00%
40.00%
50.00%
60.00%
70.00%
EBITDA DEVELOPMENT
EBITDA margin increased by 0.6 pp from Q3 to Q4
EBITDA Q3
Direct costs relating to fixed fees and commission revenue
1
Employee benefit expenses
2
Other operating expenses
3
Increased direct costs in line with the transformation towards increased portion of
external content and development.
Personnel costs in relation to revenue decreased by 5.3 pp. Driven by the scalable operating model but also by partly shifting from internal to external
expenses related to content and development.
Other operating expenses adjusted for IPO-related expenses increased by 1.7 pp driven
by investment in LAB-projects.
1 2 3
| Q4 PRESENTATION – February 21st 201914
EBITDA Q4
”Continued high margins, representing a 59.3% EBITDA margin during the
quarter”
-1.7 %
5.3 %58.7%
- 3.0 %
59.3 %
-
0.5
1.0
1.5
2.0
2.5
3.0
3.5
4.0
4.5
5.0
EUR 4.5m
EUR 0.2mEUR 0.3m*
EUR 0.7m
EUR 1.4m*EUR 0.2m
EUR 1.7m
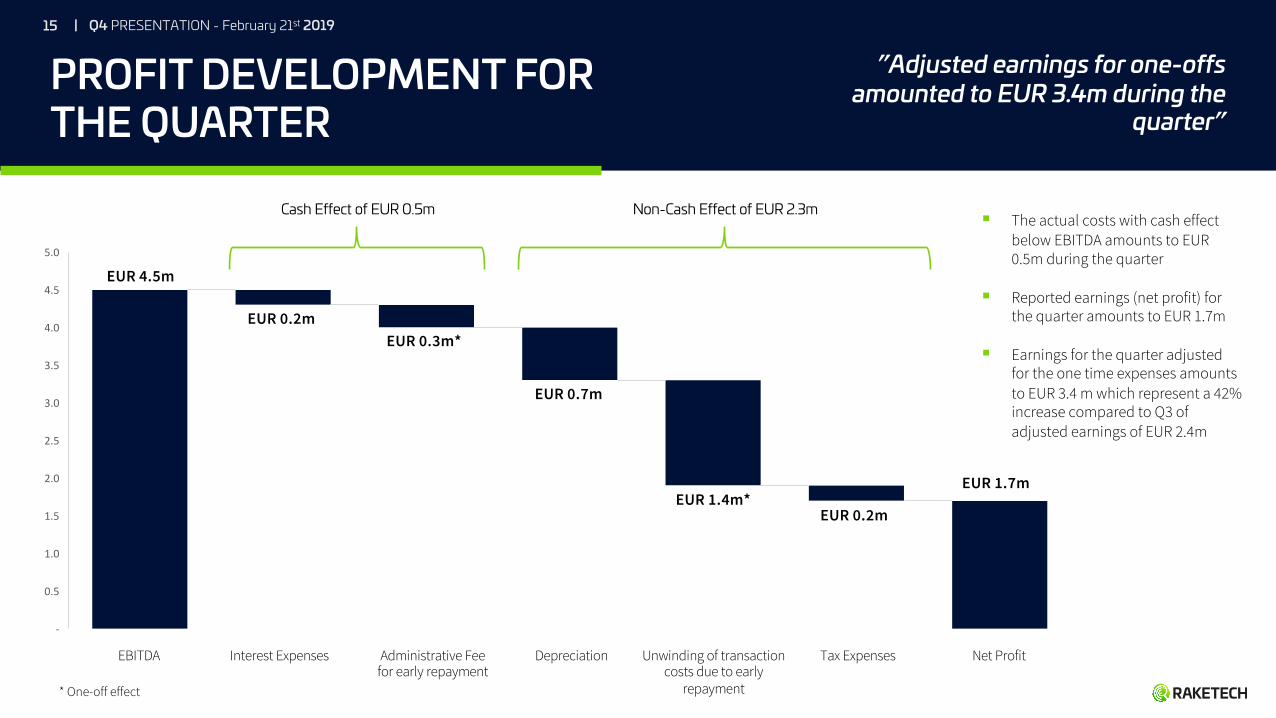
PROFIT DEVELOPMENT FORTHE QUARTER
| Q4 PRESENTATION - February 21st 201915
”Adjusted earnings for one-offs amounted to EUR 3.4m during the
quarter”
EBITDA Interest Expenses Administrative Fee for early repayment
Depreciation Unwinding of transaction costs due to early
repayment
Tax Expenses Net Profit
Cash Effect of EUR 0.5m Non-Cash Effect of EUR 2.3m§ The actual costs with cash effect
below EBITDA amounts to EUR 0.5m during the quarter
§ Reported earnings (net profit) for the quarter amounts to EUR 1.7m
§ Earnings for the quarter adjusted for the one time expenses amounts to EUR 3.4 m which represent a 42% increase compared to Q3 of adjusted earnings of EUR 2.4m
* One-off effect

STATEMENT OF FINANCIAL POSITION
BALANCE SHEET | 31 Dec 2018
Fixed assets
EUR 66.3m
Other receivables
EUR 4.3m
Cash and Cash equivalents
EUR 7.5m
Equity
EUR 58.7m
Amounts committed
EUR 7.0m
Borrowings
EUR 7.9mOther
EUR 4.5m
| Q4 PRESENTATION – February 21st 201916
§ Total assets amounted to EUR 78m, consisting mainly of Intangible assets mainly related to websites, domains, intellectual property and player databases.
§ Cash and Cash equivalents amounted to EUR 7.5m as at 31 December 2018.
§ Borrowings related to the loan facility from Ares Management was partly (EUR 15.5m) repaid during October 2018, which resulted that the loan amount as at 31 December 2018 amounted to EUR 7.9m (including accrued interest)
§ Amounts committed of EUR 7.0m consist of the expected earn out liabilities.

20,507
4,229
-2,000
-15,810 -89688
-
5,000
10,000
15,000
20,000
25,000
30,000
CASH FLOW
Cash conversion of 1.1x EBITDA (Cash conversion = Net cash flow from operations
/ EBITDA)
1
3
2
| Q4 PRESENTATION - February 21st 201917
Repayment on borrowings relates to an early repayment of the loan that amounted to EUR 15.8m (incl. admin fees).
2
Tax refund received during the quarter related to tax on profit from last year.
31
Operational cash flow is positive and amounts to
EUR 4.9 million.
”Continued high cash conversion duringthe quarter”
Cash and cash equivalents Q3 2018
Net cash from operations
Acquisition of intangible assets
Repayment on borrowings
Paid interest Tax receivable Cash and cash equivalents Q4 2018
7,526
4,878
-2,650
689

IMPROVED FINANCING| Q4 PRESENTATION - February 21st 201918
§ Since the IPO in June, Raketech has amortised the majority of its previous external borrowings.
§ On the 20th of December 2018, Raketechentered into an agreement with Swedbank for a revolving credit facility of EUR 10m.
§ Within the framework of the new credit facility with Swedbank, Raketech’s interest expense on the utilized amount is close to a third of the previous interest rate.

2018 OUTCOME
49%revenue growth, of
which organic growth 30%
✓56.3%
adj. EBITDA margin ✓With consideration to the new share issue Raketech’s leverage
ratio close to 0x✓
Growth
In the short1 to medium term Raketech targets annual total revenue growth in excess of 30 per cent on average, including acquisitions and organic growth in excess of 10 per cent. The total revenue growth is subject to availability of and successful completion of potential acquisitions.
Profitability In the short1 to medium term Raketech targets an adj. EBITDA margin exceeding 50 per cent.
Capital structure
In the short1 to medium term Raketech targets a Net debt / EBITDA ratio between 1.5 and 2.5. The company may elect to operate temporarily outside this span under certain circumstances during limited time periods, e.g. as a result of acquisitions.
FINANCIAL TARGET
1 Short term refers to from year 2020
FINANCIAL TARGETS| Q4 PRESENTATION - February 21st 201919

STRATEGIC UPDATE

IMPORTANT TRENDS| Q4 PRESENTATION - February 21st 201921
§ Understanding the player behaviour
§ Consolidation
§ Geography
§ Regulation and marketing
STRATEGIC PRIORITIES IN 2019| Q4 PRESENTATION - February 21st 201922
§ Expansion to new markets
§ Continued optimisation of assets in Raketech Core
§ New product launches in Raketech Lab
§ Product strategy for global market penetration

SUMMARY
| Q4 PRESENTATION - February 21st 201924
KEY TAKEAWAYS
§ Strong performance during the Q4
§ Continued focus on development of current portfolio (Core) together with the launch of new products (Lab)
§ Sweden in stabilisation phase post-regulation
§ Q1 has started according to plan

Q&A
FOLLOW US ON @raketechgroup @raketechgroup@raketechgroup @raketech

APPENDIX

HOW WE GROW
ACQUISITIONCAPABILITY
CONTINUOUS SCREENINGFOR NEW LEADS
BRAND AND GEOEXPANSION DIVERSITY
TOOL TO DIVERSIFYTHE PRODUCT PORTFOLIO
SEO | High ranking sitesproviding NDCs to partner sites
COMMUNITIES | Betting tips andcommunities with high brand awareness
GUIDES | Easy to use TV-sportguides on web, mobile and app
SOCIAL MEDIA | Drives trafficto Raketech’s other products
NEW TECHNOLOGYAND MEDIA
NEW MARKETS
NEW PRODUCTS
FOCUS ON INNOVATION WITHA UNIQUE STRUCTURE
M&A | Acquired growth CORE | Development of current products LAB | New innovations
| Q4 PRESENTATION - February 21st 201927


![[Smithsonian Institution appropriations hearings]](https://img.pdfslide.net/doc/110x75/63385740fb95fbb3f40303e6/smithsonian-institution-appropriations-hearings.jpg)


