Embed Size (px)
Citation preview
BiOptic Inc., 4F., No.108-3, Minquan Rd., Xindian Dist., New Taipei City 23141, Taiwan (R.O.C.)
www.bioptic.com.tw
Revolution
Qsep Series Operation Manual
--- Software

2
Welcome
Thank you for purchasing Qsep Series capillary electrophoresis system. Now you can
experience this high-performance, fully-automated and easy-to-use system.
Copyright and Trademarks
Copyright ©BiOptic Inc.
All rights reserved. Reproduction, adaptation, or translation of this manual is
prohibited without prior written permission of BiOptic Inc., except as allowed under
the copyright laws.
Qsep™ and Q-Analyzer™ are registered trademarks of BiOptic Inc.
Microsoft Windows is registered trademarks of Microsoft Corporation.
Product and company names listed are trademarks or trade names of their respective
companies.
Symbols of Qsep Series Symbol Description
CE mark for European Conformity.
FCC mark of the United States Federal Communications Commission.
Underwriters Laboratories (UL LLC) Safety Certification
3
Welcome ........................................................................................................................... 2
Copyright and Trademarks ............................................................................................... 2
Symbols of Qsep Series .................................................................................................... 2
Applications ...................................................................................................................... 7
Packing List ...................................................................................................................... 7
Cautions ............................................................................................................................ 8
1. System Overview ........................................................................................................ 10
1.1 Pre-program Method and Cartridge ....................................................................... 11
1.1.1 Pre-program Method ....................................................................................... 11
1.2 System Installation ............................................................................................... 12
1.2.1 Software Requirements .................................................................................. 12
2. Q-Analyzer Installation Instruction ............................................................................ 13
2.1 Software Installation ............................................................................................. 13
2.2 Software Mode ..................................................................................................... 18
2.2.1 USB Software Key ........................................................................................ 20
2.2.2 Q-Editor License............................................................................................ 23
3. Start to Use Qsep™ Series ......................................................................................... 26
3.1 Operation of Qsep™ Series .................................................................................. 27
3.1.1 Connection Assistance ................................................................................... 28
3.1.2 Sequence and Method Setting ....................................................................... 32
3.2 Cartridge Calibration ............................................................................................ 40
3.3 Edit Sample Position Settings .............................................................................. 42
3.4 Recalibration ......................................................................................................... 44
3.5 Capillary Clog Check ........................................................................................... 45
3.6 Purge Check Function .......................................................................................... 48
3.7 Home Function ..................................................................................................... 50
4. Q-Analyzer™ User Interface ...................................................................................... 51
4.1 Main Window ....................................................................................................... 51
4.1.1 System Overview ........................................................................................... 52
4.1.2 System Status Column ................................................................................... 53
4.2 Function bar and Toolbar ...................................................................................... 54
4.2.1 Instrument ...................................................................................................... 54
4.2.2 Results ........................................................................................................... 59
4.2.3 Comparison .................................................................................................... 65
4.2.4 Real Time ....................................................................................................... 66
4.3 Menu ..................................................................................................................... 67

4
4.3.1 File ................................................................................................................. 67
4.3.2 Edit ................................................................................................................ 70
4.3.3 Tool ................................................................................................................ 74
4.3.4 View ............................................................................................................... 77
4.3.5 Window .......................................................................................................... 78
4.3.6 Setting ............................................................................................................ 78
4.3.7 Language ....................................................................................................... 79
4.3.8 Help ............................................................................................................... 80
4.4 Control Panel ........................................................................................................ 82
4.4.1 Main ............................................................................................................... 82
4.4.2 Method ........................................................................................................... 84
4.4.3 Direct Control (Partial Advanced Only) ........................................................ 86
4.4.4 Board Setting (Advanced Only) .................................................................... 87
5. Result/Data Analysis .................................................................................................. 88
5.1 Result for Data Display ........................................................................................ 88
5.1.1 Calculation ..................................................................................................... 91
5.1.2 Reference Marker Table ................................................................................ 93
5.1.3 Improve Calculate Accuracy ......................................................................... 95
5.2 Comparison ........................................................................................................... 96
5.2.1 Export the Report of Compare Result ......................................................... 103
5.3 Total RNA Quality Analysis ............................................................................... 105
5.4 Smear DNA Analysis (gDNA QC for NGS) ...................................................... 107
5.5 Peak Calling Function for Clinical Testing ........................................................ 109
Appendix A-Troubleshooting ........................................................................................ 112
1. Unpacking, packing process and Installation ............................................................ 112
Q1:How to unpack the cargo and what should we notice when move the
instrument? ................................................................................................................ 112
Q2:What are the minimum computer requirements and recommendations? ......... 112
Q3:What is the size of the result file? ..................................................................... 113
Q4:Do we need to install the software first or connect the cable first? .................. 113
Q5:Can power adaptors be used alternately?.......................................................... 113
2. Instrument not working or working abnormally........................................................ 113
2.1 Before use ................................................................................................................ 113
Q1:Pressing the machine power, but have no response? ........................................ 113
Q2:How should we do when PC cannot detect the connection of Qsep100? ........... 114
Q3:How should we do when PC cannot connect with Qsep1 WiFi mode? ............ 114
Q4:What does the light of Qairbox mean? ............................................................... 115
2.2 During use ............................................................................................................... 115

5
Q5:If the buffer tray can’t move smoothly, how should we do? ............................ 115
Q6:The Qairbox works frequently, over 3 times/min ............................................... 117
Q7:Jet error window pop-out. ................................................................................. 117
3. Cartridge issues ......................................................................................................... 118
3.1 Before use ................................................................................................................ 118
Q1:HV check failed or Calibration failed. .............................................................. 118
Q2:What’s wrong with the pop-out error window? ................................................ 119
3.2 During use ............................................................................................................... 119
Q3:How to check if the cartridge is clogged or not and how to rescue the dry out
cartridge? ................................................................................................................... 119
Q4:What if the cartridge has expired, but still has runs left? ................................ 120
Q5:What if the cartridge has sucked the mineral oil? How to recover it? ............. 120
Q6:Anything needs to notice during insert or take out the cartridge? ................... 121
3.3 Storage .................................................................................................................... 122
Q7:How to store the cartridge? And relative buffer? ............................................. 122
4. Questions of operation .............................................................................................. 123
Q1:How do I place the Qsep400 Alignment marker and size marker? ................... 123
Q2:How do I prepare the unknown sample before Qsep analysis? ....................... 123
Q3:The minimum volume of sample? ................................................................... 123
Q4:The sample consumption (per run)? ................................................................ 124
Q5:What is the air pressure range of each instrument? ......................................... 124
Q6:What if we use the wrong buffer? .................................................................... 124
Q7:Will dye or organic solvent influence cartridge? How to pretreat the sample? 125
Q8:What is the difference between Basic key and Advance software key? .......... 125
Q9:What is the difference between Q-AnalyzerTM, Q-EditorTM and Q-viewerTM? 126
Q10:Why should I do recalibration?...................................................................... 127
5. Unexpected results .................................................................................................... 128
Q1:What kind of conditions will cause unstable current? ..................................... 128
Q2:What to do if alignment marker and samples are migrating too slowly and the
upper alignment marker does not appear on the result? ........................................... 128
Q3:Identify wrong alignment marker or size marker ............................................ 129
Q4:The calculated size is wrong ............................................................................ 131
Q5:Is the concentration display in result table reliable? ........................................ 131
Q6:The current is stable, but there is no signal at all, even the alignment marker
does not appear. RFU near zero ................................................................................ 131
Q7:The current is stable, but there is no signal except the alignment marker ....... 132
Q8:One of the 4 Channel shows different result with others. ................................ 132
6. Specific application issues (RNA, Protein …) ......................................................... 133

6
6.1 R1 RNA cartridge ............................................................................................... 133
Q1:When running RNA samples, are there any special things to consider? ......... 133
Q2:What is the criteria of RQN? ........................................................................... 133
Q3:Why the result shows “N/A” in RQN? ............................................................ 134
6.2 P2 Protein cartridge ............................................................................................ 135
Q4:What Protein Alignment marker should I use? ................................................ 135
Q5:Which instrument can I use to analyze protein sample? Or what labeling dye
should I choose? ....................................................................................................... 136
Q6:How to do the labeling process? ...................................................................... 136
7. Maintenance.............................................................................................................. 136
Q1:How often should I change the Marker and Buffer? ....................................... 136
Q2:What happens if I don't change the filter for a long time?? ............................. 136
Q3:How to clean the instrument regularly? ........................................................... 136
8. Others ....................................................................................................................... 137
Q1:Should we turn off the instrument and pump every day? ................................ 137
Q2:How should we do before discard the cartridge?............................................. 137
Report to BiOptic ..................................................................................................... 138
7
Limitation of Liability Qsep Series, Q-Analyzer™ software, and all related reagents are designed for the use of
electrophoresis analysis in general biochemistry laboratory. If you use it for profit,
diagnosis, or other non-research purposes experiments, the company is not responsible
for the accuracy and reliability of the result and the safety of operation.
BEFORE ATTEMPTING TO OPERATE THE INSTRUMENT, READ ALL PRODUCT
MANUALS AND FOLLOW THE INSTRUCTIONS.
BiOptic Inc. assumes no liability whatsoever for any personal injury, property damage,
or other loss resulting from not complying or familiar with the manuals, or improper
operation of the devices.
Applications
Genetic Profile Screening
Amplified Fragment Length Polymorphisms
Bacterial/Viral Genotyping and Identification
DNA Fragment/PCR Product Analysis
Rapid Analysis of Genomic DNA Samples
RNA Analysis
Protein Analysis
Packing List
Each Qsep™ Series Instrument package comes with the following:
Qsep™ CE Instrument
Qsep™ Standard and High resolution cartridge Kit (C105200)
Power Cord with Adapter
USB Cable
Software Key (Basic edition)
Installation Disc including Q-Analyzer™ and Qsep™ Operation Manual
*Note: The Software key contains 8GB storage space, Q-Analyzer™ and Qsep™ Series
Operation Manual, including Hardware version and Software version.
8
Cautions
Qsep™ Series are capillary electrophoresis instruments driven by high voltage.
Carefully read and thoroughly comply with the following instructions to maintain the
integrity of the equipment, the reliability of results, and the safety of operation.
Keep Qsep™ Series away from other electronic device and voltage sources.
1. Only the components and consumables provided by BiOptic Inc. are
suggested to use.
2. DO NOT perform the following actions:
• Disassemble Qsep™ Series instrument and its associated parts
• Bumps or jolts to Qsep™ Series
• Move the instrument or remove any connected external equipment,
such as computers and air pumps, while Qsep™ Series are in action
• Open the sample door or cartridge door while Qsep™ Series are in
action
• Remove the cartridge while Qsep™ Series are in action
• Power off Qsep™ Series before confirming Qsep™ Series are inactive
3. Store the cartridge upright; do not lay the cartridge on a table horizontally or
place it upside down.
4. Store the cartridge in the calm-shell container (Cartridge needs to be stored
in a proper environment as the instructions of cartridge unpacking guide to
maintaining its lifetime and quality).
5. Ensure the cartridge is taking out from Qsep™ Series before shutting down or
disconnecting instrument. Or ensure the cartridge is placed at PARK position
before shutting down or disconnecting Qsep™ Series. Failure to do so will
cause dryness of the gel at the cartridge tip, which will damage the cartridge.
6. Before operating Qsep™ Series, ensure the buffer tray is placed properly.
7. Dilute the PCR DNA test sample to 1
20 with our dilution buffer before
running the test for obtaining better result and retaining the lifetime of the
cartridge. You can adjust the dilution ratio after primary test runs.
8. Ensure that the test sample, alignment marker, cartridge, and buffer tray
have been removed from the instrument before transporting or shipping.
9. If the buffer solution spills out on the platform inside the instrument, wipe it
with tissue and clean it up immediately.
10. Ensure that the main power of the instrument has been shut down and all
9
the test materials have been removed before cleaning Qsep™ Series.
11. User can also use N2 gas as an air source to ensure the air quality and prevent
damages to the devices caused by dirty air.
12. Make sure to press the plastic connection ring before pulling the air tube out
from the back of the instrument.
13. Release the condensation water in the external air pump periodically and
check the water level before each use to avoid the mist damage the devices
of Qsep™ Series.
14. To cut off the power, please disconnect the power plug.
15. Please clean the instrument with a dry cloth. For other maintenance, please
contact the local distributor.
16. Please use the MAINS power cord within the adequate rating.
17. The conditions of transportation and storage: Temperature -30 to +60°C.
Humidity 20 to 80% RH, non-condensing.
*Note: Strongly suggest performing this step whenever you start to operate Qsep™
Series.
Warning: Qsep™ Series are high-voltage Multiple-channel electrophoresis
system. Please follow the operation manual and laboratory safety guidelines for
system operation. Do not remove covers. For operation and safety questions,
please contact BiOptic Inc. at the official website or with your local BiOptic
representatives.

10
1. System Overview
Qsep™ Series are a fully automated CE system developed by BiOptic Inc., which uses
pen-shaped disposable gel-cartridges to improve efficiency. Time-consuming manual
procedures such as gel preparation, sample loading, and capillary changing are no
longer required. Further, the information will be obtained easily with the fully-
automated Qsep™ Series. Qsep1™, Qsep100™ and Qsep400™ are designed to
accommodate the standard 96-well and 8 & 12 well PCR strip, respectively.
Qsep™ Series’s compact design helps you to set up and operate the instrument
intuitively. The disposable gel-cartridge with integrated pre-programmed test
methods makes capillary electrophoresis experiments no longer a painful procedure
that requires well-trained operators. No more worries about the operation and human
errors caused by different operators which affect the accuracy and reproducibility of
the results.
The following sections will describe the product overview, the functions of Qsep™
Series instruments and the gel-cartridge. Please read through this section and get
ready to be at amazed with the power of Qsep™ Series.
aaution: The operator of this instrument is advised that if the equipment is
operated in a manner not specified in this manual, the protection provided by the
equipment may be impaired.
11
1.1 Pre-program Method and Cartridge
1.1.1 Pre-program Method
Qsep™ series are designed to work with the special-designed cartridges provided by
BiOptic Inc.. The modularization design of cartridges makes the time-consuming gel
preparation no longer be required. For the cartridges, we provide a various specific
testing protocol, so-called “Method” which integrates the sequential steps to accomplish
the test. The various cartridges and pre-programmed Methods are utilized in performing
the CE experiment that corresponds to the size range and concentration of the sample.
Additionally, users can create their own Methods according to their preference.
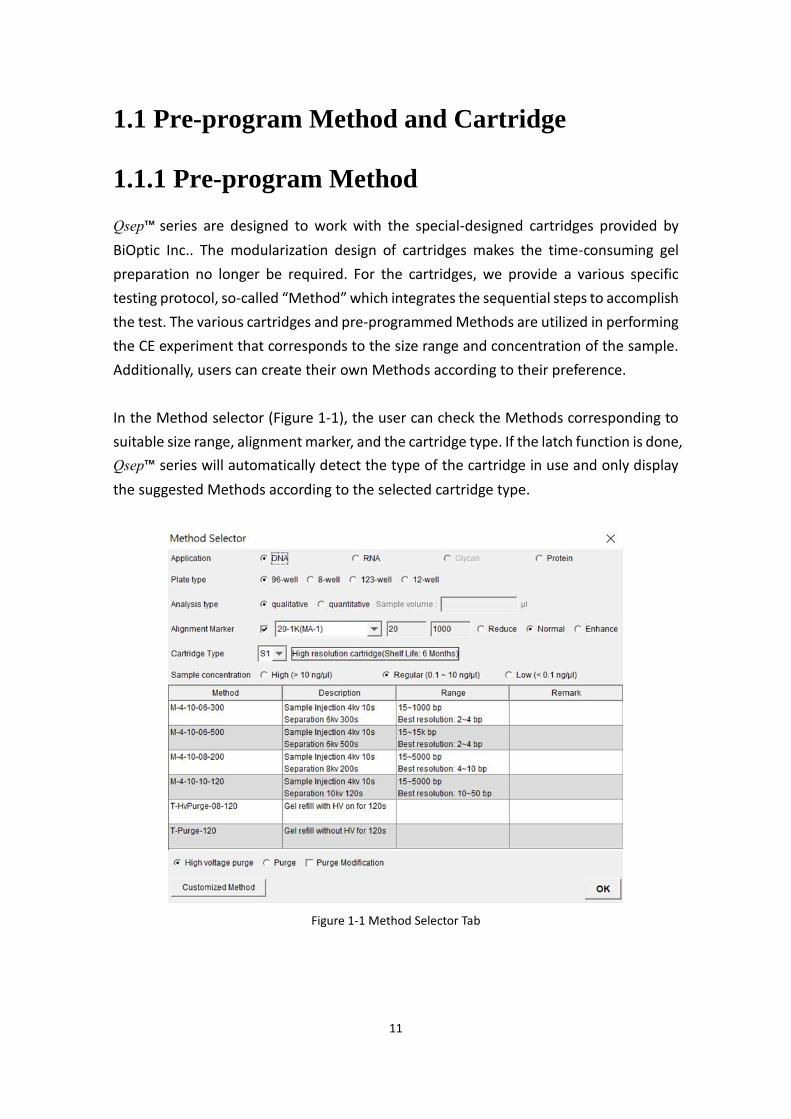
In the Method selector (Figure 1-1), the user can check the Methods corresponding to
suitable size range, alignment marker, and the cartridge type. If the latch function is done,
Qsep™ series will automatically detect the type of the cartridge in use and only display
the suggested Methods according to the selected cartridge type.
Figure 1-1 Method Selector Tab
12
1.2 System Installation
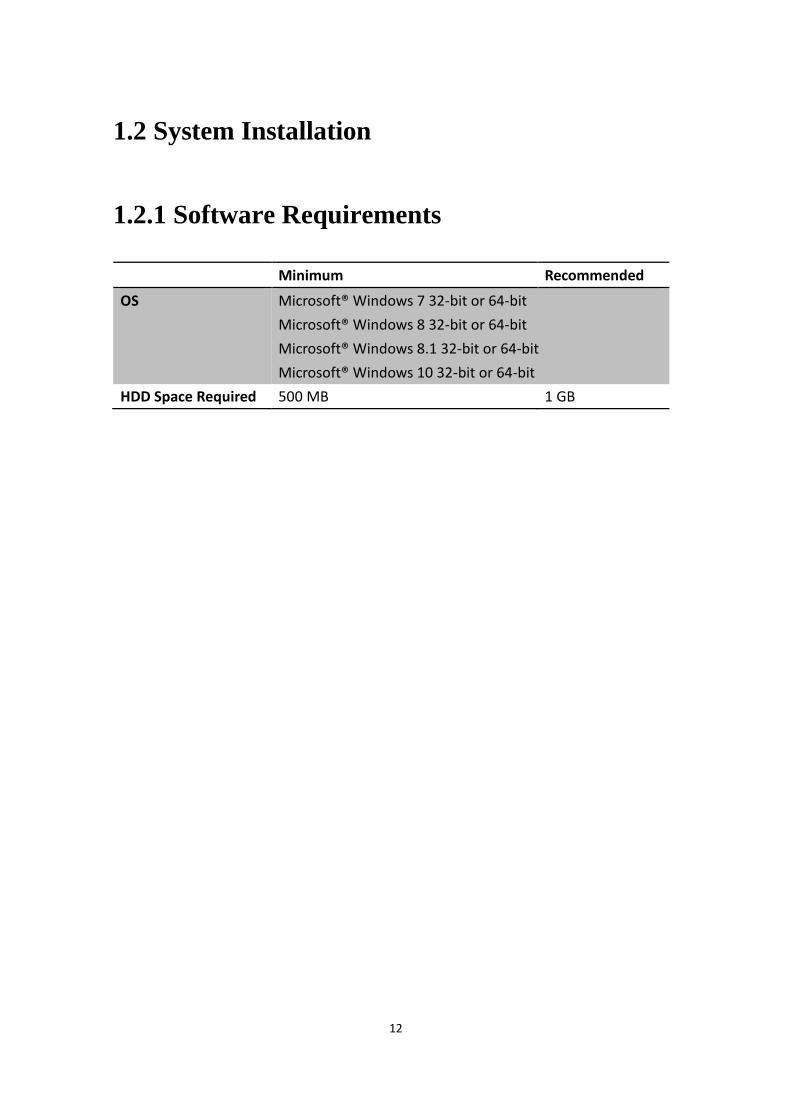
1.2.1 Software Requirements
Minimum Recommended
OS Microsoft® Windows 7 32-bit or 64-bit
Microsoft® Windows 8 32-bit or 64-bit
Microsoft® Windows 8.1 32-bit or 64-bit
Microsoft® Windows 10 32-bit or 64-bit
HDD Space Required 500 MB 1 GB
13
2. Q-Analyzer Installation Instruction
A suitable operating environment is essential to ensuring the best performance of Qsep™
Series.
2.1 Software Installation
Q-Analyzer™, including Q-Analyzer and Q-Analyzer for Qsep400, are the software that
specially designed to operate Qsep™ series. The software key will be found in the
package. Click “Q-Analyzer-Setup.exe” for Qsep1™ or Qsep100™ and “Q-Analyzer for
Qsep400-Setup.exe” for Qsep400™ to begin the installation.
*Note: Please close all the other applications before installing Q-Analyzer™. In addition,
DO NOT connect Qsep ™ series to the computer while installing Q-Analyzer™.
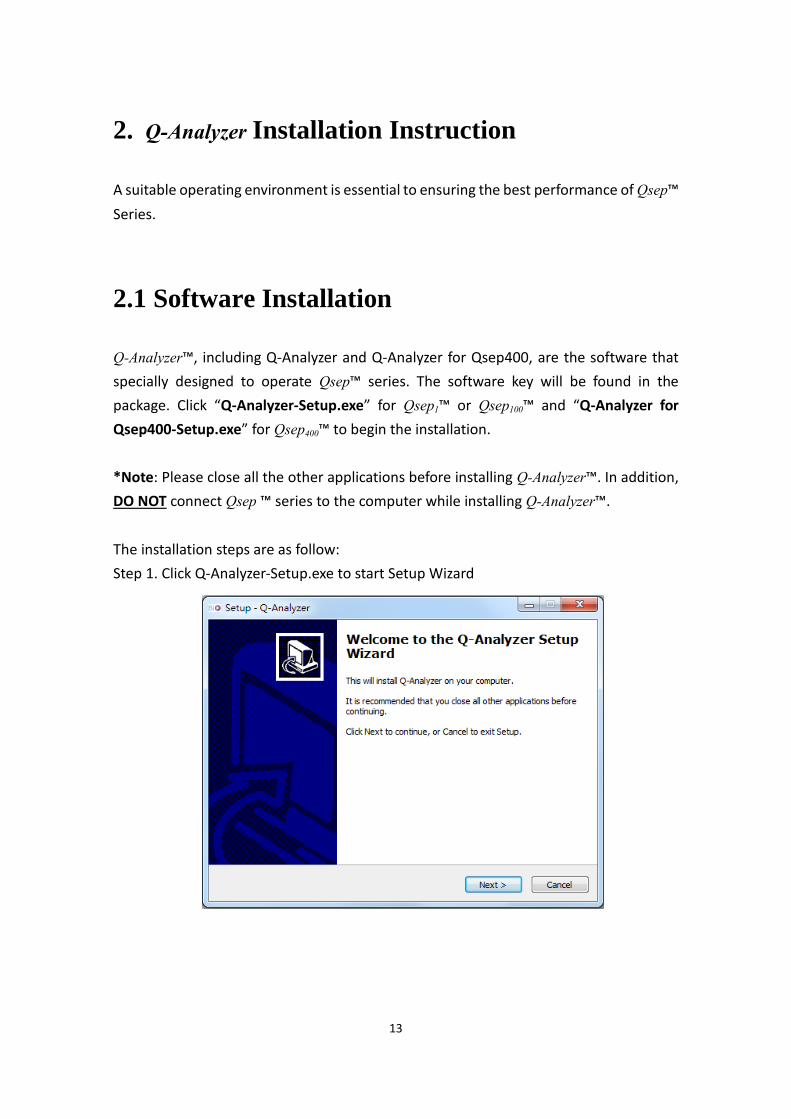
The installation steps are as follow:
Step 1. Click Q-Analyzer-Setup.exe to start Setup Wizard
14
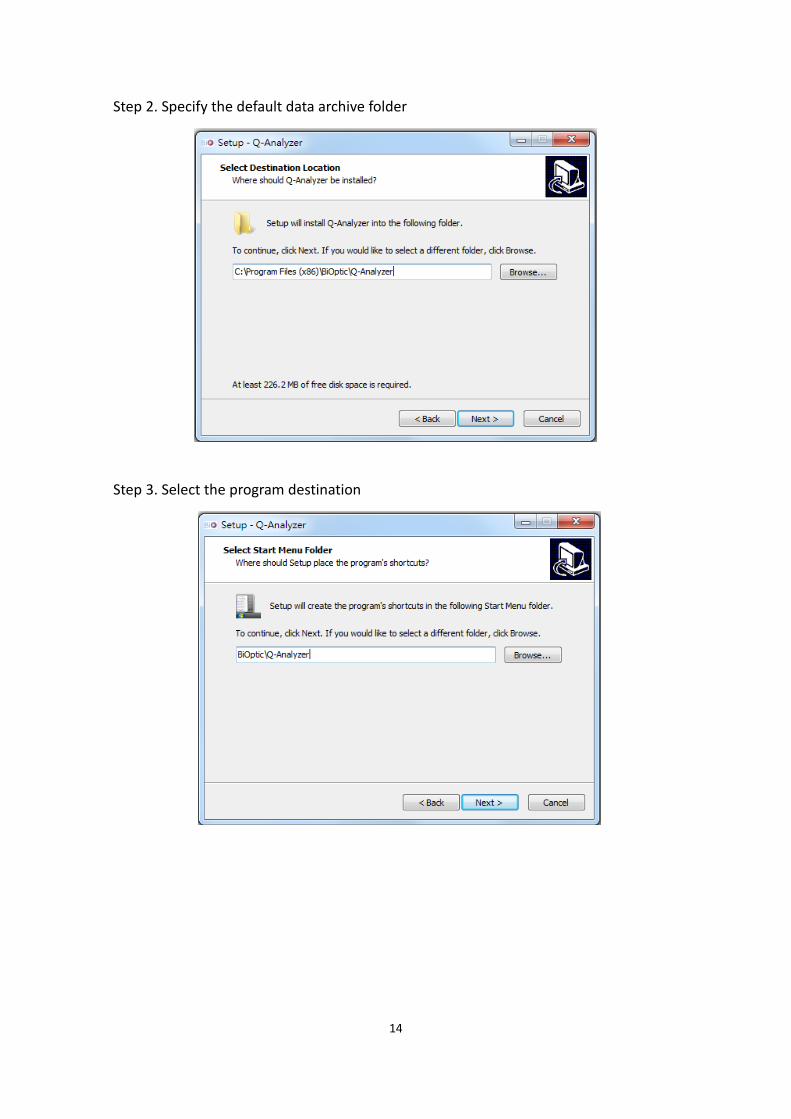
Step 2. Specify the default data archive folder
Step 3. Select the program destination
15
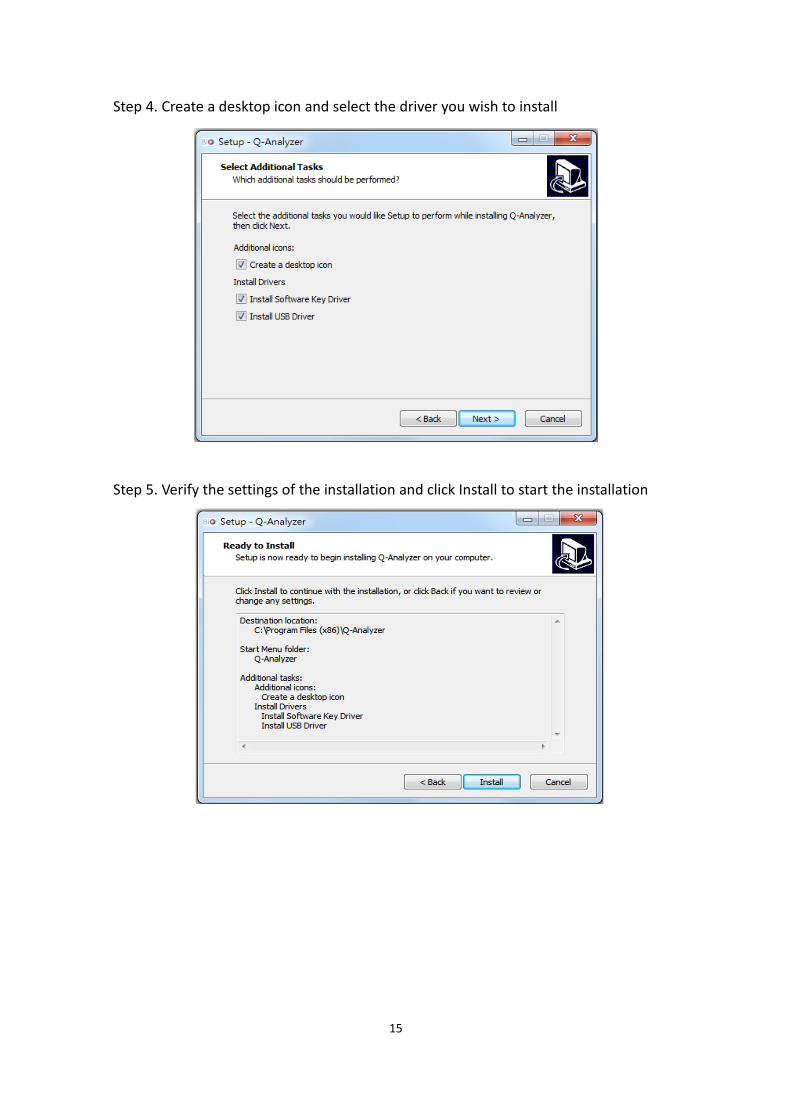
Step 4. Create a desktop icon and select the driver you wish to install
Step 5. Verify the settings of the installation and click Install to start the installation
16
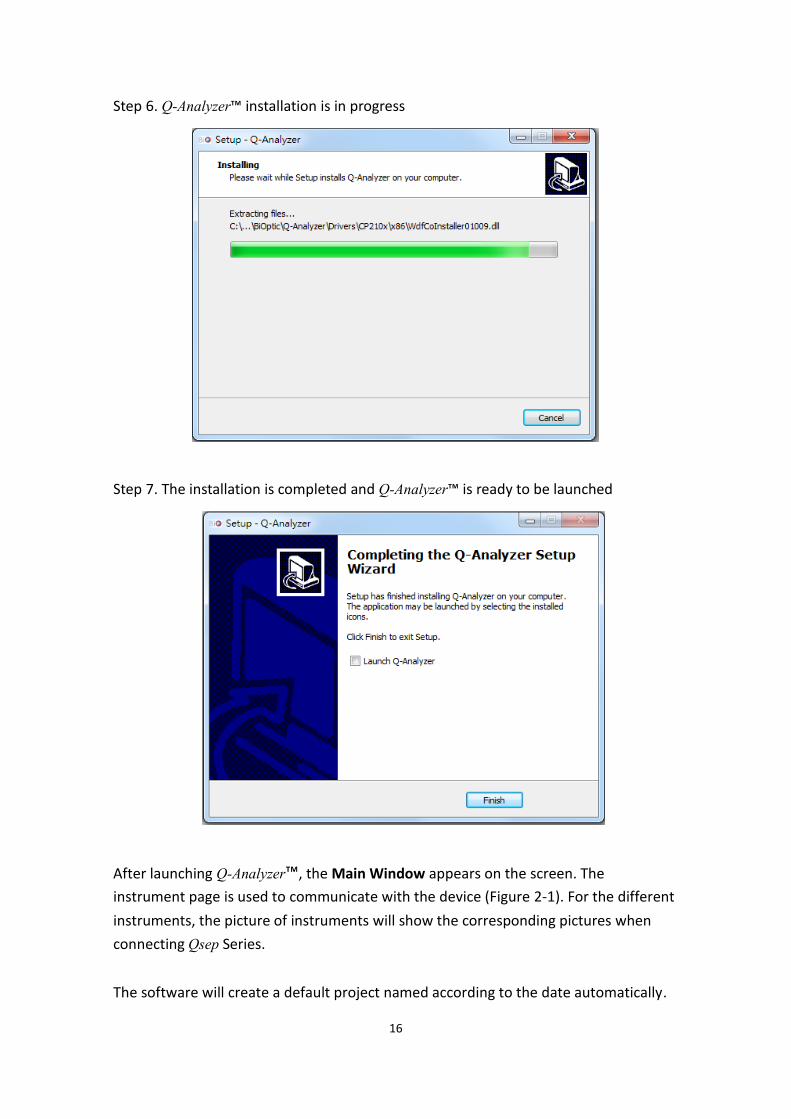
Step 6. Q-Analyzer™ installation is in progress
Step 7. The installation is completed and Q-Analyzer™ is ready to be launched
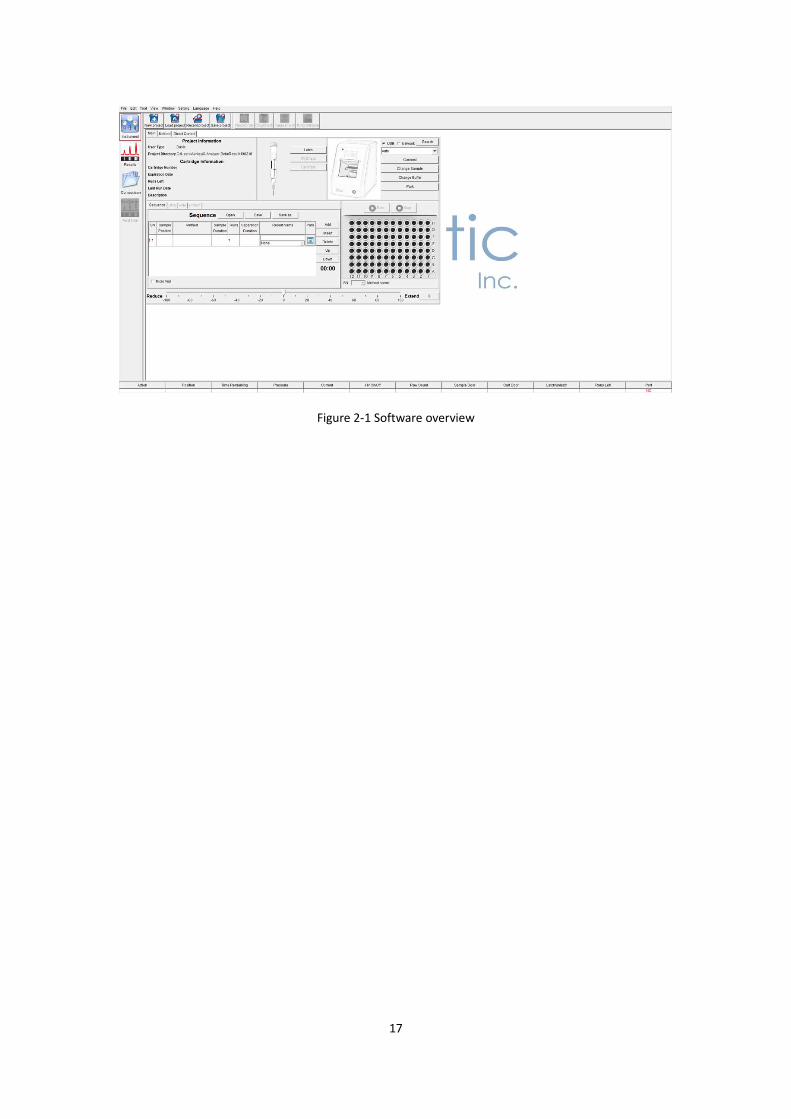
After launching Q-Analyzer™, the Main Window appears on the screen. The
instrument page is used to communicate with the device (Figure 2-1). For the different
instruments, the picture of instruments will show the corresponding pictures when
connecting Qsep Series.
The software will create a default project named according to the date automatically.
17
Figure 2-1 Software overview
18
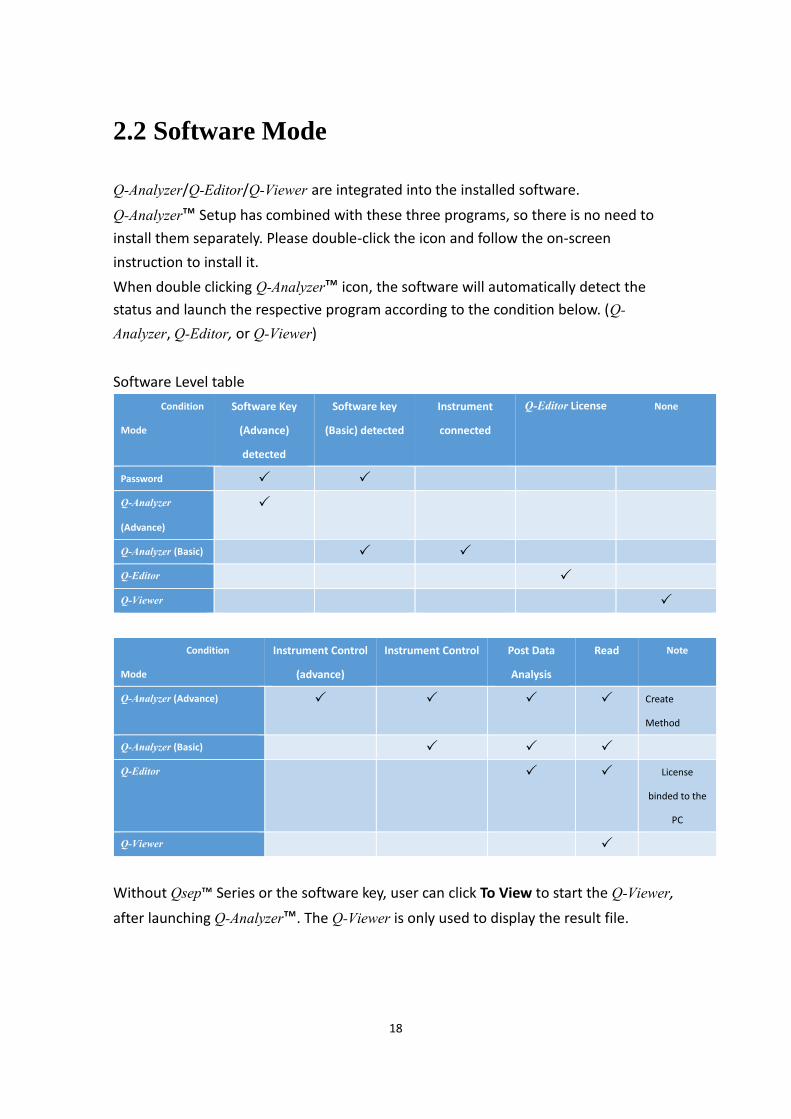
2.2 Software Mode
Q-Analyzer/Q-Editor/Q-Viewer are integrated into the installed software.
Q-Analyzer™ Setup has combined with these three programs, so there is no need to
install them separately. Please double-click the icon and follow the on-screen
instruction to install it.
When double clicking Q-Analyzer™ icon, the software will automatically detect the
status and launch the respective program according to the condition below. (Q-
Analyzer, Q-Editor, or Q-Viewer)
Software Level table
aondition
Mode
Software Key
(Advance)
detected
Software key
(Basic) detected
Instrument
connected
Q-Editor License None
Password
Q-Analyzer
(Advance)
Q-Analyzer (Basic)
Q-Editor
Q-Viewer
aondition
Mode
Instrument aontrol
(advance)
Instrument aontrol Post Data
Analysis
Read Note
Q-Analyzer (Advance) Create
Method
Q-Analyzer (Basic)
Q-Editor License
binded to the
PC
Q-Viewer
Without Qsep™ Series or the software key, user can click To View to start the Q-Viewer,
after launching Q-Analyzer™. The Q-Viewer is only used to display the result file.

19

20
2.2.1 USB Software Key
⚫ Activation Software Key
A software key is required, if the user operates the software in Q-Analyzer mode
without Qsep™ series. The software key must be activated first before its initial
usage. Insert the software key into an available USB port on the computer before
launching Q-Analyzer™.
Figure 2-2 Software Key
The system will automatically lead you to the activation page while starting Q-
Analyzer™. Enter your Company Name, User ID, and Password. After confirming the
password, you will be directed to the Login page.
Figure 2-3 Login page
*Note: Password comprises 8 characters (6 characters for the previous version of
software key) in length contained characters and/or numbers and is case-sensitive.
If the user wants to change the password of the software key, go to Change Password
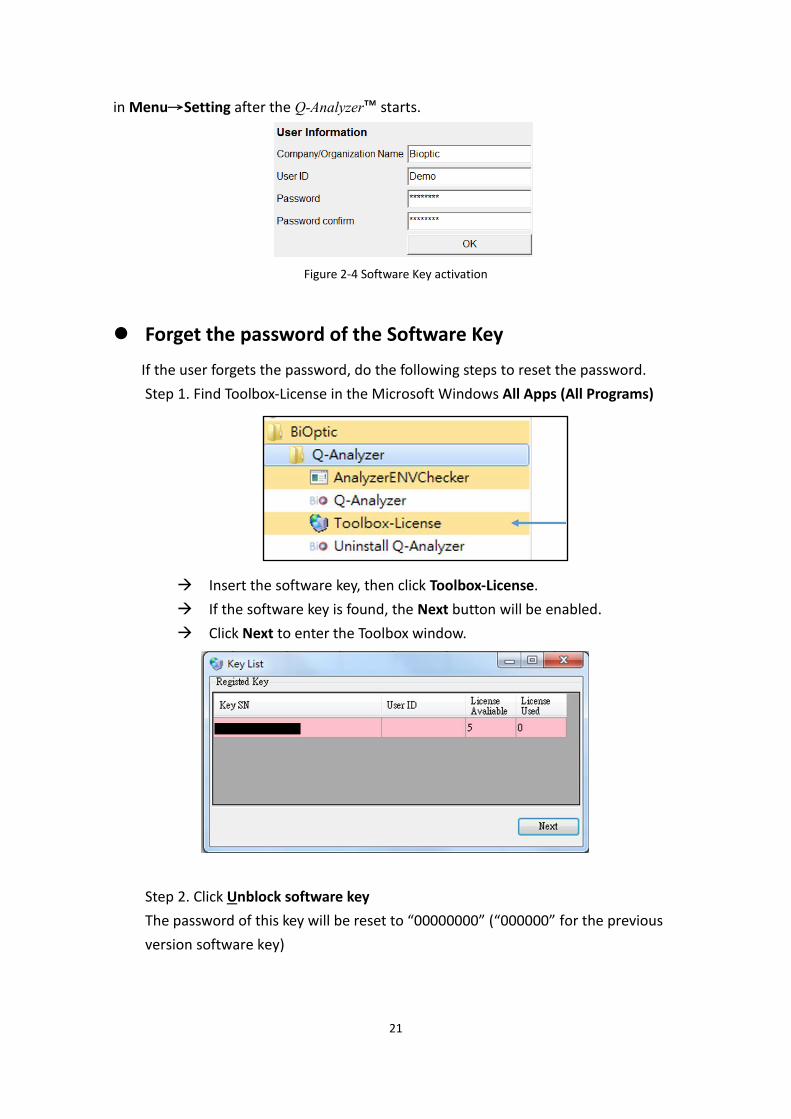
21
in Menu→Setting after the Q-Analyzer™ starts.
Figure 2-4 Software Key activation
⚫ Forget the password of the Software Key
If the user forgets the password, do the following steps to reset the password.
Step 1. Find Toolbox-License in the Microsoft Windows All Apps (All Programs)
→ Insert the software key, then click Toolbox-License.
→ If the software key is found, the Next button will be enabled.
→ Click Next to enter the Toolbox window.
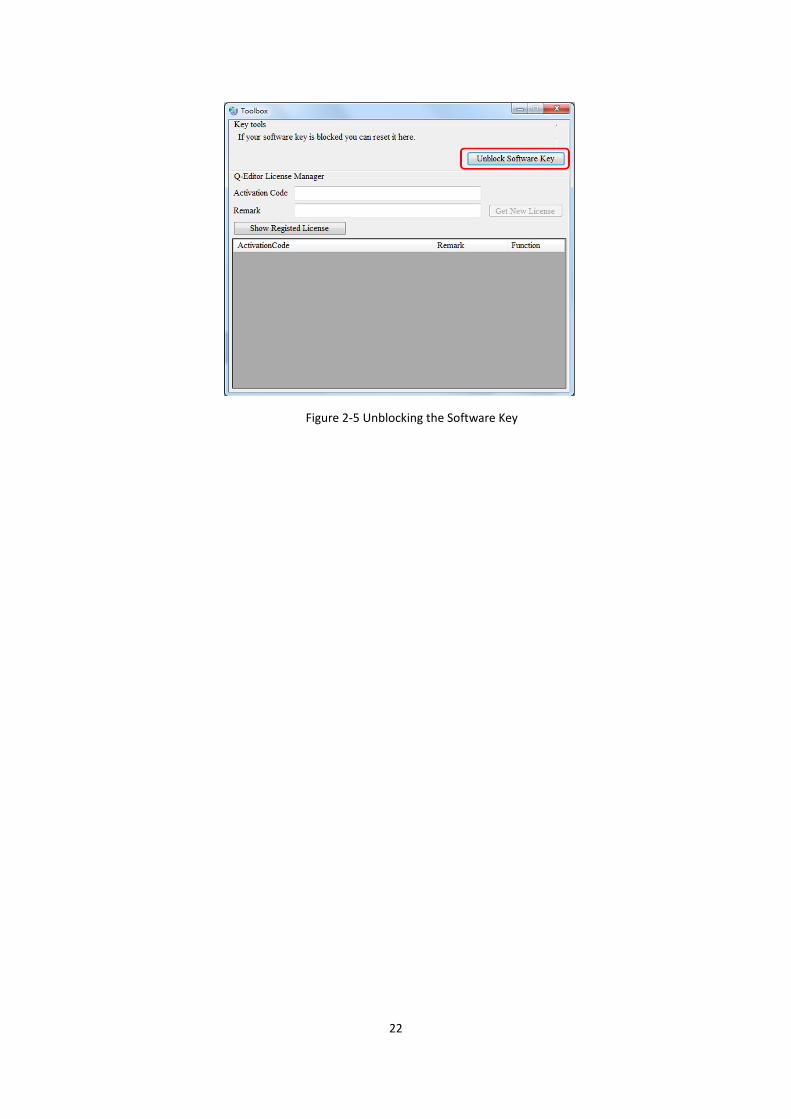
Step 2. Click Unblock software key
The password of this key will be reset to “00000000” (“000000” for the previous
version software key)
22
Figure 2-5 Unblocking the Software Key
23
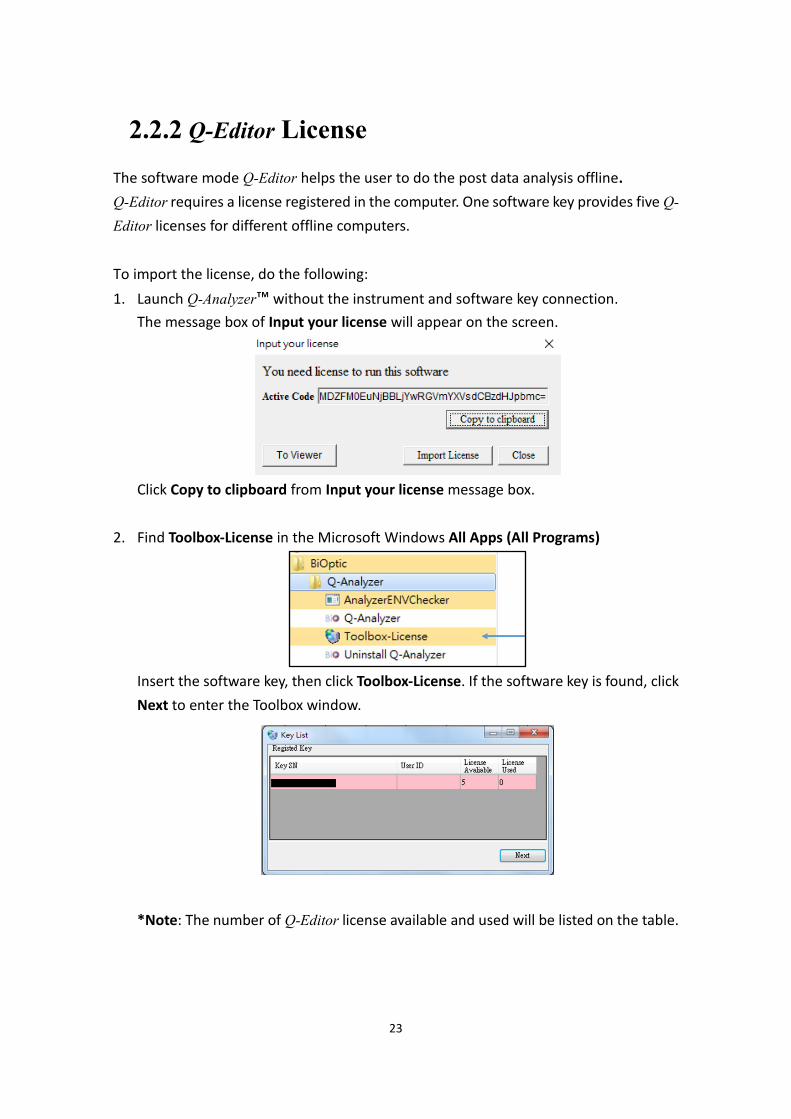
2.2.2 Q-Editor License
The software mode Q-Editor helps the user to do the post data analysis offline.
Q-Editor requires a license registered in the computer. One software key provides five Q-
Editor licenses for different offline computers.
To import the license, do the following:
1. Launch Q-Analyzer™ without the instrument and software key connection.
The message box of Input your license will appear on the screen.
Click aopy to clipboard from Input your license message box.
2. Find Toolbox-License in the Microsoft Windows All Apps (All Programs)
Insert the software key, then click Toolbox-License. If the software key is found, click
Next to enter the Toolbox window.
*Note: The number of Q-Editor license available and used will be listed on the table.
24
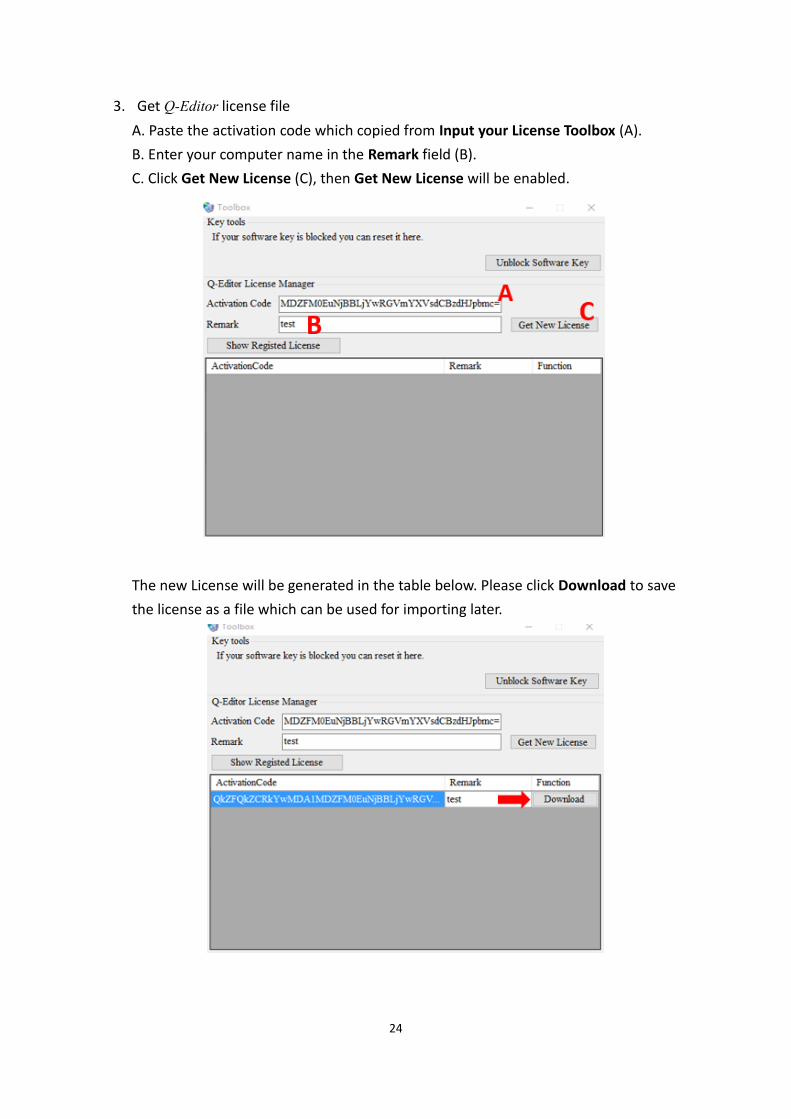
3. Get Q-Editor license file
A. Paste the activation code which copied from Input your License Toolbox (A).
B. Enter your computer name in the Remark field (B).
C. Click Get New License (C), then Get New License will be enabled.
The new License will be generated in the table below. Please click Download to save
the license as a file which can be used for importing later.
25
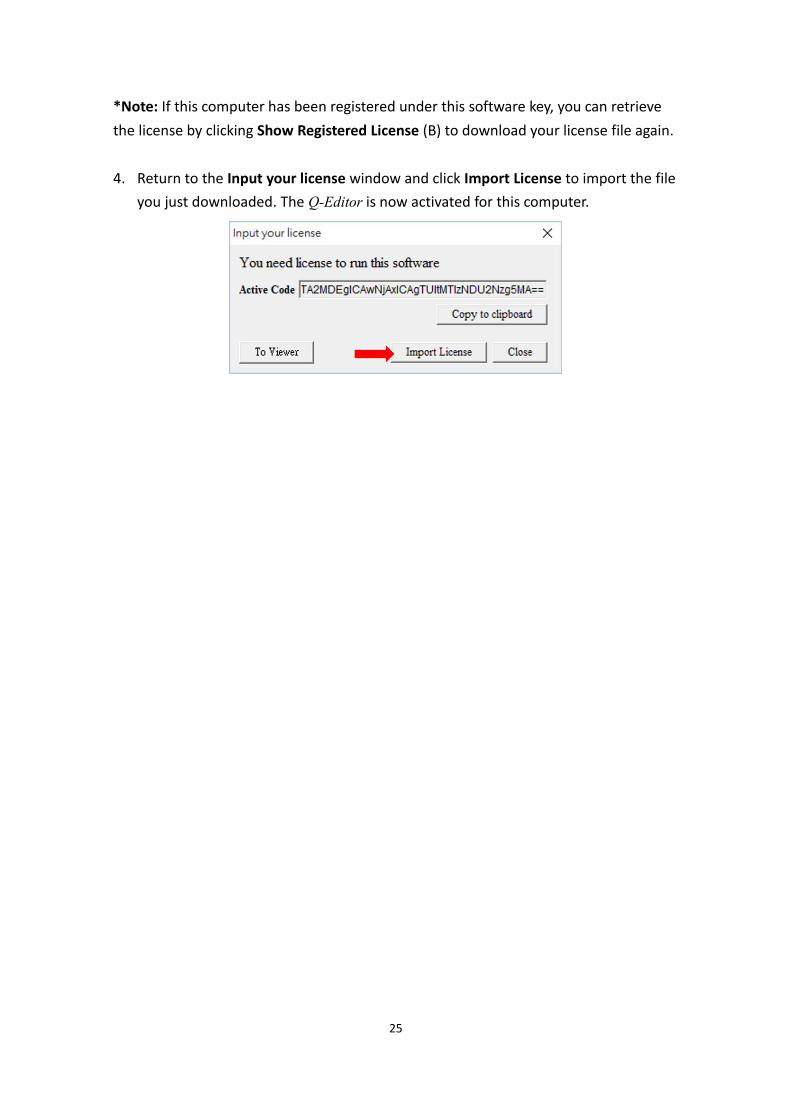
*Note: If this computer has been registered under this software key, you can retrieve
the license by clicking Show Registered License (B) to download your license file again.
4. Return to the Input your license window and click Import License to import the file
you just downloaded. The Q-Editor is now activated for this computer.
26
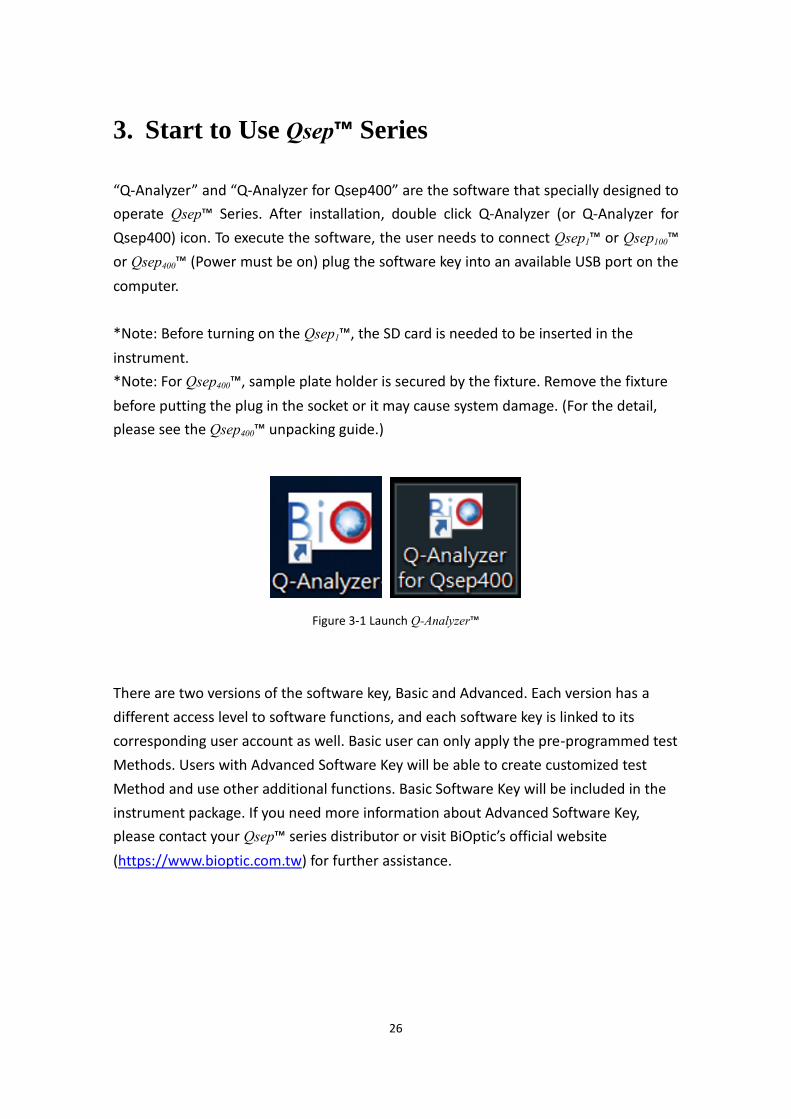
3. Start to Use Qsep™ Series
“Q-Analyzer” and “Q-Analyzer for Qsep400” are the software that specially designed to
operate Qsep™ Series. After installation, double click Q-Analyzer (or Q-Analyzer for
Qsep400) icon. To execute the software, the user needs to connect Qsep1™ or Qsep100™
or Qsep400™ (Power must be on) plug the software key into an available USB port on the
computer.
*Note: Before turning on the Qsep1™, the SD card is needed to be inserted in the
instrument.
*Note: For Qsep400™, sample plate holder is secured by the fixture. Remove the fixture
before putting the plug in the socket or it may cause system damage. (For the detail,
please see the Qsep400™ unpacking guide.)
Figure 3-1 Launch Q-Analyzer™
There are two versions of the software key, Basic and Advanced. Each version has a
different access level to software functions, and each software key is linked to its
corresponding user account as well. Basic user can only apply the pre-programmed test
Methods. Users with Advanced Software Key will be able to create customized test
Method and use other additional functions. Basic Software Key will be included in the
instrument package. If you need more information about Advanced Software Key,
please contact your Qsep™ series distributor or visit BiOptic’s official website
(https://www.bioptic.com.tw) for further assistance.

27
3.1 Operation of Qsep™ Series
After launching Q-Analyzer™, the Main Window appears on the screen.
In this window, you can access the Instrument function which is used to communicate
with the device (Figure 3-2). This section will only introduce the Main tab features and
how to operate Qsep™ series (Figure 3-2 A). The other function tabs will be described
later in the Section 4.4.
The software will create a default project named per date automatically. You can also
create another project for experiments with different purposes by clicking New project
in the Toolbar (Figure 3-2 B).
Figure 3-2 Main window of the Instrument mode
28
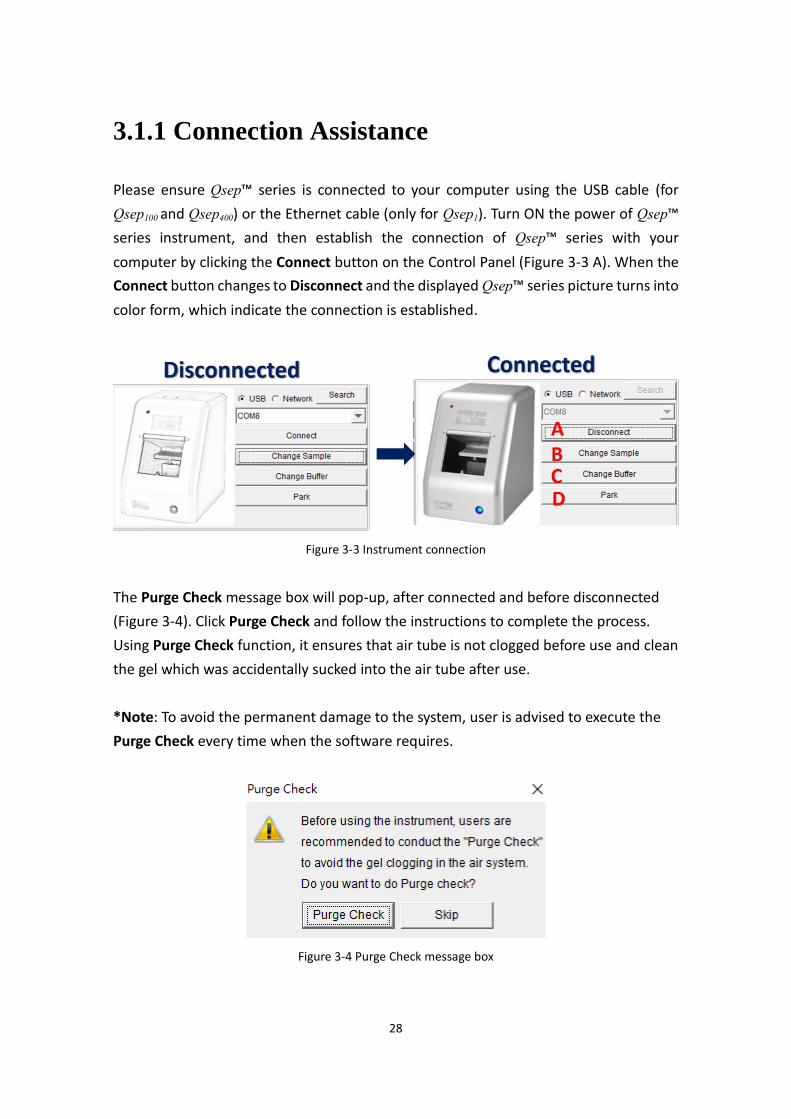
3.1.1 Connection Assistance
Please ensure Qsep™ series is connected to your computer using the USB cable (for
Qsep100 and Qsep400) or the Ethernet cable (only for Qsep1). Turn ON the power of Qsep™
series instrument, and then establish the connection of Qsep™ series with your
computer by clicking the aonnect button on the Control Panel (Figure 3-3 A). When the
aonnect button changes to Disconnect and the displayed Qsep™ series picture turns into
color form, which indicate the connection is established.
Figure 3-3 Instrument connection
The Purge aheck message box will pop-up, after connected and before disconnected
(Figure 3-4). Click Purge aheck and follow the instructions to complete the process.
Using Purge aheck function, it ensures that air tube is not clogged before use and clean
the gel which was accidentally sucked into the air tube after use.
*Note: To avoid the permanent damage to the system, user is advised to execute the
Purge aheck every time when the software requires.
Figure 3-4 Purge Check message box
29
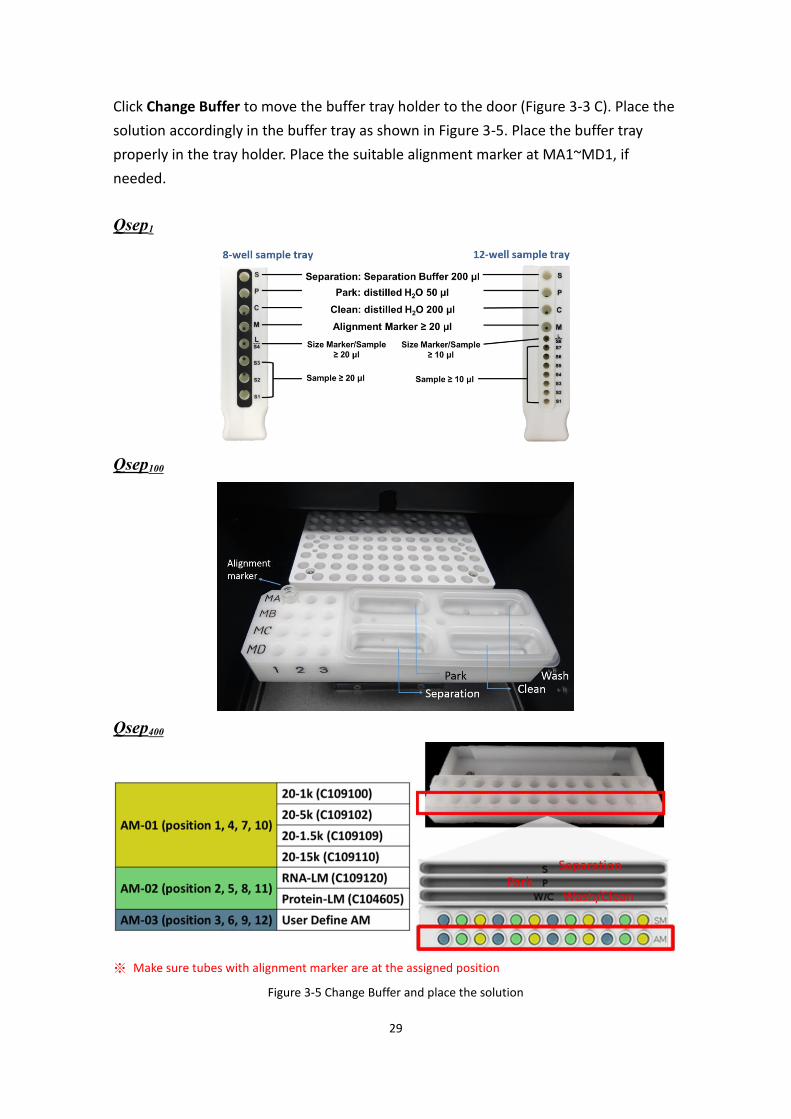
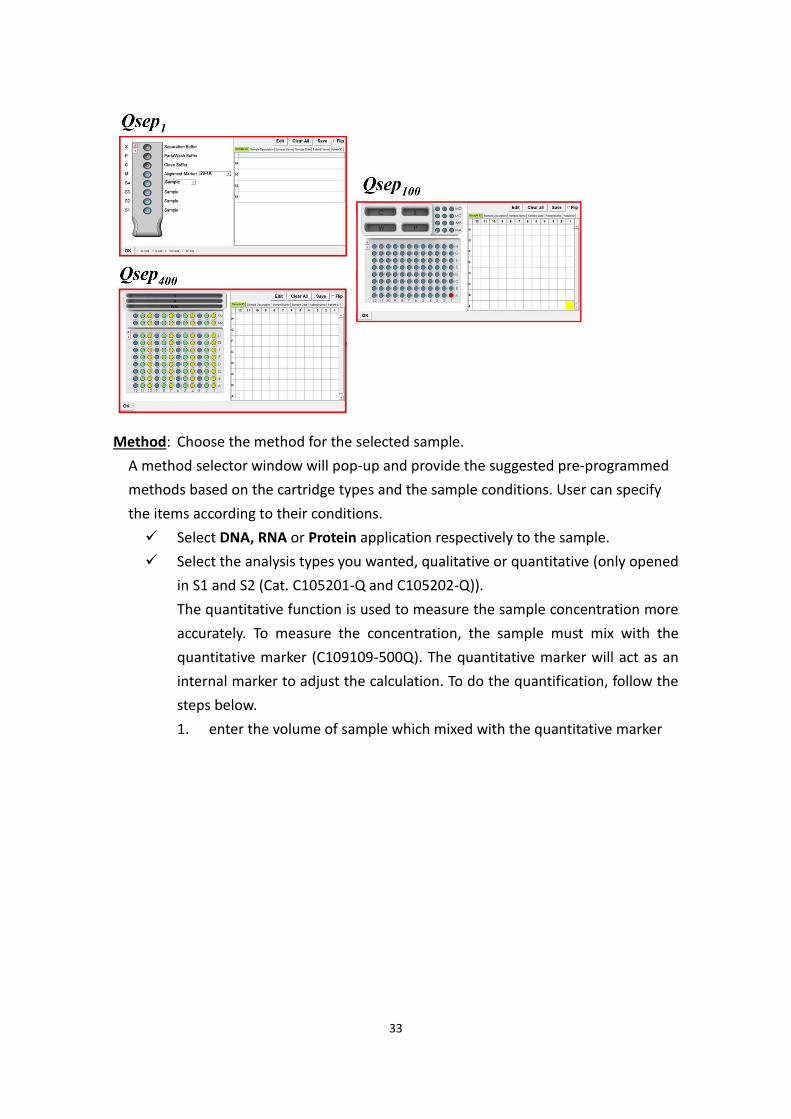
Click ahange Buffer to move the buffer tray holder to the door (Figure 3-3 C). Place the
solution accordingly in the buffer tray as shown in Figure 3-5. Place the buffer tray
properly in the tray holder. Place the suitable alignment marker at MA1~MD1, if
needed.
Qsep1
Qsep100
Qsep400
※ Make sure tubes with alignment marker are at the assigned position
Figure 3-5 Change Buffer and place the solution
30
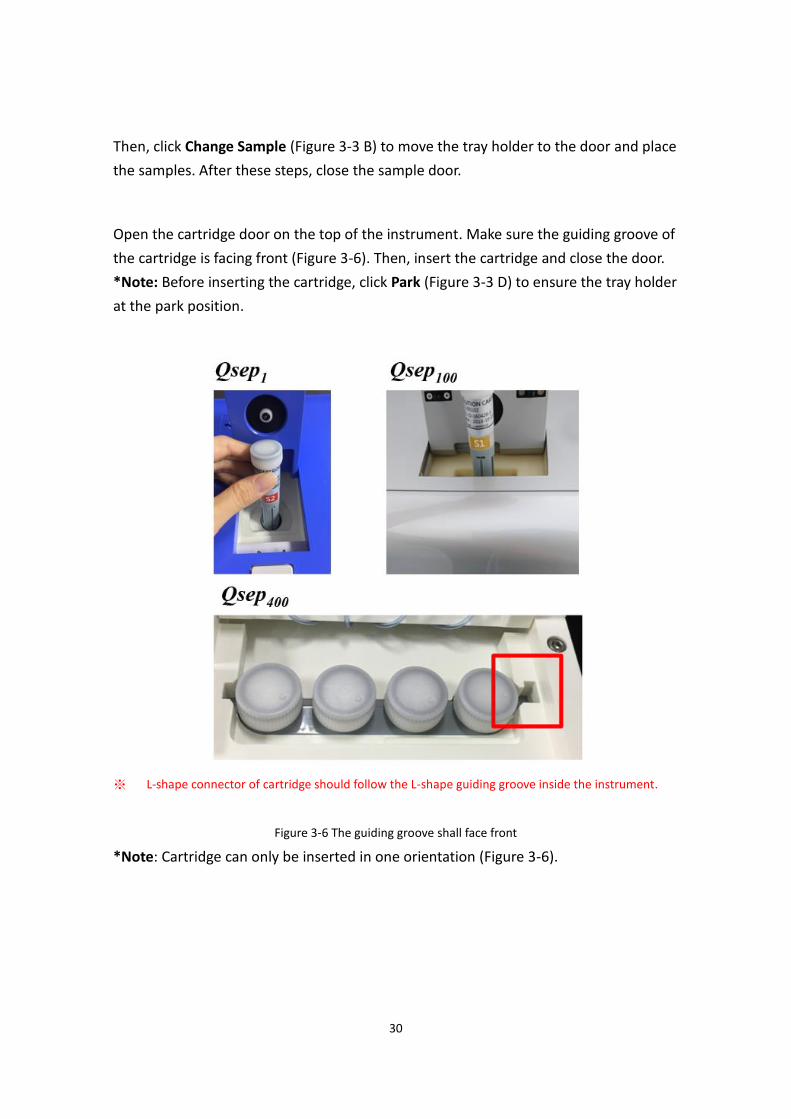
Then, click ahange Sample (Figure 3-3 B) to move the tray holder to the door and place
the samples. After these steps, close the sample door.
Open the cartridge door on the top of the instrument. Make sure the guiding groove of
the cartridge is facing front (Figure 3-6). Then, insert the cartridge and close the door.
*Note: Before inserting the cartridge, click Park (Figure 3-3 D) to ensure the tray holder
at the park position.
※ L-shape connector of cartridge should follow the L-shape guiding groove inside the instrument.
Figure 3-6 The guiding groove shall face front
*Note: Cartridge can only be inserted in one orientation (Figure 3-6).
31
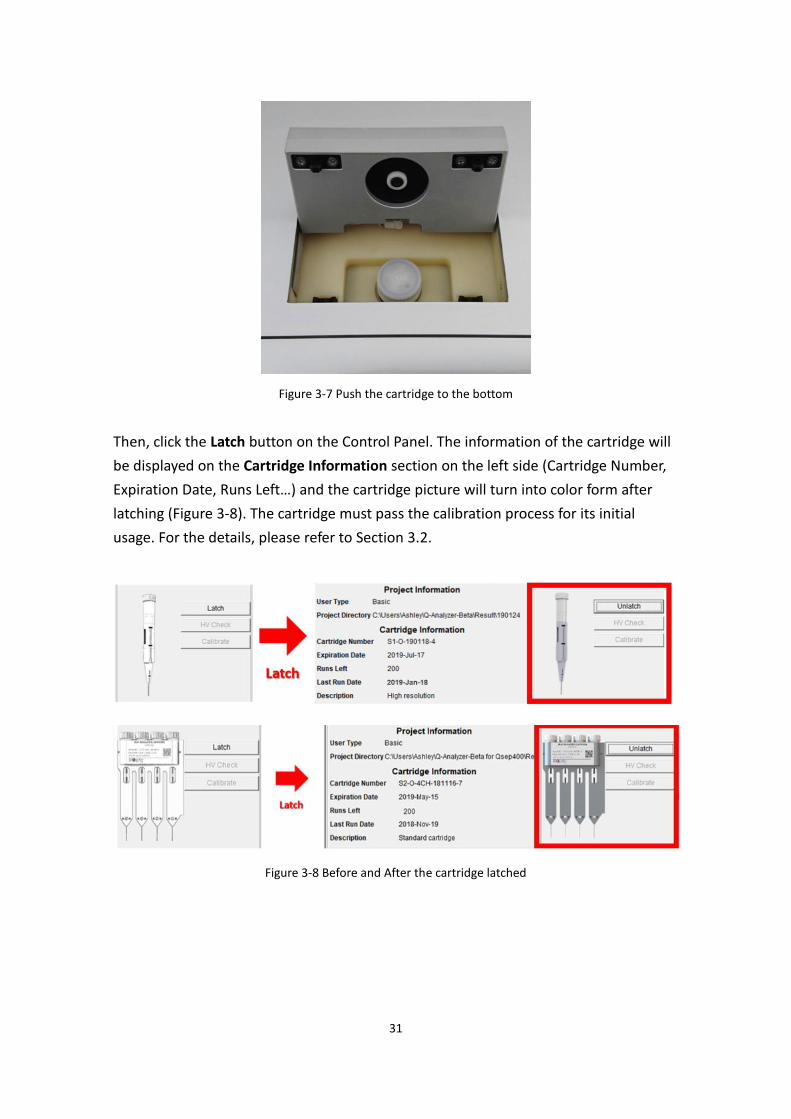
Figure 3-7 Push the cartridge to the bottom
Then, click the Latch button on the Control Panel. The information of the cartridge will
be displayed on the aartridge Information section on the left side (Cartridge Number,
Expiration Date, Runs Left…) and the cartridge picture will turn into color form after
latching (Figure 3-8). The cartridge must pass the calibration process for its initial
usage. For the details, please refer to Section 3.2.
Figure 3-8 Before and After the cartridge latched
32
3.1.2 Sequence and Method Setting
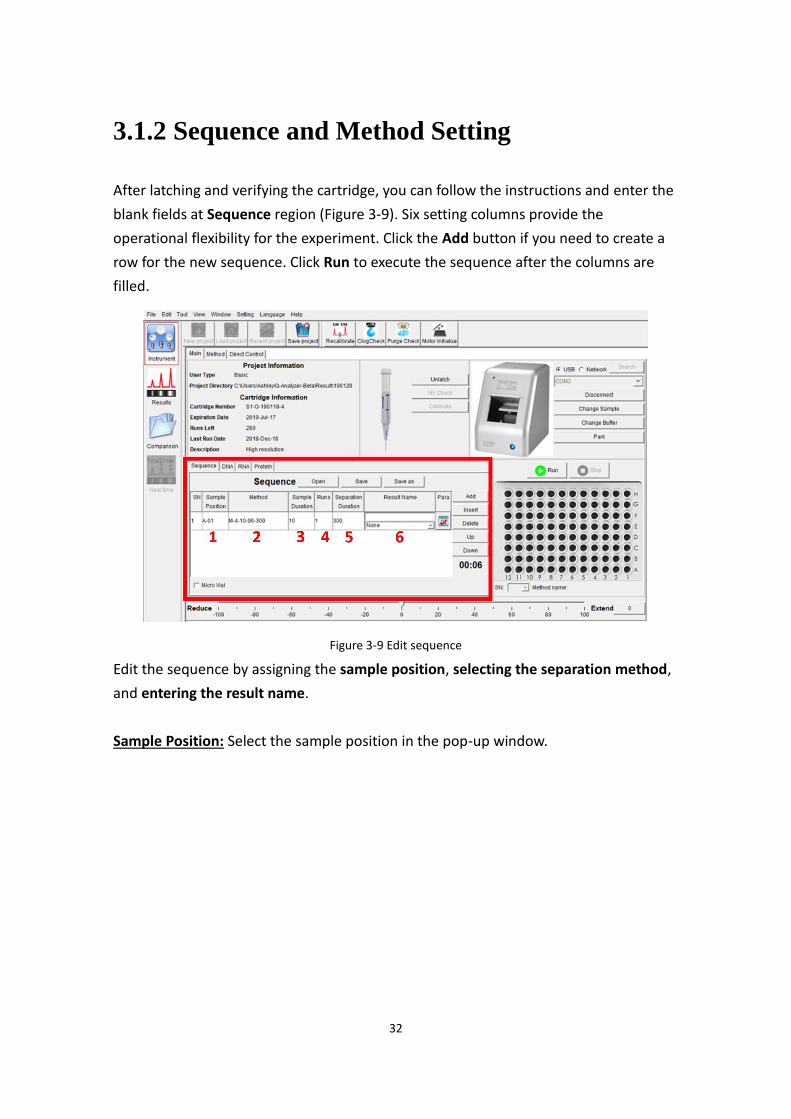
After latching and verifying the cartridge, you can follow the instructions and enter the
blank fields at Sequence region (Figure 3-9). Six setting columns provide the
operational flexibility for the experiment. Click the Add button if you need to create a
row for the new sequence. Click Run to execute the sequence after the columns are
filled.
Figure 3-9 Edit sequence
Edit the sequence by assigning the sample position, selecting the separation method,
and entering the result name.
Sample Position: Select the sample position in the pop-up window.
33
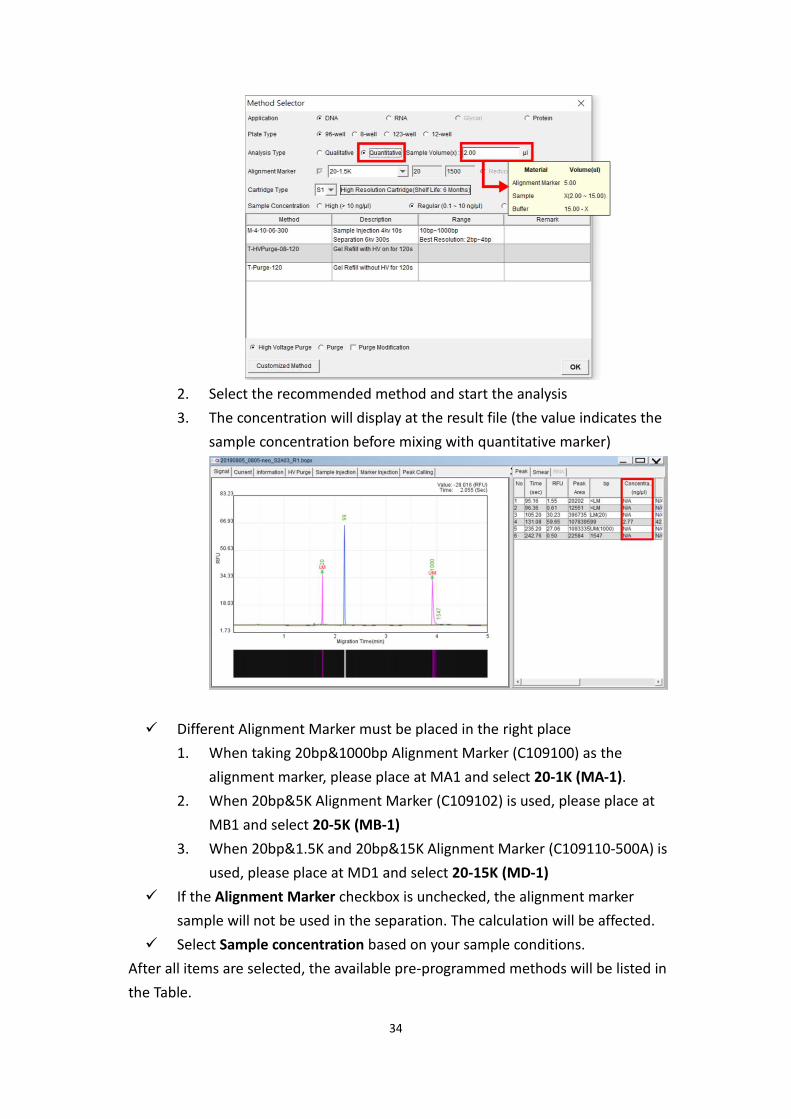
Method: Choose the method for the selected sample.
A method selector window will pop-up and provide the suggested pre-programmed
methods based on the cartridge types and the sample conditions. User can specify
the items according to their conditions.
✓ Select DNA, RNA or Protein application respectively to the sample.
✓ Select the analysis types you wanted, qualitative or quantitative (only opened
in S1 and S2 (Cat. C105201-Q and C105202-Q)).
The quantitative function is used to measure the sample concentration more
accurately. To measure the concentration, the sample must mix with the
quantitative marker (C109109-500Q). The quantitative marker will act as an
internal marker to adjust the calculation. To do the quantification, follow the
steps below.
1. enter the volume of sample which mixed with the quantitative marker
34
2. Select the recommended method and start the analysis
3. The concentration will display at the result file (the value indicates the
sample concentration before mixing with quantitative marker)
✓ Different Alignment Marker must be placed in the right place
1. When taking 20bp&1000bp Alignment Marker (C109100) as the
alignment marker, please place at MA1 and select 20-1K (MA-1).
2. When 20bp&5K Alignment Marker (C109102) is used, please place at
MB1 and select 20-5K (MB-1)
3. When 20bp&1.5K and 20bp&15K Alignment Marker (C109110-500A) is
used, please place at MD1 and select 20-15K (MD-1)
✓ If the Alignment Marker checkbox is unchecked, the alignment marker
sample will not be used in the separation. The calculation will be affected.
✓ Select Sample concentration based on your sample conditions.
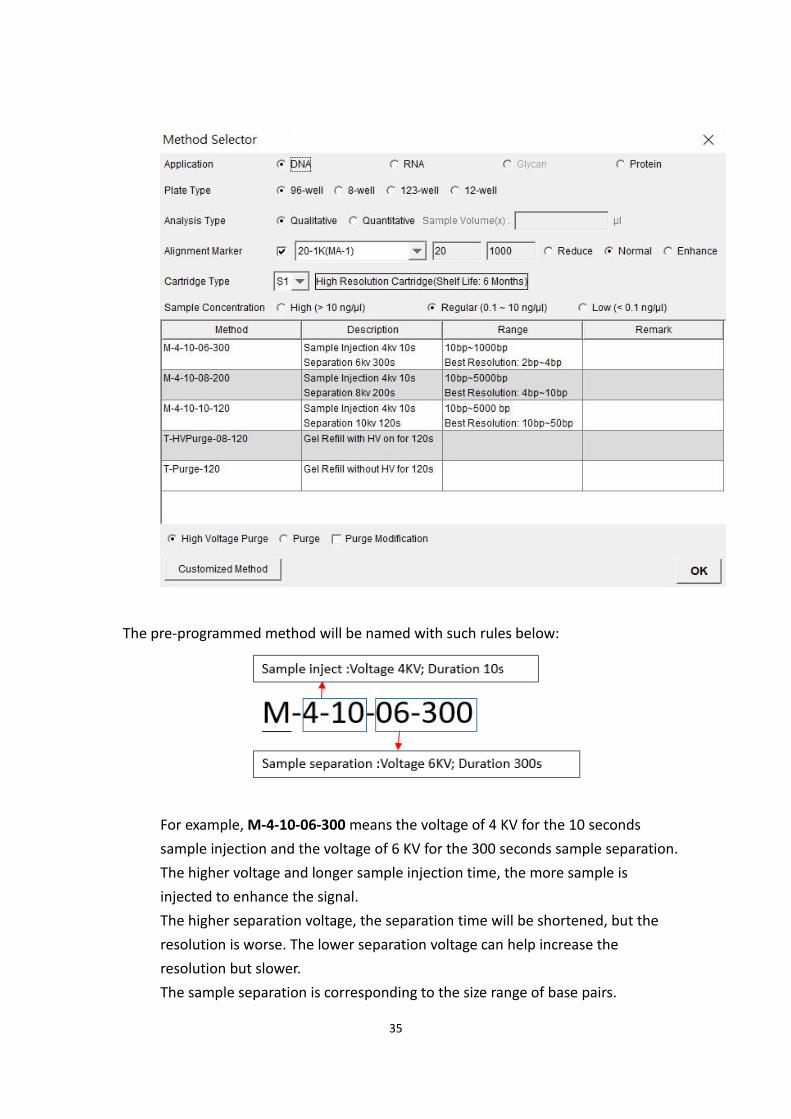
After all items are selected, the available pre-programmed methods will be listed in
the Table.
35
The pre-programmed method will be named with such rules below:
For example, M-4-10-06-300 means the voltage of 4 KV for the 10 seconds
sample injection and the voltage of 6 KV for the 300 seconds sample separation.
The higher voltage and longer sample injection time, the more sample is
injected to enhance the signal.
The higher separation voltage, the separation time will be shortened, but the
resolution is worse. The lower separation voltage can help increase the
resolution but slower.
The sample separation is corresponding to the size range of base pairs.
36
Sample Duration: The duration of the sample injection time
The selected method will display the Sample Duration on the Sequence table.
The Sample Duration affects the quantity of the injected sample. Modify the
duration according to the sample the concentration and the amplitude at your
preference.
Run: The number of runs
The repetition of the same samples is required to execute the separation. If the
samples are more than one, the sequence will be sample A, B… then sample A,
B….
Separation Duration: The separation time during the execution.
The separation time may be affected by the experimental condition such as
temperature, concentration of separation buffer, etc.
The Separation Duration of the selected method will be displayed on the
Sequence table. You can modify the duration of the separation according to
your condition. The Separation Duration time is recommended to be 30 seconds
longer than the time when the upper marker appears.
37
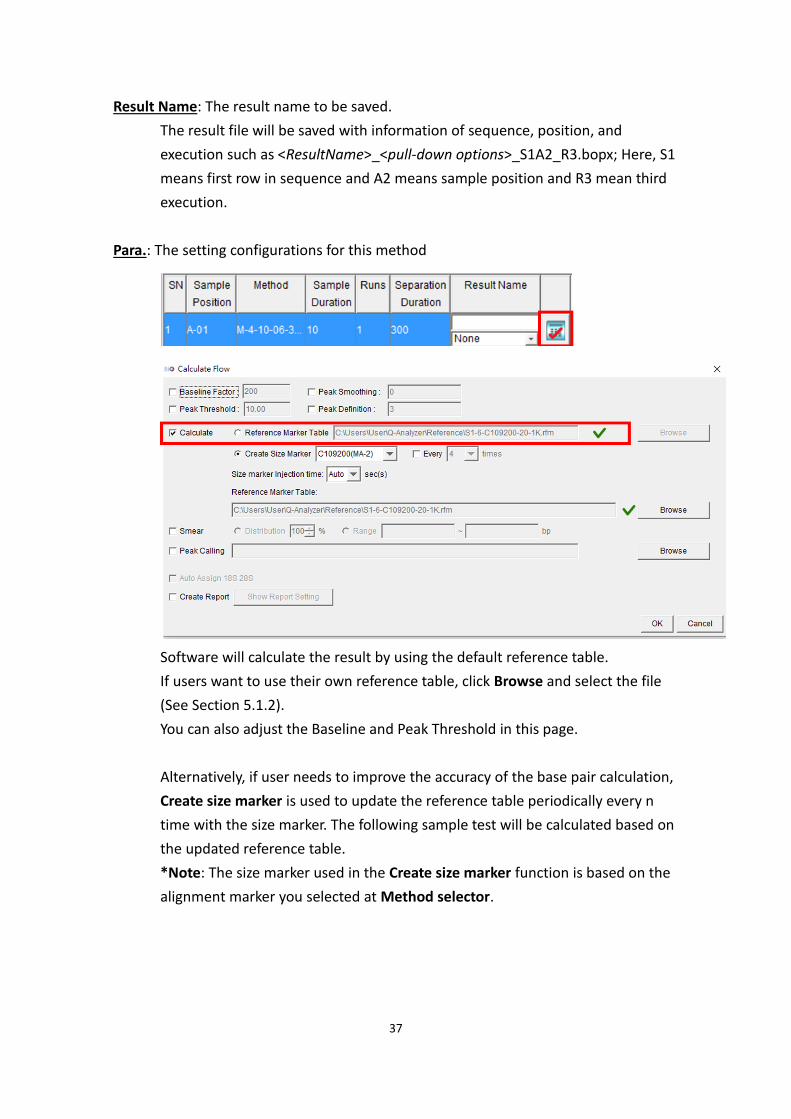
Result Name: The result name to be saved.
The result file will be saved with information of sequence, position, and
execution such as <ResultName>_<pull-down options>_S1A2_R3.bopx; Here, S1
means first row in sequence and A2 means sample position and R3 mean third
execution.
Para.: The setting configurations for this method
Software will calculate the result by using the default reference table.
If users want to use their own reference table, click Browse and select the file
(See Section 5.1.2).
You can also adjust the Baseline and Peak Threshold in this page.
Alternatively, if user needs to improve the accuracy of the base pair calculation,
areate size marker is used to update the reference table periodically every n
time with the size marker. The following sample test will be calculated based on
the updated reference table.
*Note: The size marker used in the areate size marker function is based on the
alignment marker you selected at Method selector.
38
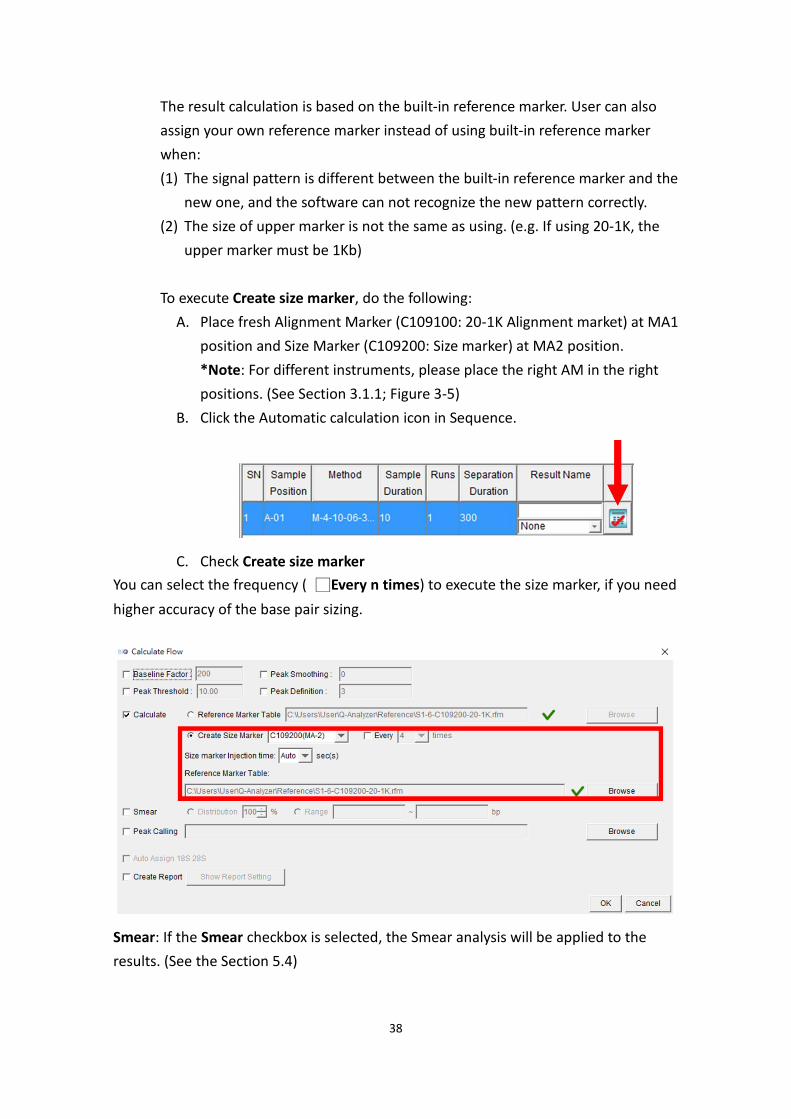
The result calculation is based on the built-in reference marker. User can also
assign your own reference marker instead of using built-in reference marker
when:
(1) The signal pattern is different between the built-in reference marker and the
new one, and the software can not recognize the new pattern correctly.
(2) The size of upper marker is not the same as using. (e.g. If using 20-1K, the
upper marker must be 1Kb)
To execute areate size marker, do the following:
A. Place fresh Alignment Marker (C109100: 20-1K Alignment market) at MA1
position and Size Marker (C109200: Size marker) at MA2 position.
*Note: For different instruments, please place the right AM in the right
positions. (See Section 3.1.1; Figure 3-5)
B. Click the Automatic calculation icon in Sequence.
C. Check areate size marker
You can select the frequency ( □Every n times) to execute the size marker, if you need
higher accuracy of the base pair sizing.
Smear: If the Smear checkbox is selected, the Smear analysis will be applied to the
results. (See the Section 5.4)
39
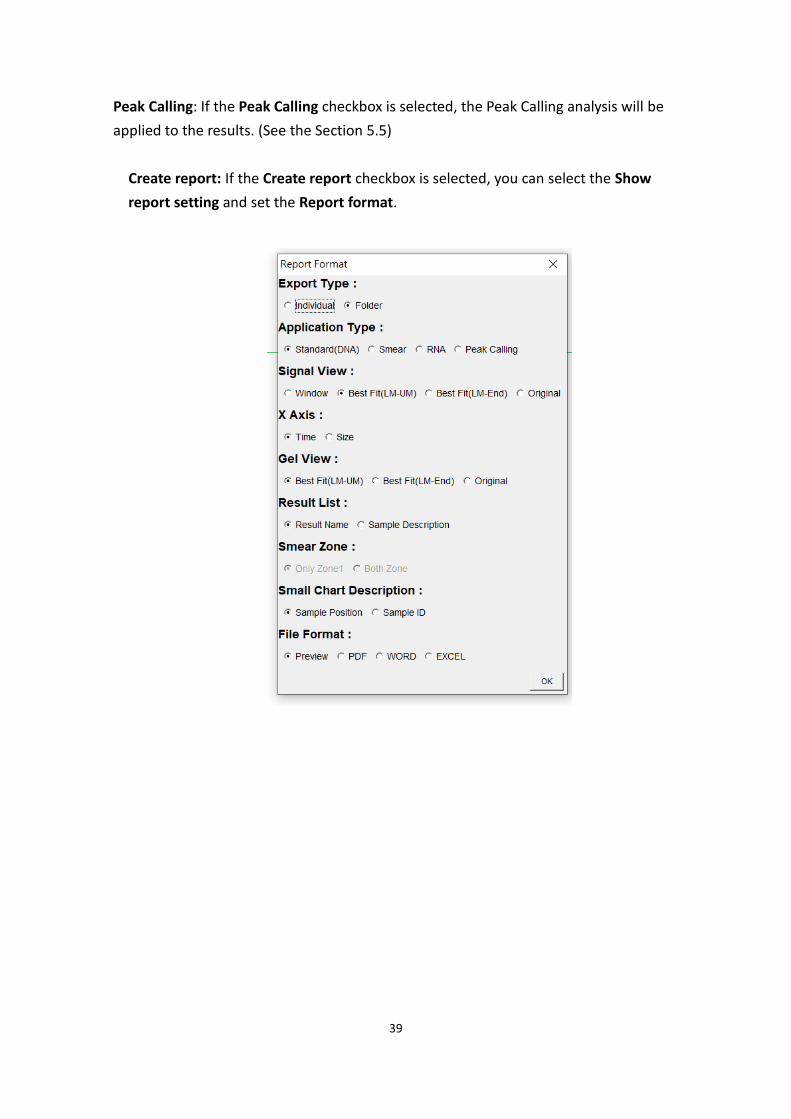
Peak aalling: If the Peak aalling checkbox is selected, the Peak Calling analysis will be
applied to the results. (See the Section 5.5)
areate report: If the areate report checkbox is selected, you can select the Show
report setting and set the Report format.
40
3.2 Cartridge Calibration
In order to ensure the quality of the new cartridge, calibration is required before the
initial usage.
The concept of the verification is to do the HV check by checking if the current of the gel
is stable under HV condition. The result will show passed if the current is stable. The
aalibrate function is to confirm the quality of the cartridge by executing the test of the
alignment marker and checking if the signal of the alignment marker can be detected
when using this cartridge.
Please prepare ≥ 20µL fresh alignment marker in a 200µL PCR tube (adding 10µL mineral
oil to prevent evaporation) and place the marker at MA1 position. Make sure the buffer
tray is placed on the buffer tray holder. Insert the new cartridge and close the door.
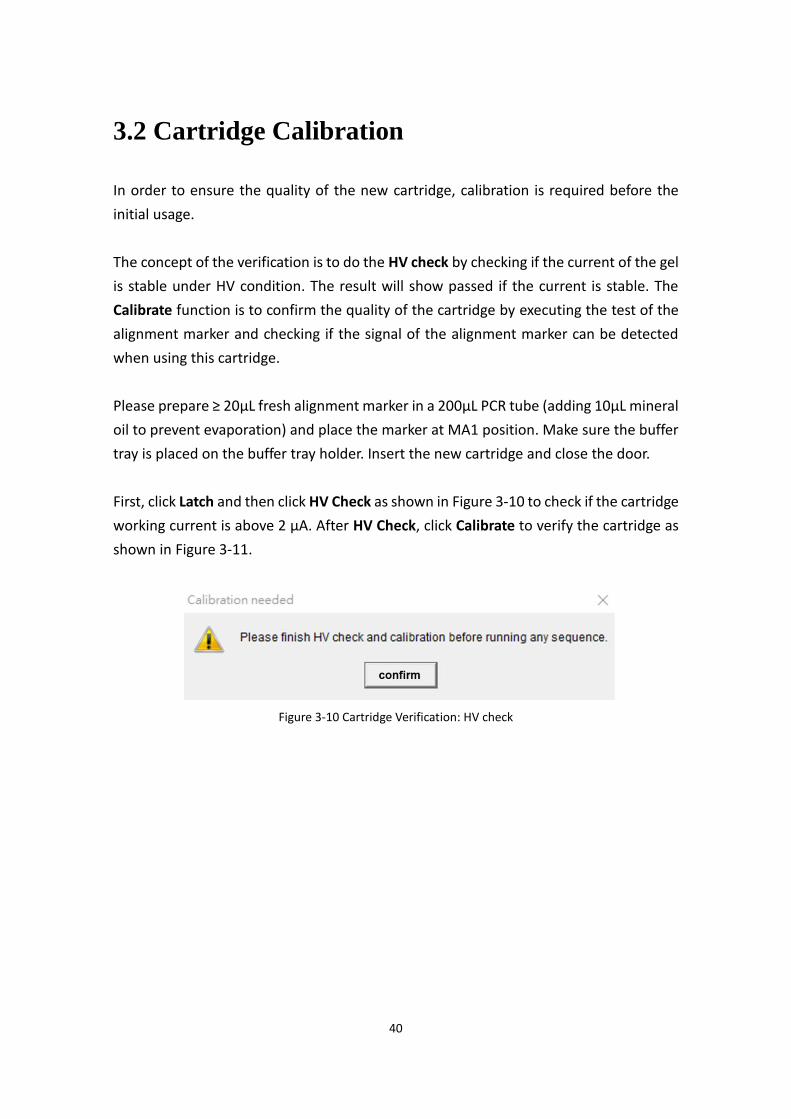
First, click Latch and then click HV aheck as shown in Figure 3-10 to check if the cartridge
working current is above 2 µA. After HV aheck, click aalibrate to verify the cartridge as
shown in Figure 3-11.
Figure 3-10 Cartridge Verification: HV check
41
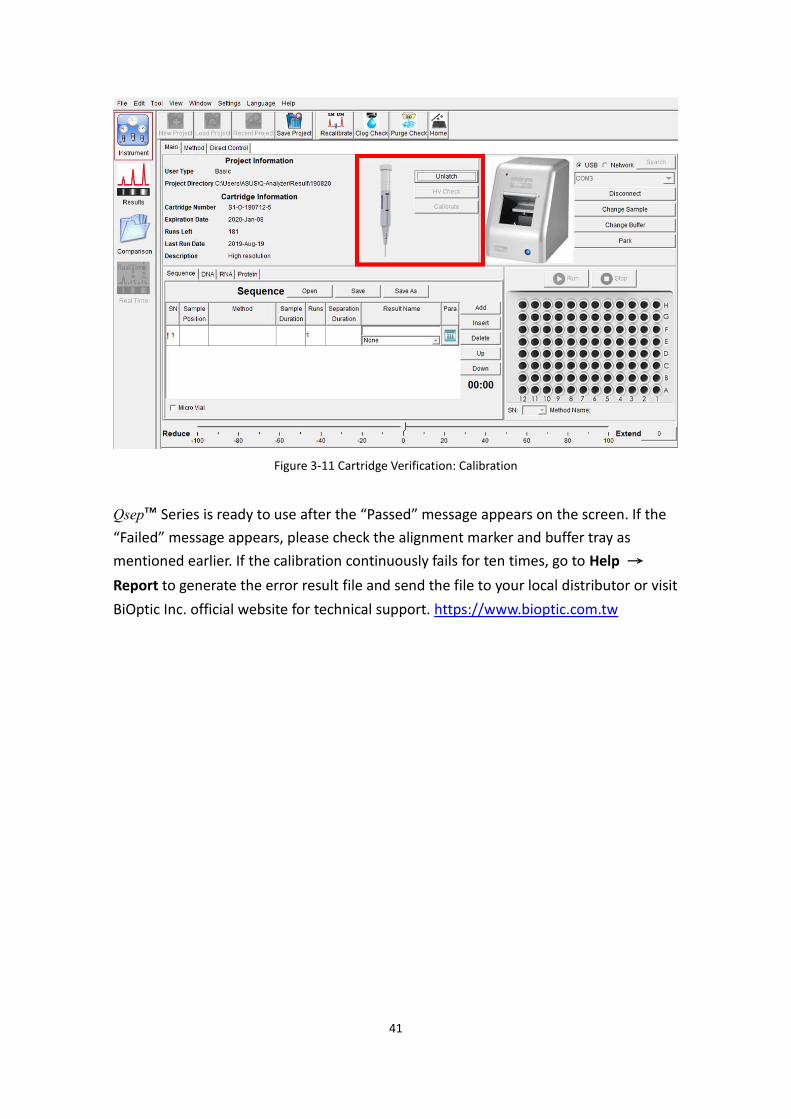
Figure 3-11 Cartridge Verification: Calibration
Qsep™ Series is ready to use after the “Passed” message appears on the screen. If the
“Failed” message appears, please check the alignment marker and buffer tray as
mentioned earlier. If the calibration continuously fails for ten times, go to Help →
Report to generate the error result file and send the file to your local distributor or visit
BiOptic Inc. official website for technical support. https://www.bioptic.com.tw
42
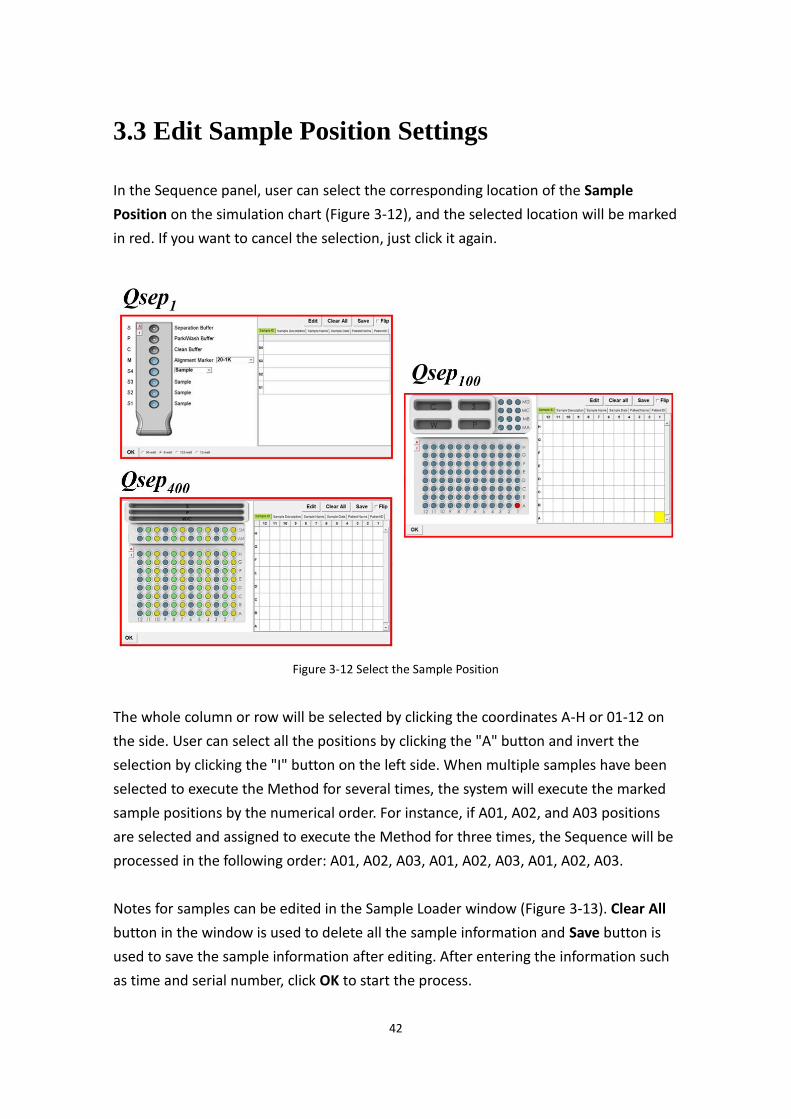
3.3 Edit Sample Position Settings
In the Sequence panel, user can select the corresponding location of the Sample
Position on the simulation chart (Figure 3-12), and the selected location will be marked
in red. If you want to cancel the selection, just click it again.
Figure 3-12 Select the Sample Position
The whole column or row will be selected by clicking the coordinates A-H or 01-12 on
the side. User can select all the positions by clicking the "A" button and invert the
selection by clicking the "I" button on the left side. When multiple samples have been
selected to execute the Method for several times, the system will execute the marked
sample positions by the numerical order. For instance, if A01, A02, and A03 positions
are selected and assigned to execute the Method for three times, the Sequence will be
processed in the following order: A01, A02, A03, A01, A02, A03, A01, A02, A03.
Notes for samples can be edited in the Sample Loader window (Figure 3-13). alear All
button in the window is used to delete all the sample information and Save button is
used to save the sample information after editing. After entering the information such
as time and serial number, click OK to start the process.
43
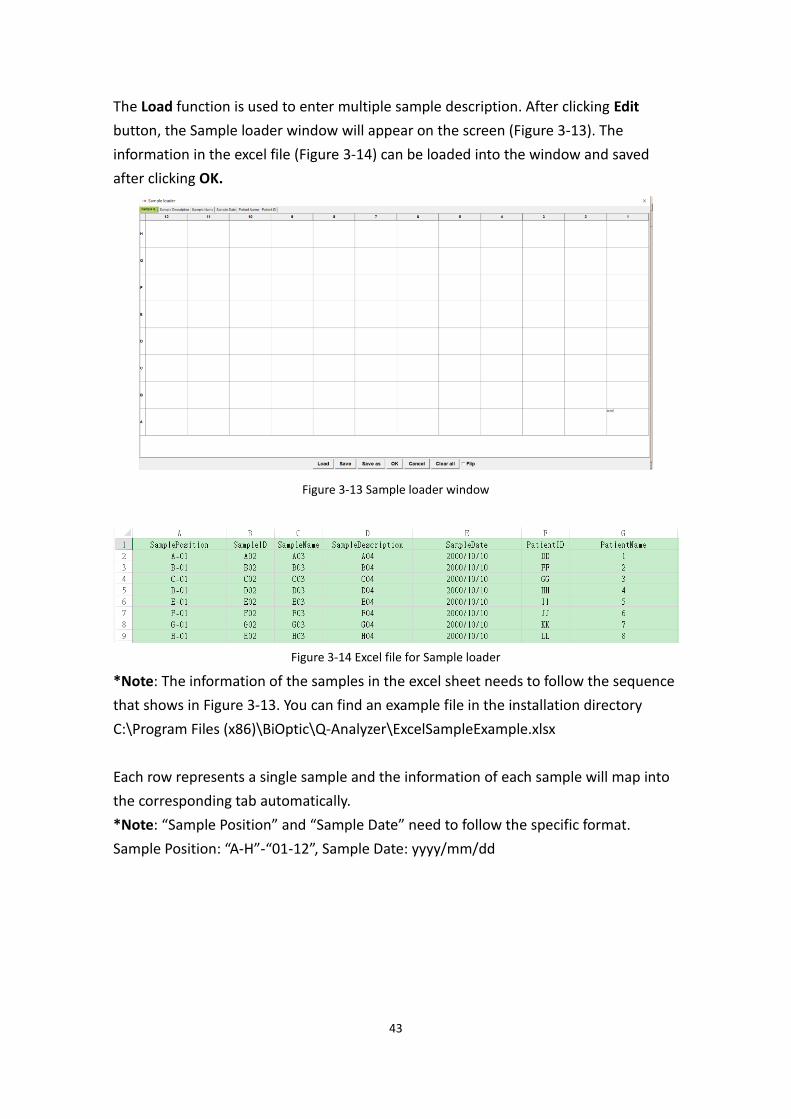
The Load function is used to enter multiple sample description. After clicking Edit
button, the Sample loader window will appear on the screen (Figure 3-13). The
information in the excel file (Figure 3-14) can be loaded into the window and saved
after clicking OK.
Figure 3-13 Sample loader window
Figure 3-14 Excel file for Sample loader
*Note: The information of the samples in the excel sheet needs to follow the sequence
that shows in Figure 3-13. You can find an example file in the installation directory
C:\Program Files (x86)\BiOptic\Q-Analyzer\ExcelSampleExample.xlsx
Each row represents a single sample and the information of each sample will map into
the corresponding tab automatically.
*Note: “Sample Position” and “Sample Date” need to follow the specific format.
Sample Position: “A-H”-“01-12”, Sample Date: yyyy/mm/dd
44
3.4 Recalibration
Recalibration can help to identify the alignment marker (upper marker and lower
marker) correctly.
Conduct Recalibrate if any of the following situations occur:
• The alignment marker has been replaced
• The cartridge has been stored for more than two weeks since the last
execution
• The software cannot identify the alignment marker correctly
To Recalibrate, do the following steps:
Step1. Make sure the fresh Alignment Marker (e.g. 20-1K) is placed at the right position
(e.g. MA1)
Step2. Make sure all buffers are in good condition
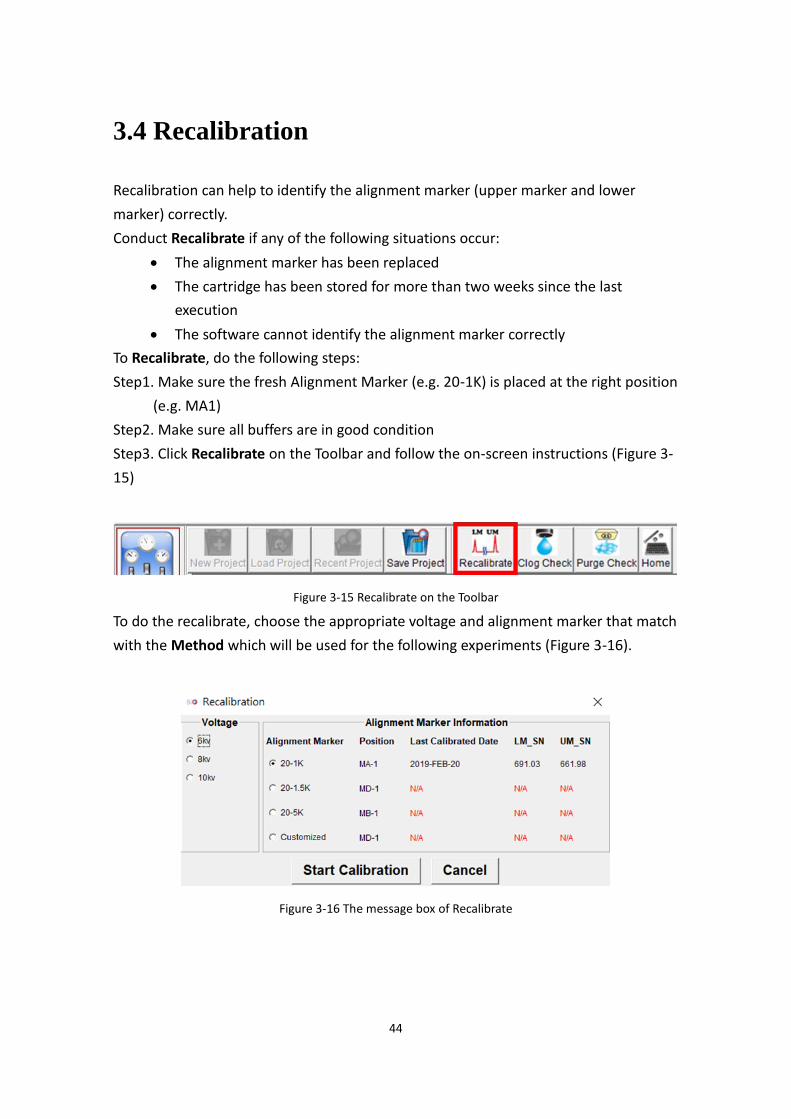
Step3. Click Recalibrate on the Toolbar and follow the on-screen instructions (Figure 3-
15)
Figure 3-15 Recalibrate on the Toolbar
To do the recalibrate, choose the appropriate voltage and alignment marker that match
with the Method which will be used for the following experiments (Figure 3-16).
Figure 3-16 The message box of Recalibrate
45
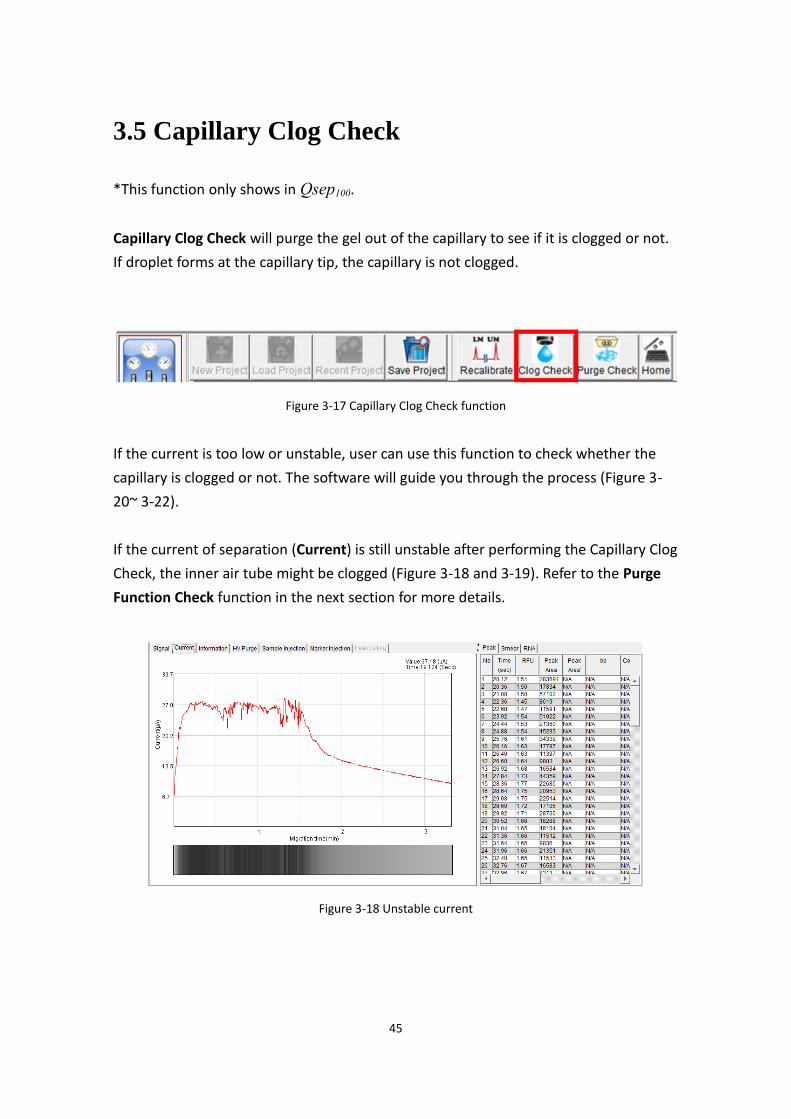
3.5 Capillary Clog Check
*This function only shows in Qsep100.
aapillary alog aheck will purge the gel out of the capillary to see if it is clogged or not.
If droplet forms at the capillary tip, the capillary is not clogged.
Figure 3-17 Capillary Clog Check function
If the current is too low or unstable, user can use this function to check whether the
capillary is clogged or not. The software will guide you through the process (Figure 3-
20~ 3-22).
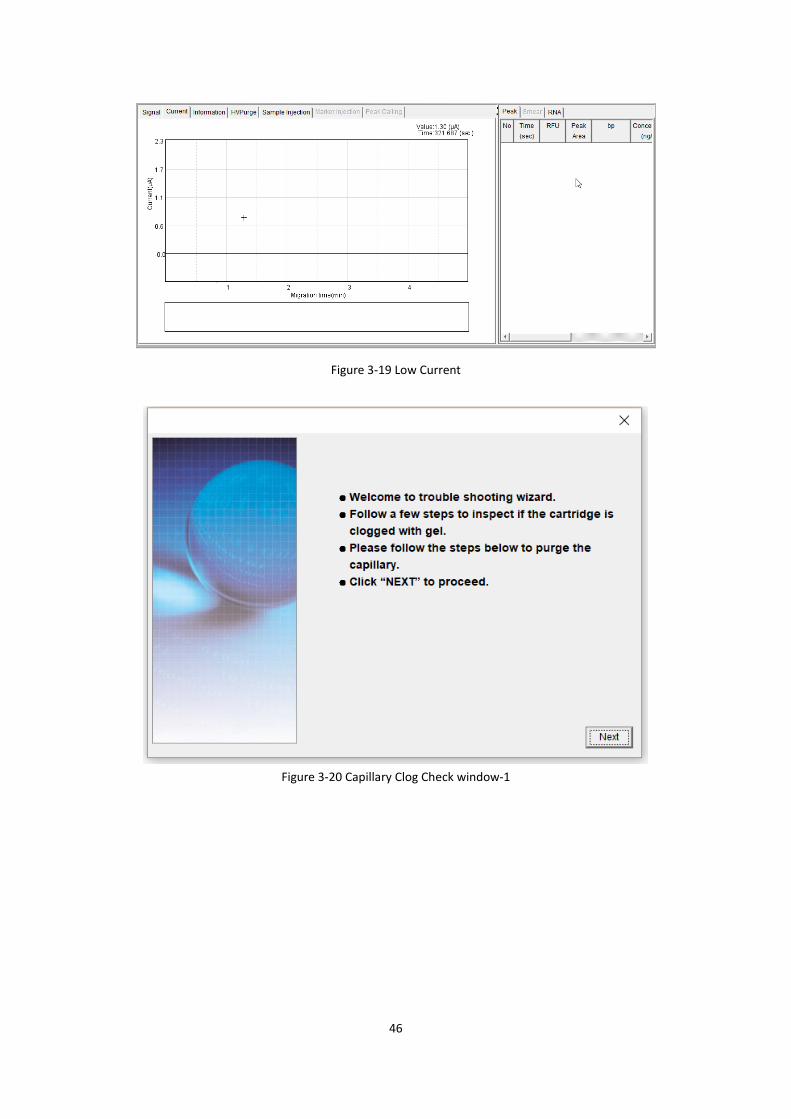
If the current of separation (aurrent) is still unstable after performing the Capillary Clog
Check, the inner air tube might be clogged (Figure 3-18 and 3-19). Refer to the Purge
Function aheck function in the next section for more details.
Figure 3-18 Unstable current
46
Figure 3-19 Low Current
Figure 3-20 Capillary Clog Check window-1
47
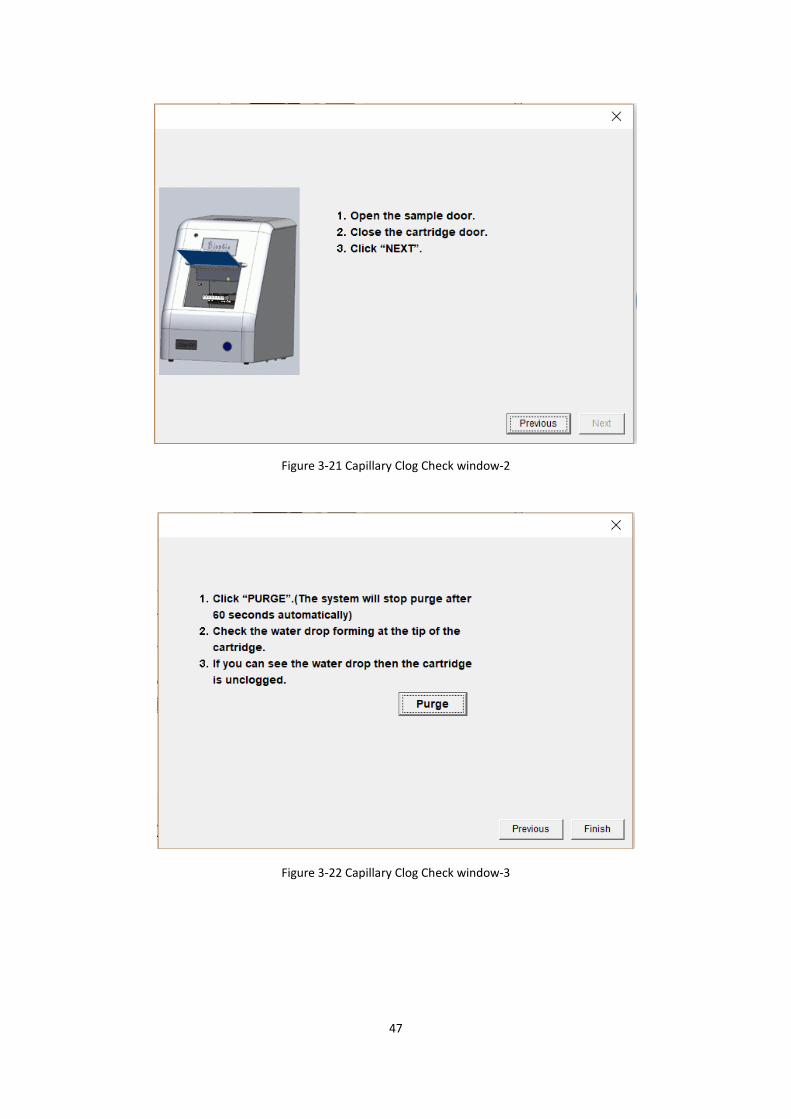
Figure 3-21 Capillary Clog Check window-2
Figure 3-22 Capillary Clog Check window-3
48
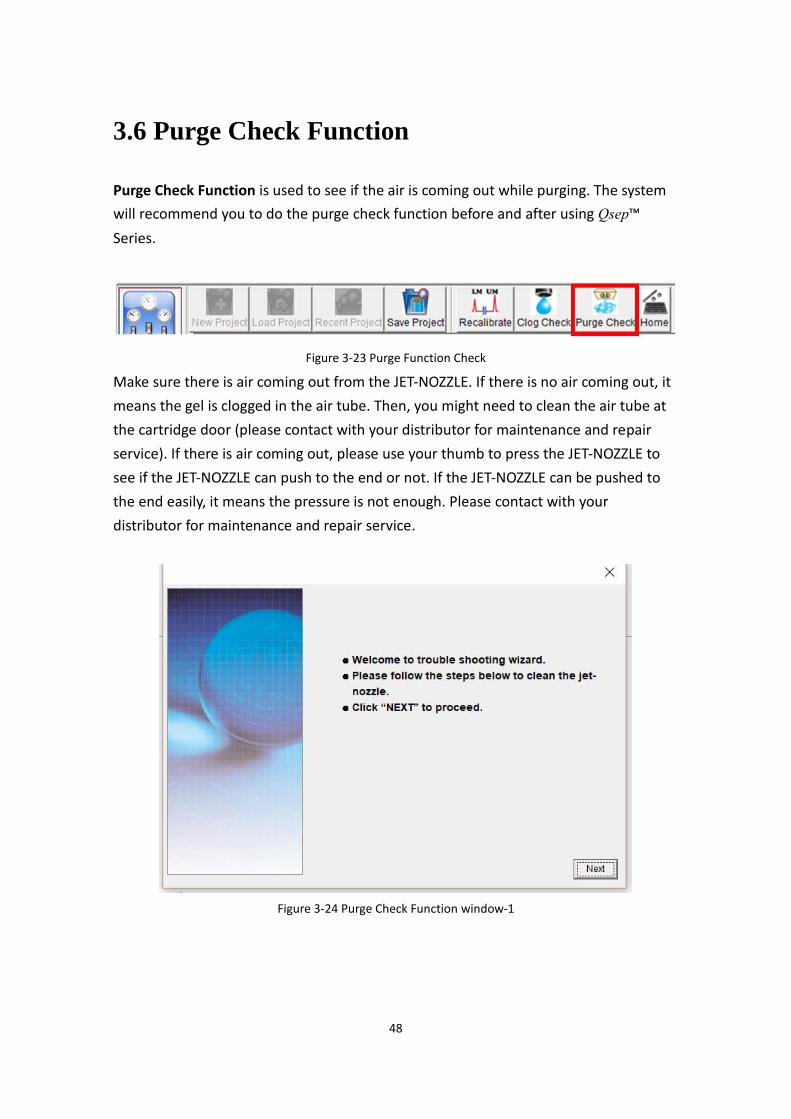
3.6 Purge Check Function
Purge aheck Function is used to see if the air is coming out while purging. The system
will recommend you to do the purge check function before and after using Qsep™
Series.
Figure 3-23 Purge Function Check
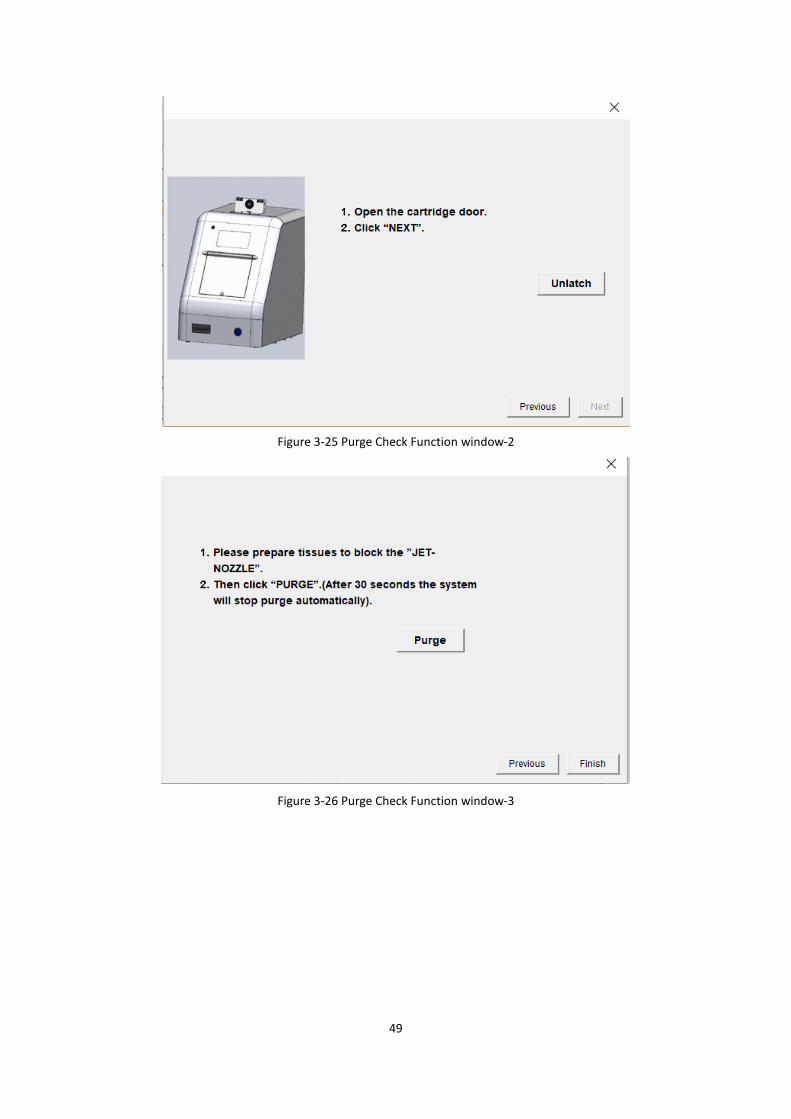
Make sure there is air coming out from the JET-NOZZLE. If there is no air coming out, it
means the gel is clogged in the air tube. Then, you might need to clean the air tube at
the cartridge door (please contact with your distributor for maintenance and repair
service). If there is air coming out, please use your thumb to press the JET-NOZZLE to
see if the JET-NOZZLE can push to the end or not. If the JET-NOZZLE can be pushed to
the end easily, it means the pressure is not enough. Please contact with your
distributor for maintenance and repair service.
Figure 3-24 Purge Check Function window-1
49
Figure 3-25 Purge Check Function window-2
Figure 3-26 Purge Check Function window-3
50
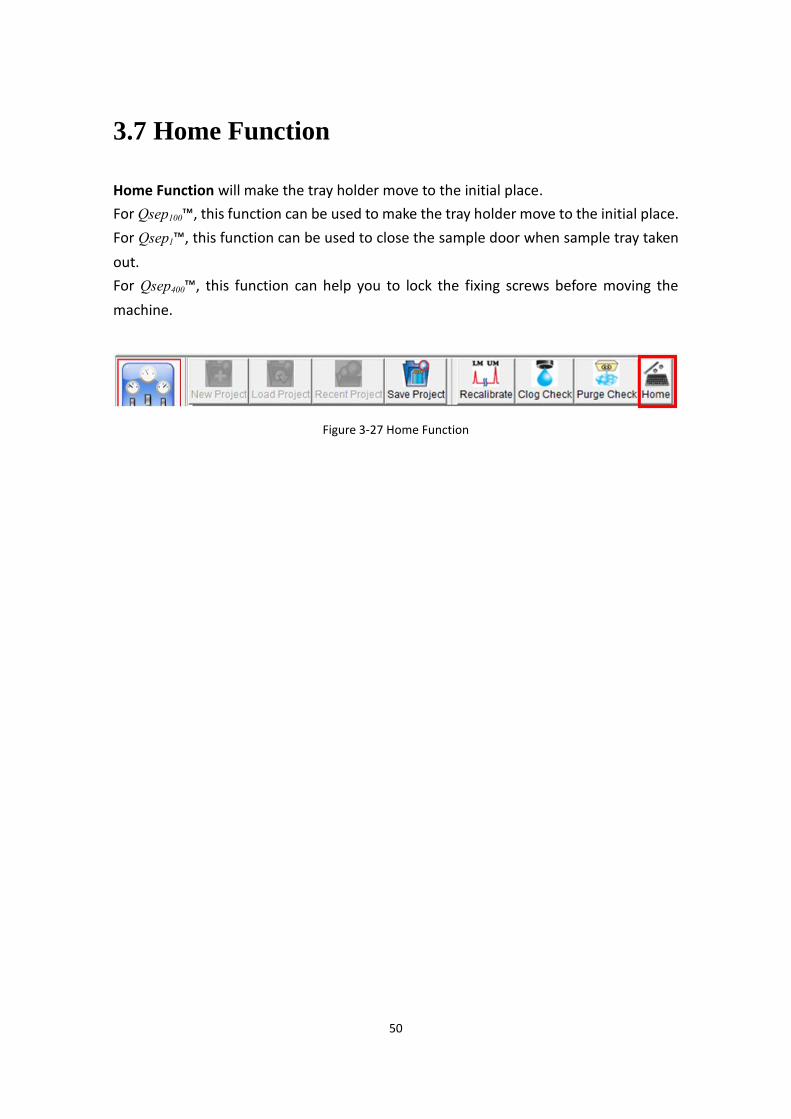
3.7 Home Function
Home Function will make the tray holder move to the initial place.
For Qsep100™, this function can be used to make the tray holder move to the initial place.
For Qsep1™, this function can be used to close the sample door when sample tray taken
out.
For Qsep400™, this function can help you to lock the fixing screws before moving the
machine.
Figure 3-27 Home Function
51
4. Q-Analyzer™ User Interface
4.1 Main Window
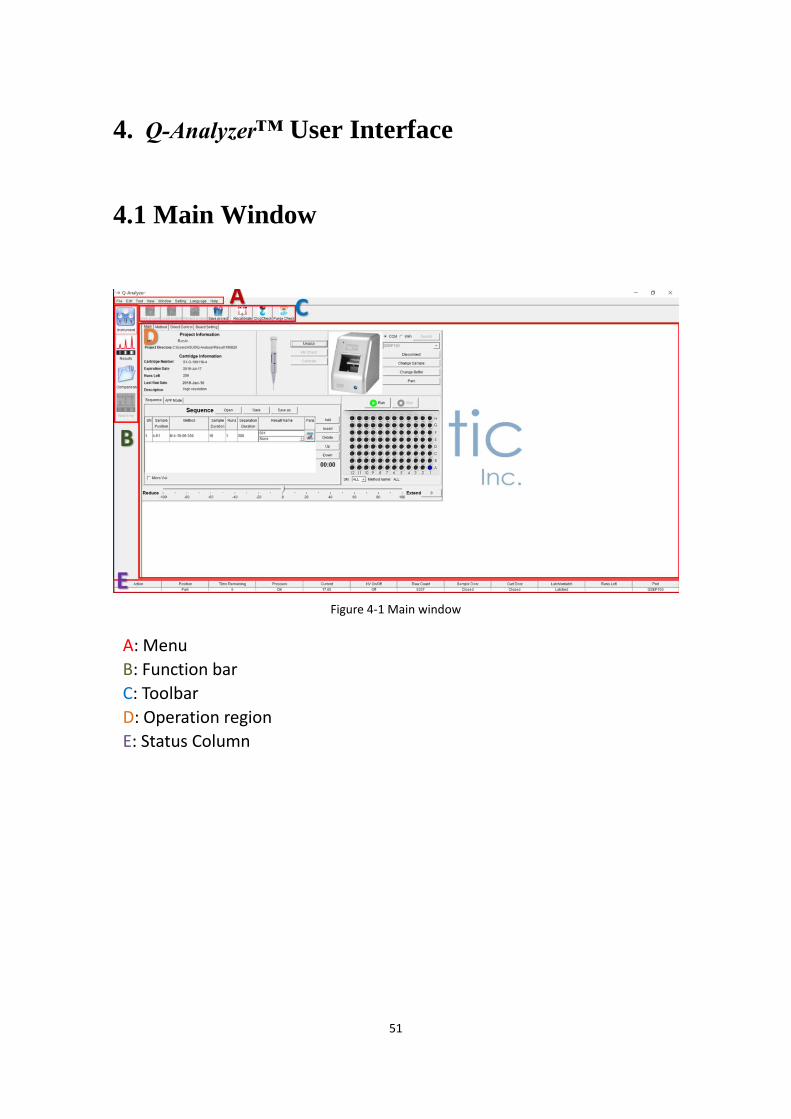
Figure 4-1 Main window
A: Menu
B: Function bar
C: Toolbar
D: Operation region
E: Status Column

52
4.1.1 System Overview
After launching Q-Analyzer™, the Main Panel (Figure 4-1) will appear and provide the
information of Qsep™ Series (status, data/results display, and post data analysis).
Menu:
All available functions can be found in the Menu list. For details, please refer to
Section 4.3
Function bar:
There are four icons in the Function bar. You can select Instrument to the
control panel and the detail of operation can be found in Section 4.4. If you
need to display or analyze the data, please click the Results or aomparison (See
Chapter 5). When the execution of sequence is in progress, the collected data
will display in the Real time.
Toolbar:
The Toolbar provides several icons relatively to the Function page you have
selected.
The icons are the most frequently accessed functions you may need. All the
detail of the Toolbar relatively to the Functions will be described at Section 4.2
Operation Region:
Operation Region is the region that is used to operate or display the main
window. After selecting the desired mode, the corresponding panel will display
on the operation region. User can switch to the control panel by clicking
Instrument in Function bar or switch to the display panel by clicking Result or
aompare. When a sequence is in progress, the Real time mode will show the
real-time data in the operation region.
Status aolumn:
The information of the system status will be shown at the bottom of Main Panel.
53
4.1.2 System Status Column
The parameters shown at Status Column are as follow (Figure 4-1 E)
Action: the proceeding action
Position: the position of the cartridge tip
Time Remaining: the remaining time to complete the processing action
Pressure: shows whether the air pressure is applied properly
Fail indicates there is lower than the system requirement
If the pressure is on the low side of the system requirement, the color of pressure
number will change from black to orange to remind you.
aurrent: the current (μA) flow through the capillary
HV On/Off: the status of High Voltage power supply
Raw aount: the original signal
Sample Door: the sample door is Opened or alosed
aart Door: the cartridge door is Opened or alosed
Latch/Unlatch: shows whether the cartridge is placed and locked properly
Runs Left: the remaining proceeding test
Port: the serial port connected with the computer
SD card: after connecting Qsep1, the SD card column will show and remain SD is
detected or not.
54
4.2 Function bar and Toolbar
In the Main window, there are four major functions of Q-Analyzer™ in Function bar,
which are Instrument, Results, Comparison, and Real time. User can select the desired
function either to operate Qsep™ series or analyze the data. For easy access, the most
frequently used functions are placed at the Toolbar. The detail information will be
described in the following section. By default, you will begin with the Instrument
function.
4.2.1 Instrument
Instrument is the major control function to operate Qsep™ series. The usage of the
control panel will be described in Section 4.4.
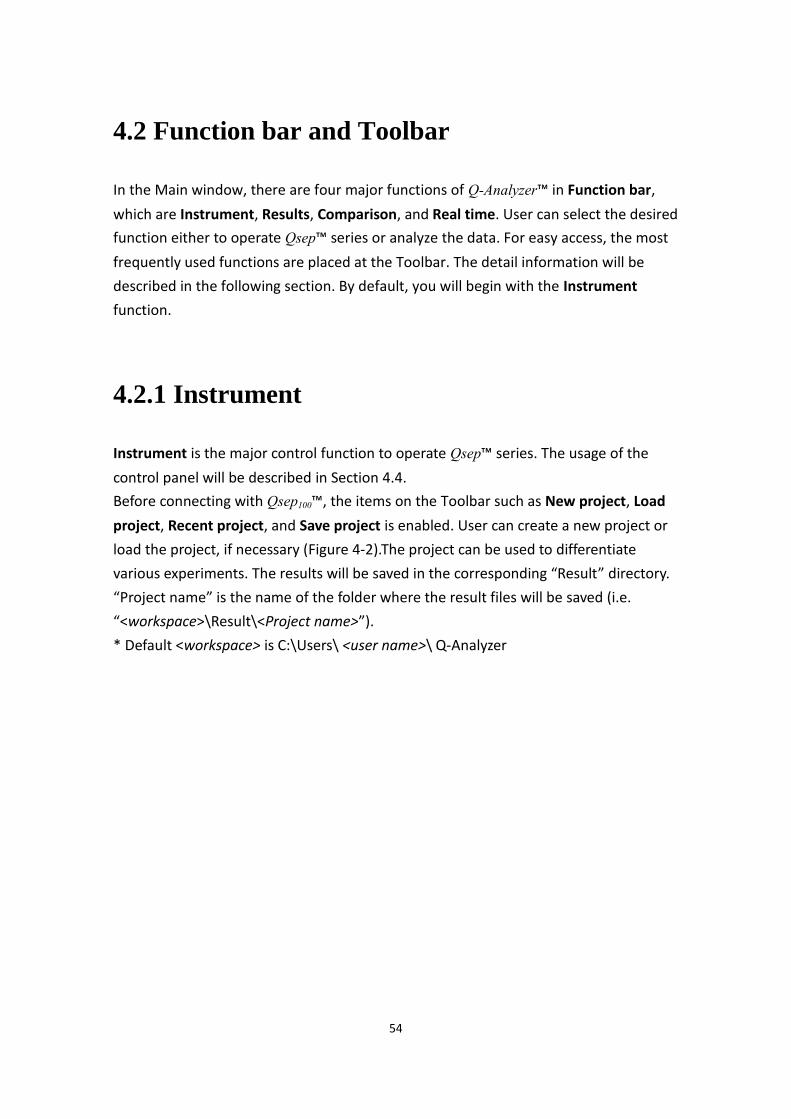
Before connecting with Qsep100™, the items on the Toolbar such as New project, Load
project, Recent project, and Save project is enabled. User can create a new project or
load the project, if necessary (Figure 4-2).The project can be used to differentiate
various experiments. The results will be saved in the corresponding “Result” directory.
“Project name” is the name of the folder where the result files will be saved (i.e.
“<workspace>\Result\<Project name>”).
* Default <workspace> is C:\Users\ <user name>\ Q-Analyzer
55
Figure 4-2 Instrument function before instrument connection
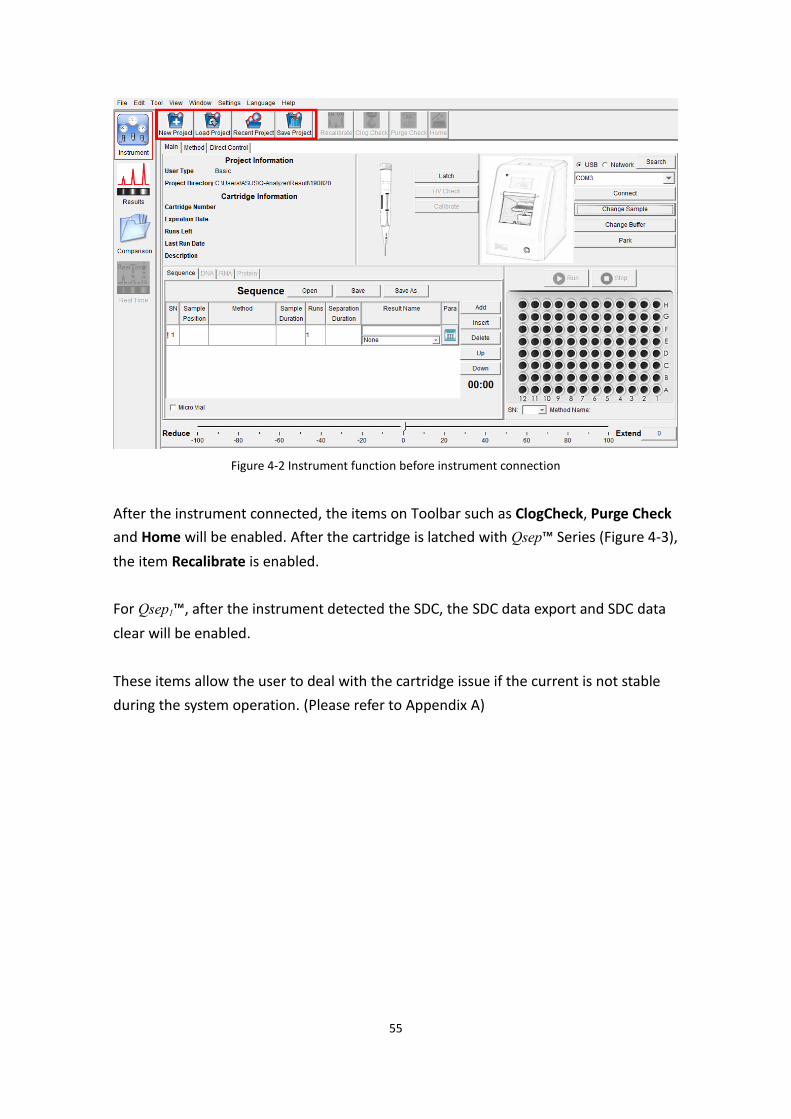
After the instrument connected, the items on Toolbar such as alogaheck, Purge aheck
and Home will be enabled. After the cartridge is latched with Qsep™ Series (Figure 4-3),
the item Recalibrate is enabled.
For Qsep1™, after the instrument detected the SDC, the SDC data export and SDC data
clear will be enabled.
These items allow the user to deal with the cartridge issue if the current is not stable
during the system operation. (Please refer to Appendix A)
56
57
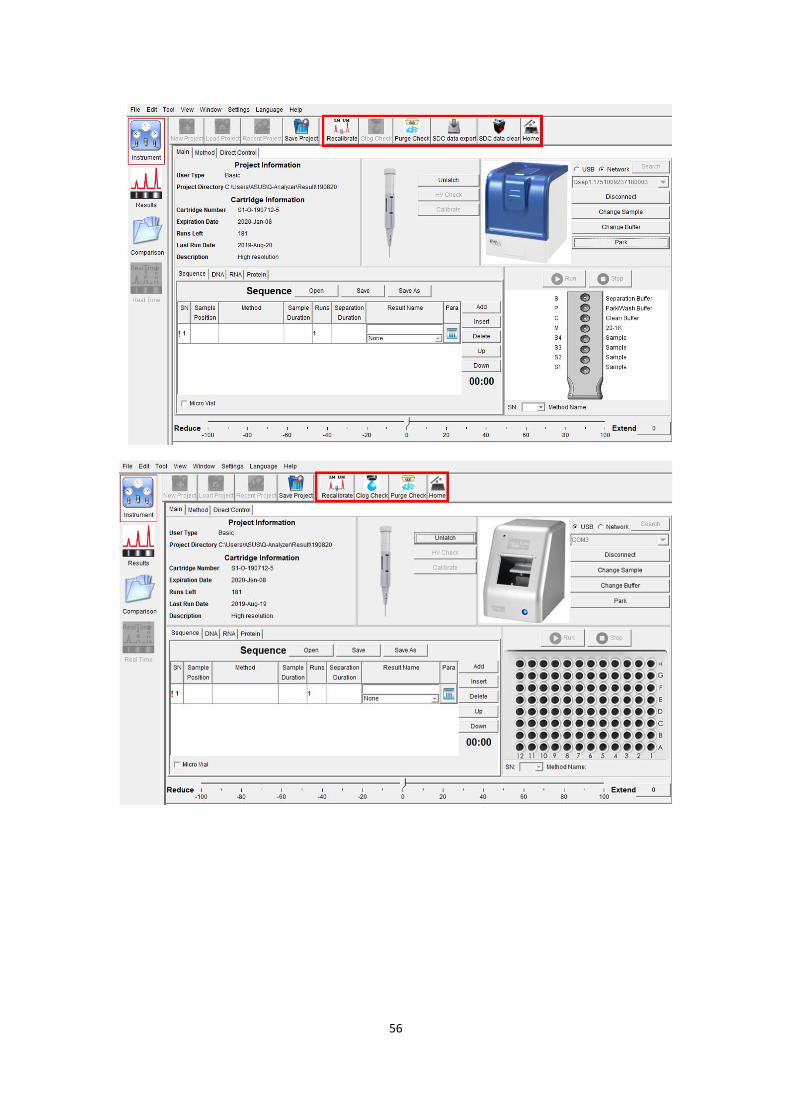
Figure 4-3 Instrument function after latching a cartridge
Recalibrate:
Recalibration can help the identification of the alignment marker. (See Section 3.5)
alogaheck:
aapillary alog aheck will lower the tray and then put the pressure into the
cartridge. If there is water drop formed at the cartridge tip, the cartridge is not
clogged. (See Section 3.6)
Purge aheck:
Purge aheck will purge while the cartridge door is opened. User can ensure that
the air is coming out while purging. (See Section 3.7)
Home:
Home will make the tray holder move to the initial place. For Qsep1™, this function
can be used to close the door when sample tray is taken out. For Qsep400™, this
function can help you to lock the fixing screws before moving the machine.
Slide bar (Reduce and Extend)
The remaining time of the proceeding action can be extended or shortened by
dragging the slider at the bottom of the window. For instance, the software is going
to running out the time of Separation & Detection, but the result is not completed
yet; you can extend the remaining time by dragging the slide bar to the right (e.g.

58
50). The amount of the adjustment time will be shown on the button. Simply click
the button to confirm the changes. Then the action of Separation & Detection will
be 50 seconds extended immediately once the value reaches 0.
*Note: Only the remaining time of the action which is in progress can be extended
or shortened.
59
4.2.2 Results
To display or analyze data from Qsep™ Series, we provide the Results function. With
the Results function, you can demonstrate the chart or edit the bp value from raw data
of capillary electrophoresis.
After the files are loaded in Q-Analyzer™, the items on Toolbar such as aalculate,
Smear, Peak aalling, Parameters, Show Size/Legend, Show Size/Min, Invert GelView,
Show Best/Ori. View, and ahange Line Thickness are enabled. The items allow user to
deal with the data. For more details about editing the raw data, please refer to Section
5.1.
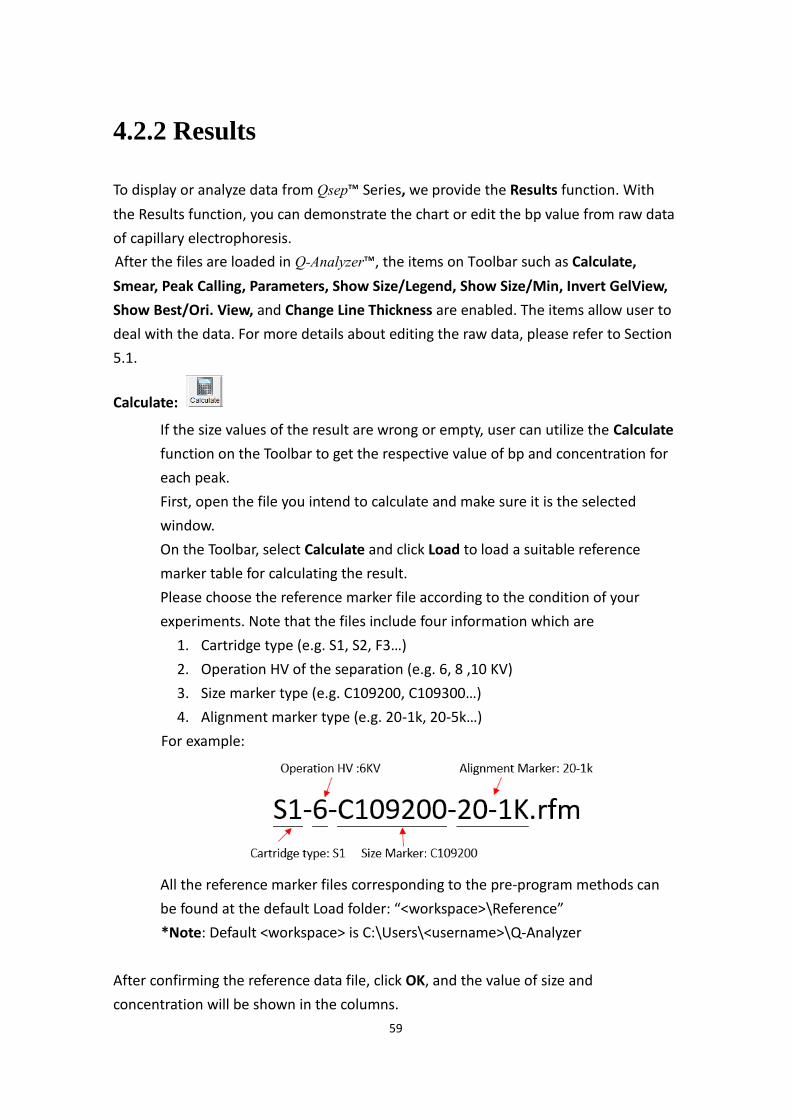
aalculate:
If the size values of the result are wrong or empty, user can utilize the aalculate
function on the Toolbar to get the respective value of bp and concentration for
each peak.
First, open the file you intend to calculate and make sure it is the selected
window.
On the Toolbar, select aalculate and click Load to load a suitable reference
marker table for calculating the result.
Please choose the reference marker file according to the condition of your
experiments. Note that the files include four information which are
1. Cartridge type (e.g. S1, S2, F3…)
2. Operation HV of the separation (e.g. 6, 8 ,10 KV)
3. Size marker type (e.g. C109200, C109300…)
4. Alignment marker type (e.g. 20-1k, 20-5k…)
For example:
All the reference marker files corresponding to the pre-program methods can
be found at the default Load folder: “<workspace>\Reference”
*Note: Default <workspace> is C:\Users\<username>\Q-Analyzer
After confirming the reference data file, click OK, and the value of size and
concentration will be shown in the columns.
60
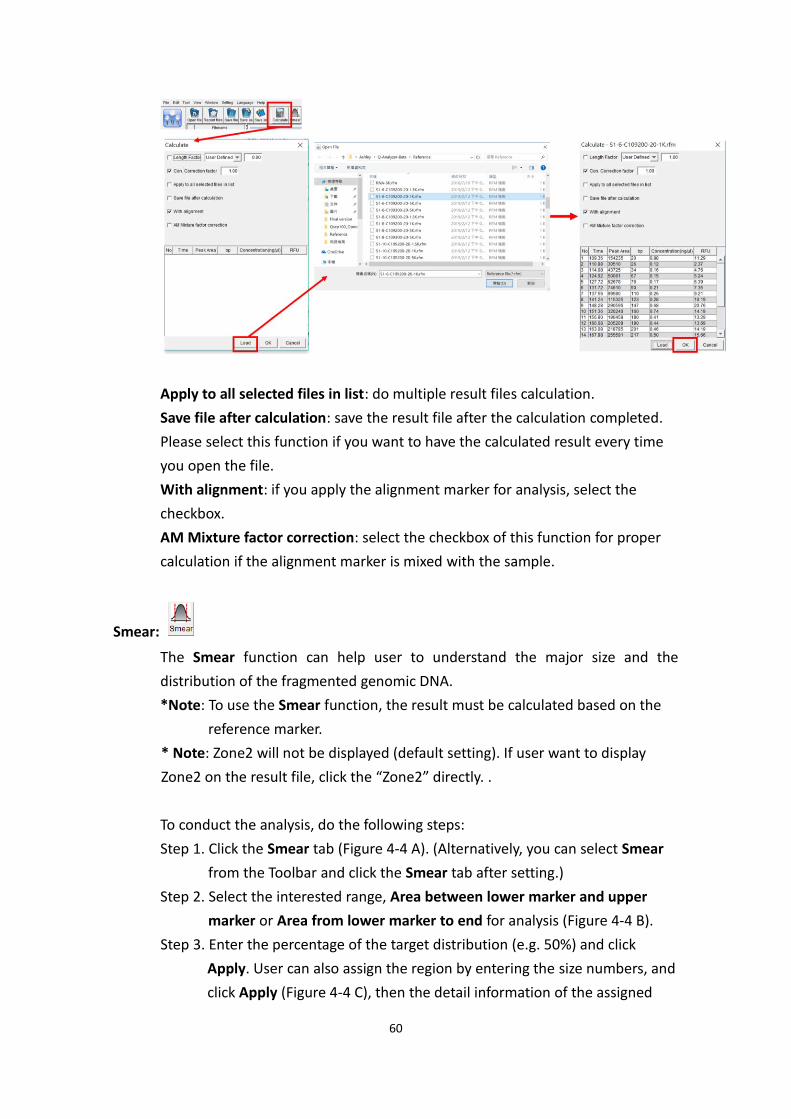
Apply to all selected files in list: do multiple result files calculation.
Save file after calculation: save the result file after the calculation completed.
Please select this function if you want to have the calculated result every time
you open the file.
With alignment: if you apply the alignment marker for analysis, select the
checkbox.
AM Mixture factor correction: select the checkbox of this function for proper
calculation if the alignment marker is mixed with the sample.
Smear:
The Smear function can help user to understand the major size and the
distribution of the fragmented genomic DNA.
*Note: To use the Smear function, the result must be calculated based on the
reference marker.
* Note: Zone2 will not be displayed (default setting). If user want to display
Zone2 on the result file, click the “Zone2” directly. .
To conduct the analysis, do the following steps:
Step 1. Click the Smear tab (Figure 4-4 A). (Alternatively, you can select Smear
from the Toolbar and click the Smear tab after setting.)
Step 2. Select the interested range, Area between lower marker and upper
marker or Area from lower marker to end for analysis (Figure 4-4 B).
Step 3. Enter the percentage of the target distribution (e.g. 50%) and click
Apply. User can also assign the region by entering the size numbers, and
click Apply (Figure 4-4 C), then the detail information of the assigned
61
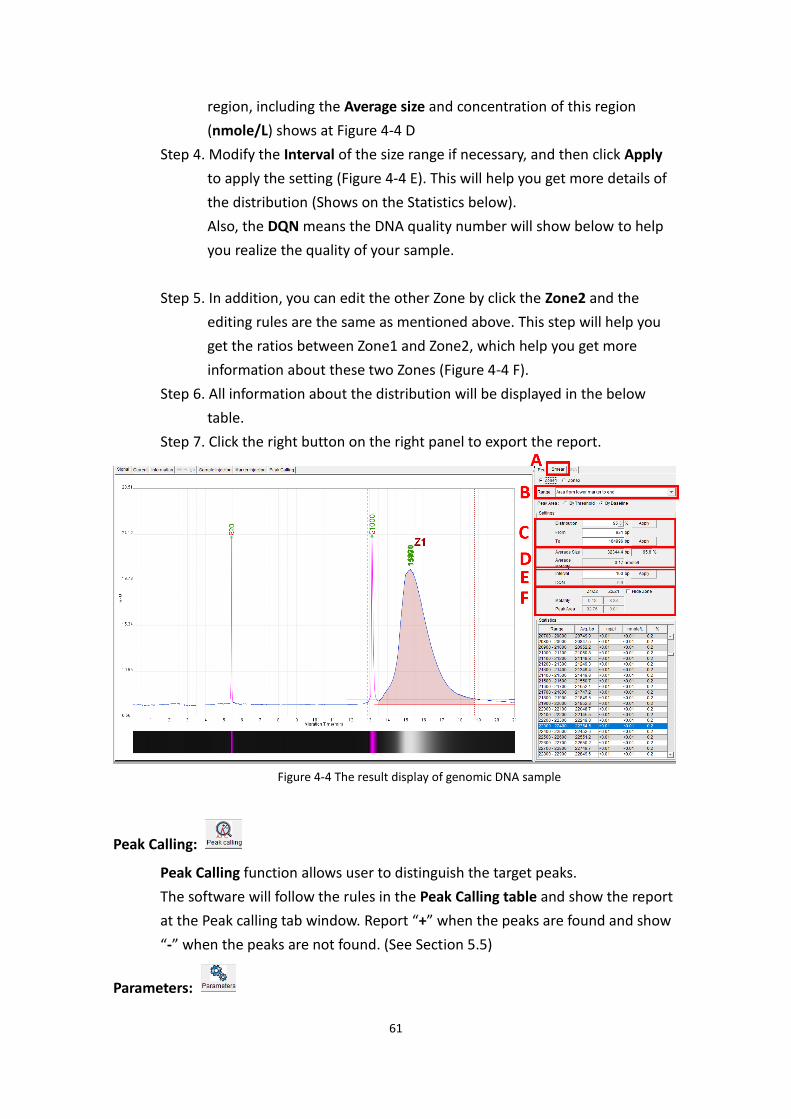
region, including the Average size and concentration of this region
(nmole/L) shows at Figure 4-4 D
Step 4. Modify the Interval of the size range if necessary, and then click Apply
to apply the setting (Figure 4-4 E). This will help you get more details of
the distribution (Shows on the Statistics below).
Also, the DQN means the DNA quality number will show below to help
you realize the quality of your sample.
Step 5. In addition, you can edit the other Zone by click the Zone2 and the
editing rules are the same as mentioned above. This step will help you
get the ratios between Zone1 and Zone2, which help you get more
information about these two Zones (Figure 4-4 F).
Step 6. All information about the distribution will be displayed in the below
table.
Step 7. Click the right button on the right panel to export the report.
Figure 4-4 The result display of genomic DNA sample
Peak aalling:
Peak aalling function allows user to distinguish the target peaks.
The software will follow the rules in the Peak aalling table and show the report
at the Peak calling tab window. Report “+” when the peaks are found and show
“-” when the peaks are not found. (See Section 5.5)
Parameters:
62
The system will generate the corresponding baseline and define the peaks
automatically. If you are not satisfied with the results, you can modify them with
Parameter functions. Make sure the selected result file window is the one you want to
modify. Multiple files can be selected by clicking their checkboxes before using the
Parameter function. (See Parameter setting in Section 4.3.2)
Show Size/Legend:
Switch the index of the peak to display the bp value or legend in the chart.
To display the bp value, the result data must be calculated. To display legend,
the Peak aalling function data must be applied.
Show Size/Min:
Switch the x-axis between size (bp) and time (minute).
To display the size, the result data must be calculated based on reference
marker.
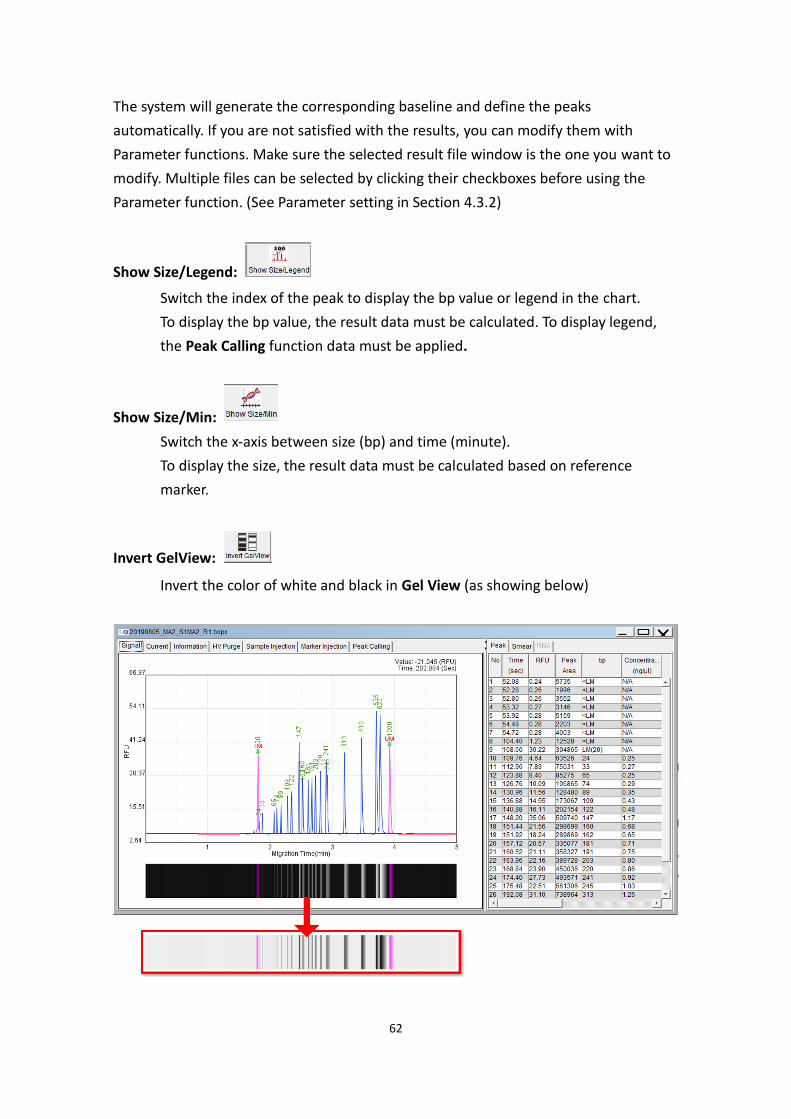
Invert GelView:
Invert the color of white and black in Gel View (as showing below)
63
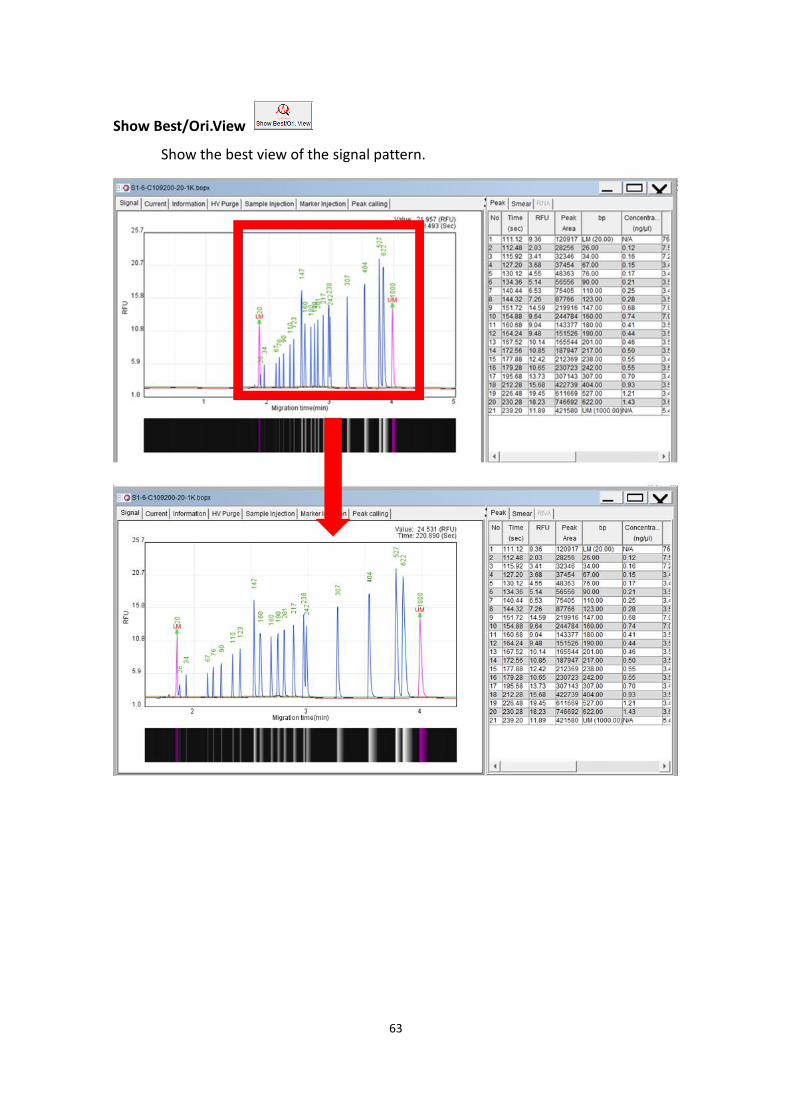
Show Best/Ori.View
Show the best view of the signal pattern.
64
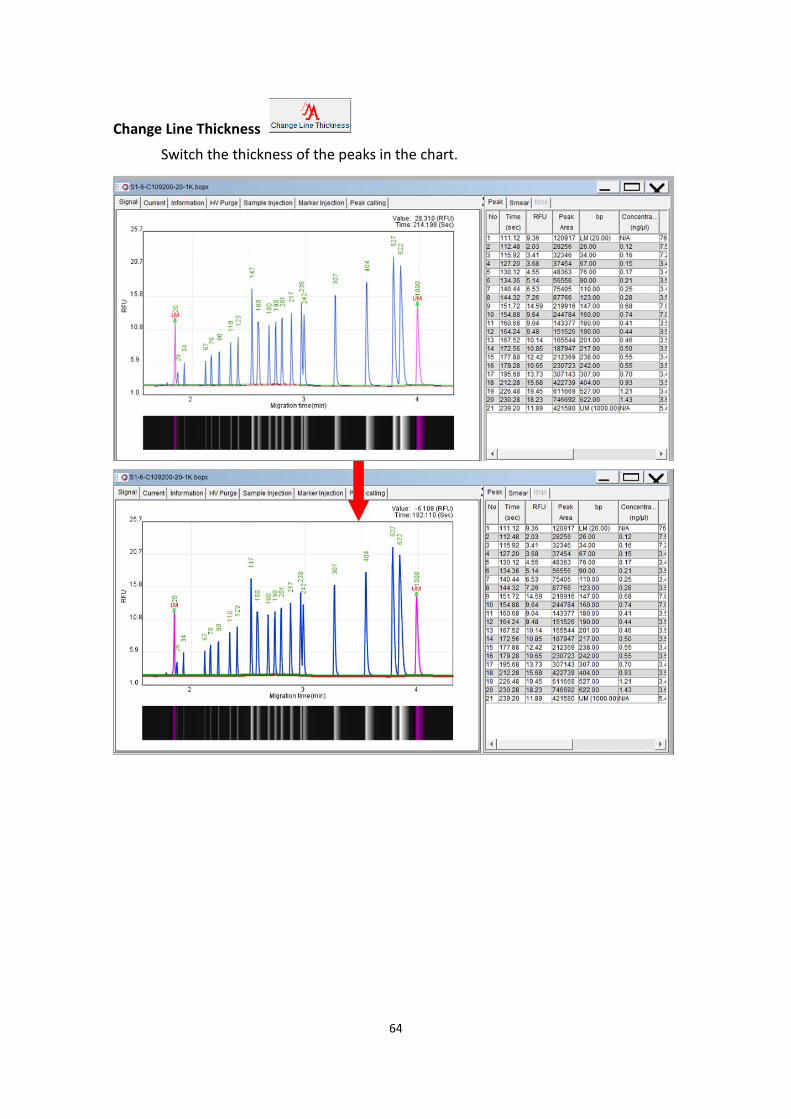
ahange Line Thickness
Switch the thickness of the peaks in the chart.
65
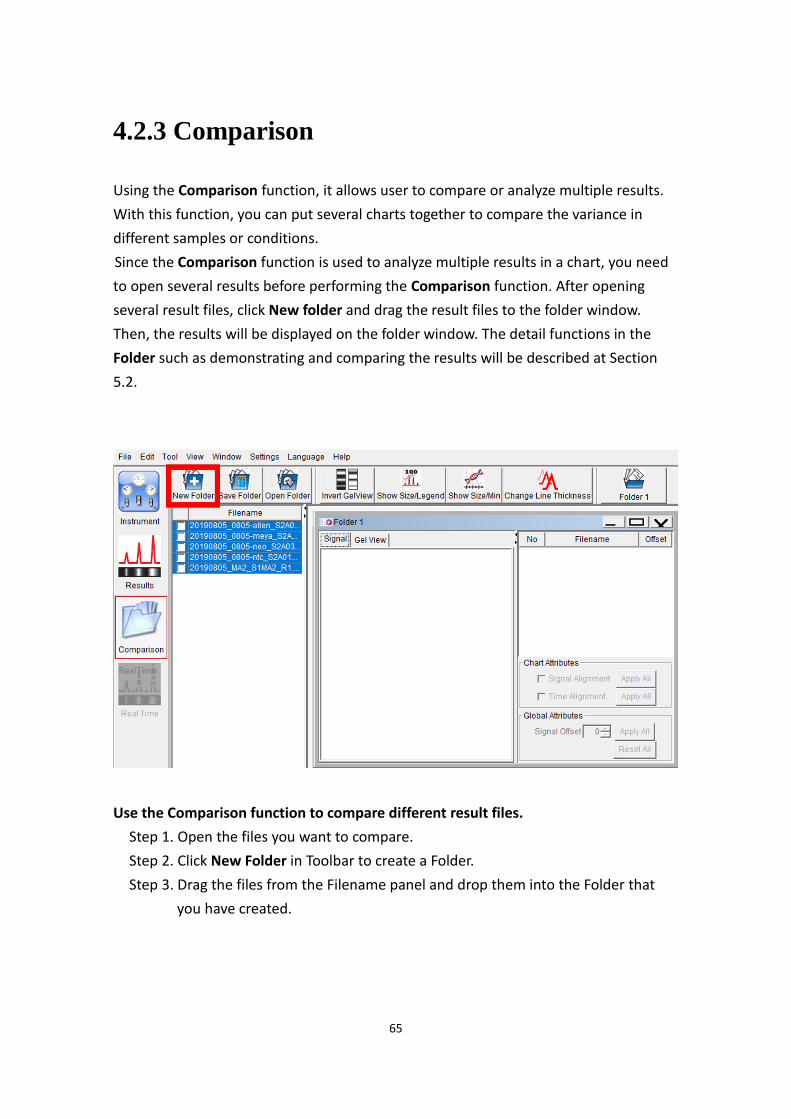
4.2.3 Comparison
Using the aomparison function, it allows user to compare or analyze multiple results.
With this function, you can put several charts together to compare the variance in
different samples or conditions.
Since the aomparison function is used to analyze multiple results in a chart, you need
to open several results before performing the aomparison function. After opening
several result files, click New folder and drag the result files to the folder window.
Then, the results will be displayed on the folder window. The detail functions in the
Folder such as demonstrating and comparing the results will be described at Section
5.2.
Use the aomparison function to compare different result files.
Step 1. Open the files you want to compare.
Step 2. Click New Folder in Toolbar to create a Folder.
Step 3. Drag the files from the Filename panel and drop them into the Folder that
you have created.
66
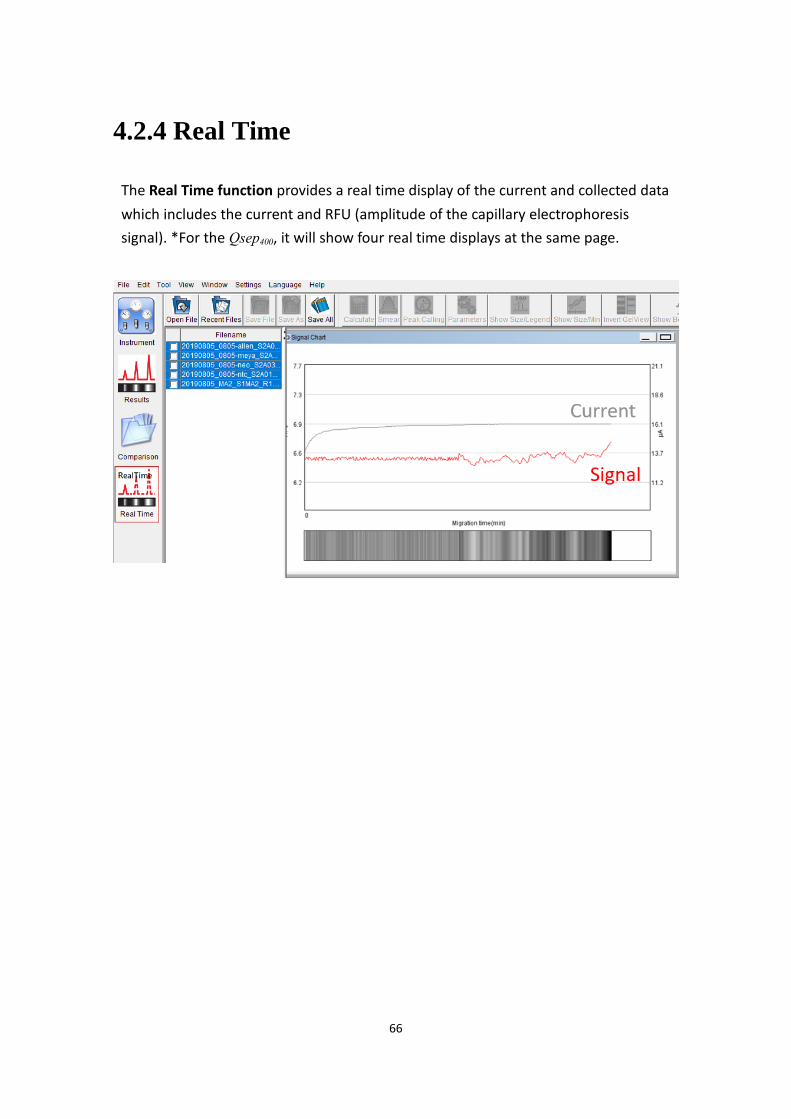
4.2.4 Real Time
The Real Time function provides a real time display of the current and collected data
which includes the current and RFU (amplitude of the capillary electrophoresis
signal). *For the Qsep400, it will show four real time displays at the same page.
67
4.3 Menu
4.3.1 File
File functions are:
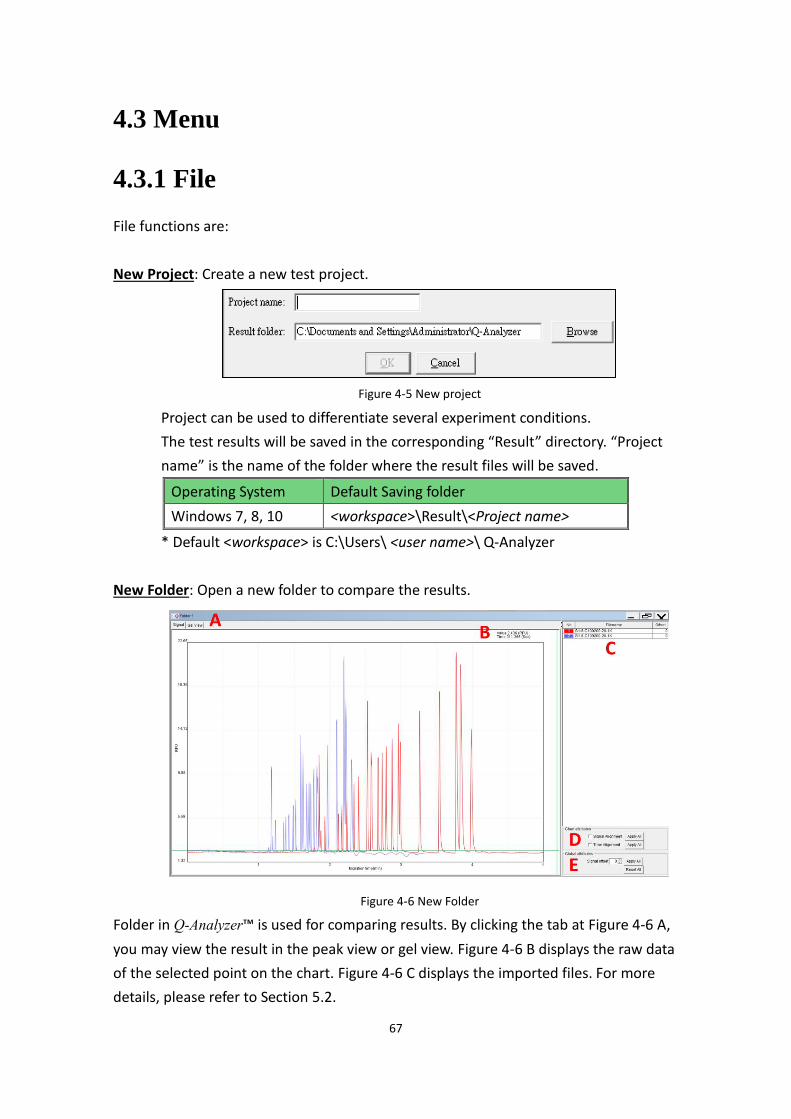
New Project: Create a new test project.
Figure 4-5 New project
Project can be used to differentiate several experiment conditions.
The test results will be saved in the corresponding “Result” directory. “Project
name” is the name of the folder where the result files will be saved.
Operating System Default Saving folder
Windows 7, 8, 10 <workspace>\Result\<Project name>
* Default <workspace> is C:\Users\ <user name>\ Q-Analyzer
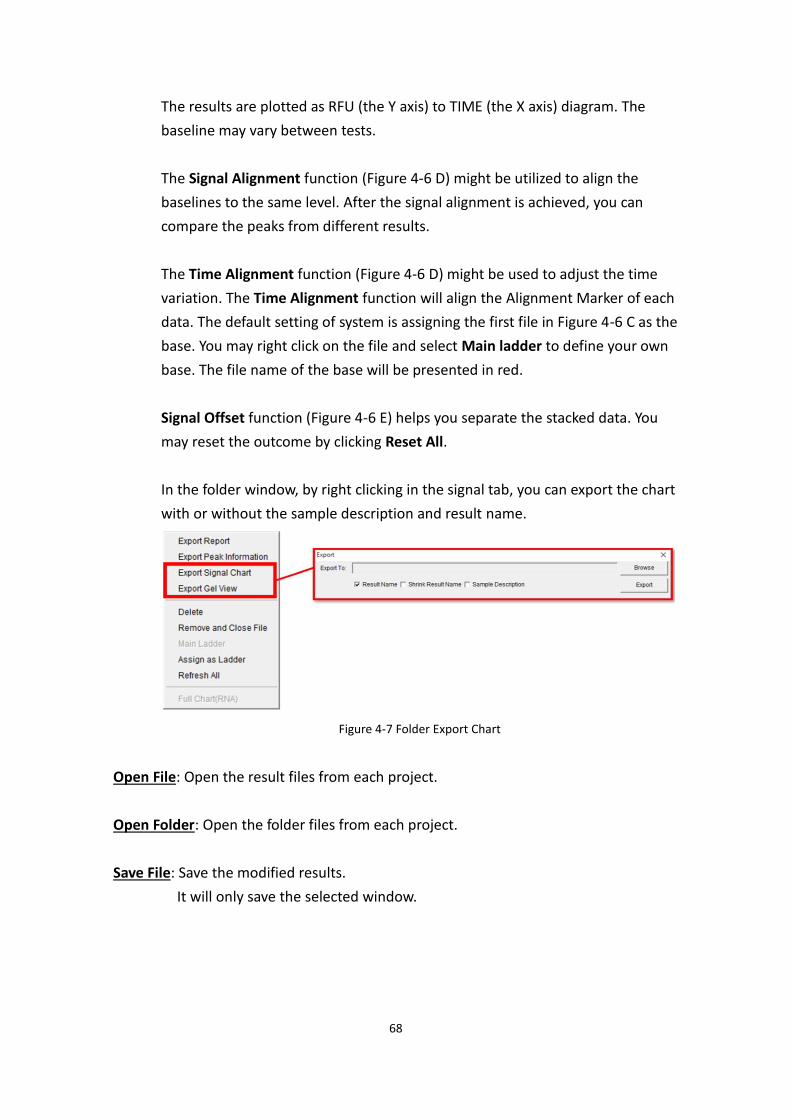
New Folder: Open a new folder to compare the results.
Figure 4-6 New Folder
Folder in Q-Analyzer™ is used for comparing results. By clicking the tab at Figure 4-6 A,
you may view the result in the peak view or gel view. Figure 4-6 B displays the raw data
of the selected point on the chart. Figure 4-6 C displays the imported files. For more
details, please refer to Section 5.2.
68
The results are plotted as RFU (the Y axis) to TIME (the X axis) diagram. The
baseline may vary between tests.
The Signal Alignment function (Figure 4-6 D) might be utilized to align the
baselines to the same level. After the signal alignment is achieved, you can
compare the peaks from different results.
The Time Alignment function (Figure 4-6 D) might be used to adjust the time
variation. The Time Alignment function will align the Alignment Marker of each
data. The default setting of system is assigning the first file in Figure 4-6 C as the
base. You may right click on the file and select Main ladder to define your own
base. The file name of the base will be presented in red.
Signal Offset function (Figure 4-6 E) helps you separate the stacked data. You
may reset the outcome by clicking Reset All.
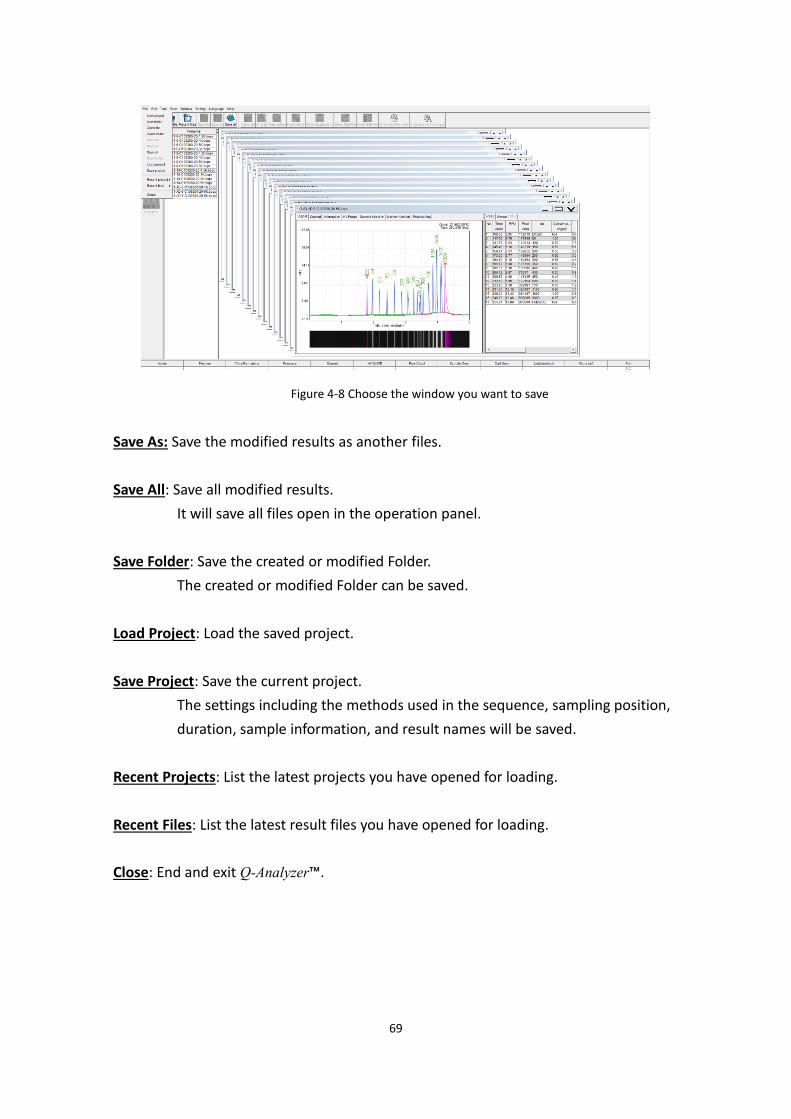
In the folder window, by right clicking in the signal tab, you can export the chart
with or without the sample description and result name.
Figure 4-7 Folder Export Chart
Open File: Open the result files from each project.
Open Folder: Open the folder files from each project.
Save File: Save the modified results.
It will only save the selected window.
69
Figure 4-8 Choose the window you want to save
Save As: Save the modified results as another files.
Save All: Save all modified results.
It will save all files open in the operation panel.
Save Folder: Save the created or modified Folder.
The created or modified Folder can be saved.
Load Project: Load the saved project.
Save Project: Save the current project.
The settings including the methods used in the sequence, sampling position,
duration, sample information, and result names will be saved.
Recent Projects: List the latest projects you have opened for loading.
Recent Files: List the latest result files you have opened for loading.
alose: End and exit Q-Analyzer™.
70
4.3.2 Edit
Edit functions are:
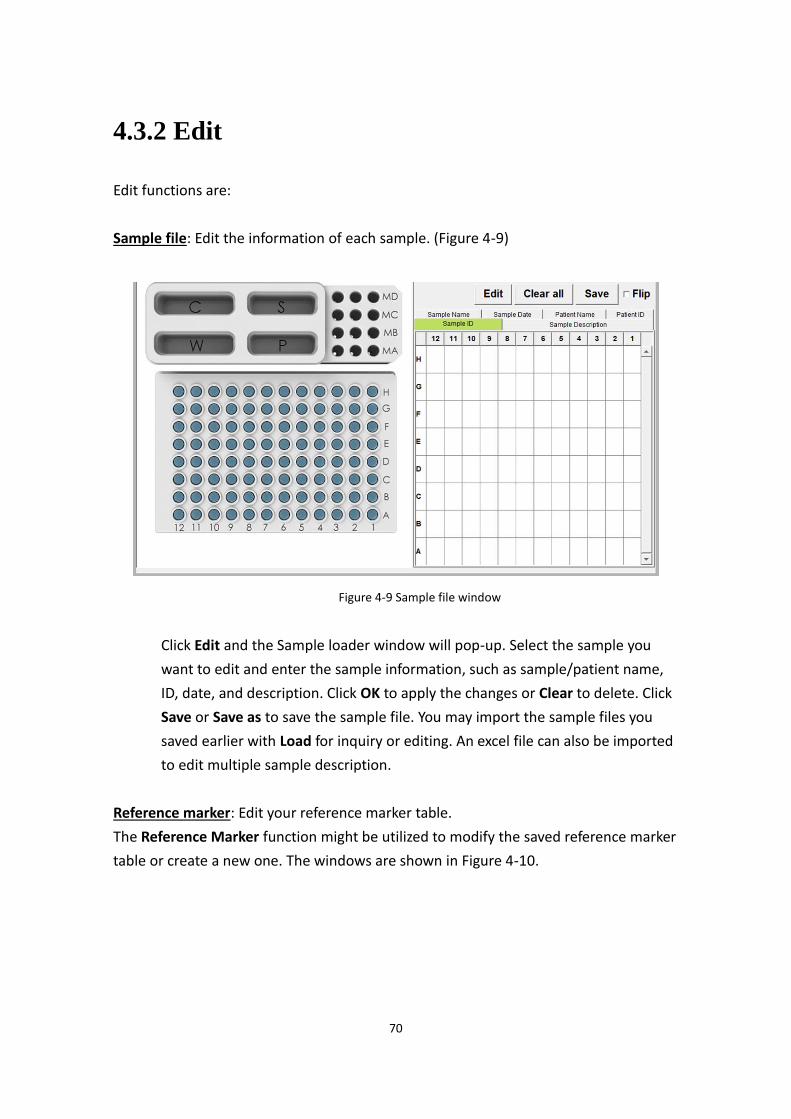
Sample file: Edit the information of each sample. (Figure 4-9)
Figure 4-9 Sample file window
Click Edit and the Sample loader window will pop-up. Select the sample you
want to edit and enter the sample information, such as sample/patient name,
ID, date, and description. Click OK to apply the changes or alear to delete. Click
Save or Save as to save the sample file. You may import the sample files you
saved earlier with Load for inquiry or editing. An excel file can also be imported
to edit multiple sample description.
Reference marker: Edit your reference marker table.
The Reference Marker function might be utilized to modify the saved reference marker
table or create a new one. The windows are shown in Figure 4-10.
71
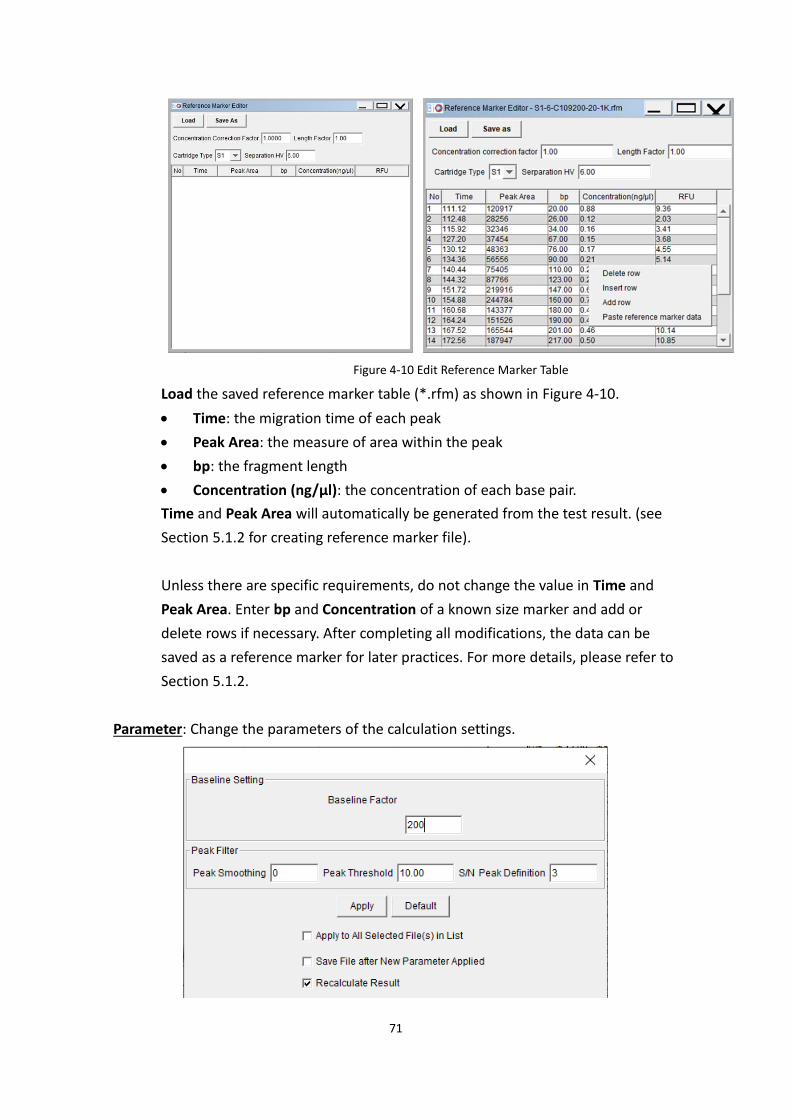
Figure 4-10 Edit Reference Marker Table
Load the saved reference marker table (*.rfm) as shown in Figure 4-10.
• Time: the migration time of each peak
• Peak Area: the measure of area within the peak
• bp: the fragment length
• aoncentration (ng/µl): the concentration of each base pair.
Time and Peak Area will automatically be generated from the test result. (see
Section 5.1.2 for creating reference marker file).
Unless there are specific requirements, do not change the value in Time and
Peak Area. Enter bp and aoncentration of a known size marker and add or
delete rows if necessary. After completing all modifications, the data can be
saved as a reference marker for later practices. For more details, please refer to
Section 5.1.2.
Parameter: Change the parameters of the calculation settings.

72
Figure 4-11 Parameter settings
The system will generate the corresponding baseline and define the peaks
automatically. If you are not satisfied with the results, the results can be
modified by the Parameter function. Make sure the selected result file window
is the one you want to modify.
You may also select multiple files by selecting their checkboxes before you use
the Parameter function.
Baseline Factor affects the smoothness of baseline. The default Baseline Factor
value is based on the chosen method. The bigger the value is, the smoother the
baseline will be, and vice versa.
Peak Smoothing affects the smoothness of peak. The bigger the Peak
Smoothing value is, the smoother the result will be. This function might be
utilized to reduce the number of peaks.
Peak Threshold changes criteria of defining the peak. The bigger the Peak
Threshold value is, the stronger the signal is requested to be recognized as a
peak. The peaks with low signal strength can be recognized by lowering the
Peak Threshold value. Meanwhile, the noise may be recognized as signal peaks
as well.
S/N Peak definition changes criteria of defining the peak. The bigger the Peak
definition value is, the more data points of the ramping signal are required to
be recognized as a peak. You may lower the Peak definition value to define
peaks with less points of the ramping signal. Meanwhile, the noise may be
recognized as signal peaks as well.
Apply to all selected files in list will change the parameter of the file you
selected in the list. Make sure to select this function if you want to do a
multiple result file modification.
Save file after new parameter applied will help you to save file automatically
after applying parameter.
Recalculate result will help you to recalculate result and show the peak bp
automatically after applying parameter.
73
*Note: Click Default button to retrieve the original settings.
Peak aalling Table:
Peak Calling helps user to create the panels for quick scanning. To use peak
calling, user needs to set up the Peak Calling Table which including the target
peak information. You can customize your own peak calling table by adding a
new row and assigning the Target, upper margin, lower margin, S/N, RFU,
Legend and IC (Internal Control).
For more details, please refer to Section 5.5.
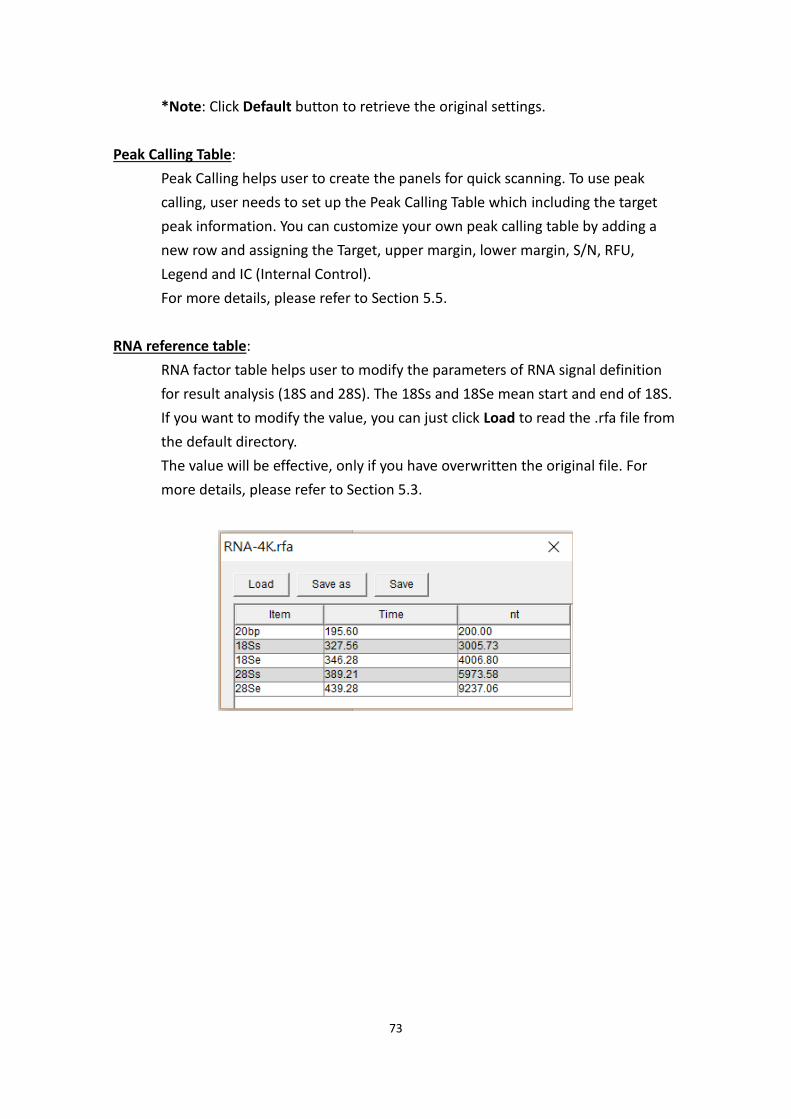
RNA reference table:
RNA factor table helps user to modify the parameters of RNA signal definition
for result analysis (18S and 28S). The 18Ss and 18Se mean start and end of 18S.
If you want to modify the value, you can just click Load to read the .rfa file from
the default directory.
The value will be effective, only if you have overwritten the original file. For
more details, please refer to Section 5.3.
74
4.3.3 Tool
Tool functions are:
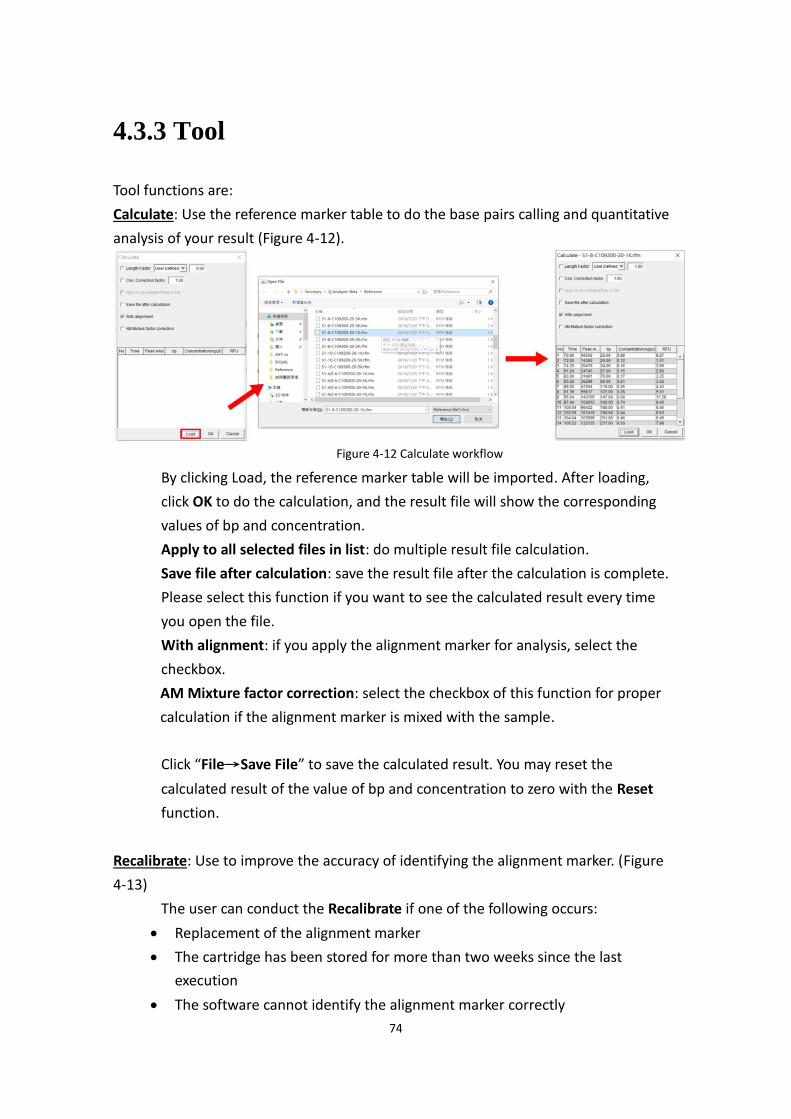
aalculate: Use the reference marker table to do the base pairs calling and quantitative
analysis of your result (Figure 4-12).
Figure 4-12 Calculate workflow
By clicking Load, the reference marker table will be imported. After loading,
click OK to do the calculation, and the result file will show the corresponding
values of bp and concentration.
Apply to all selected files in list: do multiple result file calculation.
Save file after calculation: save the result file after the calculation is complete.
Please select this function if you want to see the calculated result every time
you open the file.
With alignment: if you apply the alignment marker for analysis, select the
checkbox.
AM Mixture factor correction: select the checkbox of this function for proper
calculation if the alignment marker is mixed with the sample.
Click “File→Save File” to save the calculated result. You may reset the
calculated result of the value of bp and concentration to zero with the Reset
function.
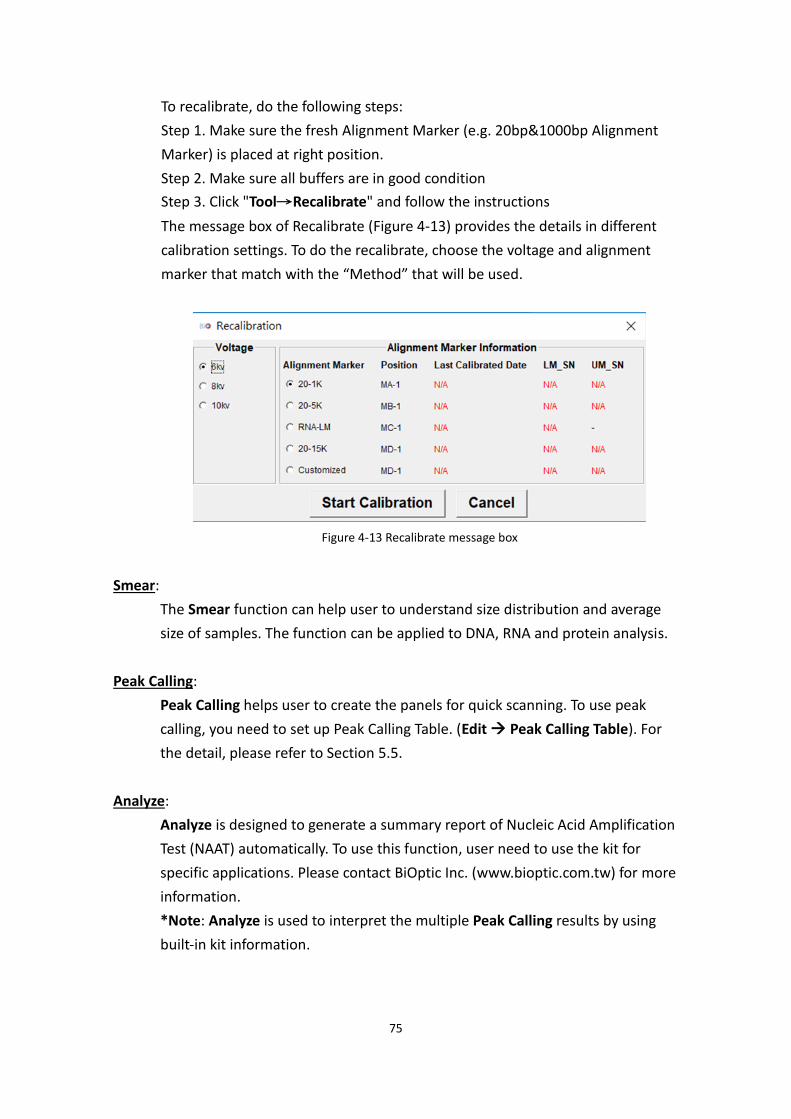
Recalibrate: Use to improve the accuracy of identifying the alignment marker. (Figure
4-13)
The user can conduct the Recalibrate if one of the following occurs:
• Replacement of the alignment marker
• The cartridge has been stored for more than two weeks since the last
execution
• The software cannot identify the alignment marker correctly
75
To recalibrate, do the following steps:
Step 1. Make sure the fresh Alignment Marker (e.g. 20bp&1000bp Alignment
Marker) is placed at right position.
Step 2. Make sure all buffers are in good condition
Step 3. Click "Tool→Recalibrate" and follow the instructions
The message box of Recalibrate (Figure 4-13) provides the details in different
calibration settings. To do the recalibrate, choose the voltage and alignment
marker that match with the “Method” that will be used.
Figure 4-13 Recalibrate message box
Smear:
The Smear function can help user to understand size distribution and average
size of samples. The function can be applied to DNA, RNA and protein analysis.
Peak aalling:
Peak aalling helps user to create the panels for quick scanning. To use peak
calling, you need to set up Peak Calling Table. (Edit → Peak aalling Table). For
the detail, please refer to Section 5.5.
Analyze:
Analyze is designed to generate a summary report of Nucleic Acid Amplification
Test (NAAT) automatically. To use this function, user need to use the kit for
specific applications. Please contact BiOptic Inc. (www.bioptic.com.tw) for more
information.
*Note: Analyze is used to interpret the multiple Peak aalling results by using
built-in kit information.
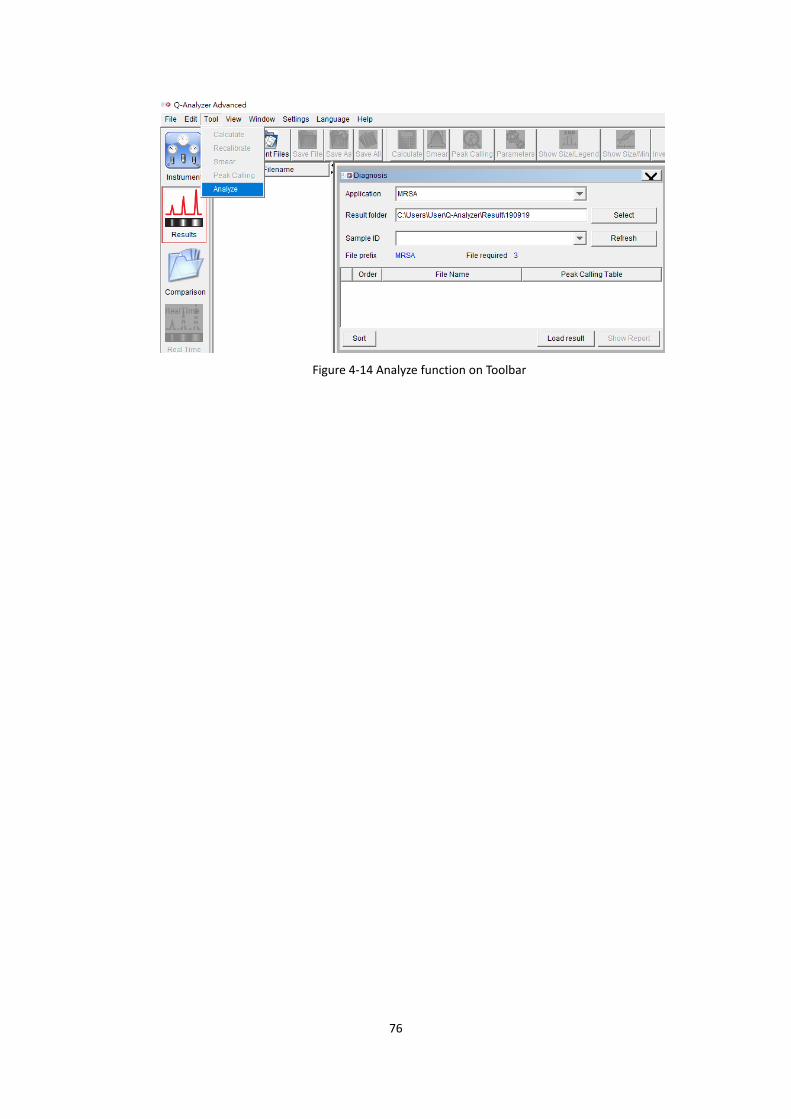
76
Figure 4-14 Analyze function on Toolbar
77
4.3.4 View
View functions are:
ahart setting: Change the settings of the electropherogram.
ahart setting functions is used to set the color of line, Size/Legend, grid,
background, data display, and whether to show the peak indicator.
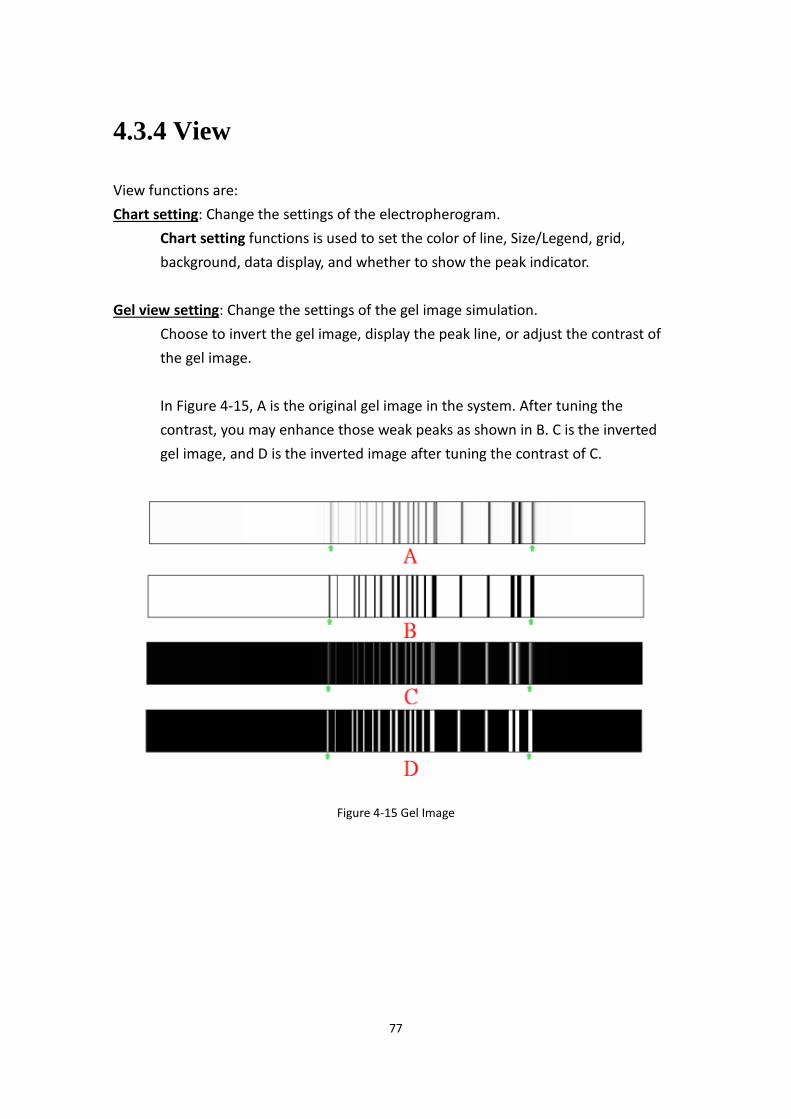
Gel view setting: Change the settings of the gel image simulation.
Choose to invert the gel image, display the peak line, or adjust the contrast of
the gel image.
In Figure 4-15, A is the original gel image in the system. After tuning the
contrast, you may enhance those weak peaks as shown in B. C is the inverted
gel image, and D is the inverted image after tuning the contrast of C.
Figure 4-15 Gel Image
78
4.3.5 Window
Window functions are:
aascade: Arrange the opened windows in the array format.
alose All: Close all opened windows.
All opened files will be listed below the Window.
4.3.6 Setting
Setting functions are:
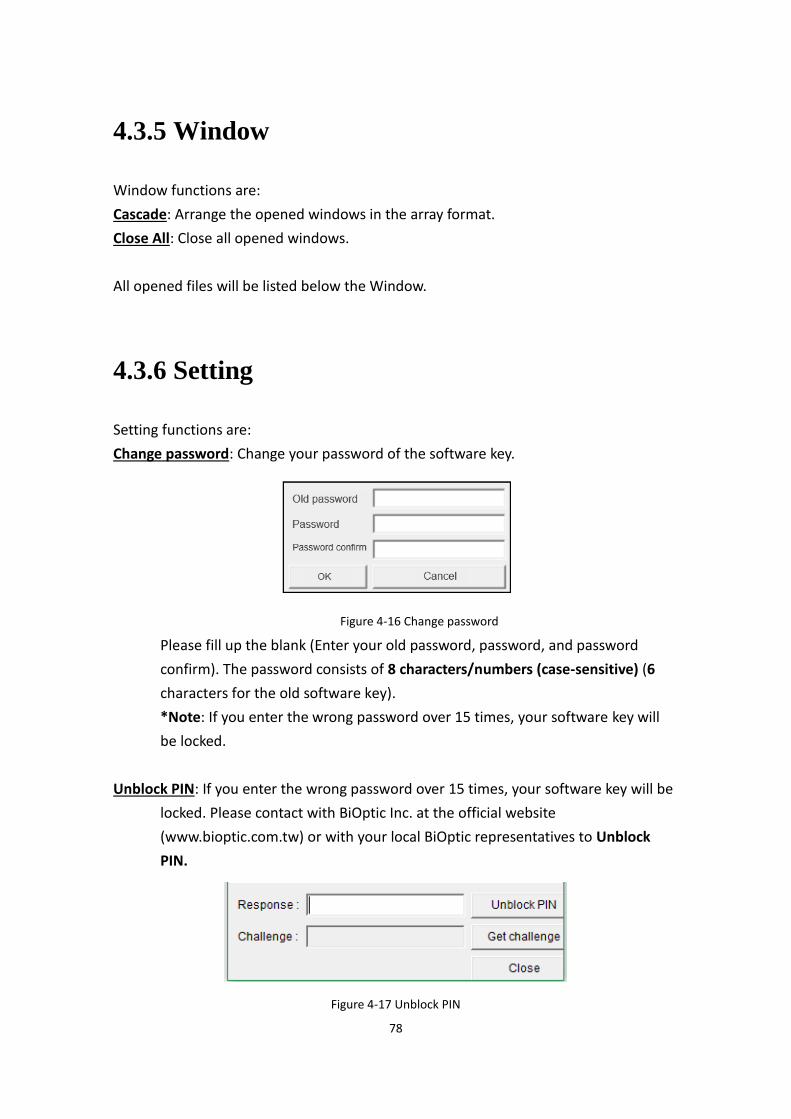
ahange password: Change your password of the software key.
Figure 4-16 Change password
Please fill up the blank (Enter your old password, password, and password
confirm). The password consists of 8 characters/numbers (case-sensitive) (6
characters for the old software key).
*Note: If you enter the wrong password over 15 times, your software key will
be locked.
Unblock PIN: If you enter the wrong password over 15 times, your software key will be
locked. Please contact with BiOptic Inc. at the official website
(www.bioptic.com.tw) or with your local BiOptic representatives to Unblock
PIN.
Figure 4-17 Unblock PIN
79
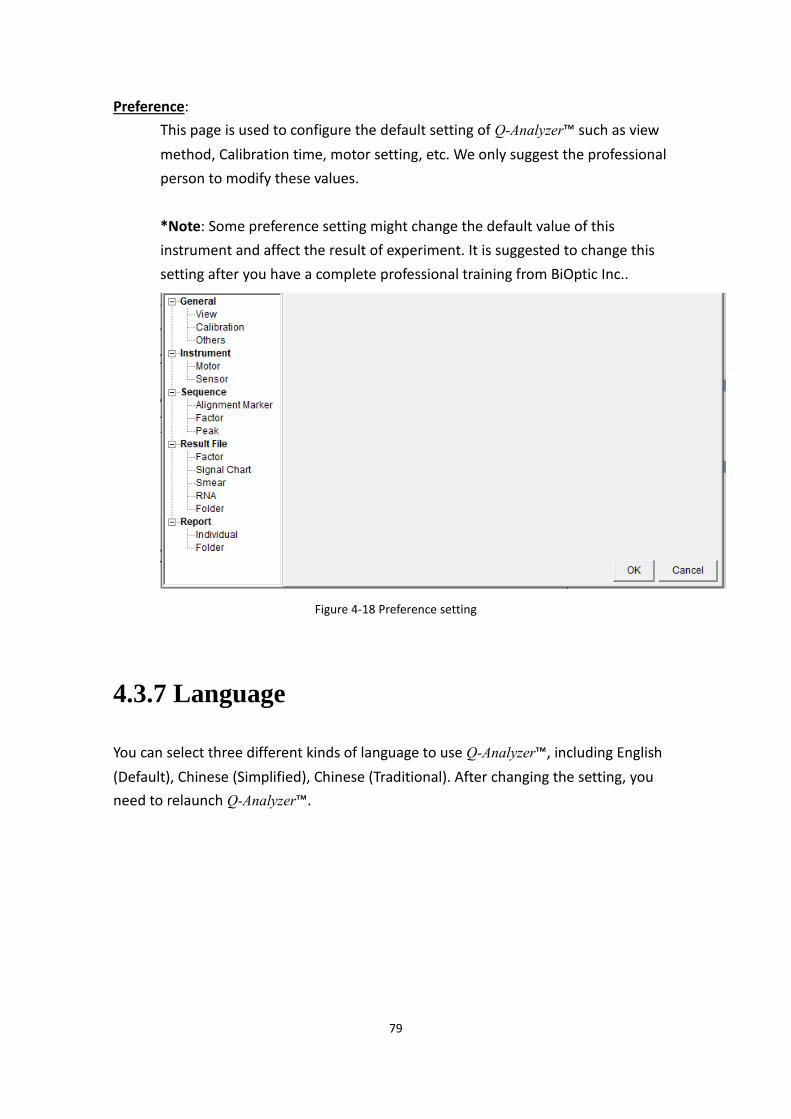
Preference:
This page is used to configure the default setting of Q-Analyzer™ such as view
method, Calibration time, motor setting, etc. We only suggest the professional
person to modify these values.
*Note: Some preference setting might change the default value of this
instrument and affect the result of experiment. It is suggested to change this
setting after you have a complete professional training from BiOptic Inc..
Figure 4-18 Preference setting
4.3.7 Language
You can select three different kinds of language to use Q-Analyzer™, including English
(Default), Chinese (Simplified), Chinese (Traditional). After changing the setting, you
need to relaunch Q-Analyzer™.
80
4.3.8 Help
Help functions are:
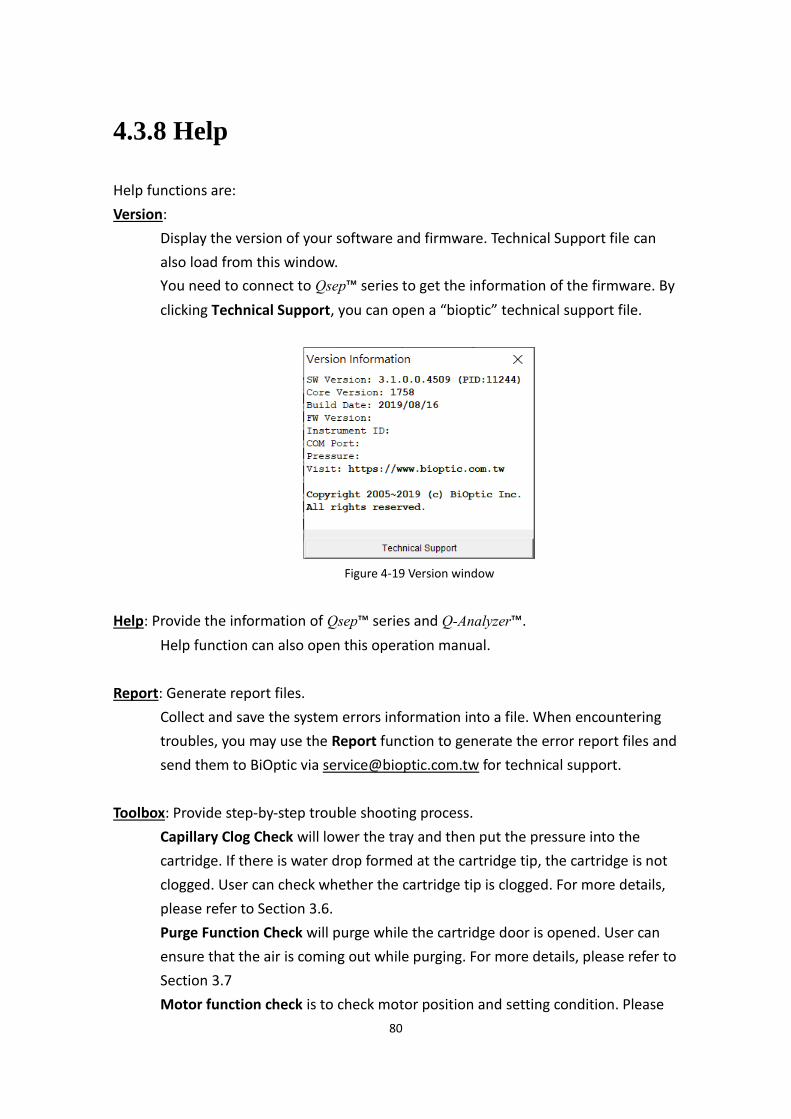
Version:
Display the version of your software and firmware. Technical Support file can
also load from this window.
You need to connect to Qsep™ series to get the information of the firmware. By
clicking Technical Support, you can open a “bioptic” technical support file.
Figure 4-19 Version window
Help: Provide the information of Qsep™ series and Q-Analyzer™.
Help function can also open this operation manual.
Report: Generate report files.
Collect and save the system errors information into a file. When encountering
troubles, you may use the Report function to generate the error report files and
send them to BiOptic via [email protected] for technical support.
Toolbox: Provide step-by-step trouble shooting process.
aapillary alog aheck will lower the tray and then put the pressure into the
cartridge. If there is water drop formed at the cartridge tip, the cartridge is not
clogged. User can check whether the cartridge tip is clogged. For more details,
please refer to Section 3.6.
Purge Function aheck will purge while the cartridge door is opened. User can
ensure that the air is coming out while purging. For more details, please refer to
Section 3.7
Motor function check is to check motor position and setting condition. Please

81
follow the instructions accordingly. The software will remind user to open the
sample door and the cartridge door, and then take out the cartridge from
instrument. After clicking start, the motors will do all kinds of actions to move
the tray holder, and user can observe motor status during each step.
aomputer compatibility check is to check the software setting environments,
including the hardware and software requirements. For more details, please
refer to Section 1.3.
82
4.4 Control Panel
When you launch Q-Analyzer™, it will open the Control Panel automatically. There are
four major functions in the Control Panel, which are Main, Method, Direct Control,
and Board Setting (shown in Figure 4-20 F). Different level of access to those functions
will be given to the user based on which software key the user has. With Basic
software key, the user has access to Main, Method, and Direct Control tabs. Only the
user with Advanced software key has access to Board Setting tab.
The functions of those tabs are listed as follows:
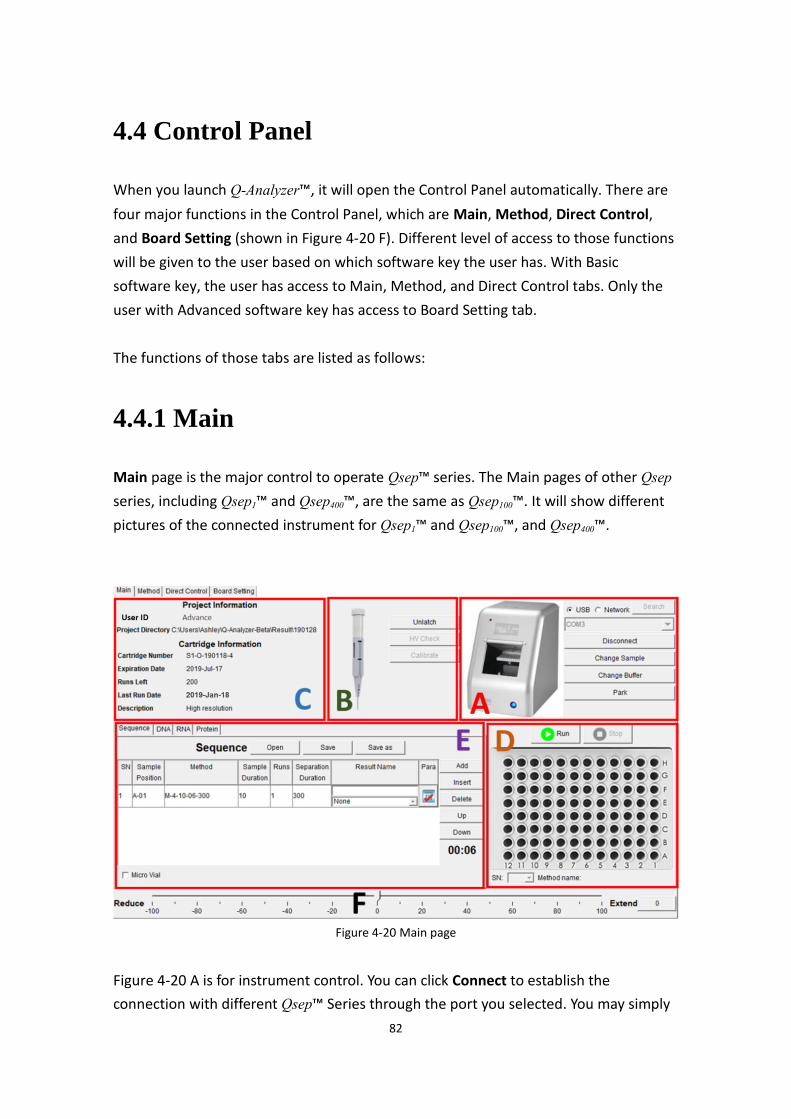
4.4.1 Main
Main page is the major control to operate Qsep™ series. The Main pages of other Qsep
series, including Qsep1™ and Qsep400™, are the same as Qsep100™. It will show different
pictures of the connected instrument for Qsep1™ and Qsep100™, and Qsep400™.
Figure 4-20 Main page
Figure 4-20 A is for instrument control. You can click aonnect to establish the
connection with different Qsep™ Series through the port you selected. You may simply

83
choose Auto to let the system to search the port automatically.
After Qsep™ Series is successfully connected, the picture of Qsep™ Series on the Main
Page will turn into color form. aonnect button will become Disconnect for manual
disconnection. Run and Stop buttons are used to start or end a test. There are three
different forms of the Run button during a test: Run to start the test, Pause to pause
the running test, and aontinue to resume the unfinished test.
ahange Sample moves the 96-well sample holder or the different sample trays (for
Qsep1) to the door.
ahange Buffer moves the holder of the buffer tray and marker to the door.
Park moves the buffer tray under the cartridge tip at the Park position to protect the
cartridge tip from dryness.
Latch and Unlatch are used to lock or unlock the cartridge(s) in the instrument. Before
executing a test, you must Latch the inserted cartridge. The cartridge information will
be displayed on Figure 4-20 B, and the picture will turn into color. Click Unlatch and
wait for few seconds before removing the cartridge.
Figure 4-20 C shows User ID and Project Directory. After latching, the cartridge
information such as Cartridge Number, Expiration Date, Runs Left, Last Run Date and
Description will be displayed.
You can build your own Sequence in Figure 4-20 E by editing Sample Position, Method,
Sample, Duration, Runs, Separation Duration and Result Name (see Section 3.1.2).
The remaining time of the proceeding action might be extended or shortened by
dragging the slide bar in Figure 4-20 F. For instance, the time of Separation & Detection
is running out, but the result has not completed yet; you may extend the remaining
time by dragging the slide bar to the right (e.g. 40). The amount of the adjustment time
will be shown on the button. Click the button to confirm the change. Then, the action
of Separation & Detection will have 40 seconds extended immediately.
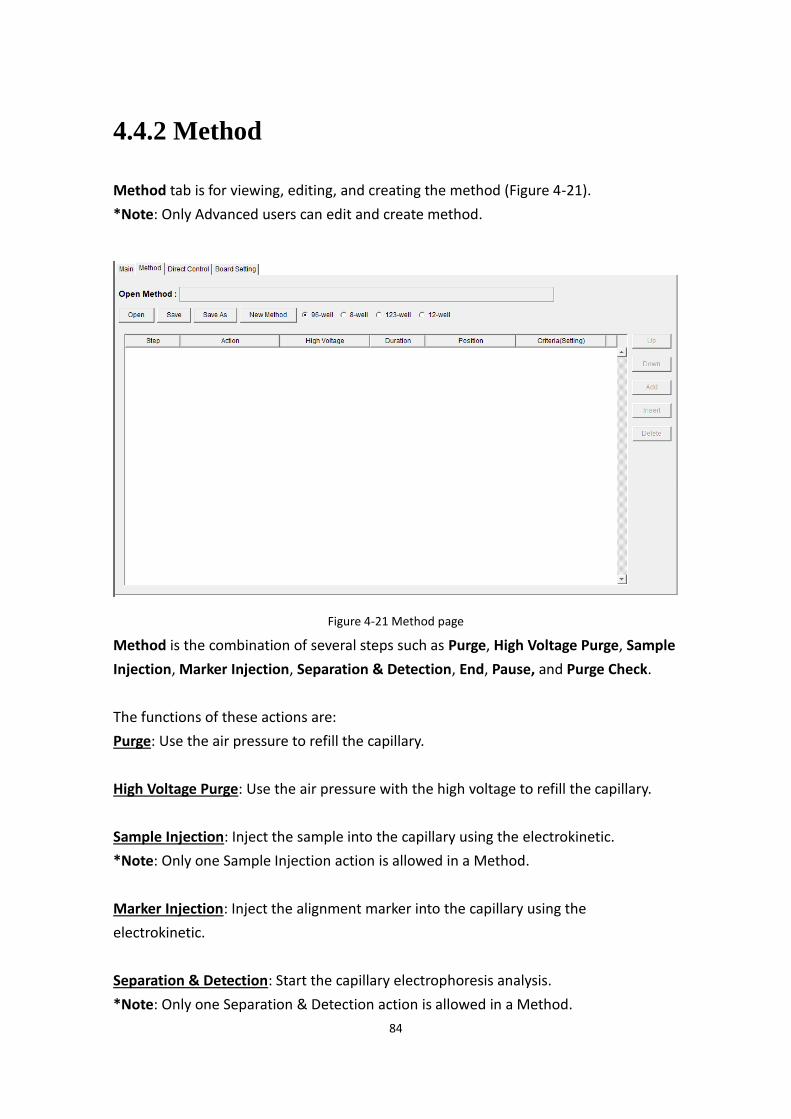
84
4.4.2 Method
Method tab is for viewing, editing, and creating the method (Figure 4-21).
*Note: Only Advanced users can edit and create method.
Figure 4-21 Method page
Method is the combination of several steps such as Purge, High Voltage Purge, Sample
Injection, Marker Injection, Separation & Detection, End, Pause, and Purge aheck.
The functions of these actions are:
Purge: Use the air pressure to refill the capillary.
High Voltage Purge: Use the air pressure with the high voltage to refill the capillary.
Sample Injection: Inject the sample into the capillary using the electrokinetic.
*Note: Only one Sample Injection action is allowed in a Method.
Marker Injection: Inject the alignment marker into the capillary using the
electrokinetic.
Separation & Detection: Start the capillary electrophoresis analysis.
*Note: Only one Separation & Detection action is allowed in a Method.

85
End: Declares the last commend of a Method.
Pause: Parks the cartridge at the Park position.
Purge aheck: Purge check ensures that the air tube is not clogged before use and clean
the gel which was accidentally sucked into the air tube after use.
You can create a method by clicking New Method in the Method tab (Figure 4-21). By
clicking Add button on the right, you can add an action. Select the action you want and
type the duration time. After you select the action position, you can add another
action row. You need to select a position for every action except Sample Injection
because the position of the sample is controlled by the Main tab.
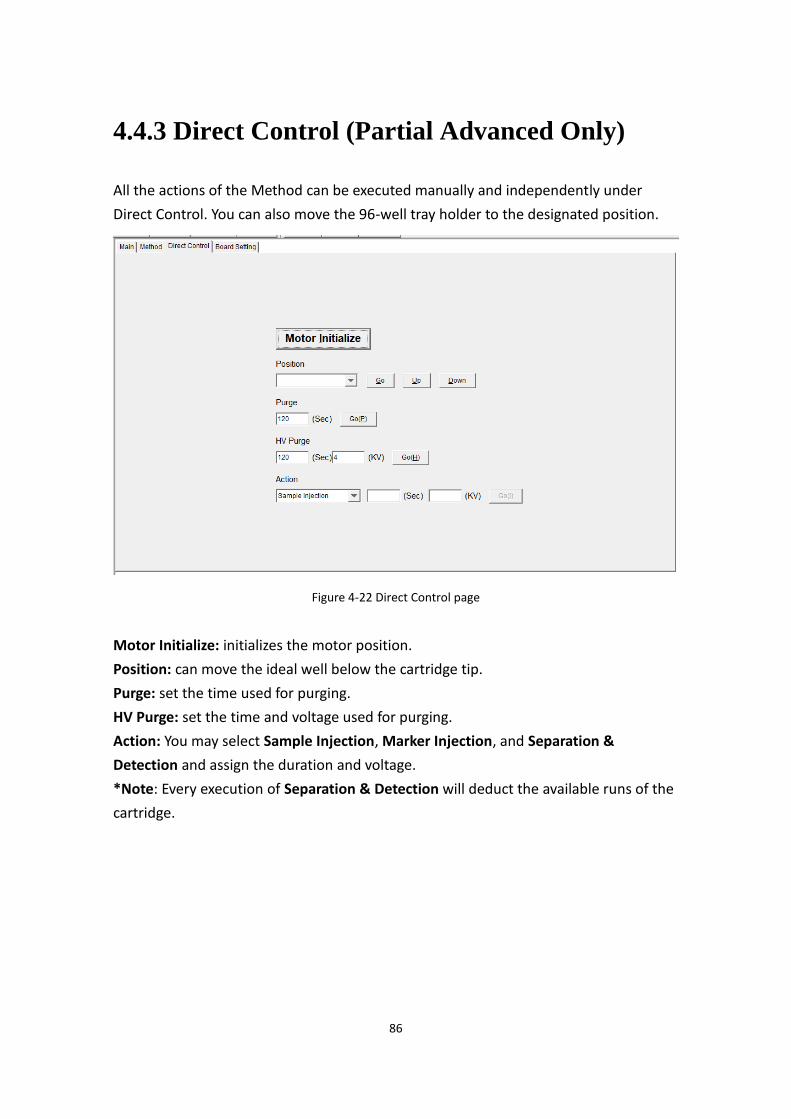
86
4.4.3 Direct Control (Partial Advanced Only)
All the actions of the Method can be executed manually and independently under
Direct Control. You can also move the 96-well tray holder to the designated position.
Figure 4-22 Direct Control page
Motor Initialize: initializes the motor position.
Position: can move the ideal well below the cartridge tip.
Purge: set the time used for purging.
HV Purge: set the time and voltage used for purging.
Action: You may select Sample Injection, Marker Injection, and Separation &
Detection and assign the duration and voltage.
*Note: Every execution of Separation & Detection will deduct the available runs of the
cartridge.
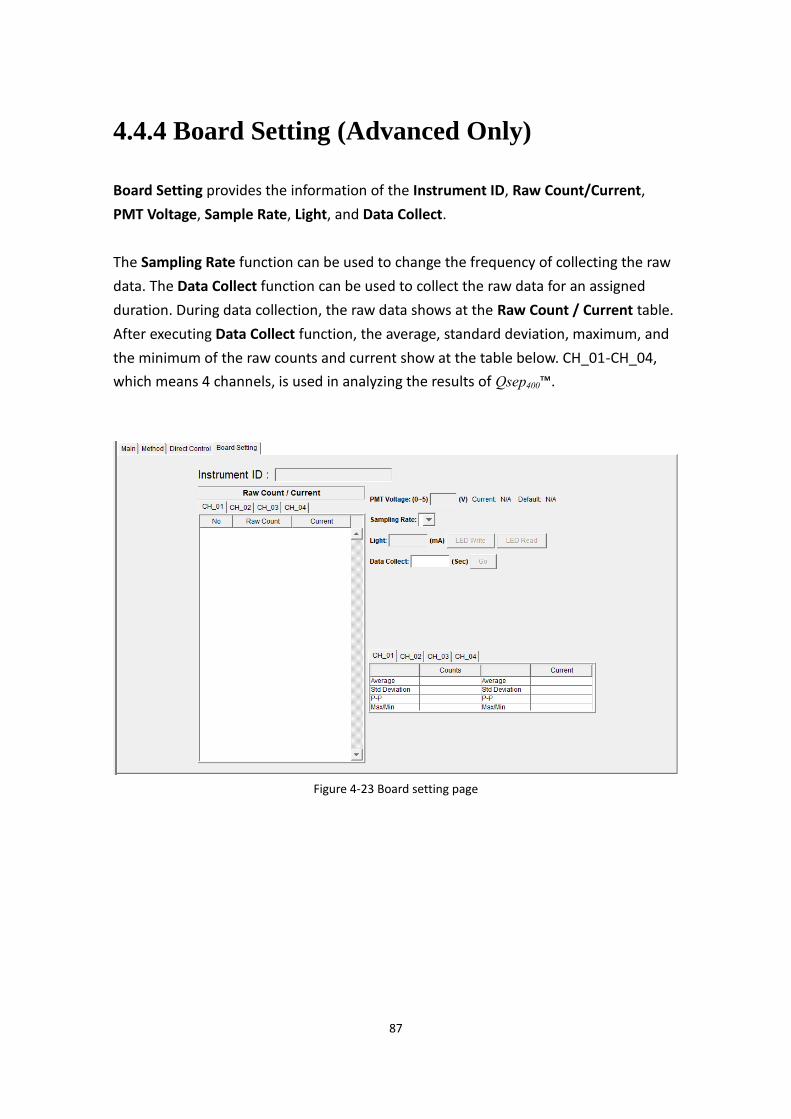
87
4.4.4 Board Setting (Advanced Only)
Board Setting provides the information of the Instrument ID, Raw aount/aurrent,
PMT Voltage, Sample Rate, Light, and Data aollect.
The Sampling Rate function can be used to change the frequency of collecting the raw
data. The Data aollect function can be used to collect the raw data for an assigned
duration. During data collection, the raw data shows at the Raw aount / aurrent table.
After executing Data aollect function, the average, standard deviation, maximum, and
the minimum of the raw counts and current show at the table below. CH_01-CH_04,
which means 4 channels, is used in analyzing the results of Qsep400™.
Figure 4-23 Board setting page
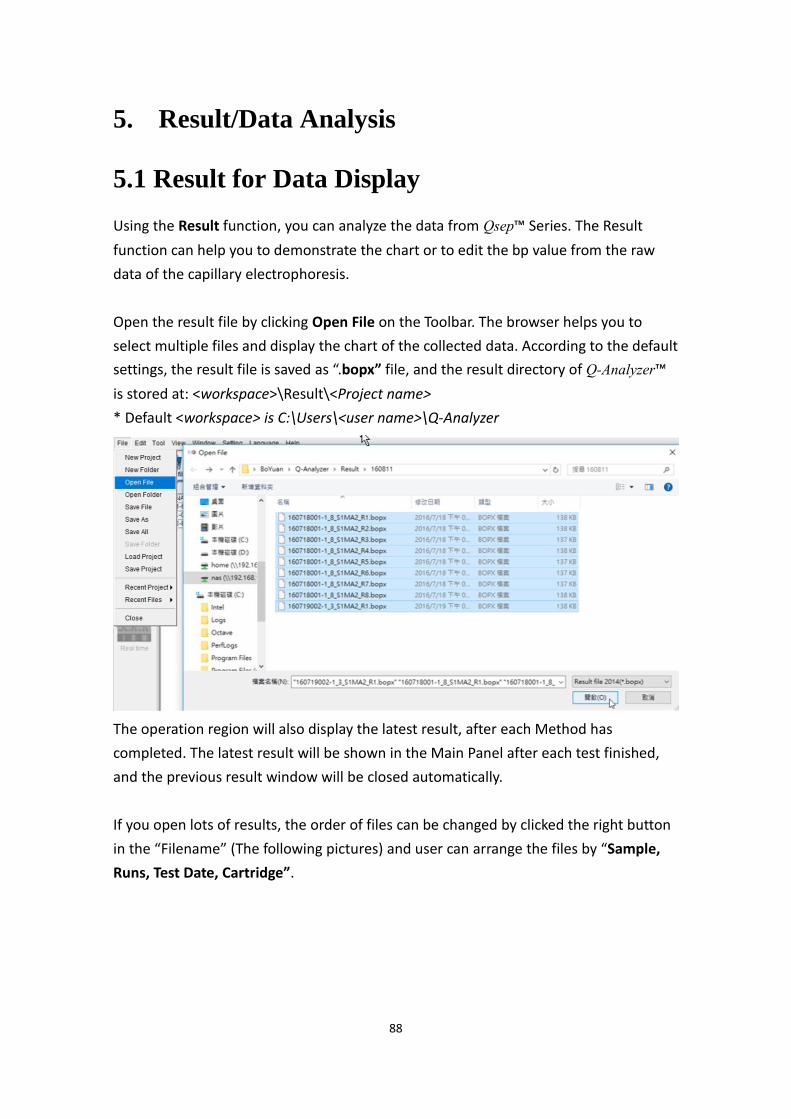
88
5. Result/Data Analysis
5.1 Result for Data Display
Using the Result function, you can analyze the data from Qsep™ Series. The Result
function can help you to demonstrate the chart or to edit the bp value from the raw
data of the capillary electrophoresis.
Open the result file by clicking Open File on the Toolbar. The browser helps you to
select multiple files and display the chart of the collected data. According to the default
settings, the result file is saved as “.bopx” file, and the result directory of Q-Analyzer™
is stored at: <workspace>\Result\<Project name>
* Default <workspace> is C:\Users\<user name>\Q-Analyzer
The operation region will also display the latest result, after each Method has
completed. The latest result will be shown in the Main Panel after each test finished,
and the previous result window will be closed automatically.
If you open lots of results, the order of files can be changed by clicked the right button
in the “Filename” (The following pictures) and user can arrange the files by “Sample,
Runs, Test Date, aartridge”.
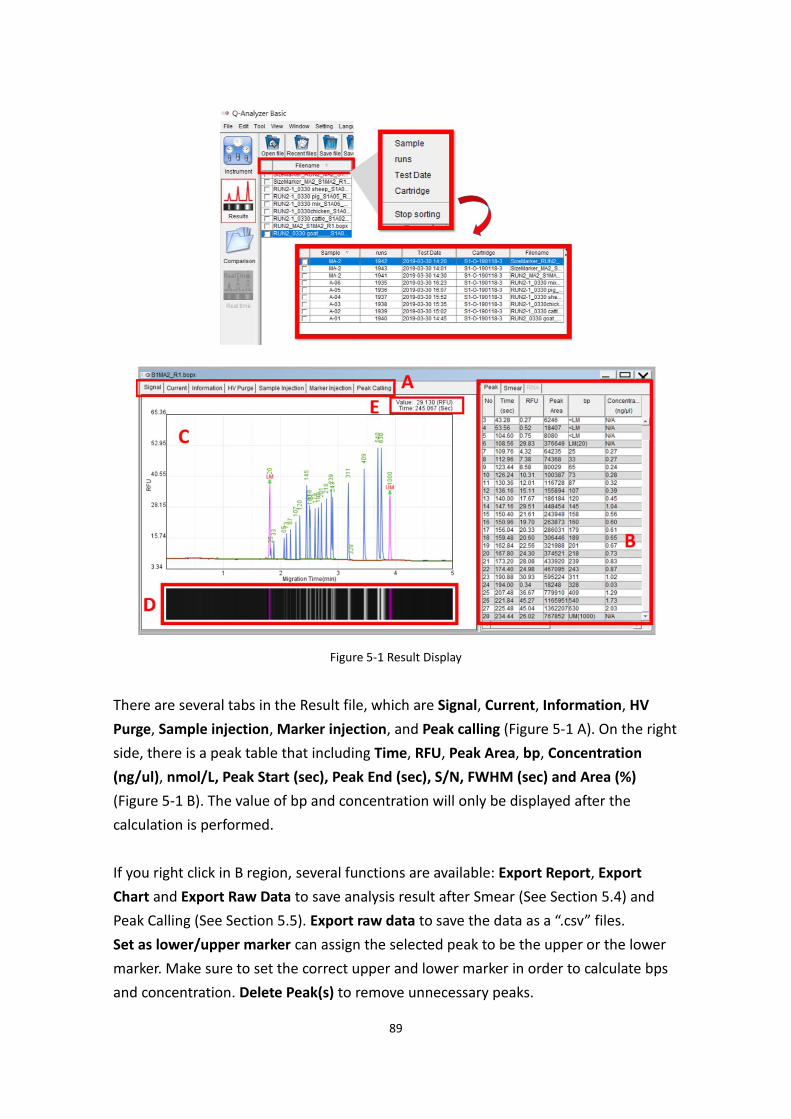
89
Figure 5-1 Result Display
There are several tabs in the Result file, which are Signal, aurrent, Information, HV
Purge, Sample injection, Marker injection, and Peak calling (Figure 5-1 A). On the right
side, there is a peak table that including Time, RFU, Peak Area, bp, aoncentration
(ng/ul), nmol/L, Peak Start (sec), Peak End (sec), S/N, FWHM (sec) and Area (%)
(Figure 5-1 B). The value of bp and concentration will only be displayed after the
calculation is performed.
If you right click in B region, several functions are available: Export Report, Export
ahart and Export Raw Data to save analysis result after Smear (See Section 5.4) and
Peak Calling (See Section 5.5). Export raw data to save the data as a “.csv” files.
Set as lower/upper marker can assign the selected peak to be the upper or the lower
marker. Make sure to set the correct upper and lower marker in order to calculate bps
and concentration. Delete Peak(s) to remove unnecessary peaks.
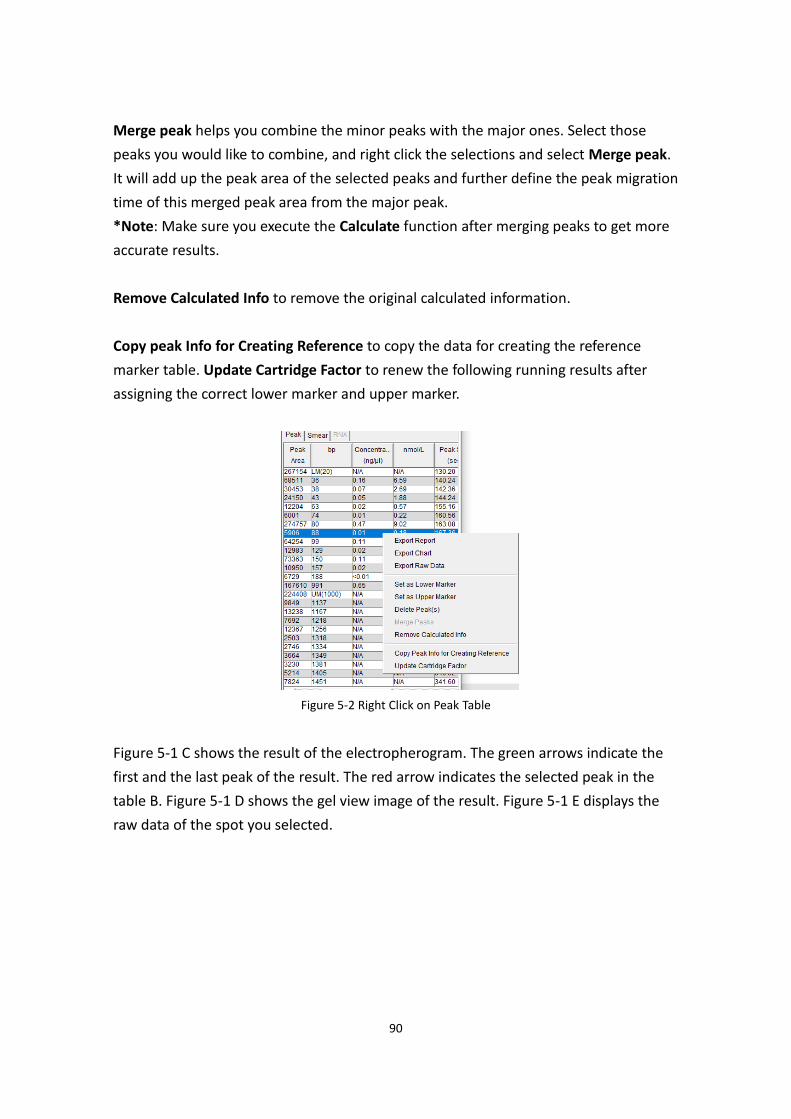
90
Merge peak helps you combine the minor peaks with the major ones. Select those
peaks you would like to combine, and right click the selections and select Merge peak.
It will add up the peak area of the selected peaks and further define the peak migration
time of this merged peak area from the major peak.
*Note: Make sure you execute the aalculate function after merging peaks to get more
accurate results.
Remove aalculated Info to remove the original calculated information.
aopy peak Info for areating Reference to copy the data for creating the reference
marker table. Update aartridge Factor to renew the following running results after
assigning the correct lower marker and upper marker.
Figure 5-2 Right Click on Peak Table
Figure 5-1 C shows the result of the electropherogram. The green arrows indicate the
first and the last peak of the result. The red arrow indicates the selected peak in the
table B. Figure 5-1 D shows the gel view image of the result. Figure 5-1 E displays the
raw data of the spot you selected.

91
5.1.1 Calculation
If you find the size values of the result are wrong or empty, you can utilize the aalculate
function on the Toolbar to get the respective value of bp and concentration for each
peak in the result. This function can also be used in RNA samples after running the RNA
ladder.
First, open the file you intend to calculate and make sure that it is the selected window.
Select aalculate on the Toolbar and click Load to load a suitable reference marker table
for calculating your result.
Go aalculate on the Toolbar and Load a suitable reference marker table for calculating
the result.
Please choose the reference marker file according to the test condition. Note that the
files include four information which are
1. Cartridge type (e.g. S1, S2, F3…)
2. Operation voltage of the separation (e.g. 6, 8 ,10 KV)
3. Size marker type (e.g. C109200, C109300…)
4. Alignment marker type (e.g. 20-1k, 20-5k…)
For example:
All the reference marker files corresponding to the pre-program methods can be found
at the default Load Folder: “<workspace>\Reference”
* Default workspace is C:\Users\<username>\Q-Analyzer

92
Apply to all selected files in list: if you want to do multiple result files calculation.
Save File after aalculation: save the result file after the calculation is complete. Please
select this function if you want to see the calculated result every time you open the
file.
With Alignment: if you apply the alignment marker for analysis.
AM Mixture Factor aorrection: select the checkbox of this function for proper
calculation if the alignment marker is mixed with the sample.
Please choose the reference marker file according to your condition.
We prepare a complete set of the reference marker files corresponding to all the pre-
program methods. The reference marker files can be accessed by clicking the Load in
the editor. You also can use another new reference marker you created according to
your specific condition (See Section 5.1.2).
Note that the file name includes four information which are cartridge type (e.g. S1, S2,
F3), operation HV of the separation (e.g. 6, 8 ,10 KV), size marker type (e.g. C109200,
C109300), and the alignment marker type (e.g. 20-1k, 20-5k).
After confirming the reference data file, click OK, and then the value of bp and
concentration will be shown in the columns. After the qualitative calculation analysis is
completed, click Save File to save the file.
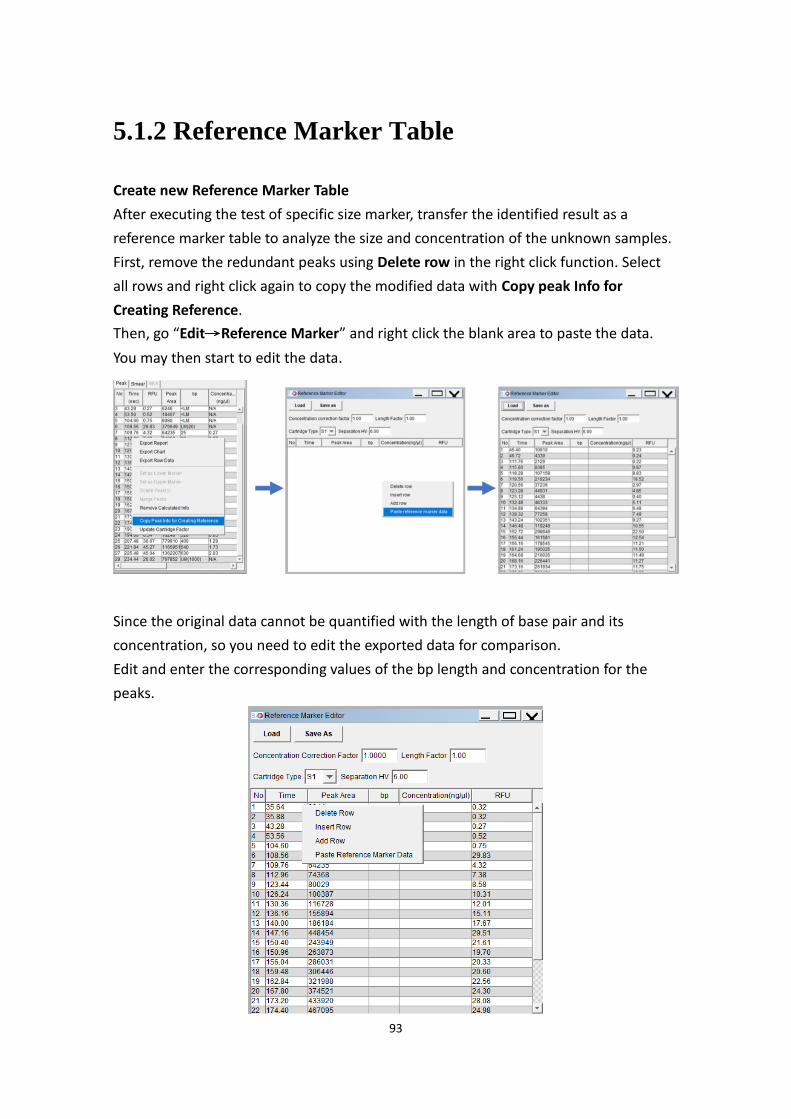
93
5.1.2 Reference Marker Table
areate new Reference Marker Table
After executing the test of specific size marker, transfer the identified result as a
reference marker table to analyze the size and concentration of the unknown samples.
First, remove the redundant peaks using Delete row in the right click function. Select
all rows and right click again to copy the modified data with aopy peak Info for
areating Reference.
Then, go “Edit→Reference Marker” and right click the blank area to paste the data.
You may then start to edit the data.
Since the original data cannot be quantified with the length of base pair and its
concentration, so you need to edit the exported data for comparison.
Edit and enter the corresponding values of the bp length and concentration for the
peaks.
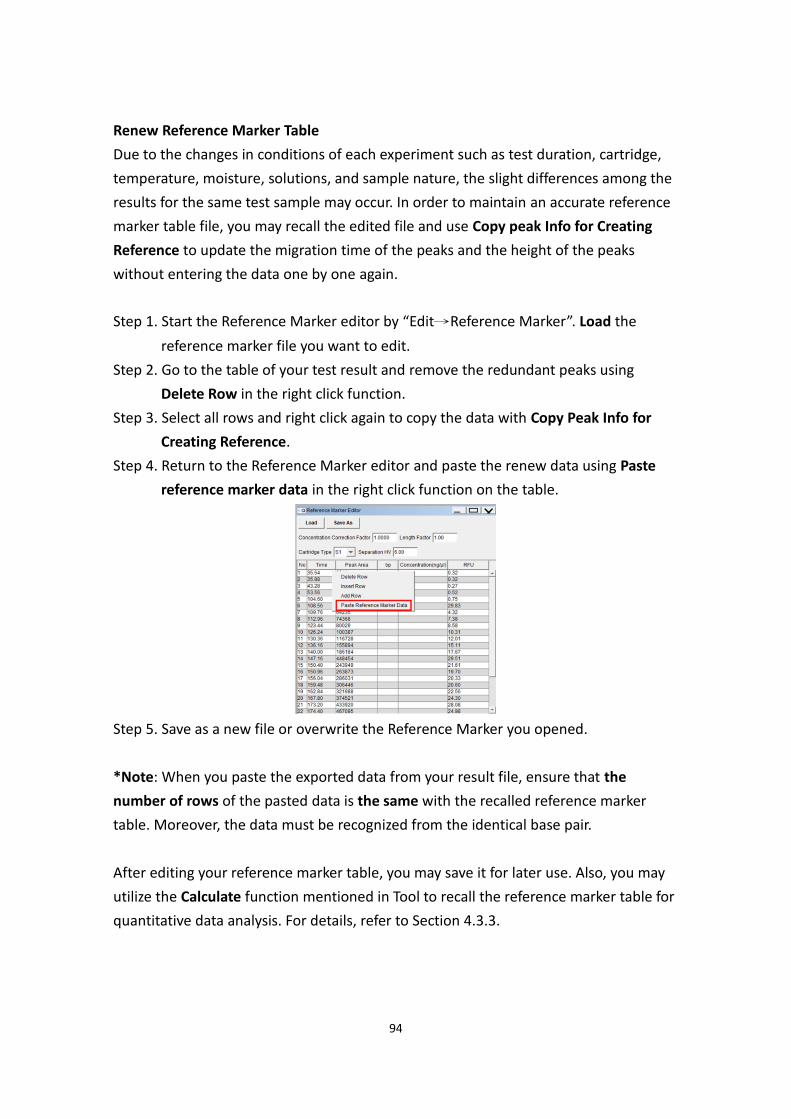
94
Renew Reference Marker Table
Due to the changes in conditions of each experiment such as test duration, cartridge,
temperature, moisture, solutions, and sample nature, the slight differences among the
results for the same test sample may occur. In order to maintain an accurate reference
marker table file, you may recall the edited file and use aopy peak Info for areating
Reference to update the migration time of the peaks and the height of the peaks
without entering the data one by one again.
Step 1. Start the Reference Marker editor by “Edit→Reference Marker”. Load the
reference marker file you want to edit.
Step 2. Go to the table of your test result and remove the redundant peaks using
Delete Row in the right click function.
Step 3. Select all rows and right click again to copy the data with aopy Peak Info for
areating Reference.
Step 4. Return to the Reference Marker editor and paste the renew data using Paste
reference marker data in the right click function on the table.
Step 5. Save as a new file or overwrite the Reference Marker you opened.
*Note: When you paste the exported data from your result file, ensure that the
number of rows of the pasted data is the same with the recalled reference marker
table. Moreover, the data must be recognized from the identical base pair.
After editing your reference marker table, you may save it for later use. Also, you may
utilize the aalculate function mentioned in Tool to recall the reference marker table for
quantitative data analysis. For details, refer to Section 4.3.3.
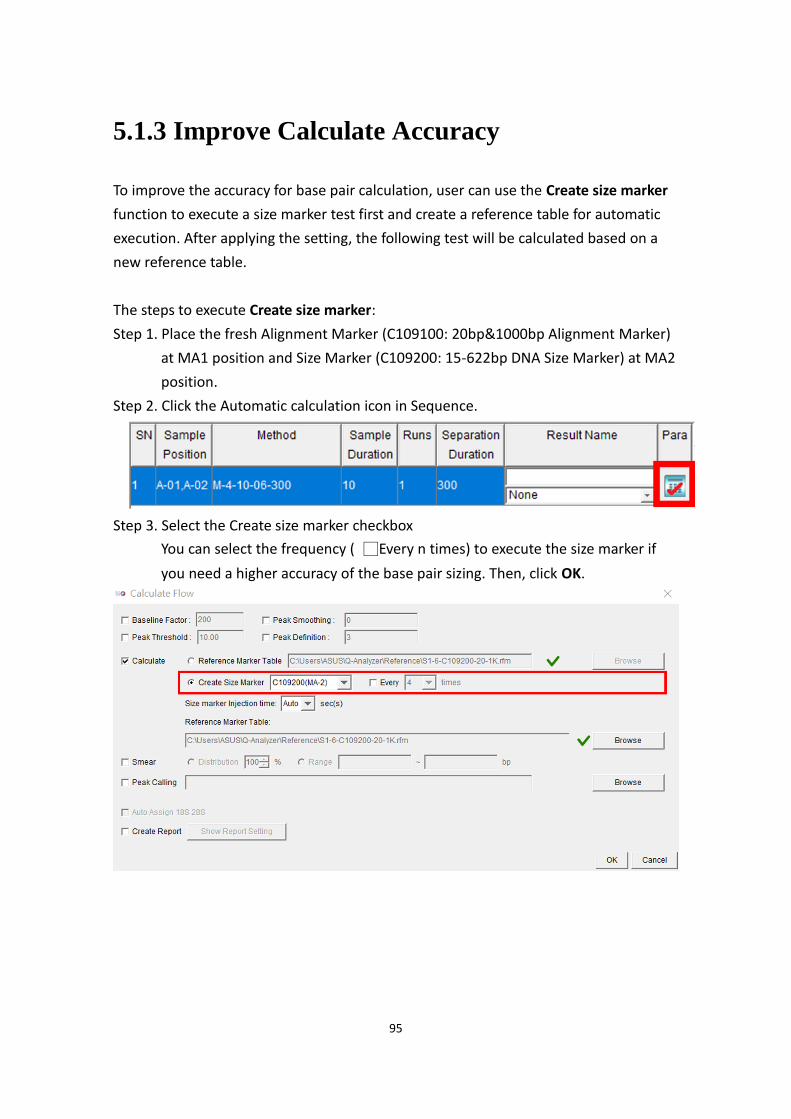
95
5.1.3 Improve Calculate Accuracy
To improve the accuracy for base pair calculation, user can use the areate size marker
function to execute a size marker test first and create a reference table for automatic
execution. After applying the setting, the following test will be calculated based on a
new reference table.
The steps to execute areate size marker:
Step 1. Place the fresh Alignment Marker (C109100: 20bp&1000bp Alignment Marker)
at MA1 position and Size Marker (C109200: 15-622bp DNA Size Marker) at MA2
position.
Step 2. Click the Automatic calculation icon in Sequence.
Step 3. Select the Create size marker checkbox
You can select the frequency ( □Every n times) to execute the size marker if
you need a higher accuracy of the base pair sizing. Then, click OK.
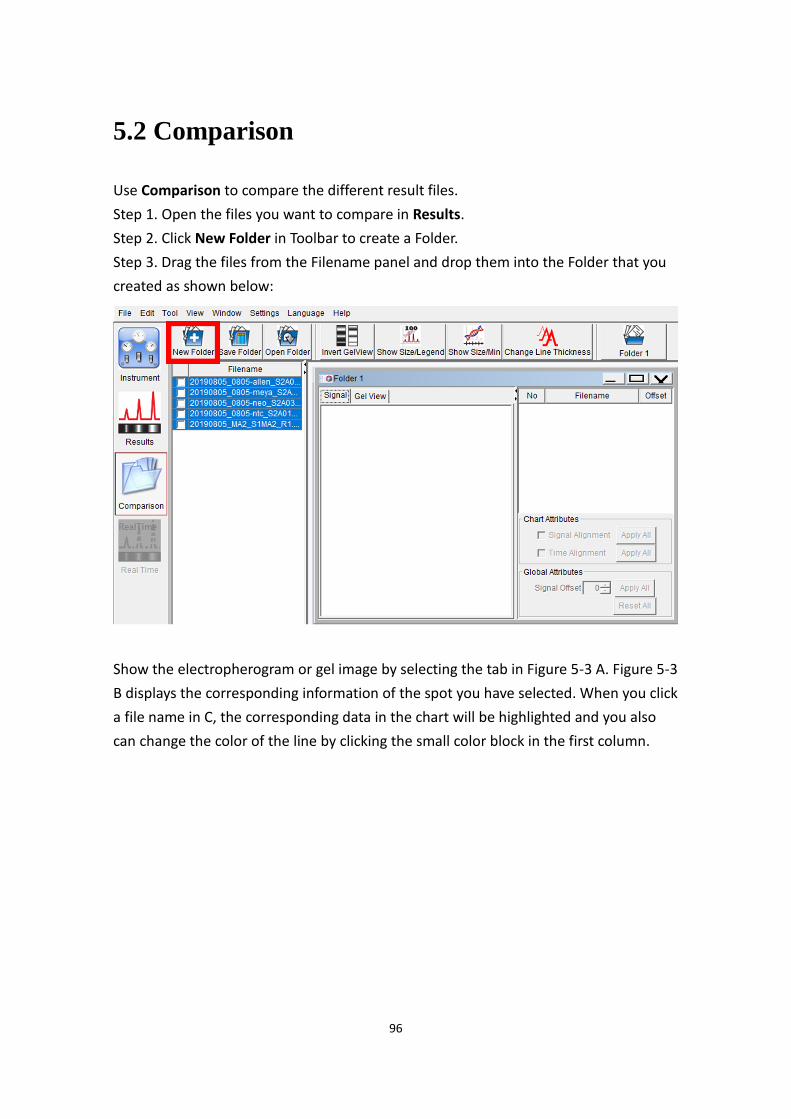
96
5.2 Comparison
Use aomparison to compare the different result files.
Step 1. Open the files you want to compare in Results.
Step 2. Click New Folder in Toolbar to create a Folder.
Step 3. Drag the files from the Filename panel and drop them into the Folder that you
created as shown below:
Show the electropherogram or gel image by selecting the tab in Figure 5-3 A. Figure 5-3
B displays the corresponding information of the spot you have selected. When you click
a file name in C, the corresponding data in the chart will be highlighted and you also
can change the color of the line by clicking the small color block in the first column.
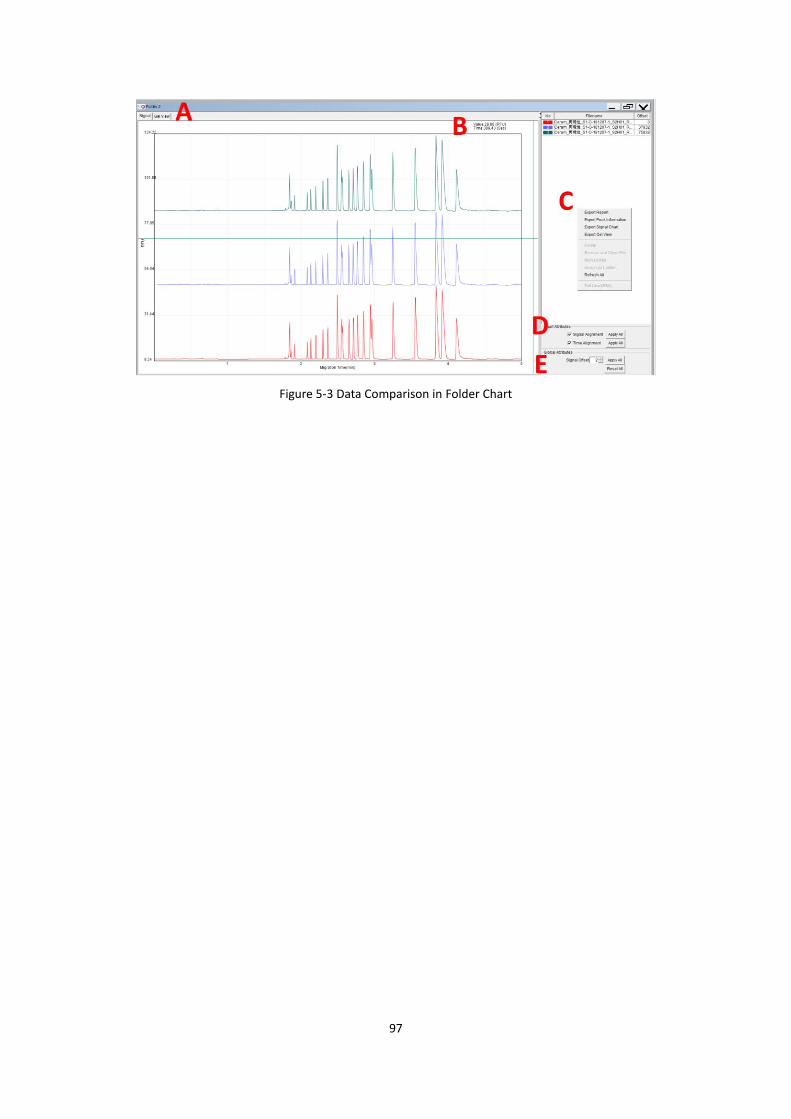
97
Figure 5-3 Data Comparison in Folder Chart
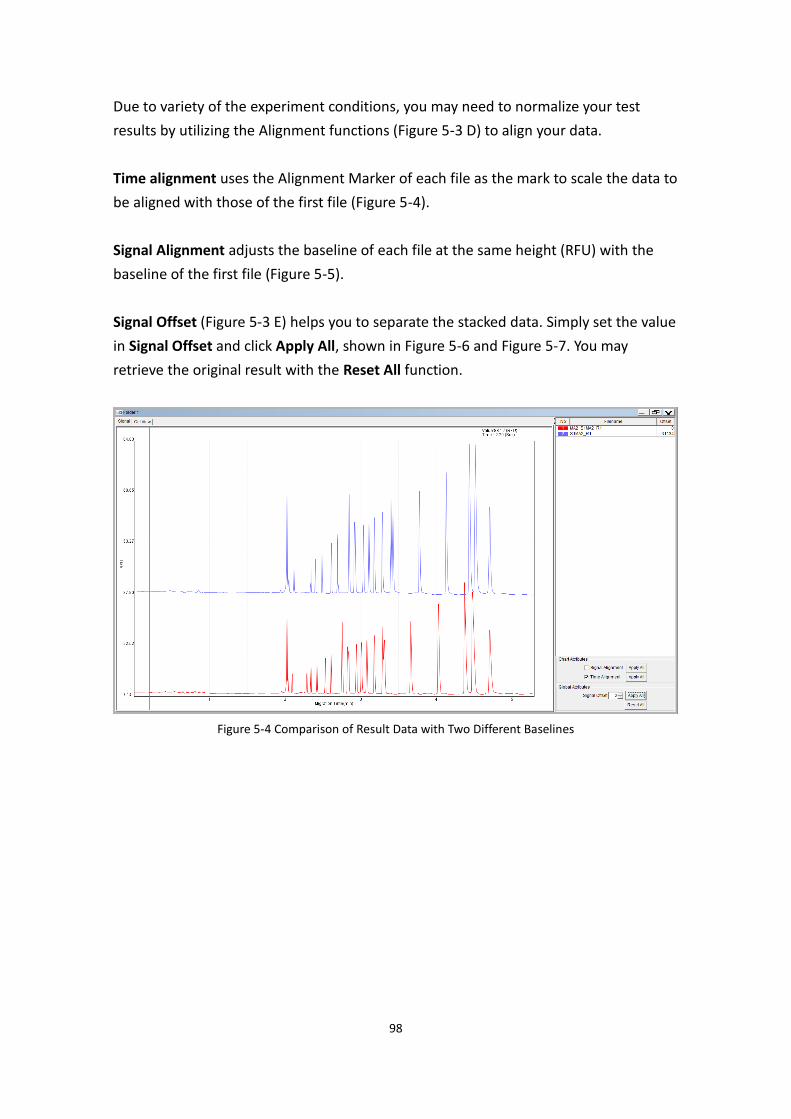
98
Due to variety of the experiment conditions, you may need to normalize your test
results by utilizing the Alignment functions (Figure 5-3 D) to align your data.
Time alignment uses the Alignment Marker of each file as the mark to scale the data to
be aligned with those of the first file (Figure 5-4).
Signal Alignment adjusts the baseline of each file at the same height (RFU) with the
baseline of the first file (Figure 5-5).
Signal Offset (Figure 5-3 E) helps you to separate the stacked data. Simply set the value
in Signal Offset and click Apply All, shown in Figure 5-6 and Figure 5-7. You may
retrieve the original result with the Reset All function.
Figure 5-4 Comparison of Result Data with Two Different Baselines
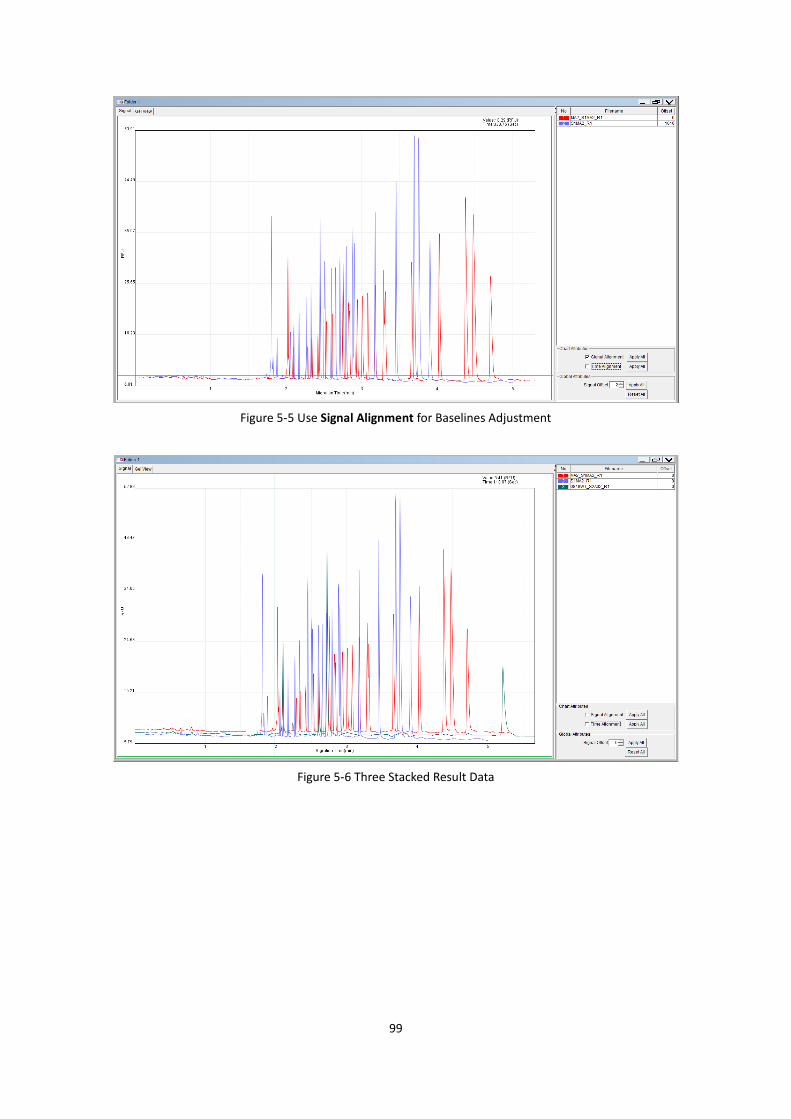
99
Figure 5-5 Use Signal Alignment for Baselines Adjustment
Figure 5-6 Three Stacked Result Data
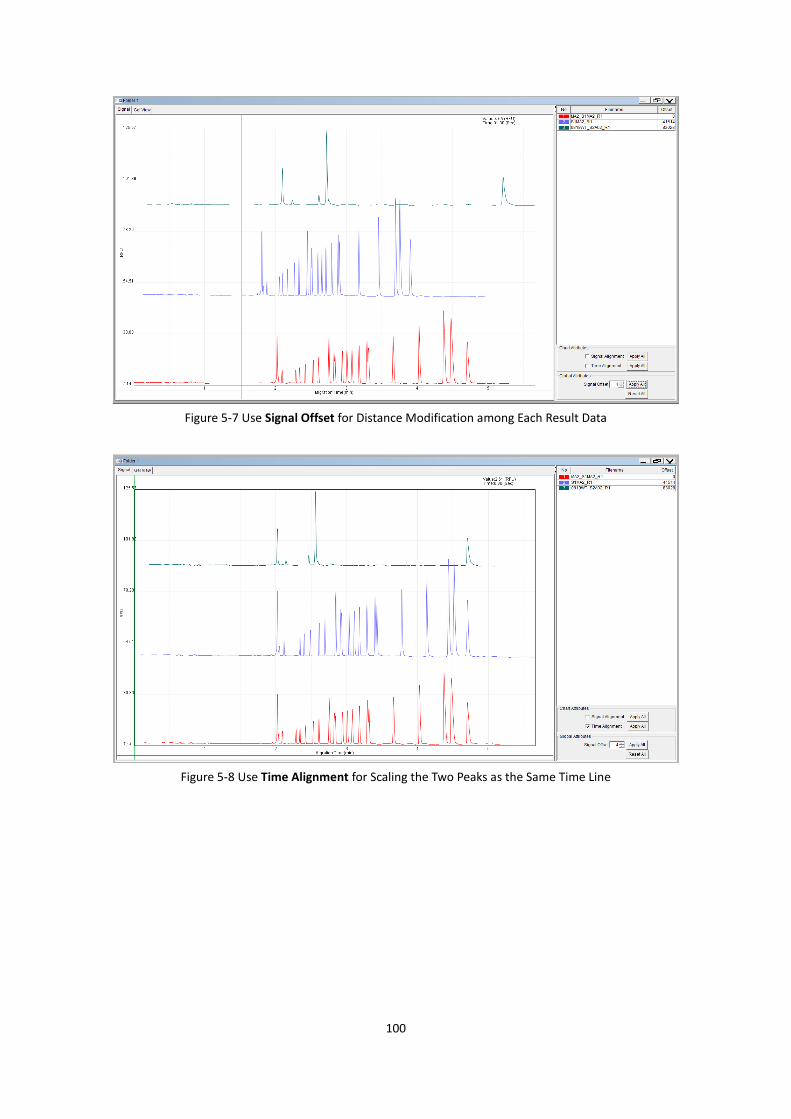
100
Figure 5-7 Use Signal Offset for Distance Modification among Each Result Data
Figure 5-8 Use Time Alignment for Scaling the Two Peaks as the Same Time Line
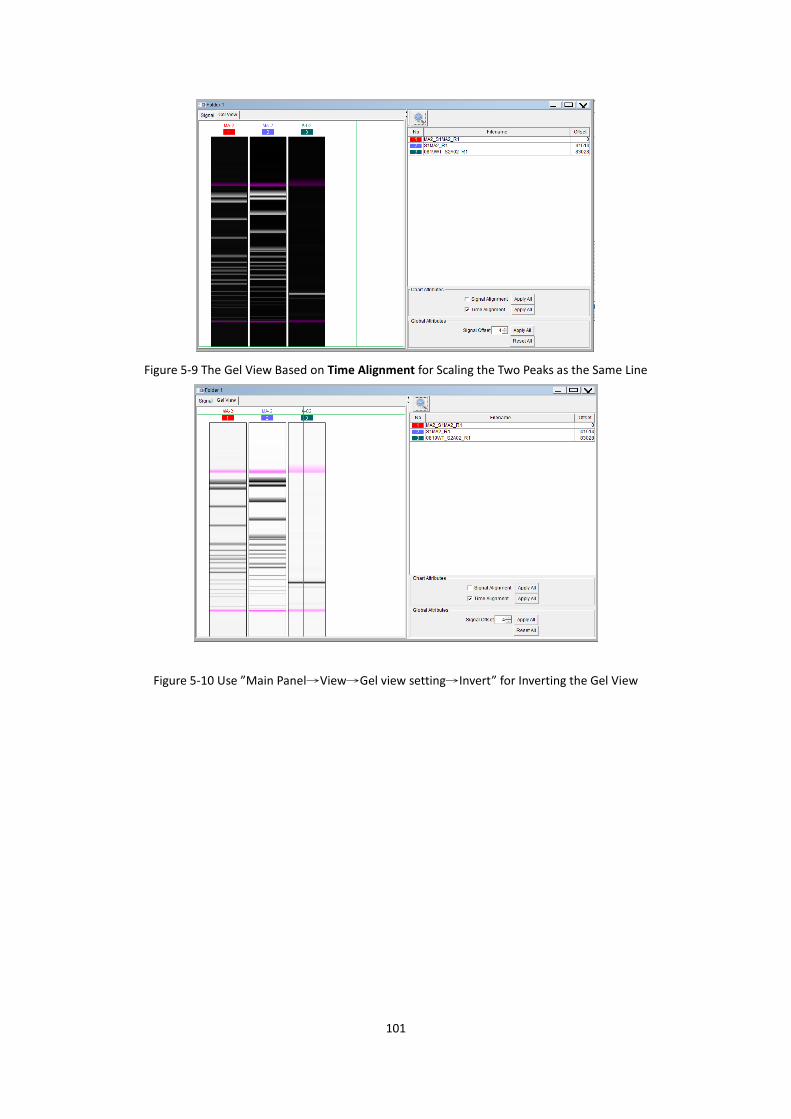
101
Figure 5-9 The Gel View Based on Time Alignment for Scaling the Two Peaks as the Same Line
Figure 5-10 Use ”Main Panel→View→Gel view setting→Invert” for Inverting the Gel View
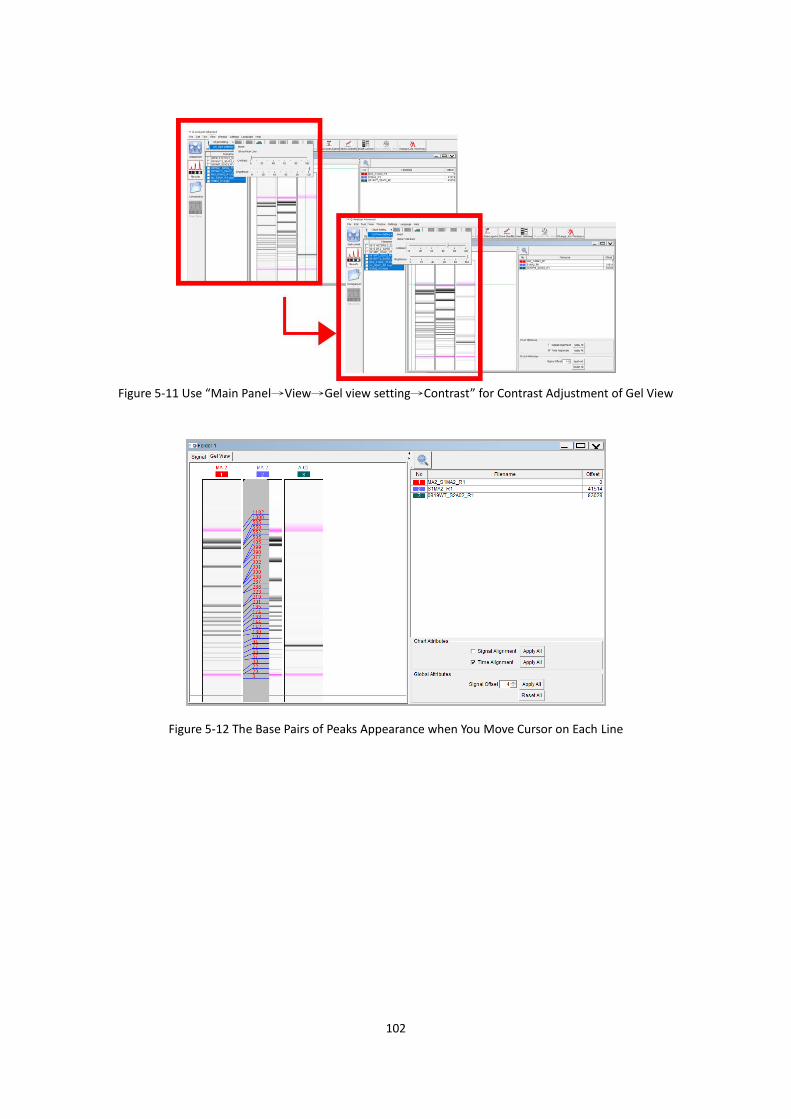
102
Figure 5-11 Use “Main Panel→View→Gel view setting→Contrast” for Contrast Adjustment of Gel View
Figure 5-12 The Base Pairs of Peaks Appearance when You Move Cursor on Each Line
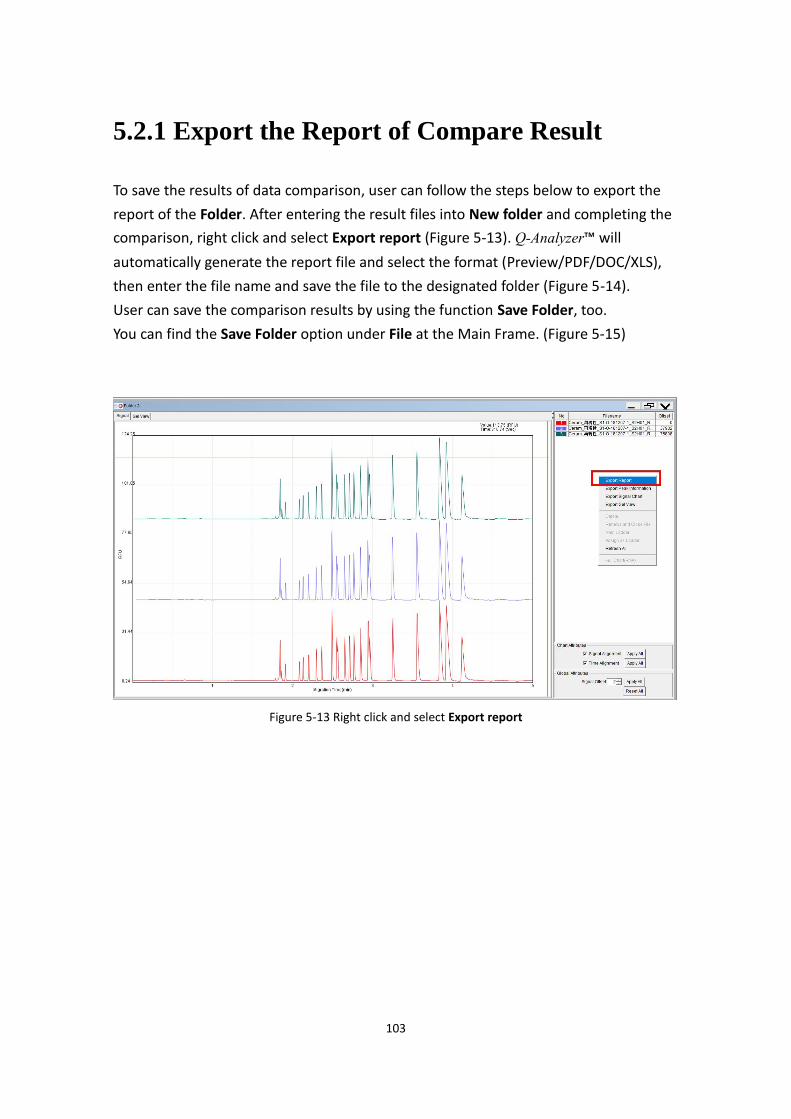
103
5.2.1 Export the Report of Compare Result
To save the results of data comparison, user can follow the steps below to export the
report of the Folder. After entering the result files into New folder and completing the
comparison, right click and select Export report (Figure 5-13). Q-Analyzer™ will
automatically generate the report file and select the format (Preview/PDF/DOC/XLS),
then enter the file name and save the file to the designated folder (Figure 5-14).
User can save the comparison results by using the function Save Folder, too.
You can find the Save Folder option under File at the Main Frame. (Figure 5-15)
Figure 5-13 Right click and select Export report
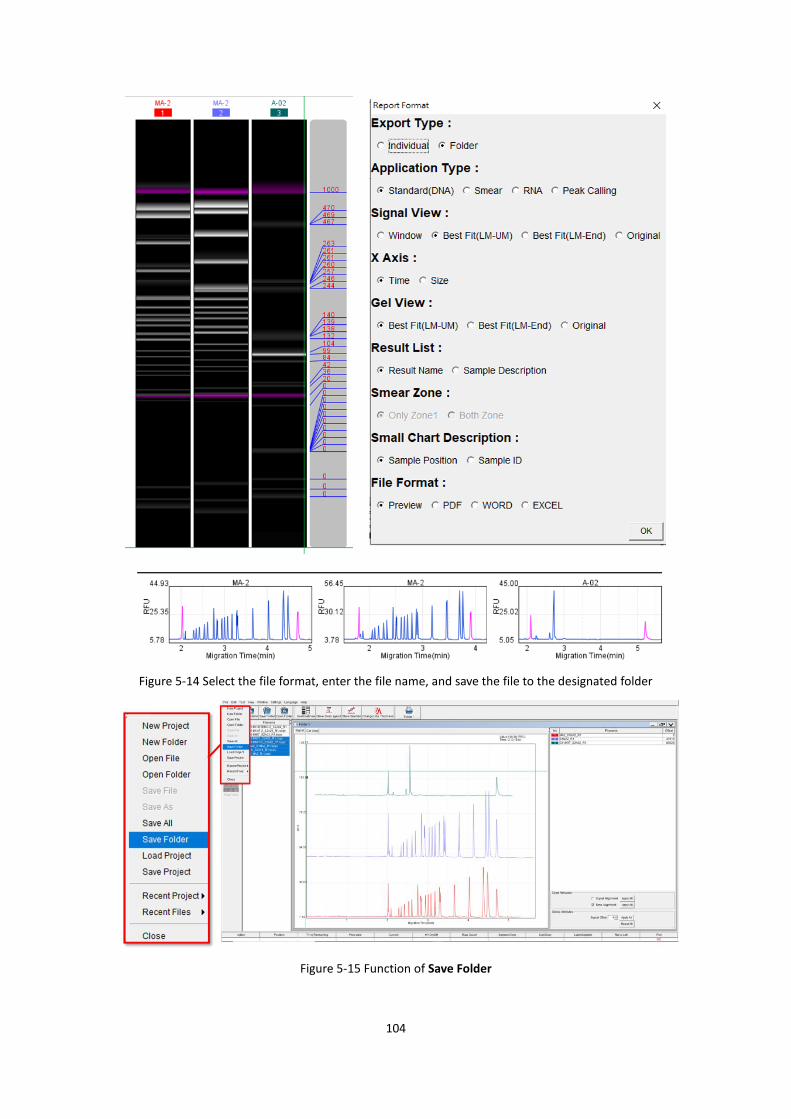
104
Figure 5-14 Select the file format, enter the file name, and save the file to the designated folder
Figure 5-15 Function of Save Folder
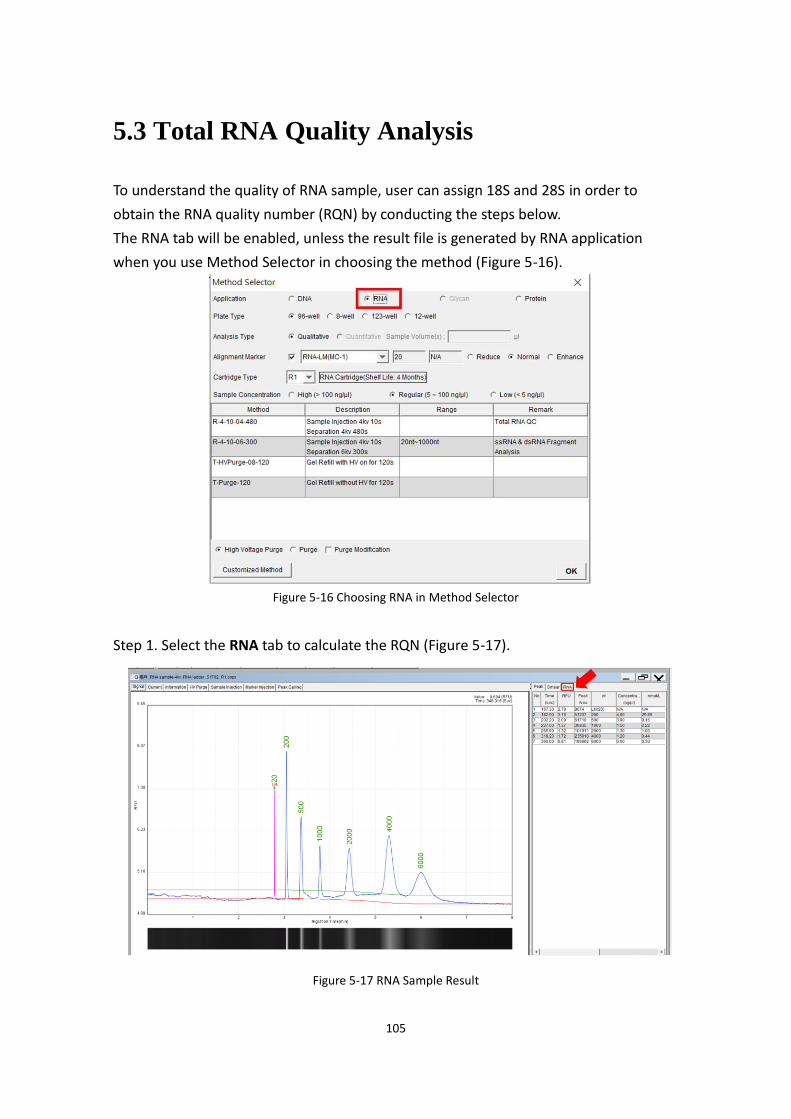
105
5.3 Total RNA Quality Analysis
To understand the quality of RNA sample, user can assign 18S and 28S in order to
obtain the RNA quality number (RQN) by conducting the steps below.
The RNA tab will be enabled, unless the result file is generated by RNA application
when you use Method Selector in choosing the method (Figure 5-16).
Figure 5-16 Choosing RNA in Method Selector
Step 1. Select the RNA tab to calculate the RQN (Figure 5-17).
Figure 5-17 RNA Sample Result
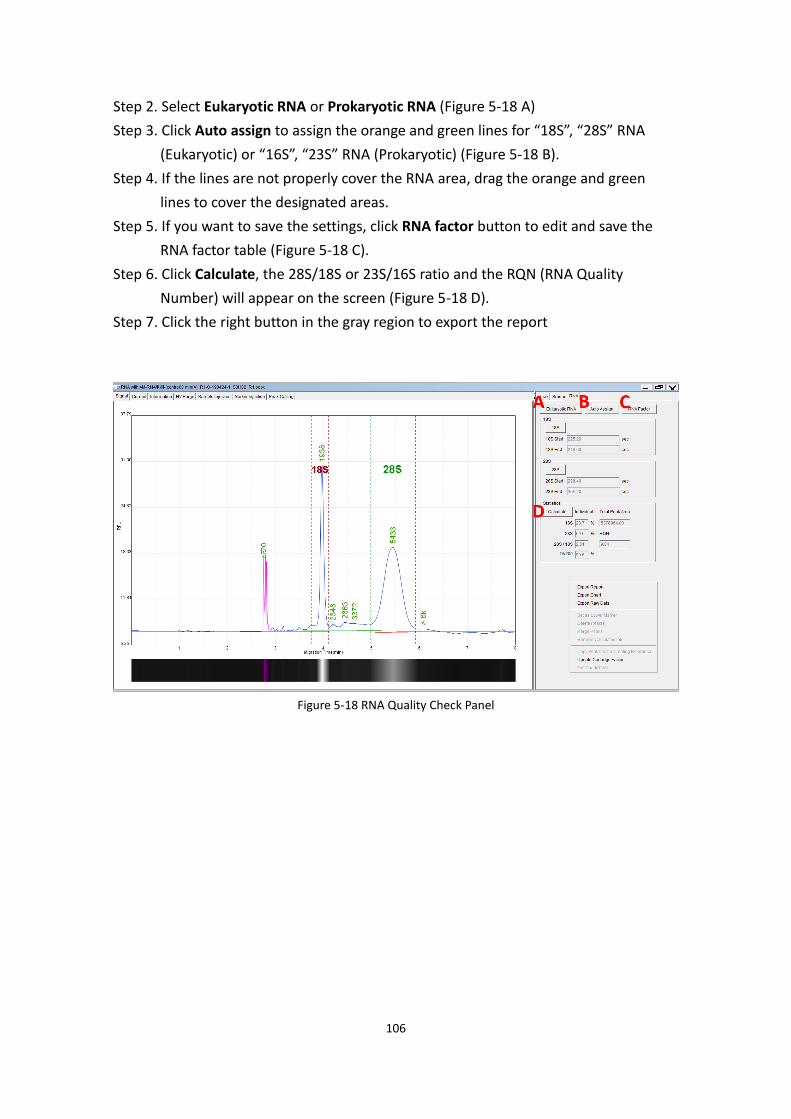
106
Step 2. Select Eukaryotic RNA or Prokaryotic RNA (Figure 5-18 A)
Step 3. Click Auto assign to assign the orange and green lines for “18S”, “28S” RNA
(Eukaryotic) or “16S”, “23S” RNA (Prokaryotic) (Figure 5-18 B).
Step 4. If the lines are not properly cover the RNA area, drag the orange and green
lines to cover the designated areas.
Step 5. If you want to save the settings, click RNA factor button to edit and save the
RNA factor table (Figure 5-18 C).
Step 6. Click aalculate, the 28S/18S or 23S/16S ratio and the RQN (RNA Quality
Number) will appear on the screen (Figure 5-18 D).
Step 7. Click the right button in the gray region to export the report
Figure 5-18 RNA Quality Check Panel
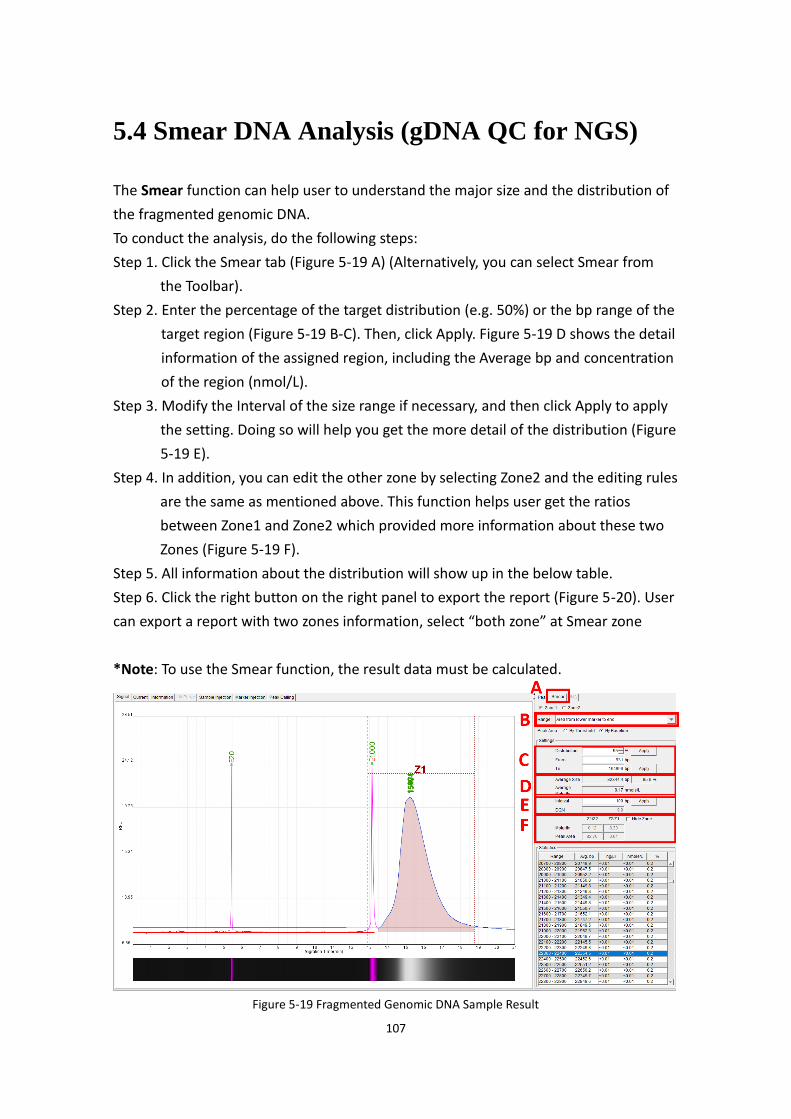
107
5.4 Smear DNA Analysis (gDNA QC for NGS)
The Smear function can help user to understand the major size and the distribution of
the fragmented genomic DNA.
To conduct the analysis, do the following steps:
Step 1. Click the Smear tab (Figure 5-19 A) (Alternatively, you can select Smear from
the Toolbar).
Step 2. Enter the percentage of the target distribution (e.g. 50%) or the bp range of the
target region (Figure 5-19 B-C). Then, click Apply. Figure 5-19 D shows the detail
information of the assigned region, including the Average bp and concentration
of the region (nmol/L).
Step 3. Modify the Interval of the size range if necessary, and then click Apply to apply
the setting. Doing so will help you get the more detail of the distribution (Figure
5-19 E).
Step 4. In addition, you can edit the other zone by selecting Zone2 and the editing rules
are the same as mentioned above. This function helps user get the ratios
between Zone1 and Zone2 which provided more information about these two
Zones (Figure 5-19 F).
Step 5. All information about the distribution will show up in the below table.
Step 6. Click the right button on the right panel to export the report (Figure 5-20). User
can export a report with two zones information, select “both zone” at Smear zone
*Note: To use the Smear function, the result data must be calculated.
Figure 5-19 Fragmented Genomic DNA Sample Result
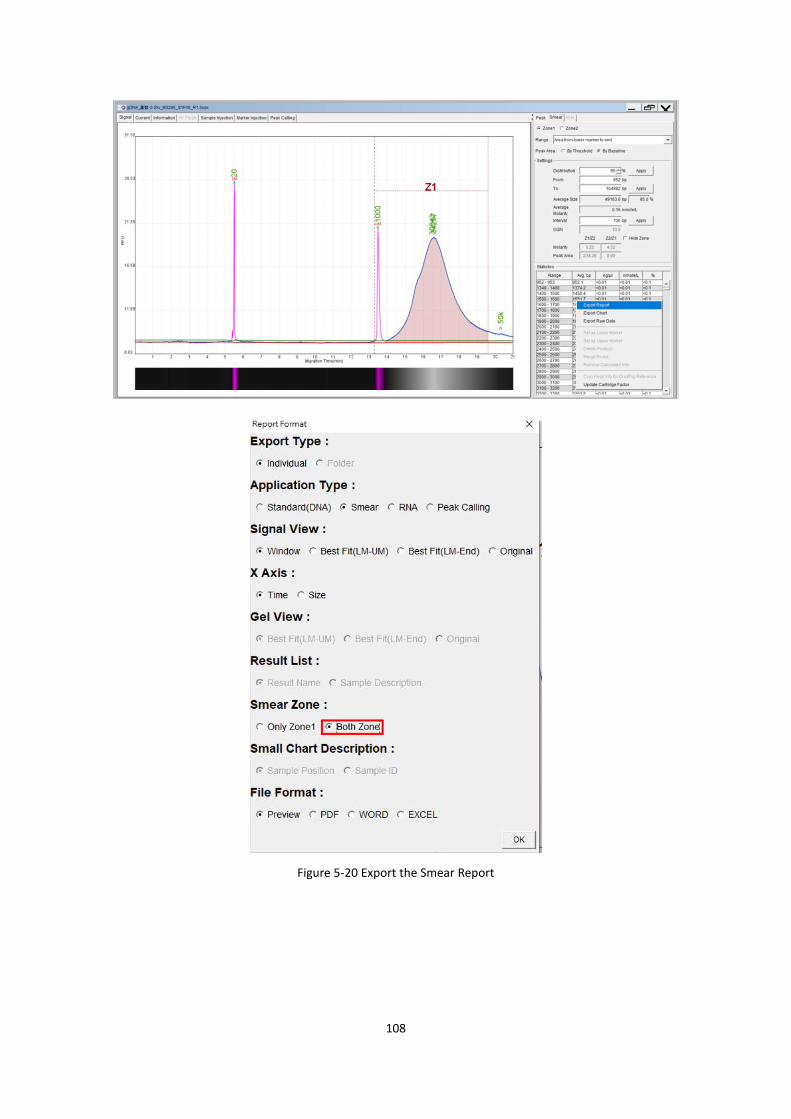
108
Figure 5-20 Export the Smear Report
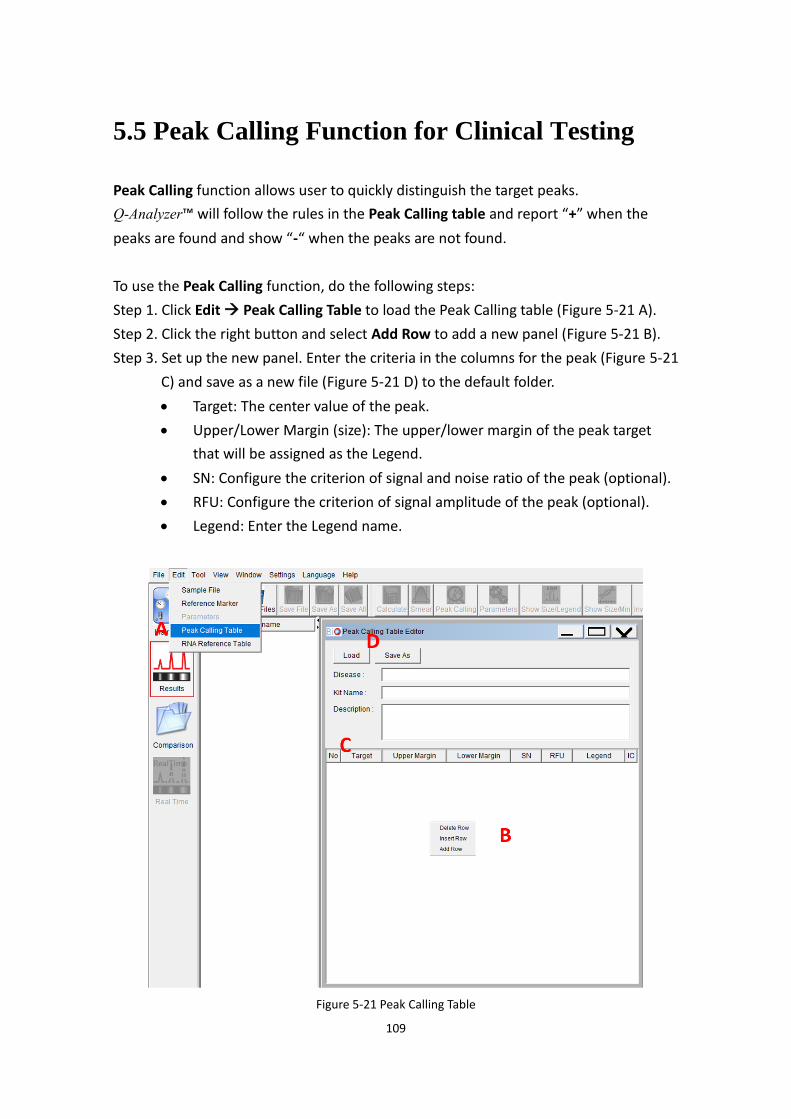
109
5.5 Peak Calling Function for Clinical Testing
Peak aalling function allows user to quickly distinguish the target peaks.
Q-Analyzer™ will follow the rules in the Peak aalling table and report “+” when the
peaks are found and show “-“ when the peaks are not found.
To use the Peak aalling function, do the following steps:
Step 1. Click Edit → Peak aalling Table to load the Peak Calling table (Figure 5-21 A).
Step 2. Click the right button and select Add Row to add a new panel (Figure 5-21 B).
Step 3. Set up the new panel. Enter the criteria in the columns for the peak (Figure 5-21
C) and save as a new file (Figure 5-21 D) to the default folder.
• Target: The center value of the peak.
• Upper/Lower Margin (size): The upper/lower margin of the peak target
that will be assigned as the Legend.
• SN: Configure the criterion of signal and noise ratio of the peak (optional).
• RFU: Configure the criterion of signal amplitude of the peak (optional).
• Legend: Enter the Legend name.
Figure 5-21 Peak Calling Table
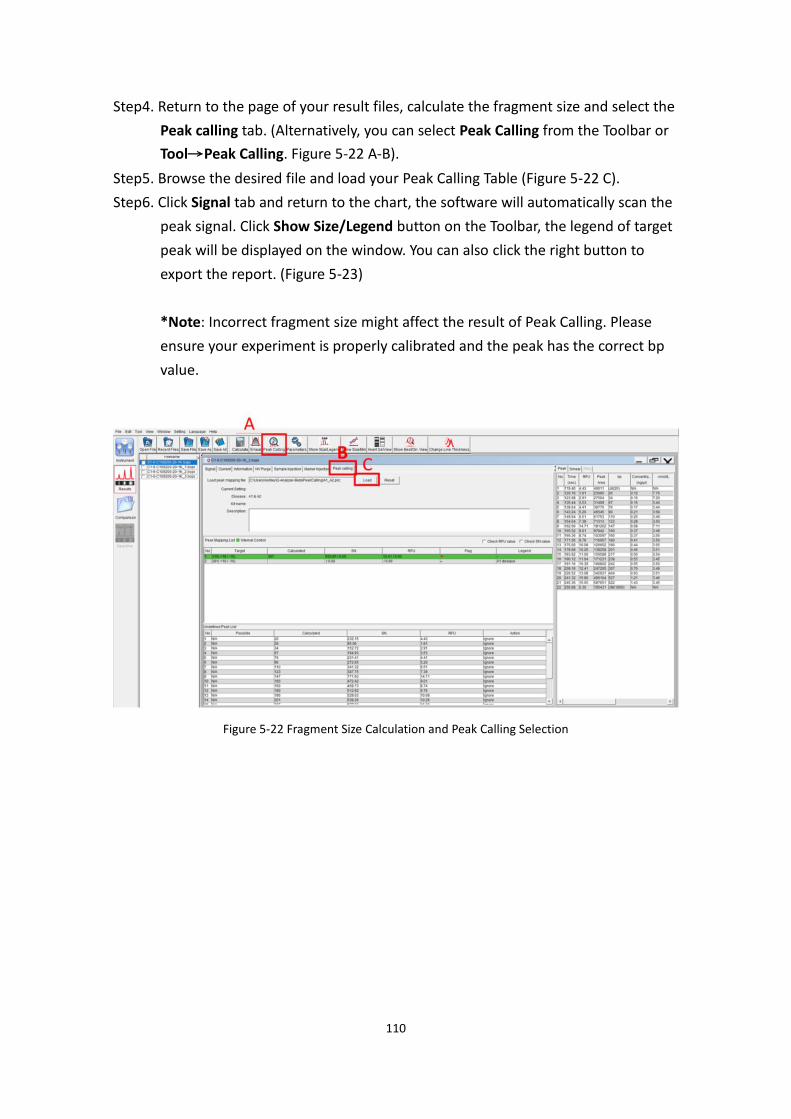
110
Step4. Return to the page of your result files, calculate the fragment size and select the
Peak calling tab. (Alternatively, you can select Peak aalling from the Toolbar or
Tool→Peak aalling. Figure 5-22 A-B).
Step5. Browse the desired file and load your Peak Calling Table (Figure 5-22 C).
Step6. Click Signal tab and return to the chart, the software will automatically scan the
peak signal. Click Show Size/Legend button on the Toolbar, the legend of target
peak will be displayed on the window. You can also click the right button to
export the report. (Figure 5-23)
*Note: Incorrect fragment size might affect the result of Peak Calling. Please
ensure your experiment is properly calibrated and the peak has the correct bp
value.
Figure 5-22 Fragment Size Calculation and Peak Calling Selection
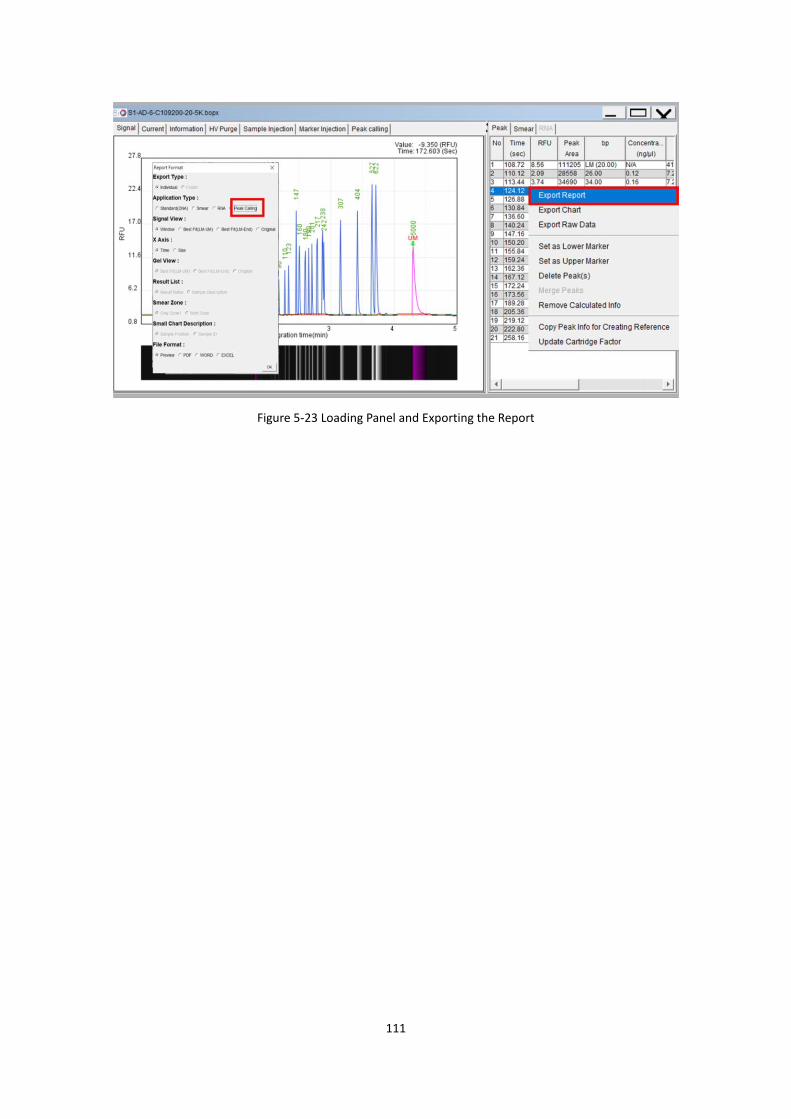
111
Figure 5-23 Loading Panel and Exporting the Report
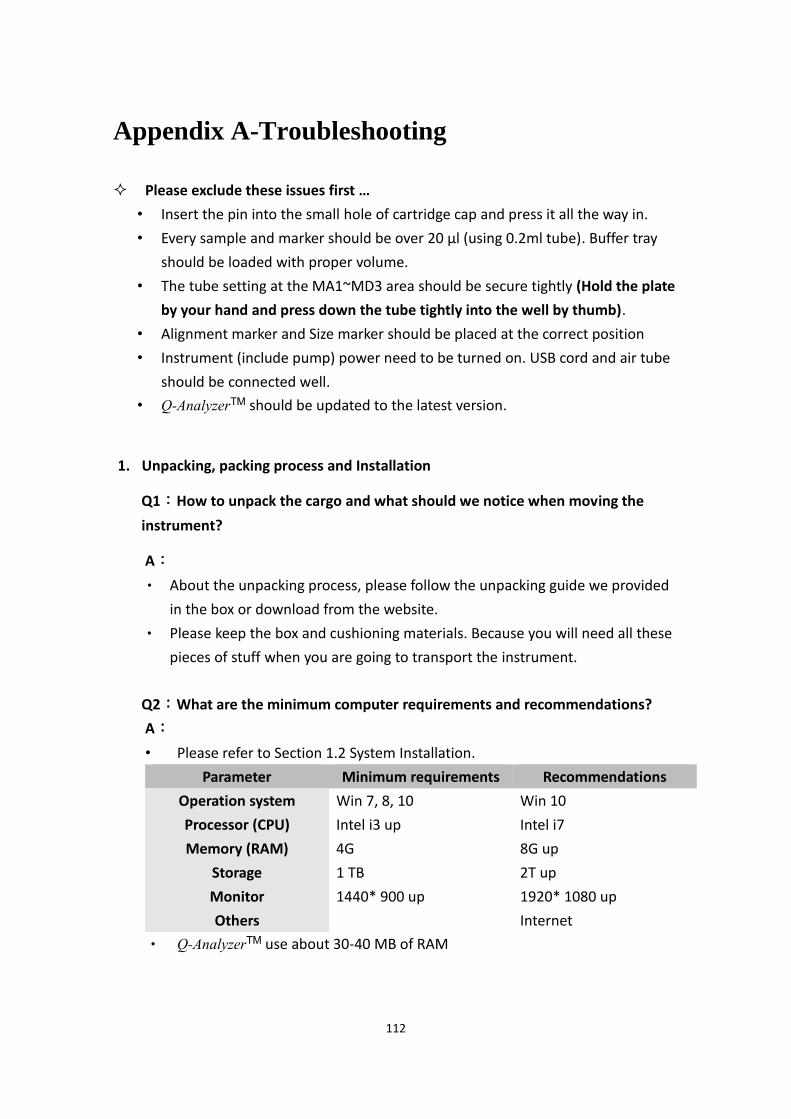
112
Appendix A-Troubleshooting
Please exclude these issues first …
• Insert the pin into the small hole of cartridge cap and press it all the way in.
• Every sample and marker should be over 20 µl (using 0.2ml tube). Buffer tray
should be loaded with proper volume.
• The tube setting at the MA1~MD3 area should be secure tightly (Hold the plate
by your hand and press down the tube tightly into the well by thumb).
• Alignment marker and Size marker should be placed at the correct position
• Instrument (include pump) power need to be turned on. USB cord and air tube
should be connected well.
• Q-AnalyzerTM should be updated to the latest version.
1. Unpacking, packing process and Installation
Q1:How to unpack the cargo and what should we notice when moving the
instrument?
A:
• About the unpacking process, please follow the unpacking guide we provided
in the box or download from the website.
• Please keep the box and cushioning materials. Because you will need all these
pieces of stuff when you are going to transport the instrument.
Q2:What are the minimum computer requirements and recommendations?
A:
• Please refer to Section 1.2 System Installation.
Parameter Minimum requirements Recommendations
Operation system Win 7, 8, 10 Win 10
Processor (aPU) Intel i3 up Intel i7
Memory (RAM) 4G 8G up
Storage 1 TB 2T up
Monitor 1440* 900 up 1920* 1080 up
Others Internet
• Q-AnalyzerTM use about 30-40 MB of RAM
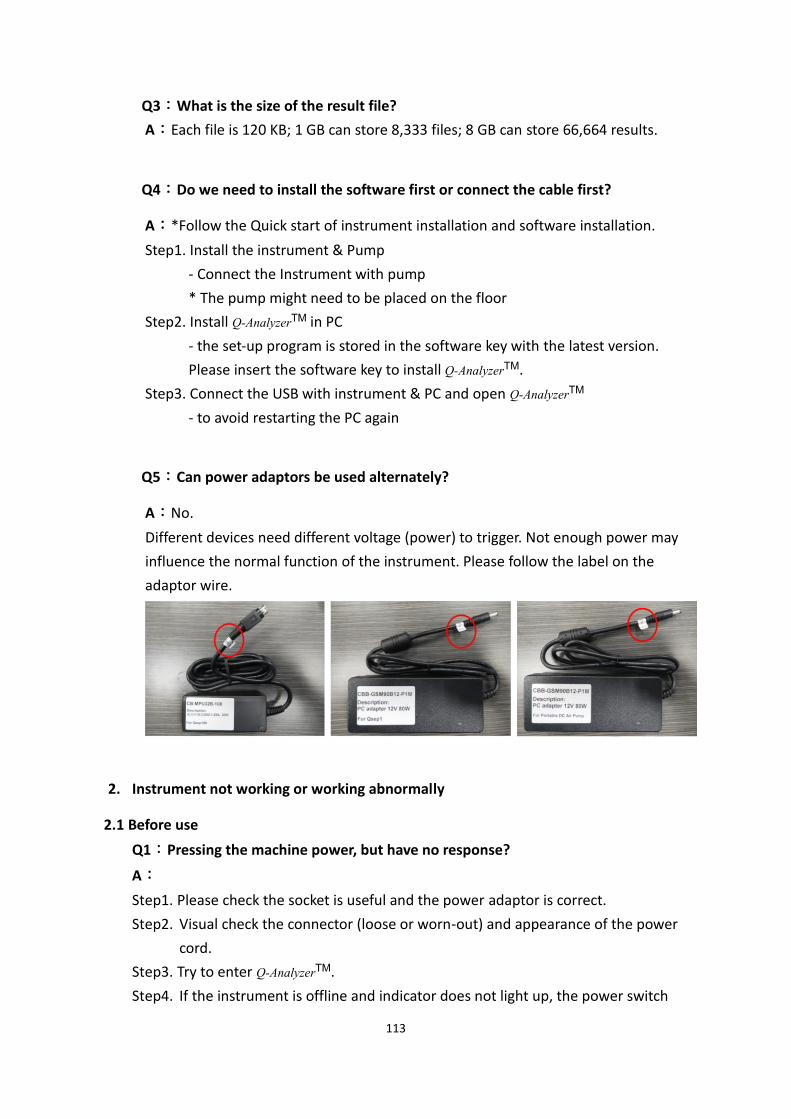
113
Q3:What is the size of the result file?
A:Each file is 120 KB; 1 GB can store 8,333 files; 8 GB can store 66,664 results.
Q4:Do we need to install the software first or connect the cable first?
A:*Follow the Quick start of instrument installation and software installation.
Step1. Install the instrument & Pump
- Connect the Instrument with pump
* The pump might need to be placed on the floor
Step2. Install Q-AnalyzerTM in PC
- the set-up program is stored in the software key with the latest version.
Please insert the software key to install Q-AnalyzerTM.
Step3. Connect the USB with instrument & PC and open Q-AnalyzerTM
- to avoid restarting the PC again
Q5:Can power adaptors be used alternately?
A:No.
Different devices need different voltage (power) to trigger. Not enough power may
influence the normal function of the instrument. Please follow the label on the
adaptor wire.
2. Instrument not working or working abnormally
2.1 Before use
Q1:Pressing the machine power, but have no response?
A:
Step1. Please check the socket is useful and the power adaptor is correct.
Step2. Visual check the connector (loose or worn-out) and appearance of the power
cord.
Step3. Try to enter Q-AnalyzerTM.
Step4. If the instrument is offline and indicator does not light up, the power switch
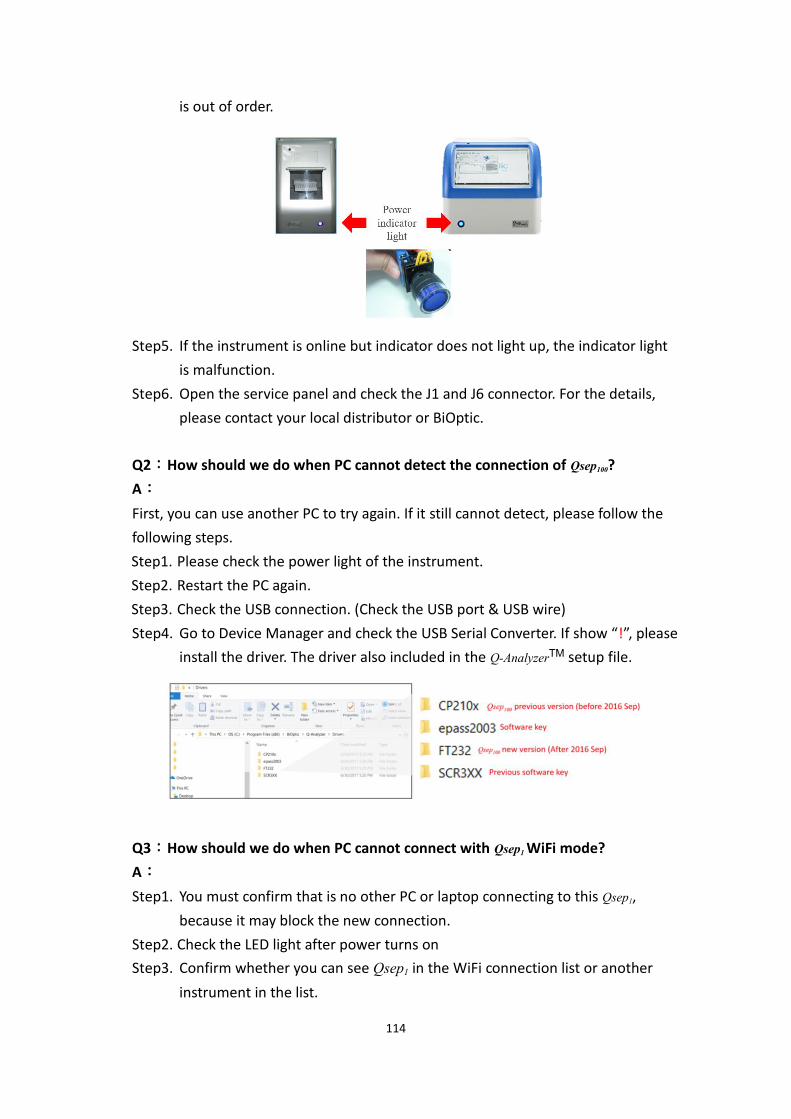
114
is out of order.
Step5. If the instrument is online but indicator does not light up, the indicator light
is malfunction.
Step6. Open the service panel and check the J1 and J6 connector. For the details,
please contact your local distributor or BiOptic.
Q2:How should we do when Pa cannot detect the connection of Qsep100?
A:
First, you can use another PC to try again. If it still cannot detect, please follow the
following steps.
Step1. Please check the power light of the instrument.
Step2. Restart the PC again.
Step3. Check the USB connection. (Check the USB port & USB wire)
Step4. Go to Device Manager and check the USB Serial Converter. If show “!”, please
install the driver. The driver also included in the Q-AnalyzerTM setup file.
Q3:How should we do when Pa cannot connect with Qsep1 WiFi mode?
A:
Step1. You must confirm that is no other PC or laptop connecting to this Qsep1,
because it may block the new connection.
Step2. Check the LED light after power turns on
Step3. Confirm whether you can see Qsep1 in the WiFi connection list or another
instrument in the list.
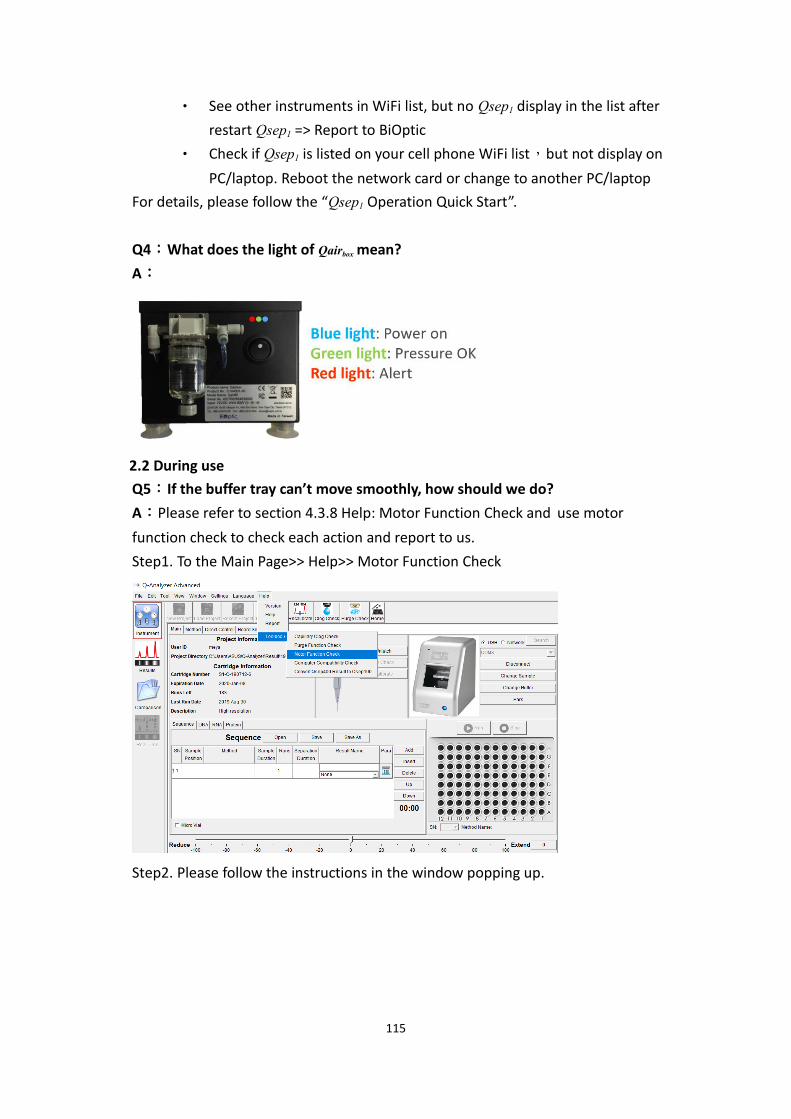
115
• See other instruments in WiFi list, but no Qsep1 display in the list after
restart Qsep1 => Report to BiOptic
• Check if Qsep1 is listed on your cell phone WiFi list,but not display on
PC/laptop. Reboot the network card or change to another PC/laptop
For details, please follow the “Qsep1 Operation Quick Start”.
Q4:What does the light of Qairbox mean?
A:
2.2 During use
Q5:If the buffer tray can’t move smoothly, how should we do?
A:Please refer to section 4.3.8 Help: Motor Function Check and use motor
function check to check each action and report to us.
Step1. To the Main Page>> Help>> Motor Function Check
Step2. Please follow the instructions in the window popping up.
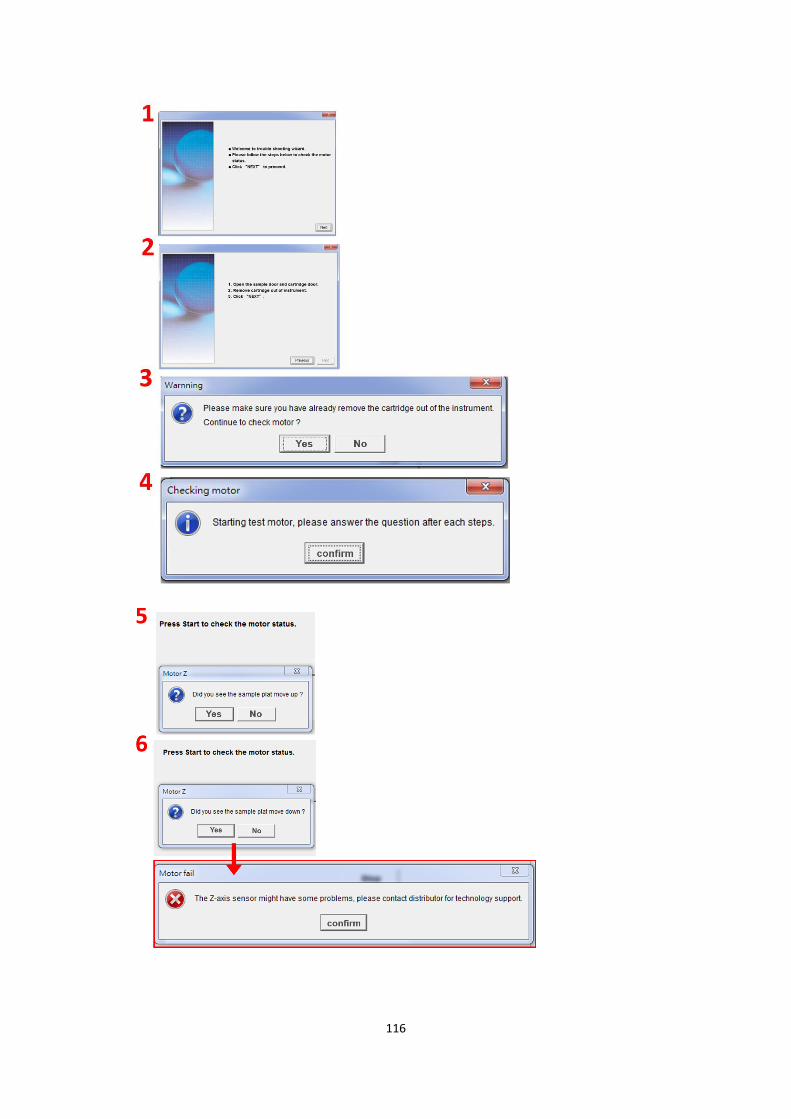
116
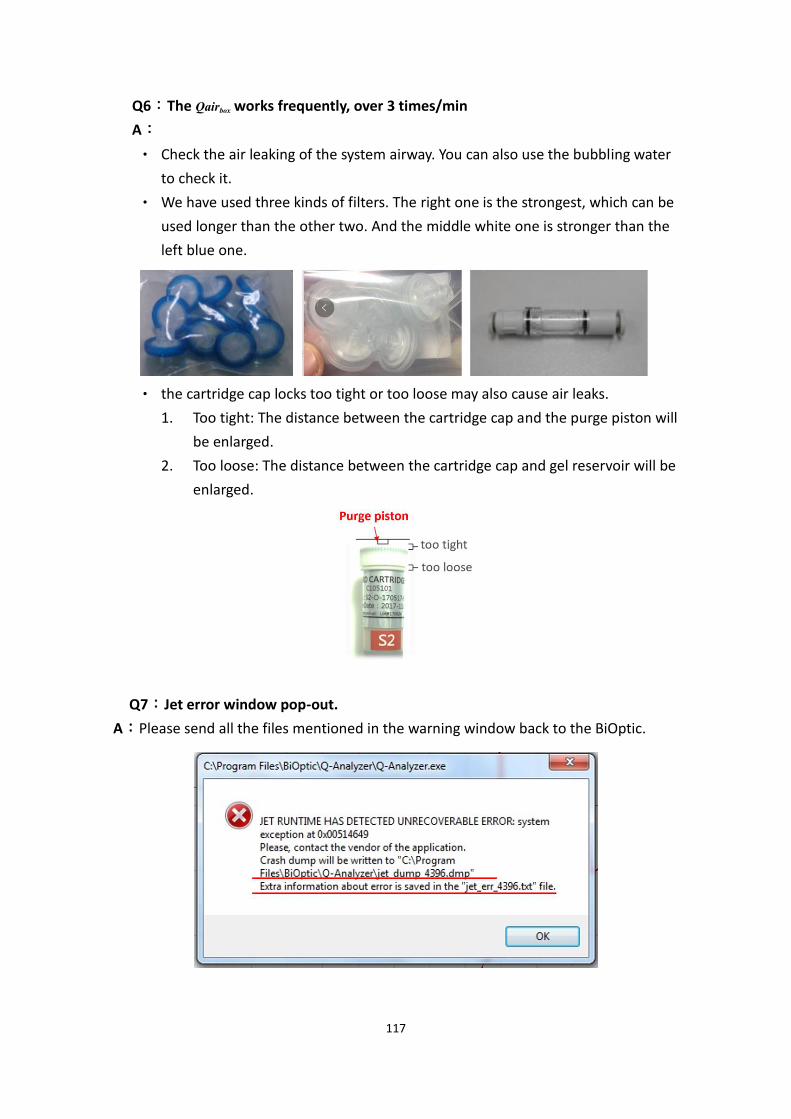
117
Q6:The Qairbox works frequently, over 3 times/min
A:
• Check the air leaking of the system airway. You can also use the bubbling water
to check it.
• We have used three kinds of filters. The right one is the strongest, which can be
used longer than the other two. And the middle white one is stronger than the
left blue one.
• the cartridge cap locks too tight or too loose may also cause air leaks.
1. Too tight: The distance between the cartridge cap and the purge piston will
be enlarged.
2. Too loose: The distance between the cartridge cap and gel reservoir will be
enlarged.
Q7:Jet error window pop-out.
A:Please send all the files mentioned in the warning window back to the BiOptic.
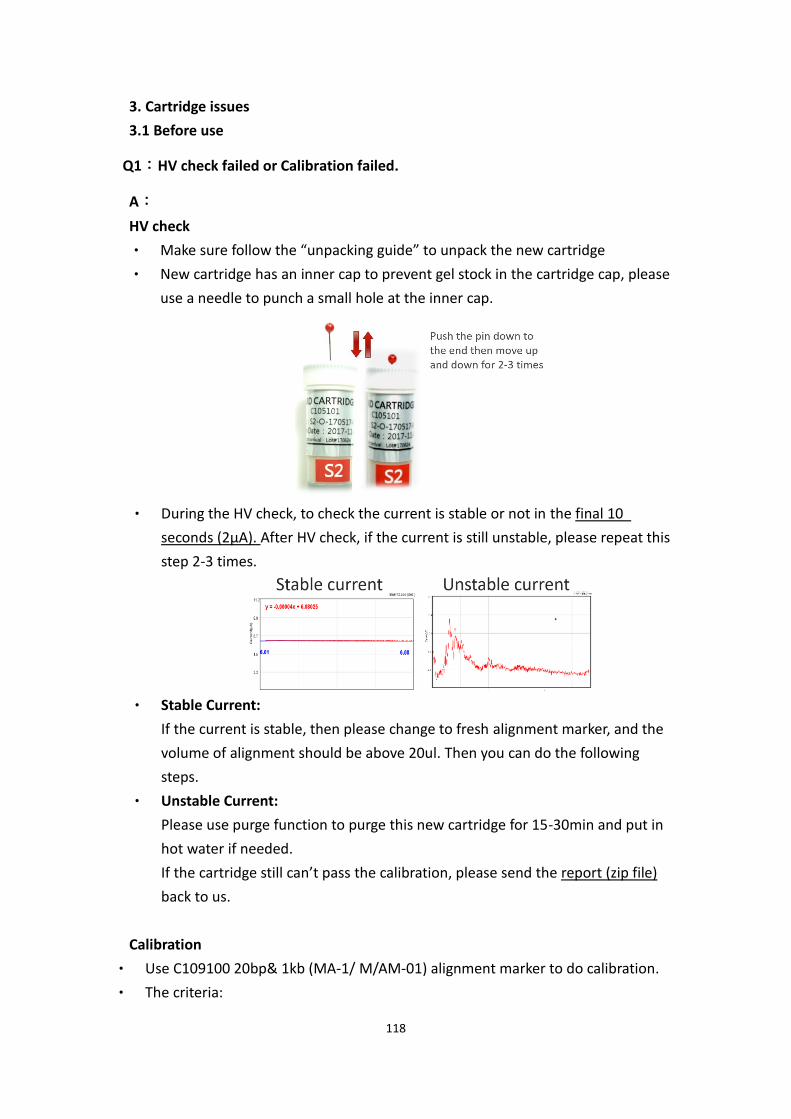
118
3. aartridge issues
3.1 Before use
Q1:HV check failed or Calibration failed.
A:
HV check
• Make sure follow the “unpacking guide” to unpack the new cartridge
• New cartridge has an inner cap to prevent gel stock in the cartridge cap, please
use a needle to punch a small hole at the inner cap.
• During the HV check, to check the current is stable or not in the final 10
seconds (2µA). After HV check, if the current is still unstable, please repeat this
step 2-3 times.
• Stable aurrent:
If the current is stable, then please change to fresh alignment marker, and the
volume of alignment should be above 20ul. Then you can do the following
steps.
• Unstable aurrent:
Please use purge function to purge this new cartridge for 15-30min and put in
hot water if needed.
If the cartridge still can’t pass the calibration, please send the report (zip file)
back to us.
aalibration
• Use C109100 20bp& 1kb (MA-1/ M/AM-01) alignment marker to do calibration.
• The criteria:
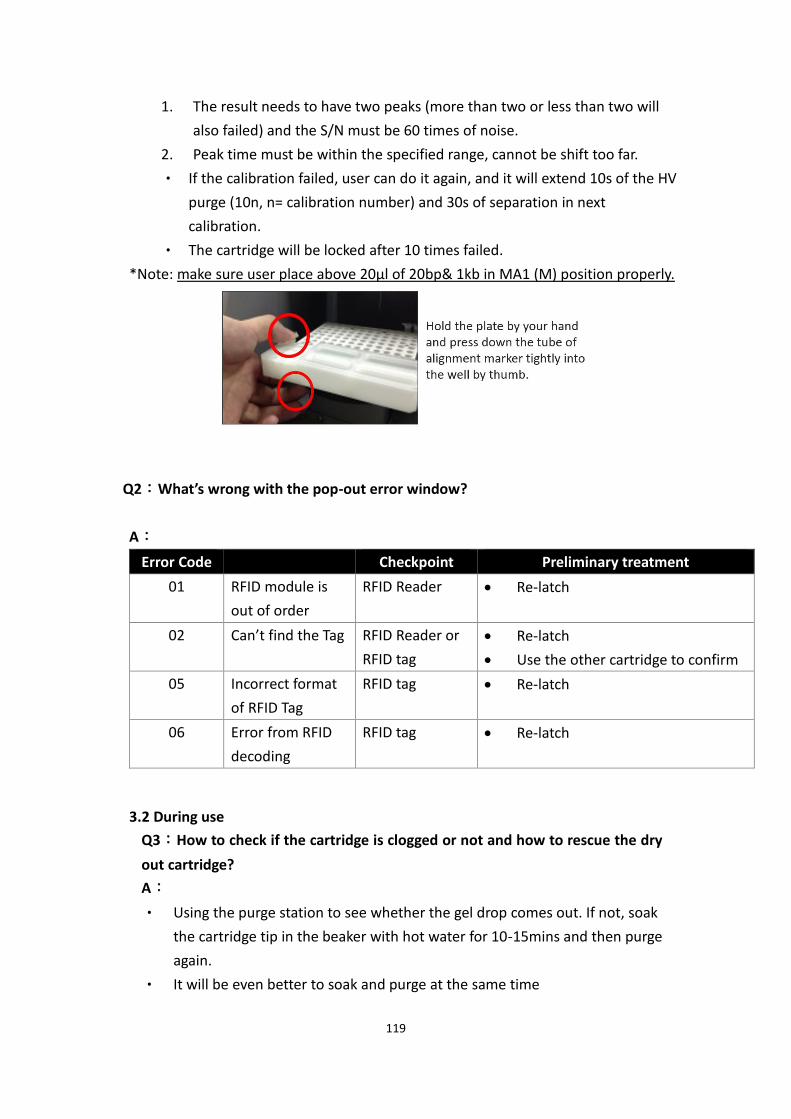
119
1. The result needs to have two peaks (more than two or less than two will
also failed) and the S/N must be 60 times of noise.
2. Peak time must be within the specified range, cannot be shift too far.
• If the calibration failed, user can do it again, and it will extend 10s of the HV
purge (10n, n= calibration number) and 30s of separation in next
calibration.
• The cartridge will be locked after 10 times failed.
*Note: make sure user place above 20µl of 20bp& 1kb in MA1 (M) position properly.
Q2:What’s wrong with the pop-out error window?
A:
Error aode
aheckpoint Preliminary treatment
01 RFID module is
out of order
RFID Reader • Re-latch
02 Can’t find the Tag RFID Reader or
RFID tag
• Re-latch
• Use the other cartridge to confirm
05 Incorrect format
of RFID Tag
RFID tag • Re-latch
06 Error from RFID
decoding
RFID tag • Re-latch
3.2 During use
Q3:How to check if the cartridge is clogged or not and how to rescue the dry
out cartridge?
A:
• Using the purge station to see whether the gel drop comes out. If not, soak
the cartridge tip in the beaker with hot water for 10-15mins and then purge
again.
• It will be even better to soak and purge at the same time
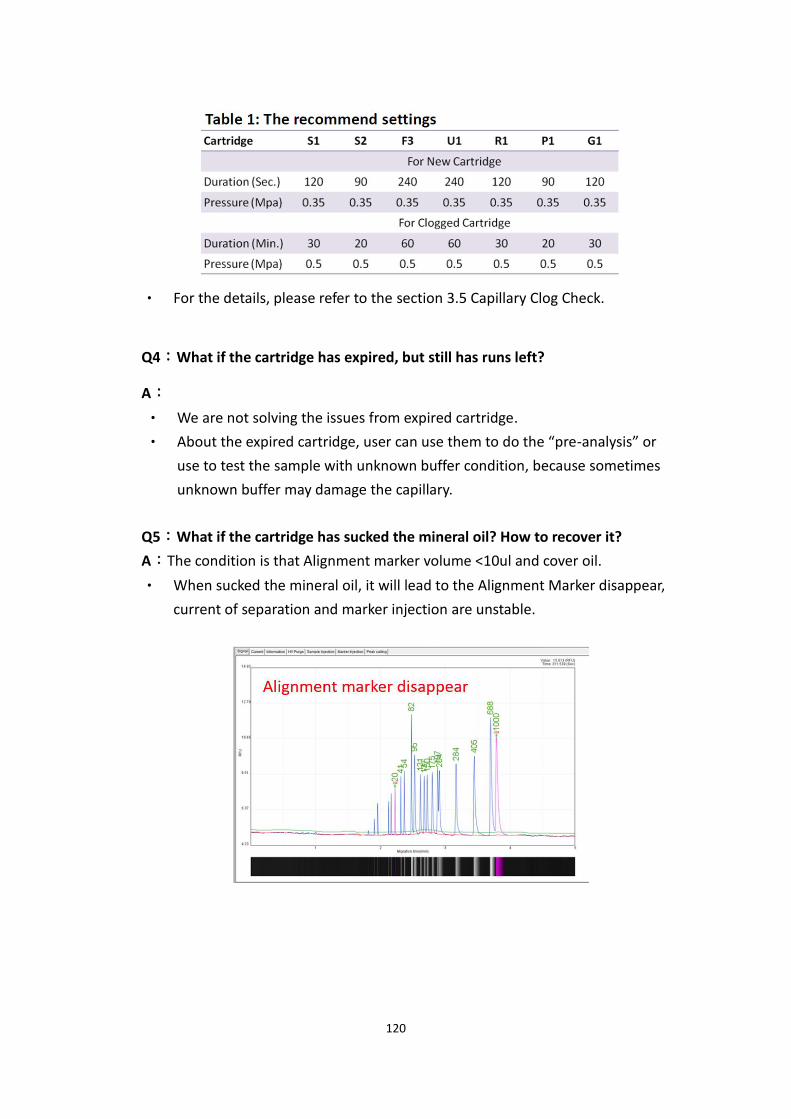
120
• For the details, please refer to the section 3.5 Capillary Clog Check.
Q4:What if the cartridge has expired, but still has runs left?
A:
• We are not solving the issues from expired cartridge.
• About the expired cartridge, user can use them to do the “pre-analysis” or
use to test the sample with unknown buffer condition, because sometimes
unknown buffer may damage the capillary.
Q5:What if the cartridge has sucked the mineral oil? How to recover it?
A:The condition is that Alignment marker volume <10ul and cover oil.
• When sucked the mineral oil, it will lead to the Alignment Marker disappear,
current of separation and marker injection are unstable.
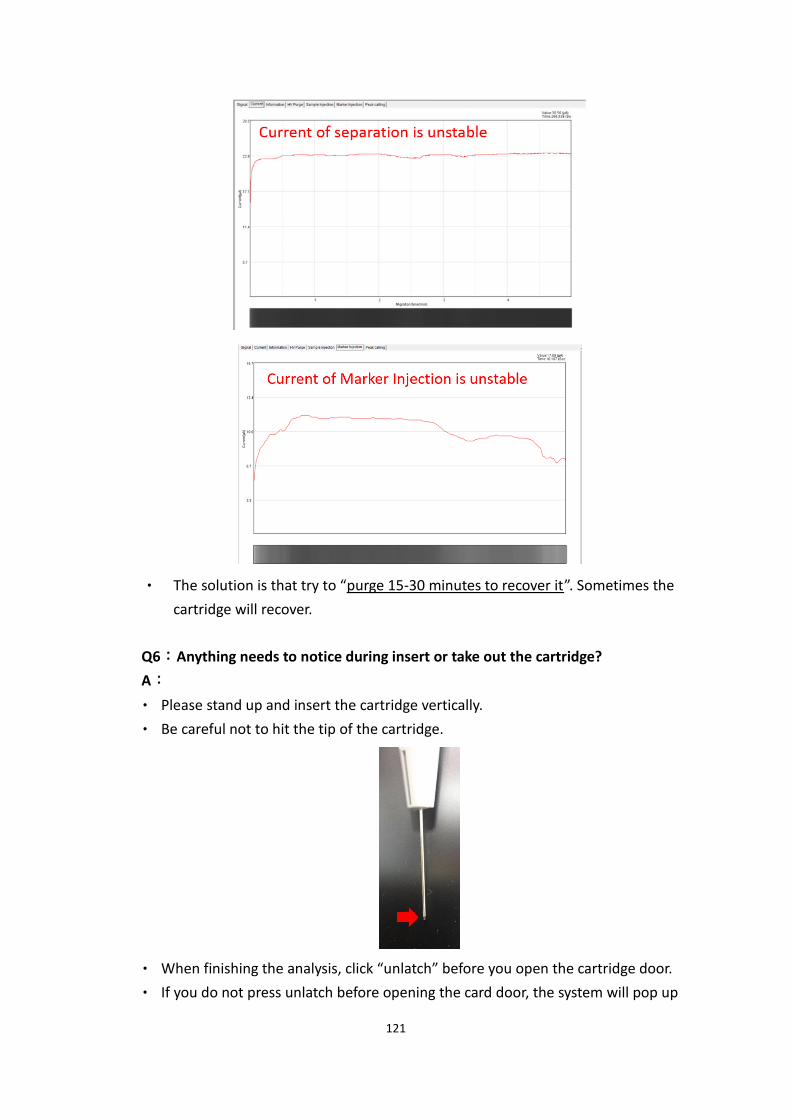
121
• The solution is that try to “purge 15-30 minutes to recover it”. Sometimes the
cartridge will recover.
Q6:Anything needs to notice during insert or take out the cartridge?
A:
• Please stand up and insert the cartridge vertically.
• Be careful not to hit the tip of the cartridge.
• When finishing the analysis, click “unlatch” before you open the cartridge door.
• If you do not press unlatch before opening the card door, the system will pop up
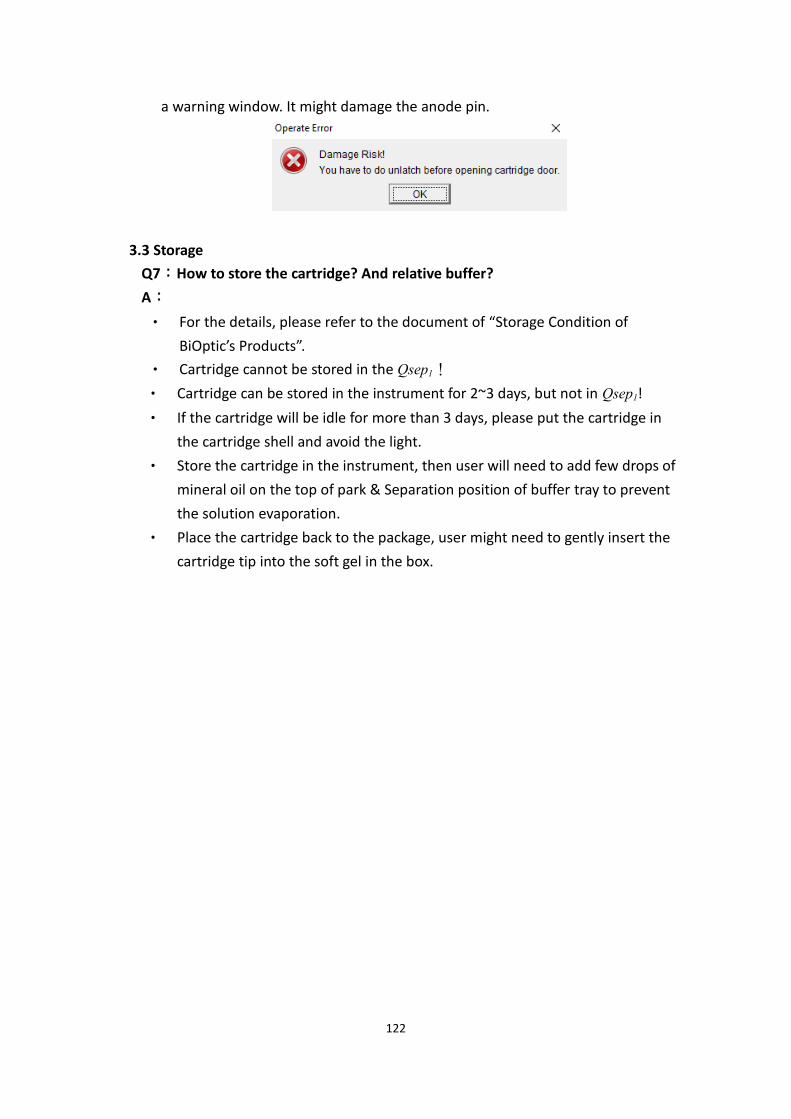
122
a warning window. It might damage the anode pin.
3.3 Storage
Q7:How to store the cartridge? And relative buffer?
A:
• For the details, please refer to the document of “Storage Condition of
BiOptic’s Products”.
• Cartridge cannot be stored in the Qsep1!
• Cartridge can be stored in the instrument for 2~3 days, but not in Qsep1!
• If the cartridge will be idle for more than 3 days, please put the cartridge in
the cartridge shell and avoid the light.
• Store the cartridge in the instrument, then user will need to add few drops of
mineral oil on the top of park & Separation position of buffer tray to prevent
the solution evaporation.
• Place the cartridge back to the package, user might need to gently insert the
cartridge tip into the soft gel in the box.
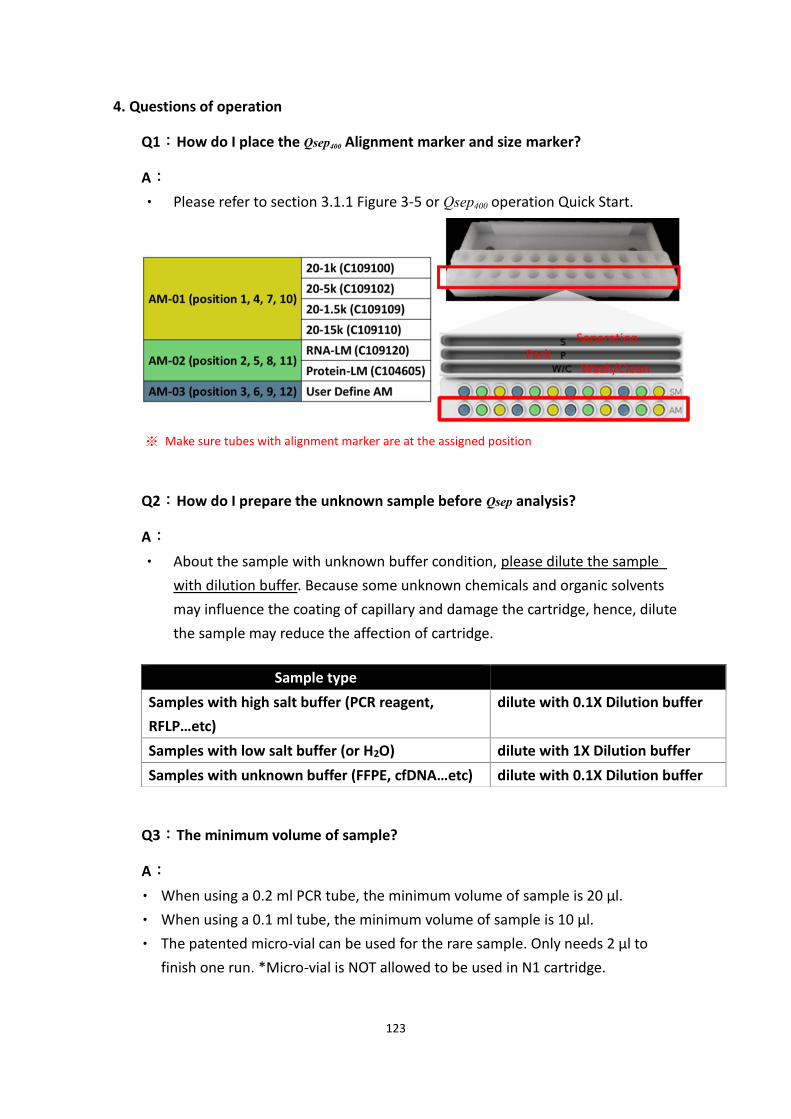
123
4. Questions of operation
Q1:How do I place the Qsep400 Alignment marker and size marker?
A:
• Please refer to section 3.1.1 Figure 3-5 or Qsep400 operation Quick Start.
※ Make sure tubes with alignment marker are at the assigned position
Q2:How do I prepare the unknown sample before Qsep analysis?
A:
• About the sample with unknown buffer condition, please dilute the sample
with dilution buffer. Because some unknown chemicals and organic solvents
may influence the coating of capillary and damage the cartridge, hence, dilute
the sample may reduce the affection of cartridge.
Q3:The minimum volume of sample?
A:
• When using a 0.2 ml PCR tube, the minimum volume of sample is 20 µl.
• When using a 0.1 ml tube, the minimum volume of sample is 10 µl.
• The patented micro-vial can be used for the rare sample. Only needs 2 µl to
finish one run. *Micro-vial is NOT allowed to be used in N1 cartridge.
Sample type
Samples with high salt buffer (PaR reagent,
RFLP…etc)
dilute with 0.1X Dilution buffer
Samples with low salt buffer (or H2O) dilute with 1X Dilution buffer
Samples with unknown buffer (FFPE, cfDNA…etc) dilute with 0.1X Dilution buffer
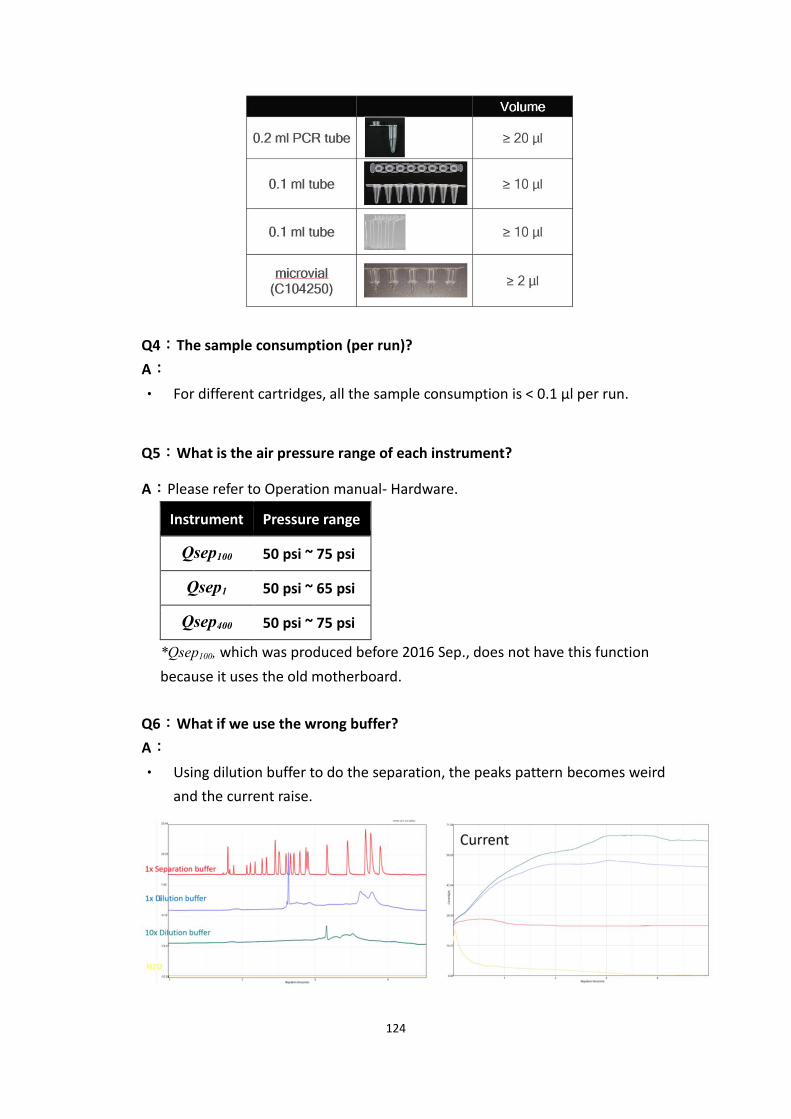
124
Q4:The sample consumption (per run)?
A:
• For different cartridges, all the sample consumption is < 0.1 µl per run.
Q5:What is the air pressure range of each instrument?
A:Please refer to Operation manual- Hardware.
Instrument Pressure range
Qsep100 50 psi ~ 75 psi
Qsep1 50 psi ~ 65 psi
Qsep400 50 psi ~ 75 psi
*Qsep100, which was produced before 2016 Sep., does not have this function
because it uses the old motherboard.
Q6:What if we use the wrong buffer?
A:
• Using dilution buffer to do the separation, the peaks pattern becomes weird
and the current raise.
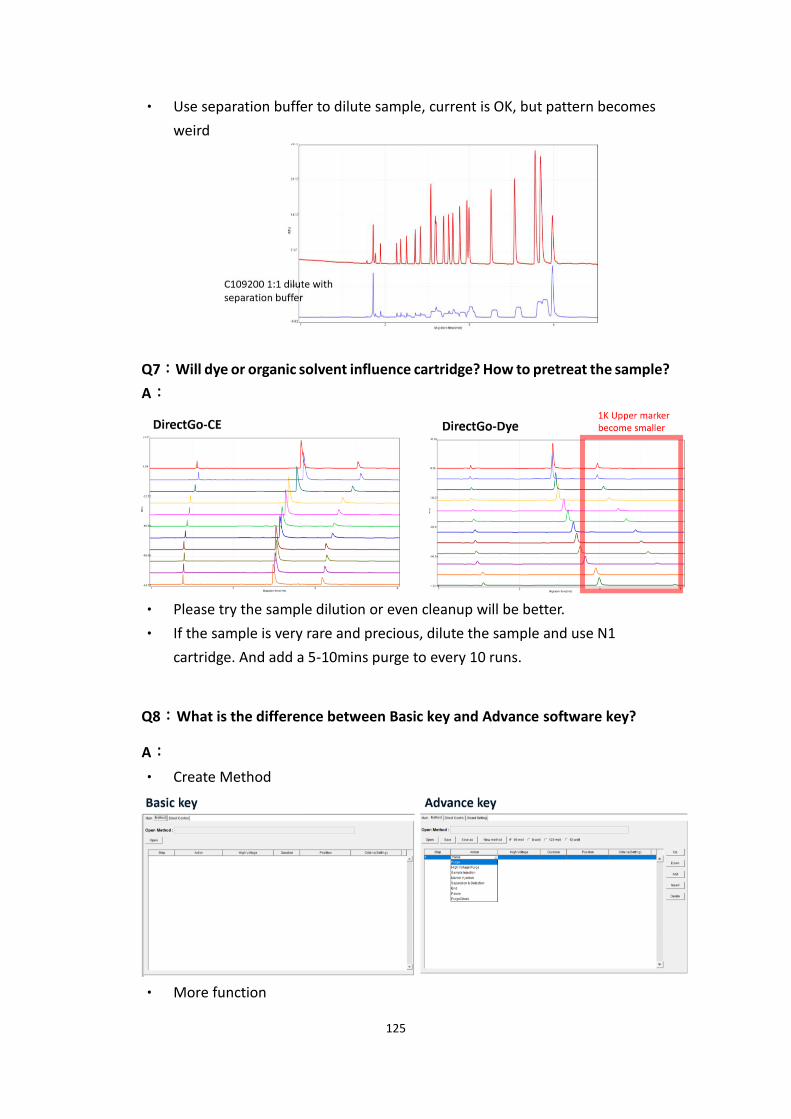
125
• Use separation buffer to dilute sample, current is OK, but pattern becomes
weird
Q7:Will dye or organic solvent influence cartridge? How to pretreat the sample?
A:
• Please try the sample dilution or even cleanup will be better.
• If the sample is very rare and precious, dilute the sample and use N1
cartridge. And add a 5-10mins purge to every 10 runs.
Q8:What is the difference between Basic key and Advance software key?
A:
• Create Method
• More function
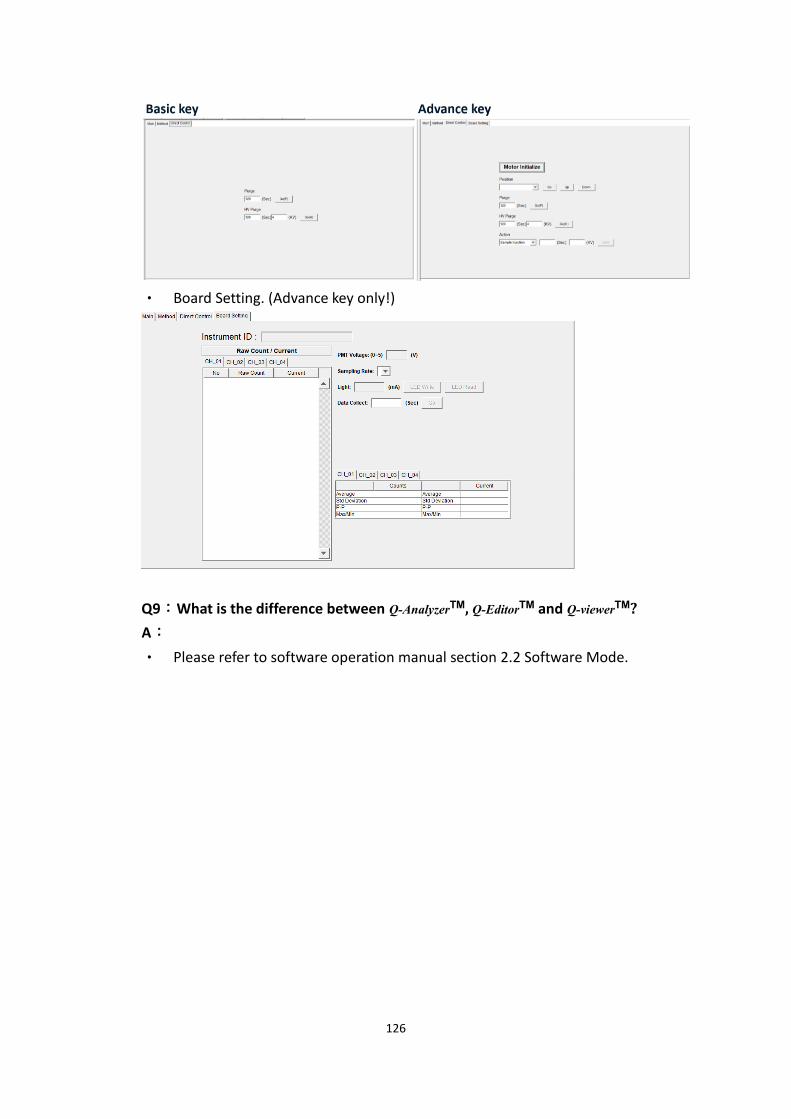
126
• Board Setting. (Advance key only!)
Q9:What is the difference between Q-AnalyzerTM, Q-EditorTM and Q-viewerTM?
A:
• Please refer to software operation manual section 2.2 Software Mode.
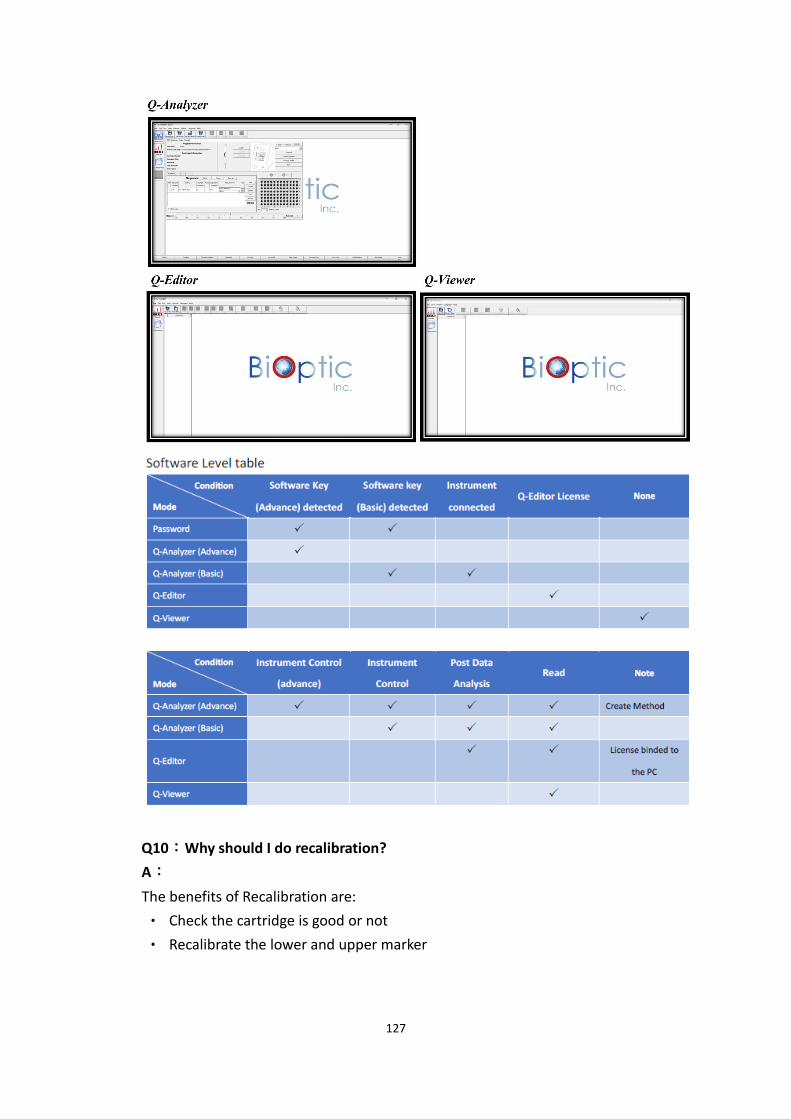
127
Q10:Why should I do recalibration?
A:
The benefits of Recalibration are:
• Check the cartridge is good or not
• Recalibrate the lower and upper marker
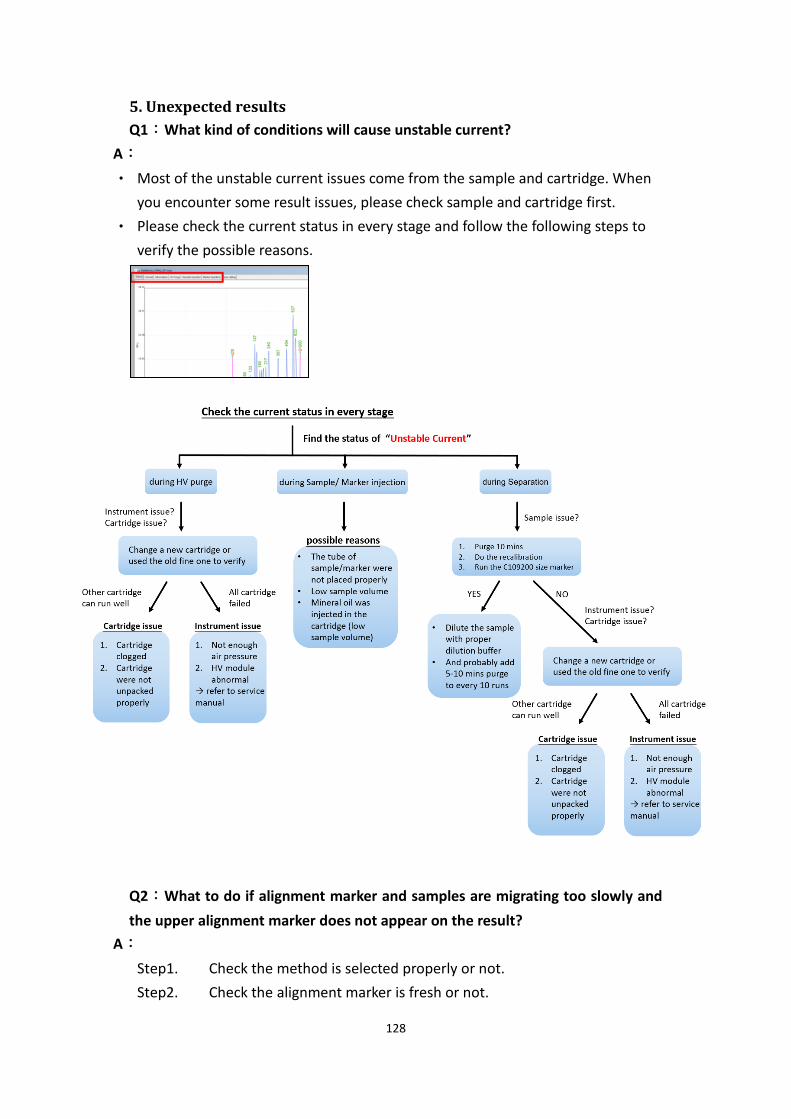
128
5. Unexpected results
Q1:What kind of conditions will cause unstable current?
A:
• Most of the unstable current issues come from the sample and cartridge. When
you encounter some result issues, please check sample and cartridge first.
• Please check the current status in every stage and follow the following steps to
verify the possible reasons.
Q2:What to do if alignment marker and samples are migrating too slowly and
the upper alignment marker does not appear on the result?
A:
Step1. Check the method is selected properly or not.
Step2. Check the alignment marker is fresh or not.
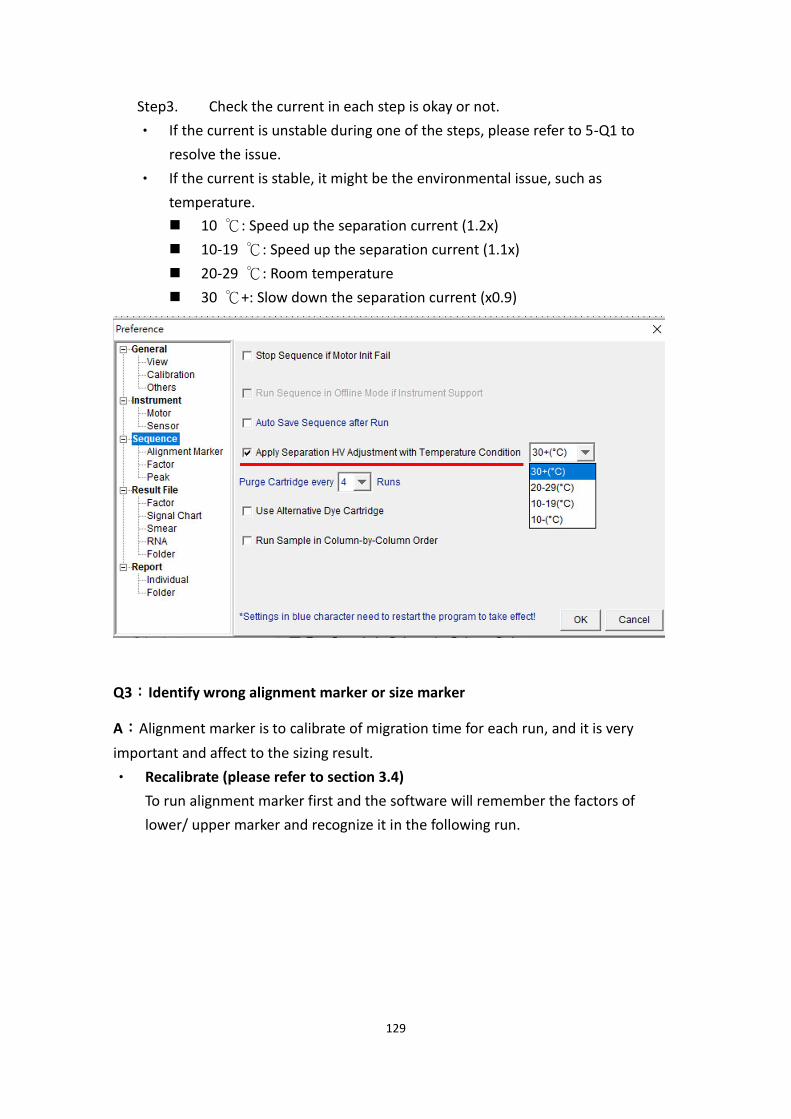
129
Step3. Check the current in each step is okay or not.
• If the current is unstable during one of the steps, please refer to 5-Q1 to
resolve the issue.
• If the current is stable, it might be the environmental issue, such as
temperature.
◼ 10 ℃: Speed up the separation current (1.2x)
◼ 10-19 ℃: Speed up the separation current (1.1x)
◼ 20-29 ℃: Room temperature
◼ 30 ℃+: Slow down the separation current (x0.9)
Q3:Identify wrong alignment marker or size marker
A:Alignment marker is to calibrate of migration time for each run, and it is very
important and affect to the sizing result.
• Recalibrate (please refer to section 3.4)
To run alignment marker first and the software will remember the factors of
lower/ upper marker and recognize it in the following run.
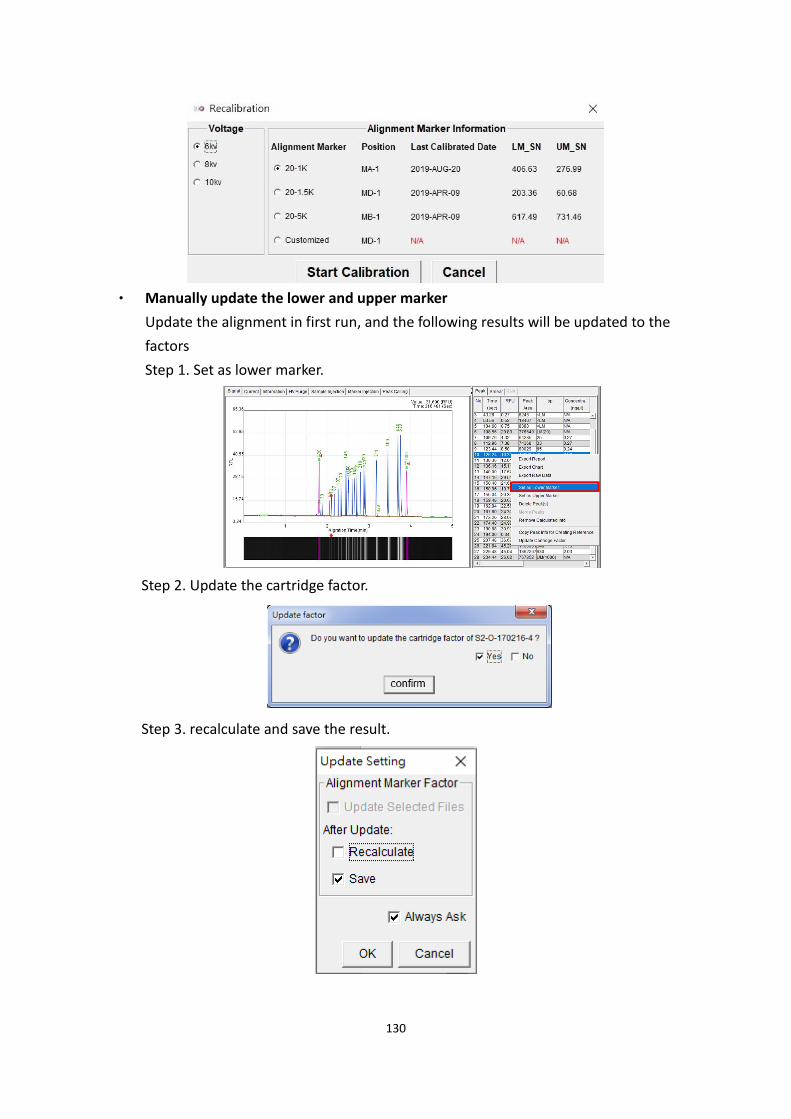
130
• Manually update the lower and upper marker
Update the alignment in first run, and the following results will be updated to the
factors
Step 1. Set as lower marker.
Step 2. Update the cartridge factor.
Step 3. recalculate and save the result.
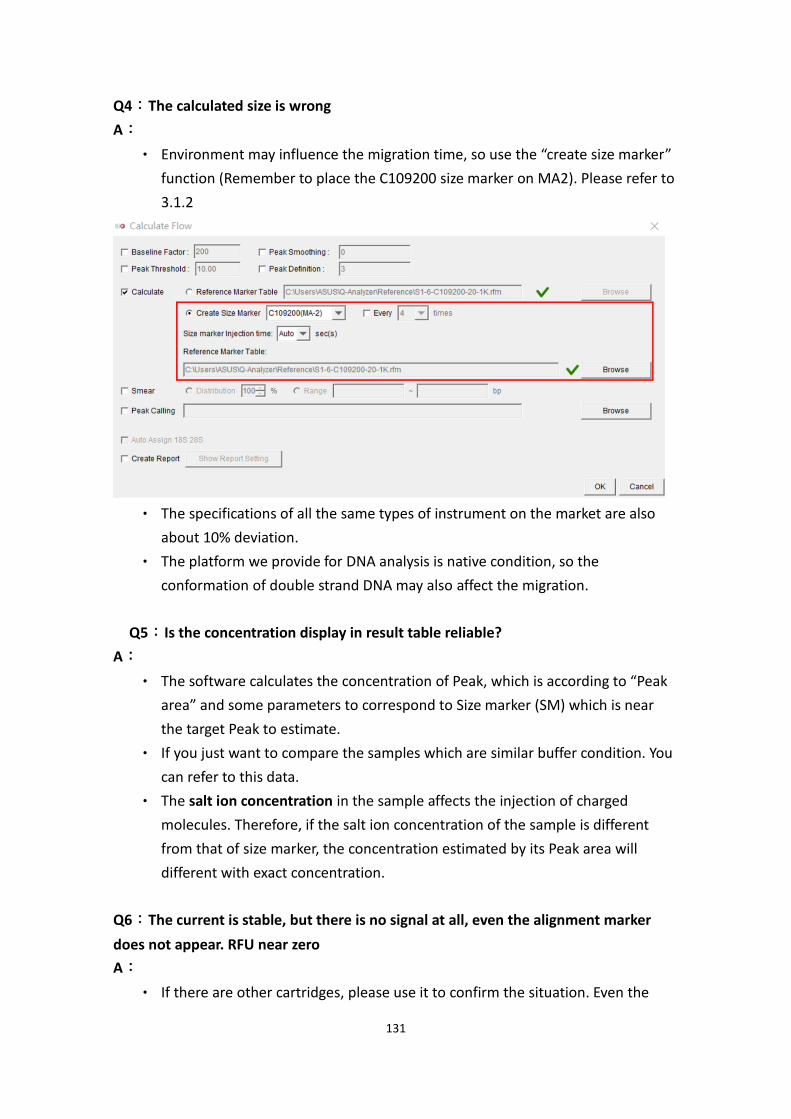
131
Q4:The calculated size is wrong
A:
• Environment may influence the migration time, so use the “create size marker”
function (Remember to place the C109200 size marker on MA2). Please refer to
3.1.2
• The specifications of all the same types of instrument on the market are also
about 10% deviation.
• The platform we provide for DNA analysis is native condition, so the
conformation of double strand DNA may also affect the migration.
Q5:Is the concentration display in result table reliable?
A:
• The software calculates the concentration of Peak, which is according to “Peak
area” and some parameters to correspond to Size marker (SM) which is near
the target Peak to estimate.
• If you just want to compare the samples which are similar buffer condition. You
can refer to this data.
• The salt ion concentration in the sample affects the injection of charged
molecules. Therefore, if the salt ion concentration of the sample is different
from that of size marker, the concentration estimated by its Peak area will
different with exact concentration.
Q6:The current is stable, but there is no signal at all, even the alignment marker
does not appear. RFU near zero
A:
• If there are other cartridges, please use it to confirm the situation. Even the
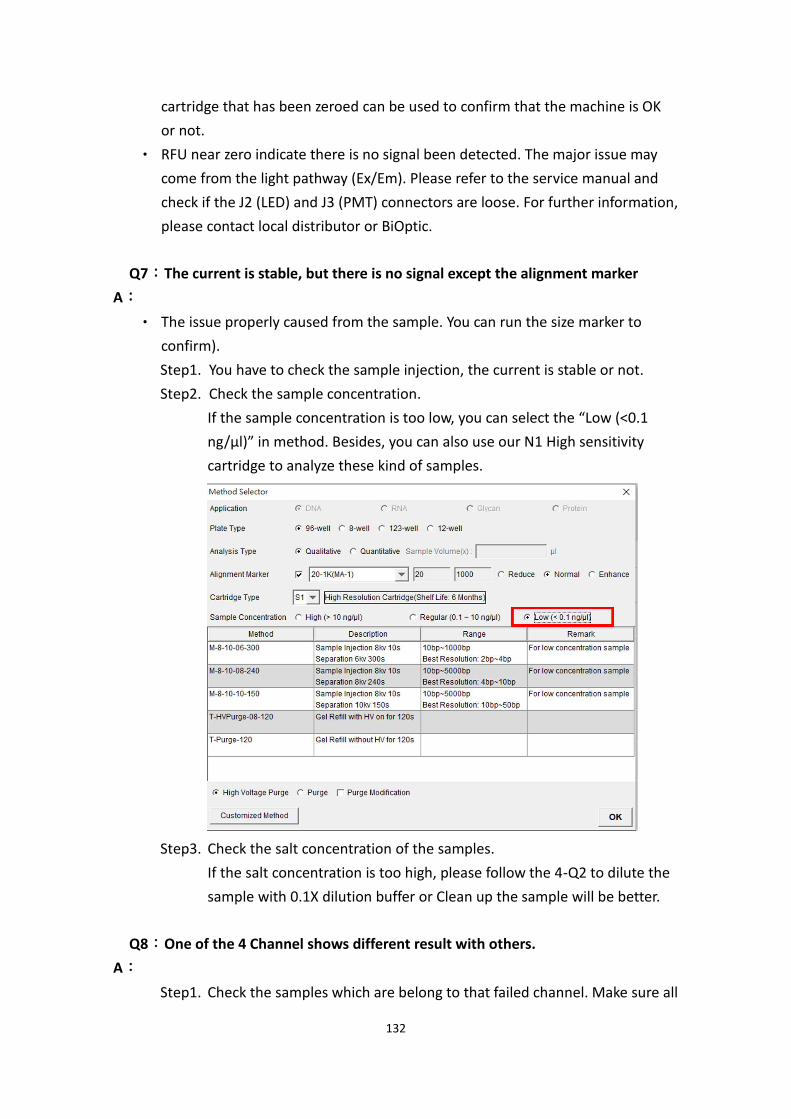
132
cartridge that has been zeroed can be used to confirm that the machine is OK
or not.
• RFU near zero indicate there is no signal been detected. The major issue may
come from the light pathway (Ex/Em). Please refer to the service manual and
check if the J2 (LED) and J3 (PMT) connectors are loose. For further information,
please contact local distributor or BiOptic.
Q7:The current is stable, but there is no signal except the alignment marker
A:
• The issue properly caused from the sample. You can run the size marker to
confirm).
Step1. You have to check the sample injection, the current is stable or not.
Step2. Check the sample concentration.
If the sample concentration is too low, you can select the “Low (<0.1
ng/µl)” in method. Besides, you can also use our N1 High sensitivity
cartridge to analyze these kind of samples.
Step3. Check the salt concentration of the samples.
If the salt concentration is too high, please follow the 4-Q2 to dilute the
sample with 0.1X dilution buffer or Clean up the sample will be better.
Q8:One of the 4 ahannel shows different result with others.
A:
Step1. Check the samples which are belong to that failed channel. Make sure all
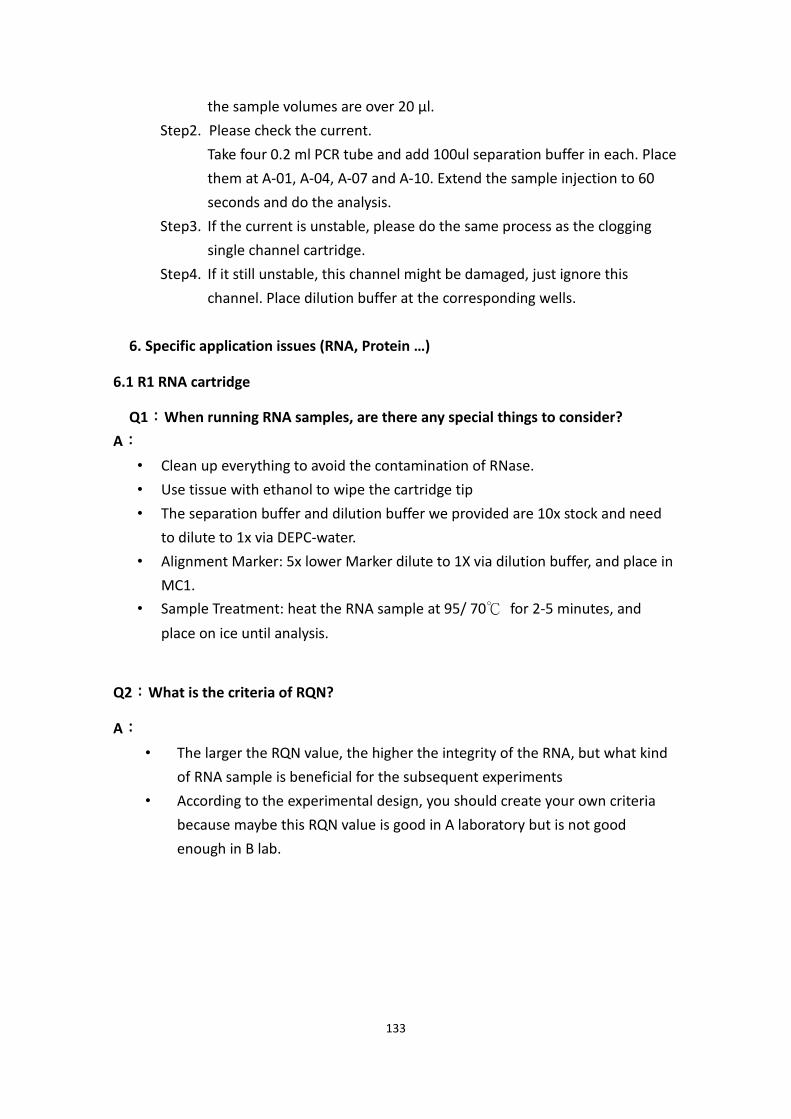
133
the sample volumes are over 20 µl.
Step2. Please check the current.
Take four 0.2 ml PCR tube and add 100ul separation buffer in each. Place
them at A-01, A-04, A-07 and A-10. Extend the sample injection to 60
seconds and do the analysis.
Step3. If the current is unstable, please do the same process as the clogging
single channel cartridge.
Step4. If it still unstable, this channel might be damaged, just ignore this
channel. Place dilution buffer at the corresponding wells.
6. Specific application issues (RNA, Protein …)
6.1 R1 RNA cartridge
Q1:When running RNA samples, are there any special things to consider?
A:
• Clean up everything to avoid the contamination of RNase.
• Use tissue with ethanol to wipe the cartridge tip
• The separation buffer and dilution buffer we provided are 10x stock and need
to dilute to 1x via DEPC-water.
• Alignment Marker: 5x lower Marker dilute to 1X via dilution buffer, and place in
MC1.
• Sample Treatment: heat the RNA sample at 95/ 70℃ for 2-5 minutes, and
place on ice until analysis.
Q2:What is the criteria of RQN?
A:
• The larger the RQN value, the higher the integrity of the RNA, but what kind
of RNA sample is beneficial for the subsequent experiments
• According to the experimental design, you should create your own criteria
because maybe this RQN value is good in A laboratory but is not good
enough in B lab.
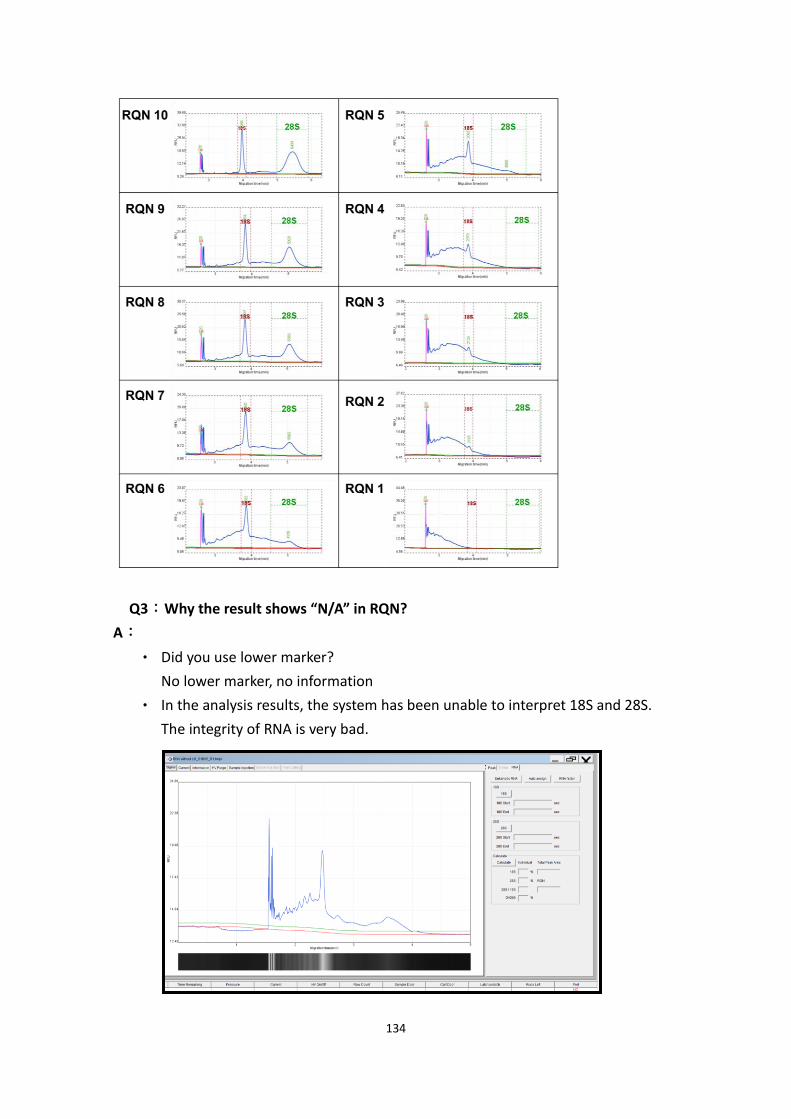
134
Q3:Why the result shows “N/A” in RQN?
A:
• Did you use lower marker?
No lower marker, no information
• In the analysis results, the system has been unable to interpret 18S and 28S.
The integrity of RNA is very bad.
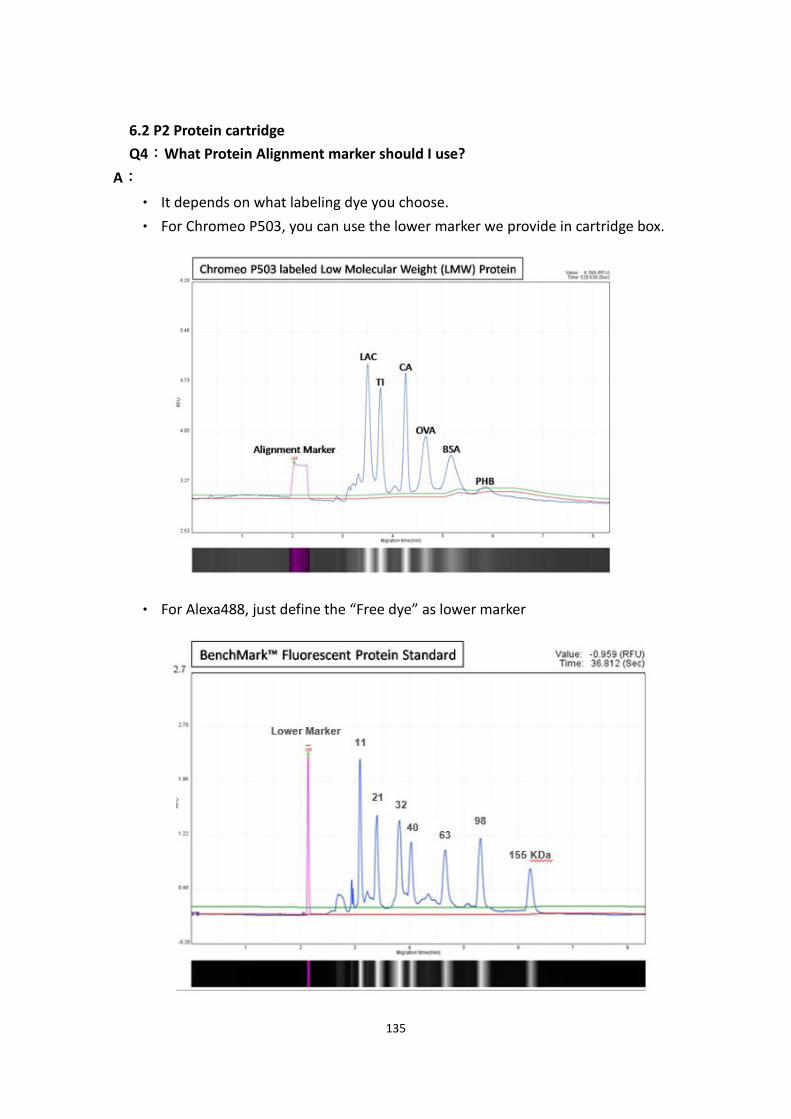
135
6.2 P2 Protein cartridge
Q4:What Protein Alignment marker should I use?
A:
• It depends on what labeling dye you choose.
• For Chromeo P503, you can use the lower marker we provide in cartridge box.
• For Alexa488, just define the “Free dye” as lower marker

136
Q5:Which instrument can I use to analyze protein sample? Or what labeling dye
should I choose?
A:
• Basically, we will choose the protein labeling dye according to the Ex/Em range
of the machine.
• We suggest user using Alexa488 labeling dye and Qsep100 Advance, Qsep100
Advance has better sensitivity and there is commercialize pre-stained ladder
from Thermo Fisher, which can provide better size accuracy.
Q6:How to do the labeling process?
A:
• For the details, please refer to the website to download the latest labeling
protocol.
7. Maintenance
Q1:How often should I change the Marker and Buffer?
A:
For Qsep100 and Qsep400
• Every 96 samples or every 3-5 days
• User need to add few drops of mineral oil to cover the Separation buffer and
10ul oil on Marker
• The buffer tray can be washed and reused
For Qsep1
• Separation buffer need to be changed every 20 runs
• System will also pop out a window to remind user to change the separation
buffer.
Q2:What happens if I don't change the filter for a long time??
A:
• There may be insignificant air leaks.
• Not enough pressure may reduce the replacement efficiency of gel in the
cartridge. Old gel may influence the current and even the analysis result may
have some unpredictable affect.
Q3:How to clean the instrument regularly?
A:
• The outside of Qsep could wipe with dry cloth. No detergent or ethanol, it might
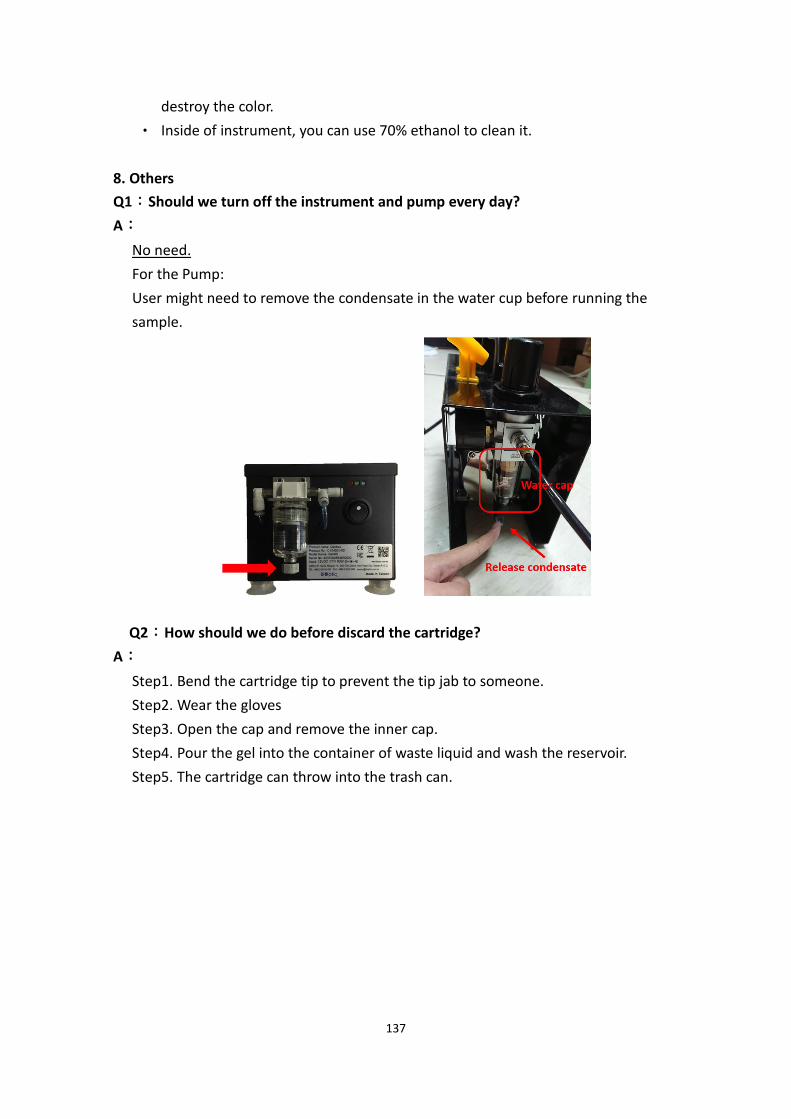
137
destroy the color.
• Inside of instrument, you can use 70% ethanol to clean it.
8. Others
Q1:Should we turn off the instrument and pump every day?
A:
No need.
For the Pump:
User might need to remove the condensate in the water cup before running the
sample.
Q2:How should we do before discard the cartridge?
A:
Step1. Bend the cartridge tip to prevent the tip jab to someone.
Step2. Wear the gloves
Step3. Open the cap and remove the inner cap.
Step4. Pour the gel into the container of waste liquid and wash the reservoir.
Step5. The cartridge can throw into the trash can.
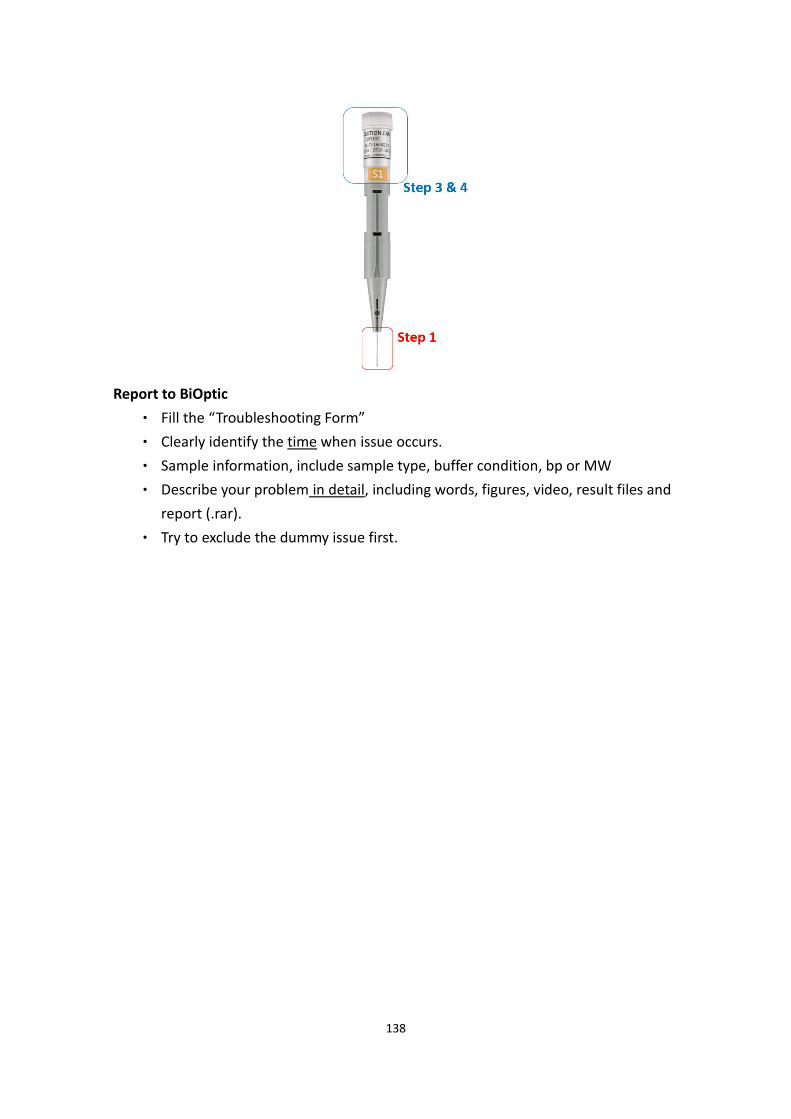
138
Report to BiOptic
• Fill the “Troubleshooting Form”
• Clearly identify the time when issue occurs.
• Sample information, include sample type, buffer condition, bp or MW
• Describe your problem in detail, including words, figures, video, result files and
report (.rar).
• Try to exclude the dummy issue first.