Embed Size (px)
Citation preview
International Journal of Food Properties, 8: 113–123, 2005
Copyright & Taylor & Francis Inc.
ISSN: 1094-2912 print/1532-2386 online
DOI: 10.1081/JFP-200048055
±±±±±±±±±±±±±±±±±±±±±±±±±±±±±±±±±±±±±±±±±±±±±±±±±±±±±±±±±±±±±±±±±±±±±±±±±±±±±±±±±±±±±±±±±±±±±±±±±±±±±±±±±
±±±±±±±±±±±±±±±±±±±±±±±±±±±±±±±±±±±±±±±±±±±±±±±±±±±±±±±±±±±±±±±±±±±±±±±±±±±±±±±±±±±±±±±±±±±±±±±±±±±±±±±±±
±±±±±±±±±±±±±±±±±±±±±±±±±±±±±±±±±±±±±±±±±±±±±±±±±±±±±±±±±±±±±±±±±±±±±±±±±±±±±±±±±±±±±±±±±±±±±±±±±±±±±±±±±
±±±±±±±±±±±±±±±±±±±±±±±±±±±±±±±±±±±±±±±±±±±±±±±±±±±±±±±±±±±±±±±±±±±±±±±±±±±±±±±±±±±±±±±±±±±±±±±±±±±±±±±±±
QUANTIFICATION OF ISOFLAVONES IN SOYMILK ANDTOFU FROM SOUTH EAST ASIA
Molamma P. Prabhakaran, Conrad O. Perera and
Suresh Valiyaveettil
Department of Chemistry, National University of Singapore, Singapore
The concentration and distribution of isoflavones in commonly used soybean foods were
evaluated by high-performance liquid chromatography. The different forms of isoflavone
glucoside esters were converted to their corresponding glucosides by a mild saponification
of the extracts. Isoflavone levels were reported as microgram aglycone equivalents per gram
of soy food. The total isoflavone concentrations in soymilk and tofu ranged from 76 to
199lg/g and 162 to 312lg/g respectively, on a wet weight basis. A comparison of
isoflavone levels in soymilk and tofu, prepared by a standard procedure with the commer-
cially available packaged soymilk and tofu samples were also carried out. Even though
different types of tofu had different isoflavones concentrations, each type had similar values
compared to those produced by the standard procedure.
Keywords: Isoflavones, Tofu, Soymilk, Protein, Aglycone.
INTRODUCTION
Phytoestrogens are naturally occurring phenolic compounds found in severalplant-foods. Though phytoestrogens possess no nutritional properties, they havebeen reported to exhibit biological activity in humans and animals, similar to thatof the natural human hormone estradiol.[1] The main known phytoestrogensare classified into four groups according to their chemical structures, namely,isoflavones, coumestans, resorcyclic acid lactones, and lignans.[1] However, themajor sources of phytoestrogens in human diets are the isoflavones.
Soybeans and soy products are particularly abundant sources of isoflavones.There are three main types of isoflavones in soybeans, and each type exists in fourdifferent chemical forms, which include the aglycons and their b-glucosideconjugates: the glucosides, the acetylglucosides and the malonyl glucosides.[2]
Figure 1 shows the structure of the three parent isoflavones and the respectiveglucosides. There is a growing literature on the health protective effects of soy foods.
Received 18 February 2004; accepted 10 April 2004.Address correspondence to Conrad O. Perera, Department of Chemistry, FST
Programme, National University of Singapore, 3 Science Drive 3, Singapore 117543;E-mail: [email protected]
113

ORDER REPRINTS
Epidemiological studies have suggested that the consumption of soybeans and soyfoods are associated with lowered risks for several types of cancers, including breast,prostate and colon,[3,4] cardiovascular diseases,[5,6] and bone health.[7,8] However,further long-term studies are required to understand their complex mechanisms ofaction. The beneficial effects of isoflavones may be due, but only in part, to the weakestrogenic activity of isoflavones.
Soybeans have long been a staple of the human diet in Asia, especially assoymilk or tofu.[9] Soymilk entered the modern era in the 1950s as it began to bemarketed in bottles, largely due to the work by K. S. Lo of Vitasoy in Hong Kongand Yeo Hiap Seng in Singapore according to the Soyfoods Centre Chronology ofsoymilk worldwide.[10] By 1967, aseptically packed Tetra Pak cartons of soymilkstarted appearing in the market. The first such product was Beanvit, made by YeoHiap Seng Ltd., in Singapore and packaged in a disposable tetrahedron-shapedcontainer. A new wave of technology development occurred since then.
Soymilk and tofu are the most popularly consumed soy food items in SouthEast Asia, China, and Japan. They are commonly served in food courts as well as insupermarkets and the consumption of these products continue to increase, sincepeople are becoming more health conscious. Recently, the FDA (1999) allowed
Figure 1 Chemical structures of parent isoflavones and respective glucosides in soybean.
114 PRABHAKARAN, PERERA AND VALIYAVEETTIL

ORDER REPRINTS
health claims to be declared on product-labels that contained a minimum of 6.25 g of
soy protein per serving.[11] It is this potential claim that further generatedconsiderable interest in soy foods. There are ongoing clinical studies to explore therelationship between soy consumption and reduction in risk of many diseases.[12–14]
It is therefore crucial to determine the qualitative and quantitative composition ofisoflavones in selected soy foods commonly consumed by the multiethnic population
in the region.
MATERIALS AND METHODS
Materials
Soymilk was prepared on a commercial plant scale using a standard procedure.
Commercially available and popular brands of soymilk were selected from themarket and their isoflavone levels were compared with those in soymilk obtained by
the standard procedure. Soft tofu and a firm tofu were also prepared on a plantscale. The soft tofu so prepared was ‘‘silken tofu,’’ while the firm tofu prepared was‘‘taw kwa.’’ The different types of soft tofu commercially available in the market
include ‘‘silken tofu,’’ ‘‘Chinese tofu,’’ and ‘‘organic tofu,’’ which were analyzed andtheir isoflavone levels were compared to those found in the different tofu samples
obtained by the standard procedure. Firm tofu varieties collected for similarcomparative studies were ‘‘taw kwa,’’ deep-fried tofu, and braised tofu. These
products were randomly picked from the main supermarkets in Singapore.
Chemicals
Authentic standards of daidzin, genistin, glycitin, daidzein, genistein, and
glycitein were purchased from LC Laboratories (Woburn, MA, USA). The HPLCgrade solvents were purchased from Sigma Chemical Co. (Jefferson City, MO,
USA). Linear responses were obtained for the six standards and calibration curveswere plotted by using peak areas vs. corresponding phytoestrogens concentration.All solvents used were of HPLC grade.
Plant Scale Preparation of Soymilk and Tofu
Soybeans were soaked in water for 5 h at ambient temperature. Rinsing
followed by grinding of soybean was carried out with a bean to water ratio of 1:5.Further steps involved were cooking, and extraction of soymilk by centrifugal
separation. The raw soymilk thus obtained had an approximate soluble solidscontent of 9�Brix. The product was aseptically packed hot and immediately cooled ina chilling room. This was considered as the standard soymilk prepared for the study.
For the manufacturing of tofu, soymilk with a higher Brix value was prepared.
This was achieved by adjusting the bean to water ratio accordingly. Raw soymilkhaving approximately 11�Brix was made and it was used for the preparation of soft
tofu. This soymilk was aseptically packaged with Glucono-delta-lactone (GDL) andCaSO4 and allowed to coagulate in the package itself to obtain soft tofu. This wasconsidered as the standard soft tofu preparation.
QUANTIFICATION OF ISOFLAVONES IN SOYMILK AND TOFU 115
ORDER REPRINTS
Raw soymilk with approximately 12�Brix was prepared and used for firm tofu
making. This soymilk was coagulated with calcium chloride and excess whey was
removed by application of pressure to obtain a standard firm tofu. The
concentration of isoflavones in the prepared soymilk, soft tofu, and firm tofu were
determined immediately after their preparation.
Extraction of Isoflavones from Soy Foods
The extraction procedure followed the methodolgy of Klump et al.[15] modified
as follows. An amount of test sample that contains approximately 1 g protein was
accurately weighed into a 250mL Erlenmeyer flask with ground-glass stopper. To
this, 40mL of the extraction solvent (80% methanol in water) was added. The flask
with its contents was shaken in a 65�C water bath for 2 h, cooled to room
temperature, and 3mL of 2M NaOH were added. They were stirred well at room
temperature for 10min and 1mL of glacial acetic acid was added. The contents were
swirled and poured into a 50mL volumetric flask, diluted to mark with the
extraction solution and mixed well. The contents were centrifuged for 10min at
5000 rpm. An aliquot of the supernatant was filtered through a 0.45 mmpolytetrafluoroethylene (PTFE) filter unit and analyzed by High Performance
Liquid Chromatography (HPLC). After the extraction of isoflavones from the soy
samples, they were immediately analyzed by HPLC. Storage of the extracted
isoflavones for extended period of time before an analysis was never done. Standard
method of moisture analysis by vacuum oven method[16] was used to determine the
moisture content of all samples.
HPLC Analysis of Isoflavones
The HPLC apparatus was a Waters model 600E with inline degasser, a
Waters 2996 photodiode array detector capable of monitoring UV absorbance from
200 to 350 nm and the Waters ‘‘Empower Software System’’ (Waters Corp., Milford,
MA, USA). Reversed phase HPLC analyses of isoflavones were carried out on
YMC-pack ODS-AM 303 (5 mm, 25 cm� 4.6mm id) column (Waters Corp.,
Milford, MA, USA).A linear HPLC gradient consisting of (A) 0.1% glacial acetic acid in filtered
MilliQ water and (B) 0.1% glacial acetic acid in acetonitrile was used. The injection
volume was 20 mL, and the components were eluted using the following solvent
gradient: from 0 to 5min 10% B and 90% A; from 5 to 50min 10–35% B and
90–65% A; then held at 35% B and 65% A for another 10min and re-equilibrated
back to 10% B and 90% A. The flow rate was 0.8mL/min and the UV detector
wavelength was set at 260 nm. The total run time was 80min including the
equilibration of column. However, this long run time allowed a clean and clear
separation of the six isoflavone conjugates good enough for quantitation. The
identity and purity of isoflavones in the samples were confirmed by matching
the retention times in combination with the mass spectrum analyses (LC-MS) of
the standards.
116 PRABHAKARAN, PERERA AND VALIYAVEETTIL

ORDER REPRINTS
Protein Assay
The protein contents of soy foods were determined by the BioRad assay.[17]
This was carried out in order to establish a correlation between the isoflavone
concentration and protein content of the samples. A calibration curve was preparedby using a series of standard solution of bovine serum albumin. Absorbance was
measured at 595 nm. The protein concentrations of samples were determined bycomparison with the calibration curve.
Calculation of Isoflavone Levels in Soy Foods
The concentration of isoflavone glucosides daidzin, glycitin, and genistin wereconverted to aglycon equivalents using the following equation:
Cae ¼ ½MWa=MWg� � Cg
where Cae¼ isoflavone aglycon equivalents (mg/g); MWa¼molecular weight ofaglycon; MWg¼molecular weight of glucoside; and Cg¼ concentration of daidzin,
glycitin, and genistin (mg/g). The total isoflavones in microgram aglycon equivalents/g of sample was calculated, by summing the concentrations of daidzein, glycitein and
genistein, and adding this total to the sum of aglycon equivalent concentrations ofdaidzin, glycitin, and genistin.
T1 ¼ CaðdaidzeinÞ þ CaðglyciteinÞ þ CaðgenisteinÞ
T2 ¼ CaeðdaidzinÞ þ CaeðglycitinÞ þ CaeðgenistinÞ
where T1¼ sum of the concentrations of aglycons, and T2¼ sum of the aglycon
equivalent concentrations of glucosides. Thus total isoflavones were expressed asmicrogram aglycon equivalents per gram of sample¼T1þT2.
Statistical Analysis
Pearson’s correlation coefficient (r) between the protein content and the
isoflavone concentrations in soymilk samples are calculated using SPSS version 12.0
(SPSS Inc., Chicago, USA). The correlations output from SPPS software obtainedfor soymilk samples are shown in Table 4. The value of r usually ranges from�1.00
toþ1.00. High positive correlation is obtained if r is closer toþ1.00, which is wellobserved in this case. The Pearson’s correlation strongly supported the research
hypothesis that there is a significant positive relationship (r¼ 0.984) between theprotein content and isoflavone concentration in soymilk samples. In a similar way,
the correlation coefficient between the protein content and isoflavone concentrationsin tofu samples were calculated (r¼ 0.942). However, braised tofu and deep-fried
tofu were exempted during this calculation due to the addition of nonsoycomponents into them.
QUANTIFICATION OF ISOFLAVONES IN SOYMILK AND TOFU 117

ORDER REPRINTS
RESULTS AND DISCUSSION
Soymilk is a colloidal solution that is obtained as a water extract from swelledand ground soybeans. It is popular among the Chinese people as a breakfast drink.The soymilks commercially available in Singapore were either imported fromAustralia and Malaysia or were manufactured locally. The typical HPLCchromatogram obtained for the soy samples is shown in Fig. 2. No publishedreports are available on the isoflavone content of Singapore soy foods apart from theone reported by Franke et al.[13] They did a comparative study on the isoflavonelevels in raw and cooked forms of ‘‘taw kwa,’’ raw tofu, fried ‘‘taw kwa,’’ driedsoybean curd sticks, and soybean. Cooking was carried out for 5min for all these soyfoods except for soybean (10min). Since there are many different types of tofu andtheir methods of preparation are different, the results they reported were a littleconfusing. For example, raw ‘‘taw kwa’’ and raw tofu showed nearly an equalamount of isoflavones (297 mg/g) in their study. However, it was not understood,how raw ‘‘taw kwa’’ differed from raw tofu and why both showed an equal amountof isoflavones. In general, cooked products showed lesser isoflavone levels than theraw products probably because of the leaching of isoflavones into the water. Thoughthe authors compared the isoflavone levels between the same food groups fromSingapore and Hawaii, they found no consistent results. In our study, wedifferentiated between the soft and firm tofu types available in the market andfurther determined the isoflavone concentrations in them. We prepared different soyfoods like soymilk, soft tofu, and firm tofu on a commercial plant scale by astandard procedure. Isoflavone levels in soy foods prepared by standard procedurewere compared with those in commercially available and branded soy foods of thesame group. We believe our study reduces the confusion between different types oftofu and enabled the comparison of their isoflavone levels with the same food groupsprepared by a standardized procedure.
The mean isoflavone concentration levels on a wet weight basis in soymilk, softtofu, and firm tofu prepared by the standard method, were 126.29, 167.13, and
Figure 2 Reversed-phase HPLC chromatogram of the six isoflavones in soy samples.
118 PRABHAKARAN, PERERA AND VALIYAVEETTIL

ORDER REPRINTS
241.35 mg/g respectively (Table 1). The isoflavone concentration in soybeans used for
the preparation of soy foods was 1467.23 mg/g on a dry weight basis. The isoflavone
concentration in soymilks collected from supermarkets varied between 76 and
199 mg/g, on a wet weight basis (Table 2). Among the different brands of soymilk
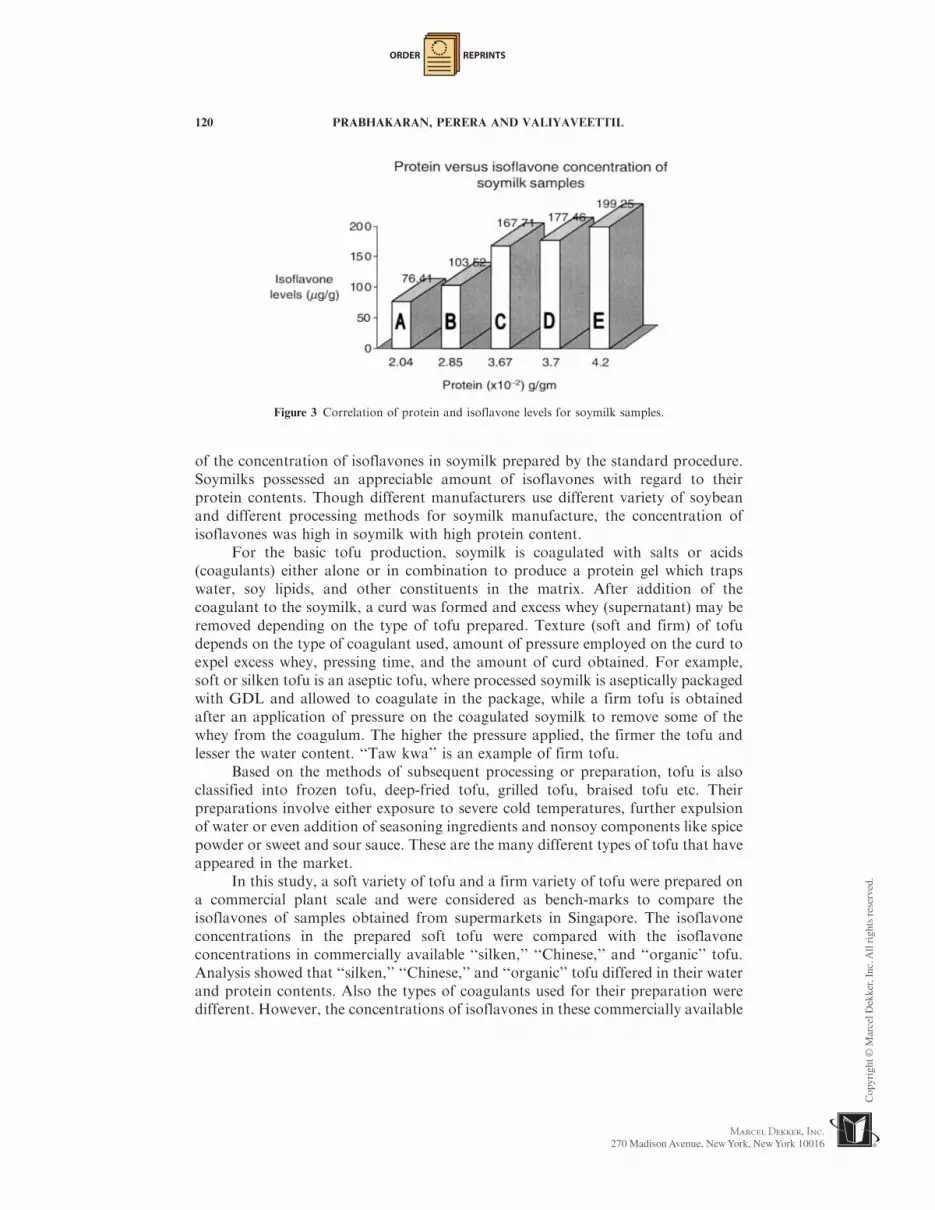
analyzed, Brand E contained the highest amounts of isoflavones and Brand A had
the lowest. Within the soymilk group, a higher isoflavone concentration was found
in soymilks containing higher protein levels than those with lesser protein levels
(Fig. 3). Such trends were also noted by other workers.[12,18–20] The concentration of
isoflavones in commercially available branded soymilks were comparable with those
Table 2 Total isoflavone data (on wet weight basis) reported as microgram aglycon equivalents per gram
of sample for the commercially available soymilks
Milk
type
Moisture
(%�SDb)
Proteina
(%)
Daidzein
(mg/gm)
Glycitein
(mg/gm)
Genistein
(mg/gm)
Total
aglycons� SDb
Brand A 96.0� 0.01 2.048 6.857 1.112 4.867 12.836� 0.17
Brand B 90.6� 0.01 2.858 3.635 0.117 1.717 5.469� 0.71
Brand C 85.2� 0.01 3.675 4.090 0.360 3.740 8.190� 0.04
Brand D 82.6� 0.01 3.700 1.327 0.092 0.957 2.377� 0.19
Brand E 86.2� 0.01 4.200 12.357 0.775 7.402 20.535� 0.08
Milk
type
Daidzin
(mg/gm)
Glycitin
(mg/gm)
Genistin
(mg/gm)
Glucosides in
aglycon-equivalents� SDbTotal
isoflavones� SDb
Brand A 44.23 8.41 49.92 63.58� 0.11 76.41� 0.28
Brand B 69.77 11.58 76.88 98.05� 1.54 103.52� 0.83
Brand C 102.56 11.56 143.18 159.52� 1.63 167.71� 1.60
Brand D 115.07 24.81 142.37 175.09� 1.17 177.46� 0.97
Brand E 136.72 11.95 140.12 178.72� 0.91 199.25� 0.99
aProtein calculated from the BioRad protein assay.bSD is standard deviation and all values are the mean of four replicates.
Table 1 Total isoflavone data (on wet weight basis) reported as microgram aglycon equivalents per gram
of sample for soymilk, soft tofu, and firm tofu prepared by standard procedure
Soy
product
Moisture
(%�SDb)
Proteina
(%)
Daidzein
(mg/gm)
Glycitein
(mg/gm)
Genistein
(mg/gm)
Total
aglycons� SDb
Soymilk 86.4� 0.01 3.30 2.746 2.170 1.771 6.687� 0.118
Soft tofu 89.8� 0.01 6.10 3.443 4.133 2.070 9.646� 0.183
Firm tofu 79.2� 0.01 10.05 7.306 4.153 4.916 16.376� 0.045
Milk
type
Daidzin
(mg/gm)
Glycitin
(mg/gm)
Genistin
(mg/gm)
Glucosides in
aglycon-equivalents�SDbTotal
isoflavones� SDb
Soymilk 84.14 9.84 99.08 119.60� 1.73 126.287� 1.70
Soft tofu 111.71 12.84 129.67 157.48� 0.340 167.13� 0.456
Firm tofu 147.80 17.34 197.78 224.97� 1.09 241.34� 1.05
aProtein calculated from the BioRad protein assay.bSD is standard deviation and all values are the mean of 6 replicates from two plant trials of the
respective soy food making.
QUANTIFICATION OF ISOFLAVONES IN SOYMILK AND TOFU 119
ORDER REPRINTS
of the concentration of isoflavones in soymilk prepared by the standard procedure.Soymilks possessed an appreciable amount of isoflavones with regard to theirprotein contents. Though different manufacturers use different variety of soybeanand different processing methods for soymilk manufacture, the concentration ofisoflavones was high in soymilk with high protein content.
For the basic tofu production, soymilk is coagulated with salts or acids(coagulants) either alone or in combination to produce a protein gel which trapswater, soy lipids, and other constituents in the matrix. After addition of thecoagulant to the soymilk, a curd was formed and excess whey (supernatant) may beremoved depending on the type of tofu prepared. Texture (soft and firm) of tofudepends on the type of coagulant used, amount of pressure employed on the curd toexpel excess whey, pressing time, and the amount of curd obtained. For example,soft or silken tofu is an aseptic tofu, where processed soymilk is aseptically packagedwith GDL and allowed to coagulate in the package, while a firm tofu is obtainedafter an application of pressure on the coagulated soymilk to remove some of thewhey from the coagulum. The higher the pressure applied, the firmer the tofu andlesser the water content. ‘‘Taw kwa’’ is an example of firm tofu.
Based on the methods of subsequent processing or preparation, tofu is alsoclassified into frozen tofu, deep-fried tofu, grilled tofu, braised tofu etc. Theirpreparations involve either exposure to severe cold temperatures, further expulsionof water or even addition of seasoning ingredients and nonsoy components like spicepowder or sweet and sour sauce. These are the many different types of tofu that haveappeared in the market.
In this study, a soft variety of tofu and a firm variety of tofu were prepared ona commercial plant scale and were considered as bench-marks to compare theisoflavones of samples obtained from supermarkets in Singapore. The isoflavoneconcentrations in the prepared soft tofu were compared with the isoflavoneconcentrations in commercially available ‘‘silken,’’ ‘‘Chinese,’’ and ‘‘organic’’ tofu.Analysis showed that ‘‘silken,’’ ‘‘Chinese,’’ and ‘‘organic’’ tofu differed in their waterand protein contents. Also the types of coagulants used for their preparation weredifferent. However, the concentrations of isoflavones in these commercially available
Figure 3 Correlation of protein and isoflavone levels for soymilk samples.
120 PRABHAKARAN, PERERA AND VALIYAVEETTIL
ORDER REPRINTS
soft tofu varieties were comparable with the isoflavone levels in the soft tofu preparedby the standard procedure. The minor differences in the isoflavone concentrationscould be partly due to the variety of beans used or the manner in which the tofu wasprepared using different coagulants. Some coagulants might be better and moreefficient than the other in terms of retaining isoflavones in tofu from soymilk.[21]
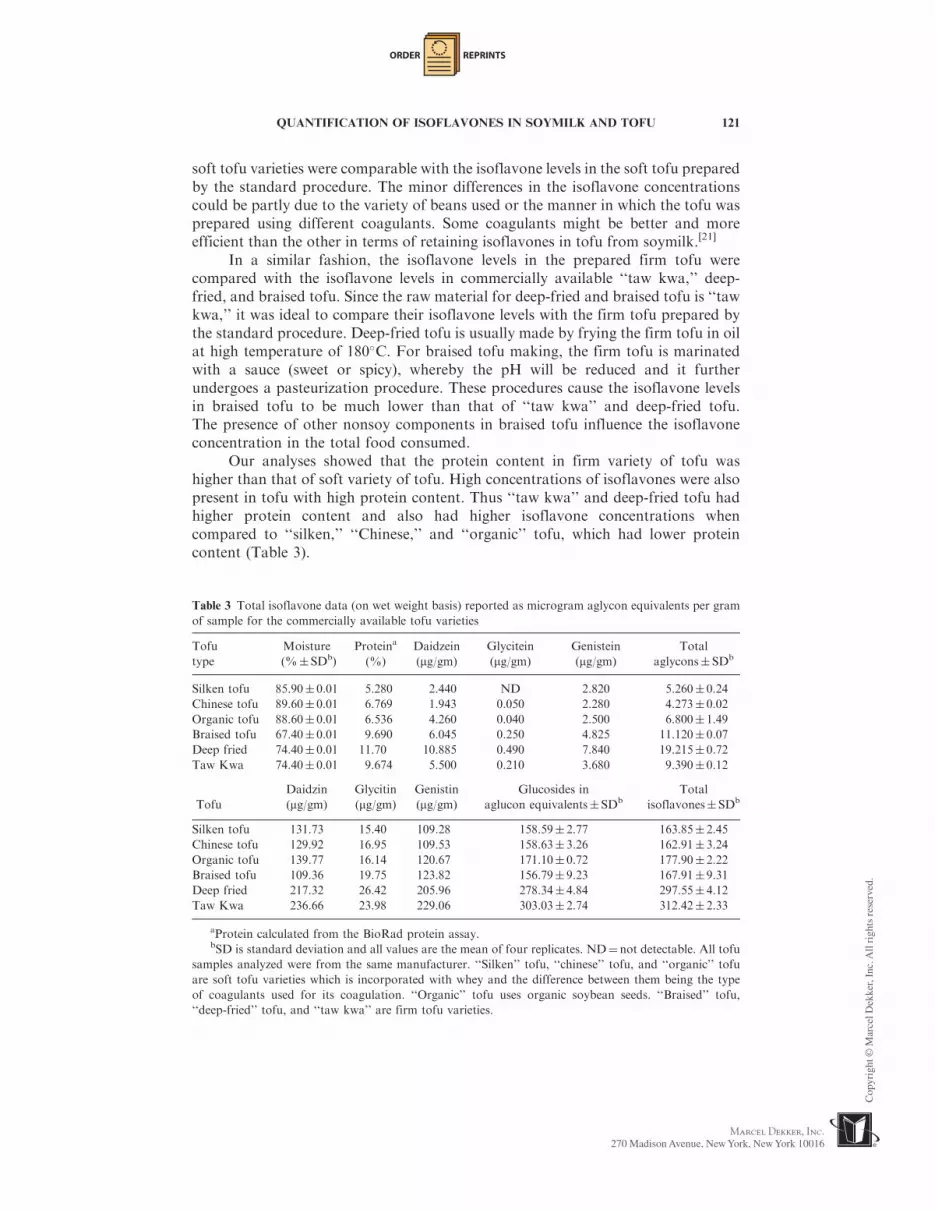
In a similar fashion, the isoflavone levels in the prepared firm tofu werecompared with the isoflavone levels in commercially available ‘‘taw kwa,’’ deep-fried, and braised tofu. Since the raw material for deep-fried and braised tofu is ‘‘tawkwa,’’ it was ideal to compare their isoflavone levels with the firm tofu prepared bythe standard procedure. Deep-fried tofu is usually made by frying the firm tofu in oilat high temperature of 180�C. For braised tofu making, the firm tofu is marinatedwith a sauce (sweet or spicy), whereby the pH will be reduced and it furtherundergoes a pasteurization procedure. These procedures cause the isoflavone levelsin braised tofu to be much lower than that of ‘‘taw kwa’’ and deep-fried tofu.The presence of other nonsoy components in braised tofu influence the isoflavoneconcentration in the total food consumed.
Our analyses showed that the protein content in firm variety of tofu washigher than that of soft variety of tofu. High concentrations of isoflavones were alsopresent in tofu with high protein content. Thus ‘‘taw kwa’’ and deep-fried tofu hadhigher protein content and also had higher isoflavone concentrations whencompared to ‘‘silken,’’ ‘‘Chinese,’’ and ‘‘organic’’ tofu, which had lower proteincontent (Table 3).
Table 3 Total isoflavone data (on wet weight basis) reported as microgram aglycon equivalents per gram
of sample for the commercially available tofu varieties
Tofu
type
Moisture
(%�SDb)
Proteina
(%)
Daidzein
(mg/gm)
Glycitein
(mg/gm)
Genistein
(mg/gm)
Total
aglycons� SDb
Silken tofu 85.90� 0.01 5.280 2.440 ND 2.820 5.260� 0.24
Chinese tofu 89.60� 0.01 6.769 1.943 0.050 2.280 4.273� 0.02
Organic tofu 88.60� 0.01 6.536 4.260 0.040 2.500 6.800� 1.49
Braised tofu 67.40� 0.01 9.690 6.045 0.250 4.825 11.120� 0.07
Deep fried 74.40� 0.01 11.70 10.885 0.490 7.840 19.215� 0.72
Taw Kwa 74.40� 0.01 9.674 5.500 0.210 3.680 9.390� 0.12
Tofu
Daidzin
(mg/gm)
Glycitin
(mg/gm)
Genistin
(mg/gm)
Glucosides in
aglucon equivalents�SDbTotal
isoflavones� SDb
Silken tofu 131.73 15.40 109.28 158.59� 2.77 163.85� 2.45
Chinese tofu 129.92 16.95 109.53 158.63� 3.26 162.91� 3.24
Organic tofu 139.77 16.14 120.67 171.10� 0.72 177.90� 2.22
Braised tofu 109.36 19.75 123.82 156.79� 9.23 167.91� 9.31
Deep fried 217.32 26.42 205.96 278.34� 4.84 297.55� 4.12
Taw Kwa 236.66 23.98 229.06 303.03� 2.74 312.42� 2.33
aProtein calculated from the BioRad protein assay.bSD is standard deviation and all values are the mean of four replicates. ND¼not detectable. All tofu
samples analyzed were from the same manufacturer. ‘‘Silken’’ tofu, ‘‘chinese’’ tofu, and ‘‘organic’’ tofu
are soft tofu varieties which is incorporated with whey and the difference between them being the type
of coagulants used for its coagulation. ‘‘Organic’’ tofu uses organic soybean seeds. ‘‘Braised’’ tofu,
‘‘deep-fried’’ tofu, and ‘‘taw kwa’’ are firm tofu varieties.
QUANTIFICATION OF ISOFLAVONES IN SOYMILK AND TOFU 121

ORDER REPRINTS
Since isoflavones are absorbed in the body as the aglycone, the totalconcentration of isoflavones in food products should not be expressed as thearithmetic sum of the aglycons and glucosides.[22] Therefore, the total isoflavonecontents were adjusted for their molecular weight differences and expressed inaglycone equivalents to avoid erroneous conclusions. Such information will also beuseful for food processors for the correct labeling of isoflavones on soy foodproducts in the future. Display of isoflavone concentrations on the labels of soyfoods would also be advantageous since it could provide additional nutritionalinformation to the consumers. From these results, it was apparent that isoflavoneswere found in higher concentration in soy foods containing higher levels of proteincontent than those with lesser protein content.
ACKNOWLEDGMENT
We would like to thank Ms. Ravinder Kaur from Unicurd Food Company,Singapore for helping to carrying out the plant scale preparations of soymilk andtofu. This research was supported by a grant from The National University ofSingapore R-143-000-179-112.
REFERENCES
1. Hutabarat, L.S.; Greenfield, H.; Mulholland, M. Isoflavones and coumestrol in soybeans
and soybean products from Australia and Indonesia. Journal of Food Composition and
Analysis 2001, 14 (1), 43–58.
2. Wang, H.J.; Murphy, P.A. Isoflavone content in commercial soybean foods. Journal of
Agricultural and Food Chemistry 1994, 42 (8), 1666–1673.
3. Messina, M. Modern applications for an ancient bean: soybeans and the prevention and
treatment of chronic disease. Journal of Nutrition 1995, 125 (3S), 567S–569S.
4. Messina, M.; Barnes, S.; Setchell, K.D. Phytoestrogens and breast cancer. Lancet 1997,
350 (9083), 971–972.
5. Anderson, J.W.; Johnstone, B.M.; Cook-Newell, M.E. Meta analysis of the effects of soy
protein intake on serum lipids. New England Journal of Medicine 1995, 333 (5), 276–282.
6. Schultz, W.B. Food labeling: health claims; soy protein and coronary heart disease.
Federal Regulations 1998, 63, 622977–623015.
7. Bahram, H.A.; Alekel, L.; Hollis, B.W.; Amin, D.; Stacewicz-Sapuntzakis, M.; Guo, P.;
Kukreja, S.C. Dietary soybean protein prevents bone loss in an ovariectomized rat model
of osteoporosis. Journal of Nutrition 1996, 126 (1), 161–167.
Table 4 Correlations output from SPSS software obtained for soymilk samples
Protein Isoflavone
Protein Pearson Correlation 1 0.984a
Sig. (2-tailed) — 0.002
N 5 5
Isoflavone Pearson Correlation 0.984a 1
Sig. (2-tailed) 0.002 —
N 5 5
aCorrelation is significant at the 0.01 level (2-tailed).
122 PRABHAKARAN, PERERA AND VALIYAVEETTIL

ORDER REPRINTS
8. Nurmi, T.; Mazur, W.; Heinonen, S.; Kokkonen, J.; Adlercreutz, H. Isoflavone content
of the soy based supplements. Journal of Pharmaceutical and Biomedical Analysis 2002,
28 (1), 1–11.
9. Liu, K. Nonfermented oriental soyfoods. Soybeans: Chemistry, Technology and
Utilization; Chapman & Hall: New York, 1997; 137–217.
10. Shurtleff, W. Chronology of soymilk worldwide. http://www.thesoydailyclub.com/
MOSsoymilk/MOSsoymilk2.asp (accessed March 2004).
11. Food and Drug Administration (FDA) FDA Talk Paper. FDA approves new health
claim for soy protein and coronary heart disease 1999; http://fda.gov (accessed
Aug 2003).
12. Jakes, R.W.; Duffy, S.W.; Ng, F.C.; Gao, F.; Ng, E.H.; Seow, A.; Lee, H.P.; Yu, M.C.
Mammographic parenchymal patterns and self reported soy intake in Singapore Chinese
women. Cancer Epidemiology Biomarkers & Prevention 2002, 11 (7), 608–613.
13. Franke, A.A.; Hankin, J.H.; Yu, M.C.; Maskarinec, G.; Low, S.H.; Custer, L.J.
Isoflavone levels in soy foods consumed by multiethnic populations in Singapore and
Hawaii. Journal of Agricultural and Food Chemistry 1999, 47 (3), 977–986.
14. Seow, A.; Shi, C.Y.; Franke, A.A.; Hankin, J.H.; Lee, H.P.; Yu, M.C. Isoflavonoid
levels in spot urine are associated with frequency of dietary soy intake in a population-
based sample of middle-aged and older Chinese in Singapore. Cancer Epidemiology
Biomarkers & Prevention 1998, 7 (2), 135–140.
15. Klump, S.P.; Allred, M.C.; MacDonald, J.L.; Ballam, J.M. Determination of isoflavones
in soy and selected foods containing soy by extraction, saponification and liquid
chromatography: collaborative study. Journal of AOAC International 2001, 84 (6),
1865–1883.
16. AOAC International: Official Methods of Analysis of AOAC International, 17th Ed.;
Gaithersburg: MD, USA, 2002; Vol. 2, 43–44.
17. Boyer, R. General laboratory procedures. Modern Experimental Biochemistry, 3rd Ed.;
Addison Wesley Longman: San Francisco, CA, 2000; 43–45.
18. Wang, H.J.; Murphy, P.A. Mass balance study of isoflavones during soybean processing.
Journal of Agricultural and Food Chemistry 1996, 44 (8), 2377–2383.
19. Murphy, P.A. Phytoestrogen content of processed soybean products. Food Technology
1982, 36, 60–64.
20. Coward, L.; Barnes, N.C.; Setchell, K.D.R.; Barnes, S. Genistein, daidzein, and their
beta glycoside conjugates: antitumor isoflavones in soybean foods from American and
Asian diets. Journal of Agricultural and Food Chemistry 1993, 41 (11), 1961–1967.
21. Jackson, C.J.C.; Dini, J.P.; Lavandier, C.; Rupasinghe, H.P.V.; Faulkner, H.; Poysa, V.;
Buzzell, D.; DeGrandis, S. Effects of processing on the content and composition of
isoflavones during the manufacturing of soy beverage and tofu. Process Biochemistry
2002, 37 (10), 1117–1123.
22. Murphy, P.A.; Song, T.; Buseman, G.; Barua, K.; Beecher, G.R.; Trainer, D.; Holden, J.
Isoflavones in retail and institutional soy foods. Journal of Agricultural and Food
Chemistry 1999, 47 (7), 2697–2704.
QUANTIFICATION OF ISOFLAVONES IN SOYMILK AND TOFU 123

Request Permission/Order Reprints
Reprints of this article can also be ordered at
http://www.dekker.com/servlet/product/DOI/101081JFP200048055
Request Permission or Order Reprints Instantly!
Interested in copying and sharing this article? In most cases, U.S. Copyright Law requires that you get permission from the article’s rightsholder before using copyrighted content.
All information and materials found in this article, including but not limited to text, trademarks, patents, logos, graphics and images (the "Materials"), are the copyrighted works and other forms of intellectual property of Marcel Dekker, Inc., or its licensors. All rights not expressly granted are reserved.
Get permission to lawfully reproduce and distribute the Materials or order reprints quickly and painlessly. Simply click on the "Request Permission/ Order Reprints" link below and follow the instructions. Visit the U.S. Copyright Office for information on Fair Use limitations of U.S. copyright law. Please refer to The Association of American Publishers’ (AAP) website for guidelines on Fair Use in the Classroom.
The Materials are for your personal use only and cannot be reformatted, reposted, resold or distributed by electronic means or otherwise without permission from Marcel Dekker, Inc. Marcel Dekker, Inc. grants you the limited right to display the Materials only on your personal computer or personal wireless device, and to copy and download single copies of such Materials provided that any copyright, trademark or other notice appearing on such Materials is also retained by, displayed, copied or downloaded as part of the Materials and is not removed or obscured, and provided you do not edit, modify, alter or enhance the Materials. Please refer to our Website User Agreement for more details.


